falseP6YP3YP3Y2019FY0000910073--12-31NEW YORK COMMUNITY BANCORP INCAmounts in parentheses indicate expense items.See Note 14, “Employee Benefits,” for additional information.The underlying assets of the asset-backed securities are substantially guaranteed by the U.S. Government.The amortized cost includes the non-credit portion of OTTI recorded in AOCL. At December 31, 2019, the non-credit portion of OTTI recorded in AOCL was $0.0 million before taxes.Primarily consists of mutual funds that are CRA-qualified investments.Not presented on a tax-equivalent basis.Includes corporate bonds, capital trust notes, and asset-backed securities.Includes specialty finance loans and leases of $0.0 billion and $1.9 billion, respectively, at December 30, 2019 and 2018. Other C&I loans of $000.0 million and $469.9 million, respectively, at December 30, 2019 and 2018.Includes $00.0 million and $20.4 million of taxi medallion-related loans at December 31, 2019 and 2018, respectively.These amounts include the amortized cost basis of closed portfolios used to designated hedging relationships in which the hedged item is the last layer expected to be remaining at the end of the hedging relationship. At December 31, 2019, the amortized cost basis of the closed portfolios used in these hedging relationships was $0.0 billion; the cumulative basis adjustments associated with these hedging relationships was $00.0 million; and the amount of the designated hedged items was $0.0 billion.Carrying value and estimated fair value are at cost. Interest-bearing checking and money market accounts, savings accounts, and non-interest-bearing accounts. Certificates of deposit. This category contains large-cap stocks with above-average yield. The portfolio typically holds between 60 and 70 stocks.This category seeks long-term capital appreciation by investing primarily in large growth companies based in the U.S.This fund tracks the performance of the S&P 500 Index by purchasing the securities represented in the Index in approximately the same weightings as the Index.This category employs an indexing investment approach designed to track the performance of the CRSP US Mid-Cap Value Index.This category employs an indexing investment approach designed to track the performance of the CRSP US Mid-Cap Growth Index.This category seeks to track the performance of the S&P Midcap 400 Index.This category consists of a selection of investments based on the Russell 2000 Value Index.This category consists of a mutual fund invested in small cap growth companies along with a fund invested in a selection of investments based on the Russell 2000 Growth Index.This category consists of a mutual fund investing in readily marketable securities of U.S. companies with market capitalizations within the smallest 10% of the market universe, or smaller than the 1000th largest US company.This category has investments in medium to large non-US companies, including high quality, durable growth companies and companies based in countries with stable economic and political systems. A portion of this category consists of an index fund designed to track the MSC ACWI ex-US Net Dividend Return Index.This category currently includes equal investments in three mutual funds, two of which usually hold at least 80% of fund assets in investment grade fixed income securities, seeking to outperform the Barclays US Aggregate Bond Index while maintaining a similar duration to that index. The third fund targets investments of 50% or more in mortgage-backed securities guaranteed by the US government and its agencies.This category consists of a mutual fund which invest in a diversified portfolio of high-quality bonds and other fixed income securities, including U.S. Government obligations, mortgage-related and asset backed securities, corporate and municipal bonds, CMOs, and other securities mostly rated A or better.Includes cash equivalent investments in equity and fixed income strategies.Included in “Non-interest income.”Represents the fair value of impaired loans, based on the value of the collateral. Represents the fair value of repossessed assets, based on the appraised value of the collateral subsequent to its initial classification as repossessed assets. Callable subject to certain conditions as described in the prospectus filed with the SEC on November 4, 2002.Callable from this date forward.From and including the date of original issuance to, but excluding November 6, 2023, the Notes will bear interest at an initial rate of 5.90% per annum payable semi-annually. Unless redeemed, from and including November 6, 2023 to but excluding the maturity date, the interest rate will reset quarterly to an annual interest rate equal to the then-current three-month LIBOR rate plus 278 basis point payable quarterly. 0000910073 2019-01-01 2019-12-31 0000910073 2018-01-01 2018-12-31 0000910073 2017-01-01 2017-12-31 0000910073 2019-12-31 0000910073 2018-12-31 0000910073 2017-12-31 0000910073 2019-06-30 0000910073 2020-02-19 0000910073 2016-12-31 0000910073 nycb:CompanyMember 2019-12-31 0000910073 us-gaap:USTreasurySecuritiesMember us-gaap:DebtSecuritiesMember 2019-12-31 0000910073 us-gaap:MortgageBackedSecuritiesIssuedByUSGovernmentSponsoredEnterprisesMember us-gaap:DebtSecuritiesMember 2019-12-31 0000910073 us-gaap:CollateralizedMortgageObligationsMember us-gaap:DebtSecuritiesMember 2019-12-31 0000910073 us-gaap:AssetBackedSecuritiesMember us-gaap:DebtSecuritiesMember 2019-12-31 0000910073 us-gaap:DebtSecuritiesMember us-gaap:CorporateBondSecuritiesMember 2019-12-31 0000910073 us-gaap:DebtSecuritiesMember 2019-12-31 0000910073 us-gaap:USGovernmentSponsoredEnterprisesDebtSecuritiesMember us-gaap:DebtSecuritiesMember 2019-12-31 0000910073 srt:MultifamilyMember 2019-12-31 0000910073 us-gaap:CommercialRealEstateMember 2019-12-31 0000910073 nycb:OneToFourFamilyMortgageLoansMember 2019-12-31 0000910073 nycb:AcquisitionDevelopmentAndConstructionMortgageLoansMember 2019-12-31 0000910073 us-gaap:MortgageReceivablesMember 2019-12-31 0000910073 us-gaap:CommercialAndIndustrialSectorMember nycb:OtherLoansMember 2019-12-31 0000910073 us-gaap:FinanceLeasesPortfolioSegmentMember 2019-12-31 0000910073 us-gaap:CommercialAndIndustrialSectorMember 2019-12-31 0000910073 nycb:OtherLoansMember 2019-12-31 0000910073 us-gaap:MortgageReceivablesMember us-gaap:LoansReceivableMember 2019-12-31 0000910073 nycb:OtherLoansMember us-gaap:LoansReceivableMember 2019-12-31 0000910073 us-gaap:LoansReceivableMember 2019-12-31 0000910073 us-gaap:SecuritiesSoldUnderAgreementsToRepurchaseMember 2019-12-31 0000910073 us-gaap:DomesticCountryMember 2019-12-31 0000910073 us-gaap:ConsumerPortfolioSegmentMember 2019-12-31 0000910073 nycb:CommercialIndustrialAndOtherLoansMember nycb:OtherLoansMember 2019-12-31 0000910073 nycb:FinancingReceivableThirtyToEightyNineDaysPastDueMember srt:MultifamilyMember 2019-12-31 0000910073 srt:MultifamilyMember nycb:NonCoveredLoansMember 2019-12-31 0000910073 nycb:OneToFourFamilyMortgageLoansMember nycb:NonCoveredLoansMember 2019-12-31 0000910073 nycb:NonCoveredLoansMember nycb:FinancingReceivableThirtyToEightyNineDaysPastDueMember us-gaap:CommercialRealEstateMember 2019-12-31 0000910073 us-gaap:CommercialRealEstateMember nycb:NonCoveredLoansMember 2019-12-31 0000910073 us-gaap:CommercialAndIndustrialSectorMember nycb:NonCoveredLoansMember 2019-12-31 0000910073 us-gaap:ConsumerPortfolioSegmentMember nycb:FinancingReceivableThirtyToEightyNineDaysPastDueMember nycb:NonCoveredLoansMember 2019-12-31 0000910073 us-gaap:ConsumerPortfolioSegmentMember nycb:NonCoveredLoansMember 2019-12-31 0000910073 nycb:FinancingReceivableThirtyToEightyNineDaysPastDueMember nycb:NonCoveredLoansMember 2019-12-31 0000910073 nycb:NonCoveredLoansMember 2019-12-31 0000910073 us-gaap:FinancingReceivablesEqualToGreaterThan90DaysPastDueMember 2019-12-31 0000910073 srt:MultifamilyMember us-gaap:PassMember 2019-12-31 0000910073 us-gaap:CommercialRealEstateMember us-gaap:PassMember 2019-12-31 0000910073 us-gaap:PassMember nycb:OneToFourFamilyMortgageLoansMember 2019-12-31 0000910073 nycb:AcquisitionDevelopmentAndConstructionMortgageLoansMember us-gaap:PassMember 2019-12-31 0000910073 us-gaap:MortgageReceivablesMember us-gaap:PassMember 2019-12-31 0000910073 us-gaap:PassMember us-gaap:CommercialAndIndustrialSectorMember 2019-12-31 0000910073 us-gaap:PassMember us-gaap:ConsumerPortfolioSegmentMember 2019-12-31 0000910073 nycb:CommercialIndustrialAndOtherLoansMember us-gaap:PassMember 2019-12-31 0000910073 srt:MultifamilyMember us-gaap:SpecialMentionMember 2019-12-31 0000910073 us-gaap:CommercialRealEstateMember us-gaap:SpecialMentionMember 2019-12-31 0000910073 us-gaap:SpecialMentionMember nycb:OneToFourFamilyMortgageLoansMember 2019-12-31 0000910073 nycb:AcquisitionDevelopmentAndConstructionMortgageLoansMember us-gaap:SpecialMentionMember 2019-12-31 0000910073 us-gaap:MortgageReceivablesMember us-gaap:SpecialMentionMember 2019-12-31 0000910073 us-gaap:SpecialMentionMember us-gaap:CommercialAndIndustrialSectorMember 2019-12-31 0000910073 nycb:CommercialIndustrialAndOtherLoansMember us-gaap:SpecialMentionMember 2019-12-31 0000910073 srt:MultifamilyMember us-gaap:SubstandardMember 2019-12-31 0000910073 us-gaap:CommercialRealEstateMember us-gaap:SubstandardMember 2019-12-31 0000910073 us-gaap:SubstandardMember nycb:OneToFourFamilyMortgageLoansMember 2019-12-31 0000910073 nycb:AcquisitionDevelopmentAndConstructionMortgageLoansMember us-gaap:SubstandardMember 2019-12-31 0000910073 us-gaap:MortgageReceivablesMember us-gaap:SubstandardMember 2019-12-31 0000910073 us-gaap:SubstandardMember us-gaap:CommercialAndIndustrialSectorMember 2019-12-31 0000910073 us-gaap:SubstandardMember us-gaap:ConsumerPortfolioSegmentMember 2019-12-31 0000910073 nycb:CommercialIndustrialAndOtherLoansMember us-gaap:SubstandardMember 2019-12-31 0000910073 nycb:CommercialIndustrialAndOtherLoansMember 2019-12-31 0000910073 nycb:NonCoveredLoansMember nycb:NonAccrualLoansMember srt:MultifamilyMember 2019-12-31 0000910073 nycb:NonCoveredLoansMember nycb:NonAccrualLoansMember nycb:OneToFourFamilyMortgageLoansMember 2019-12-31 0000910073 nycb:NonCoveredLoansMember nycb:AccrualLoansMember nycb:AcquisitionDevelopmentAndConstructionMortgageLoansMember 2019-12-31 0000910073 nycb:NonCoveredLoansMember nycb:AcquisitionDevelopmentAndConstructionMortgageLoansMember 2019-12-31 0000910073 nycb:AccrualLoansMember nycb:NonCoveredLoansMember us-gaap:CommercialAndIndustrialSectorMember 2019-12-31 0000910073 nycb:NonAccrualLoansMember nycb:NonCoveredLoansMember us-gaap:CommercialAndIndustrialSectorMember 2019-12-31 0000910073 nycb:NonCoveredLoansMember nycb:AccrualLoansMember 2019-12-31 0000910073 nycb:NonCoveredLoansMember nycb:NonAccrualLoansMember 2019-12-31 0000910073 nycb:NonCoveredLoansMember srt:MultifamilyMember nycb:AccrualLoansMember 2019-12-31 0000910073 nycb:NonCoveredLoansMember us-gaap:CommercialRealEstateMember nycb:AccrualLoansMember 2019-12-31 0000910073 nycb:NonCoveredLoansMember us-gaap:CommercialRealEstateMember nycb:NonAccrualLoansMember 2019-12-31 0000910073 nycb:NonCoveredLoansMember nycb:AccrualLoansMember nycb:OneToFourFamilyMortgageLoansMember 2019-12-31 0000910073 nycb:NonCoveredLoansMember nycb:NonAccrualLoansMember nycb:AcquisitionDevelopmentAndConstructionMortgageLoansMember 2019-12-31 0000910073 us-gaap:FinancialStandbyLetterOfCreditMember 2019-12-31 0000910073 nycb:CommercialLettersOfCreditMember 2019-12-31 0000910073 us-gaap:PerformanceGuaranteeMember 2019-12-31 0000910073 us-gaap:OtherPostretirementBenefitPlansDefinedBenefitMember 2019-12-31 0000910073 us-gaap:PensionPlansDefinedBenefitMember 2019-12-31 0000910073 nycb:LargeCapValueMember us-gaap:EquityFundsMember 2019-12-31 0000910073 nycb:LargeCapValueMember us-gaap:EquityFundsMember us-gaap:FairValueInputsLevel2Member 2019-12-31 0000910073 nycb:LargeCapGrowthMember us-gaap:EquityFundsMember 2019-12-31 0000910073 nycb:LargeCapGrowthMember us-gaap:EquityFundsMember us-gaap:FairValueInputsLevel2Member 2019-12-31 0000910073 nycb:LargeCapCoreMember us-gaap:EquityFundsMember 2019-12-31 0000910073 nycb:LargeCapCoreMember us-gaap:EquityFundsMember us-gaap:FairValueInputsLevel2Member 2019-12-31 0000910073 nycb:UnitedStatesMidCapValueMember us-gaap:EquityFundsMember 2019-12-31 0000910073 nycb:UnitedStatesMidCapValueMember us-gaap:EquityFundsMember us-gaap:FairValueInputsLevel2Member 2019-12-31 0000910073 nycb:MidCapGrowthMember us-gaap:EquityFundsMember 2019-12-31 0000910073 nycb:MidCapGrowthMember us-gaap:EquityFundsMember us-gaap:FairValueInputsLevel2Member 2019-12-31 0000910073 nycb:MidCapCoreMember us-gaap:EquityFundsMember 2019-12-31 0000910073 nycb:MidCapCoreMember us-gaap:EquityFundsMember us-gaap:FairValueInputsLevel2Member 2019-12-31 0000910073 nycb:UnitedStatesSmallCapValueMember us-gaap:EquityFundsMember 2019-12-31 0000910073 nycb:UnitedStatesSmallCapValueMember us-gaap:EquityFundsMember us-gaap:FairValueInputsLevel2Member 2019-12-31 0000910073 nycb:SmallCapValueGrowthMember us-gaap:EquityFundsMember 2019-12-31 0000910073 nycb:SmallCapValueGrowthMember us-gaap:EquityFundsMember us-gaap:FairValueInputsLevel2Member 2019-12-31 0000910073 nycb:SmallCapCoreMember us-gaap:EquityFundsMember 2019-12-31 0000910073 nycb:SmallCapCoreMember us-gaap:EquityFundsMember us-gaap:FairValueInputsLevel2Member 2019-12-31 0000910073 nycb:InternationalEquityMember us-gaap:EquityFundsMember 2019-12-31 0000910073 nycb:InternationalEquityMember us-gaap:EquityFundsMember us-gaap:FairValueInputsLevel2Member 2019-12-31 0000910073 nycb:UnitedStatesCoreMember us-gaap:FixedIncomeFundsMember 2019-12-31 0000910073 nycb:UnitedStatesCoreMember us-gaap:FixedIncomeFundsMember us-gaap:FairValueInputsLevel2Member 2019-12-31 0000910073 nycb:IntermediateDurationMember us-gaap:FixedIncomeFundsMember 2019-12-31 0000910073 nycb:IntermediateDurationMember us-gaap:FixedIncomeFundsMember us-gaap:FairValueInputsLevel2Member 2019-12-31 0000910073 us-gaap:CommonStockMember us-gaap:EquitySecuritiesMember 2019-12-31 0000910073 us-gaap:CommonStockMember us-gaap:EquitySecuritiesMember us-gaap:FairValueInputsLevel1Member 2019-12-31 0000910073 us-gaap:MoneyMarketFundsMember us-gaap:CashEquivalentsMember 2019-12-31 0000910073 us-gaap:MoneyMarketFundsMember us-gaap:CashEquivalentsMember us-gaap:FairValueInputsLevel1Member 2019-12-31 0000910073 us-gaap:MoneyMarketFundsMember us-gaap:CashEquivalentsMember us-gaap:FairValueInputsLevel2Member 2019-12-31 0000910073 us-gaap:FairValueInputsLevel1Member 2019-12-31 0000910073 us-gaap:FairValueInputsLevel2Member 2019-12-31 0000910073 nycb:LargeCapValueMember nycb:CommonCollectiveTrustsEquityMember srt:MinimumMember 2019-12-31 0000910073 nycb:LargeCapValueMember nycb:CommonCollectiveTrustsEquityMember srt:MaximumMember 2019-12-31 0000910073 nycb:BankMember 2019-12-31 0000910073 us-gaap:FairValueMeasurementsRecurringMember us-gaap:FairValueInputsLevel2Member us-gaap:MortgageBackedSecuritiesIssuedByUSGovernmentSponsoredEnterprisesMember us-gaap:MortgageBackedSecuritiesMember 2019-12-31 0000910073 us-gaap:FairValueMeasurementsRecurringMember us-gaap:MortgageBackedSecuritiesIssuedByUSGovernmentSponsoredEnterprisesMember us-gaap:MortgageBackedSecuritiesMember 2019-12-31 0000910073 us-gaap:FairValueMeasurementsRecurringMember us-gaap:FairValueInputsLevel2Member us-gaap:CollateralizedMortgageObligationsMember us-gaap:MortgageBackedSecuritiesMember 2019-12-31 0000910073 us-gaap:FairValueMeasurementsRecurringMember us-gaap:CollateralizedMortgageObligationsMember us-gaap:MortgageBackedSecuritiesMember 2019-12-31 0000910073 us-gaap:FairValueMeasurementsRecurringMember us-gaap:FairValueInputsLevel2Member us-gaap:MortgageBackedSecuritiesMember 2019-12-31 0000910073 us-gaap:FairValueMeasurementsRecurringMember us-gaap:MortgageBackedSecuritiesMember 2019-12-31 0000910073 us-gaap:FairValueInputsLevel1Member nycb:OtherSecuritiesMember us-gaap:USTreasurySecuritiesMember us-gaap:FairValueMeasurementsRecurringMember 2019-12-31 0000910073 us-gaap:FairValueMeasurementsRecurringMember nycb:OtherSecuritiesMember us-gaap:USTreasurySecuritiesMember 2019-12-31 0000910073 us-gaap:FairValueMeasurementsRecurringMember us-gaap:FairValueInputsLevel2Member nycb:OtherSecuritiesMember us-gaap:USGovernmentSponsoredEnterprisesDebtSecuritiesMember 2019-12-31 0000910073 us-gaap:FairValueMeasurementsRecurringMember nycb:OtherSecuritiesMember us-gaap:USGovernmentSponsoredEnterprisesDebtSecuritiesMember 2019-12-31 0000910073 us-gaap:FairValueMeasurementsRecurringMember us-gaap:FairValueInputsLevel2Member nycb:OtherSecuritiesMember us-gaap:AssetBackedSecuritiesMember 2019-12-31 0000910073 us-gaap:FairValueMeasurementsRecurringMember nycb:OtherSecuritiesMember us-gaap:AssetBackedSecuritiesMember 2019-12-31 0000910073 us-gaap:FairValueMeasurementsRecurringMember us-gaap:FairValueInputsLevel2Member nycb:OtherSecuritiesMember us-gaap:MunicipalBondsMember 2019-12-31 0000910073 us-gaap:FairValueMeasurementsRecurringMember nycb:OtherSecuritiesMember us-gaap:MunicipalBondsMember 2019-12-31 0000910073 us-gaap:FairValueMeasurementsRecurringMember us-gaap:FairValueInputsLevel2Member nycb:OtherSecuritiesMember us-gaap:CorporateBondSecuritiesMember 2019-12-31 0000910073 us-gaap:FairValueMeasurementsRecurringMember nycb:OtherSecuritiesMember us-gaap:CorporateBondSecuritiesMember 2019-12-31 0000910073 us-gaap:FairValueMeasurementsRecurringMember us-gaap:FairValueInputsLevel2Member nycb:OtherSecuritiesMember us-gaap:CorporateNoteSecuritiesMember 2019-12-31 0000910073 us-gaap:FairValueMeasurementsRecurringMember nycb:OtherSecuritiesMember us-gaap:CorporateNoteSecuritiesMember 2019-12-31 0000910073 us-gaap:FairValueInputsLevel1Member nycb:OtherSecuritiesMember us-gaap:FairValueMeasurementsRecurringMember 2019-12-31 0000910073 us-gaap:FairValueMeasurementsRecurringMember us-gaap:FairValueInputsLevel2Member nycb:OtherSecuritiesMember 2019-12-31 0000910073 us-gaap:FairValueMeasurementsRecurringMember nycb:OtherSecuritiesMember 2019-12-31 0000910073 us-gaap:FairValueMeasurementsRecurringMember us-gaap:FairValueInputsLevel1Member 2019-12-31 0000910073 us-gaap:FairValueMeasurementsRecurringMember us-gaap:FairValueInputsLevel2Member 2019-12-31 0000910073 us-gaap:FairValueMeasurementsRecurringMember 2019-12-31 0000910073 us-gaap:AvailableforsaleSecuritiesMember 2019-12-31 0000910073 us-gaap:MoneyMarketFundsMember 2019-12-31 0000910073 us-gaap:InterestBearingDepositsMember 2019-12-31 0000910073 us-gaap:CertificatesOfDepositMember 2019-12-31 0000910073 us-gaap:CommercialAndIndustrialSectorMember nycb:OtherLoansMember nycb:SpecialtyFinanceLoansMember 2019-12-31 0000910073 nycb:CommercialAndIndustrialLoansMember us-gaap:CommercialAndIndustrialSectorMember nycb:OtherLoansMember 2019-12-31 0000910073 us-gaap:FairValueInputsLevel3Member us-gaap:FairValueMeasurementsNonrecurringMember 2019-12-31 0000910073 us-gaap:FairValueMeasurementsNonrecurringMember 2019-12-31 0000910073 us-gaap:IPOMember 2019-12-31 0000910073 us-gaap:DebtSecuritiesMember us-gaap:MunicipalBondsMember 2019-12-31 0000910073 us-gaap:DebtSecuritiesMember us-gaap:CorporateNoteSecuritiesMember 2019-12-31 0000910073 us-gaap:EquitySecuritiesMember 2019-12-31 0000910073 nycb:NewYorkCommunityBankMember 2019-12-31 0000910073 us-gaap:EquitySecuritiesMember 2019-12-31 0000910073 us-gaap:DebtSecuritiesMember 2019-12-31 0000910073 us-gaap:CashEquivalentsMember 2019-12-31 0000910073 nycb:EarlierOfContractualMaturityOrNextCallDateMember 2019-12-31 0000910073 us-gaap:Maturity30To90DaysMember 2019-12-31 0000910073 us-gaap:MaturityOver90DaysMember 2019-12-31 0000910073 srt:ParentCompanyMember 2019-12-31 0000910073 us-gaap:MortgageBackedSecuritiesMember 2019-12-31 0000910073 us-gaap:USTreasuryAndGovernmentMember 2019-12-31 0000910073 us-gaap:USStatesAndPoliticalSubdivisionsMember 2019-12-31 0000910073 us-gaap:OtherDebtSecuritiesMember 2019-12-31 0000910073 nycb:ContractualMaturityMember 2019-12-31 0000910073 us-gaap:MaturityOver90DaysMember us-gaap:USTreasuryAndGovernmentMember 2019-12-31 0000910073 us-gaap:Maturity30To90DaysMember us-gaap:USTreasuryAndGovernmentMember 2019-12-31 0000910073 us-gaap:MaturityOver90DaysMember us-gaap:MortgageBackedSecuritiesMember 2019-12-31 0000910073 us-gaap:Maturity30To90DaysMember us-gaap:MortgageBackedSecuritiesMember 2019-12-31 0000910073 nycb:NewYorkCommunityCapitalTrustVMember 2019-12-31 0000910073 nycb:NewYorkCommunityCapitalTrustXMember 2019-12-31 0000910073 nycb:PennFedCapitalTrustIIIMember 2019-12-31 0000910073 nycb:NewYorkCommunityCapitalTrustXIMember 2019-12-31 0000910073 us-gaap:LoanOriginationCommitmentsMember 2019-12-31 0000910073 us-gaap:UnusedLinesOfCreditMember 2019-12-31 0000910073 nycb:SupplementalExecutiveRetirementPlanMember 2019-12-31 0000910073 us-gaap:USGovernmentAgenciesDebtSecuritiesMember 2019-12-31 0000910073 us-gaap:CorporateNoteSecuritiesMember 2019-12-31 0000910073 us-gaap:CollateralizedDebtObligationsMember 2019-12-31 0000910073 us-gaap:AssetBackedSecuritiesMember 2019-12-31 0000910073 us-gaap:CorporateBondSecuritiesMember 2019-12-31 0000910073 us-gaap:MunicipalBondsMember 2019-12-31 0000910073 us-gaap:MutualFundMember 2019-12-31 0000910073 srt:FederalHomeLoanBankOfNewYorkMember 2019-12-31 0000910073 nycb:MultifamilyAndCommercialRealEstateLoansMember nycb:MortgageLoanCommitmentsMember 2019-12-31 0000910073 nycb:OneToFourFamilyMortgageLoansMember nycb:MortgageLoanCommitmentsMember 2019-12-31 0000910073 nycb:AcquisitionDevelopmentAndConstructionMortgageLoansMember nycb:MortgageLoanCommitmentsMember 2019-12-31 0000910073 nycb:MortgageLoanCommitmentsMember 2019-12-31 0000910073 nycb:OtherLoanCommitmentsMember 2019-12-31 0000910073 us-gaap:FairValueMeasurementsRecurringMember us-gaap:FairValueInputsLevel1Member us-gaap:PreferredStockMember 2019-12-31 0000910073 us-gaap:FairValueMeasurementsRecurringMember us-gaap:PreferredStockMember 2019-12-31 0000910073 us-gaap:FairValueMeasurementsRecurringMember us-gaap:FairValueInputsLevel2Member nycb:MutualFundsAndCommonStockMember 2019-12-31 0000910073 us-gaap:FairValueMeasurementsRecurringMember nycb:MutualFundsAndCommonStockMember 2019-12-31 0000910073 nycb:CommercialAndIndustrialSectorAndOneToFourFamilyMortgageLoansMember 2019-12-31 0000910073 us-gaap:MortgageBackedSecuritiesIssuedByUSGovernmentSponsoredEnterprisesMember us-gaap:MortgageBackedSecuritiesMember 2019-12-31 0000910073 us-gaap:CollateralizedMortgageObligationsMember us-gaap:MortgageBackedSecuritiesMember 2019-12-31 0000910073 us-gaap:MortgageBackedSecuritiesMember 2019-12-31 0000910073 us-gaap:USGovernmentSponsoredEnterprisesDebtSecuritiesMember us-gaap:DebtSecuritiesMember 2019-12-31 0000910073 us-gaap:AssetBackedSecuritiesMember us-gaap:DebtSecuritiesMember 2019-12-31 0000910073 us-gaap:MunicipalBondsMember us-gaap:DebtSecuritiesMember 2019-12-31 0000910073 us-gaap:CorporateBondSecuritiesMember us-gaap:DebtSecuritiesMember 2019-12-31 0000910073 us-gaap:CorporateNoteSecuritiesMember us-gaap:DebtSecuritiesMember 2019-12-31 0000910073 us-gaap:DebtSecuritiesMember 2019-12-31 0000910073 nycb:MortgageBackedSecuritiesAndOtherSecuritiesMember 2019-12-31 0000910073 us-gaap:PreferredStockMember us-gaap:EquitySecuritiesMember 2019-12-31 0000910073 nycb:MutualFundsAndCommonStockMember us-gaap:EquitySecuritiesMember 2019-12-31 0000910073 us-gaap:EquitySecuritiesMember 2019-12-31 0000910073 us-gaap:DebtSecuritiesMember us-gaap:USTreasurySecuritiesMember 2019-12-31 0000910073 us-gaap:FairValueInputsLevel3Member 2019-12-31 0000910073 srt:MinimumMember 2019-12-31 0000910073 srt:MaximumMember 2019-12-31 0000910073 nycb:TaxiMedallionLoansMember 2019-12-31 0000910073 nycb:SpecialFederalTaxProvisionMember 2019-12-31 0000910073 us-gaap:CommonStockMember 2019-12-31 0000910073 us-gaap:InterestRateSwapMember us-gaap:DesignatedAsHedgingInstrumentMember 2019-12-31 0000910073 us-gaap:DesignatedAsHedgingInstrumentMember 2019-12-31 0000910073 us-gaap:DesignatedAsHedgingInstrumentMember us-gaap:OtherAssetsMember us-gaap:InterestRateSwapMember 2019-12-31 0000910073 us-gaap:DesignatedAsHedgingInstrumentMember us-gaap:InterestRateSwapMember nycb:LondonClearingHouseMember 2019-12-31 0000910073 us-gaap:InterestRateSwapMember us-gaap:CashFlowHedgingMember 2019-12-31 0000910073 nycb:LoansAndLeasesMember 2019-12-31 0000910073 us-gaap:SubordinatedDebtMember 2019-12-31 0000910073 nycb:CompanyMember 2018-12-31 0000910073 us-gaap:DebtSecuritiesMember 2018-12-31 0000910073 us-gaap:DebtSecuritiesMember us-gaap:USGovernmentSponsoredEnterprisesDebtSecuritiesMember 2018-12-31 0000910073 us-gaap:MortgageBackedSecuritiesIssuedByUSGovernmentSponsoredEnterprisesMember us-gaap:DebtSecuritiesMember 2018-12-31 0000910073 us-gaap:CollateralizedMortgageObligationsMember us-gaap:DebtSecuritiesMember 2018-12-31 0000910073 us-gaap:AssetBackedSecuritiesMember us-gaap:DebtSecuritiesMember 2018-12-31 0000910073 us-gaap:MunicipalBondsMember us-gaap:DebtSecuritiesMember 2018-12-31 0000910073 us-gaap:CorporateBondSecuritiesMember us-gaap:DebtSecuritiesMember 2018-12-31 0000910073 us-gaap:EquitySecuritiesMember 2018-12-31 0000910073 srt:MultifamilyMember 2018-12-31 0000910073 us-gaap:CommercialRealEstateMember 2018-12-31 0000910073 nycb:OneToFourFamilyMortgageLoansMember 2018-12-31 0000910073 nycb:AcquisitionDevelopmentAndConstructionMortgageLoansMember 2018-12-31 0000910073 us-gaap:MortgageReceivablesMember 2018-12-31 0000910073 us-gaap:CommercialAndIndustrialSectorMember nycb:OtherLoansMember 2018-12-31 0000910073 us-gaap:FinanceLeasesPortfolioSegmentMember 2018-12-31 0000910073 us-gaap:CommercialAndIndustrialSectorMember 2018-12-31 0000910073 us-gaap:MortgageReceivablesMember us-gaap:LoansReceivableMember 2018-12-31 0000910073 nycb:OtherLoansMember us-gaap:LoansReceivableMember 2018-12-31 0000910073 us-gaap:LoansReceivableMember 2018-12-31 0000910073 us-gaap:SecuritiesSoldUnderAgreementsToRepurchaseMember 2018-12-31 0000910073 us-gaap:ConsumerPortfolioSegmentMember 2018-12-31 0000910073 nycb:CommercialIndustrialAndOtherLoansMember nycb:OtherLoansMember 2018-12-31 0000910073 nycb:FinancingReceivableThirtyToEightyNineDaysPastDueMember nycb:NonCoveredLoansMember 2018-12-31 0000910073 us-gaap:CommercialAndIndustrialSectorMember nycb:NonCoveredLoansMember nycb:FinancingReceivableThirtyToEightyNineDaysPastDueMember 2018-12-31 0000910073 us-gaap:CommercialAndIndustrialSectorMember nycb:NonCoveredLoansMember 2018-12-31 0000910073 us-gaap:ConsumerPortfolioSegmentMember nycb:FinancingReceivableThirtyToEightyNineDaysPastDueMember nycb:NonCoveredLoansMember 2018-12-31 0000910073 us-gaap:ConsumerPortfolioSegmentMember nycb:NonCoveredLoansMember 2018-12-31 0000910073 nycb:NonCoveredLoansMember 2018-12-31 0000910073 srt:MultifamilyMember nycb:NonCoveredLoansMember 2018-12-31 0000910073 us-gaap:CommercialRealEstateMember nycb:NonCoveredLoansMember 2018-12-31 0000910073 nycb:OneToFourFamilyMortgageLoansMember nycb:FinancingReceivableThirtyToEightyNineDaysPastDueMember nycb:NonCoveredLoansMember 2018-12-31 0000910073 nycb:OneToFourFamilyMortgageLoansMember nycb:NonCoveredLoansMember 2018-12-31 0000910073 nycb:FinancingReceivableThirtyToEightyNineDaysPastDueMember 2018-12-31 0000910073 us-gaap:FinancingReceivablesEqualToGreaterThan90DaysPastDueMember 2018-12-31 0000910073 srt:MultifamilyMember us-gaap:PassMember 2018-12-31 0000910073 us-gaap:CommercialRealEstateMember us-gaap:PassMember 2018-12-31 0000910073 nycb:OneToFourFamilyMortgageLoansMember us-gaap:PassMember 2018-12-31 0000910073 nycb:AcquisitionDevelopmentAndConstructionMortgageLoansMember us-gaap:PassMember 2018-12-31 0000910073 us-gaap:MortgageReceivablesMember us-gaap:PassMember 2018-12-31 0000910073 us-gaap:PassMember us-gaap:CommercialAndIndustrialSectorMember 2018-12-31 0000910073 us-gaap:ConsumerPortfolioSegmentMember us-gaap:PassMember 2018-12-31 0000910073 nycb:CommercialIndustrialAndOtherLoansMember us-gaap:PassMember 2018-12-31 0000910073 srt:MultifamilyMember us-gaap:SpecialMentionMember 2018-12-31 0000910073 us-gaap:CommercialRealEstateMember us-gaap:SpecialMentionMember 2018-12-31 0000910073 nycb:AcquisitionDevelopmentAndConstructionMortgageLoansMember us-gaap:SpecialMentionMember 2018-12-31 0000910073 us-gaap:MortgageReceivablesMember us-gaap:SpecialMentionMember 2018-12-31 0000910073 us-gaap:SpecialMentionMember us-gaap:CommercialAndIndustrialSectorMember 2018-12-31 0000910073 nycb:CommercialIndustrialAndOtherLoansMember us-gaap:SpecialMentionMember 2018-12-31 0000910073 srt:MultifamilyMember us-gaap:SubstandardMember 2018-12-31 0000910073 us-gaap:CommercialRealEstateMember us-gaap:SubstandardMember 2018-12-31 0000910073 nycb:OneToFourFamilyMortgageLoansMember us-gaap:SubstandardMember 2018-12-31 0000910073 nycb:AcquisitionDevelopmentAndConstructionMortgageLoansMember us-gaap:SubstandardMember 2018-12-31 0000910073 us-gaap:MortgageReceivablesMember us-gaap:SubstandardMember 2018-12-31 0000910073 us-gaap:SubstandardMember us-gaap:CommercialAndIndustrialSectorMember 2018-12-31 0000910073 us-gaap:ConsumerPortfolioSegmentMember us-gaap:SubstandardMember 2018-12-31 0000910073 nycb:CommercialIndustrialAndOtherLoansMember us-gaap:SubstandardMember 2018-12-31 0000910073 nycb:CommercialIndustrialAndOtherLoansMember 2018-12-31 0000910073 nycb:AccrualLoansMember nycb:NonCoveredLoansMember srt:MultifamilyMember 2018-12-31 0000910073 nycb:AccrualLoansMember nycb:NonCoveredLoansMember us-gaap:CommercialRealEstateMember 2018-12-31 0000910073 nycb:AccrualLoansMember nycb:NonCoveredLoansMember nycb:OneToFourFamilyMortgageLoansMember 2018-12-31 0000910073 nycb:NonCoveredLoansMember nycb:NonAccrualLoansMember us-gaap:CommercialRealEstateMember 2018-12-31 0000910073 nycb:NonCoveredLoansMember nycb:NonAccrualLoansMember nycb:AcquisitionDevelopmentAndConstructionMortgageLoansMember 2018-12-31 0000910073 nycb:NonCoveredLoansMember nycb:NonAccrualLoansMember srt:MultifamilyMember 2018-12-31 0000910073 nycb:NonCoveredLoansMember nycb:NonAccrualLoansMember nycb:OneToFourFamilyMortgageLoansMember 2018-12-31 0000910073 nycb:NonCoveredLoansMember nycb:AccrualLoansMember nycb:AcquisitionDevelopmentAndConstructionMortgageLoansMember 2018-12-31 0000910073 nycb:NonCoveredLoansMember nycb:AcquisitionDevelopmentAndConstructionMortgageLoansMember 2018-12-31 0000910073 nycb:AccrualLoansMember nycb:NonCoveredLoansMember us-gaap:CommercialAndIndustrialSectorMember 2018-12-31 0000910073 nycb:NonAccrualLoansMember nycb:NonCoveredLoansMember us-gaap:CommercialAndIndustrialSectorMember 2018-12-31 0000910073 nycb:NonCoveredLoansMember nycb:AccrualLoansMember 2018-12-31 0000910073 nycb:NonCoveredLoansMember nycb:NonAccrualLoansMember 2018-12-31 0000910073 nycb:OtherLoansMember 2018-12-31 0000910073 nycb:BankMember 2018-12-31 0000910073 us-gaap:FairValueInputsLevel2Member us-gaap:FairValueMeasurementsRecurringMember us-gaap:MortgageBackedSecuritiesMember us-gaap:MortgageBackedSecuritiesIssuedByUSGovernmentSponsoredEnterprisesMember 2018-12-31 0000910073 us-gaap:FairValueMeasurementsRecurringMember us-gaap:MortgageBackedSecuritiesMember us-gaap:MortgageBackedSecuritiesIssuedByUSGovernmentSponsoredEnterprisesMember 2018-12-31 0000910073 us-gaap:FairValueInputsLevel2Member us-gaap:FairValueMeasurementsRecurringMember us-gaap:MortgageBackedSecuritiesMember us-gaap:CollateralizedMortgageObligationsMember 2018-12-31 0000910073 us-gaap:FairValueMeasurementsRecurringMember us-gaap:MortgageBackedSecuritiesMember us-gaap:CollateralizedMortgageObligationsMember 2018-12-31 0000910073 us-gaap:FairValueInputsLevel2Member us-gaap:FairValueMeasurementsRecurringMember us-gaap:MortgageBackedSecuritiesMember 2018-12-31 0000910073 us-gaap:FairValueMeasurementsRecurringMember us-gaap:MortgageBackedSecuritiesMember 2018-12-31 0000910073 us-gaap:FairValueInputsLevel2Member us-gaap:FairValueMeasurementsRecurringMember nycb:OtherSecuritiesMember us-gaap:USGovernmentSponsoredEnterprisesDebtSecuritiesMember 2018-12-31 0000910073 us-gaap:FairValueMeasurementsRecurringMember nycb:OtherSecuritiesMember us-gaap:USGovernmentSponsoredEnterprisesDebtSecuritiesMember 2018-12-31 0000910073 us-gaap:FairValueInputsLevel2Member us-gaap:FairValueMeasurementsRecurringMember nycb:OtherSecuritiesMember us-gaap:AssetBackedSecuritiesMember 2018-12-31 0000910073 us-gaap:FairValueMeasurementsRecurringMember nycb:OtherSecuritiesMember us-gaap:AssetBackedSecuritiesMember 2018-12-31 0000910073 us-gaap:FairValueInputsLevel2Member us-gaap:FairValueMeasurementsRecurringMember nycb:OtherSecuritiesMember us-gaap:MunicipalBondsMember 2018-12-31 0000910073 us-gaap:FairValueMeasurementsRecurringMember nycb:OtherSecuritiesMember us-gaap:MunicipalBondsMember 2018-12-31 0000910073 us-gaap:FairValueInputsLevel2Member us-gaap:FairValueMeasurementsRecurringMember nycb:OtherSecuritiesMember us-gaap:CorporateBondSecuritiesMember 2018-12-31 0000910073 us-gaap:FairValueMeasurementsRecurringMember nycb:OtherSecuritiesMember us-gaap:CorporateBondSecuritiesMember 2018-12-31 0000910073 us-gaap:FairValueInputsLevel2Member us-gaap:FairValueMeasurementsRecurringMember nycb:OtherSecuritiesMember us-gaap:CorporateNoteSecuritiesMember 2018-12-31 0000910073 us-gaap:FairValueMeasurementsRecurringMember nycb:OtherSecuritiesMember us-gaap:CorporateNoteSecuritiesMember 2018-12-31 0000910073 us-gaap:FairValueInputsLevel2Member us-gaap:FairValueMeasurementsRecurringMember nycb:OtherSecuritiesMember 2018-12-31 0000910073 us-gaap:FairValueMeasurementsRecurringMember nycb:OtherSecuritiesMember 2018-12-31 0000910073 us-gaap:FairValueInputsLevel2Member us-gaap:FairValueMeasurementsRecurringMember 2018-12-31 0000910073 us-gaap:FairValueMeasurementsRecurringMember 2018-12-31 0000910073 us-gaap:AvailableforsaleSecuritiesMember 2018-12-31 0000910073 us-gaap:MoneyMarketFundsMember 2018-12-31 0000910073 us-gaap:InterestBearingDepositsMember 2018-12-31 0000910073 us-gaap:CertificatesOfDepositMember 2018-12-31 0000910073 us-gaap:CommercialAndIndustrialSectorMember nycb:OtherLoansMember nycb:SpecialtyFinanceLoansMember 2018-12-31 0000910073 nycb:CommercialAndIndustrialLoansMember us-gaap:CommercialAndIndustrialSectorMember nycb:OtherLoansMember 2018-12-31 0000910073 us-gaap:FairValueInputsLevel3Member us-gaap:FairValueMeasurementsNonrecurringMember 2018-12-31 0000910073 us-gaap:FairValueMeasurementsNonrecurringMember 2018-12-31 0000910073 us-gaap:OtherPostretirementBenefitPlansDefinedBenefitMember 2018-12-31 0000910073 us-gaap:DebtSecuritiesMember us-gaap:CorporateNoteSecuritiesMember 2018-12-31 0000910073 us-gaap:EquitySecuritiesMember 2018-12-31 0000910073 us-gaap:DebtSecuritiesMember 2018-12-31 0000910073 us-gaap:CashEquivalentsMember 2018-12-31 0000910073 nycb:NewYorkCommunityBankMember 2018-12-31 0000910073 srt:ParentCompanyMember 2018-12-31 0000910073 us-gaap:LoanOriginationCommitmentsMember 2018-12-31 0000910073 us-gaap:UnusedLinesOfCreditMember 2018-12-31 0000910073 us-gaap:PensionPlansDefinedBenefitMember 2018-12-31 0000910073 nycb:SupplementalExecutiveRetirementPlanMember 2018-12-31 0000910073 us-gaap:MortgageBackedSecuritiesMember 2018-12-31 0000910073 us-gaap:USGovernmentAgenciesDebtSecuritiesMember 2018-12-31 0000910073 us-gaap:CollateralizedDebtObligationsMember 2018-12-31 0000910073 us-gaap:CorporateNoteSecuritiesMember 2018-12-31 0000910073 us-gaap:MunicipalBondsMember 2018-12-31 0000910073 us-gaap:MutualFundMember 2018-12-31 0000910073 srt:FederalHomeLoanBankOfNewYorkMember 2018-12-31 0000910073 us-gaap:FairValueInputsLevel1Member us-gaap:FairValueMeasurementsRecurringMember us-gaap:PreferredStockMember 2018-12-31 0000910073 us-gaap:FairValueMeasurementsRecurringMember us-gaap:PreferredStockMember 2018-12-31 0000910073 us-gaap:FairValueInputsLevel2Member us-gaap:FairValueMeasurementsRecurringMember nycb:MutualFundsAndCommonStockMember 2018-12-31 0000910073 us-gaap:FairValueMeasurementsRecurringMember nycb:MutualFundsAndCommonStockMember 2018-12-31 0000910073 us-gaap:FairValueInputsLevel1Member us-gaap:FairValueMeasurementsRecurringMember 2018-12-31 0000910073 us-gaap:FairValueInputsLevel1Member 2018-12-31 0000910073 us-gaap:MortgageBackedSecuritiesIssuedByUSGovernmentSponsoredEnterprisesMember us-gaap:MortgageBackedSecuritiesMember 2018-12-31 0000910073 us-gaap:CollateralizedMortgageObligationsMember us-gaap:MortgageBackedSecuritiesMember 2018-12-31 0000910073 us-gaap:MortgageBackedSecuritiesMember 2018-12-31 0000910073 us-gaap:DebtSecuritiesMember us-gaap:USGovernmentSponsoredEnterprisesDebtSecuritiesMember 2018-12-31 0000910073 us-gaap:DebtSecuritiesMember us-gaap:AssetBackedSecuritiesMember 2018-12-31 0000910073 us-gaap:DebtSecuritiesMember us-gaap:MunicipalBondsMember 2018-12-31 0000910073 us-gaap:DebtSecuritiesMember us-gaap:CorporateBondSecuritiesMember 2018-12-31 0000910073 us-gaap:DebtSecuritiesMember us-gaap:CorporateNoteSecuritiesMember 2018-12-31 0000910073 us-gaap:DebtSecuritiesMember 2018-12-31 0000910073 nycb:MortgageBackedSecuritiesAndOtherSecuritiesMember 2018-12-31 0000910073 us-gaap:EquitySecuritiesMember us-gaap:PreferredStockMember 2018-12-31 0000910073 us-gaap:EquitySecuritiesMember nycb:MutualFundsAndCommonStockMember 2018-12-31 0000910073 us-gaap:EquitySecuritiesMember 2018-12-31 0000910073 us-gaap:FairValueInputsLevel2Member 2018-12-31 0000910073 us-gaap:FairValueInputsLevel3Member 2018-12-31 0000910073 nycb:TaxiMedallionLoansMember 2018-12-31 0000910073 us-gaap:CommonStockMember 2018-12-31 0000910073 us-gaap:DesignatedAsHedgingInstrumentMember 2018-12-31 0000910073 us-gaap:CashFlowHedgingMember us-gaap:InterestRateSwapMember 2018-12-31 0000910073 srt:ParentCompanyMember 2017-01-01 2017-12-31 0000910073 nycb:NonCoveredLoansMember 2017-01-01 2017-12-31 0000910073 nycb:AcquisitionDevelopmentAndConstructionMortgageLoansMember 2017-01-01 2017-12-31 0000910073 us-gaap:CommercialAndIndustrialSectorMember 2017-01-01 2017-12-31 0000910073 nycb:OneToFourFamilyMortgageLoansMember 2017-01-01 2017-12-31 0000910073 us-gaap:PensionPlansDefinedBenefitMember 2017-01-01 2017-12-31 0000910073 us-gaap:OtherPostretirementBenefitPlansDefinedBenefitMember 2017-01-01 2017-12-31 0000910073 nycb:LoansHeldForSaleMember 2017-01-01 2017-12-31 0000910073 nycb:MortgageServicingRightsMember 2017-01-01 2017-12-31 0000910073 nycb:NewYorkCommunityBankMember 2017-01-01 2017-12-31 0000910073 us-gaap:RetainedEarningsMember 2017-01-01 2017-12-31 0000910073 nycb:StockIncentivePlanTwentyTwelveMember us-gaap:RestrictedStockMember 2017-01-01 2017-12-31 0000910073 srt:FederalHomeLoanBankOfNewYorkMember 2017-01-01 2017-12-31 0000910073 us-gaap:RestrictedStockMember 2017-01-01 2017-12-31 0000910073 us-gaap:PreferredStockMember 2017-01-01 2017-12-31 0000910073 us-gaap:AdditionalPaidInCapitalMember 2017-01-01 2017-12-31 0000910073 us-gaap:TreasuryStockMember 2017-01-01 2017-12-31 0000910073 us-gaap:CommonStockMember 2017-01-01 2017-12-31 0000910073 us-gaap:FederalHomeLoanBankAdvancesMember 2017-01-01 2017-12-31 0000910073 us-gaap:SecuritiesSoldUnderAgreementsToRepurchaseMember 2017-01-01 2017-12-31 0000910073 us-gaap:JuniorSubordinatedDebtMember 2017-01-01 2017-12-31 0000910073 nycb:CoveredLoansMember 2017-01-01 2017-12-31 0000910073 us-gaap:AccumulatedOtherComprehensiveIncomeMember 2017-01-01 2017-12-31 0000910073 srt:ParentCompanyMember 2018-01-01 2018-12-31 0000910073 nycb:NonCoveredLoansMember 2018-01-01 2018-12-31 0000910073 us-gaap:CommercialAndIndustrialSectorMember 2018-01-01 2018-12-31 0000910073 nycb:AcquisitionDevelopmentAndConstructionMortgageLoansMember 2018-01-01 2018-12-31 0000910073 us-gaap:PensionPlansDefinedBenefitMember 2018-01-01 2018-12-31 0000910073 us-gaap:OtherPostretirementBenefitPlansDefinedBenefitMember 2018-01-01 2018-12-31 0000910073 us-gaap:MortgageReceivablesMember 2018-01-01 2018-12-31 0000910073 nycb:OtherLoansMember 2018-01-01 2018-12-31 0000910073 nycb:MortgageServicingRightsMember 2018-01-01 2018-12-31 0000910073 srt:MultifamilyMember 2018-01-01 2018-12-31 0000910073 nycb:OneToFourFamilyMortgageLoansMember 2018-01-01 2018-12-31 0000910073 us-gaap:CommercialRealEstateMember 2018-01-01 2018-12-31 0000910073 us-gaap:MortgageReceivablesMember nycb:NonCoveredLoansMember 2018-01-01 2018-12-31 0000910073 nycb:NonCoveredLoansMember nycb:OtherLoansMember 2018-01-01 2018-12-31 0000910073 nycb:NewYorkCommunityBankMember 2018-01-01 2018-12-31 0000910073 us-gaap:PreferredStockMember 2018-01-01 2018-12-31 0000910073 us-gaap:RetainedEarningsMember 2018-01-01 2018-12-31 0000910073 nycb:StockIncentivePlanTwentyTwelveMember us-gaap:RestrictedStockMember 2018-01-01 2018-12-31 0000910073 srt:FederalHomeLoanBankOfNewYorkMember 2018-01-01 2018-12-31 0000910073 us-gaap:RestrictedStockMember 2018-01-01 2018-12-31 0000910073 us-gaap:AdditionalPaidInCapitalMember 2018-01-01 2018-12-31 0000910073 us-gaap:TreasuryStockMember 2018-01-01 2018-12-31 0000910073 us-gaap:CommonStockMember 2018-01-01 2018-12-31 0000910073 us-gaap:FederalHomeLoanBankAdvancesMember 2018-01-01 2018-12-31 0000910073 us-gaap:SecuritiesSoldUnderAgreementsToRepurchaseMember 2018-01-01 2018-12-31 0000910073 us-gaap:JuniorSubordinatedDebtMember 2018-01-01 2018-12-31 0000910073 us-gaap:RetainedEarningsMember us-gaap:AccountingStandardsUpdate201601Member 2018-01-01 2018-12-31 0000910073 us-gaap:AccountingStandardsUpdate201601Member 2018-01-01 2018-12-31 0000910073 us-gaap:RetainedEarningsMember us-gaap:AccountingStandardsUpdate201802Member 2018-01-01 2018-12-31 0000910073 us-gaap:AccumulatedOtherComprehensiveIncomeMember us-gaap:AccountingStandardsUpdate201802Member 2018-01-01 2018-12-31 0000910073 us-gaap:NewJerseyDivisionOfTaxationMember 2018-01-01 2018-12-31 0000910073 us-gaap:AccumulatedOtherComprehensiveIncomeMember 2018-01-01 2018-12-31 0000910073 nycb:NewYorkCommunityBankMember 2019-01-01 2019-12-31 0000910073 srt:ParentCompanyMember 2019-01-01 2019-12-31 0000910073 nycb:NonCoveredLoansMember 2019-01-01 2019-12-31 0000910073 us-gaap:CommercialAndIndustrialSectorMember 2019-01-01 2019-12-31 0000910073 nycb:OneToFourFamilyMortgageLoansMember 2019-01-01 2019-12-31 0000910073 us-gaap:PensionPlansDefinedBenefitMember 2019-01-01 2019-12-31 0000910073 us-gaap:OtherPostretirementBenefitPlansDefinedBenefitMember 2019-01-01 2019-12-31 0000910073 us-gaap:MortgageReceivablesMember 2019-01-01 2019-12-31 0000910073 nycb:OtherLoansMember 2019-01-01 2019-12-31 0000910073 us-gaap:RestrictedStockMember 2019-01-01 2019-12-31 0000910073 nycb:NewYorkCommunityBankMember us-gaap:ShareBasedCompensationAwardTrancheOneMember 2019-01-01 2019-12-31 0000910073 nycb:NewYorkCommunityBankMember us-gaap:ShareBasedCompensationAwardTrancheTwoMember 2019-01-01 2019-12-31 0000910073 us-gaap:ReclassificationOutOfAccumulatedOtherComprehensiveIncomeMember us-gaap:AccumulatedNetUnrealizedInvestmentGainLossMember 2019-01-01 2019-12-31 0000910073 srt:MultifamilyMember 2019-01-01 2019-12-31 0000910073 us-gaap:CommercialRealEstateMember 2019-01-01 2019-12-31 0000910073 nycb:AcquisitionDevelopmentAndConstructionMortgageLoansMember 2019-01-01 2019-12-31 0000910073 us-gaap:MortgageReceivablesMember nycb:NonCoveredLoansMember 2019-01-01 2019-12-31 0000910073 nycb:OtherLoansMember nycb:NonCoveredLoansMember 2019-01-01 2019-12-31 0000910073 us-gaap:AccumulatedGainLossNetCashFlowHedgeParentMember us-gaap:ReclassificationOutOfAccumulatedOtherComprehensiveIncomeMember 2019-01-01 2019-12-31 0000910073 nycb:FinancingReceivableTroubledDebtRestructuringsRateReductionsMember 2019-01-01 2019-12-31 0000910073 nycb:FinancingReceivableTroubledDebtRestructuringsForbearanceOfArrearsMember 2019-01-01 2019-12-31 0000910073 us-gaap:RetainedEarningsMember 2019-01-01 2019-12-31 0000910073 us-gaap:AccumulatedDefinedBenefitPlansAdjustmentNetPriorServiceCostCreditMember 2019-01-01 2019-12-31 0000910073 us-gaap:AccumulatedDefinedBenefitPlansAdjustmentNetUnamortizedGainLossMember 2019-01-01 2019-12-31 0000910073 us-gaap:AccumulatedDefinedBenefitPlansAdjustmentMember 2019-01-01 2019-12-31 0000910073 nycb:NewYorkCommunityCapitalTrustVMember 2019-01-01 2019-12-31 0000910073 nycb:NewYorkCommunityCapitalTrustXMember 2019-01-01 2019-12-31 0000910073 nycb:PennFedCapitalTrustIIIMember 2019-01-01 2019-12-31 0000910073 nycb:NewYorkCommunityCapitalTrustXIMember 2019-01-01 2019-12-31 0000910073 nycb:StockIncentivePlanTwentyTwelveMember us-gaap:RestrictedStockMember 2019-01-01 2019-12-31 0000910073 nycb:PerformanceBasedRestrictedStockUnitsMember 2019-01-01 2019-12-31 0000910073 srt:FederalHomeLoanBankOfNewYorkMember 2019-01-01 2019-12-31 0000910073 us-gaap:TreasuryStockMember 2019-01-01 2019-12-31 0000910073 us-gaap:AdditionalPaidInCapitalMember 2019-01-01 2019-12-31 0000910073 srt:MinimumMember 2019-01-01 2019-12-31 0000910073 srt:MaximumMember 2019-01-01 2019-12-31 0000910073 us-gaap:FederalHomeLoanBankAdvancesMember 2019-01-01 2019-12-31 0000910073 us-gaap:SecuritiesSoldUnderAgreementsToRepurchaseMember 2019-01-01 2019-12-31 0000910073 us-gaap:JuniorSubordinatedDebtMember 2019-01-01 2019-12-31 0000910073 us-gaap:CommonStockMember 2019-01-01 2019-12-31 0000910073 srt:MinimumMember us-gaap:FurnitureAndFixturesMember 2019-01-01 2019-12-31 0000910073 us-gaap:FurnitureAndFixturesMember srt:MaximumMember 2019-01-01 2019-12-31 0000910073 us-gaap:EquipmentMember srt:MaximumMember 2019-01-01 2019-12-31 0000910073 us-gaap:EquipmentMember srt:MinimumMember 2019-01-01 2019-12-31 0000910073 us-gaap:BuildingMember 2019-01-01 2019-12-31 0000910073 nycb:NewYorkCommunityCapitalTrustVMember nycb:BifurcatedOptionNoteUnitSecuritiEssmMember 2019-01-01 2019-12-31 0000910073 us-gaap:DesignatedAsHedgingInstrumentMember 2019-01-01 2019-12-31 0000910073 us-gaap:SubordinatedDebtMember 2019-01-01 2019-12-31 0000910073 us-gaap:SegmentDiscontinuedOperationsMember 2019-01-01 2019-12-31 0000910073 us-gaap:AccumulatedOtherComprehensiveIncomeMember 2019-01-01 2019-12-31 0000910073 us-gaap:InterestIncomeMember us-gaap:InterestRateSwapMember 2019-01-01 2019-12-31 0000910073 us-gaap:InterestIncomeMember us-gaap:DesignatedAsHedgingInstrumentMember 2019-01-01 2019-12-31 0000910073 us-gaap:OtherIncomeMember 2019-01-01 2019-12-31 0000910073 us-gaap:InterestRateSwapMember us-gaap:CashFlowHedgingMember 2019-01-01 2019-12-31 0000910073 nycb:BifurcatedOptionNoteUnitSecuritiesMember 2019-01-01 2019-12-31 0000910073 nycb:FixedToFloatingRateSeriesANoncumulativePerpetualPreferredStockMember 2019-01-01 2019-12-31 0000910073 us-gaap:CommonStockMember 2019-01-01 2019-12-31 0000910073 nycb:PeterBCannellAndCoMember 2019-01-01 2019-12-31 0000910073 us-gaap:IPOMember 1993-11-23 0000910073 us-gaap:OtherPostretirementBenefitPlansDefinedBenefitMember 2017-12-31 0000910073 nycb:NewYorkCommunityBankMember 2017-12-31 0000910073 nycb:DepositarySharesMember nycb:SeriesANoncumulativePreferredStockMember 2017-02-17 2017-03-17 0000910073 nycb:DepositarySharesMember nycb:SeriesANoncumulativePreferredStockMember 2017-03-17 0000910073 us-gaap:CommonStockMember 2018-10-23 0000910073 nycb:NewYorkCommunityCapitalTrustVMember nycb:BifurcatedOptionNoteUnitSecuritiEssmMember us-gaap:CapitalUnitsMember 2002-11-04 0000910073 nycb:NewYorkCommunityCapitalTrustVMember nycb:BifurcatedOptionNoteUnitSecuritiEssmMember 2002-11-04 0000910073 nycb:NewYorkCommunityCapitalTrustVMember nycb:BifurcatedOptionNoteUnitSecuritiEssmMember 2002-11-04 2002-11-04 0000910073 us-gaap:CapitalUnitsMember nycb:BifurcatedOptionNoteUnitSecuritiEssmMember nycb:NewYorkCommunityCapitalTrustVMember 2002-11-04 2002-11-04 0000910073 nycb:NewYorkCommunityCapitalTrustVMember nycb:BifurcatedOptionNoteUnitSecuritiEssmMember us-gaap:WarrantMember 2002-11-04 2002-11-04 0000910073 us-gaap:CommonStockMember 2016-12-31 0000910073 us-gaap:AdditionalPaidInCapitalMember 2016-12-31 0000910073 us-gaap:RetainedEarningsMember 2016-12-31 0000910073 us-gaap:TreasuryStockMember 2016-12-31 0000910073 us-gaap:AccumulatedOtherComprehensiveIncomeMember 2016-12-31 0000910073 srt:ParentCompanyMember 2016-12-31 0000910073 srt:ParentCompanyMember 2017-12-31 0000910073 us-gaap:PreferredStockMember 2017-12-31 0000910073 us-gaap:CommonStockMember 2017-12-31 0000910073 us-gaap:AdditionalPaidInCapitalMember 2017-12-31 0000910073 us-gaap:RetainedEarningsMember 2017-12-31 0000910073 us-gaap:TreasuryStockMember 2017-12-31 0000910073 us-gaap:AccumulatedOtherComprehensiveIncomeMember 2017-12-31 0000910073 us-gaap:MortgageReceivablesMember 2017-12-31 0000910073 nycb:OtherLoansMember 2017-12-31 0000910073 us-gaap:PensionPlansDefinedBenefitMember 2017-12-31 0000910073 us-gaap:PreferredStockMember 2018-12-31 0000910073 us-gaap:AdditionalPaidInCapitalMember 2018-12-31 0000910073 us-gaap:RetainedEarningsMember 2018-12-31 0000910073 us-gaap:TreasuryStockMember 2018-12-31 0000910073 us-gaap:AccumulatedOtherComprehensiveIncomeMember 2018-12-31 0000910073 us-gaap:PreferredStockMember 2019-12-31 0000910073 us-gaap:AdditionalPaidInCapitalMember 2019-12-31 0000910073 us-gaap:RetainedEarningsMember 2019-12-31 0000910073 us-gaap:TreasuryStockMember 2019-12-31 0000910073 us-gaap:AccumulatedOtherComprehensiveIncomeMember 2019-12-31 iso4217:USD xbrli:pure xbrli:shares iso4217:USD xbrli:shares nycb:Investment nycb:Stock nycb:age nycb:Location
Table of Contents
 
 
UNITED STATES
SECURITIES AND EXCHANGE COMMISSION
Washington, D.C. 20549
 
FORM
10-K
 
ANNUAL REPORT PURSUANT TO SECTION 13 OR 15(d) OF THE SECURITIES EXCHANGE ACT OF 1934
For the fiscal year ended: December 31, 2019
 
TRANSITION REPORT PURSUANT TO SECTION 13 OR 15(d) OF THE SECURITIES EXCHANGE ACT OF 1934
For the transition period from
                
to
                
Commission File Number
1-31565
 
NEW YORK COMMUNITY BANCORP, INC.
(Exact name of registrant as specified in its charter)
 
Delaware
 
06-1377322
(State or other jurisdiction
of incorporation or organization)
 
(I.R.S. Employer
Identification No.)
 
615 Merrick Avenue, Westbury, New York 11590
(Address of principal executive offices) (Zip code)
(516)
683-4100
(Registrant’s telephone number, including area code)
Securities registered pursuant to Section 12(b) of the Act:
Title of each class
 
Trading
Symbol(s)
 
Name of exchange
on which registered
Common Stock, $0.01 par value per share
 
NYCB
 
New York Stock Exchange
Bifurcated Option Note Unit SecuritiES
SM
 
NYCB PU
 
New York Stock Exchange
Depositary Shares each representing a 1/40
th
interest in a share of
Fixed-to-Floating
Rate Series A Noncumulative
Perpetual Preferred Stock
 
NYCB PA
 
New York Stock Exchange
Securities registered pursuant to Section 12(g) of the Act: None
 
Indicate by check mark if the registrant is a well-known seasoned issuer, as defined in Rule 405 of the Securities Act.    Yes  
    No  
Indicate by check mark if the registrant is not required to file reports pursuant to Section 13 or 15(d) of the Act.    Yes  
    No  
Indicate by check mark whether the registrant (1) has filed all reports required to be filed by Section 13 or 15(d) of the Securities Exchange Act of 1934 during the preceding 12 months (or for such shorter period that the registrant was required to file such reports), and (2) has been subject to such filing requirements for the past 90 days.    Yes  
    No  
Indicate by check mark whether the registrant has submitted electronically every Interactive Data File required to be submitted pursuant to Rule 405 of Regulation
S-T
(§232.405 of this chapter) during the preceding 12 months (or for such shorter period that the registrant was required to submit such files).    Yes  
    No  
Indicate by check mark whether the registrant is a large accelerated filer, an accelerated filer, a
non-accelerated
filer, a smaller reporting company, or an emerging growth company. See the definitions of “large accelerated filer,” “accelerated filer,” “smaller reporting company,” and “emerging growth company” in Rule
12b-2
of the Exchange Act.
Large Accelerated Filer
 
 
Accelerated Filer
 
             
Non-Accelerated Filer
 
 
Smaller Reporting Company


Emerging Growth Company
 
If an emerging growth company, indicate by check mark if the registrant has elected not to use the extended transition period for complying with any new or revised financial accounting standards provided pursuant to Section 13(a) of the Exchange Act  ☐
Indicate by check mark whether the registrant is a shell company (as defined in Rule
12b-2
of the Act).    Yes  
    No  
As of June 30, 2019, the aggregate market value of the shares of common stock outstanding of the registrant was $4.5 billion, excluding 14,381,473 shares held by all directors and executive officers of the registrant. This figure is based on the closing price of the registrant’s common stock on June 28, 2019, $9.98 per share, as reported by the New York Stock Exchange.
The number of shares of the registrant’s common stock outstanding as of February 19, 2020 was 467,301,496 shares.
Documents Incorporated by Reference
Portions of the definitive Proxy Statement for the Annual Meeting of Shareholders to be held on June 3, 2020 are incorporated by reference into Part III.


Table of Contents
CROSS REFERENCE INDEX
 
Page
 
   
1
 
   
3


7
 
     
19
 
     
31
 
     
31
 
     
31
 
     
31


32
 
     
35
 
     
36
 
     
70
 
     
76
 
     
134
 
     
134
 
     
135


135
 
     
135
 
     
135
 
     
136
 
     
136


137
 
     
139


140
 
         
Certifications


Table of Contents
For the purpose of this Annual Report on Form
10-K,
the words “we,” “us,” “our,” and the “Company” are used to refer to New York Community Bancorp, Inc. and our consolidated subsidiary, New York Community Bank (the “Bank”).
CAUTIONARY STATEMENT REGARDING FORWARD-LOOKING LANGUAGE
This report, like many written and oral communications presented by New York Community Bancorp, Inc. and our authorized officers, may contain certain forward-looking statements regarding our prospective performance and strategies within the meaning of Section 27A of the Securities Act of 1933, as amended, and Section 21E of the Securities Exchange Act of 1934, as amended. We intend such forward-looking statements to be covered by the safe harbor provisions for forward-looking statements contained in the Private Securities Litigation Reform Act of 1995, and are including this statement for purposes of said safe harbor provisions.
Forward-looking statements, which are based on certain assumptions and describe future plans, strategies, and expectations of the Company, are generally identified by use of the words “anticipate,” “believe,” “estimate,” “expect,” “intend,” “plan,” “project,” “seek,” “strive,” “try,” or future or conditional verbs such as “will,” “would,” “should,” “could,” “may,” or similar expressions. Although we believe that our plans, intentions, and expectations as reflected in these forward-looking statements are reasonable, we can give no assurance that they will be achieved or realized.
Our ability to predict results or the actual effects of our plans and strategies is inherently uncertain. Accordingly, actual results, performance, or achievements could differ materially from those contemplated, expressed, or implied by the forward-looking statements contained in this report.
There are a number of factors, many of which are beyond our control, that could cause actual conditions, events, or results to differ significantly from those described in our forward-looking statements. These factors include, but are not limited to:
  general economic conditions, either nationally or in some or all of the areas in which we and our customers conduct our respective businesses;
  conditions in the securities markets and real estate markets or the banking industry;
  changes in real estate values, which could impact the quality of the assets securing the loans in our portfolio;
  changes in interest rates, which may affect our net income, prepayment penalty income, and other future cash flows, or the market value of our assets, including our investment securities;
  any uncertainty relating to the LIBOR calculation process and the phasing out of LIBOR after 2021;
  changes in the quality or composition of our loan or securities portfolios;
  changes in our capital management policies, including those regarding business combinations, dividends, and share repurchases, among others;
  heightened regulatory focus on CRE concentrations;
  changes in competitive pressures among financial institutions or from
non-financial
institutions;
  changes in deposit flows and wholesale borrowing facilities;
  changes in the demand for deposit, loan, and investment products and other financial services in the markets we serve;
  our timely development of new lines of business and competitive products or services in a changing environment, and the acceptance of such products or services by our customers;
  our ability to obtain timely shareholder and regulatory approvals of any merger transactions or corporate restructurings we may propose;
  our ability to successfully integrate any assets, liabilities, customers, systems, and management personnel we may acquire into our operations, and our ability to realize related revenue synergies and cost savings within expected time frames;
  potential exposure to unknown or contingent liabilities of companies we have acquired, may acquire, or target for acquisition;
  the ability to invest effectively in new information technology systems and platforms;
  changes in future ALLL requirements based on our periodic review under relevant accounting and regulatory requirements;
  the ability to pay future dividends at currently expected rates;
  the ability to hire and retain key personnel;
  the ability to attract new customers and retain existing ones in the manner anticipated;
  changes in our customer base or in the financial or operating performances of our customers’ businesses;
  any interruption in customer service due to circumstances beyond our control;
1

Table of Contents
  the outcome of pending or threatened litigation, or of matters before regulatory agencies, whether currently existing or commencing in the future;
  environmental conditions that exist or may exist on properties owned by, leased by, or mortgaged to the Company;
  any interruption or breach of security resulting in failures or disruptions in customer account management, general ledger, deposit, loan, or other systems;
  operational issues stemming from, and/or capital spending necessitated by, the potential need to adapt to industry changes in information technology systems, on which we are highly dependent;
  the ability to keep pace with, and implement on a timely basis, technological changes;
  changes in legislation, regulation, policies, or administrative practices, whether by judicial, governmental, or legislative action, and other changes pertaining to banking, securities, taxation, rent regulation and housing (the Housing Stability and Tenant Protection Act of 2019), financial accounting and reporting, environmental protection, insurance, and the ability to comply with such changes in a timely manner;
  changes in the monetary and fiscal policies of the U.S. Government, including policies of the U.S. Department of the Treasury and the Board of Governors of the Federal Reserve System;
  changes in accounting principles, policies, practices, and guidelines;
  changes in regulatory expectations relating to predictive models we use in connection with stress testing and other forecasting or in the assumptions on which such modeling and forecasting are predicated;
  changes in our credit ratings or in our ability to access the capital markets;
  unforeseen or catastrophic events including natural disasters, war, terrorist activities, and the emergence of a pandemic; and
  other economic, competitive, governmental, regulatory, technological, and geopolitical factors affecting our operations, pricing, and services.
In addition, the timing and occurrence or
non-occurrence
of events may be subject to circumstances beyond our control.
Furthermore, we routinely evaluate opportunities to expand through acquisitions and conduct due diligence activities in connection with such opportunities. As a result, acquisition discussions and, in some cases, negotiations, may take place at any time, and acquisitions involving cash or our debt or equity securities may occur.
See Item 1A, “Risk Factors” in this annual report and in our other SEC filings for a further discussion of important risk factors that could cause actual results to differ materially from our forward-looking statements.
Readers should not place undue reliance on these forward-looking statements, which reflect our expectations only as of the date of this report. We do not assume any obligation to revise or update these forward-looking statements except as may be required by law.
2

Table of Contents
GLOSSARY
BASIS POINT
Throughout this filing, the year-over-year changes that occur in certain financial measures are reported in terms of basis points. Each basis point is equal to one hundredth of a percentage point, or 0.01%.
BOOK VALUE PER COMMON SHARE
Book value per common share refers to the amount of common stockholders’ equity attributable to each outstanding share of common stock, and is calculated by dividing total stockholders’ equity less preferred stock at the end of a period, by the number of shares outstanding at the same date.
BROKERED DEPOSITS
Refers to funds obtained, directly or indirectly, by or through deposit brokers that are then deposited into one or more deposit accounts at a bank.
CHARGE-OFF
Refers to the amount of a loan balance that has been written off against the allowance for loan losses.
COMMERCIAL REAL ESTATE LOAN
A mortgage loan secured by either an income-producing property owned by an investor and leased primarily for commercial purposes or, to a lesser extent, an owner-occupied building used for business purposes. The CRE loans in our portfolio are typically secured by either office buildings, retail shopping centers, light industrial centers with multiple tenants, or
mixed-use
properties.
COST OF FUNDS
The interest expense associated with interest-bearing liabilities, typically expressed as a ratio of interest expense to the average balance of interest-bearing liabilities for a given period.
CRE CONCENTRATION RATIO
Refers to the sum of multi-family,
non-owner
occupied CRE, and acquisition, development, and construction (“ADC”) loans divided by total risk-based capital.
DEBT SERVICE COVERAGE RATIO
An indication of a borrower’s ability to repay a loan, the DSCR generally measures the cash flows available to a borrower over the course of a year as a percentage of the annual interest and principal payments owed during that time.
DERIVATIVE
A term used to define a broad base of financial instruments, including swaps, options, and futures contracts, whose value is based upon, or derived from, an underlying rate, price, or index (such as interest rates, foreign currency, commodities, or prices of other financial instruments such as stocks or bonds).
DIVIDEND PAYOUT RATIO
The percentage of our earnings that is paid out to shareholders in the form of dividends. It is determined by dividing the dividend paid per share during a period by our diluted earnings per share during the same period of time.
EFFICIENCY RATIO
Measures total operating expenses as a percentage of the sum of net interest income and
non-interest
income.
GOODWILL
Refers to the difference between the purchase price and the fair value of an acquired company’s assets, net of the liabilities assumed. Goodwill is reflected as an asset on the balance sheet and is tested at least annually for impairment.
3

Table of Contents
GOVERNMENT-SPONSORED ENTERPRISES
Refers to a group of financial services corporations that were created by the United States Congress to enhance the availability, and reduce the cost of, credit to certain targeted borrowing sectors, including home finance. The GSEs include, but are not limited to, the Federal National Mortgage Association (“Fannie Mae”), the Federal Home Loan Mortgage Corporation (“Freddie Mac”), and the Federal Home Loan Banks (the “FHLBs”).
GSE OBLIGATIONS
Refers to GSE mortgage-related securities (both certificates and collateralized mortgage obligations) and GSE debentures.
INTEREST RATE SENSITIVITY
Refers to the likelihood that the interest earned on assets and the interest paid on liabilities will change as a result of fluctuations in market interest rates.
INTEREST RATE SPREAD
The difference between the yield earned on average interest-earning assets and the cost of average interest-bearing liabilities.
LOAN-TO-VALUE
RATIO
Measures the balance of a loan as a percentage of the appraised value of the underlying property.
MULTI-FAMILY LOAN
A mortgage loan secured by a rental or cooperative apartment building with more than four units.
NET INTEREST INCOME
The difference between the interest income generated by loans and securities and the interest expense produced by deposits and borrowed funds.
NET INTEREST MARGIN
Measures net interest income as a percentage of average interest-earning assets.
NON-ACCRUAL
LOAN
A loan generally is classified as a
“non-accrual”
loan when it is 90 days or more past due or when it is deemed to be impaired because we no longer expect to collect all amounts due according to the contractual terms of the loan agreement. When a loan is placed on
non-accrual
status, we cease the accrual of interest owed, and previously accrued interest is reversed and charged against interest income. A loan generally is returned to accrual status when the loan is current and we have reasonable assurance that the loan will be fully collectible.
NON-PERFORMING
LOANS AND ASSETS
Non-performing
loans consist of
non-accrual
loans and loans that are 90 days or more past due and still accruing interest.
Non-performing
assets consist of
non-performing
loans, OREO and other repossessed assets.
OREO AND OTHER REPOSSESSED ASSETS
Includes real estate owned by the Company which was acquired either through foreclosure or default. Repossessed assets are similar, except they are not real estate-related assets.
RENT-REGULATED APARTMENTS
In New York City, where the vast majority of the properties securing our multi-family loans are located, the amount of rent that tenants may be charged on the apartments in certain buildings is restricted under rent-stabilization laws. Rent-stabilized apartments are generally located in buildings with six or more units that were built between February 1947 and January 1974. Rent-regulated apartments tend to be more affordable to live in because of the applicable regulations, and buildings with a preponderance of such rent-regulated apartments are therefore less likely to experience vacancies in times of economic adversity.
4

Table of Contents
REPURCHASE AGREEMENTS
Repurchase agreements are contracts for the sale of securities owned or borrowed by the Bank with an agreement to repurchase those securities at an agreed-upon price and date. The Bank’s repurchase agreements are primarily collateralized by GSE obligations and other mortgage-related securities, and are entered into with either the FHLBs or various brokerage firms.
SYSTEMICALLY IMPORTANT FINANCIAL INSTITUTION (“SIFI”)
A bank holding company with total consolidated assets that average more than $250 billion over the four most recent quarters is designated a “Systemically Important Financial Institution” under the Dodd-Frank Wall Street Reform and Consumer Protection Act (the “Dodd-Frank Act”) of 2010, as amended by the Economic Growth, Regulatory Relief, and Consumer Protection Act of 2018.
WHOLESALE BORROWINGS
Refers to advances drawn by the Bank against its line(s) of credit with the FHLBs, their repurchase agreements with the FHLBs and various brokerage firms, and federal funds purchased.
YIELD
The interest income associated with interest-earning assets, typically expressed as a ratio of interest income to the average balance of interest-earning assets for a given period.
5

Table of Contents
LIST OF ABBREVIATIONS AND ACRONYMS
     
ADC—Acquisition, development, and construction loan
 
ALCO—Asset and Liability Management Committee
 
AMT—Alternative minimum tax
 
AmTrust—AmTrust Bank
 
AOCL—Accumulated other comprehensive loss
 
ASC—Accounting Standards Codification
 
ASU—Accounting Standards Update
 
BOLI—Bank-owned life insurance
 
BP—Basis point(s)
 
C&I—Commercial and industrial loan
 
CCAR—Comprehensive Capital Analysis and Review
 
CDs—Certificates of deposit
 
CECL—Current Expected Credit Loss
 
CFPB—Consumer Financial Protection Bureau
 
CMOs—Collateralized mortgage obligations
 
CMT—Constant maturity treasury rate
 
CPI—Consumer Price Index
 
CPR—Constant prepayment rate
 
CRA—Community Reinvestment Act
 
CRE—Commercial real estate loan
 
Desert Hills—Desert Hills Bank
 
DIF—Deposit Insurance Fund
 
DFA—Dodd-Frank Wall Street Reform and Consumer Protection Act
 
DSCR—Debt service coverage ratio
 
EaR—Earnings at Risk
 
EPS—Earnings per common share
 
ERM—Enterprise Risk Management
 
ESOP—Employee Stock Ownership Plan
 
EVE—Economic Value of Equity at Risk
 
Fannie Mae—Federal National Mortgage Association
 
FASB—Financial Accounting Standards Board
 
FDI Act—Federal Deposit Insurance Act
 
FDIC—Federal Deposit Insurance Corporation
 
FHLB—Federal Home Loan Bank
 
FHLB-NY—Federal
Home Loan Bank of New York
 
FOMC—Federal Open Market Committee
 
FRB—Federal Reserve Board
 
FRB-NY—Federal
Reserve Bank of New York
 
Freddie Mac—Federal Home Loan Mortgage Corporation
 
FTEs—Full-time equivalent employees
 
GAAP—U.S. generally accepted accounting principles
 
GLBA—The Gramm Leach Bliley Act
 
GNMA—Government National Mortgage Association
 
GSEs—Government-sponsored enterprises
 
HQLAs—High-quality liquid assets
 
LIBOR—London Interbank Offered Rate
 
LSA—Loss Share Agreements
 
LTV—Loan-to-value
ratio
 
MBS—Mortgage-backed securities
 
MSRs—Mortgage servicing rights
 
NIM—Net interest margin
 
NOL—Net operating loss
 
NPAs—Non-performing
assets
 
NPLs—Non-performing
loans
 
NPV—Net Portfolio Value
 
NYSDFS—New York State Department of Financial Services
 
NYSE—New York Stock Exchange
 
OCC—Office of the Comptroller of the Currency
 
OFAC—Office of Foreign Assets Control
 
OREO—Other real estate owned
 
OTTI—Other-than-temporary impairment
 
ROU—Right of use asset
 
SEC—U.S. Securities and Exchange Commission
 
SIFI—Systemically Important Financial Institution
 
TDRs—Troubled debt restructurings


6

Table of Contents
PART I
ITEM 1.
BUSINESS


General
New York Community Bancorp, Inc., (on a stand-alone basis, the “Parent Company” or, collectively with its subsidiaries, the “Company”) was organized under Delaware law on July 20, 1993 and is the bank holding company for New York Community Bank (hereinafter referred to as the “Bank”). Formerly known as Queens County Savings Bank, the Bank converted from a state-chartered mutual savings bank to the capital stock form of ownership on November 23, 1993, at which date the Company completed its initial offering of common stock (par value: $0.01 per share) at a price of $25.00 per share ($0.93 per share on a split-adjusted basis, reflecting the impact of nine stock splits between 1994 and 2004).
New York Community Bank
Established in 1859, the Bank is a New York State-chartered savings bank with 238 branches that currently operates through eight local divisions, each with a history of strength and service: Queens County Savings Bank, Roslyn Savings Bank, Richmond County Savings Bank, Roosevelt Savings Bank, and Atlantic Bank in New York; Garden State Community Bank in New Jersey; Ohio Savings Bank in Ohio: and AmTrust Bank in Florida and Arizona. We compete for depositors in these diverse markets by emphasizing service and convenience, with a comprehensive menu of traditional and
non-traditional
products and services, and access to multiple service channels, including online banking, mobile banking, and banking by phone.
We also are a leading producer of multi-family loans in New York City, with an emphasis on
non-luxury
residential apartment buildings with rent-regulated units that feature below-market rents. In addition to multi-family loans, which are our principal asset, we originate CRE loans (primarily in New York City), specialty finance loans and leases, and, to a much lesser extent, ADC loans, and C&I loans (typically made to small and
mid-size
business in Metro New York).
Online Information about the Company and the Bank
We also serve our customers through our website: www.myNYCB.com. In addition to providing our customers with
24-hour
access to their accounts, and information regarding our products and services, hours of service, and locations, the website provides extensive information about the Company for the investment community. Earnings releases, dividend announcements, and other press releases are posted upon issuance to the Investor Relations portion of the website.
In addition, our filings with the SEC (including our annual report on Form
10-K;
our quarterly reports on Form
10-Q;
and our current reports on Form
8-K),
and all amendments to those reports filed or furnished pursuant to Section 13(a) or 15(d) of the Securities Exchange Act of 1934, are available without charge, and are posted to the Investor Relations portion of our website. The website also provides information regarding our Board of Directors and management team, as well as certain Board Committee charters and our corporate governance policies. The content of our website shall not be deemed to be incorporated by reference into this Annual Report.
Our Market
Our current market for deposits consists of the 26 counties in the five states that are served by our branch network, including all five boroughs of New York City, Nassau and Suffolk Counties on Long Island, and Westchester County in New York; Essex, Hudson, Mercer, Middlesex, Monmouth, Ocean, and Union Counties in New Jersey; Maricopa and Yavapai Counties in Arizona; Cuyahoga, Lake, and Summit Counties in Ohio; and Broward, Collier, Lee, Miami-Dade, Palm Beach, and St. Lucie Counties in Florida.
The market for the loans we produce varies, depending on the type of loan. For example, the vast majority of our multi-family loans are collateralized by rental apartment buildings in New York City, which is also home to the majority of the properties collateralizing our CRE and ADC loans. In contrast, our specialty finance loans and leases are generally made to large corporate obligors that participate in stable industries nationwide.
Competition for Deposits
The combined population of the 26 counties where our branches are located is approximately 31.5 million, and the number of banks and thrifts we compete with currently exceeds 300. With total deposits of $31.7 billion at December 31, 2019, we ranked twelfth among all bank and thrift depositories serving these 26 counties. We also
7

Table of Contents
ranked fourth among all banks and thrifts in Union County, New Jersey, third among all banks and thrifts in Richmond County in New York, fifth among all banks and thrifts in Queens County in New York, and second among all banks and thrifts in Nassau County in New York (market share information was provided by S&P Global Market Intelligence).
We compete for deposits and customers by placing an emphasis on convenience and service and, from time to time, by offering specific products at highly competitive rates. In addition to our 238 branches, we have 348 ATM locations, including 233 that operate 24 hours a day, and 75 that are off-site ATMs. Our customers also have
24-hour
access to their accounts through our
bank-by-phone
service, through mobile banking, and online through our website, www.myNYCB.com. We also offer certain money market accounts, certificates of deposit (“CDs”), and checking accounts through a dedicated website:
www.myBankingDirect.com
.
In addition to checking and savings accounts, Individual Retirement Accounts, and CDs for both businesses and consumers, we offer a suite of cash management products to address the needs of small and
mid-size
businesses and professional associations. We also compete by complementing our broad selection of traditional banking products with an extensive menu of alternative financial services, including annuities, life and long-term care insurance, and mutual funds of various third-party service providers.
Our ability to attract and retain deposits is not only a function of short-term interest rates and industry consolidation, but also the competitiveness of the rates being offered by other financial institutions within our marketplace, including credit unions,
on-line
banks, and brokerage firms. Additionally, financial technology companies, also referred to as fintechs, are providing nontraditional, but increasingly strong competition for deposits and customers.
Competition for deposits is also influenced by several internal factors, including the opportunity to assume or acquire deposits through business combinations; the cash flows produced through loan and securities repayments and sales; and the availability of attractively priced wholesale funds. In addition, the degree to which we seek to compete for deposits is influenced by the liquidity needed to fund our loan production and other outstanding commitments.
Another competitive advantage is our strong community presence, with April 14, 2019 having marked the 160th year of service of our forebear, Queens County Savings Bank. We have found that our longevity, as well as our strong capital position, are especially appealing to customers seeking a strong, stable, and service-oriented bank.
Competition for Loans
Our success as a lender is substantially tied to the economic health of the markets where we lend. Local economic conditions have a significant impact on loan demand, the value of the collateral securing our credits, and the ability of our borrowers to repay their loans.
The competition we face for loans also varies with the type of loan we are originating. In New York City, where the majority of the buildings collateralizing our multi-family loans are located, we compete for such loans on the basis of timely service and the expertise that stems from being a specialist in this lending niche. In addition to the money center, regional, and local banks we compete with in this market, we compete with insurance companies and other types of lenders. Certain of the banks we compete with sell the loans they produce to Fannie Mae and Freddie Mac.
Our ability to compete for CRE loans depends on the same factors that impact our ability to compete for multi-family credits, and the degree to which other CRE lenders choose to offer loan products similar to ours.
While we continue to originate ADC and C&I loans for investment, such loans represent a small portion of our loan portfolio as compared to multi-family, CRE loans, and specialty finance loans.
Environmental Issues
We encounter certain environmental risks in our lending activities and other operations. The existence of hazardous materials may make it unattractive for a lender to foreclose on the properties securing its loans. In addition, under certain conditions, lenders may become liable for the costs of cleaning up hazardous materials found on such properties. We attempt to mitigate such environmental risks by requiring either that a borrower purchase environmental insurance or that an appropriate environmental site assessment be completed as part of our underwriting review on the initial granting of CRE and ADC loans, regardless of location, and of any
out-of-state
multi-family loans we may produce. Depending on the results of an assessment, appropriate measures are taken to address the identified risks. In addition, we order an updated environmental analysis prior to foreclosing on such properties, and typically hold foreclosed multi-family, CRE, and ADC properties in subsidiaries.
8

Table of Contents
Our attention to environmental risks also applies to the properties and facilities that house our bank operations. Prior to acquiring a large-scale property, a Phase 1 Environmental Property Assessment is typically performed by a licensed professional engineer to determine the integrity of, and/or the potential risk associated with, the facility and the property on which it is built. Properties and facilities of a smaller scale are evaluated by qualified
in-house
assessors, as well as by industry experts in environmental testing and remediation. This
two-pronged
approach identifies potential risks associated with asbestos-containing material, above and underground storage tanks, radon, electrical transformers (which may contain PCBs), ground water flow, storm and sanitary discharge, and mold, among other environmental risks. These processes assist us in mitigating environmental risk by enabling us to identify and address potential issues, including by avoiding taking ownership or control of contaminated properties.
Subsidiary Activities
The Bank has formed, or acquired through merger transactions, 20 active subsidiary corporations. Of these, 12 are direct subsidiaries of the Bank and eight are subsidiaries of Bank-owned entities.
The 12 direct subsidiaries of the Bank are:
         
Name
 
Jurisdiction of
Organization 
 
Purpose
100 Duffy Realty, LLC
 
New York
 
Owns a branch building.
         
Beta Investments, Inc.
 
Delaware
 
Holding company for Omega Commercial Mortgage Corp. and Long Island Commercial Capital Corp.
         
BSR 1400 Corp.
 
New York
 
Organized to own interests in real estate.
         
Ferry Development Holding Company
 
Delaware
 
Formed to hold and manage investment portfolios for the Company.
         
NYCB Specialty Finance Company, LLC
 
Delaware
 
Originates asset-based, equipment financing, and dealer-floor plan loans.
         
NYB Realty Holding Company, LLC
 
New York
 
Holding company for subsidiaries owning an interest in real estate.
         
NYCB Insurance Agency, Inc.
 
New York
 
Sells
non-deposit
investment products.
         
Pacific Urban Renewal, Inc.
 
New Jersey
 
Owns a branch building.
         
Richmond Enterprises, Inc.
 
New York
 
Holding company for previously sold entity.
         
Synergy Capital Investments, Inc.
 
New Jersey
 
Formed to hold and manage investment portfolios for the Company.
         
NYCB Mortgage Company, LLC
 
Delaware
 
Holding company for Walnut Realty Holding Company, LLC.
         
Woodhaven Investment Company, LLC
 
Delaware
 
Holding company for Ironbound Investment Company, Inc. and 1400 Corp.


9

Table of Contents
The eight subsidiaries of Bank-owned entities are:
         
Name
 
Jurisdiction of
Organization
 
Purpose
1400 Corp.
 
New York
 
Holding company for Roslyn Real Estate Asset Corp.
         
Ironbound Investment Company, LLC.
 
Florida
 
Organized for the purpose of investing in mortgage-related assets.
         
Long Island Commercial Capital Corporation
 
New York
 
A REIT organized for the purpose of investing in mortgage-related assets.
         
Omega Commercial Mortgage Corp.
 
Delaware
 
A REIT organized for the purpose of investing in mortgage-related assets.
         
Prospect Realty Holding Company, LLC
 
New York
 
Owns a back-office building.
         
Rational Real Estate II, LLC
 
New York
 
Owns a back-office building.
         
Roslyn Real Estate Asset Corp.
 
Delaware
 
A REIT organized for the purpose of investing in mortgage-related assets.
         
Walnut Realty Holding Company, LLC
 
Delaware
 
Established to own Bank-owned properties.
 
NYB Realty Holding Company, LLC owns interests in six additional active entities organized as indirect wholly-owned subsidiaries to own interests in various real estate properties.
The Parent Company owns special business trusts that were formed for the purpose of issuing capital and common securities and investing the proceeds thereof in the junior subordinated debentures issued by the Company. See Note 9, “Borrowed Funds,” in Item 8, “Financial Statements and Supplementary Data,” for a further discussion of the Company’s special business trusts. The Parent Company also has one
non-banking
subsidiary that was established in connection with the acquisition of Atlantic Bank of New York.
Personnel
At December 31, 2019, the number of FTEs was 2,786, including 1,522 branch-related FTEs. Our employees are not represented by a collective bargaining unit, and we consider our relationship with our employees to be good.
Federal, State, and Local Taxation
The Company is subject to federal, state, and local income taxes. See the discussion of “Income Taxes” in “Critical Accounting Policies” in Item 7, “Management’s Discussion and Analysis of Financial Condition and Results of Operations,” later in this annual report.
Regulation and Supervision
General
The Bank is a New York State-chartered savings bank and its deposit accounts are insured under the DIF of the FDIC up to applicable legal limits. For the fiscal year ended December 31, 2019, the Bank was subject to regulation and supervision by the NYSDFS, as its chartering agency; by the FDIC, as its insurer of deposits; and by the CFPB.
The Bank is required to file reports with the NYSDFS, the FDIC, and the CFPB concerning its activities and financial condition, and is periodically examined by the NYSDFS, the FDIC, and the CFPB to assess compliance with various regulatory requirements, including with respect to safety and soundness and consumer financial protection regulations. The regulatory structure gives the regulatory authorities extensive discretion in connection with their supervisory and enforcement activities and examination policies, including policies with respect to the classification of assets and the establishment of an adequate loan loss allowance for regulatory purposes. Changes in such regulations or in banking legislation could have a material impact on the Company, the Bank, and their operations, as well as the Company’s shareholders.
The Company is subject to examination, regulation, and periodic reporting under the Bank Holding Company Act of 1956, as amended (the “BHCA”) by the FRB. Furthermore, the Company would be required to obtain the prior approval of the FRB to acquire all, or substantially all, of the assets of any bank or bank holding company.
In addition, the Company is periodically examined by the
FRB-NY,
and is required to file certain reports under, and otherwise comply with, the rules and regulations of the SEC under federal securities laws. Certain of the regulatory requirements applicable to the Bank and the Company are referred to below or elsewhere herein. However, such discussion is not meant to be a complete explanation of all laws and regulations, and is qualified in its entirety by reference to the actual laws and regulations.
10

Table of Contents
The Dodd-Frank Wall Street Reform and Consumer Protection Act
Enacted in July 2010, the DFA significantly changed the bank regulatory structure and will continue to affect, into the immediate future, the lending and investment activities and general operations of depository institutions and their holding companies. The DFA is complex and comprehensive legislation that impacts practically all aspects of a banking organization, and represents a significant overhaul of many aspects of the regulation of the financial services industry.
The Economic Growth, Regulatory Relief, and Consumer Protection Act
On May 24, 2018, the Economic Growth, Regulatory Relief, and Consumer Protection Act (also referred to as S.2155) was signed into law. As enacted, S.2155 modifies major provisions of the DFA and other laws governing regulation of the financial industry. Among other things, S.2155
re-defines
the manner by which banks are designated as a SIFI, by increasing the asset threshold to $250 billion from $50 billion, modifies and provides exemptions to certain mortgage lending rules, provides an exemption for certain banks with less than $10 billion in assets from leverage and risk-based capital requirements, creates an exemption from prohibitions on proprietary trading (the “Volcker Rule”), includes various provisions to address consumer protection, as well as several provisions regarding securities exchanges and capital formation.
Capital Requirements
In early July 2013, the FRB and the FDIC approved revisions to their capital adequacy guidelines and prompt corrective action rules to implement the revised standards of the Basel Committee on Banking Supervision, commonly called Basel III, and to address relevant provisions of the DFA. Basel III generally refers to two consultative documents released by the Basel Committee on Banking Supervision in December 2009. The Basel III rules generally refer to the rules adopted by U.S. banking regulators in December 2010 to align U.S. bank capital requirements with Basel III and with the related loss absorbency rules they issued in January 2011, which include significant changes to bank capital, leverage, and liquidity requirements.
The Basel III rules include new risk-based capital and leverage ratios, which became effective January 1, 2015, and revised the definition of what constitutes “capital” for the purposes of calculating those ratios. Under Basel III, the Company and the Bank are required to maintain minimum capital in accordance with the following ratios: (i) a common equity tier 1 capital ratio of 4.5%; (ii) a tier 1 capital ratio of 6% (increased from 4%); (iii) a total capital ratio of 8% (unchanged from the prior rules); and (iv) a tier 1 leverage ratio of 4%.
In addition, the Basel III rules assign higher risk weights to certain assets, such as the 150% risk weighting assigned to exposures that are more than 90 days past due or are on
non-accrual
status, and to certain CRE facilities that finance the acquisition, development, or construction of real property. Basel III also eliminate the inclusion of certain instruments, such as trust preferred securities, from tier 1 capital. In addition, tier 2 capital is no longer limited to the amount of tier 1 capital included in total capital. Mortgage servicing rights, certain deferred tax assets, and investments in unconsolidated subsidiaries over designated percentages of common stock will be required, subject to limitation, to be deducted from capital. Finally, tier 1 capital will include accumulated other comprehensive income, which includes all unrealized gains and losses on
available-for-sale
securities.
Basel III also established a “capital conservation buffer” (consisting entirely of common equity tier 1 capital) that is 2.5% above the new regulatory minimum capital requirements. This resulted in an increase in the minimum common equity tier 1, tier 1, and total capital ratios to 7.0%, 8.5%, and 10.5%, respectively. The
phase-in
of the new capital conservation buffer requirement was fully implemented in January 2019. The capital conservation buffer is now at its fully
phased-in
level of 2.5%. An institution can be subject to limitations on paying dividends, engaging in share repurchases, and paying discretionary bonuses if its capital levels fall below these amounts. Basel III also establish a maximum percentage of eligible retained income that can be utilized for such capital distributions.
On September 17, 2019, the FRB, the FDIC, and the OCC issued a final rule designed to reduce regulatory burden by simplifying several requirements in the agencies’ regulatory capital rule. Most aspects of the rule apply only to banking organizations that are not subject to the “advanced approaches” in the capital rule, which are generally firms with less than $250 billion in total consolidated assets and less than $10 billion in total foreign exposure. The rule simplifies and clarifies a number of the more complex aspects of the existing capital rule. Specifically, the proposed rule simplifies the capital treatment for certain mortgage servicing assets, certain deferred tax assets, investments in the capital instruments of unconsolidated financial institutions, and minority interests.
11

Table of Contents
Prompt Corrective Regulatory Action
The Federal Deposit Insurance Corporation Improvement Act of 1991 (“FDICIA”) requires, among other things, that federal bank regulatory authorities take “prompt corrective action” with respect to institutions that do not meet minimum capital requirements. For such purposes, the law establishes five capital tiers: well capitalized, adequately capitalized, undercapitalized, significantly undercapitalized, and critically undercapitalized. The five capital tiers are described in more detail below. Under the prompt corrective action regulations, an institution that fails to remain “well capitalized” becomes subject to a series of restrictions that increase in severity as its capital condition weakens. Such restrictions may include a prohibition on capital distributions, restrictions on asset growth, or restrictions on the ability to receive regulatory approval of applications. The FDICIA also provides for enhanced supervision authority over undercapitalized institutions, including authority for the appointment of a conservator or receiver for the institution.
As a result of the Basel III rules, new definitions of the relevant measures for the five capital categories took effect on January 1, 2015. An institution is deemed to be “well capitalized” if it has a total risk-based capital ratio of 10% or greater, a tier 1 risk-based capital ratio of 8% or greater, a common equity tier 1 risk-based capital ratio of 6.5% or greater, and a tier 1 leverage ratio of 5% or greater, and is not subject to a regulatory order, agreement, or directive to meet and maintain a specific capital level for any capital measure.
An institution is deemed to be “adequately capitalized” if it has a total risk-based capital ratio of 8% or greater, a tier 1 risk-based capital ratio of 6% or greater, a common equity tier 1 risk-based capital ratio of 4.5% or greater, and a tier 1 leverage ratio of 4% or greater.
An institution is deemed to be “undercapitalized” if it has a total risk-based capital ratio of less than 8%, a tier 1 risk-based capital ratio of less than 6%, a common equity tier 1 risk-based capital ratio of less than 4.5%, or a tier 1 leverage ratio of less than 4%. An institution is deemed to be “significantly undercapitalized” if it has a total risk-based capital ratio of less than 6%, a tier 1 risk-based capital ratio of less than 4%, a common equity tier 1 risk-based capital ratio of less than 3%, or a tier 1 leverage ratio of less than 3%. An institution is deemed to be “critically undercapitalized” if it has a ratio of tangible equity (as defined in the regulations) to total assets that is equal to or less than 2%.
“Undercapitalized” institutions are subject to growth, capital distribution (including dividend), and other limitations, and are required to submit a capital restoration plan. An institution’s compliance with such a plan is required to be guaranteed by any company that controls the undercapitalized institution in an amount equal to the lesser of 5% of the bank’s total assets when deemed undercapitalized or the amount necessary to achieve the status of adequately capitalized. If an undercapitalized institution fails to submit an acceptable plan, it is treated as if it is “significantly undercapitalized.” Significantly undercapitalized institutions are subject to one or more additional restrictions including, but not limited to, an order by the FDIC to sell sufficient voting stock to become adequately capitalized; requirements to reduce total assets, cease receipt of deposits from correspondent banks, or dismiss directors or officers; and restrictions on interest rates paid on deposits, compensation of executive officers, and capital distributions by the parent holding company.
Beginning 60 days after becoming “critically undercapitalized,” critically undercapitalized institutions also may not make any payment of principal or interest on certain subordinated debt, extend credit for a highly leveraged transaction, or enter into any material transaction outside the ordinary course of business. In addition, subject to a narrow exception, the appointment of a receiver is required for a critically undercapitalized institution within 270 days after it obtains such status.
As of December 31, 2019, each of the Bank’s capital ratios exceeded those required for an institution to be considered “well capitalized” under these regulations.
Stress Testing
Stress Testing for Systemically Important Financial Institutions
Should the four-quarter average of our total consolidated assets exceed $250 billion, we would become subject to the FRB’s stress testing regulations administered under its CCAR capital planning and supervisory process. Under this regime, in addition to reporting the results of a SIFI’s own capital stress testing, the FRB uses its own models to evaluate whether each SIFI has the capital, on a total consolidated basis, necessary to continue operating under the economic and financial market conditions of stressed macroeconomic scenarios identified by the FRB. The FRB’s analysis includes an assessment of the projected losses, net income, and pro forma capital levels, and the regulatory capital ratio, tier 1 common ratio, and other capital ratios, for the SIFI, and uses such analytical techniques that the FRB determines to be appropriate to identify, measure, and monitor any risks of the SIFI that may affect the financial stability of the United States.
12

Table of Contents
Boards of directors of SIFIs are required to review and approve capital plans before they are submitted to the FRB.
In October 2019, the FDIC issued a final rule, which became effective on November 25, 2019, that revised the FDIC’s requirement for stress testing by FDIC-insured institutions, consistent with changes made by the Economic Growth, Regulatory Relief, and Consumer Protection Act (the “EGRRCPA”). The rule amended the FDIC’s existing stress testing regulations to change the minimum threshold for applicability from $10 billion to $250 billion, revised the frequency of required stress tests by FDIC-supervised institutions from annual to periodic, and reduced the number of required stress testing scenarios from three to two.
Standards for Safety and Soundness
Federal law requires each federal banking agency to prescribe, for the depository institutions under its jurisdiction, standards that relate to, among other things, internal controls; information and audit systems; loan documentation; credit underwriting; the monitoring of interest rate risk; asset growth; compensation; fees and benefits; and such other operational and managerial standards as the agency deems appropriate. The federal banking agencies adopted final regulations and Interagency Guidelines Establishing Standards for Safety and Soundness (the “Guidelines”) to implement these safety and soundness standards. The Guidelines set forth the safety and soundness standards that the federal banking agencies use to identify and address problems at insured depository institutions before capital becomes impaired. If the appropriate federal banking agency determines that an institution fails to meet any standard prescribed by the Guidelines, the agency may require the institution to provide it with an acceptable plan to achieve compliance with the standard, as required by the Federal Deposit Insurance Act, as amended, (the “FDI Act”).
FDIC Regulations
The discussion that follows pertains to FDIC regulations other than those already discussed on the preceding pages.
Real Estate Lending Standards
The FDIC and the other federal banking agencies have adopted regulations that prescribe standards for extensions of credit that (i) are secured by real estate, or (ii) are made for the purpose of financing construction or improvements on real estate. The FDIC regulations require each institution to establish and maintain written internal real estate lending standards that are consistent with safe and sound banking practices, and appropriate to the size of the institution and the nature and scope of its real estate lending activities. The standards also must be consistent with accompanying FDIC Guidelines, which include
loan-to-value
limitations for the different types of real estate loans. Institutions are also permitted to make a limited amount of loans that do not conform to the proposed
loan-to-value
limitations as long as such exceptions are reviewed and justified appropriately. The FDIC Guidelines also list a number of lending situations in which exceptions to the
loan-to-value
standards are justified.
The FDIC, the OCC, and the FRB (collectively, the “Agencies”) also have issued joint guidance entitled “Concentrations in Commercial Real Estate Lending, Sound Risk Management Practices” (the “CRE Guidance”). The CRE Guidance, which addresses land development, construction, and certain multi-family loans, as well as CRE loans, does not establish specific lending limits but, rather, reinforces and enhances the Agencies’ existing regulations and guidelines for such lending and portfolio management. Specifically, the CRE Guidance provides that a bank has a concentration in CRE lending if (1) total reported loans for construction, land development, and other land represent 100% or more of total risk-based capital; or (2) total reported loans secured by multi-family properties,
non-farm
non-residential
properties (excluding those that are owner-occupied), and loans for construction, land development, and other land represent 300% or more of total risk-based capital and the bank’s CRE loan portfolio has increased 50% or more during the prior 36 months. If a concentration is present, management must employ heightened risk management practices that address key elements, including board and management oversight and strategic planning, portfolio management, development of underwriting standards, risk assessment and monitoring through market analysis and stress testing, and maintenance of increased capital levels as needed to support the level of CRE lending.
On December 13, 2019, the FRB, FDIC, and OCC issued a final rule, which will become effective on April 1, 2020, to modify the agencies’ capital rules for high volatility CRE (“HVCRE”) exposures, as required by the EGRRCPA. The final rule revises the definition of HVCRE exposure to make it consistent with the statutory definition of the term included in Section 214
13

Table of Contents
of the EGRRCPA, which excludes any loan made before January 1, 2015. The revised HVCRE exposure definition differs from the previous definition primarily in two ways. First, the previous definition applied to loans that financed ADC activities, whereas the new definition only applies to loans that “primarily” finance ADC activities and that are secured by land or improved real estate. This change excludes multipurpose credit facilities that primarily finance the purchase of equipment or other
non-ADC
activities. Second, the new definition permits the full appraised value of borrower-contributed land (less the total amount of any liens on the real property securing the HVCRE exposure) to count toward the 15 percent capital contribution of the real property’s appraised “as completed” value, which is one of the criteria for an exemption from the heightened risk weight. The final rule includes a grandfathering provision, which will provide banking organizations with the option to maintain their current capital treatment for ADC loans originated on or after January 1, 2015, and before April 1, 2020. Banking organizations also will have the option to reevaluate any or all of their ADC loans originated on or after January 1, 2015, using the revised HVCRE exposure definition.
Dividend Limitations
The FDIC has authority to use its enforcement powers to prohibit a savings bank or commercial bank from paying dividends if, in its opinion, the payment of dividends would constitute an unsafe or unsound practice. Federal law prohibits the payment of dividends that will result in the institution failing to meet applicable capital requirements on a pro forma basis. The Bank is also subject to dividend declaration restrictions imposed by, and as later discussed under, “New York State Law.”
Investment Activities
Since the enactment of the FDICIA, all state-chartered financial institutions, including savings banks, commercial banks, and their subsidiaries, have generally been limited to such activities as principal and equity investments of the type, and in the amount, authorized for national banks. The GLBA and FDIC regulations impose certain quantitative and qualitative restrictions on such activities and on a bank’s dealings with a subsidiary that engages in specified activities.
In 1993, the Bank received grandfathering authority from the FDIC, which it continues to use, to invest in listed stocks and/or registered shares subject to the maximum permissible investments of 100% of tier 1 capital, as specified by the FDIC’s regulations, or the maximum amount permitted by New York State Banking Law, whichever is less. Such grandfathering authority is subject to termination upon the FDIC’s determination that such investments pose a safety and soundness risk to the Bank, or in the event that the Bank converts its charter or undergoes a change in control.
Enforcement
The FDIC has extensive enforcement authority over insured banks, including the Bank. This enforcement authority includes, among other things, the ability to assess civil money penalties, to issue cease and desist orders, and to remove directors and officers. In general, these enforcement actions may be initiated in response to violations of laws and regulations and unsafe or unsound practices.
Insurance of Deposit Accounts
The deposits of the Bank are insured up to applicable limits by the DIF. The maximum deposit insurance provided by the FDIC per account owner is $250,000 for all types of accounts.
Under the FDIC’s risk-based assessment system, insured institutions are assigned to one of four risk categories based upon supervisory evaluations, regulatory capital level, and certain other factors, with less risky institutions paying lower assessments based on the assigned risk levels. An institution’s assessment rate depends upon the category to which it is assigned and certain other factors. Assessment rates range from 1.5 to 40 basis points of the institution’s assessment base, which is calculated as average total assets minus average tangible equity.
Insurance of deposits may be terminated by the FDIC upon a finding that an institution has engaged in unsafe or unsound practices, is in an unsafe or unsound condition to continue operations, or has violated any applicable law, regulation, rule, order, or condition imposed by the FDIC. Management does not know of any practice, condition, or violation that would lead to termination of the deposit insurance for the Bank.
14

Table of Contents
Holding Company Regulations
Federal Regulation
The Company is currently subject to examination, regulation, and periodic reporting under the BHCA, as administered by the FRB.
The Company is required to obtain the prior approval of the FRB to acquire all, or substantially all, of the assets of any bank or bank holding company. Prior FRB approval would be required for the Company to acquire direct or indirect ownership or control of any voting securities of any bank or bank holding company if, after giving effect to such acquisition, it would, directly or indirectly, own or control more than 5% of any class of voting shares of such bank or bank holding company. In addition, before any bank acquisition can be completed, prior approval thereof may also be required to be obtained from other agencies having supervisory jurisdiction over the bank to be acquired, including the NYSDFS.
FRB regulations generally prohibit a bank holding company from engaging in, or acquiring, direct or indirect control of more than 5% of the voting securities of any company engaged in
non-banking
activities. One of the principal exceptions to this prohibition is for activities found by the FRB to be so closely related to banking or managing or controlling banks as to be a proper incident thereto. Some of the principal activities that the FRB has determined by regulation to be so closely related to banking are: (i) making or servicing loans; (ii) performing certain data processing services; (iii) providing discount brokerage services; (iv) acting as fiduciary, investment, or financial advisor; (v) leasing personal or real property; (vi) making investments in corporations or projects designed primarily to promote community welfare; and (vii) acquiring a savings and loan association.
The FRB has issued a policy statement regarding the payment of dividends by bank holding companies. In general, the FRB’s policies provide that dividends should be paid only out of current earnings, and only if the prospective rate of earnings retention by the bank holding company appears consistent with the organization’s capital needs, asset quality, and overall financial condition. The FRB’s policies also require that a bank holding company serve as a source of financial strength to its subsidiary bank by standing ready to use available resources to provide adequate capital funds to those bank during periods of financial stress or adversity, and by maintaining the financial flexibility and capital-raising capacity to obtain additional resources for assisting its subsidiary bank where necessary.
The DFA codified the source of financial strength policy and required regulations to facilitate its application. Under the prompt corrective action laws, the ability of a bank holding company to pay dividends may be restricted if a subsidiary bank becomes undercapitalized. These regulatory policies could affect the ability of the Company to pay dividends or otherwise engage in capital distributions.
The status of the Company as a registered bank holding company under the BHCA does not exempt it from certain federal and state laws and regulations applicable to corporations generally, including, without limitation, certain provisions of the federal securities laws.
New York State Regulation
The Company is subject to regulation as a “multi-bank holding company” under New York State law. Among other requirements, this means that the Company must receive the approval of the Superintendent prior to the acquisition of 10% or more of the voting stock of another banking institution, or to otherwise acquire a banking institution by merger or purchase.
Transactions with Affiliates
Under current federal law, transactions between depository institutions and their affiliates are governed by Sections 23A and 23B of the Federal Reserve Act and the FRB’s Regulation W promulgated thereunder. Generally, Section 23A limits the extent to which the institution or its subsidiaries may engage in “covered transactions” with any one affiliate to an amount equal to 10% of the institution’s capital stock and surplus, and contains an aggregate limit on all such transactions with all affiliates to an amount equal to 20% of such capital stock and surplus. Section 23A also establishes specific collateral requirements for loans or extensions of credit to, or guarantees or acceptances on letters of credit issued on behalf of, an affiliate. Section 23B requires that covered transactions and a broad list of other specified transactions be on terms substantially the same as, or at least as favorable to, the institution or its subsidiaries as similar transactions with
non-affiliates.
15

Table of Contents
The Sarbanes-Oxley Act of 2002 generally prohibits loans by the Company to its executive officers and directors. However, the Sarbanes-Oxley Act contains a specific exemption for loans by an institution to its executive officers and directors in compliance with other federal banking laws. Section 22(h) of the Federal Reserve Act, and FRB Regulation O adopted thereunder, govern loans by a savings bank or commercial bank to directors, executive officers, and principal shareholders.
Community Reinvestment Act
Federal Regulation
Under the CRA, as implemented by FDIC regulations, an institution has a continuing and affirmative obligation consistent with its safe and sound operation to help meet the credit needs of its entire community, including low and moderate income neighborhoods. The CRA generally does not establish specific lending requirements or programs for financial institutions, nor does it limit an institution’s discretion to develop the types of products and services that it believes are best suited to its particular community, consistent with the CRA. In its most recent FDIC CRA performance evaluation, the Bank received overall state ratings of “Satisfactory” for Ohio, Florida, Arizona, and New Jersey, as well as for the New York/New Jersey multi-state region. Furthermore, the most recent overall FDIC CRA ratings for the Bank was “Satisfactory.”
New York State Regulation
The Bank is also subject to provisions of the New York State Banking Law that impose continuing and affirmative obligations upon a banking institution organized in New York State to serve the credit needs of its local community. Such obligations are substantially similar to those imposed by the CRA. The latest New York State CRA ratings received by the Bank was “Outstanding”.
Bank Secrecy and Anti-Money Laundering
Federal laws and regulations impose obligations on U.S. financial institutions, including banks and broker/dealer subsidiaries, to implement and maintain appropriate policies, procedures, and controls that are reasonably designed to prevent, detect, and report instances of money laundering and the financing of terrorism, and to verify the identity of their customers. In addition, these provisions require the federal financial institution regulatory agencies to consider the effectiveness of a financial institution’s anti-money laundering activities when reviewing bank mergers and bank holding company acquisitions. Failure of a financial institution to maintain and implement adequate programs to combat money laundering and terrorist financing could have serious legal and reputational consequences for the institution.
Office of Foreign Assets Control Regulation
The United States has imposed economic sanctions that affect transactions with designated foreign countries, nationals, and others. These are typically known as the “OFAC” rules, based on their administration by the U.S. Treasury Department Office of Foreign Assets Control. The OFAC-administered sanctions targeting countries take many different forms. Generally, however, they contain one or more of the following elements: (i) restrictions on trade with, or investment in, a sanctioned country, including prohibitions against direct or indirect imports from, and exports to, a sanctioned country and prohibitions on “U.S. persons” engaging in financial transactions relating to making investments in, or providing investment-related advice or assistance to, a sanctioned country; and (ii) a blocking of assets in which the government or specially designated nationals of the sanctioned country have an interest, by prohibiting transfers of property subject to U.S. jurisdiction (including property in the possession or control of U.S. persons). Blocked assets (e.g., property and bank deposits) cannot be paid out, withdrawn, set off, or transferred in any manner without a license from OFAC. Failure to comply with these sanctions could have serious legal and reputational consequences.
Data Privacy
Federal and state law contains extensive consumer privacy protection provisions. The GLBA requires financial institutions to periodically disclose their privacy practices and policies relating to sharing such information and enable retail customers to opt out of the Company’s ability to share certain information with affiliates and
non-affiliates
for marketing and/or
non-marketing
purposes, or to contact customers with marketing offers. The GLBA also requires financial institutions to implement a comprehensive information security program that includes administrative, technical, and physical safeguards to ensure the security and confidentiality of customer records and information.
Cybersecurity
The Cybersecurity Information Sharing Act (the “CISA”) is intended to improve cybersecurity in the U.S. through sharing of information about security threats between the U.S. government and private sector organizations, including financial institutions such as the Company. The CISA also authorizes companies to monitor their own systems, notwithstanding any other provision of law, and allows companies to carry out defensive measures on their own systems from potential cyber-attacks.
16

Table of Contents
Sarbanes-Oxley Act of 2002
The Sarbanes-Oxley Act of 2002 was enacted to address, among other things, corporate governance, auditing and accounting, executive compensation, and enhanced and timely disclosure of corporate information. As directed by the Sarbanes-Oxley Act, our Chief Executive Officer and Chief Financial Officer are required to certify that our quarterly and annual reports do not contain any untrue statement of a material fact. The rules adopted by the SEC under the Sarbanes-Oxley Act have several requirements, including having those Officers certify that they are responsible for establishing, maintaining and regularly evaluating the effectiveness of our internal controls over financial reporting; that they have made certain disclosures to our auditors and the Audit Committee of the Board of Directors about our internal control over financial reporting; and they have included information in our quarterly and annual reports about their evaluation and whether there have been changes in our internal control over financial reporting or in other factors that could materially affect internal control over financial reporting.
Federal Home Loan Bank System
The Bank is a member of the
FHLB-NY.
As a member of the
FHLB-NY,
the Bank is required to acquire and hold shares of
FHLB-NY
capital stock. At December 31, 2019, the Bank held $647.6 million of
FHLB-NY
stock.
New York State Law
The Bank derives its lending, investment, and other authority primarily from the applicable provisions of New York State Banking Law and the regulations of the NYSDFS, as limited by FDIC regulations. Under these laws and regulations, banks, including the Bank, may invest in real estate mortgages, consumer and commercial loans, certain types of debt securities (including certain corporate debt securities, and obligations of federal, state, and local governments and agencies), certain types of corporate equity securities, and certain other assets.
Under New York State Banking Law, New York State-chartered stock-form savings banks and commercial banks may declare and pay dividends out of their net profits, unless there is an impairment of capital. Approval of the Superintendent is required if the total of all dividends declared by the bank in a calendar year would exceed the total of its net profits for that year combined with its retained net profits for the preceding two years, less prior dividends paid.
New York State Banking Law gives the Superintendent authority to issue an order to a New York State-chartered banking institution to appear and explain an apparent violation of law, to discontinue unauthorized or unsafe practices, and to keep prescribed books and accounts. Upon a finding by the NYSDFS that any director, trustee, or officer of any banking organization has violated any law, or has continued unauthorized or unsafe practices in conducting the business of the banking organization after having been notified by the Superintendent to discontinue such practices, such director, trustee, or officer may be removed from office after notice and an opportunity to be heard. The Superintendent also has authority to appoint a conservator or a receiver for a savings or commercial bank under certain circumstances.
Interstate Branching
Federal law allows the FDIC, and New York State Banking Law allows the Superintendent, to approve an application by a state banking institution to acquire interstate branches by merger, unless, in the case of the FDIC, the state of the target institution has opted out of interstate branching. New York State Banking Law authorizes savings banks and commercial banks to open and occupy de novo branches outside the state of New York. Pursuant to the DFA, the FDIC is authorized to approve a state bank’s establishment of a de novo interstate branch if the intended host state allows de novo branching by banks chartered by that state. The Bank currently maintains 42 branches in New Jersey, 26 branches in Florida, 28 branches in Ohio, and 14 branches in Arizona, in addition to its 128 branches in New York State.
Acquisition of the Holding Company
Federal Restrictions
Under the Federal Change in Bank Control Act (“CIBCA”), a notice must be submitted to the FRB if any person (including a company), or group acting in concert, seeks to acquire 10% or more of the Company’s shares of outstanding common stock, unless the FRB has found that the acquisition will not result in a change in control of the Company. Under the CIBCA, the FRB generally has 60 days within which to act on such notices, taking into
17

Table of Contents
consideration certain factors, including the financial and managerial resources of the acquirer; the convenience and needs of the communities served by the Company, the Bank; and the anti-trust effects of the acquisition. Under the BHCA, any company would be required to obtain approval from the FRB before it may obtain “control” of the Company within the meaning of the BHCA. Control generally is defined to mean the ownership or power to vote 25% or more of any class of voting securities of the Company, the ability to control in any manner the election of a majority of the Company’s directors, or the power to exercise a controlling influence over the management or policies of the Company. Under the BHCA, an existing bank holding company would be required to obtain the FRB’s approval before acquiring more than 5% of the Company’s voting stock. See “Holding Company Regulation” earlier in this report.
New York State Change in Control Restrictions
New York State Banking Law generally requires prior approval of the New York State Banking Board before any action is taken that causes any company to acquire direct or indirect control of a banking institution which is organized in New York.
Federal Securities Law
The Company’s common stock and certain other securities listed on the cover page of this report are registered with the SEC under the Securities Exchange Act of 1934, as amended (the “Exchange Act”). The Company is subject to the information and proxy solicitation requirements, insider trading restrictions, and other requirements under the Exchange Act.
Consumer Protection Regulations
The activities of the Company’s banking subsidiary, including its lending and deposit gathering activities, is subject to a variety of consumer laws and regulations designed to protect consumers. These laws and regulations mandate certain disclosure requirements, and regulate the manner in which financial institutions must deal with clients and monitor account activity when taking deposits from, making loans to, or engaging in other types of transactions with, such clients. Failure to comply with these laws and regulations could lead to substantial penalties, operating restrictions, and reputational damage to the financial institution.
Applicable consumer protection laws include, but may not be limited to, the DFA, Truth in Lending Act, Truth in Savings Act, Equal Credit Opportunity Act, Electronic Funds Transfer Act, Fair Housing Act, Home Mortgage Disclosure Act, Fair Debt Collection Practices Act, Fair Credit Reporting Act, Expedited Funds Availability (Regulation CC), Reserve Requirements (Regulation D), Insider Transactions (Regulation O), Privacy of Consumer Information (Regulation P), Margin Stock Loans (Regulation U), Right To Financial Privacy Act, Flood Disaster Protection Act, Homeowners Protection Act, Servicemembers Civil Relief Act, Real Estate Settlement Procedures Act, Telephone Consumer Protection Act,
CAN-SPAM
Act, Children’s Online Privacy Protection Act, the Military Lending Act, and the Homeownership Counseling Act.
In addition, the Bank and its subsidiaries are subject to certain state laws and regulations designed to protect consumers.
Consumer Financial Protection Bureau
The Bank is subject to oversight by the CFPB within the Federal Reserve System. The CFPB was established under the DFA to implement and enforce rules and regulations under certain federal consumer protection laws with respect to the conduct of providers of certain consumer financial products and services. The CFPB has broad rulemaking authority for a wide range of consumer financial laws that apply to all banks, including, among other things, the authority to prohibit acts and practices that are deemed to be unfair, deceptive, or abusive. Abusive acts or practices are defined as those that (1) materially interfere with a consumer’s ability to understand a term or condition of a consumer financial product or service, or (2) take unreasonable advantage of a consumer’s (a) lack of financial savvy, (b) inability to protect himself in the selection or use of consumer financial products or services, or (c) reasonable reliance on a covered entity to act in the consumer’s interests.
The CFPB has the authority to investigate possible violations of federal consumer financial law, hold hearings, and commence civil litigation. The CFPB can issue
cease-and-desist
orders against banks and other entities that violate consumer financial laws. The CFPB also may institute a civil action against an entity in violation of federal consumer financial law in order to impose a civil penalty or an injunction. The CFPB has examination and enforcement authority over all banks with more than $10 billion in assets, as well as certain of their affiliates.
18

Table of Contents
Enterprise Risk Management
The Company’s and the Bank’s Boards of Directors are actively engaged in the process of overseeing the efforts made by the Enterprise Risk Management (“ERM”) department to identify, measure, monitor, mitigate, and report risk. The Company has established an ERM program that reinforces a strong risk culture to support sound risk management practices. The Board is responsible for the approval and oversight of the ERM program and framework.
ERM is responsible for setting and aligning the Company’s Risk Appetite Policy with the goals and objectives set forth in the budget, and the strategic and capital plans. Internal controls and ongoing monitoring processes capture and address heightened risks that threaten the Company’s ability to achieve our goals and objectives, including the recognition of safety and soundness concerns and consumer protection. Additionally, ERM monitors key risk indicators against the established risk warning levels and limits, as well as elevated risks identified by the Chief Risk Officer.
ITEM 1A.
RISK FACTORS
There are various risks and uncertainties that are inherent to our business. Primary among these are (1) interest rate risk, which arises from movements in interest rates; (2) credit risk, which arises from an obligor’s failure to meet the terms of any contract with a bank or to otherwise perform as agreed; (3) risks related to our financial statements; (4) liquidity risk, which arises from a bank’s inability to meet its obligations when they come due without incurring unacceptable losses; (5) legal/compliance risk, which arises from violations of, or
non-conformance
with, laws, rules, regulations, prescribed practices, or ethical standards; (6) market risk, which arises from changes in the value of portfolios of financial instruments; (7) strategic risk, which is the risk of loss arising from inadequate or failed internal processes, people, and systems; (8) operational risk, which arises from problems with service or product delivery; and (9) reputational risk, which arises from negative public opinion resulting in a significant decline in shareholder value.
Following is a discussion of the material risks and uncertainties that could have a material adverse impact on our financial condition, results of operations, and the value of our shares. The failure to properly identify, monitor, and mitigate any of the below referenced risks, could result in increased regulatory risk and could potentially have an adverse impact on the Company. Additional risks that are not currently known to us, or that we currently believe to be immaterial, also may have a material effect on our financial condition and results of operations. This report is qualified in its entirety by those risk factors.
Interest Rate Risks
Changes in interest rates could reduce our net interest income and negatively impact the value of our loans, securities, and other assets. This could have a material adverse effect on our cash flows, financial condition, results of operations, and capital.
Our primary source of income is net interest income, which is the difference between the interest income generated by our interest-earning assets (consisting primarily of loans and, to a lesser extent, securities) and the interest expense produced by our interest-bearing liabilities (consisting primarily of deposits and wholesale borrowings).
The cost of our deposits and short-term wholesale borrowings is largely based on short-term interest rates, the level of which is driven by the FOMC of the FRB. However, the yields generated by our loans and securities are typically driven by intermediate-term interest rates, which are set by the bond market and generally vary from day to day. The level of our net interest income is therefore influenced by movements in such interest rates, and the pace at which such movements occur. If the interest rates on our interest-bearing liabilities increase at a faster pace than the interest rates on our interest-earning assets, the result could be a reduction in net interest income and, with it, a reduction in our earnings. Our net interest income and earnings would be similarly impacted were the interest rates on our interest-earning assets to decline more quickly than the interest rates on our interest-bearing liabilities.
In addition, such changes in interest rates could affect our ability to originate loans and attract and retain deposits; the fair values of our securities and other financial assets; the fair values of our liabilities; and the average lives of our loan and securities portfolios.
Changes in interest rates also could have an effect on loan refinancing activity, which, in turn, would impact the amount of prepayment income we receive on our multi-family and CRE loans. Because prepayment income is recorded as interest income, the extent to which it increases or decreases during any given period could have a significant impact on the level of net interest income and net income we generate during that time.
19

Table of Contents
Also, changes in interest rates could have an effect on the slope of the yield curve. If the yield curve were to invert or become flat, our net interest income and net interest margin could contract, adversely affecting our net income and cash flows, and the value of our assets.
We will be required to transition from the use of the LIBOR interest rate index to an alternate index in the future.
We have certain loans and leases, securities, wholesale borrowings, derivative financial instruments, and long-term debt whose interest rate is indexed to LIBOR. The United Kingdom’s Financial Conduct Authority, which is responsible for regulating LIBOR, has announced that the publication of LIBOR is not guaranteed beyond 2021 and it appears highly likely that LIBOR will be discontinued or modified by 2021. At this time, no consensus exists as to what reference rate or rates or benchmarks may become acceptable alternatives to LIBOR, although the Alternative Reference Rates Committee (a group of private-market participants convened by the Federal Reserve Board and the Federal Reserve Bank of New York) has identified the Secured Overnight Financing Rate, or SOFR, as the recommended alternative to LIBOR.
Uncertainty as to the adoption, market acceptance, or availability of SOFR or other alternative reference rates, may adversely affect the value of LIBOR-based loans and securities in our portfolio and may impact the availability and cost of hedging instruments and borrowings. The language in our LIBOR-based contracts and financial instruments has developed over time and may have various events that trigger when a successor index to LIBOR would be selected. If a trigger is satisfied, contracts and financial instruments may give us or the calculation agent, as applicable, discretion over the selection of the substitute index for the calculation of interest rates. The implementation of a substitute index for the calculation of interest rates under our loan agreements may result in our incurring significant expenses in effecting the transition and may result in disputes or litigation with customers over the appropriateness or comparability to LIBOR of the substitute index, any of which could have an adverse effect on our results of operations. We continue to develop and implement plans to mitigate the risks associated with the expected discontinuation of LIBOR. In particular, we have implemented or are in the process of implementing fallback language for LIBOR-linked loans.
Credit Risks
A decline in the quality of our assets could result in higher losses and the need to set aside higher loan loss provisions, thus reducing our earnings and our stockholders’ equity.
The inability of our borrowers to repay their loans in accordance with their terms would likely necessitate an increase in our provision for loan losses, and therefore reduce our earnings.
The loans we originate for investment are primarily multi-family loans, CRE loans, and specialty finance loans and leases. Such loans are generally larger, and have higher risk-adjusted returns and shorter maturities, than the other loans we produce for investment. Our credit risk would ordinarily be expected to increase with the growth of our multi-family and CRE loan portfolios.
Payments on multi-family and CRE loans generally depend on the income generated by the underlying properties which, in turn, depends on their successful operation and management. The ability of our borrowers to repay these loans may be impacted by adverse conditions in the local real estate market and the local economy. While we seek to minimize these risks through our underwriting policies, which generally require that such loans be qualified on the basis of the collateral property’s cash flows, appraised value, and debt service coverage ratio, among other factors, there can be no assurance that our underwriting policies will protect us from credit-related losses or delinquencies.
To minimize the risks involved in our specialty finance lending and leasing, we participate in syndicated loans that are brought to us, and equipment loans and leases that are assigned to us, by a select group of nationally recognized sources, and generally are made to large corporate obligors, many of which are publicly traded, carry investment grade or near-investment grade ratings, and participate in stable industries nationwide. Each of our credits is secured with a perfected first security interest in the underlying collateral and structured as senior debt or as a
non-cancelable
lease.
We seek to minimize the risks involved in our other C&I lending by underwriting such loans on the basis of the cash flows produced by the business; by requiring that such loans be collateralized by various business assets, including inventory, equipment, and accounts receivable, among others; and by requiring personal guarantees. However, the capacity of a borrower to repay such a C&I loan is substantially dependent on the degree to which his or her business is successful. In addition, the collateral underlying other C&I loans may depreciate over time, may not be conducive to appraisal, or may fluctuate in value, based upon the results of operations of the business.
20

Table of Contents
We also originate ADC loans, although to a far lesser degree than we originate multi-family and CRE loans. ADC financing typically involves a greater degree of credit risk than longer-term financing on multi-family and CRE properties. Risk of loss on an ADC loan largely depends upon the accuracy of the initial estimate of the property’s value at completion of construction or development, compared to the estimated costs (including interest) of construction. If the estimate of value proves to be inaccurate, the loan may be under-secured. While we seek to minimize these risks by maintaining consistent lending policies and procedures, and rigorous underwriting standards, an error in such estimates, among other factors, could have a material adverse effect on the quality of our ADC loan portfolio, thereby resulting in losses or delinquencies.
The ability of our borrowers to repay their loans could be adversely impacted by a decline in real estate values and/or an increase in unemployment, which not only could result in our experiencing losses, but also could necessitate our recording a provision for losses on loans. Either of these events would have an adverse impact on our net income.
Although losses on the loans we produce have been comparatively limited, even during periods of economic weakness in our markets, we cannot guarantee that this will be our experience in future periods.
Our allowance for losses on loans might not be sufficient to cover our actual losses, which would adversely impact our financial condition and results of operations.
In addition to mitigating credit risk through our underwriting processes, we attempt to mitigate such risk through the establishment of an allowance for losses on loans. The process of determining whether or not the allowance is sufficient to cover potential loan losses is based on the methodology described in detail under “Critical Accounting Policies” in Item 7, “Management’s Discussion and Analysis of Financial Condition and Results of Operations” in this report.
If the judgments and assumptions we make with regard to the allowance are incorrect, our allowance for losses on such loans might not be sufficient, and additional loan loss provisions might need to be made. Depending on the amount of such loan loss provisions, the adverse impact on our earnings could be material.
In addition, growth in our loan portfolio may require us to increase the allowance for losses on such loans by making additional provisions, which would reduce our net income. Furthermore, bank regulators have the authority to require us to make provisions for loan losses or otherwise recognize loan charge-offs following their periodic review of our loan portfolio, our underwriting procedures, and our allowance for losses on such loans. Any increase in the loan loss allowance or in loan charge-offs as required by such regulatory authorities could have a material adverse effect on our financial condition and results of operations.
Our New York State multi-family loan portfolio could be adversely impacted by changes in legislation or regulation.
On June 14, 2019, the New York State legislature passed the Housing Stability and Tenant Protection Act of 2019 impacting about one million rent-regulated apartment units. Among other things, the new legislation: (i) curtails rent increases from Major Capital Improvements and Individual Apartment Improvements; (ii) all but eliminates the ability for apartments to exit rent regulation; (iii) does away with vacancy decontrol and high-income deregulation; and (iv) repealed the 20% vacancy bonus. While it is too early to measure the full impact of the legislation or its impact on loan production, in total, it generally limits a landlord’s ability to increase rents on rent regulated apartments and makes it more difficult to convert rent regulated apartments to market rate apartments. As a result, the value of the collateral located in New York State securing the Company’s multi-family loans or the future net operating income of such properties could potentially become impaired.
Economic weakness in the New York metropolitan region, where the majority of the properties collateralizing our multi-family, CRE, and ADC loans, and the majority of the businesses collateralizing our other C&I loans, are located could have an adverse impact on our financial condition and results of operations.
Unlike larger national or superregional banks that serve a broader and more diverse geographic region, our business depends significantly on general economic conditions in the New York metropolitan region, where the majority of the buildings and properties securing the multi-family, CRE, and ADC loans we originate for investment, and the businesses of the customers to whom we make our other C&I loans, are located.
21

Table of Contents
Accordingly, the ability of our borrowers to repay their loans, and the value of the collateral securing such loans, may be significantly affected by economic conditions in this region, including changes in the local real estate market. A significant decline in general economic conditions caused by inflation, recession, unemployment, acts of terrorism, extreme weather, or other factors beyond our control, could therefore have an adverse effect on our financial condition and results of operations. In addition, because multi-family and CRE loans represent the majority of the loans in our portfolio, a decline in tenant occupancy or rents due to such factors, or for other reasons, such as new legislation, could adversely impact the ability of our borrowers to repay their loans on a timely basis, which could have a negative impact on our net income.
Furthermore, economic or market turmoil could occur in the near or long term. This could negatively affect our business, our financial condition, and our results of operations, as well as our ability to maintain or increase the level of cash dividends we currently pay to our shareholders.
Risks Related to our Financial Statements
Changes in accounting standards or interpretation of new or existing standards may affect how we report our financial condition and results of operations.
From time to time the FASB and the SEC change accounting regulations and reporting standards that govern the preparation of our financial statements. In addition, the FASB, SEC, bank regulators, and the outside independent auditors may revise their previous interpretations regarding existing accounting regulations and the application of these accounting standards. These changes can be difficult to predict and can materially impact how to record and report our financial condition and results of operations. In some cases, there could be a requirement to apply a new or revised accounting standard retroactively, resulting in the restatement of prior period financial statements.
The implementation of a new accounting standard could require us to increase its allowance for loan losses and may have a material adverse effect on our financial condition and results of operations.
In June 2016, the FASB issued ASU No.
 2016-13,
Financial Instruments—Credit Losses (Topic 326): Measurement of Credit Losses on Financial Instruments. ASU No.
 2016-13
replaces the incurred loss model with an expected loss model, which is referred to as the current expected credit loss model, or CECL. ASU No.
 2016-13
became effective for us on January 1, 2020. The change to the CECL framework requires us to greatly increase the data we must collect and review to determine the appropriate level of the allowance for loan losses. The adoption of CECL may result in greater volatility in the level of the allowance for loan losses, depending on various factors and assumptions applied in the model, such as the forecasted economic conditions in the foreseeable future and loan payment behaviors. Any increase in the allowance for loan losses, or expenses incurred to determine the appropriate level of the allowance for loan losses, may have an adverse effect on our financial condition and results of operations.
Our accounting estimates and risk management processes rely on analytical and forecasting models.
The processes that we use to estimate expected losses and to measure the fair value of financial instruments, as well as the processes used to estimate the effects of changing interest rates and other market measures on its financial condition and results of operations, depends upon the use of analytical and forecasting models. These models reflect assumptions that may not be accurate, particularly in times of market stress or other unforeseen circumstances. Even if these assumptions are adequate, the models may prove to be inadequate or inaccurate because of other flaws in their design or their implementation. If the models that we use for interest rate risk and asset-liability management are inadequate, we may incur increased or unexpected losses upon changes in market interest rates or other market measures. If the models that we use for determining its expected losses are inadequate, the allowance for loan losses may not be sufficient to support future charge-offs. If the models that we use to measure the fair value of financial instruments are inadequate, the fair value of such financial instruments may fluctuate unexpectedly or may not accurately reflect what we could realize upon sale or settlement of such financial instruments. Any such failure in our analytical or forecasting models could have a material adverse effect on our business, financial condition and results of operations.
Impairment in the carrying value of goodwill and other intangible assets could negatively impact our financial condition and results of operations.
At December 31, 2019, goodwill and other intangible assets totaled $2.4 billion. Goodwill represents the excess purchase price paid over the fair value of the net assets acquired in a business combination. Goodwill is reviewed for impairment at least annually or more frequently if events or changes in circumstances indicate that the
22

Table of Contents
carrying value may not be recoverable. A significant decline in expected future cash flows, a material change in interest rates, a significant adverse change in the business climate, slower growth rates, or a significant or sustained decline in the price of our common stock may necessitate taking charges in the future related to the impairment of goodwill and other intangible assets. The amount of any impairment charge could be significant and could have a material adverse impact on our financial condition and results of operations.
Liquidity Risks
Failure to maintain an adequate level of liquidity could result in an inability to fulfill our financial obligations and also could subject us to material reputational and compliance risk.
“Liquidity” refers to our ability to generate sufficient cash flows to support our operations and to fulfill our obligations, including commitments to originate loans, to repay our wholesale borrowings and other liabilities, and to satisfy the withdrawal of deposits by our customers.
Our primary sources of liquidity are the retail and institutional deposits we gather or acquire in connection with acquisitions, and the brokered deposits we accept; borrowed funds, primarily in the form of wholesale borrowings from the
FHLB-NY
and various Wall Street brokerage firms; cash flows generated through the repayment and sale of loans; and cash flows generated through the repayment and sale of securities. In addition, and depending on current market conditions, we have the ability to access the capital markets from time to time to generate additional liquidity.
Deposit flows, calls of investment securities and wholesale borrowings, and the prepayment of loans and mortgage-related securities are strongly influenced by such external factors as the direction of interest rates, whether actual or perceived; local and national economic conditions; and competition for deposits and loans in the markets we serve. The withdrawal of more deposits than we anticipate could have an adverse impact on our profitability as this source of funding, if not replaced by similar deposit funding, would need to be replaced with wholesale funding, the sale of interest-earning assets, or a combination of the two. The replacement of deposit funding with wholesale funding could cause our overall cost of funds to increase, which would reduce our net interest income and results of operations. A decline in interest-earning assets would also lower our net interest income and results of operations.
In addition, large-scale withdrawals of brokered or institutional deposits could require us to pay significantly higher interest rates on our retail deposits or on other wholesale funding sources, which would have an adverse impact on our net interest income and net income. Furthermore, changes to the
FHLB-NY’s
underwriting guidelines for wholesale borrowings or lending policies may limit or restrict our ability to borrow, and therefore could have a significant adverse impact on our liquidity. A decline in available funding could adversely impact our ability to originate loans, invest in securities, and meet our expenses, or to fulfill such obligations as repaying our borrowings or meeting deposit withdrawal demands.
A downgrade of the credit ratings of the Company and the Bank could also adversely affect our access to liquidity and capital, and could significantly increase our cost of funds, trigger additional collateral or funding requirements, and decrease the number of investors and counterparties willing to lend to us or to purchase our securities. This could affect our growth, profitability, and financial condition, including our liquidity.
If we were to defer payments on our trust preferred capital debt securities or were in default under the related indentures, we would be prohibited from paying dividends or distributions on our common stock.
The terms of our outstanding trust preferred capital debt securities prohibit us from (1) declaring or paying any dividends or distributions on our capital stock, including our common stock; or (2) purchasing, acquiring, or making a liquidation payment on such stock, under the following circumstances: (a) if an event of default has occurred and is continuing under the applicable indenture; (b) if we are in default with respect to a payment under the guarantee of the related trust preferred securities; or (c) if we have given notice of our election to defer interest payments but the related deferral period has not yet commenced, or a deferral period is continuing. In addition, without notice to, or consent from, the holders of our common stock, we may issue additional series of trust preferred capital debt securities with similar terms, or enter into other financing agreements, that limit our ability to pay dividends on our common stock.
Dividends on the Series A Preferred Stock are discretionary and noncumulative, and may not be paid if such payment will result in our failure to comply with all applicable laws and regulations.
Dividends on the Series A Preferred Stock are discretionary and noncumulative. If our Board of Directors (or any duly authorized committee of the Board) does not authorize and declare a dividend on the Series A Preferred Stock for any dividend period, holders of the depositary shares will not be entitled to receive any dividend for that
23

Table of Contents
dividend period, and the unpaid dividend will cease to accrue and be payable. We have no obligation to pay dividends accrued for a dividend period after the dividend payment date for that period if our Board of Directors (or any duly authorized committee thereof) has not declared a dividend before the related dividend payment date, whether or not dividends on the Series A Preferred Stock or any other series of our preferred stock or our common stock are declared for any future dividend period. Additionally, under the FRB’s capital rules, dividends on the Series A Preferred Stock may only be paid out of our net income, retained earnings, or surplus related to other additional tier 1 capital instruments.
If the
non-payment
of dividends on Series A Preferred Stock for any dividend period would cause the Company to fail to comply with any applicable law or regulation, or any agreement we may enter into with our regulators from time to time, then we would not be able to declare or pay a dividend for such dividend period. In such a case, holders of the depositary shares will not be entitled to receive any dividend for that dividend period, and the unpaid dividend will cease to accrue and be payable.
Legal/Compliance Risks
Inability to fulfill minimum capital requirements could limit our ability to conduct or expand our business, pay a dividend, or result in termination of our FDIC deposit insurance, and thus impact our financial condition, our results of operations, and the market value of our stock.
We are subject to the comprehensive, consolidated supervision and regulation set forth by the FRB. Such regulation includes, among other matters, the level of leverage and risk-based capital ratios we are required to maintain. Depending on general economic conditions, changes in our capital position could have a materially adverse impact on our financial condition and risk profile, and also could limit our ability to grow through acquisitions or otherwise. Compliance with regulatory capital requirements may limit our ability to engage in operations that require the intensive use of capital and therefore could adversely affect our ability to maintain our current level of business or expand.
Furthermore, it is possible that future regulatory changes could result in more stringent capital or liquidity requirements, including increases in the levels of regulatory capital we are required to maintain and changes in the way capital or liquidity is measured for regulatory purposes, either of which could adversely affect our business and our ability to expand. For example, federal banking regulations adopted under Basel III standards require bank holding companies and banks to undertake significant activities to demonstrate compliance with higher capital requirements. Any additional requirements to increase our capital ratios or liquidity could necessitate our liquidating certain assets, perhaps on terms that are unfavorable to us or that are contrary to our business plans. In addition, such requirements could also compel us to issue additional securities, thus diluting the value of our common stock.
In addition, failure to meet established capital requirements could result in the FRB placing limitations or conditions on our activities and further restricting the commencement of new activities. The failure to meet applicable capital guidelines could subject us to a variety of enforcement remedies available to the federal regulatory authorities, including limiting our ability to pay dividends; issuing a directive to increase our capital; and terminating our FDIC deposit insurance.
Pursuant to the current requirements of the DFA, a bank holding company whose total consolidated assets average more than $250 billion over the four most recent quarters is determined to be a SIFI, and therefore is subject to stricter prudential standards. In addition to capital and liquidity requirements, these standards primarily include risk-management requirements, dividend limits, and early remediation regimes.
Our results of operations could be materially affected by further changes in bank regulation, or by our ability to comply with certain existing laws, rules, and regulations governing our industry.
We are subject to regulation, supervision, and examination by the following entities: (1) the NYSDFS, the chartering authority for the Bank; (2) the FDIC, as the insurer of the Bank’s deposits; (3) the
FRB-NY,
in accordance with objectives and standards of the U.S. Federal Reserve System; and (4) the CFPB, which was established in 2011 under the Dodd-Frank Act and given broad authority to regulate financial service providers and financial products.
Such regulation and supervision governs the activities in which a bank holding company and its banking subsidiaries may engage, and are intended primarily for the protection of the DIF, the banking system in general, and bank customers, rather than for the benefit of a company’s stockholders. These regulatory authorities have extensive discretion in connection with their supervisory and enforcement activities, including with respect to the imposition of restrictions on the operation of a bank or a bank holding company, the imposition of significant fines, the ability to delay or deny merger or other regulatory applications, the classification of assets by a bank, and the adequacy of a
24

Table of Contents
bank’s allowance for loan losses, among other matters. Changes in such regulation and supervision, or changes in regulation or enforcement by such authorities, whether in the form of policy, regulations, legislation, rules, orders, enforcement actions, ratings, or decisions, could have a material impact on the Company, our subsidiary bank and other affiliates, and our operations. In addition, failure of the Company or the Bank to comply with such regulations could have a material adverse effect on our earnings and capital.
See “Regulation and Supervision” in Part I, Item 1, “Business” earlier in this filing for a detailed description of the federal, state, and local regulations to which the Company and the Bank are subject.
Our enterprise risk management framework may not be effective in mitigating the risks to which we are subject, based upon the size, scope, and complexity of the Company.
As a financial institution, we are subject to a number of risks, including interest rate, credit, liquidity, legal/compliance, market, strategic, operational, and reputational. Our ERM framework is designed to minimize the risks to which we are subject, as well as any losses stemming from such risks. Although we seek to identify, measure, monitor, report, and control our exposure to such risks, and employ a broad and diverse set of risk monitoring and mitigation techniques in the process, those techniques are inherently limited because they cannot anticipate the existence or development of risks that are currently unknown and unanticipated.
For example, economic and market conditions, heightened legislative and regulatory scrutiny of the financial services industry, and increases in the overall complexity of our operations, among other developments, have resulted in the creation of a variety of risks that were previously unknown and unanticipated, highlighting the intrinsic limitations of our risk monitoring and mitigation techniques. As a result, the further development of previously unknown or unanticipated risks may result in our incurring losses in the future that could adversely impact our financial condition and results of operations. Furthermore, an ineffective ERM framework, as well as other risk factors, could result in a material increase in our FDIC insurance premiums.
Market Risks
A decline in economic conditions could adversely affect the value of the loans we originate and the securities in which we invest.
Although we take steps to reduce our exposure to the risks that stem from adverse changes in economic conditions, such changes nevertheless could adversely impact the value of the loans we originate and the securities we invest in.
Declines in real estate values and home sales, and an increase in the financial stress on borrowers stemming from high unemployment or other adverse economic conditions, could negatively affect our borrowers and, in turn, the repayment of the loans in our portfolio. Deterioration in economic conditions also could subject us and our industry to increased regulatory scrutiny, and could result in an increase in loan delinquencies, an increase in problem assets and foreclosures, and a decline in the value of the collateral for our loans, which could reduce our customers’ borrowing power. Deterioration in local economic conditions could drive the level of loan losses beyond the level we have provided for in our loan loss allowance; this, in turn, could necessitate an increase in our provisions for loan losses, which would reduce our earnings and capital.
Furthermore, declines in the value of our investment securities could result in our having to record losses based on the other-than-temporary impairment of securities, which would reduce our earnings and also could reduce our capital. In addition, continued economic weakness could reduce the demand for our products and services, which would adversely impact our liquidity and the revenues we produce.
The market price and liquidity of our common stock could be adversely affected if the economy were to weaken or the capital markets were to experience volatility.
The market price of our common stock could be subject to significant fluctuations due to changes in investor sentiment regarding our operations or business prospects. Among other factors, these risks may be affected by:
  Operating results that vary from the expectations of our management or of securities analysts and investors;
  Developments in our business or in the financial services sector generally;
  Regulatory or legislative changes affecting our industry generally or our business and operations;
  Operating and securities price performance of companies that investors consider to be comparable to us;
  Changes in estimates or recommendations by securities analysts or rating agencies;
25

Table of Contents
  Announcements of strategic developments, acquisitions, dispositions, financings, and other material events by us or our competitors;
  Changes or volatility in global financial markets and economies, general market conditions, interest or foreign exchange rates, stock, commodity, credit, or asset valuations; and
  Significant fluctuations in the capital markets.
Economic or market turmoil could occur in the near or long term, which could negatively affect our business, our financial condition, and our results of operations, as well as volatility in the price and trading volume of our common stock. 
Strategic Risks
Extensive competition for loans and deposits could adversely affect our ability to expand our business, as well as our financial condition and results of operations.
We face significant competition for loans and deposits from other banks and financial institutions, both within and beyond our local markets. We also compete with companies that solicit loans and deposits over the internet and from FinTech companies.
Because our profitability stems from our ability to attract deposits and originate loans, our continued ability to compete for depositors and borrowers is critical to our success. Our success as a competitor depends on a number of factors, including our ability to develop, maintain, and build long-term relationships with our customers by providing them with convenience, in the form of multiple branch locations, extended hours of service, and access through alternative delivery channels; a broad and diverse selection of products and services; interest rates and service fees that compare favorably with those of our competitors; and skilled and knowledgeable personnel to assist our customers by addressing their financial needs. External factors that may impact our ability to compete include, among others, the entry of new lenders and depository institutions in our current markets and, with regard to lending, an increased focus on multi-family and CRE lending by existing competitors.
Limitations on our ability to grow our portfolios of multi-family and CRE loans could adversely affect our ability to generate interest income, as well our financial condition and results of operations, perhaps materially.
Although we also originate C&I and ADC loans, and invest in securities, our portfolios of multi-family and CRE loans represent the largest portion of our asset mix (91.4% of total loans as of December 31, 2019). Our leadership position in these markets has been instrumental to our production of solid earnings and our consistent record of exceptional asset quality. We monitor the ratio of our multi-family, CRE, and ADC loans (as defined in the CRE Guidance) to our total risk-based capital to ensure that we are in compliance with regulatory guidance. Any inability to grow our multi-family and CRE loan portfolios, could negatively impact our ability to grow our earnings per share.
The inability to engage in merger transactions, or to realize the anticipated benefits of acquisitions in which we might engage, could adversely affect our ability to compete with other financial institutions and weaken our financial performance.
Mergers and acquisitions have contributed significantly to our growth and it is possible that we will look to acquire other financial institutions, financial service providers, or branches in the future.
Our ability to engage in future mergers and acquisitions would depend on our ability to identify suitable merger partners and acquisition opportunities, our ability to finance and complete negotiated transactions at acceptable prices and on acceptable terms, and our ability to obtain the necessary shareholder and regulatory approvals.
If we are unable to engage in or complete a desired acquisition or merger transaction, our financial condition and results of operations could be adversely impacted. As acquisitions have been a significant source of deposits, the inability to complete a business combination could require that we increase the interest rates we pay on deposits in order to attract such funding through our current branch network, or that we increase our use of wholesale funds. Increasing our cost of funds could adversely impact our net interest income and our net income. Furthermore, the absence of acquisitions could impact our ability to fulfill our loan demand.
26

Table of Contents
Mergers and acquisitions involve a number of risks and challenges, including:
  Our ability to successfully integrate the branches and operations we acquire, and to adopt appropriate internal controls and regulatory functions relating to such activities;
  Our ability to limit the outflow of deposits held by customers in acquired branches, and to successfully retain and manage any loans we acquire;
  Our ability to attract new deposits, and to generate new interest-earning assets, in geographic areas we have not previously served;
  Our success in deploying any cash received in a transaction into assets bearing sufficiently high yields without incurring unacceptable credit or interest rate risk;
  Our ability to control the incremental
non-interest
expense from acquired operations;
  Our ability to retain and attract the appropriate personnel to staff acquired branches and conduct any acquired operations;
  Our ability to generate acceptable levels of net interest income and
non-interest
income, including fee income, from acquired operations;
  The diversion of management’s attention from existing operations;
  Our ability to address an increase in working capital requirements; and
  Limitations on our ability to successfully reposition the post-merger balance sheet when deemed appropriate.
In addition, mergers and acquisitions can lead to uncertainties about the future on the part of customers and employees. Such uncertainties could cause customers and others to consider changing their existing business relationships with the company to be acquired, and could cause its employees to accept positions with other companies before the merger occurs. As a result, the ability of a company to attract and retain customers, and to attract, retain, and motivate key personnel, prior to a merger’s completion could be impaired.
Furthermore, no assurance can be given that acquired operations would not adversely affect our existing profitability; that we would be able to achieve results in the future similar to those achieved by our existing banking business; that we would be able to compete effectively in the market areas served by acquired branches; or that we would be able to manage any growth resulting from a transaction effectively. In particular, our ability to compete effectively in new markets would be dependent on our ability to understand those markets and their competitive dynamics, and our ability to retain certain key employees from the acquired institution who know those markets better than we do.
The inability to receive dividends from our subsidiary bank could have a material adverse effect on our financial condition or results of operations, as well as our ability to maintain or increase the current level of cash dividends we pay to our shareholders.
The Parent Company (i.e., the company on an unconsolidated basis) is a separate and distinct legal entity from the Bank, and a substantial portion of the revenues the Parent Company receives consists of dividends from the Bank. These dividends are the primary funding source for the dividends we pay on our common stock and the interest and principal payments on our debt. Various federal and state laws and regulations limit the amount of dividends that a bank may pay to its parent company. In addition, our right to participate in a distribution of assets upon the liquidation or reorganization of a subsidiary may be subject to the prior claims of the subsidiary’s creditors. If the Bank is unable to pay dividends to the Parent Company, we might not be able to service our debt, pay our obligations, or pay dividends on our common stock.
Reduction or elimination of our quarterly cash dividend could have an adverse impact on the market price of our common stock.
Holders of our common stock are only entitled to receive such dividends as our Board of Directors may declare out of funds available for such payments under applicable law and regulatory guidance, and although we have historically declared cash dividends on our common stock, we are not required to do so. Furthermore, the payment of dividends falls under federal regulations that have grown more stringent in recent years. While we pay our quarterly cash dividend in compliance with current regulations, such regulations could change in the future. Any reduction or elimination of our common stock dividend in the future could adversely affect the market price of our common stock.
Operational Risks
Our stress testing processes rely on analytical and forecasting models that may prove to be inadequate or inaccurate, which could adversely affect the effectiveness of our strategic planning and our ability to pursue certain corporate goals.
The processes we use to estimate the effects of changing interest rates, real estate values, and economic indicators such as unemployment on our financial condition and results of operations depend upon the use of analytical and forecasting models. These models reflect assumptions that may not be accurate, particularly in times of market
27

Table of Contents
stress or other unforeseen circumstances. Furthermore, even if our assumptions are accurate predictors of future performance, the models they are based on may prove to be inadequate or inaccurate because of other flaws in their design or implementation. If the models we use in the process of managing our interest rate and other risks prove to be inadequate or inaccurate, we could incur increased or unexpected losses which, in turn, could adversely affect our earnings and capital. Additionally, failure by the Company to maintain compliance with strict capital, liquidity, and other stress test requirements under banking regulations could subject us to regulatory sanctions, including limitations on our ability to pay dividends.
The occurrence of any failure, breach, or interruption in service involving our systems or those of our service providers could damage our reputation, cause losses, increase our expenses, and result in a loss of customers, an increase in regulatory scrutiny, or expose us to civil litigation and possibly financial liability, any of which could adversely impact our financial condition, results of operations, and the market price of our stock.
Communication and information systems are essential to the conduct of our business, as we use such systems, and those maintained and provided to us by third party service providers, to manage our customer relationships, our general ledger, our deposits, and our loans. In addition, our operations rely on the secure processing, storage, and transmission of confidential and other information in our computer systems and networks. Although we take protective measures and endeavor to modify them as circumstances warrant, the security of our computer systems, software, and networks may be vulnerable to breaches, unauthorized access, misuse, computer viruses, or other malicious code and cyber-attacks that could have an impact on information security. With the rise and permeation of online and mobile banking, the financial services industry in particular faces substantial cybersecurity risk due to the type of sensitive information provided by customers. Our systems and those of our third-party service providers and customers are under constant threat, and it is possible that we or they could experience a significant event in the future that could adversely affect our business or operations.
In addition, breaches of security may occur through intentional or unintentional acts by those having authorized or unauthorized access to our confidential or other information, or that of our customers, clients, or counterparties. If one or more of such events were to occur, the confidential and other information processed and stored in, and transmitted through, our computer systems and networks could potentially be jeopardized, or could otherwise cause interruptions or malfunctions in our operations or the operations of our customers, clients, or counterparties. This could cause us significant reputational damage or result in our experiencing significant losses.
While we diligently assess applicable regulatory and legislative developments affecting our business, laws and regulations relating to cybersecurity have been frequently changing, imposing new requirements on us. In light of these conditions, we face the potential for additional regulatory scrutiny that will lead to increasing compliance and technology expenses and, in some cases, possible limitations on the achievement of our plans for growth and other strategic objectives.
Furthermore, we may be required to expend significant additional resources to modify our protective measures or investigate and remediate vulnerabilities or other exposures arising from operational and security risks. Additional expenditures may be required for third-party expert consultants or outside counsel.
We also may be subject to litigation and financial losses that either are not insured against or not fully covered through any insurance we maintain.
In addition, we routinely transmit and receive personal, confidential, and proprietary information by
e-mail
and other electronic means. We have discussed, and worked with our customers, clients, and counterparties to develop secure transmission capabilities, but we do not have, and may be unable to put in place, secure capabilities with all of these constituents, and we may not be able to ensure that these third parties have appropriate controls in place to protect the confidentiality of such information. We maintain disclosure controls and procedures to ensure we will timely and sufficiently notify our investors of material cybersecurity risks and incidents, including the associated financial, legal, or reputational consequence of such an event, as well as reviewing and updating any prior disclosures relating to the risk or event.
While we have established information security policies and procedures, including an Incident Response Plan, to prevent or limit the impact of systems failures and interruptions, we may not be able to anticipate all possible security breaches that could affect our systems or information and there can be no assurance that such events will not occur or will be adequately prevented or mitigated if they do.
28

Table of Contents
The Company and the Bank rely on third parties to perform certain key business functions, which may expose us to further operational risk.
We outsource certain key aspects of our data processing to certain third-party providers. While we have selected these third-party providers carefully, we cannot control their actions. Our ability to deliver products and services to our customers, to adequately process and account for our customers’ transactions, or otherwise conduct our business could be adversely impacted by any disruption in the services provided by these third parties; their failure to handle current or higher volumes of usage; or any difficulties we may encounter in communicating with them. Replacing these third-party providers also could entail significant delay and expense.
Our third-party providers may be vulnerable to unauthorized access, computer viruses, phishing schemes, and other security breaches. Threats to information security also exist in the processing of customer information through various other third-party providers and their personnel. We may be required to expend significant additional resources to protect against the threat of such security breaches and computer viruses, or to alleviate problems caused by such security breaches or viruses. To the extent that the activities of our third-party providers or the activities of our customers involve the storage and transmission of confidential information, security breaches and viruses could expose us to claims, regulatory scrutiny, litigation, and other possible liabilities.
In addition, the Company may not be adequately insured against all types of losses resulting from third-party failures, and our insurance coverage may be inadequate to cover all losses resulting from systems failures or other disruptions to our banking services.
Failure to keep pace with technological changes could have a material adverse impact on our ability to compete for loans and deposits, and therefore on our financial condition and results of operations.
Financial products and services have become increasingly technology-driven. To some degree, our ability to meet the needs of our customers competitively, and in a cost-efficient manner, is dependent on our ability to keep pace with technological advances and to invest in new technology as it becomes available. Many of our competitors have greater resources to invest in technology than we do and may be better equipped to market new technology-driven products and services.
If federal, state, or local tax authorities were to determine that we did not adequately provide for our taxes, our income tax expense could be increased, adversely affecting our earnings.
The amount of income taxes we are required to pay on our earnings is based on federal, state, and local legislation and regulations. We provide for current and deferred taxes in our financial statements, based on our results of operations, business activity, legal structure, interpretation of tax statutes, assessment of risk of adjustment upon audit, and application of financial accounting standards. We may take tax return filing positions for which the final determination of tax is uncertain, and our net income and earnings per share could be reduced if a federal, state, or local authority were to assess additional taxes that have not been provided for in our consolidated financial statements. In addition, there can be no assurance that we will achieve our anticipated effective tax rate. Unanticipated changes in tax laws or related regulatory or judicial guidance, or an audit assessment that denies previously recognized tax benefits, could result in our recording tax expenses that materially reduce our net income.
The inability to attract and retain key personnel could adversely impact our operations.
To a large degree, our success depends on our ability to attract and retain key personnel whose expertise, knowledge of our markets, and years of industry experience would make them difficult to replace. Competition for skilled leaders in our industry can be intense, and we may not be able to hire or retain the people we would like to have working for us. The unexpected loss of services of one or more of our key personnel could have a material adverse impact on our business, given the specialized knowledge of such personnel and the difficulty of finding qualified replacements on a timely basis. Furthermore, our ability to attract and retain personnel with the skills and knowledge to support our business may require that we offer additional compensation and benefits that would reduce our earnings.
Many aspects of our operations are dependent upon the soundness of other financial intermediaries and thus could expose us to systemic risk.
The soundness of many financial institutions may be closely interrelated as a result of relationships between them involving credit, trading, execution of transactions, and the like. As a result, concerns about, or a default or threatened default by, one institution could lead to significant market-wide liquidity and credit problems, losses, or defaults by other institutions. As such “systemic risk” may adversely affect the financial intermediaries with which we interact on a daily basis (such as clearing agencies, clearing houses, banks, and securities firms and exchanges), we could be adversely impacted as well.
29

Table of Contents
Noncompliance with the Bank Secrecy Act and other anti-money laundering statutes and regulations could result in material financial loss.
The BSA and the Patriot Act contain anti-money laundering and financial transparency provisions intended to detect and prevent the use of the U.S. financial system for money laundering and terrorist financing activities. The BSA, as amended by the Patriot Act, requires depository institutions to undertake activities including monitoring an anti-money laundering program, verifying the identity of clients, monitoring for and reporting suspicious transactions, reporting on cash transactions above a certain threshold, and responding to requests for information by regulatory authorities and law enforcement agencies. FINCEN, a unit of the U.S. Treasury Department that administers the BSA, is authorized to impose significant civil monetary penalties for violations of these requirements.
There is also increased scrutiny of compliance with OFAC. If the Company’s policies, procedures, and systems are deemed deficient or the policies, procedures, and systems of financial institutions we have acquired or may acquire in the future are deemed deficient, the Company would be subject to liability, including fines and regulatory actions.
Failure to maintain and implement adequate programs to combat money laundering and terrorist financing activities could also result in reputational risk for the Company.
Failure to maintain effective internal control over financial reporting in accordance with Section 404 of the Sarbanes-Oxley Act of 2002 could have a material adverse effect on our business and stock price.
As a public company, we are required to maintain effective internal control over financial reporting in accordance with Section 404 of the Sarbanes-Oxley Act of 2002. Internal control over financial reporting is complex and may be revised over time to adapt to changes in our business, or changes in applicable accounting rules. We cannot assure you that our internal control over financial reporting will be effective in the future or that a material weakness will not be discovered with respect to a prior period for which we had previously believed that our internal control over financial reporting was effective.
If we are not able to maintain or document effective internal control over financial reporting, our independent registered public accounting firm will not be able to certify as to the effectiveness of our internal control over financial reporting. Matters impacting our internal control over financial reporting may cause us to be unable to report our financial information on a timely basis, or may cause us to restate previously issued financial information, and thereby subject us to adverse regulatory consequences, including sanctions or investigations by the SEC, or violations of applicable stock exchange listing rules.
There could also be a negative reaction in the financial markets due to a loss of investor confidence in us and the reliability of our financial statements. Confidence in the reliability of our financial statements is also likely to suffer if we or our independent registered public accounting firm reports a material weakness in the effectiveness of our internal control over financial reporting. This could materially adversely affect us by, for example, leading to a decline in our stock price and impairing our ability to raise capital.
Reputational Risk
Damage to our reputation could significantly harm the businesses we engage in, as well as our competitive position and prospects for growth.
Our ability to attract and retain investors, customers, clients, and employees could be adversely affected by damage to our reputation resulting from various sources, including employee misconduct, litigation, or regulatory outcomes; failure to deliver minimum standards of service and quality; compliance failures; unethical behavior; unintended disclosure of confidential information; and the activities of our clients, customers, and/or counterparties. Actions by the financial services industry in general, or by certain entities or individuals within it, also could have a significantly adverse impact on our reputation.
Our actual or perceived failure to identify and address various issues also could give rise to reputational risk that could significantly harm us and our business prospects, including failure to properly address operational risks. These issues include legal and regulatory requirements; consumer protection, fair lending, and privacy issues; properly maintaining customer and associated personal information; record keeping; protecting against money laundering; sales and trading practices; and ethical issues.
30

Table of Contents
ITEM 1B.
UNRESOLVED STAFF COMMENTS
 
None.
ITEM 2.
PROPERTIES
 
We own certain of our branch offices, as well as our headquarters on Long Island and certain other back-office buildings in New York, Ohio, and Florida. We also utilize other branch and back-office locations in those states, and in New Jersey and Arizona, under various lease and license agreements that expire at various times. (See Note 7, “Leases” in Item 8, “Financial Statements and Supplementary Data.”) We believe that our facilities are adequate to meet our present and immediately foreseeable needs.
ITEM 3.
LEGAL PROCEEDINGS
 
The Company is involved in various legal actions arising in the ordinary course of its business. All such actions in the aggregate involve amounts that are believed by management to be immaterial to the financial condition and results of operations of the Company.
ITEM 4.
MINE SAFETY DISCLOSURES
 
Not applicable.
31

Table of Contents
PART II
ITEM 5.
MARKET FOR REGISTRANT’S COMMON EQUITY, RELATED STOCKHOLDER MATTERS, AND ISSUER PURCHASES OF EQUITY SECURITIES
 
The common stock of New York Community Bancorp, Inc. trades on the New York Stock Exchange (the “NYSE”) under the symbol “NYCB.”
At December 31, 2019, the number of outstanding shares was 467,346,781 and the number of registered owners was approximately 11,042. The latter figure does not include those investors whose shares were held for them by a bank or broker at that date.
Stock Performance Graph
The following graph compares the cumulative total return on the Company’s stock in the five years ended December 31, 2019 with the cumulative total returns on a broad market index (the S&P
Mid-Cap
400 Index) and a peer group index (the SNL U.S. Bank and Thrift Index) during the same time. The S&P
Mid-Cap
400 Index was chosen as the broad market index in connection with the Company’s trading activity on the NYSE; the SNL U.S. Bank and Thrift Index currently is comprised of 386 bank and thrift institutions, including the Company. S&P Global Market Intelligence provided us with the data for both indices.
The performance graph is being furnished solely to accompany this report pursuant to Item 201(e) of Regulation
S-K,
and is not being filed for purposes of Section 18 of the Securities Exchange Act of 1934, as amended, and is not to be incorporated by reference into any filing of the Company, whether made before or after the date hereof, regardless of any general incorporation language in such filing.
The cumulative total returns are based on the assumption that $100.00 was invested in each of the three investments on December 31, 2014 and that all dividends paid since that date were reinvested. Such returns are based on historical results and are not intended to suggest future performance.
Comparison of
5-Year
Cumulative Total Return
Among New York Community Bancorp, Inc.,
S&P
Mid-Cap
400 Index, and SNL U.S. Bank and Thrift Index
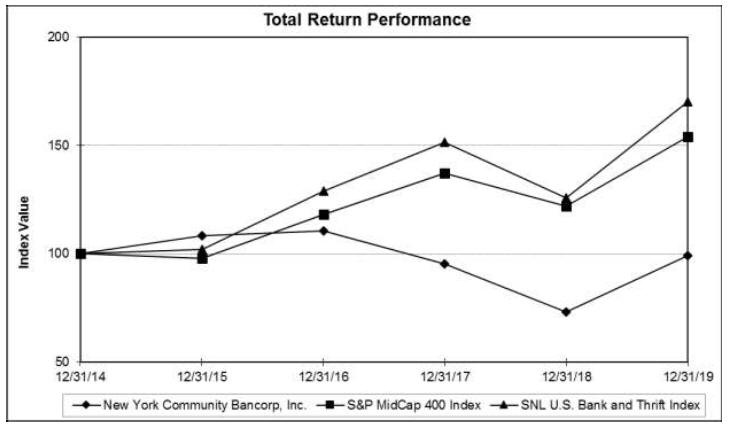
 
32

Table of Contents
ASSUMES $100 INVESTED ON DECEMBER 31, 2014
ASSUMES DIVIDEND REINVESTED
FISCAL YEAR ENDING DECEMBER 31, 2019
                                                 
 
12/31/2014
   
12/31/2015
   
12/31/2016
   
12/31/2017
   
12/31/2018
   
12/31/2019
 
New York Community Bancorp, Inc.
  $
100.00
    $
108.22
    $
110.55
    $
95.20
    $
73.09
    $
98.99
 
                                                 
S&P
Mid-Cap
400 Index
  $
100.00
    $
97.82
    $
118.11
    $
137.30
    $
122.08
    $
154.07
 
                                                 
SNL U.S. Bank and Thrift Index
  $
100.00
    $
102.02
    $
128.80
    $
151.45
    $
125.81
    $
170.04


33

Table of Contents
Share Repurchases
Shares Repurchased Pursuant to the Company’s Stock-Based Incentive Plans
Participants in the Company’s stock-based incentive plans may have shares of common stock withheld to fulfill the income tax obligations that arise in connection with their exercise of stock options and the vesting of their stock awards. Shares that are withheld for this purpose are repurchased pursuant to the terms of the applicable stock-based incentive plan, rather than pursuant to the share repurchase program authorized by the Board of Directors described below.
Shares Repurchased Pursuant to the Board of Directors’ Share Repurchase Authorization
On October 23, 2018, the Board of Directors authorized the repurchase of up to $300 million of the Company’s common stock. Under said authorization, shares may be repurchased on the open market or in privately negotiated transactions.
Shares that are repurchased pursuant to the Board of Directors’ authorization, and those that are repurchased pursuant to the Company’s stock-based incentive plans, are held in our Treasury account and may be used for various corporate purposes, including, but not limited to, merger transactions and the vesting of restricted stock awards.
As indicated in the table below, during the twelve months ended December 31, 2019, the Company allocated 769,111 shares or $8.1 million toward the repurchase of shares tied to its stock-based incentive plans. Also, during the first quarter of the year, the Company repurchased $67.1 million or 7.1 million shares of its common stock under its authorized share repurchase program, leaving $72.1 million remaining under the repurchase authorization at December 31, 2019.
                         
(dollars in thousands, except per share data)


Period
 
Total Shares of Common
Stock Repurchased
   
Average Price Paid
per Common Share
   
Total
Allocation
 
First Quarter 2019
   
7,816,228
     
$  9.57
    $
74,788
 
Second Quarter 2019
   
3,485
     
11.14
     
39
 
Third Quarter 2019
   
31,059
     
11.10
     
345
 
Fourth Quarter 2019:


October
   
232
     
13.02
     
3
 
November
   
3,018
     
12.02
     
36
 
December
   
829
     
10.53
     
9
 
                         
Total Fourth Quarter 2019
   
4,079
     
11.78
     
48
 
                         
2019 Total
   
7,854,851
     
9.58
    $
75,220


34

Table of Contents
ITEM 6.
SELECTED FINANCIAL DATA


At or For the Years Ended December 31,
 
(dollars in thousands, except share data)
 
2019
   
2018
   
2017
   
2016
   
2015
 
EARNINGS SUMMARY:


Net interest income 
(1)
  $
957,400
    $
1,030,995
    $
1,130,003
    $
1,287,382
    $
408,075
 
Provision for (recovery of) losses on
non-covered
loans
   
7,105
     
18,256
     
60,943
     
11,874
     
(3,334
)
Recovery of losses on covered loans
   
—  
     
—  
     
(23,701
)    
(7,694
)    
(11,670
)
Non-interest
income
   
84,230
     
91,558
     
216,880
     
145,572
     
210,763
 
Non-interest
expense:


Operating expenses 
(2)
   
511,218
     
546,628
     
641,218
     
638,109
     
615,600
 
Amortization of core deposit intangibles
   
—  
     
—  
     
208
     
2,391
     
5,344
 
Debt repositioning charge
   
—  
     
—  
     
—  
     
—  
     
141,209
 
Merger-related expenses
   
—  
     
—  
     
—  
     
11,146
     
3,702
 
Total
non-interest
expense
   
511,218
     
546,628
     
641,426
     
651,646
     
765,855
 
Income tax expense (benefit)
   
128,264
     
135,252
     
202,014
     
281,727
     
(84,857
)
Net income (loss) 
(3)
   
395,043
     
422,417
     
466,201
     
495,401
     
(47,156
)
Basic earnings (loss) per common share 
(3)
  $
0.77
    $
0.79
    $
0.90
    $
1.01
    $
(0.11
)
Diluted earnings (loss) per common share 
(3)
   
0.77
     
0.79
     
0.90
     
1.01
     
(0.11
)
Dividends paid per common share
   
0.68
     
0.68
     
0.68
     
0.68
     
1.00
 
SELECTED RATIOS:


Return on average assets 
(3)
   
0.76
%    
0.84
%    
0.96
%    
1.00
%    
(0.10
)%
Return on average common stockholders’
    equity  
(3)
   
5.88
     
6.20
     
7.12
     
8.19
     
(0.81
)
Average common stockholders’ equity to average assets
   
11.82
     
12.51
     
12.76
     
12.28
     
11.90
 
Operating expenses to average assets 
(2)
   
0.98
     
1.09
     
1.32
     
1.29
     
1.26
 
Efficiency ratio 
(1)(2)
   
49.08
     
48.70
     
47.61
     
44.53
     
99.48
 
Net interest rate spread 
(1)
   
1.79
     
2.06
     
2.47
     
2.85
     
0.69
 
Net interest margin 
(1)
   
2.02
     
2.25
     
2.59
     
2.93
     
0.94
 
Dividend payout ratio
   
88.31
     
86.08
     
75.56
     
67.33
     
—  
 
BALANCE SHEET SUMMARY:


Total assets
  $
53,640,821
    $
51,899,376
    $
49,124,195
    $
48,926,555
    $
50,317,796
 
Loans, net of allowance for loan losses
   
41,746,517
     
40,006,088
     
38,265,183
     
39,308,016
     
38,011,995
 
Allowance for losses on
non-covered
loans
   
147,638
     
159,820
     
158,046
     
158,290
     
147,124
 
Allowance for losses on covered loans
   
—  
     
—  
     
—  
     
23,701
     
31,395
 
Securities
   
5,885,887
     
5,644,071
     
3,531,427
     
3,817,057
     
6,173,645
 
Deposits
   
31,657,132
     
30,764,430
     
29,102,163
     
28,887,903
     
28,426,758
 
Borrowed funds
   
14,557,593
     
14,207,866
     
12,913,679
     
13,673,379
     
15,748,405
 
Common stockholders’ equity
   
6,208,854
     
6,152,395
     
6,292,536
     
6,123,991
     
5,934,696
 
Common shares outstanding
   
467,346,781
     
473,536,604
     
488,490,352
     
487,056,676
     
484,943,308
 
Book value per common share
  $
13.29
    $
12.99
    $
12.88
    $
12.57
    $
12.24
 
Common stockholders’ equity to total assets
   
11.57
%    
11.85
%    
12.81
%    
12.52
%    
11.79
%
ASSET QUALITY RATIOS (excluding covered assets and
non-covered
purchased credit-impaired loans):


Non-performing
non-covered
loans to total
non-covered
loans
   
0.15
%    
0.11
%    
0.19
%    
0.15
%    
0.13
%
Non-performing
non-covered
assets to total
non-covered
assets
   
0.14
     
0.11
     
0.18
     
0.14
     
0.13
 
Allowance for losses on
non-covered
loans to
non-performing
non-covered
loans
   
241.07
     
351.21
     
214.50
     
277.19
     
310.08
 
Allowance for losses on
non-covered
loans to total
non-covered
loans
   
0.35
     
0.40
     
0.41
     
0.42
     
0.41
 
Net charge-offs (recoveries) to average loans
 (4)
   
0.05
     
0.04
     
0.16
     
0.00
     
(0.02
)
 
(1)
The 2015 amount reflects the impact of a $773.8 million debt repositioning charge recorded as interest expense in the fourth quarter of the year.
 
(2)
The 2015 amount includes state and local
non-income
taxes of $5.4 million resulting from the debt repositioning charge.
 
(3)
The 2015 amount reflects the $546.8 million
after-tax
impact of the debt repositioning charge recorded as interest expense and
non-interest
expense, combined.
 
(4)
Average loans include covered loans.
 
35

Table of Contents
ITEM 7.
MANAGEMENT’S DISCUSSION AND ANALYSIS OF FINANCIAL CONDITION AND RESULTS OF OPERATIONS
 
For the purpose of this discussion and analysis, the words “we,” “us,” “our,” and the “Company” are used to refer to New York Community Bancorp, Inc. and our consolidated subsidiaries, including New York Community Bank (the “Bank”).
Executive Summary
New York Community Bancorp, Inc. is the holding company for New York Community Bank, with 238 branches in Metro New York, New Jersey, Ohio, Florida, and Arizona. At December 31, 2019, we had total assets of $53.6 billion, including total loans of $41.7 billion, total deposits of $31.7 billion, and total stockholders’ equity of $6.7 billion.
Chartered in the State of New York, the Bank is subject to regulation by the FDIC, the CFPB, and the NYSDFS. In addition, the holding company is subject to regulation by the FRB, the SEC, and to the requirements of the NYSE, where shares of our common stock are traded under the symbol “NYCB” and shares of our preferred stock trade under the symbol “NYCB PA.”
As a publicly traded company, our mission is to provide our shareholders with a solid return on their investment by producing a strong financial performance, maintaining a solid capital position, and engaging in corporate strategies that enhance the value of their shares. For the twelve months ended December 31, 2019, the Company reported net income of $395.0 million, compared to the $422.4 million reported for the twelve months ended December 31, 2018. Net income available to common shareholders in the comparable period was $362.2 million, versus $389.6 million for the twelve months ended December 31, 2018. Diluted earnings per common share were $0.77 for the twelve months ended December 31, 2019, as compared to $0.79 per diluted common share for the twelve months ended December 31, 2018.
The key trends during 2019 were:
Continued Growth in Our Loan Portfolio
At December 31, 2019 the Company’s loan portfolio totaled $41.7 billion, up $1.7 billion or a 4.4% increase compared to the balance at December 31, 2018. The year-over-year growth in our loan portfolio was due to growth in the multi-family portfolio, the specialty finance portfolio (which is part of our C&I loan portfolio), and the CRE portfolio.
Fueled by $6.0 billion in originations and $770.8 million of repurchases, the multi-family portfolio increased $1.3 billion or 4.3% to $31.2 billion at December 31, 2019 compared to $29.9 billion at December 31, 2018, and it accounted for most of the loan growth during the current year. The specialty finance portfolio had another strong year, growing $675.8 million or 35% on a year-over-year basis to $2.6 billion at December 31, 2019, while the CRE portfolio increased $83.5 million or 1% to $7.1 billion at December 31, 2019 compared to December 31, 2018.
Inflection Point for the NIM and Net Interest Income
Both net interest income and the NIM declined on a year-over-year basis, but they increased during the fourth quarter of 2019, marking the first time since the end of 2015 that both of these metrics increased. The primary driver of the increase was lower funding costs which led to lower interest expense, which, in turn, drove the growth in net interest income. The NIM rose five basis points to 2.04% on a linked-quarter basis as net interest income improved $6.6 million to $242.5 million or 11% annualized compared to the third quarter of 2019.
Operating Expenses Decline Further
Our cost-cutting efforts continued to pay off in 2019. After declining nearly $95 million during the course of 2018, total
non-interest
expense declined a further $35.4 million or 6.5% over the course of 2019. In 2019,
non-interest
expense included $10.4 million of certain items related to severance costs and branch rationalization costs.
36

Table of Contents
Asset Quality Remained Exceptional During the Current Year
The Company’s asset quality metrics remained strong during full-year 2019. Total NPAs were $73.5 million or 0.14% of total assets, while
non-performing
loans were $61.2 million or 0.15% of total loans. Included in these amounts was $30.4 million of
non-accrual
taxi medallion-related loans. Repossessed assets were $12.3 million at
year-end
2019 and included $10.3 million of repossessed taxi medallions at that time period.
For the twelve months ended December 31, 2019, we recorded $19.3 million of net charge-offs or 0.05% of average loans. This figure included $10.2 million of charge-offs related to the taxi medallion portfolio. Importantly, on a combined basis, we only recorded $659,000 of charge-offs in the MF/CRE loan portfolios or 0.00% of average loans.
External Factors
The following is a discussion of certain external factors that tend to influence our financial performance and the strategic actions we take.
Interest Rates
Among the external factors that tend to influence our performance, the interest rate environment is key. Just as short-term interest rates affect the cost of our deposits and that of the funds we borrow, market interest rates affect the yields on the loans we produce for investment and the securities in which we invest.
As further discussed under “Loans Held for Investment” later on in this discussion, the interest rates on our multi-family loans and CRE credits generally are based on the five-year and seven-year CMT. The following table summarizes the high, low, and average five- and seven-year CMT rates in 2019 and 2018:
                                 
 
Constant Maturity Treasury Rates
 
 
Five-Year
   
Seven-Year
 
 
2019
   
2018
   
2019
   
2018
 
High
   
2.62
%    
3.09
%    
2.70
%    
3.18
%
Low
   
1.32
     
2.25
     
1.40
     
2.37
 
Average
   
1.95
     
2.75
     
2.05
     
2.85
 
 
Because the multi-family and CRE loans we produce generate income when they prepay (which is recorded as interest income), the impact of repayment activity can be especially meaningful. In 2019, prepayment income from loans contributed $48.9 million to interest income; in the prior year, the contribution was $44.9 million.
Economic Indicators
While we attribute our asset quality to the nature of the loans we produce and our conservative underwriting standards, the quality of our assets can also be impacted by economic conditions in our local markets and throughout the United States. The information that follows consists of recent economic data that we consider to be germane to our performance and the markets we serve.
The following table presents the generally downward trend in unemployment rates, as reported by the U.S. Department of Labor, both nationally and in the various markets that comprise our footprint, for the months indicated:
                 
 
December
 
 
2019
   
2018
 
Unemployment rate:


United States
   
3.4
%    
3.7
%
New York City
   
3.2
     
3.9
 
Arizona
   
4.3
     
4.9
 
Florida
   
2.5
     
3.3
 
New Jersey
   
3.6
     
3.6
 
New York
   
3.7
     
3.9
 
Ohio
   
3.8
     
4.8
 
 
37

Table of Contents
The CPI measures the average change over time in the prices paid by urban consumers for a market basket of consumer goods and services. The following table indicates the change in the CPI for the twelve months ended at each of the indicated dates:
                 
 
For the Twelve Months Ended
December
 
 
2019
   
2018
 
Change in prices:
   
2.3
%    
1.9
%
 
Economic activity also is indicated by the Consumer Confidence Index
®
, which moved up to 128.2 in December 2019 from 126.2 in December 2018. An index level of 90 or more is considered indicative of a strong economy.
The following chart illustrates the relative stability of the rental vacancy rate in New York City for all rental units and for rent stabilized units, from 1991 through 2017, as compared to the changes in average unemployment rates in New York City during those years. As the New York City rental vacancy rate is only reported every three years, the annual average unemployment rate in New York City is provided for those years only. As you can see the vacancy rates for rent stabilized units are lower, in some years, meaningfully lower, then the vacancy rates for all rental units.
New York City Rental Vacancy Rates to Unemployment Rates
                         
Year
 
New York City

Rental Vacancy Rate

All Rental Units
1
 
 
New York City

Rental Vacancy Rate

Rent Stabilized Units
1
 
 
New York City

Annual Average

Unemployment Rate
2
 
2017
   
3.63
%    
2.06
%    
4.50
%
2014
   
3.45
%    
2.12
%    
7.20
%
2011
   
3.12
%    
2.55
%    
9.10
%
2008
   
2.88
%    
2.14
%    
5.60
%
2005
   
3.09
%    
2.68
%    
5.80
%
2002
   
2.94
%    
2.52
%    
8.00
%
1999
   
3.19
%    
2.46
%    
6.80
%
1996
   
4.01
%    
3.57
%    
8.80
%
1993
   
3.44
%    
3.10
%    
10.40
%
1991
   
3.78
%    
3.54
%    
8.70
%
 
(1)
Source: Selected Initial Findings of the New York City Housing and Vacancy Survey
 
(2)
Source: http://www.labor.ny.gov/stats/laus.asp
 
Recent Events
Dividend Declaration
On January 28, 2020, the Board of Directors declared a quarterly cash dividend on the Company’s common stock of $0.17 per share, payable on February 24, 2020 to common shareholders of record at the close of business on February 10, 2020.
Critical Accounting Policies
We consider certain accounting policies to be critically important to the portrayal of our financial condition and results of operations, since they require management to make complex or subjective judgments, some of which may relate to matters that are inherently uncertain. The inherent sensitivity of our consolidated financial statements to these critical accounting policies, and the judgments, estimates, and assumptions used therein, could have a material impact on our financial condition or results of operations.
We have identified the following to be critical accounting policies: the determination of the allowance for loan losses and the determination of the amount, if any, of goodwill impairment.
The judgments used by management in applying these critical accounting policies may be influenced by adverse changes in the economic environment, which may result in changes to future financial results.
38

Table of Contents
Allowance for Loan Losses
The allowance for loan losses represents our estimate of probable and estimable losses inherent in the loan portfolio as of the date of the balance sheet. Losses on loans are charged against, and recoveries of losses on loans are credited back to, the allowance for loan losses.
The methodology used for the allocation of the allowance for loan losses at December 31, 2019 and December 31, 2018 was generally comparable, whereby the Bank segregated their loss factors (used for both criticized and
non-criticized
loans) into a component that was primarily based on historical loss rates and a component that was primarily based on other qualitative factors that are probable to affect loan collectability. In determining the allowance for loan losses, management considers the Bank’s current business strategies and credit processes, including compliance with applicable regulatory guidelines and with guidelines approved by the Boards of Directors with regard to credit limitations, loan approvals, underwriting criteria, and loan workout procedures.
The allowance for loan losses is established based on management’s evaluation of incurred losses in the portfolio in accordance with GAAP, and is comprised of both specific valuation allowances and a general valuation allowance.
Specific valuation allowances are established based on management’s analyses of individual loans that are considered impaired. If a loan is deemed to be impaired, management measures the extent of the impairment and establishes a specific valuation allowance for that amount. A loan is classified as impaired when, based on current information and/or events, it is probable that we will be unable to collect all amounts due under the contractual terms of the loan agreement. We apply this classification as necessary to loans individually evaluated for impairment in our portfolios. Smaller-balance homogenous loans and loans carried at the lower of cost or fair value are evaluated for impairment on a collective, rather than individual, basis. Loans to certain borrowers who have experienced financial difficulty and for which the terms have been modified, resulting in a concession, are considered TDRs and are classified as impaired.
We primarily measure impairment on an individual loan and determine the extent to which a specific valuation allowance is necessary by comparing the loan’s outstanding balance to either the fair value of the collateral, less the estimated cost to sell, or the present value of expected cash flows, discounted at the loan’s effective interest rate. Generally, when the fair value of the collateral, net of the estimated cost to sell, or the present value of the expected cash flows is less than the recorded investment in the loan, any shortfall is promptly charged off.
We also follow a process to assign the general valuation allowance to loan categories. The general valuation allowance is established by applying our loan loss provisioning methodology, and reflect the inherent risk in outstanding
held-for-investment
loans. This loan loss provisioning methodology considers various factors in determining the appropriate quantified risk factors to use to determine the general valuation allowance. The factors assessed begin with the historical loan loss experience for each major loan category. We also take into account an estimated historical loss emergence period (which is the period of time between the event that triggers a loss and the confirmation and/or
charge-off
of that loss) for each loan portfolio segment.
The allocation methodology consists of the following components: First, we determine an allowance for loan losses based on a quantitative loss factor for loans evaluated collectively for impairment. This quantitative loss factor is based primarily on historical loss rates, after considering loan type, historical loss and delinquency experience, and loss emergence periods. The quantitative loss factors applied in the methodology are periodically
re-evaluated
and adjusted to reflect changes in historical loss levels, loss emergence periods, or other risks. Lastly, we allocate an allowance for loan losses based on qualitative loss factors. These qualitative loss factors are designed to account for losses that may not be provided for by the quantitative loss component due to other factors evaluated by management, which include, but are not limited to:
  Changes in lending policies and procedures, including changes in underwriting standards and collection, and
charge-off
and recovery practices;
 
  Changes in international, national, regional, and local economic and business conditions and developments that affect the collectability of the portfolio, including the condition of various market segments;
 
  Changes in the nature and volume of the portfolio and in the terms of loans;
 
  Changes in the volume and severity of
past-due
loans, the volume of
non-accrual
loans, and the volume and severity of adversely classified or graded loans;
 
  Changes in the quality of our loan review system;
 
  Changes in the value of the underlying collateral for collateral-dependent loans;
 
39

Table of Contents
  The existence and effect of any concentrations of credit, and changes in the level of such concentrations;
 
  Changes in the experience, ability, and depth of lending management and other relevant staff; and
 
  The effect of other external factors, such as competition and legal and regulatory requirements, on the level of estimated credit losses in the existing portfolio.
 
By considering the factors discussed above, we determine an allowance for loan losses that is applied to each significant loan portfolio segment to determine the total allowance for loan losses.
The historical loss period we use to determine the allowance for loan losses on loans is a rolling 36-quarter look-back period, as we believe this produces an appropriate reflection of our historical loss experience.
The process of establishing the allowance for losses on loans also involves:
  Periodic inspections of the loan collateral by qualified
in-house
and external property appraisers/inspectors;
 
  Regular meetings of executive management with the pertinent Board committees, during which observable trends in the local economy and/or the real estate market are discussed;
 
  Assessment of the aforementioned factors by the pertinent members of the Board of Directors and management when making a business judgment regarding the impact of anticipated changes on the future level of loan losses; and
 
  Analysis of the portfolio in the aggregate, as well as on an individual loan basis, taking into consideration payment history, underwriting analyses, and internal risk ratings.
 
In order to determine their overall adequacy, the loan loss allowance is reviewed quarterly by management Board Committees and the Board of Directors of the Bank, as applicable.
We charge off loans, or portions of loans, in the period that such loans, or portions thereof, are deemed uncollectible. The collectability of individual loans is determined through an assessment of the financial condition and repayment capacity of the borrower and/or through an estimate of the fair value of any underlying collateral. For
non-real
estate-related consumer credits, the following
past-due
time periods determine when charge-offs are typically recorded: (1)
 closed-end
credits are charged off in the quarter that the loan becomes 120 days past due; (2)
 open-end
credits are charged off in the quarter that the loan becomes 180 days past due; and (3) both
closed-end
and
open-end
credits are typically charged off in the quarter that the credit is 60 days past the date we received notification that the borrower has filed for bankruptcy.
The level of future additions to the respective loan loss allowance is based on many factors, including certain factors that are beyond management’s control, such as changes in economic and local market conditions, including declines in real estate values, and increases in vacancy rates and unemployment. Management uses the best available information to recognize losses on loans or to make additions to the loan loss allowance; however, the Bank may be required to take certain charge-offs and/or recognize further additions to the loan loss allowance, based on the judgment of regulatory agencies with regard to information provided during their examinations of the Bank.
An allowance for unfunded commitments is maintained separate from the allowance for loan losses and is included in Other liabilities in the Consolidated Statements of Condition.
See Note 6, Allowance for Loan Losses for a further discussion of our allowance for loan losses.
Goodwill Impairment
We have significant intangible assets related to goodwill. As of December 31, 2019, we had goodwill of $2.4 billion. In connection with our acquisitions, assets acquired and liabilities assumed are recorded at their estimated fair values. Goodwill represents the excess of the purchase price of our acquisitions over the fair value of identifiable net assets acquired, including other identified intangible assets. Our goodwill is evaluated for impairment annually as of
year-end
or more frequently if conditions exist that indicate that the value may be impaired. We test our goodwill for impairment at the reporting unit level. These impairment evaluations are performed by comparing the carrying value of the goodwill of a reporting unit to its estimated fair value. We allocate goodwill to reporting units based on the reporting unit expected to benefit from the business combination. We have identified one reporting unit which is the same as our operating segment and reportable segment. If we change our strategy or if market conditions shift, our judgments may change, which may result in adjustments to the recorded goodwill balance.
40

Table of Contents
For annual goodwill impairment testing, we have the option to first perform a qualitative assessment to determine whether it is more likely than not that the fair value of a reporting unit is less than its carrying amount, including goodwill and other intangible assets. If we conclude that this is the case, we must perform the
two-step
test described below. If we conclude based on the qualitative assessment that it is not more likely than not that the fair value of a reporting unit is less than its carrying amount, we have completed our goodwill impairment test and do not need to perform the
two-step
test.
Step one requires the fair value of each reporting unit is compared to its carrying value in order to identify potential impairment. If the fair value of a reporting unit exceeds the carrying value of its net assets, goodwill is not considered impaired and no further testing is required. If the carrying value of the net assets exceeds the fair value of a reporting unit, potential impairment is indicated at the reporting unit level and step two of the impairment test is performed.
Step two requires that when potential impairment is indicated in step one, we compare the implied fair value of goodwill with the carrying amount of that goodwill. Determining the implied fair value of goodwill requires a valuation of the reporting unit’s tangible and
(non-goodwill)
intangible assets and liabilities in a manner similar to the allocation of the purchase price in a business combination. Any excess in the value of a reporting unit over the amounts assigned to its assets and liabilities is referred to as the implied fair value of goodwill. If the carrying amount of the reporting unit goodwill exceeds the implied fair value of that goodwill, an impairment loss is recognized in an amount equal to that excess.
During the year ended December 31, 2019, no triggering events were identified that indicated that the value of goodwill may be impaired. For the year ended December 31, 2019, the Company’s annual goodwill impairment assessment, using step one of the quantitative test, found no indication of goodwill impairment.
Income Taxes
In estimating income taxes, management assesses the relative merits and risks of the tax treatment of transactions, taking into account statutory, judicial, and regulatory guidance in the context of our tax position. In this process, management also relies on tax opinions, recent audits, and historical experience. Although we use the best available information to record income taxes, underlying estimates and assumptions can change over time as a result of unanticipated events or circumstances such as changes in tax laws and judicial guidance influencing our overall or transaction-specific tax position.
We recognize deferred tax assets and liabilities for the future tax consequences attributable to differences between the financial statement carrying amounts of existing assets and liabilities and their respective tax bases, and the carryforward of certain tax attributes such as net operating losses. A valuation allowance is maintained for deferred tax assets that we estimate are more likely than not to be unrealizable, based on available evidence at the time the estimate is made. In assessing the need for a valuation allowance, we estimate future taxable income, considering the prudence and feasibility of tax planning strategies and the realizability of tax loss carryforwards. Valuation allowances related to deferred tax assets can be affected by changes to tax laws, statutory tax rates, and future taxable income levels.
In the event we were to determine that we would not be able to realize all or a portion of our net deferred tax assets in the future, we would reduce such amounts through a charge to income tax expense in the period in which that determination was made. Conversely, if we were to determine that we would be able to realize our deferred tax assets in the future in excess of the net carrying amounts, we would decrease the recorded valuation allowance through a decrease in income tax expense in the period in which that determination was made. Subsequently recognized tax benefits associated with valuation allowances recorded in a business combination would be recorded as an adjustment to goodwill.
FINANCIAL CONDITION
Balance Sheet Summary
At December 31, 2019, total assets were $53.6 billion, up $1.7 billion or 3.4% on a year-over-year basis. Our asset growth was largely the result of loan growth and to a much lesser extent, growth in the securities portfolio. This was funded through a combination of growth in deposits and in wholesale borrowings, and by a decrease in cash and cash equivalents.
41

Table of Contents
Total loans held for investment rose $1.7 billion or 4.3% on a year-over-year basis to $41.9 billion, as the multi-family loan portfolio increased $1.3 billion or 4.3% to $31.2 billion and the C&I loan portfolio rose $626.0 million or 26.2% to $3.0 billion.
Total securities, consisting mainly of
available-for-sale
securities increased $241.8 million or 4.3% on a year-over-year basis, to $5.9 billion.
On the liability side, total deposits rose $892.7 million or 2.9% to $31.7 billion compared to the balance at
year-end
2018, while total borrowed funds increased $349.7 million or 2.5% to $14.6 billion. Most of the growth in borrowings occurred in the fourth quarter of the year.
Total stockholders’ equity at December 31, 2019 was $6.7 billion, relatively unchanged compared to the balance at December 31, 2018. Common stockholders’ equity to total assets was 11.57% compared to 11.85% at December 31, 2018. Book value per common share was $13.29 at December 31, 2019 compared to $12.99 at December 31, 2018.
Excluding goodwill of $2.4 billion at both December 31, 2019 and 2018, tangible common stockholders’ equity totaled $3.8 billion at
year-end
2019, up $66.2 million or 1.8% compared to
year-end
2018. Tangible common stockholders’ equity to tangible assets was 7.39% at December 31, 2019 compared to 7.51% at December 31, 2018. Tangible book value per common share at December 31, 2019 was $8.09 compared to $7.85 at December 31, 2018.
Loans
Loans Held for Investment
The majority of the loans we produce are multi-family loans. Our production of multi-family loans began several decades ago in the five boroughs of New York City, where the majority of the rental units currently consist of rent-regulated apartments featuring below-market rents.
In addition to multi-family loans, our loan portfolio contains a large number of CRE credits, most of which are secured by income-producing properties located in New York City and on Long Island.
In addition to multi-family loans and CRE loans, our portfolio includes substantially smaller balances of
one-to-four
family loans, ADC loans, and other loans held for investment, with C&I loans comprising the bulk of the other loan portfolio. Specialty finance loans and leases account for most of our C&I credits, with the remainder consisting primarily of loans to small and
mid-size
businesses, referred to as other C&I loans.
In 2019, we originated $10.6 billion of loans, a $540.5 million or a 5.4% increase from the prior year. The higher level of originations was largely driven by an increase in specialty finance originations and CRE originations, offset by a decline in multi-family originations. During full-year 2019, the Bank originated $6.0 billion of multi-family loans, down 9.7% compared to full-year 2018, while specialty finance loans grew $882.9 million or 46.1%, to $2.8 billion, and CRE originations increased $259.5 million or 26.8%.
In addition to the strong origination volumes over the course of 2019, during the fourth quarter of the year, the Company also opportunistically repurchased $770.8 million of primarily multi-family loans it previously originated and sold to other financial institutions. These loans were originally sold by the Company in order to manage the balance sheet below the $50 billion in asset SIFI threshold in place at the time.
Multi-Family Loans
Multi-family loans are our principal asset. The loans we produce are primarily secured by
non-luxury
residential apartment buildings in New York City that feature rent-regulated units and below-market rents—a market we refer to as our “primary lending niche.” Consistent with our emphasis on multi-family lending, multi-family loan originations represented $6.0 billion, or 56.4%, of the loans we produced for investment in 2019.
At December 31, 2019, multi-family loans represented $31.2 billion, or 74.5%, of total loans held for investment, reflecting a year-over-year increase of $1.3 billion, or 4.3% and the average multi-family loan had a principal balance of $6.4 million and $6.1 million; the expected weighted average life of the portfolio was 2.0 years at December 31, 2019 compared to 2.6 years at December 31, 2018.
42

Table of Contents
The majority of our multi-family loans were secured by rental apartment buildings. In addition, 77.9% of our multi-family loans were secured by buildings in the metro New York City area and 3.0% were secured by buildings elsewhere in New York State. The remaining multi-family loans were secured by buildings outside these markets, including in the four other states served by our retail branch offices.
At December 31, 2019, $18.7 billion or 60.0% of the Company’s total multi-family loan portfolio is secured by properties in New York State and, therefore, are subject to the new rent regulation laws. The weighted average LTV of the NYS rent regulated multi-family portfolio was 53.17% as of December 31, 2019, compared to a weighted average LTV of 56.86% for the entire multi-family loan portfolio at that date.
In addition to underwriting multi-family loans on the basis of the buildings’ income and condition, we consider the borrowers’ credit history, profitability, and building management expertise. Borrowers are required to present evidence of their ability to repay the loan from the buildings’ current rent rolls, their financial statements, and related documents.
While a percentage of our multi-family loans are
ten-year
fixed rate credits, the vast majority of our multi-family loans feature a term of ten or twelve years, with a fixed rate of interest for the first five or seven years of the loan, and an alternative rate of interest in years six through ten or eight through twelve. The rate charged in the first five or seven years is generally based on intermediate-term interest rates plus a spread.
During the remaining years, the loan resets to an annually adjustable rate that is tied to the prime rate of interest, plus a spread. Alternately, the borrower may opt for a fixed rate that is tied to the five-year fixed advance rate of the
FHLB-NY,
plus a spread. The fixed-rate option also requires the payment of one percentage point of the then-outstanding loan balance. In either case, the minimum rate at repricing is equivalent to the rate in the initial
five-or
seven-year term. As the rent roll increases, the typical property owner seeks to refinance the mortgage, and generally does so before the loan reprices in year six or eight.
Multi-family loans that refinance within the first five or seven years are typically subject to an established prepayment penalty schedule. Depending on the remaining term of the loan at the time of prepayment, the penalties normally range from five percentage points to one percentage point of the then-current loan balance. If a loan extends past the fifth or seventh year and the borrower selects the fixed-rate option, the prepayment penalties typically reset to a range of five points to one point over years six through ten or eight through twelve. For example, a
ten-year
multi-family loan that prepays in year three would generally be expected to pay a prepayment penalty equal to three percentage points of the remaining principal balance. A twelve-year multi-family loan that prepays in year one or two would generally be expected to pay a penalty equal to five percentage points.
Because prepayment penalties are recorded as interest income, they are reflected in the average yields on our loans and interest-earning assets, our net interest rate spread and net interest margin, and the level of net interest income we record. No assumptions are involved in the recognition of prepayment income, as such income is only recorded when cash is received.
Our success as a multi-family lender partly reflects the solid relationships we have developed with the market’s leading mortgage brokers, who are familiar with our lending practices, our underwriting standards, and our long-standing practice of basing our loans on the cash flows produced by the properties. The process of producing such loans is generally four to six weeks in duration and, because the multi-family market is largely broker-driven, the expense incurred in sourcing such loans is substantially reduced.
Our emphasis on multi-family loans is driven by several factors, including their structure, which reduces our exposure to interest rate volatility to some degree. Another factor driving our focus on multi-family lending has been the comparative quality of the loans we produce. Reflecting the nature of the buildings securing our loans, our underwriting standards, and the generally conservative LTV ratios our multi-family loans feature at origination, a relatively small percentage of the multi-family loans that have transitioned to
non-performing
status have actually resulted in losses, even when the credit cycle has taken a downward turn.
We primarily underwrite our multi-family loans based on the current cash flows produced by the collateral property, with a reliance on the “income” approach to appraising the properties, rather than the “sales” approach. The sales approach is subject to fluctuations in the real estate market, as well as general economic conditions, and is therefore likely to be more risky in the event of a downward credit cycle turn. We also consider a variety of other factors, including the physical condition of the underlying property; the net operating income of the mortgaged premises prior to debt service; the DSCR, which is the ratio of the property’s net operating income to its debt service; and the ratio of the loan amount to the appraised value (i.e., the LTV) of the property.
43

Table of Contents
In addition to requiring a minimum DSCR of 120% on multi-family buildings, we obtain a security interest in the personal property located on the premises, and an assignment of rents and leases. Our multi-family loans generally represent no more than 75% of the lower of the appraised value or the sales price of the underlying property, and typically feature an amortization period of 30 years. In addition, our multi-family loans may contain an initial interest-only period which typically does not exceed two years; however, these loans are underwritten on a fully amortizing basis. 
Accordingly, while our multi-family lending niche has not been immune to downturns in the credit cycle, the limited number of losses we have recorded, even in adverse credit cycles, suggests that the multi-family loans we produce involve less credit risk than certain other types of loans. In general, buildings that are subject to rent regulation have tended to be stable, with occupancy levels remaining more or less constant over time. Because the rents are typically below market and the buildings securing our loans are generally maintained in good condition, they have been more likely to retain their tenants in adverse economic times. In addition, we exclude any short-term property tax exemptions and abatement benefits the property owners receive when we underwrite our multi-family loans.
Commercial Real Estate Loans
At December 31, 2019, CRE loans represented $7.1 billion, or 16.9%, of total loans held for investment, reflecting a year-over-year increase of $83.1 million or 1.2% compared to December 31, 2018. The average CRE loan had a principal balance of $6.6 million at the end of this December, as compared to $6.1 million at the prior
year-end.
In addition, the portfolio had an expected weighted average life of 2.3 years and 2.7 years at the corresponding dates.
CRE loans represented $1.2 billion, or 11.6%, of the loans we originated in 2019, as compared to $966.7 million, or 9.6%, in the prior year.
The CRE loans we produce are secured by income-producing properties such as office buildings, retail centers,
mixed-use
buildings, and multi-tenanted light industrial properties. At December 31, 2019, 85.7% of our CRE loans were secured by properties in the metro New York City area, while properties in other parts of New York State accounted for 2.3% of the properties securing our CRE credits, while all other states accounted for 12.0%, combined.
The terms of our CRE loans are similar to the terms of our multi-family credits. While a small percentage of our CRE loans feature
ten-year
fixed-rate terms, they primarily feature a fixed rate of interest for the first five or seven years of the loan that is generally based on intermediate-term interest rates plus a spread. During years six through ten or eight through twelve, the loan resets to an annually adjustable rate that is tied to the prime rate of interest, plus a spread
.
Alternately, the borrower may opt for a fixed rate that is tied to the five-year fixed advance rate of the
FHLB-NY
plus a spread. The fixed-rate option also requires the payment of an amount equal to one percentage point of the then-outstanding loan balance. In either case, the minimum rate at repricing is equivalent to the rate in the initial five- or seven-year term.
Prepayment penalties apply to our CRE loans, as they do our multi-family credits. Depending on the remaining term of the loan at the time of prepayment, the penalties normally range from five percentage points to one percentage point of the then-current loan balance. If a loan extends past the fifth or seventh year and the borrower selects the fixed rate option, the prepayment penalties typically reset to a range of five points to one point over years six through ten or eight through twelve. Our CRE loans tend to refinance within two to three years of origination, as reflected in the expected weighted average life of the CRE portfolio noted above.
The repayment of loans secured by commercial real estate is often dependent on the successful operation and management of the underlying properties. To minimize our credit risk, we originate CRE loans in adherence with conservative underwriting standards, and require that such loans qualify on the basis of the property’s current income stream and DSCR. The approval of a loan also depends on the borrower’s credit history, profitability, and expertise in property management, and generally requires a minimum DSCR of 130% and a maximum LTV of 65%. In addition, the origination of CRE loans typically requires a security interest in the fixtures, equipment, and other personal property of the borrower and/or an assignment of the rents and/or leases. In addition, our CRE loans may contain an interest-only period which typically does not exceed three years; however, these loans are underwritten on a fully amortizing basis.
44

Table of Contents
C&I Loans
Our C&I loans are divided into two categories: Specialty Finance Loans and Leases and other C&I loans, as further described below.
Specialty Finance Loans and Leases
At December 31, 2019 and 2018, specialty finance loans and leases represented $2.6 billion and $1.9 billion, respectively, of total loans held for investment. 
We produce our specialty finance loans and leases through a subsidiary that is staffed by a group of industry veterans with expertise in originating and underwriting senior securitized debt and equipment loans and leases. The subsidiary participates in syndicated loans that are brought to them, and equipment loans and leases that are assigned to them, by a select group of nationally recognized sources, and are generally made to large corporate obligors, many of which are publicly traded, carry investment grade or near-investment grade ratings, and participate in stable industries nationwide.
The specialty finance loans and leases we fund fall into three categories: asset-based lending, dealer floor-plan lending, and equipment loan and lease financing. Each of these credits is secured with a perfected first security interest in, or outright ownership of, the underlying collateral, and structured as senior debt or as a
non-cancelable
lease. Asset-based and dealer floor-plan loans are priced at floating rates predominately tied to LIBOR, while our equipment financing credits are priced at fixed rates at a spread over Treasuries.
Since launching our specialty finance business in the third quarter of 2013, no losses have been recorded on any of the loans or leases in this portfolio.
Other C&I Loans
In the twelve months ended December 31, 2019, other C&I loans declined $49.8 million to $420.1 million, and represented $391.7 million of the
held-for-investment
loans we produced. Included in the balance at
year-end
2019 were taxi medallion-related loans of $55.0 million.
In contrast to the loans produced by our specialty finance subsidiary, the other C&I loans we produce are primarily made to small and
mid-size
businesses in the five boroughs of New York City and on Long Island. Such loans are tailored to meet the specific needs of our borrowers, and include term loans, demand loans, revolving lines of credit, and, to a much lesser extent, loans that are partly guaranteed by the Small Business Administration.
A broad range of other C&I loans, both collateralized and unsecured, are made available to businesses for working capital (including inventory and accounts receivable), business expansion, the purchase of machinery and equipment, and other general corporate needs. In determining the term and structure of other C&I loans, several factors are considered, including the purpose, the collateral, and the anticipated sources of repayment. Other C&I loans are typically secured by business assets and personal guarantees of the borrower, and include financial covenants to monitor the borrower’s financial stability.
The interest rates on our other C&I loans can be fixed or floating, with floating-rate loans being tied to prime or some other market index, plus an applicable spread. Our floating-rate loans may or may not feature a floor rate of interest. The decision to require a floor on other C&I loans depends on the level of competition we face for such loans from other institutions, the direction of market interest rates, and the profitability of our relationship with the borrower.
Acquisition, Development, and Construction Loans
At December 31, 2019, ADC loans represented $200.6 million, or 0.5%, of total loans held for investment, as compared to $407.9 million, or 1.0%, at the prior
year-end.
Originations of ADC loans totaled $91.4 million in 2019, up $34.7 million from the year-earlier amount.
At December 31, 2019, 4.2% of the loans in our ADC portfolio were for land acquisition and development; the remaining 95.8% consisted of loans that were provided for the construction of commercial properties and owner-occupied homes. Loan terms vary based upon the scope of the construction, and generally range from 18 months to two years. They also feature a floating rate of interest tied to prime, with a floor. At December 31, 2019, 70.5% of our ADC loans were for properties in New York City.
45

Table of Contents
Because ADC loans are generally considered to have a higher degree of credit risk, especially during a downturn in the credit cycle, borrowers are required to provide a guarantee of repayment and completion. In the twelve months ended December 31, 2019 and 2018, we did not recover any losses against guarantees. The risk of loss on an ADC loan is largely dependent upon the accuracy of the initial appraisal of the property’s value upon completion of construction; the developer’s experience; the estimated cost of construction, including interest; and the estimated time to complete and/or sell or lease such property. 
When applicable, as a condition to closing an ADC loan, it is our practice to require that properties meet
pre-sale
or
pre-lease
requirements prior to funding.
One-to-Four
Family Loans
At December 31, 2019,
one-to-four
family loans represented $380.4 million, or 0.9%, of total loans held for investment, as compared to $446.1 million, or 1.1%, at the prior
year-end.
These loan balances include certain mixed-use CRE loans with less than five residential units being classified as
one-to-four
family loans. Other than these types of loans, we do not currently expect to originate traditional
one-to-four
family loans.
Other Loans
At December 31, 2019, other loans totaled $8.1 million and consisted primarily of consumer loans, most of which were overdraft loans and loans to
non-profit
organizations. We currently do not offer home equity loans or lines of credit.
Lending Authority
The loans we originate for investment are subject to federal and state laws and regulations, and are underwritten in accordance with loan underwriting policies approved by the Management Credit Committee, the Commercial Credit Committee and the Mortgage and Real Estate and Credit Committees of the Board, and the Board of Directors of the Bank.
All multifamily, CRE, ADC, and Specialty Finance loans regardless of amount and C&I loans in excess of $3.0 million are required to be presented to the Management Credit Committee for approval. Multifamily, CRE and C&I loans in excess of $5.0 million and Specialty Finance in excess of $15.0 million are also required to be presented to the Commercial Credit Committee and the Mortgage and Real Estate Committee of the Board, as applicable. All C&I loans less than or equal to $3.0 million are approved by the joint authority of lending officers.
All mortgage loans in excess of $50.0 million, Specialty Finance loans in excess of $15.0 million and all other C&I loans in excess of $5.0 million require approval by the Mortgage and Real Estate Committee or the Credit Committee of the Board, as applicable. In addition, all loans of $20.0 million or more originated by the Bank continue to be reported to the Board of Directors.
The various Committee have authority to direct changes in lending practices as they deem necessary or appropriate in order to address individual or aggregate risks and credit exposures in accordance with the Bank’s strategic objectives and risk appetites.
In 2019, 146 loans greater than $10.0 million were originated by the Bank, with an aggregate loan balance of $4.1 billion at origination. In 2018, by comparison, 192 loans greater than $10.0 million were originated, with an aggregate loan balance at origination of $4.5 billion.
At December 31, 2019 and 2018, the largest mortgage loan in our portfolio was a $246.0 million multi-family loan originated by the Bank on February 8, 2018, which is collateralized by six properties located in Brooklyn, New York. As of the date of this report, the loan has been current since origination.
46

Table of Contents
Geographical Analysis of the Portfolio of Loans Held for Investment
The following table presents a geographical analysis of the multi-family and CRE loans in our
held-for-investment
loan portfolio at December 31, 2019:
                                 
 
At December 31, 2019
 
 
Multi-Family Loans
   
Commercial Real Estate Loans
 
(dollars in thousands)
 
Amount
   
Percent
of Total
   
Amount
   
Percent
of Total
 
New York City:


Manhattan
  $
7,788,722
     
25.00
%   $
3,360,067
     
47.45
%
Brooklyn
   
5,486,486
     
17.61
     
537,304
     
7.59
 
Bronx
   
3,929,333
     
12.61
     
163,468
     
2.31
 
Queens
   
2,583,430
     
8.29
     
618,644
     
8.73
 
Staten Island
   
119,270
     
0.38
     
53,767
     
0.76
 
                                 
Total New York City
  $
19,907,241
     
63.89
%   $
4,733,250
     
66.84
%
                                 
New Jersey
   
3,752,028
     
12.04
     
532,029
     
7.51
 
Long Island
   
602,884
     
1.93
     
806,580
     
11.39
 
                                 
Total Metro New York
  $
24,262,153
     
77.86
%   $
6,071,859
     
85.74
%
                                 
Other New York State
   
942,881
     
3.03
     
157,841
     
2.23
 
All other states
   
5,953,638
     
19.11
     
852,210
     
12.03
 
                                 
Total
  $
31,158,672
     
100.00
%   $
7,081,910
     
100.00
%


At December 31, 2019, the largest concentration of ADC loans held for investment was in New York City, with a total of $141.5 million at that date. The majority of our other loans held for investment were secured by properties and/or businesses located in Metro New York.
Loan Maturity and Repricing Analysis: Loans Held for Investment
The following table sets forth the maturity or period to repricing of our portfolio of loans held for investment at December 31, 2019. Loans that have adjustable rates are shown as being due in the period during which their interest rates are next subject to change.
                                                 
(in thousands)
 
Multi-
Family
   
Commercial
Real Estate
   
One-to-Four

Family
   
Acquisition,
Development,
and
Construction
   
Other
   
Total
Loans
 
Amount due:


Within one year
  $
10,989,614
    $
2,264,268
    $
109,605
    $
142,281
    $
1,856,687
    $
15,362,455
 
After one year:


One to five years
   
19,324,070
     
4,212,409
     
248,216
     
57,030
     
842,900
     
24,684,625
 
Over five years
   
844,988
     
605,233
     
22,540
     
1,285
     
322,893
     
1,796,939
 
                                                 
Total due or repricing after one year
   
20,169,058
     
4,817,642
     
270,756
     
58,315
     
1,165,793
     
26,481,564
 
                                                 
Total amounts due or repricing, gross
  $
31,158,672
    $
7,081,910
    $
380,361
    $
200,596
    $
3,022,480
    $
41,844,019


47

Table of Contents
The following table sets forth, as of December 31, 2019, the dollar amount of all loans held for investment that are due after December 31, 2020, and indicates whether such loans have fixed or adjustable rates of interest:
                         
 
Due after December 31, 2020
 
(in thousands)
 
Fixed
   
Adjustable
   
Total
 
Mortgage Loans:


Multi-family
  $
2,585,674
    $
17,583,384
    $
20,169,058
 
Commercial real estate
   
904,271
     
3,913,371
     
4,817,642
 
One-to-four
family
   
64,793
     
205,963
     
270,756
 
Acquisition, development, and construction
   
40,930
     
17,385
     
58,315
 
                         
Total mortgage loans
   
3,595,668
     
21,720,103
     
25,315,771
 
Other loans
   
1,014,240
     
151,553
     
1,165,793
 
                         
Total loans
  $
4,609,908
    $
21,871,656
    $
26,481,564


Loans Held for Sale
At December 31, 2019 and 2018, we did not have any loans held for sale.
Loan Origination Analysis
The following table summarizes our production of loans held for investment in the years ended December 31, 2019 and 2018:
                                 
 
For the Years Ended December 31,
 
 
2019
   
2018
 
(dollars in thousands)
 
Amount
   
Percent
of Total
   
Amount
   
Percent
of Total
 
Mortgage Loan Originated for Investment:


Multi-family
  $
5,981,700
     
56.44
%   $
6,621,808
     
65.84
%
Commercial real estate
   
1,226,272
     
11.57
     
966,731
     
9.61
 
One-to-four
family residential
   
102,829
     
0.97
     
12,624
     
0.13
 
Acquisition, development, and construction
   
91,400
     
0.86
     
56,651
     
0.56
 
                                 
Total mortgage loans originated for investment
   
7,402,201
     
69.84
     
7,657,814
     
76.14
 
                                 
Other Loans Originated for Investment:


Specialty finance
   
2,799,962
     
26.42
     
1,917,048
     
19.06
 
Other commercial and industrial
   
391,702
     
3.70
     
478,619
     
4.76
 
Other
   
4,200
     
0.04
     
4,116
     
0.04
 
                                 
Total other loans originated for investment
   
3,195,864
     
30.16
     
2,399,783
     
23.86
 
                                 
Total loans originated for investment
  $
10,598,065
     
100.00
%   $
10,057,597
     
100.00
%


48

Table of Contents
Loan Portfolio Analysis
The following table summarizes the composition of our loan portfolio at each
year-end
for the five years ended December 31, 2019:
                                                                                                 
 
At December 31,
 
 
2019
   
2018
   
2017
   
2016
   
2015
 
(dollars in thousands)
 
Amount
   
Percent
of Total
Loans
   
Amount
   
Percent
of Total
Loans
   
Amount
   
Percent
of Total
Loans
   
Amount
   
Percent
of Total
Loans
   
Percent of
Non-Covered

Loans
   
Amount
   
Percent
of Total
Loans
   
Percent of
Non-Covered

Loans
 
Non-Covered
Mortgage Loans:


Multi-family
  $
31,158,672
     
74.46
%   $
29,883,919
     
74.46
%   $
28,074,709
     
73.12
%   $
26,945,052
     
68.28
%    
71.35
%   $
25,971,620
     
68.04
%    
71.93
%
Commercial real estate
   
7,081,910
     
16.93
     
6,998,834
     
17.44
     
7,322,226
     
19.07
     
7,724,362
     
19.57
     
20.45
     
7,857,204
     
20.58
     
21.76
 
One-to-four
family
   
380,361
     
0.91
     
446,094
     
1.11
     
477,228
     
1.24
     
381,081
     
0.97
     
1.01
     
116,841
     
0.31
     
0.32
 
Acquisition, development, and construction
   
200,596
     
0.48
     
407,870
     
1.02
     
435,825
     
1.14
     
381,194
     
0.97
     
1.01
     
311,676
     
0.82
     
0.86
 
                                                                                                 
Total
non-covered
mortgage loans
   
38,821,539
     
92.78
     
37,736,717
     
94.03
     
36,309,988
     
94.57
     
35,431,689
     
89.79
     
93.82
     
34,257,350
     
89.75
     
94.87
 
                                                                                                 
Non-Covered
Other Loans:


Specialty finance
   
2,594,326
     
6.20
     
1,918,545
     
4.78
     
1,539,733
     
4.01
     
1,267,530
     
3.21
     
3.36
     
880,673
     
2.31
     
2.44
 
Other commercial and industrial
   
420,052
     
1.00
     
469,875
     
1.17
     
500,841
     
1.31
     
632,915
     
1.60
     
1.68
     
569,883
     
1.49
     
1.58
 
Other loans
   
8,102
     
0.02
     
8,724
     
0.02
     
8,460
     
0.02
     
24,067
     
0.06
     
0.06
     
32,583
     
0.09
     
0.09
 
                                                                                                 
Total
non-covered
other loans
   
3,022,480
     
7.22
     
2,397,144
     
5.97
     
2,049,034
     
5.34
     
1,924,512
     
4.87
     
5.10
     
1,483,139
     
3.89
     
4.11
 
                                                                                                 
Total
non-covered
loans held for investment
  $
41,844,019
     
100.00
    $
40,133,861
     
100.00
    $
38,359,022
     
99.91
    $
37,356,201
     
94.66
     
98.92
    $
35,740,489
     
93.64
     
98.98
 
                                                                                                 
Loans held for sale
   
—  
     
—  
     
—  
     
—  
     
35,258
     
0.09
     
409,152
     
1.04
     
1.08
     
367,221
     
0.96
     
1.02
 
                                                                                                 
Total
non-covered
loans
  $
41,844,019
     
100.00
%   $
40,133,861
     
100.00
%   $
38,394,280
     
100.00
    $
37,765,353
     
95.70
     
100.00
%   $
36,107,710
     
94.60
     
100.00
%
                                                                                                 
Covered loans
   
—  
     
     
—  
     
     
—  
     
—  
     
1,698,133
     
4.30
     
     
2,060,089
     
5.40


Total loans
  $
41,844,019
     
    $
40,133,861
     
    $
38,394,280
     
100.00
%   $
39,463,486
     
100.00
%    
    $
38,167,799
     
100.00
%    
 
                                                                                                 
Net deferred loan origination costs
   
50,136
     
     
32,047
     
     
28,949
     
     
26,521


22,715


Allowance for losses on
non-covered
loans
   
(147,638
)    
     
(159,820
)    
     
(158,046
)    
     
(158,290
)    
     
     
(147,124
)    
     
 
Allowance for losses on covered loans
   
—  
     
     
—  
     
     
—  
     
     
(23,701
)    
     
     
(31,395
)    


Total loans and leases, net
  $
41,746,517
     
    $
40,006,088
     
    $
38,265,183
     
    $
39,308,016
     
     
    $
38,011,995


49

Table of Contents
Outstanding Loan Commitments
At December 31, 2019 and 2018, we had outstanding loan commitments of $2.0 billion and $2.0 billion, respectively. We also had commitments to issue letters of credit totaling $509.9 million and $508.1 million at December 31, 2019 and 2018, respectively. The fees we collect in connection with the issuance of letters of credit are included in “Fee income” in the Consolidated Statements of Income and Comprehensive Income.
The letters of credit we issue consist of performance
stand-by,
financial
stand-by,
and commercial letters of credit. Financial
stand-by
letters of credit primarily are issued for the benefit of other financial institutions, municipalities, or landlords on behalf of certain of our current borrowers, and obligate us to guarantee payment of a specified financial obligation. Performance
stand-by
letters of credit are primarily issued for the benefit of local municipalities on behalf of certain of our borrowers. Performance letters of credit obligate us to make payments in the event that a specified third party fails to perform under
non-financial
contractual obligations. Commercial letters of credit act as a means of ensuring payment to a seller upon shipment of goods to a buyer. Although commercial letters of credit are used to effect payment for domestic transactions, the majority are used to settle payments in international trade. Typically, such letters of credit require the presentation of documents that describe the commercial transaction, and provide evidence of shipment and the transfer of title.
For more information about our outstanding loan commitments and commitments to issue letters of credit at the end of this December, see the discussion of “Liquidity” later in this discussion and analysis of our financial condition and results of operations.
Asset Quality
Loans Held for Investment and Repossessed Assets
Total NPAs were $73.5 million or 0.14% of total assets at December 31, 2019, up 30.6% or $17.2 million compared to $56.3 million or 0.11% of total assets at December 31, 2018. Total
non-accrual
mortgage loans rose $13.1 million to $22.0 million, largely due to one CRE credit that went
non-performing
during the fourth quarter of 2019. Other
non-accrual
loans, consisting mainly of taxi medallion-related loans, rose $2.7 million to $39.3 million compared to $36.6 million at December 31, 2018. Included in these amounts were
non-accrual
taxi medallion-related loans of $30.4 million and $35.5 million, respectively.
Repossessed assets totaled $12.3 million, up $1.5 million or 13.7% compared to the balance at December 31, 2018. As is the case with other
non-accrual
loans, the majority of the Company’s repossessed assets consist of taxi medallions. Taxi medallions represented $10.3 million of total repossessed assets at December 31, 2019 compared to $8.2 million at December 31, 2018.
The following table presents our
non-performing
loans by loan type and the changes in the respective balances from December 31, 2018 to December 31, 2019:


Change from
December 31, 2018
to
December 31, 2019
 
(dollars in thousands)
 
December 31,
2019
   
December 31,
2018
   
Amount
   
Percent
 
Non-Performing
Loans:


Non-accrual
mortgage loans:


Multi-family
  $
5,407
    $
4,220
    $
1,187
     
28.13
%
Commercial real estate
   
14,830
     
3,021
     
11,809
     
390.90
 
One-to-four
family
   
1,730
     
1,651
     
79
     
4.78
 
Acquisition, development, and construction
   
—  
     
—  
     
—  
     
—  
 
                                 
Total
non-accrual
mortgage loans
   
21,967
     
8,892
     
13,075
     
147.04
 
Non-accrual
other loans
(1)
   
39,276
     
36,614
     
2,662
     
7.27
 
                                 
Total
non-performing
loans
  $
61,243
    $
45,506
    $
15,737
     
34.58


(1)
Includes $30.4 million and $35.5 million of
non-accrual
taxi medallion-related loans at December 31, 2019 and 2018, respectively.
 
 
50

Table of Contents
At the end of this December, taxi medallion-related loans totaled $55.0 million, representing 0.13% of our total
held-for-investment
loan portfolio. Last December, taxi medallion-related loans totaled $73.7 million, representing 0.18% of our total
held-for-investment
loan portfolio
The following table sets forth the changes in
non-performing
loans over the twelve months ended December 31, 2019:
         
(in thousands)
 
 
Balance at December 31, 2018
  $
45,506
 
New
non-accrual
   
46,650
 
Charge-offs
   
(10,120
)
Transferred to repossessed assets
   
(4,964
)
Loan payoffs, including dispositions and principal
pay-downs
   
(15,829
)
Restored to performing status
   
—  
 
         
Balance at December 31, 2019
  $
61,243


A loan generally is classified as a
“non-accrual”
loan when it is 90 days or more past due or when it is deemed to be impaired because we no longer expect to collect all amounts due according to the contractual terms of the loan agreement. When a loan is placed on
non-accrual
status, we cease the accrual of interest owed, and previously accrued interest is reversed and charged against interest income. At December 31, 2019 and 2018, all of our
non-performing
loans were
non-accrual
loans. A loan is generally returned to accrual status when the loan is current and we have reasonable assurance that the loan will be fully collectible.
We monitor
non-accrual
loans both within and beyond our primary lending area in the same manner. Monitoring loans generally involves inspecting and
re-appraising
the collateral properties; holding discussions with the principals and managing agents of the borrowing entities and/or retained legal counsel, as applicable; requesting financial, operating, and rent roll information; confirming that hazard insurance is in place or force-placing such insurance; monitoring tax payment status and advancing funds as needed; and appointing a receiver, whenever possible, to collect rents, manage the operations, provide information, and maintain the collateral properties.
It is our policy to order updated appraisals for all
non-performing
loans, irrespective of loan type, that are collateralized by multi-family buildings, CRE properties, or land, in the event that such a loan is 90 days or more past due, and if the most recent appraisal on file for the property is more than one year old. Appraisals are ordered annually until such time as the loan becomes performing and is returned to accrual status. It is not our policy to obtain updated appraisals for performing loans. However, appraisals may be ordered for performing loans when a borrower requests an increase in the loan amount, a modification in loan terms, or an extension of a maturing loan. We do not analyze current LTVs on a portfolio-wide basis.
Non-performing
loans are reviewed regularly by management and discussed on a monthly basis with the Mortgage Committee, the Credit Committee, and the Board of Directors of the Bank, as applicable. In accordance with our
charge-off
policy, collateral-dependent
non-performing
loans are written down to their current appraised values, less certain transaction costs. Workout specialists from our Loan Workout Unit actively pursue borrowers who are delinquent in repaying their loans in an effort to collect payment. In addition, outside counsel with experience in foreclosure proceedings are retained to institute such action with regard to such borrowers.
Properties and other assets that are acquired through foreclosure are classified as repossessed assets, and are recorded at fair value at the date of acquisition, less the estimated cost of selling the property. Subsequent declines in the fair value of the assets are charged to earnings and are included in
non-interest
expense. It is our policy to require an appraisal and an environmental assessment of properties classified as OREO before foreclosure, and to
re-appraise
the properties on an
as-needed
basis, and not less than annually, until they are sold. We dispose of such properties as quickly and prudently as possible, given current market conditions and the property’s condition. 
To mitigate the potential for credit losses, we underwrite our loans in accordance with credit standards that we consider to be prudent. In the case of multi-family and CRE loans, we look first at the consistency of the cash flows being generated by the property to determine its economic value using the “income approach,” and then at the market value of the property that collateralizes the loan. The amount of the loan is then based on the lower of the two values, with the economic value more typically used.
51

Table of Contents
The condition of the collateral property is another critical factor. Multi-family buildings and CRE properties are inspected from rooftop to basement as a prerequisite to approval, with a member of the Mortgage or Credit Committee participating in inspections on multi-family loans to be originated in excess of $7.5 million, and a member of the Mortgage or Credit Committee participating in inspections on CRE loans to be originated in excess of $4.0 million. Furthermore, independent appraisers, whose appraisals are carefully reviewed by our experienced
in-house
appraisal officers and staff, perform appraisals on collateral properties. In many cases, a second independent appraisal review is performed.
In addition, we work with a select group of mortgage brokers who are familiar with our credit standards and whose track record with our lending officers is typically greater than ten years. Furthermore, in New York City, where the majority of the buildings securing our multi-family loans are located, the rents that tenants may be charged on certain apartments are typically restricted under certain rent-control or rent-stabilization laws. As a result, the rents that tenants pay for such apartments are generally lower than current market rents. Buildings with a preponderance of such rent-regulated apartments are less likely to experience vacancies in times of economic adversity.
Reflecting the strength of the underlying collateral for these loans and the collateral structure, a relatively small percentage of our
non-performing
multi-family loans have resulted in losses over time.
To further manage our credit risk, our lending policies limit the amount of credit granted to any one borrower, and typically require minimum DSCRs of 120% for multi-family loans and 130% for CRE loans. Although we typically lend up to 75% of the appraised value on multi-family buildings and up to 65% on commercial properties, the average LTVs of such credits at origination were below those amounts at December 31, 2019. Exceptions to these LTV limitations are minimal and are reviewed on a
case-by-case
basis.
The repayment of loans secured by commercial real estate is often dependent on the successful operation and management of the underlying properties. To minimize our credit risk, we originate CRE loans in adherence with conservative underwriting standards, and require that such loans qualify on the basis of the property’s current income stream and DSCR. The approval of a CRE loan also depends on the borrower’s credit history, profitability, and expertise in property management. Given that our CRE loans are underwritten in accordance with underwriting standards that are similar to those applicable to our multi-family credits, the percentage of our
non-performing
CRE loans that have resulted in losses has been comparatively small over time.
Multi-family and CRE loans are generally originated at conservative LTVs and DSCRs, as previously stated. Low LTVs provide a greater likelihood of full recovery and reduce the possibility of incurring a severe loss on a credit; in many cases, they reduce the likelihood of the borrower “walking away” from the property. Although borrowers may default on loan payments, they have a greater incentive to protect their equity in the collateral property and to return their loans to performing status. Furthermore, in the case of multi-family loans, the cash flows generated by the properties are generally below-market and have significant value.
With regard to ADC loans, we typically lend up to 75% of the estimated
as-completed
market value of multi-family and residential tract projects; however, in the case of home construction loans to individuals, the limit is 80%. With respect to commercial construction loans, we typically lend up to 65% of the estimated
as-completed
market value of the property. Credit risk is also managed through the loan disbursement process. Loan proceeds are disbursed periodically in increments as construction progresses, and as warranted by inspection reports provided to us by our own lending officers and/or consulting engineers. 
To minimize the risk involved in specialty finance lending and leasing, each of our credits is secured with a perfected first security interest or outright ownership in the underlying collateral, and structured as senior debt or as a
non-cancellable
lease. To further minimize the risk involved in specialty finance lending and leasing, we
re-underwrite
each transaction. In addition, we retain outside counsel to conduct a further review of the underlying documentation.
Other C&I loans are typically underwritten on the basis of the cash flows produced by the borrower’s business, and are generally collateralized by various business assets, including, but not limited to, inventory, equipment, and accounts receivable. As a result, the capacity of the borrower to repay is substantially dependent on the degree to which the business is successful. Furthermore, the collateral underlying the loan may depreciate over time, may not be conducive to appraisal, and may fluctuate in value, based upon the operating results of the business. Accordingly, personal guarantees are also a normal requirement for other C&I loans.
52

Table of Contents
In addition, at December 31, 2019,
one-to-four
family loans, ADC loans, and other loans represented 0.9%, 0.5%, and 7.2%, of total loans held for investment, as compared to 1.1%, 1.0%, and 6.0%, respectively, at December 31, 2018. Furthermore, while 1.3% of our other loans were
non-performing
at December 31, 2019, 0.45% of our
one-to-four
family loans were
non-performing
at that date. There were no
non-performing
ADC loans at December 31, 2019.
The procedures we follow with respect to delinquent loans are generally consistent across all categories, with late charges assessed, and notices mailed to the borrower, at specified dates. We attempt to reach the borrower by telephone to ascertain the reasons for delinquency and the prospects for repayment. When contact is made with a borrower at any time prior to foreclosure or recovery against collateral property, we attempt to obtain full payment, and will consider a repayment schedule to avoid taking such action. Delinquencies are addressed by our Loan Workout Unit and every effort is made to collect rather than initiate foreclosure proceedings.
The following table presents our
non-covered
loans 30 to 89 days past due by loan type and the changes in the respective balances from December 31, 2018 to December 31, 2019:


Change from
December 31, 2018
to
December 31, 2019
 
(dollars in thousands)
 
December 31,
2019
   
December 31,
2018
   
Amount
   
Percent
 
Loans
30-89
Days Past Due:


Multi-family
   
$1,131
     
$—  
     
$1,131
     
NM
%
Commercial real estate
   
2,545
     
—  
     
2,545
     
NM
 
One-to-four
family
   
—  
     
9
     
(9
)    
NM
 
Acquisition, development, and construction
   
—  
     
—  
     
—  
     
—  
 
Other loans
(1)
   
44
     
555
     
(511
)    
(92.07
)
                                 
Total loans
30-89
days past due
   
$3,720
     
$564
     
$3,156
     
559.57


(1)
Includes $0 and $530,000 of
non-accrual
taxi medallion-related loans at December 31, 2019 and 2018, respectively.
 
Fair values for all multi-family buildings, CRE properties, and land are determined based on the appraised value. If an appraisal is more than one year old and the loan is classified as either
non-performing
or as an accruing TDR, then an updated appraisal is required to determine fair value. Estimated disposition costs are deducted from the fair value of the property to determine estimated net realizable value. In the instance of an outdated appraisal on an impaired loan, we adjust the original appraisal by using a third-party index value to determine the extent of impairment until an updated appraisal is received. 
While we strive to originate loans that will perform fully, adverse economic and market conditions, among other factors, can negatively impact a borrower’s ability to repay. Historically, our level of charge-offs has been relatively low in downward credit cycles, even when the volume of
non-performing
loans has increased. In 2019, we recorded net charge-offs of $19.3 million, as compared to net charge-offs of $16.5 million in the prior year. Taxi medallion-related net charge-offs accounted for $10.2 million of this year’s amount and $12.8 million of last year’s amount.
Partially reflecting the net charge-offs noted above, and the provision of $7.1 million for the allowance for loan losses, the allowance for losses on loans decreased $12.2 million, equaling $147.6 million at the end of this December from $159.8 million at December 31, 2018. Reflecting the decrease in
non-performing
loans cited earlier in this discussion, the allowance for losses on loans represented 241.07% of
non-performing
loans at December 31, 2019, as compared to 351.21% at the prior
year-end.
53

Table of Contents
Based upon all relevant and available information at the end of this December, management believes that the allowance for losses on loans was appropriate at that date.
The following table presents information about our five largest
non-performing
loans at December 31, 2019.
                                         
 
Loan No. 1
 
 
Loan No. 2
(2)
 
 
Loan No. 3
(2)
 
 
Loan No. 4
(2)
 
 
Loan No. 5
 
Type of Loan
   
CRE
     
C&I
     
Multi-Family
     
C&I
     
C&I
 
Origination date
   
06/20/14
     
10/31/17
     
1/05/06
     
4/29/14
     
06/01/16
 
Origination balance
   
$9,750,000
     
$13,000,000
     
$12,640,000
     
$13,325,000
     
$4,080,000
 
Full commitment balance
(1)
   
$9,750,000
     
$13,000,000
     
$12,640,000
     
$13,325,000
     
$4,080,000
 
Balance at December 31, 2019
   
$9,750,000
     
$  6,961,564
     
$  3,576,758
     
$  2,593,755
     
$2,145,995
 
Associated allowance
   
None
     
None
     
None
     
None
     
None
 
Non-accrual
date
   
October 2019
     
February 2019
     
March 2014
     
June 2017
     
August 2019
 
Origination LTV
   
65
%    
N/A
     
79
%    
N/A
     
21
%
Current LTV
   
66
%    
N/A
     
28
%    
N/A
     
12
%
Last appraisal
   
October 2019
     
N/A
     
February 2019
     
N/A
     
October 2019
 
 
(1)
There are no funds available for further advances on the five largest
non-performing
loans.
 
(2)
Loan is a Troubled Debt Restructure.
 
The following is a description of the five loans identified in the preceding table. It should be noted that allocations for the loan loss allowance was not required for any loan listed, as determined by using the present value of expected cash flows method in ASC
310-10-35.


No. 1 -
 
The borrower is an owner of real estate and is based in New York. The loan is collateralized by a 8,566 square foot, retail condo unit located in New York, New York.
         
 
No. 2 -
 
The borrower is an owner of an apparel company based in New York. The loan is collateralized by all of the borrower’s assets, including but not limited to: cash, accounts receivable, and inventory.
         
 
No. 3 -
 
The borrower is an owner of real estate and is based in New Jersey. The loan is collateralized by a multi-family complex with 267 residential units and four retail stores in Atlantic City, New Jersey.
         
 
No. 4 -
 
The borrower is a finance company based in New York. The loan is collateralized by various taxi medallion loans in New York, New York and Chicago, Illinois.
         
 
No. 5 -
 
The borrower is an owner/operator of a quarry company based in New York. The loan is collateralized by 139.7 acres of land used for mining granite in White Hall, New York.
 
Troubled Debt Restructurings
In an effort to proactively manage delinquent loans, we have selectively extended such concessions as rate reductions and extensions of maturity dates, as well as forbearance agreements, to certain borrowers who have experienced financial difficulty. In accordance with GAAP, we are required to account for such loan modifications or restructurings as TDRs.
The eligibility of a borrower for
work-out
concessions of any nature depends upon the facts and circumstances of each transaction, which may change from period to period, and involve management’s judgment regarding the likelihood that the concession will result in the maximum recovery for the Company.
Loans modified as TDRs are placed on
non-accrual
status until we determine that future collection of principal and interest is reasonably assured. This generally requires that the borrower demonstrate performance according to the restructured terms for at least six consecutive months.
At December 31, 2019, loans modified as TDRs totaled $40.5 million, including accruing loans of $1.3 million and
non-accrual
loans of $39.2 million. At the prior
year-end,
loans modified as TDRs totaled $34.9 million, including accruing loans of $9.2 million and
non-accrual
loans of $25.7 million.
54

Table of Contents
Analysis of Troubled Debt Restructurings
The following table sets forth the changes in our TDRs over the twelve months ended December 31, 2019:
                         
(in thousands)
 
Accruing
   
Non-Accrual
   
Total
 
Balance at December 31, 2018
  $
9,162
    $
  25,719
    $
34,881
 
New TDRs
   
865
     
28,827
     
29,692
 
Charge-offs
   
—  
     
(8,367
)    
(8,367
)
Transferred to repossessed assets
   
—  
     
(368
)    
(368
)
Loan payoffs, including dispositions and principal
pay-downs
   
(8,773
)    
(6,566
)    
(15,339
)
                         
Balance at December 31, 2019
  $
1,254
    $
39,245
    $
40,499


Loans on which concessions were made with respect to rate reductions and/or extensions of maturity dates totaled $32.7 million and $34.8 million, respectively, at December 31, 2019 and 2018; loans in connection with which forbearance agreements were reached amounted to $7.8 million and $37,000 at the respective dates.
Multi-family and CRE loans accounted for $3.6 million and zero dollars of TDRs at the end of this December, as compared to $4.2 million and zero, respectively, at the prior
year-end.
Based on the number of loans performing in accordance with their revised terms, our success rate for restructured multi-family loans was 100%; for ADC loans it was 100%; and for
one-to-four
loans it was 33% at the end of this December; our success rate for other loans was 88%, at that date.
On a limited basis, we may provide additional credit to a borrower after the loan has been placed on
non-accrual
status or modified as a TDR if, in management’s judgment, the value of the property after the additional loan funding is greater than the initial value of the property plus the additional loan funding amount. In 2019, no such additional credit was provided. Furthermore, the terms of our restructured loans typically would not restrict us from cancelling outstanding commitments for other credit facilities to a borrower in the event of
non-payment
of a restructured loan.
For additional information about our TDRs at December 31, 2019 and 2018, see the discussion of “Asset Quality” in Note 5, “Loans and Leases” in Item 8, “Financial Statements and Supplementary Data.”
Except for the
non-accrual
loans and TDRs disclosed in this filing, we did not have any potential problem loans at December 31, 2019 that would have caused management to have serious doubts as to the ability of a borrower to comply with present loan repayment terms and that would have resulted in such disclosure if that were the case.
55

Table of Contents
Asset Quality Analysis (Excluding Covered Loans, Covered OREO,
Non-Covered
Purchased Credit-Impaired Loans, and
Non-Covered
Loans Held for Sale)
The following table presents information regarding our consolidated allowance for losses on
non-covered
loans, our
non-performing
non-covered
assets, and our
non-covered
loans 30 to 89 days past due at each
year-end
in the five years ended December 31, 2019. Covered loans and
non-covered
purchased credit-impaired (“PCI”) loans are considered to be performing due to the application of the yield accretion method. Therefore, covered loans and
non-covered
PCI loans are not reflected in the amounts or ratios provided in this table.
                                         
 
At or for the Years Ended December 31,
 
(dollars in thousands)
 
2019
   
2018
   
2017
   
2016
   
2015
 
Allowance for Losses on Non-Covered Loans:


Balance at beginning of year
  $
159,820
    $
158,046
    $
156,524
    $
145,196
    $
139,857
 
Provision for (recovery of) losses on
non-covered
loans
   
7,105
     
18,256
     
60,943
     
12,036
     
(2,846
)
Recovery from allowance on PCI loans
   
—  
     
—  
     
1,766
     
—  
     
—  
 
Charge-offs:


Multi-family
   
(659
)    
(34
)    
(279
)    
—  
     
(167
)
Commercial real estate
   
—  
     
(3,191
)    
—  
     
—  
     
(273
)
One-to-four
family residential
   
(954
)    
—  
     
(96
)    
(170
)    
(875
)
Acquisition, development, and construction
   
—  
     
(2,220
)    
—  
     
—  
     
—  
 
Other loans
   
(18,694
)    
(12,897
)    
(62,975
)    
(3,413
)    
(1,273
)
                                         
Total charge-offs
   
(20,307
)    
(18,342
)    
(63,350
)    
(3,583
)    
(2,588
)
Recoveries
   
1,020
     
1,860
     
2,163
     
2,875
     
10,773
 
                                         
Net (charge-offs) recoveries
   
(19,287
)    
(16,482
)    
(61,187
)    
(708
)    
8,185
 
                                         
Balance at end of year
  $
147,638
    $
159,820
    $
158,046
    $
156,524
    $
145,196
 
                                         
Non-Performing Non-Covered Assets:


Non-accrual
non-covered
mortgage loans:


Multi-family
  $
5,407
    $
4,220
    $
11,078
    $
13,558
    $
13,904
 
Commercial real estate
   
14,830
     
3,021
     
6,659
     
9,297
     
14,920
 
One-to-four
family residential
   
1,730
     
1,651
     
1,966
     
9,679
     
12,259
 
Acquisition, development, and construction
   
—  
     
—  
     
6,200
     
6,200
     
27
 
                                         
Total
non-accrual
non-covered
mortgage loans
   
21,967
     
8,892
     
25,903
     
38,734
     
41,110
 
Non-accrual
non-covered
other loans
   
39,276
     
36,614
     
47,779
     
17,735
     
5,715
 
Loans 90 days or more past due and still accruing interest
   
—  
     
—  
     
—  
     
—  
     
—  
 
                                         
Total
non-performing
non-covered
loans
(1)
  $
61,243
    $
45,506
    $
73,682
    $
56,469
    $
46,825
 
Non-covered
repossessed assets
(2)
   
12,268
     
10,794
     
16,400
     
11,607
     
14,065
 
                                         
Total
non-performing
non-covered
assets
  $
73,511
    $
56,300
    $
90,082
    $
68,076
    $
60,890
 
                                         
Asset Quality Measures:


Non-performing
non-covered
loans to total
non-covered
loans
   
0.15
%    
0.11
%    
0.19
%    
0.15
%    
0.13
%
Non-performing
non-covered
assets to total
non-covered
assets
   
0.14
     
0.11
     
0.18
     
0.14
     
0.13
 
Allowance for losses on
non-covered
loans to
non-performing
non-covered
loans
   
241.07
     
351.21
     
214.50
     
277.19
     
310.08
 
Allowance for losses on
non-covered
loans to total
non-covered
loans
   
0.35
     
0.40
     
0.41
     
0.42
     
0.41
 
Net charge-offs (recoveries) during the period to average loans outstanding during the period
(3)
   
0.05
     
0.04
     
0.16
     
0.00
     
(0.02
)
                                         
Non-Covered Loans 30-89 Days Past Due:


Multi-family
  $
1,131
    $
—  
    $
1,258
    $
28
    $
4,818
 
Commercial real estate
   
2,545
     
—  
     
13,227
     
—  
     
178
 
One-to-four
family residential
   
—  
     
9
     
585
     
2,844
     
1,117
 
Acquisition, development, and construction
   
—  
     
—  
     
—  
     
—  
     
—  
 
Other loans
   
44
     
555
     
2,719
     
7,511
     
492
 
                                         
Total loans
30-89
days past due
(4)
  $
3,720
    $
564
    $
17,789
    $
10,383
    $
6,605


(1)
The December 31, 2016 and 2015 amounts exclude loans 90 days or more past due of $131.5 million and $137.2 million, respectively, that are covered by FDIC loss sharing agreements. The December 31, 2016 and 2015 amounts also exclude $869,000 and $969,000, respectively, of
non-covered
PCI loans.
 
(2)
The December 31, 2016 and 2015 amounts exclude OREO of $17.0 million and $25.8 million, respectively, that were covered by FDIC loss sharing agreements.
 
(3)
Average loans include covered loans.
 
(4)
The December 31, 2016 and 2015 amounts exclude loans 30 to 89 days past due of $22.6 million and $32.8 million,, respectively, that are covered by FDIC loss sharing agreements. The December 31, 2016 amount also excludes $6 thousand of
non-covered
PCI loans. There were no
non-covered
PCI loans 30 to 89 days past due at any of the prior year-ends.
 
56

Table of Contents
The following table sets forth the allocation of the consolidated allowance for losses on
non-covered
loans, excluding the allowance for losses on
non-covered
PCI loans, at each
year-end
for the five years ended December 31, 2019:
                                                                                 
 
2019
   
2018
   
2017
   
2016
   
2015
 
(dollars in thousands)
 
Amount
   
Percent of
Loans in Each
Category
to Total
Loans Held for
Investment
   
Amount
   
Percent of
Loans in Each
Category
to Total
Loans Held for
Investment
   
Amount
   
Percent of
Loans in Each
Category
to Total
Loans Held for
Investment
   
Amount
   
Percent of
Loans in Each
Category
to Total
Non-Covered

Loans Held for
Investment
   
Amount
   
Percent of
Loans in Each
Category
to Total
Non-Covered

Loans Held for
Investment
 
Multi-family loans
  $
96,751
     
74.46
%   $
98,972
     
74.46
%   $
93,651
     
73.19
%   $
91,590
     
72.13
%   $
93,977
     
72.67
%
Commercial real estate loans
   
20,744
     
16.93
     
19,934
     
17.44
     
20,572
     
19.09
     
20,943
     
20.68
     
19,721
     
21.98
 
One-to-four
family residential loans
   
1,051
     
0.91
     
1,333
     
1.11
     
1,360
     
1.24
     
1,484
     
1.02
     
612
     
0.33
 
Acquisition, development, and construction loans
   
4,148
     
0.48
     
10,744
     
1.02
     
12,692
     
1.14
     
9,908
     
1.02
     
8,402
     
0.87
 
Other loans
   
24,944
     
7.22
     
28,837
     
5.97
     
29,771
     
5.34
     
32,599
     
5.15
     
22,484
     
4.15
 
                                                                                 
Total loans
  $
147,638
     
100.00
%   $
159,820
     
100.00
%   $
158,046
     
100.00
%   $
156,524
     
100.00
%   $
145,196
     
100.00
%
                                                                                 
 
57

Table of Contents
Each of the preceding allocations was based upon an estimate of various factors, as discussed in “Critical Accounting Policies” earlier in this report, and a different allocation methodology may be deemed to be more appropriate in the future. In addition, it should be noted that the portion of the allowance for losses on
non-covered
loans allocated to each
non-covered
loan category does not represent the total amount available to absorb losses that may occur within that category, since the total loan loss allowance is available for the entire
non-covered
loan portfolio.
The following table presents a geographical analysis of our
non-performing
loans at December 31, 2019:
         
(in thousands)
 
 
New York
  $
53,974
 
New Jersey
   
6,183
 
All other states
   
1,086
 
         
Total
non-performing
loans
  $
61,243


Securities
Total securities were $5.9 billion, or 11.0%, of total assets at the end of this December, as compared to $5.6 billion, or 10.9%, of total assets at December 31, 2018. During the second quarter of 2017, we reclassified our entire securities portfolio as
“Available-for-Sale”.
Accordingly, at December 31, 2019 and December 31, 2018, we had no securities designated as
“Held-to-Maturity”.
During 2019, the Company purchased $93.5 million of CRA—qualified loans. Subsequently, the loans were securitized and transferred to the securities portfolio. At December 31, 2019, 35% of the securities portfolio was tied to floating rates, 34% of which is currently at floating rates, mainly one and three month LIBOR and prime.
At December 31, 2019,
available-for-sale
securities were $5.9 billion and had an estimated weighted average life of 4.4 years. Included in the
year-end
amount were mortgage-related securities of $3.4 billion and other debt securities of $2.5 billion.
At the prior
year-end,
available-for-sale
securities were $5.6 billion, and had an estimated weighted average life of 6.2 years. Mortgage-related securities accounted for $3.0 billion of the
year-end
balance, with other debt securities accounting for the remaining $2.6 billion.
The investment policies of the Company and the Bank are established by the Board of Directors and implemented by the ALCO. ALCO meets monthly or on an
as-needed
basis to review the portfolios and specific capital market transactions. In addition, the securities portfolios and investment activities are reviewed monthly by the Board of Directors. Furthermore, the policy governing the investment portfolio activities is reviewed at least annually by the ALCO and ratified by the Board of Directors.
Our general investment strategy is to purchase liquid investments with various maturities to ensure that our overall interest rate risk position stays within the required limits of our investment policies. We generally limit our investments to GSE obligations and U.S. Treasury obligations. At December 31, 2019 and 2018, GSE obligations and U.S. Treasury obligations together represented 82.6% and 83.5% of total securities, respectively. The remainder of the portfolio at those dates was comprised of corporate bonds, capital trust notes, asset-backed securities, and municipal obligations.
Federal Home Loan Bank Stock
As members of the
FHLB-NY,
the Bank is required to acquire and hold shares of its capital stock. At December 31, 2019, the Bank held
FHLB-NY
stock in the amount of $647.6 million. At December 31, 2018, the Bank held
FHLB-NY
stock in the amount of $644.6 million. Dividends from the
FHLB-NY
to the Bank totaled $39.5 million and $40.8 million, respectively, in 2019 and 2018.
Bank-Owned Life Insurance
BOLI is recorded at the total cash surrender value of the policies in the Consolidated Statements of Condition, and the income generated by the increase in the cash surrender value of the policies is recorded in
“Non-interest
income” in the Consolidated Statements of Income and Comprehensive Income. Reflecting an increase in the cash surrender value of the underlying policies and the purchase of $150.0 million of additional BOLI, our investment in BOLI rose $167.4 million year-over-year to $1.1 billion at December 31, 2019.
58

Table of Contents
Goodwill
We record goodwill in our consolidated statements of condition in connection with certain of our business combinations. Goodwill, which is tested at least annually for impairment, refers to the difference between the purchase price and the fair value of an acquired company’s assets, net of the liabilities assumed. Goodwill totaled $2.4 billion at both December 31, 2019 and 2018.
For more information about the Company’s goodwill, see the discussion of “Critical Accounting Policies” earlier in this report.
Sources of Funds
The Parent Company has four primary funding sources for the payment of dividends, share repurchases, and other corporate uses: dividends paid to the Parent Company by the Bank; capital raised through the issuance of securities; funding raised through the issuance of debt instruments; and repayments of, and income from, investment securities.
On a consolidated basis, our funding primarily stems from a combination of the following sources: retail, institutional, and brokered deposits; borrowed funds, primarily in the form of wholesale borrowings; cash flows generated through the repayment and sale of loans; and cash flows generated through the repayment and sale of securities.
In 2019, loan repayments and sales generated cash flows of $8.9 billion, as compared to $8.3 billion in 2018. Cash flows from repayments accounted for $8.8 billion and $8.1 billion of the respective totals and cash flows from sales accounted for $115.3 million and $195.6 million, of the respective totals.
In 2019, cash flows from the repayment and sale of securities respectively totaled $2.0 billion and $361.3 million, while the purchase of securities amounted to $2.5 billion for the year. By comparison, cash flows from the repayment and sale of securities totaled $817.8 million and $278.5 million, respectively, in 2018, and were offset by the purchase of securities totaling $3.3 billion.
In 2019, the cash flows from loans and securities were primarily deployed into the production of multi-family loans held for investment, as well as
held-for-investment
CRE loans and specialty finance loans and leases.
Deposits
Total deposits increased $892.7 million or 2.9% on a year-over-year basis to $31.7 billion. Deposit growth was driven by CDs and to a lesser extent by growth in savings accounts and
non-interest
bearing accounts. Compared to the fourth quarter of last year, CDs rose $2.0 billion or 16.6% to $14.2 billion, while savings accounts increased $136.7 million or 2.9% to $4.8 billion and
non-interest
bearing deposits increased over the same timeframe by $35.3 million or 1.5% to $2.4 billion. This was consistent with our strategy to increase the level of retail CDs.
While the vast majority of our deposits are retail in nature (i.e., they are deposits we have gathered through our branches or through business combinations), institutional deposits and municipal deposits are also part of our deposit mix. Retail deposits rose $319.7 million year-over-year to $24.4 billion, while institutional deposits declined $655.6 million to $1.1 billion at
year-end.
Municipal deposits represented $990.2 million of total deposits at the end of this December, a $28.3 million increase from the balance at December 31, 2018.
Depending on their availability and pricing relative to other funding sources, we also include brokered deposits in our deposit mix. Brokered deposits accounted for $5.2 billion of our deposits at the end of this December, compared to $4.0 billion at December 31, 2018. Brokered money market accounts represented $1.5 billion of total brokered deposits at December 31, 2019 and $1.9 billion at December 31, 2018; brokered interest-bearing checking accounts represented $1.2 billion and $786.1 million, respectively, at the corresponding dates. At December 31, 2019, we had $2.5 billion of brokered CDs, compared to $1.3 billion at December 31, 2018.
Borrowed Funds
The majority of our borrowed funds are wholesale borrowings and consist of
FHLB-NY
advances, repurchase agreements, and federal funds purchased, and, to a lesser extent, junior subordinated debentures and subordinated notes. At December 31, 2019, total borrowed funds increased $349.7 million or 2.5% to $14.6 billion compared to the balance at December 31, 2018. The bulk of the year-over-year increase was driven by a $349.0 million or 2.6% increase in the balance of wholesale borrowings.
59

Table of Contents
Wholesale Borrowings
Wholesale borrowings totaled $13.9 billion and $13.6 billion, respectively, at December 31, 2019 and 2018, representing 25.9% and 26.1% of total assets at the respective dates.
FHLB-NY
advances accounted for $13.1 billion of the
year-end
2019 balance, as compared to $13.1 billion at the prior
year-end.
 Pursuant to blanket collateral agreements with the Bank, our
FHLB-NY
advances and overnight advances are secured by pledges of certain eligible collateral in the form of loans and securities. (For more information regarding our
FHLB-NY
advances, see the discussion that appears earlier in this report regarding our membership and our ownership of stock in the
FHLB-NY.)
At December 31, 2019, $8.3 billion of our wholesale borrowings had callable features compared to $4.7 billion at December 31, 2018,
Also included in wholesale borrowings were repurchase agreements of $800.0 million at December 31, 2019 compared to $500.0 million at December 31, 2018. Repurchase agreements are contracts for the sale of securities owned or borrowed by the Bank with an agreement to repurchase those securities at agreed-upon prices and dates.
Our repurchase agreements are primarily collateralized by GSE obligations, and may be entered into with the
FHLB-NY
or certain brokerage firms. The brokerage firms we utilize are subject to an ongoing internal financial review to ensure that we borrow funds only from those dealers whose financial strength will minimize the risk of loss due to default. In addition, a master repurchase agreement must be executed and on file for each of the brokerage firms we use.
We had no federal funds purchased at both December 31, 2019 and 2018.
Junior Subordinated Debentures
Junior subordinated debentures totaled $359.9 million at December 31, 2019, slightly higher than the balance at the prior
year-end
reflecting discount accretion.
Subordinated Notes
At December 31, 2019, the balance of subordinated notes was $295.1 million, relatively unchanged from December 31, 2018.
See Note 9, “Borrowed Funds,” in Item 8, “Financial Statements and Supplementary Data” for a further discussion of our wholesale borrowings and our junior subordinated debentures.
Liquidity, Contractual Obligations and
Off-Balance
Sheet Commitments, and Capital Position
Liquidity
We manage our liquidity to ensure that our cash flows are sufficient to support our operations, and to compensate for any temporary mismatches between sources and uses of funds caused by variable loan and deposit demand.
We monitor our liquidity daily to ensure that sufficient funds are available to meet our financial obligations. Our most liquid assets are cash and cash equivalents, which totaled $741.9 million and $1.5 billion, respectively, at December 31, 2019 and 2018. As in the past, our loan and securities portfolios provided meaningful liquidity in 2019, with cash flows from the repayment and sale of loans totaling $8.9 billion and cash flows from the repayment and sale of securities totaling $2.3 billion.
Additional liquidity stems from deposits and from our use of wholesale funding sources, including brokered deposits and wholesale borrowings. In addition, we have access to the Bank’s approved lines of credit with various counterparties, including the
FHLB-NY.
The availability of these wholesale funding sources is generally based on the amount of mortgage loan collateral available under a blanket lien we have pledged to the respective institutions and, to a lesser extent, the amount of available securities that may be pledged to collateralize our borrowings. At December 31, 2019, our available borrowing capacity with the
FHLB-NY
was $7.9 billion. In addition, the Bank had
available-for-sale
securities of $5.9 billion, of which, $4.5 billion is unpledged.
Furthermore, the Bank has agreements with the
FRB-NY
that enable it to access the discount window as a further means of enhancing their liquidity. In connection with these agreements, the Bank has pledged certain loans and securities to collateralize any funds they may borrow. At December 31, 2019, the maximum amount the Bank could borrow from the
FRB-NY
was $1.1 billion. There were no borrowings against either line of credit at December 31, 2019.
60

Table of Contents
Our primary investing activity is loan production, and the volume of loans we originated for investment totaled $10.6 billion in 2019. During this time, the net cash used in investing activities totaled $2.1 billion; the net cash provided by our operating activities totaled $509.8 million. Our financing activities provided net cash of $816.1 million.
CDs due to mature or reprice in one year or less from December 31, 2019 totaled $13.3 billion, representing 94% of total CDs at that date. Our ability to attract and retain retail deposits, including CDs, depends on numerous factors, including, among others, the convenience of our branches and our other banking channels; our customers’ satisfaction with the service they receive; the rates of interest we offer; the types of products we feature; and the attractiveness of their terms.
Our decision to compete for deposits also depends on numerous factors, including, among others, our access to deposits through acquisitions, the availability of lower-cost funding sources, the impact of competition on pricing, and the need to fund our loan demand.
The Parent Company is a separate legal entity from the Bank and must provide for its own liquidity. In addition to operating expenses and any share repurchases, the Parent Company is responsible for paying any dividends declared to our shareholders. As a Delaware corporation, the Parent Company is able to pay dividends either from surplus or, in case there is no surplus, from net profits for the fiscal year in which the dividend is declared and/or the preceding fiscal year.
The Parent Company’s ability to pay dividends may also depend, in part, upon dividends it receives from the Bank. The ability of the Bank to pay dividends and other capital distributions to the Parent Company is generally limited by New York State Banking Law and regulations, and by certain regulations of the FDIC. In addition, the Superintendent of the New York State Department of Financial Services (the “Superintendent”), the FDIC, and the FRB, for reasons of safety and soundness, may prohibit the payment of dividends that are otherwise permissible by regulations.
Under New York State Banking Law, a New York State-chartered stock-form savings bank or commercial bank may declare and pay dividends out of its net profits, unless there is an impairment of capital. However, the approval of the Superintendent is required if the total of all dividends declared in a calendar year would exceed the total of a bank’s net profits for that year, combined with its retained net profits for the preceding two years. In 2019, the Bank paid dividends totaling $380.0 million to the Parent Company, leaving $305.7 million that it could dividend to the Parent Company without regulatory approval at
year-end.
Additional sources of liquidity available to the Parent Company at December 31, 2019 included $183.1 million in cash and cash equivalents. If the Bank was to apply to the Superintendent for approval to make a dividend or capital distribution in excess of the dividend amounts permitted under the regulations, there can be no assurance that such application would be approved.
Contractual Obligations and
Off-Balance
Sheet Commitments
In the normal course of business, we enter into a variety of contractual obligations in order to manage our assets and liabilities, fund loan growth, operate our branch network, and address our capital needs.
For example, we offer CDs with contractual terms to our customers, and borrow funds under contract from the
FHLB-NY
and various brokerage firms. These contractual obligations are reflected in the Consolidated Statements of Condition under “Deposits” and “Borrowed funds,” respectively. At December 31, 2019, we had CDs of $14.2 billion and long-term debt (defined as borrowed funds with an original maturity in excess of one year) of $13.5 billion.
We also are obligated under certain
non-cancelable
operating leases on the buildings and land we use in operating our branch network and in performing our back-office responsibilities. These obligations are included in the Consolidated Statements of Condition and totaled $384.2 million at December 31, 2019.
Contractual Obligations
The following table sets forth the maturity profile of the aforementioned contractual obligations as of December 31, 2019:
                                 
(in thousands)
 
Certificates of
Deposit
   
Long-Term
Debt
(1)
   
Operating
Leases
(2)
   
Total
 
One year or less
  $
13,310,426
    $
3,425,000
    $
27,304
    $
16,762,730
 
One to three years
   
711,615
     
1,097,661
     
51,865
     
1,861,141
 
Three to five years
   
192,589
     
—  
     
25,078
     
217,667
 
More than five years
   
228
     
8,934,932
     
279,961
     
9,215,121
 
                                 
Total
  $
14,214,858
    $
13,457,593
    $
384,208
    $
28,056,659


(1)
Includes FHLB advances, repurchase agreements, and junior subordinated debentures.
 
(2)
Excludes imputed interest of $98.2 million.
 
61

Table of Contents
At December 31, 2019, we also had commitments to extend credit in the form of mortgage and other loan originations, as well as commercial, performance
stand-by,
and financial
stand-by
letters of credit, totaling $2.5 billion. These
off-balance
sheet commitments consist of agreements to extend credit, as long as there is no violation of any condition established in the contract under which the loan is made. Commitments generally have fixed expiration dates or other termination clauses and may require the payment of a fee.
The following table summarizes our
off-balance
sheet commitments to extend credit in the form of loans and letters of credit at December 31, 2019:
         
(in thousands)
 
 
Mortgage Loan Commitments:
   
 
Multi-family and commercial real estate
  $
251,679
 
One-to-four
family
   
801
 
Acquisition, development, and construction
   
205,499
 
         
Total mortgage loan commitments
  $
457,979
 
Other loan commitments
(1)
   
1,548,513
 
         
Total loan commitments
  $
2,006,492
 
Commercial, performance
stand-by,
and financial
stand-by
letters of credit
   
509,942
 
         
Total commitments
  $
2,516,434


(1)
Includes unadvanced lines of credit.
 
Based upon our current liquidity position, we expect that our funding will be sufficient to fulfill these obligations and commitments when they are due.
At December 31, 2019, we had no commitments to purchase securities.
Capital Position
Total stockholders’ equity rose $56.5 million, or 0.8%, year-over-year to $6.7 billion; common stockholders’ equity represented 11.57% of total assets and a book value per common share of $13.29 at December 31, 2019. At the prior
year-end,
total stockholders’ equity totaled $6.7 billion, and common stockholders’ equity represented 11.85% of total assets and a book value per common share of $12.99.
Tangible common stockholders’ equity increased $66.2 million year-over-year to $3.8 billion. The
year-end
2019 balance represented 7.39% of tangible common assets and a tangible common book value per common share of $8.09. At the prior
year-end,
tangible common stockholders’ equity totaled $3.7 billion, representing 7.51% of tangible common assets and a tangible common book value per common share of $7.85.
We calculate tangible common stockholders’ equity by subtracting the amount of goodwill and preferred stock recorded at the end of a period from the amount of stockholders’ equity recorded at the same date. Goodwill totaled $2.4 billion at December 31, 2019 and 2018 while preferred stock was $502.8 million at the end of 2019 and 2018. (See the discussion and reconciliations of stockholders’ equity and tangible common stockholders’ equity, total assets and tangible assets, and the related financial measures that appear on the last page of this discussion and analysis of our financial condition and results of operations.)
Stockholders’ equity and tangible common stockholders’ equity both include AOCL, which is comprised of the net unrealized gain or loss on
available-for-sale
securities; the net unrealized loss on the
non-credit
portion of OTTI securities; the net unrealized gain on cash flow hedges; and the Company’s pension and post-retirement obligations at the end of a period. In the twelve months ended December 31, 2019 and 2018, AOCL totaled $32.8 million and $87.7 million, respectively. The decrease in AOCL was largely the net effect of an $11.9 million decrease in net pension and post-retirement obligations to $59.1 million and the $42.0 million difference between the net unrealized loss on securities available for sale recorded at the end of this December and the net unrealized gain on securities available for sale recorded at December 31, 2018. 
62

Table of Contents
As reflected in the following table, our capital measures continued to exceed the minimum federal requirements for a bank holding company at December 31, 2019 and 2018:
                         
At December 31, 2019
 
Actual
   
Minimum
 
(dollars in thousands)
 
Amount
   
Ratio
   
Required Ratio
 
Common equity tier 1 capital
  $
3,818,311
     
9.91
%    
4.50
%
Tier 1 risk-based capital
   
4,321,151
     
11.22
     
6.00
 
Total risk-based capital
   
5,111,990
     
13.27
     
8.00
 
Leverage capital
   
4,321,151
     
8.66
     
4.00


At December 31, 2018
 
Actual
   
Minimum
 
(dollars in thousands)
 
Amount
   
Ratio
   
Required Ratio
 
Common equity tier 1 capital
  $
3,806,857
     
10.55
%    
4.50
%
Tier 1 risk-based capital
   
4,309,697
     
11.94
     
6.00
 
Total risk-based capital
   
5,112,079
     
14.16
     
8.00
 
Leverage capital
   
4,309,697
     
8.74
     
4.00
 
 
At December 31, 2019, the capital ratios for the Company and the Bank continued to exceed the levels required for classification as “well capitalized” institutions, as defined under the Federal Deposit Insurance Corporation Improvement Act of 1991, and as further discussed in Note 19, “Capital,” in Item 8, “Financial Statements and Supplementary Data.”
RESULTS OF OPERATIONS: 2019 AS COMPARED TO 2018
Net Interest Income
Net interest income is our primary source of income. Its level is a function of the average balance of our interest-earning assets, the average balance of our interest-bearing liabilities, and the spread between the yield on such assets and the cost of such liabilities. These factors are influenced by both the pricing and mix of our interest-earning assets and our interest-bearing liabilities which, in turn, are impacted by various external factors, including the local economy, competition for loans and deposits, the monetary policy of the FOMC, and market interest rates.
The cost of our deposits and borrowed funds is largely based on short-term rates of interest, the level of which is partially impacted by the actions of the FOMC. The FOMC reduces, maintains, or increases the target federal funds rate (the rate at which banks borrow funds overnight from one another) as it deems necessary. In 2018, the FOMC increased the target federal funds rate four times for a total of 100 basis points, to a target range of 2.25% to 2.50%.
While the target federal funds rate generally impacts the cost of our short-term borrowings and deposits, the yields on our
held-for-investment
loans and other interest-earning assets are typically impacted by intermediate-term market interest rates. In 2019, the five-year CMT ranged from a low of 1.32% to a high of 2.62% with an average rate of 1.95% for the year. In 2018, the five-year CMT ranged from a low of 2.25% to a high of 3.09% with an average rate of 2.75% for the year.
Another factor that impacts the yields on our interest-earning assets—and our net interest income—is the income generated by our multi-family and CRE loans and securities when they prepay. Since prepayment income is recorded as interest income, an increase or decrease in its level will also be reflected in the average yields (as applicable) on our loans, securities, and interest-earning assets, and therefore in our net interest income, our net interest rate spread, and our net interest margin.
It should be noted that the level of prepayment income on loans recorded in any given period depends on the volume of loans that refinance or prepay during that time. Such activity is largely dependent on such external factors as current market conditions, including real estate values, and the perceived or actual direction of market interest rates. In addition, while a decline in market interest rates may trigger an increase in refinancing and, therefore, prepayment income, so too may an increase in market interest rates. It is not unusual for borrowers to lock in lower interest rates when they expect, or see, that market interest rates are rising rather than risk refinancing later at a still higher interest rate.
63

Table of Contents
For the twelve months ended December 31, 2019, net interest income declined $73.6 million or 7% to $957.4 million. Total interest income rose $115.5 million or 6.8% for the twelve months ended December 31, 2019, while total interest expense rose $189.1 million or 29% for the same time period.
Year-Over-Year Comparison
The following factors contributed to the year-over-year decline in net interest income:
  Interest income increased $115.5 million or 6.8% to $1.8 billion on a year-over-year basis due to an $85.1 million or 5.8% increase in interest income from loans and a $51.5 million or 28.0% increase in interest income from securities.
 
  The increase in interest income from loans was the result of a higher level of average loan balances in 2019 compared to 2018, as well as, a higher yield on the loans. Average loans increased $1.3 billion to $40.4 billion, up 3.2% compared to 2018. At the same time, the average yield on the loan portfolio rose ten basis points to 3.85%, year-over-year. In addition, prepayment income contributed $48.9 million and 11 basis points to interest income and the average yield from loans, respectively, compared to $44.9 million and ten basis points in the prior year.
 
  The year-over-year improvement in interest income from securities was driven by a $1.5 billion increase in the average balance of securities partially offset by a ten basis point decline in the average yield to 3.72%. Prepayment income added $5.3 million and one basis point to the interest income and average yield from securities, respectively, relatively unchanged from 2018.
 
  The average balance of interest-earning assets increased $1.6 billion or 3.4% to $47.5 billion and the average yield rose 12 basis points to 3.80%.
 
  Interest expense increased $189.1 million to $847.8 million on a year-over-year basis as interest expense on deposits rose $150.9 million and interest expense on borrowed funds rose $38.1 million.
 
  The year-over-year increase in interest expenses on deposits was due to a $1.7 billion increase in the average balance of deposits, mostly CD balances, and a 44 basis point increase in the average cost of deposits to 1.84%.
 
  The year-over-year increase in interest expense from borrowed funds was driven primarily by a 29 basis point increase in the average cost of borrowings, while the average balance of borrowed funds was relatively unchanged.
 
  As a result, the average balance of interest-bearing liabilities increased $1.6 billion or 4.0% to $42.3 billion and our average cost increased 39 basis points to 2.01%.
 
Net Interest Margin
The direction of the Company’s net interest margin was consistent with that of its net interest income, and generally was driven by the same factors as those described above. At 2.02%, the margin was 23-basis points narrower than the margin recorded for full-year 2018. Adjusted net interest margin is a
non-GAAP
financial measure, as more fully discussed below.
64

Table of Contents
                         
 
For the Twelve Months Ended


Dec. 31,
2019
 
 
Dec. 31,
2018
 
 
Change (%)
 
(dollars in thousands)


Total Interest Income
  $
1,805,160
    $
1,689,673
     
7
%
Prepayment Income:


Loans
  $
48,884
    $
44,949
     
9
%
Securities
   
5,304
     
4,957
     
7
%
                         
Total prepayment income
  $
54,188
    $
49,906
     
9
%
                         
GAAP Net Interest Margin
   
2.02
%    
2.25
%    
-23
bp
Less:


Prepayment income from loans
   
11
bp    
10
bp    
1
bp
Prepayment income from securities
   
1
     
1
     
0
bp
Plus:


Subordinated debt issuance
   
     
—  


Total prepayment income contribution to and subordinated debt impact on net interest margin
   
12
bp    
11
bp    
1
bp
                         
Adjusted Net Interest Margin (non-GAAP)
   
1.90
%    
2.14
%    
-24
bp
 
RECONCILIATION OF NET INTEREST MARGIN AND ADJUSTED NET INTEREST MARGIN
While our net interest margin, including the contribution of prepayment income and the impact from our recent subordinated notes offering, is recorded in accordance with GAAP, adjusted net interest margin, which excludes the contribution of prepayment income, is not. Nevertheless, management uses this
non-GAAP
measure in its analysis of our performance, and believes that this
non-GAAP
measure should be disclosed in this report and other investor communications for the following reasons:
  1. Adjusted net interest margin gives investors a better understanding of the effect of prepayment income on our net interest margin. Prepayment income in any given period depends on the volume of loans that refinance or prepay, or securities that prepay, during that period. Such activity is largely dependent on external factors such as current market conditions, including real estate values, and the perceived or actual direction of market interest rates.
 
  2. Adjusted net interest margin is among the measures considered by current and prospective investors, both independent of, and in comparison with, our peers.
 
Adjusted net interest margin should not be considered in isolation or as a substitute for net interest margin, which is calculated in accordance with GAAP. Moreover, the manner in which we calculate this
non-GAAP
measure may differ from that of other companies reporting a
non-GAAP
measure with a similar name.
The following table sets forth certain information regarding our average balance sheet for the years indicated, including the average yields on our interest-earning assets and the average costs of our interest-bearing liabilities. Average yields are calculated by dividing the interest income produced by the average balance of interest-earning assets. Average costs are calculated by dividing the interest expense produced by the average balance of interest-bearing liabilities. The average balances for the year are derived from average balances that are calculated daily. The average yields and costs include fees, as well as premiums and discounts (including
mark-to-market
adjustments from acquisitions), that are considered adjustments to such average yields and costs.
65

Table of Contents
Net Interest Income Analysis
                                                                         
 
For the Years Ended December 31,
 
 
2019
   
2018
   
2017
 
(dollars in thousands)
 
Average
Balance
   
Interest
   
Average
Yield/
Cost
   
Average
Balance
   
Interest
   
Average
Yield/
Cost
   
Average
Balance
   
Interest
   
Average
Yield/
Cost
 
ASSETS:


Interest-earning assets:


Mortgage and other loans and leases, net
 (1)
  $
40,384,573
    $
1,553,004
     
3.85
%   $
39,122,724
    $
1,467,944
     
3.75
%   $
38,400,003
    $
1,417,237
     
3.69
%
Securities
(2)(3)
   
6,329,898
     
235,596
     
3.72
     
4,819,789
     
184,136
     
3.82
     
3,986,722
     
148,429
     
3.72
 
Interest-earning cash and cash equivalents
   
744,204
     
16,560
     
2.23
     
1,955,837
     
37,593
     
1.92
     
1,227,137
     
16,573
     
1.35
 
                                                                         
Total interest-earning assets
   
47,458,675
     
1,805,160
     
3.80
     
45,898,350
     
1,689,673
     
3.68
     
43,613,862
     
1,582,239
     
3.63
 
Non-interest-earning
assets
   
4,650,420


4,314,990


5,011,020


Total assets
  $
52,109,095
     
     
    $
50,213,340
     
     
    $
48,624,882


LIABILITIES AND STOCKHOLDERS’ EQUITY:


Interest-bearing deposits:


Interest-bearing
 checking and money market accounts
  $
10,597,285
    $
174,347
     
1.65
%   $
12,033,213
    $
167,972
     
1.40
%   $
12,787,703
    $
98,980
     
0.77
%
Savings accounts
   
4,737,423
     
35,705
     
0.75
     
4,902,728
     
28,994
     
0.59
     
5,170,342
     
28,447
     
0.55
 
Certificates of deposit
   
13,532,036
     
320,234
     
2.37
     
10,236,599
     
182,383
     
1.78
     
8,164,518
     
102,355
     
1.25
 
                                                                         
Total interest-bearing deposits
   
28,866,744
     
530,286
     
1.84
     
27,172,540
     
379,349
     
1.40
     
26,122,563
     
229,782
     
0.88
 
Borrowed funds
   
13,393,837
     
317,474
     
2.37
     
13,454,912
     
279,329
     
2.08
     
12,836,919
     
222,454
     
1.73
 
                                                                         
Total interest-bearing liabilities
   
42,260,581
     
847,760
     
2.01
     
40,627,452
     
658,678
     
1.62
     
38,959,482
     
452,236
     
1.16
 
Non-interest-bearing
deposits
   
2,588,040


2,550,163


2,782,155


Other liabilities
   
596,488


252,804


279,466


Total liabilities
   
45,445,109


43,430,419


42,021,103


Stockholders’ equity
   
6,663,986


6,782,921


6,603,779


Total liabilities and stockholders’ equity
  $
52,109,095
     
     
    $
50,213,340
     
     
    $
48,624,882


Net interest income/interest rate spread
   
    $
957,400
     
1.79
%    
    $
1,030,995
     
2.06
%    
    $
1,130,003
     
2.47
%
                                                                         
Net interest margin


2.02
%    
     
     
2.25
%    
     
     
2.59
%
                                                                         
Ratio of interest-earning assets to interest-bearing liabilities


1.12x


1.13x


1.12x


(1)
Amounts are net of net deferred loan origination costs/(fees) and the allowances for loan losses and include
non-performing
loans.
 
(2)
Amounts are at amortized cost.
 
(3)
Includes FHLB stock.
 
66

Table of Contents
The following table presents the extent to which changes in interest rates and changes in the volume of interest-earning assets and interest-bearing liabilities affected our interest income and interest expense during the periods indicated. Information is provided in each category with respect to (i) the changes attributable to changes in volume (changes in volume multiplied by prior rate); (ii) the changes attributable to changes in rate (changes in rate multiplied by prior volume); and (iii) the net change. The changes attributable to the combined impact of volume and rate have been allocated proportionately to the changes due to volume and the changes due to rate.
Rate/Volume Analysis
                                                 
 
Year Ended
   
Year Ended
 
 
December 31, 2019
   
December 31, 2018
 
 
Compared to Year Ended
   
Compared to Year Ended
 
 
December 31, 2018
   
December 31, 2017
 
 
Increase/(Decrease)
   
Increase/(Decrease)
 
 
Due to
   
   
Due to
   
 
(in thousands)
 
Volume
   
Rate
   
Net
   
Volume
   
Rate
   
Net
 
INTEREST-EARNING
 ASSETS:


Mortgage and other loans and leases, net
  $
48,012
    $
37,048
    $
85,060
    $
26,909
    $
23,798
    $
50,707
 
Securities and interest-earning cash and cash equivalents
   
10,056
     
20,371
     
30,427
     
50,936
     
5,791
     
56,727
 
                                                 
Total
   
58,068
     
57,419
     
115,487
     
77,845
     
29,589
     
107,434
 
                                                 
INTEREST-BEARING LIABILITIES:


Interest-bearing checking and money market accounts
  $
(12,836
)   $
19,211
    $
6,375
    $
(5,468
)   $
74,460
    $
68,992
 
Savings accounts
   
(940
)    
7,651
     
6,711
     
(1,225
)    
1,772
     
547
 
Certificates of deposit
   
68,257
     
69,594
     
137,851
     
30,091
     
49,937
     
80,028
 
Borrowed funds
   
(1,262
)    
39,407
     
38,145
     
11,124
     
45,751
     
56,875
 
                                                 
Totals
   
53,219
     
135,863
     
189,082
     
34,522
     
171,920
     
206,442
 
                                                 
Change in net interest income
  $
4,849
    $
(78,444
)   $
(73,595
)   $
43,323
    $
(142,331
)   $
(99,008
)
                                                 
 
Provision for (Recoveries of) Loan Losses
Provision for (Recovery of) Losses on Loans
The provision for losses on loans, like the recovery of loan losses, is based on the methodology used by management in calculating the allowance for losses on such loans. Reflecting this methodology, which is discussed in detail under “Critical Accounting Policies” earlier in this report, for the twelve months ended December 31, 2019, the Company reported a provision for loan losses of $7.1 million, down $11.2 million or 61% compared to $18.3 million for the twelve months ended December 31, 2018. The year-over-year decrease was related to taxi medallion-related charge-offs during the year.
Reflecting the 2019 provision and twelve-month net charge-offs of $19.3 million, the allowance for losses on loans of $147.6 million decreased $12.2 million at the end of this December compared to $159.8 million at the prior
year-end.
For additional information about our methodologies for recording recoveries of, and provisions for, loan losses, see the discussion of the loan loss allowance under “Critical Accounting Policies” and the discussion of “Asset Quality” that appear earlier in this report.
Non-Interest
Income
We generate
non-interest
income through a variety of sources, including—among others—fee income (in the form of retail deposit fees and charges on loans); income from our investment in BOLI; gains on sales of securities; and “other” sources, including the revenues produced through the sale of third-party investment products.
For the twelve months ended December 31, 2019,
non-interest
income totaled $84.2 million, down $7.3 million or 8% compared to the $91.6 million for the twelve months ended December 31, 2018. Included in the full-year 2018 amount was revenue of $20.3 million related to our wealth management business (which was sold during 2019), versus no such revenue in full-year 2019. Also included in the full-year 2019 period were net gains on securities of $7.7 million compared to a net loss on securities of $2.0 million in full-year 2018 and a branch sale-leaseback gain of $7.9 million compared to no such gains in full-year 2018.
67

Table of Contents
Non-Interest
Income Analysis
The following table summarizes our sources of
non-interest
income in the twelve months ended December 31, 2019, 2018, and 2017:
                         
 
For the Years Ended December 31,
 
(in thousands)
 
2019
   
2018
   
2017
 
Fee income
  $
29,297
    $
29,765
    $
31,759
 
BOLI income
   
28,363
     
28,252
     
27,133
 
Mortgage banking income
   
—  
     
—  
     
19,337
 
Net gain (loss) on securities
   
7,725
     
(1,994
)    
29,924
 
FDIC indemnification expense
   
—  
     
—  
     
(18,961
)
Gain on sale of covered loans and mortgage banking operations
   
—  
     
—  
     
82,026
 
Other income:


Third-party investment product sales
   
6,468
     
12,474
     
12,771
 
Recovery of OTTI securities
   
55
     
146
     
1,120
 
Other
   
12,322
     
22,915
     
31,771
 
                         
Total other income
   
18,845
     
35,535
     
45,662
 
                         
Total
non-interest
income
  $
84,230
    $
91,558
    $
216,880


Non-Interest
Expense
For the twelve months ended December 31, 2019, total
non-interest
expense was $511.2 million versus $546.6 million for the twelve months ended December 31, 2018. In 2019,
non-interest
expense included $10.4 million of certain items related to severance costs and branch rationalization costs.
Reflecting the Company’s cost reduction initiatives, compensation and benefits, occupancy and equipment, and general and administrative expenses decreased year-over-year by $15.8 million, $10.9 million, and $8.7 million, respectively.
Income Tax Expense
Income tax expense includes federal, New York State, and New York City income taxes, as well as
non-material
income taxes from other jurisdictions where we operate our branches and/or conduct our mortgage banking business.
For full-year 2019, income tax expense totaled $128.3 million compared to $135.3 million for full-year 2018. The effective tax rate in 2019 was 24.51% compared to 24.25% in 2018.
RESULTS OF OPERATIONS: 2018 AS COMPARED TO 2017
The results of operations comparison of 2018 compared to 2017 can be found in the Company’s previously filed 2018 Form
10-K
under Item 7 “Management’s Discussion and analysis of Financial Condition and Results of Operations.”
QUARTERLY FINANCIAL DATA
The following table sets forth selected unaudited quarterly financial data for the years ended December 31, 2019 and 2018:
                                                                 
 
2019
   
2018
 
(in thousands, except per share data)
 
4th
   
3rd
   
2nd
   
1st
   
4th
   
3rd
   
2nd
   
1st
 
Net interest income
   
$242,470
     
$235,915
     
$237,690
     
$241,325
     
$247,236
     
$249,506
     
$263,955
     
$270,298
 
Provision for (recovery of) loan losses
   
1,702
     
4,781
     
1,844
     
(1,222
)    
2,770
     
1,201
     
4,714
     
9,571
 
Non-interest
income
   
17,462
     
24,386
     
17,597
     
24,785
     
23,073
     
22,922
     
22,706
     
22,857
 
Non-interest
expense
   
126,097
     
123,302
     
123,052
     
138,767
     
134,946
     
134,433
     
138,142
     
139,107
 
                                                                 
Income before income taxes
   
132,133
     
132,218
     
130,391
     
128,565
     
132,593
     
136,794
     
143,805
     
144,477
 
Income tax expense
   
30,959
     
33,172
     
33,145
     
30,988
     
30,854
     
30,022
     
36,451
     
37,925
 
                                                                 
Net income
   
101,174
     
99,046
     
97,246
     
97,577
     
101,739
     
106,772
     
107,354
     
106,552
 
Preferred stock dividends
   
8,207
     
8,207
     
8,207
     
8,207
     
8,207
     
8,207
     
8,207
     
8,207
 
                                                                 
Net income available to common shareholders
   
$92,967
     
$90,839
     
$89,039
     
$89,370
     
$93,532
     
$98,565
     
$99,147
     
$98,345
 
                                                                 
Basic earnings per common share
   
$0.20
     
$0.19
     
$0.19
     
$0.19
     
$0.19
     
$0.20
     
$0.20
     
$0.20
 
                                                                 
Diluted earnings per common share
   
$0.20
     
$0.19
     
$0.19
     
$0.19
     
$0.19
     
$0.20
     
$0.20
     
$0.20


68

Table of Contents
IMPACT OF INFLATION
The consolidated financial statements and notes thereto presented in this report have been prepared in accordance with GAAP, which requires that we measure our financial condition and operating results in terms of historical dollars, without considering changes in the relative purchasing power of money over time due to inflation. The impact of inflation is reflected in the increased cost of our operations. Unlike industrial companies, nearly all of a bank’s assets and liabilities are monetary in nature. As a result, the impact of interest rates on our performance is greater than the impact of general levels of inflation. Interest rates do not necessarily move in the same direction, or to the same extent, as the prices of goods and services.
IMPACT OF RECENT ACCOUNTING PRONOUNCEMENTS
Recently Issued Accounting Standards
In August 2018, the FASB issued ASU No.
 2018-13,
Fair Value Measurement (Topic 820): Disclosure Framework – Changes to the Disclosure Requirements for Fair Value Measurement. The purpose of ASU No.
 2018-13
is to improve the effectiveness of disclosures in the notes to financial statements by facilitating clear communication of the information required by GAAP that is most important to users of each entity’s financial statements. The amendments in ASU No.
 2018-13
are effective for the Company as of January 1, 2020. The amendments remove the disclosure requirements for transfers between Levels 1 and 2 of the fair value hierarchy, the disclosure of the policy for timing of transfers between levels of the fair value hierarchy, and the disclosure of the valuation processes for Level 3 fair value measurements. Additionally, the amendments modify the disclosure requirements for investments in certain entities that calculate net asset value and measurement uncertainty. Finally, the amendments added disclosure requirements for the changes in unrealized gains and losses included in other comprehensive income for recurring Level 3 fair value measurements and the range and weighted average of significant unobservable inputs used to develop Level 3 measurements. The amendments on changes in unrealized gains and losses, the range and weighted average of significant unobservable inputs used to develop Level 3 fair value measurements and the narrative description of measurement uncertainty should be applied prospectively for only the most recent interim or annual period presented in the initial fiscal year of adoption. All other amendments should be applied retrospectively to all periods presented upon their effective date. The adoption of ASU No.
 2018-13
is not expected to have a material effect on the Company’s Consolidated Statements of Condition, results of operations, or cash flows.
In January 2017, the FASB issued ASU No.
 2017-04,
Intangibles—Goodwill and Other (Topic 350): Simplifying the Test for Goodwill Impairment. ASU No.
 2017-04
eliminates the second step of the goodwill impairment test which requires an entity to determine the implied fair value of the reporting unit’s goodwill. Instead, an entity will recognize an impairment loss if the carrying value of the net assets assigned to the reporting unit exceeds the fair value of the reporting unit, with the impairment loss not to exceed the amount of goodwill recorded. ASU No.
 2017-04
does not amend the optional qualitative assessment of goodwill impairment. The Company plans to adopt ASU No.
 2017-04
prospectively beginning January 1, 2020 and the impact of its adoption on the Company’s Consolidated Statements of Condition, results of operations, or cash flows will be dependent upon goodwill impairment determinations made after that date.
In June 2016, the FASB issued ASU No.
 2016-13,
Financial Instruments—Credit Losses (Topic 326): Measurement of Credit Losses on Financial Instruments. ASU No.
 2016-13
amends guidance on reporting credit losses for assets held on an amortized cost basis and
available-for-sale
debt securities. For assets held at amortized cost, ASU No.
 2016-13
eliminates the probable initial recognition threshold in current GAAP and, instead, requires an entity to reflect its current estimate of all expected credit losses. Current GAAP requires an “incurred loss” methodology for recognizing credit losses that delays recognition until it is probable a loss has been incurred. The amendments in ASU No.
 2016-13
replace the incurred loss impairment methodology in current GAAP with a methodology that reflects the measurement of expected credit losses based on relevant information about past events, including historical loss experience, current conditions, and reasonable and supportable forecasts that affect the collectability of the reported amounts. The allowance for credit losses is a valuation account that is deducted from the amortized cost basis of financial assets to present the net amount expected to be collected. For
available-for-sale
debt securities, credit losses should be measured in a manner similar to current GAAP but will be presented as an allowance rather than as a write-down. The amendments affect loans, debt securities, trade receivables,
off-balance
sheet credit exposures, reinsurance receivables, and any other financial assets not excluded from the scope that have the contractual right to receive cash.
The Company has developed a CECL allowance model which calculates reserves over the life of the asset or off-balance sheet credit exposure and is largely driven by portfolio characteristics, risk-grading, economic outlook, and other key methodology assumptions. The Company has leveraged analyses derived from its stress testing processes in the development of CECL models. The Company will utilize a single economic forecast over a two-year reasonable and supportable forecast period and will use straight-line reversion to historical losses. The Company expects not more than a 20% increase in the allowance for credit losses, which will decrease the opening stockholders equity balance as of January 1, 2020. The Company is in the process of finalizing the review of the most recent model run and finalizing assumptions including quantative adjustments and probable troubled debt restructurings, and implementation of operational processes and internal controls.
69

Table of Contents
RECONCILIATIONS OF STOCKHOLDERS’ EQUITY, COMMON STOCKHOLDERS’ EQUITY, AND TANGIBLE COMMON STOCKHOLDERS’ EQUITY; TOTAL ASSETS AND TANGIBLE ASSETS; AND THE RELATED MEASURES
While stockholders’ equity, common stockholders’ equity, total assets, and book value per common share are financial measures that are recorded in accordance with U.S. GAAP, tangible common stockholders’ equity, tangible assets, and tangible book value per common share are not. It is management’s belief that these
non-GAAP
measures should be disclosed in this report and others we issue for the following reasons:
  1. Tangible common stockholders’ equity is an important indication of the Company’s ability to grow organically and through business combinations, as well as its ability to pay dividends and to engage in various capital management strategies.
 
  2. Tangible book value per common share and the ratio of tangible common stockholders’ equity to tangible assets are among the capital measures considered by current and prospective investors, both independent of, and in comparison with, the Company’s peers.
 
Tangible common stockholders’ equity, tangible assets, and the related
non-GAAP
measures should not be considered in isolation or as a substitute for stockholders’ equity, common stockholders’ equity, total assets, or any other measure calculated in accordance with GAAP. Moreover, the manner in which we calculate these
non-GAAP
measures may differ from that of other companies reporting
non-GAAP
measures with similar names.
Reconciliations of our stockholders’ equity, common stockholders’ equity, and tangible common stockholders’ equity; our total assets and tangible assets; and the related financial measures for the respective periods follow:
                 
 
At or for the
Twelve Months Ended
December 31,
 
(dollars in thousands)
 
2019
   
2018
 
Stockholders’ Equity
  $
6,711,694
    $
6,655,235
 
Less: Goodwill
   
(2,426,379
)    
(2,436,131
)
Preferred stock
   
(502,840
)    
(502,840
)
                 
Tangible common stockholders’ equity
  $
3,782,475
    $
3,716,264
 
Total Assets
  $
53,640,821
    $
51,899,376
 
Less: Goodwill
   
(2,426,379
)    
(2,436,131
)
                 
Tangible assets
  $
51,214,442
    $
49,463,245
 
Common stockholders’ equity to total assets
   
11.57
%    
11.85
%
Tangible common stockholders’ equity to tangible assets
   
7.39
     
7.51
 
Book value per common share
   
$13.29
     
$12.99
 
Tangible book value per common share
   
8.09
     
7.85
 
 
ITEM 7A.
QUANTITATIVE AND QUALITATIVE DISCLOSURES ABOUT MARKET RISK
 
We manage our assets and liabilities to reduce our exposure to changes in market interest rates. The asset and liability management process has three primary objectives: to evaluate the interest rate risk inherent in certain balance sheet accounts; to determine the appropriate level of risk, given our business strategy, operating environment, capital and liquidity requirements, and performance objectives; and to manage that risk in a manner consistent with guidelines approved by the Boards of Directors of the Company and the Bank.
70

Table of Contents
Market Risk
As a financial institution, we are focused on reducing our exposure to interest rate volatility, which represents our primary market risk. Changes in market interest rates represent the greatest challenge to our financial performance, as such changes can have a significant impact on the level of income and expense recorded on a large portion of our interest-earning assets and interest-bearing liabilities, and on the market value of all interest-earning assets, other than those possessing a short term to maturity. To reduce our exposure to changing rates, the Board of Directors and management monitor interest rate sensitivity on a regular or as needed basis so that adjustments to the asset and liability mix can be made when deemed appropriate.
The actual duration of
held-for-investment
mortgage loans and mortgage-related securities can be significantly impacted by changes in prepayment levels and market interest rates. The level of prepayments may, in turn, be impacted by a variety of factors, including the economy in the region where the underlying mortgages were originated; seasonal factors; demographic variables; and the assumability of the underlying mortgages. However, the factors with the most significant impact on prepayments are market interest rates and the availability of refinancing opportunities.
In 2019, we managed our interest rate risk by taking the following actions: (1) We continued to emphasize the origination and retention of intermediate-term assets, primarily in the form of multi-family and CRE loans; (2) We increased our portfolio of C&I loans, which feature floating rates; and (3) We replaced maturing wholesale borrowings with longer term borrowings, including some with callable features, and (4) We entered into interest rate swaps with a notional amount of $2.8 billion to hedge certain real estate loans and borrowings.
LIBOR Transition Process
On July 27, 2017, the U.K. Financial Conduct Authority (FCA), which regulates LIBOR, announced that it will no longer persuade or compel banks to submit rates for the calculation of LIBOR after 2021. Accordingly, the FRB has recommended an alternative index dubbed the Secured Overnight Financing Rate or “SOFR”. The Bank has established a
sub-committee
of its ALCO to address issues related to the
phase-out
and ultimate transition away from LIBOR to an alternate rate. This
sub-committee
is led by our Chief Accounting Officer and consists of personnel from various departments throughout the Bank including lending, loan administration, credit risk management, finance/treasury, information technology, and operations. The Company has LIBOR-based contracts that extend beyond 2021 included in loans and leases, securities, wholesale borrowings, derivative financial instruments, and long-term debt. The
sub-committee
has reviewed contract fallback language and noted that certain contracts will need updated provisions for the transition and is coordinating with impacted business lines.
Interest Rate Sensitivity Analysis
The matching of assets and liabilities may be analyzed by examining the extent to which such assets and liabilities are “interest rate sensitive” and by monitoring a bank’s interest rate sensitivity “gap.” An asset or liability is said to be interest rate sensitive within a specific time frame if it will mature or reprice within that period of time. The interest rate sensitivity gap is defined as the difference between the amount of interest-earning assets maturing or repricing within a specific time frame and the amount of interest-bearing liabilities maturing or repricing within that same period of time.
At December 31, 2019, our
one-year
gap was a negative 12.31%, as compared to a negative 22.56% at December 31, 2018. The change in our
one-year
gap reflects an increase in expected prepayments on loans coupled with the addition of the previously mentioned interest rate swaps, partially offset by an increase in CDs maturing within one year.
In a rising interest rate environment, an institution with a negative gap would generally be expected, absent the effects of other factors, to experience a greater increase in the cost of its interest-bearing liabilities than it would in the yield on its interest-earning assets, thus producing a decline in its net interest income. Conversely, in a declining rate environment, an institution with a negative gap would generally be expected to experience a lesser reduction in the yield on its interest-earning assets than it would in the cost of its interest-bearing liabilities, thus producing an increase in its net interest income.
In a rising interest rate environment, an institution with a positive gap would generally be expected to experience a greater increase in the yield on its interest-earning assets than it would in the cost of its interest-bearing liabilities, thus producing an increase in its net interest income. Conversely, in a declining rate environment, an institution with a positive gap would generally be expected to experience a lesser reduction in the cost of its interest-bearing liabilities than it would in the yield on its interest-earning assets, thus producing a decline in its net interest income.
71

Table of Contents
The table on the following page sets forth the amounts of interest-earning assets and interest-bearing liabilities outstanding at December 31, 2019 which, based on certain assumptions stemming from our historical experience, are expected to reprice or mature in each of the future time periods shown. Except as stated below, the amounts of assets and liabilities shown as repricing or maturing during a particular time period were determined in accordance with the earlier of (1) the term to repricing, or (2) the contractual terms of the asset or liability.
The table provides an approximation of the projected repricing of assets and liabilities at December 31, 2019 on the basis of contractual maturities, anticipated prepayments, and scheduled rate adjustments within a three-month period and subsequent selected time intervals. For residential mortgage-related securities, prepayment rates are forecasted at a weighted average CPR of 10% per annum; for multi-family and CRE loans, prepayment rates are forecasted at weighted average CPRs of 23% and 13% per annum, respectively. Borrowed funds were not assumed to prepay.
Savings, NOW, and money market accounts were assumed to decay based on a comprehensive statistical analysis that incorporated our historical deposit experience. Based on the results of this analysis, savings accounts were assumed to decay at a rate of 72% for the first five years and 28% for years six through ten. Interest-bearing checking accounts were assumed to decay at a rate of 85% for the first five years and 15% for years six through ten. The decay assumptions reflect the prolonged low interest rate environment and the uncertainty regarding future depositor behavior. Including those accounts having specified repricing dates, money market accounts were assumed to decay at a rate of 87% for the first five years and 13% for years six through ten.
72

Table of Contents
Interest Rate Sensitivity Analysis
                                                         
 
At December 31, 2019
 
(dollars in thousands)
 
Three
Months
or Less
   
Four to
Twelve
Months
   
More Than
One Year
to Three Years
   
More Than
Three Years
to Five Years
   
More Than
Three Years
to 10 Years
   
More
Than
10 Years
   
Total
 
INTEREST-EARNING ASSETS:


Mortgage and other loans
(1)
  $
6,319,629
    $
9,029,406
    $
16,176,327
    $
8,497,030
    $
1,730,422
    $
80,098
    $
41,832,912
 
Mortgage-related
 securities 
(2)(3)
   
84,390
     
333,928
     
782,108
     
604,330
     
778,414
     
770,565
     
3,353,735
 
Other securities
(2)
   
2,328,090
     
321,208
     
130,436
     
176,048
     
136,361
     
54,741
     
3,146,884
 
Interest-earning cash and cash equivalents
   
610,149
     
—  
     
—  
     
—  
     
—  
     
—  
     
610,149
 
                                                         
Total interest-earning assets
   
9,342,258
     
9,684,542
     
17,088,871
     
9,277,408
     
2,645,197
     
905,404
     
48,943,680
 
                                                         
INTEREST-BEARING LIABILITIES:


Interest-bearing checking and money market accounts
   
4,872,458
     
1,067,266
     
1,863,357
     
1,007,278
     
1,419,785
     
—  
     
10,230,144
 
Savings accounts
   
907,224
     
1,190,375
     
792,123
     
550,256
     
1,340,029
     
—  
     
4,780,007
 
Certificates of deposit
   
3,485,350
     
9,840,035
     
699,077
     
190,366
     
30
     
—  
     
14,214,858
 
Borrowed funds
   
2,263,926
     
2,005,000
     
2,697,661
     
—  
     
7,450,000
     
141,006
     
14,557,593
 
                                                         
Total
 interest-bearing
 liabilities
   
11,528,958
     
14,102,676
     
6,052,218
     
1,747,900
     
10,209,844
     
141,006
     
43,782,602
 
                                                         
Interest rate sensitivity gap per period 
(4)
  $
(2,186,700
)   $
(4,418,134
)   $
11,036,653
    $
7,529,508
    $
(7,564,647
)   $
764,398
    $
5,161,078
 
                                                         
Cumulative interest rate sensitivity gap
  $
(2,186,700
)   $
(6,604,834
)   $
4,431,819
    $
11,961,327
    $
4,396,680
    $
5,161,078


Cumulative interest rate sensitivity gap as a percentage of total assets
   
(4.08
)%    
(12.31
)%    
8.26
%    
22.30
%    
8.20
%    
9.62
%    
 
Cumulative net interest-earning assets as a percentage of net interest-bearing liabilities
   
81.03
%    
74.23
%    
113.99
%    
135.78
%    
110.07
%    
111.79
%    


(1)
For the purpose of the gap analysis,
non-performing
loans and the allowance for loan losses have been excluded.
 
(2)
Mortgage-related and other securities, including FHLB stock, are shown at their respective carrying amounts.
 
(3)
Expected amount based, in part, on historical experience.
 
(4)
The interest rate sensitivity gap per period represents the difference between interest-earning assets and interest-bearing liabilities.
 
73

Table of Contents
Prepayment and deposit decay rates can have a significant impact on our estimated gap. While we believe our assumptions to be reasonable, there can be no assurance that the assumed prepayment and decay rates noted above will approximate actual future loan and securities prepayments and deposit withdrawal activity.
To validate our prepayment assumptions for our multi-family and CRE loan portfolios, we perform a monthly analysis, during which we review our historical prepayment rates and compare them to our projected prepayment rates. We continually review the actual prepayment rates to ensure that our projections are as accurate as possible, since prepayments on these types of loans are not as closely correlated to changes in interest rates as prepayments on
one-to-four
family loans tend to be. In addition, we review the call provisions in our borrowings and investment portfolios and, on a monthly basis, compare the actual calls to our projected calls to ensure that our projections are reasonable.
As of December 31, 2019, the impact of a
100-basis
point decline in market interest rates would have increased our projected prepayment rates for multi-family and CRE loans by a constant prepayment rate of 8.57% per annum. Conversely, the impact of a
100-basis
point increase in market interest rates would have decreased our projected prepayment rates for multi-family and CRE loans by a constant prepayment rate of 9.99% per annum.
Certain shortcomings are inherent in the method of analysis presented in the preceding Interest Rate Sensitivity Analysis. For example, although certain assets and liabilities may have similar maturities or periods to repricing, they may react in different degrees to changes in market interest rates. The interest rates on certain types of assets and liabilities may fluctuate in advance of the market, while interest rates on other types may lag behind changes in market interest rates. Additionally, certain assets, such as adjustable-rate loans, have features that restrict changes in interest rates both on a short-term basis and over the life of the asset. Furthermore, in the event of a change in interest rates, prepayment and early withdrawal levels would likely deviate from those assumed in calculating the table. Also, the ability of some borrowers to repay their adjustable-rate loans may be adversely impacted by an increase in market interest rates.
Interest rate sensitivity is also monitored through the use of a model that generates estimates of the change in our Economic Value of Equity (“EVE”) over a range of interest rate scenarios. EVE is defined as the net present value of expected cash flows from assets, liabilities, and
off-balance
sheet contracts. The EVE ratio, under any interest rate scenario, is defined as the EVE in that scenario divided by the market value of assets in the same scenario. The model assumes estimated loan prepayment rates, reinvestment rates, and deposit decay rates similar to those utilized in formulating the preceding Interest Rate Sensitivity Analysis.
Based on the information and assumptions in effect at December 31, 2019, the following table sets forth our EVE, assuming the changes in interest rates noted:
(
dollars in thousands
)
                                         
Change in
Interest Rates
(in basis points)
(1)
 
Market Value
of Assets
   
Market Value
of Liabilities
   
Economic
Value of Equity
   
Net Change
   
Estimated
Percentage
Change in
Economic Value
of Equity
 
+200
  $
51,468,631
    $
45,446,988
    $
6,021,643
    $
(792,352
)    
(11.63
)%
+100
   
52,585,995
     
46,020,438
     
6,565,557
     
(248,438
)    
(3.65
)
   
53,597,005
     
46,783,010
     
6,813,995
     
—  
     
—  
 
- 100
   
54,328,065
     
47,728,811
     
6,599,254
     
(214,741
)    
(3.15
)
 
(1)
The impact of a
200-bp
reduction in interest rates is not presented in view of the current level of the federal funds rate and other short-term interest rates.
 
The net changes in EVE presented in the preceding table are within the parameters approved by the Boards of Directors of the Company and the Bank.
As with the Interest Rate Sensitivity Analysis, certain shortcomings are inherent in the methodology used in the preceding interest rate risk measurements. Modeling changes in EVE requires that certain assumptions be made which may or may not reflect the manner in which actual yields and costs respond to changes in market interest rates. In this regard, the EVE analysis presented above assumes that the composition of our interest rate sensitive assets and liabilities existing at the beginning of a period remains constant over the period being measured, and also assumes that a particular change in interest rates is reflected uniformly across the yield curve, regardless of the duration to maturity or repricing of specific assets and liabilities. Furthermore, the model does not take into account the benefit of any strategic actions we may take to further reduce our exposure to interest rate risk. Accordingly, while the EVE analysis provides an indication of our interest rate risk exposure at a particular point in time, such measurements are not intended to, and do not, provide a precise forecast of the effect of changes in market interest rates on our net interest income, and may very well differ from actual results.
74

Table of Contents
We also utilize an internal net interest income simulation to manage our sensitivity to interest rate risk. The simulation incorporates various market-based assumptions regarding the impact of changing interest rates on future levels of our financial assets and liabilities. The assumptions used in the net interest income simulation are inherently uncertain. Actual results may differ significantly from those presented in the following table, due to the frequency, timing, and magnitude of changes in interest rates; changes in spreads between maturity and repricing categories; and prepayments, among other factors, coupled with any actions taken to counter the effects of any such changes. Based on the information and assumptions in effect at December 31, 2019, the following table reflects the estimated percentage change in future net interest income for the next twelve months, assuming the changes in interest rates noted:
         
Change in Interest Rates
(in basis points)
(1) (2)
 
Estimated Percentage Change in
Future Net Interest Income
 
+100 over one year
   
(1.94
)%
+200 over one year
   
(3.91
)
-100 over one year
   
2.52
 
 
(1)
In general, short- and long-term rates are assumed to increase in parallel fashion across all four quarters and then remain unchanged.
 
(2)
The impact of a
200-bp
reduction in interest rates is not presented in view of the current level of the federal funds rate and other short-term interest rates.
 
Future changes in our mix of assets and liabilities may result in greater changes to our gap, EVE, and/or net interest income simulation.
In the event that our EVE and net interest income sensitivities were to breach our internal policy limits, we would undertake the following actions to ensure that appropriate remedial measures were put in place:
  Our ALCO Committee would inform the Board of Directors of the variance, and present recommendations to the Board regarding proposed courses of action to restore conditions to within-policy tolerances.
 
  In formulating appropriate strategies, the ALCO Committee would ascertain the primary causes of the variance from policy tolerances, the expected term of such conditions, and the projected effect on capital and earnings.
 
Where temporary changes in market conditions or volume levels result in significant increases in risk, strategies may involve reducing open positions or employing synthetic hedging techniques to more immediately reduce risk exposure. Where variance from policy tolerances is triggered by more fundamental imbalances in the risk profiles of core loan and deposit products, a remedial strategy may involve restoring balance through natural hedges to the extent possible before employing synthetic hedging techniques. Other strategies might include:
  Asset restructuring, involving sales of assets having higher risk profiles, or a gradual restructuring of the asset mix over time to affect the maturity or repricing schedule of assets;
 
  Liability restructuring, whereby product offerings and pricing are altered or wholesale borrowings are employed to affect the maturity structure or repricing of liabilities;
 
  Expansion or shrinkage of the balance sheet to correct imbalances in the repricing or maturity periods between assets and liabilities; and/or
 
  Use or alteration of
off-balance
sheet positions, including interest rate swaps, caps, floors, options, and forward purchase or sales commitments.
 
In connection with our net interest income simulation modeling, we also evaluate the impact of changes in the slope of the yield curve. At December 31, 2019, our analysis indicated that an immediate inversion of the yield curve would be expected to result in an 8.55% decrease in net interest income; conversely, an immediate steepening of the yield curve would be expected to result in an 11.48% increase.
75

Table of Contents
ITEM 8.
FINANCIAL STATEMENTS AND SUPPLEMENTARY DATA
 
Our Consolidated Financial Statements and Notes thereto and other supplementary data begin on the following page.
76

Table of Contents
NEW YORK COMMUNITY BANCORP, INC.
CONSOLIDATED STATEMENTS OF CONDITION
                 
 
December 31,
 
(in thousands, except share data)
 
2019
   
2018
 
ASSETS:


Cash and cash equivalents
 
$
741,870
    $
1,474,955
 
Securities:


Debt securities
available-for-sale
($
1,372,238
and $
1,228,702
pledged at December 31, 2019 and 2018, respectively)
   
5,853,057
     
5,613,520
 
Equity investments with readily determinable fair values, at fair value
   
32,830
     
30,551
 
                 
Total securities
   
5,885,887
     
5,644,071
 
                 
Loans and leases, net of deferred loan fees and costs
   
41,894,155
     
40,165,908
 
Less: Allowance for loan losses
   
(147,638
)    
(159,820
)
                 
Total loans and leases, net
   
41,746,517
     
40,006,088
 
Federal Home Loan Bank stock, at cost
   
647,562
     
644,590
 
Premises and equipment, net
   
312,626
     
346,179
 
Operating lease
right-of-use
assets
   
286,194
     
 
Goodwill
   
2,426,379
     
2,436,131
 
Bank-owned life insurance
   
1,145,058
     
977,627
 
Other real estate owned and other repossessed assets
   
12,268
     
10,794
 
Other assets
   
436,460
     
358,941
 
                 
Total assets
 
$
53,640,821
    $
51,899,376
 
                 
LIABILITIES AND STOCKHOLDERS’ EQUITY:


Deposits:


Interest-bearing checking and money market accounts
 
$
10,230,144
    $
11,530,049
 
Savings accounts
   
4,780,007
     
4,643,260
 
Certificates of deposit
   
14,214,858
     
12,194,322
 
Non-interest-bearing
accounts
   
2,432,123
     
2,396,799
 
                 
Total deposits
   
31,657,132
     
30,764,430
 
Borrowed funds:


Wholesale borrowings:


Federal Home Loan Bank advances
   
13,102,661
     
13,053,661
 
Repurchase agreements
   
800,000
     
500,000
 
                 
Total wholesale borrowings
   
13,902,661
     
13,553,661
 
Junior subordinated debentures
   
359,866
     
359,508
 
Subordinated notes
   
295,066
     
294,697
 
                 
Total borrowed funds
   
14,557,593
     
14,207,866
 
Operating lease liabilities
   
285,991
     
—  
 
Other liabilities
   
428,411
     
271,845
 
                 
Total liabilities
   
46,929,127
     
45,244,141
 
                 
Stockholders’ equity:


Preferred stock at par $
0.01
(
5,000,000
shares authorized): Series A (
515,000
shares issued and outstanding)
   
502,840
     
502,840
 
Common stock at par $
0.01
(
900,000,000
shares authorized;
490,439,070
and
490,439,070
shares issued
;
 and
467,346,781
and
473,536,604
shares outstanding, respectively)
   
4,904
     
4,904
 
Paid-in
capital in excess of par
   
6,115,487
     
6,099,940
 
Retained earnings
   
342,023
     
297,202
 
Treasury stock, at cost (
23,092,289
and
16,902,466
shares, respectively)
   
(220,717
)    
(161,998
)
Accumulated other comprehensive loss, net of tax:


Net unrealized
gain
(loss) on securities available for sale, net of tax of $
(11,941)
and $
4,201
, respectively
   
31,482
     
(10,534
)
Net unrealized loss on the
non-credit
portion of other-than-temporary impairment losses on securities, net of tax of $
2,517
and $
2,517
, respectively
   
(6,042
   
(6,042
)
Net unrealized loss on pension and post-retirement obligations, net of tax of $
22,191
and $
27,224
, respectively
   
(59,136
   
(71,077
)
Net unrealized gain on cash flow hedges, net of tax of $(333)
   
853
     
—  
 
                 
Total accumulated other comprehensive loss, net of tax
   
(32,843
)    
(87,653
)
                 
Total stockholders’ equity
   
6,711,694
     
6,655,235
 
                 
Total liabilities and stockholders’ equity
 
$
53,640,821
    $
51,899,376


See accompanying notes to the consolidated financial statements.
 
77

Table of Contents
NEW YORK COMMUNITY BANCORP, INC.
CONSOLIDATED STATEMENTS OF INCOME AND COMPREHENSIVE INCOME
                         
 
Years Ended December 31,
 
(in thousands, except per share data)
 
2019
   
2018
   
2017
 
INTEREST INCOME:


Mortgage and other loans and leases
 
$
1,553,004
    $
1,467,944
    $
1,417,237
 
Securities and money market investments
   
252,156
     
221,729
     
165,002
 
                         
Total interest income
   
1,805,160
     
1,689,673
     
1,582,239
 
                         
INTEREST EXPENSE:


Interest-bearing checking and money market accounts
   
174,347
     
167,972
     
98,980
 
Savings accounts
   
35,705
     
28,994
     
28,447
 
Certificates of deposit
   
320,234
     
182,383
     
102,355
 
Borrowed funds
   
317,474
     
279,329
     
222,454
 
                         
Total interest expense
   
847,760
     
658,678
     
452,236
 
                         
Net interest income
   
957,400
     
1,030,995
     
1,130,003
 
Provision for losses on
non-covered
loans
   
7,105
     
18,256
     
60,943
 
Recovery of losses on covered loans
   
     
—  
     
(23,701
)
                         
Net interest income after provision for (recovery of) loan losses
   
950,295
     
1,012,739
     
1,092,761
 
                         
NON-INTEREST
INCOME:


Fee income
   
29,297
     
29,765
     
31,759
 
Bank-owned life insurance
   
28,363
     
28,252
     
27,133
 
Net gain (loss) on securities
   
7,725
     
(1,994
)    
29,924
 
Mortgage banking income
   
     
—  
     
19,337
 
FDIC indemnification expense
   
     
—  
     
(18,961
)
Gain on sale of covered loans and mortgage banking operations
   
     
—  
     
82,026
 
Other
   
18,845
     
35,535
     
45,662
 
                         
Total
non-interest
income
   
84,230
     
91,558
     
216,880
 
                         
NON-INTEREST
EXPENSE:


Operating expenses:


Compensation and benefits
   
301,697
     
317,496
     
363,698
 
Occupancy and equipment
   
89,174
     
100,107
     
98,963
 
General and administrative
   
120,347
     
129,025
     
178,557
 
                         
Total operating expenses
   
511,218
     
546,628
     
641,218
 
Amortization of core deposit intangibles
   
     
—  
     
208
 
                         
Total
non-interest
expense
   
511,218
     
546,628
     
641,426
 
                         
Income before income taxes
   
523,307
     
557,669
     
668,215
 
Income tax expense
   
128,264
     
135,252
     
202,014
 
                         
Net income
 
$
395,043
    $
422,417
    $
466,201
 
Preferred stock dividends
   
32,828
     
32,828
     
24,621
 
                         
Net income available to common shareholders
 
$
362,215
    $
389,589
    $
441,580
 
                         
Basic earnings per common share
   
$0.77
     
$0.79
     
$0.90
 
                         
Diluted earnings per common share
   
$0.77
     
$0.79
     
$0.90
 
                         
Net income
 
$
395,043
    $
422,417
    $
466,201
 
Other comprehensive income (loss), net of tax:


Change in net unrealized gain (loss) on securities available for sale, net of tax of $
(17,669)
; $
32,166
; and $
(29,740
), respectively
   
45,934
     
(49,732
)    
41,684
 
Change in the
non-credit
portion of OTTI losses recognized in other comprehensive income (loss), net of tax of $
000
; $
(
821
)
; and $
(13
), respectively
   
     
(821
)    
20
 
Change in pension and post-retirement obligations, net of tax of $
(5,033)
; $
(
4,897
)
; and $
(2,234
), respectively
   
11,941
     
(21,943
)    
1,585
 
Change in net unrealized gain (loss) on cash flow hedges
, net of tax
 o
f
 $(376
)
 
   
964
     
—  
     
—  
 
Less: Reclassification adjustment for sales of
available-for-sale
securities, net of tax of $
1,527
; $
(4
); and $
1,245
, respectively
   
(3,918
)    
10
     
(1,743
)
Reclassification
adjustment for net gain on cash flow hedges
 included in net income
, net of tax of $43
   
(111
)    
—  
     
—  
 
                         
Total other comprehensive income (loss), net of tax
   
54,810
     
(72,486
)    
41,546
 
                         
Total comprehensive income, net of tax
 
$
449,853
    $
349,931
    $
507,747


See accompanying notes to the consolidated financial statements.
 
78

Table of Contents
NEW YORK COMMUNITY BANCORP, INC.
CONSOLIDATED STATEMENTS OF CHANGES IN STOCKHOLDERS’ EQUITY


Preferred
   
Common


Accumulated


Stock
   
Stock
   
Paid-in


Other
   
Total


Shares
Outstanding
   
(Par Value:
$0.01)
   
(Par Value:
$0.01)
   
Capital
in excess of Par
   
Retained
Earnings
   
Treasury Stock,
at Cost
   
Comprehensive
Loss, Net of Tax
   
Stockholders’
Equity
 
Twelve Months Ended December 31, 2019


Balance at January 1, 2019
 
 
473,536,604
 
 
$
502,840
   
$
4,904
 
 
$
6,099,940
 
 
$
297,202
 
 
$
(161,998
)
 
$
(87,653
)
 
$
6,655,235
 
Shares issued for restricted stock, net of forfeitures
 
 
1,665,028


(16,501


16,501


Compensation expense related to restricted stock awards


32,048


32,048
 
Net income


395,043


395,043
 
Dividends paid on common stock ($
0.68
)


(317,394


(317,394
Dividends paid on preferred stock ($
63.76
)


(32,828


(32,828
Purchase of common stock
 
 
(7,854,851
)


(75,220


(75,220
Other comprehensive income, net of tax


54,810


54,810


Balance at December 31, 2019
 
 
467,346,781
 
 
$
502,840
   
$
4,904
 
 
$
6,115,487
 
 
$
342,023
 
 
$
(220,717
 
$
(32,843
 
$
6,711,694
 
Twelve Months Ended December 31, 2018


Balance at January 1, 2018
 
 
488,490,352
 
 
$
502,840
   
$
4,891
 
 
$
6,072,559
 
 
$
237,868
 
 
$
(7,615
)
 
$
(15,167
)
 
$
6,795,376
 
Shares issued for restricted stock, net of forfeitures
 
 
2,039,603


—  
   
 
13


(8,879
)
 
 
—  


8,866


—  


—  
 
Compensation expense related to restricted stock awards
 
 
—  


—  
   
 
—  


36,260


—  


—  


—  


36,260
 
Net income
 
 
—  


—  
   
 
—  


—  


422,417


—  


—  


422,417
 
Dividends paid on common stock ($
0.68
)
 
 
—  


—  
   
 
—  


—  


(333,061
)
 
 
—  


—  


(333,061
)
Dividends paid on preferred stock ($
63.76
)
 
 
—  


—  
   
 
—  


—  


(32,828
)
 
 
—  


—  


(32,828
)
Effect of adopting ASU No.
 2016-01
 
 
—  


—  
   
 
—  


—  


260


—  


—  


260
 
Effect of adopting ASU No.
 2018-02
 
 
—  


—  
   
 
—  


—  


2,546


—  


(2,546
)
 
 
—  
 
Purchase of common stock
 
 
(16,993,351
)
 
 
—  
   
 
—  


—  


—  


(163,249
)
 
 
—  


(163,249
)
Other comprehensive
loss
, net of tax
 
 
—  


—  
   
 
—  


—  


—  


—  


(69,940
)
 
 
(69,940
)


Balance at December 31, 2018
 
 
473,536,604
 
 
$
502,840
   
$
4,904
 
 
$
6,099,940
 
 
$
297,202
 
 
$
(161,998
)
 
$
(87,653
)
 
$
6,655,235


Twelve Months Ended December 31, 2017


Balance at January 1, 2017
 
 
487,056,676
 
 
$
—  
   
$
4,871
 
 
$
6,047,558
 
 
$
128,435
 
 
$
(160
)
 
$
(56,713
)
 
$
6,123,991
 
Issuance of preferred stock (
515,000
shares)
 
 
—  


502,840
   
 
—  


—  


—  


—  


—  


502,840
 
Shares issued for restricted stock, net of forfeitures
 
 
2,718,049


—  
   
 
20


(11,028
)
 
 
—  


11,008


—  


—  
 
Compensation expense related to restricted stock awards
 
 
—  


—  
   
 
—  


36,029


—  


—  


—  


36,029
 
Net income
 
 
—  


—  
   
 
—  


—  


466,201


—  


—  


466,201
 
Dividends paid on common stock ($
0.68
)
 
 
—  


—  
   
 
—  


—  


(332,147
)
 
 
—  


—  


(332,147
)
Dividends paid on preferred stock ($
47.81
)
 
 
—  


—  
   
 
—  


—  


(24,621
)
 
 
—  


—  


(24,621
)
Purchase of common stock
 
 
(1,284,373
)
 
 
—  
   
 
—  


—  


—  


(18,463
)
 
 
—  


(18,463
 
Other comprehensive income, net of tax
 
 
—  


—  
   
 
—  


—  


—  


—  


41,546


41,546


Balance at December 31, 2017
 
 
488,490,352
 
 
$
502,840
   
$
4,891
 
 
$
6,072,559
 
 
$
237,868
 
 
$
(7,615
)
 
$
(15,167
)
 
$
6,795,376


See accompanying notes to the consolidated financial statements.
 
79

Table of Contents
NEW YORK COMMUNITY BANCORP, INC.
CONSOLIDATED STATEMENTS OF CASH FLOWS
                         
 
Years Ended December 31,
 
(in thousands)
 
2019
   
2018
   
2017
 
CASH FLOWS FROM OPERATING ACTIVITIES:


Net income
 
$
395,043
    $
422,417
    $
466,201
 
Adjustments to reconcile net income to net cash provided by operating activities:


Provision for loan losses
   
7,105
     
18,256
     
37,242
 
Depreciation
   
27,096
     
32,323
     
32,803
 
Amortization of discounts and premiums, net
   
7,951
     
(3,891
)    
(4,555
)
Amortization of core deposit intangibles
   
     
—  
     
208
 
Net (gain) loss on securities
   
(7,725
)    
14
     
(29,924
)
Gain on trading activity
   
(66
)    
(222
)    
(316
)
Net
loss (
gain
)
on sales of loans
   
75
     
(111
)    
(87,301
)
Net gain on sales of fixed assets


(7,402
)


Stock-based compensation
   
32,048
     
36,260
     
36,029
 
Deferred tax expense
   
100,813
     
23,197
     
21,444
 
Changes in operating assets and liabilities:


(Increase)
d
ecrease in other assets
(1)
   
(55,825
)    
29,952
     
451,873
 
Increase (decrease)
in other liabilities
(2)
   
10,571
     
(53,320
)    
23,329
 
Purchases of securities held for trading
   
(42,500
)    
(141,615
)    
(202,450
)
Proceeds from sales of securities held for trading
   
42,566
     
141,837
     
202,766
 
Origination of loans held for sale
   
     
—  
     
(1,674,123
)
Proceeds from sales of loans originated for sale
   
     
35,258
     
2,053,484
 
                         
Net cash provided by operating activities
   
509,750
     
540,355
     
1,326,710
 
                         
CASH FLOWS FROM INVESTING ACTIVITIES:


Proceeds from repayment of securities held to maturity
   
     
—  
     
175,375
 
Proceeds from repayment of securities available for sale
   
1,962,433
     
817,822
     
387,772
 
Proceeds from sales of securities held to maturity
   
     
—  
     
547,925
 
Proceeds from sales of securities available for sale
   
361,311
     
278,539
     
453,878
 
Purchase of securities held to maturity
   
     
—  
     
(13,030
)
Purchase of securities available for sale
   
(2,503,248
)    
(3,288,204
)    
(1,163,043
)
Redemption of Federal Home Loan Bank stock
   
135,906
     
120,220
     
90,909
 
Purchases of Federal Home Loan Bank stock
   
(138,878
)    
(160,991
)    
(103,794
)
Purchases of (proceeds from) bank-owned life insurance, net
   
(138,119
)    
16,303
     
—  
 
Proceeds from sales of loans
   
115,205
     
195,760
     
2,289,377
 
Purchases of loans
   
(864,299
)


Other changes in loans, net
   
(998,515
)    
(1,990,068
)    
(1,575,846
)
Proceeds from s
a
les
 (purchase
s
) of premises and equipment, net
   
9,297
     
(9,847
)    
(27,783
)
                         
Net cash (used in) provided by investing activities
   
(2,058,907
)    
(4,020,466
)    
1,061,740
 
                         
CASH FLOWS FROM FINANCING ACTIVITIES:


Net increase in deposits
   
892,702
     
1,662,267
     
214,260
 
Net
increase (
decrease
)
in short-term borrowed funds
   
1,100,000
     
—  
     
(460,000
)
Proceeds from long-term borrowed funds
   
4,785,812
     
5,667,268
     
3,000,000
 
Repayments of long-term borrowed funds
   
(5,537,000
)    
(4,373,500
)    
(3,300,000
)
Net proceeds from issuance of preferred stock
   
     
—  
     
502,840
 
Cash dividends paid on common stock
   
(317,394
)    
(333,061
)    
(332,147
)
Cash dividends paid on preferred stock
   
(32,828
)    
(32,828
)    
(24,621
)
Treasury stock repurchased
   
(67,125
)    
(160,767
)    
—  
 
Payments relating to treasury shares received for restricted stock award tax payments
   
(8,095
)    
(2,482
)    
(18,463
)
                         
Net cash provided by (used in) financing activities
   
816,072
     
2,426,897
     
(418,131
)
                         
Net (decrease) increase in cash, cash equivalents, and restricted cash
   
(733,085
)    
(1,053,214
)    
1,970,319
 
Cash, cash equivalents, and restricted cash at beginning of year
   
1,474,955
     
2,528,169
     
557,850
 
                         
Cash, cash equivalents, and restricted cash at end of year
 
$
741,870
    $
1,474,955
    $
2,528,169
 
                         
Supplemental information:


Cash paid for interest
 
$
813,161
    $
645,588
    $
447,476
 
Cash paid for income taxes
   
75,680
     
44,123
     
217,682
 
Non-cash
investing and financing activities:


Transfers to repossessed assets from loans
 
$
4,689
    $
5,631
    $
9,973
 
Operating lease liabilities arising from obtaining
right-of-use
assets as of January 1, 2019
   
324,360
     
—  
     
—  
 
Securitization of residential mortgage loans to mortgage-backed securities available for sale
   
93,531
     
—  
     
—  
 
Transfer of loans from held for investment to held for sale
   
115,280
     
195,649
     
1,910,121
 
Disposition of premises and equipment
   
1,245
     
—  
     
—  
 
Shares issued for restricted stock awards
   
16,501
     
8,879
     
11,028
 
Securities transferred from held to maturity to available for sale


—  
     
3,040,305


(1) Includes $38.4 million of amortization of operating lease
right-of-use
assets for the twelve months ended December 31, 2019.


(2) Includes $38.4 million of amortization of operating lease liability for the twelve months ended December 31, 2019.


See accompanying notes to the consolidated financial statements.
 
80
 

Table of Contents
NOTE 1: ORGANIZATION AND BASIS OF PRESENTATION
Organization
New York Community Bancorp, Inc. (on a stand-alone basis, the “Parent Company” or, collectively with its subsidiaries, the “Company”) was organized under Delaware law on July 20, 1993 and is the holding company for New York Community Bank (hereinafter referred to as the “Bank”).
Founded on April 14, 1859 and formerly known as Queens County Savings Bank, the Bank converted from a state-chartered mutual savings bank to the capital stock form of ownership on November 23, 1993, at which date the Company issued its initial offering of common stock (par value: $0.01 per share) at a price of $25.00 per share
($0.93 per share on a split-adjusted basis, reflecting the impact of nine stock splits between 1994 and 2004).
The Company currently operates 238 branches through eight local divisions, each with a history of service and strength: Queens County Savings Bank, Roslyn Savings Bank, Richmond County Savings Bank, Roosevelt Savings Bank, and Atlantic Bank in New York; Garden State Community Bank in New Jersey; Ohio Savings Bank in Ohio; and AmTrust Bank in Arizona and Florida.
Basis of Presentation
The following is a description of the significant accounting and reporting policies that the Company and its subsidiaries follow in preparing and presenting their consolidated financial statements, which conform to U.S. generally accepted accounting principles (“GAAP”) and to general practices within the banking industry. The preparation of financial statements in conformity with GAAP requires the Company to make estimates and judgments that affect the reported amounts of assets and liabilities and the disclosure of contingent assets and liabilities at the date of the consolidated financial statements, and the reported amounts of revenues and expenses during the reporting period. Estimates that are used in connection with the determination of the allowance for loan losses 
and
the evaluation of goodwill for impairment
,
The accompanying consolidated financial statements include the accounts of the Company and other entities in which the Company has a controlling financial interest. All inter-company accounts and transactions are eliminated in consolidation. The Company currently has certain unconsolidated subsidiaries in the form of wholly-owned statutory business trusts, which were formed to issue guaranteed capital securities. See Note 9, “Borrowed Funds,” for additional information regarding these trusts.
NOTE 2: SUMMARY OF SIGNIFICANT ACCOUNTING POLICIES
Cash and Cash Equivalents
For cash flow reporting purposes, cash and cash equivalents include cash on hand, amounts due from banks, and money market investments, which include federal funds sold and reverse repurchase agreements. At December 31, 2019 and 2018, the Company’s cash and cash equivalents totaled $
741.9
 
m
illion and $
1.5
 billion, respectively. Included in cash and cash equivalents at those dates were $
608.4
 
m
illion and $
1.3
 
b
illion, respectively, of interest-bearing deposits in other financial institutions, primarily consisting of balances due from
the FRB-NY. Also
 
included in cash and cash equivalents at December 31, 2019 and 2018 were federal funds sold of $
1.7
 million and $
5.2
million, respectively. There were
no
reverse repurchase agreements outstanding at December 31, 2019 or 2018
.
Debt Securities and Equity Investments with Readily Determinable Fair Values
The securities portfolio primarily consists of mortgage-related securities and, to a lesser extent, debt and equity (together, “other”) securities. Securities that are classified as “available for sale” are carried at their estimated fair value, with any unrealized gains or losses, net of taxes, reported as accumulated other comprehensive income or loss in stockholders’ equity. Securities that the Company has the intent and ability to hold to maturity are classified as “held to maturity” and carried at amortized cost, less the
non-credit
portion of OTTI recorded in AOCL, net of tax.
Equity investments with readily
 
determinable fair values are measured at fair value with changes in fair value recognized in net income.
The fair values of our securities—and
particularly
our fixed-rate securities—are affected by changes in market interest rates and credit spreads. In general, as interest rates rise and/or credit spreads widen, the fair value of fixed-rate securities will decline. As interest rates fall and/or credit spreads tighten, the fair value of fixed-rate securities will rise. We regularly conduct a review and evaluation of our securities portfolio to determine if the decline in the fair value of any security below its carrying amount is other than temporary. If we deem any such decline in value to be other than temporary, the security is written down to its current fair value, creating a new cost basis, and the resultant loss (other than the OTTI
 
81
 

Table of Contents
of debt securities attributable to
non-credit
factors) is charged against earnings and recorded in
“Non-interest
income.” Our assessment of a decline in fair value requires judgment as to the financial position and future prospects of the entity that issued the investment security, as well as a review of the security’s underlying collateral. Broad changes in the overall market or interest rate environment generally will not lead to a write-down.
In accordance with OTTI accounting guidance, unless we have the intent to sell, or it is more likely than not that we may be required to sell a security before recovery, OTTI is recognized as a realized loss in earnings to the extent that the decline in fair value is credit-related. If there is a decline in fair value of a security below its carrying amount and we have the intent to sell it, or it is more likely than not that we may be required to sell the security before recovery, the entire amount of the decline in fair value is charged to earnings.
Premiums and discounts on securities are amortized to expense and accreted to income over the remaining period to contractual maturity using a method that approximates the interest method, and are adjusted for anticipated prepayments. Dividend and interest income are recognized when earned. The cost of securities sold is based on the specific identification method.
Federal Home Loan Bank Stock
As a member of the
FHLB-NY,
the Company is required to hold shares of
FHLB-NY
stock, which is carried at cost. The Company’s holding requirement varies based on certain factors, including its outstanding borrowings from the
FHLB-NY.
The Company conducts a periodic review and evaluation of its
FHLB-NY
stock to determine if any impairment exists. The factors considered in this process include, among others, significant deterioration in
FHLB-NY
earnings performance, credit rating, or asset quality; significant adverse changes in the regulatory or economic environment; and other factors that could raise significant concerns about the creditworthiness and the ability of the
FHLB-NY
to continue as a going concern.
Loans
Loans, net, are carried at unpaid principal balances, including unearned discounts, purchase accounting (i.e., acquisition-date fair value) adjustments, net deferred loan origination costs or fees, and the allowance for loan losses.
The Company recognizes interest income on loans using the interest method over the life of the loan. Accordingly, the Company defers certain loan origination and commitment fees, and certain loan origination costs, and amortizes the net fee or cost as an adjustment to the loan yield over the term of the related loan. When a loan is sold or repaid, the remaining net unamortized fee or cost is recognized in interest income.
Prepayment income on loans is recorded in interest income and only when cash is received. Accordingly, there are no assumptions involved in the recognition of prepayment income.
Two factors are considered in determining the amount of prepayment income: the prepayment penalty percentage set forth in the loan documents, and the principal balance of the loan at the time of prepayment. The volume of loans prepaying may vary from one period to another, often in connection with actual or perceived changes in the direction of market interest rates. When interest rates are declining, rising precipitously, or perceived to be on the verge of rising, prepayment income may increase as more borrowers opt to refinance and lock in current rates prior to further increases taking place.
A loan generally is
 
classified as a
“non-accrual”
loan when it is 90 days or more past due or when it is deemed to be impaired because the Company no longer expects to collect all amounts due according to the contractual terms of the loan agreement. When a loan is placed on
non-accrual
status, management ceases the accrual of interest owed, and previously accrued interest is charged against interest income. A loan is generally returned to accrual status when the loan is current and management has reasonable assurance that the loan will be fully collectible. Interest income on
non-accrual
loans is recorded when received in cash.
Allowance for Loan Losses
The allowance for loan losses represents our estimate of probable and estimable losses inherent in the loan portfolio as of the date of the balance sheet. Losses on loans are charged against, and recoveries of losses on loans are credited back to, the allowance for loan losses.
 
82
 

Table of Contents
The methodology used for the allocation of the allowance for loan losses at December 31, 2019 and December 31, 2018 was generally comparable, whereby the Bank segregated their loss factors (used for both criticized and
non-criticized
loans) into a component that was primarily based on historical loss rates and a component that was primarily based on other qualitative factors that are probable to affect loan collectability. In determining the allowance for loan losses, management considers the Bank’s current business strategies and credit processes, including compliance with applicable regulatory guidelines and with guidelines approved by the Boards of Directors with regard to credit limitations, loan approvals, underwriting criteria, and loan workout procedures.
The allowance for loan losses is established based on management’s evaluation of incurred losses in the portfolio in accordance with GAAP, and is comprised of both specific valuation allowances and a general valuation allowance.
Specific valuation allowances are established based on management’s analyses of individual loans that are considered impaired. If a loan is deemed to be impaired, management measures the extent of the impairment and establishes a specific valuation allowance for that amount. A loan is classified as impaired when, based on current information and/or events, it is probable that we will be unable to collect all amounts due under the contractual terms of the loan agreement. We apply this classification as necessary to loans individually evaluated for impairment in our portfolios. Smaller-balance homogenous loans and loans carried at the lower of cost or fair value are evaluated for impairment on a collective, rather than individual, basis. Loans to certain borrowers who have experienced financial difficulty and for which the terms have been modified, resulting in a concession, are considered TDRs and are classified as impaired.
We primarily measure impairment on an individual loan and determine the extent to which a specific valuation allowance is necessary by comparing the loan’s outstanding balance to either the fair value of the collateral, less the estimated cost to sell, or the present value of expected cash flows, discounted at the loan’s effective interest rate. Generally, when the fair value of the collateral, net of the estimated cost to sell, or the present value of the expected cash flows is less than the recorded investment in the loan, any shortfall is promptly charged off.
We also follow a process to assign the general valuation allowance to loan categories. The general valuation allowance is established by applying our loan loss provisioning methodology, and reflect the inherent risk in outstanding
held-for-investment
loans. This loan loss provisioning methodology considers various factors in determining the appropriate quantified risk factors to use to determine the general valuation allowance. The factors assessed begin with the historical loan loss experience for each major loan category. We also take into account an estimated historical loss emergence period (which is the period of time between the event that triggers a loss and the confirmation and/or
charge-off
of that loss) for each loan portfolio segment.
The allocation methodology consists of the following components: First, we determine an allowance for loan losses based on a quantitative loss factor for loans evaluated collectively for impairment. This quantitative loss factor is based primarily on historical loss rates, after considering loan type, historical loss and delinquency experience, and loss emergence periods. The quantitative loss factors applied in the methodology are periodically
re-evaluated
and adjusted to reflect changes in historical loss levels, loss emergence periods, or other risks. Lastly, we allocate an allowance for loan losses based on qualitative loss factors. These qualitative loss factors are designed to account for losses that may not be provided for by the quantitative loss component due to other factors evaluated by management, which include, but are not limited to:
 
Changes in lending policies and procedures, including changes in underwriting standards and collection, and
charge-off
and recovery practices;
 
Changes in international, national, regional, and local economic and business conditions and developments that affect the collectability of the portfolio, including the condition of various market segments;
 
Changes in the nature and volume of the portfolio and in the terms of loans;
 
Changes in the volume and severity of
past-due
loans, the volume of
non-accrual
loans, and the volume and severity of adversely classified or graded loans;
 
Changes in the quality of our loan review system;
 
Changes in the value of the underlying collateral for collateral-dependent loans;
 
The existence and effect of any concentrations of credit, and changes in the level of such concentrations;
 
Changes in the experience, ability, and depth of lending management and other relevant staff; and
 
The effect of other external factors, such as competition and legal and regulatory requirements, on the level of estimated credit losses in the existing portfolio.
83
 

Table of Contents
By considering the factors discussed above, we determine an allowance for loan losses that is applied to each significant loan portfolio segment to determine the total allowance for loan losses.
The historical loss period we use to determine the allowance for loan losses on loans is a rolling 36-quarter look-back period, as we believe this produces an appropriate reflection of our historical loss experience.
The process of establishing the allowance for losses on loans also involves:
 
Periodic inspections of the loan collateral by qualified
in-house
and external property appraisers/inspectors;
 
Regular meetings of executive management with the pertinent Board committees, during which observable trends in the local economy and/or the real estate market are discussed;
 
Assessment of the aforementioned factors by the pertinent members of the Board of Directors and management when making a business judgment regarding the impact of anticipated changes on the future level of loan losses; and
 
Analysis of the portfolio in the aggregate, as well as on an individual loan basis, taking into consideration payment history, underwriting analyses, and internal risk ratings.
In order to determine their overall adequacy, the loan loss allowance is reviewed quarterly by management Board Committees and the Board of Directors of the Bank, as applicable.
We charge off loans, or portions of loans, in the period that such loans, or portions thereof, are deemed uncollectible. The collectability of individual loans is determined through an assessment of the financial condition and repayment capacity of the borrower and/or through an estimate of the fair value of any underlying collateral. For
non-real
estate-related consumer credits, the following
past-due
time periods determine when charge-offs are typically recorded: (1)
 closed-end
credits are charged off in the quarter that the loan becomes 120 days past due; (2)
 open-end
credits are charged off in the quarter that the loan becomes 180 days past due; and (3) both
closed-end
and
open-end
credits are typically charged off in the quarter that the credit is 60 days past the date we received notification that the borrower has filed for bankruptcy.
The level of future additions to the respective loan loss allowance is based on many factors, including certain factors that are beyond management’s control, such as changes in economic and local market conditions, including declines in real estate values, and increases in vacancy rates and unemployment. Management uses the best available information to recognize losses on loans or to make additions to the loan loss allowance; however, the Bank may be required to take certain charge-offs and/or recognize further additions to the loan loss allowance, based on the judgment of regulatory agencies with regard to information provided during their examinations of the Bank.
An allowance for unfunded commitments is maintained separate from the allowance for loan losses and is included in Other liabilities in the Consolidated Statements of Condition.
See Note 6, Allowance for Loan Losses for a further discussion of our allowance for loan losses.
Goodwill
We have significant intangible assets related to goodwill. In connection with our acquisitions, assets acquired and liabilities assumed are recorded at their estimated fair values. Goodwill represents the excess of the purchase price of our acquisitions over the fair value of identifiable net assets acquired, including other identified intangible assets. Our goodwill is evaluated for impairment annually as of
year-end
or more frequently if conditions exist that indicate that the value may be impaired. We test our goodwill for impairment at the reporting unit level. These impairment evaluations are performed by comparing the carrying value of the goodwill of a reporting unit to its estimated fair value. We allocate goodwill to reporting units based on the reporting unit expected to benefit from the business combination. We have identified one reporting unit which is the same as our operating segment and reportable segment. If we change our strategy or if market conditions shift, our judgments may change, which may result in adjustments to the recorded goodwill balance.
For annual goodwill impairment testing, we have the option to first perform a qualitative assessment to determine whether it is more likely than not that the fair value of a reporting unit is less than its carrying amount, including goodwill and other intangible assets. If we conclude that this is the case, we must perform the
two-step
test described below. If we conclude based on the qualitative assessment that it is not more likely than not that the fair value of a reporting unit is less than its carrying amount, we have completed our goodwill impairment test and do not need to perform the
two-step
test.
 
8
4
 

Table of Contents
Step one requires the fair value of each reporting unit is compared to its carrying value in order to identify potential impairment. If the fair value of a reporting unit exceeds the carrying value of its net assets, goodwill is not considered impaired and no further testing is required. If the carrying value of the net assets exceeds the fair value of a reporting unit, potential impairment is indicated at the reporting unit level and step two of the impairment test is performed.
Step two requires that when potential impairment is indicated in step one, we compare the implied fair value of goodwill with the carrying amount of that goodwill. Determining the implied fair value of goodwill requires a valuation of the reporting unit’s tangible and
(non-goodwill)
intangible assets and liabilities in a manner similar to the allocation of the purchase price in a business combination. Any excess in the value of a reporting unit over the amounts assigned to its assets and liabilities is referred to as the implied fair value of goodwill. If the carrying amount of the reporting unit goodwill exceeds the implied fair value of that goodwill, an impairment loss is recognized in an amount equal to that excess.
As of December 31, 2019, we had goodwill of $2.4 billion. During the year ended December 31, 2019, no triggering events were identified that indicated that the value of goodwill may be impaired. For the year ended December 31, 2019, the Company’s annual goodwill impairment assessment, using step one of the quantitative test, found no indication of goodwill impairment.
Premises and Equipment, Net
Premises, furniture, fixtures, and equipment are carried at cost, less the accumulated depreciation computed on a straight-line basis over the estimated useful lives of the respective assets (generally
 
20 years
for premises and three to ten years for furniture, fixtures, and equipment). Leasehold improvements are carried at cost less the accumulated amortization computed on a straight-line basis over the shorter of the related lease term or the estimated useful life of the improvement.
Depreciation and amortization are included in “Occupancy and equipment expense” in the Consolidated Statements of
Income
and Comprehensive Income, and amounted to $27.1 million, $32.3 million, and $32.8 million, respectively, in the years ended December 31, 2019, 2018, and 2017.
Bank-Owned Life Insurance
The Company has purchased life insurance policies on certain employees. These BOLI policies are recorded in the Consolidated Statements of Condition at their cash surrender value. Income from these policies and changes in the cash surrender value are recorded in
“Non-interest
income” in the Consolidated Statements of
Income
and Comprehensive Income. At December 31, 2019 and 2018, the Company’s investment in BOLI was $1.1 
b
illion and $977.6 
m
illion, respectively. The Company had additional purchases of BOLI of $150.0 million during the year ended December 31, 2019 and no additional purchases during the year ended December 31, 2018. The Company’s investment in BOLI generated income of $28.4 million, $28.3 million, and $27.1 million, respectively, during the years ended December 31, 2019, 2018, and 2017.
Repossessed Assets and OREO
Repossessed assets consist of any property or other assets acquired through, or in lieu of, foreclosure are sold or rented, and are recorded at fair value, less the estimated selling costs, at the date of acquisition. Following foreclosure, management periodically performs a valuation of the asset, and the assets are carried at the lower of the carrying amount or fair value, less the estimated selling costs. Expenses and revenues from operations and changes in valuation, if any, are included
in “General and administrative expense” in
the Consolidated Statements of
Income
and Comprehensive Income. At December 31, 2019, the Company had $2.0 million of OREO and $10.3 million of taxi medallions. At December 31, 2018, the Company had $2.6 million of OREO and $8.2 million of taxi medallions.
Income Taxes
Income tax expense consists of income taxes that are currently payable and deferred income taxes. Deferred income tax expense is determined by recognizing deferred tax assets and liabilities for future tax consequences attributable to temporary differences between the financial statement carrying amounts of existing assets and liabilities and their respective tax bases. Deferred tax assets and liabilities are measured using enacted tax rates that are expected to apply to taxable income in years in which those temporary differences are expected to be recovered or settled. The Company assesses the deferred tax assets and establishes a valuation allowance when realization of a deferred asset is not considered to be “more likely than not.” The Company considers its expectation of future taxable income in evaluating the need for a valuation allowance.
 
85
 

Table of Contents
The Company estimates income taxes payable based on the amount it expects to owe the various tax authorities (i.e., federal, state, and local). Income taxes represent the net estimated amount due to, or to be received from, such tax authorities. In estimating income taxes, management assesses the relative merits and risks of the appropriate tax treatment of transactions, taking into account statutory, judicial, and regulatory guidance in the context of the Company’s tax position. In this process, management also relies on tax opinions, recent audits, and historical experience. Although the Company uses the best available information to record income taxes, underlying estimates and assumptions can change over time as a result of unanticipated events or circumstances such as changes in
 
tax laws and judicial guidance influencing its overall tax position.
 
Derivative Instruments and Hedging Activities
The
Company records all derivatives on the balance sheet at fair value. The accounting for changes in the fair value of derivatives depends on the intended use of the derivative, whether the Company has elected to designate a derivative in a hedging relationship and apply hedge accounting and whether the hedging relationship has satisfied the criteria necessary to apply hedge accounting. Derivatives designated and qualifying as a hedge of the exposure to changes in the fair value of an asset, liability, or firm commitment attributable to a particular risk, such as interest rate risk, are considered fair value hedges. Derivatives designated and qualifying as a hedge of the exposure to variability in expected future cash flows, or other types of forecasted transactions, are considered cash flow hedges. Hedge accounting generally provides for the matching of the timing of gain or loss recognition on the hedging instrument with the recognition of the changes in the fair value of the hedged asset or liability that are attributable to the hedged risk in a fair value hedge or the earnings effect of the hedged forecasted transactions in a cash flow hedge. The Company may enter into derivative contracts that are intended to economically hedge certain of its risks, even though hedge accounting does not apply or the Company elects not to apply hedge accounting.
Stock-Based Compensation
Under the New York Community Bancorp, Inc. 2012 Stock Incentive Plan (the “2012 Stock Incentive Plan”), which was approved by the Company’s shareholders at its Annual Meeting on June 7, 2012, shares are available for grant as restricted stock or other forms of related rights. At December 31, 2019, the Company had 2,507,490 shares available for grant under the 2012 Stock Incentive Plan. Compensation cost related to restricted stock grants is recognized on a straight-line basis over the vesting period. For a more detailed discussion of the Company’s stock-based compensation, see Note 15, “Stock-Related Benefit Plans.”
Retirement Plans
The Company’s pension benefit obligations and post-retirement health and welfare benefit obligations, and the related costs, are calculated using actuarial concepts in accordance with GAAP. The measurement of such obligations and expenses requires that certain assumptions be made regarding several factors, most notably including the discount rate and the expected rate of return on plan assets. The Company evaluates these assumptions on an annual basis. Other factors considered by the Company in its evaluation include retirement patterns, mortality rates, turnover, and the rate of compensation increase.
Under GAAP, actuarial gains and losses, prior service costs or credits, and any remaining transition assets or obligations that have not been recognized under previous accounting standards must be recognized in AOCL until they are amortized as a component of net periodic benefit cost.
Earnings per Common Share (Basic and Diluted)
Basic EPS is computed by dividing the net income available to common shareholders by the weighted average number of common shares outstanding during the period. Diluted EPS is computed using the same method as basic EPS, however, the computation reflects the potential dilution that would occur if outstanding
in-the-money
stock options were exercised and converted into common stock.
Unvested stock-based compensation awards containing
non-forfeitable
rights to dividends paid on the Company’s common stock are considered participating securities, and therefore are included in the
two-class
method for calculating EPS. Under the
two-class
method, all earnings (distributed and undistributed) are allocated to common shares and participating securities based on their respective rights to receive dividends on the common stock. The Company grants restricted stock to certain employees under its stock-based compensation plan. Recipients receive cash dividends during the vesting periods of these awards, including on the unvested portion of such awards. Since these dividends are
non-forfeitable,
the unvested awards are considered participating securities and therefore have earnings allocated to them.
 
86
 

Table of Contents
The following table presents the Company’s computation of basic and diluted earnings per common share for the years ended December 31, 2019, 2018, and 2017:
 
Years Ended December 31,
 
(in thousands, except share and per share amounts)
 
2019
   
2018
   
2017
 
Net income available to common shareholders
   
$
362,215
     
$
389,589
     
$
441,580
 
Less: Dividends paid on and earnings allocated to participating securities
   
(4,333
)    
(4,871
)    
(3,554
)
                         
Earnings applicable to common stock
   
$
357,882
     
$
384,718
     
$
438,026
 
                         
Weighted average common shares outstanding
   
465,380,010
     
487,287,872
     
487,073,951
 
                         
Basic earnings per common share
   
$
0.77
     
$
0.79
     
$
0.90
 
                         
Earnings applicable to common stock
   
$
357,882
     
$
384,718
     
$
438,026
 
                         
Weighted average common shares outstanding
   
465,380,010
     
487,287,872
     
487,073,951
 
Potential dilutive common shares
   
283,322
     
—  
     
—  
 
                         
Total shares for diluted earnings per common share computation
   
465,663,332
     
487,287,872
     
487,073,951
 
                         
Diluted earnings per common share and common share equivalent
s
   
$
0.77
     
$
0.79
     
$
0.90
 
                         
Impact of Recent Accounting Pronouncements
Recently Adopted Accounting Standards
The Company adopted ASU No.
 2018-16,
Derivatives and Hedging (Topic 815)—Inclusion of the Secured Overnight Financing Rate (SOFR) Overnight Index Swap (OIS) Rate as a Benchmark Interest Rate for Hedge Accounting Purposes, effective on its issuance date of October 25, 2018. The purpose of ASU
 No.
2018-16
is to permit the use of the OIS rate based on SOFR as a U.S. benchmark interest rate for hedge accounting purposes under Topic 815. The amendments in ASU
 No.
2018-16
are required to be applied prospectively for qualifying new or redesignated hedging relationships entered into on or after the date of adoption. The adoption of ASU No.
 2018-16
did not have a material impact on the Company’s Consolidated Statements of Condition, results of operations, or cash flows.
The Company adopted ASU No.
 2018-15,
Intangibles – Goodwill and Other – Internal Use Software (Subtopic
350-40):
Customer’s Accounting for Implementation Costs Incurred in a Cloud Computing Arrangement that is a Service Contract as of January 1, 2019. ASU
 No.
2018-15
aligns the requirements for capitalizing implementation costs incurred in a hosting arrangement that is a service contract with the requirements for capitalizing implementation costs incurred to develop or obtain
internal-use
software (and hosting arrangements that include an
internal-use
software license). The accounting for the service element of a hosting arrangement that is a service contract is not affected by the amendment. The adoption of ASU
 No.
2018-15
did not have a material effect on the Company’s Consolidated Statements of Condition, results of operations, or cash flows.
The Company adopted ASU No.
 2017-08,
Receivables—Nonrefundable Fees and Other Costs (Subtopic
310-20):
Premium Amortization on Purchased Callable Debt Securities as of January 1, 2019. ASU No.
 2017-08
specifies that the premium amortization period ends at the earliest call date, rather than the contractual maturity date, for purchased non-contingently callable debt securities. Shortening the amortization period is generally expected to more closely align the interest income recognition with the expectations incorporated in the market pricing of the underlying securities. The adoption of ASU No.
 2017-08
on January 1, 2019 did not have a material effect on the Company’s Consolidated Statements of Condition, results of operations, or cash flows.
The Company adopted ASU No.
 2016-02,
Leases (Topic 842), and its subsequent amendments to the ASU as of January 1, 2019, using the modified retrospective approach and utilizing the effective date as its date of initial application, for which prior periods are presented in accordance with the previous guidance in ASC 840, Leases. Topic 842 was intended to improve financial reporting about leasing transactions and the key provision impacting the Company was the requirement for a lessee to record a
right-of-use
asset and a liability, which represents the obligation to make lease payments for long-term operating leases. Additionally, ASU
 No.
2016-02
includes quantitative and qualitative disclosures required by lessees and lessors to help financial statement users better understand the amount, timing, and uncertainty of cash flows arising from leases. Topic 842 includes a number of optional practical expedients that entities
 
may elect to apply. The Company adopted the practical expedients of: not reevaluating whether or not a contract contains a lease; retaining current lease classification; not reassessing initial direct costs for existing leases; and not reassessing existing land easements that were not previously accounted for as leases under current lease accounting rules. Accordingly, previously reported financial statements, including footnote disclosures, have not been recast to reflect the application of ASU
 
N
o.
2016-02
to all comparative periods presented. The adoption of ASU
 
N
o.
2016-02,
as reflected in Note 7, did not have a material impact on the Company’s Consolidated Statements of Condition, results of operations, or cash flows.
 
87
 

Table of Contents
NOTE 3: RECLASSIFICATIONS OUT OF ACCUMULATED OTHER COMPREHENSIVE LOSS
(in thousands)
 
For the Twelve
 
Months Ended December 31, 2019
Details about
Accumulated Other Comprehensive Loss
 
Amount
Reclassified out
of Accumulated
Other
Comprehensive
Loss
(1)
   
Affected Line Item in the
Consolidated Statements of Income
and Comprehensive Income
 
Unrealized gains on
available-for-sale
securities
:
  $
5,445
   
 
Net
 
gain on securities


(1,527
)
 
 
Income tax
expense


$
3,918


Net gain on securities, net of tax
 
Unrealized gains on cash flow
 
hedges
:
 
$
154
   
 
Interest expense
   
(43
 
 
Income tax benefit


  $
111
   
 
Net gain on
cash flow hedges
, net of tax


Amortization of defined benefit pension plan items:


Past service liabilit
y
  $
249
   
 
Included in the computation of net periodic credit
 
(2)
Actuarial losse
s
   
(10,160
 
 
Included in the computation of net periodic c
os
t
 
(2)


(9,911
 
 
Total before tax
   
2,726
   
 
Income tax benefit


  $
(7,185
 
 
Amortization of
 
defined benefit pension plan items, net of tax


Total reclassifications for the period
  $
(3,156


(1)
Amounts in parentheses indicate expense items.
(2)
See Note 14, “Employee Benefits,” for additional information.
 
88
 

Table of Contents
NOTE 4: SECURITIES
The following tables summarize the Company’s portfolio of debt securities available for sale and equity investments with readily determinable fair values at December 31, 2019 and 2018:
 
December 31, 2019
 
(in thousands)
 
Amortized
Cost
   
Gross
Unrealized
Gain
   
Gross
Unrealized
Loss
   
Fair Value
 
Debt securities
available-for-sale


Mortgage-Related Debt Securities:


GSE certificates
  $
1,530,317
    $
26,069
    $
3,763
    $
1,552,623
 
GSE CMOs
   
1,783,440
     
21,213
     
3,541
     
1,801,112
 
                                 
Total mortgage-related debt securities
  $
3,313,757
    $
47,282
    $
7,304
    $
3,353,735
 
                                 
Other Debt Securities:


U. S. Treasury obligations
 
$
41,820
   
$
19
   
$
   
$
41,839
 
GSE debentures
   
1,093,845
     
5,707
     
5,312
     
1,094,240
 
Asset-backed securities
(1)
   
384,108


10,854
     
373,254
 
Municipal bonds
   
26,808
     
559
     
475
     
26,892
 
Corporate bonds
   
854,195
     
15,970
     
2,983
     
867,182
 
Capital trust notes
   
95,100
     
7,121
     
6,306
     
95,915
 
                                 
Total other debt securities
  $
2,495,876
    $
29,376
    $
25,930
    $
2,499,322
 
                                 
Total other securities available for sale
(2)
  $
5,809,633
    $
76,658
    $
33,234
    $
5,853,057
 
                                 
Equity securities:


Preferred stock
   
15,292
     
122
     
     
15,414
 
Mutual funds and common stock
(3)
   
16,871
     
718
     
173
     
17,416
 
                                 
Total equity securities
  $
32,163
    $
840
    $
173
    $
32,830
 
                                 
Total securities
  $
5,841,796
    $
77,498
    $
33,407
    $
5,885,887
 
                                 
(1)
The underlying assets of the asset-backed securities are substantially guaranteed by the U.S. Government.
(2)
The amortized cost includes the non-credit portion of OTTI recorded in AOCL. At December 31, 2019, the non-credit portion of OTTI recorded in AOCL was $8.6 million before taxes.
(3)
Primarily consists of mutual funds that are CRA-qualified investments.
 
 
December 31, 2018
 
(in thousands)
 
Amortized
Cost
   
Gross
Unrealized
Gain
   
Gross
Unrealized
Loss
   
Fair Value
 
Debt securities
available-for-sale


Mortgage-Related Debt Securities:


GSE certificates
  $
1,705,336
    $
18,146
    $
15,961
    $
1,707,521
 
GSE CMOs
   
1,248,621
     
8,380
     
4,240
     
1,252,761
 
                                 
Total mortgage-related debt securities
  $
2,953,957
    $
26,526
    $
20,201
    $
2,960,282
 
                                 
Other Debt Securities:


GSE debentures
  $
1,334,549
    $
3,366
    $
8,988
    $
1,328,927
 
Asset-backed securities
(1)
   
386,768
     
784
     
430
     
387,122
 
Municipal bonds
   
68,551
     
195
     
2,563
     
66,183
 
Corporate bonds
   
836,153
     
8,667
     
23,105
     
821,715
 
Capital trust notes
   
48,278
     
6,435
     
5,422
     
49,291
 
                                 
Total other debt securities
  $
2,674,299
    $
19,447
    $
40,508
    $
2,653,238
 
                                 
Total other securities available for sale
(2)
  $
5,628,256
    $
45,973
    $
60,709
    $
5,613,520
 
                                 
Equity securities:


Preferred stock
   
15,292
     
—  
     
1,446
     
13,846
 
Mutual funds and common stock
(3)
   
16,870
     
366
     
531
     
16,705
 
                                 
Total equity securities
  $
32,162
    $
366
    $
1,977
    $
30,551
 
                                 
Total securities
  $
5,660,418
    $
46,339
    $
62,686
    $
5,644,071
 
                                 
(1)
The underlying assets of the asset-backed securities are substantially guaranteed by the U.S. Government.
(2)
The amortized cost includes the non-credit portion of OTTI recorded in AOCL. At December 31, 2018, the non-credit portion of OTTI recorded in AOCL was $
8.6
 million before taxes.
(3)
Primarily consists of mutual funds that are CRA-qualified investments.
 
89
 

Table of Contents
At December 31, 2019 and 2018, respectively, the Company had $647.6 million and $644.6 million of
FHLB-NY
stock, at cost. The Company maintains an investment in
FHLB-NY
stock partly in conjunction with its membership in the FHLB and partly related to its access to the FHLB funding it utilizes.
The following table summarizes the gross proceeds, gross realized gains, and gross realized losses from the sale of
available-for-sale
securities during the years ended December 31, 2019, 2018, and 2017:
 
December 31,
 
(in thousands)
 
2019
   
2018
   
2017
 
Gross proceeds
 
$
361,311
    $
278,539
    $
453,878
 
Gross realized gains
   
5,445
     
967
     
3,848
 
Gross realized losses
   
     
981
     
860
 
Net unrealized gains on equity securities recognized in earnings for the year ended December 31, 2019 were $2.3 million. Net unrealized losses on equity securities recognized in earnings for the year ended December 31, 2018 were $2.0 million.
In addition,
during the twelve months ended December 31, 2017, the Company sought to take advantage of favorable bond market conditions and sold
held-to-maturity
securities with an amortized cost of $521.0 million resulting in gross proceeds of $547.9 million including a gross realized gain of $26.9 million. Accordingly, the Company transferred the remaining $3.0 billion of
held-to-maturity
securities to
available-for-sale
with a net unrealized gain of $82.8 million classified in other comprehensive loss in the Consolidated Statements of Condition. Having the securities portfolio classified as
available-for-sale
improves the Company’s liquidity measures.
In the following table, the beginning balance represents the credit loss component for debt securities on which OTTI occurred prior to January 1, 2019. For credit-impaired debt securities, OTTI recognized in earnings after that date is presented as an addition in two components, based upon whether the current period is the first time a debt security was credit-impaired (initial credit impairment) or is not the first time a debt security was credit-impaired (subsequent credit impairment).
(in thousands)
 
For the
Twelve Months Ended
December 31, 2019
 
Beginning credit loss amount as of December 31, 2018
  $
196,187
 
Add: Initial other-than-temporary credit losses
   
 
Subsequent other-than-temporary credit losses
   
 
Amount previously recognized in AOCL
   
 
Less: Realized losses for securities sold
   
 
Securities intended or required to be sold
   
 
Increase in cash flows on debt securities
   
55
 
         
Ending credit loss amount as of December 31, 2019
 
$
196,132


90
 

Table of Contents
The following table summarizes, by contractual maturity, the amortized cost of securities at December 31, 2019:
                                                                         
(dollars in thousands)
 
Mortgage-
Related
Securities
   
Average
Yield
   
U.S.
Government
and GSE
Obligations
   
Average
Yield
   
State, County,
and Municipal
   
Average
Yield
(1)
   
Other Debt
Securities
(2)
   
Average
Yield
   
Fair Value
 
Available-for-Sale
Debt Securities:


Due within one year
  $
60,091
     
3.26
%   $
41,820
     
1.77
%   $
148
     
6.66
%   $
13,982
     
3.79
%   $
116,450
 
Due from one to five years
   
497,541
     
3.37
     
32,874
     
3.48


179,566
     
3.28
     
727,437
 
Due from five to ten years
   
330,095
     
3.22
     
939,971
     
3.01
     
20,773
     
3.49
     
749,871
     
3.22
     
2,061,599
 
Due after ten years
   
2,426,030
     
2.85
     
121,000
     
2.83
     
5,887
     
3.33
     
389,984
     
2.67
     
2,947,571
 
                                                                         
Total debt securities available for sale
  $
3,313,757
     
2.97
    $
1,135,665
     
2.96
    $
26,808
     
3.47
    $
1,333,403
     
3.07
    $
5,853,057


(1)
Not presented on a tax-equivalent basis.


(2)
Includes corporate bonds, capital trust notes, and asset-backed securities.


The following table presents securities having a
 
continuous
 
unrealized loss position for less than twelve months and for twelve months or longer as of December 31, 2019:
                                                 
 
Less than Twelve Months
   
Twelve Months or Longer
   
Total
 
(in thousands)
 
Fair Value
   
Unrealized Loss
   
Fair Value
   
Unrealized Loss
   
Fair Value
   
Unrealized Loss
 
Temporarily Impaired Securities
:


U. S. 
Treasur
y
 
obligations
  $
11,917
    $
    $
    $
    $
11,917
    $
 
GSE
debentures


297,179


3,916


138,189


1,396


435,368
   
 
5,312
 
GSE certificates
   
396,930
     
3,718
     
7,542
     
45
     
404,472
     
3,763
 
GSE CMOs
   
609,502
     
2,582
     
133,955
     
959
     
743,457
     
3,541
 
Asset-backed securities
   
256,619
     
7,701
     
116,635
     
3,154
     
373,254
     
10,855
 
Municipal bonds


9,349
     
475
     
9,349
     
475
 
Corporate bonds
   
99,300
     
700
     
172,717
     
2,282
     
272,017
     
2,982
 
Capital trust notes


37,525
     
6,306
     
37,525
     
6,306
 
Equity securities


11,633
     
173
     
11,633
     
173
 
                                                 
Total temporarily impaired securities
  $
1,671,447
    $
18,617
    $
627,545
    $
14,790
    $
2,298,992
    $
33,407


91
 

Table of Contents
The following table presents securities having a continuous unrealized loss position for less than twelve months and for twelve months or longer as of December 31, 2018:
                                                 
 
Less than Twelve Months
   
Twelve Months or Longer
   
Total
 
(in thousands)
 
Fair Value
   
Unrealized Loss
   
Fair Value
   
Unrealized Loss
   
Fair Value
   
Unrealized Loss
 
Temporarily Impaired Securities:


GSE debentures
  $
276,113
    $
2,629
    $
329,372
    $
6,359
    $
605,485
    $
8,988
 
GSE certificates
   
576,970
     
10,598
     
232,969
     
5,363
     
809,939
     
15,961
 
GSE CMOs
   
465,779
     
1,892
     
99,050
     
2,348
     
564,829
     
4,240
 
Asset-backed securities
   
69,166
     
430
     
—  
     
—  
     
69,166
     
430
 
Municipal bonds
   
5,876
     
21
     
48,837
     
2,542
     
54,713
     
2,563
 
Corporate bonds
   
642,843
     
23,105
     
—  
     
—  
     
642,843
     
23,105
 
Capital trust notes
   
—  
     
—  
     
38,360
     
5,422
     
38,360
     
5,422
 
Equity securities
   
17,836
     
1,464
     
11,293
     
513
     
29,129
     
1,977
 
                                                 
Total temporarily impaired securities
  $
2,054,583
    $
40,139
    $
759,881
    $
22,547
    $
2,814,464
    $
62,686


92
 

Table of Contents
An OTTI loss on impaired debt securities must be fully recognized in earnings if an investor has the intent to sell the debt security, or if it is more likely than not that the investor will be required to sell the debt security before recovery of its amortized cost. However, even if an investor does not expect to sell a debt security, it must evaluate the expected cash flows to be received and determine if a credit loss has occurred. In the event that a credit loss occurs, only the amount of impairment associated with the credit loss is recognized in earnings. Amounts of impairment relating to factors other than credit losses are recorded in AOCL.
At December 31, 2019, the Company had unrealized losses on certain available for sale GSE obligations, municipal bonds, corporate bonds, asset-backed securities, capital trust notes, and equity investments with readily determinable fair values. The unrealized losses on the Company’s GSE obligations, municipal bonds, corporate bonds, asset-backed securities and capital trust notes at December 31, 2019 were primarily caused by movements in market interest rates and spread volatility, rather than credit risk. These securities are not expected to be settled at a price that is less than the amortized cost of the Company’s investment.
The Company reviews quarterly financial information related to its investments in capital trust notes, as well as other information that is released by each of the issuers of such notes, to determine their continued creditworthiness. The Company continues to monitor these investments and currently estimates that the present value of expected cash flows is not less than the amortized cost of the securities. It is possible that these securities will perform worse than is currently expected, which could lead to adverse changes in cash flows from these securities and potential OTTI losses in the future. Future events that could trigger material unrecoverable declines in the fair values of the Company’s investments, and thus result in potential OTTI losses, include, but are not limited to, government intervention; deteriorating asset quality and credit metrics; significantly higher levels of default and loan loss provisions; losses in value on the underlying collateral; net operating losses; and illiquidity in the financial markets.
The unrealized losses on the Company’s equity investments with readily determinable fair values at December 31, 2019 were caused by market volatility. Equity investments with readily determinable fair values are measured at fair value with changes in fair value recognized in net income, thus eliminating eligibility for the
available-for-sale
category. Events that could trigger a material decline in the fair value of these securities include, but are not limited to, deterioration in the equity markets; a decline in the quality of the loan portfolio of the issuer in which the Company has invested; and the recording of higher loan loss provisions and net operating losses by such issuer.
The investment securities designated as having a continuous loss position for twelve months or more at December 31, 2019 consisted of seven US Government agency securities, five capital trusts notes, three agency mortgage-related securities, three agency
 
CMO
s
,
three asset backed
sec
urities, two corporate bonds,
one municipal bond, and one mutual fund. At December 31, 2018 securities designated as having a continuous loss position for twelve months or more consisted of nine agency mortgage-related securities, nine US Government agency securities, seven agency
C
MO
s
, five capital trusts notes, three municipal bonds, and one mutual fund.
At December 31, 2019, the fair value of securities having a continuous loss position for twelve months or more was 2.3% below the collective amortized cost of $642.3 million. At December 31, 2018, the fair value of such securities was 2.9% below the collective amortized cost of $782.4 million. At December 
31
, 2019 and
2018
, the combined market value of the respective securities represented unrealized losses of $14.8 million and $22.5 million, respectively.
 
9
3
 

Table of Contents
NOTE 5: LOANS AND LEASE
S
The following table sets forth the composition of the loan and lease portfolio at the dates indicated:
 
 
December 31, 2019
   
December 31, 2018
 
(dollars in thousands)
 
Amount
   
Percent of
Loans Held for
Investment
   
Amount
   
Percent of
Loans Held
 
for
Investment
 
Loans and Leases Held for Investment:


Mortgage Loans:


Multi-family
 
$
31,158,672
     
74.46
%   $
29,883,919
     
74.46
%
Commercial real estate
   
7,081,910
     
16.93
     
6,998,834
     
17.44
 
One-to-four
family
   
380,361
     
0.91
     
446,094
     
1.11
 
Acquisition, development, and construction
   
200,596
     
0.48
     
407,870
     
1.02
 
                                 
Total mortgage loans held for investment
   
38,821,539
     
92.78
     
37,736,717
     
94.03
 
                                 
Other Loans:


Commercial and industrial
   
1,742,380
     
4.16
     
1,705,308
     
4.25
 
Lease financing, net of unearned income of $104,826 and $53,891, respectively
   
1,271,998
     
3.04
     
683,112
     
1.70
 
                                 
Total commercial and industrial loans
(1)
   
3,014,378
     
7.20
     
2,388,420
     
5.95
 
Other
   
8,102
     
0.02
     
8,724
     
0.02
 
                                 
Total other loans held for investment
   
3,022,480
     
7.22
     
2,397,144
     
5.97
 
                                 
Total loans and leases held for investment
 
$
41,844,019
     
100.00
%   $
40,133,861
     
100.00
%
                                 
Net deferred loan origination costs
   
50,136
     
     
32,047
     
 
Allowance for
loan
losses
   
(147,638
   
     
(159,820
)    
 
                                 
Total loans and leases, net
 
$
41,746,517
     
    $
40,006,088


(1)
Includes specialty finance loans and leases of $2.6 billion and $1.9 billion, respectively, at December 
31
, 2019 and 2018. Other C&I loans of $420.1 million and $469.9 million, respectively, at December 
31
, 2019 and 2018.
Loans and Leases
Loans and Leases Held for Investment
The majority of the loans the Company originates for investment are multi-family loans, most of which are collateralized by
non-luxury
apartment buildings in New York City with rent-regulated units and below-market rents. In addition, the Company originates CRE loans, most of which are collateralized by income-producing properties such as office buildings, retail centers,
mixed-use
buildings, and multi-tenanted light industrial properties that are located in New York City and on Long Island.
To a lesser extent, the Company also originates ADC loans for investment.
One-to-four
family loans held for investment were originated through the Company’s former mortgage banking operation and primarily consisted of jumbo prime adjustable rate mortgages made to borrowers with a solid credit history.
ADC loans are primarily originated for multi-family and residential tract projects in New York City and on Long Island. C&I loans consist of asset-based loans, equipment loans and leases, and dealer floor-plan loans (together, specialty finance loans and leases) that generally are made to large corporate obligors, many of which are publicly traded, carry investment grade or near-investment grade ratings, and participate in stable industries nationwide; and other C&I loans that primarily are made to small and
mid-size
businesses in Metro New York. Other C&I loans are typically made for working capital, business expansion, and the purchase of machinery and equipment.
The repayment of multi-family and CRE loans generally depends on the income produced by the underlying properties which, in turn, depends on their successful operation and management. To mitigate the potential for credit losses, the Company underwrites its loans in accordance with credit standards it considers to be prudent, looking first at the consistency of the cash flows being produced by the underlying property. In addition, multi-family buildings, CRE properties, and ADC projects are inspected as a prerequisite to approval, and independent appraisers, whose appraisals are carefully reviewed by the Company’s
in-house
appraisers, perform appraisals on the collateral properties. In many cases, a second independent appraisal review is
performed.
To further manage its credit risk, the Company’s lending policies limit the amount of credit granted to any one borrower and typically require conservative debt service coverage ratios and
loan-to-value
ratios. Nonetheless, the ability of the Company’s borrowers to repay these loans may be impacted by adverse conditions in the local real estate market, the local economy and changes in applicable laws and regulations. Accordingly, there can be no assurance that its underwriting policies will protect the Company from credit-related losses or delinquencies
.
 
94
 

Table of Contents
ADC loans typically involve a higher degree of credit risk than loans secured by improved or owner-occupied real estate. Accordingly, borrowers are required to provide a guarantee of repayment and completion, and loan proceeds are disbursed as construction progresses, as certified by
in-house
inspectors or third-party engineers. The Company seeks to minimize the credit risk on ADC loans by maintaining conservative lending policies and rigorous underwriting standards. However, if the estimate of value proves to be inaccurate, the cost of completion is greater than expected, or the length of time to complete and/or sell or lease the collateral property is greater than anticipated, the property could have a value upon completion that is insufficient to assure full repayment of the loan. This could have a material adverse effect on the quality of the ADC loan portfolio, and could result in losses or delinquencies. In addition, the Company utilizes the same stringent appraisal process for ADC loans as it does for its multi-family and CRE loans.
To minimize the risk involved in specialty finance lending and leasing, the Company participates in syndicated loans that are brought to it, and equipment loans and leases that are assigned to it, by a select group of nationally recognized sources who have had long-term relationships with its experienced lending officers. Each of these credits is secured with a perfected first security interest or outright ownership in the underlying collateral, and structured as senior debt or as a
non-cancelable
lease. To further minimize the risk involved in specialty finance lending and leasing, each transaction is
re-underwritten.
In addition, outside counsel is retained to conduct a further review of the underlying documentation.
To minimize the risks involved in other C&I lending, the Company underwrites such loans on the basis of the cash flows produced by the business; requires that such loans be collateralized by various business assets, including inventory, equipment, and accounts receivable, among others; and typically requires personal guarantees. However, the capacity of a borrower to repay such a C&I loan is substantially dependent on the degree to which the business is successful. In addition, the collateral underlying such loans may depreciate over time, may not be conducive to appraisal, or may fluctuate in value, based upon the results of operations of the business.
Included in loans held for investment at
December
 3
1
, 2019 were loans of $38.2 million to officers, directors, and their related interests and parties. There were no loans to principal shareholders at that date.
Asset Quality
The following table presents information regarding the quality of the Company’s loans held for investment at December 31, 2019:
(in thousands)
 
Loans
30-89
 Days
Past Due
   
Non-

Accrual
Loans
   
Loans
90 Days or More
Delinquent and
Still Accruing
Interest
   
Total
Past Due
Loans
   
Current
Loans
   
Total Loans
Receivable
 
Multi-family
 
$
1,131
   
$
5,407
   
$
   
$
6,538
   
$
31,152,134
   
$
31,158,672
 
Commercial real estate
   
2,545
     
14,830
     
     
17,375
     
7,064,535
     
7,081,910
 
One-to-four
family
   
     
1,730
     
     
1,730
     
378,631
     
380,361
 
Acquisition, development, and construction


200,596
     
200,596
 
Commercial and industrial
(1) (2)
   
     
39,024
     
     
39,024
     
2,975,354
     
3,014,378
 
Other
   
44
     
252
     
     
296
     
7,806
     
8,102
 
                                                 
Total
 
$
3,720
   
$
61,243
   
$
   
$
64,963
   
$
41,779,056
   
$
41,844,019
 
                                                 
(1)
Includes $30.4 million of taxi medallion-related loans that were 90 days or more past due
. There wer
e
 
no taxi medallion
-related
loans that were 30 to 89 days past due.
(2)
Includes lease financing receivables, all of which were current.
 
95
 

Table of Contents
The following table presents information regarding the quality of the Company’s loans held for investment at December 31, 2018:
(in thousands)
 
Loans
30-89
 Days
Past Due
   
Non-

Accrual
Loans
   
Loans
90 Days or More
Delinquent and
Still Accruing
Interest
   
Total
Past Due
Loans
   
Current
Loans
   
Total Loans
Receivable
 
Multi-family
  $
 —  
    $
4,220
    $
—  
    $
4,220
    $
29,879,699
    $
29,883,919
 
Commercial real estate
   
—  
     
3,021
     
—  
     
3,021
     
6,995,813
     
6,998,834
 
One-to-four
family
   
9
     
1,651
     
—  
     
1,660
     
444,434
     
446,094
 
Acquisition, development, and construction
   
—  
     
—  
     
—  
     
—  
     
407,870
     
407,870
 
Commercial and industrial
(1) (2)
   
530
     
36,608
     
—  
     
37,138
     
2,351,282
     
2,388,420
 
Other
   
25
     
6
     
—  
     
31
     
8,693
     
8,724
 
                                                 
Total
  $
564
    $
45,506
    $
—  
    $
46,070
    $
40,087,791
    $
40,133,861
 
                                                 
(1)
Includes $530,000 and $35.5 million of taxi medallion-related loans that were 30 to 89 days past due and 90 days or more past due, respectively.
(2)
Includes lease financing receivables, all of which were current.
The following table summarizes the Company’s portfolio of loans held for investment by credit quality indicator at December 31, 2019:
 
Mortgage Loans
   
Other Loans
 
(in thousands)
 
Multi-Family
   
Commercial
Real Estate
   
One-to-Four

Family
   
Acquisition,
Development,
and
Construction
   
Total
 
Mortgage
Loans
   
Commercial
and
Industrial
(1)
   
Other
   
Total Other
Loans
 
Credit Quality Indicator:


Pass
 
$
30,903,657
   
$
6,902,218
   
$
377,883
   
$
158,751
   
$
38,342,509
   
$
2,960,557
   
$
7,850
   
$
2,968,407
 
Special mention
   
239,664
     
104,648
     
748
     
41,456
     
386,516
     
1,588
     
     
1,588
 
Substandard
   
15,351
     
75,044
     
1,730
     
389
     
92,514
     
52,233
     
252
     
52,485
 
Doubtful


Total
 
$
31,158,672
   
$
7,081,910
   
$
380,361
   
$
200,596
   
$
38,821,539
   
$
3,014,378
   
$
8,102
   
$
3,022,480
 
                                                                 
(1)
Includes lease financing receivables, all of which were classified as Pass.
The following table summarizes the Company’s portfolio of loans held for investment by credit quality indicator at December 31, 2018:
 
Mortgage Loans
   
Other Loans
 
(in thousands)
 
Multi-Family
   
Commercial
Real Estate
   
One-to-Four

Family
   
Acquisition,
Development,
and
Construction
   
Total
 
Mortgage
Loans
   
Commercial
and
Industrial
(1)
   
Other
   
Total Other
Loans
 
Credit Quality Indicator:


Pass
  $
29,548,242
    $
6,880,105
    $
444,443
    $
319,001
    $
37,191,791
    $
2,306,563
    $
8,469
    $
2,315,032
 
Special mention
   
312,025
     
90,653
     
—  
     
73,964
     
476,642
     
19,751
     
—  
     
19,751
 
Substandard
   
23,652
     
28,076
     
1,651
     
14,905
     
68,284
     
62,106
     
255
     
62,361
 
Doubtful
   
—  
     
—  
     
—  
     
—  
     
—  
     
—  
     
—  
     
—  
 
                                                                 
Total
  $
29,883,919
    $
6,998,834
    $
446,094
    $
407,870
    $
37,736,717
    $
2,388,420
    $
8,724
    $
2,397,144
 
                                                                 
(1)
Includes lease financing receivables, all of which were classified as Pass.
The preceding classifications are the most current ones available and generally have been updated within the last twelve months. In addition, they follow regulatory guidelines and can generally be described as follows: pass loans are of satisfactory quality; special mention loans have potential weaknesses that deserve management’s close attention; substandard loans are inadequately protected by the current net worth and paying capacity of the borrower or of the collateral pledged (these loans have a well-defined weakness and there is a possibility that the Company will sustain some loss); and doubtful loans, based on existing circumstances, have weaknesses that make collection or liquidation in full highly questionable and improbable. In addition,
one-to-four
family loans are classified based on the duration of the
delinquency.
At December 31, 2019 and 2018, the Company had no residential mortgage loans in the process of foreclosure
.
 
9
6
 

Table of Contents
The interest income that would have been recorded under the original terms of
non-accrual
loans at the respective year-ends, and the interest income actually recorded on these loans in the respective years, is summarized below:
 
December 31,
 
(in thousands)
 
2019
   
2018
   
2017
 
Interest income that would have been recorded
 
$
5,599
    $
4,145
    $
4,974
 
Interest income actually recorded
   
(3,409
)    
(3,480
)    
(2,904
)
                         
Interest income foregone
 
$
2,190
    $
665
    $
2,070
 
                         
Troubled Debt Restructurings
The Company is required to account for certain loan modifications and restructurings as TDRs. In general, a modification or restructuring of a loan constitutes a TDR if the Company grants a concession to a borrower experiencing financial difficulty. A loan modified as a TDR generally is placed on
non-accrual
status until the Company determines that future collection of principal and interest is reasonably assured, which requires, among other things, that the borrower demonstrate performance according to the restructured terms for a period of at least six consecutive months.
In an effort to proactively manage delinquent loans, the Company has selectively extended to certain borrowers concessions such as rate reductions, extension of maturity dates, and forbearance agreements. As of
December
 
31
, 2019, loans on which concessions were made with respect to rate reductions and/or extension of maturity dates amounted to $32.7 million; loans on which forbearance agreements were reached amounted to $7.8 million.
The following table presents information regarding the Company’s TDRs as of December 31, 2019 and 2018:
 
December 31, 2019
   
December 31, 2018
 
(in thousands)
 
Accruing
   
Non-Accrual
   
Total
   
Accruing
   
Non-Accrual
   
Total
 
Loan Category:


Multi-family
 
$
   
$
3,577
   
$
3,577
    $
  
    $
4,220
    $
4,220
 
Commercial real estate


One-to-four
family
   
     
584
     
584


1,022
     
1,022
 
Acquisition, development, and construction
   
389
     
     
389
     
8,297


8,297
 
Commercial and industrial
(1)
   
865
     
35,084
     
35,949
     
865
     
20,477
     
21,342
 
                                                 
Total
 
$
1,254
   
$
39,245
   
$
40,499
    $
9,162
    $
25,719
    $
34,881
 
                                                 
(1)
Includes $27.3 million and $20.4 million of taxi medallion-related loans at December 31, 2019 and 2018, respectively.
The eligibility of a borrower for
work-out
concessions of any nature depends upon the facts and circumstances of each loan, which may change from period to period, and involves judgment by Company personnel regarding the likelihood that the concession will result in the maximum recovery for the Company.
 
97
 

Table of Contents
The financial effects of the Company’s TDRs for the twelve months ended December 31, 2019, 2018 and 2017 are summarized as follows:
                                                                                                                                    
 
For the Twelve Months Ended December 31, 2019
 
(dollars in thousands)


Weighted Average
Interest Rate


Number 
of Loans
   
Pre-
Modification

Recorded
Investment
   
Post-
Modification

Recorded
Investment
   
Pre-
Modification
   
Post-
Modification
   
Charge-off

Amount
   
Capitalized
Interest
 
Loan Category:


One-to-four family
   
1
   
$
131
   
$
131
     
5.50
%
   
5.50
%
 
$
   
$
3
 
Commercial and industrial
   
72
     
35,156
     
30,685
     
4.31
     
4.37
     
4,471


Total
   
73
   
$
35,287
   
$
30,816


$
4,471
   
$
3


For the Twelve Months Ended December 31, 2018
 
(dollars in thousands)


Weighted Average
Interest Rate


Number
of
 
Loans
   
Pre-
Modification

Recorded
Investment
   
Post-
Modification

Recorded
Investment
   
Pre-
Modification
   
Post-
Modification
   
Charge-off

Amount
   
Capitalized
Interest
 
Loan Category:


Acquisition, development, and construction
   
1
    $
900
    $
900
     
4.50
%    
4.50
%   $
—  
    $
—  
 
Commercial and industrial
   
21
     
7,763
     
5,455
     
3.25
     
3.13
     
2,308
     
—  
 
                                                         
Total
   
22
    $
8,663
    $
6,355
     
     
    $
2,308
    $
—  


For the Twelve Months Ended December 31, 2017
 
(dollars in thousands
)


Weighted Average
Interest Rate


Number
of
 
Loans
   
Pre-
Modification

Recorded
Investment
   
Post-
Modification

Recorded
Investment
   
Pre-
Modification
   
Post-
Modification
   
Charge-off

Amount
   
Capitalized
Interest
 
Loan Category:


One-to-four
family
   
4
    $
810
    $
986
     
5.93
%    
2.21
%   $
—  
    $
12
 
Acquisition, development, and construction
   
2
     
8,652
     
8,652
     
5.50
     
5.50
     
—  
     
—  
 
Commercial and industrial
   
65
     
52,179
     
26,409
     
3.36
     
3.29
     
14,273
     
—  
 
                                                         
Total
   
71
    $
61,641
    $
36,047
     
     
    $
14,273
    $
12


At December 
31
, 2019, C&I and
one-to-four
family loans totaling $1.1 
million
that had been modified as a TDR during the twelve months ended at that date were in payment default. At December 31, 2018, one C&I loan in the amount of $194,000 that had been modified as a TDR during the twelve months ended at that date was in prepayment default.
The Company does not consider a payment to be in default when the loan is in forbearance, or otherwise granted a delay of payment, when the agreement to forebear or allow a delay of payment is part of a modification.
Subsequent to the modification, the loan is not considered to be in default until payment is contractually past due in accordance with the modified terms. However, the Company does consider a loan with multiple modifications or forbearance periods to be in default, and would also consider a loan to be in default if the borrower were in bankruptcy or if the loan were partially charged off subsequent to modification.
 
98
 

Table of Contents
NOTE 6: ALLOWANCE FOR LOAN LOSSES
The following tables provide additional information regarding the Company’s allowance
 
for loan losses based upon the method of evaluating loan impairment:
                         
(in thousands)
 
Mortgage
   
Other
   
Total
 
Allowance for Loan Losses at December 31, 2019:


Loans individually evaluated for impairment
 
 
$


$
116
 
 
$
116
 
Loans collectively evaluated for impairment
   
122,694
     
24,828
     
147,522
 
                         
Total
 
 
$
122,694
 
 
$
24,944
 
 
$
147,638
 
                   
(in thousands)
 
Mortgage
   
Other
   
Total
 
Allowance for Loan Losses at December 31, 2018:


Loans collectively evaluated for impairmen
t
  $
130,983
    $
28,837
    $
159,820


The following tables provide additional information regarding the methods used to evaluate the Company’s loan portfolio for impairment:
                         
(in thousands)
 
Mortgage
   
Other
   
Total
 
Loans Receivable at December 31, 2019:


Loans individually evaluated for impairment
  $
19,267
    $
39,114
    $
58,381
 
Loans collectively evaluated for impairment
   
38,802,272
     
2,983,366
     
41,785,638
 
                         
Total
  $
38,821,539
    $
3,022,480
    $
41,844,019


(in thousands)
 
Mortgage
   
Other
   
Total
 
Loans Receivable at December 31, 2018:


Loans individually evaluated for impairment
  $
15,794
    $
36,375
    $
52,169
 
Loans collectively evaluated for impairmen
t
   
37,720,923
     
2,360,769
     
40,081,692
 
                         
Total
  $
37,736,717
    $
2,397,144
    $
40,133,861


Allowance for Loan Losses
The following table summarizes activity in the allowance for loan losses for the periods indicated:
                                                 
 
For the Twelve Months Ended December 31,
 
 
2019
   
2018
 
(in thousands)
 
Mortgage
   
Other
   
Total
   
Mortgage
   
Other
   
Total
 
Balance, beginning of period
  $
130,983
    $
28,837
    $
159,820
    $
128,275
    $
29,771
    $
158,046
 
Charge-offs
   
(1,613
)    
(18,694
)    
(20,307
)    
(5,445
)    
(12,897
)    
(18,342
)
Recoveries
   
61
     
959
     
1,020
     
264
     
1,596
     
1,860
 
(Recovery of) provision for losses on loans
   
(6,737
)    
13,842
     
7,105
     
7,889
     
10,367
     
18,256
 
                                                 
Balance, end of period
 
$
122,694
   
$
24,944
   
$
147,638
    $
130,983
    $
28,837
    $
159,820


99
 

Table of Contents
The following table presents additional information about the Company’s impaired loans at December 31, 2019:
                                         
(in thousands)
 
Recorded
Investment
   
Unpaid
Principal
Balance
   
Related
Allowance
   
Average
Recorded
Investment
   
Interest
Income
Recognized
 
Impaired loans with no related allowance:


Multi-family
  $
3,577
    $
6,790
    $
    $
4,336
    $
266
 
Commercial real estate
   
14,717
     
19,832
     
     
6,140
     
371
 
One-to-four
family
   
584
     
602
     
     
811
     
21
 
Acquisition, development, and construction
   
389
     
1,289
     
     
3,508
     
364
 
Other
   
37,669
     
114,636
     
     
39,598
     
2,494
 
                                         
Total impaired loans with no related allowance
  $
56,936
    $
143,149
    $
    $
54,393
    $
3,516
 
                                         
Impaired loans with an allowance recorded:


Multi-family
  $
    $
    $
    $
    $
 
Commercial real estate


One-to-four
family


Acquisition, development, and construction


Other
   
1,445
     
4,173
     
116
     
4,111
     
13
 
                                         
Total impaired loans with an allowance recorded
  $
1,445
    $
4,173
    $
116
    $
4,111
    $
13
 
                                         
Total impaired loans:


Multi-family
  $
3,577
    $
6,790
    $
    $
4,336
    $
266
 
Commercial real estate
   
14,717
     
19,832
     
     
6,140
     
371
 
One-to-four
family
   
584
     
602
     
     
811
     
21
 
Acquisition, development, and construction
   
389
     
1,289
     
     
3,508
     
364
 
Other
   
39,114
     
118,809
     
116
     
43,709
     
2,507
 
                                         
Total impaired loans
  $
58,381
    $
147,322
    $
116
    $
58,504
    $
3,529


100
 

Table of Contents
The following table presents additional information about the Company’s impaired loans at December 31, 2018:
                                         
(in thousands)
 
Recorded
Investment
   
Unpaid
Principal
Balance
   
Related
Allowance
   
Average
Recorded
Investment
   
Interest
Income
Recognized
 
Impaired loans with no related allowance:


Multi-family
  $
4,220
    $
7,168
    $
—  
    $
6,114
    $
340
 
Commercial real estate
   
2,256
     
7,371
     
—  
     
3,234
     
—  
 
One-to-four
family
   
1,022
     
1,076
     
—  
     
1,576
     
26
 
Acquisition, development, and construction
   
8,296
     
9,197
     
—  
     
9,238
     
590
 
Other
   
36,375
     
101,701
     
—  
     
42,984
     
3,057
 
                                         
Total impaired loans with no related allowance
  $
52,169
    $
126,513
    $
—  
    $
63,146
    $
4,013
 
                                         
Impaired loans with an allowance recorded:


Multi-family
  $
—  
    $
—  
    $
—  
    $
—  
    $
—  
 
Commercial real estate
   
—  
     
—  
     
—  
     
—  
     
—  
 
One-to-four
family
   
—  
     
—  
     
—  
     
—  
     
—  
 
Acquisition, development, and construction
   
—  
     
—  
     
—  
     
—  
     
—  
 
Other
   
—  
     
—  
     
—  
     
20
     
—  
 
                                         
Total impaired loans with an allowance recorded
  $
—  
    $
—  
    $
—  
    $
20
    $
—  
 
                                         
Total impaired loans:


Multi-family
  $
4,220
    $
7,168
    $
—  
    $
6,114
    $
340
 
Commercial real estate
   
2,256
     
7,371
     
—  
     
3,234
     
—  
 
One-to-four
family
   
1,022
     
1,076
     
—  
     
1,576
     
26
 
Acquisition, development, and construction
   
8,296
     
9,197
     
—  
     
9,238
     
590
 
Other
   
36,375
     
101,701
     
—  
     
43,004
     
3,057
 
                                         
Total impaired loans
  $
52,169
    $
126,513
    $
—  
    $
63,166
    $
4,013


NOTE 7. LEASES
Lessor Arrangements
The Company is a lessor in the equipment finance business where it has executed direct financing leases (“lease finance receivables”). The Company produces lease finance receivables through a specialty finance subsidiary that is staffed by a group of industry veterans with expertise in originating and underwriting senior secur
ed
 debt and equipment loans and leases. The subsidiary participates in syndicated loans that are brought to them, and equipment loans and leases that are assigned to them, by a select group of nationally recognized sources, and are generally made to large corporate obligors, many of which are publicly traded, carry investment grade or near-investment grade ratings, and participate in stable industries nationwide. Lease finance receivables are carried at the aggregate of lease payments receivable plus the estimated residual value of the leased assets and any initial direct costs incurred to originate these leases, less unearned income, which is accreted to interest income over the lease term using the interest method.
The standard leases are typically repayable on a level monthly basis with terms ranging from 24 to 120 months. At the end of the lease term, the lessee usually has the option to return the equipment, to renew the lease or purchase the equipment at the then fair market value (“FMV”) price. For leases with a FMV renewal/purchase option, the relevant residual value assumptions are based on the estimated value of the leased asset at the end of lease term, including evaluation of key factors, such as, the estimated remaining useful life of the leased asset, its historical secondary market value including history of the lessee executing the FMV option, overall credit evaluation and return provisions. The Company acquires the leased asset at fair market value and provide
s
funding to the respective lessee at acquisition cost, less any volume or trade discounts, as applicable. Therefore, there is generally no selling profit or loss to recognize or defer at inception of a lease.
The residual value component of a lease financing receivable represents the estimated fair value of the leased equipment at the end of the lease term. In establishing residual value estimates, the Company may rely on industry data, historical experience, and independent appraisals and, where appropriate, information regarding product life cycle, product upgrades and competing products. Upon expiration of a lease, residual assets are remarketed, resulting in an extension of the lease by the lessee, a lease to a new customer or purchase of the residual asset by
the lessee or
 
101
 

Table of Contents
another party. Impairment of residual values arises if the expected fair value is less than the carrying amount. The Company assesses its net investment in lease financing receivables (including residual values) for impairment on an annual basis with any impairment losses recognized in accordance with the impairment guidance for financial instruments. As such, net investment in lease financing receivables may be reduced by an allowance for credit losses with changes recognized as provision expense. On certain lease financings, the Company obtains residual value insurance from third parties to manage and reduce the risk associated with the residual value of the leased assets. The carrying value of residual assets with third-party residual value insurance for at least a portion of the asset value was $70.1 million.
The Company uses the interest rate implicit in the lease to determine the present value of its lease financing receivables.
The components of lease income were as follows:
(in thousands)
 
For the Twelve
Months Ended
December 31, 2019
 
Interest income on lease financing
(1)
 
$
38,087
 
(1)
Included in Interest Income – Mortgage and other loans and leases in the Consolidated Statements of Income and Comprehensive Income.
At December 31, 2019, the carrying value of net investment in leases was $1.4 billion. The components of net investment in direct financing leases, including the carrying amount of the lease receivables, as well as the unguaranteed residual asset were as follows:
(in thousands)
 
December 31, 2019
 
Net investment in the lease- lease payments receivable
 
$
1,302,760
 
Net investment in the lease- unguaranteed residual assets
   
74,064
 
         
Total lease payments
 
$
1,376,824
 
         
The following table presents the remaining maturity analysis of the undiscounted lease receivables as of December 31, 2019, as well as the reconciliation to the total amount of receivables recognized in the Consolidated Statements of Condition:
(in thousands)
 
December 31, 2019
 
2019
 
$
13
 
2020
   
47,422
 
2021
   
135,430
 
2022
   
200,785
 
2023
   
79,105
 
Thereafter
   
914,069
 
         
Total lease payments
   
1,376,824
 
Plus: deferred origination costs
   
21,561
 
Less: unearned income
   
(104,826
)
         
Total lease finance receivables, net
 
$
1,293,559
 
         
Lessee Arrangements
The Company determines if an arrangement is a lease at inception. Operating leases are included in operating lease
right-of-use
assets and operating lease liabilities in the Consolidated Statements of Condition.
ROU assets represent the Company’s right to use an underlying asset for the lease term and lease liabilities represent the obligation to make lease payments arising from the lease. Operating lease ROU assets and liabilities are recognized at commencement date based on the present value of lease payments over the lease term. As most leases do not provide an implicit rate, the incremental borrowing rate (FHLB borrowing rate) is used based on the information available at adoption date in determining the present value of lease payments. The implicit rate is used when readily determinable. The operating lease ROU asset is measured at cost, which includes the initial measurement of the lease liability, prepaid rent and initial direct costs incurred by the Company, less incentives received. The lease terms include options to extend the lease when it is reasonably certain that we will exercise that option. For the vast majority of the Company’s leases, we are reasonably certain we will exercise our options to renew to the end of all renewal option periods. As such, substantially all of our future options to extend the leases have been included in the lease liability and ROU assets.
 
102
 

Table of Contents
Variable costs such as the proportionate share of actual costs for utilities, common area maintenance, property taxes and insurance are not included in the lease liability and are recognized in the period in which they are incurred. Amortization of the ROU assets was $38.4 million for the twelve months ended December 31, 2019. Included in the twelve month period amount is $11.7 million that was due to the closing of certain locations.
The Company has operating leases for corporate offices, branch locations
,
and certain equipment. The Company’s leases have remaining lease terms of one year to approximately 25 years, the vast majority of which include one or more options to extend the leases for up to five years resulting in lease terms up to 40 years.
During the twelve months ended December 31, 2019, the Company entered into a sale-lease back transaction with an unrelated third party with a lease term of 20 years (including renewal options). The sale of the branch property in Florida resulted in a gain of $7.9 million, which is included in “Other income” in the Consolidated Statements of Income and Comprehensive Income for the twelve months ended December 31, 2019.
The components of lease expense were as follows:
(in thousands)
 
For the Twelve
Months Ended
December 31,
2019
 
Components of
l
ease
e
xpense:
   
 
Operating lease cost
 
$
28,695
 
Sublease income
   
(105
)
         
Total lease cost
 
$
28,590
 
         
Supplemental cash flow information related to the leases for the following period:
(in thousands)
 
For the Twelve
Months Ended
December 31,
2019
 
Cash paid for amounts included in the measurement of lease liabilities:
   
 
Operating cash flows from operating leases
 
$
28,695
 
         
Supplemental balance sheet information related to the leases for the following period:
(in thousands, except lease term and discount rate)
 
December 31, 2019
 
Operating Leases:
   
 
Operating lease
right-of-use
assets
 
$
286,194
 
Operating lease liabilities
   
285,991
 
Weighted average remaining lease term
   
17 years
 
Weighted average discount rate
   
3.23
%
Maturities of lease liabilities
:
(in thousands)
 
December 31, 2019
 
2020
 
$
27,304
 
2021
   
26,350
 
2022
   
25,515
 
2023
   
25,078
 
2024
   
24,414
 
Thereafter
   
255,547
 
         
Total lease payments
   
384,208
 
Less: imputed interest
   
(98,217
)
         
Total present value of lease liabilities
 
$
285,991


103
 

Table of Contents
As previously disclosed in the Company’s 2018 Form
10-K,
under the prior guidance of ASC 840, at December 31, 2018, the Company was obligated under various
non-cancelable
operating lease and license agreements with renewal options on properties used primarily for branch operations. The agreements contain periodic escalation clauses that provide for increases in the annual rents, commencing at various times during the lives of the agreements, which are primarily based on increases in real estate taxes and
cost-of-living
indices. The remaining projected minimum annual rental commitments under these agreements, exclusive of taxes and other charges, are summarized as follows:
         
(in thousands)
 
2019
  $
30,322
 
2020
   
23,399
 
2021
   
19,736
 
2022
   
16,552
 
2023 and thereafter
   
55,525
 
         
Total minimum future rentals
  $
145,534


The 
expense
under these leases, which is included in “Occupancy and equipment expense” in the Consolidated Statements of
Income
and Comprehensive Income, amounted to $28.7 million
 and
 $33.6 million
,
 
respectively, in the years ended December 31, 201
9
 and
201
8
. Rental income on Company-owned properties, netted in occupancy and equipment expense, was approximately $9.5 million
 and
 $9.9 million, in the corresponding periods. 
NOTE 8: DEPOSITS
The following table sets forth the weighted average interest rates for each type of deposit at December 31, 2019 and 2018:
                                                 
 
December 31,
 
 
2019
   
2018
 
(dollars in thousands)
 
Amount
   
Percent
of Total
   
Weighted
 

Average
 

Interest
 

Rate
 
   
Amount
   
Percent
of Total
   
Weighted
Average
Interest
Rate
 
Interest-bearing checking and money market accounts
 
$
10,230,144
     
32.32
%    
1.30
%   $
11,530,049
     
37.48
%    
1.74
%
Savings accounts
   
4,780,007
     
15.10
     
0.75
     
4,643,260
     
15.09
     
0.68
 
Certificates of deposit
   
14,214,858
     
44.90
     
2.30
     
12,194,322
     
39.64
     
2.15
 
Non-interest-bearing
accounts
   
2,432,123
     
7.68
     
     
2,396,799
     
7.79
     
—  
 
                                                 
Total deposits
 
$
31,657,132
     
100.00
%    
1.57
%   $
30,764,430
     
100.00
%    
1.61
%


At December 31, 2019 and 2018, the aggregate amount of deposits that had been reclassified as loan balances (i.e., overdrafts) was $2.4 million and $2.8 million, respectively.
 
The scheduled maturities of certificates of deposit (“CDs”) at December 31, 2019 were as follows:
         
(in thousands)
 
 
1 year or less
 
$
13,310,426
 
More than 1 year through 2 years
   
684,586
 
More than 2 years through 3 years
   
27,029
 
More than 3 years through 4 years
   
5,638
 
More than 4 years through 5 years
   
186,951
 
Over 5 years
   
228
 
         
Total CDs
 
$
14,214,858


The following table presents a summary of CDs in amounts of $100,000 or more by remaining term to maturity, at December 31, 2019:
                                         
 
CDs of $100,000 or More Maturing Within
 
(in thousands)
 
3 Months
or Less
   
Over 3 to
6 Months
   
Over 6 to
12 Months
   
Over
12 Months
   
Total
 
Total
 
$
1,884,127
   
$
2,804,613
   
$
2,626,676
   
$
590,350
   
$
7,905,766


104

Table of Contents
Included
in total deposits at both December 
31
,
2019
and
2018
were brokered deposits of $
5.2
 billion and $
4.0
 billion with weighted average interest rates of
1.94
% and
2.50
% at the respective year-ends. Brokered money market accounts represented $
1.5
 billion and $
1.9
 billion, respectively, of the December 
31
,
2019
and
2018
totals, and brokered interest-bearing checking accounts represented $
1.2
 
billion
and $
786.1
 million, respectively. Brokered CDs represented $
2.5
 billion and $
1.3
 billion of brokered deposits at December 
31
,
2019
and
2018
, respectively.
NOTE 9: BORROWED FUNDS
The following table summarizes the Company’s borrowed funds at December 31,
2019
and 2018:
                 
 
December 31,
 
(in thousands)
 
2019
   
2018
 
Wholesale borrowings:


FHLB advances
 
$
13,102,661
    $
13,053,661
 
Repurchase agreements
   
800,000
     
500,000
 
                 
Total wholesale borrowings
 
$
13,902,661
    $
13,553,661
 
Junior subordinated debentures
   
359,866
     
359,508
 
Subordinated notes
   
295,066
     
294,697
 
                 
Total borrowed fund
s
 
$
14,557,593
    $
14,207,866


Accrued interest on borrowed funds is included in “Other liabilities” in the Consolidated Statements of Condition and amounted to $23.4 million and $23.5 million, respectively, at December 31, 2019 and 2018.
FHLB Advances
The contractual maturities and the next call dates of FHLB advances
 
outstanding at December 31, 2019 were as follows:
                                 
 
Contractual Maturity
   
Earlier of Contractual Maturity
or Next Call Date
 
(dollars in thousands)
Year
 
Amount
   
Weighted
Average
Interest Rate
   
Amount
   
Weighted
Average
Interest Rate
 
2020
 
$
4,525,000
     
2.06
   
$
6,805,000
     
2.09
 
2021
   
822,661
     
2.40
     
4,222,661
     
2.30
 
2022
   
275,000
     
2.01
     
1,875,000
     
1.55
 
2023


200,000


1.61
2028
   
4,350,000
     
2.40


2029
   
3,130,000
     
1.55


Total FHLB advance
s
 
$
13,102,661
     
2.07
%  
$
13,102,661
     
2.07
%


105
 

Table of Contents
FHLB advances include both straight fixed-rate advances and advances under the FHLB convertible advance program, which gives the FHLB the option of either calling the advance after an initial
lock-out
period of up to five years and quarterly thereafter until maturity, or a
one-time
call at the initial call date.
The Company had
$1.0 billion of
short-term FHLB advances at December 31, 2019
. During the twelve months ended December 31, 2019, the average balance of short-term FHLB advances were $52.4 million, with a weighted average interest rate of 1.9%, generating interest expense of $1.0 million. There were no short-term advances at December 31,
2018. During the twelve months ended at December 31, 2017, the average balances of short-term FHLB advances were $3.3 million, with a weighted average interest rate of 0.82%, generating interest expense of $27,000.
At December 31, 2019 and 2018, respectively, the Bank had unused lines of available credit with the
FHLB
of up to $7.9 billion and $7.5 billion. The
Company
had
overnight advances
of $100.0 million
at December 31, 2019
.
The
re were no over
night FHLB advances a
t December 31,
2018. During the twelve months ended December 31, 2019, the average balance of overnight advances amounted to $3.1 million, with a weighted average interest rate of 2.1%, generating interest expense of $66,000. During the twelve months ended December 31, 2018 and 2017, the average balances of overnight advances amounted to $5.2 million and $7.7 million, with weighted average interest rates of 2.3% and 0.98%, respectively. In 2018 and 2017, the interest expense generated by average overnight advances was $121,000 and $75,000.
Total FHLB advances generated interest expense of $259.0 million, $248.0 million, and $186.0 million, in the years ended December 31, 2019, 2018, and 2017, respectively.
Repurchase Agreements
The following table presents an analysis of the contractual maturities and next call dates of the Company’s outstanding repurchase agreements accounted for as secured borrowings at December 31, 2019
:
 
Contractual Maturity
   
Earlier of Contractual Maturity
or Next Call Date
 
(dollars in thousands)
Year
 
Amount
   
Weighted Average
Interest Rate
   
Amount
   
Weighted Average
Interest Rate
 
2021
 
$


%
 
$
400,000


2.31
%
2022


400,000


2.16
 
2028
   
300,000
     
2.37


2029
   
500,000
     
2.16


$
800,000
     
2.24
   
$
800,000
     
2.24
 
                                 
The following table provides the
 
contractual maturity and weighted average interest rate of repurchase agreements, and the amortized cost and fair value of the securities collateralizing the repurchase agreements, at December 31, 2019:


Mortgage-Related
 and
Other Securities
   
GSE Debentures and
U.S. Treasury
 
Obligations
 
(dollars in thousands)
Period of Maturity
 
Amount
   
Weighted Average
Interest Rate
   
Amortized
Cost
   
Fair Value
   
Amortized
Cost
   
Fair Value
 
30 to 90 days
 
$
     
   
$
   
$
   
$
   
$
 
Greater than 90 days
   
800,000
     
2.24
%
   
232,836
     
238,180
     
636,190
     
637,050
 
                                                 
Total
 
$
800,000
     
2.24
%
 
$
 
 
232,836
   
$
238,180
   
$
636,190
   
$
637,050
 
                                                 
The Company had no short-term repurchase agreements outstanding at December 31, 2019 or 2018.
At December 31, 2019 and 2018, the accrued interest on repurchase agreements amounted to $1.7
million
and $287,000, respectively. The interest expense on repurchase agreements was $17.7 million, $6.8 million, and $16.4 million, in the years ended December 31, 2019, 2018, and 2017, respectively.
Federal Funds Purchased
There were no federal funds purchased outstanding at December 31, 2019 or 2018.
 
106

Table of Contents
In 2019 and 2018, respectively, the average balances of federal funds purchased were $6.8
million
and $620,000, with weighted average interest rates of 1.7% and 2.2%. In 2017, the average balance of federal funds purchased amounted to $47.9 million with
a
weighted average interest rate of 2.2%. The interest expense produced by federal funds purchased was $118,000, $14,000 and $418,000 for the years ended December 31, 2019, 2018 and 2017, respectively.
Junior Subordinated Debentures
At December 31, 2019 and 2018, the Company had $359.9 million and $359.5 million, respectively, of outstanding junior subordinated deferrable interest debentures (“junior subordinated debentures”) held by statutory business trusts (the “Trusts”) that issued guaranteed capital securities.
The Trusts are accounted for as unconsolidated subsidiaries, in accordance with GAAP. The proceeds of each issuance were invested in a series of junior subordinated debentures of the Company and the underlying assets of each statutory business trust are the relevant debentures. The Company has fully and unconditionally guaranteed the obligations under each trust’s capital securities to the extent set forth in a guarantee by the Company to each trust. The Trusts’ capital securities are each subject to mandatory redemption, in whole or in part, upon repayment of the debentures at their stated maturity or earlier redemption.
The following junior subordinated debentures were outstanding at December 31, 2019:
Issuer
 
Interest
Rate
of Capital
Securities
and
Debentures
   
Junior
Subordinated
Debentures
Amount
Outstanding
   
Capital
Securities
Amount
Outstanding
   
Date of
Original Issue
   
Stated Maturity
   
First Optional
Redemption Date


(dollars in thousands)


New York Community Capital Trust V (BONUSES
SM
Units)
   
6.00
%  
$
145,940
   
$
139,589
     
Nov. 4, 2002
     
Nov. 1, 2051
     
Nov. 4, 2007
(1)
 
 
New York Community Capital Trust X
   
3.49
     
123,712
     
120,000
     
Dec. 14, 2006
     
Dec. 15, 2036
     
Dec. 15, 2011
(2)
 
 
PennFed Capital Trust III
   
5.14
     
30,928
     
30,000
     
June 2, 2003
     
June 15, 2033
     
June 15, 2008
(2)
 
 
New York Community Capital Trust XI
   
3.61
     
59,286
     
57,500
     
April 16, 2007
     
June 30, 2037
     
June 30, 2012
(2)
 
                                                 
Total junior subordinated debentures
   
   
$
359,866
   
$
347,089


(1)
Callable subject to certain conditions as described in the prospectus filed with the SEC on November 4, 2002.
(2)
Callable from this date forward.
The Bifurcated Option Note Unit SecuritiES
SM
(“BONUSES units”) included in the preceding table were issued by the Company on November 4, 2002 at a public offering price of $50.00 per share. Each of the 5,500,000 BONUSES units offered consisted of a capital security issued by New York Community Capital Trust V, a trust formed by the Company, and a warrant to purchase 2.4953 shares of the common stock of the Company (for a total of approximately 13.7 million common shares) at an effective exercise price of $20.04 per share. Each capital security has a maturity of 49 years, with a coupon, or distribution rate, of 6.00% on the $50.00 per share liquidation amount. The warrants and capital securities were
non-callable
for five years from the date of issuance and were not called by the Company when the five-year period passed on November 4, 2007.
The gross proceeds of the BONUSES units totaled $275.0 million and were allocated between the capital security and the warrant comprising such units in proportion to their relative values at the time of issuance. The value assigned to the warrants, $92.4 million, was recorded as a component of additional
“paid-in
 capital” in the Company’
s
 
Consolidated Statements of Condition. The value assigned to the capital security component was $
182.6
 million. The $
92.4
 million difference between the assigned value and the stated liquidation amount of the capital securities was treated as an original issue discount, and is being amortized to interest expense over the
49-year
life of the capital securities on a level-yield basis. At December 
31
,
2019
, this discount totaled $
65.8
 million.
The other three trust preferred securities noted in the preceding table were formed for the purpose of issuing Company Obligated Mandatorily Redeemable Capital Securities of Subsidiary Trusts Holding Solely Junior Subordinated Debentures (collectively, the “Capital Securities”). Dividends on the Capital Securities are payable either quarterly
 
or semi-annually and are deferrable, at the Company’s option, for up to five years. As of December 
31
,
2019
, all dividends were current.
107

Table of Contents
Interest expense on junior subordinated debentures was $22.4 million, $21.7 million, and $19.6 million, respectively, for the years ended December 31, 2019, 2018, and 2017.
Subordinated Notes
At December 31, 2019 and 2018, the Company had $295.1 million and $294.7 million, respectively, of
fixed-to-floating
rate subordinated notes outstanding:
             
Date of Original Issue
 
Stated Maturity
 
Interest Rate
(1)
 
Original Issue 
Amount
(dollars in thousands)
Nov. 6, 2018
 
Nov. 6, 2028
 
5.90%
 
$300,000


(1)
From and including the date of original issuance to, but excluding November 6, 2023, the Notes will bear interest at an initial rate of 5.90% per annum payable semi-annually. Unless redeemed, from and including November 6, 2023 to but excluding the maturity date, the interest rate will reset quarterly to an annual interest rate equal to the then-current three-month LIBOR rate plus 278 basis point payable quarterly.


The interest expense on subordinated notes amounted to $18.3 million and $2.8 million, for the years ended December 31, 2019 and 2018, respectively.
NOTE 10: FEDERAL, STATE, AND LOCAL TAXES
The following table summarizes the components of the Company’s net deferred tax asset
 
(liability) at December 31, 2019 and 2018:
                 
 
December 31,
 
(in thousands)
 
2019
   
2018
 
Deferred Tax Assets:


Allowance for loan losses
  $
40,584
    $
45,611
 
Compensation and related benefit obligations
   
19,401
     
19,693
 
Acquisition accounting and fair value adjustments on securities (including OTTI)
   
     
6,728
 
Non-accrual
interest
   
624
     
431
 
Net operating loss carryforwards
   
19,750
     
—  
 
Other
   
12,169
     
11,349
 
                 
Gross deferred tax assets
   
92,528
     
83,812
 
Valuation allowance
   
     
—  
 
                 
Deferred tax asset after valuation allowance
  $
92,528
    $
83,812
 
                 
Deferred Tax Liabilities:


Amortizable intangibles
  $
(2,480
)   $
(2,263
)
Acquisition accounting and fair value adjustments on securities (including OTTI)
   
(9,742
)    
—  
 
Mortgage servicing rights
   
     
(223
)
Premises and equipment
   
(7,578
)    
(11,242
)
Prepaid pension cost
   
(22,739
)    
(19,135
)
Leases
   
(237,429
)    
(115,259
)
Other
   
(13,991
)    
(14,800
)
                 
Gross
deferred tax liabilities
  $
(293,959
)   $
(162,922
)
                 
Net deferred tax liabilit
y
  $
(201,431
)   $
(79,110
)


The deferred tax liability represents the anticipated federal, state, and local tax expenses or benefits that are expected to be realized in future years upon the utilization of the underlying tax attributes comprising said balances. The net deferred tax liability is included in “Other liabilities” in the Consolidated Statements of Condition at December 31, 2019 and 2018.
At December 31, 2019, the Company had a federal net operating loss (“NOL”) carry forward of $94.0 million, which was available to offset future federal taxable income. The NOL may be carried forward to any future calendar tax year after 2019 and is not subject to expiration.
The Company
has determined that all deductible temporary differences and net operating loss carryforwards are more likely than not to provide a benefit in reducing future federal, state, and local tax liabilities, as applicable. The Company has reached this determination based on its history of reporting positive taxable income in all relevant tax jurisdictions, the length of time available to utilize the net operating loss carryforwards, and the recognition of taxable income in future periods from taxable temporary differences.
 
108
 

Table of Contents
The following table summarizes the Company’s income tax expense for the years ended December 31, 2019, 2018, and 2017:
                         
 
December 31,
 
(in thousands)
 
2019
   
2018
   
2017
 
Federal – current
 
$
4,069
    $
89,187
    $
153,587
 
State and local – current
   
23,382
     
22,868
     
26,983
 
                         
Total current
   
27,451
     
112,055
     
180,570
 
                         
Federal – deferred
   
100,971
     
13,058
     
3,498
 
State and local – deferred
   
(158
   
10,139
     
17,946
 
                         
Total deferred
   
100,813
     
23,197
     
21,444
 
                         
Income tax expense reported in net income
   
128,264
     
135,252
     
202,014
 
Income tax expense reported in stockholders’ equity related to:


Securities available-for-sale
   
16,142
     
(32,162
)
   
28,495
 
Pension liability adjustments
   
5,033
     
4,897
     
2,234
 
Cash Flow Hedge
   
333


Non-credit portion of OTTI losses
   
     
821
     
13
 
                         
Total income taxes
 
$
149,772
    $
108,808
    $
232,756


The following table presents a reconciliation of statutory federal income tax expense (benefit) to combined actual income tax expense (benefit) reported in net income for the years ended December 31, 2019, 2018, and 2017:
                         
 
December 31,
 
(in thousands)
 
2019
   
2018
   
2017
 
Statutory federal income tax at
21
%,
21
% and
35
%, respectively
 
$
109,894
    $
117,111
    $
233,875
 
State and local income taxes, net of federal income tax effect
   
18,346
     
24,451
     
29,204
 
Effect of tax law changes
   
     
1,625
     
(41,943
)
Non-deductible
FDIC deposit insurance premiums
   
6,938
     
8,852
     
—  
 
Effect of tax deductibility of ESOP
   
(3,163
)    
(3,116
)    
(5,083
)
Non-taxable
income and expense of BOLI
   
(5,981
)    
(5,957
)    
(9,529
)
Federal tax credits
   
(750
)    
(531
)    
(1,386
)
Adjustments relating to prior tax years
   
373
     
(7,246
)    
144
 
Other, ne
t
   
2,607
     
63
     
(3,268
)
                         
Total income tax expense
 
$
128,264
    $
135,252
    $
202,014


GAAP requires that the impact of tax legislation be recognized in the
 
period in which the law was enacted. As a result of the Tax Reform Act of 2017, the Company recorded a tax benefit of $42.0 million for the period ended December 31, 2017 due to the net impact of remeasurement of tax attributes affected by the enactment of the Tax Reform Act. Due to changes to the New Jersey tax laws enacted in 2018, a tax expense of $2.1 million for the year-ended December 31, 2018 was recorded.
The Company invests in affordable housing projects through limited partnerships that generate federal Low Income Housing Tax Credits. The balances of these investments, which are included in “Other assets” in the Consolidated Statements of Condition, were $57.1 million and $62.3 million, respectively, at December 31, 2019 and 2018, and included commitments of $29.1 million and $37.2 million that are expected to be funded over the next
two
years. The Company elected to apply the proportional amortization method to these investments. Recognized in the determination of income tax (benefit) expense from operations for the years ended December 31, 2019, 2018, and 2017 were $5.9 million, $5.2 million, and $4.5 million, respectively, of affordable housing tax credits and other tax benefits, and an offsetting $5.2 million, $4.7 million, and $3.1 million, respectively, for the amortization of the related investments. No impairment losses were recognized in relation to these investments for the years ended December 31, 2019, 2018, and 2017.
GAAP prescribes a recognition threshold and measurement attribute for use in connection with the obligation of a company to recognize, measure, present, and disclose in its financial statements uncertain tax positions that the Company has taken or expects to take on a tax return. As of December 31, 2019, the Company had $35.7 million of unrecognized gross tax benefits. Gross tax benefits do not reflect the federal tax effect associated with state tax amounts. The total amount of net unrecognized tax benefits at December 31, 2019 that would have affected the effective tax rate, if recognized, was $28.2 million.
 
109
 

Table of Contents
Interest and penalties (if any) related to the underpayment of income taxes are classified as a component of income tax expense in the Consolidated Statements of
Income
and Comprehensive Income. During the years ended December 31, 2019, 2018, and 2017, the Company recognized income tax expense attributed to interest and penalties of $2.5 million, $1.7 million, and $1.8 million, respectively. Accrued interest and penalties on tax liabilities were $14.5 million and $11.3 million, respectively, at December 31, 2019 and 2018.
The following table summarizes changes in the liability for unrecognized gross tax benefits for the years ended December 31, 2019, 2018, and 2017:
 
December 31,
 
(in thousands)
 
2019
   
2018
   
2017
 
Uncertain tax positions at beginning of year
 
$
33,357
    $
33,681
    $
33,487
 
Additions for tax positions relating to current-year operations
   
925
     
—  
     
4,332
 
Additions for tax positions relating to prior tax years
   
2,036
     
1,660
     
1,398
 
Subtractions for tax positions relating to prior tax years
   
(569
)    
(1,984
)    
(5,101
)
Reductions in balance due to settlements
   
     
—  
     
(435
)
                         
Uncertain tax positions at end of year
 
$
35,749
    $
33,357
    $
33,681
 
                         
The Company and its subsidiaries have filed tax returns in many states. The following are the more significant tax filings that are open for examination:
  Federal tax filings for tax years 201
6
through the present;
  New York State tax filings for tax years 2010 through the present;
  New York City tax filings for tax years 2011 through the present; and
  New Jersey tax filings for tax years 201
5
through the present.
In addition to other state audits, the Company is currently under examination by the following taxing jurisdictions of significance to the Company:
  New York State for the tax years 2010 through 2014; and
  New York City for the tax years 2011 and 201
4
.
It is reasonably possible that there will be developments within the next twelve months that would necessitate an adjustment to the balance of unrecognized tax benefits, including decreases of up to $21 million due to completion of tax authorities’ exams and the expiration of statutes of limitations.
As a savings institution, the Bank is subject to a special federal tax provision regarding its frozen tax bad debt reserve. At December 31, 2019, the Bank’s federal tax bad debt base-year reserve was $61.5 million, with a related federal deferred tax liability of $12.9 million, which has not been recognized since the Bank does not expect that this reserve will become taxable in the foreseeable future. Events that would result in taxation of this reserve include redemptions of the Bank’s stock or certain excess distributions by the Bank to the Company.
NOTE 11. DERIVATIVE AND HEDGING ACTIVITIES
The Company’s derivative financial instruments consist of interest rate swaps. The Company is exposed to certain risks arising from both its business operations and economic conditions. The Company principally manages its exposure to a wide variety of business and operational risks through management of its core business activities. The Company manages economic risks, including interest rate and liquidity risks, primarily by managing the amount, sources, and duration of its assets and liabilities and, from time to time, the use of derivative financial instruments. Specifically, the Company enters into derivative financial instruments to manage exposures that arise from business activities that result in the payment of future known and uncertain cash amounts, the value of which are determined by interest rates.
Title VII of the Dodd-Frank Wall Street Reform and Consumer Protection Act of 2010 (the “Dodd-Frank Act”) requires all standardized derivatives, including most interest rate swaps, to be submitted for clearing to central counterparties to reduce counterparty risk. Two of the central counterparties are the Chicago Mercantile Exchange (“CME”) and the London Clearing House (“LCH”). As of December 31, 2019, all of the Company’s $2.8 billion notional derivative contracts were cleared on the LCH. Daily variation margin payments on derivatives cleared
 
110
 

Table of Contents
through the LCH are accounted for as legal settlement. For derivatives cleared through LCH, the net gain (loss) position includes the variation margin amounts as settlement of the derivative and not collateral against the fair value of the derivative, which includes accrued interest; therefore, those interest rate and derivative contracts the Company clears through the LCH are reported at a fair value of approximately zero at December 31, 2019.
The Company’s exposure is limited to the value of the derivative contracts in a gain position less any collateral held and plus any collateral posted. When there is a net negative exposure, we consider our exposure to the counterparty to be zero. At December 31, 2019, the Company had a net negative exposure.
Fair Value of Hedges of Interest Rate Risk
The Company is exposed to changes in the fair value of certain of its fixed-rate assets due to changes in interest rates. The Company uses interest rate swaps to manage its exposure to changes in fair value on these instruments attributable to changes in the designated benchmark interest rate. Interest rate swaps designated as fair value hedges involve the payment of fixed-rate amounts to a counterparty in exchange for the Company receiving variable-rate payments over the life of the agreements without the exchange of the underlying notional amount. Such derivatives were used to hedge the changes in fair value of certain of its pools of prepayable fixed rate assets. For derivatives designated and that qualify as fair value hedges, the gain or loss on the derivative as well as the offsetting loss or gain on the hedged item attributable to the hedged risk are recognized in interest income.
In the first quarter of 2019, the Company entered into an interest rate swap with a notional amount of $2.0 billion to hedge certain real estate loans. For the twelve months ended December 31, 2019, the floating rate received related to the net settlement of this interest rate swap was less than the fixed rate payments. As such, interest income from Mortgage and Other Loans and Leases in the accompanying Consolidated Statements of Income and Comprehensive Income was decreased by $3.4
million
for the twelve months ended December 31, 2019, respectively.
As of December 31, 2019, the following amounts were recorded on the balance sheet related to cumulative basis adjustment for fair value hedges. The Company did not have any derivative instruments at December 31, 2018:
(in thousands)
 
December 31, 2019
 
Line Item in the Consolidated Statements of Condition in which the Hedge Item
 
is Included
 
Carrying
 
Amount of
the Hedged
 
Assets
 
 
Cumulative Amount of Fair
Value Hedging
Adjustments Included in
the Carrying Amount of the
Hedged Assets
 
Total loans and leases, net
(1)
 
$
2,053,483
 
 
$
53,483
 
(1)
These amounts include the amortized cost basis of closed portfolios used to designate hedging relationships in which the hedged item is the last layer expected to be remaining at the end of the hedging relationship. At December 31, 2019, the amortized cost basis of the closed portfolios used in these hedging relationships was $
4.5
 billion; the cumulative basis adjustments associated with these hedging relationships was $
53.5
 million; and the amount of the designated hedged items was $
2.0
 billion.
The following table sets forth information regarding the Company’s derivative financial instruments at December 31, 2019. The Company had no such derivative financial instruments at December 31, 2018.
 
December 31, 2019
 
(in thousands)
 
   
Fair Value
 
Notional
Amount
   
Other
Assets
   
Other
Liabilities
 
Derivatives designated as
fair value
hedging instruments:


Interest rate swap
  $
2,000,000
    $
    $
 
                         
Total derivatives designated as
fair value
hedging instruments
  $
2,000,000
    $
    $


111
 

Table of Contents
The following table sets forth the effect of derivative instruments on the Consolidated Statements of Income and Comprehensive Income for the periods indicated. The Company had no
such
derivative financial instruments outstanding during 2018:
(in thousands)
 
For the Twelve
Months Ended
December 31, 2019
 
Derivative – interest rate swap:


Interest income
  $
(53,483
)
Hedged item – loans:


Interest income
  $
53,483
 
Cash Flow Hedges of Interest Rate Risk
The Company’s objectives in using interest rate derivatives are to add stability to interest expense and to manage its exposure to interest rate movements. Interest rate swaps designated as cash flow hedges involve the receipt of amounts subject to variability caused by changes in interest rates from a counterparty in exchange for the Company making fixed-rate payments over the life of the agreements without exchange of the underlying notional amount. Changes in the fair value of derivatives designated and that qualify as cash flow hedges are initially recorded in other comprehensive income and are subsequently reclassified into earnings in the period that the hedged transaction affects earnings.
Interest rate swaps with notional amounts totaling $800.0 
million
as of December 31, 2019 were designated as cash flow hedges of certain FHLB borrowings. The Company had
no
such
derivative financial instruments at December 31, 2018.
The following table summarizes information about the interest rate swaps designated as cash flow hedges at December 31, 2019:
(dollars in thousands)
 
December 31, 2019
 
Notional amounts
  $
800,000
 
Cash collateral posted
 
 
1,185
 
Weighted average pay rates
   
1.62
%
Weighted average receive rates
   
1.90
%
Weighted average maturity
   
2.5 years
 
The following table presents the effect of the Company’s cash flow derivative instruments on AOCL for the year ending December 31, 2019. The Company had no
such
derivative financial instruments during the year ending December 31, 2018:
(in thousands)
 
For the Twelve
Months Ended
December 31, 2019
 
Amount of gain (loss) recognized in AOCL
  $
1,340
 
Amount of gain (loss) reclassified from AOCL to interest expense
   
154
 
Gains (losses) included in the Consolidated Statements of Income related to interest rate derivatives designated as cash flow hedges during the year ended December 31, 2019 was $154,000. Amounts reported in AOCL related to derivatives will be reclassified to interest expense as interest payments are made on the Company’s variable-rate borrowings. During the next twelve months, the Company estimates that an additional $3.0 million will be reclassified as a decrease to interest expense.
 
112
 

Table of Contents
NOTE 12: COMMITMENTS AND CONTINGENCIES
Pledged Assets
The Company pledges securities to serve as collateral for its repurchase agreements, among other purposes. At December 31, 2019, the Company had pledged available for sale mortgage-related securities and other securities with carrying values of $651.3 million and $721.0 million, respectively. At December 31, 2018, the Company had pledged available for sale mortgage-related securities and other securities with carrying values of $840.7 million and $388.0 million, respectively. In addition, the Company had $32.6 billion and $31.4 billion of loans pledged to the
FHLB-NY
to serve as collateral for its wholesale borrowings at the respective year-ends.
Loan Commitments and Letters of Credit
At December 31, 2019 and 2018, the Company had commitments to originate loans, including unused lines of credit, of $2.0 billion and $2.0 billion, respectively. The majority of the outstanding loan commitments at those dates were expected to close within 90 days. In addition, the Company had commitments to originate letters of credit totaling $509.9 million and $508.1
 
million at December 31, 2019 and 2018.
The following table summarizes the Company’s
off-balance
sheet commitments to originate loans and letters of credit at December 31, 2019:
(in thousands)
 
 
Mortgage Loan Commitments:
   
 
Multi-family and commercial real estate
 
$
251,679
 
One-to-four
family
   
801
 
Acquisition, development, and construction
   
205,499
 
         
Total mortgage loan commitments
 
$
457,979
 
Other loan commitments
   
1,548,513
 
         
Total loan commitments
 
$
2,006,492
 
Commercial, performance
stand-by,
and financial
stand-by
letters of credit
   
509,942
 
         
Total commitments
 
$
2,516,434
 
         
Financial Guarantees
The Company provides guarantees and indemnifications to its customers to enable them to complete a variety of business transactions and to enhance their credit standings. These guarantees are recorded at their respective fair values in “Other liabilities” in the Consolidated Statements of Condition. The Company deems the fair value of the guarantees to equal the consideration received.
The following table summarizes the Company’s guarantees and indemnifications at December 31, 2019:
(in thousands)
 
Expires
Within One
Year
   
Expires
After One
Year
   
Total
Outstanding
Amount
   
Maximum Potential
Amount of
Future Payments
 
Financial
stand-by
letters of credit
 
$
 
164,776
   
$
58,014
   
$
222,790
   
$
448,602
 
Performance
stand-by
letters of credit
   
3,351
     
     
3,351
     
3,351
 
Commercial letters of credit
   
2,401
     
361
     
2,762
     
57,989
 
                                 
Total letters of credit
 
$
170,528
   
$
58,375
   
$
228,903
   
$
509,942
 
                                 
The maximum potential amount of future payments represents the notional amounts that could be funded under the guarantees and indemnifications if there were a total default by the guaranteed parties or if indemnification provisions were triggered, as applicable, without consideration of possible recoveries under recourse provisions or from collateral held or pledged.
The Company collects fees upon the issuance of commercial and
stand-by
letters of credit. Fees for
stand-by
letters of credit fees are initially recorded by the Company as a liability, and are recognized as income periodically through the respective expiration dates. Fees for commercial letters of credit are collected and recognized as income at the time that they are issued and upon payment of each set of documents presented. In addition, the Company requires adequate collateral, typically in the form of cash, real property, and/or personal guarantees upon its issuance of
irrevoc
able
stand
-by
l
etters of
c
redit. Commercial letters of credit are primarily secured by the goods being purchased in the underlying transaction and are also personally guaranteed by the owner(s) of the applicant company.
 
113
 

Table of Contents
At December 31, 2019, the Company had no commitments to purchase securities.
Legal Proceedings
The Company is involved in various legal actions arising in the ordinary course of its business. All such actions in the aggregate involve amounts that are believed by management to be immaterial to the financial condition and results of operations of the Company.
NOTE 13: INTANGIBLE ASSETS
Goodwill
Goodwill is presumed to have an indefinite useful life and is tested for impairment, rather than amortized, at the reporting unit level, at least once a year.
During
the
year
ended December 31, 2019
,
goodwill was reduced by $9.8 million related to the sale of the
Company’s
we
alth
management
busi
ness, 
P
eter
B. Cannell
 & Co.
 Goodwill totaled $2.4 billion at each of these dates.
NOTE 14: EMPLOYEE BENEFITS
Retirement Plan
The New York Community Bancorp, Inc. Retirement Plan (the “Retirement Plan”) covers substantially all employees who had attained minimum age, service, and employment status requirements prior to the date when the individual plans were frozen by the banks of origin. Once frozen, the individual plans ceased to accrue additional benefits, service, and compensation factors, and became closed to employees who would otherwise have met eligibility requirements after the “freeze” date.
 
114
 

Table of Contents
The following table sets forth certain information regarding the Retirement Plan as of the dates indicated:
                 
 
December 31,
 
(in thousands)
 
2019
   
2018
 
Change in Benefit Obligation:


Benefit obligation at beginning of year
  $
143,235
    $
151,411
 
Interest cost
   
5,660
     
5,085
 
Actuarial
 
loss
(gain)
   
18,806
     
(4,676
)
Annuity payments
   
(6,473
)    
(6,453
)
Settlements
   
(1,332
)    
(2,132
)
                 
Benefit obligation at end of year
  $
159,896
    $
143,235
 
Change in Plan Assets:


Fair value of assets at beginning of year
  $
210,246
    $
234,136
 
Actual
return
(loss) on plan assets
   
40,117
     
(15,305
)
Contributions
   
     
—  
 
Annuity payments
   
(6,473
)    
(6,453
)
Settlements
   
(1,332
)    
(2,132
)
                 
Fair value of assets at end of year
  $
242,558
    $
210,246
 
                 
Funded status (included in “Other assets”)
  $
82,662
    $
67,011
 
                 
Changes recognized in other comprehensive income for the year ended December 31:


Amortization of prior service cost
  $
    $
—  
 
Amortization of actuarial loss
   
(10,035
)    
(7,179
)
Net actuarial
(gain)
loss arising during the year
   
(7,378
)    
26,768
 
                 
Total recognized in other comprehensive income for the year
(pre-tax)
  $
(17,413
)   $
19,589
 
                 
Accumulated other comprehensive loss
(pre-tax)
not yet recognized in net periodic benefit cost at December 31:


Prior service cost
  $
    $
—  
 
Actuarial loss, net
   
75,767
     
93,180
 
                 
Total accumulated other comprehensive loss
(pre-tax)
  $
75,767
    $
93,180


In 2020, an estimated $7.3 million of unrecognized net actuarial loss for the Retirement Plan will be amortized from AOCL into net periodic benefit cost. The comparable amount recognized as net periodic benefit cost in 2019 was $10.0 million. No prior service cost will be amortized in 2020 and none was amortized in 2019. The discount rates used to determine the benefit obligation at December 31, 2019 and 2018 were 3.0% and 4.1%, respectively.
The discount rate reflects rates at which the benefit obligation could be effectively settled. To determine this rate, the Company considers rates of return on high-quality fixed-income investments that are currently available and are expected to be available during the period until the pension benefits are paid. The expected future payments are discounted based on a portfolio of high-quality rated bonds (above-median AA curve) for which the Company relies on the Financial Times Stock Exchange (“FTSE”) (formerly Citigroup) Pension Liability Index that is published as of the measurement date.
The components of net periodic pension expense (credit) were as follows for the years indicated:
                         
 
Years Ended December 31,
 
(in thousands)
 
2019
   
2018
   
2017
 
Components of net periodic pension
expense (
credit
)
:


Interest cost
  $
5,660
    $
5,085
    $
5,616
 
Expected return on plan assets
   
(13,933
)    
(16,139
)    
(16,290
)
Amortization of net actuarial loss
   
10,035
     
7,179
     
8,209
 
                         
Net periodic pension
expense (
credit
)
  $
1,762
    $
(3,875
)   $
(2,465
)


115
 

Table of Contents
The following table indicates the weighted average assumptions used in determining the net periodic benefit cost for the years indicated:
                         
 
Years Ended December 31,
 
 
2019
   
2018
   
2017
 
Discount rate
   
4.1
%    
3.4
%    
3.9
%
Expected rate of return on plan assets
   
6.8
     
7.0
     
7.5


As of December 31, 2019 Retirement Plan assets were invested in two diversified investment portfolios of the Pentegra Retirement Trust (the “Trust”) (formerly known as “RSI Retirement Trust”), a private placement investment fund.
The Company (in this context, the “Plan Sponsor”) chooses the specific asset allocation for the Retirement Plan within the parameters set forth in the Trust’s Investment Policy Statement. The long-term investment objectives are to maintain the Retirement Plan’s assets at a level that will sufficiently cover the Plan Sponsor’s long-term obligations, and to generate a return on those assets that will meet or exceed the rate at which the Plan Sponsor’s long-term obligations will grow.
The Retirement Plan allocates its assets in accordance with the following targets:
  To hold
55
% of its assets in equity securities via investment in the Trust’s Long-Term Growth—Equity (“LTGE”) Portfolio, a diversified portfolio that invests in a number of actively and passively managed equity mutual funds and collective trusts in order to diversify within U.S. and
non-U.S.
equity markets;


  To hold
44
% of its assets in intermediate-term investment-grade bonds via investment in the Trust’s Long-Term Growth—Fixed Income (“LTGFI”) Portfolio, a diversified portfolio that invests in a number of fixed-income mutual funds and collective investment trusts, primarily including intermediate-term bond funds with a focus on U.S. investment grade securities and opportunistic allocations to below-investment grade and
non-U.S.
investments; and


  To hold 1% of its assets in a cash-equivalent portfolio for liquidity purposes.


In addition, the Retirement Plan holds Company shares, the value of which is approximately equal to 12% of the assets that are held by the Trust.
The LTGE and LTGFI portfolios are designed to provide long-term growth of equity and fixed-income assets with the objective of achieving an investment return in excess of the cost of funding the active life, deferred vesting, and all
30-year
term and longer obligations of retired lives in the Trust. Risk and volatility are further managed in accordance with the distinct investment objectives of the Trust’s respective portfolios.
 
116
 

Table of Contents
The following table presents information about the fair value measurements of the investments held by the Retirement Plan as of December 31, 2019:
(in thousands)
 
Total
   
Quoted Prices in
Active Markets for
Identical Assets
(Level 1)
   
Significant Other
Observable
Inputs
(Level 2)
   
Significant
Unobservable
Inputs
(Level 3)
 
Equity:


Large-cap
value
(1)
 
$
21,279
   
$
   
$
21,279
   
$
 
Large-cap
growth
(2)
   
21,852
     
     
21,852
     
 
Large-cap
core
(3)
   
15,978
     
     
15,978
     
 
Mid-cap
value
(4)
   
4,560
     
     
4,560
     
 
Mid-cap
growth
(5)
   
4,871
     
     
4,871
     
 
Mid-cap
core
(6)
   
4,664
     
     
4,664
     
 
Small-cap
value
(7)
   
3,272
     
     
3,272
     
 
Small-cap
growth
(8)
   
6,927
     
     
6,927
     
 
Small-cap
core
(9)
   
3,139
     
     
3,139
     
 
International equity
(10)
   
25,760
     
     
25,760
     
 
Fixed Income Funds:


Fixed Income – U.S. Core
(11)
   
72,765
     
     
72,765
     
 
Intermediate duration
(12)
   
24,517
     
     
24,517
     
 
Equity Securities:


Company common stock
   
28,185
     
28,185


Cash Equivalents:


Money market
*
   
4,789
     
1,810
     
2,979


$
242,558
   
$
29,995
   
$
212,563
   
$
 
                                 
*
Includes cash equivalent investments in equity and fixed income strategies.
(1)
This category contains large-cap stocks with above-average yield. The portfolio typically holds between
60
and
70
stocks.
(2)
This category seeks long-term capital appreciation by investing primarily in large growth companies based in the U.S.
(3)
This fund tracks the performance of the S&P 500 Index by purchasing the securities represented in the Index in approximately the same weightings as the Index.
(4)
This category employs an indexing investment approach designed to track the performance of the CRSP US Mid-Cap Value Index.
(5)
This category employs an indexing investment approach designed to track the performance of the CRSP US Mid-Cap Growth Index.
(6)
This category seeks to track the performance of the S&P Midcap 400 Index.
(7)
This category consists of a selection of investments based on the Russell 2000 Value Index.
(8)
This category consists of a mutual fund invested in small cap growth companies along with a fund invested in a selection of investments based on the Russell 2000 Growth Index.
(9)
This category consists of a mutual fund investing in readily marketable securities of U.S. companies with market capitalizations within the smallest 10% of the market universe, or smaller than the 1000th largest US company.
(10)
This category invests primarily in medium to large non-US companies in developed and emerging markets. Under normal circumstances, at least 80% of total assets will be invested in equity securities, including common stocks, preferred stocks, and convertible securities.
(11)
This category currently includes equal investments in three mutual funds, two of which usually hold at least 80% of fund assets in investment grade fixed income securities, seeking to outperform the Barclays US Aggregate Bond Index while maintaining a similar duration to that index. The third fund targets investments of 50% or more in mortgage-backed securities guaranteed by the US government and its agencies.
(12)
This category consists of a mutual fund which invest in a diversified portfolio of high-quality bonds and other fixed income securities, including U.S. Government obligations, mortgage-related and asset backed securities, corporate and municipal bonds, CMOs, and other securities mostly rated A or better.
 
117
 

Table of Contents
Current Asset Allocation
The asset allocations for the Retirement Plan as of December 31, 2019 and 2018 were as follows:
 
At December 31,
 
 
2019
   
2018
 
Equity securities
   
58
%    
57
%
Debt securities
   
40
     
41
 
Cash equivalents
   
2
     
2
 
                 
Total
   
100
%    
100
%
                 
Determination of Long-Term Rate of Return
The long-term rate of return on Retirement Plan assets assumption was based on historical returns earned by equities and fixed income securities, and adjusted to reflect expectations of future returns as applied to the Retirement Plan’s target allocation of asset classes. Equities and fixed income securities were assumed to earn long-term rates of return in the ranges of
6
% to
8
% and
3
% to
5
%, respectively, with an assumed long-term inflation rate of 2.5% reflected within these ranges. When these overall return expectations are applied to the Retirement Plan’s target allocations, the result is an expected rate of return of
5
% to
7
%.
Expected Contributions
The Company does not expect to contribute to the Retirement Plan in 2020.
Expected Future Annuity Payments
The following annuity payments, which reflect expected future service, as appropriate, are expected to be paid by the Retirement Plan during the years indicated:
(in thousands)
 
 
2020
 
$
8,016
 
2021
   
7,855
 
2022
   
7,932
 
2023
   
8,031
 
2024
   
8,271
 
2025 and thereafter
   
43,671
 
         
Total
 
$
83,776
 
         
Qualified Savings Plan
The Company maintains a defined contribution qualified savings plan in which all full-time employees are able to participate after three months of service and having attained age 21. No matching contributions were made by the Company to this plan during the years ended December 31, 2019 or 2018.
Post-Retirement Health and Welfare Benefits
The Company offers certain post-retirement benefits, including medical, dental, and life insurance (the “
Health
& Welfare Plan”) to retired employees, depending on age and years of service at the time of retirement. The costs of such benefits are accrued during the years that an employee renders the necessary service.
The Health & Welfare Plan is an unfunded plan and is not expected to hold assets for investment at any time. Any contributions made to the Health & Welfare Plan are used to immediately pay plan premiums and claims as they come due.
 
118
 

Table of Contents
The following table sets forth certain information regarding the Health & Welfare Plan as of the dates indicated:
 
December 31,
 
(in thousands)
 
2019
   
2018
 
Change in benefit obligation:


Benefit obligation at beginning of year
  $
13,583
    $
16,349
 
Interest cost
   
512
     
513
 
Actuarial gain
   
(1,233
)    
(2,248
)
Premiums and claims paid
   
(964
)    
(1,031
)
                 
Benefit obligation at end of year
  $
11,898
    $
13,583
 
                 
Change in plan assets:


Fair value of assets at beginning of year
  $
    $
—  
 
Employer contribution
   
964
     
1,031
 
Premiums and claims paid
   
(964
)    
(1,031
)
                 
Fair value of assets at end of year
  $
    $
—  
 
                 
Funded status (included in “Other liabilities”)
  $
(11,898
)   $
(13,583
)
                 
Changes recognized in other comprehensive income for the year ended December 31:


Amortization of prior service cost
  $
249
    $
249
 
Amortization of actuarial gain
   
(124
)    
(309
)
Net actuarial (gain) loss arising during the year
   
(1,234
)    
(2,248
)
                 
Total recognized in other comprehensive
income
for the year
(pre-tax)
  $
(1,109
)   $
(2,308
)
                 
Accumulated other comprehensive loss
(pre-tax)
not yet recognized in net periodic benefit cost at December 31:


Prior service cost
  $
(536
)   $
(785
)
Actuarial loss, net
   
1,466
     
2,823
 
                 
Total accumulated other comprehensive
income
(pre-tax)
  $
930
    $
2,038
 
                 
The discount rates used in the preceding table were
2.9
% and
3.9
%, respectively, at December 31, 2019 and 2018.
The estimated net actuarial loss and the prior service liability that will be amortized from AOCL into net periodic benefit cost in 2020 are $
25,000
and $
249,000
, respectively.
The following table presents the components of net periodic benefit cost for the years indicated:
 
Years Ended December 31,
 
(in thousands)
 
2019
   
2018
   
2017
 
Components of Net Periodic Benefit Cost:


Service cost
  $
    $
—  
    $
—  
 
Interest cost
   
512
     
513
     
577
 
Amortization of past-service liability
   
(249
)    
(249
)    
(249
)
Amortization of net actuarial loss
   
124
     
309
     
274
 
                         
Net periodic benefit cost
  $
387
    $
573
    $
602
 
                         
The following table presents the weighted average assumptions used in determining the net periodic benefit cost for the years indicated:
 
Years Ended December 31,
 
 
2019
   
2018
   
2017
 
Discount rate
   
3.9
%    
3.3
%    
3.7
%
Current medical trend rate
   
6.5
     
6.5
     
6.5
 
Ultimate trend rate
   
5.0
     
5.0
     
5.0
 
Year when ultimate trend rate will be reached
   
2025
     
2024
     
2023
 
 
119
 

Table of Contents
Had the assumed medical trend rate at December 31, 2019 increased by 1% for each future year, the accumulated post-retirement benefit obligation at that date would have increased by $
650,000
, and the aggregate of the benefits earned and the interest components of 2019 net post-retirement benefit cost would each have increased by $
26,000
. Had the assumed medical trend rate decreased by 1% for each future year, the accumulated post-retirement benefit obligation at December 31, 2019 would have declined by $
548,000
, and the aggregate of the benefits earned and the interest components of 2019 net post-retirement benefit cost would each have declined by $
22,000
.
Expected Contributions
The Company expects to contribute $
947,000
 to the Health & Welfare Plan to pay premiums and claims in the fiscal year ending December 31, 2020.
Expected Future Payments for Premiums and Claims
The following amounts are currently expected to be paid for premiums and claims during the years indicated under the Health & Welfare Plan:
(in thousands)
 
 
2020
 
$
947
 
2021
   
920
 
2022
   
887
 
2023
   
858
 
2024
   
827
 
2025 and thereafter
   
3,659
 
         
Total
 
$
8,098
 
         
NOTE 15: STOCK-RELATED BENEFIT PLANS
New York Community Bank Employee Stock Ownership Plan
All full-time employees who have attained 21 years of age and have completed twelve consecutive months of credited service are eligible to participate in the ESOP, with benefits vesting on a six-year basis, starting with 20% in the second year of employment and continuing in 20% increments in each successive year. Benefits are payable upon death, retirement, disability, or separation from service, and may be paid in stock. However, in the event of a change in control, as defined in the ESOP, any unvested portion of benefits shall vest immediately.
In 2019, 2018, and 2017, the Company allocated 349,356, 529,531, and 695,675 shares, respectively, to participants in the ESOP. For the years ended December 31, 2019, 2018, and 2017, the Company recorded ESOP-related compensation expense of $4.2 million, $5.0 million, and $9.2 million, respectively.
Supplemental Executive Retirement Plan
The
Bank
has
established a Supplemental Executive Retirement Plan (“SERP”), which provided additional unfunded,
non-qualified
benefits to certain participants in the ESOP in the form of Company common stock. The SERP was frozen in 1999. Trust-held assets, consisting entirely of Company common stock, amounted to 2,046,449 and 1,929,189 shares, respectively, at December 31, 2019 and 2018, including shares purchased through dividend reinvestment. The cost of these shares is reflected as a reduction of
paid-in
capital in excess of par in the Consolidated Statements of Condition.
Stock Based Compensation
At December 31, 2019, the Company had a total of 2,507,490 shares available for grants as restricted stock, options, or other forms of related rights under the 2012 Stock Incentive Plan, which was approved by the Company’s shareholders at its Annual Meeting on June 7, 2012. The Company granted 2,031,198 shares of restricted stock, with an average fair value of $10.45 per share on the date of grant, during the twelve months ended December 31, 2019.
During 2018 and 2017, the Company granted 2,543,023 shares and 2,956,249 shares, respectively, of restricted stock, which had average fair values of $13.50 and $15.16 per share on the respective grant dates. The shares of restricted stock that were granted during the years ended December 31, 2019, 2018, and 2017 vest over a period of five years. Compensation and benefits expense related to the restricted stock grants is recognized on a straight-line basis over the vesting period and totaled $30.9 million, $36.3 million, and $36.0 million, respectively, for the years ended December 31, 2019, 2018, and 2017.
 
120
 

Table of Contents
The following table provides a summary of activity with regard to restricted stock awards in the year ended December 31, 2019:
 
For the Year Ended December 31, 2019
 
 
Number of Shares
   
Weighted Average
Grant Date
Fair Value
 
Unvested at beginning of year
   
6,904,388
     
$
14.74
 
Granted
   
2,031,198
     
10.45
 
Vested
   
(2,203,895
)    
15.18
 
Canceled
   
(215,590
)    
12.89
 
                 
Unvested at end of year
   
6,516,101
     
13.31
 
                 
As of December 31, 2019, unrecognized compensation cost relating to unvested restricted stock totaled $63.3 million. This amount will be recognized over a remaining weighted average period of 2.7 years.
In addition, during the twelve months ended December 31, 2019, the Company granted 418,674 Performance-Based Restricted Stock Units (“PSUs”). The PSUs have a performance period of January 1, 2019 to December 31, 2021 and vest on April 1, 2022, subject to adjustment or forfeiture, based upon the achievement by the Company of certain performance standards. Compensation and benefits expense related to PSUs is recognized using the fair value as of the date the units were approved, on a straight-line basis over the vesting period and totaled $1.1
million
for the twelve months ended December 31, 2019, respectively. As of December 31, 2019, the Company believes it is probable that the performance conditions will be met.
NOTE 16: FAIR VALUE MEASUREMENTS
GAAP sets forth a definition of fair value, establishes a consistent framework for measuring fair value, and requires disclosure for each major asset and liability category measured at fair value on either a recurring or
non-recurring
basis. GAAP also clarifies that fair value is an “exit” price, representing the amount that would be received when selling an asset, or paid when transferring a liability, in an orderly transaction between market participants. Fair value is thus a market-based measurement that should be determined based on assumptions that market participants would use in pricing an asset or liability. As a basis for considering such assumptions, GAAP establishes a three-tier fair value hierarchy, which prioritizes the inputs used in measuring fair value as follows:
  Level 1 – Inputs to the valuation methodology are quoted prices (unadjusted) for identical assets or liabilities in active markets.
  Level 2 – Inputs to the valuation methodology include quoted prices for similar assets and liabilities in active markets, and inputs that are observable for the asset or liability, either directly or indirectly, for substantially the full term of the financial instrument.
  Level 3 – Inputs to the valuation methodology are significant unobservable inputs that reflect a company’s own assumptions about the assumptions that market participants use in pricing an asset or liability.
A financial instrument’s categorization within this valuation hierarchy is based upon the lowest level of input that is significant to the fair value measurement.
 
121
 

Table of Contents
The following tables present assets and liabilities that were measured at fair value on a recurring basis as of December 31, 2019 and 2018, and that were included in the Company’s Consolidated Statements of Condition at those dates:
 
Fair Value Measurements at December 31, 2019
 
(in thousands)
 
Quoted Prices
in Active
Markets for
Identical
Assets
(Level 1)
   
Significant
Other
Observable
Inputs
(Level 2)
   
Significant
Unobservable
Inputs
(Level 3)
   
Netting
Adjustments
   
Total
Fair Value
 
Assets:


Mortgage-Related Debt Securities Available for Sale:


GSE certificates
  $
    $
1,552,623
    $
    $
    $
1,552,623
 
GSE CMOs
   
     
1,801,112


1,801,112
 
                                         
Total mortgage-related debt securities
  $
    $
3,353,735
    $
    $
    $
3,353,735
 
                                         
Other Debt Securities Available for Sale:


U. S. Treasury obligations
  $
41,839
    $
    $
    $
    $
41,839
 
GSE debentures
   
     
1,094,240


1,094,240
 
Asset-backed securities
   
     
373,254


373,254
 
Municipal bonds
   
     
26,892


26,892
 
Corporate bonds
   
     
867,182


867,182
 
Capital trust notes
   
     
95,915


95,915
 
                                         
Total other debt securities
  $
41,839
    $
2,457,483
    $
    $
    $
2,499,322
 
                                         
Total debt securities available for sale
  $
41,839
    $
5,811,218
    $
    $
    $
5,853,057
 
                                         
Equity securities:


Preferred stock
  $
15,414
    $
    $
    $
    $
15,414
 
Mutual funds and common stock
   
     
17,416


17,416
 
                                         
Total equity securities
  $
15,414
    $
17,416
    $
    $
    $
32,830
 
                                         
Total securities
  $
57,253
    $
5,828,634
    $
    $
    $
5,885,887


Fair Value Measurements at December 31, 2018
 
(in thousands)
 
Quoted Prices
in Active
Markets for
Identical
Assets
(Level 1)
   
Significant
Other
Observable
Inputs
(Level 2)
   
Significant
Unobservable
Inputs
(Level 3)
   
Netting
Adjustments
   
Total
Fair Value
 
Assets:


Mortgage-Related Debt Securities Available for Sale:


GSE certificates
  $
—  
    $
1,707,521
    $
—  
    $
—  
    $
1,707,521
 
GSE CMOs
   
—  
     
1,252,761
     
—  
     
—  
     
1,252,761
 
                                         
Total mortgage-related debt securities
  $
—  
    $
2,960,282
    $
—  
    $
—  
    $
2,960,282
 
                                         
Other Debt Securities Available for Sale:


GSE debentures
  $
—  
    $
1,328,927
    $
—  
    $
—  
    $
1,328,927
 
Asset-backed securities
   
—  
     
387,122
     
—  
     
—  
     
387,122
 
Municipal bonds
   
—  
     
66,183
     
—  
     
—  
     
66,183
 
Corporate bonds
   
—  
     
821,715
     
—  
     
—  
     
821,715
 
Capital trust notes
   
—  
     
49,291
     
—  
     
—  
     
49,291
 
                                         
Total other debt securities
  $
—  
    $
2,653,238
    $
—  
    $
—  
    $
2,653,238
 
                                         
Total debt securities available for sale
  $
—  
    $
5,613,520
    $
—  
    $
—  
    $
5,613,520
 
                                         
Equity securities:


Preferred stock
  $
13,846
    $
—  
    $
—  
    $
—  
    $
13,846
 
Mutual funds and common stock
   
—  
     
16,705
     
—  
     
—  
     
16,705
 
                                         
Total equity securities
  $
13,846
    $
16,705
    $
—  
    $
—  
    $
30,551
 
                                         
Total securities
  $
13,846
    $
5,630,225
    $
—  
    $
—  
    $
5,644,071


122
 

Table of Contents
The Company reviews and updates the fair value hierarchy classifications for its assets on a quarterly basis. Changes from one quarter to the next that are related to the observability of inputs for a fair value measurement may result in a reclassification from one hierarchy level to another.
A description of the methods and significant assumptions utilized in estimating the fair values of securities follows:
Where quoted prices are available in an active market, securities are classified within Level 1 of the valuation hierarchy. Level 1 securities include highly liquid government securities and exchange-traded securities.
If quoted market prices are not available for a specific security, then fair values are estimated by using pricing models. These pricing models primarily use market-based or independently sourced market parameters as inputs, including, but not limited to, yield curves, interest rates, equity or debt prices, and credit spreads. In addition to observable market information, models incorporate transaction details such as maturity and cash flow assumptions. Securities valued in this manner would generally be classified within Level 2 of the valuation hierarchy, and primarily include such instruments as mortgage-related and corporate debt securities.
Periodically, the Company uses fair values supplied by independent pricing services to corroborate the fair values derived from the pricing models. In addition, the Company reviews the fair values supplied by independent pricing services, as well as their underlying pricing methodologies, for reasonableness. The Company challenges pricing service valuations that appear to be unusual or unexpected.
While the Company believes its valuation methods are appropriate, and consistent with those of other market participants, the use of different methodologies or assumptions to determine the fair values of certain financial instruments could result in different estimates of fair values at a reporting date.
Fair Value Option
Gains and Losses Included in Income for Assets Where the Fair Value Option Has Been Elected
The assets accounted for under the fair value option are initially measured at fair value. Gains and losses from the initial measurement and subsequent changes in fair value are recognized in earnings. The following table presents the changes in fair value related to initial measurement, and the subsequent changes in fair value included in earnings, for MSRs for the periods indicated:
 
(Loss) Gain Included in
Mortgage Banking Income
from Changes in Fair Value
 
(1)
 
 
For the Twelve Months Ended December 31,
 
(in thousands)
 
2019
   
2018
   
2017
 
Loans held for sale
  $
    $
—  
    $
899
 
Mortgage servicing rights
   
     
(224
)    
(20,076
)
                         
Total loss
  $
    $
(224
)   $
(19,177
)
                         
(1)
Included in
“Non-interest
income.”
 
123
 

Table of Contents
Assets Measured at Fair Value on a
Non-Recurring
Basis
Certain assets are measured at fair value on a
non-recurring
basis. Such instruments are subject to fair value adjustments under certain circumstances (e.g., when there is evidence of impairment). The following tables present assets that were measured at fair value on a
non-recurring
basis as of December 31, 2019 and 2018, and that were included in the Company’s Consolidated Statements of Condition at those dates:
 
Fair Value Measurements at December 31, 2019 Using
 
(in thousands)
 
Quoted Prices in
Active Markets for
Identical Assets
(Level 1)
   
Significant Other
Observable Inputs
(Level 2)
   
Significant
Unobservable Inputs
(Level 3)
   
Total Fair
Value
 
Certain impaired loans
(1)
 
$
   
$
   
$
42,767
   
$
42,767
 
Other assets
(2)


1,481
     
1,481
 
                                 
Total
 
$
   
$
   
$
44,248
   
$
44,248
 
                                 
(1)
Represents the fair value of impaired loans, based on the value of the collateral.
(2)
Represents the fair value of repossessed assets, based on the appraised value of the collateral subsequent to its initial classification as repossessed assets.
 
Fair Value Measurements at December 31, 2018 Using
 
(in thousands)
 
Quoted Prices in
Active Markets for
Identical Assets
(Level 1)
   
Significant Other
Observable Inputs
(Level 2)
   
Significant
Unobservable Inputs
(Level 3)
   
Total Fair
Value
 
Certain impaired loans
(1)
  $
—  
    $
—  
    $
38,213
    $
38,213
 
Other assets
(2)
   
—  
     
—  
     
1,265
     
1,265
 
                                 
Total
  $
—  
    $
—  
    $
39,478
    $
39,478
 
                                 
(1)
Represents the fair value of impaired loans, based on the value of the collateral.
(2)
Represents the fair value of repossessed assets, based on the appraised value of the collateral subsequent to its initial classification as repossessed assets.
The fair values of collateral-dependent impaired loans are determined using various valuation techniques, including consideration of appraised values and other pertinent real estate and other market data.
Other Fair Value Disclosures
For the disclosure of fair value information about the Company’s
on-
and
off-balance
sheet financial instruments, when available, quoted market prices are used as the measure of fair value. In cases where quoted market prices are not available, fair values are based on present-value estimates or other valuation techniques. Such fair values are significantly affected by the assumptions used, the timing of future cash flows, and the discount rate.
Because assumptions are inherently subjective in nature, estimated fair values cannot be substantiated by comparison to independent market quotes. Furthermore, in many cases, the estimated fair values provided would not necessarily be realized in an immediate sale or settlement of such instruments.
 
124
 

Table of Contents
The following tables summarize the carrying values, estimated fair values, and fair value measurement levels of financial instruments that were not carried at fair value on the Company’s Consolidated Statements of Condition at December 31, 2019 and 2018:
 
December 31, 2019
 
 
Fair Value Measurement Using
 
(in thousands)
 
Carrying
 
Value
   
Estimated
Fair Value
   
Quoted Prices in
Active Markets
for Identical
Assets
(Level 1)
   
Significant
Other
Observable
Inputs
(Level 2)
   
Significant
Unobservable
Inputs
(Level 3)
 
Financial Assets:


Cash and cash equivalents
 
$
741,870
   
$
741,870
   
$
741,870
    $
    $
 
FHLB stock
(1)
   
647,562
     
647,562
     
     
647,562
     
 
Loans and leases, net
   
41,746,517
     
41,699,929


41,699,929
 
Financial Liabilities:


Deposits
 
$
31,657,132
   
$
31,713,945
   
$
17,442,274
(2)
 
  $
14,271,671
(3)
 
  $
 
Borrowed funds
   
14,557,593
     
14,882,776
     
     
14,882,776
     
 
(1)
Carrying value and estimated fair value are at cost.
(2)
Interest-bearing checking and money market accounts, savings accounts, and
non-interest-bearing
accounts.
(3)
Certificates of deposit.
 
December 31, 2018
 
 
Fair Value Measurement Using
 
(in thousands)
 
Carrying
 
Value
   
Estimated
Fair Value
   
Quoted Prices in
Active Markets
for Identical
Assets
(Level 1)
   
Significant
Other
Observable
Inputs
(Level 2)
   
Significant
Unobservable
Inputs
(Level 3)
 
Financial Assets:


Cash and cash equivalents
  $
1,474,955
    $
1,474,955
    $
1,474,955
    $
—  
    $
—  
 
FHLB stock
(1)
   
644,590
     
644,590
     
—  
     
644,590
     
—  
 
Loans and leases, net
   
40,006,088
     
39,461,985
     
—  
     
—  
     
39,461,985
 
Financial Liabilities:


Deposits
  $
30,764,430
    $
30,748,729
    $
18,570,108
(2)
 
  $
12,178,621
(3)
 
  $
—  
 
Borrowed funds
   
14,207,866
     
14,136,526
     
—  
     
14,136,526
     
—  
 
(1)
Carrying value and estimated fair value are at cost.
(2)
Interest-bearing checking and money market accounts, savings accounts, and
non-interest-bearing
accounts.
(3)
Certificates of deposit.
The methods and significant assumptions used to estimate fair values for the Company’s financial instruments follow:
Cash and Cash Equivalents
Cash and cash equivalents include cash and due from banks and federal funds sold. The estimated fair values of cash and cash equivalents are assumed to equal their carrying values, as these financial instruments are either due on demand or have short-term maturities.
Securities
If quoted market prices are not available for a specific security, then fair values are estimated by using pricing models, quoted prices of securities with similar characteristics, or discounted cash flows. These pricing models primarily use market-based or independently sourced market parameters as inputs, including, but not limited to, yield curves, interest rates, equity or debt prices, and credit spreads. In addition to observable market information, pricing models also incorporate transaction details such as maturities and cash flow assumptions.
Federal Home Loan Bank Stock
Ownership in equity securities of the FHLB is generally restricted and there is no established liquid market for their resale. The carrying amount approximates the fair value.
 
125
 

Table of Contents
Loans
The Company discloses the fair value of loans measured at amortized cost using an exit price notion. The Company determined the fair value on substantially all of its loans for disclosure purposes, on an individual loan basis. The discount rates reflect current market rates for loans with similar terms to borrowers having similar credit quality on an exit price basis. The estimated fair values of
non-performing
mortgage and other loans are based on recent collateral appraisals. For those loans where a discounted cash flow technique was not considered reliable, the Company used a quoted market price for each individual loan.
Deposits
The fair values of deposit liabilities with no stated maturity (i.e., interest-bearing checking and money market accounts, savings accounts, and
non-interest-bearing
accounts) are equal to the carrying amounts payable on demand. The fair values of CDs represent contractual cash flows, discounted using interest rates currently offered on deposits with similar characteristics and remaining maturities. These estimated fair values do not include the intangible value of core deposit relationships, which comprise a portion of the Company’s deposit base.
Borrowed Funds
The estimated fair value of borrowed funds is based either on bid quotations received from securities dealers or the discounted value of contractual cash flows with interest rates currently in effect for borrowed funds with similar maturities and structures.
Off-Balance
Sheet Financial Instruments
The fair values of commitments to extend credit and unadvanced lines of credit are estimated based on an analysis of the interest rates and fees currently charged to enter into similar transactions, considering the remaining terms of the commitments and the creditworthiness of the potential borrowers. The estimated fair values of such
off-balance
sheet financial instruments were insignificant at December 31, 2019 and 2018.
NOTE 17: DIVIDEND RESTRICTIONS
The Parent Company is a separate legal entity from the Bank and must provide for its own liquidity. In addition to operating expenses and any share repurchases, the Parent Company is responsible for paying any dividends declared to the Company’s shareholders. As a Delaware corporation, the Parent Company is able to pay dividends either from surplus or, in case there is no surplus, from net profits for the fiscal year in which the dividend is declared and/or the preceding fiscal year.
Various legal restrictions limit the extent to which the Company’s subsidiary bank can supply funds to the Parent Company and its
non-bank
subsidiaries. The Company’s subsidiary bank would require the approval of the Superintendent of the NYSDFS if the dividends they declared in any calendar year were to exceed the total of their respective net profits for that year combined with their respective retained net profits for the preceding two calendar years, less any required transfer to
paid-in
capital. The term “net profits” is defined as the remainder of all earnings from current operations plus actual recoveries on loans, investments, and other assets, after deducting from the total thereof all current operating expenses, actual losses if any, and all federal, state, and local taxes. In 2019, dividends of $
380.0
 
million were paid by the Bank to the Parent Company; at December 31, 2019, the Bank could have paid additional dividends of $
305.7
 
million to the Parent Company without regulatory approval.
NOTE 18: PARENT COMPANY-ONLY FINANCIAL INFORMATION
The following tables present the condensed financial statements for New York Community Bancorp, Inc. (Parent Company only):
Condensed Statements of Condition
 
December 31,
 
(in thousands)
 
2019
   
2018
 
ASSETS:


Cash and cash equivalents
 
$
183,063
    $
228,618
 
Investments in subsidiaries
   
7,169,066
     
7,064,341
 
Receivables from subsidiaries
   
2,249
     
6,455
 
Other assets
   
23,338
     
23,724
 
                 
Total assets
 
$
 
7,377,716
    $
7,323,138
 
                 
LIABILITIES AND STOCKHOLDERS’ EQUITY:


Junior subordinated debentures
 
$
359,866
    $
359,508
 
Subordinated notes
   
295,066
     
294,697
 
Other liabilities
   
11,090
     
13,698
 
                 
Total liabilities
   
666,022
     
667,903
 
                 
Stockholders’ equity
   
6,711,694
     
6,655,235
 
                 
Total liabilities and stockholders’ equity
 
$
7,377,716
    $
7,323,138


126

Table of Contents
Condensed Statements of Income
 
Years Ended December 31,
 
(in thousands)
 
2019
   
2018
   
2017
 
Interest income
 
$
668
    $
500
    $
943
 
Dividends received from subsidiaries
   
380,000
     
380,000
     
336,000
 
Other income
   
716
     
793
     
1,700
 
                         
Gross income
   
381,384
     
381,293
     
338,643
 
Operating expenses
   
49,926
     
59,372
     
54,333
 
                         
Income before income tax benefit and equity in underdistributed earnings of subsidiaries
   
331,458
     
321,921
     
284,310
 
Income tax benefit
   
13,669
     
16,616
     
19,575
 
                         
Income before equity in underdistributed earnings of subsidiaries
   
345,127
     
338,537
     
303,885
 
Equity in underdistributed earnings of subsidiaries
   
49,916
     
83,880
     
162,316
 
                         
Net income
 
$
395,043
    $
422,417
    $
466,201


127
 

Table of Contents
Condensed Statements of Cash Flows
 
Years Ended December 31,
 
(in thousands)
 
2019
   
2018
   
2017
 
CASH FLOWS FROM OPERATING ACTIVITIES:


Net income
 
$
395,043
    $
422,417
    $
466,201
 
Change in other assets
   
386
     
256
     
10,122
 
Change in other liabilities
   
(2,608
)    
(1,152
)    
(36,226
)
Other, net
   
32,776
     
36,677
     
36,330
 
Equity in underdistributed earnings of subsidiaries
   
(49,916
)    
(83,880
)    
(162,316
)
                         
Net cash provided by operating activities
   
375,681
     
374,318
     
314,111
 
                         
CASH FLOWS FROM INVESTING ACTIVITIES:


Proceeds from sales and repayments of securities
   
     
—  
     
2,000
 
Change in receivable from subsidiaries, net
   
4,206
     
(1,705
)    
3,089
 
Investment in subsidiaries
   
     
—  
     
(420,000
)
                         
Net cash
provide
d
by (
used in
)
investing activities
   
4,206
     
(1,705
)    
(414,911
)
                         
CASH FLOWS FROM FINANCING ACTIVITIES:


Treasury stock repurchased
   
(75,220
)    
(163,249
)    
(18,463
)
Cash dividends paid on common and preferred stock
   
(350,222
)    
(365,889
)    
(356,768
)
Proceeds from issuance of preferred stock
   
     
—  
     
502,840
 
Proceeds from issuance of subordinated notes
   
     
294,607
     
—  
 
                         
Net cash (used in) provided by financing activities
   
(425,442
)    
(234,531
)    
127,609
 
                         
Net (decrease)
i
ncrease
in cash and cash equivalents
   
(45,555
)    
138,082
     
26,809
 
Cash and cash equivalents at beginning of year
   
228,618
     
90,536
     
63,727
 
                         
Cash and cash equivalents at end of year
 
$
183,063
    $
228,618
    $
90,536
 
                         
NOTE 19: CAPITAL
The Company is subject to examination, regulation, and periodic reporting under the Bank Holding Company Act of 1956, as amended, which is administered by the FRB. The FRB has adopted capital adequacy guidelines for bank holding companies (on a consolidated basis) that are substantially similar to those of the FDIC for the Bank.
The following tables present the regulatory capital ratios for the Company at December 31, 2019 and 2018, in comparison with the minimum amounts and ratios required by the FRB for capital adequacy purposes:
 
Risk-Based Capital
   
 
At December 31, 2019
 
Common Equity
Tier 1
   
Tier 1
   
Total
   
Leverage Capital
 
(dollars in thousands)
 
Amount
   
Ratio
   
Amount
   
Ratio
   
Amount
   
Ratio
   
Amount
   
Ratio
 
Total capital
 
$
3,818,311
     
9.91
%  
$
4,321,151
     
11.22
%  
$
5,111,990
     
13.27
%  
$
4,321,151
     
8.66
%
Minimum for capital adequacy purposes
   
1,733,826
     
4.50
     
2,311,768
     
6.00
     
3,082,358
     
8.00
     
1,996,966
     
4.00
 
                                                                 
Excess
 
$
2,084,485
     
5.41
%  
$
2,009,383
     
5.22
%  
$
2,029,632
     
5.27
%  
$
2,324,185
     
4.66
%
                                                                 
 
Risk-Based Capital
   
 
At December 31, 2018
 
Common Equity
Tier 1
   
Tier 1
   
Total
   
Leverage Capital
 
(dollars in thousands)
 
Amount
   
Ratio
   
Amount
   
Ratio
   
Amount
   
Ratio
   
Amount
   
Ratio
 
Total capital
  $
3,806,857
     
10.55
%   $
4,309,697
     
11.94
%   $
5,112,079
     
14.16
%   $
4,309,697
     
8.74
%
Minimum for capital adequacy purposes
   
1,624,366
     
4.50
     
2,165,822
     
6.00
     
2,887,763
     
8.00
     
1,972,440
     
4.00
 
                                                                 
Excess
  $
2,182,491
     
6.05
%   $
2,143,875
     
5.94
%   $
2,224,316
     
6.16
%   $
2,337,257
     
4.74
%
                                                                 
At December 31, 2019, our total risk-based capital ratio exceeded the minimum requirement for capital adequacy purposes by
527
basis points and the fully
phased-in
capital conservation buffer by
277
basis points.
 
128
 

Table of Contents
The Bank is subject to regulation, examination, and supervision by the NYSDFS and the FDIC (the “Regulators”). The Bank is also governed by numerous federal and state laws and regulations, including the FDIC Improvement Act of 1991, which established five categories of capital adequacy ranging from “well capitalized” to “critically undercapitalized.” Such classifications are used by the FDIC to determine various matters, including prompt corrective action and each institution’s FDIC deposit insurance premium assessments. Capital amounts and classifications are also subject to the Regulators’ qualitative judgments about the components of capital and risk weightings, among other factors.
The quantitative measures established to ensure capital adequacy require that banks maintain minimum amounts and ratios of leverage capital to average assets and of common equity tier 1 capital, tier 1 capital, and total capital to risk-weighted assets (as such measures are defined in the regulations). At December 31, 201
9
, the Bank exceeded all the capital adequacy requirements to which they were subject.
As of December 31, 2019, the Company and the Bank are categorized as “well capitalized” under the regulatory framework for prompt corrective action. To be categorized as well capitalized, a bank must maintain a minimum common equity tier 1 risk-based capital ratio of
6.50
%; a minimum tier 1 risk-based capital ratio of
8.00
%; a minimum total risk-based capital ratio of
10.00
%; and a minimum leverage capital ratio of
5.00
%. In the opinion of management, no conditions or events have transpired since December 31, 2019 to change these capital adequacy classifications.
The following tables present the actual capital amounts and ratios for the Bank at December 31, 2019 and 2018 in comparison to the minimum amounts and ratios required for capital adequacy purposes.
 
Risk-Based Capital
   
 
At December 31, 2019
 
Common Equity
Tier 1
   
Tier 1
   
Total
   
Leverage Capital
 
(dollars in thousands)
 
Amount
   
Ratio
   
Amount
   
Ratio
   
Amount
   
Ratio
   
Amount
   
Ratio
 
Total capital
 
$
4,785,217
     
12.42
%  
$
4,785,217
     
12.42
%  
$
4,933,900
     
12.81
%  
$
4,785,217
     
9.59
%
Minimum for capital adequacy purposes
   
1,733,085
     
4.50
     
2,310,780
     
6.00
     
3,081,040
     
8.00
     
1,996,288
     
4.00
 
                                                                 
Excess
 
$
3,052,132
     
7.92
%  
$
2,474,437
     
6.42
%  
$
1,852,860
     
4.81
%  
$
2,788,929
     
5.59
%
                                                                 
 
Risk-Based Capital
   
 
At December 31, 2018
 
Common Equity
Tier 1
   
Tier 1
   
Total
   
Leverage Capital
 
(dollars in thousands)
 
Amount
   
Ratio
   
Amount
   
Ratio
   
Amount
   
Ratio
   
Amount
   
Ratio
 
Total capital
  $
4,725,497
     
13.10
%   $
4,725,497
     
13.10
%   $
4,886,450
     
13.54
%   $
4,725,497
     
9.58
%
Minimum for capital adequacy purposes
   
1,623,575
     
4.50
     
2,164,766
     
6.00
     
2,886,355
     
8.00
     
1,972,625
     
4.00
 
                                                                 
Excess
  $
3,101,922
     
8.60
%   $
2,560,731
     
7.10
%   $
2,000,095
     
5.54
%   $
2,752,872
     
5.58
%
                                                                 
Preferred Stock
On March 17, 2017, the Company issued
20,600,000
depositary shares, each representing a 1/40th interest in a share of the Company’s
Fixed-to-Floating
Rate Series A Noncumulative Perpetual Preferred Stock, par value $
0.01
per share, with a liquidation preference of $
1,000
per share (equivalent to $
25
per depositary share). Dividends will accrue on the depositary shares at a fixed rate equal to
6.375
% per annum until March 17, 2027, and a floating rate equal to Three-month LIBOR plus 382.1 basis points per annum beginning on March 17, 2027.
Dividends will be payable in arrears on March 17, June 17, September 17, and December 17 of each year, which commenced on June 17, 2017.
Treasury Stock Repurchases
On October 23, 2018, the Board of Directors approved the repurchase of up to $
300
 million of the Company’s outstanding common stock. During the years ended December 31, 2019 and 2018, the Company repurchased
7.1
 million and
16.8
 million shares, at a cost of $
67.1
 million and $
160.8
 million, respectively.
 
129

Table of Contents
Report of Independent Registered Public Accounting Firm
To the Stockholders and Board of Directors
New York Community Bancorp, Inc.:
Opinion on the Consolidated Financial Statements
We have audited the accompanying consolidated statements of condition of New York Community Bancorp, Inc. and subsidiaries (the Company) as of December 31, 2019 and 2018, the related consolidated statements of income and comprehensive income, changes in stockholders’ equity, and cash flows for each of the years in the
three-year
period ended December 31, 2019, and the related notes (collectively, the consolidated financial statements). In our opinion, the consolidated financial statements present fairly, in all material respects, the financial position of the Company as of December 31, 2019 and 2018, and the results of its operations and its cash flows for each of the years in the
three-year
period ended December 31, 2019, in conformity with U.S. generally accepted accounting principles.
We also have audited, in accordance with the standards of the Public Company Accounting Oversight Board (United States) (PCAOB), the Company’s internal control over financial reporting as of December 31, 2019, based on criteria established in
Internal Control – Integrated Framework (2013)
 issued by the Committee of Sponsoring Organizations of the Treadway Commission, and our report dated February 28, 2020 expressed an unqualified opinion on the effectiveness of the Company’s internal control over financial reporting
.
Basis for Opinion
These consolidated financial statements are the responsibility of the Company’s management. Our responsibility is to express an opinion on these consolidated financial statements based on our audits. We are a public accounting firm registered with the PCAOB and are required to be independent with respect to the Company in accordance with the U.S. federal securities laws and the applicable rules and regulations of the Securities and Exchange Commission and the PCAOB.
We conducted our audits in accordance with the standards of the PCAOB. Those standards require that we plan and perform the audit to obtain reasonable assurance about whether the consolidated financial statements are free of material misstatement, whether due to error or fraud. Our audits included performing procedures to assess the risks of material misstatement of the consolidated financial statements, whether due to error or fraud, and performing procedures that respond to those risks. Such procedures included examining, on a test basis, evidence regarding the amounts and disclosures in the consolidated financial statements. Our audits also included evaluating the accounting principles used and significant estimates made by management, as well as evaluating the overall presentation of the consolidated financial statements. We believe that our audits provide a reasonable basis for our opinion.
Critical Audit Matter
The critical audit matter communicated below is a matter arising from the current period audit of the consolidated financial statements that was communicated or required to be communicated to the audit committee and that: (1) relates to accounts or disclosures that are material to the consolidated financial statements and (2) involved our especially challenging, subjective, or complex judgment. The communication of a critical audit matter does not alter in any way our opinion on the consolidated financial statements, taken as a whole, and we are not, by communicating the critical audit matter below, providing a separate opinion on the critical audit matter or on the accounts or disclosures to which it relates.
130

Table of Contents
Assessment of the allowance for loan losses related to commercial loans collectively evaluated for impairment
As discussed in Notes 2 and 6 to the consolidated financial statements, the Company’s allowance for loan losses related to commercial loans collectively evaluated for impairment (ALLL), which includes multi-family, commercial real estate, commercial and industrial, and acquisition, development, and construction loan segments, was $146.4 million of the $147.6 million total allowance for loan losses as of December 31, 2019. The Company estimated the ALLL using historical losses and estimated historical loss emergence periods for each loan segment, which are further segmented by loan grades. Such amounts are subsequently adjusted for certain qualitative factors.
We identified the assessment of the ALLL as a critical audit matter because it involved significant measurement uncertainty requiring a high degree of auditor judgment, and knowledge and experience in the industry. This assessment encompassed the evaluation of the ALLL methodology, inclusive of the methodologies used to estimate (1) the historical losses and their key factors and assumptions, including loan grades, the look-back period, the loss emergence periods, and (2) the qualitative factors.
The primary procedures we performed to address the critical audit matter included the following. We tested certain internal controls over the (1) development and approval of the ALLL methodology, (2) determination of the key factors and assumptions used to estimate the historical loss rates, (3) development of the qualitative factors and (4) analysis of the ALLL results, trends, and ratios. We tested the Company’s process to develop the ALLL estimate. Specifically, we tested the sources of data and assumptions that the Company used by considering whether they were relevant and reliable, and whether additional factors and alternative assumptions should be used. We evaluated trends in the total ALLL, including the qualitative factors, for consistency with trends in the loan portfolio growth and credit performance. We tested the look-back period, by evaluating (1) if the loss data in the look-back period is representative of the credit characteristics of the current loan portfolio and (2) the sufficiency of the loss data within the look-back period. We tested the qualitative factor methodology and related factors by:
  evaluating the metrics, including the relevance of sources of data and assumptions, used to allocate the qualitative factors, and
 
 
  analyzing the determination of each qualitative factor.
 
 
We involved credit risk professionals with specialized industry knowledge and experience, who assisted in evaluating the:
  Company’s ALLL methodology for compliance with U.S. generally accepted accounting principles,
 
 
  maximum qualitative factors on the highest losses over the course of the look-back period,
 
 
  length of the look-back period,
 
 
  methodology used to develop the loss emergence period assumption,
 
 
  individual loan grades for a selection of loans by evaluating the financial performance of the borrower and the underlying collateral, and
 
 
  methodology used to develop the resulting qualitative factors and effect of those factors on the ALLL compared to relevant credit risk factors and credit trends.


We have served as the Company’s auditor since 1993.
 
New York, New York
February 28, 2020


131

Table of Contents
Report of Independent Registered Public Accounting Firm
To the Stockholders and Board of Directors
New York Community Bancorp, Inc.:
Opinion on Internal Control Over Financial Reporting
We have audited New York Community Bancorp, Inc. and subsidiaries’ (the Company) internal control over financial reporting as of December 31, 2019, based on criteria established in
Internal Control – Integrated Framework (2013)
 issued by the Committee of Sponsoring Organizations of the Treadway Commission. In our opinion, the Company maintained, in all material respects, effective internal control over financial reporting as of December 31, 2019, based on criteria established in
Internal Control – Integrated Framework (2013)
 issued by the Committee of Sponsoring Organizations of the Treadway Commission.
We also have audited, in accordance with the standards of the Public Company Accounting Oversight Board (United States) (PCAOB), the consolidated statements of condition of the Company as of December 31, 2019 and 2018, the related consolidated statements of income and comprehensive income, changes in stockholders’ equity, and cash flows for each of the years in the three-year period ended December 31, 2019, and the related notes (collectively, the consolidated financial statements), and our report dated February 28, 2020 expressed an unqualified opinion on those consolidated financial statements.
Basis for Opinion
The Company’s management is responsible for maintaining effective internal control over financial reporting and for its assessment of the effectiveness of internal control over financial reporting, included in the accompanying Management’s Report on Internal Control over Financial Reporting. Our responsibility is to express an opinion on the Company’s internal control over financial reporting based on our audit. We are a public accounting firm registered with the PCAOB and are required to be independent with respect to the Company in accordance with the U.S. federal securities laws and the applicable rules and regulations of the Securities and Exchange Commission and the PCAOB.
We conducted our audit in accordance with the standards of the PCAOB. Those standards require that we plan and perform the audit to obtain reasonable assurance about whether effective internal control over financial reporting was maintained in all material respects. Our audit of internal control over financial reporting included obtaining an understanding of internal control over financial reporting, assessing the risk that a material weakness exists, and testing and evaluating the design and operating effectiveness of internal control based on the assessed risk. Our audit also included performing such other procedures as we considered necessary in the circumstances. We believe that our audit provides a reasonable basis for our opinion.
Definition and Limitations of Internal Control Over Financial Reporting
A company’s internal control over financial reporting is a process designed to provide reasonable assurance regarding the reliability of financial reporting and the preparation of financial statements for external purposes in accordance with generally accepted accounting principles. A company’s internal control over financial reporting includes those policies and procedures that (1) pertain to the maintenance of records that, in reasonable detail, accurately and fairly reflect the transactions and dispositions of the assets of the company; (2) provide reasonable assurance that transactions are recorded as necessary to permit preparation of financial statements in accordance with generally accepted accounting principles, and that receipts and expenditures of the company are being made only in accordance with authorizations of management and directors of the company; and (3) provide reasonable assurance regarding prevention or timely detection of unauthorized acquisition, use, or disposition of the company’s assets that could have a material effect on the financial statements.
132

Table of Contents
Because of its inherent limitations, internal control over financial reporting may not prevent or detect misstatements. Also, projections of any evaluation of effectiveness to future periods are subject to the risk that controls may become inadequate because of changes in conditions, or that the degree of compliance with the policies or procedures may deteriorate.
 
 
New York, New York
February 28, 2020


133

Table of Contents
ITEM 9.
CHANGES IN AND DISAGREEMENTS WITH ACCOUNTANTS ON ACCOUNTING AND FINANCIAL DISCLOSURE


None.
ITEM 9A.
CONTROLS AND PROCEDURES


(a) Evaluation of Disclosure Controls and Procedures
Under the supervision, and with the participation, of our Chief Executive Officer and Chief Financial Officer, our management evaluated the effectiveness of the design and operation of the Company’s disclosure controls and procedures pursuant to Rule
13a-15(b),
as adopted by the Securities and Exchange Commission (the “SEC”) under the Securities Exchange Act of 1934 (the “Exchange Act”). Based upon that evaluation, the Chief Executive Officer and Chief Financial Officer concluded that the Company’s disclosure controls and procedures were effective as of the end of the period covered by this annual report.
Disclosure controls and procedures are the controls and other procedures that are designed to ensure that information required to be disclosed in the reports that the Company files or submits under the Exchange Act is recorded, processed, summarized, and reported within the time periods specified in the SEC’s rules and forms. Disclosure controls and procedures include, without limitation, controls and procedures designed to ensure that information required to be disclosed in the reports that the Company files or submits under the Exchange Act is accumulated and communicated to management, including the Chief Executive Officer and Chief Financial Officer, as appropriate, to allow timely decisions regarding required disclosure.
(b) Management’s Report on Internal Control over Financial Reporting
Management of the Company is responsible for establishing and maintaining adequate internal control over financial reporting. Our system of internal control is designed under the supervision of management, including our Chief Executive Officer and Chief Financial Officer, to provide reasonable assurance regarding the reliability of our financial reporting and the preparation of the Company’s financial statements for external reporting purposes in accordance with U.S. generally accepted accounting principles (“GAAP”).
Our internal control over financial reporting includes policies and procedures that pertain to the maintenance of records that, in reasonable detail, accurately and fairly reflect transactions and dispositions of assets; provide reasonable assurances that transactions are recorded as necessary to permit preparation of financial statements in accordance with GAAP, and that receipts and expenditures are made only in accordance with the authorization of management and the Boards of Directors of the Company and the Bank; and provide reasonable assurance regarding prevention or timely detection of unauthorized acquisition, use, or disposition of the Company’s assets that could have a material effect on our financial statements.
Because of its inherent limitations, internal control over financial reporting may not prevent or detect misstatements. Projections of any evaluation of effectiveness to future periods are subject to the risk that the controls may become inadequate because of changes in conditions or that the degree of compliance with policies and procedures may deteriorate.
As of December 31, 2019, management assessed the effectiveness of the Company’s internal control over financial reporting based upon the framework established in
Internal Control—Integrated Framework (2013)
 issued by the Committee of Sponsoring Organizations of the Treadway Commission (“COSO”). Based upon its assessment, management concluded that the Company’s internal control over financial reporting as of December 31, 2019 was effective using this criteria.
The effectiveness of the Company’s internal control over financial reporting as of December 31, 2019 has been audited by KPMG LLP, an independent registered public accounting firm that audited the Company’s consolidated financial statements as of and for the year ended December 31, 2019, as stated in their report, included in Item 8 on the preceding page, which expresses an unqualified opinion on the effectiveness of the Company’s internal control over financial reporting as of December 31, 2019.
134

Table of Contents
(c) Changes in Internal Control over Financial Reporting
There have not been any changes in the Company’s internal control over financial reporting (as such term is defined in Rules
13a-15(f)
and
15d-15(f)
under the Exchange Act) during the fiscal quarter to which this report relates that have materially affected, or are reasonably likely to materially affect, the Company’s internal control over financial reporting.
ITEM 9B.
OTHER INFORMATION


None.
PART III
ITEM 10.
DIRECTORS, EXECUTIVE OFFICERS, AND CORPORATE GOVERNANCE


Information regarding our directors, executive officers, and corporate governance appears in our Proxy Statement for the Annual Meeting of Shareholders to be held on June 3, 2020 (hereafter referred to as our “2020 Proxy Statement”) under the captions “Information with Respect to Nominees, Continuing Directors, and Executive Officers,” “Section 16(a) Beneficial Ownership Reporting Compliance,” “Meetings and Committees of the Board of Directors,” and “Corporate Governance,” and is incorporated herein by this reference.
A copy of our Code of Business Conduct and Ethics, which applies to our Chief Executive Officer, Chief Operating Officer, Chief Financial Officer, and Chief Accounting Officer as officers of the Company, and all other senior financial officers of the Company designated by the Chief Executive Officer from time to time, is available on the Investor Relations portion of our website: www.myNYCB.com and will be provided, without charge, upon written request to the Chief Corporate Governance Officer and Corporate Secretary at 615 Merrick Avenue, Westbury, NY 11590.
ITEM 11.
EXECUTIVE COMPENSATION


Information regarding executive compensation appears in our 2020 Proxy Statement under the captions “Compensation Committee Report,” “Compensation Committee Interlocks and Insider Participation,” “Compensation Discussion and Analysis,” “Executive Compensation and Related Information,” and “Director Compensation,” and is incorporated herein by this reference.
ITEM 12.
SECURITY OWNERSHIP OF CERTAIN BENEFICIAL OWNERS AND MANAGEMENT, AND RELATED STOCKHOLDER MATTERS


The following table provides information regarding the Company’s equity compensation plans at December 31, 2019:
                         
Plan category
 
Number of securities to be
issued upon exercise of
outstanding options,
warrants, and rights
(a)
   
Weighted-average
 exercise
price of outstanding
options, warrants, and
rights
(b)
   
Number of securities
remaining available for
future issuance under
equity compensation plans
(excluding securities
reflected in column (a))
(c)
 
Equity compensation plans approved by security holders
   
—  
     
—  
     
2,507,490
 
Equity compensation plans not approved by security holders
   
—  
     
—  
     
—  
 
                         
Total
   
—  
     
—  
     
2,507,490


Information relating to the security ownership of certain beneficial owners and management appears in our 2020 Proxy Statement under the captions “Security Ownership of Certain Beneficial Owners” and “Information with Respect to Nominees, Continuing Directors, and Executive Officers.”
135

Table of Contents
ITEM 13.
CERTAIN RELATIONSHIPS AND RELATED TRANSACTIONS, AND DIRECTOR INDEPENDENCE
Information regarding certain relationships and related transactions, and director independence, appears in our 2020 Proxy Statement under the captions “Transactions with Certain Related Persons” and “Corporate Governance,” respectively, and is incorporated herein by this reference.
ITEM 14.
PRINCIPAL ACCOUNTING FEES AND SERVICES
Information regarding principal accounting fees and services appears in our 2020 Proxy Statement under the caption “Audit and
Non-Audit
Fees,” and is incorporated herein by this reference.
136

Table of Contents
PART IV
ITEM 15.
EXHIBITS AND FINANCIAL STATEMENT SCHEDULES
(a) Documents Filed As Part of This Report
1. Financial Statements
The following are incorporated by reference from Item 8 hereof:
  Reports of Independent Registered Public Accounting Firm;
  Consolidated Statements of Condition at December 31, 2019 and 2018;
  Consolidated Statements of Income and Comprehensive Income for each of the years in the three-year period ended December 31, 2019;
  Consolidated Statements of Changes in Stockholders’ Equity for each of the years in the three-year period ended December 31, 2019;
  Consolidated Statements of Cash Flows for each of the years in the three-year period ended December 31, 2019; and
  Notes to the Consolidated Financial Statements.
The following are incorporated by reference from Item 9A hereof:
  Management’s Report on Internal Control over Financial Reporting; and
  Changes in Internal Control over Financial Reporting.
2. Financial Statement Schedules
Financial statement schedules have been omitted because they are not applicable or because the required information is provided in the Consolidated Financial Statements or Notes thereto.
3. Exhibits Required by Securities and Exchange Commission Regulation
S-K
The following exhibits are filed as part of this Form
10-K,
and this list includes the Exhibit Index.
         
Exhibit No.


    3.1


    3.2


    3.3


    3.4


    3.5


    4.1


    4.2


    4.3


    4.4
   
137

Table of Contents


    4.5


    4.6
   
Registrant will furnish, upon request, copies of all instruments defining the rights of holders of long-term debt instruments of the registrant and its consolidated subsidiaries.
         
 
  10.1


  10.2


  10.3(P)
   
Form of Change in Control Agreements among the Company, the Bank, and Certain Officers*
(10)
         
 
  10.4(P)
   
Form of Queens County Savings Bank Employee Severance Compensation Plan*
(10)
         
 
  10.5(P)
   
Form of Queens County Savings Bank Outside Directors’ Consultation and Retirement Plan*
(10)
         
 
  10.6(P)
   
Form of Queens County Bancorp, Inc. Employee Stock Ownership Plan and Trust*
(10)
         
 
  10.7(P)
   
Incentive Savings Plan of Queens County Savings Bank*
(11)
         
 
  10.8(P)
   
Retirement Plan of Queens County Savings Bank*
(10)
         
 
  10.9(P)
   
Supplemental Benefit Plan of Queens County Savings Bank*
(12)
         
 
  10.10(P)
   
Excess Retirement Benefits Plan of Queens County Savings Bank*
(10)
         
 
  10.11(P)
   
Queens County Savings Bank Directors’ Deferred Fee Stock Unit Plan*
(10)
         
 
  10.12


  10.13


  10.14


  10.15


  10.16
   
Consulting Agreement between New York Community Bancorp, Inc. and James J. Carpenter*
         
 
  11.0


  21.0


  23.0


  31.1


  31.2


  32.0


101
   
The following materials from the Company’s Annual Report on Form
10-K
for the year ended December 31, 2019, formatted in XBRL (Extensible Business Reporting Language): (i) the Consolidated Statements of Condition, (ii) the Consolidated Statements of Income and Comprehensive Income, (iii) the Consolidated Statements of Changes in Stockholders’ Equity, (iv) the Consolidated Statements of Cash Flows, and (v) the Notes to the Consolidated Financial Statements.
         
 
104
   
Cover Page Interactive Date File (formatted in Inline XBRL and contained in Exhibit 101)
 
* Management plan or compensation plan arrangement.
138

Table of Contents
(1) Incorporated by reference to Exhibits filed with the Company’s Form
10-Q
for the quarterly period ended March 31, 2001 (File No.
 0-22278)
(2) Incorporated by reference to Exhibits filed with the Company’s Form
10-K
for the year ended December 31, 2003 (File No.
 1-31565)
(3) Incorporated by reference to Exhibits to the Company’s Form
8-K
filed with the Securities and Exchange Commission on April 27, 2016 (File No.
 1-31565)
(4) Incorporated herein by reference to 3.4 of the Registrant’s Registration Statement on Form
8-A
(File No.
 333-210919),
as filed with the Securities and Exchange Commission on March 16, 2017
(5) Incorporated by reference to Exhibits filed with the Company’s Form
10-K
for the year ended December 31, 2016 (File No.
 1-31565)
(6) Incorporated by reference to Exhibits filed with the Company’s Form
10-Q
filed with the Securities and Exchange Commission on November 9, 2017 (File No.
 1-31565)
(7) Incorporated by reference to Exhibits filed with the Company’s Form
8-K
filed with the Securities and Exchange Commission on March 17, 2017
(8) Incorporated by reference to Exhibits filed with the Company’s Form
8-k
filed with the Securities and Exchange Commission on March 9, 2006
(9) Incorporated by reference to Exhibits to Form
S-8,
Registration Statement filed on October 4, 2007, Registration No.
 333-146512
(10) Incorporated by reference to Exhibits filed with the Company’s Registration Statement filed on Form
S-1,
Registration No.
 33-66852
(11) Incorporated by reference to Exhibits to Form
S-8,
Registration Statement filed on October 27, 1994, Registration No.
 33-85682
(12) Incorporated by reference to Exhibits filed with the 1995 Proxy Statement for the Annual Meeting of Shareholders held on April 19, 1995
(13) Incorporated by reference to Exhibits filed with the 2006 Proxy Statement for the Annual Meeting of Shareholders held on June 7, 2006
(14) Incorporated by reference to Exhibits filed with the 2012 Proxy Statement for the Annual Meeting of Shareholders held on June 7, 2012
(15) Incorporated by reference to Exhibits filed with the Company’s Form
8-K
filed with the Securities and Exchange Commission on November 6, 2018 (File No.
 1-31565)
ITEM 16.
FORM
10-K
SUMMARY
None.
139

Table of Contents
SIGNATURES
Pursuant to the requirements of Section 13 or 15(d) of the Securities Exchange Act of 1934, the registrant has duly caused this report to be signed on its behalf by the undersigned, thereunto duly authorized.
     
February 28, 2020
 
New York Community Bancorp, Inc.
 
(Registrant)
     
 
/s/ Joseph R. Ficalora
 
Joseph R. Ficalora
 
President and Chief Executive Officer
 
(Principal Executive Officer)
Pursuant to the requirements of the Securities Exchange Act of 1934, this report has been signed below by the following persons on behalf of the registrant and in the capacities and on the dates indicated.
                     
/s/ Joseph R. Ficalora
   
2/28/20
   
/s/ Thomas R. Cangemi
   
2/28/20
 
Joseph R. Ficalora


Thomas R. Cangemi


President, Chief Executive Officer,
and Director
   
   
Senior Executive Vice President and
Chief Financial Officer
   
 
(Principal Executive Officer)
   
   
(Principal Financial Officer)


/s/ John J. Pinto
   
2/28/20


John J. Pinto


Executive Vice President and
Chief Accounting Officer


(Principal Accounting Officer)


/s/ Dominick Ciampa
   
2/28/20
   
/s/ Hanif W. Dahya
   
2/28/20
 
Dominick Ciampa


Hanif W. Dahya


Chairman of the Board of Directors
   
   
Director


/s/ Leslie D. Dunn
   
2/28/20
   
/s/ Michael J. Levine
   
2/28/20
 
Leslie D. Dunn


Michael J. Levine


Director
   
   
Director


/s/ James J. O’Donovan
   
2/28/20
   
/s/ Lawrence Rosano, Jr.
   
2/28/20
 
James J. O’Donovan


Lawrence Rosano, Jr.


Director
   
   
Director


/s/ Ronald A. Rosenfeld
   
2/28/20
   
/s/ Lawrence J. Savarese
   
2/28/20
 
Ronald A. Rosenfeld


Lawrence J. Savarese


Director
   
   
Director


/s/ John M. Tsimbinos
   
2/28/20
   
/s/ Robert Wann
   
2/28/20
 
John M. Tsimbinos


Robert Wann


Director
   
   
Senior Executive Vice President,
Chief Operating Officer, and Director
   
 
140