 Valuation Discussion Materials – June 2, 2008 Meeting with Financial Advisors to Tilman J. Fertitta Project Lasso Exhibit 99.1(c)(5) |
 PROJECT
LASSO Pre-opening is typically an ongoing expense for a growth company.
However, it is not a $4.0 million ongoing expense for Lasso, given the limited expected
future new unit openings. The projection model has $750,000 of pre-opening expense annually in future years, and it is agreed that this is an ongoing expense. Two recent transactions, OSI Restaurant Partners and RARE Hospitality International, are not
comparable and did not have declining unit openings and pre-opening expense in the
relevant projection periods. Both situations had projected continued new unit growth and pre-opening expense consistent with historical levels. For both of these companies, it is agreed that pre-opening is a recurring operating
expense. With Lasso’s pre-opening falling from $4.0 million in 2007 to a
run-rate of $750,000 going forward, the correct ongoing pre-opening expense to
reflect the Company’s growth rate is $750,000. It does not seem appropriate to penalize EBITDA with a level of pre-opening expense that clearly does not reflect the current growth expectations. As a result, $2.9
million of pre-opening for the March 31, 2008 LTM period should be added back to
EBITDA. Determination of EBITDA Pre-opening Expense OSI Restaurant Partners New Unit Growth RARE Hospitality Projected Pre-opening (a) Per OSI Restaurant Partners DEFM14A SEC filing dated April 3, 2007. (b) Per Wall Street research as of February 29, 2008. (c) Per RARE Hospitality International SC-TO-C SEC filing dated August 17, 2007. Projected Fiscal Year Ending December 31, 2006 2007 2008 2009 2010 OSI Restaurant Partners New Unit Growth (a) 122 94 90 95 100 2005A 2006A 2007E 2008E RARE Hospitality Projected Pre-opening (b) $7.5 $8.9 $10.2 $12.5 Darden Post-integration Outlook (c) : Plan on "accelerating new restaurant growth at both concepts" |
 PROJECT
LASSO It is agreed that the $4.5 million of non-recurring legal and litigation costs
related to the stock-based compensation review should be added back to EBITDA. After further discussions with management, it is our view that at a minimum an additional $1.0 million of non- recurring/unusual legal and litigation costs for 2007 should be added back to EBITDA, which is a conservative assumption for the excess legal costs that Lasso incurred in 2007. Determination of EBITDA and Enterprise Value Non-recurring Legal Expense Treatment of Cash in Enterprise Value Enterprise value should be calculated using net debt, not total debt. Adjusted cash is
therefore $35.6 million as of March 31, 2008, which excludes $10.0 million in mandatory
cash that is physically held on premises at the Golden Nugget properties. As a result, net debt would be $849.0 million and enterprise value would be $1,195.0 million.
|
 PROJECT
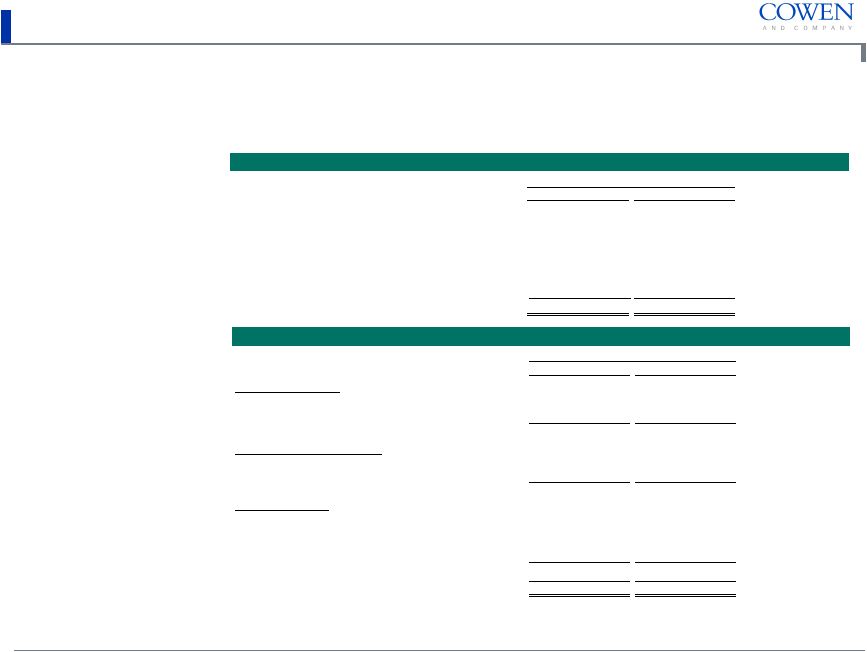
LASSO EBITDA Reconciliation and Transaction Summary LTM EBITDA Reconciliation (US$ in millions) Equity and Enterprise Value Calculation (US$ in millions, shares in thousands) (a) Includes 775,000 shares of restricted stock held by Tilman J. Fertitta that have not vested. (b) Excludes $10.0 million in mandatory cash that is physically held on premises of the Golden Nugget properties per discussions with Lasso management. As of 12/31/07 03/31/08 Basic Equity Value: Basic Shares Outstanding (a) 16,145 16,145 Assumed Offer Price 21.00 $ 21.00 $ Basic Equity Value 339.0 $ 339.0 $ Fully-Diluted Equity Value: Basic Equity Value 339.0 $ 339.0 $ Value of Options 7.0 7.0 Fully-Diluted Equity Value 346.0 $ 346.0 $ Enterprise Value: Fully-Diluted Equity Value 346.0 $ 346.0 $ Plus: Debt Outstanding 888.7 884.6 Less: Cash (b) (29.6) (35.6) Net Debt 859.1 $ 849.0 $ Fully-Diluted Enterprise Value 1,205.1 $ 1,195.0 $ Multiple of EBITDA 6.3x 6.3x LTM as of 12/31/07 03/31/08 Operating Income 111.4 $ 110.7 $ Depreciation and Amortization 65.7 67.3 Pre-opening Expense 3.2 2.9 Stock-based Compensation Expense 4.8 4.4 Leap Year - (1.0) Non-recurring Litigation 5.5 5.5 Adjusted EBITDA 190.6 $ 189.9 $ |
 PROJECT
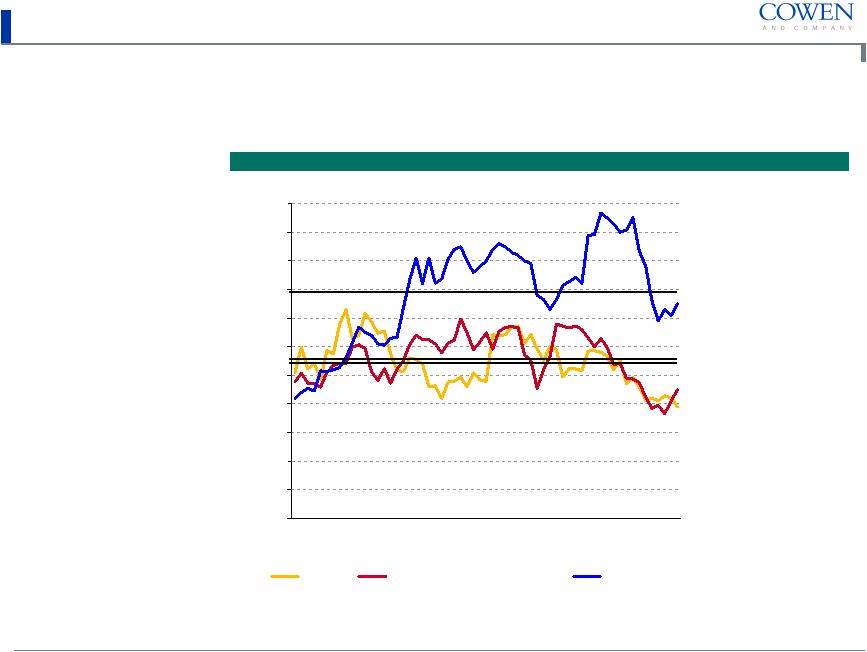
LASSO 2.0x 3.0x 4.0x 5.0x 6.0x 7.0x 8.0x 9.0x 10.0x 11.0x 12.0x 13.0x 5/08 9/06 1/05 5/03 9/01 1/00 5/98 Lasso Comparable Restaurants Comparable Casino and Gaming (Multiple) 10-year Casino Average (8.3x) 10-year Restaurant Average (7.6x) 10-year Lasso Average (6.5x) Historical EBITDA Multiples Analysis of 10-Year Historical LTM EBITDA Trading Multiples Lasso has traded at an average of 6.5x EBITDA over the past 10 years Note: Factset as of May 29, 2008. Comparable Restaurants include: Benihana, Bob Evans, Brinker, California Pizza Kitchen, CBRL Group,
CEC Entertainment, Denny’s Corp., Luby’s, McCormick & Schmick’s, O’Charley’s, Ruby Tuesday and Steak N Shake. Comparable Casino and Gaming includes: Ameristar Casinos, Boyd Gaming, Isle of Capri Casinos,
Monarch Casino and Resort, Pinnacle Entertainment, Riviera Holdings and Trump
Entertainment Resorts. |
 PROJECT
LASSO 2.0x 3.0x 4.0x 5.0x 6.0x 7.0x 8.0x 9.0x 10.0x 11.0x 12.0x 13.0x 5/08 9/06 1/05 5/03 Lasso Comparable Restaurants Comparable Casino and Gaming (Multiple) 5-year Casino Average (9.9x) 5-year Restaurant Average (7.6x) 5-year Lasso Average (7.5x) Historical EBITDA Multiples Analysis of Five-Year Historical LTM EBITDA Trading Multiples Lasso has traded at an average of 7.5x EBITDA over the past five years Note: Factset as of May 29, 2008. Comparable Restaurants include: Benihana, Bob Evans, Brinker, California Pizza Kitchen, CBRL Group,
CEC Entertainment, Denny’s Corp., Luby’s, McCormick & Schmick’s, O’Charley’s, Ruby Tuesday and Steak N Shake. Comparable Casino and Gaming includes: Ameristar Casinos, Boyd Gaming, Isle of Capri Casinos,
Monarch Casino and Resort, Pinnacle Entertainment, Riviera Holdings and Trump Entertainment Resorts. |
 PROJECT
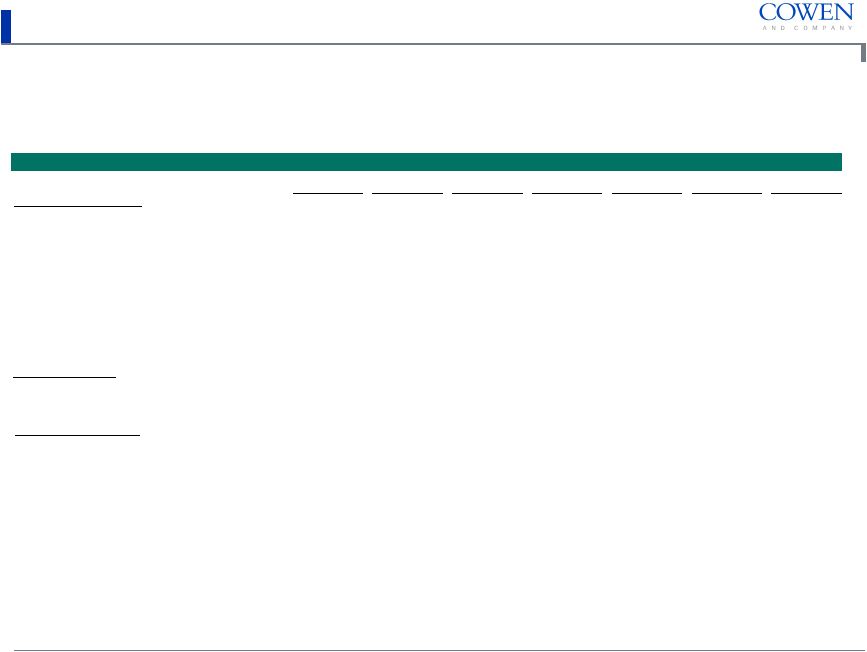
LASSO Price 52 Week FD Enterprise Enterprise Value (a) / LTM PE Ratios (b) 5-Year PE % of SGR (b) 2008 - 2009 Company Name 5/29/2008 Low High Mkt Cap Value (a) Rev EBITDA 2008E 2009E SGR (b) 2008E 2009E Rev Growth Benihana $9.23 $8.79 $25.11 $140.8 $165.2 0.6x 4.2x 11.4x 10.6x 15.0% 76.0% 70.7% 6.4% Bob Evans 29.52 23.93 39.83 921.3 1,209.6 0.7x 6.8x 15.5x 14.4x 14.0% 110.4% 102.9% 3.7% Brinker 21.63 14.65 33.59 2,192.3 3,015.3 0.7x 5.7x 12.8x 11.2x 15.0% 85.6% 74.4% 1.8% California Pizza Kitchen 14.20 9.32 24.71 359.8 417.3 0.6x 5.9x 22.5x 17.8x 12.0% 187.8% 147.9% 7.7% CBRL Group 30.75 24.00 46.36 681.6 1,457.2 0.6x 6.3x 9.4x 8.4x 11.0% 85.5% 76.2% 5.1% CEC Entertainment 35.72 19.81 39.55 898.7 1,205.6 1.5x 6.4x 15.1x 13.5x 12.0% 125.6% 112.1% 3.2% Denny's Corp. 4.01 2.50 4.99 392.5 726.9 0.8x 7.6x 25.1x 20.1x 30.0% 83.5% 66.8% NM Luby's 7.06 6.81 11.83 200.6 164.9 0.5x 5.3x 18.7x 16.7x 12.0% 155.6% 139.0% 5.6% McCormick & Schmick's 9.69 9.56 30.98 143.7 163.7 0.4x 6.7x 14.9x 12.1x 15.0% 99.4% 80.8% 11.7% O'Charley's 11.36 9.88 23.45 249.1 386.9 0.4x 4.9x 14.6x 12.5x 14.0% 104.0% 89.2% 3.9% Ruby Tuesday 7.71 5.70 27.90 398.7 1,003.9 0.7x 5.8x 16.2x 14.1x 15.0% 108.2% 94.1% NM Steak N Shake 6.66 6.42 17.92 191.2 378.4 0.6x 12.6x NM NM 13.0% NM NM 7.1% Mean 0.7x 6.5x 16.0x 13.7x 14.8% 111.1% 95.8% 5.6% Median 0.6x 6.1x 15.1x 13.5x 14.0% 104.0% 89.2% 5.4% Lasso (c) $21.00 $14.18 $32.30 $346.0 $1,195.0 1.0x 6.3x 16.0x 11.5x 12.0% 133.6% 95.9% 5.0% Comparable Restaurant Analysis — Market Statistics Market Analysis of Select Restaurant Companies (US$ in millions, except per share data) (a) Market Value plus net debt plus minority interest. (b) EPS estimates and Secular Growth Rates (SGR) per Wall Street Research. (c) EPS estimates for Lasso are per management projections and assume pro forma interest from the
refinancing of the $395.7 million, 9.5% interest rate restaurant debt on December 31,
2008 at 11.0% per discussions with Lasso management. |
 PROJECT
LASSO Market Analysis of Select Casino and Gaming Companies (US$ in millions, except per share data) Comparable Casino and Gaming Analysis — Market Statistics (a) Market Value plus net debt plus minority interest. (b) EPS estimates and Secular Growth Rates (SGR) per Wall Street Research. (c) EPS estimates for Lasso are per management projections and assume pro forma interest from the refinancing of the $395.7 million, 9.5% interest rate restaurant debt on December 31, 2008 at 11.0% per discussions with Lasso management. Price 52 Week FD Enterprise Enterprise Value (a) / LTM PE Ratios (b) 5-Year PE % of SGR (b) Company Name 5/29/2008 Low High Mkt Cap Value (a) Rev EBITDA 2008E 2009E SGR (b) 2008E 2009E Ameristar Casinos $18.00 $15.29 $38.00 $1,029.9 $2,570.7 2.2x 9.3x 14.2x 12.3x 10.0% 141.7% 123.3% Boyd Gaming Corp. 16.42 14.97 54.22 1,441.4 3,645.6 1.9x 7.2x 12.4x 11.5x 17.0% 73.2% 67.5% Isle of Capri Casinos 6.87 5.93 25.79 241.9 1,694.4 1.6x 9.5x NM 27.5x 13.0% NA 211.4% Monarch Casino and Resort 13.97 12.53 31.41 247.5 231.7 1.5x 6.0x 18.4x 13.7x 15.0% 122.5% 91.3% Pinnacle Entertainment 14.24 12.12 31.34 853.7 1,592.0 1.7x 18.2x NM 33.1x 15.0% NM 220.8% Riviera Holdings 16.24 14.24 39.12 204.7 405.2 2.0x 9.8x NA NA NA NA NA Trump Entertainment Resorts 3.56 2.29 16.41 146.3 1,727.5 1.8x 13.1x NM NM 15.0% NA NA Mean 1.8x 10.4x 15.0x 19.6x 14.2% 112.5% 142.9% Median 1.8x 9.5x 14.2x 13.7x 15.0% 122.5% 123.3% Lasso (c) $21.00 $14.18 $32.30 $346.0 $1,195.0 1.0x 6.3x 16.0x 11.5x 12.0% 133.6% 95.9% |
 PROJECT
LASSO Comparable Casual Dining M&A Transactions (a) Represents total consideration including the assumption of liabilities and residual cash (enterprise
value) when available. 2005 – 2008 YTD Comparable Casual Dining M&A Transactions (US$ in millions) Enterprise Value/ Date Date Ent. LTM LTM Announced Closed Target Acquirer Val. (a) Revenue EBITDA 5/21/2008 TBD American Restaurant Group (Black Angus Steakhouse) Versa Capital NA NA NA 3/11/2008 TBD Hooters Inc. Chanticleer Holdings 55.1 $ NA NA 12/4/2007 1/3/2008 Smokey Bones Barbeque & Grill Sun Capital 80.0 NA NA 11/6/2007 2/20/2008 Cameron Mitchell Restaurants Ruth's Chris Steak House 92.0 0.9x 7.0x 8/23/2007 8/23/2007 Yard House TSG Consumer Partners 190.0 1.7x 9.5x 8/16/2007 10/1/2007 RARE Hospitality Darden Restaurants 1,368.3 1.3x 11.4x 7/16/2007 11/29/2007 Applebee's IHOP 2,071.0 1.5x 9.2x 7/5/2007 10/22/2007 Champps Entertainment F&H Acquisition Corp. (Fox & Hound) 70.9 0.3x 5.8x 6/18/2007 9/4/2007 Friendly Ice Cream Corp. Freeze Operations (Sun Capital) 337.2 0.6x 8.1x 11/6/2006 6/14/2007 OSI Restaurant Partners (Outback) Bain Capital, Catterton, Company Founders 3,432.2 0.9x 9.3x 5/7/2007 8/20/2007 Smith & Wollensky Patina Restaurant Group 97.4 0.8x 13.2x 12/7/2006 3/5/2007 Hard Rock Café (sub of Rank Group PLC) Seminole Tribe of Florida 965.0 1.9x 9.9x 10/30/2006 12/6/2006 Logan's Roadhouse Bruckman, Rosser, Sherrill & Co. 486.0 1.2x 10.4x 10/10/2006 10/16/2006 Joe's Crab Shack J.H. Whitney Capital Partners 192.0 0.6x 6.4x 8/18/2006 1/12/2007 Lone Star Steakhouse Lone Star Funds 556.3 0.8x 12.3x 8/8/2006 8/10/2006 Real Mex Restaurants Sun Capital 350.0 0.6x 6.2x 6/5/2006 7/5/2006 Bravo Development Bruckman, Rosser, Sherrill and Castle Harlan NA NA NA 5/22/2006 6/29/2006 Main Street Restaurant Group The Briad Group 150.3 0.6x 8.2x 12/9/2005 3/8/2006 Dave & Buster's (DAB) Wellspring Capital Management 383.0 0.8x 6.1x 10/4/2005 2/27/2006 Fox & Hound Restaurant Group (FOXX) Newcastle Partners and Steel Partners 179.6 1.1x 8.2x 4/29/2005 9/22/2005 Worldwide Restaurant Concepts (SZ) Pacific Equity Partners 220.2 0.6x 8.8x 1/20/2005 3/7/2005 Charlie Brown's Trimaran Partners 140.0 0.9x 7.0x 1/11/2005 2/23/2005 Uno Restaurant Holdings Centre Partners 191.6 0.6x 5.6x Mean 0.9x 8.6x Median 0.8x 8.2x |
 PROJECT
LASSO Comparable Casino and Gaming M&A Transactions (a) Represents total consideration including the assumption of liabilities and residual cash (enterprise
value) when available. 2005 – 2008 YTD Comparable Casino and Gaming M&A Transactions (US$ in millions) Enterprise Value/ Date Date Ent. LTM LTM Announced Closed Target Acquirer Val. (a) Revenue EBITDA 5/29/2008 TBD Trump Marina Hotel Casino Coastal Marina 316.0 $ 1.4x 12.0x 12/11/2007 TBD Cannery Casino Resorts Crown Limited 1,750.0 NA NA 11/13/2007 1/25/2008 Isle of Capri Casinos (Black Hawk) Isle of Capri Casinos 150.2 NA NA 9/4/2007 9/4/2007 Jalou Fox Jacobs Entertainment 13.7 NA NA 6/27/2007 3/10/2008 Binions Gambling Hall TLC Casino Enterprises 32.0 NA NA 6/15/2007 TBD Penn National Gaming Fortress Investment Group and Centerbridge Partners 8,717.1 3.8x 14.3x 6/4/2007 6/4/2007 Green Acres Casino Management Gaming Entertainment 10.0 NA NA 4/23/2007 2/20/2008 Icahn Enterprises (American Casino, Stratosphere) Whitehall Street Fund (Goldman) 1,200.0 3.1x 13.9x 4/3/2007 11/6/2007 Gateway Casinos Income Fund New World Gaming Partners 854.4 NM 18.8x 3/19/2007 6/11/2007 Casino Aztar Isle of Capri Casinos 45.0 NA NA 1/19/2007 TBD 155 East Tropicana (Hooters Casino) NTH Advisory Group and Silverleaf Real Estate 95.0 1.4x NM 12/4/2006 11/7/2007 Station Casinos Fertitta Colony Partners 8,675.9 NM 19.3x 12/19/2006 1/28/2008 Harrah's Entertainment Apollo Management and TPG 27,753.3 2.9x 11.9x 12/7/2006 3/5/2007 Hard Rock Café Seminole Tribe of Florida 965.0 2.0x NA 9/11/2006 9/11/2006 Stanley Leisure Genting International 1,265.9 3.0x 16.4x 9/5/2006 11/17/2006 Sands Casino Pinnacle Entertainment 250.0 NA NA 8/31/2006 11/2/2006 London Clubs International Dagger Holdings (Harrah's) 592.0 2.5x 19.1x 5/31/2006 3/1/2007 Dania Jai Alai Boyd Gaming 152.5 NA NA 5/17/2006 1/3/2007 Sands Regent Herbst Gaming 138.1 1.6x 9.2x 5/11/2006 2/5/2007 Hard Rock Casino (Las Vegas) Morgans Hotel Group 770.0 4.2x NM 4/13/2006 1/3/2007 Aztar Corp (Tropicana Casino) Wimar Tahoe Corp. (Blackstone) 2,735.4 3.0x 12.8x 4/10/2006 2/1/2007 Stockman's Casino Full House Resorts 25.5 2.3x 10.0x 2/14/2006 7/31/2006 Isle of Capri Casinos (Two Casinos) Legends Gaming 240.0 1.5x 6.8x 11/29/2005 5/19/2006 Harrah's (Flamingo Casino, Laughlin) American Real Estate Partners 170.0 NA NA 8/22/2005 12/23/2005 Imperial Palace Harrah's Entertainment 370.0 NA NA 6/20/2005 10/25/2005 Argosy Casino (Baton Rouge) Columbia Sussex Corp. 150.0 1.7x 7.4x 3/23/2005 4/25/2005 MotorCity Casino Ilitch Holdings Inc 981.3 2.3x NA 2/28/2005 9/1/2005 Depot Casino Sands Regent 10.2 1.9x NA 2/4/2005 9/27/2005 Golden Nugget Casino Landry's Restaurants 316.1 1.6x 13.4x 1/20/2005 7/22/2005 Galaxy Casino SA Canton Treasure Group Ltd 2,359.5 NM NA Mean 2.4x 13.2x Median 2.3x 13.1x |
 PROJECT
LASSO Discounted Cash Flow Overview For the DCF analysis, the CAPM formula and a set of comparable companies for each division/Lasso's
projected beta according to Barra's Beta were used General CAPM assumptions: • Risk-free rate of 3.5% (a) • Equity risk premium of 7.1% (b) • Size premium of 4.4% (b) for the restaurant division and size premium of 9.7% (b) for the gaming division • Target capital structure (debt/equity) of 60%/40% for restaurants and 70%/30% for gaming
The following assumptions were used for the restaurant division: • Cost of capital of approximately 13.0% – Pre-tax cost of debt of 11.0% (c) – Re-levered comparable company beta of 1.93 • Exit multiples of 5.5x - 6.5x EBITDA • We also ran sensitivities for same-store sales between (1.0%) and 1.0% The following assumptions were used for the gaming division • Cost of capital of approximately 12.5% – Pre-tax cost of debt of 9.0% (c) – Re-levered comparable company beta of 1.99 • Exit multiples of 7.5x - 9.5x EBITDA • The impact of building the new tower was also taken into consideration The sum of the parts of the DCF by division results in a share price range of $21.00 to
$37.00 (a) U.S. 10-year Treasury Yield as of April 18, 2008. (b) Per Ibbotson Associates data. (c) Represents a blended interest rate of facilities by division. |
 PROJECT
LASSO Valuation at Various Share Prices (a) Except where noted, prices relative to initial bid announcement date. (b) Current price as of May 29, 2008. (c) Basic shares from 10-Q for the period ended March 31, 2008. Options outstanding per Lasso management as of April 2008. (d) Assumes net debt of $849.0 million, which excludes $10.0 million in mandatory cash that is physically held on premises of the Golden Nugget properties per discussions with Lasso management. (e) EPS estimates per Lasso management. (f) Assumes pro forma interest from the refinancing of the $395.7 million, 9.5% interest rate restaurant debt on December 31, 2008 at 11.0% per discussions with Lasso management. Multiples at Various Share Prices (US$ and shares in millions, except per share data) Share Price $21.00 $21.50 $22.00 $22.50 $23.00 $23.50 $24.00 Premium/(Discount) (a) 1-Day Prior Price of $16.67 26.0% 29.0% 32.0% 35.0% 38.0% 41.0% 44.0% 30-Day Average Price of $16.31 28.8% 31.8% 34.9% 38.0% 41.0% 44.1% 47.1% 3-Month Average Price of $21.29 (1.4%) 1.0% 3.3% 5.7% 8.0% 10.4% 12.7% 52-Week High of $32.30 (35.0%) (33.4%) (31.9%) (30.3%) (28.8%) (27.2%) (25.7%) 52-Week Low of $14.18 48.1% 51.6% 55.1% 58.7% 62.2% 65.7% 69.3% Current Price of $16.07 (b) 30.7% 33.8% 36.9% 40.0% 43.1% 46.2% 49.3% Implied Equity Value (c) $346.0 $354.5 $363.0 $371.5 $380.1 $388.6 $397.1 Implied Enterprise Value (d) $1,195.0 $1,203.5 $1,212.0 $1,220.5 $1,229.0 $1,237.5 $1,246.0 Fully Diluted Shares (Basic + CSEs) 16.477 16.490 16.502 16.513 16.524 16.534 16.544 Enterprise Value/: LTM Revenue $1,183.1 1.0x 1.0x 1.0x 1.0x 1.0x 1.0x 1.1x LTM Adjusted EBITDA 189.9 6.3x 6.3x 6.4x 6.4x 6.5x 6.5x 6.6x Implied Equity Value/: 2008E EPS (Mgmt.) (e) $1.31 16.0x 16.4x 16.7x 17.1x 17.5x 17.9x 18.3x 2009E EPS (Mgmt. with Refinancing) (f) 1.83 11.5x 11.8x 12.0x 12.3x 12.6x 12.9x 13.1x |
 PROJECT
LASSO Projected Shareholder Returns at Adjusted EBITDA Multiples (US$ in millions, except per share data) Projected Shareholder Returns (a) Projections per Lasso management. Excludes non-recurring pre-opening, leap year adjustments and stock compensation expense for 2008. Excludes stock compensation expense for 2009 – 2011. (b) Stock price as of May 29, 2008. (c) Future stock prices discounted to June 30, 2008. 2008E 2009E 2010E 2011E Adjusted EBITDA (a) 190.3 $ 204.3 $ 221.0 $ 239.3 $ % growth (0.1%) 7.4% 8.2% 8.3% Current Enterprise Value (b) 1,111.9 $ Current Equity Value (b) 262.9 $ Current Stock Price (b) 16.07 $ Current LTM Adjusted EBITDA Multiple 5.9x Future Enterprise Values at Various EBITDA Multiples 5.5x 1,046.7 $ 1,123.7 $ 1,215.4 $ 1,316.3 $ 6.0x 1,141.9 1,225.8 1,325.9 1,436.0 6.5x 1,237.1 1,328.0 1,436.4 1,555.7 7.0x 1,332.2 1,430.1 1,546.9 1,675.3 7.5x 1,427.4 1,532.3 1,657.4 1,795.0 Future Stock Prices at Various EBITDA Multiples 5.5x 9.86 $ 14.16 $ 23.52 $ 35.48 $ 6.0x 15.61 20.26 29.95 42.34 6.5x 21.25 26.26 36.29 49.21 7.0x 26.85 32.15 42.63 56.07 7.5x 32.32 38.01 48.97 62.94 Annualized Return at Various EBITDA Multiples Discounted to Current Market Price (c) 5.5x (62.3%) (8.1%) 16.4% 25.4% 6.0x (5.7%) 16.7% 28.3% 31.9% 6.5x 74.9% 38.7% 38.5% 37.7% 7.0x 179.1% 58.8% 47.7% 42.9% 7.5x 304.6% 77.5% 56.2% 47.7% |
 PROJECT
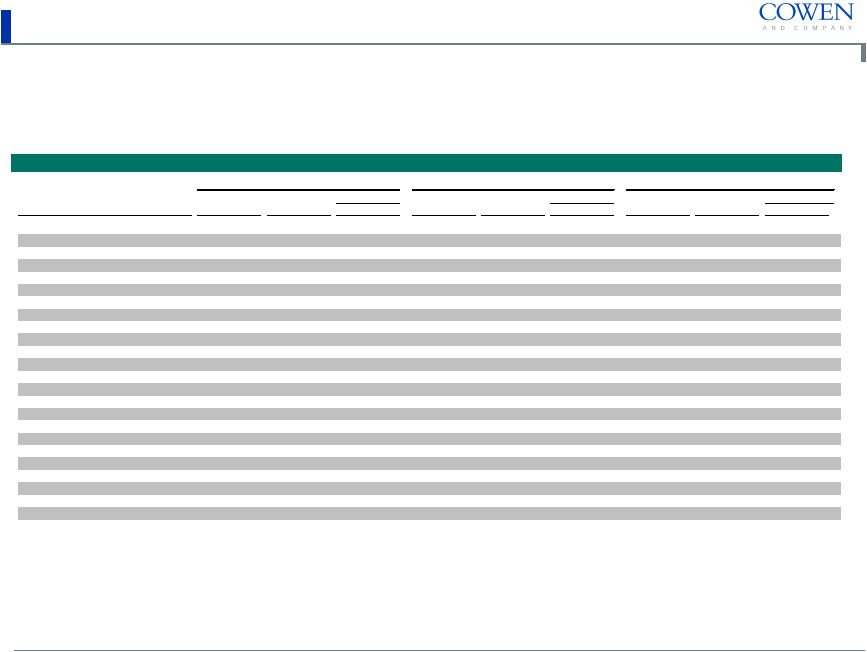
LASSO As of January 28, 2008 As of April 4, 2008 Change from 1/28/08 to 4/4/08 EV/LTM 2008E (a) EV/LTM 2008E (a) EV/LTM 2008E (a) Company Name Price EBITDA P/E Price EBITDA P/E Price EBITDA P/E CEC Entertainment $22.73 4.6x 10.6x $31.44 4.7x 14.4x 38.3% 0.1x 3.8x Darden 27.47 7.9x 9.3x 34.41 8.6x 12.2x 25.3% 0.7x 2.8x Panera Bread 36.20 8.0x 17.7x 44.00 9.2x 21.9x 21.5% 1.2x 4.2x Krispy Kreme 2.73 10.4x NM 3.29 12.0x NM 20.5% 1.6x NA CBRL Group 30.17 6.5x 9.5x 35.77 6.9x 11.0x 18.6% 0.4x 1.5x Red Robin Gourmet Burgers 33.09 7.3x 15.2x 38.59 8.1x 17.8x 16.6% 0.7x 2.6x Burger King 23.94 9.8x 17.1x 27.65 10.5x 19.9x 15.5% 0.7x 2.8x California Pizza Kitchen 12.95 5.6x 14.6x 14.45 5.4x 24.5x 11.6% (0.2x) 9.9x Buffalo Wild Wings 23.01 7.4x 17.7x 25.58 9.3x 20.4x 11.2% 1.9x 2.7x Cosi 2.60 NM NM 2.88 NM NM 10.8% NA NA Cheesecake Factory 20.75 9.2x 15.6x 22.77 9.8x 19.8x 9.7% 0.6x 4.2x Caribou Coffee 2.79 4.2x NM 3.05 5.7x NM 9.3% 1.6x NA McDonald's 51.07 10.4x 16.2x 55.72 10.9x 17.6x 9.1% 0.5x 1.4x Yum Brands 35.65 10.8x 19.5x 38.88 11.3x 20.4x 9.1% 0.5x 0.9x Morton's 7.10 5.9x 9.5x 7.67 6.1x 13.5x 8.0% 0.2x 4.0x Papa John's 23.51 6.4x 13.8x 25.15 7.4x 15.0x 7.0% 1.0x 1.1x P.F. Chang's 27.86 8.6x 21.4x 29.80 8.6x 22.3x 7.0% 0.0x 0.9x Sonic 21.33 10.3x 18.4x 22.74 10.8x 19.7x 6.6% 0.5x 1.3x Domino's Pizza 13.30 10.0x 12.5x 14.13 11.4x 13.3x 6.2% 1.4x 0.8x Jack In The Box 26.45 6.9x 13.1x 27.91 7.2x 13.4x 5.5% 0.4x 0.3x Brinker 18.13 5.0x 10.0x 19.01 5.1x 10.5x 4.9% 0.1x 0.5x Peets Coffee & Tea 23.34 16.4x 29.5x 24.45 15.2x 31.5x 4.8% (1.2x) 2.0x Carrols Restaurant Group 7.97 5.8x 9.4x 8.31 6.1x 11.5x 4.3% 0.3x 2.2x Bob Evans 27.49 6.6x 14.1x 28.53 6.6x 14.6x 3.8% 0.0x 0.5x Change in Restaurant Valuations Since January 28, 2008 Change in Restaurant Valuations Since January 28, 2008 Note: Per Factset as of May 29, 2008. (a) Estimates per Wall Street research. |
 PROJECT
LASSO Change in Restaurant Valuations Since January 28, 2008 Note: Per Factset as of May 29, 2008. (a) Estimates per Wall Street research. Change in Restaurant Valuations Since January 28, 2008 (Cont.) As of January 28, 2008 As of April 4, 2008 Change from 1/28/08 to 4/4/08 EV/LTM 2008E (a) EV/LTM 2008E (a) EV/LTM 2008E (a) Company Name Price EBITDA P/E Price EBITDA P/E Price EBITDA P/E Ruby Tuesday $7.69 4.9x 12.8x $7.96 5.9x 16.8x 3.5% 1.0x 3.9x Tim Hortons 34.86 14.3x 22.2x 35.31 13.4x 21.6x 1.3% (0.9x) (0.6x) AFC Enterprises 9.05 7.1x 10.1x 9.12 7.8x 14.0x 0.8% 0.7x 4.0x Benihana 10.24 4.5x 10.8x 10.31 4.7x 12.7x 0.7% 0.2x 1.9x Wendy's 23.92 8.7x 15.0x 23.58 7.8x 16.8x (1.4%) (0.9x) 1.9x Texas Roadhouse 11.11 9.9x 17.1x 10.54 9.2x 19.3x (5.1%) (0.7x) 2.2x McCormick & Schmick's 12.87 6.6x 12.3x 12.18 6.7x 17.4x (5.4%) 0.1x 5.1x BJ's Restaurants 15.49 13.3x 25.8x 14.65 11.5x 27.2x (5.4%) (1.8x) 1.4x Starbucks 19.66 10.0x 20.1x 18.50 8.9x 18.7x (5.9%) (1.1x) (1.4x) CKE Restaurants 13.00 7.2x 15.1x 12.10 6.5x 14.4x (6.9%) (0.8x) (0.7x) Chipotle Mexican Grill 125.37 28.3x 47.3x 116.66 24.4x 44.9x (6.9%) (3.9x) (2.4x) Denny's Corp. 3.32 6.8x 14.4x 3.01 6.3x 16.7x (9.3%) (0.5x) 2.3x Ruth's Chris 7.89 5.9x 9.9x 7.10 6.2x 12.9x (10.0%) 0.3x 3.0x Rubio's Restaurants 6.49 5.4x 17.5x 5.80 4.9x NA (10.6%) (0.4x) NA O'Charley's 13.08 4.7x 14.2x 11.57 4.6x 26.3x (11.5%) (0.1x) 12.1x Steak N Shake 8.79 8.7x 23.8x 7.76 9.5x NM (11.7%) 0.7x NA Luby's 9.37 6.8x 23.5x 7.25 5.5x 19.2x (22.6%) (1.3x) (4.4x) Kona Grill 12.30 15.2x NM 7.98 7.4x NM (35.1%) (7.8x) NA Einstein Noah Restaurant Group 18.96 9.7x 19.0x 9.76 7.3x 9.8x (48.5%) (2.4x) (9.2x) Number of Decreased 15 15 6 Number of Increased 28 27 31 Average (Decrease)/Increase 2.2% (0.2x) 1.9x Median (Decrease)/Increase 4.8% 0.2x 1.9x |