 In
Our Business, Every Second Counts Investor Day – April 3, 2009 Exhibit 99.1 |
 Forward
Looking Statements Nothing contained in this presentation is, or should be
relied upon as, a promise or representation as to the future. Any
projections contained herein or otherwise made available are based on
management’s analysis of information available at the time this
presentation was prepared and on assumptions and perspectives that may be
unique to Rural/Metro management, which may or may not prove to be
correct. There can be no representation, warranty or other assurance as to the accuracy or completeness of such projections or that any such projections
will be realized. Recipients of this presentation should conduct their own
investigation and analysis of the business, data and property
described. 2 |
 Welcome & Introductions 3 |
 Agenda 10:00 a.m. Registration & Check-In 10:15 a.m. Welcome and Introductions (Liz Merritt, Managing Director of (Tab 1) Investor Relations) 10:20 a.m. The Industry, the Company, and the Business (Tab 2) (Jack Brucker, President & CEO) 10:45 a.m. Operational Technology & Revenue Cycle Management (Todd (Tab 3) Walker, Mid-Atlantic Group President) 11:15 a.m. Financial Performance (Kristi Ponczak, Senior VP & CFO) (Tab 4) 11:30 a.m. Question & Answer Session Noon -1 p.m. Roundtable Luncheon With Management 4 |
 Management Presenters Jack Brucker, President & Chief Executive Officer – Mr. Brucker joined Rural/Metro in 1997 as Chief Operating Officer and was promoted to Chief Executive Officer in January 2000. Mr. Brucker holds an MBA degree from Ohio State University and a Bachelor of Science degree in Business
Administration from Youngstown State University. Kristi Ponczak, Senior Vice President & Chief Financial Officer – Mrs. Ponczak joined Rural/Metro in 1998 as Director of Financial Planning. She was promoted in 2004 to Vice President and Treasurer,
where she served until 2006 when she was appointed Senior Vice President &
Chief Financial Officer. Mrs. Ponczak is a certified public
accountant and holds a Bachelor of Science degree in accounting from
Arizona State University. Todd Walker, Mid-Atlantic Group President
– Mr. Walker joined Rural/Metro in 1996 as a District Manager and was promoted to Group President in 2000. Prior to joining Rural/Metro, Mr. Walker was Vice President and part owner of Metro Ambulance in Cleveland, Ohio, which was acquired by Rural/Metro. Mr. Walker holds a Bachelor of Science degree in business
administration from the University of Massachusetts. 5 |
 The
Industry, The Company, & The Business Jack Brucker, President & CEO 6 |
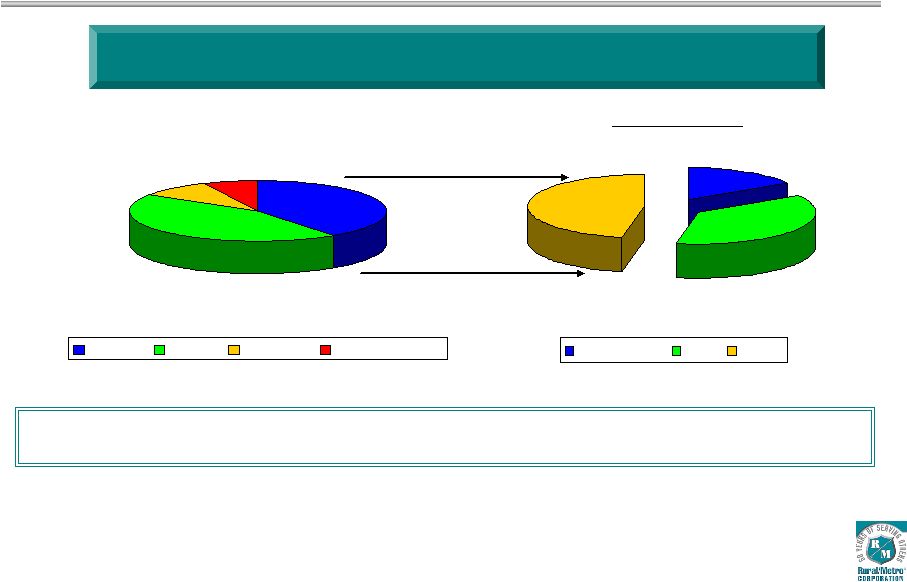 7 40.0% 44.0% 9.0% 7.0% Private Public Hospital Public Utility Medically Necessary Ambulance Market Estimated at $13.0 Billion in Gross Revenue Annually* Sources: U.S. Census Bureau; Coalition of Advanced Emergency Medical Systems; Centers
for Medicare and Medicaid Services; American Ambulance Association 2006
Ambulance Cost Survey, Final Report; 2007 Journal of Emergency Medical Services 200 City Survey. * Excludes wheelchair transports Partnerships With Municipal Departments & Hospital-Based Services Provide Market
Expansion Opportunities 16% 37% 47% Rural/Metro AMR Other Industry Overview Private Providers |
 Types
of Ambulance Services Emergency Market Dynamics Overview Advanced life support (paramedic care) Basic life support (emergency medical technician care) Exclusive 911 contracts Services provided in conjunction with local municipal system Key differentiating characteristics: Quality of service and response times 8 Budgetary constraints driving more ambulance service outsourcing by municipalities Exclusive contracts limit competitor opportunities Continued rate increases CON (Certificate of Necessity) provides barrier to entry Non-Emergency Medically necessary, pre-scheduled inter- facility services Preferred provider arrangement & contracts Services provided to facilities such as hospitals, nursing homes, surgical centers, dialysis centers Key differentiating characteristics: quality of service and response times Increasing inter-facility travel between specialty health care facilities Hospital cost containment strategy driving more ambulance service outsourcing Larger number of competitors/fewer barriers to entry More profitable when provided to communities with existing 911 services – strong operating leverage |
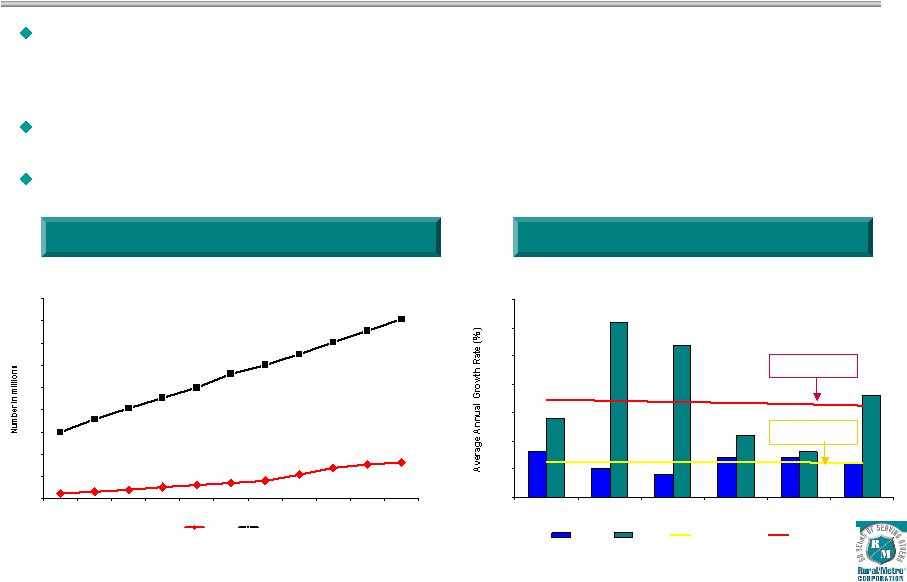 Growth
Drivers in Ambulance Reimbursement 12 16 20 26 31 35 40 54 70 77 82 150 179 203 227 249 281 300 325 351 377 404 0 50 100 150 200 250 300 350 400 450 1950 1960 1970 1980 1990 2000 2010* 2020* 2030* 2040* 2050* Age 65+ Total Elderly Population Growth Rate Steady increase in people age 65+; accelerating growth of people 55-64 (4% 5-yr CAGR) • Growth of 65+ population is 1.8% vs. 0.6% for remainder of population • 42% of R/M transports are for patients 65+ Movement of retirees to warmer-climate states in which Rural/Metro is primary
ambulance provider drives increase in transport volume Increased patient travel between specialty treatment healthcare facilities 9 Total Elderly Population (1950 – 2050) 0.0% 0.5% 1.0% 1.5% 2.0% 2.5% 3.0% 3.5% 2000 2010E 2020E 2030E 2040E 2050E Under 65 Over 65 Under 65 Average Over 65 Average Source: US Census Bureau Over 65 Average Growth: 1.8% Over 65 Average Growth: 1.8% |
 Positive Impact of Federal Healthcare Reform Expansion of healthcare insurance coverage for Americans Higher % of insured patients; positive impact on uncompensated care Federal aid to states for Medicaid funding Positive impact on uncompensated care Healthcare information technology funding included in federal stimulus package Providers eligible for part of new funding through state-directed grants and loans 10 |
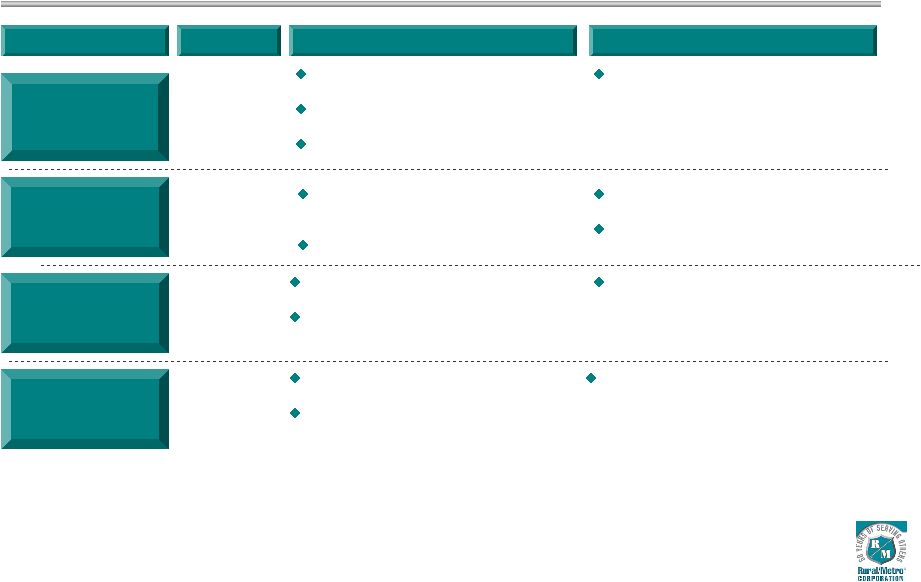 Reimbursement Environment 11 Reimbursement Trends Potential Opportunities Payer Medicare Medicaid Commercial Insurance Private Pay National fee schedule final implementation slated for 2010 Temporary Medicare rate increase of 2% Urban/3% Rural CMS assigns 5% increase in 2009 ambulance inflation factor Expansion of SCHIP program will benefit uncompensated care Healthcare Reform opportunities Temporary slowdown of payments as states react to budget pressure (California) Policies vary state to state Rate increases to offset below-cost government payers Insurers seeking rate discounts from providers Electronic claims speed payment and improve cash flow Increasing pressure to provide uncompensated care Unemployment has grown from 4.8% to 8.1% over last 12 months Healthcare Reform opportunities to improve uncompensated care R/M Mix 40% 16% 33% 11% Healthcare Reform opportunities to improve uncompensated care |
 Rural/Metro serves municipal, residential, commercial and industrial customers in more than
400 communities throughout the U.S., with more than 1,800 vehicles and over
7,800 employees The business is comprised of two segments: Ambulance Services
and Other Services Ambulance services includes emergency and non-emergency
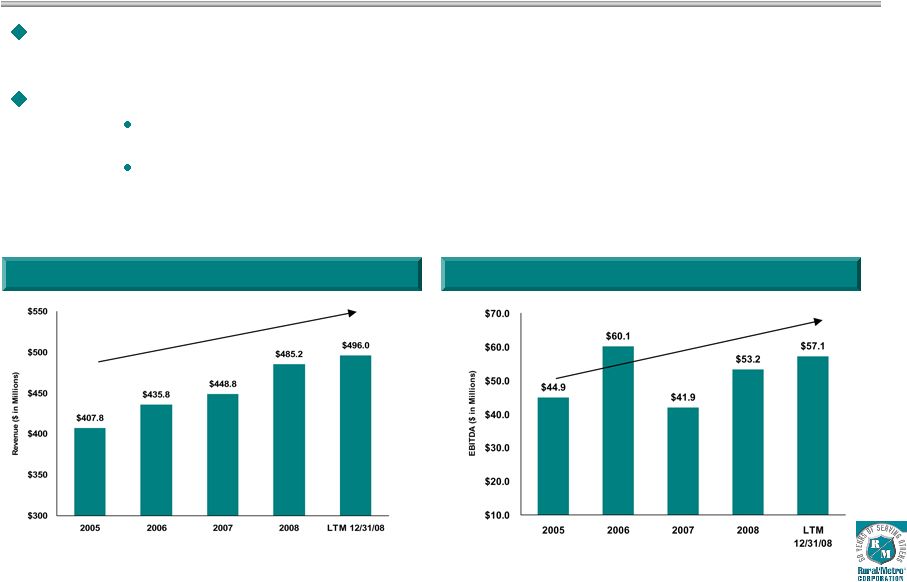
ambulance and wheelchair services (85% of revenue) Other services includes subscription fire, airport fire and home health services (15% of revenues) Company Overview 12 Annual EBITDA * Annual Net Revenue * 5.3% CAGR * Adjusted for Fiscal 2009 discontinued operations; 2005 EBITDA
excludes $8.2M loss on extinguishment of debt 6.2% CAGR |
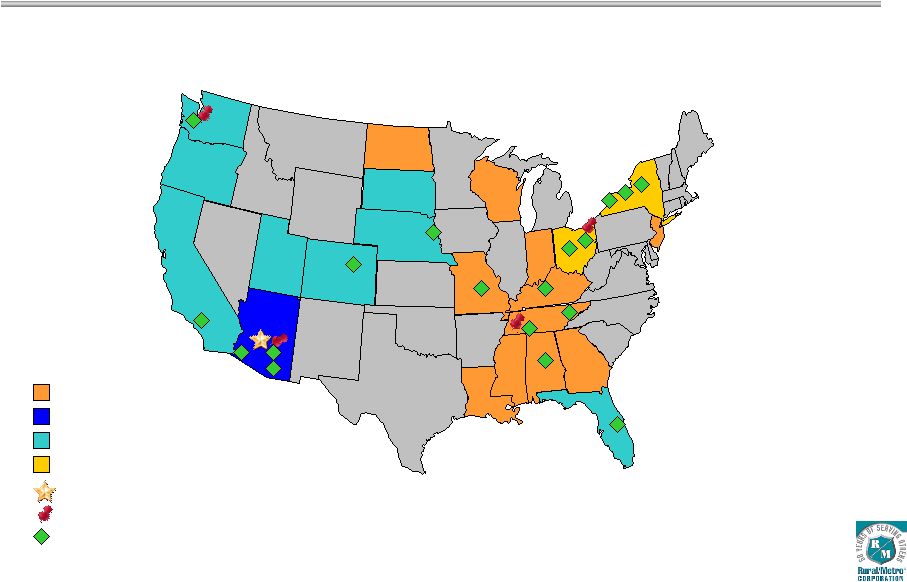 Rural/Metro provides emergency and non-emergency ambulance and private fire protection
services in 22 states and approximately 400 communities throughout the United
States. West Region Mid-Atlantic Region Southwest Region South Region Corporate Headquarters Regional Headquarters Significant Market 13 National Presence |
 Company History 1993 2000 2005 1948 Rural/Metro founded as a subscription fire protection service 2002 Medicare National Fee Schedule implementation began 2007-2008 Implementation of uncompensated care initiatives 1993 - 1997 Industry roll-up period; RURL acquires 80+entities, including ambulance companies in South America & Canada 1948 1969 1969 Rural/Metro begins providing ambulance services under contract in Arizona 2000 Company launches domestic ambulance operational restructuring 2000-2004 Focus on core business, consolidation of operations and assessment of progress 2002 2003 2005 Company successfully completes debt refinancing transaction 14 1993 Initial Public Offering 2007 2009 2009 Company issues EBITDA guidance of $54M to $58M; CapEx guidance of $15M to $18M |
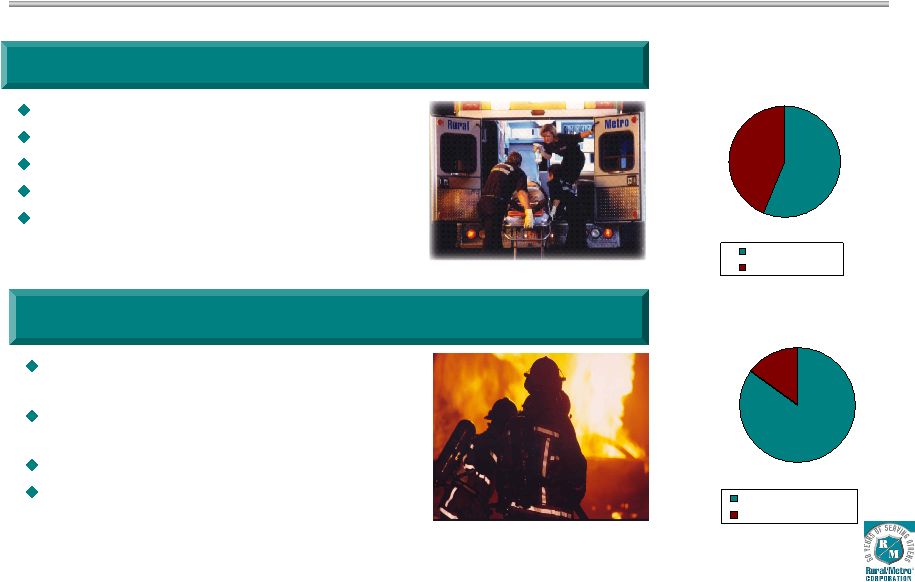 Lines
of Business Transports 56% 44% Non-Emergency Emergency Emergency response services Non-emergency response services 85% of net revenue 8.3% revenue growth LTM 12/31/08 97% contract retention rate Residential and commercial fire protection provided under subscription contracts Airport and industrial fire protection provided under master contracts 15% of net revenue 6.2% revenue growth LTM 12/31/08 Ambulance Services Other Services 15 Net Revenue 85% 15% Ambulance Services Other Services |
 Regional Overview 4 operating segments: Mid-Atlantic, South, Southwest, West Management structure includes Group Presidents, Division General Managers, Market General Managers Shared services at corporate level include risk management, financial services, Medicare compliance, national purchasing, national collections center, national billing platform 5 regional billing groups Syracuse – Mid-Atlantic Buffalo – Mid-Atlantic Indianapolis – South Region Scottsdale – Southwest Phoenix -- West 16 |
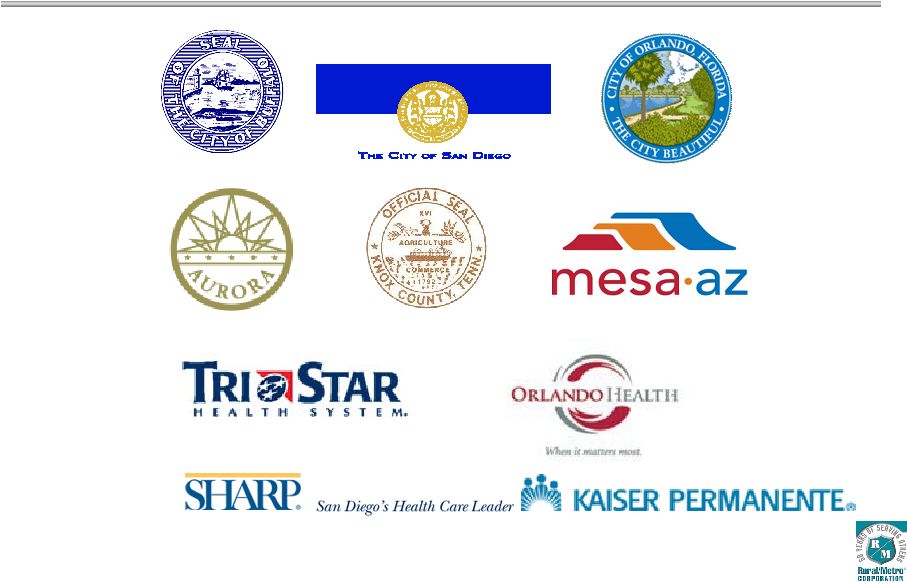 Examples of Customers Cities & Counties Hospitals & Healthcare Systems 17 |
 San
Diego Medical Services Enterprise 911 Contract (LLC with city) awarded in
fiscal 1998. Named Scripps Hospital System preferred provider in 1999. Named Sharp Health Plan exclusive non- emergency provider in 2002. Began service to Palomar Pomerado Hospital in 2002. CSA-17 exclusive 911 contract won in 2003; renewed for 5 years in 2008. Serving cities of Del Mar, Rancho Santa Fe, Encinitas, Solana Beach. Exclusive standby ambulance service for QUALCOMM Stadium, PETCO Park, PGA events. Kaiser Permanente Network preferred provider contract began in 2006. UCSD contract awarded following RFP in 3/2008; rotation with Care Ambulance. 18 |
 Strategic Approach to Growth Focus on assertive collections to drive improvement in uncompensated care Improve Average Patient Charge through rate increases and subsidy requests Increase 911 contracts by pursuing new markets through RFP awards and expanding partnerships in existing municipal markets Leverage fixed asset and labor base through increased and aggressive marketing of non- emergency medical transports Create operational education programs to minimize “treat-no-transport” activities Focused expansion into hospital system ambulance transport services 19 |
 Tactical Approach to Growth Provide specific expertise and focus on: Patient care delivery New 911 revenue generation Franchise revenue protection and expansion Revenue cycle management Implement identified technology improvements to enhance billing integration Reduce uncompensated care, improve billing outcomes, and remain focused on risk reduction programs Identify and target hospital-based ambulance services for contract negotiation Continue to improve overall patient care through clinical best practices and education around auto and professional liability 20 |
 Unit
Hour Utilization Non-emergency transports pre- scheduled during off-peak hours Knowledge of Peak Demand Patterns + Efficient Management of Assets = Maximum Leverage of Fixed Base of Fleet and Labor 21 Economies of scale achieved through effective deployment of ambulance assets 911 system demand peaks at drive time, nights, weekends |
 Emergency (911) Contract Process 1 month+ following award of contract Contract negotiations completed; capital deployed; employees hired Contract Award Providers Submit Proposals Committee Recommendation & Contract Negotiations 2 months+ following submission of proposals … Recommendation made to County Commission or City Council in advance of
formal vote and contract award; public announcement of recommendation Contract awarded on formal vote of County Commission or City Council Contract negotiations begin County or City Issues RFP Start of process … Request for Proposal approved and issued by County Board of Supervisors, City Council or other governing authority Bidders’ conference, amendments (if any) released following conference 22 30-45 days later … Letter of Intent & proposal fee submitted to contracting authority Deadline for submission of proposals & bid bond Proposal Review Committee presentations Investigation of bidders’ submissions/ scoring of bids Contract Begins |
 Non-Emergency Contract Process 23 Win 911 Contract Prepare Bid Responses Notice of Award & Contract Talks Final Contract Executed Start of process … Begin serving exclusive municipal/county 911 contract Analyze local hospital current contracts & opportunities for RFPs Initiate local marketing efforts with local hospitals and healthcare facilities
Within first 6 months … Begin bids on available hospital RFPs (timed with expiration of current provider contracts) Presentations to hospital ambulance selection panels 30 days later … Winning bidder notified Contract negotiations begin 30-45 days later … Contract negotiations completed Generally low need for additional capital/employees due to ability to leverage
from established 911 base of operations Contract Begins |
 Investment Highlights Rural/Metro is the second-largest private provider of outsourced ambulance
services to the hospital, private sector, and public safety markets Highly recurring revenue model with organic and regional growth opportunities Market expansion opportunities through new municipal partnerships and negotiation of hospital system ambulance transport services contracts Focus on quality of service, reliability, profitability and core deliverables High barriers-to-entry favor incumbent provider due to strong relationship
ties Steady free cash flow strengthens capital structure through continued
debt paydown 24 |
 Technology & Revenue Cycle Management Todd Walker, Mid-Atlantic Group President 25 |
 Patient Care Reports Patient Care Report (PCR) must be completed for every patient transported Four primary functions: – Detailed narrative of patient’s condition and treatment provided – Primary source for billing information – Record of medicines, supplies and equipment used in patient treatment – Provides basis for quality assurance process 26 |
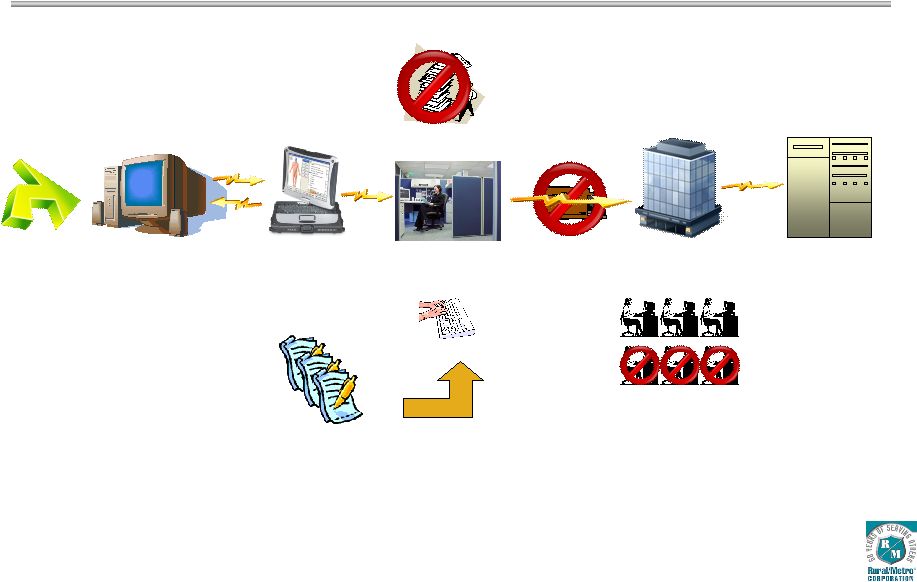
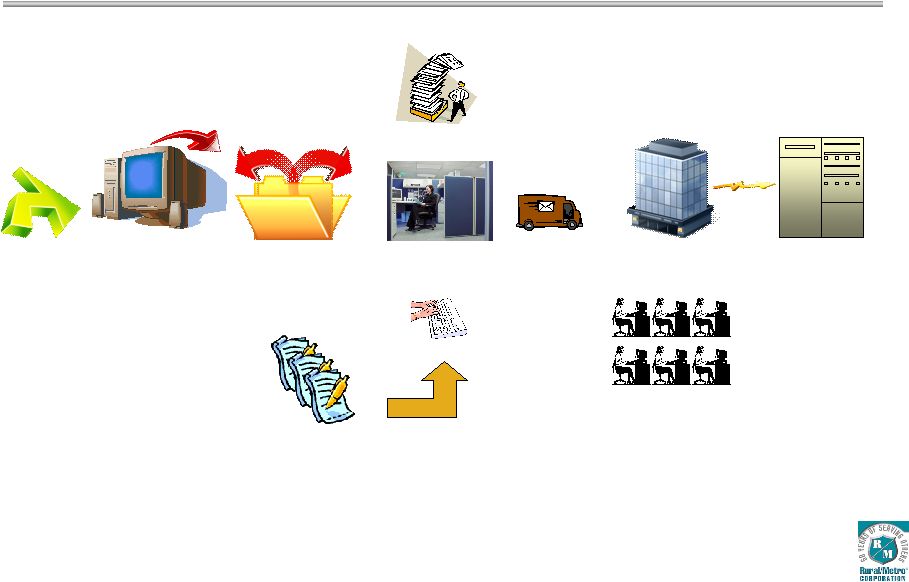 Communications Center EMT & Paramedic Services Pre –Bill Corporate Billing System Regional Billing System Data Entry All paper documentation related to the call: Physicians Certificates, insurance documentation, etc. 99% manual process, with e-mail and overnight delivery of documentation CAD, PCR, & “other” paper is manually collated, attached and send via overnight courier to regional billing center Caller Manual PCR Process 27 |
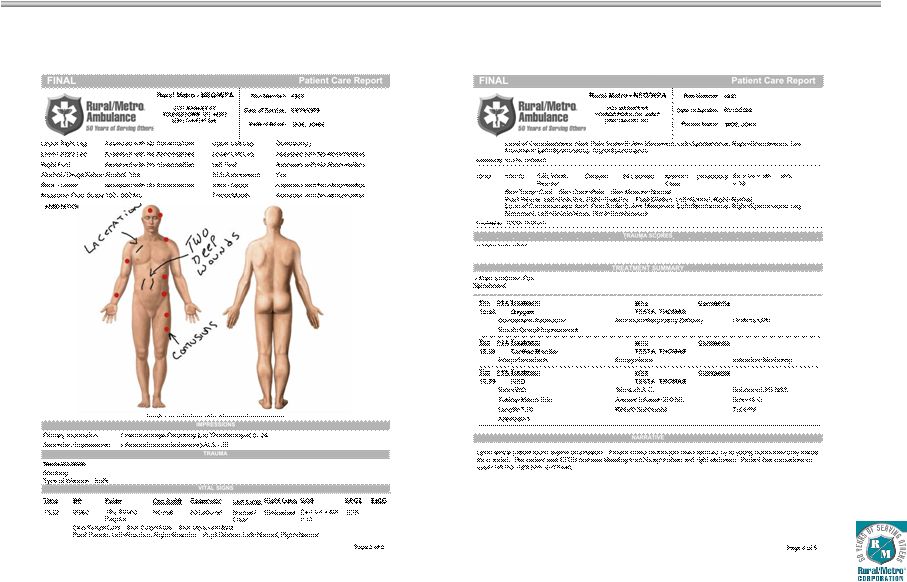
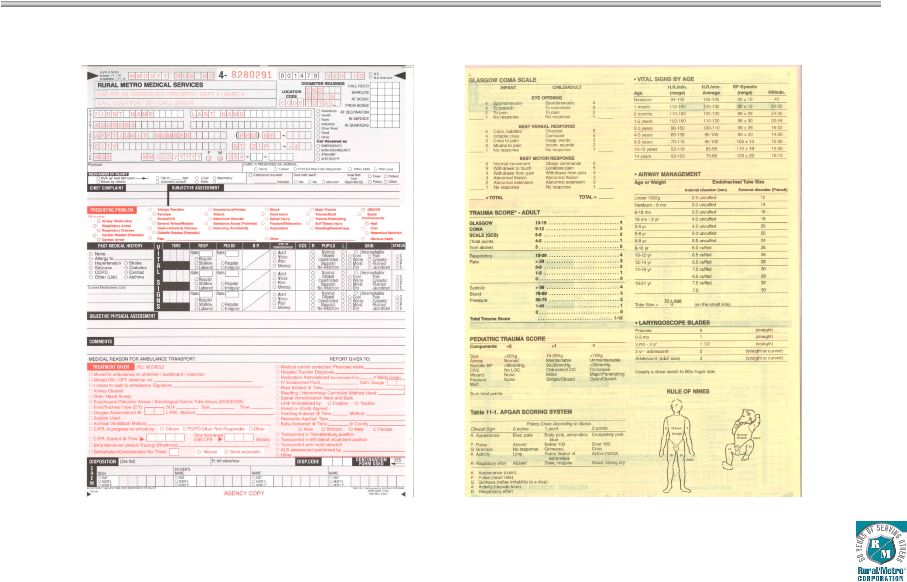 Sample Patient Care Report Page 1 Sample Patient Care Report Page 2 Sample Patient Care Report 28 |
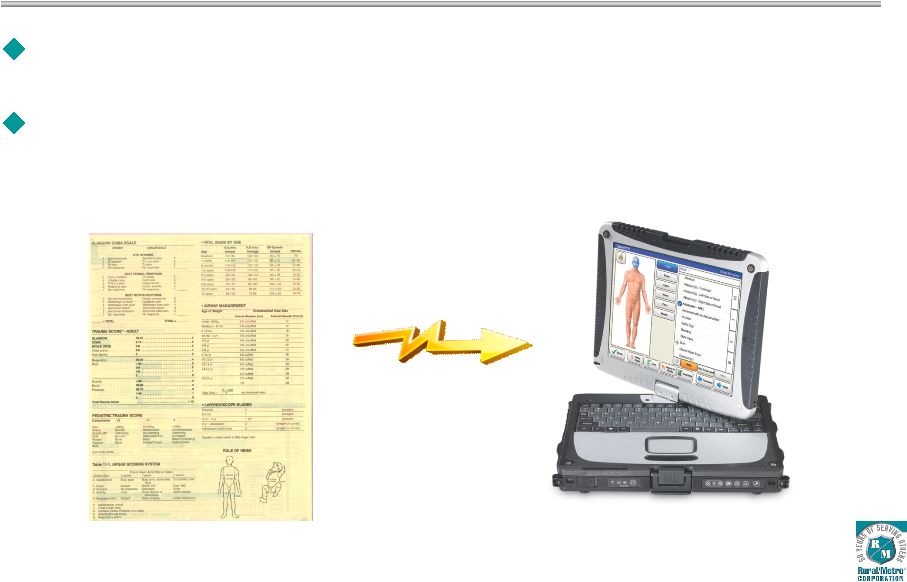 Rural/Metro began national roll-out of electronic Patient Care Reporting solution in 2008, following extensive development and testing period. Meets future demand for broader healthcare technologies, enhances quality of documentation, reduces opportunity for denials ePCR Implementation 29 |
 ePCR
Locations Rural/Metro markets currently utilizing ePCR technology: Youngstown, Ohio Salem, Oregon Metro Denver/Aurora, Colorado Western New York/Buffalo Orlando, Florida Rochester, New York Markets scheduled for implementation in calendar 2009 Seattle, Washington Memphis, Tennessee Atlanta, Georgia Indianapolis, Indiana Syracuse, New York 30 |
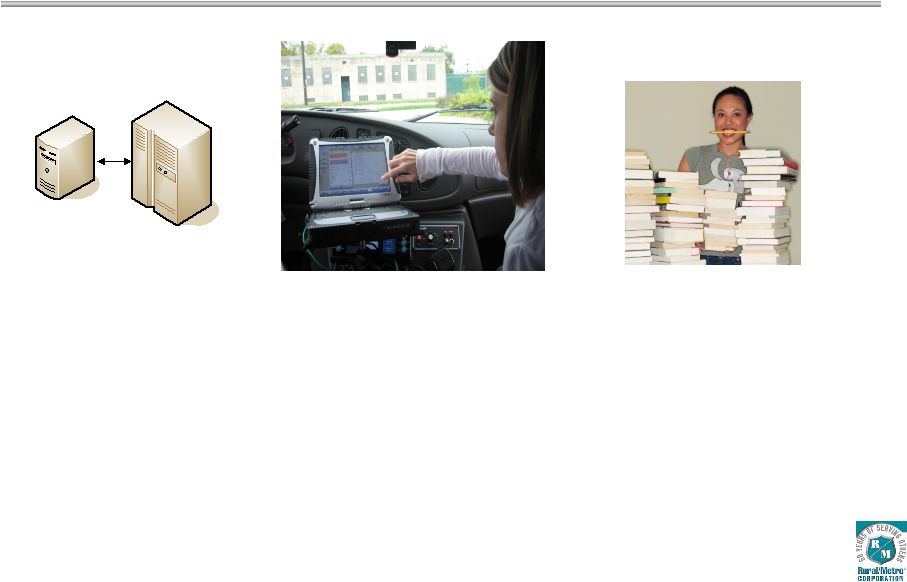
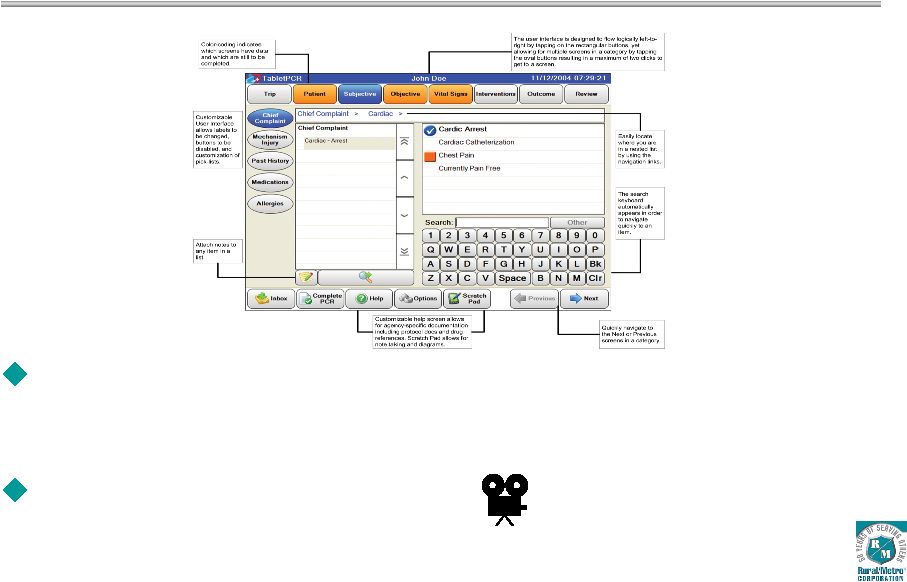 ePCR allows EMT’s and Paramedics to document all aspects of patient care using rugged tablet PC designed for first-responder environments Demonstration of ePCR system ePCR Functions & Capabilities 31 |
 Communications Center EMT & Paramedic Services Pre –Bill Corporate AS/400 Regional Billing Data Entry All paper documentation related to the call: Physicians Certificates, insurance documentation, etc. are electronically scanned into billing system Caller Electronic PCR Process ePCR automates data between CAD and EMT & Paramedic Services Physical delivery of paper reduced – saving time and money ePCRi Reduces Data Entry to Supplemental Documentation Real Time 32 |
 Benefits: • Increased PCR accuracy & legibility • Required fields will reduce incomplete PCRs • Medical protocols automatically prompt for necessary treatment standards • Elimination of lost PCRs Benefits: • Reduces mailing costs • Reduces costs related to paper storage • Reduces time Benefits: • Reduces time to process • Reduces manpower requirements • Reduces mailing costs Interface Document Management Tablet ePCR Billing CAD Operational Benefits of ePCR 33 |
 Sample Electronic Patient Care Report Page 1 Sample Electronic Patient Care Report Page 2 Sample ePCR Report 34 |
 Sample
ePCR Report Sample Electronic Patient Care Report Page 3 Sample Electronic Patient Care Report Page 4 35 |
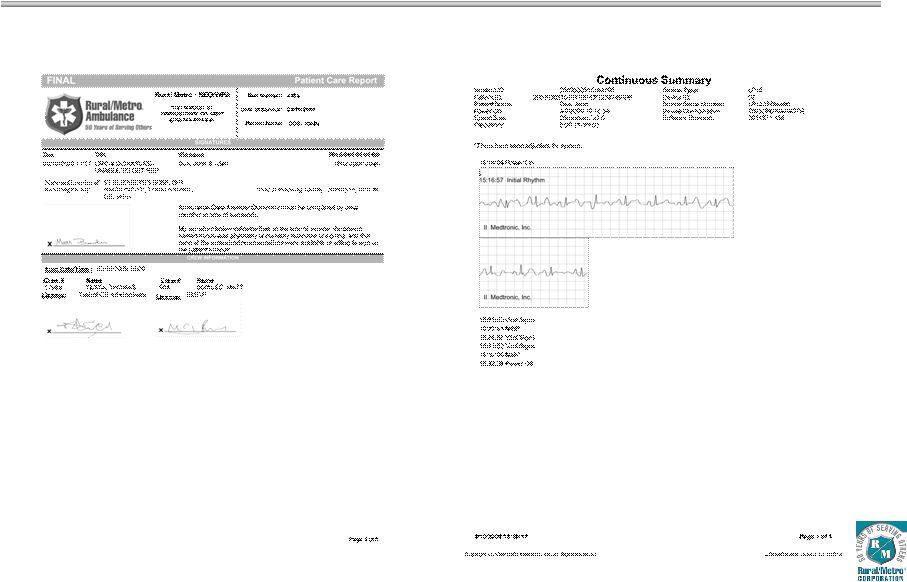 Sample
ePCR Report Sample Electronic Patient Care Report Page 5 Sample Electronic Patient Care Report Page 6 36 |
 Quality of Documentation At local operations and regional billing centers, ePCR reports are reviewed to ensure medical protocols were followed for every patient transport. ePCR reports are cross-checked for: Appropriate on-scene response & assessment ALS vs. BLS Appropriate documentation of care (i.e. heart-rate monitors) Appropriate on-scene time and total time of transport 37 |
 Financial Drivers & Performance Kristi Ponczak, Sr. VP & CFO 38 |
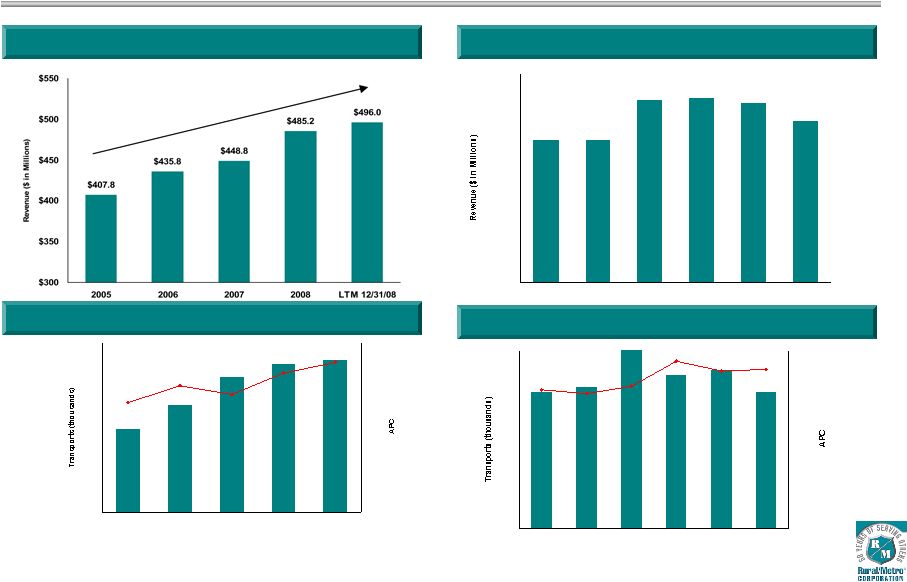 Historical Net Revenue and Drivers (Continuing operations) $117.4 $125.1 $125.4 $124.4 $121.0 $117.3 $90.0 $95.0 $100.0 $105.0 $110.0 $115.0 $120.0 $125.0 $130.0 Q1'08 Q2'08 Q3'08 Q4'08 Q1'09 Q2'09 1,091 1,139 1,162 1,169 1,047 $331 $353 $361 $337 $344 900 950 1,000 1,050 1,100 1,150 1,200 2005 2006 2007 2008 LTM 12/31/08 $250 $270 $290 $310 $330 $350 $370 Annual Net Revenue Quarterly Net Revenue Annual APC and Transports Quarterly APC and Transports 39 285 304 290 292 283 283 $348 $345 $351 $368 $361 $363 225 250 275 300 Q1'08 Q2'08 Q3'08 Q4'08 Q1'09 Q2'09 $250 $270 $290 $310 $330 $350 $370 5.0% CAGR |
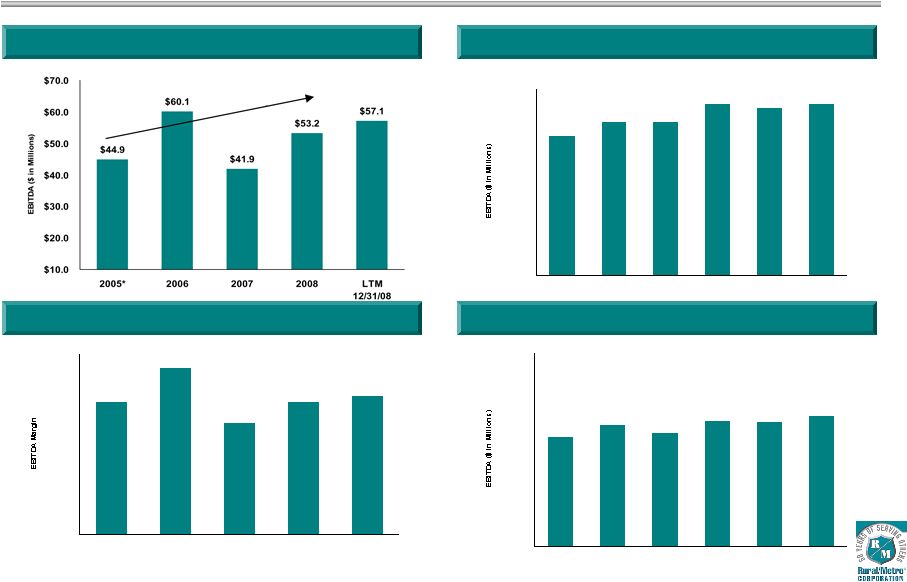 Historical EBITDA and Margins (Adjusted for continuing operations) $12.0 $13.2 $14.7 $14.4 $14.7 $13.2 $- $2.0 $4.0 $6.0 $8.0 $10.0 $12.0 $14.0 $16.0 Q1'08 Q2'08 Q3'08 Q4'08 Q1'09 Q2'09 11.0% 9.3% 11.0% 11.5% 13.8% 0.0% 3.0% 6.0% 9.0% 12.0% 15.0% 2005* 2006 2007 2008 LTM 12/31/08 Annual EBITDA Quarterly EBITDA Annual EBITDA Margin Quarterly EBITDA Margin 40 10.2% 10.6% 11.7% 11.6% 12.2% 11.3% 0.0% 2.0% 4.0% 6.0% 8.0% 10.0% 12.0% 14.0% 16.0% 18.0% Q1'08 Q2'08 Q3'08 Q4'08 Q1'09 Q2'09 6.2% CAGR * Fiscal 2005 calculations exclude $8.2 million loss on extinguishment of debt
|
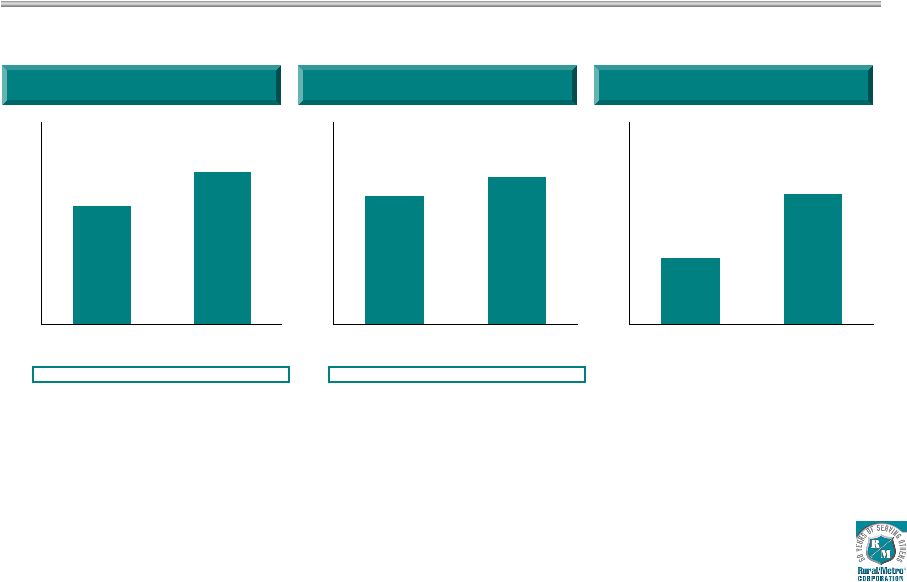 Continued Year Over Year Growth in 2009 Net Revenue ($millions) 41 EBITDA ($millions) Cash Flow from Operations ($millions) Growth 4.6% 4.6% Margin 10.8% 11.9% $235 $245 $200.0 $210.0 $220.0 $230.0 $240.0 $250.0 $260.0 YTD '08 YTD '09 $25 $29 $- $5.0 $10.0 $15.0 $20.0 $25.0 $30.0 $35.0 $40.0 YTD '08 YTD '09 $10 $19 $- $5.0 $10.0 $15.0 $20.0 $25.0 $30.0 YTD '08 YTD '09 |
 Other
Financial Drivers (6 months ended 12/31/08) Solid Second
Quarter 2009 net revenue metrics Average patient charge growth of 3.4% to
$363/transport Uncompensated care down to 14% of gross ambulance revenue
Strong earnings and cash flow metrics EBITDA margin improvement – 9.3% in fiscal 2007, 11.0% in fiscal 2008, up to 11.9% for the six months in fiscal 2009 EBITDA dollars increased 15.4% Diluted EPS growth of 100% to $0.09 Days sales outstanding down 11% to 57 days Cash flow from operations of $19.3 million Net debt of $254 million Total net leverage at 4.4x Debt of $274 million less cash on balance sheet of $20 million 42 |
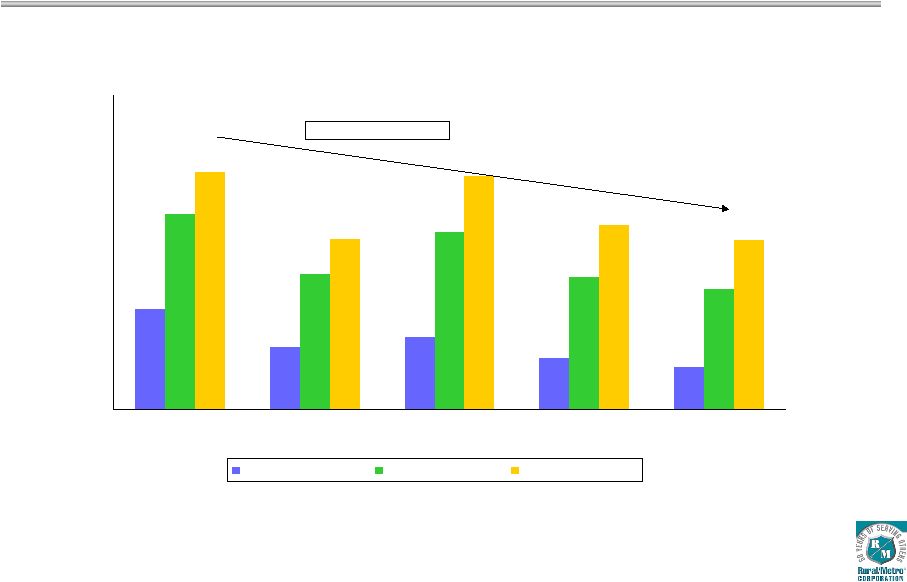
 Uncompensated Care Key challenges: Denials for non-medical necessity based on criteria set by Medicare, Medicaid and commercial insurance payers Increases in uninsured populations Inability for covered individuals to meet co-pay and deductible limits 43 Uncompensated Care as % of Total Write-Offs 12/31/08 2008 2007 2006 Medicare/Medicaid Denials 10% 10% 15% 12% Commercial Insurance 16% 18% 19% 19% Co-Pay/Deductible 9% 8% 8% 9% Self-Pay 65% 64% 58% 60% |
 Aggressive Management of Uncompensated Care Completed: Billing Services Additional resources directed to market-specific, pre-billing claims specialists
to verify and gather primary and secondary patient insurance information
through local resources Introduction of customer care advocates within
regional billing centers to specialize in tracking uninsured claims
Case Management Expanded efforts to establish rate contracts with certain commercial insurance carriers
to eliminate potential barriers to direct reimbursement for services and
minimize self-pay accounts Enhanced case management and collections for patients who require repetitive
non- emergency transports to include verification of physician’s
certification statement prior to transport, and payment in advance when
warranted. In Process: Technology Electronic Patient Care Record (ePCR) system implementation 44 Phase # Tablets Budget Cost Status Phase 0 - Fiscal 2007 29 326,500 $ Complete Phase 1 - Fiscal 2008 93 1,306,202 Complete Phase 2 - Fiscal 2009 254 3,541,686 In Process Phase 3 - Fiscal 2010 305 4,063,969 Scheduled Phase 4 - Fiscal 2011/2012 288 - Arizona - Pending Total Project 969 9,238,357 $ Roll-Out Schedule by Phase |
 ePCR
Metrics & Documentation Quality More than a dozen ePCR metrics being
measured, including: Days to bill Service level mix Denied claims Uncompensated care In Western New York/Buffalo (largest ePCR installation to date), days to bill improved 50% in first six months. 5% shift in service level mix from BLS-E to ALS-E Claim denials and uncompensated care challenging to analyze prior to passage of 12-15 month collection cycle and in consideration of possible changing market conditions 45 |
 Free
Cash Flow & Liquidity 46 Continued reductions in insurance collateral requirements Minimal cash tax payment (utilizing $76 million in historical NOL) DSO continues to reduce Capital expenditures will decrease by $4 million annually in fiscal 2011 upon completion
of ePCR technology deployment funding Senior Discount Notes convert to cash pay with first semi-annual $6 million payment
Sept. 2010 $20 million revolver remains undrawn Ample headroom under loan covenants LTM 2005 2006 2007 2008 12/31/2008 Cash flow from operations 24.9 $ 26.1 $ 29.6 $ 34.8 $ 44.3 $ Capital expenditures (12.5) (15.2) (13.2) (13.3) (14.0) Free cash flow 12.3 10.9 16.4 21.5 30.3 Cash on balance sheet (beg.) 16.4 17.7 9.2 6.2 2.2 Term loan B payments (7.0) (21.0) (19.0) (10.0) (12.0) Other debt payments/reimbursements (4.0) 1.6 (0.5) (1.8) (1.0) Net Cash after principal payments 17.7 $ 9.2 $ 6.2 $ 15.9 $ 19.6 $ |
 Debt
Structure 47 (In millions) Description Amount Leverage Rural/Metro Operating Company Term Loan B due 2011 $135
$( 69)* $ 66 1.2x ($135.0M @ LIBOR + 3.50%) Revolver (Undrawn) due 2010 -- -- 0 ($20.0M @ 0.50%) Sr. Sub. Notes due 2015 $125 $125 ($125.0M @ 9.875%) Total Operating Company Debt $260 $(
69) $191 3.4x Covenant Level Rural/Metro Corp. Holding Co. 12.75% Sr. Discount due 2016 $ 52 29 $ 81 (Accretes to $93.5M at maturity) Total Debt $312 $(
40) $272 4.8x Less Cash on Balance Sheet (20) Net Debt $252 4.4x Note: Includes $5 million principal payment on March 16, 2009. The Credit Facility also includes a $45 million Letter of Credit facility utilized primarily to support deductibles under the Company’s workers’ compensation and auto liability insurance programs. Original March 2005 Principal Change |
 Deleveraging History 48 2.9x 1.8x 2.1x 1.5x 1.2x 5.6x 3.9x 5.1x 3.8x 3.5x 6.8x 4.9x 6.7x 5.3x 4.9x 0.0x 1.0x 2.0x 3.0x 4.0x 5.0x 6.0x 7.0x 8.0x 9.0x 2005* 2006 2007 2008 LTM 12/31/08 Senior Debt/EBITDA OpCo Debt/EBITDA Total Debt/EBITDA 2x Turn on Debt * Fiscal 2005 calculations exclude $8.2 million loss on extinguishment of debt
|
 Debt
Strategies Extend maturities on current credit agreement (Letter of Credit
Facility, Revolver, Term Loan B) – Continue to prepay principal Exchange offer to capture discount on bonds & note Seek amendment to credit agreement to loosen restriction on stock buybacks and other debt repayments Effect a comprehensive capital structure transaction 49 |
 Financial Summary Favorable industry and reimbursement trends Preferred provider of choice – national presence Margin expansion opportunities APC growth Leveraging fixed labor base Track record of strong cash flow growth Continued compliance with all covenants – with LTM headroom of 20% Completed billing services and case management uncompensated care initiatives, 40% complete with technology deployment 50 |
 QUESTION-AND-ANSWER SESSION |