Exhibit 1
There is a Better Way Vote “AGAINST” Management’s Spin-Out Proposal November 2015 www.BetterACAS.com
Additional Information Elliott Associates, L.P. and Elliott International, L.P. (“Elliott”) intend to make a filing with the Securities and Exchange Commission of a definitive proxy statement and an accompanying proxy card to be used to solicit proxies in connection with the Special Meeting of Stockholders (including any adjournments or postponements thereof or any special meeting that may be called in lieu thereof) (the “Special Meeting”) of American Capital, Ltd. (the “Company”). Information relating to the participants in such proxy solicitation is available in a preliminary proxy statement filed by Elliott with the Securities and Exchange Commission on November 16, 2015 and in any amendments to that preliminary proxy statement. Stockholders are advised to read the definitive proxy statement and other documents related to the solicitation of stockholders of the Company for use at the Special Meeting when they become available because they will contain important information, including additional information relating to the participants in such proxy solicitation. When completed and available, Elliott’s definitive proxy statement and a form of proxy will be mailed to stockholders of the Company. These materials and other materials filed by Elliott in connection with the solicitation of proxies will be available at no charge at the Securities and Exchange Commission’s website at www.sec.gov. The definitive proxy statement (when available) and other relevant documents filed by Elliott with the Securities and Exchange Commission will also be available, without charge, by directing a request to Elliott’s proxy solicitor, Okapi Partners, at its toll-free number (877) 796-5274 or via email at info@okapipartners.com. Additional Information Cautionary Statement Regarding Forward-Looking Statements The information herein contains “forward-looking statements.” Specific forward-looking statements can be identified by the fact that they do not relate strictly to historical or current facts and include, without limitation, words such as “may,” “will,” “expects,” “believes,” “anticipates,” “plans,” “estimates,” “projects,” “targets,” “forecasts,” “seeks,” “could” or the negative of such terms or other variations on such terms or comparable terminology. Similarly, statements that describe our objectives, plans or goals are forward-looking. Our forward-looking statements are based on our current intent, belief, expectations, estimates and projections regarding the Company and projections regarding the industry in which it operates. These statements are not guarantees of future performance and involve risks, uncertainties, assumptions and other factors that are difficult to predict and that could cause actual results to differ materially. Accordingly, you should not rely upon forward-looking statements as a prediction of actual results and actual results may vary materially from what is expressed in or indicated by the forward-looking statements. 1
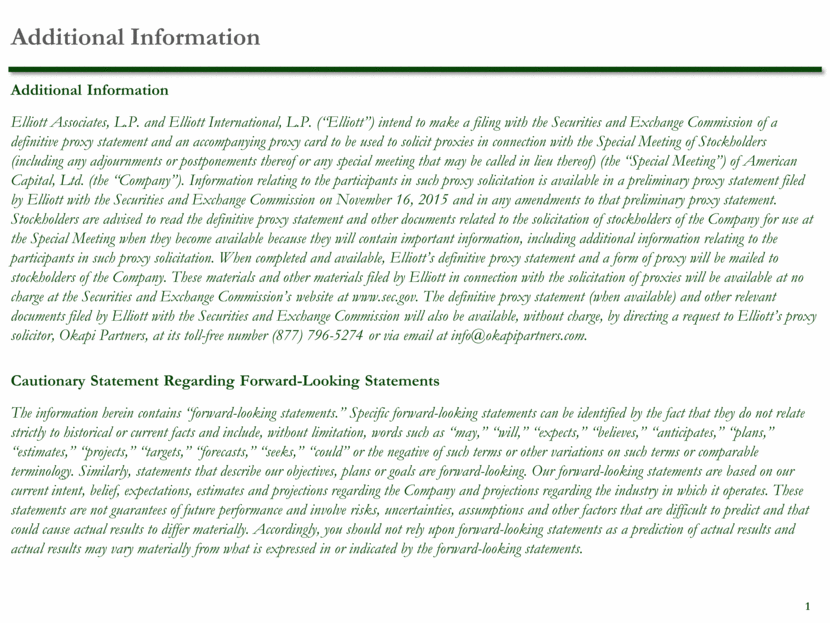
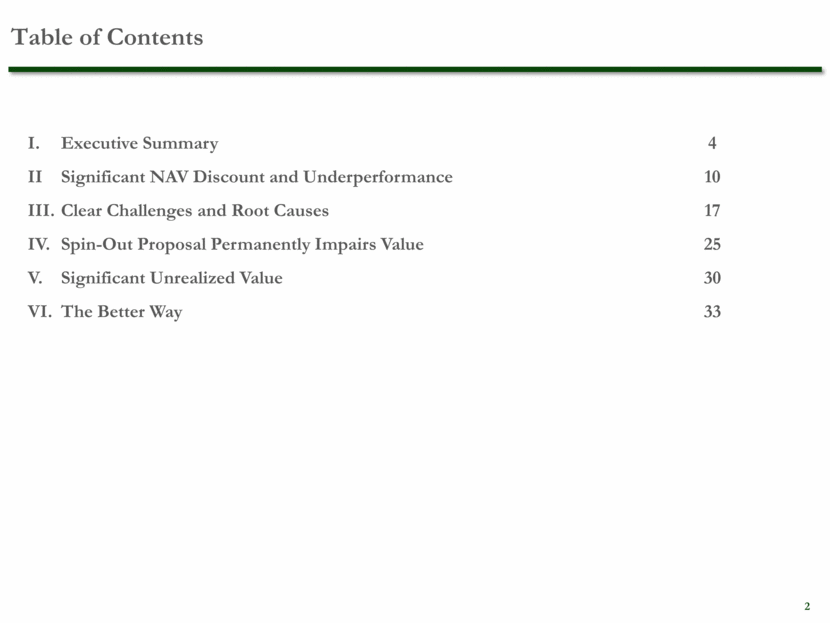
Table of Contents I. Executive Summary 4 II Significant NAV Discount and Underperformance 10 III. Clear Challenges and Root Causes 17 IV. Spin-Out Proposal Permanently Impairs Value 25 V. Significant Unrealized Value 30 VI. The Better Way 33 2
Executive Summary
Elliott believes that: American Capital has Systematically Failed to Deliver Shareholder Value Management’s Spin-Out Proposal will PERMANENTLY IMPAIR the Value of the Business There are Better Paths to Maximizing Shareholder Value Executive Summary Why Are We Here? 4
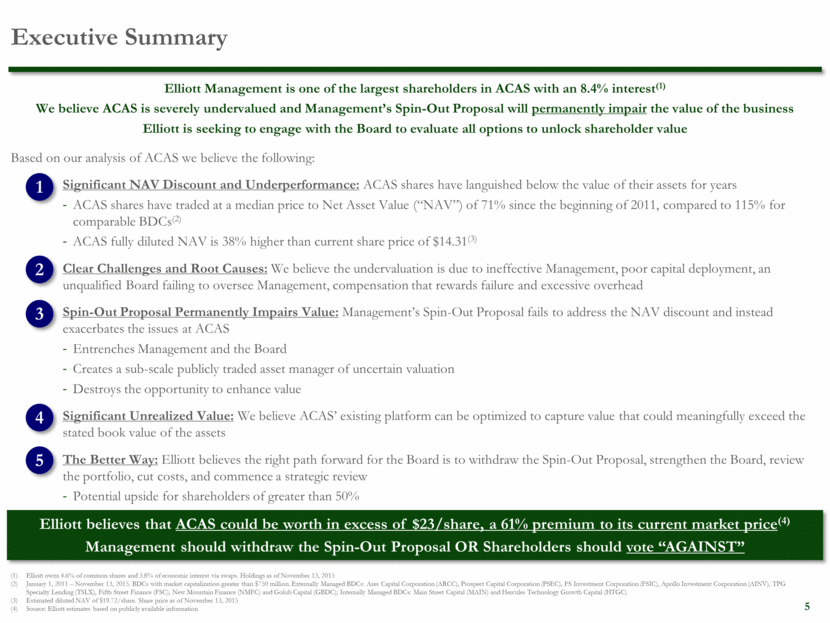
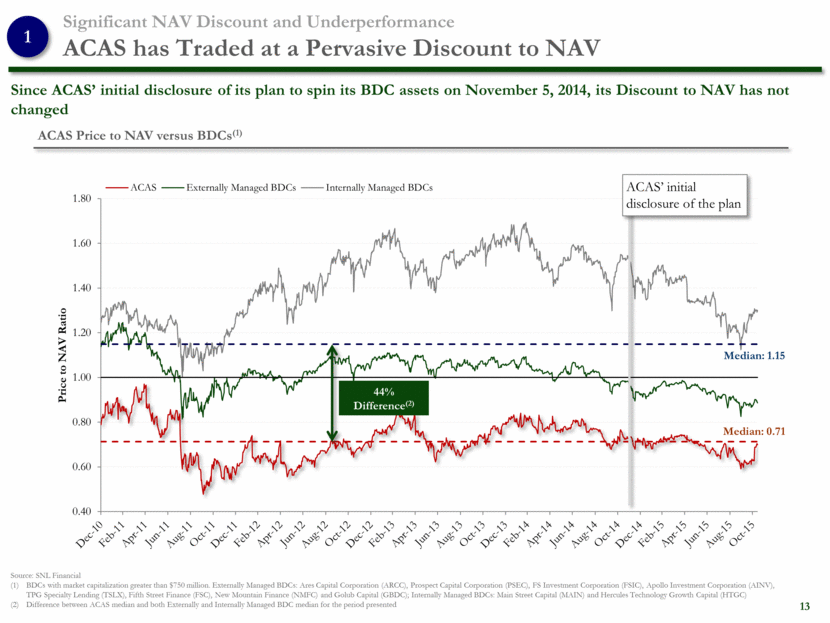
Elliott Management is one of the largest shareholders in ACAS with an 8.4% interest(1) We believe ACAS is severely undervalued and Management’s Spin-Out Proposal will permanently impair the value of the business Elliott is seeking to engage with the Board to evaluate all options to unlock shareholder value Executive Summary Based on our analysis of ACAS we believe the following: Significant NAV Discount and Underperformance: ACAS shares have languished below the value of their assets for years ACAS shares have traded at a median price to Net Asset Value (“NAV”) of 71% since the beginning of 2011, compared to 115% for comparable BDCs(2) ACAS fully diluted NAV is 38% higher than current share price of $14.31(3) Clear Challenges and Root Causes: We believe the undervaluation is due to ineffective Management, poor capital deployment, an unqualified Board failing to oversee Management, compensation that rewards failure and excessive overhead Spin-Out Proposal Permanently Impairs Value: Management’s Spin-Out Proposal fails to address the NAV discount and instead exacerbates the issues at ACAS Entrenches Management and the Board Creates a sub-scale publicly traded asset manager of uncertain valuation Destroys the opportunity to enhance value Significant Unrealized Value: We believe ACAS’ existing platform can be optimized to capture value that could meaningfully exceed the stated book value of the assets The Better Way: Elliott believes the right path forward for the Board is to withdraw the Spin-Out Proposal, strengthen the Board, review the portfolio, cut costs, and commence a strategic review Potential upside for shareholders of greater than 50% Elliott believes that ACAS could be worth in excess of $23/share, a 61% premium to its current market price(4) Management should withdraw the Spin-Out Proposal OR Shareholders should vote “AGAINST” Elliott owns 4.6% of common shares and 3.8% of economic interest via swaps. Holdings as of November 13, 2015 January 1, 2011 – November 13, 2015. BDCs with market capitalization greater than $750 million. Externally Managed BDCs: Ares Capital Corporation (ARCC), Prospect Capital Corporation (PSEC), FS Investment Corporation (FSIC), Apollo Investment Corporation (AINV), TPG Specialty Lending (TSLX), Fifth Street Finance (FSC), New Mountain Finance (NMFC) and Golub Capital (GBDC); Internally Managed BDCs: Main Street Capital (MAIN) and Hercules Technology Growth Capital (HTGC) Estimated diluted NAV of $19.72/share. Share price as of November 13, 2015 Source: Elliott estimates based on publicly available information 1 2 3 4 5 5
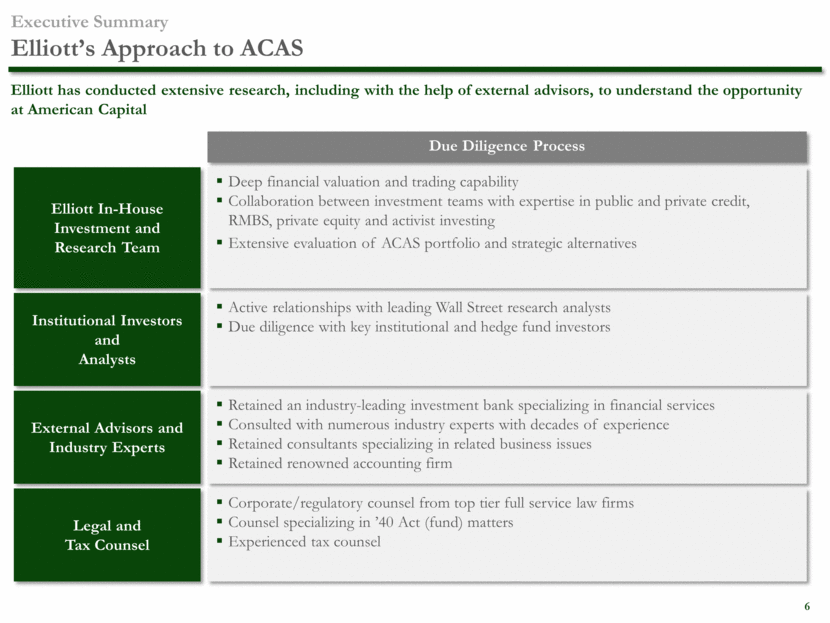
Elliott has conducted extensive research, including with the help of external advisors, to understand the opportunity at American Capital Executive Summary Elliott’s Approach to ACAS Due Diligence Process Elliott In-House Investment and Research Team Deep financial valuation and trading capability Collaboration between investment teams with expertise in public and private credit, RMBS, private equity and activist investing Extensive evaluation of ACAS portfolio and strategic alternatives Institutional Investors and Analysts Active relationships with leading Wall Street research analysts Due diligence with key institutional and hedge fund investors External Advisors and Industry Experts Retained an industry-leading investment bank specializing in financial services Consulted with numerous industry experts with decades of experience Retained consultants specializing in related business issues Retained renowned accounting firm Legal and Tax Counsel Corporate/regulatory counsel from top tier full service law firms Counsel specializing in ’40 Act (fund) matters Experienced tax counsel 6
Elliott Management Corporation manages two multi-strategy hedge funds which combined have more than $27 billion in assets under management Our flagship fund, Elliott Associates, L.P., was founded in 1977, making it one of the oldest hedge funds under continuous management Our investors include pension funds, sovereign wealth funds, endowments, foundations, funds-of-funds, high net worth individuals and families, and employees of the firm Elliott has extensive experience investing in the financial sector, including structured products, distressed and performing credit, and private equity Executive Summary Elliott Management Overview Based on our extensive experience with the asset class, and exhaustive research conducted to understand ACAS’ portfolio, operations and strategy, Elliott has developed a comprehensive plan to unlock value Elliott has conducted extensive due diligence on ACAS, and we are delighted to have the opportunity to share our recommendations with fellow shareholders Elliott has been trading a variety of corporate credit for over 30 years. Our areas of expertise include liquid loans, high yield bonds and illiquid special situations Special Situations and Private Equity Elliott has a global team of over 50 investment professionals worldwide focused on valuing and trading structured and corporate credit Structured and Corporate Credit Elliott has a long track record of adding value in activist investing Recent examples include EMC, Hess, Citrix, InterPublic Group, Informatica, Riverbed and BMC Activist Equity Investing 7
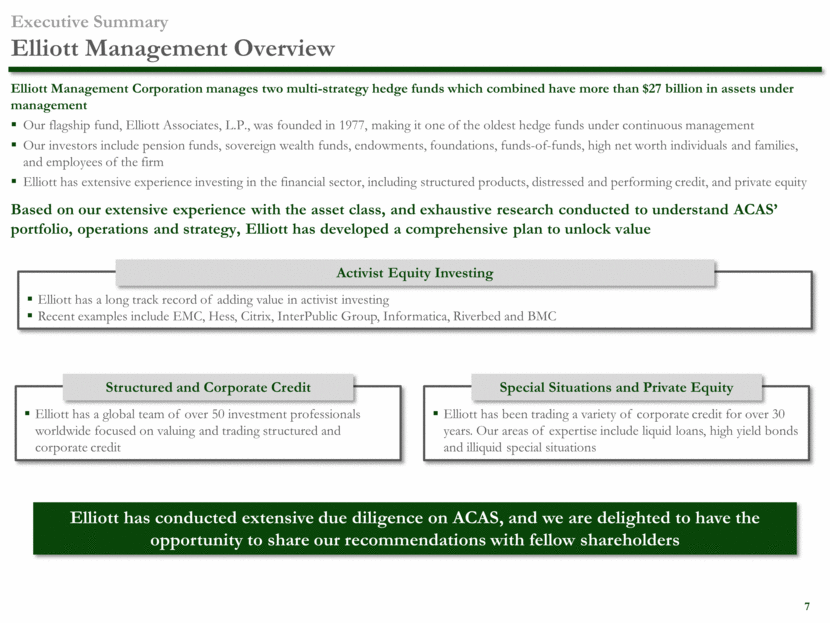
Executive Summary What is ACAS Today? ACAS is a $6 billion portfolio of on-balance sheet financial assets and an asset management platform, American Capital Asset Management (“ACAM”) Source: Bloomberg. Top 10 as of latest reported individual holdings (June 30, 2015). Institutional ownership estimated by Bloomberg as of November 12, 2015 Estimated to be greater than $200 million as of December 31, 2014, based on ACAM financials in ACAS 10-K (investments at fair value less senior and subordinated note obligations at fair value) Excludes ACAM and non-investment assets ACAS reported “Earning AUM” as of September 30, 2015 American Capital Equity I, II and III – $1.0 billion European Capital Funds – $0.15 billion ACAS CLO Fund I - $0.40 billion Private Equity Assets - $1.6 billion 8 ACAS CLOs – $3.4 billion ACSF Senior Loan Fund – $0.3 billion Leveraged Finance - $3.7 billion American Capital Agency (NASDAQ: AGNC)- $9.1 billion American Capital Mortgage (NASDAQ: MTGE) - $1.1 billion Real Estate Assets - $10.2 billion ACAM Profile ACAM has $1.1 billion of calculated fair value as of September 30, 2015, which includes CLO investments(2) ACAS has $15 billion of reported third party assets under management, and a leading mortgage REIT platform Investment Portfolio Profile $6.0 billion of reported fair value as of September 30, 2015(3) Highly diversified across industries, less than 2% exposure to Oil & Gas (4) ACAS is the second largest publicly listed BDC. Unlike other BDCs, ACAS does not pay a dividend (and has not paid a cash dividend since 2008) ACAS has a highly concentrated investor base with greater than 40% ownership in top 10 holders and greater than 80% institutional ownership(1) 8 $ in millions $2,227 $1,561 $632 $615 $459 $528 Senior Loans Senior Debt and Revolving Credit Mezzanine Debt Preferred Equity Common Equity Structured Products
Significant NAV Discount and Underperformance
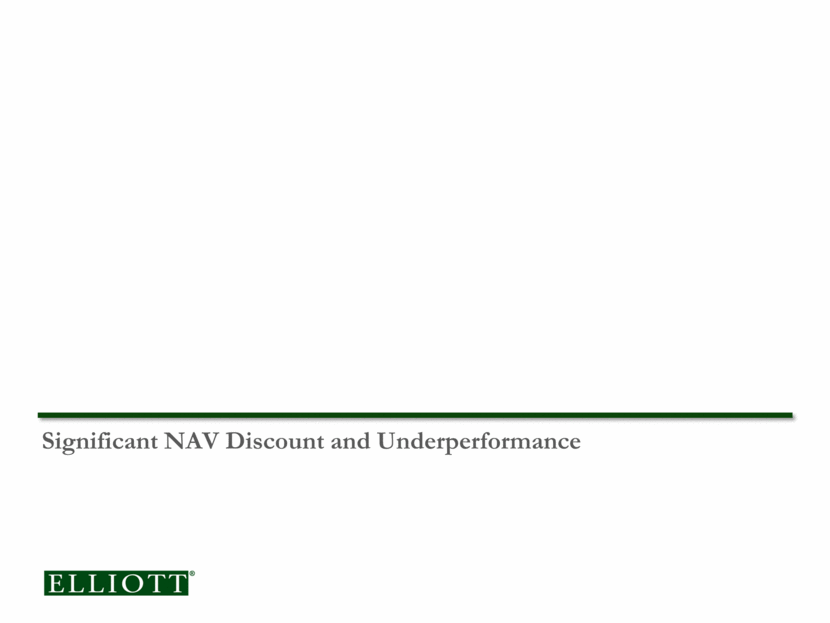
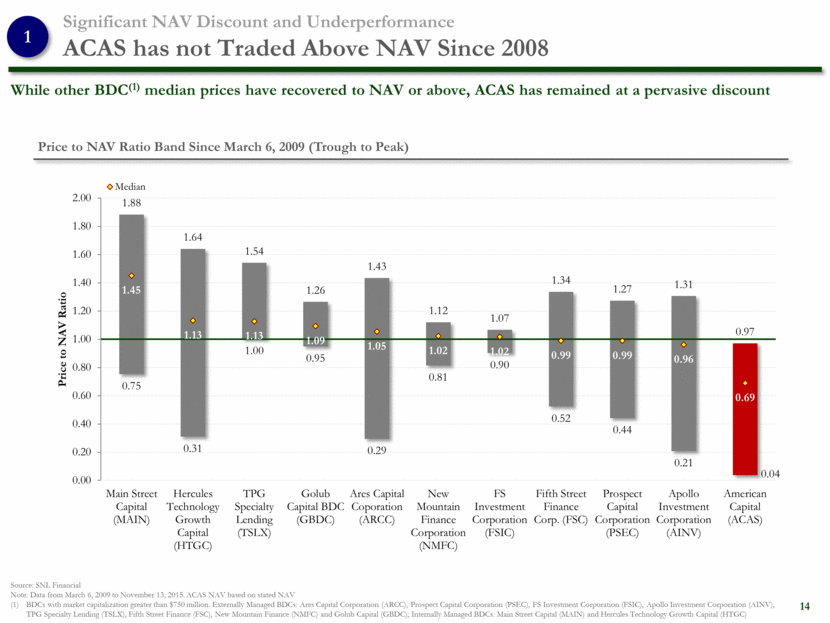
We believe ACAS has drastically underperformed as a result of a wide-ranging set of strategic, operational and leadership issues across its organization Significant NAV Discount and Underperformance Shareholder Value Destruction and Root Causes Dramatic Stock Underperformance Persistent and Significant Discount to NAV Excessive and Dilutive Management Stock Grants ACAS' poor execution is widely recognized by investors and Wall Street. ACAS stock has not traded at NAV since 2008 Shareholder Value Destruction: Root Causes: Ineffective Management Drives Low Valuation Poor Capital Deployment Directors Lack Qualifications to Oversee Management Compensation that Rewards Failure Excessive Overhead The Causes of the Value Destruction are Completely Fixable 1 10
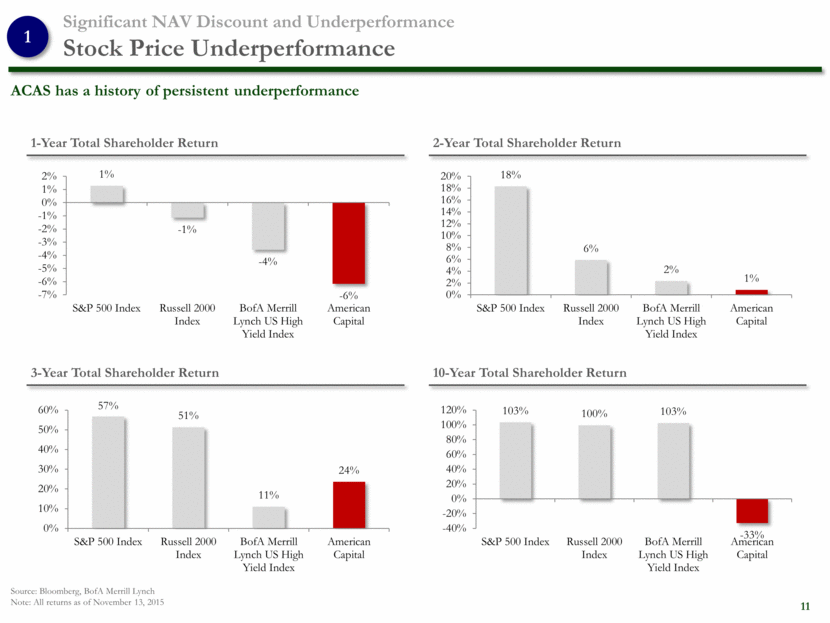
Significant NAV Discount and Underperformance Stock Price Underperformance 1-Year Total Shareholder Return 2-Year Total Shareholder Return 3-Year Total Shareholder Return 10-Year Total Shareholder Return ACAS has a history of persistent underperformance Source: Bloomberg, BofA Merrill Lynch Note: All returns as of November 13, 2015 1 11 1% - 1% - 4% - 6% -7% -6% -5% -4% -3% -2% -1% 0% 1% 2% S&P 500 Index Russell 2000 Index BofA Merrill Lynch US High Yield Index American Capital 18% 6% 2% 1% 0% 2% 4% 6% 8% 10% 12% 14% 16% 18% 20% S&P 500 Index Russell 2000 Index BofA Merrill Lynch US High Yield Index American Capital 57% 51% 11% 24% 0% 10% 20% 30% 40% 50% 60% S&P 500 Index Russell 2000 Index BofA Merrill Lynch US High Yield Index American Capital 103% 100% 103% - 33% -40% -20% 0% 20% 40% 60% 80% 100% 120% S&P 500 Index Russell 2000 Index BofA Merrill Lynch US High Yield Index American Capital
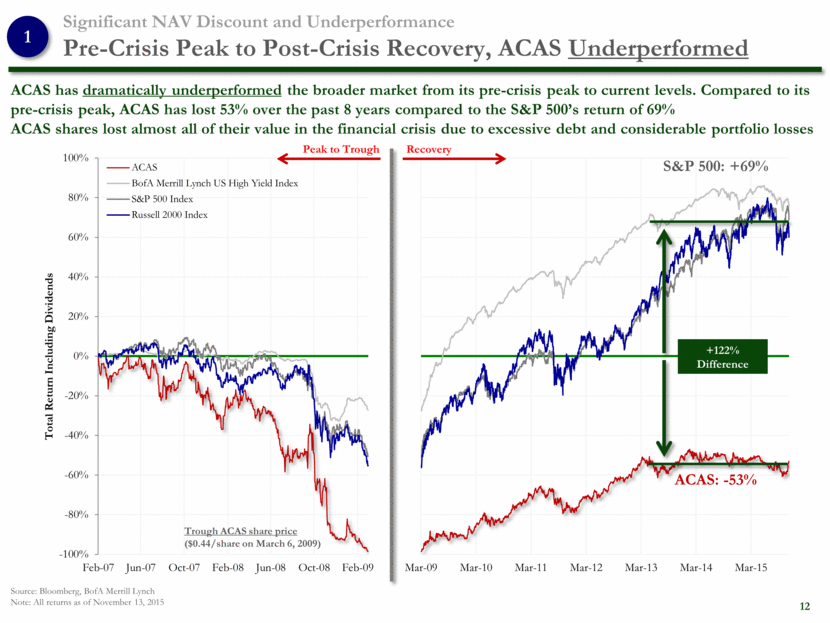
Significant NAV Discount and Underperformance Pre-Crisis Peak to Post-Crisis Recovery, ACAS Underperformed ACAS has dramatically underperformed the broader market from its pre-crisis peak to current levels. Compared to its pre-crisis peak, ACAS has lost 53% over the past 8 years compared to the S&P 500’s return of 69% ACAS shares lost almost all of their value in the financial crisis due to excessive debt and considerable portfolio losses S&P 500: +69% ACAS: -53% Source: Bloomberg, BofA Merrill Lynch Note: All returns as of November 13, 2015 Peak to Trough Recovery Trough ACAS share price ($0.44/share on March 6, 2009) 1 +122% Difference 12 -1 -0.8 -0.6 -0.4 -0.2 0 0.2 0.4 0.6 0.8 1 Mar-09 Mar-10 Mar-11 Mar-12 Mar-13 Mar-14 Mar-15 -100% -80% -60% -40% -20% 0% 20% 40% 60% 80% 100% Feb-07 Jun-07 Oct-07 Feb-08 Jun-08 Oct-08 Feb-09 Total Return Including Dividends ACAS BofA Merrill Lynch US High Yield Index S&P 500 Index Russell 2000 Index
Significant NAV Discount and Underperformance ACAS has Traded at a Pervasive Discount to NAV Source: SNL Financial BDCs with market capitalization greater than $750 million. Externally Managed BDCs: Ares Capital Corporation (ARCC), Prospect Capital Corporation (PSEC), FS Investment Corporation (FSIC), Apollo Investment Corporation (AINV), TPG Specialty Lending (TSLX), Fifth Street Finance (FSC), New Mountain Finance (NMFC) and Golub Capital (GBDC); Internally Managed BDCs: Main Street Capital (MAIN) and Hercules Technology Growth Capital (HTGC) Difference between ACAS median and both Externally and Internally Managed BDC median for the period presented ACAS’ initial disclosure of the plan 1 44% Difference(2) ACAS Price to NAV versus BDCs(1) 13 Since ACAS’ initial disclosure of its plan to spin its BDC assets on November 5, 2014, its Discount to NAV has not changed Median: 0.71 Median: 1.15 0.40 0.60 0.80 1.00 1.20 1.40 1.60 1.80 Price to NAV Ratio ACAS Externally Managed BDCs Internally Managed BDCs
Significant NAV Discount and Underperformance ACAS has not Traded Above NAV Since 2008 While other BDC(1) median prices have recovered to NAV or above, ACAS has remained at a pervasive discount Source: SNL Financial Note: Data from March 6, 2009 to November 13, 2015. ACAS NAV based on stated NAV BDCs with market capitalization greater than $750 million. Externally Managed BDCs: Ares Capital Corporation (ARCC), Prospect Capital Corporation (PSEC), FS Investment Corporation (FSIC), Apollo Investment Corporation (AINV), TPG Specialty Lending (TSLX), Fifth Street Finance (FSC), New Mountain Finance (NMFC) and Golub Capital (GBDC); Internally Managed BDCs: Main Street Capital (MAIN) and Hercules Technology Growth Capital (HTGC) 1 Price to NAV Ratio Band Since March 6, 2009 (Trough to Peak) 14 0.75 0.31 1.00 0.95 0.29 0.81 0.90 0.52 0.44 0.21 0.04 1.88 1.64 1.54 1.26 1.43 1.12 1.07 1.34 1.27 1.31 0.97 1.45 1.13 1.13 1.09 1.05 1.02 1.02 0.99 0.99 0.96 0.69 0.00 0.20 0.40 0.60 0.80 1.00 1.20 1.40 1.60 1.80 2.00 Main Street Capital (MAIN) Hercules Technology Growth Capital (HTGC) TPG Specialty Lending (TSLX) Golub Capital BDC (GBDC) Ares Capital Coporation (ARCC) New Mountain Finance Corporation (NMFC) FS Investment Corporation (FSIC) Fifth Street Finance Corp. (FSC) Prospect Capital Corporation (PSEC) Apollo Investment Corporation (AINV) American Capital (ACAS) Price to NAV Ratio Median
Significant NAV Discount and Underperformance NAV Underperformance ACAS’ net return to shareholders has been poor compared to other BDCs 1 Source: SNL Financial Note: ACAS NAV based on stated NAV. All returns as of November 13, 2015 Defined as change in NAV plus any dividends paid during that time period Net Return to Shareholders Over the Past 2 Years(1) Net Return to Shareholders Over the Past 3 Years(1) 15 71% 41% 39% 34% 31% 29% 24% 23% 23% 0% 10% 20% 30% 40% 50% 60% 70% 80% 43% 24% 23% 21% 19% 17% 16% 11% 6% 0% 5% 10% 15% 20% 25% 30% 35% 40% 45% 50%
Clear Challenges and Root Causes
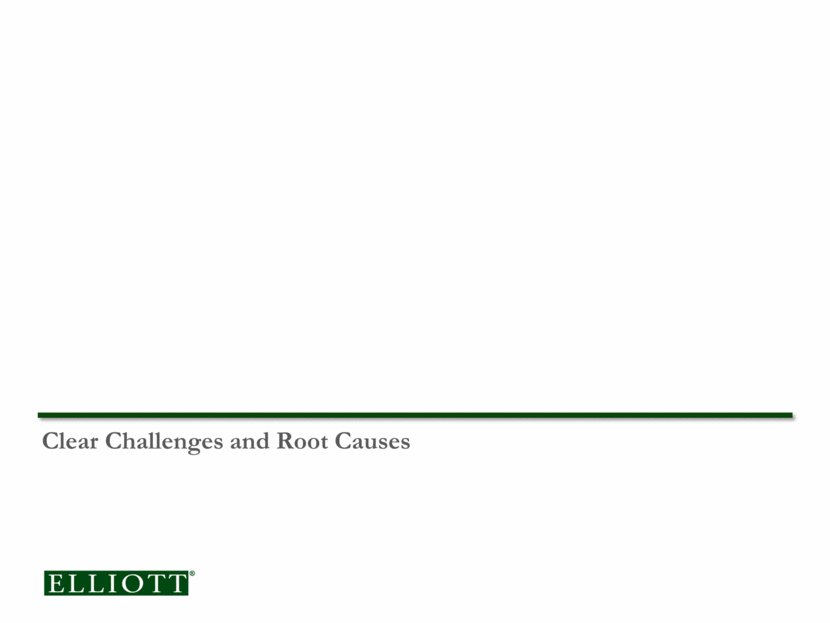
Median analyst price target for ACAS is a 10% discount to NAV compared to a 48% and 7% premium for Internally Managed BDCs and Externally Managed BDCs respectively(1) Clear Challenges and Root Causes Ineffective Management Drives Low Valuation 2 Source: Bloomberg, Wall Street Research Note: ACAS NAV based on stated NAV BDCs with market capitalization greater than $750 million. Externally Managed BDCs: Ares Capital Corporation (ARCC), Prospect Capital Corporation (PSEC), FS Investment Corporation (FSIC), Apollo Investment Corporation (AINV), TPG Specialty Lending (TSLX), Fifth Street Finance (FSC), New Mountain Finance (NMFC) and Golub Capital (GBDC); Internally Managed BDCs: Main Street Capital (MAIN) and Hercules Technology Growth Capital (HTGC) Wall Street Consensus Price Target Premium / (Discount) to NAV “The market is implying that the underlying assets are worth far less under ACAS management than they would be on a stand-alone basis.” Wells Fargo, August 7, 2015 17 48% 7% (10%) (20%) 0% 20% 40% 60% Internally Managed BDCs Externally Managed BDCs American Capital
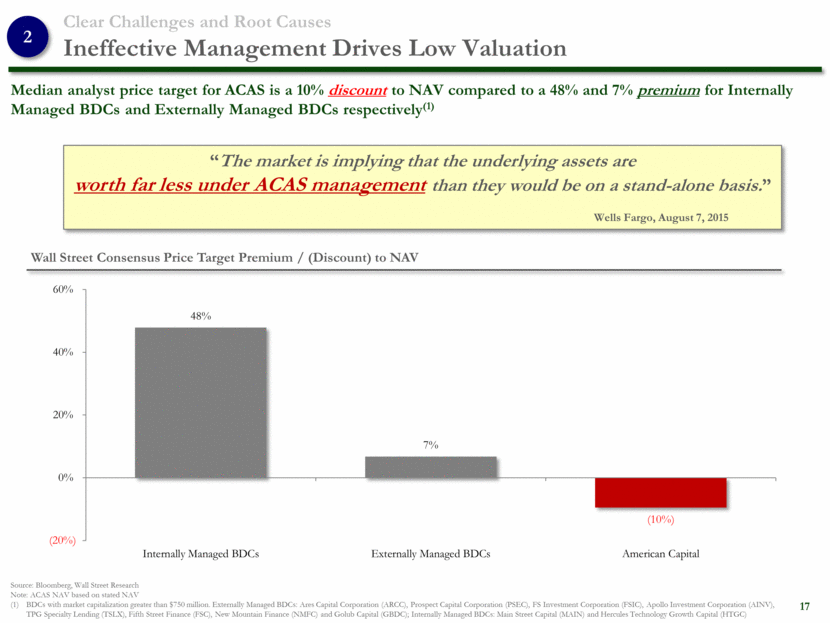
Clear Challenges and Root Causes Poor Capital Deployment Instead of generating riskless accretion through share repurchases, Management is making new investments in highly illiquid and risky assets Source: Company filings as of September 30, 2015 Year-to-date, ACAS has made $2.6 billion in new investments $1.2 billion in difficult to value and illiquid assets $1.4 billion in low yielding first lien debt ACAS has squandered a far superior alternative to invest in its own book at a huge discount to NAV by repurchasing shares (1) Represented lost potential for NAV/share accretion 2 18 Repurchase % of YTD Investments Repurchase Price 25% 35% 50% $15.26 (Year High) $1.03 $1.56 $2.56 $14.02 (Avg. Repurchase Price) $1.41 $2.16 $3.61 $12.05 (Year Low) $2.22 $3.48 $6.04 Theoretical NAV/share Accretion Prudent capital management would have allocated more to highly accretive repurchases $ in millions $1,443 $2,619 $244 $72 $183 $328 $349 $227 $0 $500 $1,000 $1,500 $2,000 $2,500 $3,000 Investment Activity Shares Repurchased Year - to - Date Investment Activity Structured Products Common Equity Preferred Equity Mezzanine Debt Second Lien Debt First Lien Debt
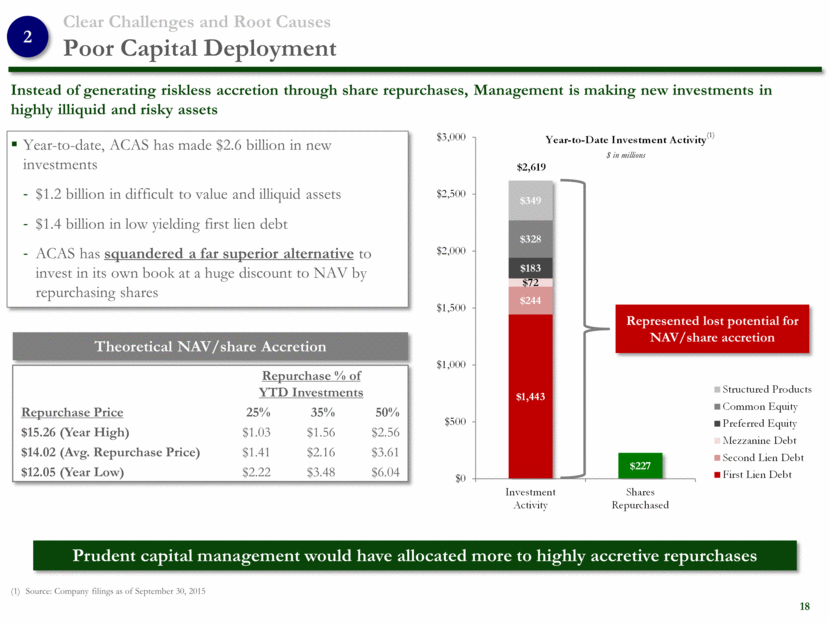
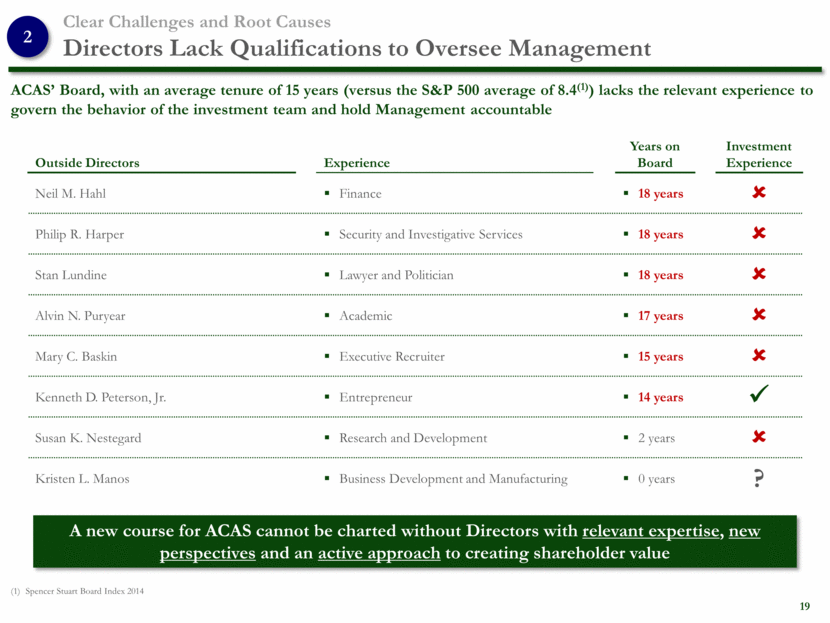
ACAS’ Board, with an average tenure of 15 years (versus the S&P 500 average of 8.4(1)) lacks the relevant experience to govern the behavior of the investment team and hold Management accountable Clear Challenges and Root Causes Directors Lack Qualifications to Oversee Management 2 Outside Directors Experience Years on Board Investment Experience Neil M. Hahl Finance 18 years Philip R. Harper Security and Investigative Services 18 years Stan Lundine Lawyer and Politician 18 years Alvin N. Puryear Academic 17 years Mary C. Baskin Executive Recruiter 15 years Kenneth D. Peterson, Jr. Entrepreneur 14 years Susan K. Nestegard Research and Development 2 years Kristen L. Manos Business Development and Manufacturing 0 years ? A new course for ACAS cannot be charted without Directors with relevant expertise, new perspectives and an active approach to creating shareholder value Spencer Stuart Board Index 2014 19
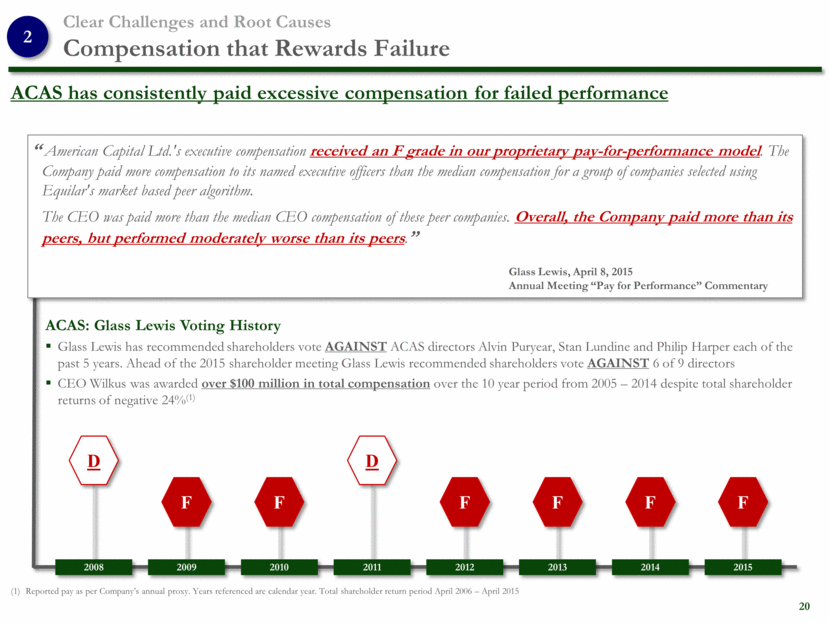
ACAS has consistently paid excessive compensation for failed performance Clear Challenges and Root Causes Compensation that Rewards Failure ACAS: Glass Lewis Voting History Glass Lewis has recommended shareholders vote AGAINST ACAS directors Alvin Puryear, Stan Lundine and Philip Harper each of the past 5 years. Ahead of the 2015 shareholder meeting Glass Lewis recommended shareholders vote AGAINST 6 of 9 directors CEO Wilkus was awarded over $100 million in total compensation over the 10 year period from 2005 – 2014 despite total shareholder returns of negative 24%(1) Reported pay as per Company’s annual proxy. Years referenced are calendar year. Total shareholder return period April 2006 – April 2015 “ American Capital Ltd.'s executive compensation received an F grade in our proprietary pay-for-performance model. The Company paid more compensation to its named executive officers than the median compensation for a group of companies selected using Equilar's market based peer algorithm. The CEO was paid more than the median CEO compensation of these peer companies. Overall, the Company paid more than its peers, but performed moderately worse than its peers.” Glass Lewis, April 8, 2015 Annual Meeting “Pay for Performance” Commentary F D 2008 2009 2010 2011 2012 2013 2014 2015 F F F F F D 2 20
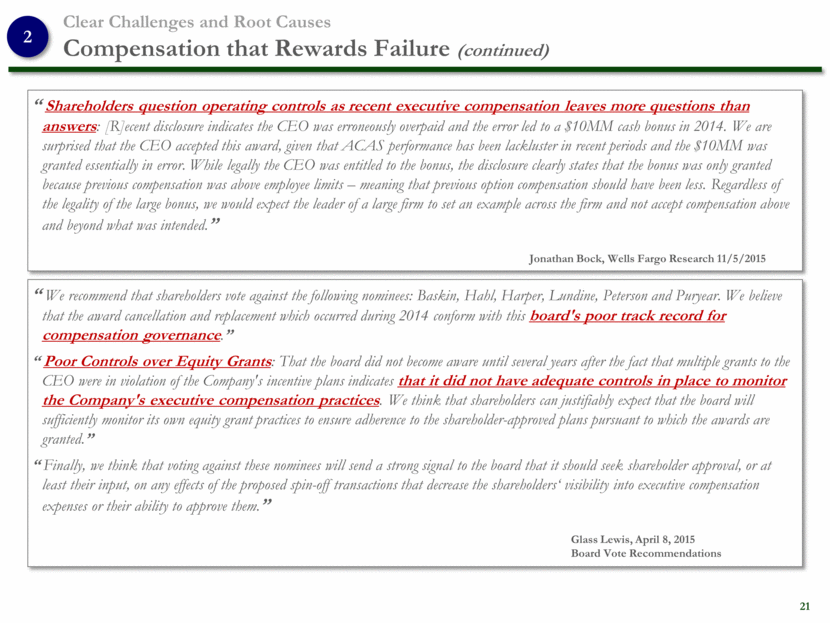
Clear Challenges and Root Causes Compensation that Rewards Failure (continued) 2 “ Shareholders question operating controls as recent executive compensation leaves more questions than answers: [R]ecent disclosure indicates the CEO was erroneously overpaid and the error led to a $10MM cash bonus in 2014. We are surprised that the CEO accepted this award, given that ACAS performance has been lackluster in recent periods and the $10MM was granted essentially in error. While legally the CEO was entitled to the bonus, the disclosure clearly states that the bonus was only granted because previous compensation was above employee limits – meaning that previous option compensation should have been less. Regardless of the legality of the large bonus, we would expect the leader of a large firm to set an example across the firm and not accept compensation above and beyond what was intended.” Jonathan Bock, Wells Fargo Research 11/5/2015 “ We recommend that shareholders vote against the following nominees: Baskin, Hahl, Harper, Lundine, Peterson and Puryear. We believe that the award cancellation and replacement which occurred during 2014 conform with this board's poor track record for compensation governance.” “ Poor Controls over Equity Grants: That the board did not become aware until several years after the fact that multiple grants to the CEO were in violation of the Company's incentive plans indicates that it did not have adequate controls in place to monitor the Company's executive compensation practices. We think that shareholders can justifiably expect that the board will sufficiently monitor its own equity grant practices to ensure adherence to the shareholder-approved plans pursuant to which the awards are granted.” “ Finally, we think that voting against these nominees will send a strong signal to the board that it should seek shareholder approval, or at least their input, on any effects of the proposed spin-off transactions that decrease the shareholders‘ visibility into executive compensation expenses or their ability to approve them.” Glass Lewis, April 8, 2015 Board Vote Recommendations 21
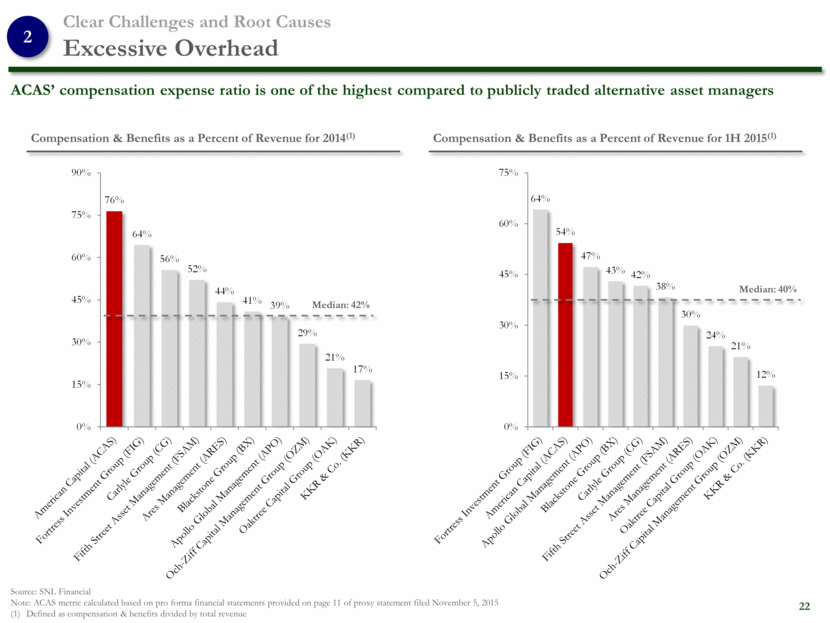
ACAS’ compensation expense ratio is one of the highest compared to publicly traded alternative asset managers Source: SNL Financial Note: ACAS metric calculated based on pro forma financial statements provided on page 11 of proxy statement filed November 5, 2015 Defined as compensation & benefits divided by total revenue Compensation & Benefits as a Percent of Revenue for 2014(1) Compensation & Benefits as a Percent of Revenue for 1H 2015(1) Clear Challenges and Root Causes Excessive Overhead 2 22 Median: 42% Median: 40% 64% 54% 47% 43% 42% 38% 30% 24% 21% 12% 0% 15% 30% 45% 60% 75% 76% 64% 56% 52% 44% 41% 39% 29% 21% 17% 0% 15% 30% 45% 60% 75% 90%
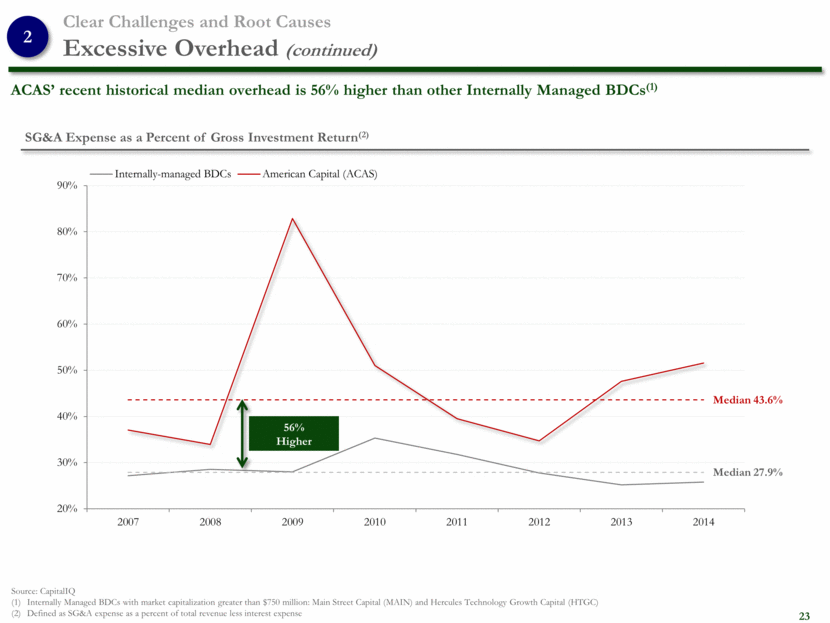
ACAS’ recent historical median overhead is 56% higher than other Internally Managed BDCs(1) Source: CapitalIQ Internally Managed BDCs with market capitalization greater than $750 million: Main Street Capital (MAIN) and Hercules Technology Growth Capital (HTGC) Defined as SG&A expense as a percent of total revenue less interest expense 23 SG&A Expense as a Percent of Gross Investment Return(2) Clear Challenges and Root Causes Excessive Overhead (continued) 2 56% Higher Median 27.9% Median 43.6% 20% 30% 40% 50% 60% 70% 80% 90% 2007 2008 2009 2010 2011 2012 2013 2014 Internally-managed BDCs American Capital (ACAS)
Spin-Out Proposal Permanently Impairs Value
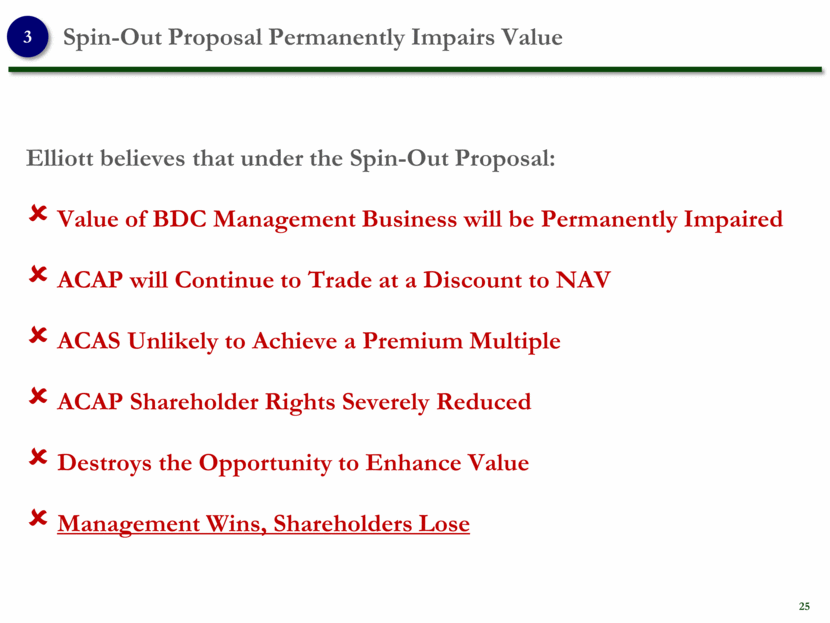
Spin-Out Proposal Permanently Impairs Value 3 25 Elliott believes that under the Spin-Out Proposal: Value of BDC Management Business will be Permanently Impaired ACAP will Continue to Trade at a Discount to NAV ACAS Unlikely to Achieve a Premium Multiple ACAP Shareholder Rights Severely Reduced Destroys the Opportunity to Enhance Value Management Wins, Shareholders Lose
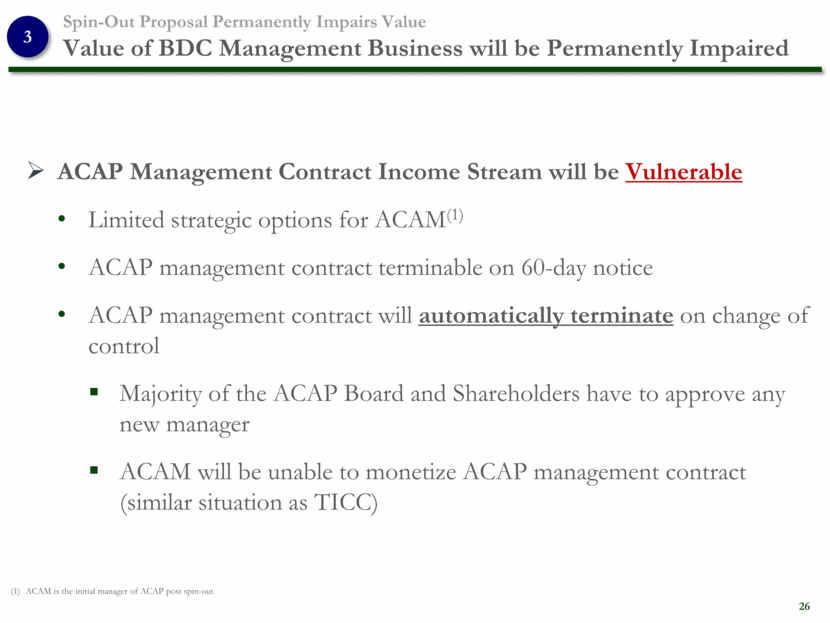
Spin-Out Proposal Permanently Impairs Value Value of BDC Management Business will be Permanently Impaired 3 26 ACAP Management Contract Income Stream will be Vulnerable Limited strategic options for ACAM(1) ACAP management contract terminable on 60-day notice ACAP management contract will automatically terminate on change of control Majority of the ACAP Board and Shareholders have to approve any new manager ACAM will be unable to monetize ACAP management contract (similar situation as TICC) ACAM is the initial manager of ACAP post spin-out
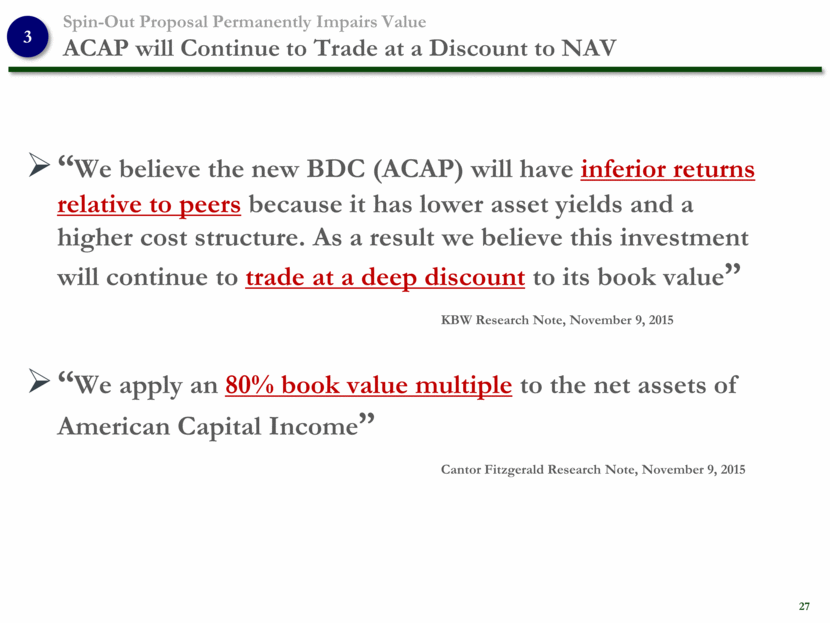
Spin-Out Proposal Permanently Impairs Value ACAP will Continue to Trade at a Discount to NAV 3 27 “We believe the new BDC (ACAP) will have inferior returns relative to peers because it has lower asset yields and a higher cost structure. As a result we believe this investment will continue to trade at a deep discount to its book value” KBW Research Note, November 9, 2015 “We apply an 80% book value multiple to the net assets of American Capital Income” Cantor Fitzgerald Research Note, November 9, 2015
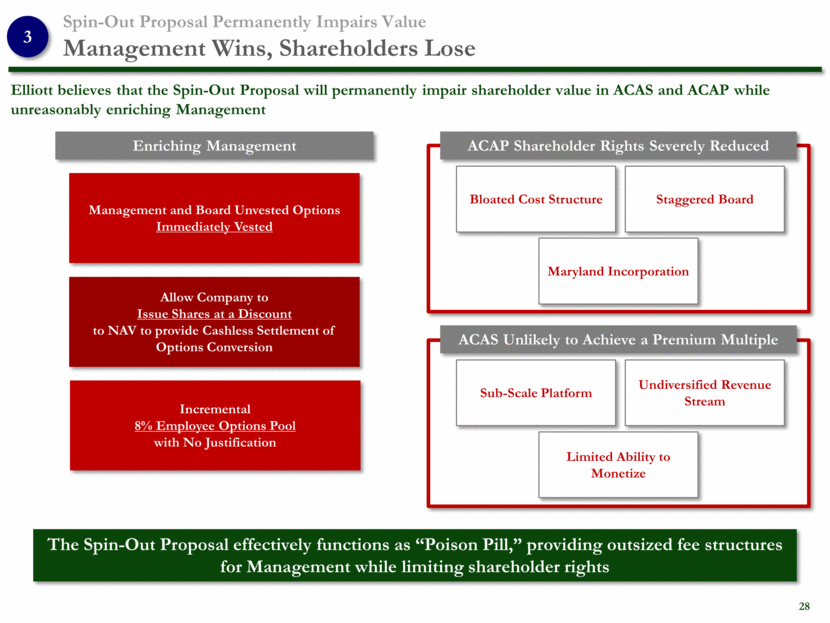
Elliott believes that the Spin-Out Proposal will permanently impair shareholder value in ACAS and ACAP while unreasonably enriching Management Spin-Out Proposal Permanently Impairs Value Management Wins, Shareholders Lose The Spin-Out Proposal effectively functions as “Poison Pill,” providing outsized fee structures for Management while limiting shareholder rights ACAS Unlikely to Achieve a Premium Multiple ACAP Shareholder Rights Severely Reduced 3 28 Management and Board Unvested Options Immediately Vested Allow Company to Issue Shares at a Discount to NAV to provide Cashless Settlement of Options Conversion Incremental 8% Employee Options Pool with No Justification Enriching Management Bloated Cost Structure Staggered Board Maryland Incorporation Sub-Scale Platform Undiversified Revenue Stream Limited Ability to Monetize
Significant Unrealized Value
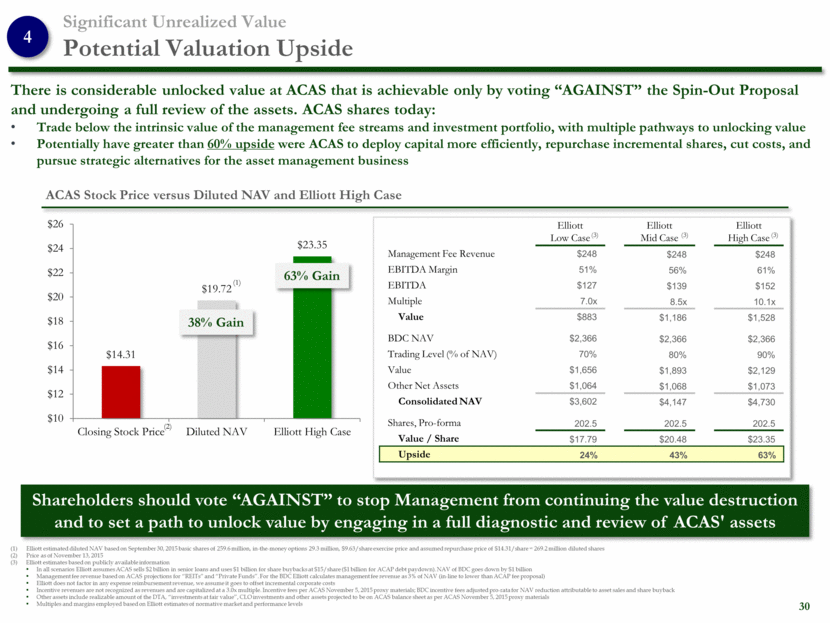
There is considerable unlocked value at ACAS that is achievable only by voting “AGAINST” the Spin-Out Proposal and undergoing a full review of the assets. ACAS shares today: Trade below the intrinsic value of the management fee streams and investment portfolio, with multiple pathways to unlocking value Potentially have greater than 60% upside were ACAS to deploy capital more efficiently, repurchase incremental shares, cut costs, and pursue strategic alternatives for the asset management business Significant Unrealized Value Potential Valuation Upside Elliott Low Case Elliott Mid Case Elliott High Case Management Fee Revenue $248 $248 $248 EBITDA Margin 51% 56% 61% EBITDA $127 $139 $152 Multiple 7.0x 8.5x 10.1x Value $883 $1,186 $1,528 BDC NAV $2,366 $2,366 $2,366 Trading Level (% of NAV) 70% 80% 90% Value $1,656 $1,893 $2,129 Other Net Assets $1,064 $1,068 $1,073 Consolidated NAV $3,602 $4,147 $4,730 Shares, Pro-forma 202.5 202.5 202.5 Value / Share $17.79 $20.48 $23.35 Upside 24% 43% 63% Shareholders should vote “AGAINST” to stop Management from continuing the value destruction and to set a path to unlock value by engaging in a full diagnostic and review of ACAS' assets ACAS Stock Price versus Diluted NAV and Elliott High Case 38% Gain 63% Gain (1) (2) (3) 4 Elliott estimated diluted NAV based on September 30, 2015 basic shares of 259.6 million, in-the-money options 29.3 million, $9.63/share exercise price and assumed repurchase price of $14.31/share = 269.2 million diluted shares Price as of November 13, 2015 Elliott estimates based on publicly available information In all scenarios Elliott assumes ACAS sells $2 billion in senior loans and uses $1 billion for share buybacks at $15/share ($1 billion for ACAP debt paydown). NAV of BDC goes down by $1 billion Management fee revenue based on ACAS projections for “REITs” and “Private Funds”. For the BDC Elliott calculates management fee revenue as 3% of NAV (in-line to lower than ACAP fee proposal) Elliott does not factor in any expense reimbursement revenue, we assume it goes to offset incremental corporate costs Incentive revenues are not recognized as revenues and are capitalized at a 3.0x multiple. Incentive fees per ACAS November 5, 2015 proxy materials; BDC incentive fees adjusted pro-rata for NAV reduction attributable to asset sales and share buyback Other assets include realizable amount of the DTA, “investments at fair value”, CLO investments and other assets projected to be on ACAS balance sheet as per ACAS November 5, 2015 proxy materials Multiples and margins employed based on Elliott estimates of normative market and performance levels 30 (3) (3) $14.31 $19.72 $23.35 $10 $12 $14 $16 $18 $20 $22 $24 $26 Closing Stock Price Diluted NAV Elliott High Case
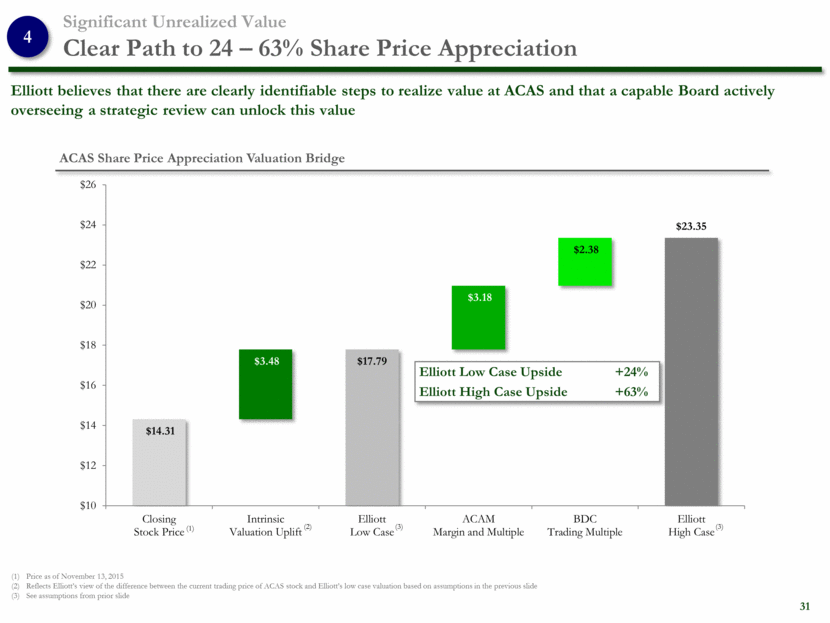
Elliott believes that there are clearly identifiable steps to realize value at ACAS and that a capable Board actively overseeing a strategic review can unlock this value Significant Unrealized Value Clear Path to 24 – 63% Share Price Appreciation ACAS Share Price Appreciation Valuation Bridge Elliott Low Case Upside +24% Elliott High Case Upside +63% Price as of November 13, 2015 Reflects Elliott’s view of the difference between the current trading price of ACAS stock and Elliott’s low case valuation based on assumptions in the previous slide See assumptions from prior slide (1) (2) (3) (3) 4 31 $14.31 $3.48 $17.79 $3.18 $2.38 $23.35 $10 $12 $14 $16 $18 $20 $22 $24 $26 Closing Stock Price Intrinsic Valuation Uplift Elliott Low Case ACAM Margin and Multiple BDC Trading Multiple Elliott High Case
The Better Way

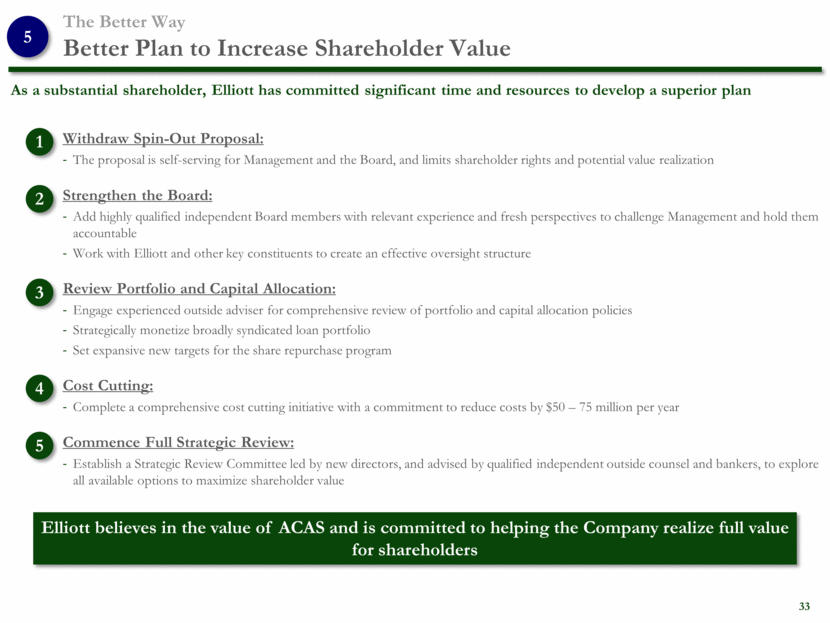
As a substantial shareholder, Elliott has committed significant time and resources to develop a superior plan The Better Way Better Plan to Increase Shareholder Value Elliott believes in the value of ACAS and is committed to helping the Company realize full value for shareholders 5 Withdraw Spin-Out Proposal: The proposal is self-serving for Management and the Board, and limits shareholder rights and potential value realization Strengthen the Board: Add highly qualified independent Board members with relevant experience and fresh perspectives to challenge Management and hold them accountable Work with Elliott and other key constituents to create an effective oversight structure Review Portfolio and Capital Allocation: Engage experienced outside adviser for comprehensive review of portfolio and capital allocation policies Strategically monetize broadly syndicated loan portfolio Set expansive new targets for the share repurchase program Cost Cutting: Complete a comprehensive cost cutting initiative with a commitment to reduce costs by $50 – 75 million per year Commence Full Strategic Review: Establish a Strategic Review Committee led by new directors, and advised by qualified independent outside counsel and bankers, to explore all available options to maximize shareholder value 1 2 3 4 5 33
