UNITED STATES
SECURITIES AND EXCHANGE COMMISSION
Washington, D.C. 20549
FORM N-CSR
CERTIFIED SHAREHOLDER REPORT OF REGISTERED
MANAGEMENT INVESTMENT COMPANIES
Investment Company Act file number: 811-07704
Schwab Capital Trust
(Exact name of registrant as specified in charter)
211 Main Street, San Francisco, California 94105
(Address of principal executive offices) (Zip code)
Jonathan de St. Paer
Schwab Capital Trust
211 Main Street, San Francisco, California 94105
(Name and address of agent for service)
Registrant’s telephone number, including area code: (415) 636-7000
Date of fiscal year end: October 31
Date of reporting period: October 31, 2022
Item 1: Report(s) to Shareholders.

| Total Return for the 12 Months Ended October 31, 2022 | |
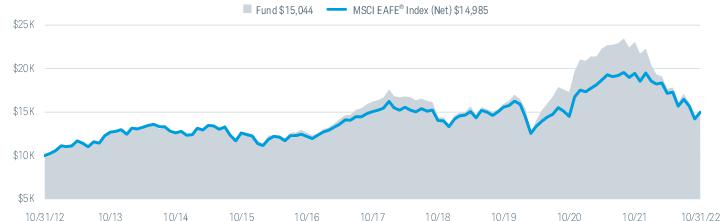
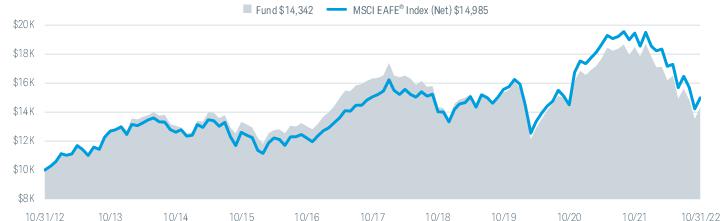
| Schwab International Opportunities Fund1 (Ticker Symbol: SWMIX) | -34.83% 2 |
| MSCI EAFE® Index (Net)3 | -23.00% |
| Fund Category: Morningstar Foreign Large Growth4 | -32.07% |
| Performance Details | pages 7-10 |
| 1 | The fund’s performance relative to the index may be affected by fair-value pricing and timing differences in foreign exchange calculations. See financial note 2 for more information. |
| 2 | Total return for the report period presented in the table differs from the return in the Financial Highlights. The total return presented in the above table is calculated based on the net asset value (NAV) at which shareholder transactions were processed. The total return presented in the Financial Highlights section of the report is calculated in the same manner, but also takes into account certain adjustments that are necessary under generally accepted accounting principles required in the annual and semiannual reports. |
| 3 | The net version of the index reflects reinvested dividends net of withholding taxes but reflects no deductions for expenses or other taxes. |
| 4 | Source for category information: Morningstar, Inc. The Morningstar Category return represents all active and index mutual funds and ETFs within the category as of the report date. |


| * | The net version of the index reflects reinvested dividends net of withholding taxes but reflects no deductions for expenses or other taxes. |

| * | The net version of the index reflects reinvested dividends net of withholding taxes but reflects no deductions for expenses or other taxes. |
 |
John Greves, CFA, Managing Director and Head of Multi-Asset Strategies, is responsible for the day-to-day co-management of the fund. Prior to joining Schwab in 2016, Mr. Greves worked at Russell Investment Management Company (Russell Investments) for 13 years, most recently as a portfolio manager for multi-asset solutions where he managed multiple target date funds, chaired the multi-asset advisory team, and co-authored papers on glide path methodology and benchmarking. Prior to that, he served in several roles for Russell Investments including associate portfolio manager for multi-asset solutions and senior portfolio analyst for multi-asset solutions. |
 |
Tony Creasy, CFA, Senior Portfolio Manager, is responsible for the day-to-day co-management of the fund. Prior to his current role, he was a portfolio manager on the Multi-Asset Strategies Team, responsible for the daily management of several multi-asset portfolios. He also spent several years as lead analyst on the Schwab Asset Management Investment Manager Research Team. Prior to that, Mr. Creasy was an institutional investment analyst for Schwab’s retirement investment services group, providing mutual fund analysis to support the Schwab Focus List™. |
 |
Daniel Piquet, CFA, Portfolio Manager, is responsible for the day-to-day co-management of the fund. Prior to joining Schwab, Mr. Piquet spent two years as an analyst at Santander Asset Management providing sub-adviser oversight in the firm’s global multi-asset solutions team. Before that, he was a portfolio analyst with Natixis Global Asset Management, performing portfolio risk analysis as well as equity, fixed income, and alternative mutual fund research. He also spent six years at The Vanguard Group, including two years as an investment analyst. |
 |
Chuck Craig, CFA, Senior Portfolio Manager, is responsible for the oversight and day-to-day co-management of the portion of the fund that is invested in accordance with a particular index. Prior to joining Schwab in 2012, Mr. Craig worked at Guggenheim Funds (formerly Claymore Group), where he spent more than five years as a managing director of portfolio management and supervision, and three years as vice president of product research and development. Prior to that, he worked as an equity research analyst at First Trust Portfolios (formerly Niké Securities), and a trader and analyst at PMA Securities, Inc. |
 |
David Rios, Portfolio Manager, is responsible for the day-to-day co-management of the portion of the fund that is invested in accordance with a particular index. Prior to this role, Mr. Rios was an associate portfolio manager on the equity index strategies team for four years. His first role with Schwab Asset Management was as a trade operations specialist. Prior to joining Schwab in 2008, Mr. Rios was a senior fund accountant at Investors Bank & Trust (subsequently acquired by State Street Corporation). |
| 1 | Total return for the report period above differs from the return in the Financial Highlights. The total return presented above is calculated based on the net asset value (NAV) at which shareholder transactions were processed. The total return presented in the Financial Highlights section of the report is calculated in the same manner, but also takes into account certain adjustments that are necessary under generally accepted accounting principles required in the annual and semiannual reports. |
| 2 | The total return cited for the index reflects reinvested dividends net of withholding taxes but reflects no deductions for expenses or other taxes. |
| Fund and Inception Date | 1 Year | 5 Years | 10 Years |
| Fund: Schwab International Opportunities Fund (4/2/04)2 | -34.83% 4 | -1.48% | 4.17% |
| MSCI EAFE® Index (Net)5 | -23.00% | -0.09% | 4.13% |
| Fund Category: Morningstar Foreign Large Growth6 | -32.07% | 0.81% | 4.87% |
| Fund Expense Ratio7: 0.83% | |||
| 1 | Fund expenses may have been partially absorbed by the investment adviser and its affiliates. Without these reductions, the fund’s returns would have been lower. These returns do not reflect the deduction of taxes that a shareholder would pay on fund distributions or the redemption of fund shares. |
| 2 | The fund commenced operations on October 16, 1996 which became the Schwab International Opportunities Fund (formerly Laudus International MarketMasters Fund) Investor Shares. The Investor Shares were consolidated into Select Shares on February 26, 2019. The performance presented is that of the former Select Shares which commenced operations on April 2, 2004. |
| 3 | The fund’s performance relative to the index may be affected by fair-value pricing. See financial note 2 for more information. |
| 4 | Total return for the report period presented in the table differs from the return in the Financial Highlights. The total return presented in the above table is calculated based on the net asset value (NAV) at which shareholder transactions were processed. The total return presented in the Financial Highlights section of the report is calculated in the same manner, but also takes into account certain adjustments that are necessary under generally accepted accounting principles required in the annual and semiannual reports. |
| 5 | The net version of the index reflects reinvested dividends net of withholding taxes but reflects no deductions for expenses or other taxes. |
| 6 | Source for category information: Morningstar, Inc. The Morningstar Category return represents all active and index mutual funds and ETFs within the category as of the report date. |
| 7 | As stated in the prospectus. Reflects the total annual fund operating expenses without contractual fee waivers. For actual expense ratios during the period, refer to the financial highlights section of the financial statements. |
| Investment Managers | Investment Style | %
of Net Assets |
| American Century Investment Management, Inc. | International Small-Cap Growth | 27.0% |
| Harris Associates L.P. | International Large-Cap Value | 21.7% |
| Charles Schwab Investment Management, Inc., dba Schwab Asset Management2 | International Large-Cap Developed | 21.0% |
| Mondrian Investment Partners Limited | International Small-Cap Value | 17.2% |
| Baillie Gifford Overseas Limited | International Growth | 7.0% |
| Cash and other assets3 | 6.1% |
| 1 | For more information about each of the investment manager’s investment styles, refer to the fund’s prospectus. |
| 2 | Charles Schwab Investment Management, Inc. manages a portion of the fund by primarily investing in stocks that are included in the FTSE Developed ex US Quality Factor Index. The Schwab International Opportunities Fund has been developed solely by Schwab Asset Management. Index Ownership – The fund is not in any way connected to or sponsored, endorsed, sold or promoted by the London Stock Exchange Group plc and its group undertakings (collectively, the LSE Group). FTSE Russell is a trading name of certain of the LSE Group companies. All rights in the FTSE Developed ex US Quality Factor Index (the Index) vest in the relevant LSE Group company which owns the Index. “FTSE®” is a trade mark of the relevant LSE Group company and is used by any other LSE Group company under license. |
| 3 | Charles Schwab Investment Management, Inc. can allocate a portion of the fund to particular market sectors, such as emerging markets, utilizing securities, exchange-traded funds (ETFs) and/or other registered investment companies and may also directly manage additional portions of the fund during transitions between investment managers. Charles Schwab Investment Management, Inc. also manages the cash portion of the fund. |


| 1 | Excludes derivatives. |
| 2 | This list is not a recommendation of any security by the investment adviser. |
| 3 | The percentage may differ from the Portfolio Holdings because the above calculation is based on a percentage of total investments, excluding derivatives, whereas the calculation in the Portfolio Holdings is based on a percentage of net assets. |
| EXPENSE
RATIO (ANNUALIZED) 1 |
BEGINNING
ACCOUNT VALUE AT 5/1/22 |
ENDING
ACCOUNT VALUE (NET OF EXPENSES) AT 10/31/22 |
EXPENSES
PAID DURING PERIOD 5/1/22-10/31/22 2 | |
| Schwab International Opportunities Fund | ||||
| Actual Return | 0.85% | $1,000.00 | $ 851.80 | $3.97 |
| Hypothetical 5% Return | 0.85% | $1,000.00 | $1,020.92 | $4.33 |
| 1 | Based on the most recent six-month expense ratio; may differ from the expense ratio provided in the Financial Highlights. |
| 2 | Expenses for the fund are equal to its annualized expense ratio, multiplied by the average account value over the period, multiplied by the 184 days of the period, and divided by the 365 days of the fiscal year. |
| 11/1/21–
10/31/22 |
11/1/20–
10/31/21 |
11/1/19–
10/31/20 |
11/1/18–
10/31/191 |
11/1/17–
10/31/18 |
||
| Per-Share Data | ||||||
| Net asset value at beginning of period | $30.60 | $24.37 | $22.89 | $22.89 | $26.96 | |
| Income (loss) from investment operations: | ||||||
| Net investment income (loss)2 | 0.26 | 0.01 | 0.00 3 | 0.31 | 0.24 | |
| Net realized and unrealized gains (losses) | (9.58) | 7.94 | 1.95 | 1.74 | (3.09) | |
| Total from investment operations | (9.32) | 7.95 | 1.95 | 2.05 | (2.85) | |
| Less distributions: | ||||||
| Distributions from net investment income | (0.28) | — | (0.43) | (0.29) | (0.36) | |
| Distributions from net realized gains | (4.10) | (1.72) | (0.04) | (1.76) | (0.86) | |
| Total distributions | (4.38) | (1.72) | (0.47) | (2.05) | (1.22) | |
| Net asset value at end of period | $16.90 | $30.60 | $24.37 | $22.89 | $22.89 | |
| Total return | (34.79%) | 33.50% | 8.56% | 10.50% | (11.09%) | |
| Ratios/Supplemental Data | ||||||
| Ratios to average net assets: | ||||||
| Net operating expenses | 0.99% 4,5 | 1.25% | 1.25% | 1.25% | 1.25% | |
| Gross operating expenses | 1.08% 5 | 1.47% | 1.51% | 1.50% | 1.51% | |
| Net investment income (loss) | 1.24% | 0.05% | 0.00% 6 | 1.43% | 0.92% | |
| Portfolio turnover rate | 81% | 59% | 65% | 54% | 69% | |
| Net assets, end of period (x 1,000,000) | $982 | $1,495 | $1,243 | $1,413 | $1,127 | |
| 1 | Effective February 26, 2019, the Investor Share class, and the Select Share class were consolidated into a single class of shares of the fund. The financial history as shown in the financial highlights is that of the former Select Shares. |
| 2 | Calculated based on the average shares outstanding during the period. |
| 3 | Per-share amount was less than $0.005. |
| 4 | Effective February 25, 2022, the net operating expense limitation was lowered from 1.25% to 0.86%. The ratio presented for the period ended October 31, 2022 is a blended ratio. |
| 5 | Ratio includes less than 0.005% of non-routine proxy expenses. |
| 6 | Less than 0.005% |
| SECURITY | VALUE
AT 10/31/21 |
PURCHASES | SALES | REALIZED
GAINS (LOSSES) |
NET
CHANGE IN UNREALIZED APPRECIATION (DEPRECIATION) |
VALUE
AT 10/31/22 |
BALANCE
OF SHARES HELD AT 10/31/22 |
DISTRIBUTIONS
RECEIVED(a) |
| AFFILIATED INVESTMENT COMPANIES 4.0% OF NET ASSETS | ||||||||
| United States 4.0% | ||||||||
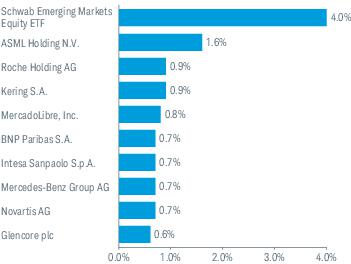
| Schwab Emerging Markets Equity ETF | $— | $59,607,100 | ($4,916,387) | ($1,135,113) | ($14,441,597) | $39,114,003 | 1,804,984 | $151,176 |
| (a) | Distributions received include distributions from net investment income and capital gains, if any, from the affiliated underlying fund. |
| DESCRIPTION | QUOTED
PRICES IN ACTIVE MARKETS FOR IDENTICAL ASSETS (LEVEL 1) |
OTHER
SIGNIFICANT OBSERVABLE INPUTS (LEVEL 2) |
SIGNIFICANT
UNOBSERVABLE INPUTS (LEVEL 3) |
TOTAL |
| Assets | ||||
| Common Stocks1 | $— | $393,576,748 | $— | $393,576,748 |
| Argentina | 7,898,191 | — | — | 7,898,191 |
| Australia | 182,082 | 57,954,560 | — | 58,136,642 |
| Brazil | 14,185,796 | — | — | 14,185,796 |
| Canada | 70,480,925 | — | — | 70,480,925 |
| China | 2,315,502 | 12,457,202 | — | 14,772,704 |
| India | 5,999,862 | 15,667,950 | — | 21,667,812 |
| Ireland | 4,065,957 | 2,322,637 | — | 6,388,594 |
| Israel | 7,254,854 | 3,783,690 | — | 11,038,544 |
| Italy | 1,253,085 | 17,701,284 | — | 18,954,369 |
| Mexico | 6,797,866 | — | — | 6,797,866 |
| Netherlands | 7,017,839 | 45,645,755 | — | 52,663,594 |
| Poland | — | 410,728 | 40,167 | 450,895 |
| South Africa | 2,695,811 | — | — | 2,695,811 |
| Sweden | 1,901,927 | 41,251,662 | — | 43,153,589 |
| Switzerland | 39,408 | 56,564,809 | — | 56,604,217 |
| Thailand | 2,030,589 | 1,330,330 | — | 3,360,919 |
| United Kingdom | 16,085,124 | 96,233,666 | — | 112,318,790 |
| United States | 10,481,092 | — | — | 10,481,092 |
| Preferred Stocks1 | — | 4,595,110 | — | 4,595,110 |
| Affiliated Investment Companies1 | 39,114,003 | — | — | 39,114,003 |
| Short-Term Investments1 | 28,994,689 | — | — | 28,994,689 |
| Futures Contracts2 | 767,044 | — | — | 767,044 |
| Total | $229,561,646 | $749,496,131 | $40,167 | $979,097,944 |
| 1 | As categorized in the Portfolio Holdings. |
| 2 | Futures contracts are reported at cumulative unrealized appreciation or depreciation. |
| Assets | ||
| Investments in securities, at value - affiliated (cost $53,555,600) | $39,114,003 | |
| Investments in securities, at value - unaffiliated (cost $1,073,009,269) including securities on loan of $374,495 | 939,216,897 | |
| Cash | 57,437 | |
| Foreign currency, at value (cost $630,110) | 627,102 | |
| Deposit with broker for futures contracts | 4,561,920 | |
| Receivables: | ||
| Investments sold | 3,293,191 | |
| Foreign tax reclaims | 1,668,804 | |
| Dividends | 1,328,197 | |
| Fund shares sold | 695,818 | |
| Income from securities on loan | 322 | |
| Prepaid expenses | + | 16,048 |
| Total assets | 990,579,739 | |
| Liabilities | ||
| Collateral held for securities on loan | 400,270 | |
| Payables: | ||
| Investments bought | 3,983,068 | |
| Fund shares redeemed | 2,600,261 | |
| Foreign capital gains tax | 580,339 | |
| Investment adviser and administrator fees | 483,377 | |
| Variation margin on futures contracts | 219,486 | |
| Shareholder service fees | 125,399 | |
| Independent trustees’ fees | 47 | |
| Accrued expenses | + | 535,598 |
| Total liabilities | 8,927,845 | |
| Net assets | $981,651,894 | |
| Net Assets by Source | ||
| Capital received from investors | $1,122,327,758 | |
| Total distributable loss | + | (140,675,864) |
| Net assets | $981,651,894 | |
| Net Asset Value (NAV) | ||||
| Net Assets | ÷ | Shares
Outstanding |
= | NAV |
| $981,651,894 | 58,073,255 | $16.90 | ||
| For the period November 1, 2021 through October 31, 2022 | ||
| Investment Income | ||
| Dividends received from securities - unaffiliated (net of foreign withholding tax of $2,600,188) | $26,797,763 | |
| Interest received from securities - unaffiliated | 338,885 | |
| Dividends received from securities - affiliated | 151,176 | |
| Securities on loan, net | + | 8,058 |
| Total investment income | 27,295,882 | |
| Expenses | ||
| Investment adviser and administrator fees | 10,582,968 | |
| Shareholder service fees | 1,912,725 | |
| Custodian fees | 329,873 | |
| Portfolio accounting fees | 148,553 | |
| Professional fees | 67,317 1 | |
| Registration fees | 30,274 | |
| Shareholder reports | 19,302 | |
| Independent trustees’ fees | 10,225 | |
| Transfer agent fees | 5,421 | |
| Proxy fees2 | 201 | |
| Other expenses | + | 96,733 |
| Total expenses | 13,203,592 | |
| Expense reduction | – | 1,039,893 1 |
| Net expenses | – | 12,163,699 |
| Net investment income | 15,132,183 | |
| REALIZED AND UNREALIZED GAINS (LOSSES) | ||
| Net realized losses on sales of securities - affiliated | (1,135,113) | |
| Net realized gains on sales of securities - unaffiliated (net of foreign capital gains tax paid of ($75,691)) | 35,504,750 | |
| Net realized losses on futures contracts | (9,817,529) | |
| Net realized gains on forward foreign currency exchange contracts | 390,863 | |
| Net realized losses on foreign currency transactions | + | (489,399) |
| Net realized gains | 24,453,572 | |
| Net change in unrealized appreciation (depreciation) on securities - affiliated | (14,441,597) | |
| Net change in unrealized appreciation (depreciation) on securities - unaffiliated (net of change in foreign capital gains tax of ($329,109)) | (559,900,963) | |
| Net change in unrealized appreciation (depreciation) on futures contracts | 900,478 | |
| Net change in unrealized appreciation (depreciation) on forward foreign currency exchange contracts | (71,094) | |
| Net change in unrealized appreciation (depreciation) on foreign currency translations | + | (76,678) |
| Net change in unrealized appreciation (depreciation) | + | (573,589,854) |
| Net realized and unrealized losses | (549,136,282) | |
| Decrease in net assets resulting from operations | ($534,004,099) | |
| 1 | Includes professional fees of $13,635 associated with the filing of tax claims in the European Union deemed to be non-contingent and non-routine expenses of the fund (see financial notes 2(d) and 4 for additional information). |
| 2 | Proxy fees are non-routine expenses (see financial note 4 for additional information). |
| OPERATIONS | |||
| 11/1/21-10/31/22 | 11/1/20-10/31/21 | ||
| Net investment income | $15,132,183 | $666,951 | |
| Net realized gains | 24,453,572 | 214,727,710 | |
| Net change in unrealized appreciation (depreciation) | + | (573,589,854) | 187,355,101 |
| Increase (decrease) in net assets resulting from operations | ($534,004,099) | $402,749,762 | |
| DISTRIBUTIONS TO SHAREHOLDERS | |||
| Total distributions | ($214,877,749) | ($85,551,526) | |
| TRANSACTIONS IN FUND SHARES | |||||
| 11/1/21-10/31/22 | 11/1/20-10/31/21 | ||||
| SHARES | VALUE | SHARES | VALUE | ||
| Shares sold | 12,166,159 | $258,391,714 | 2,560,644 | $74,676,320 | |
| Shares reinvested | 7,035,847 | 170,408,203 | 2,533,275 | 68,955,738 | |
| Shares redeemed | + | (9,976,603) | (192,980,903) | (7,230,462) | (208,820,997) |
| Net transactions in fund shares | 9,225,403 | $235,819,014 | (2,136,543) | ($65,188,939) | |
| SHARES OUTSTANDING AND NET ASSETS | |||||
| 11/1/21-10/31/22 | 11/1/20-10/31/21 | ||||
| SHARES | NET ASSETS | SHARES | NET ASSETS | ||
| Beginning of period | 48,847,852 | $1,494,714,728 | 50,984,395 | $1,242,705,431 | |
| Total increase (decrease) | + | 9,225,403 | (513,062,834) | (2,136,543) | 252,009,297 |
| End of period | 58,073,255 | $981,651,894 | 48,847,852 | $1,494,714,728 | |
| SCHWAB CAPITAL TRUST (ORGANIZED MAY 7, 1993) | |
| Schwab International Opportunities Fund | Schwab Target 2045 Fund |
| Schwab S&P 500 Index Fund | Schwab Target 2050 Fund |
| Schwab Small-Cap Index Fund® | Schwab Target 2055 Fund |
| Schwab Total Stock Market Index Fund® | Schwab Target 2060 Fund |
| Schwab U.S. Large-Cap Growth Index Fund | Schwab Target 2065 Fund |
| Schwab U.S. Large-Cap Value Index Fund | Schwab Fundamental US Large Company Index Fund |
| Schwab U.S. Mid-Cap Index Fund | Schwab Fundamental US Small Company Index Fund |
| Schwab International Index Fund® | Schwab Fundamental International Large Company Index Fund |
| Schwab MarketTrack All Equity Portfolio™ | Schwab Fundamental International Small Company Index Fund |
| Schwab MarketTrack Growth Portfolio™ | Schwab Fundamental Emerging Markets Large Company Index Fund |
| Schwab MarketTrack Balanced Portfolio™ | Schwab Fundamental Global Real Estate Index Fund |
| Schwab MarketTrack Conservative Portfolio™ | Schwab Target 2010 Index Fund |
| Schwab Balanced Fund | Schwab Target 2015 Index Fund |
| Schwab Core Equity Fund | Schwab Target 2020 Index Fund |
| Schwab Dividend Equity Fund | Schwab Target 2025 Index Fund |
| Schwab Large-Cap Growth Fund | Schwab Target 2030 Index Fund |
| Schwab Small-Cap Equity Fund | Schwab Target 2035 Index Fund |
| Schwab Health Care Fund | Schwab Target 2040 Index Fund |
| Schwab International Core Equity Fund | Schwab Target 2045 Index Fund |
| Schwab Target 2010 Fund | Schwab Target 2050 Index Fund |
| Schwab Target 2015 Fund | Schwab Target 2055 Index Fund |
| Schwab Target 2020 Fund | Schwab Target 2060 Index Fund |
| Schwab Target 2025 Fund | Schwab Target 2065 Index Fund |
| Schwab Target 2030 Fund | Schwab Monthly Income Fund – Target Payout |
| Schwab Target 2035 Fund | Schwab Monthly Income Fund – Flexible Payout |
| Schwab Target 2040 Fund | Schwab Monthly Income Fund – Income Payout |
| 3. Risk Factors: |
| 4. Affiliates and Affiliated Transactions: |
| % OF AVERAGE DAILY NET ASSETS | |
| First $500 million | 1.29% |
| $500 million to $1 billion | 1.275% |
| Over $1 billion | 1.25% |
| Schwab Balanced Fund | 5.8% |
| Schwab Target 2010 Fund | 0.2% |
| Schwab Target 2015 Fund | 0.3% |
| Schwab Target 2020 Fund | 2.5% |
| Schwab Target 2025 Fund | 4.2% |
| Schwab Target 2030 Fund | 9.5% |
| Schwab Target 2035 Fund | 5.7% |
| Schwab Target 2040 Fund | 12.4% |
| Schwab Target 2045 Fund | 2.9% |
| Schwab Target 2050 Fund | 3.0% |
| Schwab Target 2055 Fund | 2.0% |
| Schwab Target 2060 Fund | 0.6% |
| Schwab Target 2065 Fund | 0.1% |
| Schwab Emerging Markets Equity ETF | 0.5% |
| PURCHASES
OF SECURITIES |
SALES
OF SECURITIES |
| $991,287,110 | $956,319,513 |
| ASSET DERIVATIVES | FAIR VALUE |
| Equity Index Futures Contracts1 | $767,044 |
| Forward Foreign Currency Exchange Contracts2 | — |
| LIABILITY DERIVATIVES | FAIR VALUE |
| Equity Index Futures Contracts3 | $— |
| Forward Foreign Currency Exchange Contracts4 | — |
| 1 | Includes cumulative unrealized appreciation of futures contracts as reported in the Portfolio Holdings. Only current day’s variation margin on futures contracts is reported within the Statement of Assets and Liabilities. |
| 2 | Statement of Assets and Liabilities location: Unrealized appreciation on forward foreign currency exchange contracts. |
| 3 | Includes cumulative unrealized depreciation of futures contracts as reported in the Portfolio Holdings. Only current day’s variation margin on futures contracts is reported within the Statement of Assets and Liabilities. |
| 4 | Statement of Assets and Liabilities location: Unrealized depreciation on forward foreign currency exchange contracts. |
| Equity Index Futures Contracts | |
| Realized losses1 | ($9,817,529) |
| Net change in unrealized appreciation (depreciation)2 | 900,478 |
| Forward Foreign Currency Exchange Contracts | |
| Realized gains1 | 390,863 |
| Net change in unrealized appreciation (depreciation)2 | (71,094) |
| 1 | Statement of Operations location: Net realized losses on futures contracts and net realized gains on forward foreign currency exchange contracts. |
| 2 | Statement of Operations location: Net change in unrealized appreciation (depreciation) on futures contracts and net change in unrealized appreciation (depreciation) on forward foreign currency exchange contracts. |
| TAX COST | GROSS
UNREALIZED APPRECIATION |
GROSS
UNREALIZED DEPRECIATION |
NET
UNREALIZED APPRECIATION (DEPRECIATION) |
| $1,154,118,992 | $75,759,897 | ($250,780,945) | ($175,021,048) |
| UNDISTRIBUTED
ORDINARY INCOME |
UNDISTRIBUTED
LONG-TERM CAPITAL GAINS |
NET
UNREALIZED APPRECIATION (DEPRECIATION) ON INVESTMENTS |
NET
OTHER UNREALIZED APPRECIATION (DEPRECIATION) |
TOTAL |
| $8,753,846 | $26,256,614 | ($175,021,048) | ($665,276) | ($140,675,864) |
| CURRENT FISCAL YEAR END DISTRIBUTIONS | PRIOR FISCAL YEAR END DISTRIBUTIONS | |||
| ORDINARY
INCOME |
LONG-TERM
CAPITAL GAINS |
ORDINARY
INCOME |
LONG-TERM
CAPITAL GAINS | |
| $57,006,279 | $157,871,470 | $— | $85,551,526 | |
Denver, Colorado
December 16, 2022
| Proposal
– To elect each of the following individuals as trustees of the Trust: |
For | Withheld |
| Walter W. Bettinger II | 1,095,577,106.505 | 115,838,980.968 |
| Richard A. Wurster | 1,117,598,789.555 | 93,817,297.918 |
| Michael J. Beer | 1,116,890,447.505 | 94,525,639.968 |
| Robert W. Burns | 1,117,915,860.110 | 93,500,227.363 |
| Nancy F. Heller | 1,119,878,732.134 | 91,537,355.339 |
| David L. Mahoney | 1,069,125,022.434 | 142,291,065.039 |
| Jane P. Moncreiff | 1,120,187,927.838 | 91,228,159.635 |
| Kiran M. Patel | 1,116,689,111.571 | 94,726,975.902 |
| Kimberly S. Patmore | 1,119,941,056.059 | 91,475,031.414 |
| J. Derek Penn | 1,117,666,014.121 | 93,750,073.352 |
| Independent Trustees | |||
| Name,
Year of Birth, and Position(s) with the trust (Terms of office, and length of Time Served1) |
Principal
Occupations During the Past Five Years |
Number
of Portfolios in Fund Complex Overseen by the Trustee |
Other Directorships |
|
Michael J. Beer 1961 Trustee (Trustee of The Charles Schwab Family of Funds, Schwab Investments, Schwab Capital Trust, Schwab Annuity Portfolios, Schwab Strategic Trust and Laudus Trust since 2022) |
Retired. Director, President and Chief Executive Officer (Dec. 2016 – Sept. 2019), Principal Funds (investment management). | 105 | Director (2016 – 2019), Principal Funds, Inc. |
| Robert
W. Burns 1959 Trustee (Trustee of Schwab Strategic Trust since 2009; The Charles Schwab Family of Funds, Schwab Investments, Schwab Capital Trust, Schwab Annuity Portfolios and Laudus Trust since 2016) |
Retired/Private Investor. | 105 | None |
| Nancy
F. Heller 1956 Trustee (Trustee of The Charles Schwab Family of Funds, Schwab Investments, Schwab Capital Trust, Schwab Annuity Portfolios, Schwab Strategic Trust and Laudus Trust since 2018) |
Retired. | 105 | None |
| David
L. Mahoney 1954 Trustee (Trustee of The Charles Schwab Family of Funds, Schwab Investments, Schwab Capital Trust, Schwab Annuity Portfolios and Laudus Trust since 2011; Schwab Strategic Trust since 2016) |
Private Investor. | 105 | Director
(2004 – present), Corcept Therapeutics Incorporated Director (2009 – 2021), Adamas Pharmaceuticals, Inc. Director (2003 – 2019), Symantec Corporation |
| Jane
P. Moncreiff 1961 Trustee (Trustee of The Charles Schwab Family of Funds, Schwab Investments, Schwab Capital Trust, Schwab Annuity Portfolios, Schwab Strategic Trust and Laudus Trust since 2019) |
Consultant (2018 – present), Fulham Advisers LLC (management consulting); Chief Investment Officer (2009 – 2017), CareGroup Healthcare System, Inc. (healthcare). | 105 | None |
| Independent Trustees (continued) | |||
| Name,
Year of Birth, and Position(s) with the trust (Terms of office, and length of Time Served1) |
Principal
Occupations During the Past Five Years |
Number
of Portfolios in Fund Complex Overseen by the Trustee |
Other Directorships |
| Kiran
M. Patel 1948 Trustee (Trustee of The Charles Schwab Family of Funds, Schwab Investments, Schwab Capital Trust, Schwab Annuity Portfolios and Laudus Trust since 2011; Schwab Strategic Trust since 2016) |
Retired. | 105 | Director (2008 – present), KLA-Tencor Corporation |
| Kimberly
S. Patmore 1956 Trustee (Trustee of The Charles Schwab Family of Funds, Schwab Investments, Schwab Capital Trust, Schwab Annuity Portfolios, Schwab Strategic Trust and Laudus Trust since 2016) |
Consultant (2008 – present), Patmore Management Consulting (management consulting). | 105 | None |
|
J. Derek Penn 1957 Trustee (Trustee of The Charles Schwab Family of Funds, Schwab Investments, Schwab Capital Trust, Schwab Annuity Portfolios, Schwab Strategic Trust and Laudus Trust since 2021) |
Head of Equity Sales and Trading (2006 – 2018), BNY Mellon (financial services). | 105 | None |
| Interested Trustees | |||
| Name,
Year of Birth, and Position(s) with the trust (Terms of office, and length of Time Served1) |
Principal
Occupations During the Past Five Years |
Number
of Portfolios in Fund Complex Overseen by the Trustee |
Other Directorships |
| Walter
W. Bettinger II2 1960 Chairman and Trustee (Trustee of The Charles Schwab Family of Funds, Schwab Investments, Schwab Capital Trust and Schwab Annuity Portfolios since 2008; Schwab Strategic Trust since 2009; Laudus Trust since 2010) |
Co-Chairman of the Board (July 2022 – present), Director and Chief Executive Officer (Oct. 2008 – present) and President (Feb. 2007 – Oct. 2021), The Charles Schwab Corporation; President and Chief Executive Officer (Oct. 2008 – Oct. 2021) and Director (May 2008 – Oct. 2021), Charles Schwab & Co., Inc.; Director (Apr. 2006 – present), Charles Schwab Bank, SSB; Director (Nov. 2017 – present), Charles Schwab Premier Bank, SSB; Director (July 2019 – present), Charles Schwab Trust Bank; Director (May 2008 – present), Chief Executive Officer (Aug. 2017 – present) and President (Aug. 2017 – Nov. 2021), Schwab Holdings, Inc.; Director (Oct. 2020 – present), TD Ameritrade Holding Corporation; Director (July 2016 – Oct. 2021), Charles Schwab Investment Management, Inc. | 105 | Director (2008 – present), The Charles Schwab Corporation |
| Interested Trustees (continued) | |||
| Name,
Year of Birth, and Position(s) with the trust (Terms of office, and length of Time Served1) |
Principal
Occupations During the Past Five Years |
Number
of Portfolios in Fund Complex Overseen by the Trustee |
Other Directorships |
| Richard
A. Wurster2 1973 Trustee (Trustee of The Charles Schwab Family of Funds, Schwab Investments, Schwab Capital Trust, Schwab Annuity Portfolios, Schwab Strategic Trust and Laudus Trust since 2022) |
President (Oct. 2021 – present) and Executive Vice President – Schwab Asset Management Solutions (Apr. 2019 – Oct. 2021), The Charles Schwab Corporation; President, Director (Oct. 2021 – present), Executive Vice President – Schwab Asset Management Solutions (July 2019 – Oct. 2021) and Senior Vice President – Advisory (May 2016 – July 2019), Charles Schwab & Co., Inc.; President (Nov. 2021 – present), Schwab Holdings, Inc.; Director (Oct. 2021 – present) and Chief Executive Officer (Nov. 2019 – Jan. 2022), Charles Schwab Investment Management, Inc.; Director, Chief Executive Officer and President (Mar. 2018 – Oct. 2022), Charles Schwab Investment Advisory, Inc.; Chief Executive Officer (July 2016 – Apr. 2018) and President (Mar. 2017 – Apr. 2018), ThomasPartners, Inc.; Chief Executive Officer (July 2016 – Apr. 2018), Windhaven Investment Management, Inc. | 105 | None |
| Officers of the Trust | |
| Name,
Year of Birth, and Position(s) with the trust (Terms of office, and length of Time Served3) |
Principal Occupations During the Past Five Years |
| Jonathan
de St. Paer 1973 President and Chief Executive Officer (Officer of The Charles Schwab Family of Funds, Schwab Investments, Schwab Capital Trust, Schwab Annuity Portfolios, Schwab Strategic Trust and Laudus Trust since 2018) |
Director (Apr. 2019 – present), President (Oct. 2018 – present), Chief Operating Officer (Jan. 2021 – present), and Chief Executive Officer (Apr. 2019 – Nov. 2019), Charles Schwab Investment Management, Inc.; Senior Vice President (June 2020 – Mar. 2022) and Chief Operating Officer (Jan. 2021 – Mar. 2022), Charles Schwab Investment Advisory, Inc.; Chief Executive Officer (Apr. 2019 – present), President (Nov. 2018 – present) and Trustee (Apr. 2019 – Dec. 2020), Schwab Funds, Laudus Trust and Schwab ETFs; Managing Director (May 2022 – present), Senior Vice President (Apr. 2019 – May 2022) and Senior Vice President – Strategy and Product Development (CSIM) (Jan. 2014 – Mar. 2019), Charles Schwab & Co., Inc. |
| Mark
Fischer 1970 Treasurer, Chief Financial Officer and Chief Operating Officer (Officer of The Charles Schwab Family of Funds, Schwab Investments, Schwab Capital Trust, Schwab Annuity Portfolios, Schwab Strategic Trust and Laudus Trust since 2013) |
Treasurer and Chief Financial Officer (Jan. 2016 – present) and Chief Operating Officer (Dec. 2020 – present), Schwab Funds, Laudus Trust and Schwab ETFs; Chief Financial Officer (Mar. 2020 – present) and Vice President (Oct. 2013 – present), Charles Schwab Investment Management, Inc. |
| Omar
Aguilar 1970 Vice President and Chief Investment Officer (Officer of The Charles Schwab Family of Funds, Schwab Investments, Schwab Capital Trust, Schwab Annuity Portfolios, Schwab Strategic Trust and Laudus Trust since 2011) |
Chief Executive Officer (Jan. 2022 – present), Chief Investment Officer (Apr. 2011 – present) and Senior Vice President (Apr. 2011 – Dec. 2021), Charles Schwab Investment Management, Inc.; Director, Chief Executive Officer and President (Oct. 2022 – present), Charles Schwab Investment Advisory, Inc.; Vice President and Chief Investment Officer (June 2011 – present), Schwab Funds, Laudus Trust and Schwab ETFs. |
| Brett
Wander 1961 Vice President and Chief Investment Officer (Officer of The Charles Schwab Family of Funds, Schwab Investments, Schwab Capital Trust, Schwab Annuity Portfolios, Schwab Strategic Trust and Laudus Trust since 2011) |
Senior Vice President and Chief Investment Officer (Apr. 2011 – present), Charles Schwab Investment Management, Inc.; Vice President and Chief Investment Officer (June 2011 – present), Schwab Funds, Laudus Trust and Schwab ETFs. |
| William
P. McMahon, Jr. 1972 Vice President and Chief Investment Officer (Officer of The Charles Schwab Family of Funds, Schwab Investments, Schwab Capital Trust, Schwab Annuity Portfolios, Schwab Strategic Trust and Laudus Trust since 2021) |
Senior Vice President and Chief Investment Officer (Jan. 2020 – present), Charles Schwab Investment Management, Inc.; Vice President and Chief Investment Officer (June 2021 – present), Schwab Funds, Laudus Trust and Schwab ETFs; Senior Vice President and Chief Investment Officer – ThomasPartners Strategies (Apr. 2018 – Dec. 2019), Charles Schwab Investment Advisory, Inc.; Senior Vice President and Chief Investment Officer (May 2001 – Apr. 2018), ThomasPartners, Inc. |
| Officers of the Trust (continued) | |
| Name,
Year of Birth, and Position(s) with the trust (Terms of office, and length of Time Served3) |
Principal Occupations During the Past Five Years |
| Catherine
MacGregor 1964 Chief Legal Officer and Secretary, Schwab Funds and Schwab ETFs Chief Legal Officer, Vice President and Clerk, Laudus Trust (Officer of The Charles Schwab Family of Funds, Schwab Investments, Schwab Capital Trust, Schwab Annuity Portfolios and Laudus Trust since 2005; Schwab Strategic Trust since 2009) |
Chief Legal Officer (Mar. 2022 – present) and Vice President (Sept. 2005 – present), Charles Schwab Investment Management, Inc.; Managing Director (May 2022 – present) and Vice President (July 2005 – May 2022), Charles Schwab & Co., Inc.; Vice President (Dec. 2005 – present) and Chief Legal Officer and Clerk (Mar. 2007 – present), Laudus Trust; Chief Legal Officer and Secretary (Oct. 2021 – present), Vice President (Nov. 2005 – Oct. 2021) and Assistant Secretary (June 2007 – Oct. 2021), Schwab Funds; Chief Legal Officer and Secretary (Oct. 2021 – present), Vice President and Assistant Secretary (Oct. 2009 – Oct. 2021), Schwab ETFs. |
| 1 | Each Trustee shall hold office until the election and qualification of his or her successor, or until he or she dies, resigns or is removed. The retirement policy requires that each independent trustee retire by December 31 of the year in which the Trustee turns 74 or the Trustee’s twentieth year of service as an independent trustee on any trust in the Fund Complex, whichever occurs first. |
| 2 | Mr. Bettinger and Mr. Wurster are Interested Trustees. Mr. Bettinger and Mr. Wurster are Interested Trustees because each owns stock of The Charles Schwab Corporation (CSC), the parent company of Charles Schwab Investment Management, Inc., the investment adviser for the trusts in the Fund Complex, and is an employee of Charles Schwab & Co., Inc. (Schwab), the principal underwriter for The Charles Schwab Family of Funds, Schwab Investments, Schwab Capital Trust, Schwab Annuity Portfolios and Laudus Trust. |
| 3 | The President, Treasurer and Secretary/Clerk hold office until their respective successors are chosen and qualified or until he or she sooner dies, resigns, is removed or becomes disqualified. Each of the other officers serves at the pleasure of the Board. |
Schwab Funds
| ¹ | State, local, and the Federal Alternative Minimum Tax may apply. Capital gains are not exempt from Federal Taxation. |
| ² | You could lose money by investing in the Schwab Money Funds. All Schwab Money Funds with the exception of Schwab Variable Share Price Money Fund seek to preserve the value of your investment at $1.00 per share, but cannot guarantee they will do so. Because the share price of Schwab Variable Share Price Money Fund will fluctuate, when you sell your shares they may be worth more or less than what you originally paid for them. All Schwab Money Funds with the exception of Schwab Government Money Fund, Schwab Retirement Government Money Fund, Schwab U.S. Treasury Money Fund, Schwab Treasury Obligations Money Fund and Schwab Government Money Market Portfolio may impose a fee upon the sale of your shares or may temporarily suspend your ability to sell shares if the Fund’s liquidity falls below required minimums because of market conditions or other factors. An investment in the Schwab Money Funds is not insured or guaranteed by the Federal Deposit Insurance Corporation or any other government agency. The Schwab Money Funds’ sponsor has no legal obligation to provide financial support to the Funds, and you should not expect that the sponsor will provide financial support to the Funds at any time. |

| Total Return for the 12 Months Ended October 31, 2022 | |
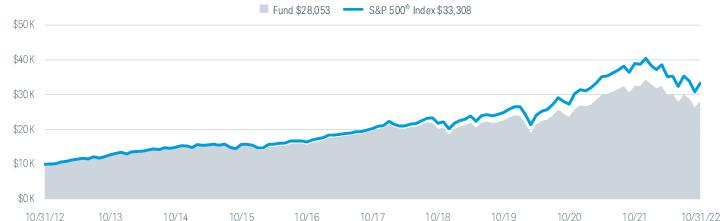
| Schwab Core Equity Fund (Ticker Symbol: SWANX) | -13.84% |
| S&P 500® Index | -14.61% |
| Fund Category: Morningstar Large Blend1 | -14.48% |
| Performance Details | pages 8-10 |
| Schwab Dividend Equity Fund2 (Ticker Symbol: SWDSX) | -3.96% |
| Russell 1000® Value Index | -7.00% |
| Fund Category: Morningstar Large Value1 | -4.53% |
| Performance Details | pages 11-13 |
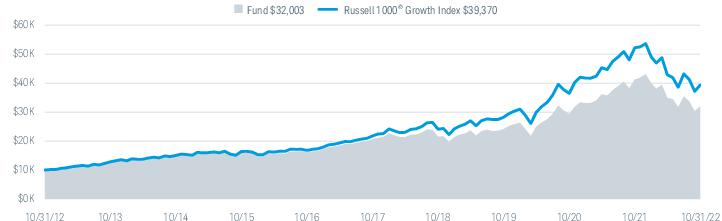
| Schwab Large-Cap Growth Fund (Ticker Symbol: SWLSX) | -22.45% |
| Russell 1000® Growth Index | -24.60% |
| Fund Category: Morningstar Large Growth1 | -28.11% |
| Performance Details | pages 14-16 |
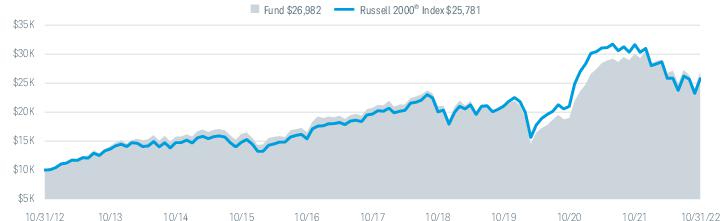
| Schwab Small-Cap Equity Fund (Ticker Symbol: SWSCX) | -10.25% |
| Russell 2000® Index | -18.54% |
| Fund Category: Morningstar Small Blend1 | -13.55% |
| Performance Details | pages 17-19 |
| Schwab Health Care Fund2 (Ticker Symbol: SWHFX) | -3.82% |
| Dow Jones Global Health Care Index | -10.03% |
| Fund Category: Morningstar Health1 | -17.14% |
| Performance Details | pages 20-22 |
| Schwab International Core Equity Fund2 (Ticker Symbol: SICNX) | -22.40% |
| MSCI EAFE® Index (Net)3 | -23.00% |
| Fund Category: Morningstar Foreign Large Blend1 | -24.04% |
| Performance Details | pages 23-25 |
| 1 | Source for category information: Morningstar, Inc. The Morningstar Category return represents all active and index mutual funds and ETFs within the category as of the report date. |
| 2 | The fund’s performance relative to the index may be affected by fair-value pricing and timing differences in foreign exchange calculations. See financial note 2 for more information. |
| 3 | The net version of the index reflects reinvested dividends net of withholding taxes but reflects no deductions for expenses or other taxes. |


| * | The net version of the index reflects reinvested dividends net of withholding taxes but reflects no deductions for expenses or other taxes. |

| * | The net version of the index reflects reinvested dividends net of withholding taxes but reflects no deductions for expenses or other taxes. |
 |
Bill McMahon, CFA, Managing Director and Chief Investment Officer of Active Equity Strategies for Schwab Asset Management, is responsible for the day-to-day co-management of the Schwab Large-Cap Growth Fund, Schwab Core Equity Fund, and Schwab Dividend Equity Fund. Mr. McMahon has more than 20 years of experience in the financial services industry. Prior to his current role, Mr. McMahon was an SVP in Charles Schwab Investment Advisory, Inc. (CSIA), serving as CIO and as a member of the portfolio management team for the ThomasPartners Strategies. Mr. McMahon co-founded ThomasPartners, Inc. in 2001 and served as partner of the firm until its acquisition by the Charles Schwab Corporation in 2012 and subsequent merger with CSIA in 2018. Mr. McMahon began his career at State Street Corporation, with the latter half of his tenure with State Street Global Advisors. |
 |
Iain Clayton, CFA, FRM, Senior Portfolio Manager and Head of Quantitative Portfolio Management for Schwab Asset Management, is responsible for the day-to-day co-management of the Schwab Core Equity Fund, Schwab International Core Equity Fund, Schwab Small-Cap Equity Fund, and Schwab Health Care Fund. Prior to joining Schwab in 2013, Mr. Clayton spent more than five years at SSI Investment Management where he was a portfolio manager and the director of quantitative research. In these roles, Mr. Clayton co-managed multiple investment strategies and developed quantitative models and valuation approaches. From 2004 to 2008, he worked as a portfolio manager and director at RCM Capital Management (now known as Allianz Global Investors) and helped manage various equity portfolios and developed fundamental-based stock selection models. Prior to that, he was a vice president at Eureka Investment Advisors for almost three years and also served as a senior quantitative analyst and assistant portfolio manager. He has also worked as a quantitative research analyst at RCM Capital Management. |
 |
Brian Hillburn, CFA, Senior Portfolio Manager and the Director of Fundamental Research for Schwab Asset Management, is responsible for the day-to-day co-management of the Schwab Core Equity Fund. Mr. Hillburn also provides fundamental equity research coverage for the ThomasPartners Strategies and the Schwab Active Equity Funds. Previously, Mr. Hillburn was a senior equity research analyst for the ThomasPartners Strategies at Schwab Asset Management. Prior to joining the ThomasPartners Strategies, Mr. Hillburn was an equity analyst at Rockland Trust, and earlier positions include equity research analysis roles on mutual fund teams at Wells Capital and Morgan Stanley Investment Management. |
 |
Wei Li, Ph.D., CFA, Senior Portfolio Manager, is responsible for the day-to-day co-management of the Schwab International Core Equity Fund, Schwab Dividend Equity Fund, Schwab Small-Cap Equity Fund, and Schwab Health Care Fund. Prior to joining Schwab in 2012, Ms. Li spent more than 10 years at Barclays Global Investors (now known as BlackRock), where she held a number of positions. From 2001 to 2009, she worked in various roles in the global advanced active group, including portfolio management and quantitative research for both U.S. and international equity markets. After 2009, she worked in the defined contribution research and product development area for almost two years. |
 |
Gretchen Novak, CFA, Senior Portfolio Manager, is responsible for the day-to-day co-management of the Schwab Large-Cap Growth Fund. Ms. Novak also provides fundamental equity research coverage of certain industry sectors for the ThomasPartners Strategies and the Schwab Active Equity Funds. Previously, Ms. Novak was a director and senior equity research analyst for the ThomasPartners Strategies at Schwab Asset Management. Prior to joining the ThomasPartners Strategies, Ms. Novak was a senior portfolio manager at Mazama Capital Management, Inc., where she oversaw the equity research and portfolio management of the firm’s consumer discretionary and staples sectors. Prior to Mazama Capital, Ms. Novak was an equity analyst at Cramer Rosenthal McGlynn, LLC. |
 |
Jim Serhant, CFA, Senior Portfolio Manager, is responsible for the day-to-day co-management of the Schwab Dividend Equity Fund and the ThomasPartners Balanced Strategies. Mr. Serhant also provides fundamental equity research coverage of certain industry sectors for the ThomasPartners Strategies and the Schwab Active Equity Funds. Prior to joining Schwab in 2016, Mr. Serhant was an executive vice president at Hartford Investment Management where he was the head of high yield and a senior portfolio manager, overseeing the credit research and portfolio management of the firm’s high yield strategies. Previously, he was a fixed income analyst at Delaware Investments and JP Morgan. |
 |
Holly Emerson, CFA, Portfolio Manager, is responsible for the day-to-day co-management of the Schwab Large-Cap Growth Fund and Schwab Small-Cap Equity Fund. Prior to joining Schwab in 2014, Ms. Emerson spent nearly 10 years at Algert Coldiron Investors LLC (now known as Algert Global), a quantitative market-neutral hedge fund manager. She held a number of positions at Algert, including assistant portfolio manager and director of operations. In her various roles, she acted as the lead portfolio manager for the Canadian fund, conducted macroeconomic research, and managed relationships with prime brokerage investment banks. |
| Fund and Inception Date | 1 Year | 5 Years | 10 Years |
| Fund: Schwab Core Equity Fund (7/1/96) | -13.84% | 7.38% | 10.87% |
| S&P 500® Index | -14.61% | 10.44% | 12.79% |
| Fund Category: Morningstar Large Blend2 | -14.48% | 9.03% | 11.44% |
| Fund Expense Ratio3: 0.73% | |||
| 1 | Fund expenses may have been partially absorbed by the investment adviser and its affiliates. Without these reductions, the fund’s returns would have been lower. These returns do not reflect the deduction of taxes that a shareholder would pay on fund distributions or the redemption of fund shares. |
| 2 | Source for category information: Morningstar, Inc. The Morningstar Category return represents all active and index mutual funds and ETFs within the category as of the report date. |
| 3 | As stated in the prospectus. Reflects the total annual fund operating expenses without contractual fee waivers. For actual expense ratios during the period, refer to the financial highlights section of the financial statements. |
| 1 | The percentage may differ from the Portfolio Holdings because the above calculation is based on a percentage of total investments, whereas the calculation in the Portfolio Holdings is based on a percentage of net assets. |
| 2 | This list is not a recommendation of any security by the investment adviser. |
| Fund and Inception Date | 1 Year | 5 Years | 10 Years |
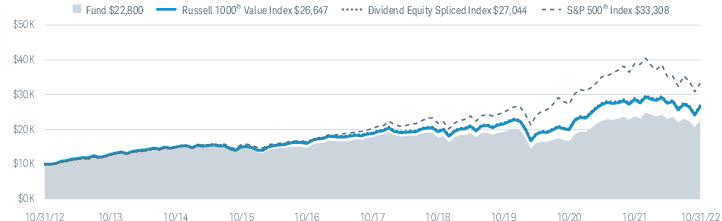
| Fund: Schwab Dividend Equity Fund (9/2/03) | -3.96% | 5.09% | 8.59% |
| Russell 1000® Value Index | -7.00% | 7.21% | 10.30% |
| Dividend Equity Spliced Index | -7.00% | 7.21% | 10.46% |
| S&P 500® Index | -14.61% | 10.44% | 12.79% |
| Fund Category: Morningstar Large Value3 | -4.53% | 7.67% | 10.21% |
| Fund Expense Ratios4: Net 0.89%; Gross 0.90% | |||
| 30-Day SEC Yield | 2.15% |
| 1 | Fund expenses may have been partially absorbed by the investment adviser and its affiliates. Without these reductions, the fund’s returns would have been lower. These returns do not reflect the deduction of taxes that a shareholder would pay on fund distributions or the redemption of fund shares. |
| 2 | The fund’s performance relative to the index may be affected by fair-value pricing. See financial note 2 for more information. |
| 3 | Source for category information: Morningstar, Inc. The Morningstar Category return represents all active and index mutual funds and ETFs within the category as of the report date. |
| 4 | As stated in the prospectus. Net Expense: Expenses reduced by a contractual fee waiver in effect for so long as Schwab Asset Management serves as the investment adviser to the fund. Gross Expense: Does not reflect the effect of contractual fee waivers. For actual expense ratios during the period, refer to the financial highlights section of the financial statements. |
| 1 | The percentage may differ from the Portfolio Holdings because the above calculation is based on a percentage of total investments, whereas the calculation in the Portfolio Holdings is based on a percentage of net assets. |
| 2 | This list is not a recommendation of any security by the investment adviser. |
| Fund and Inception Date | 1 Year | 5 Years | 10 Years |
| Fund: Schwab Large-Cap Growth Fund (10/3/05) | -22.45% | 9.18% | 12.34% |
| Russell 1000® Growth Index | -24.60% | 12.59% | 14.69% |
| Fund Category: Morningstar Large Growth2 | -28.11% | 9.51% | 12.37% |
| Fund Expense Ratios3: Net 0.99%; Gross 1.02% | |||
| 1 | Fund expenses may have been partially absorbed by the investment adviser and its affiliates. Without these reductions, the fund’s returns would have been lower. These returns do not reflect the deduction of taxes that a shareholder would pay on fund distributions or the redemption of fund shares. |
| 2 | Source for category information: Morningstar, Inc. The Morningstar Category return represents all active and index mutual funds and ETFs within the category as of the report date. |
| 3 | As stated in the prospectus. Net Expense: Expenses reduced by a contractual fee waiver in effect for so long as Schwab Asset Management serves as the investment adviser to the fund. Gross Expense: Does not reflect the effect of contractual fee waivers. For actual expense ratios during the period, refer to the financial highlights section of the financial statements. |
| 1 | Excludes derivatives. |
| 2 | The percentage may differ from the Portfolio Holdings because the above calculation is based on a percentage of total investments, excluding derivatives, whereas the calculation in the Portfolio Holdings is based on a percentage of net assets. |
| 3 | This list is not a recommendation of any security by the investment adviser. |
| Fund and Inception Date | 1 Year | 5 Years | 10 Years |
| Fund: Schwab Small-Cap Equity Fund (7/1/03) | -10.25% | 5.41% | 10.44% |
| Russell 2000® Index | -18.54% | 5.56% | 9.93% |
| Fund Category: Morningstar Small Blend2 | -13.55% | 5.76% | 9.75% |
| Fund Expense Ratio3: 1.08% | |||
| 1 | Fund expenses may have been partially absorbed by the investment adviser and its affiliates. Without these reductions, the fund’s returns would have been lower. These returns do not reflect the deduction of taxes that a shareholder would pay on fund distributions or the redemption of fund shares. |
| 2 | Source for category information: Morningstar, Inc. The Morningstar Category return represents all active and index mutual funds and ETFs within the category as of the report date. |
| 3 | As stated in the prospectus. Reflects the total annual fund operating expenses without contractual fee waivers. For actual expense ratios during the period, refer to the financial highlights section of the financial statements. |
| 1 | The percentage may differ from the Portfolio Holdings because the above calculation is based on a percentage of total investments, whereas the calculation in the Portfolio Holdings is based on a percentage of net assets. |
| 2 | This list is not a recommendation of any security by the investment adviser. |

| Fund and Inception Date | 1 Year | 5 Years | 10 Years |
| Fund: Schwab Health Care Fund (7/3/00) | -3.82% | 9.75% | 12.87% |
| Dow Jones Global Health Care Index | -10.03% | 8.96% | 11.52% |
| S&P 500® Index | -14.61% | 10.44% | 12.79% |
| Fund Category: Morningstar Health3 | -17.14% | 7.81% | 12.76% |
| Fund Expense Ratio4: 0.80% | |||
| 1 | Fund expenses may have been partially absorbed by the investment adviser and its affiliates. Without these reductions, the fund’s returns would have been lower. These returns do not reflect the deduction of taxes that a shareholder would pay on fund distributions or the redemption of fund shares. |
| 2 | The fund’s performance relative to the index may be affected by fair-value pricing. See financial note 2 for more information. |
| 3 | Source for category information: Morningstar, Inc. The Morningstar Category return represents all active and index mutual funds and ETFs within the category as of the report date. |
| 4 | As stated in the prospectus. Reflects the total annual fund operating expenses without contractual fee waivers. For actual expense ratios during the period, refer to the financial highlights section of the financial statements. |

| 1 | This list is not a recommendation of any security by the investment adviser. |
| 1 | The total return cited for the index reflects reinvested dividends net of withholding taxes but reflects no deductions for expenses or other taxes. |
| Fund and Inception Date | 1 Year | 5 Years | 10 Years |
| Fund: Schwab International Core Equity Fund (5/30/08) | -22.40% | -2.55% | 3.67% |
| MSCI EAFE® Index (Net)3 | -23.00% | -0.09% | 4.13% |
| Fund Category: Morningstar Foreign Large Blend4 | -24.04% | -0.51% | 3.75% |
| Fund Expense Ratio5: 0.86% | |||
| 1 | Fund expenses may have been partially absorbed by the investment adviser and its affiliates. Without these reductions, the fund’s returns would have been lower. These returns do not reflect the deduction of taxes that a shareholder would pay on fund distributions or the redemption of fund shares. |
| 2 | The fund’s performance relative to the index may be affected by fair-value pricing. See financial note 2 for more information. |
| 3 | The net version of the index reflects reinvested dividends net of withholding taxes but reflects no deductions for expenses or other taxes. |
| 4 | Source for category information: Morningstar, Inc. The Morningstar Category return represents all active and index mutual funds and ETFs within the category as of the report date. |
| 5 | As stated in the prospectus. Reflects the total annual fund operating expenses without contractual fee waivers. For actual expense ratios during the period, refer to the financial highlights section of the financial statements. |


| 1 | This list is not a recommendation of any security by the investment adviser. |
| 2 | The percentage may differ from the Portfolio Holdings because the above calculation is based on a percentage of total investments, whereas the calculation in the Portfolio Holdings is based on a percentage of net assets. |
| EXPENSE
RATIO (ANNUALIZED) 1 |
BEGINNING
ACCOUNT VALUE AT 5/1/22 |
ENDING
ACCOUNT VALUE (NET OF EXPENSES) AT 10/31/22 |
EXPENSES
PAID DURING PERIOD 5/1/22-10/31/22 2 | |
| Schwab Core Equity Fund | ||||
| Actual Return | 0.73% | $1,000.00 | $ 938.30 | $3.57 |
| Hypothetical 5% Return | 0.73% | $1,000.00 | $1,021.53 | $3.72 |
| Schwab Dividend Equity Fund | ||||
| Actual Return | 0.89% | $1,000.00 | $ 990.20 | $4.46 |
| Hypothetical 5% Return | 0.89% | $1,000.00 | $1,020.72 | $4.53 |
| Schwab Large-Cap Growth Fund | ||||
| Actual Return | 0.99% | $1,000.00 | $ 915.10 | $4.78 |
| Hypothetical 5% Return | 0.99% | $1,000.00 | $1,020.21 | $5.04 |
| Schwab Small-Cap Equity Fund | ||||
| Actual Return | 1.09% | $1,000.00 | $1,009.10 | $5.52 |
| Hypothetical 5% Return | 1.09% | $1,000.00 | $1,019.71 | $5.55 |
| Schwab Health Care Fund | ||||
| Actual Return | 0.80% | $1,000.00 | $1,000.00 | $4.03 |
| Hypothetical 5% Return | 0.80% | $1,000.00 | $1,021.17 | $4.08 |
| Schwab International Core Equity Fund | ||||
| Actual Return | 0.86% | $1,000.00 | $ 886.10 | $4.09 |
| Hypothetical 5% Return | 0.86% | $1,000.00 | $1,020.87 | $4.38 |
| 1 | Based on the most recent six-month expense ratio. |
| 2 | Expenses for each fund are equal to its annualized expense ratio, multiplied by the average account value over the period, multiplied by the 184 days of the period, and divided by the 365 days of the fiscal year. |
| 11/1/21–
10/31/22 |
11/1/20–
10/31/21 |
11/1/19–
10/31/20 |
11/1/18–
10/31/19 |
11/1/17–
10/31/18 |
||
| Per-Share Data | ||||||
| Net asset value at beginning of period | $29.22 | $22.24 | $21.87 | $22.40 | $24.36 | |
| Income (loss) from investment operations: | ||||||
| Net investment income (loss)1 | 0.26 | 0.21 | 0.20 | 0.21 | 0.26 | |
| Net realized and unrealized gains (losses) | (3.16) | 7.90 | 0.82 | 1.99 | 0.41 | |
| Total from investment operations | (2.90) | 8.11 | 1.02 | 2.20 | 0.67 | |
| Less distributions: | ||||||
| Distributions from net investment income | (0.26) | (0.20) | (0.20) | (0.27) | (0.34) | |
| Distributions from net realized gains | (6.60) | (0.93) | (0.45) | (2.46) | (2.29) | |
| Total distributions | (6.86) | (1.13) | (0.65) | (2.73) | (2.63) | |
| Net asset value at end of period | $19.46 | $29.22 | $22.24 | $21.87 | $22.40 | |
| Total return | (13.84%) | 37.62% | 4.65% | 12.02% | 2.71% | |
| Ratios/Supplemental Data | ||||||
| Ratios to average net assets: | ||||||
| Net operating expenses | 0.73% 2 | 0.73% | 0.73% | 0.73% | 0.73% | |
| Gross operating expenses | 0.73% 2 | 0.73% | 0.73% | 0.73% | 0.73% | |
| Net investment income (loss) | 1.18% | 0.81% | 0.91% | 1.01% | 1.12% | |
| Portfolio turnover rate | 28% | 86% | 97% | 98% | 101% | |
| Net assets, end of period (x 1,000,000) | $1,268 | $1,860 | $1,957 | $2,182 | $2,138 | |
| 1 | Calculated based on the average shares outstanding during the period. |
| 2 | Ratio includes less than 0.005% of non-routine proxy expenses. |
| DESCRIPTION | QUOTED
PRICES IN ACTIVE MARKETS FOR IDENTICAL ASSETS (LEVEL 1) |
OTHER
SIGNIFICANT OBSERVABLE INPUTS (LEVEL 2) |
SIGNIFICANT
UNOBSERVABLE INPUTS (LEVEL 3) |
TOTAL |
| Assets | ||||
| Common Stocks1 | $1,264,782,828 | $— | $— | $1,264,782,828 |
| Short-Term Investments1 | 4,883,277 | — | — | 4,883,277 |
| Total | $1,269,666,105 | $— | $— | $1,269,666,105 |
| 1 | As categorized in the Portfolio Holdings. |
| Assets | ||
| Investments in securities, at value - unaffiliated (cost $1,008,273,251) | $1,269,666,105 | |
| Receivables: | ||
| Dividends | 1,573,220 | |
| Fund shares sold | 702,323 | |
| Foreign tax reclaims | 390,386 | |
| Prepaid expenses | + | 13,526 |
| Total assets | 1,272,345,560 | |
| Liabilities | ||
| Payables: | ||
| Fund shares redeemed | 3,626,656 | |
| Investment adviser and administrator fees | 462,747 | |
| Shareholder service fees | 240,578 | |
| Independent trustees’ fees | 51 | |
| Accrued expenses | + | 181,301 |
| Total liabilities | 4,511,333 | |
| Net assets | $1,267,834,227 | |
| Net Assets by Source | ||
| Capital received from investors | $831,501,272 | |
| Total distributable earnings | + | 436,332,955 |
| Net assets | $1,267,834,227 | |
| Net Asset Value (NAV) | ||||
| Net Assets | ÷ | Shares
Outstanding |
= | NAV |
| $1,267,834,227 | 65,142,870 | $19.46 | ||
| For the period November 1, 2021 through October 31, 2022 | ||
| Investment Income | ||
| Dividends received from securities - unaffiliated (net of foreign withholding tax of $82,597) | $28,719,565 | |
| Expenses | ||
| Investment adviser and administrator fees | 7,063,747 | |
| Shareholder service fees | 3,617,715 | |
| Proxy fees1 | 70,453 | |
| Portfolio accounting fees | 63,794 | |
| Shareholder reports | 53,939 | |
| Professional fees | 33,722 | |
| Registration fees | 33,556 | |
| Custodian fees | 19,882 | |
| Independent trustees’ fees | 10,948 | |
| Transfer agent fees | 6,888 | |
| Other expenses | + | 19,851 |
| Total expenses | 10,994,495 | |
| Expense reduction | – | 6,888 |
| Net expenses | – | 10,987,607 |
| Net investment income | 17,731,958 | |
| REALIZED AND UNREALIZED GAINS (LOSSES) | ||
| Net realized gains on sales of securities - unaffiliated | 162,404,437 | |
| Net realized losses on futures contracts | + | (461,367) |
| Net realized gains | 161,943,070 | |
| Net change in unrealized appreciation (depreciation) on securities - unaffiliated | + | (384,220,325) |
| Net realized and unrealized losses | (222,277,255) | |
| Decrease in net assets resulting from operations | ($204,545,297) | |
| 1 | Proxy fees are non-routine expenses (see financial note 4 for additional information). |
| OPERATIONS | |||
| 11/1/21-10/31/22 | 11/1/20-10/31/21 | ||
| Net investment income | $17,731,958 | $15,761,570 | |
| Net realized gains | 161,943,070 | 425,880,076 | |
| Net change in unrealized appreciation (depreciation) | + | (384,220,325) | 181,824,785 |
| Increase (decrease) in net assets resulting from operations | ($204,545,297) | $623,466,431 | |
| DISTRIBUTIONS TO SHAREHOLDERS | |||
| Total distributions | ($439,343,161) | ($97,998,756) | |
| TRANSACTIONS IN FUND SHARES | |||||
| 11/1/21-10/31/22 | 11/1/20-10/31/21 | ||||
| SHARES | VALUE | SHARES | VALUE | ||
| Shares sold | 2,450,800 | $60,722,098 | 3,613,563 | $92,083,552 | |
| Shares reinvested | 10,780,617 | 251,727,418 | 3,088,327 | 73,440,411 | |
| Shares redeemed | + | (11,757,059) | (260,849,903) | (31,031,079) | (787,773,255) |
| Net transactions in fund shares | 1,474,358 | $51,599,613 | (24,329,189) | ($622,249,292) | |
| SHARES OUTSTANDING AND NET ASSETS | |||||
| 11/1/21-10/31/22 | 11/1/20-10/31/21 | ||||
| SHARES | NET ASSETS | SHARES | NET ASSETS | ||
| Beginning of period | 63,668,512 | $1,860,123,072 | 87,997,701 | $1,956,904,689 | |
| Total increase (decrease) | + | 1,474,358 | (592,288,845) | (24,329,189) | (96,781,617) |
| End of period | 65,142,870 | $1,267,834,227 | 63,668,512 | $1,860,123,072 | |
| 11/1/21–
10/31/22 |
11/1/20–
10/31/21 |
11/1/19–
10/31/20 |
11/1/18–
10/31/19 |
11/1/17–
10/31/18 |
||
| Per-Share Data | ||||||
| Net asset value at beginning of period | $16.92 | $12.14 | $15.07 | $15.43 | $17.21 | |
| Income (loss) from investment operations: | ||||||
| Net investment income (loss)1 | 0.29 | 0.31 | 0.28 | 0.23 | 0.22 | |
| Net realized and unrealized gains (losses) | (0.81) | 4.80 | (2.15) | 0.93 | (0.27) | |
| Total from investment operations | (0.52) | 5.11 | (1.87) | 1.16 | (0.05) | |
| Less distributions: | ||||||
| Distributions from net investment income | (0.29) | (0.33) | (0.26) | (0.24) | (0.30) | |
| Distributions from net realized gains | (2.19) | — | (0.80) | (1.28) | (1.43) | |
| Total distributions | (2.48) | (0.33) | (1.06) | (1.52) | (1.73) | |
| Net asset value at end of period | $13.92 | $16.92 | $12.14 | $15.07 | $15.43 | |
| Total return | (3.96%) | 42.38% | (13.30%) | 8.78% | (0.63%) | |
| Ratios/Supplemental Data | ||||||
| Ratios to average net assets: | ||||||
| Net operating expenses | 0.89% 2 | 0.89% | 0.89% | 0.89% | 0.88% | |
| Gross operating expenses | 0.90% 2 | 0.90% | 0.90% | 0.89% | 0.88% | |
| Net investment income (loss) | 1.99% | 2.01% | 2.16% | 1.58% | 1.36% | |
| Portfolio turnover rate | 27% | 83% | 70% | 70% | 79% | |
| Net assets, end of period (x 1,000) | $524,330 | $670,765 | $576,701 | $846,955 | $1,249,124 | |
| 1 | Calculated based on the average shares outstanding during the period. |
| 2 | Ratio includes less than 0.005% of non-routine proxy expenses. |
| DESCRIPTION | QUOTED
PRICES IN ACTIVE MARKETS FOR IDENTICAL ASSETS (LEVEL 1) |
OTHER
SIGNIFICANT OBSERVABLE INPUTS (LEVEL 2) |
SIGNIFICANT
UNOBSERVABLE INPUTS (LEVEL 3) |
TOTAL |
| Assets | ||||
| Common Stocks1 | $460,560,018 | $— | $— | $460,560,018 |
| Pharmaceuticals, Biotechnology & Life Sciences | 47,061,110 | 13,491,907 | — | 60,553,017 |
| Total | $507,621,128 | $13,491,907 | $— | $521,113,035 |
| 1 | As categorized in the Portfolio Holdings. |
| Assets | ||
| Investments in securities, at value - unaffiliated (cost $455,958,523) | $521,113,035 | |
| Cash | 757,578 | |
| Deposit with broker for futures contracts | 1,840,000 | |
| Receivables: | ||
| Dividends | 731,433 | |
| Fund shares sold | 522,670 | |
| Foreign tax reclaims | 235,248 | |
| Prepaid expenses | + | 15,086 |
| Total assets | 525,215,050 | |
| Liabilities | ||
| Payables: | ||
| Fund shares redeemed | 402,981 | |
| Investment adviser and administrator fees | 239,749 | |
| Shareholder service fees | 94,490 | |
| Independent trustees’ fees | 40 | |
| Accrued expenses | + | 147,777 |
| Total liabilities | 885,037 | |
| Net assets | $524,330,013 | |
| Net Assets by Source | ||
| Capital received from investors | $435,960,897 | |
| Total distributable earnings | + | 88,369,116 |
| Net assets | $524,330,013 | |
| Net Asset Value (NAV) | ||||
| Net Assets | ÷ | Shares
Outstanding |
= | NAV |
| $524,330,013 | 37,661,284 | $13.92 | ||
| For the period November 1, 2021 through October 31, 2022 | ||
| Investment Income | ||
| Dividends received from securities - unaffiliated (net of foreign withholding tax of $87,227) | $17,300,671 | |
| Interest received from securities - unaffiliated | 4,690 | |
| Securities on loan, net | + | 10 |
| Total investment income | 17,305,371 | |
| Expenses | ||
| Investment adviser and administrator fees | 3,724,068 | |
| Shareholder service fees | 1,431,584 | |
| Portfolio accounting fees | 102,287 | |
| Registration fees | 47,494 | |
| Shareholder reports | 34,000 | |
| Professional fees | 30,627 | |
| Proxy fees1 | 28,000 | |
| Custodian fees | 12,010 | |
| Independent trustees’ fees | 8,422 | |
| Transfer agent fees | 5,266 | |
| Other expenses | + | 10,686 |
| Total expenses | 5,434,444 | |
| Expense reduction | – | 60,387 |
| Net expenses | – | 5,374,057 |
| Net investment income | 11,931,314 | |
| REALIZED AND UNREALIZED GAINS (LOSSES) | ||
| Net realized gains on sales of securities - unaffiliated | 21,838,363 | |
| Net realized gains on futures contracts | 412,195 | |
| Net realized losses on foreign currency transactions | + | (7,747) |
| Net realized gains | 22,242,811 | |
| Net change in unrealized appreciation (depreciation) on securities - unaffiliated | (57,083,526) | |
| Net change in unrealized appreciation (depreciation) on foreign currency translations | + | (21,732) |
| Net change in unrealized appreciation (depreciation) | + | (57,105,258) |
| Net realized and unrealized losses | (34,862,447) | |
| Decrease in net assets resulting from operations | ($22,931,133) | |
| 1 | Proxy fees are non-routine expenses (see financial note 4 for additional information). |
| OPERATIONS | |||
| 11/1/21-10/31/22 | 11/1/20-10/31/21 | ||
| Net investment income | $11,931,314 | $12,850,464 | |
| Net realized gains | 22,242,811 | 115,287,705 | |
| Net change in unrealized appreciation (depreciation) | + | (57,105,258) | 90,530,602 |
| Increase (decrease) in net assets resulting from operations | ($22,931,133) | $218,668,771 | |
| DISTRIBUTIONS TO SHAREHOLDERS | |||
| Total distributions | ($97,765,390) | ($13,599,106) | |
| TRANSACTIONS IN FUND SHARES | |||||
| 11/1/21-10/31/22 | 11/1/20-10/31/21 | ||||
| SHARES | VALUE | SHARES | VALUE | ||
| Shares sold | 2,342,249 | $34,630,897 | 3,539,840 | $56,507,561 | |
| Shares reinvested | 5,269,146 | 79,189,907 | 674,614 | 10,361,404 | |
| Shares redeemed | + | (9,583,602) | (139,558,823) | (12,099,793) | (177,875,463) |
| Net transactions in fund shares | (1,972,207) | ($25,738,019) | (7,885,339) | ($111,006,498) | |
| SHARES OUTSTANDING AND NET ASSETS | |||||
| 11/1/21-10/31/22 | 11/1/20-10/31/21 | ||||
| SHARES | NET ASSETS | SHARES | NET ASSETS | ||
| Beginning of period | 39,633,491 | $670,764,555 | 47,518,830 | $576,701,388 | |
| Total increase (decrease) | + | (1,972,207) | (146,434,542) | (7,885,339) | 94,063,167 |
| End of period | 37,661,284 | $524,330,013 | 39,633,491 | $670,764,555 | |
| 11/1/21–
10/31/22 |
11/1/20–
10/31/21 |
11/1/19–
10/31/20 |
11/1/18–
10/31/19 |
11/1/17–
10/31/18 |
||
| Per-Share Data | ||||||
| Net asset value at beginning of period | $28.96 | $20.85 | $18.07 | $18.04 | $18.65 | |
| Income (loss) from investment operations: | ||||||
| Net investment income (loss)1 | (0.01) | (0.06) | 0.00 2 | 0.06 | 0.06 | |
| Net realized and unrealized gains (losses) | (5.97) | 8.42 | 3.76 | 1.79 | 0.75 | |
| Total from investment operations | (5.98) | 8.36 | 3.76 | 1.85 | 0.81 | |
| Less distributions: | ||||||
| Distributions from net investment income | — | — | (0.03) | (0.07) | (0.07) | |
| Distributions from net realized gains | (2.18) | (0.25) | (0.95) | (1.75) | (1.35) | |
| Total distributions | (2.18) | (0.25) | (0.98) | (1.82) | (1.42) | |
| Net asset value at end of period | $20.80 | $28.96 | $20.85 | $18.07 | $18.04 | |
| Total return | (22.45%) | 40.41% | 21.60% | 12.18% | 4.46% | |
| Ratios/Supplemental Data | ||||||
| Ratios to average net assets: | ||||||
| Net operating expenses | 0.99% 3 | 0.99% | 0.99% | 0.99% | 0.99% | |
| Gross operating expenses | 1.02% 3 | 1.02% | 1.02% | 1.03% | 1.02% | |
| Net investment income (loss) | (0.05%) | (0.23%) | 0.01% | 0.34% | 0.30% | |
| Portfolio turnover rate | 19% | 42% | 65% | 67% | 88% | |
| Net assets, end of period (x 1,000) | $218,329 | $292,447 | $210,033 | $180,809 | $242,770 | |
| 1 | Calculated based on the average shares outstanding during the period. |
| 2 | Per-share amount was less than $0.005. |
| 3 | Ratio includes less than 0.005% of non-routine proxy expenses. |
| DESCRIPTION | QUOTED
PRICES IN ACTIVE MARKETS FOR IDENTICAL ASSETS (LEVEL 1) |
OTHER
SIGNIFICANT OBSERVABLE INPUTS (LEVEL 2) |
SIGNIFICANT
UNOBSERVABLE INPUTS (LEVEL 3) |
TOTAL |
| Assets | ||||
| Common Stocks1 | $213,351,555 | $— | $— | $213,351,555 |
| Liabilities | ||||
| Futures Contracts2 | (61,037) | — | — | (61,037) |
| Total | $213,290,518 | $— | $— | $213,290,518 |
| 1 | As categorized in the Portfolio Holdings. |
| 2 | Futures contracts are reported at cumulative unrealized appreciation or depreciation. |
| Assets | ||
| Investments in securities, at value - unaffiliated (cost $130,058,782) | $213,351,555 | |
| Cash | 5,036,144 | |
| Deposit with broker for futures contracts | 72,000 | |
| Receivables: | ||
| Fund shares sold | 179,985 | |
| Dividends | 45,532 | |
| Foreign tax reclaims | 4,943 | |
| Prepaid expenses | + | 16,036 |
| Total assets | 218,706,195 | |
| Liabilities | ||
| Payables: | ||
| Fund shares redeemed | 122,820 | |
| Investment adviser and administrator fees | 115,579 | |
| Shareholder service fees | 41,848 | |
| Variation margin on futures contracts | 8,475 | |
| Independent trustees’ fees | 35 | |
| Accrued expenses | + | 88,240 |
| Total liabilities | 376,997 | |
| Net assets | $218,329,198 | |
| Net Assets by Source | ||
| Capital received from investors | $130,825,519 | |
| Total distributable earnings | + | 87,503,679 |
| Net assets | $218,329,198 | |
| Net Asset Value (NAV) | ||||
| Net Assets | ÷ | Shares
Outstanding |
= | NAV |
| $218,329,198 | 10,494,105 | $20.80 | ||
| For the period November 1, 2021 through October 31, 2022 | ||
| Investment Income | ||
| Dividends received from securities - unaffiliated (net of foreign withholding tax of $7,800) | $2,378,398 | |
| Interest received from securities - unaffiliated | + | 18,146 |
| Total investment income | 2,396,544 | |
| Expenses | ||
| Investment adviser and administrator fees | 1,834,685 | |
| Shareholder service fees | 609,226 | |
| Portfolio accounting fees | 50,561 | |
| Professional fees | 33,473 | |
| Registration fees | 28,745 | |
| Shareholder reports | 17,809 | |
| Proxy fees1 | 11,855 | |
| Independent trustees’ fees | 7,457 | |
| Custodian fees | 6,581 | |
| Transfer agent fees | 2,580 | |
| Other expenses | + | 6,736 |
| Total expenses | 2,609,708 | |
| Expense reduction | – | 75,161 |
| Net expenses | – | 2,534,547 |
| Net investment loss | (138,003) | |
| REALIZED AND UNREALIZED GAINS (LOSSES) | ||
| Net realized gains on sales of securities - unaffiliated | 4,537,319 | |
| Net realized losses on futures contracts | + | (126,575) |
| Net realized gains | 4,410,744 | |
| Net change in unrealized appreciation (depreciation) on securities - unaffiliated | (69,103,192) | |
| Net change in unrealized appreciation (depreciation) on futures contracts | + | (89,137) |
| Net change in unrealized appreciation (depreciation) | + | (69,192,329) |
| Net realized and unrealized losses | (64,781,585) | |
| Decrease in net assets resulting from operations | ($64,919,588) | |
| 1 | Proxy fees are non-routine expenses (see financial note 4 for additional information). |
| OPERATIONS | |||
| 11/1/21-10/31/22 | 11/1/20-10/31/21 | ||
| Net investment loss | ($138,003) | ($577,485) | |
| Net realized gains | 4,410,744 | 22,809,697 | |
| Net change in unrealized appreciation (depreciation) | + | (69,192,329) | 61,527,745 |
| Increase (decrease) in net assets resulting from operations | ($64,919,588) | $83,759,957 | |
| DISTRIBUTIONS TO SHAREHOLDERS | |||
| Total distributions | ($22,163,876) | ($2,530,978) | |
| TRANSACTIONS IN FUND SHARES | |||||
| 11/1/21-10/31/22 | 11/1/20-10/31/21 | ||||
| SHARES | VALUE | SHARES | VALUE | ||
| Shares sold | 1,374,258 | $34,040,262 | 2,017,391 | $50,557,323 | |
| Shares reinvested | 704,838 | 19,242,083 | 94,152 | 2,163,612 | |
| Shares redeemed | + | (1,681,639) | (40,316,352) | (2,086,140) | (51,536,257) |
| Net transactions in fund shares | 397,457 | $12,965,993 | 25,403 | $1,184,678 | |
| SHARES OUTSTANDING AND NET ASSETS | |||||
| 11/1/21-10/31/22 | 11/1/20-10/31/21 | ||||
| SHARES | NET ASSETS | SHARES | NET ASSETS | ||
| Beginning of period | 10,096,648 | $292,446,669 | 10,071,245 | $210,033,012 | |
| Total increase (decrease) | + | 397,457 | (74,117,471) | 25,403 | 82,413,657 |
| End of period | 10,494,105 | $218,329,198 | 10,096,648 | $292,446,669 | |
| 11/1/21–
10/31/22 |
11/1/20–
10/31/21 |
11/1/19–
10/31/20 |
11/1/18–
10/31/19 |
11/1/17–
10/31/18 |
||
| Per-Share Data | ||||||
| Net asset value at beginning of period | $23.77 | $15.02 | $16.68 | $20.87 | $23.58 | |
| Income (loss) from investment operations: | ||||||
| Net investment income (loss)1 | 0.03 | 0.02 | 0.03 | 0.02 | 0.01 | |
| Net realized and unrealized gains (losses) | (2.27) | 8.76 | (1.67) | (0.35) 2 | 0.32 | |
| Total from investment operations | (2.24) | 8.78 | (1.64) | (0.33) | 0.33 | |
| Less distributions: | ||||||
| Distributions from net investment income | (0.03) | (0.03) | (0.02) | (0.01) | — | |
| Distributions from net realized gains | (2.56) | — | — | (3.85) | (3.04) | |
| Total distributions | (2.59) | (0.03) | (0.02) | (3.86) | (3.04) | |
| Net asset value at end of period | $18.94 | $23.77 | $15.02 | $16.68 | $20.87 | |
| Total return | (10.25%) | 58.55% | (9.86%) | 0.08% | 1.37% | |
| Ratios/Supplemental Data | ||||||
| Ratios to average net assets: | ||||||
| Net operating expenses | 1.09% 3 | 1.08% | 1.09% | 1.09% | 1.09% | |
| Gross operating expenses | 1.09% 3 | 1.08% | 1.10% | 1.09% | 1.09% | |
| Net investment income (loss) | 0.13% | 0.11% | 0.17% | 0.09% | 0.06% | |
| Portfolio turnover rate | 74% | 84% | 113% | 117% | 111% | |
| Net assets, end of period (x 1,000) | $542,600 | $669,489 | $491,478 | $579,143 | $573,406 | |
| 1 | Calculated based on the average shares outstanding during the period. |
| 2 | The per share amount does not accord with the change in aggregate gains and losses in securities during the period because of the timing of sales and repurchases of fund shares in relation to fluctuating market values. |
| 3 | Ratio includes less than 0.005% of non-routine proxy expenses. |
| DESCRIPTION | QUOTED
PRICES IN ACTIVE MARKETS FOR IDENTICAL ASSETS (LEVEL 1) |
OTHER
SIGNIFICANT OBSERVABLE INPUTS (LEVEL 2) |
SIGNIFICANT
UNOBSERVABLE INPUTS (LEVEL 3) |
TOTAL |
| Assets | ||||
| Common Stocks1 | $537,707,021 | $— | $— | $537,707,021 |
| Total | $537,707,021 | $— | $— | $537,707,021 |
| 1 | As categorized in the Portfolio Holdings. |
| Assets | ||
| Investments in securities, at value - unaffiliated (cost $520,280,153) | $537,707,021 | |
| Cash | 14,734,558 | |
| Deposit with broker for futures contracts | 720,005 | |
| Receivables: | ||
| Fund shares sold | 250,583 | |
| Dividends | 70,610 | |
| Income from securities on loan | 316 | |
| Prepaid expenses | + | 12,280 |
| Total assets | 553,495,373 | |
| Liabilities | ||
| Payables: | ||
| Fund shares redeemed | 10,133,410 | |
| Investment adviser and administrator fees | 335,711 | |
| Investments bought | 207,452 | |
| Shareholder service fees | 102,763 | |
| Independent trustees’ fees | 40 | |
| Accrued expenses | + | 115,653 |
| Total liabilities | 10,895,029 | |
| Net assets | $542,600,344 | |
| Net Assets by Source | ||
| Capital received from investors | $478,067,479 | |
| Total distributable earnings | + | 64,532,865 |
| Net assets | $542,600,344 | |
| Net Asset Value (NAV) | ||||
| Net Assets | ÷ | Shares
Outstanding |
= | NAV |
| $542,600,344 | 28,651,758 | $18.94 | ||
| For the period November 1, 2021 through October 31, 2022 | ||
| Investment Income | ||
| Dividends received from securities - unaffiliated (net of foreign withholding tax of $18,223) | $7,181,711 | |
| Interest received from securities - unaffiliated | 60,972 | |
| Securities on loan, net | + | 19,952 |
| Total investment income | 7,262,635 | |
| Expenses | ||
| Investment adviser and administrator fees | 4,823,124 | |
| Shareholder service fees | 1,464,356 | |
| Portfolio accounting fees | 57,787 | |
| Professional fees | 34,916 | |
| Registration fees | 28,240 | |
| Proxy fees1 | 27,583 | |
| Shareholder reports | 26,876 | |
| Custodian fees | 26,131 | |
| Independent trustees’ fees | 8,407 | |
| Transfer agent fees | 2,899 | |
| Other expenses | + | 10,115 |
| Total expenses | 6,510,434 | |
| Expense reduction | – | 2,899 |
| Net expenses | – | 6,507,535 |
| Net investment income | 755,100 | |
| REALIZED AND UNREALIZED GAINS (LOSSES) | ||
| Net realized gains on sales of securities - unaffiliated | 48,206,692 | |
| Net realized losses on futures contracts | + | (1,094,071) |
| Net realized gains | 47,112,621 | |
| Net change in unrealized appreciation (depreciation) on securities - unaffiliated | (116,646,799) | |
| Net change in unrealized appreciation (depreciation) on futures contracts | + | (87,707) |
| Net change in unrealized appreciation (depreciation) | + | (116,734,506) |
| Net realized and unrealized losses | (69,621,885) | |
| Decrease in net assets resulting from operations | ($68,866,785) | |
| 1 | Proxy fees are non-routine expenses (see financial note 4 for additional information). |
| OPERATIONS | |||
| 11/1/21-10/31/22 | 11/1/20-10/31/21 | ||
| Net investment income | $755,100 | $674,136 | |
| Net realized gains | 47,112,621 | 163,410,747 | |
| Net change in unrealized appreciation (depreciation) | + | (116,734,506) | 107,558,534 |
| Increase (decrease) in net assets resulting from operations | ($68,866,785) | $271,643,417 | |
| DISTRIBUTIONS TO SHAREHOLDERS | |||
| Total distributions | ($73,439,993) | ($1,114,839) | |
| TRANSACTIONS IN FUND SHARES | |||||
| 11/1/21-10/31/22 | 11/1/20-10/31/21 | ||||
| SHARES | VALUE | SHARES | VALUE | ||
| Shares sold | 2,182,967 | $45,773,419 | 2,049,026 | $42,785,760 | |
| Shares reinvested | 2,701,118 | 55,345,927 | 44,417 | 820,369 | |
| Shares redeemed | + | (4,395,790) | (85,701,441) | (6,658,460) | (136,123,410) |
| Net transactions in fund shares | 488,295 | $15,417,905 | (4,565,017) | ($92,517,281) | |
| SHARES OUTSTANDING AND NET ASSETS | |||||
| 11/1/21-10/31/22 | 11/1/20-10/31/21 | ||||
| SHARES | NET ASSETS | SHARES | NET ASSETS | ||
| Beginning of period | 28,163,463 | $669,489,217 | 32,728,480 | $491,477,920 | |
| Total increase (decrease) | + | 488,295 | (126,888,873) | (4,565,017) | 178,011,297 |
| End of period | 28,651,758 | $542,600,344 | 28,163,463 | $669,489,217 | |
| 11/1/21–
10/31/22 |
11/1/20–
10/31/21 |
11/1/19–
10/31/20 |
11/1/18–
10/31/19 |
11/1/17–
10/31/18 |
||
| Per-Share Data | ||||||
| Net asset value at beginning of period | $30.58 | $26.27 | $25.08 | $25.85 | $25.44 | |
| Income (loss) from investment operations: | ||||||
| Net investment income (loss)1 | 0.20 | 0.21 | 0.26 | 0.26 | 0.23 | |
| Net realized and unrealized gains (losses) | (1.13) | 7.09 | 2.11 | 1.27 | 1.96 | |
| Total from investment operations | (0.93) | 7.30 | 2.37 | 1.53 | 2.19 | |
| Less distributions: | ||||||
| Distributions from net investment income | (0.23) | (0.23) | (0.29) | (0.24) | (0.24) | |
| Distributions from net realized gains | (3.34) | (2.76) | (0.89) | (2.06) | (1.54) | |
| Total distributions | (3.57) | (2.99) | (1.18) | (2.30) | (1.78) | |
| Net asset value at end of period | $26.08 | $30.58 | $26.27 | $25.08 | $25.85 | |
| Total return | (3.82%) | 30.02% | 9.57% | 6.51% | 9.13% | |
| Ratios/Supplemental Data | ||||||
| Ratios to average net assets: | ||||||
| Net operating expenses | 0.80% 2 | 0.80% | 0.80% | 0.80% | 0.80% | |
| Gross operating expenses | 0.80% 2 | 0.80% | 0.80% | 0.80% | 0.80% | |
| Net investment income (loss) | 0.76% | 0.76% | 1.01% | 1.05% | 0.91% | |
| Portfolio turnover rate | 59% | 70% | 73% | 45% | 45% | |
| Net assets, end of period (x 1,000) | $829,028 | $901,637 | $745,705 | $778,753 | $825,769 | |
| 1 | Calculated based on the average shares outstanding during the period. |
| 2 | Ratio includes less than 0.005% of non-routine proxy expenses. |
| SECURITY | NUMBER
OF SHARES |
VALUE ($) |
| Zoetis, Inc. | 108,276 | 16,325,855 |
| 656,468,909 | ||
| Total
Common Stocks (Cost $559,065,545) |
825,836,731 | |
| Total
Investments in Securities (Cost $559,065,545) |
825,836,731 | |
| * | Non-income producing security. |
| DESCRIPTION | QUOTED
PRICES IN ACTIVE MARKETS FOR IDENTICAL ASSETS (LEVEL 1) |
OTHER
SIGNIFICANT OBSERVABLE INPUTS (LEVEL 2) |
SIGNIFICANT
UNOBSERVABLE INPUTS (LEVEL 3) |
TOTAL |
| Assets | ||||
| Common Stocks1 | $673,694,715 | $— | $— | $673,694,715 |
| Australia | — | 2,735,784 | — | 2,735,784 |
| Denmark | — | 20,326,622 | — | 20,326,622 |
| France | — | 19,062,809 | — | 19,062,809 |
| Germany | — | 2,241,477 | — | 2,241,477 |
| Hong Kong | — | 3,730,650 | — | 3,730,650 |
| Japan | — | 30,823,161 | — | 30,823,161 |
| Switzerland | — | 45,744,959 | — | 45,744,959 |
| United Kingdom | — | 27,476,554 | — | 27,476,554 |
| Total | $673,694,715 | $152,142,016 | $— | $825,836,731 |
| 1 | As categorized in the Portfolio Holdings. |
| Assets | ||
| Investments in securities, at value - unaffiliated (cost $559,065,545) | $825,836,731 | |
| Cash | 1,897,669 | |
| Receivables: | ||
| Dividends | 900,757 | |
| Foreign tax reclaims | 889,393 | |
| Fund shares sold | 848,665 | |
| Interest | 977 | |
| Prepaid expenses | + | 14,362 |
| Total assets | 830,388,554 | |
| Liabilities | ||
| Payables: | ||
| Fund shares redeemed | 687,529 | |
| Investment adviser and administrator fees | 332,232 | |
| Shareholder service fees | 151,511 | |
| Due to sub-custodian | 12,359 | |
| Independent trustees’ fees | 43 | |
| Accrued expenses | + | 176,818 |
| Total liabilities | 1,360,492 | |
| Net assets | $829,028,062 | |
| Net Assets by Source | ||
| Capital received from investors | $529,862,905 | |
| Total distributable earnings | + | 299,165,157 |
| Net assets | $829,028,062 | |
| Net Asset Value (NAV) | ||||
| Net Assets | ÷ | Shares
Outstanding |
= | NAV |
| $829,028,062 | 31,782,891 | $26.08 | ||
| For the period November 1, 2021 through October 31, 2022 | ||
| Investment Income | ||
| Dividends received from securities - unaffiliated (net of foreign withholding tax of $353,130) | $13,251,924 | |
| Interest received from securities - unaffiliated | + | 9,004 |
| Total investment income | 13,260,928 | |
| Expenses | ||
| Investment adviser and administrator fees | 4,489,115 | |
| Shareholder service fees | 1,994,351 | |
| Portfolio accounting fees | 99,353 | |
| Custodian fees | 51,237 | |
| Shareholder reports | 50,392 | |
| Proxy fees1 | 38,730 | |
| Registration fees | 37,482 | |
| Professional fees | 33,222 | |
| Independent trustees’ fees | 9,058 | |
| Transfer agent fees | 7,984 | |
| Other expenses | + | 15,815 |
| Total expenses | 6,826,739 | |
| Expense reduction | – | 7,984 |
| Net expenses | – | 6,818,755 |
| Net investment income | 6,442,173 | |
| REALIZED AND UNREALIZED GAINS (LOSSES) | ||
| Net realized gains on sales of securities - unaffiliated | 27,132,567 | |
| Net realized losses on foreign currency transactions | + | (2,417) |
| Net realized gains | 27,130,150 | |
| Net change in unrealized appreciation (depreciation) on securities - unaffiliated | (67,488,611) | |
| Net change in unrealized appreciation (depreciation) on foreign currency translations | + | (117,591) |
| Net change in unrealized appreciation (depreciation) | + | (67,606,202) |
| Net realized and unrealized losses | (40,476,052) | |
| Decrease in net assets resulting from operations | ($34,033,879) | |
| 1 | Proxy fees are non-routine expenses (see financial note 4 for additional information). |
| OPERATIONS | |||
| 11/1/21-10/31/22 | 11/1/20-10/31/21 | ||
| Net investment income | $6,442,173 | $6,385,761 | |
| Net realized gains | 27,130,150 | 98,827,356 | |
| Net change in unrealized appreciation (depreciation) | + | (67,606,202) | 109,531,575 |
| Increase (decrease) in net assets resulting from operations | ($34,033,879) | $214,744,692 | |
| DISTRIBUTIONS TO SHAREHOLDERS | |||
| Total distributions | ($104,700,574) | ($84,424,068) | |
| TRANSACTIONS IN FUND SHARES | |||||
| 11/1/21-10/31/22 | 11/1/20-10/31/21 | ||||
| SHARES | VALUE | SHARES | VALUE | ||
| Shares sold | 2,461,080 | $66,220,931 | 2,830,876 | $80,007,562 | |
| Shares reinvested | 3,264,406 | 91,174,878 | 2,869,075 | 73,390,942 | |
| Shares redeemed | + | (3,426,455) | (91,270,455) | (4,601,633) | (127,787,260) |
| Net transactions in fund shares | 2,299,031 | $66,125,354 | 1,098,318 | $25,611,244 | |
| SHARES OUTSTANDING AND NET ASSETS | |||||
| 11/1/21-10/31/22 | 11/1/20-10/31/21 | ||||
| SHARES | NET ASSETS | SHARES | NET ASSETS | ||
| Beginning of period | 29,483,860 | $901,637,161 | 28,385,542 | $745,705,293 | |
| Total increase (decrease) | + | 2,299,031 | (72,609,099) | 1,098,318 | 155,931,868 |
| End of period | 31,782,891 | $829,028,062 | 29,483,860 | $901,637,161 | |
| 11/1/21–
10/31/22 |
11/1/20–
10/31/21 |
11/1/19–
10/31/20 |
11/1/18–
10/31/19 |
11/1/17–
10/31/18 |
||
| Per-Share Data | ||||||
| Net asset value at beginning of period | $11.55 | $9.11 | $10.04 | $9.64 | $11.27 | |
| Income (loss) from investment operations: | ||||||
| Net investment income (loss)1 | 0.34 | 0.21 | 0.14 | 0.24 | 0.24 | |
| Net realized and unrealized gains (losses) | (2.86) | 2.34 | (0.71) | 0.41 | (1.58) | |
| Total from investment operations | (2.52) | 2.55 | (0.57) | 0.65 | (1.34) | |
| Less distributions: | ||||||
| Distributions from net investment income | (0.32) | (0.11) | (0.36) | (0.25) | (0.26) | |
| Distributions from net realized gains | — | — | — | — | (0.03) | |
| Total distributions | (0.32) | (0.11) | (0.36) | (0.25) | (0.29) | |
| Net asset value at end of period | $8.71 | $11.55 | $9.11 | $10.04 | $9.64 | |
| Total return | (22.40%) | 28.12% | (6.01%) | 7.08% | (12.18%) | |
| Ratios/Supplemental Data | ||||||
| Ratios to average net assets: | ||||||
| Net operating expenses | 0.86% 2 | 0.86% | 0.86% | 0.86% | 0.86% | |
| Gross operating expenses | 0.89% 2 | 0.86% | 0.88% | 0.87% | 0.89% | |
| Net investment income (loss) | 3.40% | 1.93% | 1.51% | 2.44% | 2.22% | |
| Portfolio turnover rate | 94% | 103% | 97% | 91% | 98% | |
| Net assets, end of period (x 1,000) | $507,380 | $692,619 | $664,487 | $975,511 | $1,166,280 | |
| 1 | Calculated based on the average shares outstanding during the period. |
| 2 | Ratio includes less than 0.005% of non-routine proxy expenses. |
| SECURITY | NUMBEROF SHARES | VALUE ($) |
| SHORT-TERM INVESTMENTS 3.5% OF NET ASSETS | ||
| Money Market Funds 3.5% | ||
| State Street Institutional U.S. Government Money Market Fund, Premier Class 3.01% (b) | 12,946,847 | 12,946,847 |
| State Street Institutional U.S. Government Money Market Fund, Premier Class 3.01% (b)(c) | 4,656,400 | 4,656,400 |
| 17,603,247 | ||
| Total
Short-Term Investments (Cost $17,603,247) |
17,603,247 | |
| Total
Investments in Securities (Cost $529,607,684) |
511,947,279 | |
| * | Non-income producing security. |
| (a) | All or a portion of this security is on loan. Securities on loan were valued at $4,312,951. |
| (b) | The rate shown is the annualized 7-day yield. |
| (c) | Security purchased with cash collateral received for securities on loan. |
| REIT — | Real Estate Investment Trust |
| DESCRIPTION | QUOTED
PRICES IN ACTIVE MARKETS FOR IDENTICAL ASSETS (LEVEL 1) |
OTHER
SIGNIFICANT OBSERVABLE INPUTS (LEVEL 2) |
SIGNIFICANT
UNOBSERVABLE INPUTS (LEVEL 3) |
TOTAL |
| Assets | ||||
| Common Stocks1 | $— | $404,379,895 | $— | $404,379,895 |
| Brazil | 658,610 | — | — | 658,610 |
| Canada | 9,884,515 | — | — | 9,884,515 |
| United Kingdom | 1,154,051 | 78,266,961 | — | 79,421,012 |
| Short-Term Investments1 | 17,603,247 | — | — | 17,603,247 |
| Total | $29,300,423 | $482,646,856 | $— | $511,947,279 |
| 1 | As categorized in the Portfolio Holdings. |
| Assets | ||
| Investments in securities, at value - unaffiliated (cost $529,607,684) including securities on loan of $4,312,951 | $511,947,279 | |
| Foreign currency, at value (cost $544,231) | 543,425 | |
| Deposit with broker for futures contracts | 830,882 | |
| Receivables: | ||
| Foreign tax reclaims | 1,096,772 | |
| Dividends | 1,042,624 | |
| Investments sold | 287,934 | |
| Fund shares sold | 243,400 | |
| Income from securities on loan | 3,448 | |
| Prepaid expenses | + | 12,762 |
| Total assets | 516,008,526 | |
| Liabilities | ||
| Collateral held for securities on loan | 4,656,400 | |
| Payables: | ||
| Fund shares redeemed | 2,933,697 | |
| Investments bought | 490,615 | |
| Investment adviser and administrator fees | 217,894 | |
| Shareholder service fees | 94,842 | |
| Independent trustees’ fees | 39 | |
| Accrued expenses | + | 234,992 |
| Total liabilities | 8,628,479 | |
| Net assets | $507,380,047 | |
| Net Assets by Source | ||
| Capital received from investors | $618,882,093 | |
| Total distributable loss | + | (111,502,046) |
| Net assets | $507,380,047 | |
| Net Asset Value (NAV) | ||||
| Net Assets | ÷ | Shares
Outstanding |
= | NAV |
| $507,380,047 | 58,267,915 | $8.71 | ||
| For the period November 1, 2021 through October 31, 2022 | ||
| Investment Income | ||
| Dividends received from securities - unaffiliated (net of foreign withholding tax of $2,344,443) | $25,628,161 | |
| Interest received from securities - unaffiliated (net of foreign withholding tax of $4) | 163,645 | |
| Securities on loan, net | + | 111,106 |
| Total investment income | 25,902,912 | |
| Expenses | ||
| Investment adviser and administrator fees | 3,525,060 | |
| Shareholder service fees | 1,501,221 | |
| Portfolio accounting fees | 97,400 | |
| Custodian fees | 94,011 | |
| Professional fees | 47,631 1 | |
| Shareholder reports | 31,057 | |
| Proxy fees2 | 28,666 | |
| Registration fees | 27,326 | |
| Transfer agent fees | 14,996 | |
| Independent trustees’ fees | 8,446 | |
| Other expenses | + | 14,237 |
| Total expenses | 5,390,051 | |
| Expense reduction | – | 133,495 1 |
| Net expenses | – | 5,256,556 |
| Net investment income | 20,646,356 | |
| REALIZED AND UNREALIZED GAINS (LOSSES) | ||
| Net realized losses on sales of securities - unaffiliated | (33,748,621) | |
| Net realized losses on futures contracts | (212,919) | |
| Net realized losses on foreign currency transactions | + | (772,637) |
| Net realized losses | (34,734,177) | |
| Net change in unrealized appreciation (depreciation) on securities - unaffiliated | (139,410,764) | |
| Net change in unrealized appreciation (depreciation) on foreign currency translations | + | (155,194) |
| Net change in unrealized appreciation (depreciation) | + | (139,565,958) |
| Net realized and unrealized losses | (174,300,135) | |
| Decrease in net assets resulting from operations | ($153,653,779) | |
| 1 | Includes professional fees of $8,059 associated with the filing of tax claims in the European Union deemed to be non-contingent and non-routine expenses of the fund (see financial notes 2(d) and 4 for additional information). |
| 2 | Proxy fees are non-routine expenses (see financial note 4 for additional information). |
| OPERATIONS | |||
| 11/1/21-10/31/22 | 11/1/20-10/31/21 | ||
| Net investment income | $20,646,356 | $13,811,857 | |
| Net realized gains (losses) | (34,734,177) | 108,593,613 | |
| Net change in unrealized appreciation (depreciation) | + | (139,565,958) | 55,427,976 |
| Increase (decrease) in net assets resulting from operations | ($153,653,779) | $177,833,446 | |
| DISTRIBUTIONS TO SHAREHOLDERS | |||
| Total distributions | ($19,624,124) | ($7,674,015) | |
| TRANSACTIONS IN FUND SHARES | |||||
| 11/1/21-10/31/22 | 11/1/20-10/31/21 | ||||
| SHARES | VALUE | SHARES | VALUE | ||
| Shares sold | 7,796,290 | $80,239,327 | 4,866,510 | $53,723,390 | |
| Shares reinvested | 1,446,960 | 16,191,478 | 602,440 | 6,235,261 | |
| Shares redeemed | + | (10,921,575) | (108,391,973) | (18,494,429) | (201,985,524) |
| Net transactions in fund shares | (1,678,325) | ($11,961,168) | (13,025,479) | ($142,026,873) | |
| SHARES OUTSTANDING AND NET ASSETS | |||||
| 11/1/21-10/31/22 | 11/1/20-10/31/21 | ||||
| SHARES | NET ASSETS | SHARES | NET ASSETS | ||
| Beginning of period | 59,946,240 | $692,619,118 | 72,971,719 | $664,486,560 | |
| Total increase (decrease) | + | (1,678,325) | (185,239,071) | (13,025,479) | 28,132,558 |
| End of period | 58,267,915 | $507,380,047 | 59,946,240 | $692,619,118 | |
| SCHWAB CAPITAL TRUST (ORGANIZED MAY 7, 1993) | |
| Schwab Core Equity Fund | Schwab Target 2045 Fund |
| Schwab Dividend Equity Fund | Schwab Target 2050 Fund |
| Schwab Large-Cap Growth Fund | Schwab Target 2055 Fund |
| Schwab Small-Cap Equity Fund | Schwab Target 2060 Fund |
| Schwab Health Care Fund | Schwab Target 2065 Fund |
| Schwab International Core Equity Fund | Schwab Fundamental US Large Company Index Fund |
| Schwab S&P 500 Index Fund | Schwab Fundamental US Small Company Index Fund |
| Schwab Small-Cap Index Fund® | Schwab Fundamental International Large Company Index Fund |
| Schwab Total Stock Market Index Fund® | Schwab Fundamental International Small Company Index Fund |
| Schwab U.S. Large-Cap Growth Index Fund | Schwab Fundamental Emerging Markets Large Company Index Fund |
| Schwab U.S. Large-Cap Value Index Fund | Schwab Fundamental Global Real Estate Index Fund |
| Schwab U.S. Mid-Cap Index Fund | Schwab Target 2010 Index Fund |
| Schwab International Index Fund® | Schwab Target 2015 Index Fund |
| Schwab MarketTrack All Equity Portfolio™ | Schwab Target 2020 Index Fund |
| Schwab MarketTrack Growth Portfolio™ | Schwab Target 2025 Index Fund |
| Schwab MarketTrack Balanced Portfolio™ | Schwab Target 2030 Index Fund |
| Schwab MarketTrack Conservative Portfolio™ | Schwab Target 2035 Index Fund |
| Schwab International Opportunities Fund | Schwab Target 2040 Index Fund |
| Schwab Balanced Fund | Schwab Target 2045 Index Fund |
| Schwab Target 2010 Fund | Schwab Target 2050 Index Fund |
| Schwab Target 2015 Fund | Schwab Target 2055 Index Fund |
| Schwab Target 2020 Fund | Schwab Target 2060 Index Fund |
| Schwab Target 2025 Fund | Schwab Target 2065 Index Fund |
| Schwab Target 2030 Fund | Schwab Monthly Income Fund - Target Payout |
| Schwab Target 2035 Fund | Schwab Monthly Income Fund - Flexible Payout |
| Schwab Target 2040 Fund | Schwab Monthly Income Fund - Income Payout |
| 4. Affiliates and Affiliated Transactions: |
| % OF AVERAGE DAILY NET ASSETS | SCHWAB
CORE EQUITY FUND |
SCHWAB
DIVIDEND EQUITY FUND |
SCHWAB
LARGE-CAP GROWTH FUND |
SCHWAB
SMALL-CAP EQUITY FUND |
SCHWAB
INTERNATIONAL CORE EQUITY FUND |
| Flat rate | 0.47% | 0.62% | 0.72% | 0.81% | 0.58% |
| % OF AVERAGE DAILY NET ASSETS | SCHWAB
HEALTH CARE FUND |
| First $500 million | 0.54% |
| $500 million to $1 billion | 0.515% |
| Over $1 billion | 0.49% |
| SCHWAB
CORE EQUITY FUND |
SCHWAB
DIVIDEND EQUITY FUND |
SCHWAB
LARGE-CAP GROWTH FUND |
SCHWAB
SMALL-CAP EQUITY FUND |
SCHWAB
HEALTH CARE FUND |
SCHWAB
INTERNATIONAL CORE EQUITY FUND |
| 0.75% | 0.89% | 0.99% | 1.12% | 0.82% | 0.86% |
| UNDERLYING FUNDS | |||
| SCHWAB
CORE EQUITY FUND |
SCHWAB
SMALL-CAP EQUITY FUND |
SCHWAB
INTERNATIONAL CORE EQUITY FUND | |
| Schwab Balanced Fund | 13.3% | 10.2% | —% |
| Schwab Target 2010 Fund | 0.1% | 0.1% | 0.3% |
| Schwab Target 2015 Fund | 0.1% | 0.2% | 0.5% |
| Schwab Target 2020 Fund | 0.7% | 1.1% | 3.4% |
| Schwab Target 2025 Fund | 1.1% | 2.0% | 5.7% |
| Schwab Target 2030 Fund | 2.6% | 5.0% | 12.9% |
| Schwab Target 2035 Fund | 1.5% | 3.6% | 7.8% |
| Schwab Target 2040 Fund | 3.3% | 8.0% | 16.4% |
| Schwab Target 2045 Fund | 0.7% | 2.1% | 3.7% |
| Schwab Target 2050 Fund | 0.7% | 2.2% | 4.0% |
| Schwab Target 2055 Fund | 0.5% | 1.5% | 2.8% |
| Schwab Target 2060 Fund | 0.2% | 0.4% | 0.8% |
| Schwab Target 2065 Fund | 0.0%* | 0.1% | 0.1% |
| * | Less than 0.05% |
| PURCHASE COST | SALE PROCEEDS | REALIZED GAINS (LOSSES) | |
| Schwab Core Equity Fund | $— | $— | $— |
| Schwab Dividend Equity Fund | — | 897,419 | (215,231) |
| Schwab Large-Cap Growth Fund | — | — | — |
| Schwab Small-Cap Equity Fund | — | 44,900 | 22,309 |
| Schwab Health Care Fund | — | — | — |
| Schwab International Core Equity Fund | — | — | — |
| 7. Purchases and Sales of Investment Securities: |
| PURCHASES
OF SECURITIES |
SALES
OF SECURITIES | |
| Schwab Core Equity Fund | $414,349,370 | $780,574,609 |
| Schwab Dividend Equity Fund | 159,028,506 | 267,387,267 |
| Schwab Large-Cap Growth Fund | 47,256,269 | 51,705,048 |
| Schwab Small-Cap Equity Fund | 435,754,313 | 492,042,044 |
| Schwab Health Care Fund | 500,492,097 | 532,816,624 |
| Schwab International Core Equity Fund | 557,678,033 | 580,244,949 |
| NOTIONAL AMOUNTS | NUMBER OF CONTRACTS | |
| Schwab Core Equity Fund | $20,417,452* | 88* |
| Schwab Dividend Equity Fund | 2,891,277* | 14* |
| Schwab Large-Cap Growth Fund | 1,268,019 | 6 |
| Schwab Small-Cap Equity Fund | 1,922,402 | 17 |
| Schwab Health Care Fund | — | — |
| Schwab International Core Equity Fund | 2,738,123 | 24 |
| * | During the period, the fund did not hold futures contracts at any month-end. The average value and number of contracts were calculated by aggregating the highest daily values held each month during the period. |
| TAX COST | GROSS
UNREALIZED APPRECIATION |
GROSS
UNREALIZED DEPRECIATION |
NET
UNREALIZED APPRECIATION (DEPRECIATION) | |
| Schwab Core Equity Fund | $1,008,324,332 | $355,219,915 | ($93,878,142) | $261,341,773 |
| Schwab Dividend Equity Fund | 457,126,283 | 86,608,054 | (22,621,302) | 63,986,752 |
| Schwab Large-Cap Growth Fund | 129,997,745 | 95,136,345 | (11,843,572) | 83,292,773 |
| Schwab Small-Cap Equity Fund | 520,891,682 | 91,998,452 | (75,183,113) | 16,815,339 |
| Schwab Health Care Fund | 561,027,188 | 283,715,176 | (18,905,633) | 264,809,543 |
| Schwab International Core Equity Fund | 530,565,748 | 37,834,286 | (56,452,755) | (18,618,469) |
| UNDISTRIBUTED
ORDINARY INCOME |
UNDISTRIBUTED
LONG-TERM CAPITAL GAINS |
NET
UNREALIZED APPRECIATION (DEPRECIATION) ON INVESTMENTS |
NET
OTHER UNREALIZED APPRECIATION (DEPRECIATION) |
CAPITAL
LOSS CARRYFORWARDS AND OTHER LOSSES |
TOTAL | |
| Schwab Core Equity Fund | $13,779,061 | $161,212,121 | $261,341,773 | $— | $— | $436,332,955 |
| Schwab Dividend Equity Fund | 1,165,643 | 23,230,303 | 63,986,752 | (13,582) | — | 88,369,116 |
| Schwab Large-Cap Growth Fund | — | 4,291,751 | 83,292,773 | — | (80,845) | 87,503,679 |
| Schwab Small-Cap Equity Fund | 216,053 | 47,501,473 | 16,815,339 | — | — | 64,532,865 |
| Schwab Health Care Fund | 6,001,093 | 28,428,704 | 264,809,543 | (74,183) | — | 299,165,157 |
| Schwab International Core Equity Fund | 16,771,074 | — | (18,618,469) | (133,208) | (109,521,443) | (111,502,046) |
| Schwab Core Equity Fund | $— |
| Schwab Dividend Equity Fund | — |
| Schwab Large-Cap Growth Fund | — |
| Schwab Small-Cap Equity Fund | — |
| Schwab Health Care Fund | — |
| Schwab International Core Equity Fund | 109,521,443 |
| CURRENT FISCAL YEAR END DISTRIBUTIONS | PRIOR FISCAL YEAR END DISTRIBUTIONS | |||
| ORDINARY
INCOME |
LONG-TERM
CAPITAL GAINS |
ORDINARY
INCOME |
LONG-TERM
CAPITAL GAINS | |
| Schwab Core Equity Fund | $194,345,554 | $244,997,607 | $17,230,074 | $80,768,682 |
| Schwab Dividend Equity Fund | 30,011,611 | 67,753,779 | 13,599,106 | — |
| Schwab Large-Cap Growth Fund | 5,704,425 | 16,459,451 | — | 2,530,978 |
| Schwab Small-Cap Equity Fund | 825,168 | 72,614,825 | 1,114,839 | — |
| Schwab Health Care Fund | 28,840,838 | 75,859,736 | 6,419,244 | 78,004,824 |
| Schwab International Core Equity Fund | 19,624,124 | — | 7,674,015 | — |
Denver, Colorado
December 16, 2022
| Schwab Core Equity Fund | 15.52% |
| Schwab Dividend Equity Fund | 68.73% |
| Schwab Large-Cap Growth Fund | 29.12% |
| Schwab Small-Cap Equity Fund | 100.00% |
| Schwab Health Care Fund | 37.88% |
| Schwab International Core Equity Fund | —% |
| Schwab Core Equity Fund | $31,580,500 |
| Schwab Dividend Equity Fund | 21,729,739 |
| Schwab Large-Cap Growth Fund | 1,863,412 |
| Schwab Small-Cap Equity Fund | 825,168 |
| Schwab Health Care Fund | 13,467,930 |
| Schwab International Core Equity Fund | 19,624,124 |
| Schwab Core Equity Fund | $244,997,607 |
| Schwab Dividend Equity Fund | 67,753,779 |
| Schwab Large-Cap Growth Fund | 16,459,451 |
| Schwab Small-Cap Equity Fund | 72,614,825 |
| Schwab Health Care Fund | 75,859,736 |
| Schwab International Core Equity Fund | — |
| Schwab Core Equity Fund | $1,271,668 |
| Schwab Dividend Equity Fund | 981,810 |
| Schwab Large-Cap Growth Fund | 110,998 |
| Schwab Small-Cap Equity Fund | — |
| Schwab Health Care Fund | — |
| Schwab International Core Equity Fund | — |
| Proposal
– To elect each of the following individuals as trustees of the Trust: |
For | Withheld |
| Walter W. Bettinger II | 1,095,577,106.505 | 115,838,980.968 |
| Richard A. Wurster | 1,117,598,789.555 | 93,817,297.918 |
| Michael J. Beer | 1,116,890,447.505 | 94,525,639.968 |
| Robert W. Burns | 1,117,915,860.110 | 93,500,227.363 |
| Nancy F. Heller | 1,119,878,732.134 | 91,537,355.339 |
| David L. Mahoney | 1,069,125,022.434 | 142,291,065.039 |
| Jane P. Moncreiff | 1,120,187,927.838 | 91,228,159.635 |
| Kiran M. Patel | 1,116,689,111.571 | 94,726,975.902 |
| Kimberly S. Patmore | 1,119,941,056.059 | 91,475,031.414 |
| J. Derek Penn | 1,117,666,014.121 | 93,750,073.352 |
| Independent Trustees | |||
| Name,
Year of Birth, and Position(s) with the trust (Terms of office, and length of Time Served1) |
Principal
Occupations During the Past Five Years |
Number
of Portfolios in Fund Complex Overseen by the Trustee |
Other Directorships |
|
Michael J. Beer 1961 Trustee (Trustee of The Charles Schwab Family of Funds, Schwab Investments, Schwab Capital Trust, Schwab Annuity Portfolios, Schwab Strategic Trust and Laudus Trust since 2022) |
Retired. Director, President and Chief Executive Officer (Dec. 2016 – Sept. 2019), Principal Funds (investment management). | 105 | Director (2016 – 2019), Principal Funds, Inc. |
| Robert
W. Burns 1959 Trustee (Trustee of Schwab Strategic Trust since 2009; The Charles Schwab Family of Funds, Schwab Investments, Schwab Capital Trust, Schwab Annuity Portfolios and Laudus Trust since 2016) |
Retired/Private Investor. | 105 | None |
| Nancy
F. Heller 1956 Trustee (Trustee of The Charles Schwab Family of Funds, Schwab Investments, Schwab Capital Trust, Schwab Annuity Portfolios, Schwab Strategic Trust and Laudus Trust since 2018) |
Retired. | 105 | None |
| David
L. Mahoney 1954 Trustee (Trustee of The Charles Schwab Family of Funds, Schwab Investments, Schwab Capital Trust, Schwab Annuity Portfolios and Laudus Trust since 2011; Schwab Strategic Trust since 2016) |
Private Investor. | 105 | Director
(2004 – present), Corcept Therapeutics Incorporated Director (2009 – 2021), Adamas Pharmaceuticals, Inc. Director (2003 – 2019), Symantec Corporation |
| Jane
P. Moncreiff 1961 Trustee (Trustee of The Charles Schwab Family of Funds, Schwab Investments, Schwab Capital Trust, Schwab Annuity Portfolios, Schwab Strategic Trust and Laudus Trust since 2019) |
Consultant (2018 – present), Fulham Advisers LLC (management consulting); Chief Investment Officer (2009 – 2017), CareGroup Healthcare System, Inc. (healthcare). | 105 | None |
| Independent Trustees (continued) | |||
| Name,
Year of Birth, and Position(s) with the trust (Terms of office, and length of Time Served1) |
Principal
Occupations During the Past Five Years |
Number
of Portfolios in Fund Complex Overseen by the Trustee |
Other Directorships |
| Kiran
M. Patel 1948 Trustee (Trustee of The Charles Schwab Family of Funds, Schwab Investments, Schwab Capital Trust, Schwab Annuity Portfolios and Laudus Trust since 2011; Schwab Strategic Trust since 2016) |
Retired. | 105 | Director (2008 – present), KLA-Tencor Corporation |
| Kimberly
S. Patmore 1956 Trustee (Trustee of The Charles Schwab Family of Funds, Schwab Investments, Schwab Capital Trust, Schwab Annuity Portfolios, Schwab Strategic Trust and Laudus Trust since 2016) |
Consultant (2008 – present), Patmore Management Consulting (management consulting). | 105 | None |
|
J. Derek Penn 1957 Trustee (Trustee of The Charles Schwab Family of Funds, Schwab Investments, Schwab Capital Trust, Schwab Annuity Portfolios, Schwab Strategic Trust and Laudus Trust since 2021) |
Head of Equity Sales and Trading (2006 – 2018), BNY Mellon (financial services). | 105 | None |
| Interested Trustees | |||
| Name,
Year of Birth, and Position(s) with the trust (Terms of office, and length of Time Served1) |
Principal
Occupations During the Past Five Years |
Number
of Portfolios in Fund Complex Overseen by the Trustee |
Other Directorships |
| Walter
W. Bettinger II2 1960 Chairman and Trustee (Trustee of The Charles Schwab Family of Funds, Schwab Investments, Schwab Capital Trust and Schwab Annuity Portfolios since 2008; Schwab Strategic Trust since 2009; Laudus Trust since 2010) |
Co-Chairman of the Board (July 2022 – present), Director and Chief Executive Officer (Oct. 2008 – present) and President (Feb. 2007 – Oct. 2021), The Charles Schwab Corporation; President and Chief Executive Officer (Oct. 2008 – Oct. 2021) and Director (May 2008 – Oct. 2021), Charles Schwab & Co., Inc.; Director (Apr. 2006 – present), Charles Schwab Bank, SSB; Director (Nov. 2017 – present), Charles Schwab Premier Bank, SSB; Director (July 2019 – present), Charles Schwab Trust Bank; Director (May 2008 – present), Chief Executive Officer (Aug. 2017 – present) and President (Aug. 2017 – Nov. 2021), Schwab Holdings, Inc.; Director (Oct. 2020 – present), TD Ameritrade Holding Corporation; Director (July 2016 – Oct. 2021), Charles Schwab Investment Management, Inc. | 105 | Director (2008 – present), The Charles Schwab Corporation |
| Interested Trustees (continued) | |||
| Name,
Year of Birth, and Position(s) with the trust (Terms of office, and length of Time Served1) |
Principal
Occupations During the Past Five Years |
Number
of Portfolios in Fund Complex Overseen by the Trustee |
Other Directorships |
| Richard
A. Wurster2 1973 Trustee (Trustee of The Charles Schwab Family of Funds, Schwab Investments, Schwab Capital Trust, Schwab Annuity Portfolios, Schwab Strategic Trust and Laudus Trust since 2022) |
President (Oct. 2021 – present) and Executive Vice President – Schwab Asset Management Solutions (Apr. 2019 – Oct. 2021), The Charles Schwab Corporation; President, Director (Oct. 2021 – present), Executive Vice President – Schwab Asset Management Solutions (July 2019 – Oct. 2021) and Senior Vice President – Advisory (May 2016 – July 2019), Charles Schwab & Co., Inc.; President (Nov. 2021 – present), Schwab Holdings, Inc.; Director (Oct. 2021 – present) and Chief Executive Officer (Nov. 2019 – Jan. 2022), Charles Schwab Investment Management, Inc.; Director, Chief Executive Officer and President (Mar. 2018 – Oct. 2022), Charles Schwab Investment Advisory, Inc.; Chief Executive Officer (July 2016 – Apr. 2018) and President (Mar. 2017 – Apr. 2018), ThomasPartners, Inc.; Chief Executive Officer (July 2016 – Apr. 2018), Windhaven Investment Management, Inc. | 105 | None |
| Officers of the Trust | |
| Name,
Year of Birth, and Position(s) with the trust (Terms of office, and length of Time Served3) |
Principal Occupations During the Past Five Years |
| Jonathan
de St. Paer 1973 President and Chief Executive Officer (Officer of The Charles Schwab Family of Funds, Schwab Investments, Schwab Capital Trust, Schwab Annuity Portfolios, Schwab Strategic Trust and Laudus Trust since 2018) |
Director (Apr. 2019 – present), President (Oct. 2018 – present), Chief Operating Officer (Jan. 2021 – present), and Chief Executive Officer (Apr. 2019 – Nov. 2019), Charles Schwab Investment Management, Inc.; Senior Vice President (June 2020 – Mar. 2022) and Chief Operating Officer (Jan. 2021 – Mar. 2022), Charles Schwab Investment Advisory, Inc.; Chief Executive Officer (Apr. 2019 – present), President (Nov. 2018 – present) and Trustee (Apr. 2019 – Dec. 2020), Schwab Funds, Laudus Trust and Schwab ETFs; Managing Director (May 2022 – present), Senior Vice President (Apr. 2019 – May 2022) and Senior Vice President – Strategy and Product Development (CSIM) (Jan. 2014 – Mar. 2019), Charles Schwab & Co., Inc. |
| Mark
Fischer 1970 Treasurer, Chief Financial Officer and Chief Operating Officer (Officer of The Charles Schwab Family of Funds, Schwab Investments, Schwab Capital Trust, Schwab Annuity Portfolios, Schwab Strategic Trust and Laudus Trust since 2013) |
Treasurer and Chief Financial Officer (Jan. 2016 – present) and Chief Operating Officer (Dec. 2020 – present), Schwab Funds, Laudus Trust and Schwab ETFs; Chief Financial Officer (Mar. 2020 – present) and Vice President (Oct. 2013 – present), Charles Schwab Investment Management, Inc. |
| Omar
Aguilar 1970 Vice President and Chief Investment Officer (Officer of The Charles Schwab Family of Funds, Schwab Investments, Schwab Capital Trust, Schwab Annuity Portfolios, Schwab Strategic Trust and Laudus Trust since 2011) |
Chief Executive Officer (Jan. 2022 – present), Chief Investment Officer (Apr. 2011 – present) and Senior Vice President (Apr. 2011 – Dec. 2021), Charles Schwab Investment Management, Inc.; Director, Chief Executive Officer and President (Oct. 2022 – present), Charles Schwab Investment Advisory, Inc.; Vice President and Chief Investment Officer (June 2011 – present), Schwab Funds, Laudus Trust and Schwab ETFs. |
| Brett
Wander 1961 Vice President and Chief Investment Officer (Officer of The Charles Schwab Family of Funds, Schwab Investments, Schwab Capital Trust, Schwab Annuity Portfolios, Schwab Strategic Trust and Laudus Trust since 2011) |
Senior Vice President and Chief Investment Officer (Apr. 2011 – present), Charles Schwab Investment Management, Inc.; Vice President and Chief Investment Officer (June 2011 – present), Schwab Funds, Laudus Trust and Schwab ETFs. |
| William
P. McMahon, Jr. 1972 Vice President and Chief Investment Officer (Officer of The Charles Schwab Family of Funds, Schwab Investments, Schwab Capital Trust, Schwab Annuity Portfolios, Schwab Strategic Trust and Laudus Trust since 2021) |
Senior Vice President and Chief Investment Officer (Jan. 2020 – present), Charles Schwab Investment Management, Inc.; Vice President and Chief Investment Officer (June 2021 – present), Schwab Funds, Laudus Trust and Schwab ETFs; Senior Vice President and Chief Investment Officer – ThomasPartners Strategies (Apr. 2018 – Dec. 2019), Charles Schwab Investment Advisory, Inc.; Senior Vice President and Chief Investment Officer (May 2001 – Apr. 2018), ThomasPartners, Inc. |
| Officers of the Trust (continued) | |
| Name,
Year of Birth, and Position(s) with the trust (Terms of office, and length of Time Served3) |
Principal Occupations During the Past Five Years |
| Catherine
MacGregor 1964 Chief Legal Officer and Secretary, Schwab Funds and Schwab ETFs Chief Legal Officer, Vice President and Clerk, Laudus Trust (Officer of The Charles Schwab Family of Funds, Schwab Investments, Schwab Capital Trust, Schwab Annuity Portfolios and Laudus Trust since 2005; Schwab Strategic Trust since 2009) |
Chief Legal Officer (Mar. 2022 – present) and Vice President (Sept. 2005 – present), Charles Schwab Investment Management, Inc.; Managing Director (May 2022 – present) and Vice President (July 2005 – May 2022), Charles Schwab & Co., Inc.; Vice President (Dec. 2005 – present) and Chief Legal Officer and Clerk (Mar. 2007 – present), Laudus Trust; Chief Legal Officer and Secretary (Oct. 2021 – present), Vice President (Nov. 2005 – Oct. 2021) and Assistant Secretary (June 2007 – Oct. 2021), Schwab Funds; Chief Legal Officer and Secretary (Oct. 2021 – present), Vice President and Assistant Secretary (Oct. 2009 – Oct. 2021), Schwab ETFs. |
| 1 | Each Trustee shall hold office until the election and qualification of his or her successor, or until he or she dies, resigns or is removed. The retirement policy requires that each independent trustee retire by December 31 of the year in which the Trustee turns 74 or the Trustee’s twentieth year of service as an independent trustee on any trust in the Fund Complex, whichever occurs first. |
| 2 | Mr. Bettinger and Mr. Wurster are Interested Trustees. Mr. Bettinger and Mr. Wurster are Interested Trustees because each owns stock of The Charles Schwab Corporation (CSC), the parent company of Charles Schwab Investment Management, Inc., the investment adviser for the trusts in the Fund Complex, and is an employee of Charles Schwab & Co., Inc. (Schwab), the principal underwriter for The Charles Schwab Family of Funds, Schwab Investments, Schwab Capital Trust, Schwab Annuity Portfolios and Laudus Trust. |
| 3 | The President, Treasurer and Secretary/Clerk hold office until their respective successors are chosen and qualified or until he or she sooner dies, resigns, is removed or becomes disqualified. Each of the other officers serves at the pleasure of the Board. |
Schwab Funds
| ¹ | State, local, and the Federal Alternative Minimum Tax may apply. Capital gains are not exempt from Federal Taxation. |
| ² | You could lose money by investing in the Schwab Money Funds. All Schwab Money Funds with the exception of Schwab Variable Share Price Money Fund seek to preserve the value of your investment at $1.00 per share, but cannot guarantee they will do so. Because the share price of Schwab Variable Share Price Money Fund will fluctuate, when you sell your shares they may be worth more or less than what you originally paid for them. All Schwab Money Funds with the exception of Schwab Government Money Fund, Schwab Retirement Government Money Fund, Schwab U.S. Treasury Money Fund, Schwab Treasury Obligations Money Fund and Schwab Government Money Market Portfolio may impose a fee upon the sale of your shares or may temporarily suspend your ability to sell shares if the Fund’s liquidity falls below required minimums because of market conditions or other factors. An investment in the Schwab Money Funds is not insured or guaranteed by the Federal Deposit Insurance Corporation or any other government agency. The Schwab Money Funds’ sponsor has no legal obligation to provide financial support to the Funds, and you should not expect that the sponsor will provide financial support to the Funds at any time. |

| Total Return for the 12 Months Ended October 31, 2022 | |
| Schwab Balanced Fund (Ticker Symbol: SWOBX) | -18.51% |
| Balanced Blended Index | -15.32% |
| Fund Category: Morningstar Allocation—50% to 70% Equity1 | -14.00% |
| Performance Details | pages 7-9 |
| 1 | Source for category information: Morningstar, Inc. The Morningstar Category return represents all active and index mutual funds and ETFs within the category as of the report date. |


| * | The net version of the index reflects reinvested dividends net of withholding taxes but reflects no deductions for expenses or other taxes. |
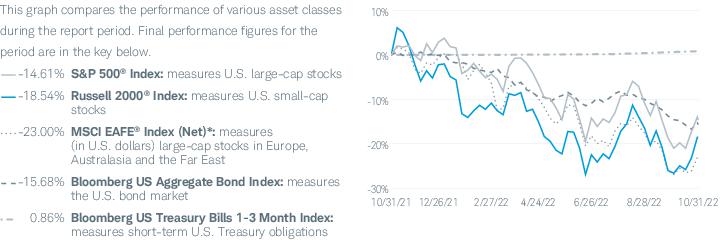
| * | The net version of the index reflects reinvested dividends net of withholding taxes but reflects no deductions for expenses or other taxes. |
 |
Zifan Tang, Ph.D., CFA, Senior Portfolio Manager, is responsible for the co-management of the fund. Prior to joining Schwab in 2012, Ms. Tang was a product manager at Thomson Reuters and from 1997 to 2009 worked as a portfolio manager at Barclays Global Investors (now known as BlackRock). |
 |
Patrick Kwok, CFA, Portfolio Manager, is responsible for the co-management of the fund. Previously, Mr. Kwok served as an associate portfolio manager from 2012 to 2016. Prior to that, he worked as a fund administration manager, where he was responsible for oversight of sub-advisers, trading, cash management, and fund administration supporting the Charles Schwab Trust Bank Collective Investment Trusts and multi-asset Schwab Funds. Prior to joining Schwab Asset Management in 2008, Mr. Kwok spent two years as an asset operations specialist at Charles Schwab Trust Company. He also worked for one year at State Street Bank & Trust as a portfolio accountant and pricing specialist. |
| 1 | The total return cited for the index reflects reinvested dividends net of withholding taxes but reflects no deductions for expenses or other taxes. |

| Fund and Inception Date | 1 Year | 5 Years | 10 Years |
| Fund: Schwab Balanced Fund (11/18/96) | -18.51% | 4.32% | 6.84% |
| S&P 500® Index | -14.61% | 10.44% | 12.79% |
| Bloomberg US Aggregate Bond Index | -15.68% | -0.54% | 0.74% |
| Balanced Blended Index | -15.32% | 5.78% | 7.66% |
| Fund Category: Morningstar Allocation—50% to 70% Equity2 | -14.00% | 4.25% | 6.15% |
| Fund Expense Ratios3: Net 0.50%; Gross 0.52% | |||
| 1 | Fund expenses may have been partially absorbed by the investment adviser and its affiliates. Without these reductions, the fund’s returns would have been lower. These returns do not reflect the deduction of taxes that a shareholder would pay on fund distributions or the redemption of fund shares. |
| 2 | Source for category information: Morningstar, Inc. The Morningstar Category return represents all active and index mutual funds and ETFs within the category as of the report date. |
| 3 | As stated in the prospectus. Includes 0.50% of acquired fund fees and expenses (AFFE), which are indirect expenses incurred by the fund through its investments in the underlying funds. Net Expense: Expenses reduced by a contractual fee waiver in effect for so long as Schwab Asset Management serves as the investment adviser to the fund. Gross Expense: Does not reflect the effect of contractual fee waivers. For actual expense ratios during the period, not including AFFE, refer to the financial highlights section of the financial statements. |

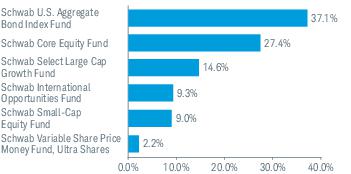
| 1 | The percentage may differ from the Portfolio Holdings because the above calculation is based on a percentage of total investments, whereas the calculation in the Portfolio Holdings is based on a percentage of net assets. |
| 2 | This list is not a recommendation of any security by the investment adviser. |
| 3 | The holdings listed exclude any temporary liquidity investments. |
| EXPENSE
RATIO (ANNUALIZED)1,2 |
EFFECTIVE
EXPENSE RATIO (ANNUALIZED)3,4 |
BEGINNING
ACCOUNT VALUE AT 5/1/22 |
ENDING
ACCOUNT VALUE (NET OF EXPENSES) AT 10/31/22 |
EXPENSES
PAID DURING PERIOD 5/1/22-10/31/222,5 |
EFFECTIVE
EXPENSES PAID DURING PERIOD 5/1/22-10/31/224,5 | |
| Schwab Balanced Fund | ||||||
| Actual Return | 0.00% | 0.50% | $1,000.00 | $ 925.30 | $0.00 | $2.43 |
| Hypothetical 5% Return | 0.00% | 0.50% | $1,000.00 | $1,025.21 | $0.00 | $2.55 |
| 1 | Based on the most recent six-month expense ratio. |
| 2 | Excludes acquired fund fees and expenses, which are indirect expenses incurred by the fund through its investments in underlying funds. |
| 3 | Based on the most recent six-month acquired fund fees and expenses and the expense ratio; may differ from the acquired fund fees and expenses and the expense ratio in the prospectus. |
| 4 | Includes acquired fund fees and expenses, which are indirect expenses incurred by the fund through its investments in underlying funds. |
| 5 | Expenses for each fund are equal to its annualized expense ratio, multiplied by the average account value over the period, multiplied by the 184 days of the period, and divided by the 365 days of the fiscal year. |
| 11/1/21–
10/31/22 |
11/1/20–
10/31/21 |
11/1/19–
10/31/20 |
11/1/18–
10/31/19 |
11/1/17–
10/31/18 |
||
| Per-Share Data | ||||||
| Net asset value at beginning of period | $19.74 | $16.50 | $15.99 | $15.41 | $15.60 | |
| Income (loss) from investment operations: | ||||||
| Net investment income (loss)1 | 0.21 | 0.19 | 0.20 | 0.24 | 0.23 | |
| Net realized and unrealized gains (losses) | (3.62) | 3.58 | 1.13 | 1.32 | 0.08 2 | |
| Total from investment operations | (3.41) | 3.77 | 1.33 | 1.56 | 0.31 | |
| Less distributions: | ||||||
| Distributions from net investment income | (0.85) | (0.19) | (0.22) | (0.37) | (0.48) | |
| Distributions from net realized gains | (0.37) | (0.34) | (0.60) | (0.61) | (0.02) | |
| Total distributions | (1.22) | (0.53) | (0.82) | (0.98) | (0.50) | |
| Net asset value at end of period | $15.11 | $19.74 | $16.50 | $15.99 | $15.41 | |
| Total return | (18.51%) | 23.20% | 8.58% | 11.19% | 1.94% | |
| Ratios/Supplemental Data | ||||||
| Ratios to average net assets: | ||||||
| Net operating expenses3 | 0.00% 4 | 0.00% | 0.00% | 0.00% | 0.00% | |
| Gross operating expenses3 | 0.03% 4 | 0.02% | 0.03% | 0.04% | 0.04% | |
| Net investment income (loss) | 1.25% | 1.01% | 1.26% | 1.55% | 1.44% | |
| Portfolio turnover rate | 31% | 6% | 18% | 32% | 6% | |
| Net assets, end of period (x 1,000) | $619,501 | $803,812 | $577,427 | $526,174 | $446,626 | |
| 1 | Calculated based on the average shares outstanding during the period. |
| 2 | The per share amount does not accord with the change in aggregate gains and losses in securities during the period because of the timing of sales and repurchases of fund shares in relation to fluctuating market values. |
| 3 | Ratio excludes acquired fund fees and expenses, which are indirect expenses incurred by the fund through its investments in underlying funds. |
| 4 | Ratio includes less than 0.005% of non-routine proxy expenses. |
| SECURITY | VALUE
AT 10/31/21 |
PURCHASES | SALES | REALIZED
GAINS (LOSSES) |
NET
CHANGE IN UNREALIZED APPRECIATION (DEPRECIATION) |
VALUE
AT 10/31/22 |
BALANCE
OF SHARES HELD AT 10/31/22 |
DISTRIBUTIONS
RECEIVED(a) |
| AFFILIATED UNDERLYING FUNDS 99.2% OF NET ASSETS | ||||||||
| U.S. Stocks 50.8% | ||||||||
| Large-Cap 41.9% | ||||||||
| Schwab Core Equity Fund | $281,181,209 | $32,188,090 | ($47,508,250) | ($7,468,844) | ($89,268,434) | $169,123,771 | 8,690,841 | $70,412,412 |
| Schwab Select Large Cap Growth Fund (formerly Laudus U.S. Large Cap Growth Fund) * | 127,249,981 | 52,063,086 | (21,746,372) | (4,447,850) | (62,777,486) | 90,341,359 | 4,583,529 | 16,447,928 |
| Schwab U.S. Large-Cap ETF | — | 68,830,829 | (68,019,047) | (811,782) | — | — | — | 7,795 |
| 259,465,130 | ||||||||
| Small-Cap 8.9% | ||||||||
| Schwab Small-Cap Equity Fund | 80,221,848 | 16,963,923 | (24,362,221) | (251,490) | (17,381,511) | 55,190,549 | 2,913,968 | 9,532,082 |
| 314,655,679 | ||||||||
| International Stocks 9.2% | ||||||||
| Developed Markets 9.2% | ||||||||
| Schwab International Opportunities Fund (formerly Laudus International MarketMasters Fund) | — | 82,505,714 | (5,341,444) | (1,299,991) | (18,716,124) | 57,148,155 | 3,383,550 | — |
| Fixed Income 37.0% | ||||||||
| Intermediate-Term Bond 37.0% | ||||||||
| Schwab U.S. Aggregate Bond Index Fund | 290,913,616 | 50,749,452 | (59,867,656) | (6,418,371) | (46,246,634) | 229,130,407 | 26,643,071 | 6,245,985 |
| Money Market Funds 2.2% | ||||||||
| Schwab Variable Share Price Money Fund, Ultra Shares, 3.10% (b) | 13,719,523 | 118,164 | (327) | — | (4,124) | 13,833,236 | 13,833,236 | 135,170 |
| Total
Affiliated Underlying Funds (Cost $662,230,507) |
$793,286,177 | $303,419,258 | ($226,845,317) | ($20,698,328) | ($234,394,313) | $614,767,477 | $102,781,372 | |
| UNAFFILIATED UNDERLYING FUNDS 0.4% OF NET ASSETS | ||||||||
| Money Market Funds 0.4% | ||||||||
| State Street Institutional U.S. Government Money Market Fund, Premier Class, 3.01% (b) | $2,427,733 | 2,427,733 | ||||||
| Total
Unaffiliated Underlying Funds (Cost $2,427,733) |
$2,427,733 | |||||||
| Total
Investments in Securities (Cost $664,658,240) |
$617,195,210 | |||||||
| * | Non-income producing security. |
| (a) | Distributions received include distributions from net investment income and capital gains, if any, from the underlying funds. Amounts shown are only presented for affiliated underlying funds, which are presented in the corresponding line-item in the Statement of Operations, if applicable (See financial note 2(c) for additional information). |
| (b) | The rate shown is the annualized 7-day yield. |
| ETF — | Exchange traded fund |
| Assets | ||
| Investments in securities, at value - affiliated (cost $662,230,507) | $614,767,477 | |
| Investments in securities, at value - unaffiliated (cost $2,427,733) | 2,427,733 | |
| Receivables: | ||
| Investments sold | 7,023,183 | |
| Fund shares sold | 563,076 | |
| Dividends | 519,579 | |
| Due from investment adviser | 16,026 | |
| Prepaid expenses | + | 24,814 |
| Total assets | 625,341,888 | |
| Liabilities | ||
| Payables: | ||
| Investments bought | 4,891,560 | |
| Fund shares redeemed | 878,954 | |
| Independent trustees’ fees | 41 | |
| Accrued expenses | + | 70,420 |
| Total liabilities | 5,840,975 | |
| Net assets | $619,500,913 | |
| Net Assets by Source | ||
| Capital received from investors | $627,557,271 | |
| Total distributable loss | + | (8,056,358) |
| Net assets | $619,500,913 | |
| Net Asset Value (NAV) | ||||
| Net Assets | ÷ | Shares
Outstanding |
= | NAV |
| $619,500,913 | 41,000,195 | $15.11 | ||
| For the period November 1, 2021 through October 31, 2022 | ||
| Investment Income | ||
| Dividends received from securities - affiliated | $9,193,798 | |
| Dividends received from securities - unaffiliated | + | 53,741 |
| Total investment income | 9,247,539 | |
| Expenses | ||
| Registration fees | 52,810 | |
| Shareholder reports | 38,074 | |
| Proxy fees1 | 34,639 | |
| Portfolio accounting fees | 29,950 | |
| Professional fees | 23,548 | |
| Independent trustees’ fees | 8,803 | |
| Transfer agent fees | 7,143 | |
| Custodian fees | 1,024 | |
| Other expenses | + | 11,248 |
| Total expenses | 207,239 | |
| Expense reduction | – | 172,600 |
| Net expenses | – | 34,639 |
| Net investment income | 9,212,900 | |
| REALIZED AND UNREALIZED GAINS (LOSSES) | ||
| Realized capital gain distributions received from underlying funds - affiliated | 93,587,574 | |
| Net realized losses on sales of securities - affiliated | + | (20,698,328) |
| Net realized gains | 72,889,246 | |
| Net change in unrealized appreciation (depreciation) on securities - affiliated | + | (234,394,313) |
| Net realized and unrealized losses | (161,505,067) | |
| Decrease in net assets resulting from operations | ($152,292,167) | |
| 1 | Proxy fees are non-routine expenses (see financial note 4 for additional information). |
| OPERATIONS | |||
| 11/1/21-10/31/22 | 11/1/20-10/31/21 | ||
| Net investment income | $9,212,900 | $7,230,817 | |
| Net realized gains | 72,889,246 | 16,382,779 | |
| Net change in unrealized appreciation (depreciation) | + | (234,394,313) | 117,082,895 |
| Increase (decrease) in net assets resulting from operations | ($152,292,167) | $140,696,491 | |
| DISTRIBUTIONS TO SHAREHOLDERS | |||
| Total distributions | ($53,966,826) | ($18,699,512) | |
| TRANSACTIONS IN FUND SHARES | |||||
| 11/1/21-10/31/22 | 11/1/20-10/31/21 | ||||
| SHARES | VALUE | SHARES | VALUE | ||
| Shares sold | 10,090,100 | $184,284,944 | 10,659,191 | $196,407,644 | |
| Shares reinvested | 2,499,461 | 47,414,756 | 946,955 | 16,600,121 | |
| Shares redeemed | + | (12,303,468) | (209,751,334) | (5,882,203) | (108,620,302) |
| Net transactions in fund shares | 286,093 | $21,948,366 | 5,723,943 | $104,387,463 | |
| SHARES OUTSTANDING AND NET ASSETS | |||||
| 11/1/21-10/31/22 | 11/1/20-10/31/21 | ||||
| SHARES | NET ASSETS | SHARES | NET ASSETS | ||
| Beginning of period | 40,714,102 | $803,811,540 | 34,990,159 | $577,427,098 | |
| Total increase (decrease) | + | 286,093 | (184,310,627) | 5,723,943 | 226,384,442 |
| End of period | 41,000,195 | $619,500,913 | 40,714,102 | $803,811,540 | |
| SCHWAB CAPITAL TRUST (ORGANIZED MAY 7, 1993) | |
| Schwab Balanced Fund | Schwab Target 2045 Fund |
| Schwab S&P 500 Index Fund | Schwab Target 2050 Fund |
| Schwab Small-Cap Index Fund® | Schwab Target 2055 Fund |
| Schwab Total Stock Market Index Fund® | Schwab Target 2060 Fund |
| Schwab U.S. Large-Cap Growth Index Fund | Schwab Target 2065 Fund |
| Schwab U.S. Large-Cap Value Index Fund | Schwab Fundamental US Large Company Index Fund |
| Schwab U.S. Mid-Cap Index Fund | Schwab Fundamental US Small Company Index Fund |
| Schwab International Index Fund® | Schwab Fundamental International Large Company Index Fund |
| Schwab MarketTrack All Equity Portfolio™ | Schwab Fundamental International Small Company Index Fund |
| Schwab MarketTrack Growth Portfolio™ | Schwab Fundamental Emerging Markets Large Company Index Fund |
| Schwab MarketTrack Balanced Portfolio™ | Schwab Fundamental Global Real Estate Index Fund |
| Schwab MarketTrack Conservative Portfolio™ | Schwab Target 2010 Index Fund |
| Schwab International Opportunities Fund | Schwab Target 2015 Index Fund |
| Schwab Core Equity Fund | Schwab Target 2020 Index Fund |
| Schwab Dividend Equity Fund | Schwab Target 2025 Index Fund |
| Schwab Large-Cap Growth Fund | Schwab Target 2030 Index Fund |
| Schwab Small-Cap Equity Fund | Schwab Target 2035 Index Fund |
| Schwab Health Care Fund | Schwab Target 2040 Index Fund |
| Schwab International Core Equity Fund | Schwab Target 2045 Index Fund |
| Schwab Target 2010 Fund | Schwab Target 2050 Index Fund |
| Schwab Target 2015 Fund | Schwab Target 2055 Index Fund |
| Schwab Target 2020 Fund | Schwab Target 2060 Index Fund |
| Schwab Target 2025 Fund | Schwab Target 2065 Index Fund |
| Schwab Target 2030 Fund | Schwab Monthly Income Fund – Target Payout |
| Schwab Target 2035 Fund | Schwab Monthly Income Fund – Flexible Payout |
| Schwab Target 2040 Fund | Schwab Monthly Income Fund – Income Payout |
| Schwab Core Equity Fund | 13.3% |
| Schwab International Opportunities Fund | 5.8% |
| Schwab Select Large Cap Growth Fund | 4.6% |
| Schwab Small-Cap Equity Fund | 10.2% |
| Schwab U.S. Aggregate Bond Index Fund | 5.6% |
| Schwab Variable Share Price Money Fund, Ultra Shares | 0.3% |
| PURCHASE COST | SALE PROCEEDS | REALIZED GAINS (LOSSES) | |
| $— | $39,355,550 | ($1,058,783) | |
| 6. Borrowing from Banks: |
| PURCHASES
OF SECURITIES |
SALES
OF SECURITIES |
| $303,419,258 | $226,845,317 |
| TAX COST | GROSS
UNREALIZED APPRECIATION |
GROSS
UNREALIZED DEPRECIATION |
NET
UNREALIZED APPRECIATION (DEPRECIATION) |
| $677,641,506 | $13,075,176 | ($73,521,472) | ($60,446,296) |
| UNDISTRIBUTED
ORDINARY INCOME |
UNDISTRIBUTED
LONG-TERM CAPITAL GAINS |
NET
UNREALIZED APPRECIATION (DEPRECIATION) ON INVESTMENTS |
TOTAL |
| $5,260,171 | $47,129,767 | ($60,446,296) | ($8,056,358) |
| CURRENT FISCAL YEAR END DISTRIBUTIONS | PRIOR FISCAL YEAR END DISTRIBUTIONS | |||
| ORDINARY
INCOME |
LONG-TERM
CAPITAL GAINS |
ORDINARY
INCOME |
LONG-TERM
CAPITAL GAINS | |
| $38,253,293 | $15,713,533 | $7,375,819 | $11,323,693 | |
Denver, Colorado
December 16, 2022
| Proposal
– To elect each of the following individuals as trustees of the Trust: |
For | Withheld |
| Walter W. Bettinger II | 1,095,577,106.505 | 115,838,980.968 |
| Richard A. Wurster | 1,117,598,789.555 | 93,817,297.918 |
| Michael J. Beer | 1,116,890,447.505 | 94,525,639.968 |
| Robert W. Burns | 1,117,915,860.110 | 93,500,227.363 |
| Nancy F. Heller | 1,119,878,732.134 | 91,537,355.339 |
| David L. Mahoney | 1,069,125,022.434 | 142,291,065.039 |
| Jane P. Moncreiff | 1,120,187,927.838 | 91,228,159.635 |
| Kiran M. Patel | 1,116,689,111.571 | 94,726,975.902 |
| Kimberly S. Patmore | 1,119,941,056.059 | 91,475,031.414 |
| J. Derek Penn | 1,117,666,014.121 | 93,750,073.352 |
| Independent Trustees | |||
| Name,
Year of Birth, and Position(s) with the trust (Terms of office, and length of Time Served1) |
Principal
Occupations During the Past Five Years |
Number
of Portfolios in Fund Complex Overseen by the Trustee |
Other Directorships |
|
Michael J. Beer 1961 Trustee (Trustee of The Charles Schwab Family of Funds, Schwab Investments, Schwab Capital Trust, Schwab Annuity Portfolios, Schwab Strategic Trust and Laudus Trust since 2022) |
Retired. Director, President and Chief Executive Officer (Dec. 2016 – Sept. 2019), Principal Funds (investment management). | 105 | Director (2016 – 2019), Principal Funds, Inc. |
| Robert
W. Burns 1959 Trustee (Trustee of Schwab Strategic Trust since 2009; The Charles Schwab Family of Funds, Schwab Investments, Schwab Capital Trust, Schwab Annuity Portfolios and Laudus Trust since 2016) |
Retired/Private Investor. | 105 | None |
| Nancy
F. Heller 1956 Trustee (Trustee of The Charles Schwab Family of Funds, Schwab Investments, Schwab Capital Trust, Schwab Annuity Portfolios, Schwab Strategic Trust and Laudus Trust since 2018) |
Retired. | 105 | None |
| David
L. Mahoney 1954 Trustee (Trustee of The Charles Schwab Family of Funds, Schwab Investments, Schwab Capital Trust, Schwab Annuity Portfolios and Laudus Trust since 2011; Schwab Strategic Trust since 2016) |
Private Investor. | 105 | Director
(2004 – present), Corcept Therapeutics Incorporated Director (2009 – 2021), Adamas Pharmaceuticals, Inc. Director (2003 – 2019), Symantec Corporation |
| Jane
P. Moncreiff 1961 Trustee (Trustee of The Charles Schwab Family of Funds, Schwab Investments, Schwab Capital Trust, Schwab Annuity Portfolios, Schwab Strategic Trust and Laudus Trust since 2019) |
Consultant (2018 – present), Fulham Advisers LLC (management consulting); Chief Investment Officer (2009 – 2017), CareGroup Healthcare System, Inc. (healthcare). | 105 | None |
| Independent Trustees (continued) | |||
| Name,
Year of Birth, and Position(s) with the trust (Terms of office, and length of Time Served1) |
Principal
Occupations During the Past Five Years |
Number
of Portfolios in Fund Complex Overseen by the Trustee |
Other Directorships |
| Kiran
M. Patel 1948 Trustee (Trustee of The Charles Schwab Family of Funds, Schwab Investments, Schwab Capital Trust, Schwab Annuity Portfolios and Laudus Trust since 2011; Schwab Strategic Trust since 2016) |
Retired. | 105 | Director (2008 – present), KLA-Tencor Corporation |
| Kimberly
S. Patmore 1956 Trustee (Trustee of The Charles Schwab Family of Funds, Schwab Investments, Schwab Capital Trust, Schwab Annuity Portfolios, Schwab Strategic Trust and Laudus Trust since 2016) |
Consultant (2008 – present), Patmore Management Consulting (management consulting). | 105 | None |
|
J. Derek Penn 1957 Trustee (Trustee of The Charles Schwab Family of Funds, Schwab Investments, Schwab Capital Trust, Schwab Annuity Portfolios, Schwab Strategic Trust and Laudus Trust since 2021) |
Head of Equity Sales and Trading (2006 – 2018), BNY Mellon (financial services). | 105 | None |
| Interested Trustees | |||
| Name,
Year of Birth, and Position(s) with the trust (Terms of office, and length of Time Served1) |
Principal
Occupations During the Past Five Years |
Number
of Portfolios in Fund Complex Overseen by the Trustee |
Other Directorships |
| Walter
W. Bettinger II2 1960 Chairman and Trustee (Trustee of The Charles Schwab Family of Funds, Schwab Investments, Schwab Capital Trust and Schwab Annuity Portfolios since 2008; Schwab Strategic Trust since 2009; Laudus Trust since 2010) |
Co-Chairman of the Board (July 2022 – present), Director and Chief Executive Officer (Oct. 2008 – present) and President (Feb. 2007 – Oct. 2021), The Charles Schwab Corporation; President and Chief Executive Officer (Oct. 2008 – Oct. 2021) and Director (May 2008 – Oct. 2021), Charles Schwab & Co., Inc.; Director (Apr. 2006 – present), Charles Schwab Bank, SSB; Director (Nov. 2017 – present), Charles Schwab Premier Bank, SSB; Director (July 2019 – present), Charles Schwab Trust Bank; Director (May 2008 – present), Chief Executive Officer (Aug. 2017 – present) and President (Aug. 2017 – Nov. 2021), Schwab Holdings, Inc.; Director (Oct. 2020 – present), TD Ameritrade Holding Corporation; Director (July 2016 – Oct. 2021), Charles Schwab Investment Management, Inc. | 105 | Director (2008 – present), The Charles Schwab Corporation |
| Interested Trustees (continued) | |||
| Name,
Year of Birth, and Position(s) with the trust (Terms of office, and length of Time Served1) |
Principal
Occupations During the Past Five Years |
Number
of Portfolios in Fund Complex Overseen by the Trustee |
Other Directorships |
| Richard
A. Wurster2 1973 Trustee (Trustee of The Charles Schwab Family of Funds, Schwab Investments, Schwab Capital Trust, Schwab Annuity Portfolios, Schwab Strategic Trust and Laudus Trust since 2022) |
President (Oct. 2021 – present) and Executive Vice President – Schwab Asset Management Solutions (Apr. 2019 – Oct. 2021), The Charles Schwab Corporation; President, Director (Oct. 2021 – present), Executive Vice President – Schwab Asset Management Solutions (July 2019 – Oct. 2021) and Senior Vice President – Advisory (May 2016 – July 2019), Charles Schwab & Co., Inc.; President (Nov. 2021 – present), Schwab Holdings, Inc.; Director (Oct. 2021 – present) and Chief Executive Officer (Nov. 2019 – Jan. 2022), Charles Schwab Investment Management, Inc.; Director, Chief Executive Officer and President (Mar. 2018 – Oct. 2022), Charles Schwab Investment Advisory, Inc.; Chief Executive Officer (July 2016 – Apr. 2018) and President (Mar. 2017 – Apr. 2018), ThomasPartners, Inc.; Chief Executive Officer (July 2016 – Apr. 2018), Windhaven Investment Management, Inc. | 105 | None |
| Officers of the Trust | |
| Name,
Year of Birth, and Position(s) with the trust (Terms of office, and length of Time Served3) |
Principal Occupations During the Past Five Years |
| Jonathan
de St. Paer 1973 President and Chief Executive Officer (Officer of The Charles Schwab Family of Funds, Schwab Investments, Schwab Capital Trust, Schwab Annuity Portfolios, Schwab Strategic Trust and Laudus Trust since 2018) |
Director (Apr. 2019 – present), President (Oct. 2018 – present), Chief Operating Officer (Jan. 2021 – present), and Chief Executive Officer (Apr. 2019 – Nov. 2019), Charles Schwab Investment Management, Inc.; Senior Vice President (June 2020 – Mar. 2022) and Chief Operating Officer (Jan. 2021 – Mar. 2022), Charles Schwab Investment Advisory, Inc.; Chief Executive Officer (Apr. 2019 – present), President (Nov. 2018 – present) and Trustee (Apr. 2019 – Dec. 2020), Schwab Funds, Laudus Trust and Schwab ETFs; Managing Director (May 2022 – present), Senior Vice President (Apr. 2019 – May 2022) and Senior Vice President – Strategy and Product Development (CSIM) (Jan. 2014 – Mar. 2019), Charles Schwab & Co., Inc. |
| Mark
Fischer 1970 Treasurer, Chief Financial Officer and Chief Operating Officer (Officer of The Charles Schwab Family of Funds, Schwab Investments, Schwab Capital Trust, Schwab Annuity Portfolios, Schwab Strategic Trust and Laudus Trust since 2013) |
Treasurer and Chief Financial Officer (Jan. 2016 – present) and Chief Operating Officer (Dec. 2020 – present), Schwab Funds, Laudus Trust and Schwab ETFs; Chief Financial Officer (Mar. 2020 – present) and Vice President (Oct. 2013 – present), Charles Schwab Investment Management, Inc. |
| Omar
Aguilar 1970 Vice President and Chief Investment Officer (Officer of The Charles Schwab Family of Funds, Schwab Investments, Schwab Capital Trust, Schwab Annuity Portfolios, Schwab Strategic Trust and Laudus Trust since 2011) |
Chief Executive Officer (Jan. 2022 – present), Chief Investment Officer (Apr. 2011 – present) and Senior Vice President (Apr. 2011 – Dec. 2021), Charles Schwab Investment Management, Inc.; Director, Chief Executive Officer and President (Oct. 2022 – present), Charles Schwab Investment Advisory, Inc.; Vice President and Chief Investment Officer (June 2011 – present), Schwab Funds, Laudus Trust and Schwab ETFs. |
| Brett
Wander 1961 Vice President and Chief Investment Officer (Officer of The Charles Schwab Family of Funds, Schwab Investments, Schwab Capital Trust, Schwab Annuity Portfolios, Schwab Strategic Trust and Laudus Trust since 2011) |
Senior Vice President and Chief Investment Officer (Apr. 2011 – present), Charles Schwab Investment Management, Inc.; Vice President and Chief Investment Officer (June 2011 – present), Schwab Funds, Laudus Trust and Schwab ETFs. |
| William
P. McMahon, Jr. 1972 Vice President and Chief Investment Officer (Officer of The Charles Schwab Family of Funds, Schwab Investments, Schwab Capital Trust, Schwab Annuity Portfolios, Schwab Strategic Trust and Laudus Trust since 2021) |
Senior Vice President and Chief Investment Officer (Jan. 2020 – present), Charles Schwab Investment Management, Inc.; Vice President and Chief Investment Officer (June 2021 – present), Schwab Funds, Laudus Trust and Schwab ETFs; Senior Vice President and Chief Investment Officer – ThomasPartners Strategies (Apr. 2018 – Dec. 2019), Charles Schwab Investment Advisory, Inc.; Senior Vice President and Chief Investment Officer (May 2001 – Apr. 2018), ThomasPartners, Inc. |
| Officers of the Trust (continued) | |
| Name,
Year of Birth, and Position(s) with the trust (Terms of office, and length of Time Served3) |
Principal Occupations During the Past Five Years |
| Catherine
MacGregor 1964 Chief Legal Officer and Secretary, Schwab Funds and Schwab ETFs Chief Legal Officer, Vice President and Clerk, Laudus Trust (Officer of The Charles Schwab Family of Funds, Schwab Investments, Schwab Capital Trust, Schwab Annuity Portfolios and Laudus Trust since 2005; Schwab Strategic Trust since 2009) |
Chief Legal Officer (Mar. 2022 – present) and Vice President (Sept. 2005 – present), Charles Schwab Investment Management, Inc.; Managing Director (May 2022 – present) and Vice President (July 2005 – May 2022), Charles Schwab & Co., Inc.; Vice President (Dec. 2005 – present) and Chief Legal Officer and Clerk (Mar. 2007 – present), Laudus Trust; Chief Legal Officer and Secretary (Oct. 2021 – present), Vice President (Nov. 2005 – Oct. 2021) and Assistant Secretary (June 2007 – Oct. 2021), Schwab Funds; Chief Legal Officer and Secretary (Oct. 2021 – present), Vice President and Assistant Secretary (Oct. 2009 – Oct. 2021), Schwab ETFs. |
| 1 | Each Trustee shall hold office until the election and qualification of his or her successor, or until he or she dies, resigns or is removed. The retirement policy requires that each independent trustee retire by December 31 of the year in which the Trustee turns 74 or the Trustee’s twentieth year of service as an independent trustee on any trust in the Fund Complex, whichever occurs first. |
| 2 | Mr. Bettinger and Mr. Wurster are Interested Trustees. Mr. Bettinger and Mr. Wurster are Interested Trustees because each owns stock of The Charles Schwab Corporation (CSC), the parent company of Charles Schwab Investment Management, Inc., the investment adviser for the trusts in the Fund Complex, and is an employee of Charles Schwab & Co., Inc. (Schwab), the principal underwriter for The Charles Schwab Family of Funds, Schwab Investments, Schwab Capital Trust, Schwab Annuity Portfolios and Laudus Trust. |
| 3 | The President, Treasurer and Secretary/Clerk hold office until their respective successors are chosen and qualified or until he or she sooner dies, resigns, is removed or becomes disqualified. Each of the other officers serves at the pleasure of the Board. |
Schwab Funds
| ¹ | State, local, and the Federal Alternative Minimum Tax may apply. Capital gains are not exempt from Federal Taxation. |
| ² | You could lose money by investing in the Schwab Money Funds. All Schwab Money Funds with the exception of Schwab Variable Share Price Money Fund seek to preserve the value of your investment at $1.00 per share, but cannot guarantee they will do so. Because the share price of Schwab Variable Share Price Money Fund will fluctuate, when you sell your shares they may be worth more or less than what you originally paid for them. All Schwab Money Funds with the exception of Schwab Government Money Fund, Schwab Retirement Government Money Fund, Schwab U.S. Treasury Money Fund, Schwab Treasury Obligations Money Fund and Schwab Government Money Market Portfolio may impose a fee upon the sale of your shares or may temporarily suspend your ability to sell shares if the Fund’s liquidity falls below required minimums because of market conditions or other factors. An investment in the Schwab Money Funds is not insured or guaranteed by the Federal Deposit Insurance Corporation or any other government agency. The Schwab Money Funds’ sponsor has no legal obligation to provide financial support to the Funds, and you should not expect that the sponsor will provide financial support to the Funds at any time. |

Index Fund
Index Fund
| 1 | Source for category information: Morningstar, Inc. The Morningstar Category return represents all active and index mutual funds and ETFs within the category as of the report date. |
| 2 | The fund’s performance relative to the index may be affected by fair-value pricing and timing differences in foreign exchange calculations. See financial note 2 for more information. |
| 3 | The net version of the index reflects reinvested dividends net of withholding taxes but reflects no deductions for expenses or other taxes. |


| * | The net version of the index reflects reinvested dividends net of withholding taxes but reflects no deductions for expenses or other taxes. |

| * | The net version of the index reflects reinvested dividends net of withholding taxes but reflects no deductions for expenses or other taxes. |
 |
Christopher Bliss, CFA, Managing Director and Head of Passive Equity Strategies for Schwab Asset Management, is responsible for overseeing the investment process and portfolio management of investment strategies for passive equity Schwab Funds and Schwab ETFs. Before joining Schwab in 2016, Mr. Bliss spent 12 years at BlackRock (formerly Barclays Global Investors) managing and leading institutional index teams, most recently as a managing director and the head of the Americas institutional index team. In this role, Mr. Bliss was responsible for overseeing a team of portfolio managers managing domestic, developed international and emerging markets index strategies. Prior to BlackRock, he worked as an equity analyst and portfolio manager for Harris Bretall and before that, as a research analyst for JP Morgan. |
 |
Jeremy Brown, CFA, Senior Portfolio Manager, is responsible for the day-to-day co-management of the funds, except for the Schwab International Index Fund. Prior to joining Schwab in 2017, Mr. Brown spent six years with ALPS Advisors, Inc. in Denver, most recently as a senior analyst on the ETF portfolio management and research team where he performed portfolio management, trading, and analytics/research functions for ALPS ETFs and passive funds. Additionally, Mr. Brown led a number of investment research, commentary, industry trend analysis, and sales and marketing support initiatives. |
 |
Chuck Craig, CFA, Senior Portfolio Manager, is responsible for the oversight and day-to-day co-management of the Schwab International Index Fund. Prior to joining Schwab in 2012, Mr. Craig worked at Guggenheim Funds (formerly Claymore Group), where he spent more than five years as a managing director of portfolio management and supervision, and three years as vice president of product research and development. Prior to that, he worked as an equity research analyst at First Trust Portfolios (formerly Niké Securities), and a trader and analyst at PMA Securities, Inc. |
 |
Ferian Juwono, CFA, Senior Portfolio Manager, is responsible for the day-to-day co-management of the funds, except for the Schwab International Index Fund. Prior to joining Schwab in 2010, Mr. Juwono worked at BlackRock (formerly Barclays Global Investors) where he spent more than three years as a portfolio manager, managing equity index funds for institutional clients, and two years as a senior business analyst. Prior to that, Mr. Juwono worked for more than four years as a senior financial analyst with Union Bank of California. |
 |
David Rios, Portfolio Manager, is responsible for the day-to-day co-management of the Schwab International Index Fund. Prior to this role, Mr. Rios was an associate portfolio manager on the equity index strategies team for four years. His first role with Schwab Asset Management was as a trade operations specialist. Prior to joining Schwab in 2008, Mr. Rios was a senior fund accountant at Investors Bank & Trust (subsequently acquired by State Street Corporation). |
 |
Sabya Sinha, Portfolio Manager, is responsible for the day-to-day co-management of the funds, except for the Schwab International Index Fund. Prior to joining Schwab in 2015, Mr. Sinha spent a year at F-Squared Investments on the product development and analytics team. Prior to F-Squared, he worked at IndexIQ Advisors as a senior index portfolio manager for three years and for Bank of America’s Columbia Management subsidiary as a portfolio manager for three years. Mr. Sinha also spent time as a software consultant at DPM Mellon, LLC and an equity trader at Jane Street Capital. |
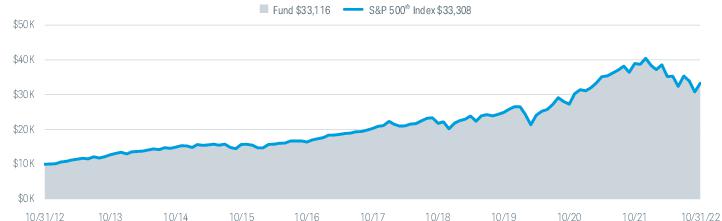
| Fund and Inception Date | 1 Year | 5 Years | 10 Years |
| Fund: Schwab S&P 500 Index Fund (5/19/97) | -14.63% | 10.41% | 12.72% |
| S&P 500® Index | -14.61% | 10.44% | 12.79% |
| Fund Category: Morningstar Large Blend2 | -14.48% | 9.03% | 11.44% |
| Fund Expense Ratio3: 0.02% | |||
| 1 | Performance does not reflect the deduction of taxes that a shareholder would pay on fund distributions or the redemption of fund shares. |
| 2 | Source for category information: Morningstar, Inc. The Morningstar Category return represents all active and index mutual funds and ETFs within the category as of the report date. |
| 3 | As stated in the prospectus. |
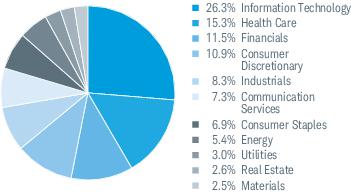
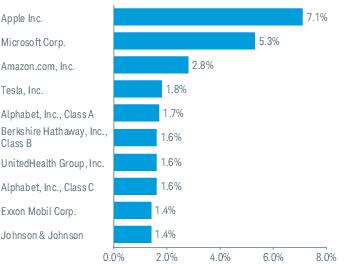
| 1 | Excludes derivatives. |
| 2 | The percentage may differ from the Portfolio Holdings because the above calculation is based on a percentage of total investments, excluding derivatives, whereas the calculation in the Portfolio Holdings is based on a percentage of net assets. |
| 3 | This list is not a recommendation of any security by the investment adviser. |
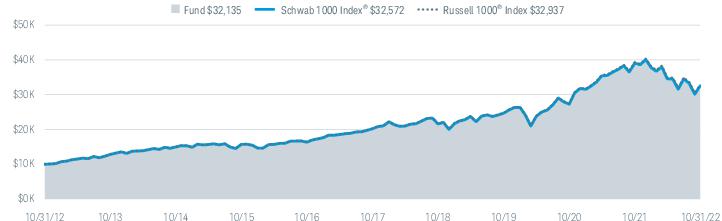
| Fund and Inception Date | 1 Year | 5 Years | 10 Years |
| Fund: Schwab 1000 Index Fund (4/2/91) | -16.73% | 9.97% | 12.38% |
| Schwab 1000 Index® | -16.69% | 10.02% | 12.53% |
| Russell 1000® Index | -16.38% | 10.19% | 12.66% |
| Fund Category: Morningstar Large Blend2 | -14.48% | 9.03% | 11.44% |
| Fund Expense Ratio3: 0.05% | |||
| 1 | Performance does not reflect the deduction of taxes that a shareholder would pay on fund distributions or the redemption of fund shares. |
| 2 | Source for category information: Morningstar, Inc. The Morningstar Category return represents all active and index mutual funds and ETFs within the category as of the report date. |
| 3 | As stated in the prospectus. |
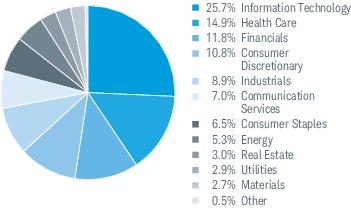
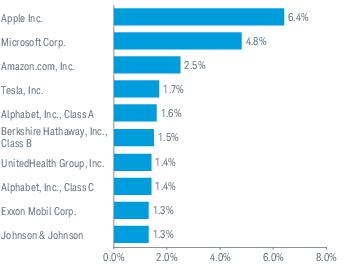
| 1 | Excludes derivatives. |
| 2 | As a result of the Schwab 1000 Index®’s once per year reconstitution and the effects of certain corporate actions, the fund may hold more or less than 1,000 securities. |
| 3 | Portfolio turnover rate excludes in-kind transactions. |
| 4 | The percentage may differ from the Portfolio Holdings because the above calculation is based on a percentage of total investments, excluding derivatives, whereas the calculation in the Portfolio Holdings is based on a percentage of net assets. |
| 5 | This list is not a recommendation of any security by the investment adviser. |

| Fund and Inception Date | 1 Year | 5 Years | 10 Years |
| Fund: Schwab Small-Cap Index Fund (5/19/97) | -18.53% | 5.62% | 9.97% |
| Russell 2000® Index | -18.54% | 5.56% | 9.93% |
| Fund Category: Morningstar Small Blend2 | -13.55% | 5.76% | 9.75% |
| Fund Expense Ratio3: 0.04% | |||
| 1 | Performance does not reflect the deduction of taxes that a shareholder would pay on fund distributions or the redemption of fund shares. |
| 2 | Source for category information: Morningstar, Inc. The Morningstar Category return represents all active and index mutual funds and ETFs within the category as of the report date. |
| 3 | As stated in the prospectus. |
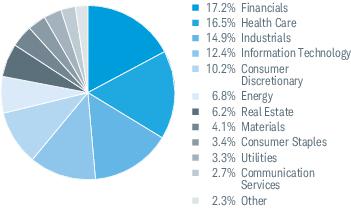
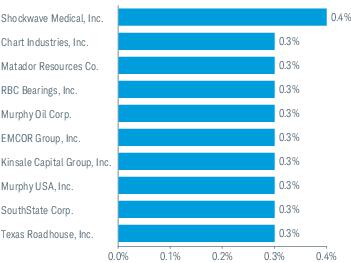
| 1 | Excludes derivatives. |
| 2 | Portfolio turnover rate excludes in-kind transactions. |
| 3 | The percentage may differ from the Portfolio Holdings because the above calculation is based on a percentage of total investments, excluding derivatives, whereas the calculation in the Portfolio Holdings is based on a percentage of net assets. |
| 4 | This list is not a recommendation of any security by the investment adviser. |
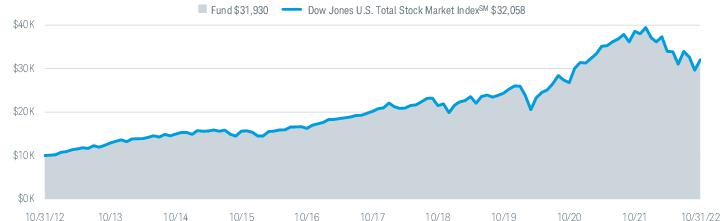
| Fund and Inception Date | 1 Year | 5 Years | 10 Years |
| Fund: Schwab Total Stock Market Index Fund (6/1/99) | -16.94% | 9.69% | 12.31% |
| Dow Jones U.S. Total Stock Market IndexSM | -16.94% | 9.72% | 12.36% |
| Fund Category: Morningstar Large Blend2 | -14.48% | 9.03% | 11.44% |
| Fund Expense Ratio3: 0.03% | |||
| 1 | Performance does not reflect the deduction of taxes that a shareholder would pay on fund distributions or the redemption of fund shares. |
| 2 | Source for category information: Morningstar, Inc. The Morningstar Category return represents all active and index mutual funds and ETFs within the category as of the report date. |
| 3 | As stated in the prospectus. |

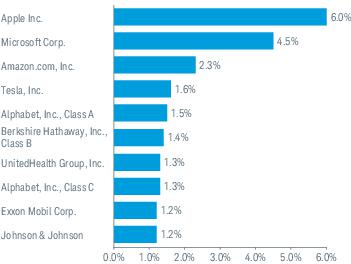
| 1 | Excludes derivatives. |
| 2 | The percentage may differ from the Portfolio Holdings because the above calculation is based on a percentage of total investments, excluding derivatives, whereas the calculation in the Portfolio Holdings is based on a percentage of net assets. |
| 3 | This list is not a recommendation of any security by the investment adviser. |
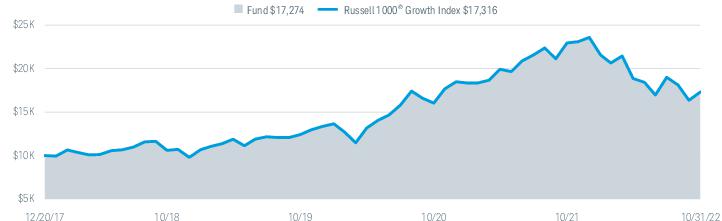
| Fund and Inception Date | 1 Year | 3 Years | Since Inception |
| Fund: Schwab U.S. Large-Cap Growth Index Fund (12/20/17) | -24.63% | 11.69% | 11.89% |
| Russell 1000® Growth Index | -24.60% | 11.75% | 11.95% |
| Fund Category: Morningstar Large Growth2 | -28.11% | 8.07% | N/A |
| Fund Expense Ratio3: 0.035% | |||
| 1 | Performance does not reflect the deduction of taxes that a shareholder would pay on fund distributions or the redemption of fund shares. |
| 2 | Source for category information: Morningstar, Inc. The Morningstar Category return represents all active and index mutual funds and ETFs within the category as of the report date. |
| 3 | As stated in the prospectus. |

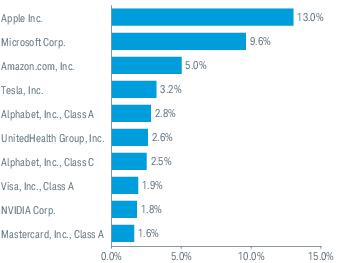
| 1 | Excludes derivatives. |
| 2 | The percentage may differ from the Portfolio Holdings because the above calculation is based on a percentage of total investments, excluding derivatives, whereas the calculation in the Portfolio Holdings is based on a percentage of net assets. |
| 3 | This list is not a recommendation of any security by the investment adviser. |
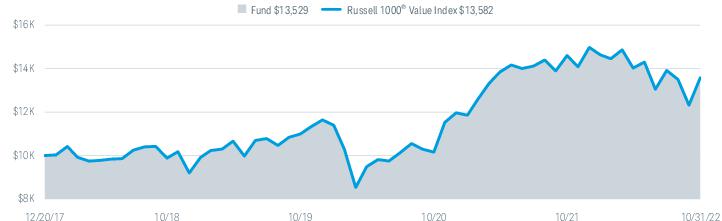
| Fund and Inception Date | 1 Year | 3 Years | Since Inception |
| Fund: Schwab U.S. Large-Cap Value Index Fund (12/20/17) | -7.04% | 7.23% | 6.41% |
| Russell 1000® Value Index | -7.00% | 7.31% | 6.49% |
| Fund Category: Morningstar Large Value2 | -4.53% | 8.42% | N/A |
| Fund Expense Ratio3: 0.035% | |||
| 1 | Performance does not reflect the deduction of taxes that a shareholder would pay on fund distributions or the redemption of fund shares. |
| 2 | Source for category information: Morningstar, Inc. The Morningstar Category return represents all active and index mutual funds and ETFs within the category as of the report date. |
| 3 | As stated in the prospectus. |

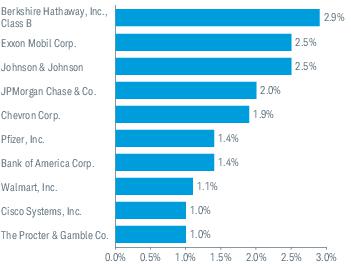
| 1 | Excludes derivatives. |
| 2 | Portfolio turnover rate excludes in-kind transactions. |
| 3 | The percentage may differ from the Portfolio Holdings because the above calculation is based on a percentage of total investments, excluding derivatives, whereas the calculation in the Portfolio Holdings is based on a percentage of net assets. |
| 4 | This list is not a recommendation of any security by the investment adviser. |
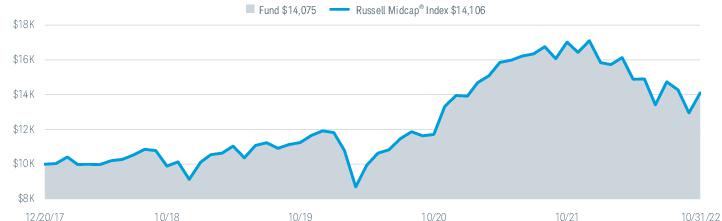
| Fund and Inception Date | 1 Year | 3 Years | Since Inception |
| Fund: Schwab U.S. Mid-Cap Index Fund (12/20/17) | -17.15% | 7.81% | 7.28% |
| Russell Midcap® Index | -17.17% | 7.84% | 7.33% |
| Fund Category: Morningstar Mid-Cap Blend2 | -12.33% | 8.05% | N/A |
| Fund Expense Ratio3: 0.04% | |||
| 1 | Performance does not reflect the deduction of taxes that a shareholder would pay on fund distributions or the redemption of fund shares. |
| 2 | Source for category information: Morningstar, Inc. The Morningstar Category return represents all active and index mutual funds and ETFs within the category as of the report date. |
| 3 | As stated in the prospectus. |
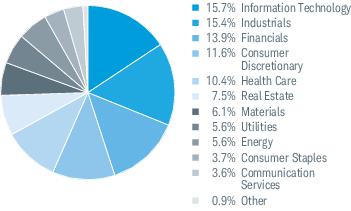

| 1 | Excludes derivatives. |
| 2 | Portfolio turnover rate excludes in-kind transactions. |
| 3 | The percentage may differ from the Portfolio Holdings because the above calculation is based on a percentage of total investments, excluding derivatives, whereas the calculation in the Portfolio Holdings is based on a percentage of net assets. |
| 4 | This list is not a recommendation of any security by the investment adviser. |
| 1 | The total return cited for the index reflects reinvested dividends net of withholding taxes but reflects no deductions for expenses or other taxes. |
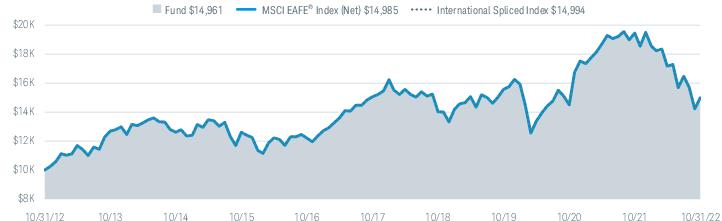
| Fund and Inception Date | 1 Year | 5 Years | 10 Years |
| Fund: Schwab International Index Fund (5/19/97) | -23.12% | -0.07% | 4.11% |
| MSCI EAFE® Index (Net)3 | -23.00% | -0.09% | 4.13% |
| International Spliced Index | -23.00% | -0.09% | 4.13% |
| Fund Category: Morningstar Foreign Large Blend4 | -24.04% | -0.51% | 3.75% |
| Fund Expense Ratio5: 0.06% | |||
| 1 | Performance does not reflect the deduction of taxes that a shareholder would pay on fund distributions or the redemption of fund shares. |
| 2 | The fund’s performance relative to the index may be affected by fair-value pricing. See financial note 2 for more information. |
| 3 | The net version of the index reflects reinvested dividends net of withholding taxes but reflects no deductions for expenses or other taxes. |
| 4 | Source for category information: Morningstar, Inc. The Morningstar Category return represents all active and index mutual funds and ETFs within the category as of the report date. |
| 5 | As stated in the prospectus. |
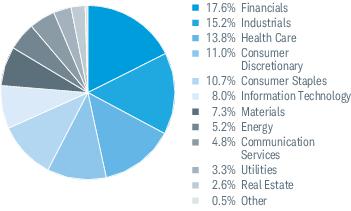

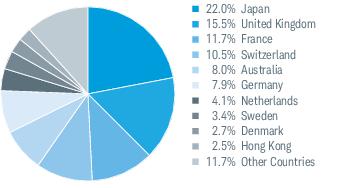
| 1 | Excludes derivatives. |
| 2 | This list is not a recommendation of any security by the investment adviser. |
| 3 | The percentage may differ from the Portfolio Holdings because the above calculation is based on a percentage of total investments, excluding derivatives, whereas the calculation in the Portfolio Holdings is based on a percentage of net assets. |
| EXPENSE
RATIO (ANNUALIZED) 1 |
BEGINNING
ACCOUNT VALUE AT 5/1/22 |
ENDING
ACCOUNT VALUE (NET OF EXPENSES) AT 10/31/22 |
EXPENSES
PAID DURING PERIOD 5/1/22-10/31/22 2 | |
| Schwab S&P 500 Index Fund | ||||
| Actual Return | 0.02% | $1,000.00 | $ 944.90 | $0.10 |
| Hypothetical 5% Return | 0.02% | $1,000.00 | $1,025.10 | $0.10 |
| Schwab 1000 Index Fund | ||||
| Actual Return | 0.05% | $1,000.00 | $ 941.70 | $0.24 |
| Hypothetical 5% Return | 0.05% | $1,000.00 | $1,024.95 | $0.26 |
| Schwab Small-Cap Index Fund | ||||
| Actual Return | 0.04% | $1,000.00 | $ 998.00 | $0.20 |
| Hypothetical 5% Return | 0.04% | $1,000.00 | $1,025.00 | $0.20 |
| Schwab Total Stock Market Index Fund | ||||
| Actual Return | 0.03% | $1,000.00 | $ 943.50 | $0.15 |
| Hypothetical 5% Return | 0.03% | $1,000.00 | $1,025.05 | $0.15 |
| Schwab U.S. Large-Cap Growth Index Fund | ||||
| Actual Return | 0.035% | $1,000.00 | $ 917.50 | $0.17 |
| Hypothetical 5% Return | 0.035% | $1,000.00 | $1,025.03 | $0.18 |
| Schwab U.S. Large-Cap Value Index Fund | ||||
| Actual Return | 0.035% | $1,000.00 | $ 967.80 | $0.17 |
| Hypothetical 5% Return | 0.035% | $1,000.00 | $1,025.03 | $0.18 |
| Schwab U.S. Mid-Cap Index Fund | ||||
| Actual Return | 0.04% | $1,000.00 | $ 947.20 | $0.20 |
| Hypothetical 5% Return | 0.04% | $1,000.00 | $1,025.00 | $0.20 |
| Schwab International Index Fund | ||||
| Actual Return | 0.06% | $1,000.00 | $ 881.20 | $0.28 |
| Hypothetical 5% Return | 0.06% | $1,000.00 | $1,024.90 | $0.31 |
| 1 | Based on the most recent six-month expense ratio. |
| 2 | Expenses for each fund are equal to its annualized expense ratio, multiplied by the average account value over the period, multiplied by the 184 days of the period, and divided by the 365 days of the fiscal year. |
| 11/1/21–
10/31/22 |
11/1/20–
10/31/21 |
11/1/19–
10/31/20 |
11/1/18–
10/31/19 |
11/1/17–
10/31/18 |
||
| Per-Share Data | ||||||
| Net asset value at beginning of period | $71.21 | $50.75 | $47.17 | $42.41 | $40.23 | |
| Income (loss) from investment operations: | ||||||
| Net investment income (loss)1 | 0.97 | 0.90 | 1.02 | 0.92 | 0.80 | |
| Net realized and unrealized gains (losses) | (11.23) | 20.60 | 3.52 | 4.86 | 2.12 | |
| Total from investment operations | (10.26) | 21.50 | 4.54 | 5.78 | 2.92 | |
| Less distributions: | ||||||
| Distributions from net investment income | (0.86) | (1.04) | (0.87) | (0.84) | (0.72) | |
| Distributions from net realized gains | (0.07) | — | (0.09) | (0.18) | (0.02) | |
| Total distributions | (0.93) | (1.04) | (0.96) | (1.02) | (0.74) | |
| Net asset value at end of period | $60.02 | $71.21 | $50.75 | $47.17 | $42.41 | |
| Total return | (14.63%) | 42.89% | 9.69% | 14.30% | 7.29% | |
| Ratios/Supplemental Data | ||||||
| Ratios to average net assets: | ||||||
| Total expenses | 0.02% 2 | 0.02% | 0.02% | 0.02% 3 | 0.03% | |
| Net investment income (loss) | 1.49% | 1.42% | 2.11% | 2.11% | 1.88% | |
| Portfolio turnover rate | 2% | 3% | 4% | 3% | 2% | |
| Net assets, end of period (x 1,000,000) | $61,068 | $67,401 | $44,184 | $40,232 | $34,410 | |
| 1 | Calculated based on the average shares outstanding during the period. |
| 2 | Ratio includes less than 0.005% of non-routine proxy expenses. |
| 3 | Effective December 20, 2018, the annual operating expense ratio was reduced to 0.02%. The ratio presented for period ended 10/31/19 is a blended ratio. |
| SECURITY | VALUE
AT 10/31/21 |
PURCHASES | SALES | REALIZED
GAINS (LOSSES) |
NET
CHANGE IN UNREALIZED APPRECIATION (DEPRECIATION) |
VALUE
AT 10/31/22 |
BALANCE
OF SHARES HELD AT 10/31/22 |
DIVIDENDS
RECEIVED |
| COMMON STOCKS 0.4% OF NET ASSETS | ||||||||
| Diversified Financials 0.4% | ||||||||
| The Charles Schwab Corp. | $210,537,870 | $21,918,562 | ($445,373) | ($5,215) | ($5,452,567) | $226,553,277 | 2,843,646 | $2,159,346 |
| DESCRIPTION | QUOTED
PRICES IN ACTIVE MARKETS FOR IDENTICAL ASSETS (LEVEL 1) |
OTHER
SIGNIFICANT OBSERVABLE INPUTS (LEVEL 2) |
SIGNIFICANT
UNOBSERVABLE INPUTS (LEVEL 3) |
TOTAL |
| Assets | ||||
| Common Stocks1 | $60,838,061,696 | $— | $— | $60,838,061,696 |
| Futures Contracts2 | 8,073,980 | — | — | 8,073,980 |
| Total | $60,846,135,676 | $— | $— | $60,846,135,676 |
| 1 | As categorized in the Portfolio Holdings. |
| 2 | Futures contracts are reported at cumulative unrealized appreciation or depreciation. |
| Assets | ||
| Investments in securities, at value - affiliated (cost $92,203,920) | $226,553,277 | |
| Investments in securities, at value - unaffiliated (cost $30,023,057,512) | 60,611,508,419 | |
| Cash | 344,194,263 | |
| Deposit with broker for futures contracts | 18,900,000 | |
| Receivables: | ||
| Fund shares sold | 59,214,222 | |
| Dividends | 44,815,579 | |
| Income from securities on loan | + | 1,200 |
| Total assets | 61,305,186,960 | |
| Liabilities | ||
| Payables: | ||
| Investments bought | 152,291,357 | |
| Fund shares redeemed | 82,061,073 | |
| Variation margin on futures contracts | 1,560,103 | |
| Investment adviser fees | + | 930,633 |
| Total liabilities | 236,843,166 | |
| Net assets | $61,068,343,794 | |
| Net Assets by Source | ||
| Capital received from investors | $30,062,293,837 | |
| Total distributable earnings | + | 31,006,049,957 |
| Net assets | $61,068,343,794 | |
| Net Asset Value (NAV) | ||||
| Net Assets | ÷ | Shares
Outstanding |
= | NAV |
| $61,068,343,794 | 1,017,497,203 | $60.02 | ||
| For the period November 1, 2021 through October 31, 2022 | ||
| Investment Income | ||
| Dividends received from securities - unaffiliated (net of foreign withholding tax of $222,410) | $977,922,706 | |
| Dividends received from securities - affiliated | 2,159,346 | |
| Interest received from securities - unaffiliated | 1,283,070 | |
| Securities on loan, net | + | 22,236 |
| Total investment income | 981,387,358 | |
| Expenses | ||
| Investment adviser fees | 12,965,469 | |
| Proxy fees1 | + | 1,474,631 |
| Total expenses | – | 14,440,100 |
| Net investment income | 966,947,258 | |
| REALIZED AND UNREALIZED GAINS (LOSSES) | ||
| Net realized losses on sales of securities - affiliated | (5,215) | |
| Net realized losses on sales of securities - unaffiliated | (116,133,262) | |
| Net realized losses on futures contracts | + | (46,274,693) |
| Net realized losses | (162,413,170) | |
| Net change in unrealized appreciation (depreciation) on securities - affiliated | (5,452,567) | |
| Net change in unrealized appreciation (depreciation) on securities - unaffiliated | (11,085,028,625) | |
| Net change in unrealized appreciation (depreciation) on futures contracts | + | (6,755,572) |
| Net change in unrealized appreciation (depreciation) | + | (11,097,236,764) |
| Net realized and unrealized losses | (11,259,649,934) | |
| Decrease in net assets resulting from operations | ($10,292,702,676) | |
| 1 | Proxy fees are non-routine expenses (see financial note 2(e) for additional information). |
| OPERATIONS | |||
| 11/1/21-10/31/22 | 11/1/20-10/31/21 | ||
| Net investment income | $966,947,258 | $819,770,960 | |
| Net realized gains (losses) | (162,413,170) | 171,562,608 | |
| Net change in unrealized appreciation (depreciation) | + | (11,097,236,764) | 18,463,816,059 |
| Increase (decrease) in net assets resulting from operations | ($10,292,702,676) | $19,455,149,627 | |
| DISTRIBUTIONS TO SHAREHOLDERS | |||
| Total distributions | ($892,809,698) | ($913,293,066) | |
| TRANSACTIONS IN FUND SHARES | |||||
| 11/1/21-10/31/22 | 11/1/20-10/31/21 | ||||
| SHARES | VALUE | SHARES | VALUE | ||
| Shares sold | 210,459,089 | $13,861,852,248 | 196,724,074 | $12,273,054,924 | |
| Shares reinvested | 10,113,772 | 728,899,804 | 13,207,873 | 748,622,260 | |
| Shares redeemed | + | (149,593,128) | (9,738,121,330) | (133,977,878) | (8,346,566,792) |
| Net transactions in fund shares | 70,979,733 | $4,852,630,722 | 75,954,069 | $4,675,110,392 | |
| SHARES OUTSTANDING AND NET ASSETS | |||||
| 11/1/21-10/31/22 | 11/1/20-10/31/21 | ||||
| SHARES | NET ASSETS | SHARES | NET ASSETS | ||
| Beginning of period | 946,517,470 | $67,401,225,446 | 870,563,401 | $44,184,258,493 | |
| Total increase (decrease) | + | 70,979,733 | (6,332,881,652) | 75,954,069 | 23,216,966,953 |
| End of period | 1,017,497,203 | $61,068,343,794 | 946,517,470 | $67,401,225,446 | |
| 11/1/21–
10/31/22 |
11/1/20–
10/31/21 |
11/1/19–
10/31/20 |
11/1/18–
10/31/19 |
11/1/17–
10/31/18 |
||
| Per-Share Data | ||||||
| Net asset value at beginning of period | $102.69 | $73.73 | $68.68 | $64.19 | $62.61 | |
| Income (loss) from investment operations: | ||||||
| Net investment income (loss)1 | 1.29 | 1.24 | 1.38 | 1.38 | 1.18 | |
| Net realized and unrealized gains (losses) | (18.14) | 30.02 | 5.81 | 6.73 | 3.05 | |
| Total from investment operations | (16.85) | 31.26 | 7.19 | 8.11 | 4.23 | |
| Less distributions: | ||||||
| Distributions from net investment income | (1.23) | (1.42) | (1.29) | (1.28) | (1.10) | |
| Distributions from net realized gains | (0.58) | (0.88) | (0.85) | (2.34) | (1.55) | |
| Total distributions | (1.81) | (2.30) | (2.14) | (3.62) | (2.65) | |
| Net asset value at end of period | $84.03 | $102.69 | $73.73 | $68.68 | $64.19 | |
| Total return | (16.73%) | 43.16% | 10.60% | 14.20% | 6.84% | |
| Ratios/Supplemental Data | ||||||
| Ratios to average net assets: | ||||||
| Total expenses | 0.05% 2 | 0.05% | 0.05% | 0.05% | 0.05% | |
| Net investment income (loss) | 1.40% | 1.36% | 1.97% | 2.15% | 1.82% | |
| Portfolio turnover rate | 2% 3 | 5% 3 | 4% | 5% | 4% | |
| Net assets, end of period (x 1,000,000) | $11,888 | $14,222 | $9,774 | $9,346 | $7,909 | |
| 1 | Calculated based on the average shares outstanding during the period. |
| 2 | Ratio includes less than 0.005% of non-routine proxy expenses. |
| 3 | Portfolio turnover rate excludes in-kind transactions. |
| SECURITY | VALUE
AT 10/31/21 |
PURCHASES | SALES | REALIZED
GAINS (LOSSES) |
NET
CHANGE IN UNREALIZED APPRECIATION (DEPRECIATION) |
VALUE
AT 10/31/22 |
BALANCE
OF SHARES HELD AT 10/31/22 |
DIVIDENDS
RECEIVED |
| COMMON STOCKS 0.3% OF NET ASSETS | ||||||||
| Diversified Financials 0.3% | ||||||||
| The Charles Schwab Corp. | $39,021,425 | $1,641,146 | ($162,866) | ($27,508) | ($940,182) | $39,532,015 | 496,197 | $385,674 |
| DESCRIPTION | QUOTED
PRICES IN ACTIVE MARKETS FOR IDENTICAL ASSETS (LEVEL 1) |
OTHER
SIGNIFICANT OBSERVABLE INPUTS (LEVEL 2) |
SIGNIFICANT
UNOBSERVABLE INPUTS (LEVEL 3) |
TOTAL |
| Assets | ||||
| Common Stocks1 | $11,831,294,018 | $— | $— | $11,831,294,018 |
| Short-Term Investments1 | 67,464,072 | — | — | 67,464,072 |
| Futures Contracts2 | 1,748,573 | — | — | 1,748,573 |
| Total | $11,900,506,663 | $— | $— | $11,900,506,663 |
| 1 | As categorized in the Portfolio Holdings. |
| 2 | Futures contracts are reported at cumulative unrealized appreciation or depreciation. |
| Assets | ||
| Investments in securities, at value - affiliated (cost $5,291,952) | $39,532,015 | |
| Investments in securities, at value - unaffiliated (cost $3,352,431,357) including securities on loan of $10,725,058 | 11,859,226,075 | |
| Cash | 11,867,524 | |
| Deposit with broker for futures contracts | 3,660,000 | |
| Receivables: | ||
| Dividends | 8,976,097 | |
| Fund shares sold | 6,691,489 | |
| Income from securities on loan | + | 52,724 |
| Total assets | 11,930,005,924 | |
| Liabilities | ||
| Collateral held for securities on loan | 11,148,600 | |
| Payables: | ||
| Investments bought | 22,467,303 | |
| Fund shares redeemed | 7,521,166 | |
| Investment adviser fees | 453,248 | |
| Variation margin on futures contracts | + | 311,463 |
| Total liabilities | 41,901,780 | |
| Net assets | $11,888,104,144 | |
| Net Assets by Source | ||
| Capital received from investors | $3,281,992,498 | |
| Total distributable earnings | + | 8,606,111,646 |
| Net assets | $11,888,104,144 | |
| Net Asset Value (NAV) | ||||
| Net Assets | ÷ | Shares
Outstanding |
= | NAV |
| $11,888,104,144 | 141,466,820 | $84.03 | ||
| For the period November 1, 2021 through October 31, 2022 | ||
| Investment Income | ||
| Dividends received from securities - unaffiliated (net of foreign withholding tax of $45,162) | $187,505,742 | |
| Dividends received from securities - affiliated | 385,674 | |
| Securities on loan, net | + | 509,697 |
| Total investment income | 188,401,113 | |
| Expenses | ||
| Investment adviser fees | 6,461,785 | |
| Proxy fees1 | + | 594,498 |
| Total expenses | – | 7,056,283 |
| Net investment income | 181,344,830 | |
| REALIZED AND UNREALIZED GAINS (LOSSES) | ||
| Net realized losses on sales of securities - affiliated | (27,508) | |
| Net realized losses on sales of securities - unaffiliated | (83,154,477) | |
| Net realized gains on sales of in-kind redemptions - unaffiliated | 118,772,535 | |
| Net realized losses on futures contracts | + | (10,990,124) |
| Net realized gains | 24,600,426 | |
| Net change in unrealized appreciation (depreciation) on securities - affiliated | (940,182) | |
| Net change in unrealized appreciation (depreciation) on securities - unaffiliated | (2,587,358,510) | |
| Net change in unrealized appreciation (depreciation) on futures contracts | + | (344,068) |
| Net change in unrealized appreciation (depreciation) | + | (2,588,642,760) |
| Net realized and unrealized losses | (2,564,042,334) | |
| Decrease in net assets resulting from operations | ($2,382,697,504) | |
| 1 | Proxy fees are non-routine expenses (see financial note 2(e) for additional information). |
| OPERATIONS | |||
| 11/1/21-10/31/22 | 11/1/20-10/31/21 | ||
| Net investment income | $181,344,830 | $171,096,348 | |
| Net realized gains | 24,600,426 | 158,449,688 | |
| Net change in unrealized appreciation (depreciation) | + | (2,588,642,760) | 3,932,270,152 |
| Increase (decrease) in net assets resulting from operations | ($2,382,697,504) | $4,261,816,188 | |
| DISTRIBUTIONS TO SHAREHOLDERS | |||
| Total distributions | ($249,966,849) | ($306,286,999) | |
| TRANSACTIONS IN FUND SHARES | |||||
| 11/1/21-10/31/22 | 11/1/20-10/31/21 | ||||
| SHARES | VALUE | SHARES | VALUE | ||
| Shares sold | 15,172,044 | $1,385,599,712 | 15,568,422 | $1,394,601,301 | |
| Shares reinvested | 1,982,815 | 202,881,568 | 3,026,807 | 250,256,414 | |
| Shares redeemed | + | (14,187,727) | (1,289,927,639) | (12,663,564) | (1,152,112,463) |
| Net transactions in fund shares | 2,967,132 | $298,553,641 | 5,931,665 | $492,745,252 | |
| SHARES OUTSTANDING AND NET ASSETS | |||||
| 11/1/21-10/31/22 | 11/1/20-10/31/21 | ||||
| SHARES | NET ASSETS | SHARES | NET ASSETS | ||
| Beginning of period | 138,499,688 | $14,222,214,856 | 132,568,023 | $9,773,940,415 | |
| Total increase (decrease) | + | 2,967,132 | (2,334,110,712) | 5,931,665 | 4,448,274,441 |
| End of period | 141,466,820 | $11,888,104,144 | 138,499,688 | $14,222,214,856 | |
| 11/1/21–
10/31/22 |
11/1/20–
10/31/21 |
11/1/19–
10/31/20 |
11/1/18–
10/31/19 |
11/1/17–
10/31/18 |
||
| Per-Share Data | ||||||
| Net asset value at beginning of period | $39.97 | $27.18 | $28.84 | $30.48 | $31.45 | |
| Income (loss) from investment operations: | ||||||
| Net investment income (loss)1 | 0.40 | 0.37 | 0.35 | 0.40 | 0.43 | |
| Net realized and unrealized gains (losses) | (7.31) | 13.29 | (0.23) | 0.54 | 0.20 | |
| Total from investment operations | (6.91) | 13.66 | 0.12 | 0.94 | 0.63 | |
| Less distributions: | ||||||
| Distributions from net investment income | (0.42) | (0.38) | (0.42) | (0.40) | (0.39) | |
| Distributions from net realized gains | (2.77) | (0.49) | (1.36) | (2.18) | (1.21) | |
| Total distributions | (3.19) | (0.87) | (1.78) | (2.58) | (1.60) | |
| Net asset value at end of period | $29.87 | $39.97 | $27.18 | $28.84 | $30.48 | |
| Total return | (18.53%) | 50.82% | 0.00% | 4.95% | 1.93% | |
| Ratios/Supplemental Data | ||||||
| Ratios to average net assets: | ||||||
| Total expenses | 0.04% 2 | 0.04% | 0.04% | 0.04% 3 | 0.05% | |
| Net investment income (loss) | 1.25% | 0.98% | 1.31% | 1.43% | 1.33% | |
| Portfolio turnover rate | 16% 4 | 19% 4 | 21% | 14% | 17% | |
| Net assets, end of period (x 1,000,000) | $5,372 | $6,587 | $3,988 | $4,187 | $3,874 | |
| 1 | Calculated based on the average shares outstanding during the period. |
| 2 | Ratio includes less than 0.005% of non-routine proxy expenses. |
| 3 | Effective December 20, 2018, the annual operating expense ratio was reduced to 0.04%. The ratio presented for period ended 10/31/19 is a blended ratio. |
| 4 | Portfolio turnover rate excludes in-kind transactions. |
| DESCRIPTION | QUOTED
PRICES IN ACTIVE MARKETS FOR IDENTICAL ASSETS (LEVEL 1) |
OTHER
SIGNIFICANT OBSERVABLE INPUTS (LEVEL 2) |
SIGNIFICANT
UNOBSERVABLE INPUTS (LEVEL 3) |
TOTAL |
| Assets | ||||
| Common Stocks1 | $5,135,228,646 | $— | $— | $5,135,228,646 |
| Materials | 223,111,763 | — | 0* | 223,111,763 |
| Rights 1 | ||||
| Pharmaceuticals, Biotechnology & Life Sciences | — | — | 303,623 | 303,623 |
| Short-Term Investments1 | 125,060,461 | — | — | 125,060,461 |
| Futures Contracts2 | 276,685 | — | — | 276,685 |
| Total | $5,483,677,555 | $— | $303,623 | $5,483,981,178 |
| * | Level 3 amount shown includes securities determined to have no value at October 31, 2022. |
| 1 | As categorized in the Portfolio Holdings. |
| 2 | Futures contracts are reported at cumulative unrealized appreciation or depreciation. |
| Assets | ||
| Investments in securities, at value - unaffiliated (cost $4,410,679,628) including securities on loan of $119,230,437 | $5,483,704,493 | |
| Cash | 16,883,257 | |
| Deposit with broker for futures contracts | 962,500 | |
| Receivables: | ||
| Fund shares sold | 6,691,790 | |
| Dividends | 1,723,532 | |
| Investments sold | 903,248 | |
| Income from securities on loan | 610,370 | |
| Interest | 41,683 | |
| Variation margin on future contracts | 10,253 | |
| Foreign tax reclaims | + | 994 |
| Total assets | 5,511,532,120 | |
| Liabilities | ||
| Collateral held for securities on loan | 125,060,461 | |
| Payables: | ||
| Fund shares redeemed | 13,158,404 | |
| Investments bought | 1,422,337 | |
| Investment adviser fees | + | 161,725 |
| Total liabilities | 139,802,927 | |
| Net assets | $5,371,729,193 | |
| Net Assets by Source | ||
| Capital received from investors | $4,549,585,969 | |
| Total distributable earnings | + | 822,143,224 |
| Net assets | $5,371,729,193 | |
| Net Asset Value (NAV) | ||||
| Net Assets | ÷ | Shares
Outstanding |
= | NAV |
| $5,371,729,193 | 179,817,041 | $29.87 | ||
| For the period November 1, 2021 through October 31, 2022 | ||
| Investment Income | ||
| Dividends received from securities - unaffiliated (net of foreign withholding tax of $104,449) | $69,425,348 | |
| Interest received from securities - unaffiliated | 138,495 | |
| Securities on loan, net | + | 5,109,502 |
| Total investment income | 74,673,345 | |
| Expenses | ||
| Investment adviser fees | 2,306,027 | |
| Proxy fees1 | + | 265,829 |
| Total expenses | – | 2,571,856 |
| Net investment income | 72,101,489 | |
| REALIZED AND UNREALIZED GAINS (LOSSES) | ||
| Net realized losses on sales of securities - unaffiliated | (133,054,315) | |
| Net realized gains on sales of in-kind redemptions - unaffiliated | 121,547,069 | |
| Net realized losses on futures contracts | + | (5,981,747) |
| Net realized losses | (17,488,993) | |
| Net change in unrealized appreciation (depreciation) on securities - unaffiliated | (1,287,117,071) | |
| Net change in unrealized appreciation (depreciation) on futures contracts | + | (179,482) |
| Net change in unrealized appreciation (depreciation) | + | (1,287,296,553) |
| Net realized and unrealized losses | (1,304,785,546) | |
| Decrease in net assets resulting from operations | ($1,232,684,057) | |
| 1 | Proxy fees are non-routine expenses (see financial note 2(e) for additional information). |
| OPERATIONS | |||
| 11/1/21-10/31/22 | 11/1/20-10/31/21 | ||
| Net investment income | $72,101,489 | $58,753,702 | |
| Net realized gains (losses) | (17,488,993) | 428,156,754 | |
| Net change in unrealized appreciation (depreciation) | + | (1,287,296,553) | 1,575,126,021 |
| Increase (decrease) in net assets resulting from operations | ($1,232,684,057) | $2,062,036,477 | |
| DISTRIBUTIONS TO SHAREHOLDERS | |||
| Total distributions | ($531,629,821) | ($129,889,789) | |
| TRANSACTIONS IN FUND SHARES | |||||
| 11/1/21-10/31/22 | 11/1/20-10/31/21 | ||||
| SHARES | VALUE | SHARES | VALUE | ||
| Shares sold | 45,597,167 | $1,444,544,971 | 42,300,482 | $1,579,406,837 | |
| Shares reinvested | 12,345,025 | 436,396,621 | 3,127,037 | 106,319,237 | |
| Shares redeemed | + | (42,926,031) | (1,331,894,500) | (27,339,753) | (1,019,048,338) |
| Net transactions in fund shares | 15,016,161 | $549,047,092 | 18,087,766 | $666,677,736 | |
| SHARES OUTSTANDING AND NET ASSETS | |||||
| 11/1/21-10/31/22 | 11/1/20-10/31/21 | ||||
| SHARES | NET ASSETS | SHARES | NET ASSETS | ||
| Beginning of period | 164,800,880 | $6,586,995,979 | 146,713,114 | $3,988,171,555 | |
| Total increase (decrease) | + | 15,016,161 | (1,215,266,786) | 18,087,766 | 2,598,824,424 |
| End of period | 179,817,041 | $5,371,729,193 | 164,800,880 | $6,586,995,979 | |
| 11/1/21–
10/31/22 |
11/1/20–
10/31/21 |
11/1/19–
10/31/20 |
11/1/18–
10/31/19 |
11/1/17–
10/31/18 |
||
| Per-Share Data | ||||||
| Net asset value at beginning of period | $81.64 | $57.62 | $53.42 | $48.38 | $46.25 | |
| Income (loss) from investment operations: | ||||||
| Net investment income (loss)1 | 1.05 | 1.00 | 1.07 | 0.99 | 0.88 | |
| Net realized and unrealized gains (losses) | (14.67) | 24.10 | 4.21 | 5.18 | 2.12 | |
| Total from investment operations | (13.62) | 25.10 | 5.28 | 6.17 | 3.00 | |
| Less distributions: | ||||||
| Distributions from net investment income | (0.96) | (1.08) | (0.94) | (0.90) | (0.76) | |
| Distributions from net realized gains | (0.24) | — | (0.14) | (0.23) | (0.11) | |
| Total distributions | (1.20) | (1.08) | (1.08) | (1.13) | (0.87) | |
| Net asset value at end of period | $66.82 | $81.64 | $57.62 | $53.42 | $48.38 | |
| Total return | (16.94%) | 44.01% | 9.94% | 13.37% | 6.51% | |
| Ratios/Supplemental Data | ||||||
| Ratios to average net assets: | ||||||
| Total expenses | 0.03% 2 | 0.03% | 0.03% | 0.03% | 0.03% | |
| Net investment income (loss) | 1.44% | 1.37% | 1.96% | 1.99% | 1.80% | |
| Portfolio turnover rate | 2% | 3% | 4% | 3% | 4% | |
| Net assets, end of period (x 1,000,000) | $16,046 | $18,232 | $11,487 | $10,220 | $8,410 | |
| 1 | Calculated based on the average shares outstanding during the period. |
| 2 | Ratio includes less than 0.005% of non-routine proxy expenses. |
| SECURITY | VALUE
AT 10/31/21 |
PURCHASES | SALES | REALIZED
GAINS (LOSSES) |
NET
CHANGE IN UNREALIZED APPRECIATION (DEPRECIATION) |
VALUE
AT 10/31/22 |
BALANCE
OF SHARES HELD AT 10/31/22 |
DIVIDENDS
RECEIVED |
| COMMON STOCKS 0.3% OF NET ASSETS | ||||||||
| Diversified Financials 0.3% | ||||||||
| The Charles Schwab Corp. | $46,634,301 | $4,717,931 | $— | $— | ($1,149,217) | $50,203,015 | 630,137 | $476,594 |
| DESCRIPTION | QUOTED
PRICES IN ACTIVE MARKETS FOR IDENTICAL ASSETS (LEVEL 1) |
OTHER
SIGNIFICANT OBSERVABLE INPUTS (LEVEL 2) |
SIGNIFICANT
UNOBSERVABLE INPUTS (LEVEL 3) |
TOTAL |
| Assets | ||||
| Common Stocks1 | $15,110,337,328 | $— | $— | $15,110,337,328 |
| Automobiles & Components | 352,285,243 | — | 16,736 | 352,301,979 |
| Real Estate | 516,473,837 | — | 0* | 516,473,837 |
| Preferred Stocks1 | ||||
| Software & Services | — | — | 587 | 587 |
| Rights 1 | ||||
| Consumer Durables & Apparel | — | — | 720 | 720 |
| Pharmaceuticals, Biotechnology & Life Sciences | — | — | 11,131 | 11,131 |
| Short-Term Investments1 | 41,672,354 | — | — | 41,672,354 |
| Futures Contracts2 | 2,948,251 | — | — | 2,948,251 |
| Total | $16,023,717,013 | $— | $29,174 | $16,023,746,187 |
| * | Level 3 amount shown includes securities determined to have no value at October 31, 2022. |
| 1 | As categorized in the Portfolio Holdings. |
| 2 | Futures contracts are reported at cumulative unrealized appreciation or depreciation. |
| Assets | ||
| Investments in securities, at value - affiliated (cost $23,776,365) | $50,203,015 | |
| Investments in securities, at value - unaffiliated (cost $9,431,852,935) including securities on loan of $39,625,164 | 15,970,594,921 | |
| Cash | 64,521,734 | |
| Deposit with broker for futures contracts | 3,647,001 | |
| Receivables: | ||
| Fund shares sold | 13,880,553 | |
| Dividends | 11,576,025 | |
| Income from securities on loan | + | 234,103 |
| Total assets | 16,114,657,352 | |
| Liabilities | ||
| Collateral held for securities on loan | 41,672,354 | |
| Payables: | ||
| Fund shares redeemed | 26,045,127 | |
| Variation margin on futures contracts | 375,495 | |
| Investment adviser fees | + | 366,711 |
| Total liabilities | 68,459,687 | |
| Net assets | $16,046,197,665 | |
| Net Assets by Source | ||
| Capital received from investors | $9,456,152,539 | |
| Total distributable earnings | + | 6,590,045,126 |
| Net assets | $16,046,197,665 | |
| Net Asset Value (NAV) | ||||
| Net Assets | ÷ | Shares
Outstanding |
= | NAV |
| $16,046,197,665 | 240,127,163 | $66.82 | ||
| For the period November 1, 2021 through October 31, 2022 | ||
| Investment Income | ||
| Dividends received from securities - unaffiliated (net of foreign withholding tax of $61,432) | $247,713,044 | |
| Dividends received from securities - affiliated | 476,594 | |
| Interest received from securities - unaffiliated | 312,974 | |
| Securities on loan, net | + | 2,824,819 |
| Total investment income | 251,327,431 | |
| Expenses | ||
| Investment adviser fees | 5,132,595 | |
| Proxy fees1 | + | 431,115 |
| Total expenses | – | 5,563,710 |
| Net investment income | 245,763,721 | |
| REALIZED AND UNREALIZED GAINS (LOSSES) | ||
| Net realized losses on sales of securities - unaffiliated | (50,051,270) | |
| Net realized losses on futures contracts | + | (12,721,600) |
| Net realized losses | (62,772,870) | |
| Net change in unrealized appreciation (depreciation) on securities - affiliated | (1,149,217) | |
| Net change in unrealized appreciation (depreciation) on securities - unaffiliated | (3,392,134,174) | |
| Net change in unrealized appreciation (depreciation) on futures contracts | + | (296,828) |
| Net change in unrealized appreciation (depreciation) | + | (3,393,580,219) |
| Net realized and unrealized losses | (3,456,353,089) | |
| Decrease in net assets resulting from operations | ($3,210,589,368) | |
| 1 | Proxy fees are non-routine expenses (see financial note 2(e) for additional information). |
| OPERATIONS | |||
| 11/1/21-10/31/22 | 11/1/20-10/31/21 | ||
| Net investment income | $245,763,721 | $213,096,831 | |
| Net realized gains (losses) | (62,772,870) | 34,732,921 | |
| Net change in unrealized appreciation (depreciation) | + | (3,393,580,219) | 5,009,497,999 |
| Increase (decrease) in net assets resulting from operations | ($3,210,589,368) | $5,257,327,751 | |
| DISTRIBUTIONS TO SHAREHOLDERS | |||
| Total distributions | ($271,189,903) | ($218,157,695) | |
| TRANSACTIONS IN FUND SHARES | |||||
| 11/1/21-10/31/22 | 11/1/20-10/31/21 | ||||
| SHARES | VALUE | SHARES | VALUE | ||
| Shares sold | 42,748,598 | $3,156,883,859 | 45,495,323 | $3,270,028,626 | |
| Shares reinvested | 2,402,741 | 195,366,859 | 2,374,705 | 156,303,072 | |
| Shares redeemed | + | (28,345,522) | (2,055,951,707) | (23,925,141) | (1,721,261,599) |
| Net transactions in fund shares | 16,805,817 | $1,296,299,011 | 23,944,887 | $1,705,070,099 | |
| SHARES OUTSTANDING AND NET ASSETS | |||||
| 11/1/21-10/31/22 | 11/1/20-10/31/21 | ||||
| SHARES | NET ASSETS | SHARES | NET ASSETS | ||
| Beginning of period | 223,321,346 | $18,231,677,925 | 199,376,459 | $11,487,437,770 | |
| Total increase (decrease) | + | 16,805,817 | (2,185,480,260) | 23,944,887 | 6,744,240,155 |
| End of period | 240,127,163 | $16,046,197,665 | 223,321,346 | $18,231,677,925 | |
| 11/1/21–
10/31/22 |
11/1/20–
10/31/21 |
11/1/19–
10/31/20 |
11/1/18–
10/31/19 |
12/20/17
1– 10/31/18 |
||
| Per-Share Data | ||||||
| Net asset value at beginning of period | $89.23 | $62.76 | $49.06 | $42.37 | $40.00 | |
| Income (loss) from investment operations: | ||||||
| Net investment income (loss)2 | 0.64 | 0.56 | 0.55 | 0.57 | 0.46 | |
| Net realized and unrealized gains (losses) | (22.20) | 26.39 | 13.65 | 6.52 | 1.91 3 | |
| Total from investment operations | (21.56) | 26.95 | 14.20 | 7.09 | 2.37 | |
| Less distributions: | ||||||
| Distributions from net investment income | (0.51) | (0.48) | (0.50) | (0.40) | — | |
| Distributions from net realized gains | (1.07) | — | — | — | — | |
| Total distributions | (1.58) | (0.48) | (0.50) | (0.40) | — | |
| Net asset value at end of period | $66.09 | $89.23 | $62.76 | $49.06 | $42.37 | |
| Total return | (24.63%) | 43.14% | 29.16% | 17.04% | 5.93% 4 | |
| Ratios/Supplemental Data | ||||||
| Ratios to average net assets: | ||||||
| Total expenses | 0.035% 5 | 0.035% | 0.035% | 0.035% 6 | 0.040% 7,8 | |
| Net operating expenses | N/A | N/A | N/A | N/A | 0.02% 7,8 | |
| Net investment income (loss) | 0.86% | 0.73% | 0.97% | 1.27% | 1.23% 7 | |
| Portfolio turnover rate | 18% | 18% | 41% | 46% | 23% 4 | |
| Net assets, end of period (x 1,000) | $928,988 | $881,159 | $487,205 | $165,819 | $92,752 | |
| 1 | Commencement of operations. |
| 2 | Calculated based on the average shares outstanding during the period. |
| 3 | The per share amount does not accord with the change in aggregate gains and losses in securities during the period because of the timing of sales and repurchases of fund shares in relation to fluctuating market values. |
| 4 | Not annualized. |
| 5 | Ratio includes less than 0.0005% of non-routine proxy expenses. |
| 6 | Effective December 20, 2018, the annual operating expense ratio was reduced to 0.035%. The ratio presented for period ended 10/31/19 is a blended ratio. |
| 7 | Annualized. |
| 8 | The investment adviser voluntarily agreed to waive the fund’s management fees to 0.00% beginning with the fund’s commencement of operations through June 30, 2018. The ratio presented for period ended 10/31/18 is a blended ratio. |
| SECURITY | VALUE
AT 10/31/21 |
PURCHASES | SALES | REALIZED
GAINS (LOSSES) |
NET
CHANGE IN UNREALIZED APPRECIATION (DEPRECIATION) |
VALUE
AT 10/31/22 |
BALANCE
OF SHARES HELD AT 10/31/22 |
DIVIDENDS
RECEIVED |
| COMMON STOCKS 0.4% OF NET ASSETS | ||||||||
| Diversified Financials 0.4% | ||||||||
| The Charles Schwab Corp. | $— | $2,927,104 | ($128,426) | $1,923 | $644,170 | $3,444,771 | 43,238 | $9,224 |
| DESCRIPTION | QUOTED
PRICES IN ACTIVE MARKETS FOR IDENTICAL ASSETS (LEVEL 1) |
OTHER
SIGNIFICANT OBSERVABLE INPUTS (LEVEL 2) |
SIGNIFICANT
UNOBSERVABLE INPUTS (LEVEL 3) |
TOTAL |
| Assets | ||||
| Common Stocks1 | $920,266,046 | $— | $— | $920,266,046 |
| Investment Companies1 | 868,062 | — | — | 868,062 |
| Short-Term Investments1 | 5,199,071 | — | — | 5,199,071 |
| Futures Contracts2 | 121,047 | — | — | 121,047 |
| Liabilities | ||||
| Futures Contracts2 | (10,173) | — | — | (10,173) |
| Total | $926,444,053 | $— | $— | $926,444,053 |
| 1 | As categorized in the Portfolio Holdings. |
| 2 | Futures contracts are reported at cumulative unrealized appreciation or depreciation. |
| Assets | ||
| Investments in securities, at value - affiliated (cost $2,800,601) | $3,444,771 | |
| Investments in securities, at value - unaffiliated (cost $796,258,574) including securities on loan of $674,746 | 922,888,408 | |
| Cash | 1,963,860 | |
| Deposit with broker for futures contracts | 463,600 | |
| Receivables: | ||
| Fund shares sold | 1,471,632 | |
| Dividends | 488,787 | |
| Income from securities on loan | + | 1,795 |
| Total assets | 930,722,853 | |
| Liabilities | ||
| Collateral held for securities on loan | 693,895 | |
| Payables: | ||
| Fund shares redeemed | 955,366 | |
| Variation margin on futures contracts | 61,054 | |
| Investment adviser fees | + | 24,508 |
| Total liabilities | 1,734,823 | |
| Net assets | $928,988,030 | |
| Net Assets by Source | ||
| Capital received from investors | $848,819,896 | |
| Total distributable earnings | + | 80,168,134 |
| Net assets | $928,988,030 | |
| Net Asset Value (NAV) | ||||
| Net Assets | ÷ | Shares
Outstanding |
= | NAV |
| $928,988,030 | 14,056,773 | $66.09 | ||
| For the period November 1, 2021 through October 31, 2022 | ||
| Investment Income | ||
| Dividends received from securities - unaffiliated (net of foreign withholding tax of $1,391) | $7,917,292 | |
| Dividends received from securities - affiliated | 9,224 | |
| Securities on loan, net | + | 27,888 |
| Total investment income | 7,954,404 | |
| Expenses | ||
| Investment adviser fees | 311,233 | |
| Proxy fees1 | + | 4,001 |
| Total expenses | – | 315,234 |
| Net investment income | 7,639,170 | |
| REALIZED AND UNREALIZED GAINS (LOSSES) | ||
| Net realized gains on sales of securities - affiliated | 1,923 | |
| Net realized losses on sales of securities - unaffiliated | (43,110,083) | |
| Net realized losses on futures contracts | + | (869,520) |
| Net realized losses | (43,977,680) | |
| Net change in unrealized appreciation (depreciation) on securities - affiliated | 644,170 | |
| Net change in unrealized appreciation (depreciation) on securities - unaffiliated | (211,896,756) | |
| Net change in unrealized appreciation (depreciation) on futures contracts | + | 83,645 |
| Net change in unrealized appreciation (depreciation) | + | (211,168,941) |
| Net realized and unrealized losses | (255,146,621) | |
| Decrease in net assets resulting from operations | ($247,507,451) | |
| 1 | Proxy fees are non-routine expenses (see financial note 2(e) for additional information). |
| OPERATIONS | |||
| 11/1/21-10/31/22 | 11/1/20-10/31/21 | ||
| Net investment income | $7,639,170 | $5,029,957 | |
| Net realized gains (losses) | (43,977,680) | 16,292,898 | |
| Net change in unrealized appreciation (depreciation) | + | (211,168,941) | 214,527,301 |
| Increase (decrease) in net assets resulting from operations | ($247,507,451) | $235,850,156 | |
| DISTRIBUTIONS TO SHAREHOLDERS | |||
| Total distributions | ($16,277,055) | ($3,820,481) | |
| TRANSACTIONS IN FUND SHARES | |||||
| 11/1/21-10/31/22 | 11/1/20-10/31/21 | ||||
| SHARES | VALUE | SHARES | VALUE | ||
| Shares sold | 7,588,954 | $563,493,219 | 4,598,477 | $352,197,876 | |
| Shares reinvested | 157,797 | 14,184,348 | 45,814 | 3,263,376 | |
| Shares redeemed | + | (3,565,449) | (266,064,240) | (2,532,061) | (193,536,712) |
| Net transactions in fund shares | 4,181,302 | $311,613,327 | 2,112,230 | $161,924,540 | |
| SHARES OUTSTANDING AND NET ASSETS | |||||
| 11/1/21-10/31/22 | 11/1/20-10/31/21 | ||||
| SHARES | NET ASSETS | SHARES | NET ASSETS | ||
| Beginning of period | 9,875,471 | $881,159,209 | 7,763,241 | $487,204,994 | |
| Total increase | + | 4,181,302 | 47,828,821 | 2,112,230 | 393,954,215 |
| End of period | 14,056,773 | $928,988,030 | 9,875,471 | $881,159,209 | |
| 11/1/21–
10/31/22 |
11/1/20–
10/31/21 |
11/1/19–
10/31/20 |
11/1/18–
10/31/19 |
12/20/17
1– 10/31/18 |
||
| Per-Share Data | ||||||
| Net asset value at beginning of period | $53.65 | $38.09 | $43.06 | $39.51 | $40.00 | |
| Income (loss) from investment operations: | ||||||
| Net investment income (loss)2 | 1.01 | 0.97 | 1.00 | 1.13 | 0.82 | |
| Net realized and unrealized gains (losses) | (4.60) | 15.47 | (4.07) | 3.10 | (1.31) | |
| Total from investment operations | (3.59) | 16.44 | (3.07) | 4.23 | (0.49) | |
| Less distributions: | ||||||
| Distributions from net investment income | (0.91) | (0.88) | (1.06) | (0.62) | — | |
| Distributions from net realized gains | (1.64) | — | (0.84) | (0.06) | — | |
| Total distributions | (2.55) | (0.88) | (1.90) | (0.68) | — | |
| Net asset value at end of period | $47.51 | $53.65 | $38.09 | $43.06 | $39.51 | |
| Total return | (7.04%) | 43.70% | (7.69%) | 11.08% | (1.23%) 3 | |
| Ratios/Supplemental Data | ||||||
| Ratios to average net assets: | ||||||
| Total expenses | 0.035% 4 | 0.035% | 0.035% | 0.035% 5 | 0.040% 6,7 | |
| Net operating expenses | N/A | N/A | N/A | N/A | 0.02% 6,7 | |
| Net investment income (loss) | 2.05% | 1.97% | 2.57% | 2.79% | 2.36% 6 | |
| Portfolio turnover rate | 15% 8 | 20% | 50% | 22% | 22% 3 | |
| Net assets, end of period (x 1,000) | $647,796 | $575,972 | $331,322 | $212,213 | $69,749 | |
| 1 | Commencement of operations. |
| 2 | Calculated based on the average shares outstanding during the period. |
| 3 | Not annualized. |
| 4 | Ratio includes less than 0.0005% of non-routine proxy expenses. |
| 5 | Effective December 20, 2018, the annual operating expense ratio was reduced to 0.035%. The ratio presented for period ended 10/31/19 is a blended ratio. |
| 6 | Annualized. |
| 7 | The investment adviser voluntarily agreed to waive the fund’s management fees to 0.00% beginning with the fund’s commencement of operations through June 30, 2018. The ratio presented for period ended 10/31/18 is a blended ratio. |
| 8 | Portfolio turnover rate excludes in-kind transactions. |
| SECURITY | VALUE
AT 10/31/21 |
PURCHASES | SALES | REALIZED
GAINS (LOSSES) |
NET
CHANGE IN UNREALIZED APPRECIATION (DEPRECIATION) |
VALUE
AT 10/31/22 |
BALANCE
OF SHARES HELD AT 10/31/22 |
DIVIDENDS
RECEIVED |
| COMMON STOCKS 0.3% OF NET ASSETS | ||||||||
| Diversified Financials 0.3% | ||||||||
| The Charles Schwab Corp. | $3,397,519 | $854,830 | ($1,862,661) | $285,654 | ($777,603) | $1,897,739 | 23,820 | $30,673 |
| DESCRIPTION | QUOTED
PRICES IN ACTIVE MARKETS FOR IDENTICAL ASSETS (LEVEL 1) |
OTHER
SIGNIFICANT OBSERVABLE INPUTS (LEVEL 2) |
SIGNIFICANT
UNOBSERVABLE INPUTS (LEVEL 3) |
TOTAL |
| Assets | ||||
| Common Stocks1 | $643,162,523 | $— | $— | $643,162,523 |
| Investment Companies1 | 621,421 | — | — | 621,421 |
| Short-Term Investments1 | 3,350,179 | — | — | 3,350,179 |
| Futures Contracts2 | 109,124 | — | — | 109,124 |
| Total | $647,243,247 | $— | $— | $647,243,247 |
| 1 | As categorized in the Portfolio Holdings. |
| 2 | Futures contracts are reported at cumulative unrealized appreciation or depreciation. |
| Assets | ||
| Investments in securities, at value - affiliated (cost $1,039,263) | $1,897,739 | |
| Investments in securities, at value - unaffiliated (cost $562,059,002) including securities on loan of $670,319 | 645,236,384 | |
| Cash | 129,853 | |
| Deposit with broker for futures contracts | 164,000 | |
| Receivables: | ||
| Fund shares sold | 1,012,934 | |
| Dividends | 616,262 | |
| Income from securities on loan | + | 4,123 |
| Total assets | 649,061,295 | |
| Liabilities | ||
| Collateral held for securities on loan | 686,224 | |
| Payables: | ||
| Fund shares redeemed | 542,954 | |
| Variation margin on futures contracts | 19,280 | |
| Investment adviser fees | + | 16,867 |
| Total liabilities | 1,265,325 | |
| Net assets | $647,795,970 | |
| Net Assets by Source | ||
| Capital received from investors | $582,325,155 | |
| Total distributable earnings | + | 65,470,815 |
| Net assets | $647,795,970 | |
| Net Asset Value (NAV) | ||||
| Net Assets | ÷ | Shares
Outstanding |
= | NAV |
| $647,795,970 | 13,634,563 | $47.51 | ||
| For the period November 1, 2021 through October 31, 2022 | ||
| Investment Income | ||
| Dividends received from securities - unaffiliated (net of foreign withholding tax of $3,229) | $12,704,310 | |
| Dividends received from securities - affiliated | 30,673 | |
| Securities on loan, net | + | 26,865 |
| Total investment income | 12,761,848 | |
| Expenses | ||
| Investment adviser fees | 214,388 | |
| Proxy fees1 | + | 2,757 |
| Total expenses | – | 217,145 |
| Net investment income | 12,544,703 | |
| REALIZED AND UNREALIZED GAINS (LOSSES) | ||
| Net realized losses on sales of securities - affiliated | (180,340) | |
| Net realized losses on sales of securities - unaffiliated | (4,434,022) | |
| Net realized gains on sales of in-kind redemptions - affiliated | 465,994 | |
| Net realized gains on sales of in-kind redemptions - unaffiliated | 9,972,950 | |
| Net realized losses on futures contracts | + | (378,084) |
| Net realized gains | 5,446,498 | |
| Net change in unrealized appreciation (depreciation) on securities - affiliated | (777,603) | |
| Net change in unrealized appreciation (depreciation) on securities - unaffiliated | (62,636,956) | |
| Net change in unrealized appreciation (depreciation) on futures contracts | + | 93,006 |
| Net change in unrealized appreciation (depreciation) | + | (63,321,553) |
| Net realized and unrealized losses | (57,875,055) | |
| Decrease in net assets resulting from operations | ($45,330,352) | |
| 1 | Proxy fees are non-routine expenses (see financial note 2(e) for additional information). |
| OPERATIONS | |||
| 11/1/21-10/31/22 | 11/1/20-10/31/21 | ||
| Net investment income | $12,544,703 | $9,554,564 | |
| Net realized gains | 5,446,498 | 18,696,413 | |
| Net change in unrealized appreciation (depreciation) | + | (63,321,553) | 125,598,537 |
| Increase (decrease) in net assets resulting from operations | ($45,330,352) | $153,849,514 | |
| DISTRIBUTIONS TO SHAREHOLDERS | |||
| Total distributions | ($27,740,131) | ($7,759,956) | |
| TRANSACTIONS IN FUND SHARES | |||||
| 11/1/21-10/31/22 | 11/1/20-10/31/21 | ||||
| SHARES | VALUE | SHARES | VALUE | ||
| Shares sold | 5,720,926 | $280,961,274 | 3,972,069 | $193,635,977 | |
| Shares reinvested | 416,349 | 21,312,908 | 129,214 | 5,614,330 | |
| Shares redeemed | + | (3,237,613) | (157,379,862) | (2,064,619) | (100,690,119) |
| Net transactions in fund shares | 2,899,662 | $144,894,320 | 2,036,664 | $98,560,188 | |
| SHARES OUTSTANDING AND NET ASSETS | |||||
| 11/1/21-10/31/22 | 11/1/20-10/31/21 | ||||
| SHARES | NET ASSETS | SHARES | NET ASSETS | ||
| Beginning of period | 10,734,901 | $575,972,133 | 8,698,237 | $331,322,387 | |
| Total increase | + | 2,899,662 | 71,823,837 | 2,036,664 | 244,649,746 |
| End of period | 13,634,563 | $647,795,970 | 10,734,901 | $575,972,133 | |
| 11/1/21–
10/31/22 |
11/1/20–
10/31/21 |
11/1/19–
10/31/20 |
11/1/18–
10/31/19 |
12/20/17
1– 10/31/18 |
||
| Per-Share Data | ||||||
| Net asset value at beginning of period | $64.44 | $44.98 | $44.29 | $39.55 | $40.00 | |
| Income (loss) from investment operations: | ||||||
| Net investment income (loss)2 | 0.79 | 0.69 | 0.72 | 0.70 | 0.59 | |
| Net realized and unrealized gains (losses) | (11.54) | 19.54 | 1.09 | 4.54 | (1.04) | |
| Total from investment operations | (10.75) | 20.23 | 1.81 | 5.24 | (0.45) | |
| Less distributions: | ||||||
| Distributions from net investment income | (0.63) | (0.77) | (0.64) | (0.42) | — | |
| Distributions from net realized gains | (1.22) | — | (0.48) | (0.08) | — | |
| Total distributions | (1.85) | (0.77) | (1.12) | (0.50) | — | |
| Net asset value at end of period | $51.84 | $64.44 | $44.98 | $44.29 | $39.55 | |
| Total return | (17.15%) | 45.35% | 4.04% | 13.61% | (1.13%) 3 | |
| Ratios/Supplemental Data | ||||||
| Ratios to average net assets: | ||||||
| Total expenses | 0.04% 4 | 0.04% | 0.04% | 0.04% 5 | 0.05% 6,7 | |
| Net operating expenses | N/A | N/A | N/A | N/A | 0.03% 6,7 | |
| Net investment income (loss) | 1.41% | 1.19% | 1.69% | 1.67% | 1.65% 6 | |
| Portfolio turnover rate | 11% 8 | 14% | 29% | 21% | 15% 3 | |
| Net assets, end of period (x 1,000) | $903,303 | $890,697 | $482,977 | $356,596 | $171,278 | |
| 1 | Commencement of operations. |
| 2 | Calculated based on the average shares outstanding during the period. |
| 3 | Not annualized. |
| 4 | Ratio includes less than 0.005% of non-routine proxy expenses. |
| 5 | Effective December 20, 2018, the annual operating expense ratio was reduced to 0.04%. The ratio presented for period ended 10/31/19 is a blended ratio. |
| 6 | Annualized. |
| 7 | The investment adviser voluntarily agreed to waive the fund’s management fees to 0.00% beginning with the fund’s commencement of operations through June 30, 2018. The ratio presented for period ended 10/31/18 is a blended ratio. |
| 8 | Portfolio turnover rate excludes in-kind transactions. |
| DESCRIPTION | QUOTED
PRICES IN ACTIVE MARKETS FOR IDENTICAL ASSETS (LEVEL 1) |
OTHER
SIGNIFICANT OBSERVABLE INPUTS (LEVEL 2) |
SIGNIFICANT
UNOBSERVABLE INPUTS (LEVEL 3) |
TOTAL |
| Assets | ||||
| Common Stocks1 | $893,523,191 | $— | $— | $893,523,191 |
| Investment Companies1 | 858,647 | — | — | 858,647 |
| Short-Term Investments1 | 6,844,410 | — | — | 6,844,410 |
| Futures Contracts2 | 205,754 | — | — | 205,754 |
| Total | $901,432,002 | $— | $— | $901,432,002 |
| 1 | As categorized in the Portfolio Holdings. |
| 2 | Futures contracts are reported at cumulative unrealized appreciation or depreciation. |
| Assets | ||
| Investments in securities, at value - unaffiliated (cost $829,083,317) including securities on loan of $3,617,681 | $901,226,248 | |
| Cash | 3,838,173 | |
| Deposit with broker for futures contracts | 432,000 | |
| Receivables: | ||
| Fund shares sold | 1,518,788 | |
| Dividends | 474,930 | |
| Investments sold | 148,722 | |
| Income from securities on loan | + | 16,907 |
| Total assets | 907,655,768 | |
| Liabilities | ||
| Collateral held for securities on loan | 3,709,990 | |
| Payables: | ||
| Fund shares redeemed | 610,528 | |
| Investment adviser fees | 27,302 | |
| Variation margin on futures contracts | + | 4,915 |
| Total liabilities | 4,352,735 | |
| Net assets | $903,303,033 | |
| Net Assets by Source | ||
| Capital received from investors | $846,432,597 | |
| Total distributable earnings | + | 56,870,436 |
| Net assets | $903,303,033 | |
| Net Asset Value (NAV) | ||||
| Net Assets | ÷ | Shares
Outstanding |
= | NAV |
| $903,303,033 | 17,423,547 | $51.84 | ||
| For the period November 1, 2021 through October 31, 2022 | ||
| Investment Income | ||
| Dividends received from securities - unaffiliated (net of foreign withholding tax of $4,217) | $12,898,234 | |
| Securities on loan, net | + | 151,822 |
| Total investment income | 13,050,056 | |
| Expenses | ||
| Investment adviser fees | 358,330 | |
| Proxy fees1 | + | 40,371 |
| Total expenses | – | 398,701 |
| Net investment income | 12,651,355 | |
| REALIZED AND UNREALIZED GAINS (LOSSES) | ||
| Net realized losses on sales of securities - unaffiliated | (10,054,896) | |
| Net realized gains on sales of in-kind redemptions - unaffiliated | 10,883,121 | |
| Net realized losses on futures contracts | + | (840,379) |
| Net realized losses | (12,154) | |
| Net change in unrealized appreciation (depreciation) on securities - unaffiliated | (182,868,180) | |
| Net change in unrealized appreciation (depreciation) on futures contracts | + | 205,753 |
| Net change in unrealized appreciation (depreciation) | + | (182,662,427) |
| Net realized and unrealized losses | (182,674,581) | |
| Decrease in net assets resulting from operations | ($170,023,226) | |
| 1 | Proxy fees are non-routine expenses (see financial note 2(e) for additional information). |
| OPERATIONS | |||
| 11/1/21-10/31/22 | 11/1/20-10/31/21 | ||
| Net investment income | $12,651,355 | $8,467,009 | |
| Net realized gains (losses) | (12,154) | 17,872,949 | |
| Net change in unrealized appreciation (depreciation) | + | (182,662,427) | 208,470,779 |
| Increase (decrease) in net assets resulting from operations | ($170,023,226) | $234,810,737 | |
| DISTRIBUTIONS TO SHAREHOLDERS | |||
| Total distributions | ($26,457,808) | ($8,319,433) | |
| TRANSACTIONS IN FUND SHARES | |||||
| 11/1/21-10/31/22 | 11/1/20-10/31/21 | ||||
| SHARES | VALUE | SHARES | VALUE | ||
| Shares sold | 6,524,271 | $369,067,984 | 5,533,289 | $322,845,672 | |
| Shares reinvested | 355,335 | 21,909,932 | 134,151 | 7,065,741 | |
| Shares redeemed | + | (3,277,725) | (181,890,798) | (2,583,256) | (148,682,619) |
| Net transactions in fund shares | 3,601,881 | $209,087,118 | 3,084,184 | $181,228,794 | |
| SHARES OUTSTANDING AND NET ASSETS | |||||
| 11/1/21-10/31/22 | 11/1/20-10/31/21 | ||||
| SHARES | NET ASSETS | SHARES | NET ASSETS | ||
| Beginning of period | 13,821,666 | $890,696,949 | 10,737,482 | $482,976,851 | |
| Total increase | + | 3,601,881 | 12,606,084 | 3,084,184 | 407,720,098 |
| End of period | 17,423,547 | $903,303,033 | 13,821,666 | $890,696,949 | |
| 11/1/21–
10/31/22 |
11/1/20–
10/31/21 |
11/1/19–
10/31/20 |
11/1/18–
10/31/19 |
11/1/17–
10/31/18 |
||
| Per-Share Data | ||||||
| Net asset value at beginning of period | $24.45 | $18.56 | $20.48 | $19.00 | $21.01 | |
| Income (loss) from investment operations: | ||||||
| Net investment income (loss)1 | 0.65 | 0.64 | 0.47 | 0.64 | 0.62 | |
| Net realized and unrealized gains (losses) | (6.14) | 5.66 | (1.75) | 1.39 | (2.06) | |
| Total from investment operations | (5.49) | 6.30 | (1.28) | 2.03 | (1.44) | |
| Less distributions: | ||||||
| Distributions from net investment income | (0.79) | (0.41) | (0.64) | (0.55) | (0.57) | |
| Net asset value at end of period | $18.17 | $24.45 | $18.56 | $20.48 | $19.00 | |
| Total return | (23.12%) | 34.24% | (6.56%) | 11.27% | (7.11%) | |
| Ratios/Supplemental Data | ||||||
| Ratios to average net assets: | ||||||
| Total expenses | 0.06% 2 | 0.06% | 0.06% | 0.06% | 0.06% | |
| Net investment income (loss) | 3.12% | 2.76% | 2.47% | 3.32% | 2.99% | |
| Portfolio turnover rate | 5% | 3% | 7% | 5% | 5% | |
| Net assets, end of period (x 1,000,000) | $7,127 | $8,781 | $5,937 | $5,443 | $4,314 | |
| 1 | Calculated based on the average shares outstanding during the period. |
| 2 | Ratio includes less than 0.005% of non-routine proxy expenses. |
| DESCRIPTION | QUOTED
PRICES IN ACTIVE MARKETS FOR IDENTICAL ASSETS (LEVEL 1) |
OTHER
SIGNIFICANT OBSERVABLE INPUTS (LEVEL 2) |
SIGNIFICANT
UNOBSERVABLE INPUTS (LEVEL 3) |
TOTAL |
| Assets | ||||
| Common Stocks1 | $— | $4,735,572,264 | $— | $4,735,572,264 |
| Australia | 5,642,212 | 560,717,035 | — | 566,359,247 |
| Hong Kong | 1,113,317 | 177,815,847 | — | 178,929,164 |
| Israel | 19,984,532 | 41,299,522 | — | 61,284,054 |
| Netherlands | 13,324,664 | 278,642,646 | — | 291,967,310 |
| Singapore | 11,746,499 | 94,885,975 | — | 106,632,474 |
| United Kingdom | — | 1,106,163,153 | 0* | 1,106,163,153 |
| Preferred Stocks1 | ||||
| Germany | 6,364,612 | 30,952,154 | — | 37,316,766 |
| Short-Term Investments1 | 37,595,691 | — | — | 37,595,691 |
| Futures Contracts2 | 483,501 | — | — | 483,501 |
| Total | $96,255,028 | $7,026,048,596 | $— | $7,122,303,624 |
| * | Level 3 amount shown includes securities determined to have no value at October 31, 2022. |
| 1 | As categorized in the Portfolio Holdings. |
| 2 | Futures contracts are reported at cumulative unrealized appreciation or depreciation. |
| Assets | ||
| Investments in securities, at value - unaffiliated (cost $6,757,920,216) including securities on loan of $34,793,118 | $7,121,820,123 | |
| Cash | 83,678 | |
| Foreign currency, at value (cost $4,045,112) | 4,011,241 | |
| Deposit with broker for futures contracts | 2,763,613 | |
| Receivables: | ||
| Foreign tax reclaims | 18,492,420 | |
| Dividends | 17,358,669 | |
| Fund shares sold | 10,564,659 | |
| Investments sold | 1,755,544 | |
| Income from securities on loan | + | 17,983 |
| Total assets | 7,176,867,930 | |
| Liabilities | ||
| Collateral held for securities on loan | 37,595,691 | |
| Payables: | ||
| Fund shares redeemed | 11,496,403 | |
| Variation margin on futures contracts | 373,726 | |
| Investment adviser fees | + | 333,729 |
| Total liabilities | 49,799,549 | |
| Net assets | $7,127,068,381 | |
| Net Assets by Source | ||
| Capital received from investors | $7,234,981,022 | |
| Total distributable loss | + | (107,912,641) |
| Net assets | $7,127,068,381 | |
| Net Asset Value (NAV) | ||||
| Net Assets | ÷ | Shares
Outstanding |
= | NAV |
| $7,127,068,381 | 392,283,690 | $18.17 | ||
| For the period November 1, 2021 through October 31, 2022 | ||
| Investment Income | ||
| Dividends received from securities - unaffiliated (net of foreign withholding tax of $25,454,968) | $257,443,454 | |
| Securities on loan, net | + | 319,517 |
| Total investment income | 257,762,971 | |
| Expenses | ||
| Investment adviser fees | 4,860,768 | |
| Proxy fees1 | 374,802 | |
| Professional fees | + | 17,455 2 |
| Total expenses | 5,253,025 | |
| Expense reduction | – | 17,455 2 |
| Net expenses | – | 5,235,570 |
| Net investment income | 252,527,401 | |
| REALIZED AND UNREALIZED GAINS (LOSSES) | ||
| Net realized losses on sales of securities - unaffiliated | (170,907,944) | |
| Net realized losses on futures contracts | (17,316,756) | |
| Net realized losses on foreign currency transactions | + | (4,093,297) |
| Net realized losses | (192,317,997) | |
| Net change in unrealized appreciation (depreciation) on securities - unaffiliated | (2,182,547,937) | |
| Net change in unrealized appreciation (depreciation) on futures contracts | (62,489) | |
| Net change in unrealized appreciation (depreciation) on foreign currency translations | + | (2,392,845) |
| Net change in unrealized appreciation (depreciation) | + | (2,185,003,271) |
| Net realized and unrealized losses | (2,377,321,268) | |
| Decrease in net assets resulting from operations | ($2,124,793,867) | |
| 1 | Proxy fees are non-routine expenses (see financial note 2(e) for additional information). |
| 2 | Professional fees associated with the filing of tax claims in the European Union deemed to be non-contingent and non-routine expenses of the fund. (see financial notes 2(d) and 4 for additional information). |
| OPERATIONS | |||
| 11/1/21-10/31/22 | 11/1/20-10/31/21 | ||
| Net investment income | $252,527,401 | $220,308,471 | |
| Net realized losses | (192,317,997) | (12,480,045) | |
| Net change in unrealized appreciation (depreciation) | + | (2,185,003,271) | 1,870,184,169 |
| Increase (decrease) in net assets resulting from operations | ($2,124,793,867) | $2,078,012,595 | |
| DISTRIBUTIONS TO SHAREHOLDERS | |||
| Total distributions | ($287,643,160) | ($134,266,147) | |
| TRANSACTIONS IN FUND SHARES | |||||
| 11/1/21-10/31/22 | 11/1/20-10/31/21 | ||||
| SHARES | VALUE | SHARES | VALUE | ||
| Shares sold | 98,990,068 | $2,090,708,813 | 84,577,903 | $1,955,546,476 | |
| Shares reinvested | 8,669,015 | 198,780,492 | 4,139,456 | 90,364,312 | |
| Shares redeemed | + | (74,590,851) | (1,531,205,969) | (49,400,102) | (1,145,927,182) |
| Net transactions in fund shares | 33,068,232 | $758,283,336 | 39,317,257 | $899,983,606 | |
| SHARES OUTSTANDING AND NET ASSETS | |||||
| 11/1/21-10/31/22 | 11/1/20-10/31/21 | ||||
| SHARES | NET ASSETS | SHARES | NET ASSETS | ||
| Beginning of period | 359,215,458 | $8,781,222,072 | 319,898,201 | $5,937,492,018 | |
| Total increase (decrease) | + | 33,068,232 | (1,654,153,691) | 39,317,257 | 2,843,730,054 |
| End of period | 392,283,690 | $7,127,068,381 | 359,215,458 | $8,781,222,072 | |
| SCHWAB CAPITAL TRUST (ORGANIZED MAY 7, 1993) | |
| Schwab S&P 500 Index Fund | Schwab Target 2045 Fund |
| Schwab Small-Cap Index Fund | Schwab Target 2050 Fund |
| Schwab Total Stock Market Index Fund | Schwab Target 2055 Fund |
| Schwab U.S. Large-Cap Growth Index Fund | Schwab Target 2060 Fund |
| Schwab U.S. Large-Cap Value Index Fund | Schwab Target 2065 Fund |
| Schwab U.S. Mid-Cap Index Fund | Schwab Fundamental US Large Company Index Fund |
| Schwab International Index Fund | Schwab Fundamental US Small Company Index Fund |
| Schwab MarketTrack All Equity Portfolio™ | Schwab Fundamental International Large Company Index Fund |
| Schwab MarketTrack Growth Portfolio™ | Schwab Fundamental International Small Company Index Fund |
| Schwab MarketTrack Balanced Portfolio™ | Schwab Fundamental Emerging Markets Large Company Index Fund |
| Schwab MarketTrack Conservative Portfolio™ | Schwab Fundamental Global Real Estate Index Fund |
| Schwab International Opportunities Fund | Schwab Target 2010 Index Fund |
| Schwab Balanced Fund | Schwab Target 2015 Index Fund |
| Schwab Core Equity Fund | Schwab Target 2020 Index Fund |
| Schwab Dividend Equity Fund | Schwab Target 2025 Index Fund |
| Schwab Large-Cap Growth Fund | Schwab Target 2030 Index Fund |
| Schwab Small-Cap Equity Fund | Schwab Target 2035 Index Fund |
| Schwab Health Care Fund | Schwab Target 2040 Index Fund |
| Schwab International Core Equity Fund | Schwab Target 2045 Index Fund |
| Schwab Target 2010 Fund | Schwab Target 2050 Index Fund |
| Schwab Target 2015 Fund | Schwab Target 2055 Index Fund |
| Schwab Target 2020 Fund | Schwab Target 2060 Index Fund |
| Schwab Target 2025 Fund | Schwab Target 2065 Index Fund |
| Schwab Target 2030 Fund | Schwab Monthly Income Fund – Target Payout |
| Schwab Target 2035 Fund | Schwab Monthly Income Fund – Flexible Payout |
| Schwab Target 2040 Fund | Schwab Monthly Income Fund – Income Payout |
| SCHWAB INVESTMENTS (ORGANIZED OCTOBER 26, 1990) | |
| Schwab 1000 Index Fund | Schwab Tax-Free Bond Fund |
| Schwab Treasury Inflation Protected Securities Index Fund | Schwab California Tax-Free Bond Fund |
| Schwab U.S. Aggregate Bond Index Fund | Schwab Opportunistic Municipal Bond Fund |
| Schwab Short-Term Bond Index Fund | Schwab Global Real Estate Fund |
| 4. Affiliates and Affiliated Transactions: |
| SCHWAB
S&P 500 INDEX FUND |
SCHWAB
1000 INDEX FUND |
SCHWAB
SMALL-CAP INDEX FUND |
SCHWAB
TOTAL STOCK MARKET INDEX FUND |
SCHWAB
U.S. LARGE-CAP GROWTH INDEX FUND |
SCHWAB
U.S. LARGE-CAP VALUE INDEX FUND |
SCHWAB
U.S. MID-CAP INDEX FUND |
SCHWAB
INTERNATIONAL INDEX FUND |
| 0.02% | 0.05% | 0.04% | 0.03% | 0.035% | 0.035% | 0.04% | 0.06% |
| UNDERLYING FUNDS | |||||
| SCHWAB
S&P 500 INDEX FUND |
SCHWAB
SMALL-CAP INDEX FUND |
SCHWAB
U.S. LARGE-CAP GROWTH INDEX FUND |
SCHWAB
U.S. MID-CAP INDEX FUND |
SCHWAB
INTERNATIONAL INDEX FUND | |
| Schwab MarketTrack All Equity Portfolio | 0.4% | 1.4% | 3.6% | —% | 1.3% |
| Schwab MarketTrack Balanced Portfolio | 0.2% | 0.6% | 1.7% | —% | 0.5% |
| Schwab MarketTrack Conservative Portfolio | 0.1% | 0.2% | 0.5% | —% | 0.2% |
| Schwab MarketTrack Growth Portfolio | 0.4% | 1.4% | 2.8% | —% | 1.1% |
| Schwab Target 2010 Fund | 0.0%* | —% | —% | 0.0%* | —% |
| Schwab Target 2015 Fund | 0.0%* | —% | —% | 0.0%* | —% |
| Schwab Target 2020 Fund | 0.1% | —% | —% | 0.4% | —% |
| Schwab Target 2025 Fund | 0.1% | —% | —% | 0.6% | —% |
| Schwab Target 2030 Fund | 0.3% | —% | —% | 1.3% | —% |
| Schwab Target 2035 Fund | 0.2% | —% | —% | 0.8% | —% |
| Schwab Target 2040 Fund | 0.3% | —% | —% | 1.7% | —% |
| Schwab Target 2045 Fund | 0.1% | —% | —% | 0.4% | —% |
| Schwab Target 2050 Fund | 0.1% | —% | —% | 0.4% | —% |
| Schwab Target 2055 Fund | 0.0%* | —% | —% | 0.3% | —% |
| Schwab Target 2060 Fund | 0.0%* | —% | —% | 0.1% | —% |
| Schwab Target 2065 Fund | 0.0%* | —% | —% | 0.0%* | —% |
| * | Less than 0.05% |
| PURCHASE COST | SALE PROCEEDS | REALIZED GAINS (LOSSES) | |
| Schwab S&P 500 Index Fund | $318,195,998 | $148,096,558 | ($58,405,895) |
| Schwab 1000 Index Fund | 108,915,902 | 72,503,471 | (52,980,385) |
| Schwab Small-Cap Index Fund | 75,675,878 | 71,460,921 | (9,946,925) |
| Schwab Total Stock Market Index Fund | 126,719,035 | 70,305,521 | (35,740,278) |
| Schwab U.S. Large-Cap Growth Index Fund | 60,900,179 | 54,811,170 | (15,209,691) |
| Schwab U.S. Large-Cap Value Index Fund | 73,511,996 | 50,433,173 | (447,208) |
| Schwab U.S. Mid-Cap Index Fund | 33,418,330 | 18,146,299 | (10,277,066) |
| Schwab International Index Fund | 26,797 | 14,543,462 | (5,047,751) |
| NOTIONAL AMOUNTS | NUMBER OF CONTRACTS | |
| Schwab S&P 500 Index Fund | $308,479,043 | 1,443 |
| Schwab 1000 Index Fund | 53,543,576 | 252 |
| Schwab Small-Cap Index Fund | 26,446,943 | 264 |
| Schwab Total Stock Market Index Fund | 83,747,872 | 462 |
| Schwab U.S. Large-Cap Growth Index Fund | 3,824,246 | 29 |
| Schwab U.S. Large-Cap Value Index Fund | 2,872,935 | 35 |
| Schwab U.S. Mid-Cap Index Fund | 4,859,089 | 19 |
| Schwab International Index Fund | 55,419,275 | 548 |
| PURCHASES
OF SECURITIES |
SALES
OF SECURITIES | |
| Schwab S&P 500 Index Fund | $6,338,239,393 | $1,128,726,146 |
| Schwab 1000 Index Fund | 741,161,276 | 297,120,612 |
| Schwab Small-Cap Index Fund | 1,479,558,224 | 896,110,327 |
| Schwab Total Stock Market Index Fund | 1,847,143,733 | 384,654,106 |
| Schwab U.S. Large-Cap Growth Index Fund | 459,123,750 | 156,043,596 |
| Schwab U.S. Large-Cap Value Index Fund | 249,347,602 | 93,887,278 |
| Schwab U.S. Mid-Cap Index Fund | 329,236,287 | 94,784,814 |
| Schwab International Index Fund | 1,152,675,780 | 429,495,435 |
| IN-KIND
PURCHASES OF SECURITIES |
IN-KIND
SALES OF SECURITIES | |
| Schwab 1000 Index Fund | $— | $130,625,736 |
| Schwab Small-Cap Index Fund | — | 154,617,030 |
| Schwab U.S. Large-Cap Value Index Fund | — | 22,015,146 |
| Schwab U.S. Mid-Cap Index Fund | — | 20,979,937 |
| 9. Federal Income Taxes: |
| TAX COST | GROSS
UNREALIZED APPRECIATION |
GROSS
UNREALIZED DEPRECIATION |
NET
UNREALIZED APPRECIATION (DEPRECIATION) | |
| Schwab S&P 500 Index Fund | $30,532,850,603 | $32,045,615,799 | ($1,732,330,726) | $30,313,285,073 |
| Schwab 1000 Index Fund | 3,350,432,752 | 8,814,241,837 | (264,167,926) | 8,550,073,911 |
| Schwab Small-Cap Index Fund | 4,653,768,199 | 1,811,947,195 | (981,734,216) | 830,212,979 |
| Schwab Total Stock Market Index Fund | 9,606,021,717 | 7,300,977,616 | (883,253,146) | 6,417,724,470 |
| Schwab U.S. Large-Cap Growth Index Fund | 824,431,051 | 164,130,707 | (62,117,705) | 102,013,002 |
| Schwab U.S. Large-Cap Value Index Fund | 592,792,293 | 119,095,255 | (64,644,301) | 54,450,954 |
| Schwab U.S. Mid-Cap Index Fund | 855,264,291 | 160,284,467 | (114,116,756) | 46,167,711 |
| Schwab International Index Fund | 7,070,935,445 | 1,192,326,347 | (1,140,958,168) | 51,368,179 |
| UNDISTRIBUTED
ORDINARY INCOME |
UNDISTRIBUTED
LONG-TERM CAPITAL GAINS |
NET
UNREALIZED APPRECIATION (DEPRECIATION) ON INVESTMENTS |
NET
OTHER UNREALIZED APPRECIATION (DEPRECIATION) |
CAPITAL
LOSS CARRYFORWARDS AND OTHER LOSSES |
TOTAL | |
| Schwab S&P 500 Index Fund | $784,280,824 | $— | $30,313,285,073 | $— | ($91,515,940) | $31,006,049,957 |
| Schwab 1000 Index Fund | 146,361,782 | — | 8,550,073,911 | — | (90,324,047) | 8,606,111,646 |
| Schwab Small-Cap Index Fund | 45,118,253 | — | 830,212,979 | — | (53,188,008) | 822,143,224 |
| Schwab Total Stock Market Index Fund | 196,900,319 | — | 6,417,724,470 | — | (24,579,663) | 6,590,045,126 |
| Schwab U.S. Large-Cap Growth Index Fund | 6,352,716 | — | 102,013,002 | — | (28,197,584) | 80,168,134 |
| Schwab U.S. Large-Cap Value Index Fund | 10,224,928 | 794,933 | 54,450,954 | — | — | 65,470,815 |
| Schwab U.S. Mid-Cap Index Fund | 9,919,928 | 782,797 | 46,167,711 | — | — | 56,870,436 |
| Schwab International Index Fund | 187,757,865 | — | 51,368,179 | (2,415,662) | (344,623,023) | (107,912,641) |
| Schwab S&P 500 Index Fund | $91,515,940 |
| Schwab 1000 Index Fund | 90,324,047 |
| Schwab Small-Cap Index Fund | 53,188,008 |
| Schwab Total Stock Market Index Fund | 24,579,663 |
| Schwab U.S. Large-Cap Growth Index Fund | 28,197,584 |
| Schwab U.S. Large-Cap Value Index Fund | — |
| Schwab U.S. Mid-Cap Index Fund | — |
| Schwab International Index Fund | 344,623,023 |
| CURRENT FISCAL YEAR END DISTRIBUTIONS | PRIOR FISCAL YEAR END DISTRIBUTIONS | |||
| ORDINARY
INCOME |
LONG-TERM
CAPITAL GAINS |
ORDINARY
INCOME |
LONG-TERM
CAPITAL GAINS | |
| Schwab S&P 500 Index Fund | $827,352,159 | $65,457,539 | $913,293,066 | $— |
| Schwab 1000 Index Fund | 170,064,667 | 79,902,182 | 189,179,998 | 117,107,001 |
| Schwab Small-Cap Index Fund | 131,927,919 | 399,701,902 | 57,108,519 | 72,781,270 |
| Schwab Total Stock Market Index Fund | 225,603,990 | 45,585,913 | 218,157,695 | — |
| Schwab U.S. Large-Cap Growth Index Fund | 6,371,109 | 9,905,946 | 3,820,481 | — |
| Schwab U.S. Large-Cap Value Index Fund | 17,495,710 | 10,244,421 | 7,759,956 | — |
| Schwab U.S. Mid-Cap Index Fund | 11,729,695 | 14,728,113 | 8,319,433 | — |
| Schwab International Index Fund | 287,643,160 | — | 134,266,147 | — |
Denver, Colorado
December 16, 2022
| Schwab S&P 500 Index Fund | 95.38% |
| Schwab 1000 Index Fund | 96.23% |
| Schwab Small-Cap Index Fund | 46.88% |
| Schwab Total Stock Market Index Fund | 91.04% |
| Schwab U.S. Large-Cap Growth Index Fund | 82.99% |
| Schwab U.S. Large-Cap Value Index Fund | 58.00% |
| Schwab U.S. Mid-Cap Index Fund | 71.49% |
| Schwab International Index Fund | —% |
| Schwab S&P 500 Index Fund | $827,352,159 |
| Schwab 1000 Index Fund | 169,571,883 |
| Schwab Small-Cap Index Fund | 93,271,782 |
| Schwab Total Stock Market Index Fund | 211,471,310 |
| Schwab U.S. Large-Cap Growth Index Fund | 5,391,873 |
| Schwab U.S. Large-Cap Value Index Fund | 10,503,674 |
| Schwab U.S. Mid-Cap Index Fund | 8,673,831 |
| Schwab International Index Fund | 247,613,149 |
| Schwab S&P 500 Index Fund | $65,457,539 |
| Schwab 1000 Index Fund | 79,902,182 |
| Schwab Small-Cap Index Fund | 399,701,902 |
| Schwab Total Stock Market Index Fund | 45,585,913 |
| Schwab U.S. Large-Cap Growth Index Fund | 9,905,946 |
| Schwab U.S. Large-Cap Value Index Fund | 10,244,421 |
| Schwab U.S. Mid-Cap Index Fund | 14,728,113 |
| Schwab International Index Fund | — |
| Schwab S&P 500 Index Fund | $— |
| Schwab 1000 Index Fund | 492,784 |
| Schwab Small-Cap Index Fund | 10,960,111 |
| Schwab Total Stock Market Index Fund | 10,371,753 |
| Schwab U.S. Large-Cap Growth Index Fund | 181,594 |
| Schwab U.S. Large-Cap Value Index Fund | 424,790 |
| Schwab U.S. Mid-Cap Index Fund | 1,143,524 |
| Schwab International Index Fund | — |
| Proposal
– To elect each of the following individuals as trustees of the Trust: |
For | Withheld |
| Walter W. Bettinger II | 1,095,577,106.505 | 115,838,980.968 |
| Richard A. Wurster | 1,117,598,789.555 | 93,817,297.918 |
| Michael J. Beer | 1,116,890,447.505 | 94,525,639.968 |
| Robert W. Burns | 1,117,915,860.110 | 93,500,227.363 |
| Nancy F. Heller | 1,119,878,732.134 | 91,537,355.339 |
| David L. Mahoney | 1,069,125,022.434 | 142,291,065.039 |
| Jane P. Moncreiff | 1,120,187,927.838 | 91,228,159.635 |
| Kiran M. Patel | 1,116,689,111.571 | 94,726,975.902 |
| Kimberly S. Patmore | 1,119,941,056.059 | 91,475,031.414 |
| J. Derek Penn | 1,117,666,014.121 | 93,750,073.352 |
| Proposal
– To elect each of the following individuals as trustees of the Trust: |
For | Withheld |
| Walter W. Bettinger II | 423,830,446.945 | 41,037,210.315 |
| Richard A. Wurster | 449,247,822.632 | 15,619,834.628 |
| Michael J. Beer | 449,188,616.594 | 15,679,040.666 |
| Robert W. Burns | 449,093,044.919 | 15,774,612.341 |
| Nancy F. Heller | 450,193,833.945 | 14,673,823.315 |
| David L. Mahoney | 419,552,571.056 | 45,315,086.204 |
| Jane P. Moncreiff | 450,325,483.733 | 14,542,173.527 |
| Kiran M. Patel | 448,721,580.221 | 16,146,077.039 |
| Kimberly S. Patmore | 449,526,424.435 | 15,341,232.825 |
| J. Derek Penn | 449,384,537.556 | 15,483,119.704 |
| Independent Trustees | |||
| Name,
Year of Birth, and Position(s) with the trust (Terms of office, and length of Time Served1) |
Principal
Occupations During the Past Five Years |
Number
of Portfolios in Fund Complex Overseen by the Trustee |
Other Directorships |
|
Michael J. Beer 1961 Trustee (Trustee of The Charles Schwab Family of Funds, Schwab Investments, Schwab Capital Trust, Schwab Annuity Portfolios, Schwab Strategic Trust and Laudus Trust since 2022) |
Retired. Director, President and Chief Executive Officer (Dec. 2016 – Sept. 2019), Principal Funds (investment management). | 105 | Director (2016 – 2019), Principal Funds, Inc. |
| Robert
W. Burns 1959 Trustee (Trustee of Schwab Strategic Trust since 2009; The Charles Schwab Family of Funds, Schwab Investments, Schwab Capital Trust, Schwab Annuity Portfolios and Laudus Trust since 2016) |
Retired/Private Investor. | 105 | None |
| Nancy
F. Heller 1956 Trustee (Trustee of The Charles Schwab Family of Funds, Schwab Investments, Schwab Capital Trust, Schwab Annuity Portfolios, Schwab Strategic Trust and Laudus Trust since 2018) |
Retired. | 105 | None |
| David
L. Mahoney 1954 Trustee (Trustee of The Charles Schwab Family of Funds, Schwab Investments, Schwab Capital Trust, Schwab Annuity Portfolios and Laudus Trust since 2011; Schwab Strategic Trust since 2016) |
Private Investor. | 105 | Director
(2004 – present), Corcept Therapeutics Incorporated Director (2009 – 2021), Adamas Pharmaceuticals, Inc. Director (2003 – 2019), Symantec Corporation |
| Jane
P. Moncreiff 1961 Trustee (Trustee of The Charles Schwab Family of Funds, Schwab Investments, Schwab Capital Trust, Schwab Annuity Portfolios, Schwab Strategic Trust and Laudus Trust since 2019) |
Consultant (2018 – present), Fulham Advisers LLC (management consulting); Chief Investment Officer (2009 – 2017), CareGroup Healthcare System, Inc. (healthcare). | 105 | None |
| Independent Trustees (continued) | |||
| Name,
Year of Birth, and Position(s) with the trust (Terms of office, and length of Time Served1) |
Principal
Occupations During the Past Five Years |
Number
of Portfolios in Fund Complex Overseen by the Trustee |
Other Directorships |
| Kiran
M. Patel 1948 Trustee (Trustee of The Charles Schwab Family of Funds, Schwab Investments, Schwab Capital Trust, Schwab Annuity Portfolios and Laudus Trust since 2011; Schwab Strategic Trust since 2016) |
Retired. | 105 | Director (2008 – present), KLA-Tencor Corporation |
| Kimberly
S. Patmore 1956 Trustee (Trustee of The Charles Schwab Family of Funds, Schwab Investments, Schwab Capital Trust, Schwab Annuity Portfolios, Schwab Strategic Trust and Laudus Trust since 2016) |
Consultant (2008 – present), Patmore Management Consulting (management consulting). | 105 | None |
|
J. Derek Penn 1957 Trustee (Trustee of The Charles Schwab Family of Funds, Schwab Investments, Schwab Capital Trust, Schwab Annuity Portfolios, Schwab Strategic Trust and Laudus Trust since 2021) |
Head of Equity Sales and Trading (2006 – 2018), BNY Mellon (financial services). | 105 | None |
| Interested Trustees | |||
| Name,
Year of Birth, and Position(s) with the trust (Terms of office, and length of Time Served1) |
Principal
Occupations During the Past Five Years |
Number
of Portfolios in Fund Complex Overseen by the Trustee |
Other Directorships |
| Walter
W. Bettinger II2 1960 Chairman and Trustee (Trustee of The Charles Schwab Family of Funds, Schwab Investments, Schwab Capital Trust and Schwab Annuity Portfolios since 2008; Schwab Strategic Trust since 2009; Laudus Trust since 2010) |
Co-Chairman of the Board (July 2022 – present), Director and Chief Executive Officer (Oct. 2008 – present) and President (Feb. 2007 – Oct. 2021), The Charles Schwab Corporation; President and Chief Executive Officer (Oct. 2008 – Oct. 2021) and Director (May 2008 – Oct. 2021), Charles Schwab & Co., Inc.; Director (Apr. 2006 – present), Charles Schwab Bank, SSB; Director (Nov. 2017 – present), Charles Schwab Premier Bank, SSB; Director (July 2019 – present), Charles Schwab Trust Bank; Director (May 2008 – present), Chief Executive Officer (Aug. 2017 – present) and President (Aug. 2017 – Nov. 2021), Schwab Holdings, Inc.; Director (Oct. 2020 – present), TD Ameritrade Holding Corporation; Director (July 2016 – Oct. 2021), Charles Schwab Investment Management, Inc. | 105 | Director (2008 – present), The Charles Schwab Corporation |
| Interested Trustees (continued) | |||
| Name,
Year of Birth, and Position(s) with the trust (Terms of office, and length of Time Served1) |
Principal
Occupations During the Past Five Years |
Number
of Portfolios in Fund Complex Overseen by the Trustee |
Other Directorships |
| Richard
A. Wurster2 1973 Trustee (Trustee of The Charles Schwab Family of Funds, Schwab Investments, Schwab Capital Trust, Schwab Annuity Portfolios, Schwab Strategic Trust and Laudus Trust since 2022) |
President (Oct. 2021 – present) and Executive Vice President – Schwab Asset Management Solutions (Apr. 2019 – Oct. 2021), The Charles Schwab Corporation; President, Director (Oct. 2021 – present), Executive Vice President – Schwab Asset Management Solutions (July 2019 – Oct. 2021) and Senior Vice President – Advisory (May 2016 – July 2019), Charles Schwab & Co., Inc.; President (Nov. 2021 – present), Schwab Holdings, Inc.; Director (Oct. 2021 – present) and Chief Executive Officer (Nov. 2019 – Jan. 2022), Charles Schwab Investment Management, Inc.; Director, Chief Executive Officer and President (Mar. 2018 – Oct. 2022), Charles Schwab Investment Advisory, Inc.; Chief Executive Officer (July 2016 – Apr. 2018) and President (Mar. 2017 – Apr. 2018), ThomasPartners, Inc.; Chief Executive Officer (July 2016 – Apr. 2018), Windhaven Investment Management, Inc. | 105 | None |
| Officers of the Trust | |
| Name,
Year of Birth, and Position(s) with the trust (Terms of office, and length of Time Served3) |
Principal Occupations During the Past Five Years |
| Jonathan
de St. Paer 1973 President and Chief Executive Officer (Officer of The Charles Schwab Family of Funds, Schwab Investments, Schwab Capital Trust, Schwab Annuity Portfolios, Schwab Strategic Trust and Laudus Trust since 2018) |
Director (Apr. 2019 – present), President (Oct. 2018 – present), Chief Operating Officer (Jan. 2021 – present), and Chief Executive Officer (Apr. 2019 – Nov. 2019), Charles Schwab Investment Management, Inc.; Senior Vice President (June 2020 – Mar. 2022) and Chief Operating Officer (Jan. 2021 – Mar. 2022), Charles Schwab Investment Advisory, Inc.; Chief Executive Officer (Apr. 2019 – present), President (Nov. 2018 – present) and Trustee (Apr. 2019 – Dec. 2020), Schwab Funds, Laudus Trust and Schwab ETFs; Managing Director (May 2022 – present), Senior Vice President (Apr. 2019 – May 2022) and Senior Vice President – Strategy and Product Development (CSIM) (Jan. 2014 – Mar. 2019), Charles Schwab & Co., Inc. |
| Mark
Fischer 1970 Treasurer, Chief Financial Officer and Chief Operating Officer (Officer of The Charles Schwab Family of Funds, Schwab Investments, Schwab Capital Trust, Schwab Annuity Portfolios, Schwab Strategic Trust and Laudus Trust since 2013) |
Treasurer and Chief Financial Officer (Jan. 2016 – present) and Chief Operating Officer (Dec. 2020 – present), Schwab Funds, Laudus Trust and Schwab ETFs; Chief Financial Officer (Mar. 2020 – present) and Vice President (Oct. 2013 – present), Charles Schwab Investment Management, Inc. |
| Omar
Aguilar 1970 Vice President and Chief Investment Officer (Officer of The Charles Schwab Family of Funds, Schwab Investments, Schwab Capital Trust, Schwab Annuity Portfolios, Schwab Strategic Trust and Laudus Trust since 2011) |
Chief Executive Officer (Jan. 2022 – present), Chief Investment Officer (Apr. 2011 – present) and Senior Vice President (Apr. 2011 – Dec. 2021), Charles Schwab Investment Management, Inc.; Director, Chief Executive Officer and President (Oct. 2022 – present), Charles Schwab Investment Advisory, Inc.; Vice President and Chief Investment Officer (June 2011 – present), Schwab Funds, Laudus Trust and Schwab ETFs. |
| Brett
Wander 1961 Vice President and Chief Investment Officer (Officer of The Charles Schwab Family of Funds, Schwab Investments, Schwab Capital Trust, Schwab Annuity Portfolios, Schwab Strategic Trust and Laudus Trust since 2011) |
Senior Vice President and Chief Investment Officer (Apr. 2011 – present), Charles Schwab Investment Management, Inc.; Vice President and Chief Investment Officer (June 2011 – present), Schwab Funds, Laudus Trust and Schwab ETFs. |
| William
P. McMahon, Jr. 1972 Vice President and Chief Investment Officer (Officer of The Charles Schwab Family of Funds, Schwab Investments, Schwab Capital Trust, Schwab Annuity Portfolios, Schwab Strategic Trust and Laudus Trust since 2021) |
Senior Vice President and Chief Investment Officer (Jan. 2020 – present), Charles Schwab Investment Management, Inc.; Vice President and Chief Investment Officer (June 2021 – present), Schwab Funds, Laudus Trust and Schwab ETFs; Senior Vice President and Chief Investment Officer – ThomasPartners Strategies (Apr. 2018 – Dec. 2019), Charles Schwab Investment Advisory, Inc.; Senior Vice President and Chief Investment Officer (May 2001 – Apr. 2018), ThomasPartners, Inc. |
| Officers of the Trust (continued) | |
| Name,
Year of Birth, and Position(s) with the trust (Terms of office, and length of Time Served3) |
Principal Occupations During the Past Five Years |
| Catherine
MacGregor 1964 Chief Legal Officer and Secretary, Schwab Funds and Schwab ETFs Chief Legal Officer, Vice President and Clerk, Laudus Trust (Officer of The Charles Schwab Family of Funds, Schwab Investments, Schwab Capital Trust, Schwab Annuity Portfolios and Laudus Trust since 2005; Schwab Strategic Trust since 2009) |
Chief Legal Officer (Mar. 2022 – present) and Vice President (Sept. 2005 – present), Charles Schwab Investment Management, Inc.; Managing Director (May 2022 – present) and Vice President (July 2005 – May 2022), Charles Schwab & Co., Inc.; Vice President (Dec. 2005 – present) and Chief Legal Officer and Clerk (Mar. 2007 – present), Laudus Trust; Chief Legal Officer and Secretary (Oct. 2021 – present), Vice President (Nov. 2005 – Oct. 2021) and Assistant Secretary (June 2007 – Oct. 2021), Schwab Funds; Chief Legal Officer and Secretary (Oct. 2021 – present), Vice President and Assistant Secretary (Oct. 2009 – Oct. 2021), Schwab ETFs. |
| 1 | Each Trustee shall hold office until the election and qualification of his or her successor, or until he or she dies, resigns or is removed. The retirement policy requires that each independent trustee retire by December 31 of the year in which the Trustee turns 74 or the Trustee’s twentieth year of service as an independent trustee on any trust in the Fund Complex, whichever occurs first. |
| 2 | Mr. Bettinger and Mr. Wurster are Interested Trustees. Mr. Bettinger and Mr. Wurster are Interested Trustees because each owns stock of The Charles Schwab Corporation (CSC), the parent company of Charles Schwab Investment Management, Inc., the investment adviser for the trusts in the Fund Complex, and is an employee of Charles Schwab & Co., Inc. (Schwab), the principal underwriter for The Charles Schwab Family of Funds, Schwab Investments, Schwab Capital Trust, Schwab Annuity Portfolios and Laudus Trust. |
| 3 | The President, Treasurer and Secretary/Clerk hold office until their respective successors are chosen and qualified or until he or she sooner dies, resigns, is removed or becomes disqualified. Each of the other officers serves at the pleasure of the Board. |
Schwab Funds
| ¹ | State, local, and the Federal Alternative Minimum Tax may apply. Capital gains are not exempt from Federal Taxation. |
| ² | You could lose money by investing in the Schwab Money Funds. All Schwab Money Funds with the exception of Schwab Variable Share Price Money Fund seek to preserve the value of your investment at $1.00 per share, but cannot guarantee they will do so. Because the share price of Schwab Variable Share Price Money Fund will fluctuate, when you sell your shares they may be worth more or less than what you originally paid for them. All Schwab Money Funds with the exception of Schwab Government Money Fund, Schwab Retirement Government Money Fund, Schwab U.S. Treasury Money Fund, Schwab Treasury Obligations Money Fund and Schwab Government Money Market Portfolio may impose a fee upon the sale of your shares or may temporarily suspend your ability to sell shares if the Fund’s liquidity falls below required minimums because of market conditions or other factors. An investment in the Schwab Money Funds is not insured or guaranteed by the Federal Deposit Insurance Corporation or any other government agency. The Schwab Money Funds’ sponsor has no legal obligation to provide financial support to the Funds, and you should not expect that the sponsor will provide financial support to the Funds at any time. |

US Large Company Index Fund
US Small Company Index Fund
Large Company Index Fund
Small Company Index Fund
Large Company Index Fund
| * | SCHWAB is a registered
trademark of Charles Schwab & Co., Inc. FUNDAMENTAL INDEX is a registered trademark of Research Affiliates LLC. |
| 1 | Source for category information: Morningstar, Inc. The Morningstar Category return represents all active and index mutual funds and ETFs within the category as of the report date. |
| 2 | The fund’s performance relative to the index may be affected by fair-value pricing and timing differences in foreign exchange calculations. See financial note 2 for more information. |
| 3 | The net version of the index reflects reinvested dividends net of withholding taxes but reflects no deductions for expenses or other taxes. |


| * | The net version of the index reflects reinvested dividends net of withholding taxes but reflects no deductions for expenses or other taxes. |

| * | The net version of the index reflects reinvested dividends net of withholding taxes but reflects no deductions for expenses or other taxes. |
 |
Christopher Bliss, CFA, Managing Director and Head of Passive Equity Strategies for Schwab Asset Management, is responsible for overseeing the investment process and portfolio management of investment strategies for passive equity Schwab Funds and Schwab ETFs. Before joining Schwab in 2016, Mr. Bliss spent 12 years at BlackRock (formerly Barclays Global Investors) managing and leading institutional index teams, most recently as a managing director and the head of the Americas institutional index team. In this role, Mr. Bliss was responsible for overseeing a team of portfolio managers managing domestic, developed international and emerging markets index strategies. Prior to BlackRock, he worked as an equity analyst and portfolio manager for Harris Bretall and before that, as a research analyst for JP Morgan. |
 |
Jeremy Brown, CFA, Senior Portfolio Manager, is responsible for the day-to-day co-management of the Schwab Fundamental US Large Company Index Fund and Schwab Fundamental US Small Company Index Fund. Prior to joining Schwab in 2017, Mr. Brown spent six years with ALPS Advisors, Inc. in Denver, most recently as a senior analyst on the ETF portfolio management and research team where he performed portfolio management, trading, and analytics/research functions for ALPS ETFs and passive funds. Additionally, Mr. Brown led a number of investment research, commentary, industry trend analysis, and sales and marketing support initiatives. |
 |
Chuck Craig, CFA, Senior Portfolio Manager, is responsible for the oversight and day-to-day co-management of the Schwab Fundamental International Large Company Index Fund, Schwab Fundamental International Small Company Index Fund, and Schwab Fundamental Emerging Markets Large Company Index Fund. Prior to joining Schwab in 2012, Mr. Craig worked at Guggenheim Funds (formerly Claymore Group), where he spent more than five years as a managing director of portfolio management and supervision, and three years as vice president of product research and development. Prior to that, he worked as an equity research analyst at First Trust Portfolios (formerly Niké Securities), and a trader and analyst at PMA Securities, Inc. |
 |
Ferian Juwono, CFA, Senior Portfolio Manager, is responsible for the day-to-day co-management of the Schwab Fundamental US Large Company Index Fund and Schwab Fundamental US Small Company Index Fund. Prior to joining Schwab in 2010, Mr. Juwono worked at BlackRock (formerly Barclays Global Investors) where he spent more than three years as a portfolio manager, managing equity index funds for institutional clients, and two years as a senior business analyst. Prior to that, Mr. Juwono worked for more than four years as a senior financial analyst with Union Bank of California. |
 |
David Rios, Portfolio Manager, is responsible for the day-to-day co-management of the Schwab Fundamental International Large Company Index Fund, Schwab Fundamental International Small Company Index Fund, and Schwab Fundamental Emerging Markets Large Company Index Fund. Prior to this role, Mr. Rios was an associate portfolio manager on the equity index strategies team for four years. His first role with Schwab Asset Management was as a trade operations specialist. Prior to joining Schwab in 2008, Mr. Rios was a senior fund accountant at Investors Bank & Trust (subsequently acquired by State Street Corporation). |
 |
Sabya Sinha, Portfolio Manager, is responsible for the day-to-day co-management of the Schwab Fundamental US Large Company Index Fund and Schwab Fundamental US Small Company Index Fund. Prior to joining Schwab in 2015, Mr. Sinha spent a year at F-Squared Investments on the product development and analytics team. Prior to F-Squared, he worked at IndexIQ Advisors as a senior index portfolio manager for three years and for Bank of America’s Columbia Management subsidiary as a portfolio manager for three years. Mr. Sinha also spent time as a software consultant at DPM Mellon, LLC and an equity trader at Jane Street Capital. |

| Fund and Inception Date | 1 Year | 5 Years | 10 Years |
| Fund: Schwab Fundamental US Large Company Index Fund (4/2/07) | -4.18% | 10.84% | 12.40% |
| Russell RAFITM US Large Company Index | -3.88% | 11.10% | 12.74% |
| Russell 1000® Index | -16.38% | 10.19% | 12.66% |
| Fund Category: Morningstar Large Value2 | -4.53% | 7.67% | 10.21% |
| Fund Expense Ratio3: 0.25% | |||
| 1 | Performance does not reflect the deduction of taxes that a shareholder would pay on fund distributions or the redemption of fund shares. |
| 2 | Source for category information: Morningstar, Inc. The Morningstar Category return represents all active and index mutual funds and ETFs within the category as of the report date. |
| 3 | As stated in the prospectus. |
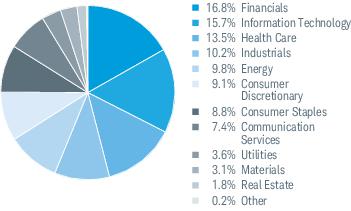
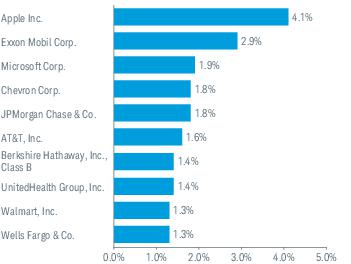
| 1 | Excludes derivatives. |
| 2 | Portfolio turnover rate excludes in-kind transactions. |
| 3 | The percentage may differ from the Portfolio Holdings because the above calculation is based on a percentage of total investments, excluding derivatives, whereas the calculation in the Portfolio Holdings is based on a percentage of net assets. |
| 4 | This list is not a recommendation of any security by the investment adviser. |
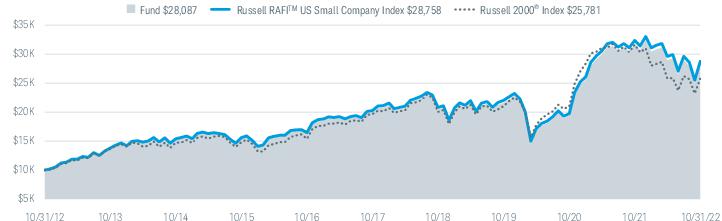
| Fund and Inception Date | 1 Year | 5 Years | 10 Years |
| Fund: Schwab Fundamental US Small Company Index Fund (4/2/07) | -11.37% | 7.05% | 10.88% |
| Russell RAFITM US Small Company Index | -11.18% | 7.24% | 11.14% |
| Russell 2000® Index | -18.54% | 5.56% | 9.93% |
| Fund Category: Morningstar Small Blend2 | -13.55% | 5.76% | 9.75% |
| Fund Expense Ratio3: 0.25% | |||
| 1 | Performance does not reflect the deduction of taxes that a shareholder would pay on fund distributions or the redemption of fund shares. |
| 2 | Source for category information: Morningstar, Inc. The Morningstar Category return represents all active and index mutual funds and ETFs within the category as of the report date. |
| 3 | As stated in the prospectus. |

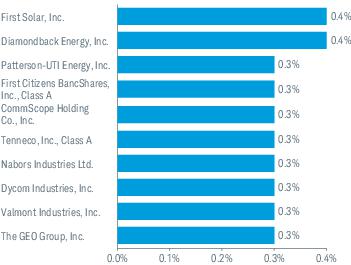
| 1 | Excludes derivatives. |
| 2 | Portfolio turnover rate excludes in-kind transactions. |
| 3 | The percentage may differ from the Portfolio Holdings because the above calculation is based on a percentage of total investments, excluding derivatives, whereas the calculation in the Portfolio Holdings is based on a percentage of net assets. |
| 4 | This list is not a recommendation of any security by the investment adviser. |
| 1 | The total return cited for the index reflects reinvested dividends net of withholding taxes but reflects no deductions for expenses or other taxes. |
| 2 | Typically, the securities in the index are valued using foreign exchange rates obtained at the close of the London foreign currency exchange (11:00 AM EST). Securities in the fund, however, are valued using foreign exchange rates obtained at the close of the New York foreign currency exchange (4:00 PM EST). This difference in closing times can result in different foreign currency exchange rates between the two exchanges, and thus different foreign currency exchange rates used in the valuation of the index’s and fund’s securities. |
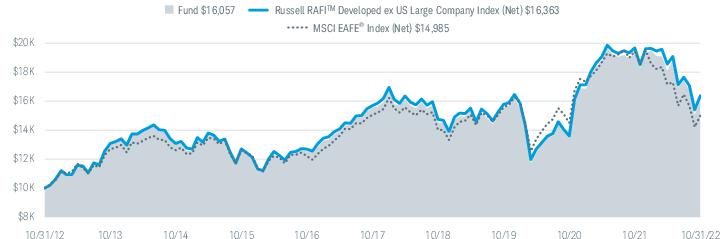
| Fund and Inception Date | 1 Year | 5 Years | 10 Years |
| Fund: Schwab Fundamental International Large Company Index Fund (4/2/07) | -17.25% | 0.67% | 4.85% |
| Russell RAFITM Developed ex US Large Company Index (Net)2 | -16.82% | 0.84% | 5.05% |
| MSCI EAFE® Index (Net)2 | -23.00% | -0.09% | 4.13% |
| Fund Category: Morningstar Foreign Large Value4 | -18.49% | -1.08% | 3.04% |
| Fund Expense Ratio5: 0.25% | |||
| 1 | Performance does not reflect the deduction of taxes that a shareholder would pay on fund distributions or the redemption of fund shares. |
| 2 | The net version of the index reflects reinvested dividends net of withholding taxes but reflects no deductions for expenses or other taxes. |
| 3 | The fund’s performance relative to the index may be affected by fair-value pricing. See financial note 2 for more information. |
| 4 | Source for category information: Morningstar, Inc. The Morningstar Category return represents all active and index mutual funds and ETFs within the category as of the report date. |
| 5 | As stated in the prospectus. |
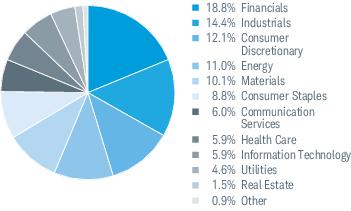
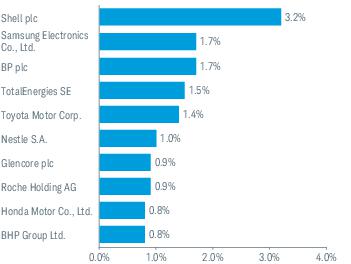
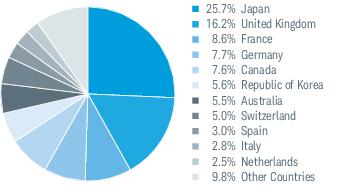
| 1 | Excludes derivatives. |
| 2 | This list is not a recommendation of any security by the investment adviser. |
| 3 | The percentage may differ from the Portfolio Holdings because the above calculation is based on a percentage of total investments, excluding derivatives, whereas the calculation in the Portfolio Holdings is based on a percentage of net assets. |
| 1 | The total return cited for the index reflects reinvested dividends net of withholding taxes but reflects no deductions for expenses or other taxes. |
| 2 | Typically, the securities in the index are valued using foreign exchange rates obtained at the close of the London foreign currency exchange (11:00 AM EST). Securities in the fund, however, are valued using foreign exchange rates obtained at the close of the New York foreign currency exchange (4:00 PM EST). This difference in closing times can result in different foreign currency exchange rates between the two exchanges, and thus different foreign currency exchange rates used in the valuation of the index’s and fund’s securities. |
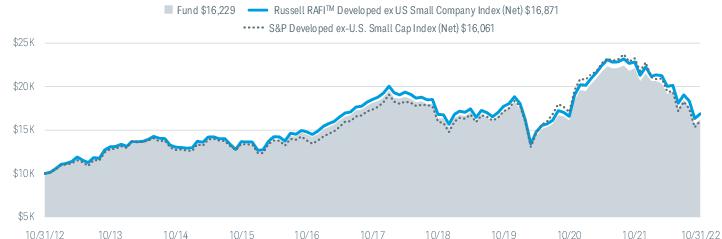
| Fund and Inception Date | 1 Year | 5 Years | 10 Years |
| Fund: Schwab Fundamental International Small Company Index Fund (1/31/08) | -26.61% | -2.19% | 4.96% |
| Russell RAFITM Developed ex US Small Company Index (Net)2 | -26.14% | -1.86% | 5.37% |
| S&P Developed ex-U.S. Small Cap Index (Net)2 | -30.95% | -1.55% | 4.85% |
| Fund Category: Morningstar Foreign Small/Mid Value4 | -21.18% | -1.47% | 4.17% |
| Fund Expense Ratio5: 0.39% | |||
| 1 | Performance does not reflect the deduction of taxes that a shareholder would pay on fund distributions or the redemption of fund shares. |
| 2 | The net version of the index reflects reinvested dividends net of withholding taxes but reflects no deductions for expenses or other taxes. |
| 3 | The fund’s performance relative to the index may be affected by fair-value pricing. See financial note 2 for more information. |
| 4 | Source for category information: Morningstar, Inc. The Morningstar Category return represents all active and index mutual funds and ETFs within the category as of the report date. |
| 5 | As stated in the prospectus. |

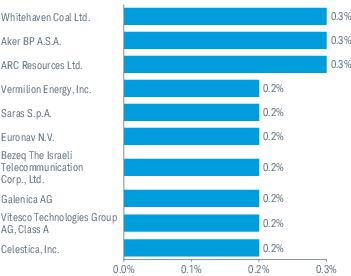
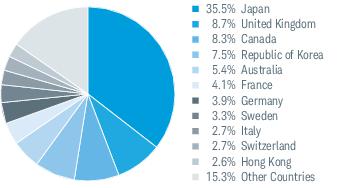
| 1 | Excludes derivatives. |
| 2 | This list is not a recommendation of any security by the investment adviser. |
| 3 | The percentage may differ from the Portfolio Holdings because the above calculation is based on a percentage of total investments, excluding derivatives, whereas the calculation in the Portfolio Holdings is based on a percentage of net assets. |
| 1 | The total return cited for the index reflects reinvested dividends net of withholding taxes but reflects no deductions for expenses or other taxes. |
| 2 | Typically, the securities in the index are valued using foreign exchange rates obtained at the close of the London foreign currency exchange (11:00 AM EST). Securities in the fund, however, are valued using foreign exchange rates obtained at the close of the New York foreign currency exchange (4:00 PM EST). This difference in closing times can result in different foreign currency exchange rates between the two exchanges, and thus different foreign currency exchange rates used in the valuation of the index’s and fund’s securities. |
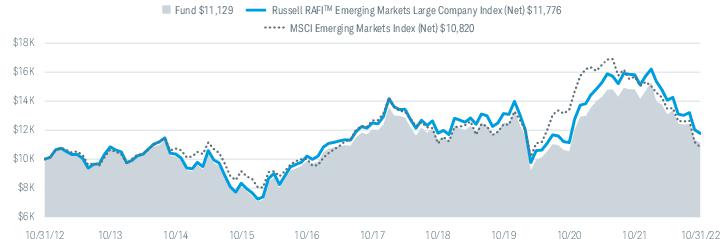
| Fund and Inception Date | 1 Year | 5 Years | 10 Years |
| Fund: Schwab Fundamental Emerging Markets Large Company Index Fund (1/31/08) | -24.86% | -1.55% | 1.08% |
| Russell RAFITM Emerging Markets Large Company Index (Net)2 | -25.58% | -1.17% | 1.65% |
| MSCI Emerging Markets Index (Net)2 | -31.03% | -3.09% | 0.79% |
| Fund Category: Morningstar Diversified Emerging Markets4 | -30.38% | -2.59% | 1.01% |
| Fund Expense Ratio5: 0.39% | |||
| 1 | Performance does not reflect the deduction of taxes that a shareholder would pay on fund distributions or the redemption of fund shares. |
| 2 | The net version of the index reflects reinvested dividends net of withholding taxes but reflects no deductions for expenses or other taxes. |
| 3 | The fund’s performance relative to the index may be affected by fair-value pricing. See financial note 2 for more information. |
| 4 | Source for category information: Morningstar, Inc. The Morningstar Category return represents all active and index mutual funds and ETFs within the category as of the report date. |
| 5 | As stated in the prospectus. |
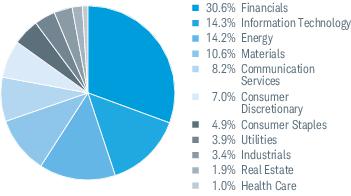
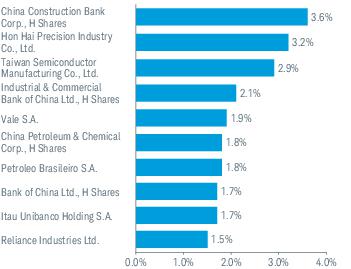
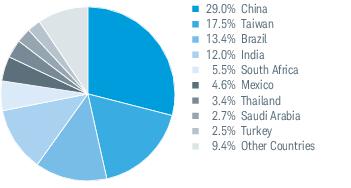
| 1 | Excludes derivatives. |
| 2 | This list is not a recommendation of any security by the investment adviser. |
| 3 | The percentage may differ from the Portfolio Holdings because the above calculation is based on a percentage of total investments, excluding derivatives, whereas the calculation in the Portfolio Holdings is based on a percentage of net assets. |
| EXPENSE
RATIO (ANNUALIZED) 1 |
BEGINNING
ACCOUNT VALUE AT 5/1/22 |
ENDING
ACCOUNT VALUE (NET OF EXPENSES) AT 10/31/22 |
EXPENSES
PAID DURING PERIOD 5/1/22-10/31/22 2 | |
| Schwab Fundamental US Large Company Index Fund | ||||
| Actual Return | 0.25% | $1,000.00 | $ 976.90 | $1.25 |
| Hypothetical 5% Return | 0.25% | $1,000.00 | $1,023.95 | $1.28 |
| Schwab Fundamental US Small Company Index Fund | ||||
| Actual Return | 0.25% | $1,000.00 | $ 970.00 | $1.24 |
| Hypothetical 5% Return | 0.25% | $1,000.00 | $1,023.95 | $1.28 |
| Schwab Fundamental International Large Company Index Fund | ||||
| Actual Return | 0.25% | $1,000.00 | $ 887.10 | $1.19 |
| Hypothetical 5% Return | 0.25% | $1,000.00 | $1,023.95 | $1.28 |
| Schwab Fundamental International Small Company Index Fund | ||||
| Actual Return | 0.39% | $1,000.00 | $ 847.40 | $1.82 |
| Hypothetical 5% Return | 0.39% | $1,000.00 | $1,023.24 | $1.99 |
| Schwab Fundamental Emerging Markets Large Company Index Fund | ||||
| Actual Return | 0.39% | $1,000.00 | $ 850.70 | $1.82 |
| Hypothetical 5% Return | 0.39% | $1,000.00 | $1,023.24 | $1.99 |
| 1 | Based on the most recent six-month expense ratio. |
| 2 | Expenses for each fund are equal to its annualized expense ratio, multiplied by the average account value over the period, multiplied by the 184 days of the period, and divided by the 365 days of the fiscal year. |
| 11/1/21–
10/31/22 |
11/1/20–
10/31/21 |
11/1/19–
10/31/20 |
11/1/18–
10/31/19 |
11/1/17–
10/31/18 |
||
| Per-Share Data | ||||||
| Net asset value at beginning of period | $23.19 | $16.28 | $17.56 | $17.47 | $16.89 | |
| Income (loss) from investment operations: | ||||||
| Net investment income (loss)1 | 0.43 | 0.39 | 0.42 | 0.42 | 0.38 | |
| Net realized and unrealized gains (losses) | (1.33) | 7.64 | (0.75) | 1.08 | 0.76 | |
| Total from investment operations | (0.90) | 8.03 | (0.33) | 1.50 | 1.14 | |
| Less distributions: | ||||||
| Distributions from net investment income | (0.40) | (0.44) | (0.43) | (0.42) | (0.36) | |
| Distributions from net realized gains | (0.70) | (0.68) | (0.52) | (0.99) | (0.20) | |
| Total distributions | (1.10) | (1.12) | (0.95) | (1.41) | (0.56) | |
| Net asset value at end of period | $21.19 | $23.19 | $16.28 | $17.56 | $17.47 | |
| Total return | (4.18%) | 51.33% | (2.33%) | 10.56% | 6.83% | |
| Ratios/Supplemental Data | ||||||
| Ratios to average net assets: | ||||||
| Total expenses | 0.25% 2 | 0.25% | 0.25% | 0.25% | 0.25% | |
| Net investment income (loss) | 1.95% | 1.87% | 2.57% | 2.53% | 2.17% | |
| Portfolio turnover rate | 13% 3 | 16% 3 | 13% | 20% | 10% | |
| Net assets, end of period (x 1,000,000) | $6,460 | $6,821 | $4,547 | $5,237 | $4,887 | |
| 1 | Calculated based on the average shares outstanding during the period. |
| 2 | Ratio includes less than 0.005% of non-routine proxy expenses. |
| 3 | Portfolio turnover rate excludes in-kind transactions. |
| SECURITY | VALUE
AT 10/31/21 |
PURCHASES | SALES | REALIZED
GAINS (LOSSES) |
NET
CHANGE IN UNREALIZED APPRECIATION (DEPRECIATION) |
VALUE
AT 10/31/22 |
BALANCE
OF SHARES HELD AT 10/31/22 |
DIVIDENDS
RECEIVED |
| COMMON STOCKS 0.1% OF NET ASSETS | ||||||||
| Diversified Financials 0.1% | ||||||||
| The Charles Schwab Corp. | $7,138,251 | $1,173,243 | ($1,717,031) | $970,644 | ($1,017,428) | $6,547,679 | 82,185 | $62,429 |
| DESCRIPTION | QUOTED
PRICES IN ACTIVE MARKETS FOR IDENTICAL ASSETS (LEVEL 1) |
OTHER
SIGNIFICANT OBSERVABLE INPUTS (LEVEL 2) |
SIGNIFICANT
UNOBSERVABLE INPUTS (LEVEL 3) |
TOTAL |
| Assets | ||||
| Common Stocks1 | $6,445,361,530 | $— | $— | $6,445,361,530 |
| Short-Term Investments1 | 14,010,312 | — | — | 14,010,312 |
| Futures Contracts2 | 435,721 | — | — | 435,721 |
| Total | $6,459,807,563 | $— | $— | $6,459,807,563 |
| 1 | As categorized in the Portfolio Holdings. |
| 2 | Futures contracts are reported at cumulative unrealized appreciation or depreciation. |
| Assets | ||
| Investments in securities, at value - affiliated (cost $2,326,386) | $6,547,679 | |
| Investments in securities, at value - unaffiliated (cost $3,927,842,530) including securities on loan of $1,058,279 | 6,452,824,163 | |
| Cash | 2,244,476 | |
| Deposit with broker for futures contracts | 1,560,000 | |
| Receivables: | ||
| Fund shares sold | 12,482,631 | |
| Dividends | 7,014,564 | |
| Income from securities on loan | + | 7,144 |
| Total assets | 6,482,680,657 | |
| Liabilities | ||
| Collateral held for securities on loan | 1,099,962 | |
| Payables: | ||
| Fund shares redeemed | 19,815,380 | |
| Investment adviser fees | 1,216,015 | |
| Variation margin on futures contracts | + | 170,968 |
| Total liabilities | 22,302,325 | |
| Net assets | $6,460,378,332 | |
| Net Assets by Source | ||
| Capital received from investors | $3,981,828,678 | |
| Total distributable earnings | + | 2,478,549,654 |
| Net assets | $6,460,378,332 | |
| Net Asset Value (NAV) | ||||
| Net Assets | ÷ | Shares
Outstanding |
= | NAV |
| $6,460,378,332 | 304,807,614 | $21.19 | ||
| For the period November 1, 2021 through October 31, 2022 | ||
| Investment Income | ||
| Dividends received from securities - unaffiliated (net of foreign withholding tax of $21,682) | $148,792,888 | |
| Dividends received from securities - affiliated | 62,429 | |
| Interest received from securities - unaffiliated | 11,652 | |
| Securities on loan, net | + | 47,141 |
| Total investment income | 148,914,110 | |
| Expenses | ||
| Investment adviser fees | 16,882,430 | |
| Proxy fees1 | + | 293,924 |
| Total expenses | – | 17,176,354 |
| Net investment income | 131,737,756 | |
| REALIZED AND UNREALIZED GAINS (LOSSES) | ||
| Net realized gains on sales of securities - affiliated | 970,644 | |
| Net realized losses on sales of securities - unaffiliated | (38,768,965) | |
| Net realized gains on sales of in-kind redemptions - unaffiliated | 394,741,998 | |
| Net realized losses on futures contracts | + | (11,452,437) |
| Net realized gains | 345,491,240 | |
| Net change in unrealized appreciation (depreciation) on securities - affiliated | (1,017,428) | |
| Net change in unrealized appreciation (depreciation) on securities - unaffiliated | (773,475,449) | |
| Net change in unrealized appreciation (depreciation) on futures contracts | + | 29,817 |
| Net change in unrealized appreciation (depreciation) | + | (774,463,060) |
| Net realized and unrealized losses | (428,971,820) | |
| Decrease in net assets resulting from operations | ($297,234,064) | |
| 1 | Proxy fees are non-routine expenses (see financial note 2(e) for additional information). |
| OPERATIONS | |||
| 11/1/21-10/31/22 | 11/1/20-10/31/21 | ||
| Net investment income | $131,737,756 | $114,455,556 | |
| Net realized gains | 345,491,240 | 318,274,828 | |
| Net change in unrealized appreciation (depreciation) | + | (774,463,060) | 1,865,374,095 |
| Increase (decrease) in net assets resulting from operations | ($297,234,064) | $2,298,104,479 | |
| DISTRIBUTIONS TO SHAREHOLDERS | |||
| Total distributions | ($324,469,338) | ($308,556,282) | |
| TRANSACTIONS IN FUND SHARES | |||||
| 11/1/21-10/31/22 | 11/1/20-10/31/21 | ||||
| SHARES | VALUE | SHARES | VALUE | ||
| Shares sold | 97,191,423 | $2,125,844,925 | 81,564,828 | $1,719,788,331 | |
| Shares reinvested | 9,796,275 | 221,297,842 | 10,503,858 | 189,909,742 | |
| Shares redeemed | + | (96,242,413) | (2,085,588,810) | (77,335,254) | (1,626,034,240) |
| Net transactions in fund shares | 10,745,285 | $261,553,957 | 14,733,432 | $283,663,833 | |
| SHARES OUTSTANDING AND NET ASSETS | |||||
| 11/1/21-10/31/22 | 11/1/20-10/31/21 | ||||
| SHARES | NET ASSETS | SHARES | NET ASSETS | ||
| Beginning of period | 294,062,329 | $6,820,527,777 | 279,328,897 | $4,547,315,747 | |
| Total increase (decrease) | + | 10,745,285 | (360,149,445) | 14,733,432 | 2,273,212,030 |
| End of period | 304,807,614 | $6,460,378,332 | 294,062,329 | $6,820,527,777 | |
| 11/1/21–
10/31/22 |
11/1/20–
10/31/21 |
11/1/19–
10/31/20 |
11/1/18–
10/31/19 |
11/1/17–
10/31/18 |
||
| Per-Share Data | ||||||
| Net asset value at beginning of period | $19.32 | $11.97 | $13.85 | $14.68 | $15.32 | |
| Income (loss) from investment operations: | ||||||
| Net investment income (loss)1 | 0.22 | 0.18 | 0.17 | 0.20 | 0.22 | |
| Net realized and unrealized gains (losses) | (2.17) | 7.38 | (1.53) | 0.32 | 0.17 | |
| Total from investment operations | (1.95) | 7.56 | (1.36) | 0.52 | 0.39 | |
| Less distributions: | ||||||
| Distributions from net investment income | (0.24) | (0.21) | (0.20) | (0.22) | (0.21) | |
| Distributions from net realized gains | (1.91) | — | (0.32) | (1.13) | (0.82) | |
| Total distributions | (2.15) | (0.21) | (0.52) | (1.35) | (1.03) | |
| Net asset value at end of period | $15.22 | $19.32 | $11.97 | $13.85 | $14.68 | |
| Total return | (11.37%) | 63.73% | (10.42%) | 5.61% | 2.40% | |
| Ratios/Supplemental Data | ||||||
| Ratios to average net assets: | ||||||
| Total expenses | 0.25% 2 | 0.25% | 0.25% | 0.25% | 0.25% | |
| Net investment income (loss) | 1.35% | 1.02% | 1.43% | 1.50% | 1.42% | |
| Portfolio turnover rate | 35% 3 | 36% 3 | 28% | 34% | 30% | |
| Net assets, end of period (x 1,000,000) | $1,631 | $1,945 | $1,394 | $1,908 | $1,782 | |
| 1 | Calculated based on the average shares outstanding during the period. |
| 2 | Ratio includes less than 0.005% of non-routine proxy expenses. |
| 3 | Portfolio turnover rate excludes in-kind transactions. |
| DESCRIPTION | QUOTED
PRICES IN ACTIVE MARKETS FOR IDENTICAL ASSETS (LEVEL 1) |
OTHER
SIGNIFICANT OBSERVABLE INPUTS (LEVEL 2) |
SIGNIFICANT
UNOBSERVABLE INPUTS (LEVEL 3) |
TOTAL |
| Assets | ||||
| Common Stocks1 | $1,497,411,933 | $— | $— | $1,497,411,933 |
| Real Estate | 132,009,819 | — | 0* | 132,009,819 |
| Short-Term Investments1 | 22,994,964 | — | — | 22,994,964 |
| Futures Contracts2 | 70,241 | — | — | 70,241 |
| Total | $1,652,486,957 | $— | $0* | $1,652,486,957 |
| * | Level 3 amount shown includes securities determined to have no value at October 31, 2022. |
| 1 | As categorized in the Portfolio Holdings. |
| 2 | Futures contracts are reported at cumulative unrealized appreciation or depreciation. |
| Assets | ||
| Investments in securities, at value - unaffiliated (cost $1,313,319,149) including securities on loan of $13,510,408 | $1,652,416,716 | |
| Foreign currency, at value (cost $34) | 23 | |
| Deposit with broker for futures contracts | 577,500 | |
| Receivables: | ||
| Fund shares sold | 1,918,757 | |
| Dividends | 593,110 | |
| Income from securities on loan | 75,852 | |
| Variation margin on future contracts | + | 6,441 |
| Total assets | 1,655,588,399 | |
| Liabilities | ||
| Collateral held for securities on loan | 14,043,476 | |
| Payables: | ||
| Investments bought | 5,523,128 | |
| Fund shares redeemed | 4,520,876 | |
| Investment adviser fees | + | 304,866 |
| Total liabilities | 24,392,346 | |
| Net assets | $1,631,196,053 | |
| Net Assets by Source | ||
| Capital received from investors | $1,271,011,958 | |
| Total distributable earnings | + | 360,184,095 |
| Net assets | $1,631,196,053 | |
| Net Asset Value (NAV) | ||||
| Net Assets | ÷ | Shares
Outstanding |
= | NAV |
| $1,631,196,053 | 107,153,100 | $15.22 | ||
| For the period November 1, 2021 through October 31, 2022 | ||
| Investment Income | ||
| Dividends received from securities - unaffiliated (net of foreign withholding tax of $9,568) | $27,256,470 | |
| Interest received from securities - unaffiliated | 4,296 | |
| Securities on loan, net | + | 612,429 |
| Total investment income | 27,873,195 | |
| Expenses | ||
| Investment adviser fees | 4,347,447 | |
| Proxy fees1 | + | 80,160 |
| Total expenses | – | 4,427,607 |
| Net investment income | 23,445,588 | |
| REALIZED AND UNREALIZED GAINS (LOSSES) | ||
| Net realized gains on sales of securities - unaffiliated | 78,234,626 | |
| Net realized gains on sales of in-kind redemptions - unaffiliated | 131,614,958 | |
| Net realized losses on futures contracts | + | (2,215,825) |
| Net realized gains | 207,633,759 | |
| Net change in unrealized appreciation (depreciation) on securities - unaffiliated | (445,702,431) | |
| Net change in unrealized appreciation (depreciation) on futures contracts | (35,606) | |
| Net change in unrealized appreciation (depreciation) on foreign currency translations | + | (3) |
| Net change in unrealized appreciation (depreciation) | + | (445,738,040) |
| Net realized and unrealized losses | (238,104,281) | |
| Decrease in net assets resulting from operations | ($214,658,693) | |
| 1 | Proxy fees are non-routine expenses (see financial note 2(e) for additional information). |
| OPERATIONS | |||
| 11/1/21-10/31/22 | 11/1/20-10/31/21 | ||
| Net investment income | $23,445,588 | $19,643,245 | |
| Net realized gains | 207,633,759 | 312,627,403 | |
| Net change in unrealized appreciation (depreciation) | + | (445,738,040) | 540,665,132 |
| Increase (decrease) in net assets resulting from operations | ($214,658,693) | $872,935,780 | |
| DISTRIBUTIONS TO SHAREHOLDERS | |||
| Total distributions | ($209,192,167) | ($24,462,415) | |
| TRANSACTIONS IN FUND SHARES | |||||
| 11/1/21-10/31/22 | 11/1/20-10/31/21 | ||||
| SHARES | VALUE | SHARES | VALUE | ||
| Shares sold | 39,427,994 | $631,702,221 | 33,185,229 | $573,288,196 | |
| Shares reinvested | 8,654,231 | 148,679,691 | 1,157,934 | 17,218,482 | |
| Shares redeemed | + | (41,616,527) | (670,809,902) | (50,160,481) | (887,504,519) |
| Net transactions in fund shares | 6,465,698 | $109,572,010 | (15,817,318) | ($296,997,841) | |
| SHARES OUTSTANDING AND NET ASSETS | |||||
| 11/1/21-10/31/22 | 11/1/20-10/31/21 | ||||
| SHARES | NET ASSETS | SHARES | NET ASSETS | ||
| Beginning of period | 100,687,402 | $1,945,474,903 | 116,504,720 | $1,393,999,379 | |
| Total increase (decrease) | + | 6,465,698 | (314,278,850) | (15,817,318) | 551,475,524 |
| End of period | 107,153,100 | $1,631,196,053 | 100,687,402 | $1,945,474,903 | |
| 11/1/21–
10/31/22 |
11/1/20–
10/31/21 |
11/1/19–
10/31/20 |
11/1/18–
10/31/19 |
11/1/17–
10/31/18 |
||
| Per-Share Data | ||||||
| Net asset value at beginning of period | $10.56 | $7.51 | $8.98 | $8.69 | $9.55 | |
| Income (loss) from investment operations: | ||||||
| Net investment income (loss)1 | 0.34 | 0.31 | 0.21 | 0.30 | 0.29 | |
| Net realized and unrealized gains (losses) | (2.10) | 2.96 | (1.35) | 0.27 | (0.89) | |
| Total from investment operations | (1.76) | 3.27 | (1.14) | 0.57 | (0.60) | |
| Less distributions: | ||||||
| Distributions from net investment income | (0.39) | (0.22) | (0.33) | (0.28) | (0.26) | |
| Net asset value at end of period | $8.41 | $10.56 | $7.51 | $8.98 | $8.69 | |
| Total return | (17.25%) | 44.03% | (13.29%) | 7.04% | (6.53%) | |
| Ratios/Supplemental Data | ||||||
| Ratios to average net assets: | ||||||
| Total expenses | 0.25% 2 | 0.25% | 0.25% | 0.25% | 0.25% | |
| Net investment income (loss) | 3.56% | 3.10% | 2.60% | 3.51% | 3.10% | |
| Portfolio turnover rate | 13% | 21% | 14% | 28% | 13% | |
| Net assets, end of period (x 1,000,000) | $1,565 | $1,406 | $966 | $1,327 | $1,349 | |
| 1 | Calculated based on the average shares outstanding during the period. |
| 2 | Ratio includes less than 0.005% of non-routine proxy expenses. |
| DESCRIPTION | QUOTED
PRICES IN ACTIVE MARKETS FOR IDENTICAL ASSETS (LEVEL 1) |
OTHER
SIGNIFICANT OBSERVABLE INPUTS (LEVEL 2) |
SIGNIFICANT
UNOBSERVABLE INPUTS (LEVEL 3) |
TOTAL |
| Assets | ||||
| Common Stocks1 | $— | $899,093,959 | $— | $899,093,959 |
| Australia | 1,713,233 | 83,537,721 | 726 | 85,251,680 |
| Canada | 118,538,960 | — | — | 118,538,960 |
| Hong Kong | — | 25,156,998 | 197,277 | 25,354,275 |
| Netherlands | 3,378,865 | 36,283,045 | 0* | 39,661,910 |
| Poland | — | 4,070,851 | 470,667 | 4,541,518 |
| Sweden | 49,783 | 29,033,827 | — | 29,083,610 |
| Switzerland | 88,143 | 78,623,524 | — | 78,711,667 |
| United Kingdom | 502,985 | 252,368,282 | — | 252,871,267 |
| Preferred Stocks1 | — | 15,172,626 | — | 15,172,626 |
| Short-Term Investments1 | 14,379,445 | — | — | 14,379,445 |
| Futures Contracts2 | 383,407 | — | — | 383,407 |
| Total | $139,034,821 | $1,423,340,833 | $668,670 | $1,563,044,324 |
| * | Level 3 amount shown includes securities determined to have no value at October 31, 2022. |
| 1 | As categorized in the Portfolio Holdings. |
| 2 | Futures contracts are reported at cumulative unrealized appreciation or depreciation. |
| Assets | ||
| Investments in securities, at value - unaffiliated (cost $1,559,011,166) including securities on loan of $13,489,921 | $1,562,660,917 | |
| Cash | 11,762,006 | |
| Foreign currency, at value (cost $502,124) | 506,474 | |
| Deposit with broker for futures contracts | 1,578,778 | |
| Receivables: | ||
| Dividends | 5,440,199 | |
| Fund shares sold | 2,661,764 | |
| Foreign tax reclaims | 2,120,800 | |
| Investments sold | 309,668 | |
| Income from securities on loan | 9,936 | |
| Interest | + | 7,519 |
| Total assets | 1,587,058,061 | |
| Liabilities | ||
| Collateral held for securities on loan | 14,379,445 | |
| Payables: | ||
| Investments bought | 6,336,170 | |
| Fund shares redeemed | 1,241,583 | |
| Investment adviser fees | 298,766 | |
| Variation margin on futures contracts | 123,349 | |
| Accrued expenses | + | 1,354 |
| Total liabilities | 22,380,667 | |
| Net assets | $1,564,677,394 | |
| Net Assets by Source | ||
| Capital received from investors | $1,693,643,991 | |
| Total distributable loss | + | (128,966,597) |
| Net assets | $1,564,677,394 | |
| Net Asset Value (NAV) | ||||
| Net Assets | ÷ | Shares
Outstanding |
= | NAV |
| $1,564,677,394 | 185,965,173 | $8.41 | ||
| For the period November 1, 2021 through October 31, 2022 | ||
| Investment Income | ||
| Dividends received from securities - unaffiliated (net of foreign withholding tax of $6,197,543) | $56,917,060 | |
| Interest received from securities - unaffiliated | 10,352 | |
| Securities on loan, net | + | 139,341 |
| Total investment income | 57,066,753 | |
| Expenses | ||
| Investment adviser fees | 3,735,441 | |
| Proxy fees1 | 66,510 | |
| Professional fees | + | 1,868 2 |
| Total expenses | 3,803,819 | |
| Expense reduction | – | 1,868 2 |
| Net expenses | – | 3,801,951 |
| Net investment income | 53,264,802 | |
| REALIZED AND UNREALIZED GAINS (LOSSES) | ||
| Net realized losses on sales of securities - unaffiliated | (22,542,589) | |
| Net realized losses on futures contracts | (4,440,362) | |
| Net realized losses on foreign currency transactions | + | (1,084,210) |
| Net realized losses | (28,067,161) | |
| Net change in unrealized appreciation (depreciation) on securities - unaffiliated | (318,647,397) | |
| Net change in unrealized appreciation (depreciation) on futures contracts | 281,387 | |
| Net change in unrealized appreciation (depreciation) on foreign currency translations | + | (363,227) |
| Net change in unrealized appreciation (depreciation) | + | (318,729,237) |
| Net realized and unrealized losses | (346,796,398) | |
| Decrease in net assets resulting from operations | ($293,531,596) | |
| 1 | Proxy fees are non-routine expenses (see financial note 2(e) for additional information). |
| 2 | Professional fees associated with the filing of tax claims in the European Union deemed to be non-contingent and non-routine expenses of the fund. (see financial notes 2(d) and 4 for additional information). |
| OPERATIONS | |||
| 11/1/21-10/31/22 | 11/1/20-10/31/21 | ||
| Net investment income | $53,264,802 | $39,731,647 | |
| Net realized gains (losses) | (28,067,161) | 16,057,904 | |
| Net change in unrealized appreciation (depreciation) | + | (318,729,237) | 361,058,807 |
| Increase (decrease) in net assets resulting from operations | ($293,531,596) | $416,848,358 | |
| DISTRIBUTIONS TO SHAREHOLDERS | |||
| Total distributions | ($52,079,126) | ($28,299,152) | |
| TRANSACTIONS IN FUND SHARES | |||||
| 11/1/21-10/31/22 | 11/1/20-10/31/21 | ||||
| SHARES | VALUE | SHARES | VALUE | ||
| Shares sold | 82,237,833 | $778,069,159 | 38,348,007 | $385,853,692 | |
| Shares reinvested | 3,235,712 | 31,904,115 | 1,660,561 | 15,210,744 | |
| Shares redeemed | + | (32,691,719) | (305,948,761) | (35,535,906) | (349,380,700) |
| Net transactions in fund shares | 52,781,826 | $504,024,513 | 4,472,662 | $51,683,736 | |
| SHARES OUTSTANDING AND NET ASSETS | |||||
| 11/1/21-10/31/22 | 11/1/20-10/31/21 | ||||
| SHARES | NET ASSETS | SHARES | NET ASSETS | ||
| Beginning of period | 133,183,347 | $1,406,263,603 | 128,710,685 | $966,030,661 | |
| Total increase | + | 52,781,826 | 158,413,791 | 4,472,662 | 440,232,942 |
| End of period | 185,965,173 | $1,564,677,394 | 133,183,347 | $1,406,263,603 | |
| 11/1/21–
10/31/22 |
11/1/20–
10/31/21 |
11/1/19–
10/31/20 |
11/1/18–
10/31/19 |
11/1/17–
10/31/18 |
||
| Per-Share Data | ||||||
| Net asset value at beginning of period | $15.42 | $11.46 | $12.57 | $12.67 | $14.58 | |
| Income (loss) from investment operations: | ||||||
| Net investment income (loss)1 | 0.30 | 0.27 | 0.22 | 0.29 | 0.33 | |
| Net realized and unrealized gains (losses) | (4.21) | 3.96 | (0.97) | 0.25 | (1.70) | |
| Total from investment operations | (3.91) | 4.23 | (0.75) | 0.54 | (1.37) | |
| Less distributions: | ||||||
| Distributions from net investment income | (0.41) | (0.27) | (0.36) | (0.30) | (0.34) | |
| Distributions from net realized gains | (0.44) | — | — | (0.34) | (0.20) | |
| Total distributions | (0.85) | (0.27) | (0.36) | (0.64) | (0.54) | |
| Net asset value at end of period | $10.66 | $15.42 | $11.46 | $12.57 | $12.67 | |
| Total return | (26.61%) | 37.25% | (6.28%) | 5.13% | (9.79%) | |
| Ratios/Supplemental Data | ||||||
| Ratios to average net assets: | ||||||
| Total expenses | 0.39% 2 | 0.39% | 0.39% | 0.39% | 0.39% | |
| Net investment income (loss) | 2.37% | 1.84% | 1.89% | 2.44% | 2.30% | |
| Portfolio turnover rate | 36% | 35% | 25% | 38% | 26% | |
| Net assets, end of period (x 1,000) | $530,184 | $708,349 | $576,948 | $775,258 | $762,630 | |
| 1 | Calculated based on the average shares outstanding during the period. |
| 2 | Ratio includes less than 0.005% of non-routine proxy expenses. |
| DESCRIPTION | QUOTED
PRICES IN ACTIVE MARKETS FOR IDENTICAL ASSETS (LEVEL 1) |
OTHER
SIGNIFICANT OBSERVABLE INPUTS (LEVEL 2) |
SIGNIFICANT
UNOBSERVABLE INPUTS (LEVEL 3) |
TOTAL |
| Assets | ||||
| Common Stocks1 | $— | $65,245,751 | $— | $65,245,751 |
| Australia | — | 28,578,943 | 0* | 28,578,943 |
| Austria | 325,116 | 3,257,597 | — | 3,582,713 |
| Canada | 43,547,766 | — | — | 43,547,766 |
| Denmark | 343,748 | 7,866,279 | — | 8,210,027 |
| Finland | 141,273 | 5,842,152 | — | 5,983,425 |
| France | 111,574 | 21,686,297 | — | 21,797,871 |
| Germany | 696,297 | 19,461,880 | — | 20,158,177 |
| Greece | — | — | 0* | 0 |
| Hong Kong | 144,162 | 13,732,940 | 0* | 13,877,102 |
| Italy | — | 13,837,327 | 0* | 13,837,327 |
| Japan | 218,661 | 186,886,740 | — | 187,105,401 |
| Luxembourg | — | — | 0* | 0 |
| Netherlands | 820,708 | 6,674,152 | — | 7,494,860 |
| Poland | 214,539 | 4,532,376 | — | 4,746,915 |
| Republic of Korea | 409,086 | 38,836,152 | — | 39,245,238 |
| Singapore | 69,510 | 7,975,320 | — | 8,044,830 |
| Spain | — | 8,107,457 | 0* | 8,107,457 |
| United Kingdom | 9,180,904 | 36,460,882 | 0* | 45,641,786 |
| Preferred Stocks1 | — | 911,875 | — | 911,875 |
| Warrants 1 | ||||
| Italy | — | — | 12,482 | 12,482 |
| Short-Term Investments1 | 1,171,878 | — | — | 1,171,878 |
| Futures Contracts2 | 91,417 | — | — | 91,417 |
| Total | $57,486,639 | $469,894,120 | $12,482 | $527,393,241 |
| * | Level 3 amount shown includes securities determined to have no value at October 31, 2022. |
| 1 | As categorized in the Portfolio Holdings. |
| 2 | Futures contracts are reported at cumulative unrealized appreciation or depreciation. |
| Assets | ||
| Investments in securities, at value - unaffiliated (cost $544,521,513) including securities on loan of $1,030,805 | $527,301,824 | |
| Cash | 35,339 | |
| Foreign currency, at value (cost $76,428) | 76,210 | |
| Deposit with broker for futures contracts | 402,632 | |
| Receivables: | ||
| Dividends | 1,852,397 | |
| Fund shares sold | 1,591,369 | |
| Foreign tax reclaims | 843,383 | |
| Investments sold | 89,154 | |
| Income from securities on loan | 5,825 | |
| Interest | + | 2,001 |
| Total assets | 532,200,134 | |
| Liabilities | ||
| Collateral held for securities on loan | 1,171,878 | |
| Payables: | ||
| Fund shares redeemed | 644,148 | |
| Investment adviser fees | 161,402 | |
| Variation margin on futures contracts | 28,018 | |
| Investments bought | + | 11,034 |
| Total liabilities | 2,016,480 | |
| Net assets | $530,183,654 | |
| Net Assets by Source | ||
| Capital received from investors | $568,864,369 | |
| Total distributable loss | + | (38,680,715) |
| Net assets | $530,183,654 | |
| Net Asset Value (NAV) | ||||
| Net Assets | ÷ | Shares
Outstanding |
= | NAV |
| $530,183,654 | 49,752,524 | $10.66 | ||
| For the period November 1, 2021 through October 31, 2022 | ||
| Investment Income | ||
| Dividends received from securities - unaffiliated (net of foreign withholding tax of $2,509,767) | $16,732,754 | |
| Securities on loan, net | + | 171,313 |
| Total investment income | 16,904,067 | |
| Expenses | ||
| Investment adviser fees | 2,382,862 | |
| Proxy fees1 | 28,433 | |
| Professional fees | + | 1,018 2 |
| Total expenses | 2,412,313 | |
| Expense reduction | – | 1,018 2 |
| Net expenses | – | 2,411,295 |
| Net investment income | 14,492,772 | |
| REALIZED AND UNREALIZED GAINS (LOSSES) | ||
| Net realized gains on sales of securities - unaffiliated | 20,927,405 | |
| Net realized losses on futures contracts | (1,575,249) | |
| Net realized losses on foreign currency transactions | + | (576,940) |
| Net realized gains | 18,775,216 | |
| Net change in unrealized appreciation (depreciation) on securities - unaffiliated | (218,874,003) | |
| Net change in unrealized appreciation (depreciation) on futures contracts | 1,559 | |
| Net change in unrealized appreciation (depreciation) on foreign currency translations | + | (135,186) |
| Net change in unrealized appreciation (depreciation) | + | (219,007,630) |
| Net realized and unrealized losses | (200,232,414) | |
| Decrease in net assets resulting from operations | ($185,739,642) | |
| 1 | Proxy fees are non-routine expenses (see financial note 2(e) for additional information). |
| 2 | Professional fees associated with the filing of tax claims in the European Union deemed to be non-contingent and non-routine expenses of the fund. (see financial notes 2(d) and 4 for additional information). |
| OPERATIONS | |||
| 11/1/21-10/31/22 | 11/1/20-10/31/21 | ||
| Net investment income | $14,492,772 | $13,283,276 | |
| Net realized gains | 18,775,216 | 51,867,574 | |
| Net change in unrealized appreciation (depreciation) | + | (219,007,630) | 149,333,425 |
| Increase (decrease) in net assets resulting from operations | ($185,739,642) | $214,484,275 | |
| DISTRIBUTIONS TO SHAREHOLDERS | |||
| Total distributions | ($39,276,717) | ($13,332,524) | |
| TRANSACTIONS IN FUND SHARES | |||||
| 11/1/21-10/31/22 | 11/1/20-10/31/21 | ||||
| SHARES | VALUE | SHARES | VALUE | ||
| Shares sold | 12,218,154 | $151,544,356 | 11,598,667 | $168,880,238 | |
| Shares reinvested | 2,187,522 | 30,100,308 | 772,628 | 10,453,657 | |
| Shares redeemed | + | (10,584,869) | (134,793,600) | (16,773,053) | (249,085,119) |
| Net transactions in fund shares | 3,820,807 | $46,851,064 | (4,401,758) | ($69,751,224) | |
| SHARES OUTSTANDING AND NET ASSETS | |||||
| 11/1/21-10/31/22 | 11/1/20-10/31/21 | ||||
| SHARES | NET ASSETS | SHARES | NET ASSETS | ||
| Beginning of period | 45,931,717 | $708,348,949 | 50,333,475 | $576,948,422 | |
| Total increase (decrease) | + | 3,820,807 | (178,165,295) | (4,401,758) | 131,400,527 |
| End of period | 49,752,524 | $530,183,654 | 45,931,717 | $708,348,949 | |
| 11/1/21–
10/31/22 |
11/1/20–
10/31/21 |
11/1/19–
10/31/20 |
11/1/18–
10/31/19 |
11/1/17–
10/31/18 |
||
| Per-Share Data | ||||||
| Net asset value at beginning of period | $10.24 | $7.51 | $9.25 | $8.60 | $9.38 | |
| Income (loss) from investment operations: | ||||||
| Net investment income (loss)1 | 0.52 | 0.36 | 0.27 | 0.35 | 0.27 | |
| Net realized and unrealized gains (losses) | (2.96) | 2.63 | (1.65) | 0.54 | (0.83) | |
| Total from investment operations | (2.44) | 2.99 | (1.38) | 0.89 | (0.56) | |
| Less distributions: | ||||||
| Distributions from net investment income | (0.45) | (0.26) | (0.36) | (0.24) | (0.22) | |
| Net asset value at end of period | $7.35 | $10.24 | $7.51 | $9.25 | $8.60 | |
| Total return | (24.86%) | 40.39% | (15.68%) | 10.73% | (6.09%) | |
| Ratios/Supplemental Data | ||||||
| Ratios to average net assets: | ||||||
| Total expenses | 0.39% 2 | 0.39% | 0.39% | 0.39% | 0.39% | |
| Net investment income (loss) | 5.83% | 3.75% | 3.32% | 3.93% | 2.92% | |
| Portfolio turnover rate | 24% | 32% | 32% | 38% | 19% | |
| Net assets, end of period (x 1,000) | $604,159 | $707,652 | $550,134 | $670,910 | $547,985 | |
| 1 | Calculated based on the average shares outstanding during the period. |
| 2 | Ratio includes less than 0.005% of non-routine proxy expenses. |
| DESCRIPTION | QUOTED
PRICES IN ACTIVE MARKETS FOR IDENTICAL ASSETS (LEVEL 1) |
OTHER
SIGNIFICANT OBSERVABLE INPUTS (LEVEL 2) |
SIGNIFICANT
UNOBSERVABLE INPUTS (LEVEL 3) |
TOTAL |
| Assets | ||||
| Common Stocks1 | $— | $274,138,506 | $— | $274,138,506 |
| Brazil | 46,624,325 | — | — | 46,624,325 |
| Chile | 4,230,418 | 575,656 | — | 4,806,074 |
| China | 1,672,229 | 171,389,927 | 803,343 | 173,865,499 |
| Colombia | 1,572,641 | — | — | 1,572,641 |
| Czech Republic | 982,511 | — | — | 982,511 |
| Greece | 6,997 | 2,643,325 | — | 2,650,322 |
| Mexico | 27,858,807 | — | — | 27,858,807 |
| South Africa | 5,543,567 | 27,762,376 | — | 33,305,943 |
| Preferred Stocks1 | 34,417,114 | — | — | 34,417,114 |
| Liabilities | ||||
| Futures Contracts2 | (28,410) | — | — | (28,410) |
| Total | $122,880,199 | $476,509,790 | $803,343 | $600,193,332 |
| 1 | As categorized in the Portfolio Holdings. |
| 2 | Futures contracts are reported at cumulative unrealized appreciation or depreciation. |
| Assets | ||
| Investments in securities, at value - unaffiliated (cost $594,915,872) | $600,221,742 | |
| Cash | 2,638,938 | |
| Foreign currency, at value (cost $887,269) | 887,333 | |
| Deposit with broker for futures contracts | 100,282 | |
| Receivables: | ||
| Fund shares sold | 4,283,100 | |
| Dividends | 466,838 | |
| Foreign tax reclaims | 12,248 | |
| Interest | 4,782 | |
| Income from securities on loan | 1,932 | |
| Investments sold | + | 73 |
| Total assets | 608,617,268 | |
| Liabilities | ||
| Payables: | ||
| Foreign capital gains tax | 2,143,709 | |
| Fund shares redeemed | 2,118,881 | |
| Investment adviser fees | 188,848 | |
| Variation margin on futures contracts | 6,103 | |
| Accrued expenses | + | 1,016 |
| Total liabilities | 4,458,557 | |
| Net assets | $604,158,711 | |
| Net Assets by Source | ||
| Capital received from investors | $730,873,956 | |
| Total distributable loss | + | (126,715,245) |
| Net assets | $604,158,711 | |
| Net Asset Value (NAV) | ||||
| Net Assets | ÷ | Shares
Outstanding |
= | NAV |
| $604,158,711 | 82,145,910 | $7.35 | ||
| For the period November 1, 2021 through October 31, 2022 | ||
| Investment Income | ||
| Dividends received from securities - unaffiliated (net of foreign withholding tax of $4,322,788) | $41,811,129 | |
| Interest received from securities - unaffiliated | 2,705 | |
| Securities on loan, net | + | 34,238 |
| Total investment income | 41,848,072 | |
| Expenses | ||
| Investment adviser fees | 2,620,279 | |
| Proxy fees1 | + | 30,758 |
| Total expenses | – | 2,651,037 |
| Net investment income | 39,197,035 | |
| REALIZED AND UNREALIZED GAINS (LOSSES) | ||
| Net realized losses on sales of securities - unaffiliated (net of foreign capital gains tax paid of $902,432) | (50,891,721) | |
| Net realized losses on futures contracts | (2,191,883) | |
| Net realized losses on foreign currency transactions | + | (718,818) |
| Net realized losses | (53,802,422) | |
| Net change in unrealized appreciation (depreciation) on securities - unaffiliated (net of change in foreign capital gains tax of $1,329,850) | (172,204,961) | |
| Net change in unrealized appreciation (depreciation) on futures contracts | (12,712) | |
| Net change in unrealized appreciation (depreciation) on foreign currency translations | + | 2,280 |
| Net change in unrealized appreciation (depreciation) | + | (172,215,393) |
| Net realized and unrealized losses | (226,017,815) | |
| Decrease in net assets resulting from operations | ($186,820,780) | |
| 1 | Proxy fees are non-routine expenses (see financial note 2(e) for additional information). |
| OPERATIONS | |||
| 11/1/21-10/31/22 | 11/1/20-10/31/21 | ||
| Net investment income | $39,197,035 | $26,482,022 | |
| Net realized gains (losses) | (53,802,422) | 10,993,707 | |
| Net change in unrealized appreciation (depreciation) | + | (172,215,393) | 184,471,344 |
| Increase (decrease) in net assets resulting from operations | ($186,820,780) | $221,947,073 | |
| DISTRIBUTIONS TO SHAREHOLDERS | |||
| Total distributions | ($30,189,359) | ($18,875,238) | |
| TRANSACTIONS IN FUND SHARES | |||||
| 11/1/21-10/31/22 | 11/1/20-10/31/21 | ||||
| SHARES | VALUE | SHARES | VALUE | ||
| Shares sold | 31,322,904 | $273,449,095 | 19,964,352 | $189,960,789 | |
| Shares reinvested | 2,271,110 | 21,734,518 | 1,622,720 | 14,425,984 | |
| Shares redeemed | + | (20,544,222) | (181,666,566) | (25,791,975) | (249,940,985) |
| Net transactions in fund shares | 13,049,792 | $113,517,047 | (4,204,903) | ($45,554,212) | |
| SHARES OUTSTANDING AND NET ASSETS | |||||
| 11/1/21-10/31/22 | 11/1/20-10/31/21 | ||||
| SHARES | NET ASSETS | SHARES | NET ASSETS | ||
| Beginning of period | 69,096,118 | $707,651,803 | 73,301,021 | $550,134,180 | |
| Total increase (decrease) | + | 13,049,792 | (103,493,092) | (4,204,903) | 157,517,623 |
| End of period | 82,145,910 | $604,158,711 | 69,096,118 | $707,651,803 | |
| SCHWAB CAPITAL TRUST (ORGANIZED MAY 7, 1993) | |
| Schwab Fundamental US Large Company Index Fund | Schwab Target 2015 Fund |
| Schwab Fundamental US Small Company Index Fund | Schwab Target 2020 Fund |
| Schwab Fundamental International Large Company Index Fund | Schwab Target 2025 Fund |
| Schwab Fundamental International Small Company Index Fund | Schwab Target 2030 Fund |
| Schwab Fundamental Emerging Markets Large Company Index Fund | Schwab Target 2035 Fund |
| Schwab Fundamental Global Real Estate Index Fund | Schwab Target 2040 Fund |
| Schwab S&P 500 Index Fund | Schwab Target 2045 Fund |
| Schwab Small-Cap Index Fund® | Schwab Target 2050 Fund |
| Schwab U.S. Large-Cap Growth Index Fund | Schwab Target 2055 Fund |
| Schwab U.S. Large-Cap Value Index Fund | Schwab Target 2060 Fund |
| Schwab U.S. Mid-Cap Index Fund | Schwab Target 2065 Fund |
| Schwab Total Stock Market Index Fund® | Schwab Target 2010 Index Fund |
| Schwab International Index Fund® | Schwab Target 2015 Index Fund |
| Schwab MarketTrack All Equity Portfolio™ | Schwab Target 2020 Index Fund |
| Schwab MarketTrack Growth Portfolio™ | Schwab Target 2025 Index Fund |
| Schwab MarketTrack Balanced Portfolio™ | Schwab Target 2030 Index Fund |
| Schwab MarketTrack Conservative Portfolio™ | Schwab Target 2035 Index Fund |
| Schwab International Opportunities Fund | Schwab Target 2040 Index Fund |
| Schwab Balanced Fund | Schwab Target 2045 Index Fund |
| Schwab Core Equity Fund | Schwab Target 2050 Index Fund |
| Schwab Dividend Equity Fund | Schwab Target 2055 Index Fund |
| Schwab Large-Cap Growth Fund | Schwab Target 2060 Index Fund |
| Schwab Small-Cap Equity Fund | Schwab Target 2065 Index Fund |
| Schwab Health Care Fund | Schwab Monthly Income Fund - Target Payout |
| Schwab International Core Equity Fund | Schwab Monthly Income Fund - Flexible Payout |
| Schwab Target 2010 Fund | Schwab Monthly Income Fund - Income Payout |
| SCHWAB
FUNDAMENTAL US LARGE COMPANY INDEX FUND |
SCHWAB
FUNDAMENTAL US SMALL COMPANY INDEX FUND |
SCHWAB
FUNDAMENTAL INTERNATIONAL LARGE COMPANY INDEX FUND |
SCHWAB
FUNDAMENTAL INTERNATIONAL SMALL COMPANY INDEX FUND |
SCHWAB
FUNDAMENTAL EMERGING MARKETS LARGE COMPANY INDEX FUND |
| 0.25% | 0.25% | 0.25% | 0.39% | 0.39% |
| UNDERLYING FUNDS | |||||
| SCHWAB
FUNDAMENTAL US LARGE COMPANY INDEX FUND |
SCHWAB
FUNDAMENTAL US SMALL COMPANY INDEX FUND |
SCHWAB
FUNDAMENTAL INTERNATIONAL LARGE COMPANY INDEX FUND |
SCHWAB
FUNDAMENTAL INTERNATIONAL SMALL COMPANY INDEX FUND |
SCHWAB
FUNDAMENTAL EMERGING MARKETS LARGE COMPANY INDEX FUND | |
| Schwab MarketTrack All Equity Portfolio | 1.5% | 2.0% | 2.7% | 6.5% | 5.7% |
| Schwab MarketTrack Balanced Portfolio | 0.7% | 0.9% | 0.6% | 3.8% | 2.0% |
| Schwab MarketTrack Conservative Portfolio | 0.2% | 0.3% | 0.3% | 0.7% | 0.6% |
| Schwab MarketTrack Growth Portfolio | 1.5% | 1.9% | 2.1% | 4.9% | 4.3% |
| Schwab Target 2010 Fund | 0.0%* | —% | —% | —% | —% |
| Schwab Target 2015 Fund | 0.0%* | —% | —% | —% | —% |
| Schwab Target 2020 Fund | 0.1% | —% | —% | —% | —% |
| Schwab Target 2025 Fund | 0.1% | —% | —% | —% | —% |
| Schwab Target 2030 Fund | 0.3% | —% | —% | —% | —% |
| Schwab Target 2035 Fund | 0.3% | —% | —% | —% | —% |
| Schwab Target 2040 Fund | 0.6% | —% | —% | —% | —% |
| Schwab Target 2045 Fund | 0.2% | —% | —% | —% | —% |
| Schwab Target 2050 Fund | 0.2% | —% | —% | —% | —% |
| Schwab Target 2055 Fund | 0.1% | —% | —% | —% | —% |
| Schwab Target 2060 Fund | 0.0%* | —% | —% | —% | —% |
| Schwab Target 2065 Fund | 0.0%* | —% | —% | —% | —% |
| * | Less than 0.05% |
| PURCHASE COST | SALE PROCEEDS | REALIZED GAINS (LOSSES) | |
| Schwab Fundamental US Large Company Index Fund | $275,195,702 | $130,460,842 | ($9,190,029) |
| Schwab Fundamental US Small Company Index Fund | 100,479,176 | 91,693,074 | 29,224,586 |
| Schwab Fundamental International Large Company Index Fund | 39,628,775 | 22,615,505 | (909,261) |
| Schwab Fundamental International Small Company Index Fund | 25,663,729 | 30,997,271 | 8,483,238 |
| Schwab Fundamental Emerging Markets Large Company Index Fund | 41,242,313 | 4,508,008 | (679,109) |
| 7. Derivatives: |
| NOTIONAL AMOUNTS | NUMBER OF CONTRACTS | |
| Schwab Fundamental US Large Company Index Fund | $33,366,107 | 159 |
| Schwab Fundamental US Small Company Index Fund | 8,993,698 | 92 |
| Schwab Fundamental International Large Company Index Fund | 12,604,194 | 126 |
| Schwab Fundamental International Small Company Index Fund | 5,132,829 | 51 |
| Schwab Fundamental Emerging Markets Large Company Index Fund | 5,441,338 | 105 |
| PURCHASES
OF SECURITIES |
SALES
OF SECURITIES | |
| Schwab Fundamental US Large Company Index Fund | $1,521,761,726 | $854,218,920 |
| Schwab Fundamental US Small Company Index Fund | 811,573,101 | 602,501,681 |
| Schwab Fundamental International Large Company Index Fund | 689,418,342 | 199,204,950 |
| Schwab Fundamental International Small Company Index Fund | 239,120,983 | 215,965,072 |
| Schwab Fundamental Emerging Markets Large Company Index Fund | 276,638,354 | 158,477,990 |
| IN-KIND
PURCHASES OF SECURITIES |
IN-KIND
SALES OF SECURITIES | |
| Schwab Fundamental US Large Company Index Fund | $— | $564,130,721 |
| Schwab Fundamental US Small Company Index Fund | — | 194,547,537 |
| TAX COST | GROSS
UNREALIZED APPRECIATION |
GROSS
UNREALIZED DEPRECIATION |
NET
UNREALIZED APPRECIATION (DEPRECIATION) | |
| Schwab Fundamental US Large Company Index Fund | $4,070,929,427 | $2,686,277,042 | ($297,398,906) | $2,388,878,136 |
| Schwab Fundamental US Small Company Index Fund | 1,390,862,774 | 457,487,358 | (195,863,175) | 261,624,183 |
| Schwab Fundamental International Large Company Index Fund | 1,696,739,994 | 171,651,471 | (305,347,141) | (133,695,670) |
| Schwab Fundamental International Small Company Index Fund | 591,337,899 | 77,195,447 | (141,140,105) | (63,944,658) |
| Schwab Fundamental Emerging Markets Large Company Index Fund | 651,559,734 | 103,056,162 | (154,422,564) | (51,366,402) |
| UNDISTRIBUTED
ORDINARY INCOME |
UNDISTRIBUTED
LONG-TERM CAPITAL GAINS |
NET
UNREALIZED APPRECIATION (DEPRECIATION) ON INVESTMENTS |
NET
OTHER UNREALIZED APPRECIATION (DEPRECIATION) |
CAPITAL
LOSS CARRYFORWARDS AND OTHER LOSSES |
TOTAL | |
| Schwab Fundamental US Large Company Index Fund | $106,067,022 | $— | $2,388,878,136 | $— | ($16,395,504) | $2,478,549,654 |
| Schwab Fundamental US Small Company Index Fund | 11,020,325 | 87,539,598 | 261,624,183 | (11) | — | 360,184,095 |
| Schwab Fundamental International Large Company Index Fund | 41,820,210 | — | (133,695,670) | (344,596) | (36,746,541) | (128,966,597) |
| Schwab Fundamental International Small Company Index Fund | 9,459,557 | 15,959,445 | (63,944,658) | (155,059) | — | (38,680,715) |
| Schwab Fundamental Emerging Markets Large Company Index Fund | 31,083,814 | — | (51,366,402) | (2,064,531) | (104,368,126) | (126,715,245) |
| Schwab Fundamental US Large Company Index Fund | $16,395,504 |
| Schwab Fundamental US Small Company Index Fund | — |
| Schwab Fundamental International Large Company Index Fund | 36,746,541 |
| Schwab Fundamental International Small Company Index Fund | — |
| Schwab Fundamental Emerging Markets Large Company Index Fund | 104,368,126 |
| CURRENT FISCAL YEAR END DISTRIBUTIONS | PRIOR FISCAL YEAR END DISTRIBUTIONS | |||
| ORDINARY
INCOME |
LONG-TERM
CAPITAL GAINS |
ORDINARY
INCOME |
LONG-TERM
CAPITAL GAINS | |
| Schwab Fundamental US Large Company Index Fund | $136,690,830 | $187,778,508 | $121,671,839 | $186,884,443 |
| Schwab Fundamental US Small Company Index Fund | 53,750,563 | 155,441,604 | 24,462,415 | — |
| Schwab Fundamental International Large Company Index Fund | 52,079,126 | — | 28,299,152 | — |
| Schwab Fundamental International Small Company Index Fund | 19,730,992 | 19,545,725 | 13,332,524 | — |
| Schwab Fundamental Emerging Markets Large Company Index Fund | 30,189,359 | — | 18,875,238 | — |
Denver, Colorado
December 16, 2022
| FOREIGN TAX CREDIT | FOREIGN SOURCE INCOME | |
| Schwab Fundamental US Large Company Index Fund | $— | $— |
| Schwab Fundamental US Small Company Index Fund | — | — |
| Schwab Fundamental International Large Company Index Fund | 5,298,716 | 63,114,602 |
| Schwab Fundamental International Small Company Index Fund | 2,254,394 | 19,143,325 |
| Schwab Fundamental Emerging Markets Large Company Index Fund | 5,158,974 | 46,133,917 |
| Schwab Fundamental US Large Company Index Fund | 94.01% |
| Schwab Fundamental US Small Company Index Fund | 51.50% |
| Schwab Fundamental International Large Company Index Fund | —% |
| Schwab Fundamental International Small Company Index Fund | —% |
| Schwab Fundamental Emerging Markets Large Company Index Fund | —% |
| Schwab Fundamental US Large Company Index Fund | $130,837,168 |
| Schwab Fundamental US Small Company Index Fund | 28,023,659 |
| Schwab Fundamental International Large Company Index Fund | 48,797,132 |
| Schwab Fundamental International Small Company Index Fund | 15,613,869 |
| Schwab Fundamental Emerging Markets Large Company Index Fund | 22,890,279 |
| Schwab Fundamental US Large Company Index Fund | $187,778,508 |
| Schwab Fundamental US Small Company Index Fund | 155,441,604 |
| Schwab Fundamental International Large Company Index Fund | — |
| Schwab Fundamental International Small Company Index Fund | 19,545,725 |
| Schwab Fundamental Emerging Markets Large Company Index Fund | — |
| Schwab Fundamental US Large Company Index Fund | $2,035,750 |
| Schwab Fundamental US Small Company Index Fund | 5,218,529 |
| Schwab Fundamental International Large Company Index Fund | — |
| Schwab Fundamental International Small Company Index Fund | — |
| Schwab Fundamental Emerging Markets Large Company Index Fund | — |
| Proposal
– To elect each of the following individuals as trustees of the Trust: |
For | Withheld |
| Walter W. Bettinger II | 1,095,577,106.505 | 115,838,980.968 |
| Richard A. Wurster | 1,117,598,789.555 | 93,817,297.918 |
| Michael J. Beer | 1,116,890,447.505 | 94,525,639.968 |
| Robert W. Burns | 1,117,915,860.110 | 93,500,227.363 |
| Nancy F. Heller | 1,119,878,732.134 | 91,537,355.339 |
| David L. Mahoney | 1,069,125,022.434 | 142,291,065.039 |
| Jane P. Moncreiff | 1,120,187,927.838 | 91,228,159.635 |
| Kiran M. Patel | 1,116,689,111.571 | 94,726,975.902 |
| Kimberly S. Patmore | 1,119,941,056.059 | 91,475,031.414 |
| J. Derek Penn | 1,117,666,014.121 | 93,750,073.352 |
| Independent Trustees | |||
| Name,
Year of Birth, and Position(s) with the trust (Terms of office, and length of Time Served1) |
Principal
Occupations During the Past Five Years |
Number
of Portfolios in Fund Complex Overseen by the Trustee |
Other Directorships |
|
Michael J. Beer 1961 Trustee (Trustee of The Charles Schwab Family of Funds, Schwab Investments, Schwab Capital Trust, Schwab Annuity Portfolios, Schwab Strategic Trust and Laudus Trust since 2022) |
Retired. Director, President and Chief Executive Officer (Dec. 2016 – Sept. 2019), Principal Funds (investment management). | 105 | Director (2016 – 2019), Principal Funds, Inc. |
| Robert
W. Burns 1959 Trustee (Trustee of Schwab Strategic Trust since 2009; The Charles Schwab Family of Funds, Schwab Investments, Schwab Capital Trust, Schwab Annuity Portfolios and Laudus Trust since 2016) |
Retired/Private Investor. | 105 | None |
| Nancy
F. Heller 1956 Trustee (Trustee of The Charles Schwab Family of Funds, Schwab Investments, Schwab Capital Trust, Schwab Annuity Portfolios, Schwab Strategic Trust and Laudus Trust since 2018) |
Retired. | 105 | None |
| David
L. Mahoney 1954 Trustee (Trustee of The Charles Schwab Family of Funds, Schwab Investments, Schwab Capital Trust, Schwab Annuity Portfolios and Laudus Trust since 2011; Schwab Strategic Trust since 2016) |
Private Investor. | 105 | Director
(2004 – present), Corcept Therapeutics Incorporated Director (2009 – 2021), Adamas Pharmaceuticals, Inc. Director (2003 – 2019), Symantec Corporation |
| Jane
P. Moncreiff 1961 Trustee (Trustee of The Charles Schwab Family of Funds, Schwab Investments, Schwab Capital Trust, Schwab Annuity Portfolios, Schwab Strategic Trust and Laudus Trust since 2019) |
Consultant (2018 – present), Fulham Advisers LLC (management consulting); Chief Investment Officer (2009 – 2017), CareGroup Healthcare System, Inc. (healthcare). | 105 | None |
| Independent Trustees (continued) | |||
| Name,
Year of Birth, and Position(s) with the trust (Terms of office, and length of Time Served1) |
Principal
Occupations During the Past Five Years |
Number
of Portfolios in Fund Complex Overseen by the Trustee |
Other Directorships |
| Kiran
M. Patel 1948 Trustee (Trustee of The Charles Schwab Family of Funds, Schwab Investments, Schwab Capital Trust, Schwab Annuity Portfolios and Laudus Trust since 2011; Schwab Strategic Trust since 2016) |
Retired. | 105 | Director (2008 – present), KLA-Tencor Corporation |
| Kimberly
S. Patmore 1956 Trustee (Trustee of The Charles Schwab Family of Funds, Schwab Investments, Schwab Capital Trust, Schwab Annuity Portfolios, Schwab Strategic Trust and Laudus Trust since 2016) |
Consultant (2008 – present), Patmore Management Consulting (management consulting). | 105 | None |
|
J. Derek Penn 1957 Trustee (Trustee of The Charles Schwab Family of Funds, Schwab Investments, Schwab Capital Trust, Schwab Annuity Portfolios, Schwab Strategic Trust and Laudus Trust since 2021) |
Head of Equity Sales and Trading (2006 – 2018), BNY Mellon (financial services). | 105 | None |
| Interested Trustees | |||
| Name,
Year of Birth, and Position(s) with the trust (Terms of office, and length of Time Served1) |
Principal
Occupations During the Past Five Years |
Number
of Portfolios in Fund Complex Overseen by the Trustee |
Other Directorships |
| Walter
W. Bettinger II2 1960 Chairman and Trustee (Trustee of The Charles Schwab Family of Funds, Schwab Investments, Schwab Capital Trust and Schwab Annuity Portfolios since 2008; Schwab Strategic Trust since 2009; Laudus Trust since 2010) |
Co-Chairman of the Board (July 2022 – present), Director and Chief Executive Officer (Oct. 2008 – present) and President (Feb. 2007 – Oct. 2021), The Charles Schwab Corporation; President and Chief Executive Officer (Oct. 2008 – Oct. 2021) and Director (May 2008 – Oct. 2021), Charles Schwab & Co., Inc.; Director (Apr. 2006 – present), Charles Schwab Bank, SSB; Director (Nov. 2017 – present), Charles Schwab Premier Bank, SSB; Director (July 2019 – present), Charles Schwab Trust Bank; Director (May 2008 – present), Chief Executive Officer (Aug. 2017 – present) and President (Aug. 2017 – Nov. 2021), Schwab Holdings, Inc.; Director (Oct. 2020 – present), TD Ameritrade Holding Corporation; Director (July 2016 – Oct. 2021), Charles Schwab Investment Management, Inc. | 105 | Director (2008 – present), The Charles Schwab Corporation |
| Interested Trustees (continued) | |||
| Name,
Year of Birth, and Position(s) with the trust (Terms of office, and length of Time Served1) |
Principal
Occupations During the Past Five Years |
Number
of Portfolios in Fund Complex Overseen by the Trustee |
Other Directorships |
| Richard
A. Wurster2 1973 Trustee (Trustee of The Charles Schwab Family of Funds, Schwab Investments, Schwab Capital Trust, Schwab Annuity Portfolios, Schwab Strategic Trust and Laudus Trust since 2022) |
President (Oct. 2021 – present) and Executive Vice President – Schwab Asset Management Solutions (Apr. 2019 – Oct. 2021), The Charles Schwab Corporation; President, Director (Oct. 2021 – present), Executive Vice President – Schwab Asset Management Solutions (July 2019 – Oct. 2021) and Senior Vice President – Advisory (May 2016 – July 2019), Charles Schwab & Co., Inc.; President (Nov. 2021 – present), Schwab Holdings, Inc.; Director (Oct. 2021 – present) and Chief Executive Officer (Nov. 2019 – Jan. 2022), Charles Schwab Investment Management, Inc.; Director, Chief Executive Officer and President (Mar. 2018 – Oct. 2022), Charles Schwab Investment Advisory, Inc.; Chief Executive Officer (July 2016 – Apr. 2018) and President (Mar. 2017 – Apr. 2018), ThomasPartners, Inc.; Chief Executive Officer (July 2016 – Apr. 2018), Windhaven Investment Management, Inc. | 105 | None |
| Officers of the Trust | |
| Name,
Year of Birth, and Position(s) with the trust (Terms of office, and length of Time Served3) |
Principal Occupations During the Past Five Years |
| Jonathan
de St. Paer 1973 President and Chief Executive Officer (Officer of The Charles Schwab Family of Funds, Schwab Investments, Schwab Capital Trust, Schwab Annuity Portfolios, Schwab Strategic Trust and Laudus Trust since 2018) |
Director (Apr. 2019 – present), President (Oct. 2018 – present), Chief Operating Officer (Jan. 2021 – present), and Chief Executive Officer (Apr. 2019 – Nov. 2019), Charles Schwab Investment Management, Inc.; Senior Vice President (June 2020 – Mar. 2022) and Chief Operating Officer (Jan. 2021 – Mar. 2022), Charles Schwab Investment Advisory, Inc.; Chief Executive Officer (Apr. 2019 – present), President (Nov. 2018 – present) and Trustee (Apr. 2019 – Dec. 2020), Schwab Funds, Laudus Trust and Schwab ETFs; Managing Director (May 2022 – present), Senior Vice President (Apr. 2019 – May 2022) and Senior Vice President – Strategy and Product Development (CSIM) (Jan. 2014 – Mar. 2019), Charles Schwab & Co., Inc. |
| Mark
Fischer 1970 Treasurer, Chief Financial Officer and Chief Operating Officer (Officer of The Charles Schwab Family of Funds, Schwab Investments, Schwab Capital Trust, Schwab Annuity Portfolios, Schwab Strategic Trust and Laudus Trust since 2013) |
Treasurer and Chief Financial Officer (Jan. 2016 – present) and Chief Operating Officer (Dec. 2020 – present), Schwab Funds, Laudus Trust and Schwab ETFs; Chief Financial Officer (Mar. 2020 – present) and Vice President (Oct. 2013 – present), Charles Schwab Investment Management, Inc. |
| Omar
Aguilar 1970 Vice President and Chief Investment Officer (Officer of The Charles Schwab Family of Funds, Schwab Investments, Schwab Capital Trust, Schwab Annuity Portfolios, Schwab Strategic Trust and Laudus Trust since 2011) |
Chief Executive Officer (Jan. 2022 – present), Chief Investment Officer (Apr. 2011 – present) and Senior Vice President (Apr. 2011 – Dec. 2021), Charles Schwab Investment Management, Inc.; Director, Chief Executive Officer and President (Oct. 2022 – present), Charles Schwab Investment Advisory, Inc.; Vice President and Chief Investment Officer (June 2011 – present), Schwab Funds, Laudus Trust and Schwab ETFs. |
| Brett
Wander 1961 Vice President and Chief Investment Officer (Officer of The Charles Schwab Family of Funds, Schwab Investments, Schwab Capital Trust, Schwab Annuity Portfolios, Schwab Strategic Trust and Laudus Trust since 2011) |
Senior Vice President and Chief Investment Officer (Apr. 2011 – present), Charles Schwab Investment Management, Inc.; Vice President and Chief Investment Officer (June 2011 – present), Schwab Funds, Laudus Trust and Schwab ETFs. |
| William
P. McMahon, Jr. 1972 Vice President and Chief Investment Officer (Officer of The Charles Schwab Family of Funds, Schwab Investments, Schwab Capital Trust, Schwab Annuity Portfolios, Schwab Strategic Trust and Laudus Trust since 2021) |
Senior Vice President and Chief Investment Officer (Jan. 2020 – present), Charles Schwab Investment Management, Inc.; Vice President and Chief Investment Officer (June 2021 – present), Schwab Funds, Laudus Trust and Schwab ETFs; Senior Vice President and Chief Investment Officer – ThomasPartners Strategies (Apr. 2018 – Dec. 2019), Charles Schwab Investment Advisory, Inc.; Senior Vice President and Chief Investment Officer (May 2001 – Apr. 2018), ThomasPartners, Inc. |
| Officers of the Trust (continued) | |
| Name,
Year of Birth, and Position(s) with the trust (Terms of office, and length of Time Served3) |
Principal Occupations During the Past Five Years |
| Catherine
MacGregor 1964 Chief Legal Officer and Secretary, Schwab Funds and Schwab ETFs Chief Legal Officer, Vice President and Clerk, Laudus Trust (Officer of The Charles Schwab Family of Funds, Schwab Investments, Schwab Capital Trust, Schwab Annuity Portfolios and Laudus Trust since 2005; Schwab Strategic Trust since 2009) |
Chief Legal Officer (Mar. 2022 – present) and Vice President (Sept. 2005 – present), Charles Schwab Investment Management, Inc.; Managing Director (May 2022 – present) and Vice President (July 2005 – May 2022), Charles Schwab & Co., Inc.; Vice President (Dec. 2005 – present) and Chief Legal Officer and Clerk (Mar. 2007 – present), Laudus Trust; Chief Legal Officer and Secretary (Oct. 2021 – present), Vice President (Nov. 2005 – Oct. 2021) and Assistant Secretary (June 2007 – Oct. 2021), Schwab Funds; Chief Legal Officer and Secretary (Oct. 2021 – present), Vice President and Assistant Secretary (Oct. 2009 – Oct. 2021), Schwab ETFs. |
| 1 | Each Trustee shall hold office until the election and qualification of his or her successor, or until he or she dies, resigns or is removed. The retirement policy requires that each independent trustee retire by December 31 of the year in which the Trustee turns 74 or the Trustee’s twentieth year of service as an independent trustee on any trust in the Fund Complex, whichever occurs first. |
| 2 | Mr. Bettinger and Mr. Wurster are Interested Trustees. Mr. Bettinger and Mr. Wurster are Interested Trustees because each owns stock of The Charles Schwab Corporation (CSC), the parent company of Charles Schwab Investment Management, Inc., the investment adviser for the trusts in the Fund Complex, and is an employee of Charles Schwab & Co., Inc. (Schwab), the principal underwriter for The Charles Schwab Family of Funds, Schwab Investments, Schwab Capital Trust, Schwab Annuity Portfolios and Laudus Trust. |
| 3 | The President, Treasurer and Secretary/Clerk hold office until their respective successors are chosen and qualified or until he or she sooner dies, resigns, is removed or becomes disqualified. Each of the other officers serves at the pleasure of the Board. |
Schwab Funds
| ¹ | State, local, and the Federal Alternative Minimum Tax may apply. Capital gains are not exempt from Federal Taxation. |
| ² | You could lose money by investing in the Schwab Money Funds. All Schwab Money Funds with the exception of Schwab Variable Share Price Money Fund seek to preserve the value of your investment at $1.00 per share, but cannot guarantee they will do so. Because the share price of Schwab Variable Share Price Money Fund will fluctuate, when you sell your shares they may be worth more or less than what you originally paid for them. All Schwab Money Funds with the exception of Schwab Government Money Fund, Schwab Retirement Government Money Fund, Schwab U.S. Treasury Money Fund, Schwab Treasury Obligations Money Fund and Schwab Government Money Market Portfolio may impose a fee upon the sale of your shares or may temporarily suspend your ability to sell shares if the Fund’s liquidity falls below required minimums because of market conditions or other factors. An investment in the Schwab Money Funds is not insured or guaranteed by the Federal Deposit Insurance Corporation or any other government agency. The Schwab Money Funds’ sponsor has no legal obligation to provide financial support to the Funds, and you should not expect that the sponsor will provide financial support to the Funds at any time. |

All Equity Portfolio™
Growth Portfolio™
Balanced Portfolio™
Conservative Portfolio™
| Total Return for the 12 Months Ended October 31, 2022 | |
| Schwab MarketTrack All Equity Portfolio (Ticker Symbol: SWEGX) | -16.89% |
| All Equity Composite Index | -16.51% |
| Fund Category: Morningstar Allocation—85%+ Equity1 | -19.47% |
| Performance Details | pages 7-9 |
| Schwab MarketTrack Growth Portfolio (Ticker Symbol: SWHGX) | -15.52% |
| Growth Composite Index | -15.10% |
| Fund Category: Morningstar Allocation—70% to 85% Equity1 | -15.46% |
| Performance Details | pages 10-12 |
| Schwab MarketTrack Balanced Portfolio (Ticker Symbol: SWBGX) | -15.32% |
| Balanced Composite Index | -14.91% |
| Fund Category: Morningstar Allocation—50% to 70% Equity1 | -14.00% |
| Performance Details | pages 13-15 |
| Schwab MarketTrack Conservative Portfolio (Ticker Symbol: SWCGX) | -15.23% |
| Conservative Composite Index | -14.84% |
| Fund Category: Morningstar Allocation—30% to 50% Equity1 | -14.73% |
| Performance Details | pages 16-18 |
| 1 | Source for category information: Morningstar, Inc. The Morningstar Category return represents all active and index mutual funds and ETFs within the category as of the report date. |


| * | The net version of the index reflects reinvested dividends net of withholding taxes but reflects no deductions for expenses or other taxes. |

| * | The net version of the index reflects reinvested dividends net of withholding taxes but reflects no deductions for expenses or other taxes. |
 |
Zifan Tang, Ph.D., CFA, Senior Portfolio Manager, is responsible for the co-management of the funds. Prior to joining Schwab in 2012, Ms. Tang was a product manager at Thomson Reuters and from 1997 to 2009 worked as a portfolio manager at Barclays Global Investors (now known as BlackRock). |
 |
Patrick Kwok, CFA, Portfolio Manager, is responsible for the co-management of the funds. Previously, Mr. Kwok served as an associate portfolio manager from 2012 to 2016. Prior to that, he worked as a fund administration manager, where he was responsible for oversight of sub-advisers, trading, cash management, and fund administration supporting the Charles Schwab Trust Bank Collective Investment Trusts and multi-asset Schwab Funds. Prior to joining Schwab Asset Management in 2008, Mr. Kwok spent two years as an asset operations specialist at Charles Schwab Trust Company. He also worked for one year at State Street Bank & Trust as a portfolio accountant and pricing specialist. |
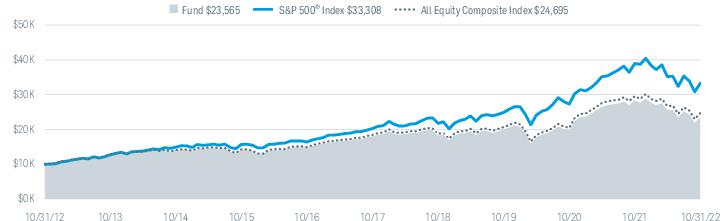
| Fund and Inception Date | 1 Year | 5 Years | 10 Years |
| Fund: Schwab MarketTrack All Equity Portfolio (5/19/98) | -16.89% | 5.50% | 8.95% |
| S&P 500® Index | -14.61% | 10.44% | 12.79% |
| All Equity Composite Index | -16.51% | 5.99% | 9.46% |
| Fund Category: Morningstar Allocation—85%+ Equity2 | -19.47% | 5.12% | 8.32% |
| Fund Expense Ratio3: 0.50% | |||
| 1 | Fund expenses may have been partially absorbed by the investment adviser and its affiliates. Without these reductions, the fund’s returns would have been lower. These returns do not reflect the deduction of taxes that a shareholder would pay on fund distributions or the redemption of fund shares. |
| 2 | Source for category information: Morningstar, Inc. The Morningstar Category return represents all active and index mutual funds and ETFs within the category as of the report date. |
| 3 | As stated in the prospectus. Includes 0.12% of acquired fund fees and expenses (AFFE), which are indirect expenses incurred by the fund through its investments in the underlying funds. Reflects the total annual fund operating expenses without contractual fee waivers. For actual expense ratios during the period, not including AFFE, refer to the financial highlights section of the financial statements. |

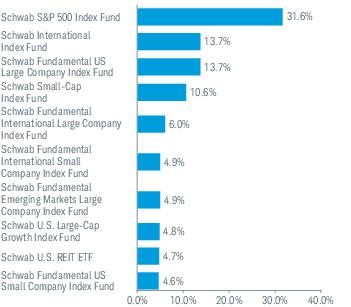
| 1 | The percentage may differ from the Portfolio Holdings because the above calculation is based on a percentage of total investments, whereas the calculation in the Portfolio Holdings is based on a percentage of net assets. |
| 2 | This list is not a recommendation of any security by the investment adviser. |
| 3 | The holdings listed exclude any temporary liquidity investments. |
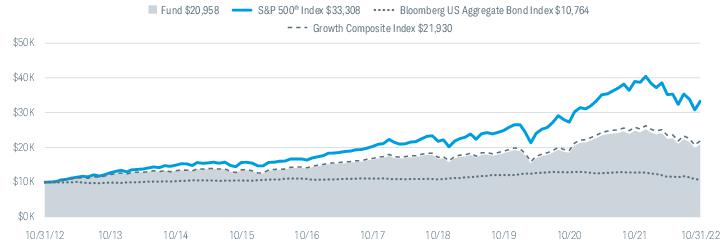
| Fund and Inception Date | 1 Year | 5 Years | 10 Years |
| Fund: Schwab MarketTrack Growth Portfolio (11/20/95) | -15.52% | 4.93% | 7.68% |
| S&P 500® Index | -14.61% | 10.44% | 12.79% |
| Bloomberg US Aggregate Bond Index | -15.68% | -0.54% | 0.74% |
| Growth Composite Index | -15.10% | 5.41% | 8.17% |
| Fund Category: Morningstar Allocation—70% to 85% Equity2 | -15.46% | 4.43% | 6.96% |
| Fund Expense Ratio3: 0.50% | |||
| 1 | Fund expenses may have been partially absorbed by the investment adviser and its affiliates. Without these reductions, the fund’s returns would have been lower. These returns do not reflect the deduction of taxes that a shareholder would pay on fund distributions or the redemption of fund shares. |
| 2 | Source for category information: Morningstar, Inc. The Morningstar Category return represents all active and index mutual funds and ETFs within the category as of the report date. |
| 3 | As stated in the prospectus. Includes 0.11% of acquired fund fees and expenses (AFFE), which are indirect expenses incurred by the fund through its investments in the underlying funds. Reflects the total annual fund operating expenses without contractual fee waivers. For actual expense ratios during the period, not including AFFE, refer to the financial highlights section of the financial statements. |

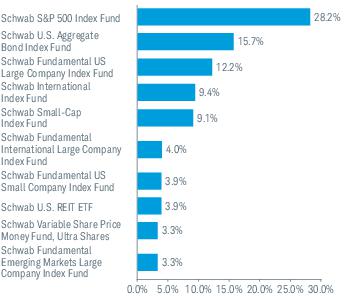
| 1 | The percentage may differ from the Portfolio Holdings because the above calculation is based on a percentage of total investments, whereas the calculation in the Portfolio Holdings is based on a percentage of net assets. |
| 2 | This list is not a recommendation of any security by the investment adviser. |
| 3 | The holdings listed exclude any temporary liquidity investments. |

| Fund and Inception Date | 1 Year | 5 Years | 10 Years |
| Fund: Schwab MarketTrack Balanced Portfolio (11/20/95) | -15.32% | 3.64% | 5.90% |
| S&P 500® Index | -14.61% | 10.44% | 12.79% |
| Bloomberg US Aggregate Bond Index | -15.68% | -0.54% | 0.74% |
| Balanced Composite Index | -14.91% | 4.13% | 6.41% |
| Fund Category: Morningstar Allocation—50% to 70% Equity2 | -14.00% | 4.25% | 6.15% |
| Fund Expense Ratio3: 0.48% | |||
| 1 | Fund expenses may have been partially absorbed by the investment adviser and its affiliates. Without these reductions, the fund’s returns would have been lower. These returns do not reflect the deduction of taxes that a shareholder would pay on fund distributions or the redemption of fund shares. |
| 2 | Source for category information: Morningstar, Inc. The Morningstar Category return represents all active and index mutual funds and ETFs within the category as of the report date. |
| 3 | As stated in the prospectus. Includes 0.09% of acquired fund fees and expenses (AFFE), which are indirect expenses incurred by the fund through its investments in the underlying funds. Reflects the total annual fund operating expenses without contractual fee waivers. For actual expense ratios during the period, not including AFFE, refer to the financial highlights section of the financial statements. |
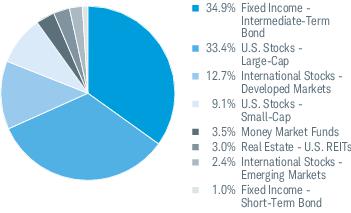
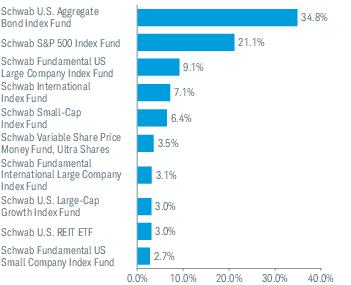
| 1 | The percentage may differ from the Portfolio Holdings because the above calculation is based on a percentage of total investments, whereas the calculation in the Portfolio Holdings is based on a percentage of net assets. |
| 2 | This list is not a recommendation of any security by the investment adviser. |
| 3 | The holdings listed exclude any temporary liquidity investments. |
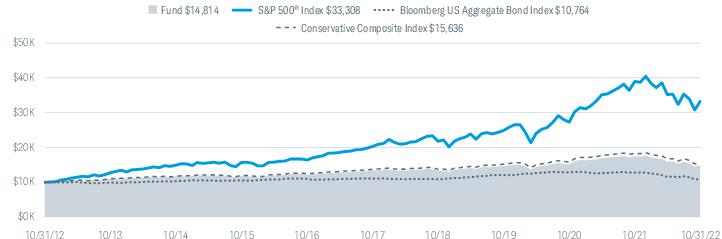
| Fund and Inception Date | 1 Year | 5 Years | 10 Years |
| Fund: Schwab MarketTrack Conservative Portfolio (11/20/95) | -15.23% | 2.17% | 4.01% |
| S&P 500® Index | -14.61% | 10.44% | 12.79% |
| Bloomberg US Aggregate Bond Index | -15.68% | -0.54% | 0.74% |
| Conservative Composite Index | -14.84% | 2.70% | 4.57% |
| Fund Category: Morningstar Allocation—30% to 50% Equity2 | -14.73% | 2.08% | 3.92% |
| Fund Expense Ratio3: 0.48% | |||
| 1 | Fund expenses may have been partially absorbed by the investment adviser and its affiliates. Without these reductions, the fund’s returns would have been lower. These returns do not reflect the deduction of taxes that a shareholder would pay on fund distributions or the redemption of fund shares. |
| 2 | Source for category information: Morningstar, Inc. The Morningstar Category return represents all active and index mutual funds and ETFs within the category as of the report date. |
| 3 | As stated in the prospectus. Includes 0.07% of acquired fund fees and expenses (AFFE), which are indirect expenses incurred by the fund through its investments in the underlying funds. Reflects the total annual fund operating expenses without contractual fee waivers. For actual expense ratios during the period, not including AFFE, refer to the financial highlights section of the financial statements. |
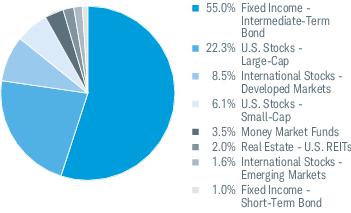
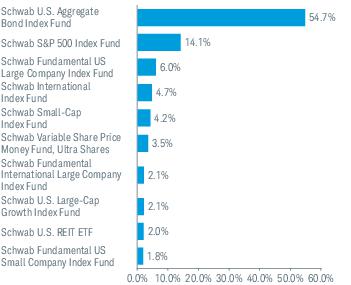
| 1 | The percentage may differ from the Portfolio Holdings because the above calculation is based on a percentage of total investments, whereas the calculation in the Portfolio Holdings is based on a percentage of net assets. |
| 2 | This list is not a recommendation of any security by the investment adviser. |
| 3 | The holdings listed exclude any temporary liquidity investments. |
| EXPENSE
RATIO (ANNUALIZED)1,2 |
EFFECTIVE
EXPENSE RATIO (ANNUALIZED)3,4 |
BEGINNING
ACCOUNT VALUE AT 5/1/22 |
ENDING
ACCOUNT VALUE (NET OF EXPENSES) AT 10/31/22 |
EXPENSES
PAID DURING PERIOD 5/1/22-10/31/222,5 |
EFFECTIVE
EXPENSES PAID DURING PERIOD 5/1/22-10/31/224,5 | |
| Schwab MarketTrack All Equity Portfolio | ||||||
| Actual Return | 0.39% | 0.51% | $1,000.00 | $ 924.50 | $1.89 | $2.47 |
| Hypothetical 5% Return | 0.39% | 0.51% | $1,000.00 | $1,023.24 | $1.99 | $2.60 |
| Schwab MarketTrack Growth Portfolio | ||||||
| Actual Return | 0.39% | 0.50% | $1,000.00 | $ 932.90 | $1.90 | $2.44 |
| Hypothetical 5% Return | 0.39% | 0.50% | $1,000.00 | $1,023.24 | $1.99 | $2.55 |
| Schwab MarketTrack Balanced Portfolio | ||||||
| Actual Return | 0.40% | 0.49% | $1,000.00 | $ 934.30 | $1.95 | $2.39 |
| Hypothetical 5% Return | 0.40% | 0.49% | $1,000.00 | $1,023.19 | $2.04 | $2.50 |
| Schwab MarketTrack Conservative Portfolio | ||||||
| Actual Return | 0.42% | 0.50% | $1,000.00 | $ 934.60 | $2.05 | $2.44 |
| Hypothetical 5% Return | 0.42% | 0.50% | $1,000.00 | $1,023.09 | $2.14 | $2.55 |
| 1 | Based on the most recent six-month expense ratio. |
| 2 | Excludes acquired fund fees and expenses, which are indirect expenses incurred by the fund through its investments in underlying funds. |
| 3 | Based on the most recent six-month acquired fund fees and expenses and the expense ratio; may differ from the acquired fund fees and expenses and the expense ratio in the prospectus. |
| 4 | Includes acquired fund fees and expenses, which are indirect expenses incurred by the fund through its investments in underlying funds. |
| 5 | Expenses for each fund are equal to its annualized expense ratio, multiplied by the average account value over the period, multiplied by the 184 days of the period, and divided by the 365 days of the fiscal year. |
| 11/1/21–
10/31/22 |
11/1/20–
10/31/21 |
11/1/19–
10/31/20 |
11/1/18–
10/31/19 |
11/1/17–
10/31/18 |
||
| Per-Share Data | ||||||
| Net asset value at beginning of period | $23.89 | $17.73 | $19.15 | $18.33 | $18.76 | |
| Income (loss) from investment operations: | ||||||
| Net investment income (loss)1 | 0.37 | 0.29 | 0.37 | 0.31 | 0.28 | |
| Net realized and unrealized gains (losses) | (4.23) | 7.21 | (0.54) | 1.30 | (0.05) | |
| Total from investment operations | (3.86) | 7.50 | (0.17) | 1.61 | 0.23 | |
| Less distributions: | ||||||
| Distributions from net investment income | (0.45) | (0.21) | (0.53) | (0.36) | (0.33) | |
| Distributions from net realized gains | (0.47) | (1.13) | (0.72) | (0.43) | (0.33) | |
| Total distributions | (0.92) | (1.34) | (1.25) | (0.79) | (0.66) | |
| Net asset value at end of period | $19.11 | $23.89 | $17.73 | $19.15 | $18.33 | |
| Total return | (16.89%) | 43.90% | (1.35%) | 9.58% | 1.10% | |
| Ratios/Supplemental Data | ||||||
| Ratios to average net assets: | ||||||
| Net operating expenses2 | 0.39% 3 | 0.38% | 0.40% | 0.40% | 0.39% | |
| Gross operating expenses2 | 0.39% 3 | 0.38% | 0.40% | 0.40% | 0.39% | |
| Net investment income (loss) | 1.75% | 1.33% | 2.08% | 1.72% | 1.46% | |
| Portfolio turnover rate | 7% | 6% | 18% | 6% | 5% | |
| Net assets, end of period (x 1,000) | $698,899 | $861,267 | $623,095 | $690,801 | $659,883 | |
| 1 | Calculated based on the average shares outstanding during the period. |
| 2 | Ratio excludes acquired fund fees and expenses, which are indirect expenses incurred by the fund through its investments in underlying funds. |
| 3 | Ratio includes less than 0.005% of non-routine proxy expenses. |
| SECURITY | VALUE
AT 10/31/21 |
PURCHASES | SALES | REALIZED
GAINS (LOSSES) |
NET
CHANGE IN UNREALIZED APPRECIATION (DEPRECIATION) |
VALUE
AT 10/31/22 |
BALANCE
OF SHARES HELD AT 10/31/22 |
DISTRIBUTIONS
RECEIVED(a) |
| AFFILIATED UNDERLYING FUNDS 99.5% OF NET ASSETS | ||||||||
| U.S. Stocks 65.3% | ||||||||
| Large-Cap 50.1% | ||||||||
| Schwab Fundamental US Large Company Index Fund | $116,756,387 | $5,526,670 | ($16,845,411) | $3,535,068 | ($13,347,981) | $95,624,733 | 4,512,729 | $5,526,670 |
| Schwab S&P 500 Index Fund | 272,314,653 | 4,232,483 | (13,784,846) | 6,856,908 | (48,666,778) | 220,952,420 | 3,681,313 | 3,432,484 |
| Schwab U.S. Large-Cap Growth Index Fund | 43,676,384 | 2,456,734 | (1,000,000) | 444,296 | (11,825,954) | 33,751,460 | 510,689 | 756,734 |
| 350,328,613 | ||||||||
| Small-Cap 15.2% | ||||||||
| Schwab Fundamental US Small Company Index Fund | 38,611,103 | 4,295,785 | (2,162,106) | (248,210) | (8,408,974) | 32,087,598 | 2,108,252 | 4,295,785 |
| Schwab Small-Cap Index Fund | 88,250,003 | 14,883,912 | (5,114,837) | (1,236,733) | (22,949,700) | 73,832,645 | 2,471,799 | 7,183,912 |
| 105,920,243 | ||||||||
| 456,248,856 | ||||||||
| International Stocks 29.5% | ||||||||
| Developed Markets 24.6% | ||||||||
| Schwab Fundamental International Large Company Index Fund | 51,138,365 | 5,920,159 | (5,000,000) | (133,491) | (10,133,268) | 41,791,765 | 4,969,294 | 1,924,957 |
| Schwab Fundamental International Small Company Index Fund | 42,258,117 | 6,794,587 | (518,000) | (158,912) | (13,958,727) | 34,417,065 | 3,228,618 | 2,441,864 |
| Schwab International Index Fund | 118,493,690 | 13,543,774 | (4,000,000) | (521,599) | (31,387,560) | 96,128,305 | 5,290,496 | 3,924,893 |
| 172,337,135 | ||||||||
| Emerging Markets 4.9% | ||||||||
| Schwab Fundamental Emerging Markets Large Company Index Fund | 42,507,983 | 8,761,915 | (4,640,000) | (60,723) | (12,288,404) | 34,280,771 | 4,664,050 | 1,909,360 |
| 206,617,906 | ||||||||
| Real Estate 4.7% | ||||||||
| U.S. REITs 4.7% | ||||||||
| Schwab U.S. REIT ETF | 43,312,349 | 1,033,679 | (3,048,106) | 426,413 | (8,825,193) | 32,899,142 | 1,703,736 | 832,760 |
| Total
Affiliated Underlying Funds (Cost $444,195,927) |
$857,319,034 | $67,449,698 | ($56,113,306) | $8,903,017 | ($181,792,539) | $695,765,904 | $32,229,419 | |
| Total
Investments in Securities (Cost $444,195,927) |
$695,765,904 | |||||||
| (a) | Distributions received include distributions from net investment income and capital gains, if any, from the underlying funds. Amounts shown are only presented for affiliated underlying funds, which are presented in the corresponding line-item in the Statement of Operations, if applicable (See financial note 2(d) for additional information). |
| ETF — | Exchange traded fund |
| REIT — | Real Estate Investment Trust |
| Assets | ||
| Investments in securities, at value - affiliated (cost $444,195,927) | $695,765,904 | |
| Cash | 3,322,645 | |
| Receivables: | ||
| Investments sold | 5,450,087 | |
| Fund shares sold | 357,650 | |
| Interest | 4,419 | |
| Prepaid expenses | + | 15,494 |
| Total assets | 704,916,199 | |
| Liabilities | ||
| Payables: | ||
| Investments bought | 5,115,184 | |
| Fund shares redeemed | 606,970 | |
| Shareholder service fees | 127,794 | |
| Investment adviser and administrator fees | 69,475 | |
| Independent trustees’ fees | 42 | |
| Accrued expenses | + | 97,893 |
| Total liabilities | 6,017,358 | |
| Net assets | $698,898,841 | |
| Net Assets by Source | ||
| Capital received from investors | $435,746,602 | |
| Total distributable earnings | + | 263,152,239 |
| Net assets | $698,898,841 | |
| Net Asset Value (NAV) | ||||
| Net Assets | ÷ | Shares
Outstanding |
= | NAV |
| $698,898,841 | 36,581,612 | $19.11 | ||
| For the period November 1, 2021 through October 31, 2022 | ||
| Investment Income | ||
| Dividends received from securities - affiliated | $16,612,616 | |
| Interest received from securities - unaffiliated | + | 16,771 |
| Total investment income | 16,629,387 | |
| Expenses | ||
| Shareholder service fees | 1,840,860 | |
| Investment adviser and administrator fees | 1,011,089 | |
| Proxy fees1 | 34,999 | |
| Shareholder reports | 34,211 | |
| Registration fees | 34,055 | |
| Portfolio accounting fees | 29,851 | |
| Professional fees | 21,540 | |
| Independent trustees’ fees | 8,907 | |
| Transfer agent fees | 5,546 | |
| Custodian fees | 1,860 | |
| Other expenses | + | 11,679 |
| Total expenses | 3,034,597 | |
| Expense reduction | – | 5,546 |
| Net expenses | – | 3,029,051 |
| Net investment income | 13,600,336 | |
| REALIZED AND UNREALIZED GAINS (LOSSES) | ||
| Realized capital gain distributions received from underlying funds - affiliated | 15,616,803 | |
| Net realized gains on sales of securities - affiliated | + | 8,903,017 |
| Net realized gains | 24,519,820 | |
| Net change in unrealized appreciation (depreciation) on securities - affiliated | + | (181,792,539) |
| Net realized and unrealized losses | (157,272,719) | |
| Decrease in net assets resulting from operations | ($143,672,383) | |
| 1 | Proxy fees are non-routine expenses (see financial note 2(e) for additional information). |
| OPERATIONS | |||
| 11/1/21-10/31/22 | 11/1/20-10/31/21 | ||
| Net investment income | $13,600,336 | $10,545,614 | |
| Net realized gains | 24,519,820 | 16,951,292 | |
| Net change in unrealized appreciation (depreciation) | + | (181,792,539) | 241,141,234 |
| Increase (decrease) in net assets resulting from operations | ($143,672,383) | $268,638,140 | |
| DISTRIBUTIONS TO SHAREHOLDERS | |||
| Total distributions | ($32,780,380) | ($46,815,289) | |
| TRANSACTIONS IN FUND SHARES | |||||
| 11/1/21-10/31/22 | 11/1/20-10/31/21 | ||||
| SHARES | VALUE | SHARES | VALUE | ||
| Shares sold | 3,208,269 | $68,237,077 | 3,230,265 | $70,646,900 | |
| Shares reinvested | 1,243,501 | 29,160,110 | 2,118,421 | 41,923,540 | |
| Shares redeemed | + | (3,924,534) | (83,312,796) | (4,430,219) | (96,220,989) |
| Net transactions in fund shares | 527,236 | $14,084,391 | 918,467 | $16,349,451 | |
| SHARES OUTSTANDING AND NET ASSETS | |||||
| 11/1/21-10/31/22 | 11/1/20-10/31/21 | ||||
| SHARES | NET ASSETS | SHARES | NET ASSETS | ||
| Beginning of period | 36,054,376 | $861,267,213 | 35,135,909 | $623,094,911 | |
| Total increase (decrease) | + | 527,236 | (162,368,372) | 918,467 | 238,172,302 |
| End of period | 36,581,612 | $698,898,841 | 36,054,376 | $861,267,213 | |
| 11/1/21–
10/31/22 |
11/1/20–
10/31/21 |
11/1/19–
10/31/20 |
11/1/18–
10/31/19 |
11/1/17–
10/31/18 |
||
| Per-Share Data | ||||||
| Net asset value at beginning of period | $27.84 | $22.42 | $23.54 | $22.67 | $23.47 | |
| Income (loss) from investment operations: | ||||||
| Net investment income (loss)1 | 0.40 | 0.35 | 0.43 | 0.41 | 0.37 | |
| Net realized and unrealized gains (losses) | (4.49) | 7.03 | (0.20) | 1.62 | (0.04) | |
| Total from investment operations | (4.09) | 7.38 | 0.23 | 2.03 | 0.33 | |
| Less distributions: | ||||||
| Distributions from net investment income | (0.44) | (0.39) | (0.47) | (0.45) | (0.40) | |
| Distributions from net realized gains | (0.92) | (1.57) | (0.88) | (0.71) | (0.73) | |
| Total distributions | (1.36) | (1.96) | (1.35) | (1.16) | (1.13) | |
| Net asset value at end of period | $22.39 | $27.84 | $22.42 | $23.54 | $22.67 | |
| Total return | (15.52%) | 34.32% | 0.74% | 9.86% | 1.28% | |
| Ratios/Supplemental Data | ||||||
| Ratios to average net assets: | ||||||
| Net operating expenses2 | 0.39% 3 | 0.39% | 0.39% | 0.40% | 0.39% | |
| Gross operating expenses2 | 0.39% 3 | 0.39% | 0.40% | 0.40% | 0.39% | |
| Net investment income (loss) | 1.63% | 1.33% | 1.92% | 1.82% | 1.59% | |
| Portfolio turnover rate | 8% | 8% | 19% | 7% | 7% | |
| Net assets, end of period (x 1,000) | $801,906 | $982,246 | $748,492 | $816,532 | $782,843 | |
| 1 | Calculated based on the average shares outstanding during the period. |
| 2 | Ratio excludes acquired fund fees and expenses, which are indirect expenses incurred by the fund through its investments in underlying funds. |
| 3 | Ratio includes less than 0.005% of non-routine proxy expenses. |
| SECURITY | VALUE
AT 10/31/21 |
PURCHASES | SALES | REALIZED
GAINS (LOSSES) |
NET
CHANGE IN UNREALIZED APPRECIATION (DEPRECIATION) |
VALUE
AT 10/31/22 |
BALANCE
OF SHARES HELD AT 10/31/22 |
DISTRIBUTIONS
RECEIVED(a) |
| AFFILIATED UNDERLYING FUNDS 99.4% OF NET ASSETS | ||||||||
| U.S. Stocks 56.6% | ||||||||
| Large-Cap 43.6% | ||||||||
| Schwab Fundamental US Large Company Index Fund | $118,042,501 | $5,587,548 | ($16,077,159) | $3,320,583 | ($13,116,896) | $97,756,577 | 4,613,335 | $5,587,548 |
| Schwab S&P 500 Index Fund | 277,499,962 | 8,842,886 | (18,255,663) | 8,024,693 | (50,032,799) | 226,079,079 | 3,766,729 | 3,528,504 |
| Schwab U.S. Large-Cap Growth Index Fund | 33,120,533 | 1,851,920 | (663,202) | 36,507 | (8,576,200) | 25,769,558 | 389,916 | 587,210 |
| 349,605,214 | ||||||||
| Small-Cap 13.0% | ||||||||
| Schwab Fundamental US Small Company Index Fund | 37,581,408 | 4,181,223 | (2,005,047) | (145,867) | (8,206,981) | 31,404,736 | 2,063,386 | 4,181,223 |
| Schwab Small-Cap Index Fund | 87,328,739 | 13,884,881 | (4,668,555) | (1,088,108) | (22,431,174) | 73,025,783 | 2,444,787 | 7,052,100 |
| 104,430,519 | ||||||||
| 454,035,733 | ||||||||
| International Stocks 19.9% | ||||||||
| Developed Markets 16.6% | ||||||||
| Schwab Fundamental International Large Company Index Fund | 39,004,287 | 4,913,207 | (3,811,820) | (41,901) | (7,810,017) | 32,253,756 | 3,835,167 | 1,470,371 |
| Schwab Fundamental International Small Company Index Fund | 32,131,665 | 4,441,824 | — | — | (10,685,726) | 25,887,763 | 2,428,496 | 1,855,489 |
| Schwab International Index Fund | 89,825,363 | 11,344,868 | (1,820,000) | (211,612) | (24,066,720) | 75,071,899 | 4,131,640 | 3,021,946 |
| 133,213,418 | ||||||||
| Emerging Markets 3.3% | ||||||||
| Schwab Fundamental Emerging Markets Large Company Index Fund | 33,053,688 | 4,479,321 | (1,900,000) | 66,722 | (9,516,552) | 26,183,179 | 3,562,337 | 1,449,004 |
| 159,396,597 | ||||||||
| Real Estate 3.9% | ||||||||
| U.S. REITs 3.9% | ||||||||
| Schwab U.S. REIT ETF | 40,246,572 | 1,171,868 | (2,550,003) | 447,972 | (8,215,530) | 31,100,879 | 1,610,610 | 777,528 |
| Fixed Income 15.7% | ||||||||
| Intermediate-Term Bond 15.7% | ||||||||
| Schwab U.S. Aggregate Bond Index Fund | 155,413,117 | 16,696,054 | (18,696,573) | (2,551,485) | (24,772,473) | 126,088,640 | 14,661,470 | 3,244,324 |
| Money Market Funds 3.3% | ||||||||
| Schwab Variable Share Price Money Fund, Ultra Shares, 3.10% (b) | 24,572,691 | 2,228,017 | (586) | — | (7,388) | 26,792,734 | 26,792,734 | 261,030 |
| Total
Affiliated Underlying Funds (Cost $534,842,009) |
$967,820,526 | $79,623,617 | ($70,448,608) | $7,857,504 | ($187,438,456) | $797,414,583 | $33,016,277 | |
| Total
Investments in Securities (Cost $534,842,009) |
$797,414,583 | |||||||
| (a) | Distributions received include distributions from net investment income and capital gains, if any, from the underlying funds. Amounts shown are only presented for affiliated underlying funds, which are presented in the corresponding line-item in the Statement of Operations, if applicable (See financial note 2(d) for additional information). |
| (b) | The rate shown is the annualized 7-day yield. |
| ETF — | Exchange traded fund |
| REIT — | Real Estate Investment Trust |
| Assets | ||
| Investments in securities, at value - affiliated (cost $534,842,009) | $797,414,583 | |
| Cash | 2,058,390 | |
| Receivables: | ||
| Investments sold | 9,177,501 | |
| Fund shares sold | 645,022 | |
| Dividends | 299,290 | |
| Interest | 4,266 | |
| Prepaid expenses | + | 18,407 |
| Total assets | 809,617,459 | |
| Liabilities | ||
| Payables: | ||
| Investments bought | 6,102,959 | |
| Fund shares redeemed | 1,312,903 | |
| Shareholder service fees | 150,440 | |
| Investment adviser and administrator fees | 80,386 | |
| Independent trustees’ fees | 43 | |
| Accrued expenses | + | 64,256 |
| Total liabilities | 7,710,987 | |
| Net assets | $801,906,472 | |
| Net Assets by Source | ||
| Capital received from investors | $519,086,131 | |
| Total distributable earnings | + | 282,820,341 |
| Net assets | $801,906,472 | |
| Net Asset Value (NAV) | ||||
| Net Assets | ÷ | Shares
Outstanding |
= | NAV |
| $801,906,472 | 35,810,255 | $22.39 | ||
| For the period November 1, 2021 through October 31, 2022 | ||
| Investment Income | ||
| Dividends received from securities - affiliated | $17,990,980 | |
| Interest received from securities - unaffiliated | + | 31,542 |
| Total investment income | 18,022,522 | |
| Expenses | ||
| Shareholder service fees | 2,140,490 | |
| Investment adviser and administrator fees | 1,156,133 | |
| Proxy fees1 | 41,087 | |
| Registration fees | 38,468 | |
| Shareholder reports | 32,738 | |
| Portfolio accounting fees | 31,131 | |
| Professional fees | 21,635 | |
| Independent trustees’ fees | 9,210 | |
| Transfer agent fees | 4,516 | |
| Custodian fees | 2,077 | |
| Other expenses | + | 12,582 |
| Total expenses | 3,490,067 | |
| Expense reduction | – | 4,516 |
| Net expenses | – | 3,485,551 |
| Net investment income | 14,536,971 | |
| REALIZED AND UNREALIZED GAINS (LOSSES) | ||
| Realized capital gain distributions received from underlying funds - affiliated | 15,025,297 | |
| Net realized gains on sales of securities - affiliated | + | 7,857,504 |
| Net realized gains | 22,882,801 | |
| Net change in unrealized appreciation (depreciation) on securities - affiliated | + | (187,438,456) |
| Net realized and unrealized losses | (164,555,655) | |
| Decrease in net assets resulting from operations | ($150,018,684) | |
| 1 | Proxy fees are non-routine expenses (see financial note 2(e) for additional information). |
| OPERATIONS | |||
| 11/1/21-10/31/22 | 11/1/20-10/31/21 | ||
| Net investment income | $14,536,971 | $12,181,853 | |
| Net realized gains | 22,882,801 | 32,571,642 | |
| Net change in unrealized appreciation (depreciation) | + | (187,438,456) | 209,004,001 |
| Increase (decrease) in net assets resulting from operations | ($150,018,684) | $253,757,496 | |
| DISTRIBUTIONS TO SHAREHOLDERS | |||
| Total distributions | ($47,953,508) | ($64,608,050) | |
| TRANSACTIONS IN FUND SHARES | |||||
| 11/1/21-10/31/22 | 11/1/20-10/31/21 | ||||
| SHARES | VALUE | SHARES | VALUE | ||
| Shares sold | 3,110,088 | $77,344,476 | 3,644,847 | $94,749,475 | |
| Shares reinvested | 1,629,745 | 43,937,930 | 2,487,105 | 59,466,671 | |
| Shares redeemed | + | (4,205,157) | (103,649,624) | (4,239,705) | (109,611,696) |
| Net transactions in fund shares | 534,676 | $17,632,782 | 1,892,247 | $44,604,450 | |
| SHARES OUTSTANDING AND NET ASSETS | |||||
| 11/1/21-10/31/22 | 11/1/20-10/31/21 | ||||
| SHARES | NET ASSETS | SHARES | NET ASSETS | ||
| Beginning of period | 35,275,579 | $982,245,882 | 33,383,332 | $748,491,986 | |
| Total increase (decrease) | + | 534,676 | (180,339,410) | 1,892,247 | 233,753,896 |
| End of period | 35,810,255 | $801,906,472 | 35,275,579 | $982,245,882 | |
| 11/1/21–
10/31/22 |
11/1/20–
10/31/21 |
11/1/19–
10/31/20 |
11/1/18–
10/31/19 |
11/1/17–
10/31/18 |
||
| Per-Share Data | ||||||
| Net asset value at beginning of period | $21.53 | $18.38 | $18.75 | $18.24 | $19.12 | |
| Income (loss) from investment operations: | ||||||
| Net investment income (loss)1 | 0.32 | 0.28 | 0.35 | 0.36 | 0.34 | |
| Net realized and unrealized gains (losses) | (3.45) | 4.11 | 0.10 | 1.32 | (0.24) | |
| Total from investment operations | (3.13) | 4.39 | 0.45 | 1.68 | 0.10 | |
| Less distributions: | ||||||
| Distributions from net investment income | (0.33) | (0.32) | (0.39) | (0.39) | (0.33) | |
| Distributions from net realized gains | (0.71) | (0.92) | (0.43) | (0.78) | (0.65) | |
| Total distributions | (1.04) | (1.24) | (0.82) | (1.17) | (0.98) | |
| Net asset value at end of period | $17.36 | $21.53 | $18.38 | $18.75 | $18.24 | |
| Total return | (15.32%) | 24.66% | 2.37% | 10.14% | 0.44% | |
| Ratios/Supplemental Data | ||||||
| Ratios to average net assets: | ||||||
| Net operating expenses2 | 0.40% 3 | 0.39% | 0.40% | 0.40% | 0.40% | |
| Gross operating expenses2 | 0.40% 3 | 0.39% | 0.40% | 0.40% | 0.40% | |
| Net investment income (loss) | 1.67% | 1.39% | 1.91% | 1.99% | 1.79% | |
| Portfolio turnover rate | 11% | 10% | 22% | 11% | 8% | |
| Net assets, end of period (x 1,000) | $519,474 | $654,876 | $517,619 | $544,554 | $514,701 | |
| 1 | Calculated based on the average shares outstanding during the period. |
| 2 | Ratio excludes acquired fund fees and expenses, which are indirect expenses incurred by the fund through its investments in underlying funds. |
| 3 | Ratio includes less than 0.005% of non-routine proxy expenses. |
| SECURITY | VALUE
AT 10/31/21 |
PURCHASES | SALES | REALIZED
GAINS (LOSSES) |
NET
CHANGE IN UNREALIZED APPRECIATION (DEPRECIATION) |
VALUE
AT 10/31/22 |
BALANCE
OF SHARES HELD AT 10/31/22 |
DISTRIBUTIONS
RECEIVED(a) |
| AFFILIATED UNDERLYING FUNDS 99.5% OF NET ASSETS | ||||||||
| U.S. Stocks 42.3% | ||||||||
| Large-Cap 33.2% | ||||||||
| Schwab Fundamental US Large Company Index Fund | $59,085,860 | $2,796,831 | ($9,859,596) | $2,281,540 | ($7,109,625) | $47,195,010 | 2,227,230 | $2,796,831 |
| Schwab S&P 500 Index Fund | 139,218,494 | 9,740,355 | (18,708,148) | 7,604,689 | (28,187,483) | 109,667,907 | 1,827,189 | 1,776,532 |
| Schwab U.S. Large-Cap Growth Index Fund | 19,858,952 | 2,053,898 | (1,128,480) | 39,028 | (5,130,363) | 15,693,035 | 237,449 | 352,089 |
| 172,555,952 | ||||||||
| Small-Cap 9.1% | ||||||||
| Schwab Fundamental US Small Company Index Fund | 18,219,135 | 2,027,021 | (2,030,898) | (143,457) | (3,895,272) | 14,176,529 | 931,441 | 2,027,021 |
| Schwab Small-Cap Index Fund | 40,657,077 | 8,157,434 | (4,749,056) | (951,792) | (9,949,550) | 33,164,113 | 1,110,282 | 3,244,429 |
| 47,340,642 | ||||||||
| 219,896,594 | ||||||||
| International Stocks 15.0% | ||||||||
| Developed Markets 12.6% | ||||||||
| Schwab Fundamental International Large Company Index Fund | 20,061,722 | 2,261,477 | (2,333,924) | (98,466) | (3,868,271) | 16,022,538 | 1,905,177 | 749,176 |
| Schwab Fundamental International Small Company Index Fund | 15,945,045 | 2,585,704 | (319,999) | (96,920) | (5,244,378) | 12,869,452 | 1,207,266 | 935,845 |
| Schwab International Index Fund | 45,041,593 | 5,275,465 | (1,317,686) | (80,356) | (12,050,037) | 36,868,979 | 2,029,113 | 1,530,377 |
| 65,760,969 | ||||||||
| Emerging Markets 2.4% | ||||||||
| Schwab Fundamental Emerging Markets Large Company Index Fund | 15,913,718 | 1,664,556 | (637,444) | 8,320 | (4,635,569) | 12,313,581 | 1,675,317 | 720,574 |
| 78,074,550 | ||||||||
| Real Estate 3.0% | ||||||||
| U.S. REITs 3.0% | ||||||||
| Schwab U.S. REIT ETF | 20,281,510 | 1,278,883 | (2,448,578) | 363,204 | (4,062,163) | 15,412,856 | 798,180 | 384,512 |
| Fixed Income 35.7% | ||||||||
| Intermediate-Term Bond 34.8% | ||||||||
| Schwab U.S. Aggregate Bond Index Fund | 228,337,823 | 26,913,317 | (34,714,378) | (4,863,789) | (35,083,221) | 180,589,752 | 20,998,808 | 4,733,666 |
| Short-Term Bond 0.9% | ||||||||
| Schwab Short-Term Bond Index Fund | 6,193,020 | 90,006 | (782,279) | (79,017) | (446,069) | 4,975,661 | 533,869 | 89,977 |
| 185,565,413 | ||||||||
| SECURITY | VALUE
AT 10/31/21 |
PURCHASES | SALES | REALIZED
GAINS (LOSSES) |
NET
CHANGE IN UNREALIZED APPRECIATION (DEPRECIATION) |
VALUE
AT 10/31/22 |
BALANCE
OF SHARES HELD AT 10/31/22 |
DISTRIBUTIONS
RECEIVED(a) |
| Money Market Funds 3.5% | ||||||||
| Schwab Variable Share Price Money Fund, Ultra Shares, 3.10% (b) | $16,771,034 | $1,152,635 | ($400) | $— | ($5,043) | $17,918,226 | 17,918,226 | $174,699 |
| Total
Affiliated Underlying Funds (Cost $403,665,947) |
$645,584,983 | $65,997,582 | ($79,030,866) | $3,982,984 | ($119,667,044) | $516,867,639 | $19,515,728 | |
| Total
Investments in Securities (Cost $403,665,947) |
$516,867,639 | |||||||
| (a) | Distributions received include distributions from net investment income and capital gains, if any, from the underlying funds. Amounts shown are only presented for affiliated underlying funds, which are presented in the corresponding line-item in the Statement of Operations, if applicable (See financial note 2(d) for additional information). |
| (b) | The rate shown is the annualized 7-day yield. |
| ETF — | Exchange traded fund |
| REIT — | Real Estate Investment Trust |
| Assets | ||
| Investments in securities, at value - affiliated (cost $403,665,947) | $516,867,639 | |
| Cash | 1,771,520 | |
| Receivables: | ||
| Investments sold | 9,272,005 | |
| Dividends | 405,611 | |
| Fund shares sold | 374,568 | |
| Interest | 2,659 | |
| Prepaid expenses | + | 17,775 |
| Total assets | 528,711,777 | |
| Liabilities | ||
| Payables: | ||
| Investments bought | 8,506,572 | |
| Fund shares redeemed | 502,815 | |
| Shareholder service fees | 98,875 | |
| Investment adviser and administrator fees | 52,550 | |
| Independent trustees’ fees | 39 | |
| Accrued expenses | + | 77,012 |
| Total liabilities | 9,237,863 | |
| Net assets | $519,473,914 | |
| Net Assets by Source | ||
| Capital received from investors | $397,618,701 | |
| Total distributable earnings | + | 121,855,213 |
| Net assets | $519,473,914 | |
| Net Asset Value (NAV) | ||||
| Net Assets | ÷ | Shares
Outstanding |
= | NAV |
| $519,473,914 | 29,923,064 | $17.36 | ||
| For the period November 1, 2021 through October 31, 2022 | ||
| Investment Income | ||
| Dividends received from securities - affiliated | $12,239,079 | |
| Interest received from securities - unaffiliated | + | 18,350 |
| Total investment income | 12,257,429 | |
| Expenses | ||
| Shareholder service fees | 1,438,179 | |
| Investment adviser and administrator fees | 770,324 | |
| Registration fees | 35,255 | |
| Portfolio accounting fees | 27,586 | |
| Proxy fees1 | 26,665 | |
| Shareholder reports | 21,694 | |
| Professional fees | 20,813 | |
| Independent trustees’ fees | 8,388 | |
| Transfer agent fees | 3,096 | |
| Custodian fees | 1,960 | |
| Other expenses | + | 9,900 |
| Total expenses | 2,363,860 | |
| Expense reduction | – | 3,097 |
| Net expenses | – | 2,360,763 |
| Net investment income | 9,896,666 | |
| REALIZED AND UNREALIZED GAINS (LOSSES) | ||
| Realized capital gain distributions received from underlying funds - affiliated | 7,276,649 | |
| Net realized gains on sales of securities - affiliated | + | 3,982,984 |
| Net realized gains | 11,259,633 | |
| Net change in unrealized appreciation (depreciation) on securities - affiliated | + | (119,667,044) |
| Net realized and unrealized losses | (108,407,411) | |
| Decrease in net assets resulting from operations | ($98,510,745) | |
| 1 | Proxy fees are non-routine expenses (see financial note 2(e) for additional information). |
| OPERATIONS | |||
| 11/1/21-10/31/22 | 11/1/20-10/31/21 | ||
| Net investment income | $9,896,666 | $8,512,714 | |
| Net realized gains | 11,259,633 | 21,530,054 | |
| Net change in unrealized appreciation (depreciation) | + | (119,667,044) | 97,820,924 |
| Increase (decrease) in net assets resulting from operations | ($98,510,745) | $127,863,692 | |
| DISTRIBUTIONS TO SHAREHOLDERS | |||
| Total distributions | ($31,823,550) | ($34,781,810) | |
| TRANSACTIONS IN FUND SHARES | |||||
| 11/1/21-10/31/22 | 11/1/20-10/31/21 | ||||
| SHARES | VALUE | SHARES | VALUE | ||
| Shares sold | 3,053,833 | $59,625,179 | 4,679,194 | $95,523,630 | |
| Shares reinvested | 1,384,745 | 28,747,318 | 1,640,068 | 31,604,119 | |
| Shares redeemed | + | (4,931,534) | (93,440,331) | (4,058,104) | (82,952,722) |
| Net transactions in fund shares | (492,956) | ($5,067,834) | 2,261,158 | $44,175,027 | |
| SHARES OUTSTANDING AND NET ASSETS | |||||
| 11/1/21-10/31/22 | 11/1/20-10/31/21 | ||||
| SHARES | NET ASSETS | SHARES | NET ASSETS | ||
| Beginning of period | 30,416,020 | $654,876,043 | 28,154,862 | $517,619,134 | |
| Total increase (decrease) | + | (492,956) | (135,402,129) | 2,261,158 | 137,256,909 |
| End of period | 29,923,064 | $519,473,914 | 30,416,020 | $654,876,043 | |
| 11/1/21–
10/31/22 |
11/1/20–
10/31/21 |
11/1/19–
10/31/20 |
11/1/18–
10/31/19 |
11/1/17–
10/31/18 |
||
| Per-Share Data | ||||||
| Net asset value at beginning of period | $18.47 | $16.50 | $16.43 | $15.63 | $16.27 | |
| Income (loss) from investment operations: | ||||||
| Net investment income (loss)1 | 0.29 | 0.26 | 0.30 | 0.35 | 0.31 | |
| Net realized and unrealized gains (losses) | (2.97) | 2.27 | 0.27 | 1.18 | (0.38) | |
| Total from investment operations | (2.68) | 2.53 | 0.57 | 1.53 | (0.07) | |
| Less distributions: | ||||||
| Distributions from net investment income | (0.30) | (0.27) | (0.31) | (0.36) | (0.32) | |
| Distributions from net realized gains | (0.59) | (0.29) | (0.19) | (0.37) | (0.25) | |
| Total distributions | (0.89) | (0.56) | (0.50) | (0.73) | (0.57) | |
| Net asset value at end of period | $14.90 | $18.47 | $16.50 | $16.43 | $15.63 | |
| Total return | (15.23%) | 15.50% | 3.57% | 10.31% | (0.49%) | |
| Ratios/Supplemental Data | ||||||
| Ratios to average net assets: | ||||||
| Net operating expenses2 | 0.42% 3 | 0.41% | 0.42% | 0.43% | 0.41% | |
| Gross operating expenses2 | 0.42% 3 | 0.41% | 0.42% | 0.43% | 0.41% | |
| Net investment income (loss) | 1.73% | 1.45% | 1.84% | 2.19% | 1.93% | |
| Portfolio turnover rate | 11% | 13% | 35% | 26% | 9% | |
| Net assets, end of period (x 1,000) | $227,991 | $335,110 | $278,883 | $263,373 | $239,068 | |
| 1 | Calculated based on the average shares outstanding during the period. |
| 2 | Ratio excludes acquired fund fees and expenses, which are indirect expenses incurred by the fund through its investments in underlying funds. |
| 3 | Ratio includes less than 0.005% of non-routine proxy expenses. |
| SECURITY | VALUE
AT 10/31/21 |
PURCHASES | SALES | REALIZED
GAINS (LOSSES) |
NET
CHANGE IN UNREALIZED APPRECIATION (DEPRECIATION) |
VALUE
AT 10/31/22 |
BALANCE
OF SHARES HELD AT 10/31/22 |
DISTRIBUTIONS
RECEIVED(a) |
| AFFILIATED UNDERLYING FUNDS 99.5% OF NET ASSETS | ||||||||
| U.S. Stocks 28.2% | ||||||||
| Large-Cap 22.2% | ||||||||
| Schwab Fundamental US Large Company Index Fund | $20,049,297 | $1,837,826 | ($6,572,518) | $1,396,688 | ($2,999,932) | $13,711,361 | 647,068 | $949,036 |
| Schwab S&P 500 Index Fund | 47,404,594 | 4,649,146 | (13,115,370) | 6,425,594 | (13,212,743) | 32,151,221 | 535,675 | 605,949 |
| Schwab U.S. Large-Cap Growth Index Fund | 6,958,268 | 1,187,278 | (1,813,636) | 260,261 | (1,923,461) | 4,668,710 | 70,642 | 123,367 |
| 50,531,292 | ||||||||
| Small-Cap 6.0% | ||||||||
| Schwab Fundamental US Small Company Index Fund | 5,916,724 | 791,966 | (1,244,377) | (8,203) | (1,299,650) | 4,156,460 | 273,092 | 658,281 |
| Schwab Small-Cap Index Fund | 14,217,551 | 3,392,638 | (4,206,181) | (306,651) | (3,458,726) | 9,638,631 | 322,686 | 1,134,557 |
| 13,795,091 | ||||||||
| 64,326,383 | ||||||||
| International Stocks 10.1% | ||||||||
| Developed Markets 8.5% | ||||||||
| Schwab Fundamental International Large Company Index Fund | 6,690,648 | 1,034,823 | (1,779,129) | (10,908) | (1,258,137) | 4,677,297 | 556,159 | 252,770 |
| Schwab Fundamental International Small Company Index Fund | 5,744,117 | 315,889 | (525,000) | (103,586) | (1,662,185) | 3,769,235 | 353,587 | 315,889 |
| Schwab International Index Fund | 15,566,944 | 1,834,556 | (2,633,552) | (176,021) | (3,828,479) | 10,763,448 | 592,375 | 516,716 |
| 19,209,980 | ||||||||
| Emerging Markets 1.6% | ||||||||
| Schwab Fundamental Emerging Markets Large Company Index Fund | 5,328,747 | 666,016 | (820,527) | (14,423) | (1,488,324) | 3,671,489 | 499,522 | 245,076 |
| 22,881,469 | ||||||||
| Real Estate 2.0% | ||||||||
| U.S. REITs 2.0% | ||||||||
| Schwab U.S. REIT ETF | 6,912,401 | 234,542 | (1,349,523) | 132,524 | (1,313,116) | 4,616,828 | 239,090 | 124,390 |
| Fixed Income 55.7% | ||||||||
| Intermediate-Term Bond 54.7% | ||||||||
| Schwab U.S. Aggregate Bond Index Fund | 183,900,598 | 13,965,471 | (43,035,923) | (5,742,878) | (24,358,395) | 124,728,873 | 14,503,357 | 3,592,868 |
| Short-Term Bond 1.0% | ||||||||
| Schwab Short-Term Bond Index Fund | 3,181,909 | 43,731 | (671,387) | (52,368) | (203,977) | 2,297,908 | 246,557 | 43,717 |
| 127,026,781 | ||||||||
| SECURITY | VALUE
AT 10/31/21 |
PURCHASES | SALES | REALIZED
GAINS (LOSSES) |
NET
CHANGE IN UNREALIZED APPRECIATION (DEPRECIATION) |
VALUE
AT 10/31/22 |
BALANCE
OF SHARES HELD AT 10/31/22 |
DISTRIBUTIONS
RECEIVED(a) |
| Money Market Funds 3.5% | ||||||||
| Schwab Variable Share Price Money Fund, Ultra Shares, 3.10% (b) | $9,220,832 | $75,242 | ($1,250,220) | ($630) | ($2,021) | $8,043,203 | 8,043,203 | $85,083 |
| Total
Affiliated Underlying Funds (Cost $202,271,486) |
$331,092,630 | $30,029,124 | ($79,017,343) | $1,799,399 | ($57,009,146) | $226,894,664 | $8,647,699 | |
| Total
Investments in Securities (Cost $202,271,486) |
$226,894,664 | |||||||
| (a) | Distributions received include distributions from net investment income and capital gains, if any, from the underlying funds. Amounts shown are only presented for affiliated underlying funds, which are presented in the corresponding line-item in the Statement of Operations, if applicable (See financial note 2(d) for additional information). |
| (b) | The rate shown is the annualized 7-day yield. |
| ETF — | Exchange traded fund |
| REIT — | Real Estate Investment Trust |
| Assets | ||
| Investments in securities, at value - affiliated (cost $202,271,486) | $226,894,664 | |
| Cash | 282,848 | |
| Receivables: | ||
| Investments sold | 4,119,420 | |
| Dividends | 278,707 | |
| Fund shares sold | 248,358 | |
| Interest | 904 | |
| Prepaid expenses | + | 15,863 |
| Total assets | 231,840,764 | |
| Liabilities | ||
| Payables: | ||
| Investments bought | 3,592,140 | |
| Fund shares redeemed | 130,497 | |
| Shareholder service fees | 44,428 | |
| Investment adviser and administrator fees | 23,384 | |
| Independent trustees’ fees | 35 | |
| Accrued expenses | + | 59,747 |
| Total liabilities | 3,850,231 | |
| Net assets | $227,990,533 | |
| Net Assets by Source | ||
| Capital received from investors | $202,174,552 | |
| Total distributable earnings | + | 25,815,981 |
| Net assets | $227,990,533 | |
| Net Asset Value (NAV) | ||||
| Net Assets | ÷ | Shares
Outstanding |
= | NAV |
| $227,990,533 | 15,304,913 | $14.90 | ||
| For the period November 1, 2021 through October 31, 2022 | ||
| Investment Income | ||
| Dividends received from securities - affiliated | $6,170,406 | |
| Interest received from securities - unaffiliated | + | 5,469 |
| Total investment income | 6,175,875 | |
| Expenses | ||
| Shareholder service fees | 702,592 | |
| Investment adviser and administrator fees | 373,899 | |
| Registration fees | 42,715 | |
| Portfolio accounting fees | 24,115 | |
| Professional fees | 20,163 | |
| Proxy fees1 | 12,943 | |
| Shareholder reports | 12,357 | |
| Independent trustees’ fees | 7,548 | |
| Transfer agent fees | 1,709 | |
| Custodian fees | 1,496 | |
| Interest expense | 380 | |
| Other expenses | + | 7,063 |
| Total expenses | 1,206,980 | |
| Expense reduction | – | 1,709 |
| Net expenses | – | 1,205,271 |
| Net investment income | 4,970,604 | |
| REALIZED AND UNREALIZED GAINS (LOSSES) | ||
| Realized capital gain distributions received from underlying funds - affiliated | 2,477,293 | |
| Net realized gains on sales of securities - affiliated | + | 1,799,399 |
| Net realized gains | 4,276,692 | |
| Net change in unrealized appreciation (depreciation) on securities - affiliated | + | (57,009,146) |
| Net realized and unrealized losses | (52,732,454) | |
| Decrease in net assets resulting from operations | ($47,761,850) | |
| 1 | Proxy fees are non-routine expenses (see financial note 2(e) for additional information). |
| OPERATIONS | |||
| 11/1/21-10/31/22 | 11/1/20-10/31/21 | ||
| Net investment income | $4,970,604 | $4,473,107 | |
| Net realized gains | 4,276,692 | 10,926,449 | |
| Net change in unrealized appreciation (depreciation) | + | (57,009,146) | 27,412,068 |
| Increase (decrease) in net assets resulting from operations | ($47,761,850) | $42,811,624 | |
| DISTRIBUTIONS TO SHAREHOLDERS | |||
| Total distributions | ($15,825,504) | ($9,242,129) | |
| TRANSACTIONS IN FUND SHARES | |||||
| 11/1/21-10/31/22 | 11/1/20-10/31/21 | ||||
| SHARES | VALUE | SHARES | VALUE | ||
| Shares sold | 2,222,481 | $37,874,315 | 4,868,387 | $87,446,661 | |
| Shares reinvested | 773,587 | 13,558,318 | 450,769 | 7,876,623 | |
| Shares redeemed | + | (5,830,067) | (94,964,552) | (4,084,996) | (72,665,622) |
| Net transactions in fund shares | (2,833,999) | ($43,531,919) | 1,234,160 | $22,657,662 | |
| SHARES OUTSTANDING AND NET ASSETS | |||||
| 11/1/21-10/31/22 | 11/1/20-10/31/21 | ||||
| SHARES | NET ASSETS | SHARES | NET ASSETS | ||
| Beginning of period | 18,138,912 | $335,109,806 | 16,904,752 | $278,882,649 | |
| Total increase (decrease) | + | (2,833,999) | (107,119,273) | 1,234,160 | 56,227,157 |
| End of period | 15,304,913 | $227,990,533 | 18,138,912 | $335,109,806 | |
| SCHWAB CAPITAL TRUST (ORGANIZED MAY 7, 1993) | |
| Schwab MarketTrack All Equity Portfolio | Schwab Target 2045 Fund |
| Schwab MarketTrack Growth Portfolio | Schwab Target 2050 Fund |
| Schwab MarketTrack Balanced Portfolio | Schwab Target 2055 Fund |
| Schwab MarketTrack Conservative Portfolio | Schwab Target 2060 Fund |
| Schwab S&P 500 Index Fund | Schwab Target 2065 Fund |
| Schwab Small-Cap Index Fund® | Schwab Fundamental US Large Company Index Fund |
| Schwab Total Stock Market Index Fund® | Schwab Fundamental US Small Company Index Fund |
| Schwab U.S. Large-Cap Growth Index Fund | Schwab Fundamental International Large Company Index Fund |
| Schwab U.S. Large-Cap Value Index Fund | Schwab Fundamental International Small Company Index Fund |
| Schwab U.S. Mid-Cap Index Fund | Schwab Fundamental Emerging Markets Large Company Index Fund |
| Schwab International Index Fund® | Schwab Fundamental Global Real Estate Index Fund |
| Schwab International Opportunities Fund | Schwab Target 2010 Index Fund |
| Schwab Balanced Fund | Schwab Target 2015 Index Fund |
| Schwab Core Equity Fund | Schwab Target 2020 Index Fund |
| Schwab Dividend Equity Fund | Schwab Target 2025 Index Fund |
| Schwab Large-Cap Growth Fund | Schwab Target 2030 Index Fund |
| Schwab Small-Cap Equity Fund | Schwab Target 2035 Index Fund |
| Schwab Health Care Fund | Schwab Target 2040 Index Fund |
| Schwab International Core Equity Fund | Schwab Target 2045 Index Fund |
| Schwab Target 2010 Fund | Schwab Target 2050 Index Fund |
| Schwab Target 2015 Fund | Schwab Target 2055 Index Fund |
| Schwab Target 2020 Fund | Schwab Target 2060 Index Fund |
| Schwab Target 2025 Fund | Schwab Target 2065 Index Fund |
| Schwab Target 2030 Fund | Schwab Monthly Income Fund - Target Payout |
| Schwab Target 2035 Fund | Schwab Monthly Income Fund - Flexible Payout |
| Schwab Target 2040 Fund | Schwab Monthly Income Fund - Income Payout |
| 4. Affiliates and Affiliated Transactions: |
| SCHWAB
MARKETTRACK ALL EQUITY PORTFOLIO |
SCHWAB
MARKETTRACK GROWTH PORTFOLIO |
SCHWAB
MARKETTRACK BALANCED PORTFOLIO |
SCHWAB
MARKETTRACK CONSERVATIVE PORTFOLIO |
| 0.50% | 0.50% | 0.50% | 0.50% |
| UNDERLYING FUNDS | SCHWAB
MARKETTRACK ALL EQUITY PORTFOLIO |
SCHWAB
MARKETTRACK GROWTH PORTFOLIO |
SCHWAB
MARKETTRACK BALANCED PORTFOLIO |
SCHWAB
MARKETTRACK CONSERVATIVE PORTFOLIO |
| Schwab Fundamental Emerging Markets Large Company Index Fund | 5.7% | 4.3% | 2.0% | 0.6% |
| Schwab Fundamental International Large Company Index Fund | 2.7% | 2.1% | 0.6% | 0.3% |
| Schwab Fundamental International Small Company Index Fund | 6.5% | 4.9% | 3.8% | 0.7% |
| Schwab Fundamental US Large Company Index Fund | 1.5% | 1.5% | 0.7% | 0.2% |
| Schwab Fundamental US Small Company Index Fund | 2.0% | 1.9% | 0.9% | 0.3% |
| Schwab International Index Fund | 1.3% | 1.1% | 0.5% | 0.2% |
| Schwab S&P 500 Index Fund | 0.4% | 0.4% | 0.2% | 0.1% |
| Schwab Short-Term Bond Index Fund | —% | —% | 0.3% | 0.1% |
| Schwab Small-Cap Index Fund | 1.4% | 1.4% | 0.6% | 0.2% |
| Schwab U.S. Aggregate Bond Index Fund | —% | 3.1% | 4.4% | 3.1% |
| Schwab U.S. Large-Cap Growth Index Fund | 3.6% | 2.8% | 1.7% | 0.5% |
| Schwab U.S. REIT ETF | 0.6% | 0.6% | 0.3% | 0.1% |
| Schwab Variable Share Price Money Fund, Ultra Shares | —% | 0.6% | 0.4% | 0.2% |
| PURCHASE COST | SALE PROCEEDS | REALIZED GAINS (LOSSES) | |
| Schwab MarketTrack All Equity Portfolio | $— | $— | $— |
| Schwab MarketTrack Growth Portfolio | — | — | — |
| Schwab MarketTrack Balanced Portfolio | — | — | — |
| Schwab MarketTrack Conservative Portfolio | — | 186,983 | 11,499 |
| 6. Borrowing from Banks: |
| PURCHASES
OF SECURITIES |
SALES
OF SECURITIES | |
| Schwab MarketTrack All Equity Portfolio | $67,449,698 | $56,113,306 |
| Schwab MarketTrack Growth Portfolio | 79,623,617 | 70,448,608 |
| Schwab MarketTrack Balanced Portfolio | 65,997,582 | 79,030,866 |
| Schwab MarketTrack Conservative Portfolio | 30,029,124 | 79,017,343 |
| TAX COST | GROSS
UNREALIZED APPRECIATION |
GROSS
UNREALIZED DEPRECIATION |
NET
UNREALIZED APPRECIATION (DEPRECIATION) | |
| Schwab MarketTrack All Equity Portfolio | $456,086,011 | $255,851,821 | ($16,171,928) | $239,679,893 |
| Schwab MarketTrack Growth Portfolio | 537,383,167 | 286,978,148 | (26,946,732) | 260,031,416 |
| Schwab MarketTrack Balanced Portfolio | 409,273,295 | 144,494,892 | (36,900,548) | 107,594,344 |
| Schwab MarketTrack Conservative Portfolio | 206,049,797 | 44,369,704 | (23,524,837) | 20,844,867 |
| UNDISTRIBUTED
ORDINARY INCOME |
UNDISTRIBUTED
LONG-TERM CAPITAL GAINS |
NET
UNREALIZED APPRECIATION (DEPRECIATION) ON INVESTMENTS |
TOTAL | |
| Schwab MarketTrack All Equity Portfolio | $898,023 | $22,574,323 | $239,679,893 | $263,152,239 |
| Schwab MarketTrack Growth Portfolio | 917,601 | 21,871,324 | 260,031,416 | 282,820,341 |
| Schwab MarketTrack Balanced Portfolio | 2,533,286 | 11,727,583 | 107,594,344 | 121,855,213 |
| Schwab MarketTrack Conservative Portfolio | 251,980 | 4,719,134 | 20,844,867 | 25,815,981 |
| CURRENT FISCAL YEAR END DISTRIBUTIONS | PRIOR FISCAL YEAR END DISTRIBUTIONS | |||
| ORDINARY
INCOME |
LONG-TERM
CAPITAL GAINS |
ORDINARY
INCOME |
LONG-TERM
CAPITAL GAINS | |
| Schwab MarketTrack All Equity Portfolio | $19,017,789 | $13,762,591 | $7,460,784 | $39,354,505 |
| Schwab MarketTrack Growth Portfolio | 16,666,445 | 31,287,063 | 12,895,152 | 51,712,898 |
| Schwab MarketTrack Balanced Portfolio | 11,374,707 | 20,448,843 | 9,583,547 | 25,198,263 |
| Schwab MarketTrack Conservative Portfolio | 5,450,344 | 10,375,160 | 5,222,343 | 4,019,786 |
Denver, Colorado
December 16, 2022
| FOREIGN TAX CREDIT | FOREIGN SOURCE INCOME | |
| Schwab MarketTrack All Equity Portfolio | $753,447 | $7,978,881 |
| Schwab MarketTrack Growth Portfolio | 575,051 | 6,101,724 |
| Schwab MarketTrack Balanced Portfolio | 289,455 | 3,079,227 |
| Schwab MarketTrack Conservative Portfolio | 97,972 | 1,041,215 |
| Schwab MarketTrack All Equity Portfolio | 44.10% |
| Schwab MarketTrack Growth Portfolio | 40.48% |
| Schwab MarketTrack Balanced Portfolio | 31.72% |
| Schwab MarketTrack Conservative Portfolio | 21.65% |
| Schwab MarketTrack All Equity Portfolio | $19,616,954 |
| Schwab MarketTrack Growth Portfolio | 16,779,760 |
| Schwab MarketTrack Balanced Portfolio | 8,249,706 |
| Schwab MarketTrack Conservative Portfolio | 2,882,608 |
| Schwab MarketTrack All Equity Portfolio | $13,762,591 |
| Schwab MarketTrack Growth Portfolio | 31,287,063 |
| Schwab MarketTrack Balanced Portfolio | 20,448,843 |
| Schwab MarketTrack Conservative Portfolio | 10,375,160 |
| Schwab MarketTrack All Equity Portfolio | $721,178 |
| Schwab MarketTrack Growth Portfolio | 512,118 |
| Schwab MarketTrack Balanced Portfolio | 276,221 |
| Schwab MarketTrack Conservative Portfolio | 85,132 |
| Schwab MarketTrack All Equity Portfolio | —% |
| Schwab MarketTrack Growth Portfolio | 0.53% |
| Schwab MarketTrack Balanced Portfolio | 0.91% |
| Schwab MarketTrack Conservative Portfolio | 1.74% |
| Proposal
– To elect each of the following individuals as trustees of the Trust: |
For | Withheld |
| Walter W. Bettinger II | 1,095,577,106.505 | 115,838,980.968 |
| Richard A. Wurster | 1,117,598,789.555 | 93,817,297.918 |
| Michael J. Beer | 1,116,890,447.505 | 94,525,639.968 |
| Robert W. Burns | 1,117,915,860.110 | 93,500,227.363 |
| Nancy F. Heller | 1,119,878,732.134 | 91,537,355.339 |
| David L. Mahoney | 1,069,125,022.434 | 142,291,065.039 |
| Jane P. Moncreiff | 1,120,187,927.838 | 91,228,159.635 |
| Kiran M. Patel | 1,116,689,111.571 | 94,726,975.902 |
| Kimberly S. Patmore | 1,119,941,056.059 | 91,475,031.414 |
| J. Derek Penn | 1,117,666,014.121 | 93,750,073.352 |
| Independent Trustees | |||
| Name,
Year of Birth, and Position(s) with the trust (Terms of office, and length of Time Served1) |
Principal
Occupations During the Past Five Years |
Number
of Portfolios in Fund Complex Overseen by the Trustee |
Other Directorships |
|
Michael J. Beer 1961 Trustee (Trustee of The Charles Schwab Family of Funds, Schwab Investments, Schwab Capital Trust, Schwab Annuity Portfolios, Schwab Strategic Trust and Laudus Trust since 2022) |
Retired. Director, President and Chief Executive Officer (Dec. 2016 – Sept. 2019), Principal Funds (investment management). | 105 | Director (2016 – 2019), Principal Funds, Inc. |
| Robert
W. Burns 1959 Trustee (Trustee of Schwab Strategic Trust since 2009; The Charles Schwab Family of Funds, Schwab Investments, Schwab Capital Trust, Schwab Annuity Portfolios and Laudus Trust since 2016) |
Retired/Private Investor. | 105 | None |
| Nancy
F. Heller 1956 Trustee (Trustee of The Charles Schwab Family of Funds, Schwab Investments, Schwab Capital Trust, Schwab Annuity Portfolios, Schwab Strategic Trust and Laudus Trust since 2018) |
Retired. | 105 | None |
| David
L. Mahoney 1954 Trustee (Trustee of The Charles Schwab Family of Funds, Schwab Investments, Schwab Capital Trust, Schwab Annuity Portfolios and Laudus Trust since 2011; Schwab Strategic Trust since 2016) |
Private Investor. | 105 | Director
(2004 – present), Corcept Therapeutics Incorporated Director (2009 – 2021), Adamas Pharmaceuticals, Inc. Director (2003 – 2019), Symantec Corporation |
| Jane
P. Moncreiff 1961 Trustee (Trustee of The Charles Schwab Family of Funds, Schwab Investments, Schwab Capital Trust, Schwab Annuity Portfolios, Schwab Strategic Trust and Laudus Trust since 2019) |
Consultant (2018 – present), Fulham Advisers LLC (management consulting); Chief Investment Officer (2009 – 2017), CareGroup Healthcare System, Inc. (healthcare). | 105 | None |
| Independent Trustees (continued) | |||
| Name,
Year of Birth, and Position(s) with the trust (Terms of office, and length of Time Served1) |
Principal
Occupations During the Past Five Years |
Number
of Portfolios in Fund Complex Overseen by the Trustee |
Other Directorships |
| Kiran
M. Patel 1948 Trustee (Trustee of The Charles Schwab Family of Funds, Schwab Investments, Schwab Capital Trust, Schwab Annuity Portfolios and Laudus Trust since 2011; Schwab Strategic Trust since 2016) |
Retired. | 105 | Director (2008 – present), KLA-Tencor Corporation |
| Kimberly
S. Patmore 1956 Trustee (Trustee of The Charles Schwab Family of Funds, Schwab Investments, Schwab Capital Trust, Schwab Annuity Portfolios, Schwab Strategic Trust and Laudus Trust since 2016) |
Consultant (2008 – present), Patmore Management Consulting (management consulting). | 105 | None |
|
J. Derek Penn 1957 Trustee (Trustee of The Charles Schwab Family of Funds, Schwab Investments, Schwab Capital Trust, Schwab Annuity Portfolios, Schwab Strategic Trust and Laudus Trust since 2021) |
Head of Equity Sales and Trading (2006 – 2018), BNY Mellon (financial services). | 105 | None |
| Interested Trustees | |||
| Name,
Year of Birth, and Position(s) with the trust (Terms of office, and length of Time Served1) |
Principal
Occupations During the Past Five Years |
Number
of Portfolios in Fund Complex Overseen by the Trustee |
Other Directorships |
| Walter
W. Bettinger II2 1960 Chairman and Trustee (Trustee of The Charles Schwab Family of Funds, Schwab Investments, Schwab Capital Trust and Schwab Annuity Portfolios since 2008; Schwab Strategic Trust since 2009; Laudus Trust since 2010) |
Co-Chairman of the Board (July 2022 – present), Director and Chief Executive Officer (Oct. 2008 – present) and President (Feb. 2007 – Oct. 2021), The Charles Schwab Corporation; President and Chief Executive Officer (Oct. 2008 – Oct. 2021) and Director (May 2008 – Oct. 2021), Charles Schwab & Co., Inc.; Director (Apr. 2006 – present), Charles Schwab Bank, SSB; Director (Nov. 2017 – present), Charles Schwab Premier Bank, SSB; Director (July 2019 – present), Charles Schwab Trust Bank; Director (May 2008 – present), Chief Executive Officer (Aug. 2017 – present) and President (Aug. 2017 – Nov. 2021), Schwab Holdings, Inc.; Director (Oct. 2020 – present), TD Ameritrade Holding Corporation; Director (July 2016 – Oct. 2021), Charles Schwab Investment Management, Inc. | 105 | Director (2008 – present), The Charles Schwab Corporation |
| Interested Trustees (continued) | |||
| Name,
Year of Birth, and Position(s) with the trust (Terms of office, and length of Time Served1) |
Principal
Occupations During the Past Five Years |
Number
of Portfolios in Fund Complex Overseen by the Trustee |
Other Directorships |
| Richard
A. Wurster2 1973 Trustee (Trustee of The Charles Schwab Family of Funds, Schwab Investments, Schwab Capital Trust, Schwab Annuity Portfolios, Schwab Strategic Trust and Laudus Trust since 2022) |
President (Oct. 2021 – present) and Executive Vice President – Schwab Asset Management Solutions (Apr. 2019 – Oct. 2021), The Charles Schwab Corporation; President, Director (Oct. 2021 – present), Executive Vice President – Schwab Asset Management Solutions (July 2019 – Oct. 2021) and Senior Vice President – Advisory (May 2016 – July 2019), Charles Schwab & Co., Inc.; President (Nov. 2021 – present), Schwab Holdings, Inc.; Director (Oct. 2021 – present) and Chief Executive Officer (Nov. 2019 – Jan. 2022), Charles Schwab Investment Management, Inc.; Director, Chief Executive Officer and President (Mar. 2018 – Oct. 2022), Charles Schwab Investment Advisory, Inc.; Chief Executive Officer (July 2016 – Apr. 2018) and President (Mar. 2017 – Apr. 2018), ThomasPartners, Inc.; Chief Executive Officer (July 2016 – Apr. 2018), Windhaven Investment Management, Inc. | 105 | None |
| Officers of the Trust | |
| Name,
Year of Birth, and Position(s) with the trust (Terms of office, and length of Time Served3) |
Principal Occupations During the Past Five Years |
| Jonathan
de St. Paer 1973 President and Chief Executive Officer (Officer of The Charles Schwab Family of Funds, Schwab Investments, Schwab Capital Trust, Schwab Annuity Portfolios, Schwab Strategic Trust and Laudus Trust since 2018) |
Director (Apr. 2019 – present), President (Oct. 2018 – present), Chief Operating Officer (Jan. 2021 – present), and Chief Executive Officer (Apr. 2019 – Nov. 2019), Charles Schwab Investment Management, Inc.; Senior Vice President (June 2020 – Mar. 2022) and Chief Operating Officer (Jan. 2021 – Mar. 2022), Charles Schwab Investment Advisory, Inc.; Chief Executive Officer (Apr. 2019 – present), President (Nov. 2018 – present) and Trustee (Apr. 2019 – Dec. 2020), Schwab Funds, Laudus Trust and Schwab ETFs; Managing Director (May 2022 – present), Senior Vice President (Apr. 2019 – May 2022) and Senior Vice President – Strategy and Product Development (CSIM) (Jan. 2014 – Mar. 2019), Charles Schwab & Co., Inc. |
| Mark
Fischer 1970 Treasurer, Chief Financial Officer and Chief Operating Officer (Officer of The Charles Schwab Family of Funds, Schwab Investments, Schwab Capital Trust, Schwab Annuity Portfolios, Schwab Strategic Trust and Laudus Trust since 2013) |
Treasurer and Chief Financial Officer (Jan. 2016 – present) and Chief Operating Officer (Dec. 2020 – present), Schwab Funds, Laudus Trust and Schwab ETFs; Chief Financial Officer (Mar. 2020 – present) and Vice President (Oct. 2013 – present), Charles Schwab Investment Management, Inc. |
| Omar
Aguilar 1970 Vice President and Chief Investment Officer (Officer of The Charles Schwab Family of Funds, Schwab Investments, Schwab Capital Trust, Schwab Annuity Portfolios, Schwab Strategic Trust and Laudus Trust since 2011) |
Chief Executive Officer (Jan. 2022 – present), Chief Investment Officer (Apr. 2011 – present) and Senior Vice President (Apr. 2011 – Dec. 2021), Charles Schwab Investment Management, Inc.; Director, Chief Executive Officer and President (Oct. 2022 – present), Charles Schwab Investment Advisory, Inc.; Vice President and Chief Investment Officer (June 2011 – present), Schwab Funds, Laudus Trust and Schwab ETFs. |
| Brett
Wander 1961 Vice President and Chief Investment Officer (Officer of The Charles Schwab Family of Funds, Schwab Investments, Schwab Capital Trust, Schwab Annuity Portfolios, Schwab Strategic Trust and Laudus Trust since 2011) |
Senior Vice President and Chief Investment Officer (Apr. 2011 – present), Charles Schwab Investment Management, Inc.; Vice President and Chief Investment Officer (June 2011 – present), Schwab Funds, Laudus Trust and Schwab ETFs. |
| William
P. McMahon, Jr. 1972 Vice President and Chief Investment Officer (Officer of The Charles Schwab Family of Funds, Schwab Investments, Schwab Capital Trust, Schwab Annuity Portfolios, Schwab Strategic Trust and Laudus Trust since 2021) |
Senior Vice President and Chief Investment Officer (Jan. 2020 – present), Charles Schwab Investment Management, Inc.; Vice President and Chief Investment Officer (June 2021 – present), Schwab Funds, Laudus Trust and Schwab ETFs; Senior Vice President and Chief Investment Officer – ThomasPartners Strategies (Apr. 2018 – Dec. 2019), Charles Schwab Investment Advisory, Inc.; Senior Vice President and Chief Investment Officer (May 2001 – Apr. 2018), ThomasPartners, Inc. |
| Officers of the Trust (continued) | |
| Name,
Year of Birth, and Position(s) with the trust (Terms of office, and length of Time Served3) |
Principal Occupations During the Past Five Years |
| Catherine
MacGregor 1964 Chief Legal Officer and Secretary, Schwab Funds and Schwab ETFs Chief Legal Officer, Vice President and Clerk, Laudus Trust (Officer of The Charles Schwab Family of Funds, Schwab Investments, Schwab Capital Trust, Schwab Annuity Portfolios and Laudus Trust since 2005; Schwab Strategic Trust since 2009) |
Chief Legal Officer (Mar. 2022 – present) and Vice President (Sept. 2005 – present), Charles Schwab Investment Management, Inc.; Managing Director (May 2022 – present) and Vice President (July 2005 – May 2022), Charles Schwab & Co., Inc.; Vice President (Dec. 2005 – present) and Chief Legal Officer and Clerk (Mar. 2007 – present), Laudus Trust; Chief Legal Officer and Secretary (Oct. 2021 – present), Vice President (Nov. 2005 – Oct. 2021) and Assistant Secretary (June 2007 – Oct. 2021), Schwab Funds; Chief Legal Officer and Secretary (Oct. 2021 – present), Vice President and Assistant Secretary (Oct. 2009 – Oct. 2021), Schwab ETFs. |
| 1 | Each Trustee shall hold office until the election and qualification of his or her successor, or until he or she dies, resigns or is removed. The retirement policy requires that each independent trustee retire by December 31 of the year in which the Trustee turns 74 or the Trustee’s twentieth year of service as an independent trustee on any trust in the Fund Complex, whichever occurs first. |
| 2 | Mr. Bettinger and Mr. Wurster are Interested Trustees. Mr. Bettinger and Mr. Wurster are Interested Trustees because each owns stock of The Charles Schwab Corporation (CSC), the parent company of Charles Schwab Investment Management, Inc., the investment adviser for the trusts in the Fund Complex, and is an employee of Charles Schwab & Co., Inc. (Schwab), the principal underwriter for The Charles Schwab Family of Funds, Schwab Investments, Schwab Capital Trust, Schwab Annuity Portfolios and Laudus Trust. |
| 3 | The President, Treasurer and Secretary/Clerk hold office until their respective successors are chosen and qualified or until he or she sooner dies, resigns, is removed or becomes disqualified. Each of the other officers serves at the pleasure of the Board. |
Schwab Funds
| ¹ | State, local, and the Federal Alternative Minimum Tax may apply. Capital gains are not exempt from Federal Taxation. |
| ² | You could lose money by investing in the Schwab Money Funds. All Schwab Money Funds with the exception of Schwab Variable Share Price Money Fund seek to preserve the value of your investment at $1.00 per share, but cannot guarantee they will do so. Because the share price of Schwab Variable Share Price Money Fund will fluctuate, when you sell your shares they may be worth more or less than what you originally paid for them. All Schwab Money Funds with the exception of Schwab Government Money Fund, Schwab Retirement Government Money Fund, Schwab U.S. Treasury Money Fund, Schwab Treasury Obligations Money Fund and Schwab Government Money Market Portfolio may impose a fee upon the sale of your shares or may temporarily suspend your ability to sell shares if the Fund’s liquidity falls below required minimums because of market conditions or other factors. An investment in the Schwab Money Funds is not insured or guaranteed by the Federal Deposit Insurance Corporation or any other government agency. The Schwab Money Funds’ sponsor has no legal obligation to provide financial support to the Funds, and you should not expect that the sponsor will provide financial support to the Funds at any time. |

| Total Return for the 12 Months Ended October 31, 2022 | |
| Schwab Target 2010 Fund (Ticker Symbol: SWBRX) | -15.69% |
| Target 2010 Composite Index | -14.26% |
| Fund Category: Morningstar Target-Date 2000-20101 | -14.76% |
| Performance Details | pages 8-10 |
| Schwab Target 2015 Fund (Ticker Symbol: SWGRX) | -16.15% |
| Target 2015 Composite Index | -14.50% |
| Fund Category: Morningstar Target-Date 20151 | -15.43% |
| Performance Details | pages 11-13 |
| Schwab Target 2020 Fund (Ticker Symbol: SWCRX) | -16.35% |
| Target 2020 Composite Index | -14.67% |
| Fund Category: Morningstar Target-Date 20201 | -16.13% |
| Performance Details | pages 14-16 |
| Schwab Target 2025 Fund (Ticker Symbol: SWHRX) | -17.39% |
| Target 2025 Composite Index | -15.34% |
| Fund Category: Morningstar Target-Date 20251 | -16.85% |
| Performance Details | pages 17-19 |
| Schwab Target 2030 Fund (Ticker Symbol: SWDRX) | -18.51% |
| Target 2030 Composite Index | -16.15% |
| Fund Category: Morningstar Target-Date 20301 | -17.69% |
| Performance Details | pages 20-22 |
| Schwab Target 2035 Fund (Ticker Symbol: SWIRX) | -19.41% |
| Target 2035 Composite Index | -16.84% |
| Fund Category: Morningstar Target-Date 20351 | -18.49% |
| Performance Details | pages 23-25 |
| 1 | Source for category information: Morningstar, Inc. The Morningstar Category return represents all active and index mutual funds and ETFs within the category as of the report date. |
| Total Return for the 12 Months Ended October 31, 2022 | |
| Schwab Target 2040 Fund (Ticker Symbol: SWERX) | -20.10% |
| Target 2040 Composite Index | -17.44% |
| Fund Category: Morningstar Target-Date 20401 | -18.96% |
| Performance Details | pages 26-28 |
| Schwab Target 2045 Fund (Ticker Symbol: SWMRX) | -20.76% |
| Target 2045 Composite Index | -17.98% |
| Fund Category: Morningstar Target-Date 20451 | -19.30% |
| Performance Details | pages 29-31 |
| Schwab Target 2050 Fund (Ticker Symbol: SWNRX) | -21.22% |
| Target 2050 Composite Index | -18.32% |
| Fund Category: Morningstar Target-Date 20501 | -19.52% |
| Performance Details | pages 32-34 |
| Schwab Target 2055 Fund (Ticker Symbol: SWORX) | -21.54% |
| Target 2055 Composite Index | -18.53% |
| Fund Category: Morningstar Target-Date 20551 | -19.63% |
| Performance Details | pages 35-37 |
| Schwab Target 2060 Fund (Ticker Symbol: SWPRX) | -21.88% |
| Target 2060 Composite Index | -18.71% |
| Fund Category: Morningstar Target-Date 20601 | -19.63% |
| Performance Details | pages 38-40 |
| Schwab Target 2065 Fund (Ticker Symbol: SWQRX) | -21.78% |
| Target 2065 Composite Index | -18.76% |
| Fund Category: Morningstar Target-Date 2065+1 | -19.88% |
| Performance Details | pages 41-43 |
| 1 | Source for category information: Morningstar, Inc. The Morningstar Category return represents all active and index mutual funds and ETFs within the category as of the report date. |


| * | The net version of the index reflects reinvested dividends net of withholding taxes but reflects no deductions for expenses or other taxes. |

| * | The net version of the index reflects reinvested dividends net of withholding taxes but reflects no deductions for expenses or other taxes. |
 |
Zifan Tang, Ph.D., CFA, Senior Portfolio Manager, is responsible for the co-management of the funds. Prior to joining Schwab in 2012, Ms. Tang was a product manager at Thomson Reuters and from 1997 to 2009 worked as a portfolio manager at Barclays Global Investors (now known as BlackRock). |
 |
Patrick Kwok, CFA, Portfolio Manager, is responsible for the co-management of the funds. Previously, Mr. Kwok served as an associate portfolio manager from 2012 to 2016. Prior to that, he worked as a fund administration manager, where he was responsible for oversight of sub-advisers, trading, cash management, and fund administration supporting the Charles Schwab Trust Bank Collective Investment Trusts and multi-asset Schwab Funds. Prior to joining Schwab Asset Management in 2008, Mr. Kwok spent two years as an asset operations specialist at Charles Schwab Trust Company. He also worked for one year at State Street Bank & Trust as a portfolio accountant and pricing specialist. |
| 1 | The total return cited for the index reflects reinvested dividends net of withholding taxes but reflects no deductions for expenses or other taxes. |
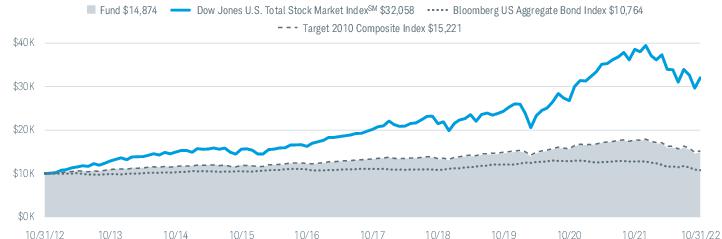
| Fund and Inception Date | 1 Year | 5 Years | 10 Years |
| Fund: Schwab Target 2010 Fund (7/1/05) | -15.69% | 2.25% | 4.05% |
| Dow Jones U.S. Total Stock Market IndexSM | -16.94% | 9.72% | 12.36% |
| Bloomberg US Aggregate Bond Index | -15.68% | -0.54% | 0.74% |
| Target 2010 Composite Index | -14.26% | 2.64% | 4.29% |
| Fund Category: Morningstar Target-Date 2000-20102 | -14.76% | 2.33% | 4.15% |
| Fund Expense Ratios3: Net 0.31%; Gross 0.43% | |||
| 1 | Fund expenses may have been partially absorbed by the investment adviser and its affiliates. Without these reductions, the fund’s returns would have been lower. These returns do not reflect the deduction of taxes that a shareholder would pay on fund distributions or the redemption of fund shares. |
| 2 | Source for category information: Morningstar, Inc. The Morningstar Category return represents all active and index mutual funds and ETFs within the category as of the report date. |
| 3 | As stated in the prospectus. Includes 0.31% of acquired fund fees and expenses (AFFE), which are indirect expenses incurred by the fund through its investments in the underlying funds. Net Expense: Expenses reduced by a contractual fee waiver in effect for so long as Schwab Asset Management serves as the investment adviser to the fund. Gross Expense: Does not reflect the effect of contractual fee waivers. For actual expense ratios during the period, not including AFFE, refer to the financial highlights section of the financial statements. |

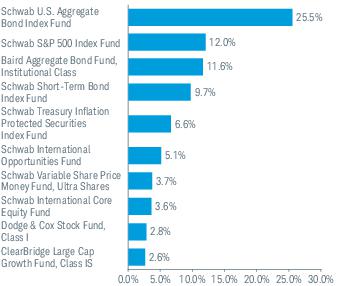
| 1 | The fund intends to invest in a combination of the underlying funds; however, the fund may also invest directly in equity and fixed-income securities, exchange-traded funds, and cash equivalents, including money market securities. |
| 2 | The percentage may differ from the Portfolio Holdings because the above calculation is based on a percentage of total investments, whereas the calculation in the Portfolio Holdings is based on a percentage of net assets. |
| 3 | This list is not a recommendation of any security by the investment adviser. |
| 4 | The holdings listed exclude any temporary liquidity investments. |
| 1 | The total return cited for the index reflects reinvested dividends net of withholding taxes but reflects no deductions for expenses or other taxes. |

| Fund and Inception Date | 1 Year | 5 Years | 10 Years |
| Fund: Schwab Target 2015 Fund (3/12/08) | -16.15% | 2.34% | 4.40% |
| Dow Jones U.S. Total Stock Market IndexSM | -16.94% | 9.72% | 12.36% |
| Bloomberg US Aggregate Bond Index | -15.68% | -0.54% | 0.74% |
| Target 2015 Composite Index | -14.50% | 2.79% | 4.67% |
| Fund Category: Morningstar Target-Date 20152 | -15.43% | 2.62% | 4.85% |
| Fund Expense Ratios3: Net 0.33%; Gross 0.41% | |||
| 1 | Fund expenses may have been partially absorbed by the investment adviser and its affiliates. Without these reductions, the fund’s returns would have been lower. These returns do not reflect the deduction of taxes that a shareholder would pay on fund distributions or the redemption of fund shares. |
| 2 | Source for category information: Morningstar, Inc. The Morningstar Category return represents all active and index mutual funds and ETFs within the category as of the report date. |
| 3 | As stated in the prospectus. Includes 0.33% of acquired fund fees and expenses (AFFE), which are indirect expenses incurred by the fund through its investments in the underlying funds. Net Expense: Expenses reduced by a contractual fee waiver in effect for so long as Schwab Asset Management serves as the investment adviser to the fund. Gross Expense: Does not reflect the effect of contractual fee waivers. For actual expense ratios during the period, not including AFFE, refer to the financial highlights section of the financial statements. |

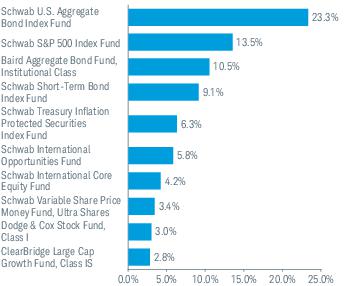
| 1 | The fund intends to invest in a combination of the underlying funds; however, the fund may also invest directly in equity and fixed-income securities, exchange-traded funds, and cash equivalents, including money market securities. |
| 2 | The percentage may differ from the Portfolio Holdings because the above calculation is based on a percentage of total investments, whereas the calculation in the Portfolio Holdings is based on a percentage of net assets. |
| 3 | This list is not a recommendation of any security by the investment adviser. |
| 4 | The holdings listed exclude any temporary liquidity investments. |
| 1 | The total return cited for the index reflects reinvested dividends net of withholding taxes but reflects no deductions for expenses or other taxes. |
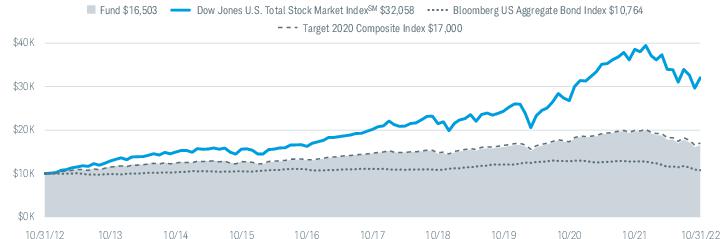
| Fund and Inception Date | 1 Year | 5 Years | 10 Years |
| Fund: Schwab Target 2020 Fund (7/1/05) | -16.35% | 2.48% | 5.14% |
| Dow Jones U.S. Total Stock Market IndexSM | -16.94% | 9.72% | 12.36% |
| Bloomberg US Aggregate Bond Index | -15.68% | -0.54% | 0.74% |
| Target 2020 Composite Index | -14.67% | 3.00% | 5.45% |
| Fund Category: Morningstar Target-Date 20202 | -16.13% | 2.79% | 5.30% |
| Fund Expense Ratios3: Net 0.34%; Gross 0.36% | |||
| 1 | Fund expenses may have been partially absorbed by the investment adviser and its affiliates. Without these reductions, the fund’s returns would have been lower. These returns do not reflect the deduction of taxes that a shareholder would pay on fund distributions or the redemption of fund shares. |
| 2 | Source for category information: Morningstar, Inc. The Morningstar Category return represents all active and index mutual funds and ETFs within the category as of the report date. |
| 3 | As stated in the prospectus. Includes 0.34% of acquired fund fees and expenses (AFFE), which are indirect expenses incurred by the fund through its investments in the underlying funds. Net Expense: Expenses reduced by a contractual fee waiver in effect for so long as Schwab Asset Management serves as the investment adviser to the fund. Gross Expense: Does not reflect the effect of contractual fee waivers. For actual expense ratios during the period, not including AFFE, refer to the financial highlights section of the financial statements. |
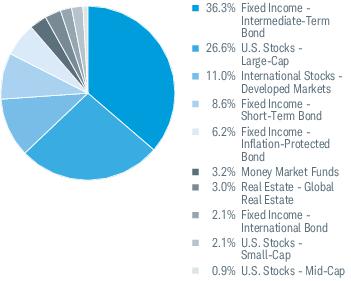
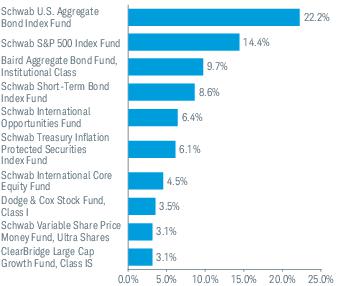
| 1 | The fund intends to invest in a combination of the underlying funds; however, the fund may also invest directly in equity and fixed-income securities, exchange-traded funds, and cash equivalents, including money market securities. |
| 2 | The percentage may differ from the Portfolio Holdings because the above calculation is based on a percentage of total investments, whereas the calculation in the Portfolio Holdings is based on a percentage of net assets. |
| 3 | This list is not a recommendation of any security by the investment adviser. |
| 4 | The holdings listed exclude any temporary liquidity investments. |
| 1 | The total return cited for the index reflects reinvested dividends net of withholding taxes but reflects no deductions for expenses or other taxes. |
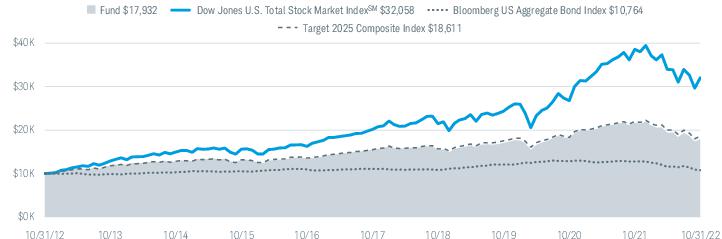
| Fund and Inception Date | 1 Year | 5 Years | 10 Years |
| Fund: Schwab Target 2025 Fund (3/12/08) | -17.39% | 3.01% | 6.01% |
| Dow Jones U.S. Total Stock Market IndexSM | -16.94% | 9.72% | 12.36% |
| Bloomberg US Aggregate Bond Index | -15.68% | -0.54% | 0.74% |
| Target 2025 Composite Index | -15.34% | 3.73% | 6.41% |
| Fund Category: Morningstar Target-Date 20252 | -16.85% | 3.08% | 5.69% |
| Fund Expense Ratios3: Net 0.43%; Gross 0.45% | |||
| 1 | Fund expenses may have been partially absorbed by the investment adviser and its affiliates. Without these reductions, the fund’s returns would have been lower. These returns do not reflect the deduction of taxes that a shareholder would pay on fund distributions or the redemption of fund shares. |
| 2 | Source for category information: Morningstar, Inc. The Morningstar Category return represents all active and index mutual funds and ETFs within the category as of the report date. |
| 3 | As stated in the prospectus. Includes 0.43% of acquired fund fees and expenses (AFFE), which are indirect expenses incurred by the fund through its investments in the underlying funds. Net Expense: Expenses reduced by a contractual fee waiver in effect for so long as Schwab Asset Management serves as the investment adviser to the fund. Gross Expense: Does not reflect the effect of contractual fee waivers. For actual expense ratios during the period, not including AFFE, refer to the financial highlights section of the financial statements. |

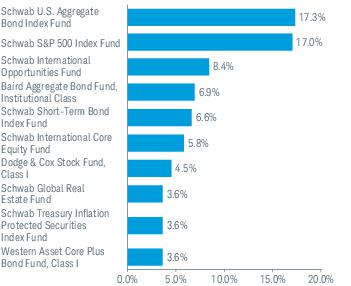
| 1 | The fund intends to invest in a combination of the underlying funds; however, the fund may also invest directly in equity and fixed-income securities, exchange-traded funds, and cash equivalents, including money market securities. |
| 2 | The percentage may differ from the Portfolio Holdings because the above calculation is based on a percentage of total investments, whereas the calculation in the Portfolio Holdings is based on a percentage of net assets. |
| 3 | This list is not a recommendation of any security by the investment adviser. |
| 4 | The holdings listed exclude any temporary liquidity investments. |
| 1 | The total return cited for the index reflects reinvested dividends net of withholding taxes but reflects no deductions for expenses or other taxes. |
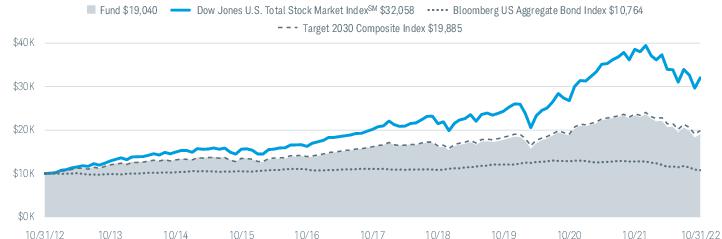
| Fund and Inception Date | 1 Year | 5 Years | 10 Years |
| Fund: Schwab Target 2030 Fund (7/1/05) | -18.51% | 3.38% | 6.65% |
| Dow Jones U.S. Total Stock Market IndexSM | -16.94% | 9.72% | 12.36% |
| Bloomberg US Aggregate Bond Index | -15.68% | -0.54% | 0.74% |
| Target 2030 Composite Index | -16.15% | 4.23% | 7.12% |
| Fund Category: Morningstar Target-Date 20302 | -17.69% | 3.67% | 6.38% |
| Fund Expense Ratios3: Net 0.50%; Gross 0.51% | |||
| 1 | Fund expenses may have been partially absorbed by the investment adviser and its affiliates. Without these reductions, the fund’s returns would have been lower. These returns do not reflect the deduction of taxes that a shareholder would pay on fund distributions or the redemption of fund shares. |
| 2 | Source for category information: Morningstar, Inc. The Morningstar Category return represents all active and index mutual funds and ETFs within the category as of the report date. |
| 3 | As stated in the prospectus. Includes 0.50% of acquired fund fees and expenses (AFFE), which are indirect expenses incurred by the fund through its investments in the underlying funds. Net Expense: Expenses reduced by a contractual fee waiver in effect for so long as Schwab Asset Management serves as the investment adviser to the fund. Gross Expense: Does not reflect the effect of contractual fee waivers. For actual expense ratios during the period, not including AFFE, refer to the financial highlights section of the financial statements. |
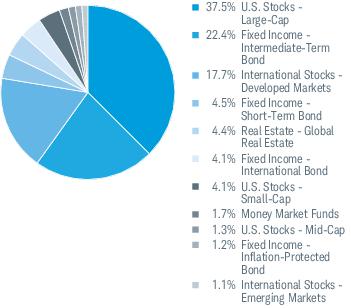
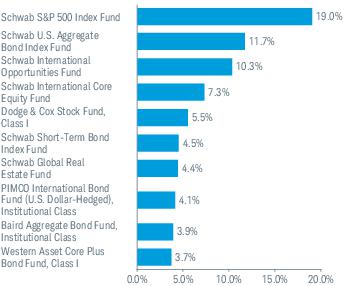
| 1 | The fund intends to invest in a combination of the underlying funds; however, the fund may also invest directly in equity and fixed-income securities, exchange-traded funds, and cash equivalents, including money market securities. |
| 2 | The percentage may differ from the Portfolio Holdings because the above calculation is based on a percentage of total investments, whereas the calculation in the Portfolio Holdings is based on a percentage of net assets. |
| 3 | This list is not a recommendation of any security by the investment adviser. |
| 4 | The holdings listed exclude any temporary liquidity investments. |
| 1 | The total return cited for the index reflects reinvested dividends net of withholding taxes but reflects no deductions for expenses or other taxes. |
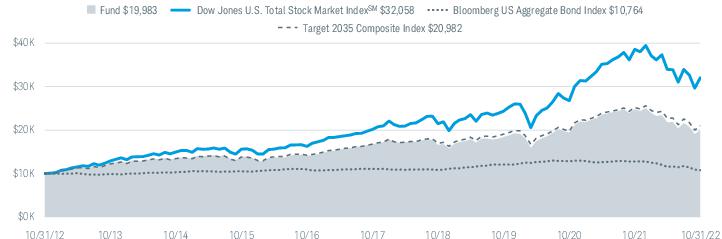
| Fund and Inception Date | 1 Year | 5 Years | 10 Years |
| Fund: Schwab Target 2035 Fund (3/12/08) | -19.41% | 3.61% | 7.17% |
| Dow Jones U.S. Total Stock Market IndexSM | -16.94% | 9.72% | 12.36% |
| Bloomberg US Aggregate Bond Index | -15.68% | -0.54% | 0.74% |
| Target 2035 Composite Index | -16.84% | 4.59% | 7.69% |
| Fund Category: Morningstar Target-Date 20352 | -18.49% | 4.18% | 7.03% |
| Fund Expense Ratios3: Net 0.56%; Gross 0.58% | |||
| 1 | Fund expenses may have been partially absorbed by the investment adviser and its affiliates. Without these reductions, the fund’s returns would have been lower. These returns do not reflect the deduction of taxes that a shareholder would pay on fund distributions or the redemption of fund shares. |
| 2 | Source for category information: Morningstar, Inc. The Morningstar Category return represents all active and index mutual funds and ETFs within the category as of the report date. |
| 3 | As stated in the prospectus. Includes 0.56% of acquired fund fees and expenses (AFFE), which are indirect expenses incurred by the fund through its investments in the underlying funds. Net Expense: Expenses reduced by a contractual fee waiver in effect for so long as Schwab Asset Management serves as the investment adviser to the fund. Gross Expense: Does not reflect the effect of contractual fee waivers. For actual expense ratios during the period, not including AFFE, refer to the financial highlights section of the financial statements. |
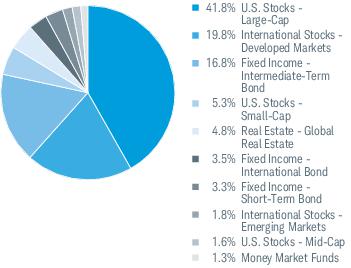
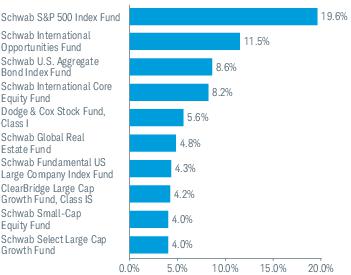
| 1 | The fund intends to invest in a combination of the underlying funds; however, the fund may also invest directly in equity and fixed-income securities, exchange-traded funds, and cash equivalents, including money market securities. |
| 2 | The percentage may differ from the Portfolio Holdings because the above calculation is based on a percentage of total investments, whereas the calculation in the Portfolio Holdings is based on a percentage of net assets. |
| 3 | This list is not a recommendation of any security by the investment adviser. |
| 4 | The holdings listed exclude any temporary liquidity investments. |
| 1 | The total return cited for the index reflects reinvested dividends net of withholding taxes but reflects no deductions for expenses or other taxes. |
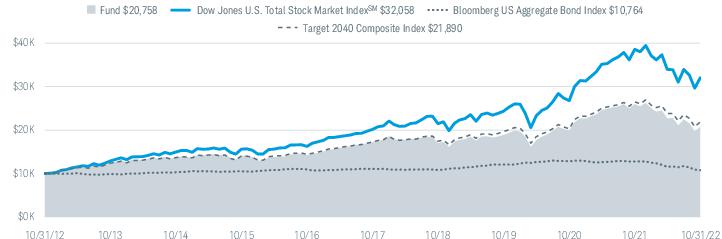
| Fund and Inception Date | 1 Year | 5 Years | 10 Years |
| Fund: Schwab Target 2040 Fund (7/1/05) | -20.10% | 3.79% | 7.58% |
| Dow Jones U.S. Total Stock Market IndexSM | -16.94% | 9.72% | 12.36% |
| Bloomberg US Aggregate Bond Index | -15.68% | -0.54% | 0.74% |
| Target 2040 Composite Index | -17.44% | 4.87% | 8.15% |
| Fund Category: Morningstar Target-Date 20402 | -18.96% | 4.57% | 7.48% |
| Fund Expense Ratios3: Net 0.60%; Gross 0.61% | |||
| 1 | Fund expenses may have been partially absorbed by the investment adviser and its affiliates. Without these reductions, the fund’s returns would have been lower. These returns do not reflect the deduction of taxes that a shareholder would pay on fund distributions or the redemption of fund shares. |
| 2 | Source for category information: Morningstar, Inc. The Morningstar Category return represents all active and index mutual funds and ETFs within the category as of the report date. |
| 3 | As stated in the prospectus. Includes 0.60% of acquired fund fees and expenses (AFFE), which are indirect expenses incurred by the fund through its investments in the underlying funds. Net Expense: Expenses reduced by a contractual fee waiver in effect for so long as Schwab Asset Management serves as the investment adviser to the fund. Gross Expense: Does not reflect the effect of contractual fee waivers. For actual expense ratios during the period, not including AFFE, refer to the financial highlights section of the financial statements. |
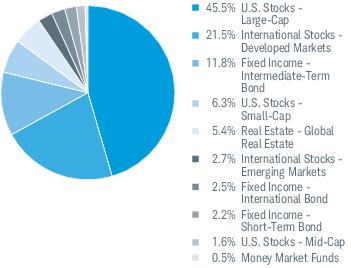
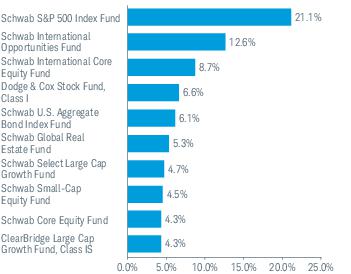
| 1 | The fund intends to invest in a combination of the underlying funds; however, the fund may also invest directly in equity and fixed-income securities, exchange-traded funds, and cash equivalents, including money market securities. |
| 2 | The percentage may differ from the Portfolio Holdings because the above calculation is based on a percentage of total investments, whereas the calculation in the Portfolio Holdings is based on a percentage of net assets. |
| 3 | This list is not a recommendation of any security by the investment adviser. |
| 4 | The holdings listed exclude any temporary liquidity investments. |
| 1 | The total return cited for the index reflects reinvested dividends net of withholding taxes but reflects no deductions for expenses or other taxes. |
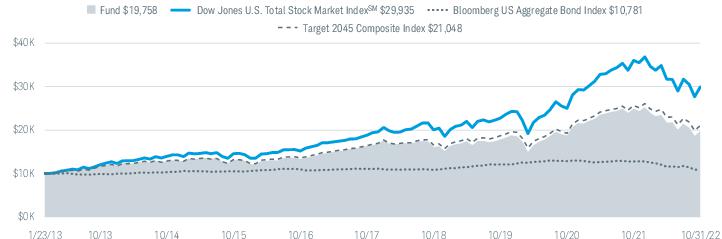
| Fund and Inception Date | 1 Year | 5 Years | Since Inception |
| Fund: Schwab Target 2045 Fund (1/23/13) | -20.76% | 3.92% | 7.22% |
| Dow Jones U.S. Total Stock Market IndexSM | -16.94% | 9.72% | 11.87% |
| Bloomberg US Aggregate Bond Index | -15.68% | -0.54% | 0.77% |
| Target 2045 Composite Index | -17.98% | 5.10% | 7.91% |
| Fund Category: Morningstar Target-Date 20452 | -19.30% | 4.85% | N/A |
| Fund Expense Ratios3: Net 0.64%; Gross 0.68% | |||
| 1 | Fund expenses may have been partially absorbed by the investment adviser and its affiliates. Without these reductions, the fund’s returns would have been lower. These returns do not reflect the deduction of taxes that a shareholder would pay on fund distributions or the redemption of fund shares. |
| 2 | Source for category information: Morningstar, Inc. The Morningstar Category return represents all active and index mutual funds and ETFs within the category as of the report date. |
| 3 | As stated in the prospectus. Includes 0.64% of acquired fund fees and expenses (AFFE), which are indirect expenses incurred by the fund through its investments in the underlying funds. Net Expense: Expenses reduced by a contractual fee waiver in effect for so long as Schwab Asset Management serves as the investment adviser to the fund. Gross Expense: Does not reflect the effect of contractual fee waivers. For actual expense ratios during the period, not including AFFE, refer to the financial highlights section of the financial statements. |
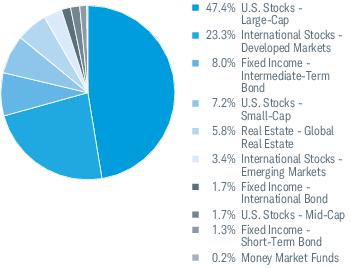
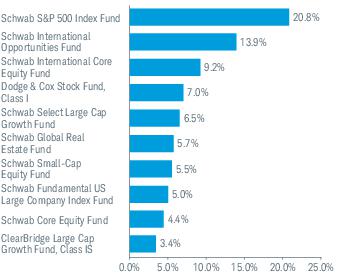
| 1 | The fund intends to invest in a combination of the underlying funds; however, the fund may also invest directly in equity and fixed-income securities, exchange-traded funds, and cash equivalents, including money market securities. |
| 2 | The percentage may differ from the Portfolio Holdings because the above calculation is based on a percentage of total investments, whereas the calculation in the Portfolio Holdings is based on a percentage of net assets. |
| 3 | This list is not a recommendation of any security by the investment adviser. |
| 4 | The holdings listed exclude any temporary liquidity investments. |
| 1 | Percentages may not add up to 100% due to rounding. |
| 2 | The total return cited for the index reflects reinvested dividends net of withholding taxes but reflects no deductions for expenses or other taxes. |
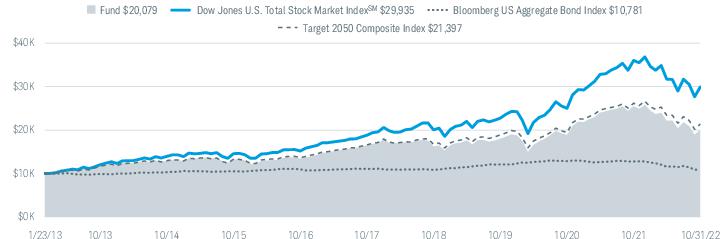
| Fund and Inception Date | 1 Year | 5 Years | Since Inception |
| Fund: Schwab Target 2050 Fund (1/23/13) | -21.22% | 4.02% | 7.39% |
| Dow Jones U.S. Total Stock Market IndexSM | -16.94% | 9.72% | 11.87% |
| Bloomberg US Aggregate Bond Index | -15.68% | -0.54% | 0.77% |
| Target 2050 Composite Index | -18.32% | 5.22% | 8.10% |
| Fund Category: Morningstar Target-Date 20502 | -19.52% | 4.91% | N/A |
| Fund Expense Ratios3: Net 0.67%; Gross 0.71% | |||
| 1 | Fund expenses may have been partially absorbed by the investment adviser and its affiliates. Without these reductions, the fund’s returns would have been lower. These returns do not reflect the deduction of taxes that a shareholder would pay on fund distributions or the redemption of fund shares. |
| 2 | Source for category information: Morningstar, Inc. The Morningstar Category return represents all active and index mutual funds and ETFs within the category as of the report date. |
| 3 | As stated in the prospectus. Includes 0.67% of acquired fund fees and expenses (AFFE), which are indirect expenses incurred by the fund through its investments in the underlying funds. Net Expense: Expenses reduced by a contractual fee waiver in effect for so long as Schwab Asset Management serves as the investment adviser to the fund. Gross Expense: Does not reflect the effect of contractual fee waivers. For actual expense ratios during the period, not including AFFE, refer to the financial highlights section of the financial statements. |
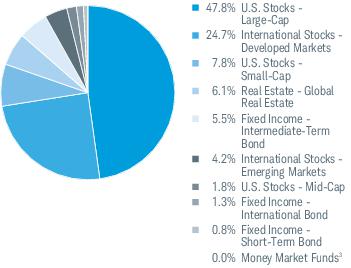
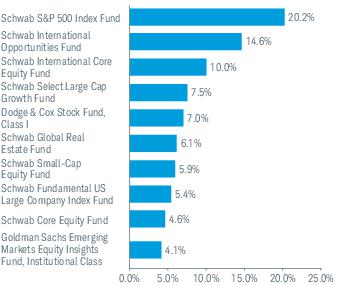
| 1 | The fund intends to invest in a combination of the underlying funds; however, the fund may also invest directly in equity and fixed-income securities, exchange-traded funds, and cash equivalents, including money market securities. |
| 2 | The percentage may differ from the Portfolio Holdings because the above calculation is based on a percentage of total investments, whereas the calculation in the Portfolio Holdings is based on a percentage of net assets. |
| 3 | Less than 0.05%. |
| 4 | This list is not a recommendation of any security by the investment adviser. |
| 5 | The holdings listed exclude any temporary liquidity investments. |
| 1 | The total return cited for the index reflects reinvested dividends net of withholding taxes but reflects no deductions for expenses or other taxes. |
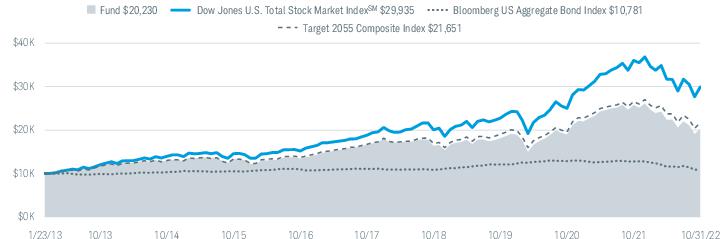
| Fund and Inception Date | 1 Year | 5 Years | Since Inception |
| Fund: Schwab Target 2055 Fund (1/23/13) | -21.54% | 4.03% | 7.48% |
| Dow Jones U.S. Total Stock Market IndexSM | -16.94% | 9.72% | 11.87% |
| Bloomberg US Aggregate Bond Index | -15.68% | -0.54% | 0.77% |
| Target 2055 Composite Index | -18.53% | 5.30% | 8.23% |
| Fund Category: Morningstar Target-Date 20552 | -19.63% | 4.95% | N/A |
| Fund Expense Ratios3: Net 0.68%; Gross 0.74% | |||
| 1 | Fund expenses may have been partially absorbed by the investment adviser and its affiliates. Without these reductions, the fund’s returns would have been lower. These returns do not reflect the deduction of taxes that a shareholder would pay on fund distributions or the redemption of fund shares. |
| 2 | Source for category information: Morningstar, Inc. The Morningstar Category return represents all active and index mutual funds and ETFs within the category as of the report date. |
| 3 | As stated in the prospectus. Includes 0.68% of acquired fund fees and expenses (AFFE), which are indirect expenses incurred by the fund through its investments in the underlying funds. Net Expense: Expenses reduced by a contractual fee waiver in effect for so long as Schwab Asset Management serves as the investment adviser to the fund. Gross Expense: Does not reflect the effect of contractual fee waivers. For actual expense ratios during the period, not including AFFE, refer to the financial highlights section of the financial statements. |
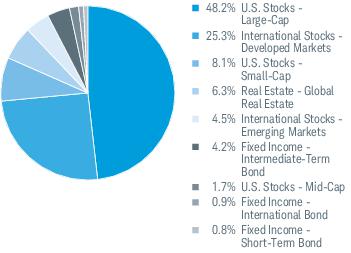
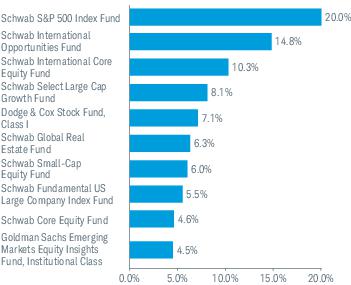
| 1 | The fund intends to invest in a combination of the underlying funds; however, the fund may also invest directly in equity and fixed-income securities, exchange-traded funds, and cash equivalents, including money market securities. |
| 2 | The percentage may differ from the Portfolio Holdings because the above calculation is based on a percentage of total investments, whereas the calculation in the Portfolio Holdings is based on a percentage of net assets. |
| 3 | This list is not a recommendation of any security by the investment adviser. |
| 4 | The holdings listed exclude any temporary liquidity investments. |
| 1 | The total return cited for the index reflects reinvested dividends net of withholding taxes but reflects no deductions for expenses or other taxes. |
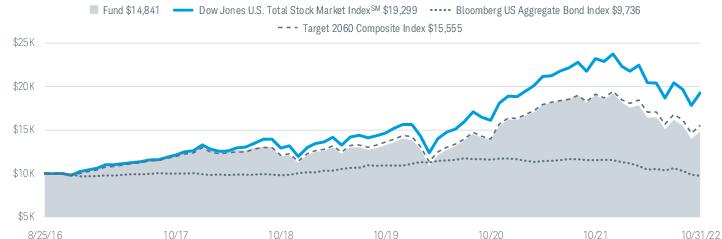
| Fund and Inception Date | 1 Year | 5 Years | Since Inception |
| Fund: Schwab Target 2060 Fund (8/25/16) | -21.88% | 4.08% | 6.59% |
| Dow Jones U.S. Total Stock Market IndexSM | -16.94% | 9.72% | 11.23% |
| Bloomberg US Aggregate Bond Index | -15.68% | -0.54% | -0.42% |
| Target 2060 Composite Index | -18.71% | 5.38% | 7.41% |
| Fund Category: Morningstar Target-Date 20602 | -19.63% | 5.00% | N/A |
| Fund Expense Ratios3: Net 0.69%; Gross 0.91% | |||
| 1 | Fund expenses may have been partially absorbed by the investment adviser and its affiliates. Without these reductions, the fund’s returns would have been lower. These returns do not reflect the deduction of taxes that a shareholder would pay on fund distributions or the redemption of fund shares. |
| 2 | Source for category information: Morningstar, Inc. The Morningstar Category return represents all active and index mutual funds and ETFs within the category as of the report date. |
| 3 | As stated in the prospectus. Includes 0.69% of acquired fund fees and expenses (AFFE), which are indirect expenses incurred by the fund through its investments in the underlying funds. Net Expense: Expenses reduced by a contractual fee waiver in effect for so long as Schwab Asset Management serves as the investment adviser to the fund. Gross Expense: Does not reflect the effect of contractual fee waivers. For actual expense ratios during the period, not including AFFE, refer to the financial highlights section of the financial statements. |
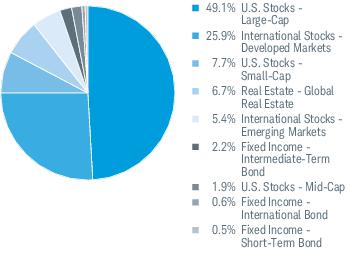
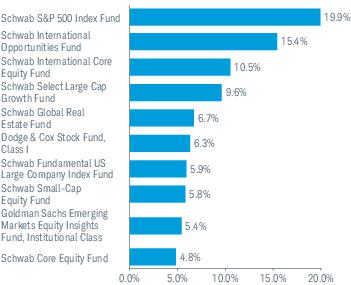
| 1 | The fund intends to invest in a combination of the underlying funds; however, the fund may also invest directly in equity and fixed-income securities, exchange-traded funds, and cash equivalents, including money market securities. |
| 2 | The percentage may differ from the Portfolio Holdings because the above calculation is based on a percentage of total investments, whereas the calculation in the Portfolio Holdings is based on a percentage of net assets. |
| 3 | This list is not a recommendation of any security by the investment adviser. |
| 4 | The holdings listed exclude any temporary liquidity investments. |
| 1 | The total return cited for the index reflects reinvested dividends net of withholding taxes but reflects no deductions for expenses or other taxes. |
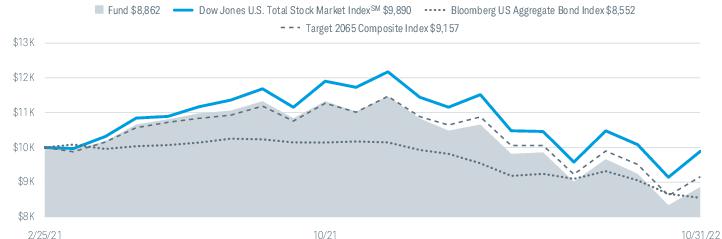
| Fund and Inception Date | 1 Year | Since Inception |
| Fund: Schwab Target 2065 Fund (2/25/21) | -21.78% | -6.94% |
| Dow Jones U.S. Total Stock Market IndexSM | -16.94% | -0.66% |
| Bloomberg US Aggregate Bond Index | -15.68% | -8.90% |
| Target 2065 Composite Index | -18.76% | -5.11% |
| Fund Category: Morningstar Target-Date 2065+2 | -19.88% | N/A |
| Fund Expense Ratios3: Net 0.68%; Gross 2.58% | ||
| 1 | Fund expenses may have been partially absorbed by the investment adviser and its affiliates. Without these reductions, the fund’s returns would have been lower. These returns do not reflect the deduction of taxes that a shareholder would pay on fund distributions or the redemption of fund shares. |
| 2 | Source for category information: Morningstar, Inc. The Morningstar Category return represents all active and index mutual funds and ETFs within the category as of the report date. |
| 3 | As stated in the prospectus. Includes 0.68% of acquired fund fees and expenses (AFFE), which are indirect expenses incurred by the fund through its investments in the underlying funds. Net Expense: Expenses reduced by a contractual fee waiver in effect for so long as Schwab Asset Management serves as the investment adviser to the fund. Gross Expense: Does not reflect the effect of contractual fee waivers. For actual expense ratios during the period, not including AFFE, refer to the financial highlights section of the financial statements. |
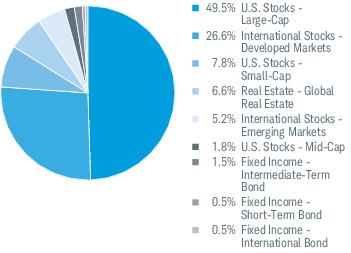
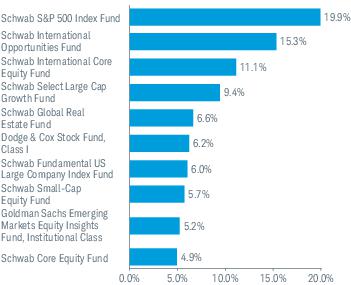
| 1 | The fund intends to invest in a combination of the underlying funds; however, the fund may also invest directly in equity and fixed-income securities, exchange-traded funds, and cash equivalents, including money market securities. |
| 2 | The percentage may differ from the Portfolio Holdings because the above calculation is based on a percentage of total investments, whereas the calculation in the Portfolio Holdings is based on a percentage of net assets. |
| 3 | This list is not a recommendation of any security by the investment adviser. |
| 4 | The holdings listed exclude any temporary liquidity investments. |
| EXPENSE
RATIO (ANNUALIZED)1,2 |
EFFECTIVE
EXPENSE RATIO (ANNUALIZED)3,4 |
BEGINNING
ACCOUNT VALUE AT 5/1/22 |
ENDING
ACCOUNT VALUE (NET OF EXPENSES) AT 10/31/222 |
EXPENSES
PAID DURING PERIOD 5/1/22-10/31/222,5 |
EFFECTIVE
EXPENSES PAID DURING PERIOD 5/1/22-10/31/224,5 | |
| Schwab Target 2010 Fund | ||||||
| Actual Return | 0.00% | 0.26% | $1,000.00 | $ 931.50 | $0.00 | $1.27 |
| Hypothetical 5% Return | 0.00% | 0.26% | $1,000.00 | $1,025.21 | $0.00 | $1.33 |
| Schwab Target 2015 Fund | ||||||
| Actual Return | 0.00% | 0.28% | $1,000.00 | $ 930.70 | $0.00 | $1.36 |
| Hypothetical 5% Return | 0.00% | 0.28% | $1,000.00 | $1,025.21 | $0.00 | $1.43 |
| Schwab Target 2020 Fund | ||||||
| Actual Return | 0.00% | 0.30% | $1,000.00 | $ 929.60 | $0.00 | $1.46 |
| Hypothetical 5% Return | 0.00% | 0.30% | $1,000.00 | $1,025.21 | $0.00 | $1.53 |
| Schwab Target 2025 Fund | ||||||
| Actual Return | 0.00% | 0.36% | $1,000.00 | $ 925.60 | $0.00 | $1.75 |
| Hypothetical 5% Return | 0.00% | 0.36% | $1,000.00 | $1,025.21 | $0.00 | $1.84 |
| Schwab Target 2030 Fund | ||||||
| Actual Return | 0.00% | 0.43% | $1,000.00 | $ 920.70 | $0.00 | $2.08 |
| Hypothetical 5% Return | 0.00% | 0.43% | $1,000.00 | $1,025.21 | $0.00 | $2.19 |
| Schwab Target 2035 Fund | ||||||
| Actual Return | 0.00% | 0.48% | $1,000.00 | $ 917.20 | $0.00 | $2.32 |
| Hypothetical 5% Return | 0.00% | 0.48% | $1,000.00 | $1,025.21 | $0.00 | $2.45 |
| Schwab Target 2040 Fund | ||||||
| Actual Return | 0.00% | 0.51% | $1,000.00 | $ 914.10 | $0.00 | $2.46 |
| Hypothetical 5% Return | 0.00% | 0.51% | $1,000.00 | $1,025.21 | $0.00 | $2.60 |
| Schwab Target 2045 Fund | ||||||
| Actual Return | 0.00% | 0.55% | $1,000.00 | $ 909.90 | $0.00 | $2.65 |
| Hypothetical 5% Return | 0.00% | 0.55% | $1,000.00 | $1,025.21 | $0.00 | $2.80 |
| Schwab Target 2050 Fund | ||||||
| Actual Return | 0.00% | 0.57% | $1,000.00 | $ 906.90 | $0.00 | $2.74 |
| Hypothetical 5% Return | 0.00% | 0.57% | $1,000.00 | $1,025.21 | $0.00 | $2.91 |
| Schwab Target 2055 Fund | ||||||
| Actual Return | 0.00% | 0.59% | $1,000.00 | $ 905.40 | $0.00 | $2.83 |
| Hypothetical 5% Return | 0.00% | 0.59% | $1,000.00 | $1,025.21 | $0.00 | $3.01 |
| EXPENSE
RATIO (ANNUALIZED)1,2 |
EFFECTIVE
EXPENSE RATIO (ANNUALIZED)3,4 |
BEGINNING
ACCOUNT VALUE AT 5/1/22 |
ENDING
ACCOUNT VALUE (NET OF EXPENSES) AT 10/31/222 |
EXPENSES
PAID DURING PERIOD 5/1/22-10/31/222,5 |
EFFECTIVE
EXPENSES PAID DURING PERIOD 5/1/22-10/31/224,5 | |
| Schwab Target 2060 Fund | ||||||
| Actual Return | 0.00% | 0.60% | $1,000.00 | $ 904.10 | $0.00 | $2.88 |
| Hypothetical 5% Return | 0.00% | 0.60% | $1,000.00 | $1,025.21 | $0.00 | $3.06 |
| Schwab Target 2065 Fund | ||||||
| Actual Return | 0.00% | 0.61% | $1,000.00 | $ 902.70 | $0.00 | $2.93 |
| Hypothetical 5% Return | 0.00% | 0.61% | $1,000.00 | $1,025.21 | $0.00 | $3.11 |
| 1 | Based on the most recent six-month expense ratio. |
| 2 | Excludes acquired fund fees and expenses, which are indirect expenses incurred by the fund through its investments in underlying funds. |
| 3 | Based on the most recent six-month acquired fund fees and expenses and the expense ratio; may differ from the acquired fund fees and expenses and the expense ratio in the prospectus. |
| 4 | Includes acquired fund fees and expenses, which are indirect expenses incurred by the fund through its investments in underlying funds. |
| 5 | Expenses for each fund are equal to its annualized expense ratio, multiplied by the average account value over the period, multiplied by the 184 days of the period, and divided by the 365 days of the fiscal year. |
| 11/1/21–
10/31/22 |
11/1/20–
10/31/21 |
11/1/19–
10/31/20 |
11/1/18–
10/31/19 |
11/1/17–
10/31/18 |
||
| Per-Share Data | ||||||
| Net asset value at beginning of period | $15.21 | $13.76 | $13.57 | $13.06 | $13.42 | |
| Income (loss) from investment operations: | ||||||
| Net investment income (loss)1 | 0.28 | 0.22 | 0.27 | 0.30 | 0.29 | |
| Net realized and unrealized gains (losses) | (2.55) | 1.61 | 0.57 | 0.97 | (0.35) | |
| Total from investment operations | (2.27) | 1.83 | 0.84 | 1.27 | (0.06) | |
| Less distributions: | ||||||
| Distributions from net investment income | (0.30) | (0.27) | (0.34) | (0.34) | (0.30) | |
| Distributions from net realized gains | (0.41) | (0.11) | (0.31) | (0.42) | — | |
| Total distributions | (0.71) | (0.38) | (0.65) | (0.76) | (0.30) | |
| Net asset value at end of period | $12.23 | $15.21 | $13.76 | $13.57 | $13.06 | |
| Total return | (15.69%) | 13.46% | 6.38% | 10.42% | (0.52%) | |
| Ratios/Supplemental Data | ||||||
| Ratios to average net assets: | ||||||
| Net operating expenses2 | 0.00% 3 | 0.00% | 0.00% | 0.00% | 0.00% 4 | |
| Gross operating expenses2 | 0.14% 3 | 0.12% | 0.14% | 0.17% | 0.12% | |
| Net investment income (loss) | 2.04% | 1.50% | 2.03% | 2.33% | 2.15% | |
| Portfolio turnover rate | 24% | 21% | 27% | 13% | 16% | |
| Net assets, end of period (x 1,000) | $46,359 | $65,477 | $55,507 | $51,106 | $51,996 | |
| 1 | Calculated based on the average shares outstanding during the period. |
| 2 | Ratio excludes acquired fund fees and expenses, which are indirect expenses incurred by the fund through its investments in underlying funds. |
| 3 | Ratio includes less than 0.005% of non-routine proxy expenses. |
| 4 | Less than 0.005%; the ratio of net operating expenses would have been 0.00%, if certain non-routine expenses had not been incurred. |
| SECURITY | VALUE
AT 10/31/21 |
PURCHASES | SALES | REALIZED
GAINS (LOSSES) |
NET
CHANGE IN UNREALIZED APPRECIATION (DEPRECIATION) |
VALUE
AT 10/31/22 |
BALANCE
OF SHARES HELD AT 10/31/22 |
DISTRIBUTIONS
RECEIVED(a) |
| AFFILIATED UNDERLYING FUNDS 77.0% OF NET ASSETS | ||||||||
| U.S. Stocks 20.3% | ||||||||
| Large-Cap 18.1% | ||||||||
| Schwab Core Equity Fund | $1,568,956 | $— | ($295,388) | $95,241 | ($542,645) | $826,164 | 42,454 | $325,091 |
| Schwab Fundamental US Large Company Index Fund | 137,540 | 1,083,654 | (167,709) | (7,474) | (67,359) | 978,652 | 46,185 | 23,067 |
| Schwab S&P 500 Index Fund | 8,383,553 | 605,099 | (2,375,887) | 505,149 | (1,549,821) | 5,568,093 | 92,771 | 108,464 |
| Schwab Select Large Cap Growth Fund (formerly Laudus U.S. Large Cap Growth Fund) * | — | 1,421,398 | (50,924) | (1,395) | (353,542) | 1,015,537 | 51,524 | — |
| 8,388,446 | ||||||||
| Mid-Cap 0.7% | ||||||||
| Schwab U.S. Mid-Cap Index Fund | 464,029 | 13,281 | (84,083) | 18,025 | (100,307) | 310,945 | 5,998 | 13,281 |
| Small-Cap 1.5% | ||||||||
| Schwab Small-Cap Equity Fund | 781,673 | 179,736 | (70,000) | (20,388) | (165,593) | 705,428 | 37,245 | 94,736 |
| 9,404,819 | ||||||||
| International Stocks 8.7% | ||||||||
| Developed Markets 8.7% | ||||||||
| Schwab International Core Equity Fund | 1,983,253 | 717,937 | (513,307) | (41,170) | (468,165) | 1,678,548 | 192,715 | 64,381 |
| Schwab International Opportunities Fund (formerly Laudus International MarketMasters Fund) | 3,840,054 | 819,150 | (444,296) | (144,554) | (1,722,210) | 2,348,144 | 139,026 | 549,467 |
| 4,026,692 | ||||||||
| Real Estate 2.5% | ||||||||
| Global Real Estate 2.5% | ||||||||
| Schwab Global Real Estate Fund | 1,350,166 | 379,071 | (147,718) | (12,971) | (387,865) | 1,180,683 | 200,116 | 40,937 |
| Fixed Income 41.8% | ||||||||
| Inflation-Protected Bond 6.6% | ||||||||
| Schwab Treasury Inflation Protected Securities Index Fund | 4,365,856 | 336,678 | (970,430) | (49,449) | (620,100) | 3,062,555 | 293,629 | 236,678 |
| Intermediate-Term Bond 25.5% | ||||||||
| Schwab U.S. Aggregate Bond Index Fund | 16,943,429 | 1,784,694 | (4,260,569) | (446,917) | (2,212,779) | 11,807,858 | 1,373,007 | 319,585 |
| Short-Term Bond 9.7% | ||||||||
| Schwab Short-Term Bond Index Fund | 6,499,915 | 284,521 | (1,780,441) | (98,027) | (387,752) | 4,518,216 | 484,787 | 84,492 |
| 19,388,629 | ||||||||
| SECURITY | VALUE
AT 10/31/21 |
PURCHASES | SALES | REALIZED
GAINS (LOSSES) |
NET
CHANGE IN UNREALIZED APPRECIATION (DEPRECIATION) |
VALUE
AT 10/31/22 |
BALANCE
OF SHARES HELD AT 10/31/22 |
DISTRIBUTIONS
RECEIVED(a) |
| Money Market Funds 3.7% | ||||||||
| Schwab Variable Share Price Money Fund, Ultra Shares, 3.10% (b) | $2,041,093 | $17,258 | ($350,049) | ($70) | ($474) | $1,707,758 | 1,707,758 | $19,343 |
| Total
Affiliated Underlying Funds (Cost $34,514,238) |
$48,359,517 | $7,642,477 | ($11,510,801) | ($204,000) | ($8,578,612) | $35,708,581 | $1,879,522 | |
| UNAFFILIATED UNDERLYING FUNDS 22.2% OF NET ASSETS | ||||||||
| U.S. Stocks 5.9% | ||||||||
| Large-Cap 5.4% | ||||||||
| ClearBridge Large Cap Growth Fund, Class IS * | $1,214,671 | 23,812 | ||||||
| Dodge & Cox Stock Fund, Class I | 1,286,121 | 5,828 | ||||||
| 2,500,792 | ||||||||
| Small-Cap 0.5% | ||||||||
| ClearBridge Small Cap Growth Fund, Class IS * | 204,014 | 5,335 | ||||||
| 2,704,806 | ||||||||
| Fixed Income 16.3% | ||||||||
| Intermediate-Term Bond 14.2% | ||||||||
| Baird Aggregate Bond Fund, Institutional Class | 5,392,982 | 578,646 | ||||||
| Loomis Sayles Investment Grade Bond Fund, Class Y | 418,535 | 44,478 | ||||||
| Western Asset Core Plus Bond Fund, Class I | 786,065 | 87,147 | ||||||
| 6,597,582 | ||||||||
| International Bond 2.1% | ||||||||
| PIMCO International Bond Fund (U.S. Dollar-Hedged), Institutional Class | 955,308 | 100,453 | ||||||
| 7,552,890 | ||||||||
| Total
Unaffiliated Underlying Funds (Cost $11,077,575) |
$10,257,696 | |||||||
| Total
Investments in Securities (Cost $45,591,813) |
$45,966,277 | |||||||
| * | Non-income producing security. |
| (a) | Distributions received include distributions from net investment income and capital gains, if any, from the underlying funds. Amounts shown are only presented for affiliated underlying funds, which are presented in the corresponding line-item in the Statement of Operations, if applicable (See financial note 2(d) for additional information). |
| (b) | The rate shown is the annualized 7-day yield. |
| Assets | ||
| Investments in securities, at value - affiliated (cost $34,514,238) | $35,708,581 | |
| Investments in securities, at value - unaffiliated (cost $11,077,575) | 10,257,696 | |
| Cash | 469,156 | |
| Receivables: | ||
| Fund shares sold | 1,104,582 | |
| Investments sold | 430,698 | |
| Dividends | 37,510 | |
| Due from investment adviser | 6,133 | |
| Interest | 332 | |
| Prepaid expenses | + | 9,890 |
| Total assets | 48,024,578 | |
| Liabilities | ||
| Payables: | ||
| Fund shares redeemed | 1,593,870 | |
| Investments bought | 35,409 | |
| Independent trustees’ fees | 33 | |
| Accrued expenses | + | 36,323 |
| Total liabilities | 1,665,635 | |
| Net assets | $46,358,943 | |
| Net Assets by Source | ||
| Capital received from investors | $45,125,322 | |
| Total distributable earnings | + | 1,233,621 |
| Net assets | $46,358,943 | |
| Net Asset Value (NAV) | ||||
| Net Assets | ÷ | Shares
Outstanding |
= | NAV |
| $46,358,943 | 3,789,888 | $12.23 | ||
| For the period November 1, 2021 through October 31, 2022 | ||
| Investment Income | ||
| Dividends received from securities - affiliated | $902,279 | |
| Dividends received from securities - unaffiliated | 226,917 | |
| Interest received from securities - unaffiliated | + | 1,156 |
| Total investment income | 1,130,352 | |
| Expenses | ||
| Professional fees | 21,609 | |
| Registration fees | 21,363 | |
| Portfolio accounting fees | 12,298 | |
| Independent trustees’ fees | 6,901 | |
| Shareholder reports | 4,244 | |
| Proxy fees1 | 2,586 | |
| Custodian fees | 2,262 | |
| Transfer agent fees | 1,118 | |
| Other expenses | + | 5,103 |
| Total expenses | 77,484 | |
| Expense reduction | – | 74,898 |
| Net expenses | – | 2,586 |
| Net investment income | 1,127,766 | |
| REALIZED AND UNREALIZED GAINS (LOSSES) | ||
| Realized capital gain distributions received from underlying funds - affiliated | 977,243 | |
| Realized capital gain distributions received from underlying funds - unaffiliated | 328,219 | |
| Net realized losses on sales of securities - affiliated | (204,000) | |
| Net realized losses on sales of securities - unaffiliated | + | (316,571) |
| Net realized gains | 784,891 | |
| Net change in unrealized appreciation (depreciation) on securities - affiliated | (8,578,612) | |
| Net change in unrealized appreciation (depreciation) on securities - unaffiliated | + | (2,615,892) |
| Net change in unrealized appreciation (depreciation) | + | (11,194,504) |
| Net realized and unrealized losses | (10,409,613) | |
| Decrease in net assets resulting from operations | ($9,281,847) | |
| 1 | Proxy fees are non-routine expenses (see financial note 4 for additional information). |
| OPERATIONS | |||
| 11/1/21-10/31/22 | 11/1/20-10/31/21 | ||
| Net investment income | $1,127,766 | $898,910 | |
| Net realized gains | 784,891 | 1,965,368 | |
| Net change in unrealized appreciation (depreciation) | + | (11,194,504) | 4,477,633 |
| Increase (decrease) in net assets resulting from operations | ($9,281,847) | $7,341,911 | |
| DISTRIBUTIONS TO SHAREHOLDERS | |||
| Total distributions | ($3,070,834) | ($1,544,083) | |
| TRANSACTIONS IN FUND SHARES | |||||
| 11/1/21-10/31/22 | 11/1/20-10/31/21 | ||||
| SHARES | VALUE | SHARES | VALUE | ||
| Shares sold | 570,204 | $7,624,804 | 1,210,571 | $17,923,236 | |
| Shares reinvested | 188,385 | 2,752,308 | 94,692 | 1,353,144 | |
| Shares redeemed | + | (1,273,388) | (17,142,875) | (1,035,698) | (15,103,593) |
| Net transactions in fund shares | (514,799) | ($6,765,763) | 269,565 | $4,172,787 | |
| SHARES OUTSTANDING AND NET ASSETS | |||||
| 11/1/21-10/31/22 | 11/1/20-10/31/21 | ||||
| SHARES | NET ASSETS | SHARES | NET ASSETS | ||
| Beginning of period | 4,304,687 | $65,477,387 | 4,035,122 | $55,506,772 | |
| Total increase (decrease) | + | (514,799) | (19,118,444) | 269,565 | 9,970,615 |
| End of period | 3,789,888 | $46,358,943 | 4,304,687 | $65,477,387 | |
| 11/1/21–
10/31/22 |
11/1/20–
10/31/21 |
11/1/19–
10/31/20 |
11/1/18–
10/31/19 |
11/1/17–
10/31/18 |
||
| Per-Share Data | ||||||
| Net asset value at beginning of period | $13.36 | $12.18 | $12.07 | $11.49 | $12.21 | |
| Income (loss) from investment operations: | ||||||
| Net investment income (loss)1 | 0.23 | 0.19 | 0.25 | 0.27 | 0.25 | |
| Net realized and unrealized gains (losses) | (2.24) | 1.54 | 0.50 | 0.86 | (0.30) | |
| Total from investment operations | (2.01) | 1.73 | 0.75 | 1.13 | (0.05) | |
| Less distributions: | ||||||
| Distributions from net investment income | (0.28) | (0.24) | (0.31) | (0.30) | (0.27) | |
| Distributions from net realized gains | (0.59) | (0.31) | (0.33) | (0.25) | (0.40) | |
| Total distributions | (0.87) | (0.55) | (0.64) | (0.55) | (0.67) | |
| Net asset value at end of period | $10.48 | $13.36 | $12.18 | $12.07 | $11.49 | |
| Total return | (16.15%) | 14.54% | 6.41% | 10.48% | (0.57%) | |
| Ratios/Supplemental Data | ||||||
| Ratios to average net assets: | ||||||
| Net operating expenses2 | 0.00% 3 | 0.00% | 0.00% | 0.00% | 0.00% 4 | |
| Gross operating expenses2 | 0.11% 3 | 0.08% | 0.10% | 0.11% | 0.07% | |
| Net investment income (loss) | 1.97% | 1.47% | 2.07% | 2.35% | 2.12% | |
| Portfolio turnover rate | 19% | 14% | 15% | 10% | 14% | |
| Net assets, end of period (x 1,000) | $57,879 | $81,399 | $77,274 | $81,139 | $90,292 | |
| 1 | Calculated based on the average shares outstanding during the period. |
| 2 | Ratio excludes acquired fund fees and expenses, which are indirect expenses incurred by the fund through its investments in underlying funds. |
| 3 | Ratio includes less than 0.005% of non-routine proxy expenses. |
| 4 | Less than 0.005%; the ratio of net operating expenses would have been 0.00%, if certain non-routine expenses had not been incurred. |
| SECURITY | VALUE
AT 10/31/21 |
PURCHASES | SALES | REALIZED
GAINS (LOSSES) |
NET
CHANGE IN UNREALIZED APPRECIATION (DEPRECIATION) |
VALUE
AT 10/31/22 |
BALANCE
OF SHARES HELD AT 10/31/22 |
DISTRIBUTIONS
RECEIVED(a) |
| AFFILIATED UNDERLYING FUNDS 76.7% OF NET ASSETS | ||||||||
| U.S. Stocks 21.8% | ||||||||
| Large-Cap 19.5% | ||||||||
| Schwab Core Equity Fund | $2,277,077 | $— | ($518,354) | $231,402 | ($879,274) | $1,110,851 | 57,084 | $477,407 |
| Schwab Fundamental US Large Company Index Fund | 84,013 | 1,254,375 | — | — | (32,146) | 1,306,242 | 61,644 | 3,977 |
| Schwab S&P 500 Index Fund | 11,092,729 | 173,692 | (1,910,465) | 1,274,290 | (2,840,412) | 7,789,834 | 129,787 | 142,213 |
| Schwab Select Large Cap Growth Fund (formerly Laudus U.S. Large Cap Growth Fund) * | — | 1,409,891 | — | — | (345,163) | 1,064,728 | 54,020 | — |
| 11,271,655 | ||||||||
| Mid-Cap 0.7% | ||||||||
| Schwab U.S. Mid-Cap Index Fund | 693,518 | 18,018 | (150,567) | 43,248 | (157,398) | 446,819 | 8,619 | 18,018 |
| Small-Cap 1.6% | ||||||||
| Schwab Small-Cap Equity Fund | 1,092,075 | 200,431 | (120,000) | (22,138) | (224,802) | 925,566 | 48,868 | 118,989 |
| 12,644,040 | ||||||||
| International Stocks 10.0% | ||||||||
| Developed Markets 10.0% | ||||||||
| Schwab International Core Equity Fund | 2,177,755 | 1,262,173 | (384,340) | (46,376) | (610,761) | 2,398,451 | 275,367 | 59,309 |
| Schwab International Opportunities Fund (formerly Laudus International MarketMasters Fund) | 6,019,167 | 942,644 | (715,072) | (209,630) | (2,677,063) | 3,360,046 | 198,937 | 861,272 |
| 5,758,497 | ||||||||
| Real Estate 2.8% | ||||||||
| Global Real Estate 2.8% | ||||||||
| Schwab Global Real Estate Fund | 1,748,366 | 603,411 | (175,000) | (45,143) | (517,885) | 1,613,749 | 273,517 | 55,698 |
| Fixed Income 38.7% | ||||||||
| Inflation-Protected Bond 6.3% | ||||||||
| Schwab Treasury Inflation Protected Securities Index Fund | 5,118,855 | 285,090 | (930,185) | (12,272) | (802,074) | 3,659,414 | 350,855 | 285,090 |
| Intermediate-Term Bond 23.3% | ||||||||
| Schwab U.S. Aggregate Bond Index Fund | 19,995,824 | 647,328 | (3,991,838) | (332,662) | (2,854,404) | 13,464,248 | 1,565,610 | 381,206 |
| Short-Term Bond 9.1% | ||||||||
| Schwab Short-Term Bond Index Fund | 7,560,669 | 99,084 | (1,805,524) | (80,104) | (494,299) | 5,279,826 | 566,505 | 99,052 |
| 22,403,488 | ||||||||
| SECURITY | VALUE
AT 10/31/21 |
PURCHASES | SALES | REALIZED
GAINS (LOSSES) |
NET
CHANGE IN UNREALIZED APPRECIATION (DEPRECIATION) |
VALUE
AT 10/31/22 |
BALANCE
OF SHARES HELD AT 10/31/22 |
DISTRIBUTIONS
RECEIVED(a) |
| Money Market Funds 3.4% | ||||||||
| Schwab Variable Share Price Money Fund, Ultra Shares, 3.10% (b) | $2,590,441 | $18,079 | ($650,061) | ($94) | ($654) | $1,957,711 | 1,957,711 | $20,460 |
| Total
Affiliated Underlying Funds (Cost $41,343,822) |
$60,450,489 | $6,914,216 | ($11,351,406) | $800,521 | ($12,436,335) | $44,377,485 | $2,522,691 | |
| UNAFFILIATED UNDERLYING FUNDS 22.6% OF NET ASSETS | ||||||||
| U.S. Stocks 6.3% | ||||||||
| Large-Cap 5.8% | ||||||||
| ClearBridge Large Cap Growth Fund, Class IS * | $1,644,845 | 32,246 | ||||||
| Dodge & Cox Stock Fund, Class I | 1,703,338 | 7,719 | ||||||
| 3,348,183 | ||||||||
| Small-Cap 0.5% | ||||||||
| ClearBridge Small Cap Growth Fund, Class IS * | 285,177 | 7,458 | ||||||
| 3,633,360 | ||||||||
| Fixed Income 16.3% | ||||||||
| Intermediate-Term Bond 14.1% | ||||||||
| Baird Aggregate Bond Fund, Institutional Class | 6,081,927 | 652,567 | ||||||
| Loomis Sayles Investment Grade Bond Fund, Class Y | 659,693 | 70,106 | ||||||
| Western Asset Core Plus Bond Fund, Class I | 1,442,547 | 159,928 | ||||||
| 8,184,167 | ||||||||
| International Bond 2.2% | ||||||||
| PIMCO International Bond Fund (U.S. Dollar-Hedged), Institutional Class | 1,255,534 | 132,023 | ||||||
| 9,439,701 | ||||||||
| Total
Unaffiliated Underlying Funds (Cost $14,059,465) |
$13,073,061 | |||||||
| Total
Investments in Securities (Cost $55,403,287) |
$57,450,546 | |||||||
| * | Non-income producing security. |
| (a) | Distributions received include distributions from net investment income and capital gains, if any, from the underlying funds. Amounts shown are only presented for affiliated underlying funds, which are presented in the corresponding line-item in the Statement of Operations, if applicable (See financial note 2(d) for additional information). |
| (b) | The rate shown is the annualized 7-day yield. |
| Assets | ||
| Investments in securities, at value - affiliated (cost $41,343,822) | $44,377,485 | |
| Investments in securities, at value - unaffiliated (cost $14,059,465) | 13,073,061 | |
| Cash | 65,979 | |
| Receivables: | ||
| Investments sold | 640,559 | |
| Fund shares sold | 234,507 | |
| Dividends | 46,429 | |
| Due from investment adviser | 6,141 | |
| Interest | 480 | |
| Prepaid expenses | + | 3,968 |
| Total assets | 58,448,609 | |
| Liabilities | ||
| Payables: | ||
| Investments bought | 310,026 | |
| Fund shares redeemed | 222,389 | |
| Independent trustees’ fees | 33 | |
| Accrued expenses | + | 36,771 |
| Total liabilities | 569,219 | |
| Net assets | $57,879,390 | |
| Net Assets by Source | ||
| Capital received from investors | $53,424,857 | |
| Total distributable earnings | + | 4,454,533 |
| Net assets | $57,879,390 | |
| Net Asset Value (NAV) | ||||
| Net Assets | ÷ | Shares
Outstanding |
= | NAV |
| $57,879,390 | 5,522,473 | $10.48 | ||
| For the period November 1, 2021 through October 31, 2022 | ||
| Investment Income | ||
| Dividends received from securities - affiliated | $1,085,856 | |
| Dividends received from securities - unaffiliated | 288,785 | |
| Interest received from securities - unaffiliated | + | 2,223 |
| Total investment income | 1,376,864 | |
| Expenses | ||
| Professional fees | 21,643 | |
| Registration fees | 18,839 | |
| Portfolio accounting fees | 12,443 | |
| Independent trustees’ fees | 6,942 | |
| Shareholder reports | 4,143 | |
| Proxy fees1 | 3,252 | |
| Custodian fees | 1,785 | |
| Transfer agent fees | 1,601 | |
| Other expenses | + | 5,249 |
| Total expenses | 75,897 | |
| Expense reduction | – | 72,645 |
| Net expenses | – | 3,252 |
| Net investment income | 1,373,612 | |
| REALIZED AND UNREALIZED GAINS (LOSSES) | ||
| Realized capital gain distributions received from underlying funds - affiliated | 1,436,835 | |
| Realized capital gain distributions received from underlying funds - unaffiliated | 414,993 | |
| Net realized gains on sales of securities - affiliated | 800,521 | |
| Net realized losses on sales of securities - unaffiliated | + | (177,215) |
| Net realized gains | 2,475,134 | |
| Net change in unrealized appreciation (depreciation) on securities - affiliated | (12,436,335) | |
| Net change in unrealized appreciation (depreciation) on securities - unaffiliated | + | (3,640,272) |
| Net change in unrealized appreciation (depreciation) | + | (16,076,607) |
| Net realized and unrealized losses | (13,601,473) | |
| Decrease in net assets resulting from operations | ($12,227,861) | |
| 1 | Proxy fees are non-routine expenses (see financial note 4 for additional information). |
| OPERATIONS | |||
| 11/1/21-10/31/22 | 11/1/20-10/31/21 | ||
| Net investment income | $1,373,612 | $1,200,315 | |
| Net realized gains | 2,475,134 | 3,802,441 | |
| Net change in unrealized appreciation (depreciation) | + | (16,076,607) | 6,018,277 |
| Increase (decrease) in net assets resulting from operations | ($12,227,861) | $11,021,033 | |
| DISTRIBUTIONS TO SHAREHOLDERS | |||
| Total distributions | ($5,182,871) | ($3,467,726) | |
| TRANSACTIONS IN FUND SHARES | |||||
| 11/1/21-10/31/22 | 11/1/20-10/31/21 | ||||
| SHARES | VALUE | SHARES | VALUE | ||
| Shares sold | 297,978 | $3,496,419 | 645,653 | $8,261,663 | |
| Shares reinvested | 380,762 | 4,793,794 | 263,836 | 3,295,303 | |
| Shares redeemed | + | (1,248,825) | (14,398,775) | (1,161,720) | (14,985,882) |
| Net transactions in fund shares | (570,085) | ($6,108,562) | (252,231) | ($3,428,916) | |
| SHARES OUTSTANDING AND NET ASSETS | |||||
| 11/1/21-10/31/22 | 11/1/20-10/31/21 | ||||
| SHARES | NET ASSETS | SHARES | NET ASSETS | ||
| Beginning of period | 6,092,558 | $81,398,684 | 6,344,789 | $77,274,293 | |
| Total increase (decrease) | + | (570,085) | (23,519,294) | (252,231) | 4,124,391 |
| End of period | 5,522,473 | $57,879,390 | 6,092,558 | $81,398,684 | |
| 11/1/21–
10/31/22 |
11/1/20–
10/31/21 |
11/1/19–
10/31/20 |
11/1/18–
10/31/19 |
11/1/17–
10/31/18 |
||
| Per-Share Data | ||||||
| Net asset value at beginning of period | $16.14 | $14.55 | $14.46 | $13.87 | $14.71 | |
| Income (loss) from investment operations: | ||||||
| Net investment income (loss)1 | 0.28 | 0.23 | 0.30 | 0.32 | 0.30 | |
| Net realized and unrealized gains (losses) | (2.72) | 1.94 | 0.58 | 1.04 | (0.33) | |
| Total from investment operations | (2.44) | 2.17 | 0.88 | 1.36 | (0.03) | |
| Less distributions: | ||||||
| Distributions from net investment income | (0.35) | (0.29) | (0.36) | (0.35) | (0.33) | |
| Distributions from net realized gains | (0.80) | (0.29) | (0.43) | (0.42) | (0.48) | |
| Total distributions | (1.15) | (0.58) | (0.79) | (0.77) | (0.81) | |
| Net asset value at end of period | $12.55 | $16.14 | $14.55 | $14.46 | $13.87 | |
| Total return | (16.35%) | 15.27% | 6.33% | 10.58% | (0.32%) | |
| Ratios/Supplemental Data | ||||||
| Ratios to average net assets: | ||||||
| Net operating expenses2 | 0.00% 3 | 0.00% | 0.00% | 0.00% | 0.00% | |
| Gross operating expenses2 | 0.03% 3 | 0.02% | 0.02% | 0.03% | 0.02% | |
| Net investment income (loss) | 1.97% | 1.47% | 2.13% | 2.28% | 2.07% | |
| Portfolio turnover rate | 17% | 10% | 17% | 14% | 18% | |
| Net assets, end of period (x 1,000) | $383,963 | $531,012 | $525,444 | $548,690 | $541,856 | |
| 1 | Calculated based on the average shares outstanding during the period. |
| 2 | Ratio excludes acquired fund fees and expenses, which are indirect expenses incurred by the fund through its investments in underlying funds. |
| 3 | Ratio includes less than 0.005% of non-routine proxy expenses. |
| SECURITY | VALUE
AT 10/31/21 |
PURCHASES | SALES | REALIZED
GAINS (LOSSES) |
NET
CHANGE IN UNREALIZED APPRECIATION (DEPRECIATION) |
VALUE
AT 10/31/22 |
BALANCE
OF SHARES HELD AT 10/31/22 |
DISTRIBUTIONS
RECEIVED(a) |
| AFFILIATED UNDERLYING FUNDS 76.2% OF NET ASSETS | ||||||||
| U.S. Stocks 22.3% | ||||||||
| Large-Cap 19.8% | ||||||||
| Schwab Core Equity Fund | $15,100,292 | $— | ($2,084,672) | $736,346 | ($5,459,059) | $8,292,907 | 426,151 | $3,544,693 |
| Schwab Fundamental US Large Company Index Fund | 630,096 | 5,899,652 | — | — | (390,791) | 6,138,957 | 289,710 | 29,826 |
| Schwab S&P 500 Index Fund | 75,059,726 | 1,181,557 | (10,325,834) | 6,944,063 | (17,664,164) | 55,195,348 | 919,616 | 973,848 |
| Schwab Select Large Cap Growth Fund (formerly Laudus U.S. Large Cap Growth Fund) * | — | 8,482,778 | — | — | (2,047,836) | 6,434,942 | 326,481 | — |
| 76,062,154 | ||||||||
| Mid-Cap 0.9% | ||||||||
| Schwab U.S. Mid-Cap Index Fund | 4,461,137 | 127,673 | (399,999) | 48,967 | (926,803) | 3,310,975 | 63,869 | 127,673 |
| Small-Cap 1.6% | ||||||||
| Schwab Small-Cap Equity Fund | 8,228,779 | 896,580 | (1,284,522) | (2,730) | (1,751,491) | 6,086,616 | 321,363 | 896,580 |
| 85,459,745 | ||||||||
| International Stocks 10.9% | ||||||||
| Developed Markets 10.9% | ||||||||
| Schwab International Core Equity Fund | 17,711,654 | 7,128,958 | (2,374,019) | (222,533) | (4,813,523) | 17,430,537 | 2,001,210 | 484,294 |
| Schwab International Opportunities Fund (formerly Laudus International MarketMasters Fund) | 40,801,835 | 6,734,304 | (3,251,786) | (1,005,482) | (18,713,576) | 24,565,295 | 1,454,428 | 5,838,263 |
| 41,995,832 | ||||||||
| Real Estate 3.0% | ||||||||
| Global Real Estate 3.0% | ||||||||
| Schwab Global Real Estate Fund | 12,191,759 | 3,422,008 | (300,000) | 19,874 | (3,905,583) | 11,428,058 | 1,936,959 | 378,467 |
| Fixed Income 36.9% | ||||||||
| Inflation-Protected Bond 6.1% | ||||||||
| Schwab Treasury Inflation Protected Securities Index Fund | 32,789,992 | 1,807,648 | (5,863,252) | (42,790) | (5,157,485) | 23,534,113 | 2,256,387 | 1,807,648 |
| Intermediate-Term Bond 22.2% | ||||||||
| Schwab U.S. Aggregate Bond Index Fund | 125,307,510 | 3,646,314 | (23,755,451) | (1,925,917) | (18,088,025) | 85,184,431 | 9,905,166 | 2,393,864 |
| Short-Term Bond 8.6% | ||||||||
| Schwab Short-Term Bond Index Fund | 46,734,024 | 616,352 | (10,792,260) | (416,171) | (3,143,528) | 32,998,417 | 3,540,603 | 616,146 |
| 141,716,961 | ||||||||
| SECURITY | VALUE
AT 10/31/21 |
PURCHASES | SALES | REALIZED
GAINS (LOSSES) |
NET
CHANGE IN UNREALIZED APPRECIATION (DEPRECIATION) |
VALUE
AT 10/31/22 |
BALANCE
OF SHARES HELD AT 10/31/22 |
DISTRIBUTIONS
RECEIVED(a) |
| Money Market Funds 3.1% | ||||||||
| Schwab Variable Share Price Money Fund, Ultra Shares, 3.10% (b) | $15,951,603 | $115,537 | ($4,000,381) | ($750) | ($3,743) | $12,062,266 | 12,062,266 | $130,213 |
| Total
Affiliated Underlying Funds (Cost $267,295,382) |
$394,968,407 | $40,059,361 | ($64,432,176) | $4,132,877 | ($82,065,607) | $292,662,862 | $17,221,515 | |
| UNAFFILIATED UNDERLYING FUNDS 23.2% OF NET ASSETS | ||||||||
| U.S. Stocks 7.2% | ||||||||
| Large-Cap 6.6% | ||||||||
| ClearBridge Large Cap Growth Fund, Class IS * | $12,044,200 | 236,114 | ||||||
| Dodge & Cox Stock Fund, Class I | 13,203,535 | 59,831 | ||||||
| 25,247,735 | ||||||||
| Small-Cap 0.6% | ||||||||
| ClearBridge Small Cap Growth Fund, Class IS * | 2,122,068 | 55,493 | ||||||
| 27,369,803 | ||||||||
| Fixed Income 16.0% | ||||||||
| Intermediate-Term Bond 13.9% | ||||||||
| Baird Aggregate Bond Fund, Institutional Class | 37,281,857 | 4,000,199 | ||||||
| Loomis Sayles Investment Grade Bond Fund, Class Y | 5,072,986 | 539,106 | ||||||
| Western Asset Core Plus Bond Fund, Class I | 10,867,217 | 1,204,791 | ||||||
| 53,222,060 | ||||||||
| International Bond 2.1% | ||||||||
| PIMCO International Bond Fund (U.S. Dollar-Hedged), Institutional Class | 8,252,800 | 867,802 | ||||||
| 61,474,860 | ||||||||
| Total
Unaffiliated Underlying Funds (Cost $95,056,039) |
$88,844,663 | |||||||
| Total
Investments in Securities (Cost $362,351,421) |
$381,507,525 | |||||||
| * | Non-income producing security. |
| (a) | Distributions received include distributions from net investment income and capital gains, if any, from the underlying funds. Amounts shown are only presented for affiliated underlying funds, which are presented in the corresponding line-item in the Statement of Operations, if applicable (See financial note 2(d) for additional information). |
| (b) | The rate shown is the annualized 7-day yield. |
| Assets | ||
| Investments in securities, at value - affiliated (cost $267,295,382) | $292,662,862 | |
| Investments in securities, at value - unaffiliated (cost $95,056,039) | 88,844,663 | |
| Cash | 1,239,731 | |
| Receivables: | ||
| Investments sold | 3,350,368 | |
| Dividends | 296,645 | |
| Fund shares sold | 255,839 | |
| Due from investment adviser | 8,788 | |
| Interest | 2,025 | |
| Prepaid expenses | + | 12,512 |
| Total assets | 386,673,433 | |
| Liabilities | ||
| Payables: | ||
| Investments bought | 2,209,409 | |
| Fund shares redeemed | 447,127 | |
| Independent trustees’ fees | 38 | |
| Accrued expenses | + | 53,646 |
| Total liabilities | 2,710,220 | |
| Net assets | $383,963,213 | |
| Net Assets by Source | ||
| Capital received from investors | $348,674,003 | |
| Total distributable earnings | + | 35,289,210 |
| Net assets | $383,963,213 | |
| Net Asset Value (NAV) | ||||
| Net Assets | ÷ | Shares
Outstanding |
= | NAV |
| $383,963,213 | 30,585,071 | $12.55 | ||
| For the period November 1, 2021 through October 31, 2022 | ||
| Investment Income | ||
| Dividends received from securities - affiliated | $7,103,413 | |
| Dividends received from securities - unaffiliated | 1,898,257 | |
| Interest received from securities - unaffiliated | + | 9,201 |
| Total investment income | 9,010,871 | |
| Expenses | ||
| Registration fees | 28,350 | |
| Portfolio accounting fees | 25,918 | |
| Professional fees | 22,433 | |
| Proxy fees1 | 21,385 | |
| Shareholder reports | 13,182 | |
| Independent trustees’ fees | 8,019 | |
| Transfer agent fees | 2,481 | |
| Custodian fees | 1,799 | |
| Other expenses | + | 8,847 |
| Total expenses | 132,414 | |
| Expense reduction | – | 111,029 |
| Net expenses | – | 21,385 |
| Net investment income | 8,989,486 | |
| REALIZED AND UNREALIZED GAINS (LOSSES) | ||
| Realized capital gain distributions received from underlying funds - affiliated | 10,118,102 | |
| Realized capital gain distributions received from underlying funds - unaffiliated | 2,724,057 | |
| Net realized gains on sales of securities - affiliated | 4,132,877 | |
| Net realized losses on sales of securities - unaffiliated | + | (1,196,173) |
| Net realized gains | 15,778,863 | |
| Net change in unrealized appreciation (depreciation) on securities - affiliated | (82,065,607) | |
| Net change in unrealized appreciation (depreciation) on securities - unaffiliated | + | (23,848,080) |
| Net change in unrealized appreciation (depreciation) | + | (105,913,687) |
| Net realized and unrealized losses | (90,134,824) | |
| Decrease in net assets resulting from operations | ($81,145,338) | |
| 1 | Proxy fees are non-routine expenses (see financial note 4 for additional information). |
| OPERATIONS | |||
| 11/1/21-10/31/22 | 11/1/20-10/31/21 | ||
| Net investment income | $8,989,486 | $7,899,808 | |
| Net realized gains | 15,778,863 | 27,827,003 | |
| Net change in unrealized appreciation (depreciation) | + | (105,913,687) | 40,880,954 |
| Increase (decrease) in net assets resulting from operations | ($81,145,338) | $76,607,765 | |
| DISTRIBUTIONS TO SHAREHOLDERS | |||
| Total distributions | ($37,368,972) | ($20,699,693) | |
| TRANSACTIONS IN FUND SHARES | |||||
| 11/1/21-10/31/22 | 11/1/20-10/31/21 | ||||
| SHARES | VALUE | SHARES | VALUE | ||
| Shares sold | 1,284,284 | $18,669,459 | 3,640,033 | $56,415,138 | |
| Shares reinvested | 2,320,540 | 35,086,570 | 1,291,646 | 19,426,353 | |
| Shares redeemed | + | (5,910,068) | (82,290,268) | (8,142,847) | (126,181,394) |
| Net transactions in fund shares | (2,305,244) | ($28,534,239) | (3,211,168) | ($50,339,903) | |
| SHARES OUTSTANDING AND NET ASSETS | |||||
| 11/1/21-10/31/22 | 11/1/20-10/31/21 | ||||
| SHARES | NET ASSETS | SHARES | NET ASSETS | ||
| Beginning of period | 32,890,315 | $531,011,762 | 36,101,483 | $525,443,593 | |
| Total increase (decrease) | + | (2,305,244) | (147,048,549) | (3,211,168) | 5,568,169 |
| End of period | 30,585,071 | $383,963,213 | 32,890,315 | $531,011,762 | |
| 11/1/21–
10/31/22 |
11/1/20–
10/31/21 |
11/1/19–
10/31/20 |
11/1/18–
10/31/19 |
11/1/17–
10/31/18 |
||
| Per-Share Data | ||||||
| Net asset value at beginning of period | $17.30 | $14.81 | $14.74 | $14.10 | $14.71 | |
| Income (loss) from investment operations: | ||||||
| Net investment income (loss)1 | 0.27 | 0.22 | 0.31 | 0.30 | 0.28 | |
| Net realized and unrealized gains (losses) | (3.09) | 2.74 | 0.55 | 1.10 | (0.34) | |
| Total from investment operations | (2.82) | 2.96 | 0.86 | 1.40 | (0.06) | |
| Less distributions: | ||||||
| Distributions from net investment income | (0.39) | (0.28) | (0.35) | (0.34) | (0.34) | |
| Distributions from net realized gains | (0.66) | (0.19) | (0.44) | (0.42) | (0.21) | |
| Total distributions | (1.05) | (0.47) | (0.79) | (0.76) | (0.55) | |
| Net asset value at end of period | $13.43 | $17.30 | $14.81 | $14.74 | $14.10 | |
| Total return | (17.39%) | 20.25% | 5.98% | 10.79% | (0.53%) | |
| Ratios/Supplemental Data | ||||||
| Ratios to average net assets: | ||||||
| Net operating expenses2 | 0.00% 3 | 0.00% | 0.00% | 0.00% | 0.00% | |
| Gross operating expenses2 | 0.03% 3 | 0.02% | 0.02% | 0.03% | 0.02% | |
| Net investment income (loss) | 1.82% | 1.33% | 2.14% | 2.10% | 1.88% | |
| Portfolio turnover rate | 19% | 16% | 16% | 15% | 13% | |
| Net assets, end of period (x 1,000) | $494,852 | $662,236 | $571,738 | $577,095 | $530,596 | |
| 1 | Calculated based on the average shares outstanding during the period. |
| 2 | Ratio excludes acquired fund fees and expenses, which are indirect expenses incurred by the fund through its investments in underlying funds. |
| 3 | Ratio includes less than 0.005% of non-routine proxy expenses. |
| SECURITY | VALUE
AT 10/31/21 |
PURCHASES | SALES | REALIZED
GAINS (LOSSES) |
NET
CHANGE IN UNREALIZED APPRECIATION (DEPRECIATION) |
VALUE
AT 10/31/22 |
BALANCE
OF SHARES HELD AT 10/31/22 |
DISTRIBUTIONS
RECEIVED(a) |
| AFFILIATED UNDERLYING FUNDS 74.8% OF NET ASSETS | ||||||||
| U.S. Stocks 26.9% | ||||||||
| Large-Cap 23.7% | ||||||||
| Schwab Core Equity Fund | $30,810,897 | $— | ($7,337,903) | $1,496,834 | ($10,640,362) | $14,329,466 | 736,355 | $7,232,652 |
| Schwab Fundamental US Large Company Index Fund | 1,143,426 | 7,591,725 | — | — | (389,889) | 8,345,262 | 393,830 | 54,124 |
| Schwab S&P 500 Index Fund | 112,235,211 | 1,735,285 | (13,533,971) | 3,671,638 | (20,203,251) | 83,904,912 | 1,397,949 | 1,456,173 |
| Schwab Select Large Cap Growth Fund (formerly Laudus U.S. Large Cap Growth Fund) * | 5,443,022 | 10,934,857 | — | — | (5,739,586) | 10,638,293 | 539,741 | 646,054 |
| 117,217,933 | ||||||||
| Mid-Cap 1.1% | ||||||||
| Schwab U.S. Mid-Cap Index Fund | 7,075,174 | 202,483 | (600,000) | 54,102 | (1,467,228) | 5,264,531 | 101,553 | 202,483 |
| Small-Cap 2.1% | ||||||||
| Schwab Small-Cap Equity Fund | 15,175,891 | 1,653,515 | (3,010,599) | 92,588 | (3,318,457) | 10,592,938 | 559,289 | 1,653,515 |
| 133,075,402 | ||||||||
| International Stocks 14.2% | ||||||||
| Developed Markets 14.2% | ||||||||
| Schwab International Core Equity Fund | 30,940,500 | 6,970,703 | (632,397) | (180,062) | (8,301,032) | 28,797,712 | 3,306,282 | 870,352 |
| Schwab International Opportunities Fund (formerly Laudus International MarketMasters Fund) | 65,698,592 | 10,428,183 | (2,610,000) | (1,001,078) | (30,974,438) | 41,541,259 | 2,459,518 | 9,400,696 |
| 70,338,971 | ||||||||
| Real Estate 3.6% | ||||||||
| Global Real Estate 3.6% | ||||||||
| Schwab Global Real Estate Fund | 19,340,678 | 4,611,799 | — | — | (6,190,981) | 17,761,496 | 3,010,423 | 605,625 |
| Fixed Income 27.5% | ||||||||
| Inflation-Protected Bond 3.6% | ||||||||
| Schwab Treasury Inflation Protected Securities Index Fund | 19,066,823 | 4,480,921 | (2,317,741) | (232,753) | (3,459,570) | 17,537,680 | 1,681,465 | 1,246,654 |
| Intermediate-Term Bond 17.3% | ||||||||
| Schwab U.S. Aggregate Bond Index Fund | 116,519,168 | 6,257,405 | (17,406,269) | (2,559,808) | (17,061,739) | 85,748,757 | 9,970,786 | 2,335,249 |
| Short-Term Bond 6.6% | ||||||||
| Schwab Short-Term Bond Index Fund | 42,631,137 | 589,127 | (7,020,166) | (488,084) | (2,951,479) | 32,760,535 | 3,515,079 | 588,938 |
| 136,046,972 | ||||||||
| SECURITY | VALUE
AT 10/31/21 |
PURCHASES | SALES | REALIZED
GAINS (LOSSES) |
NET
CHANGE IN UNREALIZED APPRECIATION (DEPRECIATION) |
VALUE
AT 10/31/22 |
BALANCE
OF SHARES HELD AT 10/31/22 |
DISTRIBUTIONS
RECEIVED(a) |
| Money Market Funds 2.6% | ||||||||
| Schwab Variable Share Price Money Fund, Ultra Shares, 3.10% (b) | $12,653,373 | $108,982 | ($302) | $— | ($3,804) | $12,758,249 | 12,758,249 | $124,666 |
| Total
Affiliated Underlying Funds (Cost $347,686,400) |
$478,733,892 | $55,564,985 | ($54,469,348) | $853,377 | ($110,701,816) | $369,981,090 | $26,417,181 | |
| UNAFFILIATED UNDERLYING FUNDS 24.7% OF NET ASSETS | ||||||||
| U.S. Stocks 8.5% | ||||||||
| Large-Cap 7.8% | ||||||||
| ClearBridge Large Cap Growth Fund, Class IS * | $16,023,054 | 314,116 | ||||||
| Dodge & Cox Stock Fund, Class I | 22,386,393 | 101,443 | ||||||
| 38,409,447 | ||||||||
| Small-Cap 0.7% | ||||||||
| ClearBridge Small Cap Growth Fund, Class IS * | 3,672,789 | 96,046 | ||||||
| 42,082,236 | ||||||||
| International Stocks 0.2% | ||||||||
| Emerging Markets 0.2% | ||||||||
| Goldman Sachs Emerging Markets Equity Insights Fund, Institutional Class | 1,150,275 | 167,923 | ||||||
| Fixed Income 16.0% | ||||||||
| Intermediate-Term Bond 12.5% | ||||||||
| Baird Aggregate Bond Fund, Institutional Class | 33,988,775 | 3,646,864 | ||||||
| Loomis Sayles Investment Grade Bond Fund, Class Y | 9,952,522 | 1,057,654 | ||||||
| Western Asset Core Plus Bond Fund, Class I | 18,054,982 | 2,001,661 | ||||||
| 61,996,279 | ||||||||
| International Bond 3.5% | ||||||||
| PIMCO International Bond Fund (U.S. Dollar-Hedged), Institutional Class | 17,073,633 | 1,795,335 | ||||||
| 79,069,912 | ||||||||
| Total
Unaffiliated Underlying Funds (Cost $130,814,564) |
$122,302,423 | |||||||
| Total
Investments in Securities (Cost $478,500,964) |
$492,283,513 | |||||||
| * | Non-income producing security. |
| (a) | Distributions received include distributions from net investment income and capital gains, if any, from the underlying funds. Amounts shown are only presented for affiliated underlying funds, which are presented in the corresponding line-item in the Statement of Operations, if applicable (See financial note 2(d) for additional information). |
| (b) | The rate shown is the annualized 7-day yield. |
| Assets | ||
| Investments in securities, at value - affiliated (cost $347,686,400) | $369,981,090 | |
| Investments in securities, at value - unaffiliated (cost $130,814,564) | 122,302,423 | |
| Cash | 1,787,330 | |
| Receivables: | ||
| Investments sold | 4,614,981 | |
| Dividends | 333,188 | |
| Fund shares sold | 205,139 | |
| Due from investment adviser | 10,440 | |
| Interest | 2,559 | |
| Prepaid expenses | + | 8,598 |
| Total assets | 499,245,748 | |
| Liabilities | ||
| Payables: | ||
| Investments bought | 3,951,842 | |
| Fund shares redeemed | 385,730 | |
| Independent trustees’ fees | 39 | |
| Accrued expenses | + | 56,479 |
| Total liabilities | 4,394,090 | |
| Net assets | $494,851,658 | |
| Net Assets by Source | ||
| Capital received from investors | $462,882,749 | |
| Total distributable earnings | + | 31,968,909 |
| Net assets | $494,851,658 | |
| Net Asset Value (NAV) | ||||
| Net Assets | ÷ | Shares
Outstanding |
= | NAV |
| $494,851,658 | 36,845,846 | $13.43 | ||
| For the period November 1, 2021 through October 31, 2022 | ||
| Investment Income | ||
| Dividends received from securities - affiliated | $7,952,874 | |
| Dividends received from securities - unaffiliated | 2,614,670 | |
| Interest received from securities - unaffiliated | + | 15,243 |
| Total investment income | 10,582,787 | |
| Expenses | ||
| Registration fees | 37,100 | |
| Portfolio accounting fees | 27,493 | |
| Proxy fees1 | 27,157 | |
| Professional fees | 22,633 | |
| Shareholder reports | 14,852 | |
| Independent trustees’ fees | 8,362 | |
| Transfer agent fees | 6,067 | |
| Custodian fees | 1,595 | |
| Other expenses | + | 9,948 |
| Total expenses | 155,207 | |
| Expense reduction | – | 128,050 |
| Net expenses | – | 27,157 |
| Net investment income | 10,555,630 | |
| REALIZED AND UNREALIZED GAINS (LOSSES) | ||
| Realized capital gain distributions received from underlying funds - affiliated | 18,464,307 | |
| Realized capital gain distributions received from underlying funds - unaffiliated | 4,204,343 | |
| Net realized gains on sales of securities - affiliated | 853,377 | |
| Net realized losses on sales of securities - unaffiliated | + | (2,445,598) |
| Net realized gains | 21,076,429 | |
| Net change in unrealized appreciation (depreciation) on securities - affiliated | (110,701,816) | |
| Net change in unrealized appreciation (depreciation) on securities - unaffiliated | + | (31,989,045) |
| Net change in unrealized appreciation (depreciation) | + | (142,690,861) |
| Net realized and unrealized losses | (121,614,432) | |
| Decrease in net assets resulting from operations | ($111,058,802) | |
| 1 | Proxy fees are non-routine expenses (see financial note 4 for additional information). |
| OPERATIONS | |||
| 11/1/21-10/31/22 | 11/1/20-10/31/21 | ||
| Net investment income | $10,555,630 | $8,465,976 | |
| Net realized gains | 21,076,429 | 27,687,865 | |
| Net change in unrealized appreciation (depreciation) | + | (142,690,861) | 77,630,122 |
| Increase (decrease) in net assets resulting from operations | ($111,058,802) | $113,783,963 | |
| DISTRIBUTIONS TO SHAREHOLDERS | |||
| Total distributions | ($40,238,108) | ($17,910,599) | |
| TRANSACTIONS IN FUND SHARES | |||||
| 11/1/21-10/31/22 | 11/1/20-10/31/21 | ||||
| SHARES | VALUE | SHARES | VALUE | ||
| Shares sold | 3,386,870 | $52,261,525 | 6,926,067 | $114,143,701 | |
| Shares reinvested | 2,343,986 | 38,464,811 | 1,088,638 | 17,189,589 | |
| Shares redeemed | + | (7,174,723) | (106,813,544) | (8,322,542) | (136,708,712) |
| Net transactions in fund shares | (1,443,867) | ($16,087,208) | (307,837) | ($5,375,422) | |
| SHARES OUTSTANDING AND NET ASSETS | |||||
| 11/1/21-10/31/22 | 11/1/20-10/31/21 | ||||
| SHARES | NET ASSETS | SHARES | NET ASSETS | ||
| Beginning of period | 38,289,713 | $662,235,776 | 38,597,550 | $571,737,834 | |
| Total increase (decrease) | + | (1,443,867) | (167,384,118) | (307,837) | 90,497,942 |
| End of period | 36,845,846 | $494,851,658 | 38,289,713 | $662,235,776 | |
| 11/1/21–
10/31/22 |
11/1/20–
10/31/21 |
11/1/19–
10/31/20 |
11/1/18–
10/31/19 |
11/1/17–
10/31/18 |
||
| Per-Share Data | ||||||
| Net asset value at beginning of period | $18.88 | $15.67 | $15.79 | $15.24 | $16.10 | |
| Income (loss) from investment operations: | ||||||
| Net investment income (loss)1 | 0.27 | 0.22 | 0.33 | 0.30 | 0.29 | |
| Net realized and unrealized gains (losses) | (3.53) | 3.54 | 0.57 | 1.21 | (0.38) | |
| Total from investment operations | (3.26) | 3.76 | 0.90 | 1.51 | (0.09) | |
| Less distributions: | ||||||
| Distributions from net investment income | (0.45) | (0.27) | (0.37) | (0.37) | (0.39) | |
| Distributions from net realized gains | (0.78) | (0.28) | (0.65) | (0.59) | (0.38) | |
| Total distributions | (1.23) | (0.55) | (1.02) | (0.96) | (0.77) | |
| Net asset value at end of period | $14.39 | $18.88 | $15.67 | $15.79 | $15.24 | |
| Total return | (18.51%) | 24.38% | 5.81% | 10.94% | (0.75%) | |
| Ratios/Supplemental Data | ||||||
| Ratios to average net assets: | ||||||
| Net operating expenses2 | 0.00% 3 | 0.00% | 0.00% | 0.00% | 0.00% | |
| Gross operating expenses2 | 0.02% 3 | 0.01% | 0.02% | 0.02% | 0.02% | |
| Net investment income (loss) | 1.65% | 1.21% | 2.15% | 2.00% | 1.79% | |
| Portfolio turnover rate | 16% | 14% | 13% | 17% | 14% | |
| Net assets, end of period (x 1,000) | $901,007 | $1,166,390 | $965,288 | $998,681 | $957,756 | |
| 1 | Calculated based on the average shares outstanding during the period. |
| 2 | Ratio excludes acquired fund fees and expenses, which are indirect expenses incurred by the fund through its investments in underlying funds. |
| 3 | Ratio includes less than 0.005% of non-routine proxy expenses. |
| SECURITY | VALUE
AT 10/31/21 |
PURCHASES | SALES | REALIZED
GAINS (LOSSES) |
NET
CHANGE IN UNREALIZED APPRECIATION (DEPRECIATION) |
VALUE
AT 10/31/22 |
BALANCE
OF SHARES HELD AT 10/31/22 |
DISTRIBUTIONS
RECEIVED(a) |
| AFFILIATED UNDERLYING FUNDS 73.5% OF NET ASSETS | ||||||||
| U.S. Stocks 32.5% | ||||||||
| Large-Cap 28.2% | ||||||||
| Schwab Core Equity Fund | $70,910,149 | $— | ($17,497,159) | $5,603,493 | ($26,571,225) | $32,445,258 | 1,667,279 | $16,645,684 |
| Schwab Fundamental US Large Company Index Fund | 5,893,250 | 17,463,390 | — | — | (1,525,648) | 21,830,992 | 1,030,250 | 278,957 |
| Schwab S&P 500 Index Fund | 217,688,882 | 3,294,756 | (17,014,706) | 2,059,431 | (34,848,464) | 171,179,899 | 2,852,048 | 2,824,361 |
| Schwab Select Large Cap Growth Fund (formerly Laudus U.S. Large Cap Growth Fund) * | 23,583,922 | 22,721,646 | — | — | (17,302,576) | 29,002,992 | 1,471,486 | 2,799,271 |
| 254,459,141 | ||||||||
| Mid-Cap 1.3% | ||||||||
| Schwab U.S. Mid-Cap Index Fund | 14,994,937 | 429,138 | (800,000) | 74,283 | (3,004,354) | 11,694,004 | 225,579 | 429,138 |
| Small-Cap 3.0% | ||||||||
| Schwab Small-Cap Equity Fund | 36,286,126 | 3,953,615 | (5,477,495) | (80,593) | (7,695,771) | 26,985,882 | 1,424,809 | 3,953,615 |
| 293,139,027 | ||||||||
| International Stocks 17.6% | ||||||||
| Developed Markets 17.6% | ||||||||
| Schwab International Core Equity Fund | 72,385,637 | 12,608,044 | — | — | (19,620,844) | 65,372,837 | 7,505,492 | 2,036,199 |
| Schwab International Opportunities Fund (formerly Laudus International MarketMasters Fund) | 133,184,630 | 28,875,176 | (2,400,000) | (680,181) | (65,919,741) | 93,059,884 | 5,509,762 | 19,057,154 |
| 158,432,721 | ||||||||
| Real Estate 4.4% | ||||||||
| Global Real Estate 4.4% | ||||||||
| Schwab Global Real Estate Fund | 38,745,994 | 14,122,196 | — | — | (13,518,688) | 39,349,502 | 6,669,407 | 1,289,064 |
| Fixed Income 17.4% | ||||||||
| Inflation-Protected Bond 1.2% | ||||||||
| Schwab Treasury Inflation Protected Securities Index Fund | 8,963,030 | 3,986,015 | — | — | (2,070,471) | 10,878,574 | 1,043,008 | 679,621 |
| Intermediate-Term Bond 11.7% | ||||||||
| Schwab U.S. Aggregate Bond Index Fund | 145,012,045 | 2,925,545 | (17,678,679) | (2,643,670) | (21,897,672) | 105,717,569 | 12,292,741 | 2,924,613 |
| Short-Term Bond 4.5% | ||||||||
| Schwab Short-Term Bond Index Fund | 52,149,714 | 727,497 | (8,174,887) | (607,381) | (3,634,791) | 40,460,152 | 4,341,218 | 727,263 |
| 157,056,295 | ||||||||
| SECURITY | VALUE
AT 10/31/21 |
PURCHASES | SALES | REALIZED
GAINS (LOSSES) |
NET
CHANGE IN UNREALIZED APPRECIATION (DEPRECIATION) |
VALUE
AT 10/31/22 |
BALANCE
OF SHARES HELD AT 10/31/22 |
DISTRIBUTIONS
RECEIVED(a) |
| Money Market Funds 1.6% | ||||||||
| Schwab Variable Share Price Money Fund, Ultra Shares, 3.10% (b) | $14,659,600 | $126,262 | ($350) | $— | ($4,407) | $14,781,105 | 14,781,105 | $144,432 |
| Total
Affiliated Underlying Funds (Cost $581,454,997) |
$834,457,916 | $111,233,280 | ($69,043,276) | $3,725,382 | ($217,614,652) | $662,758,650 | $53,789,372 | |
| UNAFFILIATED UNDERLYING FUNDS 25.8% OF NET ASSETS | ||||||||
| U.S. Stocks 10.1% | ||||||||
| Large-Cap 9.0% | ||||||||
| ClearBridge Large Cap Growth Fund, Class IS * | $31,964,432 | 626,631 | ||||||
| Dodge & Cox Stock Fund, Class I | 49,191,048 | 222,907 | ||||||
| 81,155,480 | ||||||||
| Small-Cap 1.1% | ||||||||
| ClearBridge Small Cap Growth Fund, Class IS * | 9,990,306 | 261,253 | ||||||
| 91,145,786 | ||||||||
| International Stocks 1.1% | ||||||||
| Emerging Markets 1.1% | ||||||||
| Goldman Sachs Emerging Markets Equity Insights Fund, Institutional Class | 9,774,218 | 1,426,893 | ||||||
| Fixed Income 14.6% | ||||||||
| Intermediate-Term Bond 10.5% | ||||||||
| Baird Aggregate Bond Fund, Institutional Class | 35,305,494 | 3,788,143 | ||||||
| Loomis Sayles Investment Grade Bond Fund, Class Y | 26,121,867 | 2,775,969 | ||||||
| Western Asset Core Plus Bond Fund, Class I | 33,383,102 | 3,701,009 | ||||||
| 94,810,463 | ||||||||
| International Bond 4.1% | ||||||||
| PIMCO International Bond Fund (U.S. Dollar-Hedged), Institutional Class | 36,412,018 | 3,828,814 | ||||||
| 131,222,481 | ||||||||
| Total
Unaffiliated Underlying Funds (Cost $247,994,990) |
$232,142,485 | |||||||
| Total
Investments in Securities (Cost $829,449,987) |
$894,901,135 | |||||||
| * | Non-income producing security. |
| (a) | Distributions received include distributions from net investment income and capital gains, if any, from the underlying funds. Amounts shown are only presented for affiliated underlying funds, which are presented in the corresponding line-item in the Statement of Operations, if applicable (See financial note 2(d) for additional information). |
| (b) | The rate shown is the annualized 7-day yield. |
| Assets | ||
| Investments in securities, at value - affiliated (cost $581,454,997) | $662,758,650 | |
| Investments in securities, at value - unaffiliated (cost $247,994,990) | 232,142,485 | |
| Cash | 3,716,356 | |
| Receivables: | ||
| Investments sold | 8,192,469 | |
| Dividends | 485,280 | |
| Fund shares sold | 441,032 | |
| Due from investment adviser | 10,975 | |
| Interest | 5,908 | |
| Prepaid expenses | + | 17,481 |
| Total assets | 907,770,636 | |
| Liabilities | ||
| Payables: | ||
| Investments bought | 6,119,831 | |
| Fund shares redeemed | 576,383 | |
| Independent trustees’ fees | 45 | |
| Accrued expenses | + | 67,540 |
| Total liabilities | 6,763,799 | |
| Net assets | $901,006,837 | |
| Net Assets by Source | ||
| Capital received from investors | $794,195,411 | |
| Total distributable earnings | + | 106,811,426 |
| Net assets | $901,006,837 | |
| Net Asset Value (NAV) | ||||
| Net Assets | ÷ | Shares
Outstanding |
= | NAV |
| $901,006,837 | 62,603,231 | $14.39 | ||
| For the period November 1, 2021 through October 31, 2022 | ||
| Investment Income | ||
| Dividends received from securities - affiliated | $12,398,635 | |
| Dividends received from securities - unaffiliated | 4,636,340 | |
| Interest received from securities - unaffiliated | + | 31,262 |
| Total investment income | 17,066,237 | |
| Expenses | ||
| Proxy fees1 | 48,078 | |
| Registration fees | 38,435 | |
| Portfolio accounting fees | 32,845 | |
| Shareholder reports | 24,081 | |
| Professional fees | 23,489 | |
| Independent trustees’ fees | 9,617 | |
| Transfer agent fees | 3,117 | |
| Custodian fees | 1,556 | |
| Other expenses | + | 13,972 |
| Total expenses | 195,190 | |
| Expense reduction | – | 147,112 |
| Net expenses | – | 48,078 |
| Net investment income | 17,018,159 | |
| REALIZED AND UNREALIZED GAINS (LOSSES) | ||
| Realized capital gain distributions received from underlying funds - affiliated | 41,390,737 | |
| Realized capital gain distributions received from underlying funds - unaffiliated | 9,770,261 | |
| Net realized gains on sales of securities - affiliated | 3,725,382 | |
| Net realized losses on sales of securities - unaffiliated | + | (3,082,106) |
| Net realized gains | 51,804,274 | |
| Net change in unrealized appreciation (depreciation) on securities - affiliated | (217,614,652) | |
| Net change in unrealized appreciation (depreciation) on securities - unaffiliated | + | (62,742,341) |
| Net change in unrealized appreciation (depreciation) | + | (280,356,993) |
| Net realized and unrealized losses | (228,552,719) | |
| Decrease in net assets resulting from operations | ($211,534,560) | |
| 1 | Proxy fees are non-routine expenses (see financial note 4 for additional information). |
| OPERATIONS | |||
| 11/1/21-10/31/22 | 11/1/20-10/31/21 | ||
| Net investment income | $17,018,159 | $13,372,126 | |
| Net realized gains | 51,804,274 | 51,402,654 | |
| Net change in unrealized appreciation (depreciation) | + | (280,356,993) | 168,319,075 |
| Increase (decrease) in net assets resulting from operations | ($211,534,560) | $233,093,855 | |
| DISTRIBUTIONS TO SHAREHOLDERS | |||
| Total distributions | ($76,077,422) | ($33,685,506) | |
| TRANSACTIONS IN FUND SHARES | |||||
| 11/1/21-10/31/22 | 11/1/20-10/31/21 | ||||
| SHARES | VALUE | SHARES | VALUE | ||
| Shares sold | 4,812,363 | $80,128,583 | 8,679,574 | $154,456,722 | |
| Shares reinvested | 4,101,491 | 73,252,632 | 1,918,145 | 32,455,024 | |
| Shares redeemed | + | (8,083,930) | (131,152,076) | (10,436,498) | (185,218,592) |
| Net transactions in fund shares | 829,924 | $22,229,139 | 161,221 | $1,693,154 | |
| SHARES OUTSTANDING AND NET ASSETS | |||||
| 11/1/21-10/31/22 | 11/1/20-10/31/21 | ||||
| SHARES | NET ASSETS | SHARES | NET ASSETS | ||
| Beginning of period | 61,773,307 | $1,166,389,680 | 61,612,086 | $965,288,177 | |
| Total increase (decrease) | + | 829,924 | (265,382,843) | 161,221 | 201,101,503 |
| End of period | 62,603,231 | $901,006,837 | 61,773,307 | $1,166,389,680 | |
| 11/1/21–
10/31/22 |
11/1/20–
10/31/21 |
11/1/19–
10/31/20 |
11/1/18–
10/31/19 |
11/1/17–
10/31/18 |
||
| Per-Share Data | ||||||
| Net asset value at beginning of period | $19.05 | $15.34 | $15.46 | $14.94 | $15.58 | |
| Income (loss) from investment operations: | ||||||
| Net investment income (loss)1 | 0.25 | 0.20 | 0.31 | 0.28 | 0.27 | |
| Net realized and unrealized gains (losses) | (3.73) | 3.99 | 0.53 | 1.19 | (0.38) | |
| Total from investment operations | (3.48) | 4.19 | 0.84 | 1.47 | (0.11) | |
| Less distributions: | ||||||
| Distributions from net investment income | (0.48) | (0.24) | (0.34) | (0.36) | (0.39) | |
| Distributions from net realized gains | (0.58) | (0.24) | (0.62) | (0.59) | (0.14) | |
| Total distributions | (1.06) | (0.48) | (0.96) | (0.95) | (0.53) | |
| Net asset value at end of period | $14.51 | $19.05 | $15.34 | $15.46 | $14.94 | |
| Total return | (19.41%) | 27.76% | 5.51% | 10.90% | (0.88%) | |
| Ratios/Supplemental Data | ||||||
| Ratios to average net assets: | ||||||
| Net operating expenses2 | 0.00% 3 | 0.00% | 0.00% | 0.00% | 0.00% 4 | |
| Gross operating expenses2 | 0.03% 3 | 0.02% | 0.03% | 0.03% | 0.03% | |
| Net investment income (loss) | 1.55% | 1.11% | 2.06% | 1.87% | 1.70% | |
| Portfolio turnover rate | 13% | 14% | 12% | 15% | 14% | |
| Net assets, end of period (x 1,000) | $482,594 | $612,195 | $476,911 | $483,191 | $446,711 | |
| 1 | Calculated based on the average shares outstanding during the period. |
| 2 | Ratio excludes acquired fund fees and expenses, which are indirect expenses incurred by the fund through its investments in underlying funds. |
| 3 | Ratio includes less than 0.005% of non-routine proxy expenses. |
| 4 | Less than 0.005%; the ratio of net operating expenses would have been 0.00%, if certain non-routine expenses had not been incurred. |
| SECURITY | VALUE
AT 10/31/21 |
PURCHASES | SALES | REALIZED
GAINS (LOSSES) |
NET
CHANGE IN UNREALIZED APPRECIATION (DEPRECIATION) |
VALUE
AT 10/31/22 |
BALANCE
OF SHARES HELD AT 10/31/22 |
DISTRIBUTIONS
RECEIVED(a) |
| AFFILIATED UNDERLYING FUNDS 75.1% OF NET ASSETS | ||||||||
| U.S. Stocks 37.5% | ||||||||
| Large-Cap 31.9% | ||||||||
| Schwab Core Equity Fund | $41,894,424 | $— | ($10,323,893) | $1,817,068 | ($14,169,209) | $19,218,390 | 987,584 | $9,834,436 |
| Schwab Fundamental US Large Company Index Fund | 7,215,216 | 14,944,082 | — | — | (1,284,007) | 20,875,291 | 985,148 | 341,533 |
| Schwab S&P 500 Index Fund | 118,696,941 | 1,540,010 | (7,484,015) | 870,008 | (18,936,696) | 94,686,248 | 1,577,578 | 1,540,010 |
| Schwab Select Large Cap Growth Fund (formerly Laudus U.S. Large Cap Growth Fund) * | 20,266,768 | 11,594,267 | — | — | (12,575,375) | 19,285,660 | 978,471 | 2,405,545 |
| 154,065,589 | ||||||||
| Mid-Cap 1.6% | ||||||||
| Schwab U.S. Mid-Cap Index Fund | 9,050,934 | 259,028 | — | — | (1,810,989) | 7,498,973 | 144,656 | 259,028 |
| Small-Cap 4.0% | ||||||||
| Schwab Small-Cap Equity Fund | 22,651,391 | 3,239,228 | (1,500,000) | (127,876) | (4,704,565) | 19,558,178 | 1,032,639 | 2,468,020 |
| 181,122,740 | ||||||||
| International Stocks 19.7% | ||||||||
| Developed Markets 19.7% | ||||||||
| Schwab International Core Equity Fund | 41,509,544 | 10,284,573 | — | — | (12,250,664) | 39,543,453 | 4,540,006 | 1,299,415 |
| Schwab International Opportunities Fund (formerly Laudus International MarketMasters Fund) | 80,171,247 | 15,442,256 | — | — | (40,053,990) | 55,559,513 | 3,289,492 | 11,471,562 |
| 95,102,966 | ||||||||
| Real Estate 4.8% | ||||||||
| Global Real Estate 4.8% | ||||||||
| Schwab Global Real Estate Fund | 23,203,409 | 8,280,808 | — | — | (8,198,352) | 23,285,865 | 3,946,757 | 782,792 |
| Fixed Income 11.8% | ||||||||
| Intermediate-Term Bond 8.6% | ||||||||
| Schwab U.S. Aggregate Bond Index Fund | 55,188,599 | 1,116,474 | (5,527,853) | (722,563) | (8,650,829) | 41,403,828 | 4,814,399 | 1,116,122 |
| Short-Term Bond 3.2% | ||||||||
| Schwab Short-Term Bond Index Fund | 19,015,497 | 265,570 | (1,988,311) | (102,702) | (1,440,230) | 15,749,824 | 1,689,895 | 265,483 |
| 57,153,652 | ||||||||
| Money Market Funds 1.3% | ||||||||
| Schwab Variable Share Price Money Fund, Ultra Shares, 3.10% (b) | 6,016,506 | 51,819 | (143) | — | (1,809) | 6,066,373 | 6,066,373 | 59,276 |
| Total
Affiliated Underlying Funds (Cost $336,957,725) |
$444,880,476 | $67,018,115 | ($26,824,215) | $1,733,935 | ($124,076,715) | $362,731,596 | $31,843,222 | |
| SECURITY | VALUE
AT 10/31/21 |
PURCHASES | SALES | REALIZED
GAINS (LOSSES) |
NET
CHANGE IN UNREALIZED APPRECIATION (DEPRECIATION) |
VALUE
AT 10/31/22 |
BALANCE
OF SHARES HELD AT 10/31/22 |
DISTRIBUTIONS
RECEIVED(a) |
| UNAFFILIATED UNDERLYING FUNDS 24.4% OF NET ASSETS | ||||||||
| U.S. Stocks 11.0% | ||||||||
| Large-Cap 9.8% | ||||||||
| ClearBridge Large Cap Growth Fund, Class IS * | $19,979,005 | 391,668 | ||||||
| Dodge & Cox Stock Fund, Class I | 27,007,538 | 122,383 | ||||||
| 46,986,543 | ||||||||
| Small-Cap 1.2% | ||||||||
| ClearBridge Small Cap Growth Fund, Class IS * | 5,889,946 | 154,026 | ||||||
| 52,876,489 | ||||||||
| International Stocks 1.8% | ||||||||
| Emerging Markets 1.8% | ||||||||
| Goldman Sachs Emerging Markets Equity Insights Fund, Institutional Class | 8,595,503 | 1,254,818 | ||||||
| Fixed Income 11.6% | ||||||||
| Intermediate-Term Bond 8.1% | ||||||||
| Baird Aggregate Bond Fund, Institutional Class | 10,387,732 | 1,114,564 | ||||||
| Loomis Sayles Investment Grade Bond Fund, Class Y | 15,197,342 | 1,615,020 | ||||||
| Western Asset Core Plus Bond Fund, Class I | 13,645,902 | 1,512,849 | ||||||
| 39,230,976 | ||||||||
| International Bond 3.5% | ||||||||
| PIMCO International Bond Fund (U.S. Dollar-Hedged), Institutional Class | 16,909,466 | 1,778,072 | ||||||
| 56,140,442 | ||||||||
| Total
Unaffiliated Underlying Funds (Cost $126,795,860) |
$117,612,434 | |||||||
| Total
Investments in Securities (Cost $463,753,585) |
$480,344,030 | |||||||
| * | Non-income producing security. |
| (a) | Distributions received include distributions from net investment income and capital gains, if any, from the underlying funds. Amounts shown are only presented for affiliated underlying funds, which are presented in the corresponding line-item in the Statement of Operations, if applicable (See financial note 2(d) for additional information). |
| (b) | The rate shown is the annualized 7-day yield. |
| Assets | ||
| Investments in securities, at value - affiliated (cost $336,957,725) | $362,731,596 | |
| Investments in securities, at value - unaffiliated (cost $126,795,860) | 117,612,434 | |
| Cash | 1,379,946 | |
| Receivables: | ||
| Investments sold | 5,204,066 | |
| Fund shares sold | 422,229 | |
| Dividends | 198,038 | |
| Due from investment adviser | 10,654 | |
| Interest | 2,114 | |
| Prepaid expenses | + | 9,517 |
| Total assets | 487,570,594 | |
| Liabilities | ||
| Payables: | ||
| Investments bought | 4,345,448 | |
| Fund shares redeemed | 574,615 | |
| Independent trustees’ fees | 39 | |
| Accrued expenses | + | 56,748 |
| Total liabilities | 4,976,850 | |
| Net assets | $482,593,744 | |
| Net Assets by Source | ||
| Capital received from investors | $440,113,716 | |
| Total distributable earnings | + | 42,480,028 |
| Net assets | $482,593,744 | |
| Net Asset Value (NAV) | ||||
| Net Assets | ÷ | Shares
Outstanding |
= | NAV |
| $482,593,744 | 33,250,024 | $14.51 | ||
| For the period November 1, 2021 through October 31, 2022 | ||
| Investment Income | ||
| Dividends received from securities - affiliated | $6,243,748 | |
| Dividends received from securities - unaffiliated | 2,288,055 | |
| Interest received from securities - unaffiliated | + | 11,825 |
| Total investment income | 8,543,628 | |
| Expenses | ||
| Registration fees | 31,784 | |
| Portfolio accounting fees | 27,202 | |
| Proxy fees1 | 25,464 | |
| Professional fees | 22,543 | |
| Shareholder reports | 15,399 | |
| Independent trustees’ fees | 8,268 | |
| Transfer agent fees | 6,399 | |
| Custodian fees | 1,438 | |
| Other expenses | + | 9,571 |
| Total expenses | 148,068 | |
| Expense reduction | – | 122,604 |
| Net expenses | – | 25,464 |
| Net investment income | 8,518,164 | |
| REALIZED AND UNREALIZED GAINS (LOSSES) | ||
| Realized capital gain distributions received from underlying funds - affiliated | 25,599,474 | |
| Realized capital gain distributions received from underlying funds - unaffiliated | 6,283,526 | |
| Net realized gains on sales of securities - affiliated | 1,733,935 | |
| Net realized losses on sales of securities - unaffiliated | + | (1,292,213) |
| Net realized gains | 32,324,722 | |
| Net change in unrealized appreciation (depreciation) on securities - affiliated | (124,076,715) | |
| Net change in unrealized appreciation (depreciation) on securities - unaffiliated | + | (35,211,916) |
| Net change in unrealized appreciation (depreciation) | + | (159,288,631) |
| Net realized and unrealized losses | (126,963,909) | |
| Decrease in net assets resulting from operations | ($118,445,745) | |
| 1 | Proxy fees are non-routine expenses (see financial note 4 for additional information). |
| OPERATIONS | |||
| 11/1/21-10/31/22 | 11/1/20-10/31/21 | ||
| Net investment income | $8,518,164 | $6,365,426 | |
| Net realized gains | 32,324,722 | 20,324,363 | |
| Net change in unrealized appreciation (depreciation) | + | (159,288,631) | 106,391,162 |
| Increase (decrease) in net assets resulting from operations | ($118,445,745) | $133,080,951 | |
| DISTRIBUTIONS TO SHAREHOLDERS | |||
| Total distributions | ($34,334,971) | ($15,121,800) | |
| TRANSACTIONS IN FUND SHARES | |||||
| 11/1/21-10/31/22 | 11/1/20-10/31/21 | ||||
| SHARES | VALUE | SHARES | VALUE | ||
| Shares sold | 3,692,487 | $62,406,093 | 5,580,980 | $98,912,959 | |
| Shares reinvested | 1,828,575 | 33,316,650 | 875,675 | 14,737,609 | |
| Shares redeemed | + | (4,400,937) | (72,542,793) | (5,406,863) | (96,325,760) |
| Net transactions in fund shares | 1,120,125 | $23,179,950 | 1,049,792 | $17,324,808 | |
| SHARES OUTSTANDING AND NET ASSETS | |||||
| 11/1/21-10/31/22 | 11/1/20-10/31/21 | ||||
| SHARES | NET ASSETS | SHARES | NET ASSETS | ||
| Beginning of period | 32,129,899 | $612,194,510 | 31,080,107 | $476,910,551 | |
| Total increase (decrease) | + | 1,120,125 | (129,600,766) | 1,049,792 | 135,283,959 |
| End of period | 33,250,024 | $482,593,744 | 32,129,899 | $612,194,510 | |
| 11/1/21–
10/31/22 |
11/1/20–
10/31/21 |
11/1/19–
10/31/20 |
11/1/18–
10/31/19 |
11/1/17–
10/31/18 |
||
| Per-Share Data | ||||||
| Net asset value at beginning of period | $20.52 | $16.24 | $16.61 | $16.27 | $17.14 | |
| Income (loss) from investment operations: | ||||||
| Net investment income (loss)1 | 0.26 | 0.20 | 0.32 | 0.28 | 0.28 | |
| Net realized and unrealized gains (losses) | (4.10) | 4.68 | 0.56 | 1.28 | (0.45) | |
| Total from investment operations | (3.84) | 4.88 | 0.88 | 1.56 | (0.17) | |
| Less distributions: | ||||||
| Distributions from net investment income | (0.54) | (0.24) | (0.35) | (0.39) | (0.44) | |
| Distributions from net realized gains | (0.81) | (0.36) | (0.90) | (0.83) | (0.26) | |
| Total distributions | (1.35) | (0.60) | (1.25) | (1.22) | (0.70) | |
| Net asset value at end of period | $15.33 | $20.52 | $16.24 | $16.61 | $16.27 | |
| Total return | (20.10%) | 30.57% | 5.31% | 10.90% | (1.17%) | |
| Ratios/Supplemental Data | ||||||
| Ratios to average net assets: | ||||||
| Net operating expenses2 | 0.00% 3 | 0.00% | 0.00% | 0.00% | 0.00% 4 | |
| Gross operating expenses2 | 0.02% 3 | 0.01% | 0.02% | 0.02% | 0.02% | |
| Net investment income (loss) | 1.49% | 1.05% | 2.01% | 1.78% | 1.65% | |
| Portfolio turnover rate | 10% | 14% | 10% | 15% | 17% | |
| Net assets, end of period (x 1,000) | $959,722 | $1,235,538 | $985,325 | $1,011,558 | $961,899 | |
| 1 | Calculated based on the average shares outstanding during the period. |
| 2 | Ratio excludes acquired fund fees and expenses, which are indirect expenses incurred by the fund through its investments in underlying funds. |
| 3 | Ratio includes less than 0.005% of non-routine proxy expenses. |
| 4 | Less than 0.005%; the ratio of net operating expenses would have been 0.00%, if certain non-routine expenses had not been incurred. |
| SECURITY | VALUE
AT 10/31/21 |
PURCHASES | SALES | REALIZED
GAINS (LOSSES) |
NET
CHANGE IN UNREALIZED APPRECIATION (DEPRECIATION) |
VALUE
AT 10/31/22 |
BALANCE
OF SHARES HELD AT 10/31/22 |
DISTRIBUTIONS
RECEIVED(a) |
| AFFILIATED UNDERLYING FUNDS 75.9% OF NET ASSETS | ||||||||
| U.S. Stocks 40.5% | ||||||||
| Large-Cap 34.3% | ||||||||
| Schwab Core Equity Fund | $91,261,565 | $— | ($22,738,550) | $5,908,447 | ($32,932,221) | $41,499,241 | 2,132,541 | $21,423,043 |
| Schwab Fundamental US Large Company Index Fund | 21,802,800 | 22,053,362 | — | — | (3,204,138) | 40,652,024 | 1,918,453 | 1,032,037 |
| Schwab S&P 500 Index Fund | 246,182,829 | 3,194,050 | (8,700,000) | 432,627 | (38,969,214) | 202,140,292 | 3,367,882 | 3,194,050 |
| Schwab Select Large Cap Growth Fund (formerly Laudus U.S. Large Cap Growth Fund) * | 58,761,596 | 18,186,555 | — | — | (31,772,368) | 45,175,783 | 2,292,023 | 6,974,652 |
| 329,467,340 | ||||||||
| Mid-Cap 1.7% | ||||||||
| Schwab U.S. Mid-Cap Index Fund | 18,965,177 | 542,762 | — | — | (3,794,715) | 15,713,224 | 303,110 | 542,762 |
| Small-Cap 4.5% | ||||||||
| Schwab Small-Cap Equity Fund | 53,945,780 | 5,877,752 | (4,750,000) | (650,588) | (10,997,733) | 43,425,211 | 2,292,778 | 5,877,752 |
| 388,605,775 | ||||||||
| International Stocks 21.3% | ||||||||
| Developed Markets 21.3% | ||||||||
| Schwab International Core Equity Fund | 95,031,438 | 14,047,576 | — | — | (26,040,322) | 83,038,692 | 9,533,719 | 2,673,222 |
| Schwab International Opportunities Fund (formerly Laudus International MarketMasters Fund) | 174,075,204 | 34,671,003 | — | — | (87,319,701) | 121,426,506 | 7,189,254 | 24,908,114 |
| 204,465,198 | ||||||||
| Real Estate 5.3% | ||||||||
| Global Real Estate 5.3% | ||||||||
| Schwab Global Real Estate Fund | 51,681,449 | 17,580,113 | — | — | (18,046,496) | 51,215,066 | 8,680,520 | 1,720,968 |
| Fixed Income 8.3% | ||||||||
| Intermediate-Term Bond 6.1% | ||||||||
| Schwab U.S. Aggregate Bond Index Fund | 75,697,757 | 1,562,542 | (5,779,804) | (792,854) | (12,261,313) | 58,426,328 | 6,793,759 | 1,562,051 |
| Short-Term Bond 2.2% | ||||||||
| Schwab Short-Term Bond Index Fund | 26,529,002 | 360,353 | (3,757,024) | (151,023) | (1,922,130) | 21,059,178 | 2,259,568 | 360,238 |
| 79,485,506 | ||||||||
| Money Market Funds 0.5% | ||||||||
| Schwab Variable Share Price Money Fund, Ultra Shares, 3.10% (b) | 4,878,097 | 42,014 | (116) | — | (1,466) | 4,918,529 | 4,918,529 | 48,061 |
| Total
Affiliated Underlying Funds (Cost $624,999,475) |
$918,812,694 | $118,118,082 | ($45,725,494) | $4,746,609 | ($267,261,817) | $728,690,074 | $70,316,950 | |
| SECURITY | VALUE
AT 10/31/21 |
PURCHASES | SALES | REALIZED
GAINS (LOSSES) |
NET
CHANGE IN UNREALIZED APPRECIATION (DEPRECIATION) |
VALUE
AT 10/31/22 |
BALANCE
OF SHARES HELD AT 10/31/22 |
DISTRIBUTIONS
RECEIVED(a) |
| UNAFFILIATED UNDERLYING FUNDS 23.4% OF NET ASSETS | ||||||||
| U.S. Stocks 12.6% | ||||||||
| Large-Cap 10.9% | ||||||||
| ClearBridge Large Cap Growth Fund, Class IS * | $40,924,172 | 802,277 | ||||||
| Dodge & Cox Stock Fund, Class I | 62,943,069 | 285,223 | ||||||
| 103,867,241 | ||||||||
| Small-Cap 1.7% | ||||||||
| ClearBridge Small Cap Growth Fund, Class IS * | 16,447,673 | 430,117 | ||||||
| 120,314,914 | ||||||||
| International Stocks 2.7% | ||||||||
| Emerging Markets 2.7% | ||||||||
| Goldman Sachs Emerging Markets Equity Insights Fund, Institutional Class | 26,056,843 | 3,803,919 | ||||||
| Fixed Income 8.1% | ||||||||
| Intermediate-Term Bond 5.6% | ||||||||
| Baird Aggregate Bond Fund, Institutional Class | 9,014,164 | 967,185 | ||||||
| Loomis Sayles Investment Grade Bond Fund, Class Y | 28,461,003 | 3,024,549 | ||||||
| Western Asset Core Plus Bond Fund, Class I | 16,560,801 | 1,836,009 | ||||||
| 54,035,968 | ||||||||
| International Bond 2.5% | ||||||||
| PIMCO International Bond Fund (U.S. Dollar-Hedged), Institutional Class | 23,904,493 | 2,513,617 | ||||||
| 77,940,461 | ||||||||
| Total
Unaffiliated Underlying Funds (Cost $240,004,289) |
$224,312,218 | |||||||
| Total
Investments in Securities (Cost $865,003,764) |
$953,002,292 | |||||||
| * | Non-income producing security. |
| (a) | Distributions received include distributions from net investment income and capital gains, if any, from the underlying funds. Amounts shown are only presented for affiliated underlying funds, which are presented in the corresponding line-item in the Statement of Operations, if applicable (See financial note 2(d) for additional information). |
| (b) | The rate shown is the annualized 7-day yield. |
| Assets | ||
| Investments in securities, at value - affiliated (cost $624,999,475) | $728,690,074 | |
| Investments in securities, at value - unaffiliated (cost $240,004,289) | 224,312,218 | |
| Cash | 5,706,746 | |
| Receivables: | ||
| Investments sold | 1,700,000 | |
| Fund shares sold | 328,922 | |
| Dividends | 267,674 | |
| Due from investment adviser | 10,664 | |
| Interest | 7,836 | |
| Prepaid expenses | + | 15,921 |
| Total assets | 961,040,055 | |
| Liabilities | ||
| Payables: | ||
| Fund shares redeemed | 981,142 | |
| Investments bought | 262,653 | |
| Independent trustees’ fees | 46 | |
| Accrued expenses | + | 74,385 |
| Total liabilities | 1,318,226 | |
| Net assets | $959,721,829 | |
| Net Assets by Source | ||
| Capital received from investors | $816,097,710 | |
| Total distributable earnings | + | 143,624,119 |
| Net assets | $959,721,829 | |
| Net Asset Value (NAV) | ||||
| Net Assets | ÷ | Shares
Outstanding |
= | NAV |
| $959,721,829 | 62,613,531 | $15.33 | ||
| For the period November 1, 2021 through October 31, 2022 | ||
| Investment Income | ||
| Dividends received from securities - affiliated | $12,284,603 | |
| Dividends received from securities - unaffiliated | 4,057,653 | |
| Interest received from securities - unaffiliated | + | 34,375 |
| Total investment income | 16,376,631 | |
| Expenses | ||
| Proxy fees1 | 50,877 | |
| Registration fees | 34,967 | |
| Portfolio accounting fees | 33,570 | |
| Shareholder reports | 29,264 | |
| Professional fees | 23,603 | |
| Independent trustees’ fees | 9,787 | |
| Transfer agent fees | 4,031 | |
| Custodian fees | 1,278 | |
| Other expenses | + | 14,596 |
| Total expenses | 201,973 | |
| Expense reduction | – | 151,096 |
| Net expenses | – | 50,877 |
| Net investment income | 16,325,754 | |
| REALIZED AND UNREALIZED GAINS (LOSSES) | ||
| Realized capital gain distributions received from underlying funds - affiliated | 58,032,347 | |
| Realized capital gain distributions received from underlying funds - unaffiliated | 13,733,859 | |
| Net realized gains on sales of securities - affiliated | 4,746,609 | |
| Net realized losses on sales of securities - unaffiliated | + | (1,831,953) |
| Net realized gains | 74,680,862 | |
| Net change in unrealized appreciation (depreciation) on securities - affiliated | (267,261,817) | |
| Net change in unrealized appreciation (depreciation) on securities - unaffiliated | + | (70,063,178) |
| Net change in unrealized appreciation (depreciation) | + | (337,324,995) |
| Net realized and unrealized losses | (262,644,133) | |
| Decrease in net assets resulting from operations | ($246,318,379) | |
| 1 | Proxy fees are non-routine expenses (see financial note 4 for additional information). |
| OPERATIONS | |||
| 11/1/21-10/31/22 | 11/1/20-10/31/21 | ||
| Net investment income | $16,325,754 | $12,284,342 | |
| Net realized gains | 74,680,862 | 51,396,989 | |
| Net change in unrealized appreciation (depreciation) | + | (337,324,995) | 234,058,424 |
| Increase (decrease) in net assets resulting from operations | ($246,318,379) | $297,739,755 | |
| DISTRIBUTIONS TO SHAREHOLDERS | |||
| Total distributions | ($81,174,869) | ($36,450,563) | |
| TRANSACTIONS IN FUND SHARES | |||||
| 11/1/21-10/31/22 | 11/1/20-10/31/21 | ||||
| SHARES | VALUE | SHARES | VALUE | ||
| Shares sold | 4,935,695 | $87,389,811 | 7,151,395 | $135,282,209 | |
| Shares reinvested | 4,103,345 | 79,686,963 | 1,997,627 | 35,757,521 | |
| Shares redeemed | + | (6,646,804) | (115,399,889) | (9,615,839) | (182,116,086) |
| Net transactions in fund shares | 2,392,236 | $51,676,885 | (466,817) | ($11,076,356) | |
| SHARES OUTSTANDING AND NET ASSETS | |||||
| 11/1/21-10/31/22 | 11/1/20-10/31/21 | ||||
| SHARES | NET ASSETS | SHARES | NET ASSETS | ||
| Beginning of period | 60,221,295 | $1,235,538,192 | 60,688,112 | $985,325,356 | |
| Total increase (decrease) | + | 2,392,236 | (275,816,363) | (466,817) | 250,212,836 |
| End of period | 62,613,531 | $959,721,829 | 60,221,295 | $1,235,538,192 | |
| 11/1/21–
10/31/22 |
11/1/20–
10/31/21 |
11/1/19–
10/31/20 |
11/1/18–
10/31/19 |
11/1/17–
10/31/18 |
||
| Per-Share Data | ||||||
| Net asset value at beginning of period | $17.97 | $13.83 | $13.88 | $13.35 | $13.92 | |
| Income (loss) from investment operations: | ||||||
| Net investment income (loss)1 | 0.22 | 0.16 | 0.25 | 0.22 | 0.21 | |
| Net realized and unrealized gains (losses) | (3.76) | 4.36 | 0.46 | 1.09 | (0.39) | |
| Total from investment operations | (3.54) | 4.52 | 0.71 | 1.31 | (0.18) | |
| Less distributions: | ||||||
| Distributions from net investment income | (0.49) | (0.18) | (0.28) | (0.31) | (0.36) | |
| Distributions from net realized gains | (0.40) | (0.20) | (0.48) | (0.47) | (0.03) | |
| Total distributions | (0.89) | (0.38) | (0.76) | (0.78) | (0.39) | |
| Net asset value at end of period | $13.54 | $17.97 | $13.83 | $13.88 | $13.35 | |
| Total return | (20.76%) | 33.13% | 5.10% | 10.91% | (1.43%) | |
| Ratios/Supplemental Data | ||||||
| Ratios to average net assets: | ||||||
| Net operating expenses2 | 0.00% 3 | 0.00% | 0.00% | 0.00% | 0.00% 4 | |
| Gross operating expenses2 | 0.05% 3 | 0.04% | 0.05% | 0.08% | 0.06% | |
| Net investment income (loss) | 1.46% | 0.96% | 1.87% | 1.65% | 1.52% | |
| Portfolio turnover rate | 7% | 12% | 6% | 8% | 12% | |
| Net assets, end of period (x 1,000) | $206,203 | $252,294 | $177,992 | $162,017 | $138,813 | |
| 1 | Calculated based on the average shares outstanding during the period. |
| 2 | Ratio excludes acquired fund fees and expenses, which are indirect expenses incurred by the fund through its investments in underlying funds. |
| 3 | Ratio includes less than 0.005% of non-routine proxy expenses. |
| 4 | Less than 0.005%; the ratio of net operating expenses would have been 0.00%, if certain non-routine expenses had not been incurred. |
| SECURITY | VALUE
AT 10/31/21 |
PURCHASES | SALES | REALIZED
GAINS (LOSSES) |
NET
CHANGE IN UNREALIZED APPRECIATION (DEPRECIATION) |
VALUE
AT 10/31/22 |
BALANCE
OF SHARES HELD AT 10/31/22 |
DISTRIBUTIONS
RECEIVED(a) |
| AFFILIATED UNDERLYING FUNDS 77.6% OF NET ASSETS | ||||||||
| U.S. Stocks 43.9% | ||||||||
| Large-Cap 36.7% | ||||||||
| Schwab Core Equity Fund | $19,914,426 | $— | ($4,845,615) | $137,455 | ($6,057,734) | $9,148,532 | 470,120 | $4,674,778 |
| Schwab Fundamental US Large Company Index Fund | 6,691,733 | 4,440,638 | — | — | (810,815) | 10,321,556 | 487,096 | 316,754 |
| Schwab S&P 500 Index Fund | 50,570,503 | 656,117 | (400,000) | (49,384) | (7,981,258) | 42,795,978 | 713,029 | 656,117 |
| Schwab Select Large Cap Growth Fund (formerly Laudus U.S. Large Cap Growth Fund) * | 15,029,286 | 7,027,605 | — | — | (8,599,145) | 13,457,746 | 682,788 | 1,783,887 |
| 75,723,812 | ||||||||
| Mid-Cap 1.7% | ||||||||
| Schwab U.S. Mid-Cap Index Fund | 4,191,025 | 119,942 | — | — | (838,576) | 3,472,391 | 66,983 | 119,942 |
| Small-Cap 5.5% | ||||||||
| Schwab Small-Cap Equity Fund | 12,082,130 | 1,844,224 | — | — | (2,580,857) | 11,345,497 | 599,023 | 1,316,429 |
| 90,541,700 | ||||||||
| International Stocks 23.1% | ||||||||
| Developed Markets 23.1% | ||||||||
| Schwab International Core Equity Fund | 22,705,478 | 2,323,952 | — | — | (6,078,324) | 18,951,106 | 2,175,787 | 643,952 |
| Schwab International Opportunities Fund (formerly Laudus International MarketMasters Fund) | 37,401,355 | 10,789,802 | — | — | (19,426,876) | 28,764,281 | 1,703,036 | 5,478,467 |
| 47,715,387 | ||||||||
| Real Estate 5.7% | ||||||||
| Global Real Estate 5.7% | ||||||||
| Schwab Global Real Estate Fund | 11,378,442 | 4,659,841 | — | — | (4,219,649) | 11,818,634 | 2,003,158 | 396,915 |
| Fixed Income 4.7% | ||||||||
| Intermediate-Term Bond 3.4% | ||||||||
| Schwab U.S. Aggregate Bond Index Fund | 9,548,183 | 183,657 | (1,270,000) | (83,922) | (1,451,172) | 6,926,746 | 805,436 | 183,595 |
| Short-Term Bond 1.3% | ||||||||
| Schwab Short-Term Bond Index Fund | 3,248,739 | 47,876 | (329,999) | (36,462) | (243,099) | 2,687,055 | 288,311 | 47,863 |
| 9,613,801 | ||||||||
| Money Market Funds 0.2% | ||||||||
| Schwab Variable Share Price Money Fund, Ultra Shares, 3.10% (b) | 425,417 | 3,664 | (10) | — | (128) | 428,943 | 428,943 | 4,191 |
| Total
Affiliated Underlying Funds (Cost $162,776,180) |
$193,186,717 | $32,097,318 | ($6,845,624) | ($32,313) | ($58,287,633) | $160,118,465 | $15,622,890 | |
| SECURITY | VALUE
AT 10/31/21 |
PURCHASES | SALES | REALIZED
GAINS (LOSSES) |
NET
CHANGE IN UNREALIZED APPRECIATION (DEPRECIATION) |
VALUE
AT 10/31/22 |
BALANCE
OF SHARES HELD AT 10/31/22 |
DISTRIBUTIONS
RECEIVED(a) |
| UNAFFILIATED UNDERLYING FUNDS 21.7% OF NET ASSETS | ||||||||
| U.S. Stocks 12.1% | ||||||||
| Large-Cap 10.4% | ||||||||
| ClearBridge Large Cap Growth Fund, Class IS * | $7,049,467 | 138,198 | ||||||
| Dodge & Cox Stock Fund, Class I | 14,361,388 | 65,078 | ||||||
| 21,410,855 | ||||||||
| Small-Cap 1.7% | ||||||||
| ClearBridge Small Cap Growth Fund, Class IS * | 3,453,020 | 90,299 | ||||||
| 24,863,875 | ||||||||
| International Stocks 3.4% | ||||||||
| Emerging Markets 3.4% | ||||||||
| Goldman Sachs Emerging Markets Equity Insights Fund, Institutional Class | 6,952,100 | 1,014,905 | ||||||
| Fixed Income 6.2% | ||||||||
| Intermediate-Term Bond 4.5% | ||||||||
| Baird Aggregate Bond Fund, Institutional Class | 1,892,739 | 203,084 | ||||||
| Loomis Sayles Investment Grade Bond Fund, Class Y | 5,319,276 | 565,279 | ||||||
| Western Asset Core Plus Bond Fund, Class I | 2,161,547 | 239,639 | ||||||
| 9,373,562 | ||||||||
| International Bond 1.7% | ||||||||
| PIMCO International Bond Fund (U.S. Dollar-Hedged), Institutional Class | 3,505,098 | 368,570 | ||||||
| 12,878,660 | ||||||||
| Total
Unaffiliated Underlying Funds (Cost $48,251,531) |
$44,694,635 | |||||||
| Total
Investments in Securities (Cost $211,027,711) |
$204,813,100 | |||||||
| * | Non-income producing security. |
| (a) | Distributions received include distributions from net investment income and capital gains, if any, from the underlying funds. Amounts shown are only presented for affiliated underlying funds, which are presented in the corresponding line-item in the Statement of Operations, if applicable (See financial note 2(d) for additional information). |
| (b) | The rate shown is the annualized 7-day yield. |
| Assets | ||
| Investments in securities, at value - affiliated (cost $162,776,180) | $160,118,465 | |
| Investments in securities, at value - unaffiliated (cost $48,251,531) | 44,694,635 | |
| Cash | 974,743 | |
| Receivables: | ||
| Investments sold | 330,000 | |
| Fund shares sold | 294,659 | |
| Dividends | 33,986 | |
| Due from investment adviser | 9,294 | |
| Interest | 1,594 | |
| Prepaid expenses | + | 5,936 |
| Total assets | 206,463,312 | |
| Liabilities | ||
| Payables: | ||
| Fund shares redeemed | 175,989 | |
| Investments bought | 33,619 | |
| Independent trustees’ fees | 35 | |
| Accrued expenses | + | 50,470 |
| Total liabilities | 260,113 | |
| Net assets | $206,203,199 | |
| Net Assets by Source | ||
| Capital received from investors | $199,945,725 | |
| Total distributable earnings | + | 6,257,474 |
| Net assets | $206,203,199 | |
| Net Asset Value (NAV) | ||||
| Net Assets | ÷ | Shares
Outstanding |
= | NAV |
| $206,203,199 | 15,231,148 | $13.54 | ||
| For the period November 1, 2021 through October 31, 2022 | ||
| Investment Income | ||
| Dividends received from securities - affiliated | $2,575,016 | |
| Dividends received from securities - unaffiliated | 781,488 | |
| Interest received from securities - unaffiliated | + | 7,421 |
| Total investment income | 3,363,925 | |
| Expenses | ||
| Registration fees | 26,605 | |
| Portfolio accounting fees | 23,382 | |
| Professional fees | 21,919 | |
| Shareholder reports | 11,421 | |
| Proxy fees1 | 10,587 | |
| Independent trustees’ fees | 7,383 | |
| Transfer agent fees | 3,309 | |
| Custodian fees | 1,649 | |
| Other expenses | + | 6,552 |
| Total expenses | 112,807 | |
| Expense reduction | – | 102,220 |
| Net expenses | – | 10,587 |
| Net investment income | 3,353,338 | |
| REALIZED AND UNREALIZED GAINS (LOSSES) | ||
| Realized capital gain distributions received from underlying funds - affiliated | 13,047,874 | |
| Realized capital gain distributions received from underlying funds - unaffiliated | 3,152,671 | |
| Net realized losses on sales of securities - affiliated | (32,313) | |
| Net realized losses on sales of securities - unaffiliated | + | (360,904) |
| Net realized gains | 15,807,328 | |
| Net change in unrealized appreciation (depreciation) on securities - affiliated | (58,287,633) | |
| Net change in unrealized appreciation (depreciation) on securities - unaffiliated | + | (14,314,504) |
| Net change in unrealized appreciation (depreciation) | + | (72,602,137) |
| Net realized and unrealized losses | (56,794,809) | |
| Decrease in net assets resulting from operations | ($53,441,471) | |
| 1 | Proxy fees are non-routine expenses (see financial note 4 for additional information). |
| OPERATIONS | |||
| 11/1/21-10/31/22 | 11/1/20-10/31/21 | ||
| Net investment income | $3,353,338 | $2,164,292 | |
| Net realized gains | 15,807,328 | 5,977,920 | |
| Net change in unrealized appreciation (depreciation) | + | (72,602,137) | 51,929,106 |
| Increase (decrease) in net assets resulting from operations | ($53,441,471) | $60,071,318 | |
| DISTRIBUTIONS TO SHAREHOLDERS | |||
| Total distributions | ($12,672,803) | ($4,963,016) | |
| TRANSACTIONS IN FUND SHARES | |||||
| 11/1/21-10/31/22 | 11/1/20-10/31/21 | ||||
| SHARES | VALUE | SHARES | VALUE | ||
| Shares sold | 2,459,577 | $38,547,342 | 3,403,163 | $56,732,083 | |
| Shares reinvested | 714,175 | 12,369,502 | 312,568 | 4,851,051 | |
| Shares redeemed | + | (1,981,375) | (30,893,311) | (2,547,667) | (42,389,208) |
| Net transactions in fund shares | 1,192,377 | $20,023,533 | 1,168,064 | $19,193,926 | |
| SHARES OUTSTANDING AND NET ASSETS | |||||
| 11/1/21-10/31/22 | 11/1/20-10/31/21 | ||||
| SHARES | NET ASSETS | SHARES | NET ASSETS | ||
| Beginning of period | 14,038,771 | $252,293,940 | 12,870,707 | $177,991,712 | |
| Total increase (decrease) | + | 1,192,377 | (46,090,741) | 1,168,064 | 74,302,228 |
| End of period | 15,231,148 | $206,203,199 | 14,038,771 | $252,293,940 | |
| 11/1/21–
10/31/22 |
11/1/20–
10/31/21 |
11/1/19–
10/31/20 |
11/1/18–
10/31/19 |
11/1/17–
10/31/18 |
||
| Per-Share Data | ||||||
| Net asset value at beginning of period | $18.48 | $14.03 | $14.03 | $13.49 | $14.07 | |
| Income (loss) from investment operations: | ||||||
| Net investment income (loss)1 | 0.22 | 0.16 | 0.25 | 0.21 | 0.21 | |
| Net realized and unrealized gains (losses) | (3.90) | 4.66 | 0.45 | 1.11 | (0.41) | |
| Total from investment operations | (3.68) | 4.82 | 0.70 | 1.32 | (0.20) | |
| Less distributions: | ||||||
| Distributions from net investment income | (0.53) | (0.17) | (0.27) | (0.31) | (0.36) | |
| Distributions from net realized gains | (0.53) | (0.20) | (0.43) | (0.47) | (0.02) | |
| Total distributions | (1.06) | (0.37) | (0.70) | (0.78) | (0.38) | |
| Net asset value at end of period | $13.74 | $18.48 | $14.03 | $14.03 | $13.49 | |
| Total return | (21.22%) | 34.83% | 4.96% | 10.87% | (1.50%) | |
| Ratios/Supplemental Data | ||||||
| Ratios to average net assets: | ||||||
| Net operating expenses2 | 0.00% 3 | 0.00% | 0.00% | 0.00% | 0.00% 4 | |
| Gross operating expenses2 | 0.05% 3 | 0.04% | 0.06% | 0.08% | 0.07% | |
| Net investment income (loss) | 1.44% | 0.93% | 1.83% | 1.54% | 1.45% | |
| Portfolio turnover rate | 6% | 19% | 5% | 7% | 10% | |
| Net assets, end of period (x 1,000) | $203,896 | $245,059 | $181,391 | $161,003 | $122,459 | |
| 1 | Calculated based on the average shares outstanding during the period. |
| 2 | Ratio excludes acquired fund fees and expenses, which are indirect expenses incurred by the fund through its investments in underlying funds. |
| 3 | Ratio includes less than 0.005% of non-routine proxy expenses. |
| 4 | Less than 0.005%; the ratio of net operating expenses would have been 0.00%, if certain non-routine expenses had not been incurred. |
| SECURITY | VALUE
AT 10/31/21 |
PURCHASES | SALES | REALIZED
GAINS (LOSSES) |
NET
CHANGE IN UNREALIZED APPRECIATION (DEPRECIATION) |
VALUE
AT 10/31/22 |
BALANCE
OF SHARES HELD AT 10/31/22 |
DISTRIBUTIONS
RECEIVED(a) |
| AFFILIATED UNDERLYING FUNDS 79.5% OF NET ASSETS | ||||||||
| U.S. Stocks 45.3% | ||||||||
| Large-Cap 37.7% | ||||||||
| Schwab Core Equity Fund | $20,714,110 | $— | ($5,228,355) | $157,179 | ($6,286,788) | $9,356,146 | 480,789 | $4,862,499 |
| Schwab Fundamental US Large Company Index Fund | 7,501,204 | 4,338,486 | — | — | (901,805) | 10,937,885 | 516,181 | 355,069 |
| Schwab S&P 500 Index Fund | 49,586,015 | 643,345 | (1,190,000) | (124,119) | (7,703,572) | 41,211,669 | 686,632 | 643,345 |
| Schwab Select Large Cap Growth Fund (formerly Laudus U.S. Large Cap Growth Fund) * | 16,862,105 | 8,078,331 | — | — | (9,633,666) | 15,306,770 | 776,599 | 2,001,431 |
| 76,812,470 | ||||||||
| Mid-Cap 1.7% | ||||||||
| Schwab U.S. Mid-Cap Index Fund | 3,962,121 | 392,226 | — | — | (823,331) | 3,531,016 | 68,114 | 113,391 |
| Small-Cap 5.9% | ||||||||
| Schwab Small-Cap Equity Fund | 12,824,393 | 1,877,303 | — | — | (2,724,169) | 11,977,527 | 632,393 | 1,397,303 |
| 92,321,013 | ||||||||
| International Stocks 24.6% | ||||||||
| Developed Markets 24.6% | ||||||||
| Schwab International Core Equity Fund | 22,597,338 | 4,180,268 | — | — | (6,353,624) | 20,423,982 | 2,344,889 | 655,269 |
| Schwab International Opportunities Fund (formerly Laudus International MarketMasters Fund) | 38,092,718 | 11,440,451 | — | — | (19,896,601) | 29,636,568 | 1,754,681 | 5,549,543 |
| 50,060,550 | ||||||||
| Real Estate 6.1% | ||||||||
| Global Real Estate 6.1% | ||||||||
| Schwab Global Real Estate Fund | 11,579,737 | 5,344,429 | (200,000) | (31,841) | (4,270,425) | 12,421,900 | 2,105,407 | 406,604 |
| Fixed Income 3.5% | ||||||||
| Intermediate-Term Bond 2.7% | ||||||||
| Schwab U.S. Aggregate Bond Index Fund | 6,018,149 | 1,090,265 | (440,000) | (36,924) | (1,042,988) | 5,588,502 | 649,826 | 130,225 |
| Short-Term Bond 0.8% | ||||||||
| Schwab Short-Term Bond Index Fund | 1,920,368 | 530,597 | (620,000) | (60,357) | (119,507) | 1,651,101 | 177,157 | 30,587 |
| 7,239,603 | ||||||||
| Money Market Funds 0.0% | ||||||||
| Schwab Variable Share Price Money Fund, Ultra Shares, 3.10% (b) | 28,055 | 240 | — | — | (8) | 28,287 | 28,287 | 276 |
| Total
Affiliated Underlying Funds (Cost $165,737,191) |
$191,686,313 | $37,915,941 | ($7,678,355) | ($96,062) | ($59,756,484) | $162,071,353 | $16,145,542 | |
| SECURITY | VALUE
AT 10/31/21 |
PURCHASES | SALES | REALIZED
GAINS (LOSSES) |
NET
CHANGE IN UNREALIZED APPRECIATION (DEPRECIATION) |
VALUE
AT 10/31/22 |
BALANCE
OF SHARES HELD AT 10/31/22 |
DISTRIBUTIONS
RECEIVED(a) |
| UNAFFILIATED UNDERLYING FUNDS 19.9% OF NET ASSETS | ||||||||
| U.S. Stocks 11.8% | ||||||||
| Large-Cap 9.9% | ||||||||
| ClearBridge Large Cap Growth Fund, Class IS * | $5,945,323 | 116,552 | ||||||
| Dodge & Cox Stock Fund, Class I | 14,145,799 | 64,101 | ||||||
| 20,091,122 | ||||||||
| Small-Cap 1.9% | ||||||||
| ClearBridge Small Cap Growth Fund, Class IS * | 3,895,006 | 101,857 | ||||||
| 23,986,128 | ||||||||
| International Stocks 4.1% | ||||||||
| Emerging Markets 4.1% | ||||||||
| Goldman Sachs Emerging Markets Equity Insights Fund, Institutional Class | 8,422,505 | 1,229,563 | ||||||
| Fixed Income 4.0% | ||||||||
| Intermediate-Term Bond 2.7% | ||||||||
| Loomis Sayles Investment Grade Bond Fund, Class Y | 3,806,184 | 404,483 | ||||||
| Western Asset Core Plus Bond Fund, Class I | 1,773,376 | 196,605 | ||||||
| 5,579,560 | ||||||||
| International Bond 1.3% | ||||||||
| PIMCO International Bond Fund (U.S. Dollar-Hedged), Institutional Class | 2,556,387 | 268,810 | ||||||
| 8,135,947 | ||||||||
| Total
Unaffiliated Underlying Funds (Cost $43,884,031) |
$40,544,580 | |||||||
| Total
Investments in Securities (Cost $209,621,222) |
$202,615,933 | |||||||
| * | Non-income producing security. |
| (a) | Distributions received include distributions from net investment income and capital gains, if any, from the underlying funds. Amounts shown are only presented for affiliated underlying funds, which are presented in the corresponding line-item in the Statement of Operations, if applicable (See financial note 2(d) for additional information). |
| (b) | The rate shown is the annualized 7-day yield. |
| Assets | ||
| Investments in securities, at value - affiliated (cost $165,737,191) | $162,071,353 | |
| Investments in securities, at value - unaffiliated (cost $43,884,031) | 40,544,580 | |
| Cash | 705,937 | |
| Receivables: | ||
| Investments sold | 620,000 | |
| Fund shares sold | 160,267 | |
| Dividends | 26,302 | |
| Due from investment adviser | 9,502 | |
| Interest | 1,977 | |
| Prepaid expenses | + | 5,093 |
| Total assets | 204,145,011 | |
| Liabilities | ||
| Payables: | ||
| Fund shares redeemed | 170,706 | |
| Investments bought | 26,395 | |
| Independent trustees’ fees | 35 | |
| Accrued expenses | + | 51,990 |
| Total liabilities | 249,126 | |
| Net assets | $203,895,885 | |
| Net Assets by Source | ||
| Capital received from investors | $198,097,778 | |
| Total distributable earnings | + | 5,798,107 |
| Net assets | $203,895,885 | |
| Net Asset Value (NAV) | ||||
| Net Assets | ÷ | Shares
Outstanding |
= | NAV |
| $203,895,885 | 14,840,935 | $13.74 | ||
| For the period November 1, 2021 through October 31, 2022 | ||
| Investment Income | ||
| Dividends received from securities - affiliated | $2,537,933 | |
| Dividends received from securities - unaffiliated | 702,383 | |
| Interest received from securities - unaffiliated | + | 7,382 |
| Total investment income | 3,247,698 | |
| Expenses | ||
| Registration fees | 25,382 | |
| Portfolio accounting fees | 23,207 | |
| Professional fees | 21,909 | |
| Shareholder reports | 13,318 | |
| Proxy fees1 | 10,387 | |
| Independent trustees’ fees | 7,371 | |
| Transfer agent fees | 3,519 | |
| Custodian fees | 1,030 | |
| Other expenses | + | 6,492 |
| Total expenses | 112,615 | |
| Expense reduction | – | 102,228 |
| Net expenses | – | 10,387 |
| Net investment income | 3,237,311 | |
| REALIZED AND UNREALIZED GAINS (LOSSES) | ||
| Realized capital gain distributions received from underlying funds - affiliated | 13,607,609 | |
| Realized capital gain distributions received from underlying funds - unaffiliated | 3,331,104 | |
| Net realized losses on sales of securities - affiliated | (96,062) | |
| Net realized losses on sales of securities - unaffiliated | + | (263,349) |
| Net realized gains | 16,579,302 | |
| Net change in unrealized appreciation (depreciation) on securities - affiliated | (59,756,484) | |
| Net change in unrealized appreciation (depreciation) on securities - unaffiliated | + | (13,896,515) |
| Net change in unrealized appreciation (depreciation) | + | (73,652,999) |
| Net realized and unrealized losses | (57,073,697) | |
| Decrease in net assets resulting from operations | ($53,836,386) | |
| 1 | Proxy fees are non-routine expenses (see financial note 4 for additional information). |
| OPERATIONS | |||
| 11/1/21-10/31/22 | 11/1/20-10/31/21 | ||
| Net investment income | $3,237,311 | $2,054,026 | |
| Net realized gains | 16,579,302 | 7,389,566 | |
| Net change in unrealized appreciation (depreciation) | + | (73,652,999) | 53,519,263 |
| Increase (decrease) in net assets resulting from operations | ($53,836,386) | $62,962,855 | |
| DISTRIBUTIONS TO SHAREHOLDERS | |||
| Total distributions | ($14,164,921) | ($4,905,042) | |
| TRANSACTIONS IN FUND SHARES | |||||
| 11/1/21-10/31/22 | 11/1/20-10/31/21 | ||||
| SHARES | VALUE | SHARES | VALUE | ||
| Shares sold | 2,707,954 | $42,898,468 | 3,400,099 | $58,030,659 | |
| Shares reinvested | 779,861 | 13,787,936 | 302,276 | 4,791,072 | |
| Shares redeemed | + | (1,908,268) | (29,847,949) | (3,366,800) | (57,211,988) |
| Net transactions in fund shares | 1,579,547 | $26,838,455 | 335,575 | $5,609,743 | |
| SHARES OUTSTANDING AND NET ASSETS | |||||
| 11/1/21-10/31/22 | 11/1/20-10/31/21 | ||||
| SHARES | NET ASSETS | SHARES | NET ASSETS | ||
| Beginning of period | 13,261,388 | $245,058,737 | 12,925,813 | $181,391,181 | |
| Total increase (decrease) | + | 1,579,547 | (41,162,852) | 335,575 | 63,667,556 |
| End of period | 14,840,935 | $203,895,885 | 13,261,388 | $245,058,737 | |
| 11/1/21–
10/31/22 |
11/1/20–
10/31/21 |
11/1/19–
10/31/20 |
11/1/18–
10/31/19 |
11/1/17–
10/31/18 |
||
| Per-Share Data | ||||||
| Net asset value at beginning of period | $18.74 | $14.11 | $14.15 | $13.60 | $14.18 | |
| Income (loss) from investment operations: | ||||||
| Net investment income (loss)1 | 0.23 | 0.15 | 0.24 | 0.21 | 0.20 | |
| Net realized and unrealized gains (losses) | (4.05) | 4.83 | 0.45 | 1.10 | (0.39) | |
| Total from investment operations | (3.82) | 4.98 | 0.69 | 1.31 | (0.19) | |
| Less distributions: | ||||||
| Distributions from net investment income | (0.54) | (0.16) | (0.27) | (0.31) | (0.37) | |
| Distributions from net realized gains | (0.41) | (0.19) | (0.46) | (0.45) | (0.02) | |
| Total distributions | (0.95) | (0.35) | (0.73) | (0.76) | (0.39) | |
| Net asset value at end of period | $13.97 | $18.74 | $14.11 | $14.15 | $13.60 | |
| Total return | (21.54%) | 35.79% | 4.86% | 10.73% | (1.49%) | |
| Ratios/Supplemental Data | ||||||
| Ratios to average net assets: | ||||||
| Net operating expenses2 | 0.00% 3 | 0.00% | 0.00% | 0.00% | 0.00% 4 | |
| Gross operating expenses2 | 0.07% 3 | 0.06% | 0.09% | 0.13% | 0.11% | |
| Net investment income (loss) | 1.43% | 0.88% | 1.78% | 1.53% | 1.41% | |
| Portfolio turnover rate | 4% | 11% | 6% | 6% | 10% | |
| Net assets, end of period (x 1,000) | $135,741 | $158,223 | $107,401 | $93,743 | $73,259 | |
| 1 | Calculated based on the average shares outstanding during the period. |
| 2 | Ratio excludes acquired fund fees and expenses, which are indirect expenses incurred by the fund through its investments in underlying funds. |
| 3 | Ratio includes less than 0.005% of non-routine proxy expenses. |
| 4 | Less than 0.005%; the ratio of net operating expenses would have been 0.00%, if certain non-routine expenses had not been incurred. |
| SECURITY | VALUE
AT 10/31/21 |
PURCHASES | SALES | REALIZED
GAINS (LOSSES) |
NET
CHANGE IN UNREALIZED APPRECIATION (DEPRECIATION) |
VALUE
AT 10/31/22 |
BALANCE
OF SHARES HELD AT 10/31/22 |
DISTRIBUTIONS
RECEIVED(a) |
| AFFILIATED UNDERLYING FUNDS 79.8% OF NET ASSETS | ||||||||
| U.S. Stocks 45.9% | ||||||||
| Large-Cap 38.2% | ||||||||
| Schwab Core Equity Fund | $13,228,444 | $— | ($3,026,432) | $63,899 | ($4,025,565) | $6,240,346 | 320,676 | $3,105,288 |
| Schwab Fundamental US Large Company Index Fund | 5,397,376 | 2,747,029 | — | — | (636,071) | 7,508,334 | 354,334 | 255,485 |
| Schwab S&P 500 Index Fund | 31,762,806 | 412,099 | — | — | (5,060,136) | 27,114,769 | 451,762 | 412,099 |
| Schwab Select Large Cap Growth Fund (formerly Laudus U.S. Large Cap Growth Fund) * | 12,058,925 | 5,944,008 | — | — | (6,994,178) | 11,008,755 | 558,537 | 1,431,322 |
| 51,872,204 | ||||||||
| Mid-Cap 1.7% | ||||||||
| Schwab U.S. Mid-Cap Index Fund | 2,744,354 | 78,541 | — | — | (549,114) | 2,273,781 | 43,862 | 78,541 |
| Small-Cap 6.0% | ||||||||
| Schwab Small-Cap Equity Fund | 8,858,802 | 1,265,226 | — | — | (1,904,195) | 8,219,833 | 433,993 | 965,225 |
| 62,365,818 | ||||||||
| International Stocks 25.1% | ||||||||
| Developed Markets 25.1% | ||||||||
| Schwab International Core Equity Fund | 14,639,313 | 3,681,667 | — | — | (4,251,647) | 14,069,333 | 1,615,308 | 461,667 |
| Schwab International Opportunities Fund (formerly Laudus International MarketMasters Fund) | 25,342,418 | 7,982,091 | — | — | (13,268,731) | 20,055,778 | 1,187,435 | 3,692,079 |
| 34,125,111 | ||||||||
| Real Estate 6.3% | ||||||||
| Global Real Estate 6.3% | ||||||||
| Schwab Global Real Estate Fund | 7,795,440 | 3,618,201 | — | — | (2,893,226) | 8,520,415 | 1,444,138 | 271,651 |
| Fixed Income 2.5% | ||||||||
| Intermediate-Term Bond 1.6% | ||||||||
| Schwab U.S. Aggregate Bond Index Fund | 2,564,999 | 451,527 | (399,999) | (19,506) | (398,196) | 2,198,825 | 255,677 | 51,511 |
| Short-Term Bond 0.9% | ||||||||
| Schwab Short-Term Bond Index Fund | 875,475 | 364,664 | — | — | (87,331) | 1,152,808 | 123,692 | 14,662 |
| 3,351,633 | ||||||||
| Total
Affiliated Underlying Funds (Cost $112,444,230) |
$125,268,352 | $26,545,053 | ($3,426,431) | $44,393 | ($40,068,390) | $108,362,977 | $10,739,530 | |
| SECURITY | VALUE
AT 10/31/21 |
PURCHASES | SALES | REALIZED
GAINS (LOSSES) |
NET
CHANGE IN UNREALIZED APPRECIATION (DEPRECIATION) |
VALUE
AT 10/31/22 |
BALANCE
OF SHARES HELD AT 10/31/22 |
DISTRIBUTIONS
RECEIVED(a) |
| UNAFFILIATED UNDERLYING FUNDS 19.7% OF NET ASSETS | ||||||||
| U.S. Stocks 11.8% | ||||||||
| Large-Cap 9.7% | ||||||||
| ClearBridge Large Cap Growth Fund, Class IS * | $3,593,334 | 70,444 | ||||||
| Dodge & Cox Stock Fund, Class I | 9,594,637 | 43,478 | ||||||
| 13,187,971 | ||||||||
| Small-Cap 2.1% | ||||||||
| ClearBridge Small Cap Growth Fund, Class IS * | 2,783,720 | 72,796 | ||||||
| 15,971,691 | ||||||||
| International Stocks 4.5% | ||||||||
| Emerging Markets 4.5% | ||||||||
| Goldman Sachs Emerging Markets Equity Insights Fund, Institutional Class | 6,087,651 | 888,708 | ||||||
| Fixed Income 3.4% | ||||||||
| Intermediate-Term Bond 2.5% | ||||||||
| Loomis Sayles Investment Grade Bond Fund, Class Y | 2,525,987 | 268,436 | ||||||
| Western Asset Core Plus Bond Fund, Class I | 885,627 | 98,185 | ||||||
| 3,411,614 | ||||||||
| International Bond 0.9% | ||||||||
| PIMCO International Bond Fund (U.S. Dollar-Hedged), Institutional Class | 1,223,518 | 128,656 | ||||||
| 4,635,132 | ||||||||
| Total
Unaffiliated Underlying Funds (Cost $28,935,461) |
$26,694,474 | |||||||
| Total
Investments in Securities (Cost $141,379,691) |
$135,057,451 | |||||||
| * | Non-income producing security. |
| (a) | Distributions received include distributions from net investment income and capital gains, if any, from the underlying funds. Amounts shown are only presented for affiliated underlying funds, which are presented in the corresponding line-item in the Statement of Operations, if applicable (See financial note 2(d) for additional information). |
| Assets | ||
| Investments in securities, at value - affiliated (cost $112,444,230) | $108,362,977 | |
| Investments in securities, at value - unaffiliated (cost $28,935,461) | 26,694,474 | |
| Cash | 701,282 | |
| Receivables: | ||
| Fund shares sold | 63,280 | |
| Dividends | 11,745 | |
| Due from investment adviser | 9,341 | |
| Interest | 1,169 | |
| Prepaid expenses | + | 4,540 |
| Total assets | 135,848,808 | |
| Liabilities | ||
| Payables: | ||
| Fund shares redeemed | 54,002 | |
| Investments bought | 11,807 | |
| Independent trustees’ fees | 34 | |
| Accrued expenses | + | 42,201 |
| Total liabilities | 108,044 | |
| Net assets | $135,740,764 | |
| Net Assets by Source | ||
| Capital received from investors | $133,571,725 | |
| Total distributable earnings | + | 2,169,039 |
| Net assets | $135,740,764 | |
| Net Asset Value (NAV) | ||||
| Net Assets | ÷ | Shares
Outstanding |
= | NAV |
| $135,740,764 | 9,713,327 | $13.97 | ||
| For the period November 1, 2021 through October 31, 2022 | ||
| Investment Income | ||
| Dividends received from securities - affiliated | $1,664,281 | |
| Dividends received from securities - unaffiliated | 451,075 | |
| Interest received from securities - unaffiliated | + | 4,139 |
| Total investment income | 2,119,495 | |
| Expenses | ||
| Registration fees | 23,652 | |
| Professional fees | 21,768 | |
| Shareholder reports | 13,953 | |
| Portfolio accounting fees | 13,385 | |
| Independent trustees’ fees | 7,156 | |
| Proxy fees1 | 6,775 | |
| Transfer agent fees | 2,645 | |
| Custodian fees | 1,518 | |
| Other expenses | + | 5,867 |
| Total expenses | 96,719 | |
| Expense reduction | – | 89,944 |
| Net expenses | – | 6,775 |
| Net investment income | 2,112,720 | |
| REALIZED AND UNREALIZED GAINS (LOSSES) | ||
| Realized capital gain distributions received from underlying funds - affiliated | 9,075,249 | |
| Realized capital gain distributions received from underlying funds - unaffiliated | 2,229,685 | |
| Net realized gains on sales of securities - affiliated | 44,393 | |
| Net realized losses on sales of securities - unaffiliated | + | (57,984) |
| Net realized gains | 11,291,343 | |
| Net change in unrealized appreciation (depreciation) on securities - affiliated | (40,068,390) | |
| Net change in unrealized appreciation (depreciation) on securities - unaffiliated | + | (9,117,630) |
| Net change in unrealized appreciation (depreciation) | + | (49,186,020) |
| Net realized and unrealized losses | (37,894,677) | |
| Decrease in net assets resulting from operations | ($35,781,957) | |
| 1 | Proxy fees are non-routine expenses (see financial note 4 for additional information). |
| OPERATIONS | |||
| 11/1/21-10/31/22 | 11/1/20-10/31/21 | ||
| Net investment income | $2,112,720 | $1,237,409 | |
| Net realized gains | 11,291,343 | 3,679,483 | |
| Net change in unrealized appreciation (depreciation) | + | (49,186,020) | 34,739,616 |
| Increase (decrease) in net assets resulting from operations | ($35,781,957) | $39,656,508 | |
| DISTRIBUTIONS TO SHAREHOLDERS | |||
| Total distributions | ($8,207,354) | ($2,778,154) | |
| TRANSACTIONS IN FUND SHARES | |||||
| 11/1/21-10/31/22 | 11/1/20-10/31/21 | ||||
| SHARES | VALUE | SHARES | VALUE | ||
| Shares sold | 2,031,561 | $32,815,671 | 2,415,853 | $41,626,853 | |
| Shares reinvested | 442,294 | 7,983,406 | 169,303 | 2,710,532 | |
| Shares redeemed | + | (1,204,703) | (19,292,293) | (1,750,620) | (30,393,721) |
| Net transactions in fund shares | 1,269,152 | $21,506,784 | 834,536 | $13,943,664 | |
| SHARES OUTSTANDING AND NET ASSETS | |||||
| 11/1/21-10/31/22 | 11/1/20-10/31/21 | ||||
| SHARES | NET ASSETS | SHARES | NET ASSETS | ||
| Beginning of period | 8,444,175 | $158,223,291 | 7,609,639 | $107,401,273 | |
| Total increase (decrease) | + | 1,269,152 | (22,482,527) | 834,536 | 50,822,018 |
| End of period | 9,713,327 | $135,740,764 | 8,444,175 | $158,223,291 | |
| 11/1/21–
10/31/22 |
11/1/20–
10/31/21 |
11/1/19–
10/31/20 |
11/1/18–
10/31/19 |
11/1/17–
10/31/18 |
||
| Per-Share Data | ||||||
| Net asset value at beginning of period | $16.42 | $12.21 | $12.16 | $11.53 | $12.02 | |
| Income (loss) from investment operations: | ||||||
| Net investment income (loss)1 | 0.19 | 0.12 | 0.20 | 0.16 | 0.14 | |
| Net realized and unrealized gains (losses) | (3.61) | 4.34 | 0.38 | 0.99 | (0.32) | |
| Total from investment operations | (3.42) | 4.46 | 0.58 | 1.15 | (0.18) | |
| Less distributions: | ||||||
| Distributions from net investment income | (0.47) | (0.13) | (0.22) | (0.26) | (0.29) | |
| Distributions from net realized gains | (0.27) | (0.12) | (0.31) | (0.26) | (0.02) | |
| Total distributions | (0.74) | (0.25) | (0.53) | (0.52) | (0.31) | |
| Net asset value at end of period | $12.26 | $16.42 | $12.21 | $12.16 | $11.53 | |
| Total return | (21.88%) | 36.89% | 4.73% | 10.85% | (1.64%) | |
| Ratios/Supplemental Data | ||||||
| Ratios to average net assets: | ||||||
| Net operating expenses2 | 0.00% 3 | 0.00% | 0.00% | 0.00% | 0.00% | |
| Gross operating expenses2 | 0.20% 3 | 0.22% | 0.41% | 0.67% | 0.73% | |
| Net investment income (loss) | 1.35% | 0.80% | 1.67% | 1.42% | 1.18% | |
| Portfolio turnover rate | 15% | 11% | 8% | 13% | 22% | |
| Net assets, end of period (x 1,000) | $39,741 | $40,077 | $21,509 | $15,765 | $10,479 | |
| 1 | Calculated based on the average shares outstanding during the period. |
| 2 | Ratio excludes acquired fund fees and expenses, which are indirect expenses incurred by the fund through its investments in underlying funds. |
| 3 | Ratio includes less than 0.005% of non-routine proxy expenses. |
| SECURITY | VALUE
AT 10/31/21 |
PURCHASES | SALES | REALIZED
GAINS (LOSSES) |
NET
CHANGE IN UNREALIZED APPRECIATION (DEPRECIATION) |
VALUE
AT 10/31/22 |
BALANCE
OF SHARES HELD AT 10/31/22 |
DISTRIBUTIONS
RECEIVED(a) |
| AFFILIATED UNDERLYING FUNDS 82.1% OF NET ASSETS | ||||||||
| U.S. Stocks 47.9% | ||||||||
| Large-Cap 40.2% | ||||||||
| Schwab Core Equity Fund | $3,258,883 | $379,376 | ($733,176) | ($22,401) | ($976,659) | $1,906,023 | 97,946 | $765,001 |
| Schwab Fundamental US Large Company Index Fund | 1,474,879 | 1,552,075 | (488,313) | (33,561) | (125,252) | 2,379,828 | 112,309 | 69,814 |
| Schwab S&P 500 Index Fund | 8,131,219 | 2,020,456 | (978,762) | (130,431) | (1,133,407) | 7,909,075 | 131,774 | 105,497 |
| Schwab Select Large Cap Growth Fund (formerly Laudus U.S. Large Cap Growth Fund) * | 3,322,582 | 2,888,892 | (307,395) | (157,179) | (1,933,278) | 3,813,622 | 193,487 | 426,011 |
| 16,008,548 | ||||||||
| Mid-Cap 1.9% | ||||||||
| Schwab U.S. Mid-Cap Index Fund | 683,890 | 220,728 | — | — | (152,446) | 752,172 | 14,509 | 20,728 |
| Small-Cap 5.8% | ||||||||
| Schwab Small-Cap Equity Fund | 2,241,296 | 846,384 | (318,580) | (69,864) | (398,231) | 2,301,005 | 121,489 | 254,121 |
| 19,061,725 | ||||||||
| International Stocks 25.9% | ||||||||
| Developed Markets 25.9% | ||||||||
| Schwab International Core Equity Fund | 4,222,062 | 1,869,805 | (747,137) | (210,049) | (973,409) | 4,161,272 | 477,758 | 125,667 |
| Schwab International Opportunities Fund (formerly Laudus International MarketMasters Fund) | 6,269,552 | 3,794,643 | (302,708) | (227,877) | (3,390,737) | 6,142,873 | 363,699 | 975,468 |
| 10,304,145 | ||||||||
| Real Estate 6.7% | ||||||||
| Global Real Estate 6.7% | ||||||||
| Schwab Global Real Estate Fund | 2,031,876 | 1,651,199 | (205,977) | (66,022) | (760,429) | 2,650,647 | 449,262 | 77,870 |
| Fixed Income 1.6% | ||||||||
| Intermediate-Term Bond 1.1% | ||||||||
| Schwab U.S. Aggregate Bond Index Fund | 371,694 | 535,797 | (385,826) | (34,900) | (50,508) | 436,257 | 50,728 | 10,794 |
| Short-Term Bond 0.5% | ||||||||
| Schwab Short-Term Bond Index Fund | 107,781 | 238,183 | (128,696) | (10,549) | (5,730) | 200,989 | 21,565 | 2,687 |
| 637,246 | ||||||||
| Total
Affiliated Underlying Funds (Cost $35,274,190) |
$32,115,714 | $15,997,538 | ($4,596,570) | ($962,833) | ($9,900,086) | $32,653,763 | $2,833,658 | |
| SECURITY | VALUE
AT 10/31/21 |
PURCHASES | SALES | REALIZED
GAINS (LOSSES) |
NET
CHANGE IN UNREALIZED APPRECIATION (DEPRECIATION) |
VALUE
AT 10/31/22 |
BALANCE
OF SHARES HELD AT 10/31/22 |
DISTRIBUTIONS
RECEIVED(a) |
| UNAFFILIATED UNDERLYING FUNDS 17.9% OF NET ASSETS | ||||||||
| U.S. Stocks 10.8% | ||||||||
| Large-Cap 8.9% | ||||||||
| ClearBridge Large Cap Growth Fund, Class IS * | $1,043,647 | 20,460 | ||||||
| Dodge & Cox Stock Fund, Class I | 2,476,702 | 11,223 | ||||||
| 3,520,349 | ||||||||
| Small-Cap 1.9% | ||||||||
| ClearBridge Small Cap Growth Fund, Class IS * | 763,152 | 19,957 | ||||||
| 4,283,501 | ||||||||
| International Stocks 5.4% | ||||||||
| Emerging Markets 5.4% | ||||||||
| Goldman Sachs Emerging Markets Equity Insights Fund, Institutional Class | 2,142,710 | 312,804 | ||||||
| Fixed Income 1.7% | ||||||||
| Intermediate-Term Bond 1.2% | ||||||||
| Loomis Sayles Investment Grade Bond Fund, Class Y | 456,924 | 48,557 | ||||||
| International Bond 0.5% | ||||||||
| PIMCO International Bond Fund (U.S. Dollar-Hedged), Institutional Class | 217,853 | 22,908 | ||||||
| 674,777 | ||||||||
| Total
Unaffiliated Underlying Funds (Cost $7,865,071) |
$7,100,988 | |||||||
| Total
Investments in Securities (Cost $43,139,261) |
$39,754,751 | |||||||
| * | Non-income producing security. |
| (a) | Distributions received include distributions from net investment income and capital gains, if any, from the underlying funds. Amounts shown are only presented for affiliated underlying funds, which are presented in the corresponding line-item in the Statement of Operations, if applicable (See financial note 2(d) for additional information). |
| Assets | ||
| Investments in securities, at value - affiliated (cost $35,274,190) | $32,653,763 | |
| Investments in securities, at value - unaffiliated (cost $7,865,071) | 7,100,988 | |
| Cash | 242,905 | |
| Receivables: | ||
| Investments sold | 3,708,521 | |
| Fund shares sold | 26,493 | |
| Due from investment adviser | 7,163 | |
| Dividends | 2,229 | |
| Interest | 446 | |
| Prepaid expenses | + | 11,635 |
| Total assets | 43,754,143 | |
| Liabilities | ||
| Payables: | ||
| Fund shares redeemed | 3,972,119 | |
| Investments bought | 2,241 | |
| Independent trustees’ fees | 33 | |
| Accrued expenses | + | 38,987 |
| Total liabilities | 4,013,380 | |
| Net assets | $39,740,763 | |
| Net Assets by Source | ||
| Capital received from investors | $42,069,542 | |
| Total distributable loss | + | (2,328,779) |
| Net assets | $39,740,763 | |
| Net Asset Value (NAV) | ||||
| Net Assets | ÷ | Shares
Outstanding |
= | NAV |
| $39,740,763 | 3,241,892 | $12.26 | ||
| For the period November 1, 2021 through October 31, 2022 | ||
| Investment Income | ||
| Dividends received from securities - affiliated | $441,435 | |
| Dividends received from securities - unaffiliated | 107,652 | |
| Interest received from securities - unaffiliated | + | 1,317 |
| Total investment income | 550,404 | |
| Expenses | ||
| Professional fees | 21,578 | |
| Registration fees | 20,411 | |
| Portfolio accounting fees | 12,097 | |
| Shareholder reports | 8,455 | |
| Independent trustees’ fees | 6,859 | |
| Custodian fees | 2,554 | |
| Proxy fees1 | 1,824 | |
| Transfer agent fees | 958 | |
| Other expenses | + | 4,962 |
| Total expenses | 79,698 | |
| Expense reduction | – | 77,874 |
| Net expenses | – | 1,824 |
| Net investment income | 548,580 | |
| REALIZED AND UNREALIZED GAINS (LOSSES) | ||
| Realized capital gain distributions received from underlying funds - affiliated | 2,392,223 | |
| Realized capital gain distributions received from underlying funds - unaffiliated | 609,550 | |
| Net realized losses on sales of securities - affiliated | (962,833) | |
| Net realized losses on sales of securities - unaffiliated | + | (176,682) |
| Net realized gains | 1,862,258 | |
| Net change in unrealized appreciation (depreciation) on securities - affiliated | (9,900,086) | |
| Net change in unrealized appreciation (depreciation) on securities - unaffiliated | + | (2,229,203) |
| Net change in unrealized appreciation (depreciation) | + | (12,129,289) |
| Net realized and unrealized losses | (10,267,031) | |
| Decrease in net assets resulting from operations | ($9,718,451) | |
| 1 | Proxy fees are non-routine expenses (see financial note 4 for additional information). |
| OPERATIONS | |||
| 11/1/21-10/31/22 | 11/1/20-10/31/21 | ||
| Net investment income | $548,580 | $254,444 | |
| Net realized gains | 1,862,258 | 732,256 | |
| Net change in unrealized appreciation (depreciation) | + | (12,129,289) | 7,778,541 |
| Increase (decrease) in net assets resulting from operations | ($9,718,451) | $8,765,241 | |
| DISTRIBUTIONS TO SHAREHOLDERS | |||
| Total distributions | ($1,894,146) | ($458,337) | |
| TRANSACTIONS IN FUND SHARES | |||||
| 11/1/21-10/31/22 | 11/1/20-10/31/21 | ||||
| SHARES | VALUE | SHARES | VALUE | ||
| Shares sold | 1,472,977 | $20,023,654 | 1,163,081 | $17,567,794 | |
| Shares reinvested | 115,712 | 1,840,977 | 31,814 | 444,437 | |
| Shares redeemed | + | (787,575) | (10,587,897) | (515,554) | (7,751,420) |
| Net transactions in fund shares | 801,114 | $11,276,734 | 679,341 | $10,260,811 | |
| SHARES OUTSTANDING AND NET ASSETS | |||||
| 11/1/21-10/31/22 | 11/1/20-10/31/21 | ||||
| SHARES | NET ASSETS | SHARES | NET ASSETS | ||
| Beginning of period | 2,440,778 | $40,076,626 | 1,761,437 | $21,508,911 | |
| Total increase (decrease) | + | 801,114 | (335,863) | 679,341 | 18,567,715 |
| End of period | 3,241,892 | $39,740,763 | 2,440,778 | $40,076,626 | |
| 11/1/21–
10/31/22 |
2/26/21
1– 10/31/21 |
|||||
| Per-Share Data | ||||||
| Net asset value at beginning of period | $11.33 | $10.00 | ||||
| Income (loss) from investment operations: | ||||||
| Net investment income (loss)2 | 0.11 | 0.03 | ||||
| Net realized and unrealized gains (losses) | (2.51) | 1.30 | ||||
| Total from investment operations | (2.40) | 1.33 | ||||
| Less distributions: | ||||||
| Distributions from net investment income | (0.30) | — | ||||
| Net asset value at end of period | $8.63 | $11.33 | ||||
| Total return | (21.78%) | 13.30% 3 | ||||
| Ratios/Supplemental Data | ||||||
| Ratios to average net assets: | ||||||
| Net operating expenses4 | 0.00% 5 | 0.00% 6 | ||||
| Gross operating expenses4 | 1.10% 5 | 1.90% 6 | ||||
| Net investment income (loss)4 | 1.17% | 0.35% 6 | ||||
| Portfolio turnover rate | 26% | 34% 3 | ||||
| Net assets, end of period (x 1,000) | $6,611 | $4,489 | ||||
| 1 | Commencement of operations. |
| 2 | Calculated based on the average shares outstanding during the period. |
| 3 | Not annualized. |
| 4 | Ratio excludes acquired fund fees and expenses, which are indirect expenses incurred by the fund through its investments in underlying funds. |
| 5 | Ratio includes less than 0.005% of non-routine proxy expenses. |
| 6 | Annualized. |
| SECURITY | VALUE
AT 10/31/21 |
PURCHASES | SALES | REALIZED
GAINS (LOSSES) |
NET
CHANGE IN UNREALIZED APPRECIATION (DEPRECIATION) |
VALUE
AT 10/31/22 |
BALANCE
OF SHARES HELD AT 10/31/22 |
DISTRIBUTIONS
RECEIVED(a) |
| AFFILIATED UNDERLYING FUNDS 81.6% OF NET ASSETS | ||||||||
| U.S. Stocks 47.7% | ||||||||
| Large-Cap 40.2% | ||||||||
| Schwab Core Equity Fund | $362,105 | $108,000 | ($25,000) | ($7,001) | ($117,597) | $320,507 | 16,470 | $85,002 |
| Schwab Fundamental US Large Company Index Fund | 166,209 | 311,654 | (53,942) | (4,106) | (24,367) | 395,448 | 18,662 | 9,454 |
| Schwab S&P 500 Index Fund | 924,860 | 888,779 | (300,536) | (15,845) | (178,610) | 1,318,648 | 21,970 | 11,779 |
| Schwab Select Large Cap Growth Fund (formerly Laudus U.S. Large Cap Growth Fund) * | 375,362 | 622,902 | (77,001) | (26,522) | (271,116) | 623,625 | 31,640 | 50,589 |
| Schwab U.S. Large-Cap ETF | — | 165,387 | (165,694) | 307 | — | — | — | — |
| 2,658,228 | ||||||||
| Mid-Cap 1.8% | ||||||||
| Schwab U.S. Mid-Cap Index Fund | 77,292 | 60,297 | — | — | (20,245) | 117,344 | 2,264 | 2,296 |
| Small-Cap 5.7% | ||||||||
| Schwab Small-Cap Equity Fund | 250,158 | 238,485 | (46,000) | (9,998) | (57,394) | 375,251 | 19,813 | 29,486 |
| Schwab U.S. Small-Cap ETF | — | 41,930 | (42,046) | 116 | — | — | — | — |
| 375,251 | ||||||||
| 3,150,823 | ||||||||
| International Stocks 26.4% | ||||||||
| Developed Markets 26.4% | ||||||||
| Schwab International Core Equity Fund | 531,592 | 588,437 | (209,098) | (24,218) | (149,569) | 737,144 | 84,632 | 15,437 |
| Schwab International Equity ETF | — | 113,307 | (113,259) | (48) | — | — | — | — |
| Schwab International Opportunities Fund (formerly Laudus International MarketMasters Fund) | 645,158 | 958,158 | (100,012) | (46,305) | (445,786) | 1,011,213 | 59,870 | 111,727 |
| 1,748,357 | ||||||||
| Real Estate 6.6% | ||||||||
| Global Real Estate 6.6% | ||||||||
| Schwab Global Real Estate Fund | 223,516 | 351,090 | (10,000) | (856) | (129,664) | 434,086 | 73,574 | 10,810 |
| Fixed Income 0.9% | ||||||||
| Intermediate-Term Bond 0.4% | ||||||||
| Schwab U.S. Aggregate Bond Index Fund | 30,682 | 68,739 | (63,324) | (5,915) | (1,853) | 28,329 | 3,294 | 946 |
| Short-Term Bond 0.5% | ||||||||
| Schwab Short-Term Bond Index Fund | 15,020 | 37,441 | (18,001) | (1,556) | (1,027) | 31,877 | 3,420 | 440 |
| 60,206 | ||||||||
| Total
Affiliated Underlying Funds (Cost $6,568,386) |
$3,601,954 | $4,554,606 | ($1,223,913) | ($141,947) | ($1,397,228) | $5,393,472 | $327,966 | |
| SECURITY | VALUE
AT 10/31/21 |
PURCHASES | SALES | REALIZED
GAINS (LOSSES) |
NET
CHANGE IN UNREALIZED APPRECIATION (DEPRECIATION) |
VALUE
AT 10/31/22 |
BALANCE
OF SHARES HELD AT 10/31/22 |
DISTRIBUTIONS
RECEIVED(a) |
| UNAFFILIATED UNDERLYING FUNDS 17.9% OF NET ASSETS | ||||||||
| U.S. Stocks 11.1% | ||||||||
| Large-Cap 9.0% | ||||||||
| ClearBridge Large Cap Growth Fund, Class IS * | $183,786 | 3,603 | ||||||
| Dodge & Cox Stock Fund, Class I | 410,982 | 1,862 | ||||||
| 594,768 | ||||||||
| Small-Cap 2.1% | ||||||||
| ClearBridge Small Cap Growth Fund, Class IS * | 140,979 | 3,687 | ||||||
| 735,747 | ||||||||
| International Stocks 5.2% | ||||||||
| Emerging Markets 5.2% | ||||||||
| Goldman Sachs Emerging Markets Equity Insights Fund, Institutional Class | 341,062 | 49,790 | ||||||
| Fixed Income 1.6% | ||||||||
| Intermediate-Term Bond 1.1% | ||||||||
| Loomis Sayles Investment Grade Bond Fund, Class Y | 69,875 | 7,426 | ||||||
| International Bond 0.5% | ||||||||
| PIMCO International Bond Fund (U.S. Dollar-Hedged), Institutional Class | 36,104 | 3,796 | ||||||
| 105,979 | ||||||||
| Total
Unaffiliated Underlying Funds (Cost $1,452,402) |
$1,182,788 | |||||||
| Total
Investments in Securities (Cost $8,020,788) |
$6,576,260 | |||||||
| * | Non-income producing security. |
| (a) | Distributions received include distributions from net investment income and capital gains, if any, from the underlying funds. Amounts shown are only presented for affiliated underlying funds, which are presented in the corresponding line-item in the Statement of Operations, if applicable (See financial note 2(d) for additional information). |
| ETF — | Exchange traded fund |
| Assets | ||
| Investments in securities, at value - affiliated (cost $6,568,386) | $5,393,472 | |
| Investments in securities, at value - unaffiliated (cost $1,452,402) | 1,182,788 | |
| Receivables: | ||
| Fund shares sold | 204,853 | |
| Investments sold | 182,000 | |
| Due from investment adviser | 6,995 | |
| Dividends | 355 | |
| Prepaid expenses | + | 3,375 |
| Total assets | 6,973,838 | |
| Liabilities | ||
| Payables: | ||
| Fund shares redeemed | 196,601 | |
| Due to custodian | 134,764 | |
| Investments bought | 283 | |
| Independent trustees’ fees | 32 | |
| Accrued expenses | + | 31,633 |
| Total liabilities | 363,313 | |
| Net assets | $6,610,525 | |
| Net Assets by Source | ||
| Capital received from investors | $7,954,641 | |
| Total distributable loss | + | (1,344,116) |
| Net assets | $6,610,525 | |
| Net Asset Value (NAV) | ||||
| Net Assets | ÷ | Shares
Outstanding |
= | NAV |
| $6,610,525 | 766,235 | $8.63 | ||
| For the period November 1, 2021 through October 31, 2022 | ||
| Investment Income | ||
| Dividends received from securities - affiliated | $53,455 | |
| Dividends received from securities - unaffiliated | + | 13,793 |
| Total investment income | 67,248 | |
| Expenses | ||
| Professional fees | 18,390 | |
| Registration fees | 14,880 | |
| Portfolio accounting fees | 11,512 | |
| Independent trustees’ fees | 6,764 | |
| Custodian fees | 3,261 | |
| Shareholder reports | 2,643 | |
| Transfer agent fees | 679 | |
| Proxy fees1 | 245 | |
| Other expenses | + | 4,579 |
| Total expenses | 62,953 | |
| Expense reduction | – | 62,708 |
| Net expenses | – | 245 |
| Net investment income | 67,003 | |
| REALIZED AND UNREALIZED GAINS (LOSSES) | ||
| Realized capital gain distributions received from underlying funds - affiliated | 274,511 | |
| Realized capital gain distributions received from underlying funds - unaffiliated | 71,093 | |
| Net realized losses on sales of securities - affiliated | (141,947) | |
| Net realized losses on sales of securities - unaffiliated | + | (40,786) |
| Net realized gains | 162,871 | |
| Net change in unrealized appreciation (depreciation) on securities - affiliated | (1,397,228) | |
| Net change in unrealized appreciation (depreciation) on securities - unaffiliated | + | (290,186) |
| Net change in unrealized appreciation (depreciation) | + | (1,687,414) |
| Net realized and unrealized losses | (1,524,543) | |
| Decrease in net assets resulting from operations | ($1,457,540) | |
| 1 | Proxy fees are non-routine expenses (see financial note 4 for additional information). |
| OPERATIONS | |||
| 11/1/21-10/31/22 | 2/26/21 1-10/31/21 | ||
| Net investment income | $67,003 | $5,881 | |
| Net realized gains (losses) | 162,871 | (2,415) | |
| Net change in unrealized appreciation (depreciation) | + | (1,687,414) | 242,886 |
| Increase (decrease) in net assets resulting from operations | ($1,457,540) | $246,352 | |
| DISTRIBUTIONS TO SHAREHOLDERS | |||
| Total distributions | ($132,928) | $— | |
| TRANSACTIONS IN FUND SHARES | |||||
| 11/1/21-10/31/22 | 2/26/21 1-10/31/21 | ||||
| SHARES | VALUE | SHARES | VALUE | ||
| Shares sold | 558,480 | $5,553,563 | 438,998 | $4,713,650 | |
| Shares reinvested | 10,020 | 112,123 | — | — | |
| Shares redeemed | + | (198,386) | (1,953,828) | (42,877) | (470,867) |
| Net transactions in fund shares | 370,114 | $3,711,858 | 396,121 | $4,242,783 | |
| SHARES OUTSTANDING AND NET ASSETS | |||||
| 11/1/21-10/31/22 | 2/26/21 1-10/31/21 | ||||
| SHARES | NET ASSETS | SHARES | NET ASSETS | ||
| Beginning of period | 396,121 | $4,489,135 | — | $— | |
| Total increase | + | 370,114 | 2,121,390 | 396,121 | 4,489,135 |
| End of period | 766,235 | $6,610,525 | 396,121 | $4,489,135 | |
| 1 | Commencement of operations. |
| SCHWAB CAPITAL TRUST (ORGANIZED MAY 7, 1993) | |
| Schwab Target 2010 Fund | Schwab Dividend Equity Fund |
| Schwab Target 2015 Fund | Schwab Large-Cap Growth Fund |
| Schwab Target 2020 Fund | Schwab Small-Cap Equity Fund |
| Schwab Target 2025 Fund | Schwab Health Care Fund |
| Schwab Target 2030 Fund | Schwab International Core Equity Fund |
| Schwab Target 2035 Fund | Schwab Fundamental US Large Company Index Fund |
| Schwab Target 2040 Fund | Schwab Fundamental US Small Company Index Fund |
| Schwab Target 2045 Fund | Schwab Fundamental International Large Company Index Fund |
| Schwab Target 2050 Fund | Schwab Fundamental International Small Company Index Fund |
| Schwab Target 2055 Fund | Schwab Fundamental Emerging Markets Large Company Index Fund |
| Schwab Target 2060 Fund | Schwab Fundamental Global Real Estate Index Fund |
| Schwab Target 2065 Fund | Schwab Target 2010 Index Fund |
| Schwab S&P 500 Index Fund | Schwab Target 2015 Index Fund |
| Schwab Small-Cap Index Fund® | Schwab Target 2020 Index Fund |
| Schwab Total Stock Market Index Fund® | Schwab Target 2025 Index Fund |
| Schwab U.S. Large-Cap Growth Index Fund | Schwab Target 2030 Index Fund |
| Schwab U.S. Large-Cap Value Index Fund | Schwab Target 2035 Index Fund |
| Schwab U.S. Mid-Cap Index Fund | Schwab Target 2040 Index Fund |
| Schwab International Index Fund® | Schwab Target 2045 Index Fund |
| Schwab MarketTrack All Equity Portfolio™ | Schwab Target 2050 Index Fund |
| Schwab MarketTrack Growth Portfolio™ | Schwab Target 2055 Index Fund |
| Schwab MarketTrack Balanced Portfolio™ | Schwab Target 2060 Index Fund |
| Schwab MarketTrack Conservative Portfolio™ | Schwab Target 2065 Index Fund |
| Schwab International Opportunities Fund | Schwab Monthly Income Fund - Target Payout |
| Schwab Balanced Fund | Schwab Monthly Income Fund - Flexible Payout |
| Schwab Core Equity Fund | Schwab Monthly Income Fund - Income Payout |
| UNDERLYING FUNDS | SCHWAB
TARGET 2010 FUND |
SCHWAB
TARGET 2015 FUND |
SCHWAB
TARGET 2020 FUND |
SCHWAB
TARGET 2025 FUND |
SCHWAB
TARGET 2030 FUND |
SCHWAB
TARGET 2035 FUND |
SCHWAB
TARGET 2040 FUND |
SCHWAB
TARGET 2045 FUND |
SCHWAB
TARGET 2050 FUND |
SCHWAB
TARGET 2055 FUND |
SCHWAB
TARGET 2060 FUND |
SCHWAB
TARGET 2065 FUND |
| Schwab Core Equity Fund | 0.1% | 0.1% | 0.7% | 1.1% | 2.6% | 1.5% | 3.3% | 0.7% | 0.7% | 0.5% | 0.2% | 0.0%* |
| Schwab Fundamental US Large Company Index Fund | 0.0%* | 0.0%* | 0.1% | 0.1% | 0.3% | 0.3% | 0.6% | 0.2% | 0.2% | 0.1% | 0.0%* | 0.0%* |
| Schwab Global Real Estate Fund | 0.4% | 0.6% | 4.1% | 6.3% | 14.0% | 8.3% | 18.2% | 4.2% | 4.4% | 3.0% | 0.9% | 0.2% |
| Schwab International Core Equity Fund | 0.3% | 0.5% | 3.4% | 5.7% | 12.9% | 7.8% | 16.4% | 3.7% | 4.0% | 2.8% | 0.8% | 0.1% |
| Schwab International Opportunities Fund | 0.2% | 0.3% | 2.5% | 4.2% | 9.5% | 5.7% | 12.4% | 2.9% | 3.0% | 2.0% | 0.6% | 0.1% |
| Schwab S&P 500 Index Fund | 0.0%* | 0.0%* | 0.1% | 0.1% | 0.3% | 0.2% | 0.3% | 0.1% | 0.1% | 0.0%* | 0.0%* | 0.0%* |
| Schwab Select Large Cap Growth Fund | 0.1% | 0.1% | 0.3% | 0.5% | 1.5% | 1.0% | 2.3% | 0.7% | 0.8% | 0.6% | 0.2% | 0.0% |
| Schwab Short-Term Bond Index Fund | 0.3% | 0.3% | 1.9% | 1.9% | 2.4% | 0.9% | 1.2% | 0.2% | 0.1% | 0.1% | 0.0%* | 0.0%* |
| Schwab Small-Cap Equity Fund | 0.1% | 0.2% | 1.1% | 2.0% | 5.0% | 3.6% | 8.0% | 2.1% | 2.2% | 1.5% | 0.4% | 0.1% |
| Schwab Treasury Inflation Protected Securities Index Fund | 0.1% | 0.1% | 0.9% | 0.7% | 0.4% | —% | —% | —% | —% | —% | —% | —% |
| Schwab U.S. Aggregate Bond Index Fund | 0.3% | 0.3% | 2.1% | 2.1% | 2.6% | 1.0% | 1.4% | 0.2% | 0.1% | 0.1% | 0.0%* | 0.0%* |
| Schwab U.S. Mid Cap Index Fund | 0.0%* | 0.0%* | 0.4% | 0.6% | 1.3% | 0.8% | 1.7% | 0.4% | 0.4% | 0.3% | 0.1% | 0.0%* |
| Schwab Variable Share Price Money Fund, Ultra Shares | 0.0%* | 0.0%* | 0.3% | 0.3% | 0.3% | 0.1% | 0.1% | 0.0%* | 0.0%* | —% | —% | —% |
| * | Less than 0.05% |
| PURCHASE COST | SALE PROCEEDS | REALIZED GAINS (LOSSES) | |
| Schwab Target 2010 Fund | $— | $— | $— |
| Schwab Target 2015 Fund | — | — | — |
| Schwab Target 2020 Fund | — | — | — |
| Schwab Target 2025 Fund | — | — | — |
| Schwab Target 2030 Fund | — | — | — |
| Schwab Target 2035 Fund | — | — | — |
| Schwab Target 2040 Fund | — | — | — |
| Schwab Target 2045 Fund | — | — | — |
| Schwab Target 2050 Fund | — | — | — |
| Schwab Target 2055 Fund | — | — | — |
| Schwab Target 2060 Fund | — | — | — |
| Schwab Target 2065 Fund | — | 278,953 | 259 |
| 7. Purchases and Sales of Investment Securities: |
| PURCHASES
OF SECURITIES |
SALES
OF SECURITIES | |
| Schwab Target 2010 Fund | $13,204,160 | $19,944,840 |
| Schwab Target 2015 Fund | 13,107,915 | 20,674,483 |
| Schwab Target 2020 Fund | 79,122,258 | 119,912,226 |
| Schwab Target 2025 Fund | 109,134,993 | 125,910,903 |
| Schwab Target 2030 Fund | 191,985,372 | 168,769,300 |
| Schwab Target 2035 Fund | 103,663,076 | 70,472,734 |
| Schwab Target 2040 Fund | 175,616,897 | 109,697,049 |
| Schwab Target 2045 Fund | 42,988,038 | 14,913,023 |
| Schwab Target 2050 Fund | 48,037,506 | 14,449,509 |
| Schwab Target 2055 Fund | 33,481,575 | 6,362,330 |
| Schwab Target 2060 Fund | 19,076,539 | 5,931,913 |
| Schwab Target 2065 Fund | 5,470,880 | 1,483,824 |
| TAX COST | GROSS
UNREALIZED APPRECIATION |
GROSS
UNREALIZED DEPRECIATION |
NET
UNREALIZED APPRECIATION (DEPRECIATION) | |
| Schwab Target 2010 Fund | $46,397,393 | $4,932,984 | ($5,364,100) | ($431,116) |
| Schwab Target 2015 Fund | 55,973,126 | 7,263,833 | (5,786,413) | 1,477,420 |
| Schwab Target 2020 Fund | 364,605,448 | 53,586,280 | (36,684,203) | 16,902,077 |
| Schwab Target 2025 Fund | 482,329,687 | 63,620,654 | (53,666,828) | 9,953,826 |
| Schwab Target 2030 Fund | 836,295,115 | 146,165,669 | (87,559,649) | 58,606,020 |
| Schwab Target 2035 Fund | 466,276,130 | 64,250,381 | (50,182,481) | 14,067,900 |
| Schwab Target 2040 Fund | 872,936,729 | 172,309,097 | (92,243,534) | 80,065,563 |
| Schwab Target 2045 Fund | 211,558,457 | 18,236,969 | (24,982,326) | (6,745,357) |
| Schwab Target 2050 Fund | 210,295,813 | 17,829,836 | (25,509,716) | (7,679,880) |
| Schwab Target 2055 Fund | 142,039,127 | 11,013,808 | (17,995,484) | (6,981,676) |
| Schwab Target 2060 Fund | 43,968,607 | 2,031,557 | (6,245,413) | (4,213,856) |
| Schwab Target 2065 Fund | 8,183,770 | - | (1,607,510) | (1,607,510) |
| UNDISTRIBUTED
ORDINARY INCOME |
UNDISTRIBUTED
LONG-TERM CAPITAL GAINS |
NET
UNREALIZED APPRECIATION (DEPRECIATION) ON INVESTMENTS |
TOTAL | |
| Schwab Target 2010 Fund | $697,873 | $966,864 | ($431,116) | $1,233,621 |
| Schwab Target 2015 Fund | 857,354 | 2,119,759 | 1,477,420 | 4,454,533 |
| Schwab Target 2020 Fund | 5,470,109 | 12,917,024 | 16,902,077 | 35,289,210 |
| Schwab Target 2025 Fund | 5,830,323 | 16,184,760 | 9,953,826 | 31,968,909 |
| Schwab Target 2030 Fund | 8,009,739 | 40,195,667 | 58,606,020 | 106,811,426 |
| Schwab Target 2035 Fund | 3,337,303 | 25,074,825 | 14,067,900 | 42,480,028 |
| Schwab Target 2040 Fund | 5,368,418 | 58,190,138 | 80,065,563 | 143,624,119 |
| Schwab Target 2045 Fund | 917,250 | 12,085,581 | (6,745,357) | 6,257,474 |
| Schwab Target 2050 Fund | 767,606 | 12,710,381 | (7,679,880) | 5,798,107 |
| Schwab Target 2055 Fund | 454,525 | 8,696,190 | (6,981,676) | 2,169,039 |
| Schwab Target 2060 Fund | 111,063 | 1,774,014 | (4,213,856) | (2,328,779) |
| Schwab Target 2065 Fund | 27,371 | 236,023 | (1,607,510) | (1,344,116) |
| CURRENT FISCAL YEAR END DISTRIBUTIONS | PRIOR FISCAL YEAR END DISTRIBUTIONS | |||
| ORDINARY
INCOME |
LONG-TERM
CAPITAL GAINS |
ORDINARY
INCOME |
LONG-TERM
CAPITAL GAINS | |
| Schwab Target 2010 Fund | $1,331,099 | $1,739,735 | $1,158,878 | $385,205 |
| Schwab Target 2015 Fund | 1,744,930 | 3,437,941 | 1,603,533 | 1,864,193 |
| Schwab Target 2020 Fund | 11,812,575 | 25,556,397 | 10,442,930 | 10,256,763 |
| Schwab Target 2025 Fund | 15,900,882 | 24,337,226 | 10,641,524 | 7,269,075 |
| Schwab Target 2030 Fund | 29,568,203 | 46,509,219 | 16,741,235 | 16,944,271 |
| Schwab Target 2035 Fund | 16,504,016 | 17,830,955 | 7,639,008 | 7,482,792 |
| Schwab Target 2040 Fund | 34,399,189 | 46,775,680 | 14,499,604 | 21,950,959 |
| Schwab Target 2045 Fund | 7,204,576 | 5,468,227 | 2,368,978 | 2,594,038 |
| Schwab Target 2050 Fund | 7,536,621 | 6,628,300 | 2,230,995 | 2,674,047 |
| Schwab Target 2055 Fund | 4,779,602 | 3,427,752 | 1,270,190 | 1,507,964 |
| Schwab Target 2060 Fund | 1,250,419 | 643,727 | 239,872 | 218,465 |
| Schwab Target 2065 Fund | 132,928 | — | — | — |
Denver, Colorado
December 16, 2022
| FOREIGN TAX CREDIT | FOREIGN SOURCE INCOME | |
| Schwab Target 2010 Fund | $8,955 | $112,291 |
| Schwab Target 2015 Fund | 10,862 | 140,166 |
| Schwab Target 2020 Fund | 79,907 | 1,021,007 |
| Schwab Target 2025 Fund | 165,695 | 1,807,469 |
| Schwab Target 2030 Fund | 444,173 | 4,146,613 |
| Schwab Target 2035 Fund | 311,128 | 2,667,754 |
| Schwab Target 2040 Fund | 754,786 | 5,900,946 |
| Schwab Target 2045 Fund | 187,507 | 1,399,535 |
| Schwab Target 2050 Fund | 206,021 | 1,465,218 |
| Schwab Target 2055 Fund | 144,331 | 1,012,008 |
| Schwab Target 2060 Fund | 40,134 | 275,435 |
| Schwab Target 2065 Fund | 4,775 | 32,479 |
| Schwab Target 2010 Fund | 12.28% |
| Schwab Target 2015 Fund | 12.86% |
| Schwab Target 2020 Fund | 13.45% |
| Schwab Target 2025 Fund | 16.51% |
| Schwab Target 2030 Fund | 18.87% |
| Schwab Target 2035 Fund | 19.96% |
| Schwab Target 2040 Fund | 20.85% |
| Schwab Target 2045 Fund | 20.94% |
| Schwab Target 2050 Fund | 20.90% |
| Schwab Target 2055 Fund | 20.73% |
| Schwab Target 2060 Fund | 20.27% |
| Schwab Target 2065 Fund | 17.45% |
| Schwab Target 2010 Fund | $298,309 |
| Schwab Target 2015 Fund | 404,374 |
| Schwab Target 2020 Fund | 2,908,859 |
| Schwab Target 2025 Fund | 5,113,024 |
| Schwab Target 2030 Fund | 11,494,428 |
| Schwab Target 2035 Fund | 7,195,826 |
| Schwab Target 2040 Fund | 16,000,106 |
| Schwab Target 2045 Fund | 3,557,701 |
| Schwab Target 2050 Fund | 3,748,741 |
| Schwab Target 2055 Fund | 2,450,357 |
| Schwab Target 2060 Fund | 641,044 |
| Schwab Target 2065 Fund | 61,894 |
| Schwab Target 2010 Fund | $1,739,735 |
| Schwab Target 2015 Fund | 3,437,941 |
| Schwab Target 2020 Fund | 25,556,397 |
| Schwab Target 2025 Fund | 24,337,226 |
| Schwab Target 2030 Fund | 46,509,219 |
| Schwab Target 2035 Fund | 17,830,955 |
| Schwab Target 2040 Fund | 46,775,680 |
| Schwab Target 2045 Fund | 5,468,227 |
| Schwab Target 2050 Fund | 6,628,300 |
| Schwab Target 2055 Fund | 3,427,752 |
| Schwab Target 2060 Fund | 643,727 |
| Schwab Target 2065 Fund | — |
| Schwab Target 2010 Fund | $16,168 |
| Schwab Target 2015 Fund | 22,919 |
| Schwab Target 2020 Fund | 160,864 |
| Schwab Target 2025 Fund | 250,417 |
| Schwab Target 2030 Fund | 508,554 |
| Schwab Target 2035 Fund | 301,909 |
| Schwab Target 2040 Fund | 649,167 |
| Schwab Target 2045 Fund | 131,341 |
| Schwab Target 2050 Fund | 50,892 |
| Schwab Target 2055 Fund | 86,801 |
| Schwab Target 2060 Fund | 8,641 |
| Schwab Target 2065 Fund | 2,505 |
| Schwab Target 2010 Fund | 9.21% |
| Schwab Target 2015 Fund | 8.73% |
| Schwab Target 2020 Fund | 8.51% |
| Schwab Target 2025 Fund | 5.29% |
| Schwab Target 2030 Fund | 1.99% |
| Schwab Target 2035 Fund | 0.27% |
| Schwab Target 2040 Fund | 0.18% |
| Schwab Target 2045 Fund | 0.11% |
| Schwab Target 2050 Fund | 0.08% |
| Schwab Target 2055 Fund | 0.05% |
| Schwab Target 2060 Fund | 0.03% |
| Schwab Target 2065 Fund | 0.03% |
| Proposal
– To elect each of the following individuals as trustees of the Trust: |
For | Withheld |
| Walter W. Bettinger II | 1,095,577,106.505 | 115,838,980.968 |
| Richard A. Wurster | 1,117,598,789.555 | 93,817,297.918 |
| Michael J. Beer | 1,116,890,447.505 | 94,525,639.968 |
| Robert W. Burns | 1,117,915,860.110 | 93,500,227.363 |
| Nancy F. Heller | 1,119,878,732.134 | 91,537,355.339 |
| David L. Mahoney | 1,069,125,022.434 | 142,291,065.039 |
| Jane P. Moncreiff | 1,120,187,927.838 | 91,228,159.635 |
| Kiran M. Patel | 1,116,689,111.571 | 94,726,975.902 |
| Kimberly S. Patmore | 1,119,941,056.059 | 91,475,031.414 |
| J. Derek Penn | 1,117,666,014.121 | 93,750,073.352 |
| Independent Trustees | |||
| Name,
Year of Birth, and Position(s) with the trust (Terms of office, and length of Time Served1) |
Principal
Occupations During the Past Five Years |
Number
of Portfolios in Fund Complex Overseen by the Trustee |
Other Directorships |
|
Michael J. Beer 1961 Trustee (Trustee of The Charles Schwab Family of Funds, Schwab Investments, Schwab Capital Trust, Schwab Annuity Portfolios, Schwab Strategic Trust and Laudus Trust since 2022) |
Retired. Director, President and Chief Executive Officer (Dec. 2016 – Sept. 2019), Principal Funds (investment management). | 105 | Director (2016 – 2019), Principal Funds, Inc. |
| Robert
W. Burns 1959 Trustee (Trustee of Schwab Strategic Trust since 2009; The Charles Schwab Family of Funds, Schwab Investments, Schwab Capital Trust, Schwab Annuity Portfolios and Laudus Trust since 2016) |
Retired/Private Investor. | 105 | None |
| Nancy
F. Heller 1956 Trustee (Trustee of The Charles Schwab Family of Funds, Schwab Investments, Schwab Capital Trust, Schwab Annuity Portfolios, Schwab Strategic Trust and Laudus Trust since 2018) |
Retired. | 105 | None |
| David
L. Mahoney 1954 Trustee (Trustee of The Charles Schwab Family of Funds, Schwab Investments, Schwab Capital Trust, Schwab Annuity Portfolios and Laudus Trust since 2011; Schwab Strategic Trust since 2016) |
Private Investor. | 105 | Director
(2004 – present), Corcept Therapeutics Incorporated Director (2009 – 2021), Adamas Pharmaceuticals, Inc. Director (2003 – 2019), Symantec Corporation |
| Jane
P. Moncreiff 1961 Trustee (Trustee of The Charles Schwab Family of Funds, Schwab Investments, Schwab Capital Trust, Schwab Annuity Portfolios, Schwab Strategic Trust and Laudus Trust since 2019) |
Consultant (2018 – present), Fulham Advisers LLC (management consulting); Chief Investment Officer (2009 – 2017), CareGroup Healthcare System, Inc. (healthcare). | 105 | None |
| Independent Trustees (continued) | |||
| Name,
Year of Birth, and Position(s) with the trust (Terms of office, and length of Time Served1) |
Principal
Occupations During the Past Five Years |
Number
of Portfolios in Fund Complex Overseen by the Trustee |
Other Directorships |
| Kiran
M. Patel 1948 Trustee (Trustee of The Charles Schwab Family of Funds, Schwab Investments, Schwab Capital Trust, Schwab Annuity Portfolios and Laudus Trust since 2011; Schwab Strategic Trust since 2016) |
Retired. | 105 | Director (2008 – present), KLA-Tencor Corporation |
| Kimberly
S. Patmore 1956 Trustee (Trustee of The Charles Schwab Family of Funds, Schwab Investments, Schwab Capital Trust, Schwab Annuity Portfolios, Schwab Strategic Trust and Laudus Trust since 2016) |
Consultant (2008 – present), Patmore Management Consulting (management consulting). | 105 | None |
|
J. Derek Penn 1957 Trustee (Trustee of The Charles Schwab Family of Funds, Schwab Investments, Schwab Capital Trust, Schwab Annuity Portfolios, Schwab Strategic Trust and Laudus Trust since 2021) |
Head of Equity Sales and Trading (2006 – 2018), BNY Mellon (financial services). | 105 | None |
| Interested Trustees | |||
| Name,
Year of Birth, and Position(s) with the trust (Terms of office, and length of Time Served1) |
Principal
Occupations During the Past Five Years |
Number
of Portfolios in Fund Complex Overseen by the Trustee |
Other Directorships |
| Walter
W. Bettinger II2 1960 Chairman and Trustee (Trustee of The Charles Schwab Family of Funds, Schwab Investments, Schwab Capital Trust and Schwab Annuity Portfolios since 2008; Schwab Strategic Trust since 2009; Laudus Trust since 2010) |
Co-Chairman of the Board (July 2022 – present), Director and Chief Executive Officer (Oct. 2008 – present) and President (Feb. 2007 – Oct. 2021), The Charles Schwab Corporation; President and Chief Executive Officer (Oct. 2008 – Oct. 2021) and Director (May 2008 – Oct. 2021), Charles Schwab & Co., Inc.; Director (Apr. 2006 – present), Charles Schwab Bank, SSB; Director (Nov. 2017 – present), Charles Schwab Premier Bank, SSB; Director (July 2019 – present), Charles Schwab Trust Bank; Director (May 2008 – present), Chief Executive Officer (Aug. 2017 – present) and President (Aug. 2017 – Nov. 2021), Schwab Holdings, Inc.; Director (Oct. 2020 – present), TD Ameritrade Holding Corporation; Director (July 2016 – Oct. 2021), Charles Schwab Investment Management, Inc. | 105 | Director (2008 – present), The Charles Schwab Corporation |
| Interested Trustees (continued) | |||
| Name,
Year of Birth, and Position(s) with the trust (Terms of office, and length of Time Served1) |
Principal
Occupations During the Past Five Years |
Number
of Portfolios in Fund Complex Overseen by the Trustee |
Other Directorships |
| Richard
A. Wurster2 1973 Trustee (Trustee of The Charles Schwab Family of Funds, Schwab Investments, Schwab Capital Trust, Schwab Annuity Portfolios, Schwab Strategic Trust and Laudus Trust since 2022) |
President (Oct. 2021 – present) and Executive Vice President – Schwab Asset Management Solutions (Apr. 2019 – Oct. 2021), The Charles Schwab Corporation; President, Director (Oct. 2021 – present), Executive Vice President – Schwab Asset Management Solutions (July 2019 – Oct. 2021) and Senior Vice President – Advisory (May 2016 – July 2019), Charles Schwab & Co., Inc.; President (Nov. 2021 – present), Schwab Holdings, Inc.; Director (Oct. 2021 – present) and Chief Executive Officer (Nov. 2019 – Jan. 2022), Charles Schwab Investment Management, Inc.; Director, Chief Executive Officer and President (Mar. 2018 – Oct. 2022), Charles Schwab Investment Advisory, Inc.; Chief Executive Officer (July 2016 – Apr. 2018) and President (Mar. 2017 – Apr. 2018), ThomasPartners, Inc.; Chief Executive Officer (July 2016 – Apr. 2018), Windhaven Investment Management, Inc. | 105 | None |
| Officers of the Trust | |
| Name,
Year of Birth, and Position(s) with the trust (Terms of office, and length of Time Served3) |
Principal Occupations During the Past Five Years |
| Jonathan
de St. Paer 1973 President and Chief Executive Officer (Officer of The Charles Schwab Family of Funds, Schwab Investments, Schwab Capital Trust, Schwab Annuity Portfolios, Schwab Strategic Trust and Laudus Trust since 2018) |
Director (Apr. 2019 – present), President (Oct. 2018 – present), Chief Operating Officer (Jan. 2021 – present), and Chief Executive Officer (Apr. 2019 – Nov. 2019), Charles Schwab Investment Management, Inc.; Senior Vice President (June 2020 – Mar. 2022) and Chief Operating Officer (Jan. 2021 – Mar. 2022), Charles Schwab Investment Advisory, Inc.; Chief Executive Officer (Apr. 2019 – present), President (Nov. 2018 – present) and Trustee (Apr. 2019 – Dec. 2020), Schwab Funds, Laudus Trust and Schwab ETFs; Managing Director (May 2022 – present), Senior Vice President (Apr. 2019 – May 2022) and Senior Vice President – Strategy and Product Development (CSIM) (Jan. 2014 – Mar. 2019), Charles Schwab & Co., Inc. |
| Mark
Fischer 1970 Treasurer, Chief Financial Officer and Chief Operating Officer (Officer of The Charles Schwab Family of Funds, Schwab Investments, Schwab Capital Trust, Schwab Annuity Portfolios, Schwab Strategic Trust and Laudus Trust since 2013) |
Treasurer and Chief Financial Officer (Jan. 2016 – present) and Chief Operating Officer (Dec. 2020 – present), Schwab Funds, Laudus Trust and Schwab ETFs; Chief Financial Officer (Mar. 2020 – present) and Vice President (Oct. 2013 – present), Charles Schwab Investment Management, Inc. |
| Omar
Aguilar 1970 Vice President and Chief Investment Officer (Officer of The Charles Schwab Family of Funds, Schwab Investments, Schwab Capital Trust, Schwab Annuity Portfolios, Schwab Strategic Trust and Laudus Trust since 2011) |
Chief Executive Officer (Jan. 2022 – present), Chief Investment Officer (Apr. 2011 – present) and Senior Vice President (Apr. 2011 – Dec. 2021), Charles Schwab Investment Management, Inc.; Director, Chief Executive Officer and President (Oct. 2022 – present), Charles Schwab Investment Advisory, Inc.; Vice President and Chief Investment Officer (June 2011 – present), Schwab Funds, Laudus Trust and Schwab ETFs. |
| Brett
Wander 1961 Vice President and Chief Investment Officer (Officer of The Charles Schwab Family of Funds, Schwab Investments, Schwab Capital Trust, Schwab Annuity Portfolios, Schwab Strategic Trust and Laudus Trust since 2011) |
Senior Vice President and Chief Investment Officer (Apr. 2011 – present), Charles Schwab Investment Management, Inc.; Vice President and Chief Investment Officer (June 2011 – present), Schwab Funds, Laudus Trust and Schwab ETFs. |
| William
P. McMahon, Jr. 1972 Vice President and Chief Investment Officer (Officer of The Charles Schwab Family of Funds, Schwab Investments, Schwab Capital Trust, Schwab Annuity Portfolios, Schwab Strategic Trust and Laudus Trust since 2021) |
Senior Vice President and Chief Investment Officer (Jan. 2020 – present), Charles Schwab Investment Management, Inc.; Vice President and Chief Investment Officer (June 2021 – present), Schwab Funds, Laudus Trust and Schwab ETFs; Senior Vice President and Chief Investment Officer – ThomasPartners Strategies (Apr. 2018 – Dec. 2019), Charles Schwab Investment Advisory, Inc.; Senior Vice President and Chief Investment Officer (May 2001 – Apr. 2018), ThomasPartners, Inc. |
| Officers of the Trust (continued) | |
| Name,
Year of Birth, and Position(s) with the trust (Terms of office, and length of Time Served3) |
Principal Occupations During the Past Five Years |
| Catherine
MacGregor 1964 Chief Legal Officer and Secretary, Schwab Funds and Schwab ETFs Chief Legal Officer, Vice President and Clerk, Laudus Trust (Officer of The Charles Schwab Family of Funds, Schwab Investments, Schwab Capital Trust, Schwab Annuity Portfolios and Laudus Trust since 2005; Schwab Strategic Trust since 2009) |
Chief Legal Officer (Mar. 2022 – present) and Vice President (Sept. 2005 – present), Charles Schwab Investment Management, Inc.; Managing Director (May 2022 – present) and Vice President (July 2005 – May 2022), Charles Schwab & Co., Inc.; Vice President (Dec. 2005 – present) and Chief Legal Officer and Clerk (Mar. 2007 – present), Laudus Trust; Chief Legal Officer and Secretary (Oct. 2021 – present), Vice President (Nov. 2005 – Oct. 2021) and Assistant Secretary (June 2007 – Oct. 2021), Schwab Funds; Chief Legal Officer and Secretary (Oct. 2021 – present), Vice President and Assistant Secretary (Oct. 2009 – Oct. 2021), Schwab ETFs. |
| 1 | Each Trustee shall hold office until the election and qualification of his or her successor, or until he or she dies, resigns or is removed. The retirement policy requires that each independent trustee retire by December 31 of the year in which the Trustee turns 74 or the Trustee’s twentieth year of service as an independent trustee on any trust in the Fund Complex, whichever occurs first. |
| 2 | Mr. Bettinger and Mr. Wurster are Interested Trustees. Mr. Bettinger and Mr. Wurster are Interested Trustees because each owns stock of The Charles Schwab Corporation (CSC), the parent company of Charles Schwab Investment Management, Inc., the investment adviser for the trusts in the Fund Complex, and is an employee of Charles Schwab & Co., Inc. (Schwab), the principal underwriter for The Charles Schwab Family of Funds, Schwab Investments, Schwab Capital Trust, Schwab Annuity Portfolios and Laudus Trust. |
| 3 | The President, Treasurer and Secretary/Clerk hold office until their respective successors are chosen and qualified or until he or she sooner dies, resigns, is removed or becomes disqualified. Each of the other officers serves at the pleasure of the Board. |
Schwab Funds
| ¹ | State, local, and the Federal Alternative Minimum Tax may apply. Capital gains are not exempt from Federal Taxation. |
| ² | You could lose money by investing in the Schwab Money Funds. All Schwab Money Funds with the exception of Schwab Variable Share Price Money Fund seek to preserve the value of your investment at $1.00 per share, but cannot guarantee they will do so. Because the share price of Schwab Variable Share Price Money Fund will fluctuate, when you sell your shares they may be worth more or less than what you originally paid for them. All Schwab Money Funds with the exception of Schwab Government Money Fund, Schwab Retirement Government Money Fund, Schwab U.S. Treasury Money Fund, Schwab Treasury Obligations Money Fund and Schwab Government Money Market Portfolio may impose a fee upon the sale of your shares or may temporarily suspend your ability to sell shares if the Fund’s liquidity falls below required minimums because of market conditions or other factors. An investment in the Schwab Money Funds is not insured or guaranteed by the Federal Deposit Insurance Corporation or any other government agency. The Schwab Money Funds’ sponsor has no legal obligation to provide financial support to the Funds, and you should not expect that the sponsor will provide financial support to the Funds at any time. |
Item 2: Code of Ethics.
| (a) | Registrant has adopted a code of ethics that applies to its principal executive officer, principal financial officer, and any other persons who perform a similar function, regardless of whether these individuals are employed by Registrant or a third party. |
| (c) | During the period covered by the report, no amendments were made to the provisions of this code of ethics. |
| (d) | During the period covered by the report, Registrant did not grant any waivers, including implicit waivers, from the provisions of this code of ethics. |
| (e) | Not applicable. |
| (f)(1) | Registrant has filed this code of ethics as an exhibit pursuant to Item 13(a)(1) of Form N-CSR. |
Item 3: Audit Committee Financial Expert.
Registrant’s Board of Trustees has determined that Kiran M. Patel, Kimberly S. Patmore and J. Derek Penn, each currently serving on its audit, compliance and valuation committee, are each an “audit committee financial expert,” as such term is defined in Item 3 of Form N-CSR. Each member of Registrant’s audit, compliance and valuation committee is “independent” under the standards set forth in Item 3 of Form N-CSR.
The designation of each of Mr. Patel, Ms. Patmore and Mr. Penn as an “audit committee financial expert” pursuant to Item 3 of Form N-CSR does not (i) impose upon such individual any duties, obligations, or liability that are greater than the duties, obligations and liability imposed upon such individual as a member of Registrant’s audit, compliance and valuation committee or Board of Trustees in the absence of such designation; and (ii) affect the duties, obligations or liability of any other member of Registrant’s audit, compliance and valuation committee or Board of Trustees.
Item 4: Principal Accountant Fees and Services.
Registrant is composed of fifty-two operational series. Thirty-six series have a fiscal year-end of October 31, whose annual financial statements are reported in Item 1, three series have a fiscal year-end of December 31, twelve series have a fiscal year-end of March 31, and one series has a fiscal year-end of the last day of February. Principal accountant fees disclosed in Items 4(a)-(d) and 4(g) include fees billed for services rendered to the fifty-two operational series during 2022/2023 and the fifty-two operational series during 2021/2022, based on their respective 2022/2023 and 2021/2022 fiscal years, as applicable.
The following table presents fees billed by the principal accountant in each of the last two fiscal years for the services rendered to the Funds:
| (a) Audit Fees1 | (b) Audit-Related Fees2 | (c) Tax Fees3 | (d) All Other Fees | |||||||||||||||||||||||||||
| Fiscal Year 2022/2023 |
Fiscal Year 2021/2022 |
Fiscal Year 2022/2023 |
Fiscal Year 2021/2022 |
Fiscal Year 2022/2023 |
Fiscal Year 2021/2022 |
Fiscal Year 2022/2022 |
Fiscal Year 2021/2022 |
|||||||||||||||||||||||
| $ | 1,195,825 | $ | 1,187,075 | $ | 90,000 | $ | 90,000 | $ | 161,200 | $ | 161,200 | $ | 0 | $ | 0 | |||||||||||||||
| 1 | The nature of the services includes audit of the registrant’s annual financial statements and normally provided services in connection with regulatory filings for those fiscal years. |
| 2 | The nature of the services includes assurance and related services reasonably related to the performance of the audit of financial statements not included in Audit Fees. |
| 3 | The nature of the services includes tax compliance, tax advice and tax planning. |
| (e) (1) | Registrant’s audit, compliance and valuation committee does not have pre-approval policies and procedures as described in paragraph (c)(7) of Rule 2-01 of Regulation S-X. |
| (2) | There were no services described in each of paragraphs (b) through (d) above that were approved by Registrant’s audit, compliance and valuation committee pursuant to paragraph (c)(7)(i)(C) of Rule 2-01 of Regulation S-X. |
| (f) | Not applicable. |
| (g) | Below are the aggregate non-audit fees billed in each of the last two fiscal years by Registrant’s principal accountant for services rendered to Registrant, to Registrant’s investment adviser, and to any entity controlling, controlled by, or under common control with Registrant’s investment adviser that provides ongoing services to Registrant. |
| 2021/2022: $8,528,894 | 2020/2021: $3,309,631 |
| (h) | During the past fiscal year, all non-audit services provided by Registrant’s principal accountant to either Registrant’s investment adviser or to any entity controlling, controlled by, or under common control with Registrant’s investment adviser that provides ongoing services to Registrant were pre-approved. Included in the audit, compliance and valuation committee’s pre-approval was the review and consideration as to whether the provision of these non-audit services is compatible with maintaining the principal accountant’s independence. |
| (i) | Not applicable. |
| (j) | Not applicable. |
Item 5: Audit Committee of Listed Registrants.
Not applicable.
Item 6: Schedule of Investments.
The schedules of investments are included as part of the report to shareholders filed under Item 1 of this Form.
Item 7: Disclosure of Proxy Voting Policies and Procedures for Closed-End Management Investment Companies.
Not applicable.
Item 8: Portfolio Managers of Closed-End Management Investment Companies.
Not applicable.
Item 9: Purchases of Equity Securities by Closed-End Management Investment Company and Affiliated Purchasers.
Not applicable.
Item 10: Submission of Matters to a Vote of Security Holders.
Not applicable.
Item 11: Controls and Procedures.
| (a) | Based on their evaluation of Registrant’s disclosure controls and procedures, as of a date within 90 days of the filing date, Registrant’s Chief Executive Officer, Jonathan de St. Paer and Registrant’s Chief Financial Officer, Mark Fischer, have concluded that Registrant’s disclosure controls and procedures are: (i) reasonably designed to ensure that information required to be disclosed in this report is appropriately communicated to Registrant’s officers to allow timely decisions regarding disclosures required in this report; (ii) reasonably designed to ensure that information required to be disclosed in this report is recorded, processed, summarized and reported in a timely manner; and (iii) are effective in achieving the goals described in (i) and (ii) above. |
| (b) | During the period covered by this report, there have been no changes in Registrant’s internal control over financial reporting that the above officers believe to have materially affected, or to be reasonably likely to materially affect, Registrant’s internal control over financial reporting. |
Item 12: Disclosure of Securities Lending Activities for Closed-End Management Investment Companies.
Not applicable.
Item 13: Exhibits.
| (a) (1) |
| (2) |
| (b) |
Pursuant to the requirements of the Securities Exchange Act of 1934 and the Investment Company Act of 1940, the registrant has duly caused this report to be signed on its behalf by the undersigned, thereunto duly authorized.
(Registrant) Schwab Capital Trust
| By: | /s/ Jonathan de St. Paer | |
| Jonathan de St. Paer Chief Executive Officer | ||
| Date: | December 16, 2022 | |
Pursuant to the requirements of the Securities Exchange Act of 1934 and the Investment Company Act of 1940, this report has been signed below by the following persons on behalf of the registrant and in the capacities and on the dates indicated.
| By: | /s/ Jonathan de St. Paer | |
| Jonathan de St. Paer Chief Executive Officer | ||
| Date: | December 16, 2022 | |
| By: | /s/ Mark Fischer | |
| Mark Fischer Chief Financial Officer | ||
| Date: | December 16, 2022 | |