| |
SUMMARY | |
TRBCX TBCIX PABGX RRBGX | Investor Class I Class Advisor Class R Class |
May 1, 2017 | |
T. Rowe Price Blue Chip Growth Fund | |
A fund seeking long-term capital growth through investments in stocks of large- and mid-cap companies with strong fundamentals and leading market positions. | |
Before
you invest, you may want to review the fund’s prospectus, which contains more information about
the fund and its risks. You can find the fund’s prospectus and other information about the fund
online at troweprice.com/prospectus.
You can also get this information at no cost by calling The Securities and Exchange Commission has not approved or disapproved these securities or passed upon the adequacy of this prospectus. Any representation to the contrary is a criminal offense. | |
| |

Summary | 1 |
Investment Objective
The fund seeks to provide long-term capital growth. Income is a secondary objective.
Fees and Expenses
This table describes the fees and expenses that you may pay if you buy and hold shares of the fund. You may also incur brokerage commissions and other charges when buying or selling shares of the fund, which are not reflected in the table.
Fees and Expenses of the Fund
Investor | I | Advisor | R | |||||
Shareholder fees (fees paid directly from your investment) | ||||||||
Maximum account fee | $20 | a | — | — | — | |||
Annual
fund operating expenses | ||||||||
Management fees | 0.57 | % | 0.57 | % | 0.57 | % | 0.57 | % |
Distribution and service (12b-1) fees | — | — | 0.25 | 0.50 | ||||
Other expenses | 0.15 | 0.01 | 0.16 | 0.18 | ||||
Total annual fund operating expenses | 0.72 | 0.58 | 0.98 | 1.25 | ||||
a Subject to certain exceptions, accounts with a balance of less than $10,000 are charged an annual $20 fee.
Example This example is intended to help you compare the cost of investing in the fund with the cost of investing in other mutual funds. The example assumes that you invest $10,000 in the fund for the time periods indicated and then redeem all of your shares at the end of those periods, that your investment has a 5% return each year, and that the fund’s operating expenses remain the same. Although your actual costs may be higher or lower, based on these assumptions your costs would be:
1 year | 3 years | 5 years | 10 years | |
Investor Class | $74 | $230 | $401 | $894 |
I Class | 59 | 186 | 324 | 726 |
Advisor Class | 100 | 312 | 542 | 1,201 |
R Class | 127 | 397 | 686 | 1,511 |
Portfolio Turnover The fund pays transaction costs, such as commissions, when it buys and sells securities (or “turns over” its portfolio). A higher portfolio turnover rate may indicate higher transaction costs and may result in higher taxes when the fund’s shares are held in a taxable account. These costs, which are not reflected in annual fund operating expenses or in the example, affect the fund’s performance. During the most recent fiscal year, the fund’s portfolio turnover rate was 32.4% of the average value of its portfolio.
T. Rowe Price | 2 |
Investments, Risks, and Performance
Principal Investment Strategies The fund will normally invest at least 80% of its net assets (including any borrowings for investment purposes) in the common stocks of large and medium-sized blue chip growth companies. These are firms that, in the investment adviser’s view, are well established in their industries and have the potential for above-average earnings growth. The fund focuses on companies with leading market positions, seasoned management, and strong financial fundamentals. The fund’s investment approach reflects the adviser’s belief that solid company fundamentals (with an emphasis on the potential for strong growth in earnings per share or operating cash flow) combined with a positive outlook for a company’s industry will ultimately reward investors with strong investment performance. Some of the companies the adviser targets for the fund should have good prospects for dividend growth, and the fund may at times invest significantly in stocks of technology companies.
In pursuing its investment objective, the fund has the discretion to deviate from its normal investment criteria. These situations might arise when the fund’s adviser believes a security could increase in value for a variety of reasons, including an extraordinary corporate event, a new product introduction or innovation, a favorable competitive development, or a change in management.
While most assets will typically be invested in U.S. common stocks, the fund may invest in foreign stocks in keeping with the fund’s objectives.
The fund may sell securities for a variety of reasons, such as to secure gains, limit losses, or redeploy assets into more promising opportunities.
Principal Risks As with any mutual fund, there is no guarantee that the fund will achieve its objective. The fund’s share price fluctuates, which means you could lose money by investing in the fund. The principal risks of investing in this fund are summarized as follows:
Active management risks The investment adviser’s judgments about the attractiveness, value, or potential appreciation of the fund’s investments may prove to be incorrect. If the investments selected and strategies employed by the fund fail to produce the intended results, the fund could underperform in comparison to other funds with similar objectives and investment strategies.
Risks of U.S. stock investing Stocks generally fluctuate in value more than bonds and may decline significantly over short time periods. There is a chance that stock prices overall will decline because stock markets tend to move in cycles, with periods of rising and falling prices. The value of a stock in which the fund invests may decline due to general weakness in the U.S. stock market, such as when the U.S. financial markets decline, or because of factors that affect a particular company or industry.
Investment style risks Different investment styles tend to shift in and out of favor depending on market conditions and investor sentiment. The fund’s growth
Summary | 3 |
approach to investing could cause it to underperform other stock funds that employ a different investment style. Growth stocks tend to be more volatile than certain other types of stocks, and their prices may fluctuate more dramatically than the overall stock market. A stock with growth characteristics can have sharp price declines due to decreases in current or expected earnings and may lack dividends that can help cushion its share price in a declining market.
Market capitalization risks The fund’s focus on large and medium-sized companies subjects the fund to the risks that larger companies may not be able to attain the high growth rates of successful smaller companies, especially during strong economic periods, and that they may be less capable of responding quickly to competitive challenges and industry changes. Because the fund focuses on large and medium sized companies, its share price could be more volatile than a fund that invests only in large companies. Medium-sized companies typically have less experienced management, narrower product lines, more limited financial resources, and less publicly available information than larger companies.
Industry risks To the extent the fund invests in specific industries or sectors, it may be more susceptible to developments affecting those industries and sectors. For example, the fund may at times have significant investments in technology companies, which could result in the fund performing poorly during a downturn in one or more of the industries that heavily impact technology companies. Technology companies can be adversely affected by, among other things, intense competition, earnings disappointments, and rapid obsolescence of products and services due to technological innovations or changing consumer preferences.
Foreign investing risks The fund’s investments in foreign securities may be adversely affected by local, political, social, and economic conditions overseas, greater volatility, reduced liquidity, or decreases in foreign currency values relative to the U.S. dollar. These risks are heightened for the fund’s investments in emerging markets, which are more susceptible to governmental interference, less efficient trading markets, and the imposition of local taxes or restrictions on gaining access to sales proceeds for foreign investors.
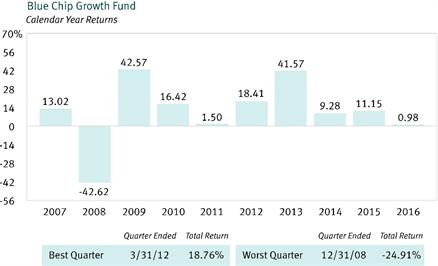
Performance The following performance information provides some indication of the risks of investing in the fund. The fund’s performance information represents only past performance (before and after taxes) and is not necessarily an indication of future results.
The following bar chart illustrates how much returns can differ from year to year by showing calendar year returns and the best and worst calendar quarter returns during those years for the fund’s Investor Class. Returns for other share classes vary since they have different expenses.
T. Rowe Price | 4 |
The following table shows the average annual total returns for each class of the fund that has been in operation for at least one full calendar year, and also compares the returns with the returns of a relevant broad-based market index, as well as with the returns of one or more comparative indexes that have investment characteristics similar to those of the fund.
In addition, the table shows hypothetical after-tax returns to demonstrate how taxes paid by a shareholder may influence returns. After-tax returns are calculated using the historical highest individual federal marginal income tax rates and do not reflect the impact of state and local taxes. Actual after-tax returns depend on an investor’s tax situation and may differ from those shown. After-tax returns shown are not relevant to investors who hold their fund shares through tax-deferred arrangements, such as a 401(k) account or individual retirement account. After-tax returns are shown only for the Investor Class and will differ for other share classes.
Summary | 5 |
Average Annual Total Returns |
|
|
| |||||||||||||
|
|
| Periods ended |
| ||||||||||||
| December 31, 2016 |
| ||||||||||||||
|
| |||||||||||||||
| Since | Inception |
| |||||||||||||
| 1 Year | 5 Years | 10 Years | inception | date |
| ||||||||||
| Investor Class | 06/30/1993 |
| |||||||||||||
| Returns before taxes | 0.98 | % |
| 15.51 | % |
| 8.43 | % |
| — | % |
|
|
| |
| Returns after taxes on distributions | 0.83 |
|
| 15.03 |
|
| 8.19 |
|
| — |
|
|
|
| |
| Returns after taxes on distributions |
|
|
|
|
|
|
|
|
|
|
|
|
|
| |
| and sale of fund shares | 0.69 |
|
| 12.50 |
|
| 6.89 |
|
| — |
|
|
|
| |
| I Class | 12/17/2015 |
| |||||||||||||
| Returns before taxes | 1.13 |
|
| — |
|
| — |
|
| 1.05 |
|
|
|
| |
| Advisor Class | 03/31/2000 |
| |||||||||||||
| Returns before taxes | 0.72 |
|
| 15.21 |
|
| 8.18 |
|
| — |
|
|
|
| |
| R Class | 09/30/2002 |
| |||||||||||||
| Returns before taxes | 0.45 |
|
| 14.92 |
|
| 7.91 |
|
| — |
|
|
|
| |
| S&P 500 Index (reflects no deduction for fees, expenses, or taxes) | 11.96 |
|
| 14.66 |
|
| 6.95 |
|
| 11.67 | a |
|
|
| |
| Lipper Large-Cap Growth Funds Index | 0.54 |
|
| 12.96 |
|
| 6.73 |
|
| 0.53 | a |
|
|
| |
a Return as of 12/17/15.
Updated performance information is available through troweprice.com.
Management
Investment Adviser T. Rowe Price Associates, Inc. (T. Rowe Price)
Portfolio Manager | Title | Managed Fund Since | Joined Investment |
Larry J. Puglia | Chairman of Investment Advisory Committee | 1993 | 1990 |
Purchase and Sale of Fund Shares
The fund generally requires a $2,500 minimum initial investment ($1,000 minimum initial investment if opening an IRA, a custodial account for a minor, or a small business retirement plan account). Additional purchases generally require a $100 minimum. These investment minimums may be waived or modified for financial intermediaries and certain employer-sponsored retirement plans submitting orders on behalf of their customers. Advisor Class and R Class shares may generally only be purchased through a financial intermediary or retirement plan.
The I Class generally requires a $1,000,000 minimum initial investment and there is no minimum for additional purchases, although the initial investment minimum may be waived for intermediaries and retirement plans maintaining omnibus accounts,
T. Rowe Price | 6 |
and certain institutional client accounts for which T. Rowe Price or its affiliate has discretionary investment authority.
For investors holding shares of the fund directly with T. Rowe Price, you may purchase, redeem, or exchange fund shares by mail; by telephone (1-800-225-5132 for IRAs and nonretirement accounts; 1-800-492-7670 for small business retirement plans; and 1-800-638-8790 for institutional investors and financial intermediaries); or, for certain accounts, by accessing your account online through troweprice.com.
If you hold shares through a financial intermediary or retirement plan, you must purchase, redeem, and exchange shares of the fund through your intermediary or retirement plan. You should check with your intermediary or retirement plan to determine the investment minimums that apply to your account.
Tax Information
Any dividends or capital gains are declared and paid annually, usually in December. Redemptions or exchanges of fund shares and distributions by the fund, whether or not you reinvest these amounts in additional fund shares, may be taxed as ordinary income or capital gains unless you invest through a tax-deferred account (in which case you will be taxed upon withdrawal from such account).
Payments to Broker-Dealers and Other Financial Intermediaries
If you purchase shares of the fund through a broker-dealer or other financial intermediary (such as a bank), the fund and its related companies may pay the intermediary for the sale of fund shares and related services. These payments may create a conflict of interest by influencing the broker-dealer or other intermediary and your salesperson to recommend the fund over another investment. Ask your salesperson or visit your financial intermediary’s website for more information. However, the fund and its investment adviser do not pay broker-dealers and other financial intermediaries for sales or related services of the I Class shares.
T. Rowe Price
Associates, Inc. | F93-045 5/1/17 |