0000902259-16-000064.txt : 20160511
0000902259-16-000064.hdr.sgml : 20160511
20160511064627
ACCESSION NUMBER: 0000902259-16-000064
CONFORMED SUBMISSION TYPE: 485BPOS
PUBLIC DOCUMENT COUNT: 25
FILED AS OF DATE: 20160511
DATE AS OF CHANGE: 20160511
EFFECTIVENESS DATE: 20160511
FILER:
COMPANY DATA:
COMPANY CONFORMED NAME: T. Rowe Price Blue Chip Growth Fund, Inc.
CENTRAL INDEX KEY: 0000902259
IRS NUMBER: 521827505
FISCAL YEAR END: 1231
FILING VALUES:
FORM TYPE: 485BPOS
SEC ACT: 1933 Act
SEC FILE NUMBER: 033-49581
FILM NUMBER: 161637731
BUSINESS ADDRESS:
STREET 1: 100 EAST PRATT STREET
CITY: BALTIMORE
STATE: MD
ZIP: 21202
BUSINESS PHONE: 410-345-2000
MAIL ADDRESS:
STREET 1: 100 EAST PRATT STREET
CITY: BALTIMORE
STATE: MD
ZIP: 21202
FORMER COMPANY:
FORMER CONFORMED NAME: PRICE T ROWE BLUE CHIP GROWTH FUND INC
DATE OF NAME CHANGE: 19930426
FILER:
COMPANY DATA:
COMPANY CONFORMED NAME: T. Rowe Price Blue Chip Growth Fund, Inc.
CENTRAL INDEX KEY: 0000902259
IRS NUMBER: 521827505
FISCAL YEAR END: 1231
FILING VALUES:
FORM TYPE: 485BPOS
SEC ACT: 1940 Act
SEC FILE NUMBER: 811-07059
FILM NUMBER: 161637732
BUSINESS ADDRESS:
STREET 1: 100 EAST PRATT STREET
CITY: BALTIMORE
STATE: MD
ZIP: 21202
BUSINESS PHONE: 410-345-2000
MAIL ADDRESS:
STREET 1: 100 EAST PRATT STREET
CITY: BALTIMORE
STATE: MD
ZIP: 21202
FORMER COMPANY:
FORMER CONFORMED NAME: PRICE T ROWE BLUE CHIP GROWTH FUND INC
DATE OF NAME CHANGE: 19930426
0000902259
S000002069
T. Rowe Price Blue Chip Growth Fund, Inc.
C000005424
T. Rowe Price Blue Chip Growth Fund, Inc.
TRBCX
C000005425
T. Rowe Price Blue Chip Growth Fund-Advisor Class
PABGX
C000005426
T. Rowe Price Blue Chip Growth Fund-R Class
RRBGX
C000166329
T. Rowe Price Blue Chip Growth Fund-I Class
TBCIX
485BPOS
1
bcgxbrl-51201111.htm
Untitled Document
Registration
Nos. 033-49581/811-7059
UNITED STATES SECURITIES AND EXCHANGE COMMISSION WASHINGTON, D.C. 20549 FORM N-1A
REGISTRATION
STATEMENT UNDER THE SECURITIES ACT OF 1933
/X/
Post-Effective Amendment
No. 36
/X/
and/or
REGISTRATION
STATEMENT UNDER THE INVESTMENT COMPANY ACT OF 1940 /X/
Amendment
No. 37
/X/
T. ROWE PRICE BLUE CHIP GROWTH FUND, INC.
Exact Name of Registrant as Specified in Charter
100
East Pratt Street, Baltimore, Maryland 21202 Address of Principal Executive Offices
410-345-2000 Registrant’s
Telephone Number, Including Area Code
David Oestreicher
100 East Pratt Street, Baltimore, Maryland
21202 Name and Address of Agent for Service
It is proposed
that this filing will become effective (check appropriate box):
/X/ Immediately
upon filing pursuant to paragraph (b)
// On (date) pursuant
to paragraph (b)
// 60 days after filing pursuant to paragraph
(a)(1)
// On (date) pursuant to paragraph (a)(1)
// 75
days after filing pursuant to paragraph (a)(2)
// On (date) pursuant
to paragraph (a)(2) of Rule 485
If appropriate, check
the following box:
// This
post-effective amendment designates a new effective date for a previously filed post-effective amendment.
Pursuant
to the requirements of the Securities Act of 1933, as amended, and the Investment Company Act of 1940,
as amended, the Registrant certifies that it meets all of the requirements for effectiveness of this
Registration Statement pursuant to Rule 485(b) under the Securities Act of 1933 and has duly caused this
Registration Statement to be signed on its behalf by the undersigned, duly authorized, in the City of
Baltimore, State of Maryland, this May 11, 2016.
T.
ROWE PRICE BLUE CHIP GROWTH FUND, INC.
/s/Edward
C. Bernard
By: Edward C. Bernard
Chairman of the Board
Pursuant to the requirements of the Securities
Act of 1933, as amended, this Registration Statement has been signed below by the following persons in
the capacities and on the dates indicated:
Signature
Title
Date
/s/Edward C. Bernard
Chairman of the Board
May 11, 2016
Edward C. Bernard
(Chief Executive Officer)
/s/Catherine D. Mathews
Treasurer
May 11, 2016
Catherine
D. Mathews
(Chief Financial Officer)
and Vice President
*
William R. Brody
Director
May 11, 2016
*
Anthony W. Deering
Director
May
11, 2016
*
Bruce W. Duncan
Director
May
11, 2016
*
Robert J. Gerrard, Jr.
Director
May
11, 2016
*
Paul F. McBride
Director
May
11, 2016
/s/Brian C. Rogers
Director
May 11, 2016
Brian
C. Rogers
*
Cecilia E. Rouse
Director
May
11, 2016
Page
4
*
John G. Schreiber
Director
May
11, 2016
*
Mark. R. Tercek
Director
May
11, 2016
*/s/David Oestreicher
Vice President and
May 11, 2016
David Oestreicher
Attorney-In-Fact
Page
5
T.
ROWE PRICE BALANCED FUND, INC.
T. ROWE PRICE BLUE CHIP GROWTH FUND, INC.
T. ROWE PRICE CALIFORNIA TAX-FREE INCOME TRUST
T.
ROWE PRICE CAPITAL APPRECIATION FUND
T. ROWE PRICE CAPITAL OPPORTUNITY FUND, INC.
T. ROWE PRICE CORPORATE INCOME
FUND, INC.
T.
ROWE PRICE CREDIT OPPORTUNITIES FUND, INC.
T. ROWE PRICE DIVERSIFIED MID-CAP GROWTH FUND, INC.
T. ROWE PRICE DIVIDEND GROWTH
FUND, INC.
T.
ROWE PRICE EQUITY INCOME FUND
T. ROWE PRICE EQUITY SERIES, INC.
T. ROWE PRICE FINANCIAL SERVICES FUND, INC.
T.
ROWE PRICE FIXED INCOME SERIES, INC.
T. ROWE PRICE FLOATING RATE FUND, INC.
T. ROWE PRICE GLOBAL ALLOCATION
FUND, INC.
T.
ROWE PRICE GLOBAL MULTI-SECTOR BOND FUND, INC.
T. ROWE PRICE GLOBAL REAL ESTATE FUND, INC.
T. ROWE PRICE GLOBAL TECHNOLOGY
FUND, INC.
T.
ROWE PRICE GNMA FUND
T. ROWE PRICE GROWTH & INCOME FUND, INC.
T. ROWE PRICE GROWTH STOCK FUND, INC.
T. ROWE PRICE HEALTH SCIENCES
FUND, INC.
T.
ROWE PRICE HIGH YIELD FUND, INC.
T. ROWE PRICE INDEX TRUST, INC.
T. ROWE PRICE INFLATION PROTECTED
BOND FUND, INC.
T. ROWE PRICE INSTITUTIONAL EQUITY FUNDS, INC.
T. ROWE PRICE INSTITUTIONAL INCOME FUNDS, INC.
T.
ROWE PRICE INSTITUTIONAL INTERNATIONAL FUNDS, INC.
T. ROWE PRICE INTERMEDIATE TAX-FREE HIGH YIELD
FUND, INC.
T.
ROWE PRICE INTERNATIONAL FUNDS, INC.
T. ROWE PRICE INTERNATIONAL INDEX FUND, INC.
T. ROWE PRICE INTERNATIONAL
SERIES, INC.
T.
ROWE PRICE LIMITED DURATION INFLATION FOCUSED BOND FUND, INC.
T. ROWE PRICE MEDIA & TELECOMMUNICATIONS
FUND, INC.
T.
ROWE PRICE MID-CAP GROWTH FUND, INC.
T. ROWE PRICE MID-CAP VALUE FUND, INC.
T. ROWE PRICE MULTI-SECTOR
ACCOUNT PORTFOLIOS, INC.
T. ROWE PRICE NEW AMERICA GROWTH FUND T. ROWE PRICE NEW ERA FUND, INC.
T. ROWE PRICE NEW HORIZONS
FUND, INC.
T.
ROWE PRICE NEW INCOME FUND, INC.
T. ROWE PRICE PERSONAL STRATEGY FUNDS, INC.
T. ROWE PRICE PRIME RESERVE
FUND, INC.
T.
ROWE PRICE QUANTITATIVE MANAGEMENT FUNDS, INC.
T. ROWE PRICE REAL ASSETS FUND, INC.
T. ROWE PRICE REAL ESTATE FUND,
INC.
T.
ROWE PRICE RESERVE INVESTMENT FUNDS, INC.
T. ROWE PRICE RETIREMENT FUNDS, INC.
T. ROWE PRICE SCIENCE &
TECHNOLOGY FUND, INC.
T. ROWE PRICE SHORT-TERM BOND FUND, INC.
Page
6
T.
ROWE PRICE SMALL-CAP STOCK FUND, INC.
T. ROWE PRICE SMALL-CAP VALUE FUND, INC.
T. ROWE PRICE SPECTRUM FUND,
INC.
T.
ROWE PRICE STATE TAX-FREE INCOME TRUST
T. ROWE PRICE SUMMIT FUNDS, INC.
T. ROWE PRICE SUMMIT MUNICIPAL
FUNDS, INC.
T.
ROWE PRICE TAX-EFFICIENT FUNDS, INC.
T. ROWE PRICE TAX-EXEMPT MONEY FUND, INC.
T. ROWE PRICE TAX-FREE HIGH
YIELD FUND, INC.
T. ROWE PRICE TAX-FREE INCOME FUND, INC.
T. ROWE PRICE TAX-FREE SHORT-INTERMEDIATE FUND,
INC.
T.
ROWE PRICE U.S. BOND ENHANCED INDEX FUND, INC.
T. ROWE PRICE U.S. LARGE-CAP CORE FUND, INC.
T. ROWE PRICE U.S. TREASURY
FUNDS, INC.
T.
ROWE PRICE VALUE FUND, INC.
POWER OF ATTORNEY
RESOLVED, that the Corporation does hereby constitute and authorize
Edward C. Bernard, Margery K. Neale, and David Oestreicher, and each of them individually, their true
and lawful attorneys and agents to take any and all action and execute any and all instruments which
said attorneys and agents may deem necessary or advisable to enable the Corporation/Trust to comply with
the Securities Act of 1933, as amended, and the Investment Company Act of 1940, as amended, and any rules,
regulations, orders or other requirements of the United States Securities and Exchange Commission thereunder,
in connection with the registration under the Securities Act of 1933, as amended, of shares of the Corporation/Trust,
to be offered by the Corporation/Trust, and the registration of the Corporation/Trust under the Investment
Company Act of 1940, as amended, including specifically, but without limitation of the foregoing, power
and authority to sign the name of the Corporation/Trust on its behalf, and to sign the names of each
of such directors/trustees and officers on his behalf as such director/trustee or officer to any (i) Registration
Statement on Form N-1A or N-14 of the Corporation/Trust filed with the Securities and Exchange Commission
under the Securities Act of 1933, as amended; (ii) Registration Statement on Form N-1A or N-14 of
the Corporation/Trust under the Investment Company Act of 1940, as amended; (iii) amendment or supplement
(including, but not limited to, Post-Effective Amendments adding additional series or classes of the
Corporation/Trust) to said Registration Statement; and (iv) instruments or documents filed or to
be filed as a part of or in connection with such Registration Statement, including Articles Supplementary,
Articles of Amendment, and other instruments with respect to the Articles of Incorporation or Master
Trust Agreement of the Corporation/Trust.
IN WITNESS WHEREOF,
the above named Corporations/Trusts have caused these presents to be signed and the same attested by
its Secretary, each thereunto duly authorized by its Board of Directors/Trustees, and each of the undersigned
has hereunto set his hand and seal as of the day set opposite his name.
Page
7
ALL
CORPORATIONS/TRUSTS
/s/Edward C. Bernard
Edward C. Bernard
/s/Catherine D. Mathews
Chairman
of the Board (Principal Executive Officer)
Director/Trustee
April 21, 2016
Catherine D. Mathews
/s/William R. Brody
Treasurer (Principal Financial
Officer)
Vice
President
April 21, 2016
William R. Brody
/s/Anthony W. Deering
Director/Trustee
April 21, 2016
Anthony
W. Deering
/s/Bruce
W. Duncan
Director/Trustee
April 21, 2016
Bruce
W. Duncan
/s/Robert
J. Gerrard, Jr.
Director/Trustee
April
21, 2016
Robert J. Gerrard, Jr.
/s/Paul F. McBride
Director/Trustee
April 21, 2016
Paul F. McBride
/s/Cecilia E. Rouse
Director/Trustee
April 21, 2016
Cecilia E. Rouse
/s/John G. Schreiber
Director/Trustee
April 21, 2016
John G. Schreiber
/s/Mark R. Tercek
Director/Trustee
April 21, 2016
Mark
R. Tercek
Director/Trustee
April
21, 2016
(Signatures Continued)
Page
8
BRIAN
C. ROGERS, Director/Trustee
T. ROWE PRICE BALANCED FUND, INC.
T. ROWE PRICE BLUE CHIP GROWTH FUND, INC.
T.
ROWE PRICE CAPITAL APPRECIATION FUND
T. ROWE PRICE CAPITAL OPPORTUNITY FUND, INC.
T. ROWE PRICE DIVERSIFIED MID-CAP
GROWTH FUND, INC.
T. ROWE PRICE DIVIDEND GROWTH FUND, INC.
T. ROWE PRICE EQUITY INCOME FUND
T. ROWE PRICE EQUITY SERIES,
INC.
T.
ROWE PRICE FINANCIAL SERVICES FUND, INC.
T. ROWE PRICE GLOBAL ALLOCATION FUND, INC.
T. ROWE PRICE GLOBAL REAL ESTATE
FUND, INC.
T.
ROWE PRICE GLOBAL TECHNOLOGY FUND, INC.
T. ROWE PRICE GROWTH & INCOME FUND, INC.
T. ROWE PRICE GROWTH STOCK
FUND, INC.
T.
ROWE PRICE HEALTH SCIENCES FUND, INC.
T. ROWE INDEX TRUST, INC.
T. ROWE PRICE INSTITUTIONAL EQUITY FUNDS, INC.
T.
ROWE PRICE INSTITUTIONAL INTERNATIONAL FUNDS, INC.
T. ROWE PRICE INTERNATIONAL FUNDS, INC.
T.
ROWE PRICE INTERNATIONAL INDEX FUND, INC.
T. ROWE PRICE INTERNATIONAL SERIES, INC.
T. ROWE PRICE MEDIA & TELECOMMUNICATIONS
FUND, INC.
T.
ROWE PRICE MID-CAP GROWTH FUND, INC.
T. ROWE PRICE MID-CAP VALUE FUND, INC.
T. ROWE PRICE NEW AMERICA GROWTH
FUND
T.
ROWE PRICE NEW ERA FUND, INC.
T. ROWE PRICE NEW HORIZONS FUND, INC.
T. ROWE PRICE PERSONAL STRATEGY FUNDS, INC.
T.
ROWE PRICE QUANTITATIVE MANAGEMENT FUNDS, INC.
T. ROWE PRICE REAL ASSETS FUND, INC.
T. ROWE PRICE REAL ESTATE FUND,
INC.
T.
ROWE PRICE RETIREMENT FUNDS, INC.
T. ROWE PRICE SCIENCE & TECHNOLOGY FUND, INC.
T. ROWE PRICE SMALL-CAP STOCK
FUND, INC.
T.
ROWE PRICE SMALL-CAP VALUE FUND, INC.
T. ROWE PRICE SPECTRUM FUND, INC.
T. ROWE PRICE TAX-EFFICIENT
FUNDS, INC.
T.
ROWE PRICE U.S. LARGE-CAP CORE FUND, INC.
T. ROWE PRICE VALUE FUND, INC.
/s/Brian C. Rogers
Brian C. Rogers
April 21, 2016
(Signatures
Continued)
Page
9
EDWARD
A. WIESE, Director/Trustee
T. ROWE PRICE CALIFORNIA TAX-FREE INCOME TRUST
T. ROWE PRICE CORPORATE INCOME
FUND, INC.
T.
ROWE PRICE CREDIT OPPORTUNITIES FUND, INC.
T. ROWE PRICE FIXED INCOME SERIES, INC.
T. ROWE PRICE FLOATING RATE
FUND, INC.
T.
ROWE PRICE GLOBAL MULTI-SECTOR BOND FUND, INC.
T. ROWE PRICE GNMA FUND
T. ROWE PRICE HIGH YIELD FUND, INC.
T. ROWE PRICE INSTITUTIONAL
INCOME FUNDS, INC.
T. ROWE PRICE INFLATION PROTECTED BOND FUND, INC.
T. ROWE PRICE INTERMEDIATE
TAX-FREE HIGH YIELD FUND, INC.
T. ROWE PRICE LIMITED DURATION INFLATION FOCUSED BOND FUND, INC.
T. ROWE PRICE MULTI-SECTOR
ACCOUNT PORTFOLIOS, INC.
T. ROWE PRICE NEW INCOME FUND, INC.
T. ROWE PRICE PRIME RESERVE FUND, INC.
T.
ROWE PRICE RESERVE INVESTMENT FUNDS, INC.
T. ROWE PRICE SHORT-TERM BOND FUND, INC.
T. ROWE PRICE STATE TAX-FREE
INCOME TRUST
T.
ROWE PRICE SUMMIT FUNDS, INC.
T. ROWE PRICE SUMMIT MUNICIPAL FUNDS, INC.
T. ROWE PRICE TAX-EXEMPT MONEY FUND, INC.
T.
ROWE PRICE TAX-FREE HIGH YIELD FUND, INC.
T. ROWE PRICE TAX-FREE INCOME FUND, INC.
T. ROWE PRICE TAX-FREE SHORT-INTERMEDIATE
FUND, INC.
T.
ROWE PRICE U.S. BOND ENHANCED INDEX FUND, INC.
T. ROWE PRICE U.S. TREASURY FUNDS, INC.
/s/Edward A. Wiese
Edward A. Wiese
April 21, 2016
(Signatures
Continued)
Page
10
ATTEST:
/s/Darrell N. Braman
Darrell N. Braman, Secretary
EX-101.INS
2
trpbcgfi-20160427.xml
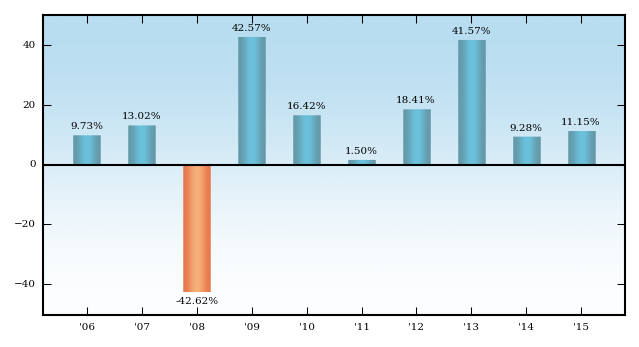
00009022592016-05-012016-05-010000902259trpbcgfi:S000002069Membertrpbcgfi:InvestorClassSharesMember2016-05-012016-05-010000902259trpbcgfi:S000002069Membertrpbcgfi:InvestorClassSharesMembertrpbcgfi:C000005424Member2016-05-012016-05-010000902259trpbcgfi:S000002069Membertrpbcgfi:InvestorClassSharesMemberrr:AfterTaxesOnDistributionsMembertrpbcgfi:C000005424Member2016-05-012016-05-010000902259trpbcgfi:S000002069Membertrpbcgfi:InvestorClassSharesMemberrr:AfterTaxesOnDistributionsAndSalesMembertrpbcgfi:C000005424Member2016-05-012016-05-010000902259trpbcgfi:S000002069Membertrpbcgfi:InvestorClassSharesMembertrpbcgfi:SAndPFivehundredIndexMember2016-05-012016-05-010000902259trpbcgfi:S000002069Membertrpbcgfi:InvestorClassSharesMembertrpbcgfi:LipperLargeCapGrowthFundsIndexMember2016-05-012016-05-010000902259trpbcgfi:S000002069Membertrpbcgfi:AdvisorClassSharesMember2016-05-012016-05-010000902259trpbcgfi:S000002069Membertrpbcgfi:AdvisorClassSharesMembertrpbcgfi:C000005425Member2016-05-012016-05-010000902259trpbcgfi:S000002069Membertrpbcgfi:AdvisorClassSharesMemberrr:AfterTaxesOnDistributionsMembertrpbcgfi:C000005425Member2016-05-012016-05-010000902259trpbcgfi:S000002069Membertrpbcgfi:AdvisorClassSharesMemberrr:AfterTaxesOnDistributionsAndSalesMembertrpbcgfi:C000005425Member2016-05-012016-05-010000902259trpbcgfi:S000002069Membertrpbcgfi:AdvisorClassSharesMembertrpbcgfi:SAndPFivehundredIndexMember2016-05-012016-05-010000902259trpbcgfi:S000002069Membertrpbcgfi:AdvisorClassSharesMembertrpbcgfi:LipperLargeCapGrowthFundsIndexMember2016-05-012016-05-010000902259trpbcgfi:S000002069Membertrpbcgfi:IClassSharesMember2016-05-012016-05-010000902259trpbcgfi:S000002069Membertrpbcgfi:IClassSharesMembertrpbcgfi:C000166329Member2016-05-012016-05-010000902259trpbcgfi:S000002069Membertrpbcgfi:IClassSharesMembertrpbcgfi:C000005424Member2016-05-012016-05-010000902259trpbcgfi:S000002069Membertrpbcgfi:IClassSharesMemberrr:AfterTaxesOnDistributionsMembertrpbcgfi:C000005424Member2016-05-012016-05-010000902259trpbcgfi:S000002069Membertrpbcgfi:IClassSharesMemberrr:AfterTaxesOnDistributionsAndSalesMembertrpbcgfi:C000005424Member2016-05-012016-05-010000902259trpbcgfi:S000002069Membertrpbcgfi:IClassSharesMembertrpbcgfi:SAndPFivehundredIndexMember2016-05-012016-05-010000902259trpbcgfi:S000002069Membertrpbcgfi:IClassSharesMembertrpbcgfi:LipperLargeCapGrowthFundsIndexMember2016-05-012016-05-010000902259trpbcgfi:S000002069Membertrpbcgfi:RClassSharesMember2016-05-012016-05-010000902259trpbcgfi:S000002069Membertrpbcgfi:RClassSharesMembertrpbcgfi:C000005426Member2016-05-012016-05-010000902259trpbcgfi:S000002069Membertrpbcgfi:RClassSharesMemberrr:AfterTaxesOnDistributionsMembertrpbcgfi:C000005426Member2016-05-012016-05-010000902259trpbcgfi:S000002069Membertrpbcgfi:RClassSharesMemberrr:AfterTaxesOnDistributionsAndSalesMembertrpbcgfi:C000005426Member2016-05-012016-05-010000902259trpbcgfi:S000002069Membertrpbcgfi:RClassSharesMembertrpbcgfi:SAndPFivehundredIndexMember2016-05-012016-05-010000902259trpbcgfi:S000002069Membertrpbcgfi:RClassSharesMembertrpbcgfi:LipperLargeCapGrowthFundsIndexMember2016-05-012016-05-01pureiso4217:USD2016-05-01485BPOS2015-12-31T. Rowe Price Blue Chip Growth Fund, Inc.0000902259false2016-04-272016-05-01T. Rowe Price<br/><br/> Blue Chip Growth Fund<br /><br /><b>SUMMARY</b><b> Investment Objective</b>The fund seeks to provide long-term capital growth.<b>Fees and Expenses</b>This table describes the fees and expenses that you may pay if you buy and hold shares of the fund.<b>Fees and Expenses of the Fund<br/><br/>Shareholder fees (fees paid directly from your investment)</b>000200.0057<b>Annual fund operating expenses<br/> (expenses that you pay each year as a<br/>percentage of the value of your investment)</b>00.00140.0071This example is intended to help you compare the cost of investing in the fund with the cost of investing in other mutual funds. The example assumes that you invest $10,000 in the fund for the time periods indicated and then redeem all of your shares at the end of those periods. The example also assumes that your investment has a 5% return each year and that the fund’s operating expenses remain the same. Although your actual costs may be higher or lower, based on these assumptions your costs would be:<b>Example</b><b>Portfolio Turnover</b><b>Principal Risks</b><b>Performance</b>73227395883The fund pays transaction costs, such as commissions, when it buys and sells securities (or “turns over” its portfolio). A higher portfolio turnover rate may indicate higher transaction costs and may result in higher taxes when fund shares are held in a taxable account. These costs, which are not reflected in annual fund operating expenses or in the example, affect the fund’s performance. During the most recent fiscal year, the fund’s portfolio turnover rate was 33.1% of the average value of its portfolio.<b>Investments, Risks, and Performance<br/><br/>Principal Investment Strategies</b>The fund will normally invest at least 80% of its net assets (including any borrowings for investment purposes) in the common stocks of large- and medium-sized blue chip growth companies. These are firms that, in our view, are well established in their industries and have the potential for above-average earnings growth. We focus on companies with leading market positions, seasoned management, and strong financial fundamentals. The fund’s investment approach reflects our belief that solid company fundamentals (with an emphasis on the potential for strong growth in earnings per share or operating cash flow) combined with a positive outlook for a company’s industry will ultimately reward investors with strong investment performance. Some of the companies we target for the fund should have good prospects for dividend growth, and the fund may at times invest significantly in stocks of technology companies.<br /><br />In pursuing its investment objective, the fund has the discretion to deviate from its normal investment criteria. These situations might arise when the fund’s adviser believes a security could increase in value for a variety of reasons, including an extraordinary corporate event, a new product introduction or innovation, a favorable competitive development, or a change in management.<br /><br />While most assets will typically be invested in U.S. common stocks, the fund may invest in foreign stocks in keeping with the fund’s objectives.<br /><br />The fund may sell securities for a variety of reasons, such as to secure gains, limit losses, or redeploy assets into more promising opportunities.As with any mutual fund, there is no guarantee that the fund will achieve its objective. The fund’s share price fluctuates, which means you could lose money by investing in the fund. The principal risks of investing in this fund are summarized as follows:<br /><br /><b>Active management risk</b> The fund is subject to the risk that the investment adviser’s judgments about the attractiveness, value, or potential appreciation of the fund’s investments may prove to be incorrect. If the investments selected and strategies employed by the fund fail to produce the intended results, the fund could underperform in comparison to other funds with similar objectives and investment strategies.<br /><br /><b>Risks of U.S. stock investing</b> Stocks generally fluctuate in value more than bonds and may decline significantly over short time periods. There is a chance that stock prices overall will decline because stock markets tend to move in cycles, with periods of rising and falling prices. The value of a stock in which the fund invests may decline due to general weakness in the U.S. stock market, such as when the U.S. financial markets decline, or because of factors that affect a particular company or industry.<br /><br /><b>Investment style risk</b> Different investment styles tend to shift in and out of favor depending on market conditions and investor sentiment. The fund’s growth approach to investing could cause it to underperform other stock funds that employ a different investment style. Growth stocks tend to be more volatile than certain other types of stocks, and their prices may fluctuate more dramatically than the overall stock market. A stock with growth characteristics can have sharp price declines due to decreases in current or expected earnings and may lack dividends that can help cushion its share price in a declining market.<br /><br /><b>Market capitalization risk</b> The fund’s focus on large and medium sized companies subjects the fund to the risk that larger companies may not be able to attain the high growth rates of successful smaller companies, especially during strong economic periods, and they may be less capable of responding quickly to competitive challenges and industry changes. Because the fund focuses on large and medium sized companies, its share price could be more volatile than a fund that invests only in large companies. Medium sized companies typically have less experienced management, narrower product lines, more limited financial resources, and less publicly available information than larger companies.<br /><br /><b>Industry risk</b> To the extent the fund invests in specific industries or sectors, it may be more susceptible to developments affecting those industries and sectors. For example, the fund may at times have significant investments in technology companies, which could result in the fund performing poorly during a downturn in one or more of the industries that heavily impact technology companies. Technology companies can be adversely affected by, among other things, intense competition, earnings disappointments, and rapid obsolescence of products and services due to technological innovations or changing consumer preferences.<br /><br /><b>Foreign investing risk</b> This is the risk that the fund’s investments in foreign securities may be adversely affected by local, political, social, and economic conditions overseas, greater volatility, reduced liquidity, or decreases in foreign currency values relative to the U.S. dollar.The bar chart showing calendar year returns and the average annual total returns table provide some indication of the risks of investing in the fund by showing how much returns can differ from year to year and how the fund's average annual returns for certain periods compare with the returns of a relevant broad-based market index, as well as with the returns of one or more comparative indexes that have investment characteristics similar to those of the fund. The fund's performance information represents only past performance (before and after taxes) and is not necessarily an indication of future results.<br /><br />The fund can also experience short-term performance swings, as shown by the best and worst calendar quarter returns during the years depicted.In addition, the average annual total returns table shows hypothetical after-tax returns to demonstrate how taxes paid by a shareholder may influence returns. After-tax returns are calculated using the historical highest individual federal marginal income tax rates and do not reflect the impact of state and local taxes. Actual after-tax returns depend on an investor’s tax situation and may differ from those shown. After-tax returns shown are not relevant to investors who hold their fund shares through tax-deferred arrangements, such as a 401(k) account or individual retirement account. In some cases, the figure shown for “returns after taxes on distributions and sale of fund shares” may be higher than the figure shown for “returns before taxes” because the calculations assume the investor received a tax deduction for any loss incurred on the sale of shares.<b>Blue Chip Growth Fund<br/>Calendar Year Returns</b><b>Average Annual Total Returns<br/><br/>Periods ended<br/>December 31, 2015</b><table style="width: 183pt; border-collapse: collapse;" border="0" cellspacing="0" cellpadding="0" width="244"><tr style="height: 15pt;"> <td style="background-color: transparent; width: 84pt; height: 15pt;" class="xl65" height="20" width="112"> </td> <td style="background-color: transparent; width: 51pt;" class="xl66" width="68"><b>Quarter<br/> Ended</b></td> <td style="background-color: transparent; width: 48pt;" class="xl66" width="64"><b> Total<br/>Return</b></td></tr><tr style="height: 15pt;"><td style="background-color: transparent; height: 15pt;" class="xl68" height="20"><b>Best Quarter</b></td> <td style="background-color: transparent;" class="xl69"><b> 3/31/12</b></td> <td style="background-color: transparent;" class="xl70"><b> 18.76%</b></td></tr> <tr style="height: 8pt;"><td style="background-color: transparent; height: 15pt;" class="xl68" height="20"><b>Worst Quarter</b></td> <td style="background-color: transparent;" class="xl69"><b>12/31/08</b></td> <td style="background-color: transparent;" class="xl70"><b>-24.91%</b></td></tr></table><b>Best Quarter</b>2012-03-310.1876<b>Worst Quarter</b>2008-12-31-0.24910.11150.1030.06990.01380.05610.15630.15170.1260.12570.12170.09330.0910.07670.07310.0717Updated performance information is available through <b>troweprice.com</b> or may be obtained by calling 1-800-225-5132.Income is a secondary objective.0.331The fund’s share price fluctuates, which means you could lose money by investing in the fund.The bar chart showing calendar year returns and the average annual total returns table provide some indication of the risks of investing in the fund by showing how much returns can differ from year to year and how the fund's average annual returns for certain periods compare with the returns of a relevant broad-based market index, as well as with the returns of one or more comparative indexes that have investment characteristics similar to those of the fund.The fund's performance information represents only past performance (before and after taxes) and is not necessarily an indication of future results.After-tax returns are calculated using the historical highest individual federal marginal income tax rates and do not reflect the impact of state and local taxes.Actual after-tax returns depend on an investor’s tax situation and may differ from those shown. After-tax returns shown are not relevant to investors who hold their fund shares through tax-deferred arrangements, such as a 401(k) account or individual retirement account.In some cases, the figure shown for “returns after taxes on distributions and sale of fund shares” may be higher than the figure shown for “returns before taxes” because the calculations assume the investor received a tax deduction for any loss incurred on the sale of shares.<b>troweprice.com</b>1-800-225-51320.09730.1302-0.42620.42570.16420.0150.18410.41570.09280.1115T. Rowe Price<br/><br/>Blue Chip Growth Fund—Advisor Class<br /><br /><b>SUMMARY</b><b> Investment Objective</b>The fund seeks to provide long-term capital growth.<b>Fees and Expenses</b>This table describes the fees and expenses that you may pay if you buy and hold shares of the fund.<b>Fees and Expenses of the Fund’s Advisor Class</b><br/><br/><b>Annual fund operating expenses<br/> (expenses that you pay each year as a<br/>percentage of the value of your investment)</b>0.00570.00250.00170.0099This example is intended to help you compare the cost of investing in the fund with the cost of investing in other mutual funds. The example assumes that you invest $10,000 in the fund for the time periods indicated and then redeem all of your shares at the end of those periods. The example also assumes that your investment has a 5% return each year and that the fund’s operating expenses remain the same. Although your actual costs may be higher or lower, based on these assumptions your costs would be:<b>Example</b><b>Portfolio Turnover</b><b>Principal Risks</b><b>Performance</b>1013155471213The fund pays transaction costs, such as commissions, when it buys and sells securities (or “turns over” its portfolio). A higher portfolio turnover rate may indicate higher transaction costs and may result in higher taxes when fund shares are held in a taxable account. These costs, which are not reflected in annual fund operating expenses or in the example, affect the fund’s performance. During the most recent fiscal year, the fund’s portfolio turnover rate was 33.1% of the average value of its portfolio.<b>Investments, Risks, and Performance<br/><br/>Principal Investment Strategies</b>The fund will normally invest at least 80% of its net assets (including any borrowings for investment purposes) in the common stocks of large- and medium-sized blue chip growth companies. These are firms that, in our view, are well established in their industries and have the potential for above-average earnings growth. We focus on companies with leading market positions, seasoned management, and strong financial fundamentals. The fund’s investment approach reflects our belief that solid company fundamentals (with an emphasis on the potential for strong growth in earnings per share or operating cash flow) combined with a positive outlook for a company’s industry will ultimately reward investors with strong investment performance. Some of the companies we target for the fund should have good prospects for dividend growth, and the fund may at times invest significantly in stocks of technology companies.<br /><br />In pursuing its investment objective, the fund has the discretion to deviate from its normal investment criteria. These situations might arise when the fund’s adviser believes a security could increase in value for a variety of reasons, including an extraordinary corporate event, a new product introduction or innovation, a favorable competitive development, or a change in management.<br /><br />While most assets will typically be invested in U.S. common stocks, the fund may invest in foreign stocks in keeping with the fund’s objectives.<br /><br />The fund may sell securities for a variety of reasons, such as to secure gains, limit losses, or redeploy assets into more promising opportunities.As with any mutual fund, there is no guarantee that the fund will achieve its objective. The fund’s share price fluctuates, which means you could lose money by investing in the fund. The principal risks of investing in this fund are summarized as follows:<br /><br /><b>Active management risk</b> The fund is subject to the risk that the investment adviser’s judgments about the attractiveness, value, or potential appreciation of the fund’s investments may prove to be incorrect. If the investments selected and strategies employed by the fund fail to produce the intended results, the fund could underperform in comparison to other funds with similar objectives and investment strategies.<br /><br /><b>Risks of U.S. stock investing</b> Stocks generally fluctuate in value more than bonds and may decline significantly over short time periods. There is a chance that stock prices overall will decline because stock markets tend to move in cycles, with periods of rising and falling prices. The value of a stock in which the fund invests may decline due to general weakness in the U.S. stock market, such as when the U.S. financial markets decline, or because of factors that affect a particular company or industry.<br /><br /><b>Investment style risk</b> Different investment styles tend to shift in and out of favor depending on market conditions and investor sentiment. The fund’s growth approach to investing could cause it to underperform other stock funds that employ a different investment style. Growth stocks tend to be more volatile than certain other types of stocks, and their prices may fluctuate more dramatically than the overall stock market. A stock with growth characteristics can have sharp price declines due to decreases in current or expected earnings and may lack dividends that can help cushion its share price in a declining market.<br /><br /><b>Market capitalization risk</b> The fund’s focus on large and medium sized companies subjects the fund to the risk that larger companies may not be able to attain the high growth rates of successful smaller companies, especially during strong economic periods, and they may be less capable of responding quickly to competitive challenges and industry changes. Because the fund focuses on large and medium sized companies, its share price could be more volatile than a fund that invests only in large companies. Medium sized companies typically have less experienced management, narrower product lines, more limited financial resources, and less publicly available information than larger companies.<br /><br /><b>Industry risk</b> To the extent the fund invests in specific industries or sectors, it may be more susceptible to developments affecting those industries and sectors. For example, the fund may at times have significant investments in technology companies, which could result in the fund performing poorly during a downturn in one or more of the industries that heavily impact technology companies. Technology companies can be adversely affected by, among other things, intense competition, earnings disappointments, and rapid obsolescence of products and services due to technological innovations or changing consumer preferences.<br /><br /><b>Foreign investing risk</b> This is the risk that the fund’s investments in foreign securities may be adversely affected by local, political, social, and economic conditions overseas, greater volatility, reduced liquidity, or decreases in foreign currency values relative to the U.S. dollar.The bar chart showing calendar year returns and the average annual total returns table provide some indication of the risks of investing in the fund by showing how much returns can differ from year to year and how the fund’s average annual returns for certain periods compare with the returns of a relevant broad-based market index, as well as with the returns of one or more comparative indexes that have investment characteristics similar to those of the fund. The fund’s performance information represents only past performance (before and after taxes) and is not necessarily an indication of future results.<br /><br />The fund can also experience short-term performance swings, as shown by the best and worst calendar quarter returns during the years depicted.In addition, the average annual total returns table shows hypothetical after-tax returns to demonstrate how taxes paid by a shareholder may influence returns. After-tax returns are calculated using the historical highest individual federal marginal income tax rates and do not reflect the impact of state and local taxes. Actual after-tax returns depend on an investor’s tax situation and may differ from those shown. After-tax returns shown are not relevant to investors who hold their fund shares through tax-deferred arrangements, such as a 401(k) account or individual retirement account. In some cases, the figure shown for “returns after taxes on distributions and sale of fund shares” may be higher than the figure shown for “returns before taxes” because the calculations assume the investor received a tax deduction for any loss incurred on the sale of shares.Updated performance information is available through <b>troweprice.com</b> or may be obtained by calling 1-800-638-8790.0.0960.1281-0.42720.4230.16160.01260.18120.4120.08990.1086<b>Best Quarter</b>2012-03-310.1866<b>Worst Quarter</b>2008-12-31-0.2493<table style="width: 183pt; border-collapse: collapse;" border="0" cellspacing="0" cellpadding="0" width="244"><tr style="height: 15pt;"> <td style="background-color: transparent; width: 84pt; height: 15pt;" class="xl65" height="20" width="112"> </td> <td style="background-color: transparent; width: 51pt;" class="xl66" width="68"><b>Quarter<br/> Ended</b></td> <td style="background-color: transparent; width: 48pt;" class="xl66" width="64"><b> Total<br/>Return</b></td></tr><tr style="height: 15pt;"><td style="background-color: transparent; height: 15pt;" class="xl68" height="20"><b>Best Quarter</b></td> <td style="background-color: transparent;" class="xl69"><b> 3/31/12</b></td> <td style="background-color: transparent;" class="xl70"><b> 18.66%</b></td></tr> <tr style="height: 8pt;"><td style="background-color: transparent; height: 15pt;" class="xl68" height="20"><b>Worst Quarter</b></td> <td style="background-color: transparent;" class="xl69"><b>12/31/08</b></td> <td style="background-color: transparent;" class="xl70"><b>-24.93%</b></td></tr></table>0.10860.10010.06830.01380.05610.15330.14890.12360.12570.12170.0910.08880.07470.07310.0717Income is a secondary objective.0.331The fund’s share price fluctuates, which means you could lose money by investing in the fund.The bar chart showing calendar year returns and the average annual total returns table provide some indication of the risks of investing in the fund by showing how much returns can differ from year to year and how the fund’s average annual returns for certain periods compare with the returns of a relevant broad-based market index, as well as with the returns of one or more comparative indexes that have investment characteristics similar to those of the fund.The fund’s performance information represents only past performance (before and after taxes) and is not necessarily an indication of future results.After-tax returns are calculated using the historical highest individual federal marginal income tax rates and do not reflect the impact of state and local taxes.Actual after-tax returns depend on an investor’s tax situation and may differ from those shown. After-tax returns shown are not relevant to investors who hold their fund shares through tax-deferred arrangements, such as a 401(k) account or individual retirement account.In some cases, the figure shown for “returns after taxes on distributions and sale of fund shares” may be higher than the figure shown for “returns before taxes” because the calculations assume the investor received a tax deduction for any loss incurred on the sale of shares.<b>Blue Chip Growth Fund–Advisor Class<br/>Calendar Year Returns</b><div style="display:none">~ http://troweprice.com/role/ScheduleAnnualFundOperatingExpenses000023 column period compact * ~</div><div style="display:none">~ http://troweprice.com/role/ScheduleExpenseExampleTransposed000024 column period compact * ~</div><div style="display:none">~ http://troweprice.com/role/ScheduleAnnualTotalReturnsBarChart000026 column period compact * ~</div><div style="display:none">~ http://troweprice.com/role/ScheduleAverageAnnualTotalReturnsTransposed000027 column period compact * ~</div><div style="display:none">~ http://troweprice.com/role/ScheduleShareholderFees000012 column period compact * ~</div><div style="display:none">~ http://troweprice.com/role/ScheduleAnnualFundOperatingExpenses000013 column period compact * ~</div><div style="display:none">~ http://troweprice.com/role/ScheduleExpenseExampleTransposed000014 column period compact * ~</div><div style="display:none">~ http://troweprice.com/role/ScheduleAnnualTotalReturnsBarChart000016 column period compact * ~</div><div style="display:none">~ http://troweprice.com/role/ScheduleAverageAnnualTotalReturnsTransposed000017 column period compact * ~</div><b>Average Annual Total Returns<br/><br/>Periods ended<br/>December 31, 2015</b><b>troweprice.com</b>1-800-638-8790T. Rowe Price<br/><br/>Blue Chip Growth Fund—I Class<br /><br /><b>SUMMARY</b><b> Investment Objective</b>The fund seeks to provide long-term capital growth.<b>Fees and Expenses</b>Income is a secondary objective.This table describes the fees and expenses that you may pay if you buy and hold shares of the fund.<b>Fees and Expenses of the Fund’s I Class<br/><br/>Annual fund operating expenses<br/>(expenses that you pay each year as a<br/>percentage of the value of your investment)</b>0.005700.00060.0063-0.00010.0062This example is intended to help you compare the cost of investing in the fund with the cost of investing in other mutual funds. The example assumes that you invest $10,000 in the fund for the time periods indicated and then redeem all of your shares at the end of those periods. The example also assumes that your investment has a 5% return each year, the fund’s operating expenses remain the same, and the expense limitation currently in place is not renewed. The figures have been adjusted to reflect fee waivers or expense reimbursements only in the periods for which the expense limitation arrangement is expected to continue. Although your actual costs may be higher or lower, based on these assumptions your costs would be:63200349784The fund pays transaction costs, such as commissions, when it buys and sells securities (or “turns over” its portfolio). A higher portfolio turnover rate may indicate higher transaction costs and may result in higher taxes when fund shares are held in a taxable account. These costs, which are not reflected in annual fund operating expenses or in the example, affect the fund’s performance. During the period December 17, 2015 through December 31, 2015, the fund’s portfolio turnover rate was 33.1% of the average value of its portfolio.<b>Investments, Risks, and Performance<br/><br/>Principal Investment Strategies</b>The fund will normally invest at least 80% of its net assets (including any borrowings for investment purposes) in the common stocks of large- and medium-sized blue chip growth companies. These are firms that, in our view, are well established in their industries and have the potential for above-average earnings growth. We focus on companies with leading market positions, seasoned management, and strong financial fundamentals. The fund’s investment approach reflects our belief that solid company fundamentals (with an emphasis on the potential for strong growth in earnings per share or operating cash flow) combined with a positive outlook for a company’s industry will ultimately reward investors with strong investment performance. Some of the companies we target for the fund should have good prospects for dividend growth, and the fund may at times invest significantly in stocks of technology companies.<br /><br />In pursuing its investment objective, the fund has the discretion to deviate from its normal investment criteria. These situations might arise when the fund’s adviser believes a security could increase in value for a variety of reasons, including an extraordinary corporate event, a new product introduction or innovation, a favorable competitive development, or a change in management.<br /><br />While most assets will typically be invested in U.S. common stocks, the fund may invest in foreign stocks in keeping with the fund’s objectives.<br /><br />The fund may sell securities for a variety of reasons, such as to secure gains, limit losses, or redeploy assets into more promising opportunities.As with any mutual fund, there is no guarantee that the fund will achieve its objective. The fund’s share price fluctuates, which means you could lose money by investing in the fund. The principal risks of investing in this fund are summarized as follows:<br /><br /><b>Active management risk</b> The fund is subject to the risk that the investment adviser’s judgments about the attractiveness, value, or potential appreciation of the fund’s investments may prove to be incorrect. If the investments selected and strategies employed by the fund fail to produce the intended results, the fund could underperform in comparison to other funds with similar objectives and investment strategies.<br /><br /><b>Risks of U.S. stock investing</b> Stocks generally fluctuate in value more than bonds and may decline significantly over short time periods. There is a chance that stock prices overall will decline because stock markets tend to move in cycles, with periods of rising and falling prices. The value of a stock in which the fund invests may decline due to general weakness in the U.S. stock market, such as when the U.S. financial markets decline, or because of factors that affect a particular company or industry.<br /><br /><b>Investment style risk</b> Different investment styles tend to shift in and out of favor depending on market conditions and investor sentiment. The fund’s growth approach to investing could cause it to underperform other stock funds that employ a different investment style. Growth stocks tend to be more volatile than certain other types of stocks, and their prices may fluctuate more dramatically than the overall stock market. A stock with growth characteristics can have sharp price declines due to decreases in current or expected earnings and may lack dividends that can help cushion its share price in a declining market.<br /><br /><b>Market capitalization risk</b> The fund’s focus on large and medium sized companies subjects the fund to the risk that larger companies may not be able to attain the high growth rates of successful smaller companies, especially during strong economic periods, and they may be less capable of responding quickly to competitive challenges and industry changes. Because the fund focuses on large and medium sized companies, its share price could be more volatile than a fund that invests only in large companies. Medium sized companies typically have less experienced management, narrower product lines, more limited financial resources, and less publicly available information than larger companies.<br /><br /><b>Industry risk</b> To the extent the fund invests in specific industries or sectors, it may be more susceptible to developments affecting those industries and sectors. For example, the fund may at times have significant investments in technology companies, which could result in the fund performing poorly during a downturn in one or more of the industries that heavily impact technology companies. Technology companies can be adversely affected by, among other things, intense competition, earnings disappointments, and rapid obsolescence of products and services due to technological innovations or changing consumer preferences.<br /><br /><b>Foreign investing risk</b> This is the risk that the fund’s investments in foreign securities may be adversely affected by local, political, social, and economic conditions overseas, greater volatility, reduced liquidity, or decreases in foreign currency values relative to the U.S. dollar.The Blue Chip Growth Fund—I Class has an inception date of December 17, 2015, and does not have a full calendar year of performance history. Performance for the class will be presented after the class has been in operation for one full calendar year. As a point of comparison, however, the following bar chart and table show calendar year returns and average annual total returns for the existing Investor Class of the Blue Chip Growth Fund (“Investor Class”). Because the Blue Chip Growth Fund—I Class is expected to have lower expenses than the Investor Class, its performance, had it existed over the periods shown, would have been higher. The Investor Class and the Blue Chip Growth Fund—I Class share the same portfolio. The bar chart and table provide some indication of the risks of investing in the fund by showing how much returns can differ from year to year and how the Investor Class’ average annual returns for certain periods compare with the returns of a relevant broad-based market index, as well as with the returns of one or more other comparative indexes that have investment characteristics similar to those of the fund.<br /><br />The fund can also experience short-term performance swings, as shown by the best and worst calendar quarter returns during the years depicted for the Investor Class.<br /><br />Performance information represents only past performance (before and after taxes) and does not necessarily indicate future results.In addition, the average annual total returns table shows hypothetical after-tax returns to demonstrate how taxes paid by a shareholder may influence returns. After-tax returns are calculated using the historical highest individual federal marginal income tax rates and do not reflect the impact of state and local taxes. Actual after-tax returns depend on an investor’s tax situation and may differ from those shown. After-tax returns shown are not relevant to investors who hold their fund shares through tax-deferred arrangements, such as a 401(k) account or individual retirement account. In some cases, the figure shown for “returns after taxes on distributions and sale of fund shares” may be higher than the figure shown for “returns before taxes” because the calculations assume the investor received a tax deduction for any loss incurred on the sale of shares.<b>Example</b><b>Portfolio Turnover</b><b>Principal Risks</b><b>Performance</b><b>Average Annual Total Returns<br/><br/>Periods ended<br/>December 31, 2015</b>
Current performance information may be obtained through <b>troweprice.com</b> or by calling 1-800-638-8790.0.11150.1030.06990.01380.05610.15630.15170.1260.12570.12170.09330.0910.07670.07310.0717April 30, 20180.331The fund’s share price fluctuates, which means you could lose money by investing in the fund.The bar chart and table provide some indication of the risks of investing in the fund by showing how much returns can differ from year to year and how the Investor Class’ average annual returns for certain periods compare with the returns of a relevant broad-based market index, as well as with the returns of one or more other comparative indexes that have investment characteristics similar to those of the fund.As a point of comparison, however, the following bar chart and table show calendar year returns and average annual total returns for the existing Investor Class of the Blue Chip Growth Fund (“Investor Class”).The Blue Chip Growth Fund—I Class has an inception date of December 17, 2015, and does not have a full calendar year of performance history. Performance for the class will be presented after the class has been in operation for one full calendar year.Performance information represents only past performance (before and after taxes) and does not necessarily indicate future results.After-tax returns are calculated using the historical highest individual federal marginal income tax rates and do not reflect the impact of state and local taxes.Actual after-tax returns depend on an investor’s tax situation and may differ from those shown. After-tax returns shown are not relevant to investors who hold their fund shares through tax-deferred arrangements, such as a 401(k) account or individual retirement account.In some cases, the figure shown for “returns after taxes on distributions and sale of fund shares” may be higher than the figure shown for “returns before taxes” because the calculations assume the investor received a tax deduction for any loss incurred on the sale of shares.<b>troweprice.com</b>1-800-638-8790<b>Blue Chip Growth Fund<br/>Calendar Year Returns</b><table style="width: 183pt; border-collapse: collapse;" border="0" cellspacing="0" cellpadding="0" width="244"><tr style="height: 15pt;"> <td style="background-color: transparent; width: 84pt; height: 15pt;" class="xl65" height="20" width="112"> </td> <td style="background-color: transparent; width: 51pt;" class="xl66" width="68"><b>Quarter<br/> Ended</b></td> <td style="background-color: transparent; width: 48pt;" class="xl66" width="64"><b> Total<br/>Return</b></td></tr><tr style="height: 15pt;"><td style="background-color: transparent; height: 15pt;" class="xl68" height="20"><b>Best Quarter</b></td> <td style="background-color: transparent;" class="xl69"><b> 3/31/12</b></td> <td style="background-color: transparent;" class="xl70"><b> 18.76%</b></td></tr> <tr style="height: 8pt;"><td style="background-color: transparent; height: 15pt;" class="xl68" height="20"><b>Worst Quarter</b></td> <td style="background-color: transparent;" class="xl69"><b>12/31/08</b></td> <td style="background-color: transparent;" class="xl70"><b>-24.91%</b></td></tr></table>0.09730.1302-0.42620.42570.16420.0150.18410.41570.09280.1115<b>Best Quarter</b>2012-03-310.1876<b>Worst Quarter</b>2008-12-31-0.2491<div style="display:none">~ http://troweprice.com/role/ScheduleAnnualFundOperatingExpenses000033 column period compact * ~</div><div style="display:none">~ http://troweprice.com/role/ScheduleExpenseExampleTransposed000034 column period compact * ~</div><div style="display:none">~ http://troweprice.com/role/ScheduleAnnualTotalReturnsBarChart000036 column period compact * ~</div><div style="display:none">~ http://troweprice.com/role/ScheduleAverageAnnualTotalReturnsTransposed000037 column period compact * ~</div>T. Rowe Price<br/><br/>Blue Chip Growth Fund—R Class<br /><br /><b>SUMMARY</b><b> Investment Objective</b>The fund seeks to provide long-term capital growth.<b>Fees and Expenses</b>This table describes the fees and expenses that you may pay if you buy and hold shares of the fund.<b>Fees and Expenses of the Fund’s R Class</b><br/><br/><b>Annual fund operating expenses<br/> (expenses that you pay each year as a<br/>percentage of the value of your investment)</b>0.00570.0050.00170.01241263936811500This example is intended to help you compare the cost of investing in the fund with the cost of investing in other mutual funds. The example assumes that you invest $10,000 in the fund for the time periods indicated and then redeem all of your shares at the end of those periods. The example also assumes that your investment has a 5% return each year and that the fund’s operating expenses remain the same. Although your actual costs may be higher or lower, based on these assumptions your costs would be:The fund pays transaction costs, such as commissions, when it buys and sells securities (or “turns over” its portfolio). A higher portfolio turnover rate may indicate higher transaction costs and may result in higher taxes when fund shares are held in a taxable account. These costs, which are not reflected in annual fund operating expenses or in the example, affect the fund’s performance. During the most recent fiscal year, the fund’s portfolio turnover rate was 33.1% of the average value of its portfolio.<b>Investments, Risks, and Performance<br/><br/>Principal Investment Strategies</b>The fund will normally invest at least 80% of its net assets (including any borrowings for investment purposes) in the common stocks of large- and medium-sized blue chip growth companies. These are firms that, in our view, are well established in their industries and have the potential for above-average earnings growth. We focus on companies with leading market positions, seasoned management, and strong financial fundamentals. The fund’s investment approach reflects our belief that solid company fundamentals (with an emphasis on the potential for strong growth in earnings per share or operating cash flow) combined with a positive outlook for a company’s industry will ultimately reward investors with strong investment performance. Some of the companies we target for the fund should have good prospects for dividend growth, and the fund may at times invest significantly in stocks of technology companies.<br /><br />In pursuing its investment objective, the fund has the discretion to deviate from its normal investment criteria. These situations might arise when the fund’s adviser believes a security could increase in value for a variety of reasons, including an extraordinary corporate event, a new product introduction or innovation, a favorable competitive development, or a change in management.<br /><br />While most assets will typically be invested in U.S. common stocks, the fund may invest in foreign stocks in keeping with the fund’s objectives.<br /><br />The fund may sell securities for a variety of reasons, such as to secure gains, limit losses, or redeploy assets into more promising opportunities.As with any mutual fund, there is no guarantee that the fund will achieve its objective. The fund’s share price fluctuates, which means you could lose money by investing in the fund. The principal risks of investing in this fund are summarized as follows:<br /><br /><b>Active management risk</b> The fund is subject to the risk that the investment adviser’s judgments about the attractiveness, value, or potential appreciation of the fund’s investments may prove to be incorrect. If the investments selected and strategies employed by the fund fail to produce the intended results, the fund could underperform in comparison to other funds with similar objectives and investment strategies.<br /><br /><b>Risks of U.S. stock investing</b> Stocks generally fluctuate in value more than bonds and may decline significantly over short time periods. There is a chance that stock prices overall will decline because stock markets tend to move in cycles, with periods of rising and falling prices. The value of a stock in which the fund invests may decline due to general weakness in the U.S. stock market, such as when the U.S. financial markets decline, or because of factors that affect a particular company or industry.<br /><br /><b>Investment style risk</b> Different investment styles tend to shift in and out of favor depending on market conditions and investor sentiment. The fund’s growth approach to investing could cause it to underperform other stock funds that employ a different investment style. Growth stocks tend to be more volatile than certain other types of stocks, and their prices may fluctuate more dramatically than the overall stock market. A stock with growth characteristics can have sharp price declines due to decreases in current or expected earnings and may lack dividends that can help cushion its share price in a declining market.<br /><br /><b>Market capitalization risk</b> The fund’s focus on large and medium sized companies subjects the fund to the risk that larger companies may not be able to attain the high growth rates of successful smaller companies, especially during strong economic periods, and they may be less capable of responding quickly to competitive challenges and industry changes. Because the fund focuses on large and medium sized companies, its share price could be more volatile than a fund that invests only in large companies. Medium sized companies typically have less experienced management, narrower product lines, more limited financial resources, and less publicly available information than larger companies.<br /><br /><b>Industry risk</b> To the extent the fund invests in specific industries or sectors, it may be more susceptible to developments affecting those industries and sectors. For example, the fund may at times have significant investments in technology companies, which could result in the fund performing poorly during a downturn in one or more of the industries that heavily impact technology companies. Technology companies can be adversely affected by, among other things, intense competition, earnings disappointments, and rapid obsolescence of products and services due to technological innovations or changing consumer preferences.<br /><br /><b>Foreign investing risk</b> This is the risk that the fund’s investments in foreign securities may be adversely affected by local, political, social, and economic conditions overseas, greater volatility, reduced liquidity, or decreases in foreign currency values relative to the U.S. dollar.The bar chart showing calendar year returns and the average annual total returns table provide some indication of the risks of investing in the fund by showing how much returns can differ from year to year and how the fund’s average annual returns for certain periods compare with the returns of a relevant broad-based market index, as well as with the returns of one or more comparative indexes that have investment characteristics similar to those of the fund. The fund’s performance information represents only past performance (before and after taxes) and is not necessarily an indication of future results.<br /><br />The fund can also experience short-term performance swings, as shown by the best and worst calendar quarter returns during the years depicted.In addition, the average annual total returns table shows hypothetical after-tax returns to demonstrate how taxes paid by a shareholder may influence returns. After-tax returns are calculated using the historical highest individual federal marginal income tax rates and do not reflect the impact of state and local taxes. Actual after-tax returns depend on an investor’s tax situation and may differ from those shown. After-tax returns shown are not relevant to investors who hold their fund shares through tax-deferred arrangements, such as a 401(k) account or individual retirement account. In some cases, the figure shown for “returns after taxes on distributions and sale of fund shares” may be higher than the figure shown for “returns before taxes” because the calculations assume the investor received a tax deduction for any loss incurred on the sale of shares.<b>Average Annual Total Returns<br/><br/>Periods ended<br/>December 31, 2015</b><b>Example</b><b>Portfolio Turnover</b><b>Principal Risks</b><b>Performance</b><b>Blue Chip Growth Fund–R Class<br/>Calendar Year Returns</b><table style="width: 183pt; border-collapse: collapse;" border="0" cellspacing="0" cellpadding="0" width="244"><tr style="height: 15pt;"> <td style="background-color: transparent; width: 84pt; height: 15pt;" class="xl65" height="20" width="112"> </td> <td style="background-color: transparent; width: 51pt;" class="xl66" width="68"><b>Quarter<br/> Ended</b></td> <td style="background-color: transparent; width: 48pt;" class="xl66" width="64"><b> Total<br/>Return</b></td></tr><tr style="height: 15pt;"><td style="background-color: transparent; height: 15pt;" class="xl68" height="20"><b>Best Quarter</b></td> <td style="background-color: transparent;" class="xl69"><b> 3/31/12</b></td> <td style="background-color: transparent;" class="xl70"><b> 18.62%</b></td></tr> <tr style="height: 8pt;"><td style="background-color: transparent; height: 15pt;" class="xl68" height="20"><b>Worst Quarter</b></td> <td style="background-color: transparent;" class="xl69"><b>12/31/08</b></td> <td style="background-color: transparent;" class="xl70"><b>-24.97%</b></td></tr></table><b>Best Quarter</b>2012-03-310.1862<b>Worst Quarter</b>2008-12-31-0.2497Income is a secondary objective.0.09290.1255-0.42850.41980.15880.00990.17830.40860.0870.10570.10570.09690.06690.01380.05610.15040.14590.12110.12570.12170.08830.08610.07240.07310.0717Updated performance information is available through <b>troweprice.com</b> or may be obtained by calling 1-800-638-8790.0.331The fund’s share price fluctuates, which means you could lose money by investing in the fund.The bar chart showing calendar year returns and the average annual total returns table provide some indication of the risks of investing in the fund by showing how much returns can differ from year to year and how the fund’s average annual returns for certain periods compare with the returns of a relevant broad-based market index, as well as with the returns of one or more comparative indexes that have investment characteristics similar to those of the fund.The fund’s performance information represents only past performance (before and after taxes) and is not necessarily an indication of future results.After-tax returns are calculated using the historical highest individual federal marginal income tax rates and do not reflect the impact of state and local taxes.Actual after-tax returns depend on an investor’s tax situation and may differ from those shown. After-tax returns shown are not relevant to investors who hold their fund shares through tax-deferred arrangements, such as a 401(k) account or individual retirement account.In some cases, the figure shown for “returns after taxes on distributions and sale of fund shares” may be higher than the figure shown for “returns before taxes” because the calculations assume the investor received a tax deduction for any loss incurred on the sale of shares.<b>troweprice.com</b>1-800-638-8790<div style="display:none">~ http://troweprice.com/role/ScheduleAnnualFundOperatingExpenses000043 column period compact * ~</div><div style="display:none">~ http://troweprice.com/role/ScheduleExpenseExampleTransposed000044 column period compact * ~</div><div style="display:none">~ http://troweprice.com/role/ScheduleAnnualTotalReturnsBarChart000046 column period compact * ~</div><div style="display:none">~ http://troweprice.com/role/ScheduleAverageAnnualTotalReturnsTransposed000047 column period compact * ~</div>Subject to certain exceptions, accounts with a balance of less than $10,000 are charged an annual $20 fee.Through April 30, 2018, T. Rowe Price Associates, Inc. has agreed to pay the operating expenses of the fund’s I Class excluding management fees; interest; expenses related to borrowings, taxes and brokerage; nonrecurring, extraordinary expenses; and acquired fund fees and expenses (“I Class Operating Expenses”), to the extent the I Class Operating Expenses exceed 0.05% of the class’ average daily net assets. Any expenses paid under this agreement are subject to reimbursement to T. Rowe Price Associates, Inc. by the fund or class whenever the fund’s I Class Operating Expenses are below 0.05%. However, no reimbursement will be made more than three years after the payment of the I Class Operating Expenses or if such reimbursement would cause the fund’s I Class Operating Expenses to exceed 0.05%. The agreement may be terminated at any time beyond April 30, 2018, with approval by the fund’s Board of Directors.EX-101.SCH
3
trpbcgfi-20160427.xsd
000000 - Document - Document and Entity Information {Elements}link:presentationLinklink:calculationLinklink:definitionLink000011 - Document - Risk/Return Summary {Unlabeled} - T. Rowe Price Blue Chip Growth Fund, Inc. (Investor Class Shares)link:presentationLinklink:calculationLinklink:definitionLink000012 - Schedule - Shareholder Feeslink:presentationLinklink:calculationLinklink:definitionLink000013 - Schedule - Annual Fund Operating Expenseslink:calculationLinklink:presentationLinklink:definitionLink000014 - Schedule - Expense Example {Transposed}link:presentationLinklink:calculationLinklink:definitionLink000015 - Schedule - Expense Example, No Redemption {Transposed}link:presentationLinklink:calculationLinklink:definitionLink000016 - Schedule - Annual Total Returns [BarChart]link:presentationLinklink:calculationLinklink:definitionLink000017 - Schedule - Average Annual Total Returns {Transposed}link:presentationLinklink:calculationLinklink:definitionLink000018 - Document - Risk/Return Detail {Unlabeled} - T. Rowe Price Blue Chip Growth Fund, Inc.link:presentationLinklink:calculationLinklink:definitionLink000019 - Disclosure - Risk/Return Detail Data {Elements} - T. Rowe Price Blue Chip Growth Fund, Inc. (Investor Class Shares)link:presentationLinklink:calculationLinklink:definitionLink000021 - Document - Risk/Return Summary {Unlabeled} - T. Rowe Price Blue Chip Growth Fund, Inc. (Advisor Class Shares)link:presentationLinklink:calculationLinklink:definitionLink000022 - Schedule - Shareholder Feeslink:presentationLinklink:calculationLinklink:definitionLink000023 - Schedule - Annual Fund Operating Expenseslink:presentationLinklink:calculationLinklink:definitionLink000024 - Schedule - Expense Example {Transposed}link:presentationLinklink:calculationLinklink:definitionLink000025 - Schedule - Expense Example, No Redemption {Transposed}link:presentationLinklink:calculationLinklink:definitionLink000026 - Schedule - Annual Total Returns [BarChart]link:presentationLinklink:calculationLinklink:definitionLink000027 - Schedule - Average Annual Total Returns {Transposed}link:presentationLinklink:calculationLinklink:definitionLink000028 - Document - Risk/Return Detail {Unlabeled} - T. Rowe Price Blue Chip Growth Fund, Inc. T. Rowe Price Blue Chip Growth Fund-Advisor Classlink:presentationLinklink:calculationLinklink:definitionLink000029 - Disclosure - Risk/Return Detail Data {Elements} - T. Rowe Price Blue Chip Growth Fund, Inc. (Advisor Class Shares)link:presentationLinklink:calculationLinklink:definitionLink000031 - Document - Risk/Return Summary {Unlabeled} - T. Rowe Price Blue Chip Growth Fund, Inc. (I Class Shares)link:presentationLinklink:calculationLinklink:definitionLink000032 - Schedule - Shareholder Feeslink:presentationLinklink:calculationLinklink:definitionLink000033 - Schedule - Annual Fund Operating Expenseslink:presentationLinklink:calculationLinklink:definitionLink000034 - Schedule - Expense Example {Transposed}link:presentationLinklink:calculationLinklink:definitionLink000035 - Schedule - Expense Example, No Redemption {Transposed}link:presentationLinklink:calculationLinklink:definitionLink000036 - Schedule - Annual Total Returns [BarChart]link:presentationLinklink:calculationLinklink:definitionLink000037 - Schedule - Average Annual Total Returns {Transposed}link:presentationLinklink:calculationLinklink:definitionLink000038 - Document - Risk/Return Detail {Unlabeled} - T. Rowe Price Blue Chip Growth Fund, Inc. T. Rowe Price Blue Chip Growth Fund-R Classlink:presentationLinklink:calculationLinklink:definitionLink000039 - Disclosure - Risk/Return Detail Data {Elements} - T. Rowe Price Blue Chip Growth Fund, Inc. (I Class Shares)link:presentationLinklink:calculationLinklink:definitionLink000041 - Document - Risk/Return Summary {Unlabeled} - T. Rowe Price Blue Chip Growth Fund, Inc. (R Class Shares)link:presentationLinklink:calculationLinklink:definitionLink000042 - Schedule - Shareholder Feeslink:presentationLinklink:calculationLinklink:definitionLink000043 - Schedule - Annual Fund Operating Expenseslink:presentationLinklink:calculationLinklink:definitionLink000044 - Schedule - Expense Example {Transposed}link:presentationLinklink:calculationLinklink:definitionLink000045 - Schedule - Expense Example, No Redemption {Transposed}link:presentationLinklink:calculationLinklink:definitionLink000046 - Schedule - Annual Total Returns [BarChart]link:presentationLinklink:calculationLinklink:definitionLink000047 - Schedule - Average Annual Total Returns {Transposed}link:presentationLinklink:calculationLinklink:definitionLink000048 - Document - Risk/Return Detail {Unlabeled} - T. Rowe Price Blue Chip Growth Fund, Inc. T. Rowe Price Blue Chip Growth Fund-I Classlink:presentationLinklink:calculationLinklink:definitionLink000049 - Disclosure - Risk/Return Detail Data {Elements} - T. Rowe Price Blue Chip Growth Fund, Inc. (R Class Shares)link:presentationLinklink:calculationLinklink:definitionLinkEX-101.CAL
4
trpbcgfi-20160427_cal.xml
EX-101.DEF
5
trpbcgfi-20160427_def.xml
EX-101.LAB
6
trpbcgfi-20160427_lab.xml
EX-101.PRE
7
trpbcgfi-20160427_pre.xml
XML
8
R1.htm
IDEA: XBRL DOCUMENT
v3.4.0.3
The date the document was made available and submitted, in CCYY-MM-DD format. The date of submission, date of acceptance by the recipient, and the document effective date are all potentially different.
The date when a document, upon receipt and acceptance, becomes officially effective, in CCYY-MM-DD format. Usually it is a system-assigned date time value, but it may be declared by the submitter in some cases.
The end date of the period reflected on the cover page if a periodic report. For all other reports and registration statements containing historical data, it is the date up through which that historical data is presented. If there is no historical data in the report, use the filing date. The format of the date is CCYY-MM-DD.
The type of document being provided (such as 10-K, 10-Q, 485BPOS, etc). The document type is limited to the same value as the supporting SEC submission type, or the word "Other".
This example is intended to help you compare the cost of investing in the fund with the cost of investing in other mutual funds. The example assumes that you invest $10,000 in the fund for the time periods indicated and then redeem all of your shares at the end of those periods. The example also assumes that your investment has a 5% return each year and that the fund’s operating expenses remain the same. Although your actual costs may be higher or lower, based on these assumptions your costs would be:
The fund pays transaction costs, such as commissions, when it buys and sells securities (or “turns over” its portfolio). A higher portfolio turnover rate may indicate higher transaction costs and may result in higher taxes when fund shares are held in a taxable account. These costs, which are not reflected in annual fund operating expenses or in the example, affect the fund’s performance. During the most recent fiscal year, the fund’s portfolio turnover rate was 33.1% of the average value of its portfolio.
Investments, Risks, and Performance
Principal Investment Strategies
The fund will normally invest at least 80% of its net assets (including any borrowings for investment purposes) in the common stocks of large- and medium-sized blue chip growth companies. These are firms that, in our view, are well established in their industries and have the potential for above-average earnings growth. We focus on companies with leading market positions, seasoned management, and strong financial fundamentals. The fund’s investment approach reflects our belief that solid company fundamentals (with an emphasis on the potential for strong growth in earnings per share or operating cash flow) combined with a positive outlook for a company’s industry will ultimately reward investors with strong investment performance. Some of the companies we target for the fund should have good prospects for dividend growth, and the fund may at times invest significantly in stocks of technology companies.
In pursuing its investment objective, the fund has the discretion to deviate from its normal investment criteria. These situations might arise when the fund’s adviser believes a security could increase in value for a variety of reasons, including an extraordinary corporate event, a new product introduction or innovation, a favorable competitive development, or a change in management.
While most assets will typically be invested in U.S. common stocks, the fund may invest in foreign stocks in keeping with the fund’s objectives.
The fund may sell securities for a variety of reasons, such as to secure gains, limit losses, or redeploy assets into more promising opportunities.
Principal Risks
As with any mutual fund, there is no guarantee that the fund will achieve its objective. The fund’s share price fluctuates, which means you could lose money by investing in the fund. The principal risks of investing in this fund are summarized as follows:
Active management risk The fund is subject to the risk that the investment adviser’s judgments about the attractiveness, value, or potential appreciation of the fund’s investments may prove to be incorrect. If the investments selected and strategies employed by the fund fail to produce the intended results, the fund could underperform in comparison to other funds with similar objectives and investment strategies.
Risks of U.S. stock investing Stocks generally fluctuate in value more than bonds and may decline significantly over short time periods. There is a chance that stock prices overall will decline because stock markets tend to move in cycles, with periods of rising and falling prices. The value of a stock in which the fund invests may decline due to general weakness in the U.S. stock market, such as when the U.S. financial markets decline, or because of factors that affect a particular company or industry.
Investment style risk Different investment styles tend to shift in and out of favor depending on market conditions and investor sentiment. The fund’s growth approach to investing could cause it to underperform other stock funds that employ a different investment style. Growth stocks tend to be more volatile than certain other types of stocks, and their prices may fluctuate more dramatically than the overall stock market. A stock with growth characteristics can have sharp price declines due to decreases in current or expected earnings and may lack dividends that can help cushion its share price in a declining market.
Market capitalization risk The fund’s focus on large and medium sized companies subjects the fund to the risk that larger companies may not be able to attain the high growth rates of successful smaller companies, especially during strong economic periods, and they may be less capable of responding quickly to competitive challenges and industry changes. Because the fund focuses on large and medium sized companies, its share price could be more volatile than a fund that invests only in large companies. Medium sized companies typically have less experienced management, narrower product lines, more limited financial resources, and less publicly available information than larger companies.
Industry risk To the extent the fund invests in specific industries or sectors, it may be more susceptible to developments affecting those industries and sectors. For example, the fund may at times have significant investments in technology companies, which could result in the fund performing poorly during a downturn in one or more of the industries that heavily impact technology companies. Technology companies can be adversely affected by, among other things, intense competition, earnings disappointments, and rapid obsolescence of products and services due to technological innovations or changing consumer preferences.
Foreign investing risk This is the risk that the fund’s investments in foreign securities may be adversely affected by local, political, social, and economic conditions overseas, greater volatility, reduced liquidity, or decreases in foreign currency values relative to the U.S. dollar.
Performance
The bar chart showing calendar year returns and the average annual total returns table provide some indication of the risks of investing in the fund by showing how much returns can differ from year to year and how the fund's average annual returns for certain periods compare with the returns of a relevant broad-based market index, as well as with the returns of one or more comparative indexes that have investment characteristics similar to those of the fund. The fund's performance information represents only past performance (before and after taxes) and is not necessarily an indication of future results.
The fund can also experience short-term performance swings, as shown by the best and worst calendar quarter returns during the years depicted.
Blue Chip Growth Fund Calendar Year Returns
Quarter Ended
Total Return
Best Quarter
3/31/12
18.76%
Worst Quarter
12/31/08
-24.91%
In addition, the average annual total returns table shows hypothetical after-tax returns to demonstrate how taxes paid by a shareholder may influence returns. After-tax returns are calculated using the historical highest individual federal marginal income tax rates and do not reflect the impact of state and local taxes. Actual after-tax returns depend on an investor’s tax situation and may differ from those shown. After-tax returns shown are not relevant to investors who hold their fund shares through tax-deferred arrangements, such as a 401(k) account or individual retirement account. In some cases, the figure shown for “returns after taxes on distributions and sale of fund shares” may be higher than the figure shown for “returns before taxes” because the calculations assume the investor received a tax deduction for any loss incurred on the sale of shares.
Average Annual Total Returns
Periods ended December 31, 2015
Average Annual Total Returns - Investor Class Shares - T. Rowe Price Blue Chip Growth Fund, Inc.
If the Fund has annual returns for at least one calendar year, provide a bar chart showing the Fund's annual total returns for each of the last 10 calendar years (or for the life of the Fund if less than 10 years), but only for periods subsequent to the effective date of the Fund's registration statement. Present the corresponding numerical return adjacent to each bar. If the Fund's fiscal year is other than a calendar year, include the year-to-date return information as of the end of the most recent quarter in a footnote to the bar chart. Following the bar chart, disclose the Fund's highest and lowest return for a quarter during the 10 years or other period of the bar chart. When a Multiple Class Fund offers more than one Class in the prospectus, provide annual total returns in the bar chart for only one of those Classes. The Fund can select which Class to include (e.g., the oldest Class, the Class with the greatest net assets).
Reference 1: http://www.xbrl.org/2003/role/presentationRef -Publisher SEC -Name Form -Number N-1A -Chapter A -Section 4 -Subsection b -Paragraph 2 -Subparagraph ii
If the Fund has annual returns for at least one calendar year, provide a bar chart showing the Fund's annual total returns for each of the last 10 calendar years (or for the life of the Fund if less than 10 years), but only for periods subsequent to the effective date of the Fund's registration statement. Present the corresponding numerical return adjacent to each bar. If the Fund's fiscal year is other than a calendar year, include the year-to-date return information as of the end of the most recent quarter in a footnote to the bar chart. Following the bar chart, disclose the Fund's highest and lowest return for a quarter during the 10 years or other period of the bar chart. When a Multiple Class Fund offers more than one Class in the prospectus, provide annual total returns in the bar chart for only one of those Classes. The Fund can select which Class to include (e.g., the oldest Class, the Class with the greatest net assets).
If the Fund has annual returns for at least one calendar year, provide a bar chart showing the Fund's annual total returns for each of the last 10 calendar years (or for the life of the Fund if less than 10 years), but only for periods subsequent to the effective date of the Fund's registration statement. Present the corresponding numerical return adjacent to each bar. If the Fund's fiscal year is other than a calendar year, include the year-to-date return information as of the end of the most recent quarter in a footnote to the bar chart. Following the bar chart, disclose the Fund's highest and lowest return for a quarter during the 10 years or other period of the bar chart. When a Multiple Class Fund offers more than one Class in the prospectus, provide annual total returns in the bar chart for only one of those Classes. The Fund can select which Class to include (e.g., the oldest Class, the Class with the greatest net assets).
Reference 1: http://www.xbrl.org/2003/role/presentationRef -Publisher SEC -Name Form -Number N-1A -Chapter A -Section 4 -Subsection b -Paragraph 2 -Subparagraph ii
If the Fund has annual returns for at least one calendar year, provide a bar chart showing the Fund's annual total returns for each of the last 10 calendar years (or for the life of the Fund if less than 10 years), but only for periods subsequent to the effective date of the Fund's registration statement. Present the corresponding numerical return adjacent to each bar. If the Fund's fiscal year is other than a calendar year, include the year-to-date return information as of the end of the most recent quarter in a footnote to the bar chart. Following the bar chart, disclose the Fund's highest and lowest return for a quarter during the 10 years or other period of the bar chart. When a Multiple Class Fund offers more than one Class in the prospectus, provide annual total returns in the bar chart for only one of those Classes. The Fund can select which Class to include (e.g., the oldest Class, the Class with the greatest net assets).
Reference 1: http://www.xbrl.org/2003/role/presentationRef -Publisher SEC -Name Form -Number N-1A -Chapter A -Section 4 -Subsection b -Paragraph 2 -Subparagraph ii
If the Fund has annual returns for at least one calendar year, provide a bar chart showing the Fund's annual total returns for each of the last 10 calendar years (or for the life of the Fund if less than 10 years), but only for periods subsequent to the effective date of the Fund's registration statement. Present the corresponding numerical return adjacent to each bar. If the Fund's fiscal year is other than a calendar year, include the year-to-date return information as of the end of the most recent quarter in a footnote to the bar chart. Following the bar chart, disclose the Fund's highest and lowest return for a quarter during the 10 years or other period of the bar chart.
Reference 1: http://www.xbrl.org/2003/role/presentationRef -Publisher SEC -Name Form -Number N-1A -Chapter A -Section 4 -Subsection b -Paragraph 2 -Subparagraph ii
Distribution [and/or Service] (12b-1) Fees" include all distribution or other expenses incurred during the most recent fiscal year under a plan adopted pursuant to rule 12b-1 [17 CFR 270.12b-1]. Under an appropriate caption or a subcaption of "Other Expenses," disclose the amount of any distribution or similar expenses deducted from the Fund's assets other than pursuant to a rule 12b-1 plan.
Risk/Return Summary Fee Table Includes the following information, in plain English under rule 421(d) under the Securities Act, after Item 2 Fees and expenses of the Fund This table describes the fees and expenses that you may pay if you buy and hold shared of the Fund. You may qualify for sales charge discounts if you and your family invest, or agree to invest in the future, at least $[_____] in [name of fund family] funds. Shareholder Fees (fees paid directly from your investment) Example This Example is intended to help you compare the cost of investing in the Fund with the cost of investing in other mutual funds. The Example assumes that you invest $10,000 in the Fund for the time periods indicated and then you redeem all of your shares at the end of those periods. The Example also assumes that your investment has a 5% return per year and that the Fund's operating expenses remained the same. Although your actual costs may be higher or lower, based on these assumptions your costs would be You would pay the following expenses if you did not redeem your shares The Example does not reflect sales charges (loads) on reinvested dividends [and other distributions]. If these sales charges (loads) were included, your costs would be higher. Portfolio Turnover The Fund pays transaction costs, such as commissions, when it buys and sells securities (or "turns over" its portfolio). A higher portfolio turnover may indicate higher transaction costs. These costs, which are not reflected in annual fund operating expenses or in the example, affect the Fund's performance. During the most recent fiscal year, the Fund's portfolio turnover rate was __% of the average value of its whole portfolio. Instructions. A.3.instructions.6 New Funds. For purposes of this Item, a "New Fund" is a Fund that does not include in Form N-1A financial statements reporting operating results or that includes financial statements for the Fund's initial fiscal year reporting operating results for a period of 6 months or less. The following Instructions apply to New Funds.
This table describes the fees and expenses that you may pay if you buy and hold shared of the Fund. You may qualify for sales charge discounts if you and your family invest, or agree to invest in the future, at least $[_____] in [name of fund family] funds. Include the narrative explanations in the order indicated. A Fund may modify the narrative explanations if the explanation contains comparable information to that shown. The narrative explanation regarding sales charge discounts is only required by a Fund that offers such discounts and should specify the minimum level of investment required to qualify for a discount. Modify the narrative explanation to state that Fund shares are sold on a national securities exchange at the end of the time periods indicated, and that brokerage commissions for buying and selling Fund shares through a broker are not reflected.
Total Annual Fund Operating Expenses. If the Fund is a Feeder Fund, reflect the aggregate expenses of the Feeder Fund and the Master Fund in a single fee table using the captions provided. In a footnote to the fee table, state that the table and Example reflect the expenses of both the Feeder and Master Funds. If the prospectus offers more than one Class of a Multiple Class Fund or more than one Feeder Fund that invests in the same Master Fund, provide a separate response for each Class or Feeder Fund. Base the percentages of "Annual Fund Operating Expenses" on amounts incurred during the Fund's most recent fiscal year, but include in expenses amounts that would have been incurred absent expense reimbursement or fee waiver arrangements. If the Fund has changed its fiscal year and, as a result, the most recent fiscal year is less than three months, use the fiscal year prior to the most recent fiscal year as the basis for determining "Annual Fund Operating Expenses."
Management Fees include investment advisory fees (including any fees based on the Fund's performance), any other management fees payable to the investment adviser or its affiliates, and administrative fees payable to the investment adviser or its affiliates that are not included as "Other Expenses."
Include the caption "Maximum Account Fees" only if the Fund charges these fees. A Fund may omit other captions if the Fund does not charge the fees or expenses covered by the captions. Disclose account fees that may be charged to a typical investor in the Fund; fees that apply to only a limited number of shareholders based on their particular circumstances need not be disclosed. Include a caption describing the maximum account fee (e.g., "Maximum Account Maintenance Fee" or "Maximum Cash Management Fee"). State the maximum annual account fee as either a fixed dollar amount or a percentage of assets. Include in a parenthetical to the caption the basis on which any percentage is calculated. If an account fee is charged only to accounts that do not meet a certain threshold (e.g., accounts under $5)
Maximum Deferred Sales Charge (Load) (as a percentage of ____) "Maximum Deferred Sales Charge (Load)" includes the maximum total deferred sales charge (load) payable upon redemption, in installments, or both, expressed as a percentage of the amount or amounts stated in response to Item 7(a), except that, for a sales charge (load) based on net asset value at the time of purchase, show the sales charge (load) as a percentage of the offering price at the time of purchase. A Fund may include in a footnote to the table, if applicable, a tabular presentation showing the amount of deferred sales charges (loads) over time or a narrative explanation of the sales charges (loads) (e.g., __% in the first year after purchase, declining to __% in the __ year and eliminated thereafter). If more than one type of sales charge (load) is imposed (e.g., a deferred sales charge (load) and a front-end sales charge (load)), the first caption in the table should read "Maximum Sales Charge (Load)" and show the maximum cumulative percentage. Show the percentage amounts and the terms of each sales charge (load) comprising that figure on separate lines below.
Maximum Deferred Sales Charge (Load) (as a percentage of ____) A.3.instructions.2.a.i "Maximum Deferred Sales Charge (Load)" includes the maximum total deferred sales charge (load) payable upon redemption, in installments, or both, expressed as a percentage of the amount or amounts stated in response to Item 7(a), except that, for a sales charge (load) based on net asset value at the time of purchase, show the sales charge (load) as a percentage of the offering price at the time of purchase. A Fund may include in a footnote to the table, if applicable, a tabular presentation showing the amount of deferred sales charges (loads) over time or a narrative explanation of the sales charges (loads) (e.g., __% in the first year after purchase, declining to __% in the __ year and eliminated thereafter). A.3.instructions.2.a.ii If more than one type of sales charge (load) is imposed (e.g., a deferred sales charge (load) and a front-end sales charge (load)), the first caption in the table should read "Maximum Sales Charge (Load)" and show the maximum cumulative percentage. Show the percentage amounts and the terms of each sales charge (load) comprising that figure on separate lines below.
Investment Objectives/Goals. Disclose the Fund's investment objectives or goals. A Fund also may identify its type or category (e.g., that it is a Money Market Fund or a balanced fund).
Investment Objectives/Goals. Disclose the Fund's investment objectives or goals. A Fund also may identify its type or category (e.g., that it is a Money Market Fund or a balanced fund).
Investment Objectives/Goals. Disclose the Fund's investment objectives or goals. A Fund also may identify its type or category (e.g., that it is a Money Market Fund or a balanced fund).
"Other Expenses" include all expenses not otherwise disclosed in the table that are deducted from the Fund's assets or charged to all shareholder accounts. The amount of expenses deducted from the Fund's assets are the amounts shown as expenses in the Fund's statement of operations (including increases resulting from complying with paragraph 2(g) of rule 6-07 of Regulation S-X [17 CFR 210.6-07]). "Other Expenses" do not include extraordinary expenses as determined under generally accepted accounting principles (see Accounting Principles Board Opinion No. 30). If extraordinary expenses were incurred that materially affected the Fund's "Other Expenses," disclose in a footnote to the table what "Other Expenses" would have been had the extraordinary expenses been included.
If the Fund has annual returns for at least one calendar year, provide a table showing the Fund's (A) average annual total return; (B) average annual total return (after taxes on distributions); and (C) average annual total return (after taxes on distributions and redemption). A Money Market Fund should show only the returns described in clause (A) of the preceding sentence. All returns should be shown for 1-, 5-, and 10- calendar year periods ending on the date of the most recently completed calendar year (or for the life of the Fund, if shorter), but only for periods subsequent to the effective date of the Fund's registration statement. The table also should show the returns of an appropriate broad-based securities market index as defined in Instruction 5 to Item 22(b)(7) for the same periods. A Fund that has been in existence for more than 10 years also may include returns for the life of the Fund. A Money Market Fund may provide the Fund's 7-day yield ending on the date of the most recent calendar year or disclose a toll-free (or collect) telephone number that investors can use to obtain the Fund's current 7-day yield. For a Fund (other than a Money Market Fund or a Fund described in General Instruction C.3.(d)(iii)), provide the information in the following table with the specified captions AVERAGE ANNUAL TOTAL RETURNS (For the periods ended December 31, _____)
Reference 1: http://www.xbrl.org/2003/role/presentationRef -Publisher SEC -Name Form -Number N-1A -Chapter A -Section 4 -Subsection b -Paragraph 2 -Subparagraph iii
This item represents Average Anuual Total Returns. If a Multiple Class Fund offers a Class in the prospectus that converts into another Class after a stated period, compute average annual total returns in the table by using the returns of the other Class for the period after conversion.
If the Fund has annual returns for at least one calendar year, provide a table showing the Fund's (A) average annual total return; (B) average annual total return (after taxes on distributions); and (C) average annual total return (after taxes on distributions and redemption). A Money Market Fund should show only the returns described in clause (A) of the preceding sentence. All returns should be shown for 1-, 5-, and 10- calendar year periods ending on the date of the most recently completed calendar year (or for the life of the Fund, if shorter), but only for periods subsequent to the effective date of the Fund's registration statement. The table also should show the returns of an appropriate broad-based securities market index as defined in Instruction 5 to Item 22(b)(7) for the same periods. A Fund that has been in existence for more than 10 years also may include returns for the life of the Fund. A Money Market Fund may provide the Fund's 7-day yield ending on the date of the most recent calendar year or disclose a toll-free (or collect) telephone number that investors can use to obtain the Fund's current 7-day yield. For a Fund (other than a Money Market Fund or a Fund described in General Instruction C.3.(d)(iii)), provide the information in the following table with the specified captions AVERAGE ANNUAL TOTAL RETURNS (For the periods ended December 31, _____). For a Fund that provides annual total returns for only one calendar year or for a Fund that does not include the bar chart because it does not have annual returns for a full calendar year, modify, as appropriate, the narrative explanation required by paragraph (c)(2)(i) (e.g., by stating that the information gives some indication of the risks of an investment in the Fund by comparing the Fund's performance with a broad measure of market performance).
Reference 1: http://www.xbrl.org/2003/role/presentationRef -Publisher SEC -Name Form -Number N-1A -Chapter A -Section 4 -Subsection b -Paragraph 2 -Subparagraph iv
Disclose the portfolio turnover rate provided in response to Item 14(a) for the most recent fiscal year (or for such shorter period as the Fund has been in operation). Disclose the period for which the information is provided if less than a full fiscal year. A Fund that is a Money Market Fund may omit the portfolio turnover information required by this Item.
Disclose the portfolio turnover rate provided in response to Item 14(a) for the most recent fiscal year (or for such shorter period as the Fund has been in operation). Disclose the period for which the information is provided if less than a full fiscal year. A Fund that is a Money Market Fund may omit the portfolio turnover information required by this Item.
"Redemption Fee" (as a percentage of amount redeemed, if applicable) If the Fund is an Exchange-Traded Fund and issues or redeems shares in creation units of not less than 25,000 shares each, exclude any fees charged for the purchase and redemption of the Fund's creation units. "Redemption Fee" includes a fee charged for any redemption of the Fund's shares, but does not include a deferred sales charge (load) imposed upon redemption.
Narrative Risk Disclosure. A Fund may, in responding to this Item, describe the types of investors for whom the Fund is intended or the types of investment goals that may be consistent with an investment in the Fund.
Risk/Return Summary Investment Objectives/Goals Include the following information, in plain English under rule 421(d) under the Securities Act, in the order and subject matter indicated
Principal investment strategies of the Fund. Summarize how the Fund intends to achieve its investment objectives by identifying the Fund's principal investment strategies (including the type or types of securities in which the Fund invests or will invest principally) and any policy to concentrate in securities of issuers in a particular industry or group of industries.
Principal investment strategies of the Fund. Summarize how the Fund intends to achieve its investment objectives by identifying the Fund's principal investment strategies (including the type or types of securities in which the Fund invests or will invest principally) and any policy to concentrate in securities of issuers in a particular industry or group of industries.
The fund pays transaction costs, such as commissions, when it buys and sells securities (or “turns over” its portfolio). A higher portfolio turnover rate may indicate higher transaction costs and may result in higher taxes when fund shares are held in a taxable account. These costs, which are not reflected in annual fund operating expenses or in the example, affect the fund’s performance. During the most recent fiscal year, the fund’s portfolio turnover rate was 33.1% of the average value of its portfolio.
This example is intended to help you compare the cost of investing in the fund with the cost of investing in other mutual funds. The example assumes that you invest $10,000 in the fund for the time periods indicated and then redeem all of your shares at the end of those periods. The example also assumes that your investment has a 5% return each year and that the fund’s operating expenses remain the same. Although your actual costs may be higher or lower, based on these assumptions your costs would be:
The fund will normally invest at least 80% of its net assets (including any borrowings for investment purposes) in the common stocks of large- and medium-sized blue chip growth companies. These are firms that, in our view, are well established in their industries and have the potential for above-average earnings growth. We focus on companies with leading market positions, seasoned management, and strong financial fundamentals. The fund’s investment approach reflects our belief that solid company fundamentals (with an emphasis on the potential for strong growth in earnings per share or operating cash flow) combined with a positive outlook for a company’s industry will ultimately reward investors with strong investment performance. Some of the companies we target for the fund should have good prospects for dividend growth, and the fund may at times invest significantly in stocks of technology companies.
In pursuing its investment objective, the fund has the discretion to deviate from its normal investment criteria. These situations might arise when the fund’s adviser believes a security could increase in value for a variety of reasons, including an extraordinary corporate event, a new product introduction or innovation, a favorable competitive development, or a change in management.
While most assets will typically be invested in U.S. common stocks, the fund may invest in foreign stocks in keeping with the fund’s objectives.
The fund may sell securities for a variety of reasons, such as to secure gains, limit losses, or redeploy assets into more promising opportunities.
As with any mutual fund, there is no guarantee that the fund will achieve its objective. The fund’s share price fluctuates, which means you could lose money by investing in the fund. The principal risks of investing in this fund are summarized as follows:
Active management risk The fund is subject to the risk that the investment adviser’s judgments about the attractiveness, value, or potential appreciation of the fund’s investments may prove to be incorrect. If the investments selected and strategies employed by the fund fail to produce the intended results, the fund could underperform in comparison to other funds with similar objectives and investment strategies.
Risks of U.S. stock investing Stocks generally fluctuate in value more than bonds and may decline significantly over short time periods. There is a chance that stock prices overall will decline because stock markets tend to move in cycles, with periods of rising and falling prices. The value of a stock in which the fund invests may decline due to general weakness in the U.S. stock market, such as when the U.S. financial markets decline, or because of factors that affect a particular company or industry.
Investment style risk Different investment styles tend to shift in and out of favor depending on market conditions and investor sentiment. The fund’s growth approach to investing could cause it to underperform other stock funds that employ a different investment style. Growth stocks tend to be more volatile than certain other types of stocks, and their prices may fluctuate more dramatically than the overall stock market. A stock with growth characteristics can have sharp price declines due to decreases in current or expected earnings and may lack dividends that can help cushion its share price in a declining market.
Market capitalization risk The fund’s focus on large and medium sized companies subjects the fund to the risk that larger companies may not be able to attain the high growth rates of successful smaller companies, especially during strong economic periods, and they may be less capable of responding quickly to competitive challenges and industry changes. Because the fund focuses on large and medium sized companies, its share price could be more volatile than a fund that invests only in large companies. Medium sized companies typically have less experienced management, narrower product lines, more limited financial resources, and less publicly available information than larger companies.
Industry risk To the extent the fund invests in specific industries or sectors, it may be more susceptible to developments affecting those industries and sectors. For example, the fund may at times have significant investments in technology companies, which could result in the fund performing poorly during a downturn in one or more of the industries that heavily impact technology companies. Technology companies can be adversely affected by, among other things, intense competition, earnings disappointments, and rapid obsolescence of products and services due to technological innovations or changing consumer preferences.
Foreign investing risk This is the risk that the fund’s investments in foreign securities may be adversely affected by local, political, social, and economic conditions overseas, greater volatility, reduced liquidity, or decreases in foreign currency values relative to the U.S. dollar.
The bar chart showing calendar year returns and the average annual total returns table provide some indication of the risks of investing in the fund by showing how much returns can differ from year to year and how the fund's average annual returns for certain periods compare with the returns of a relevant broad-based market index, as well as with the returns of one or more comparative indexes that have investment characteristics similar to those of the fund. The fund's performance information represents only past performance (before and after taxes) and is not necessarily an indication of future results.
The fund can also experience short-term performance swings, as shown by the best and worst calendar quarter returns during the years depicted.
The bar chart showing calendar year returns and the average annual total returns table provide some indication of the risks of investing in the fund by showing how much returns can differ from year to year and how the fund's average annual returns for certain periods compare with the returns of a relevant broad-based market index, as well as with the returns of one or more comparative indexes that have investment characteristics similar to those of the fund.
After-tax returns are calculated using the historical highest individual federal marginal income tax rates and do not reflect the impact of state and local taxes.
Actual after-tax returns depend on an investor’s tax situation and may differ from those shown. After-tax returns shown are not relevant to investors who hold their fund shares through tax-deferred arrangements, such as a 401(k) account or individual retirement account.
In some cases, the figure shown for “returns after taxes on distributions and sale of fund shares” may be higher than the figure shown for “returns before taxes” because the calculations assume the investor received a tax deduction for any loss incurred on the sale of shares.
In addition, the average annual total returns table shows hypothetical after-tax returns to demonstrate how taxes paid by a shareholder may influence returns. After-tax returns are calculated using the historical highest individual federal marginal income tax rates and do not reflect the impact of state and local taxes. Actual after-tax returns depend on an investor’s tax situation and may differ from those shown. After-tax returns shown are not relevant to investors who hold their fund shares through tax-deferred arrangements, such as a 401(k) account or individual retirement account. In some cases, the figure shown for “returns after taxes on distributions and sale of fund shares” may be higher than the figure shown for “returns before taxes” because the calculations assume the investor received a tax deduction for any loss incurred on the sale of shares.
If the Fund has annual returns for at least one calendar year, provide a bar chart showing the Fund's annual total returns for each of the last 10 calendar years (or for the life of the Fund if less than 10 years), but only for periods subsequent to the effective date of the Fund's registration statement. Present the corresponding numerical return adjacent to each bar. If the Fund's fiscal year is other than a calendar year, include the year-to-date return information as of the end of the most recent quarter in a footnote to the bar chart. Following the bar chart, disclose the Fund's highest and lowest return for a quarter during the 10 years or other period of the bar chart. When a Multiple Class Fund offers more than one Class in the prospectus, provide annual total returns in the bar chart for only one of those Classes. The Fund can select which Class to include (e.g., the oldest Class, the Class with the greatest net assets).
Reference 1: http://www.xbrl.org/2003/role/presentationRef -Publisher SEC -Name Form -Number N-1A -Chapter A -Section 4 -Subsection b -Paragraph 2 -Subparagraph ii
If the Fund has annual returns for at least one calendar year, provide a bar chart showing the Fund's annual total returns for each of the last 10 calendar years (or for the life of the Fund if less than 10 years), but only for periods subsequent to the effective date of the Fund's registration statement. Present the corresponding numerical return adjacent to each bar. If the Fund's fiscal year is other than a calendar year, include the year-to-date return information as of the end of the most recent quarter in a footnote to the bar chart. Following the bar chart, disclose the Fund's highest and lowest return for a quarter during the 10 years or other period of the bar chart. When a Multiple Class Fund offers more than one Class in the prospectus, provide annual total returns in the bar chart for only one of those Classes. The Fund can select which Class to include (e.g., the oldest Class, the Class with the greatest net assets).
If the Fund has annual returns for at least one calendar year, provide a bar chart showing the Fund's annual total returns for each of the last 10 calendar years (or for the life of the Fund if less than 10 years), but only for periods subsequent to the effective date of the Fund's registration statement. Present the corresponding numerical return adjacent to each bar. If the Fund's fiscal year is other than a calendar year, include the year-to-date return information as of the end of the most recent quarter in a footnote to the bar chart. Following the bar chart, disclose the Fund's highest and lowest return for a quarter during the 10 years or other period of the bar chart. When a Multiple Class Fund offers more than one Class in the prospectus, provide annual total returns in the bar chart for only one of those Classes. The Fund can select which Class to include (e.g., the oldest Class, the Class with the greatest net assets).
Reference 1: http://www.xbrl.org/2003/role/presentationRef -Publisher SEC -Name Form -Number N-1A -Chapter A -Section 4 -Subsection b -Paragraph 2 -Subparagraph ii
If the Fund has annual returns for at least one calendar year, provide a bar chart showing the Fund's annual total returns for each of the last 10 calendar years (or for the life of the Fund if less than 10 years), but only for periods subsequent to the effective date of the Fund's registration statement. Present the corresponding numerical return adjacent to each bar. If the Fund's fiscal year is other than a calendar year, include the year-to-date return information as of the end of the most recent quarter in a footnote to the bar chart. Following the bar chart, disclose the Fund's highest and lowest return for a quarter during the 10 years or other period of the bar chart. When a Multiple Class Fund offers more than one Class in the prospectus, provide annual total returns in the bar chart for only one of those Classes. The Fund can select which Class to include (e.g., the oldest Class, the Class with the greatest net assets).
Reference 1: http://www.xbrl.org/2003/role/presentationRef -Publisher SEC -Name Form -Number N-1A -Chapter A -Section 4 -Subsection b -Paragraph 2 -Subparagraph ii
If the Fund has annual returns for at least one calendar year, provide a bar chart showing the Fund's annual total returns for each of the last 10 calendar years (or for the life of the Fund if less than 10 years), but only for periods subsequent to the effective date of the Fund's registration statement. Present the corresponding numerical return adjacent to each bar. If the Fund's fiscal year is other than a calendar year, include the year-to-date return information as of the end of the most recent quarter in a footnote to the bar chart. Following the bar chart, disclose the Fund's highest and lowest return for a quarter during the 10 years or other period of the bar chart.
Reference 1: http://www.xbrl.org/2003/role/presentationRef -Publisher SEC -Name Form -Number N-1A -Chapter A -Section 4 -Subsection b -Paragraph 2 -Subparagraph ii
Distribution [and/or Service] (12b-1) Fees" include all distribution or other expenses incurred during the most recent fiscal year under a plan adopted pursuant to rule 12b-1 [17 CFR 270.12b-1]. Under an appropriate caption or a subcaption of "Other Expenses," disclose the amount of any distribution or similar expenses deducted from the Fund's assets other than pursuant to a rule 12b-1 plan.
The Example assumes that you invest $10,000 in the Fund for the time periods indicated and then you redeem all of your shares at the end of those periods. The Example also assumes that your investment has a 5% return per year and that the Fund's operating expenses remained the same. Although your actual costs may be higher or lower.
The Example assumes that you invest $10,000 in the Fund for the time periods indicated and then you redeem all of your shares at the end of those periods. The Example also assumes that your investment has a 5% return per year and that the Fund's operating expenses remained the same. Although your actual costs may be higher or lower.
The Example assumes that you invest $10,000 in the Fund for the time periods indicated and then you redeem all of your shares at the end of those periods. The Example also assumes that your investment has a 5% return per year and that the Fund's operating expenses remained the same. Although your actual costs may be higher or lower.
The Example assumes that you invest $10,000 in the Fund for the time periods indicated and then you redeem all of your shares at the end of those periods. The Example also assumes that your investment has a 5% return per year and that the Fund's operating expenses remained the same. Although your actual costs may be higher or lower.
Risk/Return Summary Fee Table Includes the following information, in plain English under rule 421(d) under the Securities Act, after Item 2 Fees and expenses of the Fund This table describes the fees and expenses that you may pay if you buy and hold shared of the Fund. You may qualify for sales charge discounts if you and your family invest, or agree to invest in the future, at least $[_____] in [name of fund family] funds. Shareholder Fees (fees paid directly from your investment) Example This Example is intended to help you compare the cost of investing in the Fund with the cost of investing in other mutual funds. The Example assumes that you invest $10,000 in the Fund for the time periods indicated and then you redeem all of your shares at the end of those periods. The Example also assumes that your investment has a 5% return per year and that the Fund's operating expenses remained the same. Although your actual costs may be higher or lower, based on these assumptions your costs would be You would pay the following expenses if you did not redeem your shares The Example does not reflect sales charges (loads) on reinvested dividends [and other distributions]. If these sales charges (loads) were included, your costs would be higher. Portfolio Turnover The Fund pays transaction costs, such as commissions, when it buys and sells securities (or "turns over" its portfolio). A higher portfolio turnover may indicate higher transaction costs. These costs, which are not reflected in annual fund operating expenses or in the example, affect the Fund's performance. During the most recent fiscal year, the Fund's portfolio turnover rate was __% of the average value of its whole portfolio. Instructions. A.3.instructions.6 New Funds. For purposes of this Item, a "New Fund" is a Fund that does not include in Form N-1A financial statements reporting operating results or that includes financial statements for the Fund's initial fiscal year reporting operating results for a period of 6 months or less. The following Instructions apply to New Funds.
This table describes the fees and expenses that you may pay if you buy and hold shared of the Fund. You may qualify for sales charge discounts if you and your family invest, or agree to invest in the future, at least $[_____] in [name of fund family] funds. Include the narrative explanations in the order indicated. A Fund may modify the narrative explanations if the explanation contains comparable information to that shown. The narrative explanation regarding sales charge discounts is only required by a Fund that offers such discounts and should specify the minimum level of investment required to qualify for a discount. Modify the narrative explanation to state that Fund shares are sold on a national securities exchange at the end of the time periods indicated, and that brokerage commissions for buying and selling Fund shares through a broker are not reflected.
Total Annual Fund Operating Expenses. If the Fund is a Feeder Fund, reflect the aggregate expenses of the Feeder Fund and the Master Fund in a single fee table using the captions provided. In a footnote to the fee table, state that the table and Example reflect the expenses of both the Feeder and Master Funds. If the prospectus offers more than one Class of a Multiple Class Fund or more than one Feeder Fund that invests in the same Master Fund, provide a separate response for each Class or Feeder Fund. Base the percentages of "Annual Fund Operating Expenses" on amounts incurred during the Fund's most recent fiscal year, but include in expenses amounts that would have been incurred absent expense reimbursement or fee waiver arrangements. If the Fund has changed its fiscal year and, as a result, the most recent fiscal year is less than three months, use the fiscal year prior to the most recent fiscal year as the basis for determining "Annual Fund Operating Expenses."
If the Fund has annual returns for at least one calendar year, provide a bar chart showing the Fund's annual total returns for each of the last 10 calendar years (or for the life of the Fund if less than 10 years), but only for periods subsequent to the effective date of the Fund's registration statement. Present the corresponding numerical return adjacent to each bar. If the Fund's fiscal year is other than a calendar year, include the year-to-date return information as of the end of the most recent quarter in a footnote to the bar chart. Following the bar chart, disclose the Fund's highest and lowest return for a quarter during the 10 years or other period of the bar chart.
Reference 1: http://www.xbrl.org/2003/role/presentationRef -Publisher SEC -Name Form -Number N-1A -Chapter A -Section 4 -Subsection b -Paragraph 2 -Subparagraph ii
Management Fees include investment advisory fees (including any fees based on the Fund's performance), any other management fees payable to the investment adviser or its affiliates, and administrative fees payable to the investment adviser or its affiliates that are not included as "Other Expenses."
Include the caption "Maximum Account Fees" only if the Fund charges these fees. A Fund may omit other captions if the Fund does not charge the fees or expenses covered by the captions. Disclose account fees that may be charged to a typical investor in the Fund; fees that apply to only a limited number of shareholders based on their particular circumstances need not be disclosed. Include a caption describing the maximum account fee (e.g., "Maximum Account Maintenance Fee" or "Maximum Cash Management Fee"). State the maximum annual account fee as either a fixed dollar amount or a percentage of assets. Include in a parenthetical to the caption the basis on which any percentage is calculated. If an account fee is charged only to accounts that do not meet a certain threshold (e.g., accounts under $5)
Maximum Deferred Sales Charge (Load) (as a percentage of ____) "Maximum Deferred Sales Charge (Load)" includes the maximum total deferred sales charge (load) payable upon redemption, in installments, or both, expressed as a percentage of the amount or amounts stated in response to Item 7(a), except that, for a sales charge (load) based on net asset value at the time of purchase, show the sales charge (load) as a percentage of the offering price at the time of purchase. A Fund may include in a footnote to the table, if applicable, a tabular presentation showing the amount of deferred sales charges (loads) over time or a narrative explanation of the sales charges (loads) (e.g., __% in the first year after purchase, declining to __% in the __ year and eliminated thereafter). If more than one type of sales charge (load) is imposed (e.g., a deferred sales charge (load) and a front-end sales charge (load)), the first caption in the table should read "Maximum Sales Charge (Load)" and show the maximum cumulative percentage. Show the percentage amounts and the terms of each sales charge (load) comprising that figure on separate lines below.
Maximum Deferred Sales Charge (Load) (as a percentage of ____) A.3.instructions.2.a.i "Maximum Deferred Sales Charge (Load)" includes the maximum total deferred sales charge (load) payable upon redemption, in installments, or both, expressed as a percentage of the amount or amounts stated in response to Item 7(a), except that, for a sales charge (load) based on net asset value at the time of purchase, show the sales charge (load) as a percentage of the offering price at the time of purchase. A Fund may include in a footnote to the table, if applicable, a tabular presentation showing the amount of deferred sales charges (loads) over time or a narrative explanation of the sales charges (loads) (e.g., __% in the first year after purchase, declining to __% in the __ year and eliminated thereafter). A.3.instructions.2.a.ii If more than one type of sales charge (load) is imposed (e.g., a deferred sales charge (load) and a front-end sales charge (load)), the first caption in the table should read "Maximum Sales Charge (Load)" and show the maximum cumulative percentage. Show the percentage amounts and the terms of each sales charge (load) comprising that figure on separate lines below.
Investment Objectives/Goals. Disclose the Fund's investment objectives or goals. A Fund also may identify its type or category (e.g., that it is a Money Market Fund or a balanced fund).
Investment Objectives/Goals. Disclose the Fund's investment objectives or goals. A Fund also may identify its type or category (e.g., that it is a Money Market Fund or a balanced fund).
Investment Objectives/Goals. Disclose the Fund's investment objectives or goals. A Fund also may identify its type or category (e.g., that it is a Money Market Fund or a balanced fund).
"Other Expenses" include all expenses not otherwise disclosed in the table that are deducted from the Fund's assets or charged to all shareholder accounts. The amount of expenses deducted from the Fund's assets are the amounts shown as expenses in the Fund's statement of operations (including increases resulting from complying with paragraph 2(g) of rule 6-07 of Regulation S-X [17 CFR 210.6-07]). "Other Expenses" do not include extraordinary expenses as determined under generally accepted accounting principles (see Accounting Principles Board Opinion No. 30). If extraordinary expenses were incurred that materially affected the Fund's "Other Expenses," disclose in a footnote to the table what "Other Expenses" would have been had the extraordinary expenses been included.
If applicable, include a statement explaining that updated performance information is available and providing a Web site address and/or toll-free (or collect) telephone number where the updated information may be obtained.
Reference 1: http://www.xbrl.org/2003/role/presentationRef -Publisher SEC -Name Form -Number N-1A -Chapter A -Section 4 -Subsection b -Paragraph 2 -Subparagraph i
If applicable, include a statement explaining that updated performance information is available and providing a Website address and/or toll-free (or collect) telephone number where the updated information may be obtained.
Reference 1: http://www.xbrl.org/2003/role/presentationRef -Publisher SEC -Name Form -Number N-1A -Chapter A -Section 4 -Subsection b -Paragraph 2 -Subparagraph i
Include the bar chart and table required by paragraphs (b)(2)(ii) and (iii) of this section. Provide a brief explanation of how the information illustrates the variability of the Fund's returns (e.g., by stating that the information provides some indication of the risks of investing in the Fund by showing changes in the Fund's performance from year to year and by showing how the Fund's average annual returns for 1, 5, and 10 years compare with those of a broad measure of market performance). Provide a statement to the effect that the Fund's past performance (before and after taxes) is not necessarily an indication of how the Fund will perform in the future.
Reference 1: http://www.xbrl.org/2003/role/presentationRef -Publisher SEC -Name Form -Number N-1A -Chapter A -Section 4 -Subsection b -Paragraph 2 -Subparagraph i
If the Fund has annual returns for at least one calendar year, provide a table showing the Fund's (A) average annual total return; (B) average annual total return (after taxes on distributions); and (C) average annual total return (after taxes on distributions and redemption). A Money Market Fund should show only the returns described in clause (A) of the preceding sentence. All returns should be shown for 1-, 5-, and 10- calendar year periods ending on the date of the most recently completed calendar year (or for the life of the Fund, if shorter), but only for periods subsequent to the effective date of the Fund's registration statement. The table also should show the returns of an appropriate broad-based securities market index as defined in Instruction 5 to Item 22(b)(7) for the same periods. A Fund that has been in existence for more than 10 years also may include returns for the life of the Fund. A Money Market Fund may provide the Fund's 7-day yield ending on the date of the most recent calendar year or disclose a toll-free (or collect) telephone number that investors can use to obtain the Fund's current 7-day yield. For a Fund (other than a Money Market Fund or a Fund described in General Instruction C.3.(d)(iii)), provide the information in the following table with the specified captions AVERAGE ANNUAL TOTAL RETURNS (For the periods ended December 31, _____)
Reference 1: http://www.xbrl.org/2003/role/presentationRef -Publisher SEC -Name Form -Number N-1A -Chapter A -Section 4 -Subsection b -Paragraph 2 -Subparagraph iii
If average annual total return (after taxes on distributions and redemption) is higher than average annual total return, the reason for this result may be explained.
Reference 1: http://www.xbrl.org/2003/role/presentationRef -Publisher SEC -Name Form -Number N-1A -Chapter A -Section 4 -Subsection b -Paragraph 2 -Subparagraph iv -Clause D
This item represents Average Anuual Total Returns. If a Multiple Class Fund offers a Class in the prospectus that converts into another Class after a stated period, compute average annual total returns in the table by using the returns of the other Class for the period after conversion.
If the Fund has annual returns for at least one calendar year, provide a table showing the Fund's (A) average annual total return; (B) average annual total return (after taxes on distributions); and (C) average annual total return (after taxes on distributions and redemption). A Money Market Fund should show only the returns described in clause (A) of the preceding sentence. All returns should be shown for 1-, 5-, and 10- calendar year periods ending on the date of the most recently completed calendar year (or for the life of the Fund, if shorter), but only for periods subsequent to the effective date of the Fund's registration statement. The table also should show the returns of an appropriate broad-based securities market index as defined in Instruction 5 to Item 22(b)(7) for the same periods. A Fund that has been in existence for more than 10 years also may include returns for the life of the Fund. A Money Market Fund may provide the Fund's 7-day yield ending on the date of the most recent calendar year or disclose a toll-free (or collect) telephone number that investors can use to obtain the Fund's current 7-day yield. For a Fund (other than a Money Market Fund or a Fund described in General Instruction C.3.(d)(iii)), provide the information in the following table with the specified captions AVERAGE ANNUAL TOTAL RETURNS (For the periods ended December 31, _____). For a Fund that provides annual total returns for only one calendar year or for a Fund that does not include the bar chart because it does not have annual returns for a full calendar year, modify, as appropriate, the narrative explanation required by paragraph (c)(2)(i) (e.g., by stating that the information gives some indication of the risks of an investment in the Fund by comparing the Fund's performance with a broad measure of market performance).
Reference 1: http://www.xbrl.org/2003/role/presentationRef -Publisher SEC -Name Form -Number N-1A -Chapter A -Section 4 -Subsection b -Paragraph 2 -Subparagraph iv
Provide a brief explanation that the actual after-tax returns depend on an investor's tax situation and may differ from those shown, and after-tax returns shown are not relevant to investors who hold their Fund shares through tax-deferred arrangements, such as 401(k) plans or individual retirement accounts.
Reference 1: http://www.xbrl.org/2003/role/presentationRef -Publisher SEC -Name Form -Number N-1A -Chapter A -Section 4 -Subsection b -Paragraph 2 -Subparagraph iv -Clause B
Provide a brief explanation that after-tax returns are calculated using the historical highest individual federal marginal income tax rates and do not reflect the impact of state and local taxes.
Reference 1: http://www.xbrl.org/2003/role/presentationRef -Publisher SEC -Name Form -Number N-1A -Chapter A -Section 4 -Subsection b -Paragraph 2 -Subparagraph iii
Disclose the portfolio turnover rate provided in response to Item 14(a) for the most recent fiscal year (or for such shorter period as the Fund has been in operation). Disclose the period for which the information is provided if less than a full fiscal year. A Fund that is a Money Market Fund may omit the portfolio turnover information required by this Item.
This element represents the rate of portfolio turnover presented as a percentage (SEC Form N-1A 2006-09-14 A.3.example.3 Portfolio Turnover A.3.instructions.5 Portfolio Turnover).
Disclose the portfolio turnover rate provided in response to Item 14(a) for the most recent fiscal year (or for such shorter period as the Fund has been in operation). Disclose the period for which the information is provided if less than a full fiscal year. A Fund that is a Money Market Fund may omit the portfolio turnover information required by this Item.
"Redemption Fee" (as a percentage of amount redeemed, if applicable) If the Fund is an Exchange-Traded Fund and issues or redeems shares in creation units of not less than 25,000 shares each, exclude any fees charged for the purchase and redemption of the Fund's creation units. "Redemption Fee" includes a fee charged for any redemption of the Fund's shares, but does not include a deferred sales charge (load) imposed upon redemption.
Summarize the principal risks of investing in the Fund, including the risks to which the Fund's portfolio as a whole is subject and the circumstances reasonably likely to affect adversely the Fund's net asset value, yield, and total return. Unless the Fund is a Money Market Fund, disclose that loss of money is a risk of investing in the Fund. A Fund may, in responding to this Item, describe the types of investors for whom the Fund is intended or the types of investment goals that may be consistent with an investment in the Fund.
Reference 1: http://www.xbrl.org/2003/role/presentationRef -Publisher SEC -Name Form -Number N-1A -Chapter A -Section 4 -Subsection b -Paragraph 1 -Subparagraph i
Narrative Risk Disclosure. A Fund may, in responding to this Item, describe the types of investors for whom the Fund is intended or the types of investment goals that may be consistent with an investment in the Fund.
Risk/Return Summary Investment Objectives/Goals Include the following information, in plain English under rule 421(d) under the Securities Act, in the order and subject matter indicated
Principal investment strategies of the Fund. Summarize how the Fund intends to achieve its investment objectives by identifying the Fund's principal investment strategies (including the type or types of securities in which the Fund invests or will invest principally) and any policy to concentrate in securities of issuers in a particular industry or group of industries.
Principal investment strategies of the Fund. Summarize how the Fund intends to achieve its investment objectives by identifying the Fund's principal investment strategies (including the type or types of securities in which the Fund invests or will invest principally) and any policy to concentrate in securities of issuers in a particular industry or group of industries.