UNITED STATES
SECURITIES AND EXCHANGE COMMISSION
Washington, D.C. 20549
FORM N-CSR
CERTIFIED SHAREHOLDER REPORT OF REGISTERED MANAGEMENT
INVESTMENT COMPANIES
Investment Company Act file number: 811-07660
Name of Fund: BlackRock Massachusetts Tax-Exempt Trust (MHE)
Fund Address: 100 Bellevue Parkway, Wilmington, DE 19809
Name and address of agent for service: John M. Perlowski, Chief Executive Officer, BlackRock Massachusetts Tax-Exempt Trust, 55 East 52nd Street, New York, NY 10055
Registrant’s telephone number, including area code: (800) 882-0052, Option 4
Date of fiscal year end: 08/31/2019
Date of reporting period: 08/31/2019
Item 1 – Report to Stockholders
AUGUST 31, 2019
| ANNUAL REPORT |

|
BlackRock Maryland Municipal Bond Trust (BZM)
BlackRock Massachusetts Tax-Exempt Trust (MHE)
BlackRock MuniHoldings New York Quality Fund, Inc. (MHN)
BlackRock New York Municipal Bond Trust (BQH)
BlackRock New York Municipal Income Quality Trust (BSE)
BlackRock New York Municipal Income Trust II (BFY)
BlackRock Virginia Municipal Bond Trust (BHV)
Beginning on January 1, 2021, as permitted by regulations adopted by the Securities and Exchange Commission, paper copies of each Trust’s shareholder reports will no longer be sent by mail, unless you specifically request paper copies of the reports from BlackRock or from your financial intermediary, such as a broker-dealer or bank. Instead, the reports will be made available on a website, and you will be notified by mail each time a report is posted and provided with a website link to access the report.
You may elect to receive all future reports in paper free of charge. If you hold accounts directly with BlackRock, you can call Computershare at (800) 699-1236 to request that you continue receiving paper copies of your shareholder reports. If you hold accounts through a financial intermediary, you can follow the instructions included with this disclosure, if applicable, or contact your financial intermediary to request that you continue to receive paper copies of your shareholder reports. Please note that not all financial intermediaries may offer this service. Your election to receive reports in paper will apply to all funds advised by BlackRock Advisors, LLC or its affiliates, or all funds held with your financial intermediary, as applicable.
If you already elected to receive shareholder reports electronically, you will not be affected by this change and you need not take any action. You may elect to receive electronic delivery of shareholder reports and other communications by contacting your financial intermediary, if you hold accounts through a financial intermediary. Please note that not all financial intermediaries may offer this service.
| Not FDIC Insured • May Lose Value • No Bank Guarantee |


| 2 | THIS PAGE IS NOT PART OF YOUR FUND REPORT |
| Page | ||||
| 2 | ||||
| 4 | ||||
| 5 | ||||
| 5 | ||||
| 6 | ||||
| Financial Statements: |
||||
| 20 | ||||
| 54 | ||||
| 56 | ||||
| 58 | ||||
| 62 | ||||
| 64 | ||||
| 71 | ||||
| 82 | ||||
| 83 | ||||
| 87 | ||||
| 88 | ||||
| 91 | ||||
| 94 | ||||
| 3 |
Municipal Market Overview For the Reporting Period Ended August 31, 2019
Municipal Market Conditions
Municipal bonds posted strong total returns during the period, buoyed by rallying interest rates as the Fed turned more dovish late in 2018 on the back of slowing global growth and trade uncertainties, indicated by a commitment to sustain the current economic expansion, and ultimately cut interest rates for the first time since 2008 at its July meeting.
| Outside of the favorable rate backdrop, municipal technicals remained incredibly supportive with strong demand outpacing moderate supply. Broadly, investors favored the tax-exempt income, diversification, quality, and value of municipal bonds given that tax reform ultimately lowered the top individual tax rate just 2.6% while eliminating deductions. During the 12 months ended August 31, 2019, municipal bond funds experienced net inflows of approximately $53 billion (based on data from the Investment Company Institute), although they displayed some bouts of volatility. For the same 12-month period, | S&P Municipal Bond Index | |
| Total Returns as of August 31, 2019 | ||
| 6 months: 5.92% | ||
| 12 months: 8.26% | ||
total new issuance underwhelmed from a historical perspective at just $331 billion (below the $373 billion issued in the prior 12-month period), a direct result of the elimination of advanced refundings through the 2017 Tax Cuts and Jobs Act. This transitioned the market to a favorable net negative supply environment in which reinvestment income (coupons, calls, and maturities) largely outstripped gross issuance and provided a powerful technical tailwind.
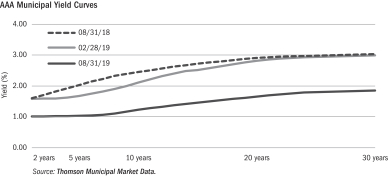
A Closer Look at Yields
|
|
From August 31, 2018 to August 31, 2019, yields on AAA-rated 30-year municipal bonds decreased by 118 basis points (“bps”) from 3.02% to 1.84%, while ten-year rates decreased by 122 bps from 2.44% to 1.22% and five-year rates decreased by 99 bps from 2.02% to 1.03% (as measured by Thomson Municipal Market Data). As a result, the municipal yield curve flattened over the 12-month period with the spread between two- and 30-year maturities flattening by 49 bps, led by 53 bps of flattening between two- and ten-year maturities. |
During the same time period, tax-exempt municipal bonds underperformed duration matched U.S. Treasuries, most notably in the front and intermediate part of the curve. However, relative valuations remained stretched versus recent history. Given that the corporate tax rate was lowered much more than the individual rate, institutions now have less incentive to own tax-exempt municipal bonds, while individuals are more incentivized. In a more retail-driven market, lower municipal-to-Treasury ratios are likely sustainable as individuals are focused on generating tax-free income and less concerned with relative valuations. The asset class is known for its lower relative volatility and preservation of principal with an emphasis on income as tax rates rise.
Financial Conditions of Municipal Issuers
The majority of municipal credits remain strong, despite well-publicized problems among a few issuers. Four of the five states with the largest amount of debt outstanding — California, New York, Texas and Florida — continue to exhibit improved credit fundamentals. However, several states with the largest unfunded pension liabilities are faced with elevated borrowing costs and difficult budgetary decisions. Across the country on the local level, property values support credit stability. S&P Global Inc.’s decision to remove its “negative” outlook on New Mexico underscores the improvement in state finances as it was the only remaining state with the designation. Revenue bonds continue to drive performance as investors continue to seek higher yield bonds in the tobacco sector. BlackRock maintains the view that municipal bond defaults will remain minimal and in the periphery while the overall market is fundamentally sound. We continue to advocate careful credit research and believe that a thoughtful approach to structure and security selection remains imperative amid uncertainty in a modestly improving economic environment.
The opinions expressed are those of BlackRock as of August 31, 2019 and are subject to change at any time due to changes in market or economic conditions. The comments should not be construed as a recommendation of any individual holdings or market sectors. Investing involves risk including loss of principal. Bond values fluctuate in price so the value of your investment can go down depending on market conditions. Fixed income risks include interest-rate and credit risk. Typically, when interest rates rise, there is a corresponding decline in bond values. Credit risk refers to the possibility that the bond issuer will not be able to make principal and interest payments. There may be less information on the financial condition of municipal issuers than for public corporations. The market for municipal bonds may be less liquid than for taxable bonds. Some investors may be subject to Alternative Minimum Tax (“AMT”). Capital gains distributions, if any, are taxable.
The S&P Municipal Bond Index, a broad, market value-weighted index, seeks to measure the performance of the U.S. municipal bond market. All bonds in the index are exempt from U.S. federal income taxes or subject to the AMT. Past performance is no guarantee of future results. Index performance is shown for illustrative purposes only. It is not possible to invest directly in an index.
| 4 | 2019 BLACKROCK ANNUAL REPORT TO SHAREHOLDERS |
The Benefits and Risks of Leveraging
The Trusts may utilize leverage to seek to enhance the distribution rate on, and net asset value (“NAV”) of, their common shares (“Common Shares”). However, there is no guarantee that these objectives can be achieved in all interest rate environments.
In general, the concept of leveraging is based on the premise that the financing cost of leverage, which is based on short-term interest rates, is normally lower than the income earned by a Trust on its longer-term portfolio investments purchased with the proceeds from leverage. To the extent that the total assets of the Trusts (including the assets obtained from leverage) are invested in higher-yielding portfolio investments, the Trusts’ shareholders benefit from the incremental net income. The interest earned on securities purchased with the proceeds from leverage (after paying the leverage costs) is paid to shareholders in the form of dividends, and the value of these portfolio holdings (less the leverage liability) is reflected in the per share NAV.
To illustrate these concepts, assume a Trust’s Common Shares capitalization is $100 million and it utilizes leverage for an additional $30 million, creating a total value of $130 million available for investment in longer-term income securities. If prevailing short-term interest rates are 3% and longer-term interest rates are 6%, the yield curve has a strongly positive slope. In this case, a Trust’s financing costs on the $30 million of proceeds obtained from leverage are based on the lower short-term interest rates. At the same time, the securities purchased by a Trust with the proceeds from leverage earn income based on longer-term interest rates. In this case, a Trust’s financing cost of leverage is significantly lower than the income earned on a Trust’s longer-term investments acquired from such leverage proceeds, and therefore the holders of Common Shares (“Common Shareholders”) are the beneficiaries of the incremental net income.
However, in order to benefit Common Shareholders, the return on assets purchased with leverage proceeds must exceed the ongoing costs associated with the leverage. If interest and other costs of leverage exceed the Trusts’ return on assets purchased with leverage proceeds, income to shareholders is lower than if the Trusts had not used leverage. Furthermore, the value of the Trusts’ portfolio investments generally varies inversely with the direction of long-term interest rates, although other factors can influence the value of portfolio investments. In contrast, the value of the Trusts’ obligations under their respective leverage arrangements generally does not fluctuate in relation to interest rates. As a result, changes in interest rates can influence the Trusts’ NAVs positively or negatively. Changes in the future direction of interest rates are very difficult to predict accurately, and there is no assurance that the Trusts’ intended leveraging strategy will be successful.
The use of leverage also generally causes greater changes in each Trust’s NAV, market price and dividend rates than comparable portfolios without leverage. In a declining market, leverage is likely to cause a greater decline in the NAV and market price of a Trust’s Common Shares than if the Trust were not leveraged. In addition, each Trust may be required to sell portfolio securities at inopportune times or at distressed values in order to comply with regulatory requirements applicable to the use of leverage or as required by the terms of leverage instruments, which may cause the Trust to incur losses. The use of leverage may limit a Trust’s ability to invest in certain types of securities or use certain types of hedging strategies. Each Trust incurs expenses in connection with the use of leverage, all of which are borne by Common Shareholders and may reduce income to the Common Shares. Moreover, to the extent the calculation of the Trusts’ investment advisory fees includes assets purchased with the proceeds of leverage, the investment advisory fees payable to the Trusts’ investment adviser will be higher than if the Trusts did not use leverage.
To obtain leverage, each Trust has issued Variable Rate Demand Preferred Shares (“VRDP Shares”) and/or leveraged its assets through the use of tender option bond trusts (“TOB Trusts”) as described in the Notes to Financial Statements.
Under the Investment Company Act of 1940, as amended (the “1940 Act”), each Trust is permitted to issue debt up to 33 1/3% of its total managed assets or equity securities (e.g., Preferred Shares) up to 50% of its total managed assets. A Trust may voluntarily elect to limit its leverage to less than the maximum amount permitted under the 1940 Act. In addition, a Trust may also be subject to certain asset coverage, leverage or portfolio composition requirements imposed by the Preferred Shares’ governing instruments or by agencies rating the Preferred Shares, which may be more stringent than those imposed by the 1940 Act.
If a Trust segregates or designates on its books and records cash or liquid assets having a value not less than the value of a Trust’s obligations under the TOB Trust (including accrued interest), then the TOB Trust is not considered a senior security and is not subject to the foregoing limitations and requirements imposed by the 1940 Act.
Derivative Financial Instruments
The Trusts may invest in various derivative financial instruments. These instruments are used to obtain exposure to a security, commodity, index, market, and/or other assets without owning or taking physical custody of securities, commodities and/or other referenced assets or to manage market, equity, credit, interest rate, foreign currency exchange rate, commodity and/or other risks. Derivative financial instruments may give rise to a form of economic leverage and involve risks, including the imperfect correlation between the value of a derivative financial instrument and the underlying asset, possible default of the counterparty to the transaction or illiquidity of the instrument. The Trusts’ successful use of a derivative financial instrument depends on the investment adviser’s ability to predict pertinent market movements accurately, which cannot be assured. The use of these instruments may result in losses greater than if they had not been used, may limit the amount of appreciation a Trust can realize on an investment and/or may result in lower distributions paid to shareholders. The Trusts’ investments in these instruments, if any, are discussed in detail in the Notes to Financial Statements.
| THE BENEFITS AND RISKS OF LEVERAGING / DERIVATIVE FINANCIAL INSTRUMENTS | 5 |
| Trust Summary as of August 31, 2019 | BlackRock Maryland Municipal Bond Trust |
BlackRock Maryland Municipal Bond Trust’s (BZM) (the “Trust”) investment objective is to provide current income exempt from regular U.S. federal income taxes and Maryland personal income taxes. The Trust seeks to achieve its investment objective by investing primarily in municipal bonds exempt from U.S. federal income taxes (except that the interest may be subject to the U.S. federal alternative minimum tax) and Maryland personal income taxes. The Trust invests, under normal market conditions, at least 80% of its managed assets in municipal bonds that are investment grade quality at the time of investment or, if unrated, determined to be of comparable quality by the Trust’s investment adviser at the time of investment. The Trust may invest directly in such securities or synthetically through the use of derivatives.
No assurance can be given that the Trust’s investment objective will be achieved.
Trust Information
| Symbol on New York Stock Exchange (“NYSE”) |
BZM | |
| Initial Offering Date |
April 30, 2002 | |
| Yield on Closing Market Price as of August 31, 2019 ($14.42)(a) |
3.03% | |
| Tax Equivalent Yield(b) |
5.67% | |
| Current Monthly Distribution per Common Share(c) |
$0.0364 | |
| Current Annualized Distribution per Common Share(c) |
$0.4368 | |
| Leverage as of August 31, 2019(d) |
37% |
| (a) | Yield on closing market price is calculated by dividing the current annualized distribution per share by the closing market price. Past performance does not guarantee future results. |
| (b) | Tax equivalent yield assumes the maximum marginal U.S. federal and state tax rate of 46.55%, which includes the 3.8% Medicare tax. Actual tax rates will vary based on income, exemptions and deductions. Lower taxes will result in lower tax equivalent yields. |
| (c) | The distribution rate is not constant and is subject to change. |
| (d) | Represents VRDP Shares and TOB Trusts as a percentage of total managed assets, which is the total assets of the Trust, including any assets attributable to VRDP Shares and TOB Trusts, minus the sum of accrued liabilities. Does not reflect derivatives or other instruments that may give rise to economic leverage. For a discussion of leveraging techniques utilized by the Trust, please see The Benefits and Risks of Leveraging and Derivative Financial Instruments on page 5. |
Performance
Returns for the 12 months ended August 31, 2019 were as follows:
| Returns Based On | ||||||||
| Market Price | NAV | |||||||
| BZM(a)(b) |
7.25 | % | 9.40 | % | ||||
| Lipper Other States Municipal Debt Funds(c) |
15.20 | 10.59 | ||||||
| (a) | All returns reflect reinvestment of dividends and/or distributions at actual reinvestment prices. |
| (b) | The Trust’s discount to NAV widened during the period, which accounts for the difference between performance based on market price and performance based on NAV. |
| (c) | Average return. Returns reflect reinvestment of dividends and/or distributions at NAV on the ex-dividend date as calculated by Lipper. |
Performance results may include adjustments made for financial reporting purposes in accordance with U.S. generally accepted accounting principles.
Past performance is not indicative of future results.
The following discussion relates to the Trust’s absolute performance based on NAV:
Municipal bonds produced a healthy gain in the 12-month period, largely as a result of the sharp decline in U.S. Treasury yields from November onward. (Prices and yields move in opposite directions.) Government bonds were boosted by the combination of slowing economic growth and the Fed’s pivot toward a more accommodative monetary policy. Tax-exempt issues gained further support from a continued improvement in municipal finances and a favorable balance of supply and demand in the market. Lower-quality bonds performed particularly well amid investors’ search for yield.
Although Maryland’s economic growth lagged the national average, generally positive economic conditions and robust revenues have helped the state add to its reserves. However, the state’s municipal market underperformed the national indexes largely a result of its lower interest-rate sensitivity and higher average credit quality.
At a time of strong returns for the overall market, the Trust’s use of leverage aided performance by amplifying price gains and enhancing portfolio income. Holdings in longer-dated securities with maturities of greater than 20 years generated the largest gains, as longer-term bonds outpaced short-term issues by a wide margin. The Trust further benefited from its positions in health care, transportation, and education sectors.
The Trust sought to manage interest rate risk using U.S. Treasury futures. Since U.S. Treasury yields fell, as prices rose, this strategy had an adverse impact on returns. The trend of net negative issuance exacerbated reinvestment risk as the proceeds from bonds that matured or were called needed to be reinvested at lower prevailing yields compared to bonds that were issued when yields were higher.
The views expressed reflect the opinions of BlackRock as of the date of this report and are subject to change based on changes in market, economic or other conditions. These views are not intended to be a forecast of future events and are no guarantee of future results.
| 6 | 2019 BLACKROCK ANNUAL REPORT TO SHAREHOLDERS |
| Trust Summary as of August 31, 2019 (continued) | BlackRock Maryland Municipal Bond Trust |
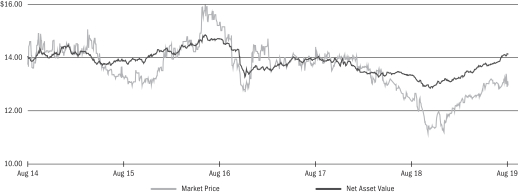
Market Price and Net Asset Value Per Share Summary
| 08/31/19 | 08/31/18 | Change | High | Low | ||||||||||||||||
| Market Price |
$ | 14.42 | $ | 14.04 | 2.71 | % | $ | 15.10 | $ | 12.61 | ||||||||||
| Net Asset Value |
15.61 | 14.90 | 4.77 | 15.62 | 14.41 | |||||||||||||||
Market Price and Net Asset Value History For the Past Five Years

Overview of the Trust’s Total Investments*
| TRUST SUMMARY | 7 |
| Trust Summary as of August 31, 2019 | BlackRock Massachusetts Tax-Exempt Trust |
Trust Overview
BlackRock Massachusetts Tax-Exempt Trust’s (MHE) (the “Trust”) investment objective is to provide as high a level of current income exempt from both regular U.S. federal income taxes and Massachusetts personal income taxes as is consistent with the preservation of shareholders’ capital. The Trust seeks to achieve its investment objective by investing primarily in Massachusetts tax-exempt obligations (including bonds, notes and capital lease obligations). The Trust invests, under normal market conditions, at least 80% of its assets in obligations that are rated investment grade at the time of investment or, if unrated, determined to be of comparable quality at the time of investment by the Trust’s investment adviser. Under normal market conditions, the Trust invests its assets so that at least 80% of the income generated by the Trust is exempt from U.S. federal income taxes, including U.S. federal alternative minimum tax, and Massachusetts personal income taxes. The Trust invests primarily in long term municipal obligations with maturities of more than ten years. The Trust may invest directly in such securities or synthetically through the use of derivatives.
No assurance can be given that the Trust’s investment objective will be achieved.
Trust Information
| Symbol on NYSE |
MHE | |
| Initial Offering Date |
July 23, 1993 | |
| Yield on Closing Market Price as of August 31, 2019 ($12.96)(a) |
3.70% | |
| Tax Equivalent Yield(b) |
6.84% | |
| Current Monthly Distribution per Common Share(c) |
$0.0400 | |
| Current Annualized Distribution per Common Share(c) |
$0.4800 | |
| Leverage as of August 31, 2019(d) |
39% |
| (a) | Yield on closing market price is calculated by dividing the current annualized distribution per share by the closing market price. Past performance does not guarantee future results. |
| (b) | Tax equivalent yield assumes the maximum marginal U.S. federal and state tax rate of 45.9%, which includes the 3.8% Medicare tax. Actual tax rates will vary based on income, exemptions and deductions. Lower taxes will result in lower tax equivalent yields. |
| (c) | The distribution rate is not constant and is subject to change. |
| (d) | Represents VRDP Shares and TOB Trusts as a percentage of total managed assets, which is the total assets of the Trust, including any assets attributable to VRDP Shares and TOB Trusts, minus the sum of accrued liabilities. Does not reflect derivatives or other instruments that may give rise to economic leverage. For a discussion of leveraging techniques utilized by the Trust, please see The Benefits and Risks of Leveraging and Derivative Financial Instruments on page 5. |
Performance
Returns for the 12 months ended August 31, 2019 were as follows:
| Returns Based On | ||||||||
| Market Price | NAV | |||||||
| MHE(a)(b) |
9.15 | % | 10.52 | % | ||||
| Lipper Other States Municipal Debt Funds(c) |
15.20 | 10.59 | ||||||
| (a) | All returns reflect reinvestment of dividends and/or distributions at actual reinvestment prices. |
| (b) | The Trust’s discount to NAV widened during the period, which accounts for the difference between performance based on market price and performance based on NAV. |
| (c) | Average return. Returns reflect reinvestment of dividends and/or distributions at NAV on the ex-dividend date as calculated by Lipper. |
Performance results may include adjustments made for financial reporting purposes in accordance with U.S. generally accepted accounting principles.
Past performance is not indicative of future results.
The following discussion relates to the Trust’s absolute performance based on NAV:
Municipal bonds produced a healthy gain in the 12-month period, largely as a result of the sharp decline in U.S. Treasury yields from November onward. (Prices and yields move in opposite directions.) Government bonds were boosted by the combination of slowing economic growth and the Fed’s pivot toward a more accommodative monetary policy. Tax-exempt issues gained further support from a continued improvement in municipal finances and a favorable balance of supply and demand in the market. Lower-quality bonds performed particularly well amid investors’ search for yield.
The Commonwealth of Massachusetts is in its healthiest financial position in more than a decade, with strong tax revenue growth and conservative budgeting for the 2019 fiscal year helping the state’s reserves reach the highest level in history. Massachusetts continued to benefit from an ongoing economic expansion, with low unemployment and a robust housing market. However, the state’s municipal market underperformed the national indexes largely a result of its lower interest-rate sensitivity and higher average credit quality.
At a time of strong returns for the overall market, the Trust’s use of leverage aided performance by amplifying price gains and enhancing portfolio income. Holdings in longer-dated securities with maturities of greater than 20 years generated the largest gains, as longer-term bonds outpaced short-term issues by a wide margin. The Trust was helped by its allocation to BBB credit tier, where yields spreads tightened due to the scarcity of higher yielding bonds in Massachusetts. The Trust further benefited from its positions in the education and state tax-backed sectors.
The Trust sought to manage interest rate risk using U.S. Treasury futures. Since U.S. Treasury yields fell, as prices rose, this strategy had an adverse impact on returns. The trend of net negative issuance exacerbated reinvestment risk as the proceeds from bonds that matured or were called needed to be reinvested at lower prevailing yields compared to bonds that were issued when yields were higher.
The views expressed reflect the opinions of BlackRock as of the date of this report and are subject to change based on changes in market, economic or other conditions. These views are not intended to be a forecast of future events and are no guarantee of future results.
| 8 | 2019 BLACKROCK ANNUAL REPORT TO SHAREHOLDERS |
| Trust Summary as of August 31, 2019 (continued) | BlackRock Massachusetts Tax-Exempt Trust |
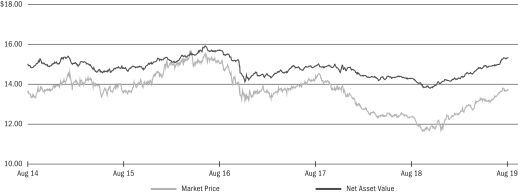
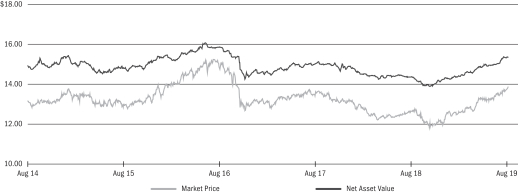
Market Price and Net Asset Value Per Share Summary
| 08/31/19 | 08/31/18 | Change | High | Low | ||||||||||||||||
| Market Price |
$ | 12.96 | $ | 12.38 | 4.68 | % | $ | 13.80 | $ | 11.09 | ||||||||||
| Net Asset Value |
14.13 | 13.33 | 6.00 | 14.14 | 12.85 | |||||||||||||||
Market Price and Net Asset Value History For the Past Five Years
Overview of the Trust’s Total Investments*
| TRUST SUMMARY | 9 |
| Trust Summary as of August 31, 2019 | BlackRock MuniHoldings New York Quality Fund, Inc. |
Trust Overview
BlackRock MuniHoldings New York Quality Fund, Inc.’s (MHN) (the “Trust”) investment objective is to provide shareholders with current income exempt from U.S. federal income tax and New York State and New York City personal income taxes. The Trust seeks to achieve its investment objective by investing, under normal market conditions, at least 80% of its assets in investment grade (as rated or, if unrated, considered to be of comparable quality at the time of investment by the Trust’s investment adviser) New York municipal obligations exempt from U.S. federal income taxes (except that the interest may be subject to the U.S. federal alternative minimum tax) and New York State and New York City personal income taxes (“New York Municipal Bonds”), except at times when, in the judgment of its investment adviser, New York Municipal Bonds of sufficient quality and quantity are unavailable for investment by the Trust. At all times, except during temporary defensive periods, the Trust invests at least 65% of its assets in New York Municipal Bonds. The Trust invests, under normal market conditions, at least 80% of its assets in municipal obligations with remaining maturities of one year or more. Effective July 31, 2019, the Trust may invest up to 20% of its managed assets in securities that are rated below investment grade, or are considered by BlackRock to be of comparable quality, at the time of purchase. The Trust may invest directly in such securities or synthetically through the use of derivatives.
No assurance can be given that the Trust’s investment objective will be achieved.
Trust Information
| Symbol on NYSE |
MHN | |
| Initial Offering Date |
September 19, 1997 | |
| Yield on Closing Market Price as of August 31, 2019 ($13.74)(a) |
3.89% | |
| Tax Equivalent Yield(b) |
7.72% | |
| Current Monthly Distribution per Common Share(c) |
$0.0445 | |
| Current Annualized Distribution per Common Share(c) |
$0.5340 | |
| Leverage as of August 31, 2019(d) |
39% |
| (a) | Yield on closing market price is calculated by dividing the current annualized distribution per share by the closing market price. Past performance does not guarantee future results. |
| (b) | Tax equivalent yield assumes the maximum marginal U.S. federal and state tax rate of 49.62%, which includes the 3.8% Medicare tax. Actual tax rates will vary based on income, exemptions and deductions. Lower taxes will result in lower tax equivalent yields. |
| (c) | The distribution rate is not constant and is subject to change. |
| (d) | Represents VRDP Shares and TOB Trusts as a percentage of total managed assets, which is the total assets of the Trust, including any assets attributable to VRDP Shares and TOB Trusts, minus the sum of accrued liabilities. Does not reflect derivatives or other instruments that may give rise to economic leverage. For a discussion of leveraging techniques utilized by the Trust, please see The Benefits and Risks of Leveraging and Derivative Financial Instruments on page 5. |
Performance
Returns for the 12 months ended August 31, 2019 were as follows:
| Returns Based On | ||||||||
| Market Price | NAV | |||||||
| MHN(a)(b) |
16.02 | % | 11.88 | % | ||||
| Lipper New York Municipal Debt Funds(c) |
14.90 | 11.11 | ||||||
| (a) | All returns reflect reinvestment of dividends and/or distributions at actual reinvestment prices. |
| (b) | The Trust’s discount to NAV narrowed during the period, which accounts for the difference between performance based on market price and performance based on NAV. |
| (c) | Average return. Returns reflect reinvestment of dividends and/or distributions at NAV on the ex-dividend date as calculated by Lipper. |
Performance results may include adjustments made for financial reporting purposes in accordance with U.S. generally accepted accounting principles.
Past performance is not indicative of future results.
The following discussion relates to the Trust’s absolute performance based on NAV:
Municipal bonds produced a healthy gain in the 12-month period, largely as a result of the sharp decline in U.S. Treasury yields from November onward. (Prices and yields move in opposite directions.) Government bonds were boosted by the combination of slowing economic growth and the Fed’s pivot toward a more accommodative monetary policy. Tax-exempt issues gained further support from a continued improvement in municipal finances and a favorable balance of supply and demand in the market.
Consistent with trends in the national market, New York municipal bonds struggled early in the period due to higher interest rates and expectations of further Fed tightening. These headwinds dissipated in early 2019, fueling a rally in New York issues and helping the state deliver a competitive return versus the broader U.S. indexes despite its lower duration and higher average credit quality. (Duration is a measure of interest rate sensitivity.) New York tax-exempt issues were further helped by strong demand as the Tax Cuts and Jobs Act of 2017 gave residents of high-tax states more incentive to own in-state bonds. Additionally, New York continued to benefit from its broad and diverse economic base.
At a time of strong results for the overall market, the Trust’s use of leverage aided performance by amplifying price gains and enhancing portfolio income. Positions in the tax-backed, transportation and health care sectors contributed positively to performance. The Trust’s growing position in housing issues also registered robust gains given the sector’s above-average sensitivity to interest rate movements.
The Trust sought to manage interest rate risk using U.S. Treasury futures. Since U.S. Treasury yields fell, as prices rose, this strategy had an adverse impact on returns.
Reinvestment also had an adverse effect on the Trust’s income, as the proceeds of higher-yielding bonds that matured or were called needed to be reinvested at lower prevailing rates compared to bonds that were issued when yields were higher.
The views expressed reflect the opinions of BlackRock as of the date of this report and are subject to change based on changes in market, economic or other conditions. These views are not intended to be a forecast of future events and are no guarantee of future results.
| 10 | 2019 BLACKROCK ANNUAL REPORT TO SHAREHOLDERS |
| Trust Summary as of August 31, 2019 (continued) | BlackRock MuniHoldings New York Quality Fund, Inc. |
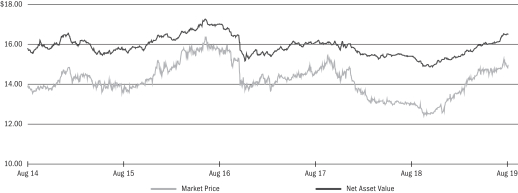
Market Price and Net Asset Value Per Share Summary
| 08/31/19 |
08/31/18 | Change | High | Low | ||||||||||||||||
| Market Price |
$ | 13.74 | $ | 12.35 | 11.26 | % | $ | 13.92 | $ | 11.63 | ||||||||||
| Net Asset Value |
15.31 | 14.27 | 7.29 | 15.32 | 13.80 | |||||||||||||||
Market Price and Net Asset Value History For the Past Five Years
Overview of the Trust’s Total Investments*
| TRUST SUMMARY | 11 |
| Trust Summary as of August 31, 2019 | BlackRock New York Municipal Bond Trust |
Trust Overview
BlackRock New York Municipal Bond Trust’s (BQH) (the “Trust”) investment objective is to provide current income exempt from regular U.S. federal income taxes and New York State and New York City personal income taxes. The Trust seeks to achieve its investment objective by investing primarily in municipal bonds exempt from U.S. federal income taxes (except that the interest may be subject to the U.S. federal alternative minimum tax) and New York State and New York City personal income taxes. Under normal market conditions, the Trust invests at least 80% of its managed assets in municipal bonds that are investment grade quality at the time of investment or, if unrated, determined to be of comparable quality at the time of investment by the Trust’s investment adviser. The Trust may invest directly in such securities or synthetically through the use of derivatives.
No assurance can be given that the Trust’s investment objective will be achieved.
Trust Information
| Symbol on NYSE |
BQH | |
| Initial Offering Date |
April 30, 2002 | |
| Yield on Closing Market Price as of August 31, 2019 ($14.94)(a) |
3.86% | |
| Tax Equivalent Yield(b) |
7.66% | |
| Current Monthly Distribution per Common Share(c) |
$0.0480 | |
| Current Annualized Distribution per Common Share(c) |
$0.5760 | |
| Leverage as of August 31, 2019(d) |
39% |
| (a) | Yield on closing market price is calculated by dividing the current annualized distribution per share by the closing market price. Past performance does not guarantee future results. |
| (b) | Tax equivalent yield assumes the maximum marginal U.S. federal and state tax rate of 49.62%, which includes the 3.8% Medicare tax. Actual tax rates will vary based on income, exemptions and deductions. Lower taxes will result in lower tax equivalent yields. |
| (c) | The distribution rate is not constant and is subject to change. |
| (d) | Represents VRDP Shares and TOB Trusts as a percentage of total managed assets, which is the total assets of the Trust, including any assets attributable to VRDP Shares and TOB Trusts, minus the sum of accrued liabilities. Does not reflect derivatives or other instruments that may give rise to economic leverage. For a discussion of leveraging techniques utilized by the Trust, please see The Benefits and Risks of Leveraging and Derivative Financial Instruments on page 5. |
Performance
Returns for the 12 months ended August 31, 2019 were as follows:
| Returns Based On | ||||||||
| Market Price | NAV | |||||||
| BQH(a)(b) |
19.61 | % | 11.61 | % | ||||
| Lipper New York Municipal Debt Funds(c) |
14.90 | 11.11 | ||||||
| (a) | All returns reflect reinvestment of dividends and/or distributions at actual reinvestment prices. |
| (b) | The Trust’s discount to NAV narrowed during the period, which accounts for the difference between performance based on market price and performance based on NAV. |
| (c) | Average return. Returns reflect reinvestment of dividends and/or distributions at NAV on the ex-dividend date as calculated by Lipper. |
Performance results may include adjustments made for financial reporting purposes in accordance with U.S. generally accepted accounting principles.
Past performance is not indicative of future results.
The following discussion relates to the Trust’s absolute performance based on NAV:
Municipal bonds produced a healthy gain in the 12-month period, largely as a result of the sharp decline in U.S. Treasury yields from November onward. (Prices and yields move in opposite directions.) Government bonds were boosted by the combination of slowing economic growth and the Fed’s pivot toward a more accommodative monetary policy. Tax-exempt issues gained further support from a continued improvement in municipal finances and a favorable balance of supply and demand in the market.
Consistent with trends in the national market, New York municipal bond struggled early in the period due to higher interest rates and expectations of further Fed tightening. These headwinds dissipated in early 2019, fueling a rally in New York issues and helping the state deliver a competitive return versus the broader U.S. indexes despite its lower duration and higher average credit quality. (Duration is a measure of interest rate sensitivity.) New York tax-exempt issues were further helped by strong demand as the Tax Cuts and Jobs Act of 2017 gave residents of high-tax states more incentive to own in-state bonds. Additionally, New York continued to benefit from its broad and diverse economic base.
At a time of strong results for the overall market, the Trust’s use of leverage aided performance by amplifying price gains and enhancing portfolio income. Holdings in longer-dated securities with maturities of greater than 20 years generated the largest gains, as longer-term bonds outpaced short-term issues. The Trust further benefited from its positions in the project finance and state tax-backed sectors. An allocation to BBB rated and non-investment grade securities, which outpaced higher-quality issues, was an additional contributor.
The Trust sought to manage interest rate risk using U.S. Treasury futures. Since U.S. Treasury yields fell, as prices rose, this strategy had an adverse impact on returns. In addition, the trend of net negative issuance exacerbated reinvestment risk as the proceeds from bonds that matured or were called needed to be reinvested at lower prevailing yields compared to bonds that were issued when yields were higher.
The views expressed reflect the opinions of BlackRock as of the date of this report and are subject to change based on changes in market, economic or other conditions. These views are not intended to be a forecast of future events and are no guarantee of future results.
| 12 | 2019 BLACKROCK ANNUAL REPORT TO SHAREHOLDERS |
| Trust Summary as of August 31, 2019 (continued) | BlackRock New York Municipal Bond Trust |
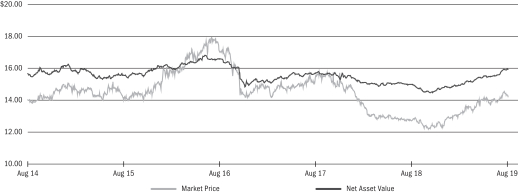
Market Price and Net Asset Value Per Share Summary
| 08/31/19 |
08/31/18 | Change | High | Low | ||||||||||||||||
| Market Price |
$ | 14.94 | $ | 13.01 | 14.83 | % | $ | 15.28 | $ | 12.31 | ||||||||||
| Net Asset Value |
16.49 | 15.39 | 7.15 | 16.51 | 14.86 | |||||||||||||||
Market Price and Net Asset Value History For the Past Five Years
Overview of the Trust’s Total Investments*
| TRUST SUMMARY | 13 |
| Trust Summary as of August 31, 2019 | BlackRock New York Municipal Income Quality Trust |
Trust Overview
BlackRock New York Municipal Income Quality Trust’s (BSE) (the “Trust”) investment objective is to provide current income exempt from U.S. federal income tax, including the alternative minimum tax, and New York State and New York City personal income taxes. The Trust seeks to achieve its investment objective by investing at least 80% of its managed assets in municipal obligations exempt from U.S. federal income taxes (including the U.S. federal alternative minimum tax) and New York State and New York City personal income taxes. Under normal market conditions, the Trust invests primarily in municipal bonds that are investment grade quality at the time of investment or, if unrated, are determined to be of comparable quality at the time of investment by the Trust’s investment adviser. Effective July 31, 2019, the Trust may invest up to 20% of its managed assets in securities that are rated below investment grade, or are considered by BlackRock to be of comparable quality, at the time of purchase. The Trust may invest directly in such securities or synthetically through the use of derivatives.
No assurance can be given that the Trust’s investment objective will be achieved.
Trust Information
| Symbol on NYSE |
BSE | |
| Initial Offering Date |
October 31, 2002 | |
| Yield on Closing Market Price as of August 31, 2019 ($13.86)(a) |
3.51% | |
| Tax Equivalent Yield(b) |
6.97% | |
| Current Monthly Distribution per Common Share(c) |
$0.0405 | |
| Current Annualized Distribution per Common Share(c) |
$0.4860 | |
| Leverage as of August 31, 2019(d) |
38% |
| (a) | Yield on closing market price is calculated by dividing the current annualized distribution per share by the closing market price. Past performance does not guarantee future results. |
| (b) | Tax equivalent yield assumes the maximum marginal U.S. federal and state tax rate of 49.62%, which includes the 3.8% Medicare tax. Actual tax rates will vary based on income, exemptions and deductions. Lower taxes will result in lower tax equivalent yields. |
| (c) | The distribution rate is not constant and is subject to change. A portion of the distribution may be deemed a return of capital or net realized gain. |
| (d) | Represents VRDP Shares and TOB Trusts as a percentage of total managed assets, which is the total assets of the Trust, including any assets attributable to VRDP Shares and TOB Trusts, minus the sum of accrued liabilities. Does not reflect derivatives or other instruments that may give rise to economic leverage. For a discussion of leveraging techniques utilized by the Trust, please see The Benefits and Risks of Leveraging and Derivative Financial Instruments on page 5. |
Performance
Returns for the 12 months ended August 31, 2019 were as follows:
| Returns Based On | ||||||||
| Market Price | NAV | |||||||
| BSE(a)(b) |
13.79 | % | 11.02 | % | ||||
| Lipper New York Municipal Debt Funds(c) |
14.90 | 11.11 | ||||||
| (a) | All returns reflect reinvestment of dividends and/or distributions at actual reinvestment prices. |
| (b) | The Trust’s discount to NAV narrowed during the period, which accounts for the difference between performance based on market price and performance based on NAV. |
| (c) | Average return. Returns reflect reinvestment of dividends and/or distributions at NAV on the ex-dividend date as calculated by Lipper. |
Performance results may include adjustments made for financial reporting purposes in accordance with U.S. generally accepted accounting principles.
Past performance is not indicative of future results.
The following discussion relates to the Trust’s absolute performance based on NAV:
Municipal bonds produced a healthy gain in the 12-month period, largely as a result of the sharp decline in U.S. Treasury yields from November onward. (Prices and yields move in opposite directions.) Government bonds were boosted by the combination of slowing economic growth and the Fed’s pivot toward a more accommodative monetary policy. Tax-exempt issues gained further support from a continued improvement in municipal finances and a favorable balance of supply and demand in the market.
Consistent with trends in the national market, New York municipal bonds struggled early in the period due to higher interest rates and expectations of further Fed tightening. These headwinds dissipated in early 2019, fueling a rally in New York issues and helping the state deliver a competitive return versus the broader U.S. indexes despite its lower duration and higher average credit quality. (Duration is a measure of interest rate sensitivity.) New York tax-exempt issues were further helped by strong demand as the Tax Cuts and Jobs Act of 2017 gave residents of high-tax states more incentive to own in-state bonds. Additionally, New York continued to benefit from its broad and diverse economic base.
At a time of strong results for the overall market, the Trust’s use of leverage aided performance by amplifying price gains and enhancing portfolio income. Holdings in longer-dated securities with maturities of greater than 20 years generated the strongest returns, as longer-term bonds outpaced short-term issues. The Trust further benefited from its positions in the local tax-backed and education sectors.
The Trust sought to manage interest rate risk using U.S. Treasury futures. Since U.S. Treasury yields fell, as prices rose, this strategy had an adverse impact on returns. The Trust’s higher-quality bias was also a headwind to performance at a time when lower-rated bonds outperformed. In addition, the trend of net negative issuance exacerbated reinvestment risk as the proceeds from bonds that matured or were called needed to be reinvested at lower prevailing yields compared to bonds that were issued when yields were higher.
The views expressed reflect the opinions of BlackRock as of the date of this report and are subject to change based on changes in market, economic or other conditions. These views are not intended to be a forecast of future events and are no guarantee of future results.
| 14 | 2019 BLACKROCK ANNUAL REPORT TO SHAREHOLDERS |
| Trust Summary as of August 31, 2019 (continued) | BlackRock New York Municipal Income Quality Trust |
Market Price and Net Asset Value Per Share Summary
| 08/31/19 | 08/31/18 | Change | High | Low | ||||||||||||||||
| Market Price |
$ | 13.86 | $ | 12.65 | 9.57 | % | $ | 13.87 | $ | 11.84 | ||||||||||
| Net Asset Value |
15.34 | 14.35 | 6.90 | 15.36 | 13.89 | |||||||||||||||
Market Price and Net Asset Value History For the Past Five Years
Overview of the Trust’s Total Investments*
| TRUST SUMMARY | 15 |
| Trust Summary as of August 31, 2019 | BlackRock New York Municipal Income Trust II |
Trust Overview
BlackRock New York Municipal Income Trust II’s (BFY) (the “Trust”) investment objective is to provide current income exempt from regular U.S. federal income tax and New York State and New York City personal income taxes. The Trust seeks to achieve its investment objective by investing primarily in municipal bonds exempt from U.S. federal income taxes (except that the interest may be subject to the U.S. federal alternative minimum tax) and New York State and New York City personal income taxes. Under normal market conditions, the Trust invests at least 80% of its managed assets in municipal bonds that are investment grade quality at the time of investment or, if unrated, determined to be of comparable quality at the time of investment by the Trust’s investment adviser. The Trust may invest directly in such securities or synthetically through the use of derivatives.
No assurance can be given that the Trust’s investment objective will be achieved.
Trust Information
| Symbol on NYSE |
BFY | |
| Initial Offering Date |
July 30, 2002 | |
| Yield on Closing Market Price as of August 31, 2019 ($14.21)(a) |
4.14% | |
| Tax Equivalent Yield(b) |
8.22% | |
| Current Monthly Distribution per Common Share(c) |
$0.0490 | |
| Current Annualized Distribution per Common Share(c) |
$0.5880 | |
| Leverage as of August 31, 2019(d) |
40% |
| (a) | Yield on closing market price is calculated by dividing the current annualized distribution per share by the closing market price. Past performance does not guarantee future results. |
| (b) | Tax equivalent yield assumes the maximum marginal U.S. federal and state tax rate of 49.62%, which includes the 3.8% Medicare tax. Actual tax rates will vary based on income, exemptions and deductions. Lower taxes will result in lower tax equivalent yields. |
| (c) | The distribution rate is not constant and is subject to change. |
| (d) | Represents VRDP Shares and TOB Trusts as a percentage of total managed assets, which is the total assets of the Trust, including any assets attributable to VRDP Shares and TOB Trusts, minus the sum of accrued liabilities. Does not reflect derivatives or other instruments that may give rise to economic leverage. For a discussion of leveraging techniques utilized by the Trust, please see The Benefits and Risks of Leveraging and Derivative Financial Instruments on page 5. |
Performance
Returns for the 12 months ended August 31, 2019 were as follows:
| Returns Based On | ||||||||
| Market Price | NAV | |||||||
| BFY(a)(b) |
16.29 | % | 11.14 | % | ||||
| Lipper New York Municipal Debt Funds(c) |
14.90 | 11.11 | ||||||
| (a) | All returns reflect reinvestment of dividends and/or distributions at actual reinvestment prices. |
| (b) | The Trust’s discount to NAV narrowed during the period, which accounts for the difference between performance based on market price and performance based on NAV. |
| (c) | Average return. Returns reflect reinvestment of dividends and/or distributions at NAV on the ex-dividend date as calculated by Lipper. |
Performance results may include adjustments made for financial reporting purposes in accordance with U.S. generally accepted accounting principles.
Past performance is not indicative of future results.
The following discussion relates to the Trust’s absolute performance based on NAV:
Municipal bonds produced a healthy gain in the 12-month period, largely as a result of the sharp decline in U.S. Treasury yields from November onward. (Prices and yields move in opposite directions.) Government bonds were boosted by the combination of slowing economic growth and the Fed’s pivot toward a more accommodative monetary policy. Tax-exempt issues gained further support from a continued improvement in municipal finances and a favorable balance of supply and demand in the market.
Consistent with trends in the national market, New York municipal bonds struggled early in the period due to higher interest rates and expectations of further Fed tightening. These headwinds dissipated in early 2019, fueling a rally in New York issues and helping the state deliver a competitive return versus the broader U.S. indexes despite its lower duration and higher average credit quality. (Duration is a measure of interest rate sensitivity.) New York tax-exempt issues were further helped by strong demand as the Tax Cuts and Jobs Act of 2017 gave residents of high-tax states more incentive to own in-state bonds. Additionally, New York continued to benefit from its broad and diverse economic base.
At a time of strong results for the overall market, the Trust’s use of leverage aided performance by amplifying price gains and enhancing portfolio income. Holdings in longer-dated securities with maturities of greater than 20 years generated the largest gains, as longer-term bonds outpaced short-term issues. The Trust further benefited from its positions in state tax-backed, local tax-backed and transportation sectors. An allocation to BBB rated and non-investment grade securities, which outpaced higher-quality issues, was an additional contributor.
The Trust sought to manage interest rate risk using U.S. Treasury futures. Since U.S. Treasury yields fell, as prices rose, this strategy had an adverse impact on returns. In addition, the trend of net negative issuance exacerbated reinvestment risk as the proceeds from bonds that matured or were called needed to be reinvested at lower prevailing yields compared to bonds that were issued when yields were higher.
The views expressed reflect the opinions of BlackRock as of the date of this report and are subject to change based on changes in market, economic or other conditions. These views are not intended to be a forecast of future events and are no guarantee of future results.
| 16 | 2019 BLACKROCK ANNUAL REPORT TO SHAREHOLDERS |
| Trust Summary as of August 31, 2019 (continued) | BlackRock New York Municipal Income Trust II |
Market Price and Net Asset Value Per Share Summary
| 08/31/19 |
08/31/18 | Change | High | Low | ||||||||||||||||
| Market Price |
$ | 14.21 | $ | 12.77 | 11.28 | % | $ | 14.56 | $ | 12.15 | ||||||||||
| Net Asset Value |
15.92 | 14.97 | 6.35 | 15.94 | 14.46 | |||||||||||||||
Market Price and Net Asset Value History For the Past Five Years
Overview of the Trust’s Total Investments*
| TRUST SUMMARY | 17 |
| Trust Summary as of August 31, 2019 | BlackRock Virginia Municipal Bond Trust |
Trust Overview
BlackRock Virginia Municipal Bond Trust’s (BHV) (the “Trust”) investment objective is to provide current income exempt from regular U.S. federal income tax and Virginia personal income taxes. The Trust seeks to achieve its investment objectives by investing primarily in municipal bonds exempt from U.S. federal income taxes (except that the interest may be subject to the U.S. federal alternative minimum tax) and Virginia personal income taxes. The Trust invests, under normal market conditions, at least 80% of its managed assets in municipal bonds that are investment grade quality at the time of investment or, if unrated, determined to be of comparable quality at the time of investment by the Trust’s investment adviser. The Trust may invest directly in such securities or synthetically through the use of derivatives.
No assurance can be given that the Trust’s investment objective will be achieved.
Trust Information
| Symbol on NYSE |
BHV | |
| Initial Offering Date |
April 30, 2002 | |
| Yield on Closing Market Price as of August 31, 2019 ($16.54)(a) |
3.30% | |
| Tax Equivalent Yield(b) |
6.17% | |
| Current Monthly Distribution per Common Share(c) |
$0.0455 | |
| Current Annualized Distribution per Common Share(c) |
$0.5460 | |
| Leverage as of August 31, 2019(d) |
40% |
| (a) | Yield on closing market price is calculated by dividing the current annualized distribution per share by the closing market price. Past performance does not guarantee future results. |
| (b) | Tax equivalent yield assumes the maximum marginal U.S. federal and state tax rate of 46.55%, which includes the 3.8% Medicare tax. Actual tax rates will vary based on income, exemptions and deductions. Lower taxes will result in lower tax equivalent yields. |
| (c) | The distribution rate is not constant and is subject to change. |
| (d) | Represents VRDP Shares and TOB Trusts as a percentage of total managed assets, which is the total assets of the Trust, including any assets attributable to VRDP Shares and TOB Trusts, minus the sum of accrued liabilities. Does not reflect derivatives or other instruments that may give rise to economic leverage. For a discussion of leveraging techniques utilized by the Trust, please see The Benefits and Risks of Leveraging and Derivative Financial Instruments on page 5. |
Performance
Returns for the 12 months ended August 31, 2019 were as follows:
| Returns Based On | ||||||||
| Market Price | NAV | |||||||
| BHV(a)(b) |
4.15 | % | 8.94 | % | ||||
| Lipper Other States Municipal Debt Funds(c) |
15.20 | 10.59 | ||||||
| (a) | All returns reflect reinvestment of dividends and/or distributions at actual reinvestment prices. |
| (b) | The Trust’s premium to NAV narrowed during the period, which accounts for the difference between performance based on market price and performance based on NAV. |
| (c) | Average return. Returns reflect reinvestment of dividends and/or distributions at NAV on the ex-dividend date as calculated by Lipper. |
Performance results may include adjustments made for financial reporting purposes in accordance with U.S. generally accepted accounting principles.
Past performance is not indicative of future results.
The following discussion relates to the Trust’s absolute performance based on NAV:
Municipal bonds produced a healthy gain in the 12-month period, largely as a result of the sharp decline in U.S. Treasury yields from November onward. (Prices and yields move in opposite directions.) Government bonds were boosted by the combination of slowing economic growth and the Fed’s pivot toward a more accommodative monetary policy. Tax-exempt issues gained further support from a continued improvement in municipal finances and a favorable balance of supply and demand in the market. Lower-quality bonds performed particularly well amid investors’ search for yield.
Virginia’s economy remains robust, highlighted by low unemployment and solid gross domestic product growth. In addition, general revenues came in ahead of the budgeted level for the 2019 fiscal year. However, the state’s municipal market underperformed the national indexes largely a result of its lower interest-rate sensitivity and higher average credit quality.
At a time of strong returns for the overall market, the Trust’s use of leverage aided performance by amplifying price gains and enhancing portfolio income. Holdings in longer-dated securities with maturities of greater than 20 years generated the largest gains, as longer-term bonds outpaced short-term issues by a wide margin. The Trust further benefited from its positions in tax-backed local and health care sectors.
The Trust sought to manage interest rate risk using U.S. Treasury futures. Since U.S. Treasury yields fell, as prices rose, this strategy had an adverse impact on returns. The trend of net negative issuance exacerbated reinvestment risk as the proceeds from bonds that matured or were called needed to be reinvested at lower prevailing yields compared to bonds that were issued when yields were higher.
The views expressed reflect the opinions of BlackRock as of the date of this report and are subject to change based on changes in market, economic or other conditions. These views are not intended to be a forecast of future events and are no guarantee of future results.
| 18 | 2019 BLACKROCK ANNUAL REPORT TO SHAREHOLDERS |
| Trust Summary as of August 31, 2019 (continued) | BlackRock Virginia Municipal Bond Trust |
Market Price and Net Asset Value Per Share Summary
| 08/31/19 |
08/31/18 | Change | High | Low | ||||||||||||||||
| Market Price |
$ | 16.54 | $ | 16.56 | (0.12 | )% | $ | 19.75 | $ | 13.67 | ||||||||||
| Net Asset Value |
15.64 | 14.97 | 4.48 | 15.65 | 14.48 | |||||||||||||||
Market Price and Net Asset Value History For the Past Five Years

Overview of the Trust’s Total Investments*
| TRUST SUMMARY | 19 |
| August 31, 2019 |
BlackRock Maryland Municipal Bond Trust (BZM) (Percentages shown are based on Net Assets) |
| 20 | 2019 BLACKROCK ANNUAL REPORT TO SHAREHOLDERS |
| Schedule of Investments (continued) August 31, 2019 |
BlackRock Maryland Municipal Bond Trust (BZM) (Percentages shown are based on Net Assets) |
| (e) | During the year ended August 31, 2019, investments in issuers considered to be an affiliate/affiliates of the Trust for purposes of Section 2(a)(3) of the Investment Company Act of 1940, as amended, were as follows: |
| Affiliate | Shares Held at 08/31/18 |
Net Activity |
Shares Held at 08/31/19 |
Value at 08/31/19 |
Income | Net Realized Gain (Loss) (a) |
Change in Unrealized Appreciation (Depreciation) |
|||||||||||||||||||||
| BlackRock Liquidity Funds, MuniCash, Institutional Class |
273,831 | 125,397 | 399,228 | $ | 399,268 | $ | 13,120 | $ | 117 | $ | (40 | ) | ||||||||||||||||
|
|
|
|
|
|
|
|
|
|||||||||||||||||||||
| (a) | Includes net capital gain distributions, if applicable. |
For Trust compliance purposes, the Trust’s sector classifications refer to one or more of the sector sub-classifications used by one or more widely recognized market indexes or rating group indexes, and/or as defined by the investment adviser. These definitions may not apply for purposes of this report, which may combine such sector sub-classifications for reporting ease.
| SCHEDULES OF INVESTMENTS | 21 |
| Schedule of Investments (continued) August 31, 2019 |
BlackRock Maryland Municipal Bond Trust (BZM) |
Derivative Financial Instruments Outstanding as of Period End
Futures Contracts
| Description | Number of Contracts |
Expiration Date |
Notional Amount (000) |
Value/ Unrealized Appreciation (Depreciation) |
||||||||||||
| Short Contracts |
||||||||||||||||
| 10-Year U.S. Treasury Note |
4 | 12/19/19 | $ | 527 | $ | (538 | ) | |||||||||
| Long U.S. Treasury Bond |
8 | 12/19/19 | 1,322 | (4,838 | ) | |||||||||||
| 5-Year U.S. Treasury Note |
4 | 12/31/19 | 480 | (522 | ) | |||||||||||
|
|
|
|||||||||||||||
| $ | (5,898 | ) | ||||||||||||||
|
|
|
|||||||||||||||
Derivative Financial Instruments Categorized by Risk Exposure
As of period end, the fair values of derivative financial instruments located in the Statements of Assets and Liabilities were as follows:
| Commodity Contracts |
Credit Contracts |
Equity Contracts |
Foreign Currency Exchange Contracts |
Interest Rate Contracts |
Other Contracts |
Total | ||||||||||||||||||||||
| Liabilities — Derivative Financial Instruments |
||||||||||||||||||||||||||||
| Futures contracts |
||||||||||||||||||||||||||||
| Unrealized depreciation on futures contracts(a) |
$ | — | $ | — | $ | — | $ | — | $ | 5,898 | $ | — | $ | 5,898 | ||||||||||||||
|
|
|
|
|
|
|
|
|
|
|
|
|
|
|
|||||||||||||||
| (a) | Net cumulative unrealized appreciation (depreciation) on futures contracts, are reported in the Schedule of Investments. In the Statements of Assets and Liabilities, only current day’s variation margin is reported in receivables or payables and the net cumulative unrealized appreciation (depreciation) is included in accumulated earnings (loss). |
For the year ended August 31, 2019, the effect of derivative financial instruments in the Statements of Operations was as follows:
| Commodity Contracts |
Credit Contracts |
Equity Contracts |
Foreign Currency Exchange Contracts |
Interest Rate Contracts |
Other Contracts |
Total | ||||||||||||||||||||||
| Net Realized Gain (Loss) from: |
||||||||||||||||||||||||||||
| Future contracts |
$ | — | $ | — | $ | — | $ | — | $ | (355,065 | ) | $ | — | $ | (355,065 | ) | ||||||||||||
|
|
|
|
|
|
|
|
|
|
|
|
|
|
|
|||||||||||||||
| Net Change in Unrealized Appreciation (Depreciation) on: | ||||||||||||||||||||||||||||
| Future contracts |
$ | — | $ | — | $ | — | $ | — | $ | (10,507 | ) | $ | — | $ | (10,507 | ) | ||||||||||||
|
|
|
|
|
|
|
|
|
|
|
|
|
|
|
|||||||||||||||
Average Quarterly Balances of Outstanding Derivative Financial Instruments
| Futures contracts: |
| |||
| Average notional value of contracts — short |
$ | 2,813,420 | ||
For more information about the Trust’s investment risks regarding derivative financial instruments, refer to the Notes to Financial Statements.
Fair Value Hierarchy as of Period End
Various inputs are used in determining the fair value of investments and derivative financial instruments. For information about the Trust’s policy regarding valuation of investments and derivative financial instruments, refer to the Notes to Financial Statements.
The following tables summarize the Trust’s investments and derivative financial instruments categorized in the disclosure hierarchy:
| Level 1 | Level 2 | Level 3 | Total | |||||||||||||
| Assets: |
| |||||||||||||||
| Investments: |
| |||||||||||||||
| Long-Term Investments(a) |
$ | — | $ | 50,690,232 | $ | — | $ | 50,690,232 | ||||||||
| Short-Term Securities |
399,268 | — | — | 399,268 | ||||||||||||
|
|
|
|
|
|
|
|
|
|||||||||
| $ | 399,268 | $ | 50,690,232 | $ | — | $ | 51,089,500 | |||||||||
|
|
|
|
|
|
|
|
|
|||||||||
| Derivative Financial Instruments(b) |
| |||||||||||||||
| Liabilities: |
| |||||||||||||||
| Interest rate contracts |
$ | (5,898 | ) | $ | — | $ | — | $ | (5,898 | ) | ||||||
|
|
|
|
|
|
|
|
|
|||||||||
| (a) | See above Schedule of Investments for values in each sector. |
| (b) | Derivative financial instruments are futures contracts which are valued at the unrealized appreciation (depreciation) on the instrument. |
| 22 | 2019 BLACKROCK ANNUAL REPORT TO SHAREHOLDERS |
| Schedule of Investments (continued) August 31, 2019 |
BlackRock Maryland Municipal Bond Trust (BZM) |
The Trust may hold assets and/or liabilities in which the fair value approximates the carrying amount for financial statement purposes. As of period end, such assets and/or liabilities are categorized within the disclosure hierarchy as follows:
| Level 1 | Level 2 | Level 3 | Total | |||||||||||||
| Liabilities: |
| |||||||||||||||
| TOB Trust Certificates |
$ | — | $ | (2,999,064 | ) | $ | — | $ | (2,999,064 | ) | ||||||
| VRDP Shares at Liquidation Value |
— | (16,000,000 | ) | — | (16,000,000 | ) | ||||||||||
|
|
|
|
|
|
|
|
|
|||||||||
| $ | — | $ | (18,999,064 | ) | $ | — | $ | (18,999,064 | ) | |||||||
|
|
|
|
|
|
|
|
|
|||||||||
See notes to financial statements.
| SCHEDULES OF INVESTMENTS | 23 |
| Schedule of Investments August 31, 2019 |
BlackRock Massachusetts Tax-Exempt Trust (MHE) (Percentages shown are based on Net Assets) |
| 24 | 2019 BLACKROCK ANNUAL REPORT TO SHAREHOLDERS |
| Schedule of Investments (continued) August 31, 2019 |
BlackRock Massachusetts Tax-Exempt Trust (MHE) (Percentages shown are based on Net Assets) |
| (f) | During the year ended August 31, 2019, investments in issuers considered to be an affiliate/affiliates of the Trust for purposes of Section 2(a)(3) of the Investment Company Act of 1940, as amended, were as follows: |
| Affiliate | Shares Held at 08/31/18 |
Net Activity |
Shares Held at 08/31/19 |
Value at 08/31/19 |
Income | Net Realized Gain (Loss) (a) |
Change in Unrealized Appreciation (Depreciation) |
|||||||||||||||||||||
| BlackRock Liquidity Funds, MuniCash, Institutional Class |
427,577 | (351,367 | ) | 76,210 | $ | 76,217 | $ | 6,841 | $ | 298 | $ | (3 | ) | |||||||||||||||
|
|
|
|
|
|
|
|
|
|||||||||||||||||||||
| (a) | Includes net capital gain distributions, if applicable. |
For Trust compliance purposes, the Trust’s sector classifications refer to one or more of the sector sub-classifications used by one or more widely recognized market indexes or rating group indexes, and/or as defined by the investment adviser. These definitions may not apply for purposes of this report, which may combine such sector sub-classifications for reporting ease.
| SCHEDULES OF INVESTMENTS | 25 |
| Schedule of Investments (continued) August 31, 2019 |
BlackRock Massachusetts Tax-Exempt Trust (MHE) |
Derivative Financial Instruments Outstanding as of Period End
Futures Contracts
| Description | Number of Contracts |
Expiration Date |
Notional Amount (000) |
Value/ Unrealized Appreciation (Depreciation) |
||||||||||||
| Short Contracts |
||||||||||||||||
| 10-Year U.S. Treasury Note |
5 | 12/19/19 | $ | 659 | $ | (641 | ) | |||||||||
| Long U.S. Treasury Bond |
8 | 12/19/19 | 1,322 | (4,838 | ) | |||||||||||
| 5-Year U.S. Treasury Note |
3 | 12/31/19 | 360 | (374 | ) | |||||||||||
|
|
|
|||||||||||||||
| $ | (5,853 | ) | ||||||||||||||
|
|
|
|||||||||||||||
Derivative Financial Instruments Categorized by Risk Exposure
As of period end, the fair values of derivative financial instruments located in the Statements of Assets and Liabilities were as follows:
| Commodity Contracts |
Credit Contracts |
Equity Contracts |
Foreign Currency Exchange Contracts |
Interest Rate Contracts |
Other Contracts |
Total | ||||||||||||||||||||||
| Liabilities — Derivative Financial Instruments |
||||||||||||||||||||||||||||
| Futures contracts |
||||||||||||||||||||||||||||
| Unrealized depreciation on futures contracts(a) |
$ | — | $ | — | $ | — | $ | — | $ | 5,853 | $ | — | $ | 5,853 | ||||||||||||||
|
|
|
|
|
|
|
|
|
|
|
|
|
|
|
|||||||||||||||
| (a) | Net cumulative unrealized appreciation (depreciation) on futures contracts, are reported in the Schedule of Investments. In the Statements of Assets and Liabilities, only current day’s variation margin is reported in receivables or payables and the net cumulative unrealized appreciation (depreciation) is included in accumulated earnings (loss). |
For the year ended August 31, 2019, the effect of derivative financial instruments in the Statements of Operations was as follows:
| Commodity Contracts |
Credit Contracts |
Equity Contracts |
Foreign Currency Exchange Contracts |
Interest Rate Contracts |
Other Contracts |
Total | ||||||||||||||||||||||
| Net Realized Gain (Loss) from: |
||||||||||||||||||||||||||||
| Future contracts |
$ | — | $ | — | $ | — | $ | — | $ | (344,651 | ) | $ | — | $ | (344,651 | ) | ||||||||||||
|
|
|
|
|
|
|
|
|
|
|
|
|
|
|
|||||||||||||||
| Net Change in Unrealized Appreciation (Depreciation) on: | ||||||||||||||||||||||||||||
| Future contracts |
$ | — | $ | — | $ | — | $ | — | $ | (9,885 | ) | $ | — | $ | (9,885 | ) | ||||||||||||
|
|
|
|
|
|
|
|
|
|
|
|
|
|
|
|||||||||||||||
Average Quarterly Balances of Outstanding Derivative Financial Instruments
| Futures contracts: |
| |||
| Average notional value of contracts — short |
$ | 2,717,779 | ||
For more information about the Trust’s investment risks regarding derivative financial instruments, refer to the Notes to Financial Statements.
Fair Value Hierarchy as of Period End
Various inputs are used in determining the fair value of investments and derivative financial instruments. For information about the Trust’s policy regarding valuation of investments and derivative financial instruments, refer to the Notes to Financial Statements.
The following tables summarize the Trust’s investments and derivative financial instruments categorized in the disclosure hierarchy:
| Level 1 | Level 2 | Level 3 | Total | |||||||||||||
| Assets: |
| |||||||||||||||
| Investments: |
| |||||||||||||||
| Long-Term Investments(a) |
$ | — | $ | 54,456,292 | $ | — | $ | 54,456,292 | ||||||||
| Short-Term Securities |
76,217 | — | — | 76,217 | ||||||||||||
|
|
|
|
|
|
|
|
|
|||||||||
| $ | 76,217 | $ | 54,456,292 | $ | — | $ | 54,532,509 | |||||||||
|
|
|
|
|
|
|
|
|
|||||||||
| Derivative Financial Instruments(b) |
| |||||||||||||||
| Liabilities: |
| |||||||||||||||
| Interest rate contracts |
$ | (5,853 | ) | $ | — | $ | — | $ | (5,853 | ) | ||||||
|
|
|
|
|
|
|
|
|
|||||||||
| (a) | See above Schedule of Investments for values in each sector. |
| (b) | Derivative financial instruments are futures contracts which are valued at the unrealized appreciation (depreciation) on the instrument. |
| 26 | 2019 BLACKROCK ANNUAL REPORT TO SHAREHOLDERS |
| Schedule of Investments (continued) August 31, 2019 |
BlackRock Massachusetts Tax-Exempt Trust (MHE) |
The Trust may hold assets and/or liabilities in which the fair value approximates the carrying amount for financial statement purposes. As of period end, such assets and/or liabilities are categorized within the disclosure hierarchy as follows:
| Level 1 | Level 2 | Level 3 | Total | |||||||||||||
| Liabilities: |
| |||||||||||||||
| TOB Trust Certificates |
$ | — | $ | (3,136,631 | ) | $ | — | $ | (3,136,631 | ) | ||||||
| VRDP Shares at Liquidation Value |
— | (18,500,000 | ) | — | (18,500,000 | ) | ||||||||||
|
|
|
|
|
|
|
|
|
|||||||||
| $ | — | $ | (21,636,631 | ) | $ | — | $ | (21,636,631 | ) | |||||||
|
|
|
|
|
|
|
|
|
|||||||||
See notes to financial statements.
| SCHEDULES OF INVESTMENTS | 27 |
| Schedule of Investments August 31, 2019 |
BlackRock MuniHoldings New York Quality Fund, Inc. (MHN) (Percentages shown are based on Net Assets) |
| 28 | 2019 BLACKROCK ANNUAL REPORT TO SHAREHOLDERS |
| Schedule of Investments (continued) August 31, 2019 |
BlackRock MuniHoldings New York Quality Fund, Inc. (MHN) (Percentages shown are based on Net Assets) |
| SCHEDULES OF INVESTMENTS | 29 |
| Schedule of Investments (continued) August 31, 2019 |
BlackRock MuniHoldings New York Quality Fund, Inc. (MHN) (Percentages shown are based on Net Assets) |
| 30 | 2019 BLACKROCK ANNUAL REPORT TO SHAREHOLDERS |
| Schedule of Investments (continued) August 31, 2019 |
BlackRock MuniHoldings New York Quality Fund, Inc. (MHN) (Percentages shown are based on Net Assets) |
| SCHEDULES OF INVESTMENTS | 31 |
| Schedule of Investments (continued) August 31, 2019 |
BlackRock MuniHoldings New York Quality Fund, Inc. (MHN) (Percentages shown are based on Net Assets) |
| (f) | During the year ended August 31, 2019, investments in issuers considered to be an affiliate/affiliates of the Trust for purposes of Section 2(a)(3) of the Investment Company Act of 1940, as amended, were as follows: |
| Affiliate | Shares Held at 08/31/18 |
Net Activity |
Shares Held at 08/31/19 |
Value at 08/31/19 |
Income | Net Realized Gain (Loss) (a) |
Change in Unrealized Appreciation (Depreciation) |
|||||||||||||||||||||
| BlackRock Liquidity Funds New York Money Fund Portfolio |
— | 343,108 | 343,108 | $ | 343,108 | $ | 22,921 | $ | — | $ | — | |||||||||||||||||
| BlackRock Liquidity Funds, MuniCash, Institutional Class(b) |
2,683,498 | (2,683,498 | ) | — | — | 4,507 | 49 | (49 | ) | |||||||||||||||||||
|
|
|
|
|
|
|
|
|
|||||||||||||||||||||
| $ | 343,108 | $ | 27,428 | $ | 49 | $ | (49 | ) | ||||||||||||||||||||
|
|
|
|
|
|
|
|
|
|||||||||||||||||||||
| (a) | Includes net capital gain distributions, if applicable. |
| (b) | No longer held by the Trust as of period end |
For Trust compliance purposes, the Trust’s sector classifications refer to one or more of the sector sub-classifications used by one or more widely recognized market indexes or rating group indexes, and/or as defined by the investment adviser. These definitions may not apply for purposes of this report, which may combine such sector sub-classifications for reporting ease.
Derivative Financial Instruments Outstanding as of Period End
Futures Contracts
| Description | Number of Contracts |
Expiration Date |
Notional Amount (000) |
Value/ Unrealized Appreciation (Depreciation) |
||||||||||||
| Short Contracts |
||||||||||||||||
| 10-Year U.S. Treasury Note |
50 | 12/19/19 | $ | 6,586 | $ | (6,722 | ) | |||||||||
| Long U.S. Treasury Bond |
88 | 12/19/19 | 14,542 | (53,221 | ) | |||||||||||
| 5-Year U.S. Treasury Note |
68 | 12/31/19 | 8,158 | (8,227 | ) | |||||||||||
|
|
|
|||||||||||||||
| $ | (68,170 | ) | ||||||||||||||
|
|
|
|||||||||||||||
| 32 | 2019 BLACKROCK ANNUAL REPORT TO SHAREHOLDERS |
| Schedule of Investments (continued) August 31, 2019 |
BlackRock MuniHoldings New York Quality Fund, Inc. (MHN) |
Derivative Financial Instruments Categorized by Risk Exposure
As of period end, the fair values of derivative financial instruments located in the Statements of Assets and Liabilities were as follows:
| Commodity Contracts |
Credit Contracts |
Equity Contracts |
Foreign Currency Exchange Contracts |
Interest Rate Contracts |
Other Contracts |
Total | ||||||||||||||||||||||
| Liabilities — Derivative Financial Instruments |
| |||||||||||||||||||||||||||
| Futures contracts |
||||||||||||||||||||||||||||
| Unrealized depreciation on futures contracts(a) |
$ | — | $ | — | $ | — | $ | — | $ | 68,170 | $ | — | $ | 68,170 | ||||||||||||||
|
|
|
|
|
|
|
|
|
|
|
|
|
|
|
|||||||||||||||
| (a) | Net cumulative unrealized appreciation (depreciation) on futures contracts, are reported in the Schedule of Investments. In the Statements of Assets and Liabilities, only current day’s variation margin is reported in receivables or payables and the net cumulative unrealized appreciation (depreciation) is included in accumulated earnings (loss). |
For the year ended August 31, 2019, the effect of derivative financial instruments in the Statements of Operations was as follows:
| Commodity Contracts |
Credit Contracts |
Equity Contracts |
Foreign Currency Exchange Contracts |
Interest Rate Contracts |
Other Contracts |
Total | ||||||||||||||||||||||
| Net Realized Gain (Loss) from: |
| |||||||||||||||||||||||||||
| Futures contracts |
$ | — | $ | — | $ | — | $ | — | $ | (4,539,926 | ) | $ | — | $ | (4,539,926 | ) | ||||||||||||
|
|
|
|
|
|
|
|
|
|
|
|
|
|
|
|||||||||||||||
| Net Change in Unrealized Appreciation (Depreciation) on: | ||||||||||||||||||||||||||||
| Futures contracts |
$ | — | $ | — | $ | — | $ | — | $ | (118,321 | ) | $ | — | $ | (118,321 | ) | ||||||||||||
|
|
|
|
|
|
|
|
|
|
|
|
|
|
|
|||||||||||||||
Average Quarterly Balances of Outstanding Derivative Financial Instruments
| Futures contracts: |
| |||
| Average notional value of contracts — short |
$ | 39,477,602 | ||
For more information about the Trust’s investment risks regarding derivative financial instruments, refer to the Notes to Financial Statements.
Fair Value Hierarchy as of Period End
Various inputs are used in determining the fair value of investments and derivative financial instruments. For information about the Trust’s policy regarding valuation of investments and derivative financial instruments, refer to the Notes to Financial Statements.
The following tables summarize the Trust’s investments and derivative financial instruments categorized in the disclosure hierarchy:
| Level 1 | Level 2 | Level 3 | Total | |||||||||||||
| Assets: |
| |||||||||||||||
| Investments: |
| |||||||||||||||
| Long-Term Investments(a) |
$ | — | $ | 768,840,660 | $ | — | $ | 768,840,660 | ||||||||
| Short-Term Securities |
343,108 | — | — | 343,108 | ||||||||||||
|
|
|
|
|
|
|
|
|
|||||||||
| $ | 343,108 | $ | 768,840,660 | $ | — | $ | 769,183,768 | |||||||||
|
|
|
|
|
|
|
|
|
|||||||||
| Derivative Financial Instruments(b) |
| |||||||||||||||
| Liabilities: |
| |||||||||||||||
| Interest rate contracts |
$ | (68,170 | ) | $ | — | $ | — | $ | (68,170 | ) | ||||||
|
|
|
|
|
|
|
|
|
|||||||||
| (a) | See above Schedule of Investments for values in each sector. |
| (b) | Derivative financial instruments are futures contracts, which are valued at the unrealized appreciation (depreciation) on the instrument. |
The Trust may hold assets and/or liabilities in which the fair value approximates the carrying amount for financial statement purposes. As of period end, such assets and/or liabilities are categorized within the disclosure hierarchy as follows:
| Level 1 | Level 2 | Level 3 | Total | |||||||||||||
| Liabilities: |
| |||||||||||||||
| TOB Trust Certificates |
$ | — | $ | (55,898,643 | ) | $ | — | $ | (55,898,643 | ) | ||||||
| VRDP Shares at Liquidation Value |
— | (243,600,000 | ) | — | (243,600,000 | ) | ||||||||||
|
|
|
|
|
|
|
|
|
|||||||||
| $ | — | $ | (299,498,643 | ) | $ | — | $ | (299,498,643 | ) | |||||||
|
|
|
|
|
|
|
|
|
|||||||||
See notes to financial statements.
| SCHEDULES OF INVESTMENTS | 33 |
| Schedule of Investments August 31, 2019 |
BlackRock New York Municipal Bond Trust (BQH) (Percentages shown are based on Net Assets) |
| 34 | 2019 BLACKROCK ANNUAL REPORT TO SHAREHOLDERS |
| Schedule of Investments (continued) August 31, 2019 |
BlackRock New York Municipal Bond Trust (BQH) (Percentages shown are based on Net Assets) |
| SCHEDULES OF INVESTMENTS | 35 |
| Schedule of Investments (continued) August 31, 2019 |
BlackRock New York Municipal Bond Trust (BQH) (Percentages shown are based on Net Assets) |
| 36 | 2019 BLACKROCK ANNUAL REPORT TO SHAREHOLDERS |
| Schedule of Investments (continued) August 31, 2019 |
BlackRock New York Municipal Bond Trust (BQH) (Percentages shown are based on Net Assets) |
| (h) | During the year ended August 31, 2019, investments in issuers considered to be an affiliate/affiliates of the Trust for purposes of Section 2(a)(3) of the Investment Company Act of 1940, as amended, were as follows: |
| Affiliate | Shares Held at 08/31/18 |
Net Activity |
Shares Held at 08/31/19 |
Value at 08/31/19 |
Income | Net Gain (Loss) (a) |
Change in Unrealized Appreciation (Depreciation) |
|||||||||||||||||||||
| BlackRock Liquidity Funds New York Money Fund Portfolio |
— | 64,451 | 64,451 | $ | 64,451 | $ | 3,096 | $ | — | $ | — | |||||||||||||||||
| BlackRock Liquidity Funds, MuniCash, Institutional Class(b) |
343,324 | (343,324 | ) | — | — | 720 | — | — | ||||||||||||||||||||
|
|
|
|
|
|
|
|
|
|||||||||||||||||||||
| $ | 64,451 | $ | 3,816 | $ | — | $ | — | |||||||||||||||||||||
|
|
|
|
|
|
|
|
|
|||||||||||||||||||||
| (a) | Includes net capital gain distributions, if applicable. |
| (b) | No longer held by the Trust as of period end. |
For Trust compliance purposes, the Trust’s sector classifications refer to one or more of the sector sub-classifications used by one or more widely recognized market indexes or rating group indexes, and/or as defined by the investment adviser. These definitions may not apply for purposes of this report, which may combine such sector sub classifications for reporting ease.
Derivative Financial Instruments Outstanding as of Period End
Futures Contracts
| Description | Number of Contracts |
Expiration Date |
Notional Amount (000) |
Value/ Unrealized Appreciation (Depreciation) |
||||||||||||
| Short Contracts |
||||||||||||||||
| 10-Year U.S. Treasury Note |
3 | 12/19/19 | $ | 395 | $ | (372 | ) | |||||||||
| Long U.S. Treasury Bond |
11 | 12/19/19 | 1,818 | (6,653 | ) | |||||||||||
| 5-Year U.S. Treasury Note |
5 | 12/31/19 | 600 | (598 | ) | |||||||||||
|
|
|
|||||||||||||||
| $ | (7,623 | ) | ||||||||||||||
|
|
|
|||||||||||||||
| SCHEDULES OF INVESTMENTS | 37 |
| Schedule of Investments (continued) August 31, 2019 |
BlackRock New York Municipal Bond Trust (BQH) |
Derivative Financial Instruments Categorized by Risk Exposure
As of period end, the fair values of derivative financial instruments located in the Statements of Assets and Liabilities were as follows:
| Commodity Contracts |
Credit Contracts |
Equity Contracts |
Foreign Currency Exchange Contracts |
Interest Rate Contracts |
Other Contracts |
Total | ||||||||||||||||||||||
| Liabilities — Derivative Financial Instruments |
||||||||||||||||||||||||||||
| Futures contracts |
||||||||||||||||||||||||||||
| Unrealized depreciation on futures contracts(a) |
$ | — | $ | — | $ | — | $ | — | $ | 7,623 | $ | — | $ | 7,623 | ||||||||||||||
|
|
|
|
|
|
|
|
|
|
|
|
|
|
|
|||||||||||||||
| (a) | Net cumulative unrealized appreciation (depreciation) on futures contracts, if any, are reported in the Schedule of Investments. In the Statements of Assets and Liabilities, only current day’s variation margin is reported in receivables or payables and the net cumulative unrealized appreciation (depreciation) is included in accumulated earnings (loss). |
For the year ended August 31, 2019, the effect of derivative financial instruments in the Statements of Operations was as follows:
| Commodity Contracts |
Credit Contracts |
Equity Contracts |
Foreign Currency Exchange Contracts |
Interest Rate Contracts |
Other Contracts |
Total | ||||||||||||||||||||||
| Net Realized Gain (Loss) from: |
||||||||||||||||||||||||||||
| Futures contracts |
$ | — | $ | — | $ | — | $ | — | $ | (473,065 | ) | $ | — | $ | (473,065 | ) | ||||||||||||
|
|
|
|
|
|
|
|
|
|
|
|
|
|
|
|||||||||||||||
| Net Change in Unrealized Appreciation (Depreciation) on: | ||||||||||||||||||||||||||||
| Futures contracts |
$ | — | $ | — | $ | — | $ | — | $ | (12,777 | ) | $ | — | $ | (12,777 | ) | ||||||||||||
|
|
|
|
|
|
|
|
|
|
|
|
|
|
|
|||||||||||||||
Average Quarterly Balances of Outstanding Derivative Financial Instruments
| Futures contracts: |
| |||
| Average notional value of contracts — short |
$ | 3,735,566 | ||
For more information about the Trust’s investment risks regarding derivative financial instruments, refer to the Notes to Financial Statements.
Fair Value Hierarchy as of Period End
Various inputs are used in determining the fair value of investments and derivative financial instruments. For information about the Trust’s policy regarding valuation of investments and derivative financial instruments, refer to the Notes to Financial Statements.
The following tables summarize the Trust’s investments and derivative financial instruments categorized in the disclosure hierarchy:
| Level 1 | Level 2 | Level 3 | Total | |||||||||||||
| Assets: |
| |||||||||||||||
| Investments: |
| |||||||||||||||
| Long-Term Investments(a) |
$ | — | $ | 75,938,441 | $ | — | $ | 75,938,441 | ||||||||
| Short-Term Securities |
64,451 | — | — | 64,451 | ||||||||||||
|
|
|
|
|
|
|
|
|
|||||||||
| $ | 64,451 | $ | 75,938,441 | $ | — | $ | 76,002,892 | |||||||||
|
|
|
|
|
|
|
|
|
|||||||||
| Derivative Financial Instruments(b) |
| |||||||||||||||
| Liabilities: |
| |||||||||||||||
| Interest rate contracts |
$ | (7,623 | ) | $ | — | $ | — | $ | (7,623 | ) | ||||||
|
|
|
|
|
|
|
|
|
|||||||||
| (a) | See above Schedule of Investments for values in each sector. |
| (b) | Derivative financial instruments are futures contracts which are valued at the unrealized appreciation (depreciation) on the instrument. |
The Trust may hold assets and/or liabilities in which the fair value approximates the carrying amount for financial statement purposes. As of period end, such assets and/or liabilities are categorized within the disclosure hierarchy as follows:
| Level 1 | Level 2 | Level 3 | Total | |||||||||||||
| Liabilities: |
| |||||||||||||||
| TOB Trust Certificates |
$ | — | $ | (7,857,402 | ) | $ | — | $ | (7,857,402 | ) | ||||||
| VRDP Shares at Liquidation Value |
— | (22,100,000 | ) | — | (22,100,000 | ) | ||||||||||
|
|
|
|
|
|
|
|
|
|||||||||
| $ | — | $ | (29,957,402 | ) | $ | — | $ | (29,957,402 | ) | |||||||
|
|
|
|
|
|
|
|
|
|||||||||
See notes to financial statements.
| 38 | 2019 BLACKROCK ANNUAL REPORT TO SHAREHOLDERS |
| Schedule of Investments August 31, 2019 |
BlackRock New York Municipal Income Quality Trust (BSE) (Percentages shown are based on Net Assets) |
| SCHEDULES OF INVESTMENTS | 39 |
| Schedule of Investments (continued) August 31, 2019 |
BlackRock New York Municipal Income Quality Trust (BSE) (Percentages shown are based on Net Assets) |
| 40 | 2019 BLACKROCK ANNUAL REPORT TO SHAREHOLDERS |
| Schedule of Investments (continued) August 31, 2019 |
BlackRock New York Municipal Income Quality Trust (BSE) (Percentages shown are based on Net Assets) |
| SCHEDULES OF INVESTMENTS | 41 |
| Schedule of Investments (continued) August 31, 2019 |
BlackRock New York Municipal Income Quality Trust (BSE) (Percentages shown are based on Net Assets) |
During the year ended August 31, 2019, investments in issuers considered to be an affiliate/affiliates of the Trust for purposes of Section 2(a)(3) of the Investment Company Act of 1940, as amended, were as follows:
| Affiliate | Shares Held at 08/31/18 |
Net Activity |
Shares Held at 08/31/19 |
Value at 08/31/19 |
Income | Net Realized Gain (Loss) (a) |
Change in Unrealized Appreciation (Depreciation) |
|||||||||||||||||||||
| BlackRock Liquidity Funds New York Money Fund Portfolio(b) |
— | — | — | $ | — | $ | 8,432 | $ | — | $ | — | |||||||||||||||||
| BlackRock Liquidity Funds, MuniCash, Institutional Class(b) |
673,097 | (673,097 | ) | — | — | 1,449 | — | — | ||||||||||||||||||||
|
|
|
|
|
|
|
|
|
|||||||||||||||||||||
| $ | — | $ | 9,881 | $ | — | $ | — | |||||||||||||||||||||
|
|
|
|
|
|
|
|
|
|||||||||||||||||||||
| (a) | Includes net capital gain distributions, if applicable. |
| (b) | No longer held by the Trust as of period end. |
For Trust compliance purposes, the Trust’s sector classifications refer to one or more of the sector sub-classifications used by one or more widely recognized market indexes or rating group indexes, and/or as defined by the investment adviser. These definitions may not apply for purposes of this report, which may combine such sector sub-classifications for reporting ease.
Derivative Financial Instruments Outstanding as of Period End
Futures Contracts
| Description | Number of Contracts |
Expiration Date |
Notional Amount (000) |
Value/ Unrealized Appreciation (Depreciation) |
||||||||||||
| Short Contracts |
||||||||||||||||
| 10-Year U.S. Treasury Note |
11 | 12/19/19 | $ | 1,449 | $ | (1,447 | ) | |||||||||
| Long U.S. Treasury Bond |
17 | 12/19/19 | 2,809 | (10,281 | ) | |||||||||||
| 5-Year U.S. Treasury Note |
15 | 12/31/19 | 1,800 | (1,796 | ) | |||||||||||
|
|
|
|||||||||||||||
| $ | (13,524 | ) | ||||||||||||||
|
|
|
|||||||||||||||
| 42 | 2019 BLACKROCK ANNUAL REPORT TO SHAREHOLDERS |
| Schedule of Investments (continued) August 31, 2019 |
BlackRock New York Municipal Income Quality Trust (BSE) |
Derivative Financial Instruments Categorized by Risk Exposure
As of period end, the fair values of derivative financial instruments located in the Statements of Assets and Liabilities were as follows:
| Commodity Contracts |
Credit Contracts |
Equity Contracts |
Foreign Currency Exchange Contracts |
Interest Rate Contracts |
Other Contracts |
Total | ||||||||||||||||||||||
| Liabilities — Derivative Financial Instruments |
||||||||||||||||||||||||||||
| Futures contracts |
||||||||||||||||||||||||||||
| Unrealized depreciation on futures contracts(a) |
$ | — | $ | — | $ | — | $ | — | $ | 13,524 | $ | — | $ | 13,524 | ||||||||||||||
|
|
|
|
|
|
|
|
|
|
|
|
|
|
|
|||||||||||||||
| (a) | Net cumulative unrealized appreciation (depreciation) on futures contracts, if any, are reported in the Schedule of Investments. In the Statements of Assets and Liabilities, only current day’s variation margin is reported in receivables or payables and the net cumulative unrealized appreciation (depreciation) is included in accumulated earnings (loss). |
For the year ended August 31, 2019, the effect of derivative financial instruments in the Statements of Operations was as follows:
| Commodity Contracts |
Credit Contracts |
Equity Contracts |
Foreign Currency Exchange Contracts |
Interest Rate Contracts |
Other Contracts |
Total | ||||||||||||||||||||||
| Net Realized Gain (Loss) from: |
||||||||||||||||||||||||||||
| Futures contracts |
$ | — | $ | — | $ | — | $ | — | $ | (933,973 | ) | $ | — | $ | (933,973 | ) | ||||||||||||
|
|
|
|
|
|
|
|
|
|
|
|
|
|
|
|||||||||||||||
| Net Change in Unrealized Appreciation on: | ||||||||||||||||||||||||||||
| Futures contracts |
$ | — | $ | — | $ | — | $ | — | $ | (22,786 | ) | $ | — | $ | (22,786 | ) | ||||||||||||
|
|
|
|
|
|
|
|
|
|
|
|
|
|
|
|||||||||||||||
Average Quarterly Balances of Outstanding Derivative Financial Instruments
| Futures contracts: |
| |||
| Average notional value of contracts — short |
$ | 8,461,145 | ||
For more information about the Trust’s investment risks regarding derivative financial instruments, refer to the Notes to Financial Statements.
Fair Value Hierarchy as of Period End
Various inputs are used in determining the fair value of investments and derivative financial instruments. For information about the Trust’s policy regarding valuation of investments and derivative financial instruments, refer to the Notes to Financial Statements.
The following tables summarize the Trust’s investments and derivative financial instruments categorized in the disclosure hierarchy:
| Level 1 | Level 2 | Level 3 | Total | |||||||||||||
| Assets: |
| |||||||||||||||
| Investments: |
| |||||||||||||||
| Long-Term Investments(a) |
$ | — | $ | 161,699,405 | $ | — | $ | 161,699,405 | ||||||||
|
|
|
|
|
|
|
|
|
|||||||||
| Derivative Financial Instruments(b) |
| |||||||||||||||
| Liabilities: |
| |||||||||||||||
| Interest rate contracts |
$ | (13,524 | ) | $ | — | $ | — | $ | (13,524 | ) | ||||||
|
|
|
|
|
|
|
|
|
|||||||||
| (a) | See above Schedule of Investments for values in each sector. |
| (b) | Derivative financial instruments are futures contracts, which are valued at the unrealized appreciation (depreciation) on the instrument. |
The Trust may hold assets and/or liabilities in which the fair value approximates the carrying amount for financial statement purposes. As of period end, such assets and/or liabilities are categorized within the disclosure hierarchy as follows:
| Level 1 | Level 2 | Level 3 | Total | |||||||||||||
| Liabilities: |
| |||||||||||||||
| TOB Trust Certificates |
$ | — | $ | (22,050,197 | ) | $ | — | $ | (22,050,197 | ) | ||||||
| VRDP Shares at Liquidation Value |
— | (40,500,000 | ) | — | (40,500,000 | ) | ||||||||||
|
|
|
|
|
|
|
|
|
|||||||||
| $ | — | $ | (62,550,197 | ) | $ | — | $ | (62,550,197 | ) | |||||||
|
|
|
|
|
|
|
|
|
|||||||||
See notes to financial statements.
| SCHEDULES OF INVESTMENTS | 43 |
| Schedule of Investments August 31, 2019 |
BlackRock New York Municipal Income Trust II (BFY) (Percentages shown are based on Net Asset) |
| 44 | 2019 BLACKROCK ANNUAL REPORT TO SHAREHOLDERS |
| Schedule of Investments (continued) August 31, 2019 |
BlackRock New York Municipal Income Trust II (BFY) (Percentages shown are based on Net Asset) |
| SCHEDULES OF INVESTMENTS | 45 |
| Schedule of Investments (continued) August 31, 2019 |
BlackRock New York Municipal Income Trust II (BFY) (Percentages shown are based on Net Asset) |
| 46 | 2019 BLACKROCK ANNUAL REPORT TO SHAREHOLDERS |
| Schedule of Investments (continued) August 31, 2019 |
BlackRock New York Municipal Income Trust II (BFY) (Percentages shown are based on Net Asset) |
| (h) | During the year ended August 31, 2019, investments in issuers considered to be an affiliate/ affiliates of the Trust for purposes of Section 2(a)(3) of the Investment Company Act of 1940, as amended, were as follows: |
| Affiliate | Shares Held at |
Net Activity |
Shares Held at |
Value at 08/31/19 |
Income | Net Realized Gain (Loss) (a) |
Change in Unrealized (Depreciation) |
|||||||||||||||||||||
| BlackRock Liquidity Funds New York Money Fund Portfolio |
— | 273,796 | 273,796 | $ | 273,796 | $ | 9,997 | $ | — | $ | — | |||||||||||||||||
| BlackRock Liquidity Funds, MuniCash, Institutional Class(b) |
129,237 | (129,237 | ) | — | — | 901 | 13 | (13 | ) | |||||||||||||||||||
|
|
|
|
|
|
|
|
|
|||||||||||||||||||||
| $ | 273,796 | $ | 10,898 | $ | 13 | $ | (13 | ) | ||||||||||||||||||||
|
|
|
|
|
|
|
|
|
|||||||||||||||||||||
| (a) | Includes net capital gain distributions, if applicable. |
| (b) | No longer held by the Trust as of period end. |
For Trust compliance purposes, the Trust’s sector classifications refer to one or more of the sector sub-classifications used by one or more widely recognized market indexes or rating group indexes, and/or as defined by the investment adviser. These definitions may not apply for purposes of this report, which may combine such sector sub-classifications for reporting ease.
| SCHEDULES OF INVESTMENTS | 47 |
| Schedule of Investments (continued) August 31, 2019 |
BlackRock New York Municipal Income Trust II (BFY) |
Derivative Financial Instruments Outstanding as of Period End
Futures Contracts
| Description | Number of Contracts |
Expiration Date |
Notional Amount (000) |
Value/ (Depreciation) |
||||||||||||
| Short Contracts |
||||||||||||||||
| 10-Year U.S. Treasury Note |
7 | 12/19/19 | $ | 922 | $ | (910 | ) | |||||||||
| Long U.S. Treasury Bond |
15 | 12/19/19 | 2,479 | (9,072 | ) | |||||||||||
| 5-Year U.S. Treasury Note |
10 | 12/31/19 | 1,200 | (1,197 | ) | |||||||||||
|
|
|
|||||||||||||||
| $ | (11,179 | ) | ||||||||||||||
|
|
|
|||||||||||||||
Derivative Financial Instruments Categorized by Risk Exposure
As of period end, the fair values of derivative financial instruments located in the Statements of Assets and Liabilities were as follows:
| Commodity Contracts |
Credit Contracts |
Equity Contracts |
Foreign Currency Exchange Contracts |
Interest Rate Contracts |
Other Contracts |
Total | ||||||||||||||||||||||
| Liabilities — Derivative Financial Instruments |
||||||||||||||||||||||||||||
| Futures contracts |
||||||||||||||||||||||||||||
| Unrealized depreciation on futures contracts(a) |
$ | — | $ | — | $ | — | $ | — | $ | 11,179 | $ | — | $ | 11,179 | ||||||||||||||
|
|
|
|
|
|
|
|
|
|
|
|
|
|
|
|||||||||||||||
| (a) | Net cumulative unrealized appreciation (depreciation) on futures, are reported in the Schedule of Investments. In the Statements of Assets and Liabilities, only current day’s variation margin is reported in receivables or payables and the net cumulative unrealized appreciation (depreciation) is included in accumulated earnings (loss). |
For the year ended August 31, 2019, the effect of derivative financial instruments in the Statements of Operations was as follows:
| Commodity Contracts |
Credit Contracts |
Equity Contracts |
Foreign Currency Exchange Contracts |
Interest Rate Contracts |
Other Contracts |
Total | ||||||||||||||||||||||
| Net Realized Gain (Loss) from: |
||||||||||||||||||||||||||||
| Futures contracts |
$ | — | $ | — | $ | — | $ | — | $ | (737,722 | ) | $ | — | $ | (737,722 | ) | ||||||||||||
|
|
|
|
|
|
|
|
|
|
|
|
|
|
|
|||||||||||||||
| Net Change in Unrealized Appreciation (Depreciation) on: | ||||||||||||||||||||||||||||
| Futures contracts |
$ | — | $ | — | $ | — | $ | — | $ | (19,068 | ) | $ | — | $ | (19,068 | ) | ||||||||||||
|
|
|
|
|
|
|
|
|
|
|
|
|
|
|
|||||||||||||||
Average Quarterly Balances of Outstanding Derivative Financial Instruments
| Futures contracts: |
| |||
| Average notional value of contracts — short |
$ | 6,298,607 | ||
For more information about the Trust’s investment risks regarding derivative financial instruments, refer to the Notes to Financial Statements.
Fair Value Hierarchy as of Period End
Various inputs are used in determining the fair value of investments and derivative financial instruments. For information about the Trust’s policy regarding valuation of investments and derivative financial instruments, refer to the Notes to Financial Statements.
The following tables summarize the Trust’s investments and derivative financial instruments categorized in the disclosure hierarchy:
| Level 1 | Level 2 | Level 3 | Total | |||||||||||||
| Assets: |
| |||||||||||||||
| Investments: |
| |||||||||||||||
| Long-Term Investments(a) |
$ | — | $ | 131,671,527 | $ | — | $ | 131,671,527 | ||||||||
| Short-Term Securities |
273,796 | — | — | 273,796 | ||||||||||||
|
|
|
|
|
|
|
|
|
|||||||||
| $ | 273,796 | $ | 131,671,527 | $ | $ | 131,945,323 | ||||||||||
|
|
|
|
|
|
|
|
|
|||||||||
| Derivative Financial Instruments(b) |
| |||||||||||||||
| Liabilities: |
| |||||||||||||||
| Interest rate contracts |
$ | (11,179 | ) | $ | — | $ | — | $ | (11,179 | ) | ||||||
|
|
|
|
|
|
|
|
|
|||||||||
| (a) | See above Schedule of Investments for values in each sector. |
| (b) | Derivative financial instruments are futures contracts which are valued at the unrealized appreciation (depreciation) on the instrument. |
| 48 | 2019 BLACKROCK ANNUAL REPORT TO SHAREHOLDERS |
| Schedule of Investments (continued) August 31, 2019 |
BlackRock New York Municipal Income Trust II (BFY) |
The Trust may hold assets and/or liabilities in which the fair value approximates the carrying amount for financial statement purposes. As of period end, such assets and/or liabilities are categorized within the disclosure hierarchy as follows:
| Level 1 | Level 2 | Level 3 | Total | |||||||||||||
| Liabilities: |
| |||||||||||||||
| TOB Trust Certificates |
$ | — | $ | (8,058,575 | ) | $ | — | $ | (8,058,575 | ) | ||||||
| VRDP Shares at Liquidation Value |
— | (44,400,000 | ) | — | (44,400,000 | ) | ||||||||||
|
|
|
|
|
|
|
|
|
|||||||||
| $ | — | $ | (52,458,575 | ) | $ | — | $ | (52,458,575 | ) | |||||||
|
|
|
|
|
|
|
|
|
|||||||||
See notes to financial statements.
| SCHEDULES OF INVESTMENTS | 49 |
| Schedule of Investments August 31, 2019 |
BlackRock Virginia Municipal Bond Trust (BHV) (Percentages shown are based on Net Assets) |
| 50 | 2019 BLACKROCK ANNUAL REPORT TO SHAREHOLDERS |
| Schedule of Investments (continued) August 31, 2019 |
BlackRock Virginia Municipal Bond Trust (BHV) (Percentages shown are based on Net Assets) |
| (h) | During the year ended August 31, 2019, investments in issuers considered to be an affiliate/ affiliates of the Trust for purposes of Section 2(a)(3) of the Investment Company Act of 1940, as amended, were as follows: |
| Affiliate | Shares Held at 08/31/18 |
Net Activity |
Shares Held at 08/31/19 |
Value at 08/31/19 |
Income | Net Realized Gain (Loss) (a) |
Change in Unrealized Appreciation (Depreciation) |
|||||||||||||||||||||
| BlackRock Liquidity Funds, MuniCash, Institutional Class |
13,073 | 438,767 | 451,840 | $ | 451,886 | $ | 5,651 | $ | 112 | $ | — | |||||||||||||||||
|
|
|
|
|
|
|
|
|
|||||||||||||||||||||
| (a) | Includes net capital gain distributions, if applicable. |
| SCHEDULES OF INVESTMENTS | 51 |
| Schedule of Investments (continued) August 31, 2019 |
BlackRock Virginia Municipal Bond Trust (BHV) |
For Trust compliance purposes, the Trust’s sector classifications refer to one or more of the sector sub-classifications used by one or more widely recognized market indexes or rating group indexes, and/or as defined by the investment adviser. These definitions may not apply for purposes of this report, which may combine such sector sub-classifications for reporting ease.
Derivative Financial Instruments Outstanding as of Period End
Futures Contracts
| Description | Number of Contracts |
Expiration Date |
Notional Amount (000) |
Value/ Unrealized Appreciation (Depreciation) |
||||||||||||
| Short Contracts |
||||||||||||||||
| 10-Year U.S. Treasury Note |
4 | 12/19/19 | $ | 527 | $ | (537 | ) | |||||||||
| Long U.S. Treasury Bond |
5 | 12/19/19 | 826 | (3,024 | ) | |||||||||||
| 5-Year U.S. Treasury Note |
1 | 12/31/19 | 120 | (149 | ) | |||||||||||
|
|
|
|||||||||||||||
| $ | (3,710 | ) | ||||||||||||||
|
|
|
|||||||||||||||
Derivative Financial Instruments Categorized by Risk Exposure
As of period end, the fair values of derivative financial instruments located in the Statements of Assets and Liabilities were as follows:
| Commodity Contracts |
Credit Contracts |
Equity Contracts |
Foreign Currency Exchange Contracts |
Interest Rate Contracts |
Other Contracts |
Total | ||||||||||||||||||||||
| Liabilities — Derivative Financial Instruments |
||||||||||||||||||||||||||||
| Futures contracts |
||||||||||||||||||||||||||||
| Unrealized depreciation on futures contracts(a) |
$ | — | $ | — | $ | — | $ | — | $ | 3,710 | $ | — | $ | 3,710 | ||||||||||||||
|
|
|
|
|
|
|
|
|
|
|
|
|
|
|
|||||||||||||||
| (a) | Net cumulative unrealized appreciation (depreciation) on futures contracts, are reported in the Schedule of Investments. In the Statements of Assets and Liabilities, only current day’s variation margin is reported in receivables or payables and the net cumulative unrealized appreciation (depreciation) is included in accumulated earnings (loss) |
For the year ended August 31, 2019, the effect of derivative financial instruments in the Statements of Operations was as follows:
| Commodity Contracts |
Credit Contracts |
Equity Contracts |
Foreign Currency Exchange Contracts |
Interest Rate Contracts |
Other Contracts |
Total | ||||||||||||||||||||||
| Net Realized Gain (Loss) from: |
||||||||||||||||||||||||||||
| Futures contracts |
$ | — | $ | — | $ | — | $ | — | $ | (239,039 | ) | $ | — | $ | (239,039 | ) | ||||||||||||
|
|
|
|
|
|
|
|
|
|
|
|
|
|
|
|||||||||||||||
| Net Change in Unrealized Appreciation (Depreciation) on: | ||||||||||||||||||||||||||||
| Futures contracts |
$ | — | $ | — | $ | — | $ | — | $ | (5,320 | ) | $ | — | $ | (5,320 | ) | ||||||||||||
|
|
|
|
|
|
|
|
|
|
|
|
|
|
|
|||||||||||||||
Average Quarterly Balances of Outstanding Derivative Financial Instruments
| Futures contracts: |
| |||
| Average notional value of contracts — short |
$ | 1,759,904 | ||
For more information about the Trust’s investment risks regarding derivative financial instruments, refer to the Notes to Financial Statements.
| 52 | 2019 BLACKROCK ANNUAL REPORT TO SHAREHOLDERS |
| Schedule of Investments (continued) August 31, 2019 |
BlackRock Virginia Municipal Bond Trust (BHV) |
Fair Value Hierarchy as of Period End
Various inputs are used in determining the fair value of investments and derivative financial instruments. For information about the Trust’s policy regarding valuation of investments and derivative financial instruments, refer to the Notes to Financial Statements.
The following tables summarize the Trust’s investments and derivative financial instruments categorized in the disclosure hierarchy:
| Level 1 | Level 2 | Level 3 | Total | |||||||||||||
| Assets: |
| |||||||||||||||
| Investments: |
| |||||||||||||||
| Long-Term Investments(a) |
$ | — | $ | 41,243,427 | $ | — | $ | 41,243,427 | ||||||||
| Short-Term Securities |
451,886 | — | — | 451,886 | ||||||||||||
|
|
|
|
|
|
|
|
|
|||||||||
| $ | 451,886 | $ | 41,243,427 | $ | $ | 41,695,313 | ||||||||||
|
|
|
|
|
|
|
|
|
|||||||||
| Derivative Financial Instruments(b) |
| |||||||||||||||
| Liabilities: |
| |||||||||||||||
| Interest rate contracts |
$ | (3,710 | ) | $ | — | $ | — | $ | (3,710 | ) | ||||||
|
|
|
|
|
|
|
|
|
|||||||||
| (a) | See above Schedule of Investments for values in each sector. |
| (b) | Derivative financial instruments are futures contracts which are valued at the unrealized appreciation (depreciation) on the instrument. |
The Trust may hold assets and/or liabilities in which the fair value approximates the carrying amount for financial statement purposes. As of period end, such assets and/or liabilities are categorized within the disclosure hierarchy as follows:
| Level 1 | Level 2 | Level 3 | Total | |||||||||||||
| Liabilities: |
| |||||||||||||||
| TOB Trust Certificates |
$ | — | $ | (5,396,436 | ) | $ | — | $ | (5,396,436 | ) | ||||||
| VRDP Shares at Liquidation Value |
— | (11,600,000 | ) | — | (11,600,000 | ) | ||||||||||
|
|
|
|
|
|
|
|
|
|||||||||
| $ | — | $ | (16,996,436 | ) | $ | — | $ | (16,996,436 | ) | |||||||
|
|
|
|
|
|
|
|
|
|||||||||
See notes to financial statements
| SCHEDULES OF INVESTMENTS | 53 |
Statements of Assets and Liabilities
August 31, 2019
| BZM | MHE | MHN | BQH | |||||||||||||
| ASSETS |
| |||||||||||||||
| Investments at value — unaffiliated(a) |
$ | 50,690,232 | $ | 54,456,292 | $ | 768,840,660 | $ | 75,938,441 | ||||||||
| Investments at value — affiliated(b) |
399,268 | 76,217 | 343,108 | 64,451 | ||||||||||||
| Cash |
9,344 | 9,539 | 109,813 | 11,773 | ||||||||||||
| Cash pledged for futures contracts |
31,350 | 32,050 | 369,850 | 39,350 | ||||||||||||
| Receivables: |
| |||||||||||||||
| Investments sold |
— | — | 1,149,400 | — | ||||||||||||
| Dividends — affiliated |
754 | 64 | 1,105 | 94 | ||||||||||||
| Interest — unaffiliated |
489,850 | 611,068 | 8,460,390 | 815,510 | ||||||||||||
| Variation margin on futures contracts |
— | 24 | — | — | ||||||||||||
| Prepaid expenses |
32,513 | 29,965 | 29,218 | 59,848 | ||||||||||||
|
|
|
|
|
|
|
|
|
|||||||||
| Total assets |
51,653,311 | 55,215,219 | 779,303,544 | 76,929,467 | ||||||||||||
|
|
|
|
|
|
|
|
|
|||||||||
| ACCRUED LIABILITIES |
| |||||||||||||||
| Payables: |
| |||||||||||||||
| Investments purchased |
— | — | 1,120,000 | 595,000 | ||||||||||||
| Income dividend distributions — Common Shares |
75,771 | 94,841 | 1,385,375 | 134,405 | ||||||||||||
| Interest expense and fees |
10,006 | 17,431 | 261,280 | 40,147 | ||||||||||||
| Investment advisory fees |
26,088 | 23,321 | 340,735 | 35,448 | ||||||||||||
| Trustees’ and Officer’s fees |
12,496 | 283 | 257,775 | 12,231 | ||||||||||||
| Other accrued expenses |
87,969 | 94,863 | 216,925 | 76,344 | ||||||||||||
| Variation margin on futures contracts |
750 | 750 | 11,062 | 750 | ||||||||||||
|
|
|
|
|
|
|
|
|
|||||||||
| Total accrued liabilities |
213,080 | 231,489 | 3,593,152 | 894,325 | ||||||||||||
|
|
|
|
|
|
|
|
|
|||||||||
| OTHER LIABILITIES |
| |||||||||||||||
| TOB Trust Certificates |
2,999,064 | 3,136,631 | 55,898,643 | 7,857,402 | ||||||||||||
| VRDP Shares, at liquidation value of $100,000 per share, net of deferred offering costs(c)(d) |
15,940,403 | 18,345,944 | 243,262,725 | 22,004,239 | ||||||||||||
|
|
|
|
|
|
|
|
|
|||||||||
| Total other liabilities |
18,939,467 | 21,482,575 | 299,161,368 | 29,861,641 | ||||||||||||
|
|
|
|
|
|
|
|
|
|||||||||
| Total liabilities |
19,152,547 | 21,714,064 | 302,754,520 | 30,755,966 | ||||||||||||
|
|
|
|
|
|
|
|
|
|||||||||
| NET ASSETS APPLICABLE TO COMMON SHAREHOLDERS |
$ | 32,500,764 | $ | 33,501,155 | $ | 476,549,024 | $ | 46,173,501 | ||||||||
|
|
|
|
|
|
|
|
|
|||||||||
| NET ASSETS APPLICABLE TO COMMON SHAREHOLDERS CONSIST OF |
| |||||||||||||||
| Paid-in capital(e)(f)(g) |
$ | 29,494,034 | $ | 29,297,199 | $ | 432,632,271 | $ | 39,687,618 | ||||||||
| Accumulated earnings |
3,006,730 | $ | 4,203,956 | 43,916,753 | 6,485,883 | |||||||||||
|
|
|
|
|
|
|
|
|
|||||||||
| NET ASSETS APPLICABLE TO COMMON SHAREHOLDERS |
$ | 32,500,764 | $ | 33,501,155 | $ | 476,549,024 | $ | 46,173,501 | ||||||||
|
|
|
|
|
|
|
|
|
|||||||||
| Net asset value per Common Share |
$ | 15.61 | $ | 14.13 | $ | 15.31 | $ | 16.49 | ||||||||
|
|
|
|
|
|
|
|
|
|||||||||
| (a) Investments at cost — unaffiliated |
$ | 47,394,195 | $ | 49,776,126 | $ | 704,353,317 | $ | 68,130,640 | ||||||||
| (b) Investments at cost — affiliated |
$ | 399,308 | $ | 76,220 | $ | 343,108 | $ | 64,451 | ||||||||
| (c) Preferred Shares outstanding: |
||||||||||||||||
| Par value $0.001 per share |
160 | — | — | 221 | ||||||||||||
| Par value $0.01 per share |
— | 185 | — | — | ||||||||||||
| Par value $0.10 per share |
— | — | 2,436 | — | ||||||||||||
| (d) Preferred Shares authorized |
unlimited | unlimited | 14,956 | unlimited | ||||||||||||
| (e) Par value per Common Shares |
$ | 0.001 | $ | 0.010 | $ | 0.1000 | $ | 0.001 | ||||||||
| (f) Common Shares outstanding |
2,081,608 | 2,371,023 | 31,132,023 | 2,800,105 | ||||||||||||
| (g) Common Shares authorized |
unlimited | unlimited | 199,985,044 | unlimited | ||||||||||||
See notes to financial statements.
| 54 | 2019 BLACKROCK ANNUAL REPORT TO SHAREHOLDERS |
Statements of Assets and Liabilities (continued)
August 31, 2019
| BSE | BFY | BHV | ||||||||||
| ASSETS |
| |||||||||||
| Investments at value — unaffiliated(a) |
$ | 161,699,405 | $ | 131,671,527 | $ | 41,243,427 | ||||||
| Investments at value — affiliated(b) |
— | 273,796 | 451,886 | |||||||||
| Cash |
60,650 | 17,813 | 6,133 | |||||||||
| Cash pledged for futures contracts |
75,300 | 60,400 | 20,950 | |||||||||
| Receivables: |
| |||||||||||
| Investments sold |
584,963 | — | — | |||||||||
| Dividends — affiliated |
327 | 880 | 98 | |||||||||
| Interest — unaffiliated |
1,797,548 | 1,404,976 | 497,693 | |||||||||
| Prepaid expenses |
61,341 | 69,341 | 22,857 | |||||||||
|
|
|
|
|
|
|
|||||||
| Total assets |
164,279,534 | 133,498,733 | 42,243,044 | |||||||||
|
|
|
|
|
|
|
|||||||
| ACCRUED LIABILITIES |
| |||||||||||
| Payables: |
| |||||||||||
| Investments purchased |
1,270,000 | 1,030,000 | — | |||||||||
| Income dividend distributions — Common Shares |
264,046 | 245,241 | 73,084 | |||||||||
| Interest expense and fees |
100,390 | 39,337 | 18,676 | |||||||||
| Investment advisory fees |
75,715 | 61,514 | 18,554 | |||||||||
| Trustees’ and Officer’s fees |
11,634 | 14,254 | 9,327 | |||||||||
| Other accrued expenses |
103,579 | 87,835 | 66,864 | |||||||||
| Variation margin on futures contracts |
2,438 | 1,594 | 469 | |||||||||
|
|
|
|
|
|
|
|||||||
| Total accrued liabilities |
1,827,802 | 1,479,775 | 186,974 | |||||||||
|
|
|
|
|
|
|
|||||||
| OTHER LIABILITIES |
| |||||||||||
| TOB Trust Certificates |
22,050,197 | 8,058,575 | 5,396,436 | |||||||||
| VRDP Shares, at liquidation value of $100,000 per share, net of deferred offering costs(c)(d) |
40,396,390 | 44,302,072 | 11,541,104 | |||||||||
|
|
|
|
|
|
|
|||||||
| Total other liabilities |
62,446,587 | 52,360,647 | 16,937,540 | |||||||||
|
|
|
|
|
|
|
|||||||
| Total liabilities |
64,274,389 | 53,840,422 | 17,124,514 | |||||||||
|
|
|
|
|
|
|
|||||||
| NET ASSETS APPLICABLE TO COMMON SHAREHOLDERS |
$ | 100,005,145 | $ | 79,658,311 | $ | 25,118,530 | ||||||
|
|
|
|
|
|
|
|||||||
| NET ASSETS APPLICABLE TO COMMON SHAREHOLDERS CONSIST OF |
| |||||||||||
| Paid-in capital(e)(f)(g) |
$ | 89,248,714 | $ | 69,624,340 | $ | 22,874,629 | ||||||
| Accumulated earnings |
10,756,431 | $ | 10,033,971 | 2,243,901 | ||||||||
|
|
|
|
|
|
|
|||||||
| NET ASSETS APPLICABLE TO COMMON SHAREHOLDERS |
$ | 100,005,145 | $ | 79,658,311 | $ | 25,118,530 | ||||||
|
|
|
|
|
|
|
|||||||
| Net asset value per Common Share |
$ | 15.34 | $ | 15.92 | $ | 15.64 | ||||||
|
|
|
|
|
|
|
|||||||
| (a) Investments at cost — unaffiliated |
$ | 148,154,357 | $ | 119,789,035 | $ | 38,342,440 | ||||||
| (b) Investments at cost — affiliated |
$ | — | $ | 273,796 | $ | 451,886 | ||||||
| (c) Preferred Shares outstanding: |
||||||||||||
| Par value $ 0.001 per share |
405 | 444 | 116 | |||||||||
| (d) Preferred Shares authorized |
unlimited | unlimited | unlimited | |||||||||
| (e) Par value per Common Shares |
$ | 0.001 | $ | 0.001 | $ | 0.001 | ||||||
| (f) Common Shares outstanding |
6,519,660 | 5,004,922 | 1,606,237 | |||||||||
| (g) Common Shares authorized |
unlimited | unlimited | unlimited | |||||||||
See notes to financial statements.
| FINANCIAL STATEMENTS | 55 |
Year Ended August 31, 2019
| BZM | MHE | MHN | BQH | |||||||||||||
| INVESTMENT INCOME |
| |||||||||||||||
| Interest — unaffiliated |
$ | 1,912,689 | $ | 2,094,374 | $ | 28,619,714 | $ | 2,883,036 | ||||||||
| Dividends — affiliated |
13,120 | 6,841 | 27,428 | 3,816 | ||||||||||||
|
|
|
|
|
|
|
|
|
|||||||||
| Total investment income |
1,925,809 | 2,101,215 | 28,647,142 | 2,886,852 | ||||||||||||
|
|
|
|
|
|
|
|
|
|||||||||
| EXPENSES |
| |||||||||||||||
| Investment advisory |
324,516 | 264,957 | 4,127,665 | 474,529 | ||||||||||||
| Liquidity fees |
122,589 | — | 24,684 | 1,048 | ||||||||||||
| Professional |
48,214 | 44,245 | 88,525 | 139,794 | ||||||||||||
| Rating agency |
32,677 | 32,682 | 45,105 | 44,686 | ||||||||||||
| Accounting services |
19,210 | 19,682 | 110,516 | 22,634 | ||||||||||||
| Transfer agent |
15,442 | 16,412 | 31,290 | 89,936 | ||||||||||||
| Remarketing fees on Preferred Shares |
11,355 | — | 24,357 | 1,029 | ||||||||||||
| Printing |
6,486 | 6,565 | 12,201 | 21,475 | ||||||||||||
| Registration |
5,695 | 5,752 | 11,791 | 9,237 | ||||||||||||
| Custodian |
2,521 | 2,181 | 20,359 | 3,186 | ||||||||||||
| Trustees and Officer |
2,235 | 1,793 | 42,308 | 2,349 | ||||||||||||
| Miscellaneous |
16,904 | 14,283 | 31,447 | 16,487 | ||||||||||||
|
|
|
|
|
|
|
|
|
|||||||||
| Total expenses excluding interest expense, fees and amortization of offering costs |
607,844 | 408,552 | 4,570,248 | 826,390 | ||||||||||||
| Interest expense, fees and amortization of offering costs(a) |
351,189 | 507,994 | 7,213,032 | 711,583 | ||||||||||||
|
|
|
|
|
|
|
|
|
|||||||||
| Total expenses |
959,033 | 916,546 | 11,783,280 | 1,537,973 | ||||||||||||
| Less fees waived and/or reimbursed by the Manager |
(25,811 | ) | (454 | ) | (325,470 | ) | (150,823 | ) | ||||||||
|
|
|
|
|
|
|
|
|
|||||||||
| Total expenses after fees waived and/or reimbursed |
933,222 | 916,092 | 11,457,810 | 1,387,150 | ||||||||||||
|
|
|
|
|
|
|
|
|
|||||||||
| Net investment income |
992,587 | 1,185,123 | 17,189,332 | 1,499,702 | ||||||||||||
|
|
|
|
|
|
|
|
|
|||||||||
| REALIZED AND UNREALIZED GAIN (LOSS) |
| |||||||||||||||
| Net realized gain (loss) from: |
| |||||||||||||||
| Investments — unaffiliated |
(28,417 | ) | 90,402 | (2,169,996 | ) | (12,995 | ) | |||||||||
| Investments — affiliated |
60 | 247 | 49 | — | ||||||||||||
| Futures contracts |
(355,065 | ) | (344,651 | ) | (4,539,926 | ) | (473,065 | ) | ||||||||
| Capital gain distributions from investment companies — affiliated |
57 | 51 | — | — | ||||||||||||
|
|
|
|
|
|
|
|
|
|||||||||
| (383,365 | ) | (253,951 | ) | (6,709,873 | ) | (486,060 | ) | |||||||||
|
|
|
|
|
|
|
|
|
|||||||||
| Net change in unrealized appreciation (depreciation) on: |
||||||||||||||||
| Investments — unaffiliated |
2,166,292 | 2,203,422 | 38,453,814 | 3,672,861 | ||||||||||||
| Investments — affiliated |
(40 | ) | (3 | ) | (49 | ) | — | |||||||||
| Futures contracts |
(10,507 | ) | (9,885 | ) | (118,321 | ) | (12,777 | ) | ||||||||
|
|
|
|
|
|
|
|
|
|||||||||
| 2,155,745 | 2,193,534 | 38,335,444 | 3,660,084 | |||||||||||||
|
|
|
|
|
|
|
|
|
|||||||||
| Net realized and unrealized gain |
1,772,380 | 1,939,583 | 31,625,571 | 3,174,024 | ||||||||||||
|
|
|
|
|
|
|
|
|
|||||||||
| NET INCREASE IN NET ASSETS APPLICABLE TO COMMON SHAREHOLDERS RESULTING FROM OPERATIONS |
$ | 2,764,967 | $ | 3,124,706 | $ | 48,814,903 | $ | 4,673,726 | ||||||||
|
|
|
|
|
|
|
|
|
|||||||||
| (a) | Related to TOB Trusts and/or VRDP Shares. |
See notes to financial statements.
| 56 | 2019 BLACKROCK ANNUAL REPORT TO SHAREHOLDERS |
Statements of Operations (continued)
Year Ended August 31, 2019
| BSE | BFY | BHV | ||||||||||
| INVESTMENT INCOME |
| |||||||||||
| Interest — unaffiliated |
$ | 5,863,282 | $ | 5,168,026 | $ | 1,679,871 | ||||||
| Dividends — affiliated |
9,881 | 10,898 | 5,651 | |||||||||
|
|
|
|
|
|
|
|||||||
| Total investment income |
5,873,163 | 5,178,924 | 1,685,522 | |||||||||
|
|
|
|
|
|
|
|||||||
| EXPENSES |
| |||||||||||
| Investment advisory |
864,159 | 702,159 | 266,486 | |||||||||
| Professional |
93,645 | 86,238 | 36,072 | |||||||||
| Rating agency |
44,721 | 44,728 | 32,669 | |||||||||
| Accounting services |
38,294 | 25,641 | 12,046 | |||||||||
| Transfer agent |
18,668 | 17,102 | 15,331 | |||||||||
| Registration |
9,237 | 6,272 | 5,616 | |||||||||
| Trustees and Officer |
9,102 | 7,714 | 1,986 | |||||||||
| Printing |
7,379 | 7,245 | 6,418 | |||||||||
| Custodian |
4,068 | 3,934 | 1,559 | |||||||||
| Liquidity fees |
1,921 | 2,106 | 88,875 | |||||||||
| Remarketing fees on Preferred Shares |
1,886 | 2,068 | 8,234 | |||||||||
| Miscellaneous |
18,096 | 16,330 | 15,188 | |||||||||
|
|
|
|
|
|
|
|||||||
| Total expenses excluding interest expense, fees and amortization of offering costs |
1,111,176 | 921,537 | 490,480 | |||||||||
| Interest expense, fees and amortization of offering costs(a) |
1,487,486 | 1,271,053 | 318,259 | |||||||||
|
|
|
|
|
|
|
|||||||
| Total expenses |
2,598,662 | 2,192,590 | 808,739 | |||||||||
| Less fees waived and/or reimbursed by the Manager |
(147 | ) | (193 | ) | (53,669 | ) | ||||||
|
|
|
|
|
|
|
|||||||
| Total expenses after fees waived and/or reimbursed |
2,598,515 | 2,192,397 | 755,070 | |||||||||
|
|
|
|
|
|
|
|||||||
| Net investment income |
3,274,648 | 2,986,527 | 930,452 | |||||||||
|
|
|
|
|
|
|
|||||||
| REALIZED AND UNREALIZED GAIN (LOSS) |
| |||||||||||
| Net realized gain (loss) from: |
| |||||||||||
| Investments — unaffiliated |
(244,717 | ) | (209,847 | ) | 134,307 | |||||||
| Investments — affiliated |
— | 13 | 91 | |||||||||
| Futures contracts |
(933,973 | ) | (737,722 | ) | (239,039 | ) | ||||||
| Capital gain distributions from investment companies — affiliated |
— | — | 21 | |||||||||
|
|
|
|
|
|
|
|||||||
| (1,178,690 | ) | (947,556 | ) | (104,620 | ) | |||||||
|
|
|
|
|
|
|
|||||||
| Net change in unrealized appreciation (depreciation) on: |
| |||||||||||
| Investments — unaffiliated |
7,568,590 | 5,655,407 | 1,304,116 | |||||||||
| Investments — affiliated |
— | (13 | ) | — | ||||||||
| Futures contracts |
(22,786 | ) | (19,068 | ) | (5,320 | ) | ||||||
|
|
|
|
|
|
|
|||||||
| 7,545,804 | 5,636,326 | 1,298,796 | ||||||||||
|
|
|
|
|
|
|
|||||||
| Net realized and unrealized gain |
6,367,114 | 4,688,770 | 1,194,176 | |||||||||
|
|
|
|
|
|
|
|||||||
| NET INCREASE IN NET ASSETS APPLICABLE TO COMMON SHAREHOLDERS RESULTING FROM OPERATIONS |
$ | 9,641,762 | $ | 7,675,297 | $ | 2,124,628 | ||||||
|
|
|
|
|
|
|
|||||||
| (a) | Related to TOB Trusts and/or VRDP Shares. |
See notes to financial statements.
| FINANCIAL STATEMENTS | 57 |
Statements of Changes in Net Assets
| BZM | MHE | |||||||||||||||||||
| Year Ended August 31, | Year Ended August 31, | |||||||||||||||||||
| 2019 | 2018 | 2019 | 2018 | |||||||||||||||||
| INCREASE (DECREASE) IN NET ASSETS APPLICABLE TO COMMON SHAREHOLDERS |
|
|||||||||||||||||||
| OPERATIONS |
|
|||||||||||||||||||
| Net investment income |
$ | 992,587 | $ | 1,138,627 | $ | 1,185,123 | $ | 1,313,939 | ||||||||||||
| Net realized gain (loss) |
(383,365 | ) | 268,008 | (253,951 | ) | 112,606 | ||||||||||||||
| Net change in unrealized appreciation (depreciation) |
2,155,745 | (1,024,723 | ) | 2,193,534 | (1,577,609 | ) | ||||||||||||||
|
|
|
|
|
|
|
|
|
|||||||||||||
| Net increase (decrease) in net assets applicable to Common Shareholders resulting from operations |
2,764,967 | 381,912 | 3,124,706 | (151,064 | ) | |||||||||||||||
|
|
|
|
|
|
|
|
|
|||||||||||||
| DISTRIBUTIONS TO COMMON SHAREHOLDERS(a)(b) |
|
|||||||||||||||||||
| Decrease in net assets resulting from distributions to Common Shareholders |
(1,278,380 | ) | (1,267,374 | ) | (1,232,944 | ) | (1,379,587 | ) | ||||||||||||
|
|
|
|
|
|
|
|
|
|||||||||||||
| CAPITAL SHARE TRANSACTIONS |
|
|||||||||||||||||||
| Reinvestment of common distributions |
6,379 | — | — | 24,680 | ||||||||||||||||
|
|
|
|
|
|
|
|
|
|||||||||||||
| NET ASSETS APPLICABLE TO COMMON SHAREHOLDERS(b) |
|
|||||||||||||||||||
| Total increase (decrease) in net assets applicable to Common Shareholders |
1,492,966 | (885,462 | ) | 1,891,762 | (1,505,971 | ) | ||||||||||||||
| Beginning of year |
31,007,798 | 31,893,260 | 31,609,393 | 33,115,364 | ||||||||||||||||
|
|
|
|
|
|
|
|
|
|||||||||||||
| End of year |
$ | 32,500,764 | $ | 31,007,798 | $ | 33,501,155 | $ | 31,609,393 | ||||||||||||
|
|
|
|
|
|
|
|
|
|||||||||||||
| (a) | Distributions for annual periods determined in accordance with U.S. federal income tax regulations. |
| (b) | Prior year distribution character information and undistributed net investment income has been modified or removed to conform with current year Regulation S-X presentation changes. Refer to Note 11 for this prior year information. |
See notes to financial statements.
| 58 | 2019 BLACKROCK ANNUAL REPORT TO SHAREHOLDERS |
Statements of Changes in Net Assets (continued)
| MHN | BQH | |||||||||||||||||||
| Year Ended August 31, | Year Ended August 31, | |||||||||||||||||||
| 2019 | 2018 | 2019 | 2018 | |||||||||||||||||
| INCREASE (DECREASE) IN NET ASSETS APPLICABLE TO COMMON SHAREHOLDERS |
|
|||||||||||||||||||
| OPERATIONS |
|
|||||||||||||||||||
| Net investment income |
$ | 17,189,332 | $ | 18,810,840 | $ | 1,499,702 | $ | 1,682,937 | ||||||||||||
| Net realized gain (loss) |
(6,709,873 | ) | 2,573,809 | (486,060 | ) | 214,610 | ||||||||||||||
| Net change in unrealized appreciation (depreciation) |
38,335,444 | (22,601,872 | ) | 3,660,084 | (2,161,887 | ) | ||||||||||||||
|
|
|
|
|
|
|
|
|
|||||||||||||
| Net increase (decrease) in net assets applicable to Common Shareholders resulting from operations |
48,814,903 | (1,217,223 | ) | 4,673,726 | (264,340 | ) | ||||||||||||||
|
|
|
|
|
|
|
|
|
|||||||||||||
| DISTRIBUTIONS TO COMMON SHAREHOLDERS(a)(b) |
|
|||||||||||||||||||
| Decrease in net assets resulting from distributions to Common Shareholders |
(16,634,680 | ) | (19,231,620 | ) | (1,585,008 | ) | (1,764,066 | ) | ||||||||||||
|
|
|
|
|
|
|
|
|
|||||||||||||
| NET ASSETS APPLICABLE TO COMMON SHAREHOLDERS(b) |
|
|||||||||||||||||||
| Total increase (decrease) in net assets applicable to Common Shareholders |
32,180,223 | (20,448,843 | ) | 3,088,718 | (2,028,406 | ) | ||||||||||||||
| Beginning of year |
444,368,801 | 464,817,644 | 43,084,783 | 45,113,189 | ||||||||||||||||
|
|
|
|
|
|
|
|
|
|||||||||||||
| End of year |
$ | 476,549,024 | $ | 444,368,801 | $ | 46,173,501 | $ | 43,084,783 | ||||||||||||
|
|
|
|
|
|
|
|
|
|||||||||||||
| (a) | Distributions for annual periods determined in accordance with U.S. federal income tax regulations. |
| (b) | Prior year distribution character information and undistributed net investment income has been modified or removed to conform with current year Regulation S-X presentation changes. Refer to Note 11 for this prior year information. |
See notes to financial statements.
| FINANCIAL STATEMENTS | 59 |
Statements of Changes in Net Assets (continued)
| BSE | BFY | |||||||||||||||||||
| Year Ended August 31, | Year Ended August 31, | |||||||||||||||||||
| 2019 | 2018 | 2019 | 2018 | |||||||||||||||||
| INCREASE (DECREASE) IN NET ASSETS APPLICABLE TO COMMON SHAREHOLDERS |
|
|||||||||||||||||||
| OPERATIONS |
|
|||||||||||||||||||
| Net investment income |
$ | 3,274,648 | $ | 3,598,429 | $ | 2,986,527 | $ | 3,202,983 | ||||||||||||
| Net realized gain (loss) |
(1,178,690 | ) | 332,262 | (947,556 | ) | 410,552 | ||||||||||||||
| Net change in unrealized appreciation (depreciation) |
7,545,804 | (4,807,235 | ) | 5,636,326 | (4,024,445 | ) | ||||||||||||||
|
|
|
|
|
|
|
|
|
|||||||||||||
| Net increase (decrease) in net assets applicable to Common Shareholders resulting from operations |
9,641,762 | (876,544 | ) | 7,675,297 | (410,910 | ) | ||||||||||||||
|
|
|
|
|
|
|
|
|
|||||||||||||
| DISTRIBUTIONS TO COMMON SHAREHOLDERS(a)(b) |
|
|||||||||||||||||||
| Decrease in net assets resulting from distributions to Common Shareholders |
(3,168,555 | ) | (3,667,309 | ) | (2,948,084 | ) | (3,303,232 | ) | ||||||||||||
|
|
|
|
|
|
|
|
|
|||||||||||||
| CAPITAL SHARE TRANSACTIONS |
|
|||||||||||||||||||
| Reinvestment of common distributions |
— | — | — | 4,281 | ||||||||||||||||
|
|
|
|
|
|
|
|
|
|||||||||||||
| NET ASSETS APPLICABLE TO COMMON SHAREHOLDERS(b) |
|
|||||||||||||||||||
| Total increase (decrease) in net assets applicable to Common Shareholders |
6,473,207 | (4,543,853 | ) | 4,727,213 | (3,709,861 | ) | ||||||||||||||
| Beginning of year |
93,531,938 | 98,075,791 | 74,931,098 | 78,640,959 | ||||||||||||||||
|
|
|
|
|
|
|
|
|
|||||||||||||
| End of year |
$ | 100,005,145 | $ | 93,531,938 | $ | 79,658,311 | $ | 74,931,098 | ||||||||||||
|
|
|
|
|
|
|
|
|
|||||||||||||
| (a) | Distributions for annual periods determined in accordance with U.S. federal income tax regulations. |
| (b) | Prior year distribution character information and undistributed net investment income has been modified or removed to conform with current year Regulation S-X presentation changes. Refer to Note 11 for this prior year information. |
See notes to financial statements.
| 60 | 2019 BLACKROCK ANNUAL REPORT TO SHAREHOLDERS |
Statements of Changes in Net Assets (continued)
| BHV | ||||||||
| Year Ended August 31, | ||||||||
| 2019 | 2018 | |||||||
| INCREASE (DECREASE) IN NET ASSETS APPLICABLE TO COMMON SHAREHOLDERS |
| |||||||
| OPERATIONS |
| |||||||
| Net investment income |
$ | 930,452 | $ | 1,104,663 | ||||
| Net realized gain (loss) |
(104,620 | ) | 260,327 | |||||
| Net change in unrealized appreciation (depreciation) |
1,298,796 | (1,376,380 | ) | |||||
|
|
|
|
|
|||||
| Net increase (decrease) in net assets applicable to Common Shareholders resulting from operations |
2,124,628 | (11,390 | ) | |||||
|
|
|
|
|
|||||
| DISTRIBUTIONS TO COMMON SHAREHOLDERS(a)(b) |
| |||||||
| Decrease in net assets resulting from distributions to Common Shareholders |
(1,050,654 | ) | (1,245,984 | ) | ||||
|
|
|
|
|
|||||
| CAPITAL SHARE TRANSACTIONS |
| |||||||
| Reinvestment of common distributions |
38,664 | 47,740 | ||||||
|
|
|
|
|
|||||
| NET ASSETS APPLICABLE TO COMMON SHAREHOLDERS(b) |
| |||||||
| Total increase (decrease) in net assets applicable to Common Shareholders |
1,112,638 | (1,209,634 | ) | |||||
| Beginning of year |
24,005,892 | 25,215,526 | ||||||
|
|
|
|
|
|||||
| End of year |
$ | 25,118,530 | $ | 24,005,892 | ||||
|
|
|
|
|
|||||
| (a) | Distributions for annual periods determined in accordance with U.S. federal income tax regulations. |
| (b) | Prior year distribution character information and undistributed net investment income has been modified or removed to conform with current year Regulation S-X presentation changes. Refer to Note 11 for this prior year information. |
See notes to financial statements.
| FINANCIAL STATEMENTS | 61 |
Year Ended August 31, 2019
| BZM | MHE | MHN | BQH | |||||||||||||
| CASH PROVIDED BY (USED FOR) OPERATING ACTIVITIES |
| |||||||||||||||
| Net increase in net assets resulting from operations |
$ | 2,764,967 | $ | 3,124,706 | $ | 48,814,903 | $ | 4,673,726 | ||||||||
| Adjustments to reconcile net increase in net assets resulting from operations to net cash provided by operating activities: |
||||||||||||||||
| Proceeds from sales of long-term investments |
8,068,103 | 5,267,829 | 179,280,301 | 17,756,786 | ||||||||||||
| Purchases of long-term investments |
(7,944,584 | ) | (5,439,067 | ) | (173,672,458 | ) | (19,013,921 | ) | ||||||||
| Net proceeds from sales (purchases) of short-term securities |
(125,389 | ) | 351,647 | 2,340,658 | 278,907 | |||||||||||
| Amortization of premium and accretion of discount on investments and other fees |
279,870 | 299,898 | 4,580,426 | 303,089 | ||||||||||||
| Net realized (gain) loss on investments |
28,357 | (90,649 | ) | 2,169,947 | 12,995 | |||||||||||
| Net unrealized appreciation on investments |
(2,166,252 | ) | (2,203,419 | ) | (38,453,765 | ) | (3,672,861 | ) | ||||||||
| (Increase) Decrease in Assets: |
| |||||||||||||||
| Receivables: |
| |||||||||||||||
| Dividends — affiliated |
(375 | ) | 713 | 2,401 | 356 | |||||||||||
| Interest — unaffiliated |
28,883 | 7,777 | 10,614 | (48,119 | ) | |||||||||||
| Variation margin on futures contracts |
— | (24 | ) | — | — | |||||||||||
| Prepaid expenses |
(19,621 | ) | (19,535 | ) | 595 | (16,035 | ) | |||||||||
| Increase (Decrease) in Liabilities: |
| |||||||||||||||
| Payables: |
| |||||||||||||||
| Interest expense and fees |
1,549 | 6,895 | 10,998 | 16,484 | ||||||||||||
| Investment advisory fees |
806 | 1,321 | 21,329 | 2,148 | ||||||||||||
| Trustees’ and Officer’s fees |
259 | (199 | ) | 1,243 | 41 | |||||||||||
| Other accrued expenses |
20,011 | 26,218 | (2,834 | ) | (1,183 | ) | ||||||||||
| Variation margin on futures contracts |
(94 | ) | (96 | ) | 382 | (179 | ) | |||||||||
|
|
|
|
|
|
|
|
|
|||||||||
| Net cash provided by operating activities |
936,490 | 1,334,015 | 25,104,740 | 292,234 | ||||||||||||
|
|
|
|
|
|
|
|
|
|||||||||
| CASH PROVIDED BY (USED FOR) FINANCING ACTIVITIES |
| |||||||||||||||
| Cash dividends paid to Common Shareholders |
(1,294,878 | ) | (1,242,416 | ) | (16,634,680 | ) | (1,579,408 | ) | ||||||||
| Repayments of TOB Trust Certificates |
— | (670,000 | ) | (21,975,904 | ) | (524,896 | ) | |||||||||
| Proceeds from TOB Trust Certificates |
361,957 | 670,773 | 13,612,215 | 1,822,006 | ||||||||||||
| Amortization of deferred offering costs |
3,037 | 4,081 | 15,442 | 5,837 | ||||||||||||
| Increase in deferred offering costs |
— | (85,914 | ) | — | — | |||||||||||
|
|
|
|
|
|
|
|
|
|||||||||
| Net cash used for financing activities |
(929,884 | ) | (1,323,476 | ) | (24,982,927 | ) | (276,461 | ) | ||||||||
|
|
|
|
|
|
|
|
|
|||||||||
| CASH |
| |||||||||||||||
| Net increase in restricted and unrestricted cash |
$ | 6,606 | $ | 10,539 | $ | 121,813 | $ | 15,773 | ||||||||
| Restricted and unrestricted cash at beginning of year |
34,088 | 31,050 | 357,850 | 35,350 | ||||||||||||
|
|
|
|
|
|
|
|
|
|||||||||
| Restricted and unrestricted cash at end of year |
$ | 40,694 | $ | 41,589 | $ | 479,663 | $ | 51,123 | ||||||||
|
|
|
|
|
|
|
|
|
|||||||||
| SUPPLEMENTAL DISCLOSURE OF CASH FLOW INFORMATION |
| |||||||||||||||
| Cash paid during the year for interest expense |
$ | 346,603 | $ | 497,018 | $ | 7,186,592 | $ | 689,262 | ||||||||
|
|
|
|
|
|
|
|
|
|||||||||
| NON-CASH FINANCING ACTIVITIES |
| |||||||||||||||
| Capital shares issued in reinvestment of distributions paid to Common Shareholders |
$ | 6,379 | $ | — | $ | — | $ | — | ||||||||
|
|
|
|
|
|
|
|
|
|||||||||
| RECONCILIATION OF RESTRICTED AND UNRESTRICTED CASH AT THE END OF YEAR TO THE |
| |||||||||||||||
| Cash |
$ | 9,344 | $ | 9,539 | $ | 109,813 | $ | 11,773 | ||||||||
| Cash pledged: |
| |||||||||||||||
| Futures contracts |
31,350 | 32,050 | 369,850 | 39,350 | ||||||||||||
|
|
|
|
|
|
|
|
|
|||||||||
| $ | 40,694 | $ | 41,589 | $ | 479,663 | $ | 51,123 | |||||||||
|
|
|
|
|
|
|
|
|
|||||||||
| RECONCILIATION OF RESTRICTED AND UNRESTRICTED CASH AT THE BEGINNING OF YEAR TO
THE |
| |||||||||||||||
| Cash |
$ | 738 | $ | — | $ | — | $ | — | ||||||||
| Cash pledged: |
| |||||||||||||||
| Futures contracts |
33,350 | 31,050 | 357,850 | 35,350 | ||||||||||||
|
|
|
|
|
|
|
|
|
|||||||||
| $ | 34,088 | $ | 31,050 | $ | 357,850 | $ | 35,350 | |||||||||
|
|
|
|
|
|
|
|
|
|||||||||
See notes to financial statements.
| 62 | 2019 BLACKROCK ANNUAL REPORT TO SHAREHOLDERS |
Statements of Cash Flows (continued)
Year Ended August 31, 2019
| BSE | BFY | BHV | ||||||||||
| CASH PROVIDED BY (USED FOR) OPERATING ACTIVITIES |
| |||||||||||
| Net increase in net assets resulting from operations |
$ | 9,641,762 | $ | 7,675,297 | $ | 2,124,628 | ||||||
| Adjustments to reconcile net increase in net assets resulting from operations to net cash provided by operating activities: |
||||||||||||
| Proceeds from sales of long-term investments |
36,386,803 | 33,643,035 | 8,826,753 | |||||||||
| Purchases of long-term investments |
(37,563,696 | ) | (33,801,962 | ) | (8,270,088 | ) | ||||||
| Net proceeds from sales (purchases) of short-term securities |
673,165 | (144,546 | ) | (438,720 | ) | |||||||
| Amortization of premium and accretion of discount on investments and other fees |
1,043,094 | 466,957 | 184,941 | |||||||||
| Net realized (gain) loss on investments |
244,717 | 209,834 | (134,398 | ) | ||||||||
| Net unrealized appreciation on investments |
(7,568,590 | ) | (5,655,394 | ) | (1,304,116 | ) | ||||||
| (Increase) Decrease in Assets: |
| |||||||||||
| Receivables: |
| |||||||||||
| Dividends — affiliated |
371 | 64 | (24 | ) | ||||||||
| Interest — unaffiliated |
(17,382 | ) | (30,272 | ) | 41,916 | |||||||
| Variation margin on futures contracts |
— | — | — | |||||||||
| Prepaid expenses |
(834 | ) | (3,871 | ) | (19,753 | ) | ||||||
| Increase (Decrease) in Liabilities: |
| |||||||||||
| Payables: |
| |||||||||||
| Interest expense and fees |
27,316 | 14,033 | 3,693 | |||||||||
| Investment advisory fees |
3,363 | 2,512 | 449 | |||||||||
| Trustees’ and Officer’s fees |
381 | 529 | 201 | |||||||||
| Other accrued expenses |
5,981 | 2,484 | 14,033 | |||||||||
| Variation margin on futures contracts |
(382 | ) | (398 | ) | 148 | |||||||
|
|
|
|
|
|
|
|||||||
| Net cash provided by operating activities |
2,876,069 | 2,378,302 | 1,029,663 | |||||||||
|
|
|
|
|
|
|
|||||||
| CASH PROVIDED BY (USED FOR) FINANCING ACTIVITIES |
| |||||||||||
| Cash dividends paid to Common Shareholders |
(3,168,555 | ) | (2,948,084 | ) | (1,039,942 | ) | ||||||
| Repayments of TOB Trust Certificates |
(1,020,000 | ) | (1,224,731 | ) | (845,917 | ) | ||||||
| Proceeds from TOB Trust Certificates |
1,367,994 | 1,807,994 | 867,746 | |||||||||
| Decrease in bank overdraft |
(109 | ) | — | — | ||||||||
| Amortization of deferred offering costs |
6,251 | 6,332 | 2,583 | |||||||||
|
|
|
|
|
|
|
|||||||
| Net cash used for financing activities |
(2,814,419 | ) | (2,358,489 | ) | (1,015,530 | ) | ||||||
|
|
|
|
|
|
|
|||||||
| CASH |
| |||||||||||
| Net increase in restricted and unrestricted cash |
$ | 61,650 | $ | 19,813 | $ | 14,133 | ||||||
| Restricted and unrestricted cash at beginning of year |
74,300 | 58,400 | 12,950 | |||||||||
|
|
|
|
|
|
|
|||||||
| Restricted and unrestricted cash at end of year |
$ | 135,950 | $ | 78,213 | $ | 27,083 | ||||||
|
|
|
|
|
|
|
|||||||
| SUPPLEMENTAL DISCLOSURE OF CASH FLOW INFORMATION |
| |||||||||||
| Cash paid during the year for interest expense |
$ | 1,453,919 | $ | 1,250,688 | $ | 311,983 | ||||||
|
|
|
|
|
|
|
|||||||
| NON-CASH FINANCING ACTIVITIES |
| |||||||||||
| Capital shares issued in reinvestment of distributions paid to Common Shareholders |
$ | — | $ | — | $ | 38,664 | ||||||
|
|
|
|
|
|
|
|||||||
| RECONCILIATION OF RESTRICTED AND UNRESTRICTED CASH AT THE END OF YEAR TO THE STATEMENTS
OF |
| |||||||||||
| Cash |
$ | 60,650 | $ | 17,813 | $ | 6,133 | ||||||
| Cash pledged: |
| |||||||||||
| Futures contracts |
75,300 | 60,400 | 20,950 | |||||||||
|
|
|
|
|
|
|
|||||||
| $ | 135,950 | $ | 78,213 | $ | 27,083 | |||||||
|
|
|
|
|
|
|
|||||||
| RECONCILIATION OF RESTRICTED AND UNRESTRICTED CASH AT THE BEGINNING OF YEAR TO THE
STATEMENTS |
| |||||||||||
| Cash |
$ | — | $ | — | $ | — | ||||||
| Cash pledged: |
| |||||||||||
| Futures contracts |
74,300 | 58,400 | 12,950 | |||||||||
|
|
|
|
|
|
|
|||||||
| $ | 74,300 | $ | 58,400 | $ | 12,950 | |||||||
|
|
|
|
|
|
|
|||||||
See notes to financial statements.
| FINANCIAL STATEMENTS | 63 |
(For a share outstanding throughout each period)
| BZM | ||||||||||||||||||||
| Year Ended August 31, | ||||||||||||||||||||
| 2019 | 2018 | 2017 | 2016 | 2015 | ||||||||||||||||
| Net asset value, beginning of year |
$ | 14.90 | $ | 15.32 | $ | 15.97 | $ | 14.96 | $ | 15.20 | ||||||||||
|
|
|
|
|
|
|
|
|
|
|
|||||||||||
| Net investment income(a) |
0.48 | 0.55 | 0.59 | 0.61 | 0.63 | |||||||||||||||
| Net realized and unrealized gain (loss) |
0.85 | (0.36 | ) | (0.67 | ) | 1.02 | (0.19 | ) | ||||||||||||
|
|
|
|
|
|
|
|
|
|
|
|||||||||||
| Net increase (decrease) from investment operations |
1.33 | 0.19 | (0.08 | ) | 1.63 | 0.44 | ||||||||||||||
|
|
|
|
|
|
|
|
|
|
|
|||||||||||
| Distributions to Common Shareholders(b) |
||||||||||||||||||||
| From net investment income |
(0.55 | ) | (0.57 | ) | (0.57 | ) | (0.62 | ) | (0.68 | ) | ||||||||||
| From net realized gain |
(0.07 | ) | (0.04 | ) | — | — | — | |||||||||||||
|
|
|
|
|
|
|
|
|
|
|
|||||||||||
| Total distributions to Common Shareholders |
(0.62 | ) | (0.61 | ) | (0.57 | ) | (0.62 | ) | (0.68 | ) | ||||||||||
|
|
|
|
|
|
|
|
|
|
|
|||||||||||
| Net asset value, end of year |
$ | 15.61 | $ | 14.90 | $ | 15.32 | $ | 15.97 | $ | 14.96 | ||||||||||
|
|
|
|
|
|
|
|
|
|
|
|||||||||||
| Market price, end of year |
$ | 14.42 | $ | 14.04 | $ | 14.29 | $ | 16.06 | $ | 14.44 | ||||||||||
|
|
|
|
|
|
|
|
|
|
|
|||||||||||
| Total Return Applicable to Common Shareholders(c) |
||||||||||||||||||||
| Based on net asset value |
9.40 | % | 1.67 | % | (0.31 | )% | 11.15 | % | 3.07 | % | ||||||||||
|
|
|
|
|
|
|
|
|
|
|
|||||||||||
| Based on market price |
7.25 | % | 2.71 | % | (7.53 | )% | 15.80 | % | 3.64 | % | ||||||||||
|
|
|
|
|
|
|
|
|
|
|
|||||||||||
| Ratios to Average Net Assets Applicable to Common Shareholders |
||||||||||||||||||||
| Total expenses |
3.10 | %(d) | 2.75 | % | 2.35 | % | 2.10 | % | 1.96 | % | ||||||||||
|
|
|
|
|
|
|
|
|
|
|
|||||||||||
| Total expenses after fees waived and/or reimbursed and paid indirectly |
3.02 | %(d) | 2.67 | % | 2.27 | % | 2.02 | % | 1.88 | % | ||||||||||
|
|
|
|
|
|
|
|
|
|
|
|||||||||||
| Total expenses after fees waived and/or reimbursed and paid indirectly and excluding interest expense, fees, and amortization of offering costs(e)(f) |
1.88 | %(d) | 1.78 | % | 1.75 | % | 1.83 | % | 1.41 | % | ||||||||||
|
|
|
|
|
|
|
|
|
|
|
|||||||||||
| Net investment income to Common Shareholders |
3.21 | %(d) | 3.63 | % | 3.87 | % | 3.98 | % | 4.19 | % | ||||||||||
|
|
|
|
|
|
|
|
|
|
|
|||||||||||
| Supplemental Data |
||||||||||||||||||||
| Net assets applicable to Common Shareholders, end of year (000) |
$ | 32,501 | $ | 31,008 | $ | 31,893 | $ | 33,202 | $ | 31,073 | ||||||||||
|
|
|
|
|
|
|
|
|
|
|
|||||||||||
| VRDP Shares outstanding at $100,000 liquidation value, end of year (000) |
$ | 16,000 | $ | 16,000 | $ | 16,000 | $ | 16,000 | $ | 16,000 | ||||||||||
|
|
|
|
|
|
|
|
|
|
|
|||||||||||
| Asset coverage per VRDP Shares at $100,000 liquidation value, end of year |
$ | 303,130 | $ | 293,799 | $ | 299,333 | $ | 307,510 | $ | 294,207 | ||||||||||
|
|
|
|
|
|
|
|
|
|
|
|||||||||||
| Borrowings outstanding, end of year (000) |
$ | 2,999 | $ | 2,637 | $ | 2,134 | $ | 1,500 | $ | 1,500 | ||||||||||
|
|
|
|
|
|
|
|
|
|
|
|||||||||||
| Portfolio turnover rate |
16 | % | 16 | % | 12 | % | 11 | % | 18 | % | ||||||||||
|
|
|
|
|
|
|
|
|
|
|
|||||||||||
| (a) | Based on average Common Shares outstanding. |
| (b) | Distributions for annual periods determined in accordance with U.S. federal income tax regulations. |
| (c) | Total returns based on market price, which can be significantly greater or less than the net asset value, may result in substantially different returns. Where applicable, excludes the effects of any sales charges and assumes the reinvestment of distributions at actual reinvestment prices. |
| (d) | Excludes 0.01% of expenses incurred indirectly as a result of investments in underlying funds. |
| (e) | Interest expense, fees, and amortization of offering costs related to TOBs and/or VRDP Shares. See Note 4 and Note 10 of the Notes to Financial Statements for details. |
| (f) | The total expense ratio after fees waived and/or reimbursed and paid indirectly and excluding interest expense, fees, amortization of offering costs, liquidity and remarketing fees were as follows: |
| Year Ended August 31, | ||||||||||||||||||||||||||||||||||||||||
| 2019 | 2018 | 2017 | 2016 | 2015 | ||||||||||||||||||||||||||||||||||||
| Expense ratios |
1.45 | % | 1.38 | % | 1.31 | % | 1.39 | % | 1.33 | % | ||||||||||||||||||||||||||||||
|
|
|
|
|
|
|
|
|
|
|
|||||||||||||||||||||||||||||||
See notes to financial statements.
| 64 | 2019 BLACKROCK ANNUAL REPORT TO SHAREHOLDERS |
Financial Highlights (continued)
(For a share outstanding throughout each period)
| MHE | ||||||||||||||||||||
| Year Ended August 31, | ||||||||||||||||||||
| 2019 | 2018 | 2017 | 2016 | 2015 | ||||||||||||||||
| Net asset value, beginning of year |
$ | 13.33 | $ | 13.98 | $ | 14.69 | $ | 13.89 | $ | 14.02 | ||||||||||
|
|
|
|
|
|
|
|
|
|
|
|||||||||||
| Net investment income(a) |
0.50 | 0.55 | 0.62 | 0.65 | 0.68 | |||||||||||||||
| Net realized and unrealized gain (loss) |
0.82 | (0.62 | ) | (0.69 | ) | 0.83 | (0.10 | ) | ||||||||||||
|
|
|
|
|
|
|
|
|
|
|
|||||||||||
| Net increase (decrease) from investment operations |
1.32 | (0.07 | ) | (0.07 | ) | 1.48 | 0.58 | |||||||||||||
|
|
|
|
|
|
|
|
|
|
|
|||||||||||
| Distributions to Common Shareholders from net investment income(b) |
(0.52 | ) | (0.58 | ) | (0.64 | ) | (0.68 | ) | (0.71 | ) | ||||||||||
|
|
|
|
|
|
|
|
|
|
|
|||||||||||
| Net asset value, end of year |
$ | 14.13 | $ | 13.33 | $ | 13.98 | $ | 14.69 | $ | 13.89 | ||||||||||
|
|
|
|
|
|
|
|
|
|
|
|||||||||||
| Market price, end of year |
$ | 12.96 | $ | 12.38 | $ | 14.00 | $ | 15.32 | $ | 13.26 | ||||||||||
|
|
|
|
|
|
|
|
|
|
|
|||||||||||
| Total Return Applicable to Common Shareholders(c) |
||||||||||||||||||||
| Based on net asset value |
10.52 | % | (0.41 | )% | (0.34 | )% | 11.01 | % | 4.25 | % | ||||||||||
|
|
|
|
|
|
|
|
|
|
|
|||||||||||
| Based on market price |
9.15 | % | (7.64 | )% | (4.30 | )% | 21.27 | % | 1.47 | % | ||||||||||
|
|
|
|
|
|
|
|
|
|
|
|||||||||||
| Ratios to Average Net Assets Applicable to Common Shareholders |
||||||||||||||||||||
| Total expenses |
2.89 | % | 2.50 | % | 2.17 | % | 1.77 | % | 1.71 | % | ||||||||||
|
|
|
|
|
|
|
|
|
|
|
|||||||||||
| Total expenses after fees waived and/or reimbursed and paid indirectly |
2.89 | % | 2.50 | % | 2.17 | % | 1.77 | % | 1.71 | % | ||||||||||
|
|
|
|
|
|
|
|
|
|
|
|||||||||||
| Total expenses after fees waived and/or reimbursed and paid indirectly and excluding interest expense, fees and amortization of offering costs(d) |
1.29 | % | 1.20 | % | 1.18 | % | 1.15 | % | 1.15 | % | ||||||||||
|
|
|
|
|
|
|
|
|
|
|
|||||||||||
| Net investment income to Common Shareholders |
3.74 | % | 4.08 | % | 4.44 | % | 4.53 | % | 4.82 | % | ||||||||||
|
|
|
|
|
|
|
|
|
|
|
|||||||||||
| Supplemental Data |
||||||||||||||||||||
| Net assets applicable to Common Shareholders, end of year (000) |
$ | 33,501 | $ | 31,609 | $ | 33,115 | $ | 34,772 | $ | 32,864 | ||||||||||
|
|
|
|
|
|
|
|
|
|
|
|||||||||||
| VRDP Shares outstanding at $100,000 liquidation value, end of year (000) |
$ | 18,500 | $ | 18,500 | $ | 18,500 | $ | 18,500 | $ | 18,500 | ||||||||||
|
|
|
|
|
|
|
|
|
|
|
|||||||||||
| Asset coverage per VRDP Shares at $100,000 liquidation value, end of year |
$ | 281,087 | $ | 270,862 | $ | 279,002 | $ | 287,959 | $ | 277,646 | ||||||||||
|
|
|
|
|
|
|
|
|
|
|
|||||||||||
| Borrowings outstanding, end of year (000) |
$ | 3,137 | $ | 3,136 | $ | 1,421 | $ | 751 | $ | — | ||||||||||
|
|
|
|
|
|
|
|
|
|
|
|||||||||||
| Portfolio turnover rate |
10 | % | 17 | % | 18 | % | 30 | % | 8 | % | ||||||||||
|
|
|
|
|
|
|
|
|
|
|
|||||||||||
| (a) | Based on average Common Shares outstanding. |
| (b) | Distributions for annual periods determined in accordance with U.S. federal income tax regulations. |
| (c) | Total returns based on market price, which can be significantly greater or less than the net asset value, may result in substantially different returns. Where applicable, excludes the effects of any sales charges and assumes the reinvestment of distributions at actual reinvestment prices. |
| (d) | Interest expense, fees and amortization of offering costs related to TOB Trusts and/or VMTP Shares. See Note 4 and Note 10 of the Notes to Financial Statements for details. |
See notes to financial statements.
| FINANCIAL HIGHLIGHTS | 65 |
Financial Highlights (continued)
(For a share outstanding throughout each period)
| MHN | ||||||||||||||||||||
| Year Ended August 31, | ||||||||||||||||||||
| 2019 | 2018 | 2017 | 2016 | 2015 | ||||||||||||||||
| Net asset value, beginning of year |
$ | 14.27 | $ | 14.93 | $ | 15.69 | $ | 14.81 | $ | 14.98 | ||||||||||
|
|
|
|
|
|
|
|
|
|
|
|||||||||||
| Net investment income(a) |
0.55 | 0.60 | 0.69 | 0.75 | 0.80 | |||||||||||||||
| Net realized and unrealized gain (loss) |
1.02 | (0.64 | ) | (0.75 | ) | 0.91 | (0.15 | ) | ||||||||||||
|
|
|
|
|
|
|
|
|
|
|
|||||||||||
| Net increase (decrease) from investment operations |
1.57 | (0.04 | ) | (0.06 | ) | 1.66 | 0.65 | |||||||||||||
|
|
|
|
|
|
|
|
|
|
|
|||||||||||
| Distributions to Common Shareholders from net investment income(b) |
(0.53 | ) | (0.62 | ) | (0.70 | ) | (0.78 | ) | (0.82 | ) | ||||||||||
|
|
|
|
|
|
|
|
|
|
|
|||||||||||
| Net asset value, end of year |
$ | 15.31 | $ | 14.27 | $ | 14.93 | $ | 15.69 | $ | 14.81 | ||||||||||
|
|
|
|
|
|
|
|
|
|
|
|||||||||||
| Market price, end of year |
$ | 13.74 | $ | 12.35 | $ | 14.36 | $ | 15.04 | $ | 13.65 | ||||||||||
|
|
|
|
|
|
|
|
|
|
|
|||||||||||
| Total Return Applicable to Common Shareholders(c) |
| |||||||||||||||||||
| Based on net asset value |
11.88 | % | 0.22 | % | 0.04 | % | 11.63 | % | 4.88 | % | ||||||||||
|
|
|
|
|
|
|
|
|
|
|
|||||||||||
| Based on market price |
16.02 | % | (9.82 | )% | 0.37 | % | 16.10 | % | 6.16 | % | ||||||||||
|
|
|
|
|
|
|
|
|
|
|
|||||||||||
| Ratios to Average Net Assets Applicable to Common Shareholders |
| |||||||||||||||||||
| Total expenses |
2.62 | % | 2.45 | % | 2.13 | % | 1.68 | % | 1.58 | % | ||||||||||
|
|
|
|
|
|
|
|
|
|
|
|||||||||||
| Total expenses after fees waived and/or reimbursed and paid indirectly |
2.55 | % | 2.36 | % | 2.05 | % | 1.62 | % | 1.52 | % | ||||||||||
|
|
|
|
|
|
|
|
|
|
|
|||||||||||
| Total expenses after fees waived and/or reimbursed and paid indirectly and excluding interest expense, fees and amortization of offering costs(d)(e) |
0.94 | % | 0.94 | % | 0.96 | % | 0.95 | % | 0.95 | % | ||||||||||
|
|
|
|
|
|
|
|
|
|
|
|||||||||||
| Net investment income to Common Shareholders |
3.82 | % | 4.15 | % | 4.65 | % | 4.91 | % | 5.35 | % | ||||||||||
|
|
|
|
|
|
|
|
|
|
|
|||||||||||
| Supplemental Data |
| |||||||||||||||||||
| Net assets applicable to Common Shareholders, end of year (000) |
$ | 476,549 | $ | 444,369 | $ | 464,818 | $ | 488,318 | $ | 461,159 | ||||||||||
|
|
|
|
|
|
|
|
|
|
|
|||||||||||
| VRDP Shares outstanding at $100,000 liquidation value, end of year (000) |
$ | 243,600 | $ | 243,600 | $ | 243,600 | $ | 243,600 | $ | 243,600 | ||||||||||
|
|
|
|
|
|
|
|
|
|
|
|||||||||||
| Asset coverage per VRDP Shares at $100,000 liquidation value, end of year |
$ | 295,628 | $ | 282,417 | $ | 290,812 | $ | 300,459 | $ | 289,310 | ||||||||||
|
|
|
|
|
|
|
|
|
|
|
|||||||||||
| Borrowings outstanding, end of year (000) |
$ | 55,899 | $ | 64,262 | $ | 70,007 | $ | 76,443 | $ | 53,308 | ||||||||||
|
|
|
|
|
|
|
|
|
|
|
|||||||||||
| Portfolio turnover rate |
23 | % | 15 | % | 17 | % | 13 | % | 19 | % | ||||||||||
|
|
|
|
|
|
|
|
|
|
|
|||||||||||
| (a) | Based on average Common Shares outstanding. |
| (b) | Distributions for annual periods determined in accordance with U.S. federal income tax regulations. |
| (c) | Total returns based on market price, which can be significantly greater or less than the net asset value, may result in substantially different returns. Where applicable, excludes the effects of any sales charges and assumes the reinvestment of distributions at actual reinvestment prices. |
| (d) | Interest expense, fees and amortization of offering costs related to TOB Trusts and/or VRDP Shares. See Note 4 and Note 10 of the Notes to Financial Statements for details. |
| (e) | The total expense ratio after fees waived and/or reimbursed and paid indirectly and excluding interest expense, fees, amortization of offering costs, liquidity and remarketing fees were as follows: |
| Year Ended August 31, | ||||||||||||||||||||||||||||||||||||||||
| 2019 | 2018 | 2017 | 2016 | 2015 | ||||||||||||||||||||||||||||||||||||
| Expense ratios |
0.93 | % | 0.94 | % | 0.95 | % | 0.94 | % | 0.94 | % | ||||||||||||||||||||||||||||||
|
|
|
|
|
|
|
|
|
|
|
|||||||||||||||||||||||||||||||
See notes to financial statements.
| 66 | 2019 BLACKROCK ANNUAL REPORT TO SHAREHOLDERS |
Financial Highlights (continued)
(For a share outstanding throughout each period)
| BQH | ||||||||||||||||||||
| Year Ended August 31, | ||||||||||||||||||||
| 2019 | 2018 | 2017 | 2016 | 2015 | ||||||||||||||||
| Net asset value, beginning of year |
$ | 15.39 | $ | 16.11 | $ | 16.99 | $ | 15.75 | $ | 15.77 | ||||||||||
|
|
|
|
|
|
|
|
|
|
|
|||||||||||
| Net investment income(a) |
0.54 | 0.60 | 0.67 | 0.71 | 0.74 | |||||||||||||||
| Net realized and unrealized gain (loss) |
1.13 | (0.69 | ) | (0.84 | ) | 1.27 | 0.03 | |||||||||||||
|
|
|
|
|
|
|
|
|
|
|
|||||||||||
| Net increase (decrease) from investment operations |
1.67 | (0.09 | ) | (0.17 | ) | 1.98 | 0.77 | |||||||||||||
|
|
|
|
|
|
|
|
|
|
|
|||||||||||
| Distributions to Common Shareholders from net investment income(b) |
(0.57 | ) | (0.63 | ) | (0.71 | ) | (0.74 | ) | (0.79 | ) | ||||||||||
|
|
|
|
|
|
|
|
|
|
|
|||||||||||
| Net asset value, end of year |
$ | 16.49 | $ | 15.39 | $ | 16.11 | $ | 16.99 | $ | 15.75 | ||||||||||
|
|
|
|
|
|
|
|
|
|
|
|||||||||||
| Market price, end of year |
$ | 14.94 | $ | 13.01 | $ | 14.55 | $ | 15.70 | $ | 13.66 | ||||||||||
|
|
|
|
|
|
|
|
|
|
|
|||||||||||
| Total Return Applicable to Common Shareholders(c) |
| |||||||||||||||||||
| Based on net asset value |
11.61 | % | (0.03 | )% | (0.47 | )% | 13.22 | % | 5.57 | % | ||||||||||
|
|
|
|
|
|
|
|
|
|
|
|||||||||||
| Based on market price |
19.61 | % | (6.44 | )% | (2.73 | )% | 20.63 | % | 4.18 | % | ||||||||||
|
|
|
|
|
|
|
|
|
|
|
|||||||||||
| Ratios to Average Net Assets Applicable to Common Shareholders |
| |||||||||||||||||||
| Total expenses |
3.53 | % | 2.78 | % | 2.44 | % | 2.10 | % | 2.08 | % | ||||||||||
|
|
|
|
|
|
|
|
|
|
|
|||||||||||
| Total expenses after fees waived and/or reimbursed and paid indirectly |
3.19 | % | 2.61 | % | 2.28 | % | 2.07 | % | 2.07 | % | ||||||||||
|
|
|
|
|
|
|
|
|
|
|
|||||||||||
| Total expenses after fees waived and/or reimbursed and paid indirectly and excluding interest expense, fees and amortization of offering costs(d)(e) |
1.55 | % | 1.26 | % | 1.24 | % | 1.48 | % | 1.91 | % | ||||||||||
|
|
|
|
|
|
|
|
|
|
|
|||||||||||
| Net investment income to Common Shareholders |
3.45 | % | 3.84 | % | 4.21 | % | 4.31 | % | 4.68 | % | ||||||||||
|
|
|
|
|
|
|
|
|
|
|
|||||||||||
| Supplemental Data |
| |||||||||||||||||||
| Net assets applicable to Common Shareholders, end of year (000) |
$ | 46,174 | $ | 43,085 | $ | 45,113 | $ | 47,581 | $ | 44,111 | ||||||||||
|
|
|
|
|
|
|
|
|
|
|
|||||||||||
| VRDP Shares outstanding at $100,000 liquidation value, end of year (000) |
$ | 22,100 | $ | 22,100 | $ | 22,100 | $ | 22,100 | $ | 22,100 | ||||||||||
|
|
|
|
|
|
|
|
|
|
|
|||||||||||
| Asset coverage per VRDP Shares at $100,000 liquidation value, end of year |
$ | 308,930 | $ | 294,954 | $ | 304,132 | $ | 315,300 | $ | 299,597 | ||||||||||
|
|
|
|
|
|
|
|
|
|
|
|||||||||||
| Borrowings outstanding, end of year (000) |
$ | 7,857 | $ | 6,560 | $ | 6,521 | $ | 6,381 | $ | 5,070 | ||||||||||
|
|
|
|
|
|
|
|
|
|
|
|||||||||||
| Portfolio turnover rate |
24 | % | 11 | % | 17 | % | 13 | % | 22 | % | ||||||||||
|
|
|
|
|
|
|
|
|
|
|
|||||||||||
| (a) | Based on average Common Shares outstanding. |
| (b) | Distributions for annual periods determined in accordance with U.S. federal income tax regulations. |
| (c) | Total returns based on market price, which can be significantly greater or less than the net asset value, may result in substantially different returns. Where applicable, excludes the effects of any sales charges and assumes the reinvestment of distributions at actual reinvestment prices. |
| (d) | Interest expense, fees and amortization of offering costs related to TOBs and/or VRDP Shares. See Note 4 and Note 10 of the Notes to Financial Statements for details. |
| (e) | The total expense ratio after fees waived and/or reimbursed and paid indirectly and excluding interest expense, fees, amortization of offering costs, liquidity and remarketing fees were as follows: |
| Year Ended August 31, | ||||||||||||||||||||||||||||||||||||||||
| 2019 | 2018 | 2017 | 2016 | 2015 | ||||||||||||||||||||||||||||||||||||
| Expense ratios |
1.55 | % | 1.26 | % | 1.24 | % | 1.41 | % | 1.41 | % | ||||||||||||||||||||||||||||||
|
|
|
|
|
|
|
|
|
|
|
|||||||||||||||||||||||||||||||
See notes to financial statements.
| FINANCIAL HIGHLIGHTS | 67 |
Financial Highlights (continued)
(For a share outstanding throughout each period)
| BSE | ||||||||||||||||||||
| Year Ended August 31, | ||||||||||||||||||||
| 2019 | 2018 | 2017 | 2016 | 2015 | ||||||||||||||||
| Net asset value, beginning of year |
$ | 14.35 | $ | 15.04 | $ | 15.84 | $ | 14.81 | $ | 14.92 | ||||||||||
|
|
|
|
|
|
|
|
|
|
|
|||||||||||
| Net investment income(a) |
0.50 | 0.55 | 0.63 | 0.68 | 0.70 | |||||||||||||||
| Net realized and unrealized gain (loss) |
0.98 | (0.68 | ) | (0.80 | ) | 1.03 | (0.08 | ) | ||||||||||||
|
|
|
|
|
|
|
|
|
|
|
|||||||||||
| Net increase (decrease) from investment operations |
1.48 | (0.13 | ) | (0.17 | ) | 1.71 | 0.62 | |||||||||||||
|
|
|
|
|
|
|
|
|
|
|
|||||||||||
| Distributions to Common Shareholders from net investment income(b) |
(0.49 | ) | (0.56 | ) | (0.63 | ) | (0.68 | ) | (0.73 | ) | ||||||||||
|
|
|
|
|
|
|
|
|
|
|
|||||||||||
| Net asset value, end of year |
$ | 15.34 | $ | 14.35 | $ | 15.04 | $ | 15.84 | $ | 14.81 | ||||||||||
|
|
|
|
|
|
|
|
|
|
|
|||||||||||
| Market price, end of year |
$ | 13.86 | $ | 12.65 | $ | 13.55 | $ | 14.84 | $ | 12.99 | ||||||||||
|
|
|
|
|
|
|
|
|
|
|
|||||||||||
| Total Return Applicable to Common Shareholders(c) |
||||||||||||||||||||
| Based on net asset value |
11.02 | % | (0.33 | )% | (0.55 | )% | 12.22 | % | 4.88 | % | ||||||||||
|
|
|
|
|
|
|
|
|
|
|
|||||||||||
| Based on market price |
13.79 | % | (2.47 | )% | (4.36 | )% | 19.87 | % | 4.29 | % | ||||||||||
|
|
|
|
|
|
|
|
|
|
|
|||||||||||
| Ratios to Average Net Assets Applicable to Common Shareholders |
||||||||||||||||||||
| Total expenses |
2.75 | % | 2.41 | % | 2.10 | % | 1.76 | % | 1.70 | % | ||||||||||
|
|
|
|
|
|
|
|
|
|
|
|||||||||||
| Total expenses after fees waived and/or reimbursed and paid indirectly |
2.75 | % | 2.41 | % | 2.09 | % | 1.75 | % | 1.70 | % | ||||||||||
|
|
|
|
|
|
|
|
|
|
|
|||||||||||
| Total expenses after fees waived and/or reimbursed and paid indirectly and excluding interest expense fees, and amortization of offering costs(d)(e) |
1.17 | % | 1.10 | % | 1.10 | % | 1.17 | % | 1.51 | % | ||||||||||
|
|
|
|
|
|
|
|
|
|
|
|||||||||||
| Net investment income to Common Shareholders |
3.46 | % | 3.77 | % | 4.23 | % | 4.40 | % | 4.72 | % | ||||||||||
|
|
|
|
|
|
|
|
|
|
|
|||||||||||
| Supplemental Data |
||||||||||||||||||||
| Net assets applicable to Common Shareholders, end of year (000) |
$ | 100,005 | $ | 93,532 | $ | 98,076 | $ | 103,296 | $ | 96,587 | ||||||||||
|
|
|
|
|
|
|
|
|
|
|
|||||||||||
| VRDP Shares outstanding at $100,000 liquidation value, end of year (000) |
$ | 40,500 | $ | 40,500 | $ | 40,500 | $ | 40,500 | $ | 40,500 | ||||||||||
|
|
|
|
|
|
|
|
|
|
|
|||||||||||
| Asset coverage per VRDP Shares at $100,000 liquidation value, end of year |
$ | 346,926 | $ | 330,943 | $ | 342,162 | $ | 355,052 | $ | 338,486 | ||||||||||
|
|
|
|
|
|
|
|
|
|
|
|||||||||||
| Borrowings outstanding, end of year (000) |
$ | 22,050 | $ | 21,702 | $ | 20,604 | $ | 21,873 | $ | 18,091 | ||||||||||
|
|
|
|
|
|
|
|
|
|
|
|||||||||||
| Portfolio turnover rate |
24 | % | 16 | % | 13 | % | 8 | % | 20 | % | ||||||||||
|
|
|
|
|
|
|
|
|
|
|
|||||||||||
| (a) | Based on average Common Shares outstanding. |
| (b) | Distributions for annual periods determined in accordance with U.S. federal income tax regulations. |
| (c) | Total returns based on market price, which can be significantly greater or less than the net asset value, may result in substantially different returns. Where applicable, excludes the effects of any sales charges and assumes the reinvestment of distributions at actual reinvestment prices. |
| (d) | Interest expense, fees and amortization of offering costs related to TOBs and/or VRDP Shares. See Note 4 and Note 10 of the Notes to Financial Statements for details. |
| (e) | The total expense ratio after fees waived and/or reimbursed and paid indirectly and excluding interest expense, fees, amortization of offering costs, liquidity and remarketing fees were as follows: |
| Year Ended August 31, | ||||||||||||||||||||||||||||||||||||||||
| 2019 | 2018 | 2017 | 2016 | 2015 | ||||||||||||||||||||||||||||||||||||
| Expense ratios |
1.17 | % | 1.10 | % | 1.10 | % | 1.12 | % | 1.09 | % | ||||||||||||||||||||||||||||||
|
|
|
|
|
|
|
|
|
|
|
|||||||||||||||||||||||||||||||
See notes to financial statements.
| 68 | 2019 BLACKROCK ANNUAL REPORT TO SHAREHOLDERS |
Financial Highlights (continued)
(For a share outstanding throughout each period)
| BFY | ||||||||||||||||||||
| Year Ended August 31, | ||||||||||||||||||||
| 2019 | 2018 | 2017 | 2016 | 2015 | ||||||||||||||||
| Net asset value, beginning of year |
$ | 14.97 | $ | 15.71 | $ | 16.58 | $ | 15.57 | $ | 15.66 | ||||||||||
|
|
|
|
|
|
|
|
|
|
|
|||||||||||
| Net investment income(a) |
0.60 | 0.64 | 0.71 | 0.78 | 0.82 | |||||||||||||||
| Net realized and unrealized gain (loss) |
0.94 | (0.72 | ) | (0.82 | ) | 1.06 | (0.07 | ) | ||||||||||||
|
|
|
|
|
|
|
|
|
|
|
|||||||||||
| Net increase (decrease) from investment operations |
1.54 | (0.08 | ) | (0.11 | ) | 1.84 | 0.75 | |||||||||||||
|
|
|
|
|
|
|
|
|
|
|
|||||||||||
| Distributions to Common Shareholders from net investment income(b) |
(0.59 | ) | (0.66 | ) | (0.76 | ) | (0.83 | ) | (0.84 | ) | ||||||||||
|
|
|
|
|
|
|
|
|
|
|
|||||||||||
| Net asset value, end of year |
$ | 15.92 | $ | 14.97 | $ | 15.71 | $ | 16.58 | $ | 15.57 | ||||||||||
|
|
|
|
|
|
|
|
|
|
|
|||||||||||
| Market price, end of year |
$ | 14.21 | $ | 12.77 | $ | 15.51 | $ | 17.01 | $ | 14.16 | ||||||||||
|
|
|
|
|
|
|
|
|
|
|
|||||||||||
| Total Return Applicable to Common Shareholders(c) |
||||||||||||||||||||
| Based on net asset value |
11.14 | % | (0.08 | )% | (0.37 | )% | 12.24 | % | 5.33 | % | ||||||||||
|
|
|
|
|
|
|
|
|
|
|
|||||||||||
| Based on market price |
16.29 | % | (13.66 | )% | (4.13 | )% | 26.61 | % | 7.00 | % | ||||||||||
|
|
|
|
|
|
|
|
|
|
|
|||||||||||
| Ratios to Average Net Assets Applicable to Common Shareholders |
||||||||||||||||||||
| Total expenses |
2.91 | % | 2.57 | % | 2.21 | % | 1.86 | % | 1.83 | % | ||||||||||
|
|
|
|
|
|
|
|
|
|
|
|||||||||||
| Total expenses after fees waived and/or reimbursed and paid indirectly |
2.91 | % | 2.56 | % | 2.21 | % | 1.85 | % | 1.83 | % | ||||||||||
|
|
|
|
|
|
|
|
|
|
|
|||||||||||
| Total expenses after fees waived and/or reimbursed and paid indirectly and excluding interest expense, fees, and amortization of offering costs(d)(e) |
1.22 | % | 1.13 | % | 1.12 | % | 1.23 | % | 1.69 | % | ||||||||||
|
|
|
|
|
|
|
|
|
|
|
|||||||||||
| Net investment income to Common Shareholders |
3.96 | % | 4.20 | % | 4.60 | % | 4.83 | % | 5.25 | % | ||||||||||
|
|
|
|
|
|
|
|
|
|
|
|||||||||||
| Supplemental Data |
||||||||||||||||||||
| Net assets applicable to Common Shareholders, end of year (000) |
$ | 79,658 | $ | 74,931 | $ | 78,641 | $ | 82,927 | $ | 77,854 | ||||||||||
|
|
|
|
|
|
|
|
|
|
|
|||||||||||
| VRDP Shares outstanding at $100,000 liquidation value, end of year (000) |
$ | 44,400 | $ | 44,400 | $ | 44,400 | $ | 44,400 | $ | 44,400 | ||||||||||
|
|
|
|
|
|
|
|
|
|
|
|||||||||||
| Asset coverage per VRDP Shares at $100,000 liquidation value, end of year |
$ | 279,411 | $ | 268,764 | $ | 277,119 | $ | 286,771 | $ | 275,347 | ||||||||||
|
|
|
|
|
|
|
|
|
|
|
|||||||||||
| Borrowings outstanding, end of year (000) |
$ | 8,059 | $ | 7,475 | $ | 7,817 | $ | 8,061 | $ | 5,895 | ||||||||||
|
|
|
|
|
|
|
|
|
|
|
|||||||||||
| Portfolio turnover rate |
26 | % | 12 | % | 14 | % | 17 | % | 20 | % | ||||||||||
|
|
|
|
|
|
|
|
|
|
|
|||||||||||
| (a) | Based on average Common Shares outstanding. |
| (b) | Distributions for annual periods determined in accordance with U.S. federal income tax regulations. |
| (c) | Total returns based on market price, which can be significantly greater or less than the net asset value, may result in substantially different returns. Where applicable, excludes the effects of any sales charges and assumes the reinvestment of distributions at actual reinvestment prices. |
| (d) | Interest expense, fees and amortization of offering costs related to TOBs and/or VRDP Shares. See Note 4 and Note 10 of the Notes to Financial Statements for details. |
| (e) | The total expense ratio after fees waived and/or reimbursed and paid indirectly and excluding interest expense, fees, amortization of offering costs, liquidity and remarketing fees were as follows: |
| Year Ended August 31, | ||||||||||||||||||||||||||||||||||||||||
| 2019 | 2018 | 2017 | 2016 | 2015 | ||||||||||||||||||||||||||||||||||||
| Expense ratios |
1.22 | % | 1.13 | % | 1.12 | % | 1.16 | % | 1.13 | % | ||||||||||||||||||||||||||||||
|
|
|
|
|
|
|
|
|
|
|
|||||||||||||||||||||||||||||||
See notes to financial statements.
| FINANCIAL HIGHLIGHTS | 69 |
Financial Highlights (continued)
(For a share outstanding throughout each period)
| BHV | ||||||||||||||||||||
| Year Ended August 31, | ||||||||||||||||||||
| 2019 | 2018 | 2017 | 2016 | 2015 | ||||||||||||||||
| Net asset value, beginning of year |
$ | 14.97 | $ | 15.75 | $ | 16.56 | $ | 15.90 | $ | 15.95 | ||||||||||
|
|
|
|
|
|
|
|
|
|
|
|||||||||||
| Net investment income(a) |
0.58 | 0.69 | 0.78 | 0.81 | 0.81 | |||||||||||||||
| Net realized and unrealized gain (loss) |
0.74 | (0.69 | ) | (0.83 | ) | 0.66 | (0.01 | ) | ||||||||||||
|
|
|
|
|
|
|
|
|
|
|
|||||||||||
| Net increase (decrease) from investment operations |
1.32 | — | (0.05 | ) | 1.47 | 0.80 | ||||||||||||||
|
|
|
|
|
|
|
|
|
|
|
|||||||||||
| Distributions to Common Shareholders from net investment income(b) |
(0.65 | ) | (0.78 | ) | (0.76 | ) | (0.81 | ) | (0.85 | ) | ||||||||||
|
|
|
|
|
|
|
|
|
|
|
|||||||||||
| Net asset value, end of year |
$ | 15.64 | $ | 14.97 | $ | 15.75 | $ | 16.56 | $ | 15.90 | ||||||||||
|
|
|
|
|
|
|
|
|
|
|
|||||||||||
| Market price, end of year |
$ | 16.54 | $ | 16.56 | $ | 18.68 | $ | 19.14 | $ | 16.70 | ||||||||||
|
|
|
|
|
|
|
|
|
|
|
|||||||||||
| Total Return Applicable to Common Shareholders(c) |
||||||||||||||||||||
| Based on net asset value |
8.94 | % | (0.20 | )% | (0.44 | )% | 9.05 | % | 5.02 | % | ||||||||||
|
|
|
|
|
|
|
|
|
|
|
|||||||||||
| Based on market price |
4.15 | % | (6.91 | )% | 2.17 | % | 20.00 | % | 7.61 | % | ||||||||||
|
|
|
|
|
|
|
|
|
|
|
|||||||||||
| Ratios to Average Net Assets Applicable to Common Shareholders |
||||||||||||||||||||
| Total expenses |
3.37 | % | 2.94 | % | 2.46 | % | 2.16 | % | 1.98 | % | ||||||||||
|
|
|
|
|
|
|
|
|
|
|
|||||||||||
| Total expenses after fees waived and/or reimbursed and paid indirectly |
3.15 | % | 2.72 | % | 2.25 | % | 1.95 | % | 1.77 | % | ||||||||||
|
|
|
|
|
|
|
|
|
|
|
|||||||||||
| Total expenses after fees waived and/or reimbursed and paid indirectly and excluding interest expense, fees and amortization of offering costs(d)(e) |
1.82 | % | 1.70 | % | 1.61 | % | 1.70 | % | 1.30 | % | ||||||||||
|
|
|
|
|
|
|
|
|
|
|
|||||||||||
| Net investment income to Common Shareholders |
3.88 | % | 4.51 | % | 4.95 | % | 5.00 | % | 5.08 | % | ||||||||||
|
|
|
|
|
|
|
|
|
|
|
|||||||||||
| Supplemental Data |
||||||||||||||||||||
| Net assets applicable to Common Shareholders, end of year (000) |
$ | 25,119 | $ | 24,006 | $ | 25,216 | $ | 26,462 | $ | 25,336 | ||||||||||
|
|
|
|
|
|
|
|
|
|
|
|||||||||||
| VRDP Shares outstanding at $100,000 liquidation value, end of year (000) |
$ | 11,600 | $ | 11,600 | $ | 11,600 | $ | 11,600 | $ | 11,600 | ||||||||||
|
|
|
|
|
|
|
|
|
|
|
|||||||||||
| Asset coverage per VRDP Shares at $100,000 liquidation value, end of year |
$ | 316,539 | $ | 306,947 | $ | 317,375 | $ | 328,121 | $ | 318,414 | ||||||||||
|
|
|
|
|
|
|
|
|
|
|
|||||||||||
| Borrowings outstanding, end of year (000) |
$ | 5,396 | $ | 5,396 | $ | 4,360 | $ | 3,860 | $ | 3,019 | ||||||||||
|
|
|
|
|
|
|
|
|
|
|
|||||||||||
| Portfolio turnover rate |
17 | % | 26 | % | 10 | % | 6 | % | 9 | % | ||||||||||
|
|
|
|
|
|
|
|
|
|
|
|||||||||||
| (a) | Based on average Common Shares outstanding. |
| (b) | Distributions for annual periods determined in accordance with U.S. federal income tax regulations. |
| (c) | Total returns based on market price, which can be significantly greater or less than the net asset value, may result in substantially different returns. Where applicable, excludes the effects of any sales charges and assumes the reinvestment of distributions at actual reinvestment prices. |
| (d) | Interest expense, fees and amortization of offering costs related to TOB Trusts and/or VRDP Shares. See Note 4 and Note 10 of the Notes to Financial Statements for details. |
| (e) | The total expense ratio after fees waived and/or reimbursed and paid indirectly and excluding interest expense, fees, amortization of offering costs, liquidity and remarketing fees were as follows: |
| Year Ended August 31, | ||||||||||||||||||||||||||||||||||||||||
| 2019 | 2018 | 2017 | 2016 | 2015 | ||||||||||||||||||||||||||||||||||||
| Expense ratios |
1.42 | % | 1.32 | % | 1.22 | % | 1.30 | % | 1.23 | % | ||||||||||||||||||||||||||||||
|
|
|
|
|
|
|
|
|
|
|
|||||||||||||||||||||||||||||||
See notes to financial statements.
| 70 | 2019 BLACKROCK ANNUAL REPORT TO SHAREHOLDERS |
| 1. | ORGANIZATION |
The following are registered under the Investment Company Act of 1940, as amended (the “1940 Act”), as closed-end management investment companies and are referred to herein collectively as the “Trusts”, or individually as a “Trust”:
| Trust Name | Herein Referred To As | Organized | Diversification Classification | |||
| BlackRock Maryland Municipal Bond Trust |
BZM | Delaware | Non-diversified | |||
| BlackRock Massachusetts Tax-Exempt Trust |
MHE | Massachusetts | Non-diversified | |||
| BlackRock MuniHoldings New York Quality Fund, Inc. |
MHN | Maryland | Non-diversified | |||
| BlackRock New York Municipal Bond Trust |
BQH | Delaware | Diversified | |||
| BlackRock New York Municipal Income Quality Trust |
BSE | Delaware | Non-diversified | |||
| BlackRock New York Municipal Income Trust II |
BFY | Delaware | Non-diversified | |||
| BlackRock Virginia Municipal Bond Trust |
BHV | Delaware | Non-diversified |
The Boards of Directors and Boards of Trustees of the Trusts are collectively referred to throughout this report as the “Board of Trustees” or the “Board,” and the trustees thereof are collectively referred to throughout this report as “Trustees”. The Trusts determine and make available for publication the net asset values (“NAVs”) of their Common Shares on a daily basis.
The Trusts, together with certain other registered investment companies advised by BlackRock Advisors, LLC (the “Manager”) or its affiliates, are included in a complex of open-end non-index fixed-income mutual funds and all BlackRock-advised closed-end funds referred to as the BlackRock Fixed-Income Complex.
| 2. | SIGNIFICANT ACCOUNTING POLICIES |
The financial statements are prepared in conformity with accounting principles generally accepted in the United States of America (“U.S. GAAP”), which may require management to make estimates and assumptions that affect the reported amounts of assets and liabilities in the financial statements, disclosure of contingent assets and liabilities at the date of the financial statements and the reported amounts of increases and decreases in net assets from operations during the reporting period. Actual results could differ from those estimates. Each Trust is considered an investment company under U.S. GAAP and follows the accounting and reporting guidance applicable to investment companies. Below is a summary of significant accounting policies:
Investment Transactions and Income Recognition: For financial reporting purposes, investment transactions are recorded on the dates the transactions are executed. Realized gains and losses on investment transactions are determined on the identified cost basis. Dividend income is recorded on the ex-dividend date. Interest income, including amortization and accretion of premiums and discounts on debt securities, is recognized on an accrual basis.
Segregation and Collateralization: In cases where a Trust enters into certain investments (e.g., futures contracts) or certain borrowings (e.g.,TOB Trust transactions) that would be treated as “senior securities” for 1940 Act purposes, a Trust may segregate or designate on its books and records cash or liquid assets having a market value at least equal to the amount of its future obligations under such investments or borrowings. Doing so allows the investment or borrowings to be excluded from treatment as a “senior security.” Furthermore, if required by an exchange or counterparty agreement, the Trusts may be required to deliver/deposit cash and/or securities to/with an exchange, or broker-dealer or custodian as collateral for certain investments or obligations.
Distributions: Distributions from net investment income are declared and paid monthly. Distributions of capital gains are recorded on the ex-dividend date and made at least annually. The character and timing of distributions are determined in accordance with U.S. federal income tax regulations, which may differ from U.S. GAAP.
Distributions to Preferred Shareholders are accrued and determined as described in Note 10.
Deferred Compensation Plan: Under the Deferred Compensation Plan (the “Plan”) approved by each Trust’s Board, the trustees who are not “interested persons” of the Trusts, as defined in the 1940 Act (“Independent Trustees”), may defer a portion of their annual complex-wide compensation. Deferred amounts earn an approximate return as though equivalent dollar amounts had been invested in common shares of certain funds in the BlackRock Fixed-Income Complex selected by the Independent Trustees. This has the same economic effect for the Independent Trustees as if the Independent Trustees had invested the deferred amounts directly in certain funds in the BlackRock Fixed-Income Complex.
The Plan is not funded and obligations thereunder represent general unsecured claims against the general assets of each Trust, as applicable. Deferred compensation liabilities are included in the Trustees’ and Officer’s fees payable in the Statements of Assets and Liabilities and will remain as a liability of the Trusts until such amounts are distributed in accordance with the Plan.
Recent Accounting Standards: In March 2017, the Financial Accounting Standards Board issued Accounting Standards Update “Premium Amortization of Purchased Callable Debt Securities” which amends the amortization period for certain purchased callable debt securities. Under the new guidance, the premium amortization of purchased callable debt securities that have explicit, non-contingent call features and are callable at fixed prices will be amortized to the earliest call date. The guidance will be applied on a modified retrospective basis and is effective for fiscal years, and their interim periods, beginning after December 15, 2018. Management continues to evaluate the impact of this guidance on the Trusts.
Indemnifications: In the normal course of business, a Trust enters into contracts that contain a variety of representations that provide general indemnification. A Trust’s maximum exposure under these arrangements is unknown because it involves future potential claims against a Trust, which cannot be predicted with any certainty.
Other: Expenses directly related to a Trust are charged to that Trust. Other operating expenses shared by several funds, including other funds managed by the Manager, are prorated among those funds on the basis of relative net assets or other appropriate methods.
| NOTES TO FINANCIAL STATEMENTS | 71 |
Notes to Financial Statements (continued)
| 3. | INVESTMENT VALUATION AND FAIR VALUE MEASUREMENTS |
Investment Valuation Policies: The Trusts’ investments are valued at fair value (also referred to as “market value” within the financial statements) as of the close of trading on the New York Stock Exchange (“NYSE”) (generally 4:00 p.m., Eastern time) (or if the reporting date falls on a day the NYSE is closed, investments are valued at fair value as of the period end). U.S. GAAP defines fair value as the price the Trusts would receive to sell an asset or pay to transfer a liability in an orderly transaction between market participants at the measurement date. The Trusts determine the fair values of their financial instruments using various independent dealers or pricing services under policies approved by the Trustees. The BlackRock Global Valuation Methodologies Committee (the “Global Valuation Committee”) is the committee formed by management to develop global pricing policies and procedures and to oversee the pricing function for all financial instruments.
Fair Value Inputs and Methodologies: The following methods and inputs are used to establish the fair value of each Trust’s assets and liabilities:
| • | Municipal investments (including commitments to purchase such investments on a “when-issued” basis) are valued on the basis of prices provided by dealers or pricing services. In determining the value of a particular investment, pricing services may use certain information with respect to transactions in such investments, quotations from dealers, pricing matrixes, market transactions in comparable investments and information with respect to various relationships between investments. |
| • | Investments in open-end U.S. mutual funds are valued at NAV each business day. |
| • | Futures contracts traded on exchanges are valued at their last sale price. |
If events (e.g., a company announcement, market volatility or a natural disaster) occur that are expected to materially affect the value of such investments, or in the event that the application of these methods of valuation results in a price for an investment that is deemed not to be representative of the market value of such investment, or if a price is not available, the investment will be valued by the Global Valuation Committee, or its delegate, in accordance with a policy approved by the Board as reflecting fair value (“Fair Valued Investments”). The fair valuation approaches that may be used by the Global Valuation Committee will include market approach, income approach and cost approach. Valuation techniques such as discounted cash flow, use of market comparables and matrix pricing are types of valuation approaches and are typically used in determining fair value. When determining the price for Fair Valued Investments, the Global Valuation Committee, or its delegate, seeks to determine the price that each Trust might reasonably expect to receive or pay from the current sale or purchase of that asset or liability in an arm’s-length transaction. Fair value determinations shall be based upon all available factors that the Global Valuation Committee, or its delegate, deems relevant and consistent with the principles of fair value measurement. The pricing of all Fair Valued Investments is subsequently reported to the Board or a committee thereof on a quarterly basis.
Fair Value Hierarchy: Various inputs are used in determining the fair value of investments and derivative financial instruments. These inputs to valuation techniques are categorized into a fair value hierarchy consisting of three broad levels for financial statement purposes as follows:
| • | Level 1 — Unadjusted price quotations in active markets/exchanges for identical assets or liabilities that each Trust has the ability to access |
| • | Level 2 — Other observable inputs (including, but not limited to, quoted prices for similar assets or liabilities in markets that are active, quoted prices for identical or similar assets or liabilities in markets that are not active, inputs other than quoted prices that are observable for the assets or liabilities (such as interest rates, yield curves, volatilities, prepayment speeds, loss severities, credit risks and default rates) or other market–corroborated inputs) |
| • | Level 3 — Unobservable inputs based on the best information available in the circumstances, to the extent observable inputs are not available (including the Global Valuation Committee’s assumptions used in determining the fair value of investments and derivative financial instruments) |
The hierarchy gives the highest priority to unadjusted quoted prices in active markets for identical assets or liabilities (Level 1 measurements) and the lowest priority to unobservable inputs (Level 3 measurements). Accordingly, the degree of judgment exercised in determining fair value is greatest for instruments categorized in Level 3. The inputs used to measure fair value may fall into different levels of the fair value hierarchy. In such cases, for disclosure purposes, the fair value hierarchy classification is determined based on the lowest level input that is significant to the fair value measurement in its entirety. Investments classified within Level 3 have significant unobservable inputs used by the Global Valuation Committee in determining the price for Fair Valued Investments. Level 3 investments include equity or debt issued by privately held companies or funds. There may not be a secondary market, and/or there are a limited number of investors. The categorization of a value determined for investments and derivative financial instruments is based on the pricing transparency of the investments and derivative financial instruments and is not necessarily an indication of the risks associated with investing in those securities.
| 4. | SECURITIES AND OTHER INVESTMENTS |
Zero-Coupon Bonds: Zero-coupon bonds are normally issued at a significant discount from face value and do not provide for periodic interest payments. These bonds may experience greater volatility in market value than other debt obligations of similar maturity which provide for regular interest payments.
Forward Commitments, When-Issued and Delayed Delivery Securities: Certain funds may purchase securities on a when-issued basis and may purchase or sell securities on a forward commitment basis. Settlement of such transactions normally occurs within a month or more after the purchase or sale commitment is made. A fund may purchase securities under such conditions with the intention of actually acquiring them, but may enter into a separate agreement to sell the securities before the settlement date. Since the value of securities purchased may fluctuate prior to settlement, a fund may be required to pay more at settlement than the security is worth. In addition, a fund is not entitled to any of the interest earned prior to settlement. When purchasing a security on a delayed delivery basis, a fund assumes the rights and risks of ownership of the security, including the risk of price and yield fluctuations. In the event of default by the counterparty, a fund’s maximum amount of loss is the unrealized appreciation of unsettled when-issued transactions.
Municipal Bonds Transferred to TOB Trusts: Certain Trusts leverage their assets through the use of “TOB Trust” transactions. The funds transfer municipal bonds into a special purpose trust (a “TOB Trust”). A TOB Trust issues two classes of beneficial interests: short-term floating rate interests (“TOB Trust Certificates”), which are sold
| 72 | 2019 BLACKROCK ANNUAL REPORT TO SHAREHOLDERS |
Notes to Financial Statements (continued)
to third party investors, and residual inverse floating rate interests (“TOB Residuals”), which are issued to the participating funds that contributed the municipal bonds to the TOB Trust. The TOB Trust Certificates have interest rates that reset weekly and their holders have the option to tender such certificates to the TOB Trust for redemption at par and any accrued interest at each reset date. The TOB Residuals held by a fund provide the fund with the right to cause the holders of a proportional share of the TOB Trust Certificates to tender their certificates to the TOB Trust at par plus accrued interest. The funds may withdraw a corresponding share of the municipal bonds from the TOB Trust. Other funds managed by the investment adviser may also contribute municipal bonds to a TOB Trust into which a fund has contributed bonds. If multiple BlackRock advised funds participate in the same TOB Trust, the economic rights and obligations under the TOB Residuals will be shared among the funds ratably in proportion to their participation in the TOB Trust.
TOB Trusts are supported by a liquidity facility provided by a third party bank or other financial institution (the “Liquidity Provider”) that allows the holders of the TOB Trust Certificates to tender their certificates in exchange for payment of par plus accrued interest on any business day. The tendered TOB Trust Certificates are remarketed by a Remarketing Agent. In the event of a failed remarketing, the TOB Trust may draw upon a loan from the Liquidity Provider to purchase the tendered TOB Trust Certificates. Any loans made by the Liquidity Provider will be secured by the purchased TOB Trust Certificates held by the TOB Trust and will be subject to an increased interest rate based on number of days the loan is outstanding.
The TOB Trust may be collapsed without the consent of a fund, upon the occurrence of a termination event, as defined in the TOB Trust agreement. Upon the occurrence of a termination event, a TOB Trust would be liquidated with the proceeds applied first to any accrued fees owed to the trustee of the TOB Trust, the Remarketing Agent and the Liquidity Provider. Upon certain termination events, TOB Trust Certificates holders will be paid before the TOB Residuals holders (i.e., the Trusts) whereas in other termination events, TOB Trust Certificates holders and TOB Residuals holders will be paid pro rata.
While a fund’s investment policies and restrictions expressly permit investments in inverse floating rate securities, such as TOB Residuals, they restrict the ability of a trust to borrow money for purposes of making investments. MHE’s management believes that each fund’s restrictions on borrowings do not apply to the fund’s TOB Trust transactions. Each fund’s transfer of the municipal bonds to a TOB Trust is considered a secured borrowing for financial reporting purposes. The cash received by the TOB Trust from the sale of the TOB Trust Certificates, less certain transaction expenses, is paid to a fund. A fund typically invests the cash received in additional municipal bonds.
Accounting for TOB Trusts: The municipal bonds deposited into a TOB Trust are presented in a fund’s Schedule of Investments and the TOB Trust Certificates are shown in Other Liabilities in the Statement of Assets and Liabilities. Any loans drawn by the TOB Trust pursuant to the liquidity facility to purchase tendered TOB Trust Certificates are shown as Loan for TOB Trust Certificates. The carrying amount of a fund’s payable to the holder of the TOB Trust Certificates, as reported in the Statements of Assets and Liabilities as TOB Trust Certificates, approximates its fair value.
Interest income, including amortization and accretion of premiums and discounts, from the underlying municipal bonds is recorded by a fund on an accrual basis. Interest expense incurred on the TOB Trust transaction and other expenses related to remarketing, administration, trustee, liquidity and other services to a TOB Trust are shown as interest expense, fees and amortization of offering costs in the Statement of Operations. Fees paid upon creation of the TOB Trust are recorded as debt issuance costs and are amortized to interest expense, fees and amortization of offering costs in the Statement of Operations to the expected maturity of the TOB Trust. In connection with the restructurings of the TOB Trusts to non-bank sponsored TOB Trusts, a fund incurred non-recurring, legal and restructuring fees, which are recorded as interest expense, fees and amortization of deferred offering costs in the Statement of Operations.
Amounts recorded within interest expense, fees and amortization of offering costs in the Statement of Operations are:
| Interest Expense |
Liquidity Fees |
Other Expenses |
Total | |||||||||||||
| BZM |
$ | 47,775 | $ | 13,718 | $ | 3,724 | $ | 65,217 | ||||||||
| MHE |
44,471 | 10,402 | 4,125 | 58,998 | ||||||||||||
| MHN |
918,628 | 252,076 | 80,055 | 1,250,759 | ||||||||||||
| BQH |
118,774 | 31,900 | 10,212 | 160,886 | ||||||||||||
| BSE |
353,829 | 103,229 | 27,254 | 484,312 | ||||||||||||
| BFY |
125,631 | 35,836 | 9,500 | 170,967 | ||||||||||||
| BHV |
86,271 | 23,326 | 7,416 | 117,013 | ||||||||||||
For the year ended August 31, 2019, the following table is a summary of each Trust’s TOB Trusts:
| Underlying Municipal Bonds Transferred to TOB Trusts (a) |
Liability for TOB Trust Certificates (b) |
Range of Interest Rates on TOB Trust Certificates at Period End |
Average TOB Trust Certificates Outstanding |
Daily Weighted Average Rate of Interest and Other Expenses on TOB Trusts |
||||||||||||||||
| BZM |
$ | 5,898,440 | $ | 2,999,064 | 1.38% — 1.38% | $ | 2,987,435 | 2.18 | % | |||||||||||
| MHE |
5,138,943 | 3,136,631 | 1.38% — 1.40% | 2,781,891 | 2.12 | |||||||||||||||
| MHN |
107,117,075 | 55,898,643 | 1.37% — 1.50% | 57,337,011 | 2.18 | |||||||||||||||
| BQH |
14,849,514 | 7,857,402 | 1.36% — 1.50% | 7,395,567 | 2.17 | |||||||||||||||
| BSE |
41,588,569 | 22,050,197 | 1.36% — 1.50% | 22,031,454 | 2.20 | |||||||||||||||
| BFY |
15,630,862 | 8,058,575 | 1.36% — 1.43% | 7,848,258 | 2.18 | |||||||||||||||
| BHV |
10,651,221 | 5,396,436 | 1.38% — 1.39% | 5,396,413 | 2.17 | |||||||||||||||
| (a) | The municipal bonds transferred to a TOB Trust are generally high grade municipal bonds. In certain cases, when municipal bonds transferred are lower grade municipal bonds, the TOB Trust transaction may include a credit enhancement feature that provides for the timely payment of principal and interest on the bonds to the TOB Trust by a credit |
| NOTES TO FINANCIAL STATEMENTS | 73 |
Notes to Financial Statements (continued)
| enhancement provider in the event of default of the municipal bond. The TOB Trust would be responsible for the payment of the credit enhancement fee and the funds, as TOB Residuals holders, would be responsible for reimbursement of any payments of principal and interest made by the credit enhancement provider. The maximum potential amounts owed by the funds for such reimbursements, as applicable, are included in the maximum potential amounts disclosed for recourse TOB Trusts. |
| (b) | TOB Trusts may be structured on a non-recourse or recourse basis. When a Trust invests in TOB Trusts on a non-recourse basis, the Liquidity Provider may be required to make a payment under the liquidity facility to allow the TOB Trust to repurchase TOB Trust Certificates. The Liquidity Provider will be reimbursed from the liquidation of bonds held in the TOB Trust. If a fund invests in a TOB Trust on a recourse basis, a fund enters into a reimbursement agreement with the Liquidity Provider where a fund is required to reimburse the Liquidity Provider for any shortfall between the amount paid by the Liquidity Provider and proceeds received from liquidation of municipal bonds held in the TOB Trust (the “Liquidation Shortfall”). As a result, if a fund invests in a recourse TOB Trust, a fund will bear the risk of loss with respect to any Liquidation Shortfall. If multiple funds participate in any such TOB Trust, these losses will be shared ratably, including the maximum potential amounts owed by a fund at August 31, 2019, in proportion to their participation in the TOB Trust. The recourse TOB Trusts are identified in the Schedules of Investments including the maximum potential amounts owed by a fund at August 31, 2019. |
| 5. | DERIVATIVE FINANCIAL INSTRUMENTS |
The Trusts engage in various portfolio investment strategies using derivative contracts both to increase the returns of the Trusts and/or to manage their exposure to certain risks such as credit risk, equity risk, interest rate risk, foreign currency exchange rate risk, commodity price risk or other risks (e.g., inflation risk). Derivative financial instruments categorized by risk exposure are included in the Schedules of Investments. These contracts may be transacted on an exchange or over-the-counter (“OTC”).
Futures Contracts: Futures contracts are purchased or sold to gain exposure to, or manage exposure to, changes in interest rates (interest rate risk), and changes in the value of equity securities (equity risk) or foreign currencies (foreign currency exchange rate risk).
Futures contracts are agreements between the Trusts and a counterparty to buy or sell a specific quantity of an underlying instrument at a specified price and on a specified date. Depending on the terms of a contract, it is settled either through physical delivery of the underlying instrument on the settlement date or by payment of a cash amount on the settlement date. Upon entering into a futures contract, the Trusts are required to deposit initial margin with the broker in the form of cash or securities in an amount that varies depending on a contract’s size and risk profile. The initial margin deposit must then be maintained at an established level over the life of the contract. Amounts pledged, which are considered restricted, are included in cash pledged for futures contracts in the Statements of Assets and Liabilities.
Securities deposited as initial margin are designated in the Schedules of Investments and cash deposited, if any, are shown as cash pledged for futures contracts in the Statements of Assets and Liabilities. Pursuant to the contract, the Trusts agree to receive from or pay to the broker an amount of cash equal to the daily fluctuation in market value of the contract (“variation margin”). Variation margin is recorded as unrealized appreciation (depreciation) and, if any, shown as variation margin receivable (or payable) on futures contracts in the Statements of Assets and Liabilities. When the contract is closed, a realized gain or loss is recorded in the Statements of Operations equal to the difference between the notional amount of the contract at the time it was opened and the notional amount at the time it was closed. The use of futures contracts involves the risk of an imperfect correlation in the movements in the price of futures contracts and interest, foreign currency exchange rates or underlying assets.
| 6. | INVESTMENT ADVISORY AGREEMENT AND OTHER TRANSACTIONS WITH AFFILIATES |
Investment Advisory: Each Trust entered into an Investment Advisory Agreement with the Manager, the Trusts’ investment adviser and an indirect, wholly-owned subsidiary of BlackRock, Inc. (“BlackRock”), to provide investment advisory and administrative services. The Manager is responsible for the management of each Trust’s portfolio and provides the personnel, facilities, equipment and certain other services necessary to the operations of each Trust.
For such services, each Trust, except for MHE and MHN, pays the Manager a monthly fee at an annual rate equal to a percentage of each Trust’s average weekly managed assets. For such services, MHE and MHN each pays the Manager a monthly fee at an annual rate equal to a percentage of each Trust’s average daily net assets. The Trusts pay their respective fees based on the following annual rates:
| BZM | MHE | MHN | BQH | BSE | BFY | BHV | ||||||||||||||||||||||
| Investment advisory fee |
0.65 | % | 0.50 | % | 0.55 | % | 0.65 | % | 0.55 | % | 0.55 | % | 0.65 | % | ||||||||||||||
For purposes of calculating these fees, “net assets” mean the total assets of each Trust minus the sum of its accrued liabilities (which does not include liabilities represented by TOB Trusts and the liquidation preference of any outstanding preferred shares). It is understood that the liquidation preference of any outstanding preferred stock (other than accumulated dividends) and TOB Trusts is not considered a liability in determining a Trust’s NAV. For purposes of calculating these fees, “managed assets” mean the total assets of each Trust minus the sum of its accrued liabilities (other than the aggregate indebtedness constituting financial leverage).
Expense Waivers and Reimbursements: With respect to BZM, BQH and BHV, the Manager voluntarily agreed to waive and/or reimburse fees or expenses in order to limit expenses, excluding interest expense, dividend expense, tax expense, acquired fund fees and expenses, and certain other trust expenses, which constitute extraordinary expenses not incurred in the ordinary course of each Trust’s business (“expense limitation”). The expense limitations as a percentage of average weekly managed assets are as follows:
| BZM | BQH | BHV | ||||||||||
| Fee waived |
0.05 | % | 0.10 | % | 0.13 | % | ||||||
This amount is included in fees waived and/or reimbursed by the Manager in the Statements of Operations. For the year ended August 31, 2019 the waivers were as follows:
| BZM | BQH | BHV | ||||||||||
| Amounts waived |
$ | 24,963 | $ | 73,004 | $ | 53,297 | ||||||
| 74 | 2019 BLACKROCK ANNUAL REPORT TO SHAREHOLDERS |
Notes to Financial Statements (continued)
The Manager, for MHN, voluntarily agreed to waive its investment advisory fee on the proceeds of the Preferred Shares and TOB Trusts that exceed 35% of total assets minus the sum of its accrued liabilities (which does not include liabilities represented by TOB Trusts and the liquidation preference of any outstanding preferred shares). The voluntary waiver may be reduced or discontinued at any time without notice. This amount is included in fees waived and/or reimbursed by the Manager in the Statements of Operations. For the year ended August 31, 2019 the waiver was $324,995.
With respect to each Trust, the Manager voluntarily agreed to waive its investment advisory fees by the amount of investment advisory fees each Trust pays to the Manager indirectly through its investment in affiliated money market funds (the “affiliated money market fund waiver”). The amount of waivers and/or reimbursements of fees and expenses made pursuant to the expense limitation described below will be reduced by the amount of the affiliated money market fund waiver. These amounts are included in fees waived and/or reimbursed by the Manager in the Statements of Operations. For the year ended August 31, 2019 the waivers were as follows:
| BZM | MHE | MHN | BQH | BSE | BFY | BHV | ||||||||||||||||||||||
| Amounts waived |
$ | 848 | $ | 454 | $ | 475 | $ | 64 | $ | 147 | $ | 193 | $ | 372 | ||||||||||||||
The Manager contractually agreed to waive its investment advisory fee with respect to any portion of each Trust’s assets invested in affiliated equity and fixed-income mutual funds and affiliated exchange-traded funds that have a contractual management fee through June 30, 2020. The agreement can be renewed for annual periods thereafter, and may be terminated on 90 days’ notice, each subject to approval by a majority of the Trusts’ Independent Trustees. For the year ended August 31, 2019, there were no fees waived by the Manager.
With respect to BQH, the Manager voluntarily agreed to reimburse the Trust for certain proxy related expenses in the amount of $77,755. The amount is included in fees waived and/or reimbursed by the Manager in the Statement of Operations.
Trustees and Officers: Certain trustees and/or officers of the Trusts are directors and/or officers of BlackRock or its affiliates. The Trusts reimburse the Manager for a portion of the compensation paid to the Trusts’ Chief Compliance Officer, which is included in Trustees and Officer in the Statements of Operations.
| 7. | PURCHASES AND SALES |
For the year ended August 31, 2019, purchases and sales of investments, excluding short-term securities, were as follows:
| BZM | MHE | MHN | BQH | BSE | BFY | BHV | ||||||||||||||||||||||
| Purchases |
$ | 7,944,584 | $ | 5,439,067 | $ | 174,792,458 | $ | 18,968,921 | $ | 38,833,696 | $ | 33,701,962 | $ | 6,760,821 | ||||||||||||||
| Sales |
8,068,103 | 5,079,951 | 180,089,701 | 17,254,411 | 36,971,766 | 33,140,660 | 8,826,753 | |||||||||||||||||||||
| 8. | INCOME TAX INFORMATION |
It is each Trust’s policy to comply with the requirements of the Internal Revenue Code of 1986, as amended, applicable to regulated investment companies, and to distribute substantially all of its taxable income to its shareholders. Therefore, no U.S. federal income tax provision is required.
Each Trust files U.S. federal and various state and local tax returns. No income tax returns are currently under examination. The statute of limitations on each Trust’s U.S. federal tax returns generally remains open for each of the four years ended August 31, 2019. The statutes of limitations on each Trust’s state and local tax returns may remain open for an additional year depending upon the jurisdiction.
Management has analyzed tax laws and regulations and their application to the Trusts as of August 31, 2019, inclusive of the open tax return years, and does not believe that there are any uncertain tax positions that require recognition of a tax liability in the Trusts’ financial statements.
U.S. GAAP requires that certain components of net assets be adjusted to reflect permanent differences between financial and tax reporting. These reclassifications have no effect on net assets or net asset values per share. As of period end, the following permanent differences attributable to non-deductible expenses and the expiration of capital loss carryforwards were reclassified to the following accounts:
| BZM | MHE | MHN | BQH | BSE | BFY | BHV | ||||||||||||||||||||||
| Paid-in capital |
$ | (3,037 | ) | $ | (4,155 | ) | $ | (688,973 | ) | $ | (5,837 | ) | $ | (6,251 | ) | $ | (261,333 | ) | $ | (54,450 | ) | |||||||
| Accumulated earnings |
3,037 | 4,155 | 688,973 | 5,837 | 6,251 | 261,333 | 54,450 | |||||||||||||||||||||
| NOTES TO FINANCIAL STATEMENTS | 75 |
Notes to Financial Statements (continued)
The tax character of distributions paid was as follows:
| BZM | MHE | MHN | BQH | BSE | BFY | BHV | ||||||||||||||||||||||
| Tax-exempt Income(a) |
||||||||||||||||||||||||||||
| 8/31/2019 |
$ | 1,394,694 | $ | 1,677,271 | $ | 22,568,116 | $ | 2,122,477 | $ | 4,164,518 | $ | 4,035,096 | $ | 1,247,916 | ||||||||||||||
| 8/31/2018 |
1,399,571 | 1,765,789 | 24,317,312 | 2,233,502 | 4,526,182 | 4,243,606 | 1,368,757 | |||||||||||||||||||||
| Ordinary Income(b) |
||||||||||||||||||||||||||||
| 8/31/2019 |
42,654 | 588 | 13,395 | 7,391 | 962 | 6,744 | 1,400 | |||||||||||||||||||||
| 8/31/2018 |
6,221 | 1,494 | 45,867 | 240 | 1,846 | 3,229 | 37,465 | |||||||||||||||||||||
| Long term capital gains(c) |
||||||||||||||||||||||||||||
| 8/31/2019 |
123,967 | — | — | — | — | — | — | |||||||||||||||||||||
| 8/31/2018 |
87,606 | — | — | — | — | — | — | |||||||||||||||||||||
|
|
|
|
|
|
|
|
|
|
|
|
|
|
|
|||||||||||||||
| 8/31/2019 |
$ | 1,561,315 | $ | 1,677,859 | $ | 22,581,511 | $ | 2,129,868 | $ | 4,165,480 | $ | 4,041,840 | $ | 1,249,316 | ||||||||||||||
|
|
|
|
|
|
|
|
|
|
|
|
|
|
|
|||||||||||||||
| 8/31/2018 |
$ | 1,493,398 | $ | 1,767,283 | $ | 24,363,179 | $ | 2,233,742 | $ | 4,528,028 | $ | 4,246,835 | $ | 1,406,222 | ||||||||||||||
|
|
|
|
|
|
|
|
|
|
|
|
|
|
|
|||||||||||||||
| (a) | The Trusts designate these amounts paid during the fiscal year ended August 31, 2019, as exempt-interest dividends. |
| (b) | Ordinary income consists primarily of taxable income recognized from market discount and net short-term capital gains. Additionally, all ordinary income distributions are comprised of interest related dividends for non-US residents and are eligible for exemption from US withholding tax for nonresident aliens and foreign corporations. |
| (c) | The Trusts designate this amount paid during the fiscal year ended August 31, 2019 as a capital gain dividend. |
As of period end, the tax components of accumulated net earnings were as follows:
| BZM | MHE | MHN | BQH | BSE | BFY | BHV | ||||||||||||||||||||||
| Undistributed tax-exempt income |
$ | 113,930 | $ | 71,167 | $ | 584,960 | $ | 157,469 | $ | — | $ | 411,134 | $ | 23,015 | ||||||||||||||
| Undistributed ordinary income |
500 | 11,537 | 7,104 | 1,056 | 1,256 | 2,550 | 302 | |||||||||||||||||||||
| Non-expiring capital loss carryforwards(a) |
(393,910 | ) | (556,044 | ) | (21,121,810 | ) | (1,479,569 | ) | (2,664,149 | ) | (2,262,685 | ) | (684,230 | ) | ||||||||||||||
| Net unrealized gains(b) |
3,286,210 | 4,677,296 | 64,446,499 | 7,806,927 | 13,419,324 | 11,882,972 | 2,904,814 | |||||||||||||||||||||
|
|
|
|
|
|
|
|
|
|
|
|
|
|
|
|||||||||||||||
| $ | 3,006,730 | $ | 4,203,956 | $ | 43,916,753 | $ | 6,485,883 | $ | 10,756,431 | $ | 10,033,971 | $ | 2,243,901 | |||||||||||||||
|
|
|
|
|
|
|
|
|
|
|
|
|
|
|
|||||||||||||||
| (a) | Amounts available to offset future realized capital gains. |
| (b) | The difference between book-basis and tax-basis net unrealized gains was attributable primarily to the tax deferral of losses on wash sales, amortization and accretion methods of premiums and discounts on fixed income securities, the treatment of residual interests in tender option bond trusts, the realization for tax purposes of unrealized gains/losses on certain futures contracts, and the deferral of compensation to trustees. |
As of August 31, 2019, gross unrealized appreciation and depreciation for investments and derivatives based on cost for U.S. federal income tax purposes were as follows:
| BZM | MHE | MHN | BQH | BSE | BFY | BHV | ||||||||||||||||||||||
| Tax cost |
$ | 44,792,008 | $ | 46,718,582 | $ | 648,585,201 | $ | 60,326,614 | $ | 126,192,640 | $ | 111,990,736 | $ | 33,384,997 | ||||||||||||||
|
|
|
|
|
|
|
|
|
|
|
|
|
|
|
|||||||||||||||
| Gross unrealized appreciation |
$ | 3,304,404 | $ | 4,683,149 | $ | 64,747,402 | $ | 7,826,409 | $ | 13,562,842 | $ | 11,907,191 | $ | 2,917,590 | ||||||||||||||
| Gross unrealized depreciation |
(5,978 | ) | (5,853 | ) | (47,478 | ) | (7,533 | ) | (106,274 | ) | (11,179 | ) | (3,710 | ) | ||||||||||||||
|
|
|
|
|
|
|
|
|
|
|
|
|
|
|
|||||||||||||||
| Net unrealized appreciation |
$ | 3,298,426 | $ | 4,677,296 | $ | 64,699,924 | $ | 7,818,876 | $ | 13,456,568 | $ | 11,896,012 | $ | 2,913,880 | ||||||||||||||
|
|
|
|
|
|
|
|
|
|
|
|
|
|
|
|||||||||||||||
| 9. | PRINCIPAL RISKS |
Many municipalities insure repayment of their bonds, which may reduce the potential for loss due to credit risk. The market value of these bonds may fluctuate for other reasons, including market perception of the value of such insurance, and there is no guarantee that the insurer will meet its obligation.
Inventories of municipal bonds held by brokers and dealers may decrease, which would lessen their ability to make a market in these securities. Such a reduction in market making capacity could potentially decrease a Trust’s ability to buy or sell bonds. As a result, a Trust may sell a security at a lower price, sell other securities to raise cash, or give up an investment opportunity, any of which could have a negative impact on performance. If a Trust needed to sell large blocks of bonds, those sales could further reduce the bonds’ prices and impact performance.
In the normal course of business, certain Trusts invest in securities or other instruments and may enter into certain transactions, and such activities subject each Trust to various risks, including among others, fluctuations in the market (market risk) or failure of an issuer to meet all of its obligations. The value of securities or other instruments may also be affected by various factors, including, without limitation: (i) the general economy; (ii) the overall market as well as local, regional or global political and/or social instability; (iii) regulation, taxation or international tax treaties between various countries; or (iv) currency, interest rate and price fluctuations.
Each Trust may be exposed to prepayment risk, which is the risk that borrowers may exercise their option to prepay principal earlier than scheduled during periods of declining interest rates, which would force each Trust to reinvest in lower yielding securities. Each Trust may also be exposed to reinvestment risk, which is the risk that income from each Trust’s portfolio will decline if each Trust invests the proceeds from matured, traded or called fixed-income securities at market interest rates that are below each Trust portfolio’s current earnings rate.
The Trusts may hold a significant amount of bonds subject to calls by the issuers at defined dates and prices. When bonds are called by issuers and the Trusts reinvest the proceeds received, such investments may be in securities with lower yields than the bonds originally held, and correspondingly, could adversely impact the yield and total return performance of a Trust.
| 76 | 2019 BLACKROCK ANNUAL REPORT TO SHAREHOLDERS |
Notes to Financial Statements (continued)
A Trust structures and “sponsors” the TOB Trusts in which it holds TOB Residuals and has certain duties and responsibilities, which may give rise to certain additional risks including, but not limited to, compliance, securities law and operational risks.
Should short-term interest rates rise, the Trusts’ investments in the TOB Trusts may adversely affect the Trusts’ net investment income and dividends to Common Shareholders. Also, fluctuations in the market value of municipal bonds deposited into the TOB Trust may adversely affect the Trusts’ NAVs per share.
The U.S. Securities and Exchange Commission (“SEC”) and various federal banking and housing agencies have adopted credit risk retention rules for securitizations (the “Risk Retention Rules”). The Risk Retention Rules would require the sponsor of a TOB Trust to retain at least 5% of the credit risk of the underlying assets supporting the TOB Trust’s municipal bonds. The Risk Retention Rules may adversely affect the Trusts’ ability to engage in TOB Trust transactions or increase the costs of such transactions in certain circumstances.
TOB Trusts constitute an important component of the municipal bond market. Any modifications or changes to rules governing TOB Trusts may adversely impact the municipal market and the Trusts, including through reduced demand for and liquidity of municipal bonds and increased financing costs for municipal issuers. The ultimate impact of any potential modifications on the TOB Trust market and the overall municipal market is not yet certain.
Each Trust may invest without limitation in illiquid or less liquid investments or investments in which no secondary market is readily available or which are otherwise illiquid, including private placement securities. A Trust may not be able to readily dispose of such investments at prices that approximate those at which the Trust could sell such investments if they were more widely traded and, as a result of such illiquidity, the Trust may have to sell other investments or engage in borrowing transactions if necessary to raise funds to meet its obligations. Limited liquidity can also affect the market price of investments, thereby adversely affecting a Trust’s net asset value and ability to make dividend distributions. Privately issued debt securities are often of below investment grade quality, frequently are unrated and present many of the same risks as investing in below investment grade public debt securities.
Counterparty Credit Risk: The Trusts may be exposed to counterparty credit risk, or the risk that an entity may fail to or be unable to perform on its commitments related to unsettled or open transactions. The Trusts manage counterparty credit risk by entering into transactions only with counterparties that the Manager believes have the financial resources to honor their obligations and by monitoring the financial stability of those counterparties. Financial assets, which potentially expose the Trusts to market, issuer and counterparty credit risks, consist principally of financial instruments and receivables due from counterparties. The extent of the Trusts’ exposure to market, issuer and counterparty credit risks with respect to these financial assets is approximately their value recorded in the Statements of Assets and Liabilities, less any collateral held by the Trusts.
A derivative contract may suffer a mark-to-market loss if the value of the contract decreases due to an unfavorable change in the market rates or values of the underlying instrument. Losses can also occur if the counterparty does not perform under the contract.
With exchange-traded futures, there is less counterparty credit risk to the Trusts since the exchange or clearinghouse, as counterparty to such instruments, guarantees against a possible default. The clearinghouse stands between the buyer and the seller of the contract; therefore, credit risk is limited to failure of the clearinghouse. While offset rights may exist under applicable law, a Trust does not have a contractual right of offset against a clearing broker or clearinghouse in the event of a default (including the bankruptcy or insolvency). Additionally, credit risk exists in exchange-traded futures with respect to initial and variation margin that is held in a clearing broker’s customer accounts. While clearing brokers are required to segregate customer margin from their own assets, in the event that a clearing broker becomes insolvent or goes into bankruptcy and at that time there is a shortfall in the aggregate amount of margin held by the clearing broker for all its clients, typically the shortfall would be allocated on a pro rata basis across all the clearing broker’s customers, potentially resulting in losses to the Trusts.
Concentration Risk: Each Trust invests a substantial amount of its assets in issuers located in a single state or limited number of states. This may subject each Trust to the risk that economic, political or social issues impacting a particular state or group of states could have an adverse and disproportionate impact on the income from, or the value or liquidity of, the Trust’s respective portfolios. Investment percentages in specific states or U.S. territories are presented in the Schedules of Investments.
As of period end, BQH and BFY invested a significant portion of their assets in securities in the county, city, special district and school district sector. BZM and BHV invested a significant portion of their assets in securities in the health sector. MHE invested a significant portion of their assets in securities in the education sector. BHV invested a significant portion of their assets in securities in the transportation sector. Changes in economic conditions affecting such sectors would have a greater impact on the Trusts and could affect the value, income and/or liquidity of positions in such securities.
Certain Trusts invest a significant portion of their assets in fixed-income securities and/or use derivatives tied to the fixed-income markets. Changes in market interest rates or economic conditions may affect the value and/or liquidity of such investments. Interest rate risk is the risk that prices of bonds and other fixed-income securities will increase as interest rates fall and decrease as interest rates rise. The Trusts may be subject to a greater risk of rising interest rates due to the current period of historically low rates.
| 10. | CAPITAL SHARE TRANSACTIONS |
Each Trust, except for MHN, is authorized to issue an unlimited number of Shares, all of which were initially classified as Common Shares. MHN is authorized to issue 200 million shares, all of which were initially classified as Common Shares. The par value for each Trust’s Common Shares is $0.001, except for MHE and MHN, which is $0.01 and $0.10, respectively. The par value for each Trust’s Preferred Shares outstanding is $0.001, except for MHE and MHN, which is $0.01 and $0.10, respectively. The Board is authorized, however, to reclassify any unissued Common Shares to Preferred Shares without the approval of Common Shareholders.
| NOTES TO FINANCIAL STATEMENTS | 77 |
Notes to Financial Statements (continued)
Common Shares
For the years shown, shares issued and outstanding increased by the following amounts as a result of dividend reinvestment:
| Year Ended August 31, | BZM | MHE | BFY | BHV | ||||||||||||
| 2019 |
425 | — | — | 2,473 | ||||||||||||
| 2018 |
— | 1,800 | 273 | 2,965 | ||||||||||||
For the years ended August 31, 2019 and August 31, 2018, shares issued and outstanding remained constant for MHN, BQH and BSE.
On November 15, 2018, the Board of Trustees authorized each Trust, to participate in an open market share repurchase program (the “Repurchase Program”). Under the Repurchase Program, each Trust may repurchase up to 5% of its outstanding common shares through November 30, 2019, based on common shares outstanding as of the close of business on November 30, 2018, subject to certain conditions. There is no assurance that the Trusts will purchase shares in any particular amounts. For the year ended August 31, 2019, the Trusts did not repurchase any shares.
Preferred Shares
A Trust’s Preferred Shares rank prior to its Common Shares as to the payment of dividends by the Trust and distribution of assets upon dissolution or liquidation of the Trust. The 1940 Act prohibits the declaration of any dividend on Common Shares or the repurchase of Common Shares if the Trust fails to maintain asset coverage of at least 200% of the liquidation preference of the its outstanding Preferred Shares. In addition, pursuant to the Preferred Shares’ governing instruments, a Trust is restricted from declaring and paying dividends on classes of shares ranking junior to or on parity with its Preferred Shares or repurchasing such shares if the Trust fails to declare and pay dividends on the Preferred Shares, redeem any Preferred Shares required to be redeemed under the Preferred Shares’ governing instruments or comply with the basic maintenance amount requirement of the ratings agencies rating the Preferred Shares.
Holders of Preferred Shares have voting rights equal to the voting rights of holders of Common Shares (one vote per share) and vote together with holders of Common Shares (one vote per share) as a single class on certain matters. Holders of Preferred Shares, voting as a separate class, are also entitled to (i) elect two members of the Board, (ii) elect the full Board if dividends on the Preferred Shares are not paid for a period of two years and (iii) a separate class vote to amend the Preferred Share governing documents. In addition, the 1940 Act requires the approval of the holders of a majority of any outstanding Preferred Shares, voting as a separate class, to (a) adopt any plan of reorganization that would adversely affect the Preferred Shares, (b) change a Trust’s sub-classification as a closed-end investment company or change its fundamental investment restrictions or (c) change its business so as to cease to be an investment company.
VRDP Shares
BZM, MHE, MHN, BQH, BSE, BFY and BHV (for purposes of this section, a “VRDP Trust”), have issued Series W-7 VRDP Shares, $100,000 liquidation preference per share, in one or more privately negotiated offerings to qualified institutional buyers as defined pursuant to Rule 144A under the Securities Act of 1933, as amended (the “Securities Act”). The VRDP Shares include a liquidity feature and may be subject to a special rate period. As of period end, the VRDP Shares outstanding were as follows:
| Issue Date |
Shares Issued |
Aggregate Principal |
Maturity Date |
|||||||||||||
| BZM |
06/14/12 | 160 | $ | 16,000,000 | 07/02/42 | |||||||||||
| MHE |
06/14/12 | 185 | 18,500,000 | 07/02/42 | ||||||||||||
| MHN |
06/30/11 | 2,436 | 243,600,000 | 07/01/41 | ||||||||||||
| BQH |
11/29/12 | 221 | 22,100,000 | 10/01/41 | ||||||||||||
| BSE |
11/29/12 | 405 | 40,500,000 | 10/01/41 | ||||||||||||
| BFY |
11/29/12 | 444 | 44,400,000 | 10/01/41 | ||||||||||||
| BHV |
06/14/12 | 116 | 11,600,000 | 07/02/42 | ||||||||||||
Redemption Terms: A VRDP Trust is required to redeem its VRDP Shares on the maturity date, unless earlier redeemed or repurchased. Six months prior to the maturity date, a VRDP Trust is required to begin to segregate liquid assets with the Trust’s custodian to fund the redemption. In addition, a VRDP Trust is required to redeem certain of its outstanding VRDP Shares if it fails to comply with certain asset coverage, basic maintenance amount or leverage requirements.
Subject to certain conditions, the VRDP Shares may also be redeemed, in whole or in part, at any time at the option of a VRDP Trust. The redemption price per VRDP Share is equal to the liquidation preference per share plus any outstanding unpaid dividends.
Liquidity Feature: VRDP Shares are subject to a fee agreement between the VRDP Trust and the liquidity provider that requires a per annum liquidity fee and, in some cases, an upfront or initial commitment fee, payable to the liquidity provider. These fees, if applicable, are shown as liquidity fees in the Statements of Operations. As of period end, the fee agreement is set to expire, unless renewed or terminated in advance, as follows:
| BZM | MHE | MHN | BQH | BSE | BFY | BHV | ||||||||||||||||||||||
| Expiration Date |
07/03/20 | 07/02/20 | 04/15/20 | 04/15/20 | 04/15/20 | 04/15/20 | 07/03/20 | |||||||||||||||||||||
The VRDP Shares are also subject to a purchase agreement in connection with the liquidity feature. In the event a purchase agreement is not renewed or is terminated in advance, and the VRDP Shares do not become subject to a purchase agreement with an alternate liquidity provider, the VRDP Shares will be subject to mandatory purchase by the liquidity provider prior to the termination of the purchase agreement. In the event of such mandatory purchase, a VRDP Trust is required to redeem the
| 78 | 2019 BLACKROCK ANNUAL REPORT TO SHAREHOLDERS |
Notes to Financial Statements (continued)
VRDP Shares six months after the purchase date. Immediately after such mandatory purchase, the VRDP Trust is required to begin to segregate liquid assets with its custodian to fund the redemption. There is no assurance that a VRDP Trust will replace such redeemed VRDP Shares with any other preferred shares or other form of leverage.
Remarketing: A VRDP Trust may incur remarketing fees on the aggregate principal amount of all its VRDP Shares, which, if any, are included in remarketing fees on Preferred Shares in the Statements of Operations. During any special rate period (as described below), a VRDP Trust may incur nominal or no remarketing fees.
Ratings: As of period end, the VRDP Shares were assigned the following ratings:
| Moody’s Long-term Rating |
Fitch Long-term Rating |
Moody’s Short-term Rating |
Fitch Short-term Rating |
|||||||||||||
| BZM |
Aa2 | AAA | P1 | F1 | ||||||||||||
| MHE |
Aa2 | AAA | N/A | N/A | ||||||||||||
| MHN |
Aa2 | AAA | N/A | N/A | ||||||||||||
| BQH |
Aa2 | AAA | N/A | N/A | ||||||||||||
| BSE |
Aa2 | AAA | N/A | N/A | ||||||||||||
| BFY |
Aa2 | AAA | N/A | N/A | ||||||||||||
| BHV |
Aa2 | AAA | P1 | F1 | ||||||||||||
Any short-term ratings on VRDP Shares are directly related to the short-term ratings of the liquidity provider for such VRDP Shares. Changes in the credit quality of the liquidity provider could cause a change in the short-term credit ratings of the VRDP Shares as rated by Moody’s and Fitch. The liquidity provider may be terminated prior to the scheduled termination date if the liquidity provider fails to maintain short-term debt ratings in one of the two highest rating categories.
Special Rate Period: A VRDP Trust may commence a “special rate period” with respect to its VRDP Shares, during which the VRDP Shares will not be subject to any remarketing and the dividend rate will be based on a predetermined methodology. During a special rate period, short-term ratings on VRDP Shares are withdrawn.
The following VRDP Trusts have commenced or are set to commence a special rate period:
| Commencement Date |
Termination Date |
|||||||
| MHE |
06/14/2012 | 07/02/2020 | ||||||
| BQH |
10/22/2015 | 04/15/2020 | ||||||
| BSE |
10/22/2015 | 04/15/2020 | ||||||
| BFY |
10/22/2015 | 04/15/2020 | ||||||
| MHN |
04/17/2014 | 04/15/2020 | ||||||
Prior to the expiration date, the VRDP Trust and the VRDP Shares holder may mutually agree to extend the special rate period. If a special rate period is not extended, the VRDP Shares will revert to remarketable securities upon the termination of the special rate period and will be remarketed and available for purchase by qualified institutional investors.
During the special rate period: (i) the liquidity and fee agreements remain in effect, (ii) VRDP Shares remain subject to mandatory redemption by the VRDP Trust on the maturity date, (iii) VRDP Shares will not be remarketed or subject to optional or mandatory tender events, (iv) the VRDP Trust is required to comply with the same asset coverage, basic maintenance amount and leverage requirements for the VRDP Shares as is required when the VRDP Shares are not in a special rate period, (v) the VRDP Trust will pay dividends monthly based on the sum of an agreed upon reference rate and a percentage per annum based on the long-term ratings assigned to the VRDP Shares and (vi) the VRDP Trust will pay nominal or no fees to the liquidity provider and remarketing agent.
If a VRDP Trust redeems its VRDP Shares prior to end of the special rate period and the VRDP Shares have long-term ratings above A1/A+ and its equivalent by all ratings agencies then rating the VRDP Shares, then such redemption may be subject to a redemption premium payable to the holder of the VRDP Shares based on the time remaining in the special rate period, subject to certain exceptions for redemptions that are required to comply with minimum asset coverage requirements.
Dividends: Except during the Special Rate Period as described above, dividends on the VRDP Shares are payable monthly at a variable rate set weekly by the remarketing agent. Such dividend rates are generally based upon a spread over a base rate and cannot exceed a maximum rate. A change in the short-term credit rating of the liquidity provider or the VRDP Shares may adversely affect the dividend rate paid on such shares, although the dividend rate paid on the VRDP Shares is not directly based upon either short-term rating. In the event of a failed remarketing, the dividend rate of the VRDP Shares will be reset to a maximum rate. The maximum rate is determined based on, among other things, the long-term preferred share rating assigned to the VRDP Shares and the length of time that the VRDP Shares fail to be remarketed.
For the year ended August 31, 2019, the annualized dividend rate for the VRDP Shares were as follows:
| BZM | MHE | MHN | BQH | BSE | BFY | BHV | ||||||||||||||||||||||
| Rate |
1.77 | % | 2.40 | % | 2.44 | % | 2.47 | % | 2.46 | % | 2.46 | % | 1.71 | % | ||||||||||||||
For the year ended August 31, 2019, VRDP Shares issued and outstanding of each Trust remained constant.
| NOTES TO FINANCIAL STATEMENTS | 79 |
Notes to Financial Statements (continued)
Offering Costs: The Trusts incurred costs in connection with the issuance of VRDP Shares, which were recorded as a direct deduction from the carrying value of the related debt liability and will be amortized over the life of the VRDP Shares with the exception of any upfront fees paid by a VRDP Trust to the liquidity provider which, if any, were amortized over the life of the liquidity agreement. Amortization of these costs is included in interest expense, fees and amortization of offering costs in the Statements of Operations.
Financial Reporting: The VRDP Shares are considered debt of the issuer; therefore, the liquidation preference, which approximates fair value of the VRDP Shares, is recorded as a liability in the Statements of Assets and Liabilities net of deferred offering costs. Unpaid dividends are included in interest expense and fees payable in the Statements of Assets and Liabilities, and the dividends accrued and paid on the VRDP Shares are included as a component of interest expense, fees and amortization of offering costs in the Statements of Operations. The VRDP Shares are treated as equity for tax purposes. Dividends paid to holders of the VRDP Shares are generally classified as tax-exempt income for tax-reporting purposes. Dividends and amortization of deferred offering costs on VRDP Shares are included in interest expense, fees and amortization of offering costs in the Statements of Operations:
| Dividends Accrued |
Deferred Offering Costs Amortization |
|||||||
| BZM |
$ | 282,935 | $ | 3,037 | ||||
| MHE |
444,915 | 4,081 | ||||||
| MHN |
5,946,831 | 15,442 | ||||||
| BQH |
544,860 | 5,837 | ||||||
| BSE |
996,923 | 6,251 | ||||||
| BFY |
1,093,754 | 6,332 | ||||||
| BHV |
198,663 | 2,583 | ||||||
| 11. | REGULATION S-X AMENDMENTS |
On August 17, 2018, the SEC adopted amendments to certain disclosure requirements in Securities Act Release No. 33-10532, Disclosure Update and Simplification. The Trusts have adopted the amendments pertinent to Regulation S-X in this shareholder report. The amendments impacted certain disclosure presentation on the Statements of Assets and Liabilities, Statements of Changes in Net Assets and Notes to the Financial Statements.
Prior year distribution information and undistributed (distribution in excess of) net investment income in the Statements of Changes in Net Assets has been modified to conform to the current year presentation in accordance with the Regulation S-X changes.
Distributions for the year ended August 31, 2018 were classified as follows:
| Net Investment Income |
Net Realized Gain |
|||||||
| BZM |
$ | 1,184,330 | $ | 83,044 | ||||
| MHE |
1,379,587 | — | ||||||
| MHN |
19,231,620 | — | ||||||
| BQH |
1,764,066 | — | ||||||
| BSE |
3,667,309 | — | ||||||
| BFY |
3,303,232 | — | ||||||
| BHV |
1,245,984 | — | ||||||
Undistributed net investment income as of August 31, 2018 was as follows:
| Undistributed Net Investment Income |
||||
| BZM |
$ | 221,233 | ||
| MHE |
130,411 | |||
| MHN |
1,076,098 | |||
| BQH |
335,187 | |||
| BSE |
141,169 | |||
| BFY |
614,961 | |||
| BHV |
157,423 | |||
| 80 | 2019 BLACKROCK ANNUAL REPORT TO SHAREHOLDERS |
Notes to Financial Statements (continued)
| 12. | SUBSEQUENT EVENTS |
Management’s evaluation of the impact of all subsequent events on the Trusts’ financial statements was completed through the date the financial statements were issued and the following items were noted:
| Common Dividend Per Share |
Preferred Shares(c) | |||||||||||||||||||||||
| Paid (a) | Declared (b) | Shares | Series | Declared | ||||||||||||||||||||
| BZM |
$ | 0.036400 | $ | 0.036400 | VRDP | W-7 | $ | 18,946 | ||||||||||||||||
| MHE |
0.040000 | 0.040000 | VRDP | W-7 | 30,421 | |||||||||||||||||||
| MHN |
0.044500 | 0.044500 | VRDP | W-7 | 424,865 | |||||||||||||||||||
| BQH |
0.048000 | 0.048000 | VRDP | W-7 | 37,806 | |||||||||||||||||||
| BSE |
0.040500 | 0.040500 | VRDP | W-7 | 69,282 | |||||||||||||||||||
| BFY |
0.049000 | 0.049000 | VRDP | W-7 | 75,953 | |||||||||||||||||||
| BHV |
0.045500 | 0.045500 | VRDP | W-7 | 13,736 | |||||||||||||||||||
| (a) | Net investment income dividend paid on October 1, 2019 to Common Shareholders of record on September 16, 2019. |
| (b) | Net investment income dividend declared on October 1, 2019, payable to Common Shareholders of record on October 15, 2019. |
| (c) | Dividends declared for period September 1, 2019 to September 30, 2019. |
On September 5, 2019, each Trust announced a continuation of its open market share repurchase program. Commencing on December 1, 2019, each Trust may repurchase through November 30, 2020, up to 5% of its common shares outstanding as of the close of business on November 30, 2019, subject to certain conditions. There is no assurance that the Trusts will purchase shares in any particular amounts.
| NOTES TO FINANCIAL STATEMENTS | 81 |
| Report of Independent Registered Public Accounting Firm |
To the Shareholders and Board of Trustees/Directors of BlackRock Maryland Municipal Bond Trust, BlackRock Massachusetts Tax-Exempt Trust, BlackRock MuniHoldings New York Quality Fund, Inc., BlackRock New York Municipal Bond Trust, BlackRock New York Municipal Income Quality Trust, BlackRock New York Municipal Income Trust II, and BlackRock Virginia Municipal Bond Trust:
Opinion on the Financial Statements and Financial Highlights
We have audited the accompanying statements of assets and liabilities of BlackRock Maryland Municipal Bond Trust, BlackRock Massachusetts Tax-Exempt Trust, BlackRock MuniHoldings New York Quality Fund, Inc., BlackRock New York Municipal Bond Trust, BlackRock New York Municipal Income Quality Trust, BlackRock New York Municipal Income Trust II, and BlackRock Virginia Municipal Bond Trust (the “Funds”), including the schedules of investments, as of August 31, 2019, the related statements of operations and cash flows for the year then ended, the statements of changes in net assets for each of the two years in the period then ended, the financial highlights for each of the five years in the period then ended, and the related notes. In our opinion, the financial statements and financial highlights present fairly, in all material respects, the financial position of the Funds as of August 31, 2019, and the results of their operations and their cash flows for the year then ended, the changes in their net assets for each of the two years in the period then ended, and the financial highlights for each of the five years in the period then ended, in conformity with accounting principles generally accepted in the United States of America.
Basis for Opinion
These financial statements and financial highlights are the responsibility of the Funds’ management. Our responsibility is to express an opinion on the Funds’ financial statements and financial highlights based on our audits. We are a public accounting firm registered with the Public Company Accounting Oversight Board (United States) (PCAOB) and are required to be independent with respect to the Funds in accordance with the U.S. federal securities laws and the applicable rules and regulations of the Securities and Exchange Commission and the PCAOB.
We conducted our audits in accordance with the standards of the PCAOB. Those standards require that we plan and perform the audit to obtain reasonable assurance about whether the financial statements and financial highlights are free of material misstatement, whether due to error or fraud. The Funds are not required to have, nor were we engaged to perform, an audit of their internal control over financial reporting. As part of our audits we are required to obtain an understanding of internal control over financial reporting but not for the purpose of expressing an opinion on the effectiveness of the Funds’ internal control over financial reporting. Accordingly, we express no such opinion.
Our audits included performing procedures to assess the risks of material misstatement of the financial statements and financial highlights, whether due to error or fraud, and performing procedures that respond to those risks. Such procedures included examining, on a test basis, evidence regarding the amounts and disclosures in the financial statements and financial highlights. Our audits also included evaluating the accounting principles used and significant estimates made by management, as well as evaluating the overall presentation of the financial statements and financial highlights. Our procedures included confirmation of securities owned as of August 31, 2019, by correspondence with the custodian and brokers; when replies were not received from brokers, we performed other auditing procedures. We believe that our audits provide a reasonable basis for our opinion.
Deloitte & Touche LLP
Boston, Massachusetts
October 22, 2019
We have served as the auditor of one or more BlackRock investment companies since 1992.
| 82 | 2019 BLACKROCK ANNUAL REPORT TO SHAREHOLDERS |
Disclosure of Investment Advisory Agreements
The Board of Directors and the Boards of Trustees, as applicable (collectively, the “Board,” the members of which are referred to as “Board Members”) of BlackRock MuniHoldings New York Quality Fund, Inc. (“MHN”), BlackRock Maryland Municipal Bond Trust (“BZM”), BlackRock New York Municipal Income Quality Trust (“BSE”), BlackRock New York Municipal Bond Trust (“BQH”), BlackRock New York Municipal Income Trust II (“BFY”), BlackRock Virginia Municipal Bond Trust (“BHV”), and BlackRock Massachusetts Tax-Exempt Trust (“MHE”) (collectively, the “Funds” and each, a “Fund”) met in person on May 1, 2019 (the “May Meeting”) and June 5-6, 2019 (the “June Meeting”) to consider the approval of the investment advisory agreements (collectively, the “Advisory Agreements” or the “Agreements”) between the Funds and BlackRock Advisors, LLC (the “Manager” or “BlackRock”), each Fund’s investment advisor.
Activities and Composition of the Board
On the date of the June Meeting, the Board consisted of eleven individuals, nine of whom were not “interested persons” of each Fund as defined in the Investment Company Act of 1940, as amended (the “1940 Act”) (the “Independent Board Members”). The Board Members are responsible for the oversight of the operations of each Fund and perform the various duties imposed on the directors of investment companies by the 1940 Act. The Independent Board Members have retained independent legal counsel to assist them in connection with their duties. The Co-Chairs of the Board are Independent Board Members. The Board has established five standing committees: an Audit Committee, a Governance and Nominating Committee, a Compliance Committee, a Performance Oversight Committee and an Executive Committee, each of which is chaired by an Independent Board Member and composed of Independent Board Members (except for the Executive Committee, which also has one interested Board Member).
The Agreements
Consistent with the requirements of the 1940 Act, the Board considers the continuation of the Agreements on an annual basis. The Board has four quarterly meetings per year, each typically extending for two days, and additional in-person and telephonic meetings throughout the year, as needed. While the Board also has a fifth one-day meeting to consider specific information surrounding the renewal of the Agreements, the Board’s consideration entails a year-long deliberative process whereby the Board and its committees assess BlackRock’s services to each Fund. In particular, the Board assessed, among other things, the nature, extent and quality of the services provided to each Fund by BlackRock, BlackRock’s personnel and affiliates, including (as applicable): investment management; accounting, administrative and shareholder services; oversight of each Fund’s service providers; risk management and oversight; legal and compliance services; and ability to meet applicable legal and regulatory requirements. Throughout the year, including during the contract renewal process, the Independent Board Members were advised by independent legal counsel, and met with independent legal counsel in various executive sessions outside of the presence of management.
During the year, the Board, acting directly and through its committees, considers information that is relevant to its annual consideration of the renewal of the Agreements, including the services and support provided by BlackRock to each Fund and its shareholders. BlackRock also furnished additional information to the Board in response to specific questions from the Board. This additional information is discussed further below in the section titled “Board Considerations in Approving the Agreements.” Among the matters the Board considered were: (a) investment performance for one-year, three-year, five-year, ten-year, and/or since inception periods, as applicable, against peer funds, applicable benchmarks, and performance metrics, as applicable, as well as senior management’s and portfolio managers’ analyses of the reasons for any over-performance or underperformance relative to its peers, benchmarks, and other performance metrics, as applicable; (b) leverage management, as applicable; (c) fees, including advisory, administration, if applicable, and other amounts paid to BlackRock and its affiliates by each Fund for services; (d) Fund operating expenses and how BlackRock allocates expenses to each Fund; (e) the resources devoted to, risk oversight of, and compliance reports relating to, implementation of each Fund’s investment objective, policies and restrictions, and meeting regulatory requirements; (f) BlackRock and each Fund’s adherence to applicable compliance policies and procedures; (g) the nature, character and scope of non-investment management services provided by BlackRock and its affiliates and the estimated cost of such services; (h) BlackRock’s and other service providers’ internal controls and risk and compliance oversight mechanisms; (i) BlackRock’s implementation of the proxy voting policies approved by the Board; (j) execution quality of portfolio transactions; (k) BlackRock’s implementation of each Fund’s valuation and liquidity procedures; (l) an analysis of management fees for products with similar investment mandates across the open-end fund, closed-end fund, sub-advised mutual fund, collective investment trust, and institutional separate account product channels, as applicable, and the similarities and differences between these products and the services provided as compared to each Fund; (m) BlackRock’s compensation methodology for its investment professionals and the incentives and accountability it creates, along with investment professionals’ investments in the fund(s) they manage; (n) periodic updates on BlackRock’s business; and (o) each Fund’s market discount/premium compared to peer funds.
Board Considerations in Approving the Agreements
The Approval Process: Prior to the May Meeting, the Board requested and received materials specifically relating to the Agreements. The Independent Board Members are continuously engaged in a process with their independent legal counsel and BlackRock to review the nature and scope of the information provided to better assist its deliberations. The materials provided in connection with the May Meeting included, among other things: (a) information independently compiled and prepared by Broadridge Financial Solutions, Inc. (“Broadridge”), based on Lipper classifications, regarding each Fund’s fees and expenses as compared with a peer group of funds as determined by Broadridge (“Expense Peers”), the investment performance of each Fund as compared with a peer group of funds (“Performance Peers”) and other metrics, as applicable; (b) information on the composition of the Expense Peers and Performance Peers, and a description of Broadridge’s methodology; (c) information on the estimated profits realized by BlackRock and its affiliates pursuant to the Agreements and a discussion of fall-out benefits to BlackRock and its affiliates; (d) a general analysis provided by BlackRock concerning investment management fees received in connection with other types of investment products, such as institutional accounts, sub-advised mutual funds, closed-end funds, and open-end funds, under similar investment mandates, as applicable; (e) review of non-management fees; (f) the existence, impact and sharing of potential economies of scale, if any, with each Fund; (g) a summary of aggregate amounts paid by each Fund to BlackRock; and (h) various additional information requested by the Board as appropriate regarding BlackRock’s and each Fund’s operations.
At the May Meeting, the Board reviewed materials relating to its consideration of the Agreements. As a result of the discussions that occurred during the May Meeting, and as a culmination of the Board’s year-long deliberative process, the Board presented BlackRock with questions and requests for additional information. BlackRock responded to these requests with additional written information in advance of the June Meeting. Topics covered included: (a) the methodology for measuring estimated fund profitability; (b) fund expenses and potential fee waivers; (c) differences in services provided and management fees between closed-end funds and other product channels; and (d) BlackRock’s option overwrite strategy.
| DISCLOSURE OF INVESTMENT ADVISORY AGREEMENTS | 83 |
Disclosure of Investment Advisory Agreements (continued)
At the June Meeting, the Board concluded its assessment of, among other things: (a) the nature, extent and quality of the services provided by BlackRock; (b) the investment performance of each Fund as compared with Performance Peers and other metrics, as applicable; (c) the advisory fee and the estimated cost of the services and estimated profits realized by BlackRock and its affiliates from their relationship with each Fund; (d) each Fund’s fees and expenses compared to Expense Peers; (e) the sharing of potential economies of scale; (f) fall-out benefits to BlackRock and its affiliates as a result of BlackRock’s relationship with each Fund; and (g) other factors deemed relevant by the Board Members.
The Board also considered other matters it deemed important to the approval process, such as other payments made to BlackRock or its affiliates relating to securities lending and cash management, and BlackRock’s services related to the valuation and pricing of Fund portfolio holdings. The Board noted the willingness of BlackRock personnel to engage in open, candid discussions with the Board. The Board did not identify any particular information as determinative, and each Board Member may have attributed different weights to the various items considered.
A. Nature, Extent and Quality of the Services Provided by BlackRock: The Board, including the Independent Board Members, reviewed the nature, extent and quality of services provided by BlackRock, including the investment advisory services and the resulting performance of each Fund. Throughout the year, the Board compared Fund performance to the performance of a comparable group of closed-end funds, relevant benchmarks, and performance metrics, as applicable. The Board met with BlackRock’s senior management personnel responsible for investment activities, including the senior investment officers. The Board also reviewed the materials provided by each Fund’s portfolio management team discussing each Fund’s performance and each Fund’s investment objective, strategies and outlook.
The Board considered, among other factors, with respect to BlackRock: the number, education and experience of investment personnel generally and each Fund’s portfolio management team; BlackRock’s research capabilities; investments by portfolio managers in the funds they manage; portfolio trading capabilities; use of technology; commitment to compliance; credit analysis capabilities; risk analysis and oversight capabilities; and the approach to training and retaining portfolio managers and other research, advisory and management personnel. The Board also considered BlackRock’s overall risk management program, including the continued efforts of BlackRock and its affiliates to address cybersecurity risks and the role of BlackRock’s Risk & Quantitative Analysis Group. The Board engaged in a review of BlackRock’s compensation structure with respect to each Fund’s portfolio management team and BlackRock’s ability to attract and retain high-quality talent and create performance incentives.
In addition to investment advisory services, the Board considered the nature and quality of the administrative and other non-investment advisory services provided to each Fund. BlackRock and its affiliates provide each Fund with certain administrative, shareholder and other services (in addition to any such services provided to each Fund by third parties) and officers and other personnel as are necessary for the operations of each Fund. In particular, BlackRock and its affiliates provide each Fund with administrative services including, among others: (i) responsibility for disclosure documents, such as the prospectus and the statement of additional information in connection with the initial public offering and periodic shareholder reports; (ii) preparing communications with analysts to support secondary market trading of each Fund; (iii) oversight of daily accounting and pricing; (iv) responsibility for periodic filings with regulators and stock exchanges; (v) overseeing and coordinating the activities of other service providers including, among others, each Fund’s custodian, fund accountant, transfer agent, and auditor; (vi) organizing Board meetings and preparing the materials for such Board meetings; (vii) providing legal and compliance support; (viii) furnishing analytical and other support to assist the Board in its consideration of strategic issues such as the merger, consolidation or repurposing of certain closed-end funds; and (ix) performing or managing administrative functions necessary for the operation of each Fund, such as tax reporting, expense management, fulfilling regulatory filing requirements, and shareholder call center and other services. The Board reviewed the structure and duties of BlackRock’s fund administration, shareholder services, and legal & compliance departments and considered BlackRock’s policies and procedures for assuring compliance with applicable laws and regulations.
B. The Investment Performance of each Fund and BlackRock: The Board, including the Independent Board Members, also reviewed and considered the performance history of each Fund. In preparation for the May Meeting, the Board was provided with reports independently prepared by Broadridge, which included a comprehensive analysis of each Fund’s performance as of December 31, 2018. The performance information is based on net asset value (NAV), and utilizes Lipper data. Lipper’s methodology calculates a fund’s total return assuming distributions are reinvested on the ex-date at a fund’s ex-date NAV. Broadridge ranks funds in quartiles, ranging from first to fourth, where first is the most desirable quartile position and fourth is the least desirable. In connection with its review, the Board received and reviewed information regarding the investment performance of each Fund as compared to its Performance Peers, a custom peer group of funds as defined by BlackRock (“Customized Peer Group”), and a composite measuring a blend of total return and yield (“Composite”). The Board and its Performance Oversight Committee regularly review, and meet with Fund management to discuss, the performance of each Fund throughout the year.
In evaluating performance, the Board focused particular attention on funds with less favorable performance records. The Board also noted that while it found the data provided by Broadridge generally useful, it recognized the limitations of such data, including in particular, that notable differences may exist between a fund and the Performance Peer funds (for example, the investment objective(s) and investment strategies). Further, the Board recognized that the performance data reflects a snapshot of a period as of a particular date and that selecting a different performance period could produce significantly different results. The Board also acknowledged that long-term performance could be impacted by even one period of significant outperformance or underperformance, and that a single investment theme could have the ability to affect long-term performance disproportionately.
The Board noted that for each of the one-, three- and five-year periods reported, MHN ranked first out of two funds against its Customized Peer Group Composite. The Board noted that BlackRock believes that the Customized Peer Group Composite is an appropriate performance metric for MHN, and that BlackRock has explained its rationale for this belief to the Board.
The Board noted that for the one-, three- and five-year periods reported, BZM ranked second out of two funds, first out of two funds, and first out of two funds, respectively, against its Customized Peer Group Composite. The Board noted that BlackRock believes that the Customized Peer Group Composite is an appropriate performance metric for BZM, and that BlackRock has explained its rationale for this belief to the Board. The Board and BlackRock reviewed BZM’s underperformance during the applicable period.
| 84 | 2019 BLACKROCK ANNUAL REPORT TO SHAREHOLDERS |
Disclosure of Investment Advisory Agreements (continued)
The Board noted that for the one-, three- and five-year periods reported, BSE ranked second out of two funds, second out of two funds, and first out of two funds, respectively, against its Customized Peer Group Composite. The Board noted that BlackRock believes that the Customized Peer Group Composite is an appropriate performance metric for BSE, and that BlackRock has explained its rationale for this belief to the Board. The Board and BlackRock reviewed BSE’s underperformance during the applicable periods.
The Board noted that for the one-, three- and five-year periods reported, BQH ranked in the fourth, third and first quartiles, respectively, against its Customized Peer Group Composite. The Board noted that BlackRock believes that the Customized Peer Group Composite is an appropriate performance metric for BQH, and that BlackRock has explained its rationale for this belief to the Board. The Board and BlackRock reviewed BQH’s underperformance during the applicable periods.
The Board noted that for the one-, three- and five-year periods reported, BFY ranked in the third, second, and first quartiles, respectively, against its Customized Peer Group Composite. The Board noted that BlackRock believes that the Customized Peer Group Composite is an appropriate performance metric for BFY, and that BlackRock has explained its rationale for this belief to the Board. The Board and BlackRock reviewed BFY’s underperformance during the applicable periods.
The Board noted that for each of the one-, three- and five-year periods reported, BHV ranked first out of two funds against its Customized Peer Group Composite. The Board noted that BlackRock believes that the Customized Peer Group Composite is an appropriate performance metric for BHV, and that BlackRock has explained its rationale for this belief to the Board.
The Board noted that for each of the one-, three- and five-year periods reported, MHE ranked first out of two funds against its Customized Peer Group Composite. The Board noted that BlackRock believes that the Customized Peer Group Composite is an appropriate performance metric for MHE, and that BlackRock has explained its rationale for this belief to the Board.
C. Consideration of the Advisory/Management Fees and the Estimated Cost of the Services and Estimated Profits Realized by BlackRock and its Affiliates from their Relationship with each Fund: The Board, including the Independent Board Members, reviewed each Fund’s contractual management fee rate compared with those of its Expense Peers. The contractual management fee rate represents a combination of the advisory fee and any administrative fees, before taking into account any reimbursements or fee waivers. The Board also compared each Fund’s total expense ratio, as well as its actual management fee rate as a percentage of total assets, to those of its Expense Peers. The total expense ratio represents a fund’s total net operating expenses, excluding any investment related expenses. The total expense ratio gives effect to any expense reimbursements or fee waivers that benefit a fund, and the actual management fee rate gives effect to any management fee reimbursements or waivers that benefit a fund. The Board considered the services provided and the fees charged by BlackRock and its affiliates to other types of clients with similar investment mandates, as applicable, including institutional accounts and sub-advised mutual funds (including mutual funds sponsored by third parties).
The Board received and reviewed statements relating to BlackRock’s financial condition. The Board reviewed BlackRock’s profitability methodology and was also provided with an estimated profitability analysis that detailed the revenues earned and the expenses incurred by BlackRock for services provided to each Fund. The Board reviewed BlackRock’s estimated profitability with respect to each Fund and other funds the Board currently oversees for the year ended December 31, 2018 compared to available aggregate estimated profitability data provided for the prior two years. The Board reviewed BlackRock’s estimated profitability with respect to certain other U.S. fund complexes managed by the Manager and/or its affiliates. The Board reviewed BlackRock’s assumptions and methodology of allocating expenses in the estimated profitability analysis, noting the inherent limitations in allocating costs among various advisory products. The Board recognized that profitability may be affected by numerous factors including, among other things, fee waivers and expense reimbursements by the Manager, the types of funds managed, precision of expense allocations and business mix. The Board thus recognized that calculating and comparing profitability at individual fund levels is difficult.
The Board noted that, in general, individual fund or product line profitability of other advisors is not publicly available. The Board reviewed BlackRock’s overall operating margin, in general, compared to that of certain other publicly-traded asset management firms. The Board considered the differences between BlackRock and these other firms, including the contribution of technology at BlackRock, BlackRock’s expense management, and the relative product mix.
In addition, the Board considered the estimated cost of the services provided to each Fund by BlackRock, and BlackRock’s and its affiliates’ estimated profits relating to the management of each Fund and the other funds advised by BlackRock and its affiliates. As part of its analysis, the Board reviewed BlackRock’s methodology in allocating its costs of managing the Funds, to each Fund. The Board considered whether BlackRock has the financial resources necessary to attract and retain high quality investment management personnel to perform its obligations under the Agreements and to continue to provide the high quality of services that is expected by the Board. The Board further considered factors including but not limited to BlackRock’s commitment of time, assumption of risk, and liability profile in servicing each Fund, including in contrast to what is required of BlackRock with respect to other products with similar investment mandates across the open-end fund, closed-end fund, sub-advised mutual fund, collective investment trust, and institutional separate account product channels, as applicable.
The Board noted that MHN’s contractual management fee rate ranked in the first quartile, and that the actual management fee rate and total expense ratio each ranked in the first quartile relative to the Expense Peers.
The Board noted that BZM’s contractual management fee rate ranked in the third quartile, and that the actual management fee rate and total expense ratio ranked in the second and third quartiles, respectively, relative to the Expense Peers. In addition, the Board noted that BlackRock had agreed to voluntarily waive a portion of the advisory fee payable by BZM. An advisory fee waiver has been in effect since 2013, the amount of which may have varied from time to time. After discussions between the Board, including Independent Board Members, and BlackRock, the Board and BlackRock agreed to a continuation of the current 5 basis points voluntary advisory fee waiver.
The Board noted that BSE’s contractual management fee rate ranked in the first quartile, and that the actual management fee rate and total expense ratio ranked in the first and second quartiles, respectively, relative to the Expense Peers.
The Board noted that BQH’s contractual management fee rate ranked in the fourth quartile, and that the actual management fee rate and total expense ratio ranked in the first and second quartiles, respectively, relative to the Expense Peers. In addition, the Board noted that BlackRock had agreed to voluntarily waive a portion of the advisory fee payable by BQH. An advisory fee waiver has been in effect since 2016, the amount of which may have varied from time to time. After discussions between the Board,
| DISCLOSURE OF INVESTMENT ADVISORY AGREEMENTS | 85 |
Disclosure of Investment Advisory Agreements (continued)
including Independent Board Members, and BlackRock, the Board and BlackRock agreed to a continuation of the current 10 basis point voluntary advisory fee waiver. After discussions between the Board, including the Independent Board Members, and BlackRock, the Board and BlackRock agreed to limit the impact of certain proxy related expenses to a certain threshold. Expenses above the threshold will be reimbursed by BlackRock.
The Board noted that BFY’s contractual management fee rate ranked in the first quartile, and that the actual management fee rate and total expense ratio ranked in the first and second quartiles, respectively, relative to the Expense Peers.
The Board noted that BHV’s contractual management fee rate ranked in the fourth quartile, and that the actual management fee rate and total expense ratio ranked in the first and second quartiles, respectively, relative to the Expense Peers. The Board also noted that BlackRock had agreed to voluntarily waive a portion of the advisory fee payable by BHV. An advisory fee waiver has been in effect since 2014, the amount of which may have varied from time to time. After discussions between the Board, including the Independent Board Members, and BlackRock, the Board and BlackRock agreed to a continuation of the current 13 basis point voluntary advisory fee waiver.
The Board noted that MHE’s contractual management fee rate ranked in the first quartile, and that the actual management fee rate and total expense ratio ranked in the first and third quartiles, respectively, relative to the Expense Peers.
D. Economies of Scale: The Board, including the Independent Board Members, considered the extent to which economies of scale might be realized as the assets of each Fund increase. The Board also considered the extent to which each Fund benefits from such economies in a variety of ways, and whether there should be changes in the advisory fee rate or breakpoint structure in order to enable each Fund to more fully participate in these economies of scale. The Board considered each Fund’s asset levels and whether the current fee was appropriate.
Based on the Board’s review and consideration of the issue, the Board concluded that most closed-end funds do not have fund level breakpoints because closed-end funds generally do not experience substantial growth after the initial public offering. They are typically priced at scale at a fund’s inception.
E. Other Factors Deemed Relevant by the Board Members: The Board, including the Independent Board Members, also took into account other ancillary or “fall-out” benefits that BlackRock or its affiliates may derive from BlackRock’s respective relationships with each Fund, both tangible and intangible, such as BlackRock’s ability to leverage its investment professionals who manage other portfolios and risk management personnel, an increase in BlackRock’s profile in the investment advisory community, and the engagement of BlackRock’s affiliates as service providers to each Fund, including for administrative, securities lending and cash management services. The Board also considered BlackRock’s overall operations and its efforts to expand the scale of, and improve the quality of, its operations. The Board also noted that, subject to applicable law, BlackRock may use and benefit from third party research obtained by soft dollars generated by certain registered fund transactions to assist in managing all or a number of its other client accounts.
In connection with its consideration of the Agreements, the Board also received information regarding BlackRock’s brokerage and soft dollar practices. The Board received reports from BlackRock which included information on brokerage commissions and trade execution practices throughout the year.
The Board noted the competitive nature of the closed-end fund marketplace, and that shareholders are able to sell their Fund shares in the secondary market if they believe that each Fund’s fees and expenses are too high or if they are dissatisfied with the performance of each Fund.
The Board also considered the various notable initiatives and projects BlackRock performed in connection with its closed-end fund product line. These initiatives included developing equity shelf programs; efforts to eliminate product overlap with fund mergers; ongoing services to manage leverage that has become increasingly complex; periodic evaluation of share repurchases and other support initiatives for certain BlackRock funds; and continued communications efforts with shareholders, fund analysts and financial advisers. With respect to the latter, the Independent Board Members noted BlackRock’s continued commitment to supporting the secondary market for the common shares of its closed-end funds through a comprehensive secondary market communication program designed to raise investor and analyst awareness and understanding of closed-end funds. BlackRock’s support services included, among other things: sponsoring and participating in conferences; communicating with closed-end fund analysts covering the BlackRock funds throughout the year; providing marketing and product updates for the closed-end funds; and maintaining and enhancing its closed-end fund website.
Conclusion
The Board, including the Independent Board Members, approved the continuation of the Advisory Agreements between the Manager and each Fund for a one-year term ending June 30, 2020. Based upon its evaluation of all of the aforementioned factors in their totality, as well as other information, the Board, including the Independent Board Members, was satisfied that the terms of the Agreements were fair and reasonable and in the best interest of each Fund and its shareholders. In arriving at its decision to approve the Agreements, the Board did not identify any single factor or group of factors as all-important or controlling, but considered all factors together, and different Board Members may have attributed different weights to the various factors considered. The Independent Board Members were also assisted by the advice of independent legal counsel in making this determination.
| 86 | 2019 BLACKROCK ANNUAL REPORT TO SHAREHOLDERS |
Automatic Dividend Reinvestment Plans
Pursuant to each Trust’s Dividend Reinvestment Plan (the “Reinvestment Plan”), Common Shareholders are automatically enrolled to have all distributions of dividends and capital gains and other distributions reinvested by Computershare Trust Company, N.A. (the “Reinvestment Plan Agent”) in the respective Trust’s Common Shares pursuant to the Reinvestment Plan. Shareholders who do not participate in the Reinvestment Plan will receive all distributions in cash paid by check and mailed directly to the shareholders of record (or if the shares are held in street name or other nominee name, then to the nominee) by the Reinvestment Plan Agent, which serves as agent for the shareholders in administering the Reinvestment Plan.
After the Trusts declare a dividend or determine to make a capital gain or other distribution, the Reinvestment Plan Agent will acquire shares for the participants’ accounts, depending upon the following circumstances, either (i) through receipt of unissued but authorized shares from the Trusts (“newly issued shares”) or (ii) by purchase of outstanding shares on the open market or on the Trust’s primary exchange (“open-market purchases”). If, on the dividend payment date, the net asset value per share (“NAV”) is equal to or less than the market price per share plus estimated brokerage commissions (such condition often referred to as a “market premium”), the Reinvestment Plan Agent will invest the dividend amount in newly issued shares acquired on behalf of the participants. The number of newly issued shares to be credited to each participant’s account will be determined by dividing the dollar amount of the dividend by the NAV on the date the shares are issued. However, if the NAV is less than 95% of the market price on the dividend payment date, the dollar amount of the dividend will be divided by 95% of the market price on the dividend payment date. If, on the dividend payment date, the NAV is greater than the market price per share plus estimated brokerage commissions (such condition often referred to as a “market discount”), the Reinvestment Plan Agent will invest the dividend amount in shares acquired on behalf of the participants in open-market purchases. If the Reinvestment Plan Agent is unable to invest the full dividend amount in open-market purchases, or if the market discount shifts to a market premium during the purchase period, the Reinvestment Plan Agent will invest any un-invested portion in newly issued shares. Investments in newly issued shares made in this manner would be made pursuant to the same process described above and the date of issue for such newly issued shares will substitute for the dividend payment date.
You may elect not to participate in the Reinvestment Plan and to receive all dividends in cash by contacting the Reinvestment Plan Agent, at the address set forth below.
Participation in the Reinvestment Plan is completely voluntary and may be terminated or resumed at any time without penalty by notice if received and processed by the Reinvestment Plan Agent prior to the dividend record date. Additionally, the Reinvestment Plan Agent seeks to process notices received after the record date but prior to the payable date and such notices often will become effective by the payable date. Where late notices are not processed by the applicable payable date, such termination or resumption will be effective with respect to any subsequently declared dividend or other distribution.
The Reinvestment Plan Agent’s fees for the handling of the reinvestment of distributions will be paid by each Trust. However, each participant will pay a pro rata share of brokerage commissions incurred with respect to the Reinvestment Plan Agent’s open-market purchases in connection with the reinvestment of all distributions. The automatic reinvestment of all distributions will not relieve participants of any U.S. federal, state or local income tax that may be payable on such dividends or distributions.
Each Trust reserves the right to amend or terminate the Reinvestment Plan. There is no direct service charge to participants in the Reinvestment Plan; however, each Trust reserves the right to amend the Reinvestment Plan to include a service charge payable by the participants. Participants in BZM, BQH, BSE, BFY and BHV that request a sale of shares are subject to a $2.50 sales fee and a $0.15 per share sold brokerage commission fee. Participants in MHE and MHN that request a sale of shares are subject to a $0.02 per share sold brokerage commission. All correspondence concerning the Reinvestment Plan should be directed to Computershare Trust Company, N.A. through the internet at http://www.computershare.com/blackrock, or in writing to Computershare, P.O. Box 505000, Louisville, KY 40233, Telephone: (800) 699-1236. Overnight correspondence should be directed to the Reinvestment Plan Agent at Computershare, 462 South 4th Street, Suite 1600, Louisville, KY 40202.
| AUTOMATIC DIVIDEND REINVESTMENT PLANS | 87 |
Trustee and Officer Information
| Independent Trustees (a) | ||||||||
| Name Year of Birth (b) |
Position(s) Held (Length of Service) (c) |
Principal Occupation(s) During Past Five Years | Number of BlackRock-Advised Registered Investment Companies (“RICs”) Consisting of Investment Portfolios (“Portfolios”) Overseen (d) |
Public Company and Other Investment Company Directorships Held During Past Five Years | ||||
| Richard E. Cavanagh 1946 |
Co-Chair of the Board and Trustee (Since 2007) |
Director, The Guardian Life Insurance Company of America since 1998; Board Chair, Volunteers of America (a not-for-profit organization) from 2015 to 2018 (board member since 2009); Director, Arch Chemicals (chemical and allied products) from 1999 to 2011; Trustee, Educational Testing Service from 1997 to 2009 and Chairman thereof from 2005 to 2009; Senior Advisor, The Fremont Group since 2008 and Director thereof since 1996; Faculty Member/Adjunct Lecturer, Harvard University since 2007 and Executive Dean from 1987 to 1995; President and Chief Executive Officer, The Conference Board, Inc. (global business research organization) from 1995 to 2007. | 87 RICs consisting of 111 Portfolios | None | ||||
| Karen P. Robards 1950 |
Co-Chair of the Board and Trustee (Since 2007) |
Principal of Robards & Company, LLC (consulting and private investing) since 1987; Co-founder and Director of the Cooke Center for Learning and Development (a not-for-profit organization) since 1987; Director of Enable Injections, LLC (medical devices) since 2019; Investment Banker at Morgan Stanley from 1976 to 1987. | 87 RICs consisting of 111 Portfolios | Greenhill & Co., Inc.; AtriCure, Inc. (medical devices) from 2000 until 2017 | ||||
| Michael J. Castellano 1946 |
Trustee (Since 2011) |
Chief Financial Officer of Lazard Group LLC from 2001 to 2011; Chief Financial Officer of Lazard Ltd from 2004 to 2011; Director, Support Our Aging Religious (non-profit) from 2009 to June 2015 and since 2017; Director, National Advisory Board of Church Management at Villanova University since 2010; Trustee, Domestic Church Media Foundation since 2012; Director, CircleBlack Inc. (financial technology company) since 2015. | 87 RICs consisting of 111 Portfolios | None | ||||
| Cynthia L. Egan 1955 |
Trustee (Since 2016) |
Advisor, U.S. Department of the Treasury from 2014 to 2015; President, Retirement Plan Services, for T. Rowe Price Group, Inc. from 2007 to 2012; executive positions within Fidelity Investments from 1989 to 2007. | 87 RICs consisting of 111 Portfolios | Unum (insurance); The Hanover Insurance Group (insurance); Envestnet (investment platform) from 2013 until 2016 | ||||
| Frank J. Fabozzi (d) 1948 |
Trustee |
Editor of The Journal of Portfolio Management since 1986; Professor of Finance, EDHEC Business School (France) since 2011; Visiting Professor, Princeton University for the 2013 to 2014 academic year and Spring 2017 semester; Professor in the Practice of Finance, Yale University School of Management from 1994 to 2011 and currently a Teaching Fellow in Yale’s Executive Programs; Board Member, BlackRock Equity-Liquidity Funds from 2014 to 2016; affiliated professor Karlsruhe Institute of Technology from 2008 to 2011. | 88 RICs consisting of 112 Portfolios | None | ||||
| Henry Gabbay 1947 |
Trustee (Since 2019) |
Board Member, BlackRock Equity-Bond Board from 2007 to 2018; Board Member, BlackRock Equity-Liquidity and BlackRock Closed-End Fund Boards from 2007 through 2014; Consultant, BlackRock, Inc. from 2007 to 2008; Managing Director, BlackRock, Inc. from 1989 to 2007; Chief Administrative Officer, BlackRock Advisors, LLC from 1998 to 2007; President of BlackRock Funds and BlackRock Allocation Target Shares (formerly, BlackRock Bond Allocation Target Shares) from 2005 to 2007 and Treasurer of certain closed-end funds in the BlackRock fund complex from 1989 to 2006. | 87 RICs consisting of 111 Portfolios | None | ||||
| 88 | 2019 BLACKROCK ANNUAL REPORT TO SHAREHOLDERS |
Trustee and Officer Information (continued)
| Independent Trustees (a) (continued) | ||||||||
| Name Year of Birth (b) |
Position(s) Held (Length of Service) (c) |
Principal Occupation(s) During Past Five Years | Number of BlackRock-Advised Registered Investment Companies (“RICs”) Consisting of Investment Portfolios (“Portfolios”) Overseen (d) |
Public Company and Other Investment Company Directorships Held During Past Five Years | ||||
| R. Glenn Hubbard 1958 |
Trustee (Since 2007) |
Dean, Columbia Business School from 2004 to 2019; Faculty member, Columbia Business School since 1988. | 87 RICs consisting of 111 Portfolios | ADP (data and information services); Metropolitan Life Insurance Company (insurance); KKR Financial Corporation (finance) from 2004 until 2014 | ||||
| W. Carl Kester (d) 1951 |
Trustee (Since 2007) |
George Fisher Baker Jr. Professor of Business Administration, Harvard Business School since 2008; Deputy Dean for Academic Affairs from 2006 to 2010; Chairman of the Finance Unit, from 2005 to 2006; Senior Associate Dean and Chairman of the MBA Program from 1999 to 2005; Member of the faculty of Harvard Business School since 1981. | 88 RICs consisting of 112 Portfolios | None | ||||
| Catherine A. Lynch (d) 1961 |
Trustee (Since 2016) |
Chief Executive Officer, Chief Investment Officer and various other positions, National Railroad Retirement Investment Trust from 2003 to 2016; Associate Vice President for Treasury Management, The George Washington University from 1999 to 2003; Assistant Treasurer, Episcopal Church of America from 1995 to 1999. | 88 RICs consisting of 112 Portfolios | None | ||||
| Interested Trustees (a)(e) | ||||||||
| Name Year of Birth (b) |
Position(s) Held (Length of Service) (c) |
Principal Occupation(s) During Past Five Years | Number of BlackRock-Advised Registered Investment Companies (“RICs”) Consisting of Investment Portfolios (“Portfolios”) Overseen (d) |
Public Company and Other Investment Company Directorships Held During Past Five Years | ||||
| Robert Fairbairn 1965 |
Trustee (Since 2018) |
Vice Chairman of BlackRock, Inc. since 2019; Member of BlackRock’s Global Executive and Global Operating Committees; Co-Chair of BlackRock’s Human Capital Committee; Senior Managing Director of BlackRock, Inc. from 2010 to 2019; oversaw BlackRock’s Strategic Partner Program and Strategic Product Management Group from 2012 to 2019; Member of the Board of Managers of BlackRock Investments, LLC from 2011 to 2018; Global Head of BlackRock’s Retail and iShares® businesses from 2012 to 2016. | 125 RICs consisting of 293 Portfolios | None | ||||
| John M. Perlowski (d) 1964 |
Trustee (Since 2015); President and Chief Executive Officer (Since 2010) |
Managing Director of BlackRock, Inc. since 2009; Head of BlackRock Global Accounting and Product Services since 2009; Advisory Director of Family Resource Network (charitable foundation) since 2009. | 126 RICs consisting of 294 Portfolios | None | ||||
| (a) The address of each Trustee is c/o BlackRock, Inc., 55 East 52nd Street, New York, New York 10055. (b) Each Independent Trustee holds office until his or her successor is duly elected and qualifies or until his or her earlier death, resignation, retirement or removal as provided by the Trust’s by-laws or charter or statute, or until December 31 of the year in which he or she turns 75. Trustees who are “interested persons,” as defined in the Investment Company Act serve until their successor is duly elected and qualifies or until their earlier death, resignation, retirement or removal as provided by the Trust’s by-laws or statute, or until December 31 of the year in which they turn 72. The Board may determine to extend the terms of Independent Trustees on a case-by-case basis, as appropriate. (c) Following the combination of Merrill Lynch Investment Managers, L.P. (“MLIM”) and BlackRock, Inc. in September 2006, the various legacy MLIM and legacy BlackRock fund boards were realigned and consolidated into three new fund boards in 2007. Certain Independent Trustees first became members of the boards of other legacy MLIM or legacy BlackRock funds as follows: Richard E. Cavanagh, 1994; Frank J. Fabozzi, 1988; R. Glenn Hubbard, 2004; W. Carl Kester, 1995; and Karen P. Robards, 1998. Mr. Gabbay became a member of the boards of the open-end funds in the Fixed-Income Complex in 2007. (d) Dr. Fabozzi, Dr. Kester, Ms. Lynch and Mr. Perlowski are also trustees of the BlackRock Credit Strategies Fund. (e) Mr. Fairbairn and Mr. Perlowski are both “interested persons,” as defined in the 1940 Act, of the Trust based on their positions with BlackRock, Inc. and its affiliates. Mr. Fairbairn and Mr. Perlowski are also board members of the BlackRock Multi-Asset Complex. | ||||||||
| TRUSTEE AND OFFICER INFORMATION | 89 |
Trustee and Officer Information (continued)
| Officers Who Are Not Trustees (a) | ||||
| Name Year of Birth (b) |
Position(s) Held (Length of Service) |
Principal Occupation(s) During Past Five Years | ||
| Jonathan Diorio 1980 |
Vice President (Since 2015) |
Managing Director of BlackRock, Inc. since 2015; Director of BlackRock, Inc. from 2011 to 2015. | ||
| Neal J. Andrews 1966 |
Chief Financial Officer (Since 2007) |
Chief Financial Officer of the iShares® exchange traded funds since 2019; Managing Director of BlackRock, Inc. since 2006. | ||
| Jay M. Fife 1970 |
Treasurer (Since 2007) |
Managing Director of BlackRock, Inc. since 2007. | ||
| Charles Park 1967 |
Chief Compliance Officer (Since 2014) |
Anti-Money Laundering Compliance Officer for certain BlackRock-advised Funds from 2014 to 2015; Chief Compliance Officer of BlackRock Advisors, LLC and the BlackRock-advised Funds in the BlackRock Multi-Asset Complex and the BlackRock Fixed-Income Complex since 2014; Principal of and Chief Compliance Officer for iShares® Delaware Trust Sponsor LLC since 2012 and BlackRock Fund Advisors (“BFA”) since 2006; Chief Compliance Officer for the BFA-advised iShares® exchange traded funds since 2006; Chief Compliance Officer for BlackRock Asset Management International Inc. since 2012. | ||
| Janey Ahn 1975 |
Secretary (Since 2012) |
Managing Director of BlackRock, Inc. since 2018; Director of BlackRock, Inc. from 2009 to 2017. | ||
| (a) The address of each Officer is c/o BlackRock, Inc., 55 East 52nd Street, New York, New York 10055. (b) Officers of the Trust serve at the pleasure of the Board. | ||||
| (a) | For BZM and BHV. |
| (b) | For MHN, BQH, BSE and BFY. |
| (c) | For MHE. |
| 90 | 2019 BLACKROCK ANNUAL REPORT TO SHAREHOLDERS |
Section 19(a) Notices
The amounts and sources of distributions reported are estimates and are being provided pursuant to regulatory requirements and are not being provided for tax reporting purposes. The actual amounts and sources for tax reporting purposes will depend upon the Fund’s investment experience during the year and may be subject to changes based on tax regulations. Shareholders will receive a Form 1099-DIV each calendar year that will inform them how to report these distributions for federal income tax purposes.
August 31, 2019
| Total Cumulative Distributions for the Fiscal Period |
% Breakdown of the Total Cumulative Distributions for the Fiscal Period |
|||||||||||||||||||||||||||||||||||||||
| Ticker | Net Investment Income |
Net Realized Capital Gains Short Term |
Net Realized Capital Gains Long Term |
Return of Capital |
Total Per Common Share |
Net Investment Income |
Net Realized Capital Gains Short Term |
Net Realized Capital Gains Long Term |
Return of Capital |
Total Per Common Share |
||||||||||||||||||||||||||||||
| BSE |
$ | 0.486000 | $ | 0.000000 | $ | 0.000000 | $ | 0.000000 | $ | 0.4860000 | 100 | % | 0 | % | 0 | % | 0 | % | 100 | % | ||||||||||||||||||||
Section 19(a) notices for the Trusts, as applicable, are available on the BlackRock website at http://www.blackrock.com.
Proxy Results
The Annual Meeting of Shareholders was held on July 29, 2019 for shareholders of record on May 30, 2019, to elect Trustee nominees for each Trust. There were no broker non-votes with regard to any of the Trusts.
Shareholders elected the Class III Trustees as follows:
|
|
Richard E. Cavanagh | Cynthia L. Egan | Robert Fairbairn | Henry Gabbay | ||||||||||||||||||||||||||||
| Votes For | Votes Withheld | Votes For | Votes Withheld | Votes For | Votes Withheld | Votes For | Votes Withheld | |||||||||||||||||||||||||
| BZM |
1,888,259 | 64,462 | 1,899,850 | 52,871 | 1,891,009 | 61,712 | 1,891,009 | 61,712 | ||||||||||||||||||||||||
| BSE |
4,595,878 | 1,507,150 | 4,627,839 | 1,475,189 | 4,618,029 | 1,484,999 | 4,618,029 | 1,484,999 | ||||||||||||||||||||||||
| BFY |
3,751,462 | 847,988 | 3,783,353 | 816,097 | 3,785,955 | 813,495 | 3,785,955 | 813,495 | ||||||||||||||||||||||||
| BHV |
1,450,845 | 64,873 | 1,450,845 | 64,873 | 1,450,845 | 64,873 | 1,450,845 | 64,873 | ||||||||||||||||||||||||
For the Trusts listed above, Trustees whose term of office continued after the Annual Meeting of Shareholders because they were not up for election are Michael J. Castellano, R. Glenn Hubbard, Catherine A. Lynch, John M. Perlowski, Karen P. Robards, Frank J. Fabozzi and W. Carl Kester.
Shareholders elected the Trustees as follows:
|
|
Michael J. Castellano | Richard E. Cavanagh | Cynthia L. Egan | |||||||||||||||||||||||||||||||||
| Votes For | Votes Withheld | Votes For | Votes Withheld | Votes For | Votes Withheld | |||||||||||||||||||||||||||||||
| MHN |
21,578,174 | 5,185,811 | 21,522,882 | 5,241,103 | 21,580,804 | 5,183,181 | ||||||||||||||||||||||||||||||
| Votes For | Votes Against | Abstain | Votes For | Votes Against | Abstain | Votes For | Votes Against | Abstain | ||||||||||||||||||||||||||||
| MHE |
2,110,663 | 91,991 | 400 | 2,091,807 | 108,847 | 2,400 | 2,098,115 | 104,539 | 400 | |||||||||||||||||||||||||||
|
|
Robert Fairbairn | Henry Gabbay | R. Glenn Hubbard | |||||||||||||||||||||||||||||||||
| Votes For | Votes Withheld | Votes For | Votes Withheld | Votes For | Votes Withheld | |||||||||||||||||||||||||||||||
| MHN |
21,559,830 | 5,204,155 | 21,560,755 | 5,203,230 | 21,497,235 | 5,266,750 | ||||||||||||||||||||||||||||||
| Votes For | Votes Against | Abstain | Votes For | Votes Against | Abstain | Votes For | Votes Against | Abstain | ||||||||||||||||||||||||||||
| MHE |
2,101,589 | 99,065 | 2,400 | 2,104,389 | 98,265 | 400 | 2,083,366 | 117,288 | 2,400 | |||||||||||||||||||||||||||
|
|
Catherine A. Lynch | John M. Perlowski | Karen P. Robards | |||||||||||||||||||||||||||||||||
| Votes For | Votes Withheld | Votes For | Votes Withheld | Votes For | Votes Withheld | |||||||||||||||||||||||||||||||
| MHN |
21,587,065 | 5,176,920 | 21,566,181 | 5,197,804 | 21,589,529 | 5,174,456 | ||||||||||||||||||||||||||||||
| Votes For | Votes Against | Abstain | Votes For | Votes Against | Abstain | Votes For | Votes Against | Abstain | ||||||||||||||||||||||||||||
| MHE |
2,100,236 | 102,418 | 400 | 2,103,711 | 96,943 | 2,400 | 2,100,236 | 102,418 | 400 | |||||||||||||||||||||||||||
| ADDITIONAL INFORMATION | 91 |
Additional Information (continued)
|
|
Frank J. Fabozzi (a) | W. Carl Kester (a) | ||||||||||||||||||||||||||||
| Votes For | Votes Withheld | Votes For | Votes Withheld | |||||||||||||||||||||||||||
| MHN |
2,436 | 0 | 2,436 | 0 | ||||||||||||||||||||||||||
| Votes For | Votes Against | Abstain | Votes For | Votes Against | Abstain | |||||||||||||||||||||||||
| MHE |
185 | 0 | 0 | 185 | 0 | 0 | ||||||||||||||||||||||||
| (a) | Voted on by holders of preferred shares only. |
The Annual Meeting of Shareholders was held on July 18, 2019 for shareholders of record on May 20, 2019, to elect Trustee nominees for BlackRock New York Municipal Bond Trust (BQH) and to vote on a non-binding shareholder proposal to declassify the Board of Trustees so that all Trustees are elected on an annual basis. There were no broker non-votes with regard to the Trust.
Shareholders elected Richard E. Cavanagh, Cynthia L. Egan, Robert Fairbairn and Henry Gabbay as the Class III Trustees. The vote results for the nominees were as follows:
|
|
Richard E. Cavanagh (a) | Cynthia L. Egan (a) | Robert Fairbairn (a) | Henry Gabbay (a) | ||||||||||||||||||||||||||||
| Votes For | Votes Withheld | Votes For | Votes Withheld | Votes For | Votes Withheld | Votes For | Votes Withheld | |||||||||||||||||||||||||
| BQH |
847,258 | 51,182 | 839,035 | 59,405 | 847,258 | 51,182 | 847,258 | 51,182 | ||||||||||||||||||||||||
|
|
Stephen J. Flanagan | Frederic Gabriel | Thomas H. McGlade | Jassen Trenkow | ||||||||||||||||||||||||||||
| Votes For | Votes Withheld | Votes For | Votes Withheld | Votes For | Votes Withheld | Votes For | Votes Withheld | |||||||||||||||||||||||||
| BQH |
518,727 | 23,446 | 518,727 | 23,446 | 518,727 | 23,446 | 518,727 | 23,446 | ||||||||||||||||||||||||
| (a) | These individuals were elected to serve as Trustees of the Trust. |
For the Trust listed above, Trustees whose term of office continued after the Annual Meeting of Shareholders because they were not up for election are Michael J. Castellano, R. Glenn Hubbard, Catherine A. Lynch, John M. Perlowski, Karen P. Robards, Frank J. Fabozzi and W. Carl Kester.
Shareholders voted on the non-binding proposal as follows:
| Votes For | Votes Against | Abstain | ||||||||||
| BQH |
788,931 | 503,855 | 46,434 | |||||||||
Trust Certification
The Trusts are listed for trading on the NYSE and have filed with the NYSE their annual chief executive officer certification regarding compliance with the NYSE’s listing standards. The Trusts filed with the SEC the certification of its chief executive officer and chief financial officer required by section 302 of the Sarbanes-Oxley Act.
Dividend Policy
Each Trust’s dividend policy is to distribute all or a portion of its net investment income to its shareholders on a monthly basis. In order to provide shareholders with a more stable level of distributions, the Trusts may at times pay out less than the entire amount of net investment income earned in any particular month and may at times in any particular month pay out such accumulated but undistributed income in addition to net investment income earned in that month. As a result, the distributions paid by the Trusts for any particular month may be more or less than the amount of net investment income earned by the Trusts during such month. The Trusts’ current accumulated but undistributed net investment income, if any, is disclosed as accumulated earnings (loss) in the Statements of Assets and Liabilities, which comprises part of the financial information included in this report.
General Information
The Trusts do not make available copies of their Statements of Additional Information because the Trusts’ shares are not continuously offered, which means that the Statement of Additional Information of each Trust has not been updated after completion of the respective Trust’s offerings and the information contained in each Trust’s Statement of Additional Information may have become outdated.
Except as described below, during the period, there were no material changes in the Trusts’ investment objectives or policies or to the Trusts’ charters or by-laws that would delay or prevent a change of control of the Trusts that were not approved by the shareholders or in the principal risk factors associated with investment in the Trusts. There have been no changes in the persons who are primarily responsible for the day-to-day management of the Trusts’ portfolios.
On July 29, 2019, the Board approved the elimination of MHN’s non-fundamental policy limiting investments in illiquid investments to 15% of MHN’s net assets. As a result, MHN may invest without limit in illiquid investments.
Effective July 31, 2019, each BSE and MHN may invest up to 20% of its managed assets in securities that are rated below investment grade, or are considered by BlackRock to be of comparable quality, at the time of purchase, subject to each Trust’s other investment policies. The adoption of the new policy will have no effect on each Trust’s existing investment policy to invest primarily in investment grade municipal bonds or obligations, as applicable.
In accordance with Section 23(c) of the Investment Company Act of 1940, each Trust may from time to time purchase shares of its common stock in the open market or in private transactions.
| 92 | 2019 BLACKROCK ANNUAL REPORT TO SHAREHOLDERS |
Additional Information (continued)
Quarterly performance, semi-annual and annual reports, current net asset value and other information regarding the Trusts may be found on BlackRock’s website, which can be accessed at http://www.blackrock.com. Any reference to BlackRock’s website in this report is intended to allow investors public access to information regarding the Trusts and does not, and is not intended to, incorporate BlackRock’s website in this report.
Electronic Delivery
Shareholders can sign up for e-mail notifications of quarterly statements, annual and semi-annual shareholder reports by enrolling in the electronic delivery program. Electronic copies of shareholder reports are available on BlackRock’s website.
To enroll in electronic delivery:
Shareholders Who Hold Accounts with Investment Advisers, Banks or Brokerages:
Please contact your financial advisor. Please note that not all investment advisers, banks or brokerages may offer this service.
Householding
The Trusts will mail only one copy of shareholder documents, annual and semi-annual reports and proxy statements, to shareholders with multiple accounts at the same address. This practice is commonly called “householding” and is intended to reduce expenses and eliminate duplicate mailings of shareholder documents. Mailings of your shareholder documents may be householded indefinitely unless you instruct us otherwise. If you do not want the mailing of these documents to be combined with those for other members of your household, please call the Trusts at (800) 882-0052.
Availability of Quarterly Schedule of Investments
The Trusts file their complete schedule of portfolio holdings with the SEC for the first and third quarters of each fiscal year as an exhibit to its reports on Form N-PORT, and for reporting periods ended prior to March 31, 2019, filed such information on Form N-Q. The Trusts’ Forms N-PORT and N-Q are available on the SEC’s website at http://www.sec.gov. The Trusts’ Forms N-PORT and N-Q may also be obtained upon request and without charge by calling (800) 882-0052.
Availability of Proxy Voting Policies and Procedures
A description of the policies and procedures that the Trusts use to determine how to vote proxies relating to portfolio securities is available upon request and without charge (1) by calling (800) 882-0052; (2) at http://www.blackrock.com; and (3) on the SEC’s website at http://www.sec.gov.
Availability of Proxy Voting Record
Information about how the Trusts voted proxies relating to securities held in the Trusts’ portfolios during the most recent 12-month period ended June 30 is available upon request and without charge (1) at http://www.blackrock.com; or by calling (800) 882-0052; and (2) on the SEC’s website at http://www.sec.gov.
Availability of Trust Updates
BlackRock will update performance and certain other data for the Trusts on a monthly basis on its website in the “Closed-end Funds” section of http://www.blackrock.com as well as certain other material information as necessary from time to time. Investors and others are advised to check the website for updated performance information and the release of other material information about the Trusts. This reference to BlackRock’s website is intended to allow investors public access to information regarding the Trusts and does not, and is not intended to, incorporate BlackRock’s website in this report.
BlackRock Privacy Principles
BlackRock is committed to maintaining the privacy of its current and former fund investors and individual clients (collectively, “Clients”) and to safeguarding their non-public personal information. The following information is provided to help you understand what personal information BlackRock collects, how we protect that information and why in certain cases we share such information with select parties.
If you are located in a jurisdiction where specific laws, rules or regulations require BlackRock to provide you with additional or different privacy-related rights beyond what is set forth below, then BlackRock will comply with those specific laws, rules or regulations.
BlackRock obtains or verifies personal non-public information from and about you from different sources, including the following: (i) information we receive from you or, if applicable, your financial intermediary, on applications, forms or other documents; (ii) information about your transactions with us, our affiliates, or others; (iii) information we receive from a consumer reporting agency; and (iv) from visits to our websites.
BlackRock does not sell or disclose to non-affiliated third parties any non-public personal information about its Clients, except as permitted by law or as is necessary to respond to regulatory requests or to service Client accounts. These non-affiliated third parties are required to protect the confidentiality and security of this information and to use it only for its intended purpose.
We may share information with our affiliates to service your account or to provide you with information about other BlackRock products or services that may be of interest to you. In addition, BlackRock restricts access to non-public personal information about its Clients to those BlackRock employees with a legitimate business need for the information. BlackRock maintains physical, electronic and procedural safeguards that are designed to protect the non-public personal information of its Clients, including procedures relating to the proper storage and disposal of such information.
| ADDITIONAL INFORMATION | 93 |
Glossary of Terms Used in this Report
| 94 | 2019 BLACKROCK ANNUAL REPORT TO SHAREHOLDERS |
This report is intended for current holders. It is not a prospectus. Past performance results shown in this report should not be considered a representation of future performance. The Trusts have leveraged their Common Shares, which creates risks for Common Shareholders, including the likelihood of greater volatility of net asset value and market price of the Common Shares, and the risk that fluctuations in short-term interest rates may reduce the Common Shares’ yield. Statements and other information herein are as dated and are subject to change.

| CEF-STMUNI-8-8/19-AR |

|
| Item 2 – | Code of Ethics – The registrant (or the “Fund”) has adopted a code of ethics, as of the end of the period covered by this report, applicable to the registrant’s principal executive officer, principal financial officer, principal accounting officer or controller, or persons performing similar functions. During the period covered by this report, the code of ethics was amended to update certain information and to make other non-material changes. During the period covered by this report, there have been no waivers granted under the code of ethics. The registrant undertakes to provide a copy of the code of ethics to any person upon request, without charge, who calls 1-800-882-0052, option 4. |
| Item 3 – | Audit Committee Financial Expert – The registrant’s board of directors (the “board of directors”), has determined that (i) the registrant has the following audit committee financial experts serving on its audit committee and (ii) each audit committee financial expert is independent: |
Michael Castellano
Frank J. Fabozzi
Henry Gabbay
Catherine A. Lynch
Karen P. Robards
The registrant’s board of directors has determined that Karen P. Robards qualifies as an audit committee financial expert pursuant to Item 3(c)(4) of Form N-CSR.
Ms. Robards has a thorough understanding of generally accepted accounting principles, financial statements and internal control over financial reporting as well as audit committee functions. Ms. Robards has been President of Robards & Company, a financial advisory firm, since 1987. Ms. Robards was formerly an investment banker for more than 10 years where she was responsible for evaluating and assessing the performance of companies based on their financial results. Ms. Robards has over 30 years of experience analyzing financial statements. She also is a member of the audit committee of one publicly held company and a non-profit organization.
Under applicable securities laws, a person determined to be an audit committee financial expert will not be deemed an “expert” for any purpose, including without limitation for the purposes of Section 11 of the Securities Act of 1933, as a result of being designated or identified as an audit committee financial expert. The designation or identification of a person as an audit committee financial expert does not impose on such person any duties, obligations, or liabilities greater than the duties, obligations, and liabilities imposed on such person as a member of the audit committee and board of directors in the absence of such designation or identification. The designation or identification of a person as an audit committee financial expert does not affect the duties, obligations, or liability of any other member of the audit committee or board of directors.
| Item 4 – | Principal Accountant Fees and Services |
The following table presents fees billed by Deloitte & Touche LLP (“D&T”) in each of the last two fiscal years for the services rendered to the Fund:
|
(a) Audit Fees |
(b) Audit-Related Fees1 | (c) Tax Fees2 | (d) All Other Fees | |||||||||||||
|
Entity Name |
Current Fiscal Year End |
Previous Fiscal Year End |
Current Fiscal Year End |
Previous Fiscal Year End |
Current Fiscal Year End |
Previous Fiscal Year End |
Current Fiscal Year End |
Previous Fiscal Year End | ||||||||
| BlackRock Massachusetts Tax- Exempt Trust | $26,112 | $26,112 | $0 | $0 | $8,000 | $8,000 | $0 | $0 | ||||||||
2
The following table presents fees billed by D&T that were required to be approved by the registrant’s audit committee (the “Committee”) for services that relate directly to the operations or financial reporting of the Fund and that are rendered on behalf of BlackRock Advisors, LLC (“Investment Adviser” or “BlackRock”) and entities controlling, controlled by, or under common control with BlackRock (not including any sub-adviser whose role is primarily portfolio management and is subcontracted with or overseen by another investment adviser) that provide ongoing services to the Fund (“Affiliated Service Providers”):
| Current Fiscal Year End | Previous Fiscal Year End | |||
| (b) Audit-Related Fees1 |
$0 | $0 | ||
| (c) Tax Fees2 |
$0 | $0 | ||
| (d) All Other Fees3 |
$2,050,500 | $2,274,000 | ||
1 The nature of the services includes assurance and related services reasonably related to the performance of the audit or review of financial statements not included in Audit Fees, including accounting consultations, agreed-upon procedure reports, attestation reports, comfort letters, out-of-pocket expenses and internal control reviews not required by regulators.
2 The nature of the services includes tax compliance and/or tax preparation, including services relating to the filing or amendment of federal, state or local income tax returns, regulated investment company qualification reviews, taxable income and tax distribution calculations.
3 Non-audit fees of $2,050,500 and $2,274,000 for the current fiscal year and previous fiscal year, respectively, were paid to the Fund’s principal accountant in their entirety by BlackRock, in connection with services provided to the Affiliated Service Providers of the Fund and of certain other funds sponsored and advised by BlackRock or its affiliates for a service organization review and an accounting research tool subscription. These amounts represent aggregate fees paid by BlackRock and were not allocated on a per fund basis.
(e)(1) Audit Committee Pre-Approval Policies and Procedures:
The Committee has adopted policies and procedures with regard to the pre-approval of services. Audit, audit-related and tax compliance services provided to the registrant on an annual basis require specific pre-approval by the Committee. The Committee also must approve other non-audit services provided to the registrant and those non-audit services provided to the Investment Adviser and Affiliated Service Providers that relate directly to the operations and the financial reporting of the registrant. Certain of these non-audit services that the Committee believes are (a) consistent with the SEC’s auditor independence rules and (b) routine and recurring services that will not impair the independence of the independent accountants may be approved by the Committee without consideration on a specific case-by-case basis (“general pre-approval”). The term of any general pre-approval is 12 months from the date of the pre-approval, unless the Committee provides for a different period. Tax or other non-audit services provided to the registrant which have a direct impact on the operations or financial reporting of the registrant will only be deemed pre-approved provided that any individual project does not exceed $10,000 attributable to the registrant or $50,000 per project. For this purpose, multiple projects will be aggregated to determine if they exceed the previously mentioned cost levels.
Any proposed services exceeding the pre-approved cost levels will require specific pre-approval by the Committee, as will any other services not subject to general pre-approval (e.g., unanticipated but permissible services). The Committee is informed of each service approved subject to general pre-approval at the next regularly scheduled in-person board meeting. At this meeting, an analysis of such services is presented to the Committee for ratification. The Committee may delegate to the Committee Chairman the authority to approve the provision of and fees for any specific engagement
3
of permitted non-audit services, including services exceeding pre-approved cost levels.
(e)(2) None of the services described in each of Items 4(b) through (d) were approved by the Committee pursuant to the de minimis exception in paragraph (c)(7)(i)(C) of Rule 2-01 of Regulation S-X.
(f) Not Applicable
(g) The aggregate non-audit fees, defined as the sum of the fees shown under “Audit-Related Fees,” “Tax Fees” and “All Other Fees,” paid to the accountant for services rendered by the accountant to the registrant, the Investment Adviser and the Affiliated Service Providers were:
| Entity Name | Current Fiscal Year End |
Previous Fiscal Year End |
||||||
| BlackRock Massachusetts Tax-Exempt Trust | $8,000 | $8,000 |
Additionally, the amounts billed by D&T in connection with services provided to the Affiliated Service Providers of the Fund and of other funds sponsored or advised by BlackRock or its affiliates during the current and previous fiscal years for a service organization review and an accounting research tool subscription were:
| Current Fiscal Year End |
Previous Fiscal Year End | |
| $2,050,500 | $2,274,000 |
These amounts represent aggregate fees paid by BlackRock and were not allocated on a per fund basis.
(h) The Committee has considered and determined that the provision of non-audit services that were rendered to the Investment Adviser, and the Affiliated Service Providers that were not pre-approved pursuant to paragraph (c)(7)(ii) of Rule 2-01 of Regulation S-X is compatible with maintaining the principal accountant’s independence.
| Item 5 – | Audit Committee of Listed Registrants |
| (a) | The following individuals are members of the registrant’s separately-designated standing audit committee established in accordance with Section 3(a)(58)(A) of the Securities Exchange Act of 1934 (15 U.S.C. 78c(a)(58)(A)): |
Michael Castellano
Frank J. Fabozzi
Henry Gabbay
Catherine A. Lynch
Karen P. Robards
| (b) | Not Applicable |
| Item 6 – | Investments |
4
(a) The registrant’s Schedule of Investments is included as part of the Report to Stockholders filed under Item 1 of this Form.
(b) Not Applicable due to no such divestments during the semi-annual period covered since the previous Form N-CSR filing.
| Item 7 – | Disclosure of Proxy Voting Policies and Procedures for Closed-End Management Investment Companies – The board of directors has delegated the voting of proxies for the Fund’s portfolio securities to the Investment Adviser pursuant to the Investment Adviser’s proxy voting guidelines. Under these guidelines, the Investment Adviser will vote proxies related to Fund securities in the best interests of the Fund and its stockholders. From time to time, a vote may present a conflict between the interests of the Fund’s stockholders, on the one hand, and those of the Investment Adviser, or any affiliated person of the Fund or the Investment Adviser, on the other. In such event, provided that the Investment Adviser’s Equity Investment Policy Oversight Committee, or a sub-committee thereof (the “Oversight Committee”) is aware of the real or potential conflict or material non-routine matter and if the Oversight Committee does not reasonably believe it is able to follow its general voting guidelines (or if the particular proxy matter is not addressed in the guidelines) and vote impartially, the Oversight Committee may retain an independent fiduciary to advise the Oversight Committee on how to vote or to cast votes on behalf of the Investment Adviser’s clients. If the Investment Adviser determines not to retain an independent fiduciary, or does not desire to follow the advice of such independent fiduciary, the Oversight Committee shall determine how to vote the proxy after consulting with the Investment Adviser’s Portfolio Management Group and/or the Investment Adviser’s Legal and Compliance Department and concluding that the vote cast is in its client’s best interest notwithstanding the conflict. A copy of the Fund’s Proxy Voting Policy and Procedures are attached as Exhibit 99.PROXYPOL. Information on how the Fund voted proxies relating to portfolio securities during the most recent 12-month period ended June 30 is available without charge, (i) at www.blackrock.com and (ii) on the SEC’s website at http://www.sec.gov. |
| Item 8 – | Portfolio Managers of Closed-End Management Investment Companies |
(a)(1) As of the date of filing this Report:
The registrant is managed by a team of investment professionals comprised of Michael Perilli, Vice President at BlackRock and Kevin Maloney, Vice President at BlackRock. Each of the foregoing professionals is a member of BlackRock’s municipal tax-exempt management group and is jointly responsible for the day-to-day management of the registrant’s portfolio, which includes setting the registrant’s overall investment strategy, overseeing the management of the registrant and/or selection of its investments. Messrs. Perilli and Maloney have been members of the registrant’s portfolio management team since 2016 and 2017, respectively.
|
Portfolio Manager
|
Biography
| |
| Michael Perilli
|
Vice President of BlackRock since 2014; Associate of BlackRock from 2008 to 2014.
| |
| Kevin Maloney |
Vice President of BlackRock since 2018; Associate of BlackRock from 2017 to 2014; Analyst of BlackRock from 2011 to 2013.
|
5
(a)(2) As of August 31, 2019:
|
(ii) Number of Other Accounts Managed and Assets by Account Type |
(iii) Number of Other Accounts and Assets for Which Advisory Fee is Performance-Based | |||||||||||
|
(i) Name of Portfolio Manager |
Other Registered Investment Companies |
Other Pooled Investment Vehicles |
Other Accounts |
Other Registered Investment Companies |
Other Pooled Investment Vehicles |
Other Accounts | ||||||
|
Michael Perilli
|
20 | 0 | 0 | 0 | 0 | 0 | ||||||
| $5.56 Billion
|
$0 | $0 | $0 | $0 | $0 | |||||||
|
Kevin Maloney |
7
|
0 | 0 | 0 | 0 | 0 | ||||||
| $2.20 Billion
|
$0 | $0 | $0 | $0 | $0 | |||||||
(iv) Portfolio Manager Potential Material Conflicts of Interest
BlackRock has built a professional working environment, firm-wide compliance culture and compliance procedures and systems designed to protect against potential incentives that may favor one account over another. BlackRock has adopted policies and procedures that address the allocation of investment opportunities, execution of portfolio transactions, personal trading by employees and other potential conflicts of interest that are designed to ensure that all client accounts are treated equitably over time. Nevertheless, BlackRock furnishes investment management and advisory services to numerous clients in addition to the Fund, and BlackRock may, consistent with applicable law, make investment recommendations to other clients or accounts (including accounts which are hedge funds or have performance or higher fees paid to BlackRock, or in which portfolio managers have a personal interest in the receipt of such fees), which may be the same as or different from those made to the Fund. In addition, BlackRock, Inc., its affiliates and significant shareholders and any officer, director, shareholder or employee may or may not have an interest in the securities whose purchase and sale BlackRock recommends to the Fund. BlackRock, Inc., or any of its affiliates or significant shareholders, or any officer, director, shareholder, employee or any member of their families may take different actions than those recommended to the Fund by BlackRock with respect to the same securities. Moreover, BlackRock may refrain from rendering any advice or services concerning securities of companies of which any of BlackRock, Inc.’s (or its affiliates’ or significant shareholders’) officers, directors or employees are directors or officers, or companies as to which BlackRock, Inc. or any of its affiliates or significant shareholders or the officers, directors and employees of any of them has any substantial economic interest or possesses material non-public information. Certain portfolio managers also may manage accounts whose investment strategies may at times be opposed to the strategy utilized for a fund. It should also be noted that a portfolio manager may be managing hedge fund and/or long only accounts, or may be part of a team managing hedge fund and/or long only accounts, subject to incentive fees. Such portfolio managers may therefore be entitled to receive a portion of any incentive fees earned on such accounts. Currently, the portfolio managers of this Fund are not entitled to receive a portion of incentive fees of other accounts.
As a fiduciary, BlackRock owes a duty of loyalty to its clients and must treat each client fairly. When BlackRock purchases or sells securities for more than one account, the trades must be allocated in a manner consistent with its fiduciary duties. BlackRock attempts to allocate investments in a fair and equitable manner among client accounts, with no account receiving
6
preferential treatment. To this end, BlackRock, Inc. has adopted policies that are intended to ensure reasonable efficiency in client transactions and provide BlackRock with sufficient flexibility to allocate investments in a manner that is consistent with the particular investment discipline and client base, as appropriate.
(a)(3) As of August 31, 2019:
Portfolio Manager Compensation Overview
The discussion below describes the portfolio managers’ compensation as of August 31, 2019.
BlackRock’s financial arrangements with its portfolio managers, its competitive compensation and its career path emphasis at all levels reflect the value senior management places on key resources. Compensation may include a variety of components and may vary from year to year based on a number of factors. The principal components of compensation include a base salary, a performance-based discretionary bonus, participation in various benefits programs and one or more of the incentive compensation programs established by BlackRock.
Base Compensation. Generally, portfolio managers receive base compensation based on their position with the firm.
Discretionary Incentive Compensation. Discretionary incentive compensation is a function of several components: the performance of BlackRock, Inc., the performance of the portfolio manager’s group within BlackRock, the investment performance, including risk-adjusted returns, of the firm’s assets under management or supervision by that portfolio manager relative to predetermined benchmarks, and the individual’s performance and contribution to the overall performance of these portfolios and BlackRock. In most cases, these benchmarks are the same as the benchmark or benchmarks against which the performance of the Funds or other accounts managed by the portfolio managers are measured. Among other things, BlackRock’s Chief Investment Officers make a subjective determination with respect to each portfolio manager’s compensation based on the performance of the Funds and other accounts managed by each portfolio manager relative to the various benchmarks. Performance of fixed income funds is measured on a pre-tax and/or after-tax basis over various time periods including 1-, 3- and 5- year periods, as applicable. With respect to these portfolio managers, the benchmark for the Fund and other accounts is: a combination of market-based indices (e.g., Standard & Poor’s Municipal Bond Index), certain customized indices and certain fund industry peer groups
Distribution of Discretionary Incentive Compensation. Discretionary incentive compensation is distributed to portfolio managers in a combination of cash, deferred BlackRock, Inc. stock awards, and/or deferred cash awards that notionally track the return of certain BlackRock investment products.
Portfolio managers receive their annual discretionary incentive compensation in the form of cash. Portfolio managers whose total compensation is above a specified threshold also receive deferred BlackRock, Inc. stock awards annually as part of their discretionary incentive compensation. Paying a portion of discretionary incentive compensation in the form of deferred
7
BlackRock, Inc. stock puts compensation earned by a portfolio manager for a given year “at risk” based on BlackRock’s ability to sustain and improve its performance over future periods. In some cases, additional deferred BlackRock, Inc. stock may be granted to certain key employees as part of a long-term incentive award to aid in retention, align interests with long-term shareholders and motivate performance. Deferred BlackRock, Inc. stock awards are generally granted in the form of BlackRock, Inc. restricted stock units that vest pursuant to the terms of the applicable plan and, once vested, settle in BlackRock, Inc. common stock. The portfolio managers of this Fund have deferred BlackRock, Inc. stock awards.
For certain portfolio managers, a portion of the discretionary incentive compensation is also distributed in the form of deferred cash awards that notionally track the returns of select BlackRock investment products they manage, which provides direct alignment of portfolio manager discretionary incentive compensation with investment product results. Deferred cash awards vest ratably over a number of years and, once vested, settle in the form of cash. Only portfolio managers who manage specified products and whose total compensation is above a specified threshold are eligible to participate in the deferred cash award program.
Other Compensation Benefits. In addition to base salary and discretionary incentive compensation, portfolio managers may be eligible to receive or participate in one or more of the following:
Incentive Savings Plans — BlackRock, Inc. has created a variety of incentive savings plans in which BlackRock, Inc. employees are eligible to participate, including a 401(k) plan, the BlackRock Retirement Savings Plan (RSP), and the BlackRock Employee Stock Purchase Plan (ESPP). The employer contribution components of the RSP include a company match equal to 50% of the first 8% of eligible pay contributed to the plan capped at $5,000 per year, and a company retirement contribution equal to 3-5% of eligible compensation up to the Internal Revenue Service limit ($280,000 for 2019). The RSP offers a range of investment options, including registered investment companies and collective investment funds managed by the firm. BlackRock, Inc. contributions follow the investment direction set by participants for their own contributions or, absent participant investment direction, are invested into a target date fund that corresponds to, or is closest to, the year in which the participant attains age 65. The ESPP allows for investment in BlackRock, Inc. common stock at a 5% discount on the fair market value of the stock on the purchase date. Annual participation in the ESPP is limited to the purchase of 1,000 shares of common stock or a dollar value of $25,000 based on its fair market value on the purchase date. All of the eligible portfolio managers are eligible to participate in these plans.
(a)(4) Beneficial Ownership of Securities – As of August 31, 2019.
| Portfolio Manager | Dollar Range of Equity Securities of the Fund Beneficially Owned | |
| Michael Perilli |
None | |
| Kevin Maloney |
None |
(b) Not Applicable
8
| Item 9 – | Purchases of Equity Securities by Closed-End Management Investment Company and Affiliated Purchasers – Not Applicable due to no such purchases during the period covered by this report. |
| Item 10 – | Submission of Matters to a Vote of Security Holders – There have been no material changes to these procedures. |
| Item 11 – | Controls and Procedures |
(a) – The registrant’s principal executive and principal financial officers, or persons performing similar functions, have concluded that the registrant’s disclosure controls and procedures (as defined in Rule 30a-3(c) under the Investment Company Act of 1940, as amended (the “1940 Act”)) are effective as of a date within 90 days of the filing of this report based on the evaluation of these controls and procedures required by Rule 30a-3(b) under the 1940 Act and Rule 13a-15(b) under the Securities Exchange Act of 1934, as amended.
(b) – There were no changes in the registrant’s internal control over financial reporting (as defined in Rule 30a-3(d) under the 1940 Act) that occurred during the second fiscal quarter of the period covered by this report that have materially affected, or are reasonably likely to materially affect, the registrant’s internal control over financial reporting.
| Item 12 – | Disclosure of Securities Lending Activities for Closed-End Management Investment Companies -- Not Applicable |
| Item 13 – | Exhibits attached hereto |
(a)(1) – Code of Ethics – See Item 2
(a)(2) – Certifications – Attached hereto
(a)(3) – Not Applicable
(a)(4) – Not Applicable
(b) – Certifications – Attached hereto
9
Pursuant to the requirements of the Securities Exchange Act of 1934 and the Investment Company Act of 1940, the registrant has duly caused this report to be signed on its behalf by the undersigned, thereunto duly authorized.
| BlackRock Massachusetts Tax-Exempt Trust | ||||
| By: | /s/ John M. Perlowski | |||
| John M. Perlowski | ||||
| Chief Executive Officer (principal executive officer) of BlackRock Massachusetts Tax-Exempt Trust | ||||
Date: November 5, 2019
Pursuant to the requirements of the Securities Exchange Act of 1934 and the Investment Company Act of 1940, this report has been signed below by the following persons on behalf of the registrant and in the capacities and on the dates indicated.
| By: | /s/ John M. Perlowski | |||
| John M. Perlowski | ||||
| Chief Executive Officer (principal executive officer) of BlackRock Massachusetts Tax-Exempt Trust |
Date: November 5, 2019
| By: | /s/ Neal J. Andrews | |||
| Neal J. Andrews | ||||
| Chief Financial Officer (principal financial officer) of BlackRock Massachusetts Tax-Exempt Trust | ||||
Date: November 5, 2019
10