TA B L EO FC O N T E N T S Section I Overview 2 II Market Perspective 5 III Valuation 12 Appendix 21
OVERVIEW 2

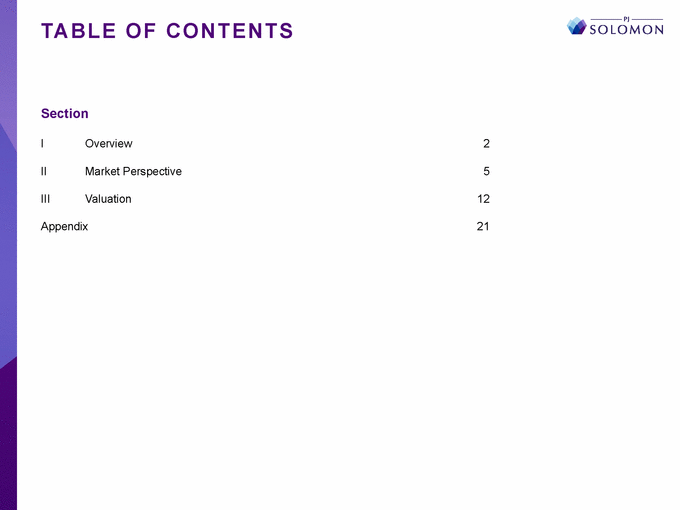
S E L E C T E D T E R M S P R O P O S E D T R A N S A C T I O N (a) 15.9mm shares outstanding as of June 14, 2018. Source: Company provided figures. Includes 0.004mm option equivalent shares and 0.01mm Stock Appreciation Rights (“SARs”) equivalent shares utilizing treasury stock method. Assumes October 31, 2018 close for vesting calculation of RSAs issued on June 14, 2018. Based on pro forma cash of $11.9mm and debt of $101.3mm. Represents cash of $50.5mm and total debt of $144.8mm as of May 5, 2018 adjusted for the May 29, 2018 redemption of $49.9mm of senior subordinated notes funded by $4.9mm of investments, $38.6mm of cash and $6.4mm of additional revolver draw as discussed with management on May 30, 2018. Source: ‘Sources & Uses’ received from Scope Capital Partners on June 14, 2018, ‘Short Putt – Wells Fargo Commitment Letter with Term Sheet’ and ‘Short Putt – Fortress Commitment Letter with Term Sheet’. Note: $81mm Feldenkreis Equity based on 3.1mm shares and assumes participation of Oscar Feldenkreis and other rollover shareholders. Wells Fargo Senior Secured Revolving Loan Facility may be structured to include a FILO tranche of up to $15 million to provide enhanced liquidity under its borrowing base. George Feldenkreis has also guaranteed to backstop any shortfalls with up to $5 million of incremental rollover. 289,088 performance-based RSAs worth $7.9mm converted to cash awards subject to time vesting. 9,794 performance-based RSAs held by Jorge Narino, Tricia Thompkins and Kevin Flint paid at close. Excludes any additional shares that may be acquired prior to close whether pursuant to the vesting of restricted stock units or otherwise. (b) (c) (d) (e) 3 (f) Acquiror Feldenkreis Holdings LLC, a vehicle controlled by George Feldenkreis (the “Sponsor”) Per Share Consideration $27.50 in cash Offer Premium to Undisturbed Price (2/5/18) 21.6% Implied Equity Value (a) $437.0mm Implied Enterprise Value (b) $526.3mm Financing (c) •$275mm Wells Fargo Senior Secured Revolving Loan Facility; approximately $144mm drawn at close (d) •$47mm Fortress Bridge Facility •$140mm Fortress 1st Lien Term Loan •$95mm Fortress 2nd Lien Term Loan •$81mm Feldenkreis Equity Other •Customary closing conditions, including HSR clearance and shareholder approval, but no financing condition •Right of Company to receive a reverse break-up fee of 4% ($17.5mm) collateralized by 647,451 shares from the Sponsor if the transaction is terminated by the Acquiror •Right of Company to enter into a superior transaction prior to shareholder approval with unsolicited third parties after paying a break-up fee of 2% of the transaction value and complying with Acquiror's match rights •Options, SAR’s and time-vested RSA’s fully paid out at close. Performance based RSA’s converted into a cash award subject to time vesting (e) •The Sponsor commits to cause 3,139,975 shares of the outstanding shares to vote for the merger and to rollover in the transaction into Sponsor’s equity (f)
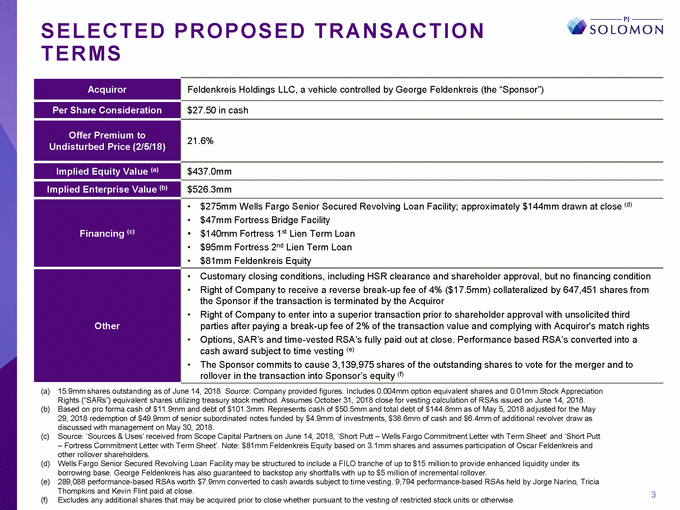
O F F E R S U M M A RY (Amounts in Millions, Except Per Share Data) Stock Price Shares Outstanding (a) Restricted Stock Units (c) Option Equivalent Shares (e) SARs Equivalent Shares (f) Diluted Shares Outstanding Total Equity Value Plus: Net Debt (g) Total Enterprise Value Premium / (Discount) to: Undisturbed 90-Day VWAP (h) 60-Day VWAP (h) 30-Day VWAP (h) 52-Week High (h) 5-Year High (h) Enterprise Value as a Multiple of: $22.62 24.13 24.75 25.14 25.99 28.80 Net Sales - Street LTM 2019E 2020E LTM 2019E 2020E 2019E 2020E 2019E 2020E $888.0 863.6 888.0 $60.1 57.7 62.8 $873.3 892.3 $62.4 66.1 EBITDA - Street Net Sales - Mgmt EBITDA - Mgmt Price as a Multiple of: Diluted EPS - Street 2019E 2020E 2019E 2020E $1.90 2.15 $2.00 2.26 Diluted EPS - Mgmt Source: ‘FY2019 Adjusted Income Statement’, ‘FY2020 and FY2021 (projection)’ received from management on March 15, 2018 and Median of Wall Street analysts' estimates as reported by ThomsonOne on June 14, 2018. Note: Undisturbed share count of 15.7mm as of November 24, 2017. Includes 0.7mm RSA’s. Undisturbed net debt based on cash of $26.5mm and total debt of $90.6mm as of October 28, 2017. (a) 15.9mm shares outstanding as of June 14, 2018. Includes 0.6mm of RSAs of which 0.02mm were authorized on June 13, 2018 and issued on June 14, 2018. Source: Company provided figures. Includes 298,882 performance-based RSAs, 289,088 of which will be converted to cash awards subject to time vesting at close. Assumes October 31, 2018 close for vesting calculation of RSAs issued on June 14, 2018. 0.01mm of restricted stock units outstanding as of June 14, 2018. 0.01mm of restricted stock units assumed to be canceled immediately prior to close. Assumes the treasury stock method with 0.004mm option equivalent shares utilizing the treasury stock method as of June 14, 2018. Assumes the treasury stock method with 0.005 – 0.01mm SAR equivalent shares utilizing the treasury stock method as of June 14, 2018. Based on pro forma cash of $11.9mm and debt of $101.3mm. Represents cash of $50.5mm and total debt of $144.8mm as of May 5, 2018 adjusted for the May 29, 2018 redemption of $49.9mm of senior subordinated notes funded by $4.9mm of investments, $38.6mm of cash and $6.4mm of additional revolver draw as discussed with management on May 30, 2018. Prior to February 5, 2018 undisturbed price date. (b) (c) (d) (e) (f) (g) 4 (h) Undisturbed 2/5/18 Close on 6/14/18 Feldenkreis Proposal $22.62 $27.73 $27.50 15.7 0.0 0.0 0.0 15.7 64.1 --% (6.3) (8.6) (10.0) (13.0) (21.5) 47.3 % 48.6 47.3 7.0 x 7.3 6.7 48.0 % 47.0 6.7 x 6.4 11.9 x 10.5 11.3 x 10.0 15.9 0.0 0.0 0.0 15.9 89.4 22.6 % 14.9 12.0 10.3 6.7 (3.7) 59.8 % 61.4 59.8 8.8 x 9.2 8.4 60.8 % 59.5 8.5 x 8.0 14.6 x 12.9 13.9 x 12.3 15.9 (b) --(d) 0.0 0.0 15.9 (b) 89.4 21.6 % 14.0 11.1 9.4 5.8 (4.5) 59.3 % 60.9 59.3 8.8 x 9.1 8.4 60.3 % 59.0 8.4 x 8.0 14.5 x 12.8 13.8 x 12.2 $526.3 $530.6 $419.6 $437.0 $441.2 $355.5
MARKET PERSPECTIVE 5

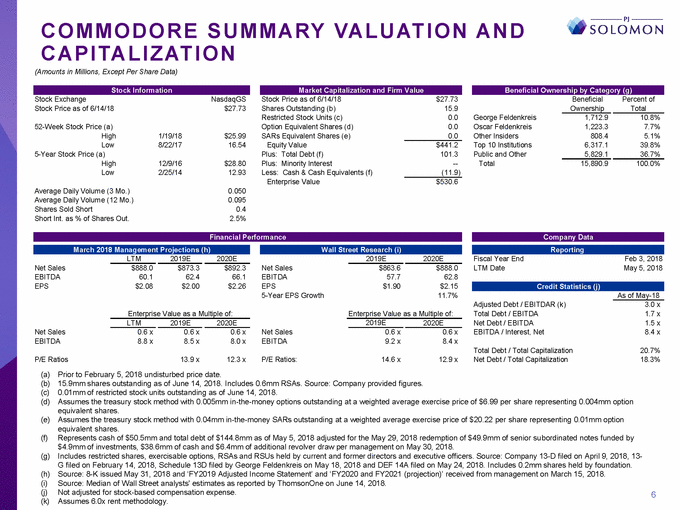
C O M M O D O R ES U M M A RY VA L U AT I O N C A P I TA L I Z AT I O N (Amounts in Millions, Except Per Share Data) A N D Stock Exchange Stock Price as of 6/14/18 NasdaqGS $27.73 Stock Price as of 6/14/18 Shares Outstanding (b) Restricted Stock Units (c) Option Equivalent Shares (d) SARs Equivalent Shares (e) Equity Value Plus: Total Debt (f) Plus: Minority Interest Less: Cash & Cash Equivalents (f) Enterprise Value $27.73 15.9 0.0 0.0 0.0 Beneficial Ownership Percent of Total George Feldenkreis Oscar Feldenkreis Other Insiders Top 10 Institutions Public and Other Total 52-Week Stock Price (a) High Low 5-Year Stock Price (a) High Low 1,223.3 808.4 6,317.1 5,829.1 7.7% 5.1% 39.8% 36.7% 1/19/18 8/22/17 $25.99 16.54 $441.2 101.3 --(11.9) 12/9/16 2/25/14 $28.80 12.93 $530.6 Average Daily Volume (3 Mo.) Average Daily Volume (12 Mo.) Shares Sold Short Short Int. as % of Shares Out. 0.050 0.095 0.4 2.5% LTM 2019E 2020E 2019E 2020E Fiscal Year End LTM Date Feb 3, 2018 May 5, 2018 Net Sales EBITDA EPS Net Sales EBITDA EPS 5-Year EPS Growth 60.1 $2.08 62.4 $2.00 66.1 $2.26 57.7 $1.90 62.8 $2.15 11.7% As of May-18 Adjusted Debt / EBITDAR (k) Total Debt / EBITDA Net Debt / EBITDA EBITDA / Interest, Net Enterprise Value as a Multiple of: Enterprise Value as a Multiple of: 1.7 x 1.5 x 8.4 x LTM 2019E 2020E 2019E 2020E Net Sales EBITDA Net Sales EBITDA 8.8 x 8.5 x 8.0 x 9.2 x 8.4 x Total Debt / Total Capitalization Net Debt / Total Capitalization 20.7% 18.3% P/E Ratios 13.9 x 12.3 x P/E Ratios: 14.6 x 12.9 x (a) (b) (c) (d) Prior to February 5, 2018 undisturbed price date. 15.9mm shares outstanding as of June 14, 2018. Includes 0.6mm RSAs. Source: Company provided figures. 0.01mm of restricted stock units outstanding as of June 14, 2018. Assumes the treasury stock method with 0.005mm in-the-money options outstanding at a weighted average exercise price of $6.99 per share representing 0.004mm option equivalent shares. Assumes the treasury stock method with 0.04mm in-the-money SARs outstanding at a weighted average exercise price of $20.22 per share representing 0.01mm option equivalent shares. Represents cash of $50.5mm and total debt of $144.8mm as of May 5, 2018 adjusted for the May 29, 2018 redemption of $49.9mm of senior subordinated notes funded by $4.9mm of investments, $38.6mm of cash and $6.4mm of additional revolver draw per management on May 30, 2018. Includes restricted shares, exercisable options, RSAs and RSUs held by current and former directors and executive officers. Source: Company 13-D filed on April 9, 2018, 13-G filed on February 14, 2018, Schedule 13D filed by George Feldenkreis on May 18, 2018 and DEF 14A filed on May 24, 2018. Includes 0.2mm shares held by foundation. Source: 8-K issued May 31, 2018 and ‘FY2019 Adjusted Income Statement’ and ‘FY2020 and FY2021 (projection)’ received from management on March 15, 2018. Source: Median of Wall Street analysts' estimates as reported by ThomsonOne on June 14, 2018. Not adjusted for stock-based compensation expense. Assumes 6.0x rent methodology. (e) (f) (g) (h) (i) (j) (k) 6 0.6 x 0.6 x 0.6 x 0.6 x 0.6 x 3.0 x Credit Statistics (j) $863.6 $888.0 $888.0 $873.3 $892.3 Reporting Wall Street Research (i) March 2018 Management Projections (h) Company Data Financial Performance 15,890.9 100.0% 1,712.9 10.8% Beneficial Ownership by Category (g) Market Capitalization and Firm Value Stock Information
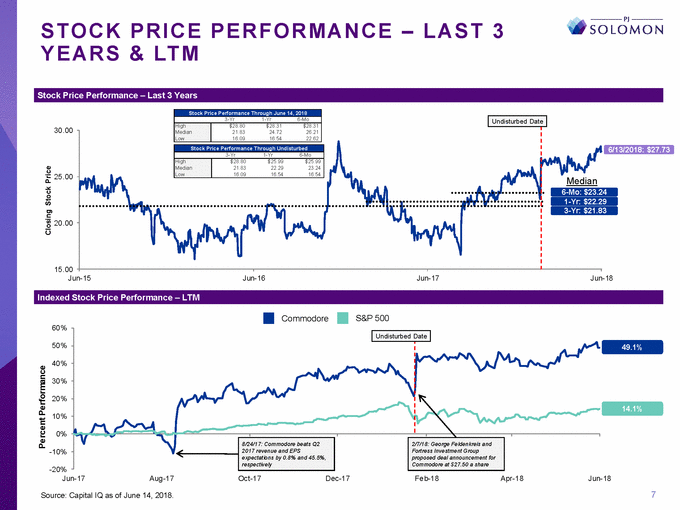
S T O C K Y E A R S P R I C E P E R F O R M A N C E – L A S T 3 & LT M 30.00 6/13/2018: $27.73 25.00 4 9 3 20.00 15.00 Jun-15 Jun-16 Jun-17 Jun-18 Commodore S&P 500 60% 50% 49.1% 40% 30% 20% 14.1% 10% 0% -10% -20% Jun-17 Aug-17 Oct-17 Dec-17 Feb-18 Apr-18 Jun-18 7 Source: Capital IQ as of June 14, 2018. Percent Performance Closing Stock Price Undisturbed Date 8/24/17: Commodore beats Q2 2017 revenue and EPS expectations by 0.8% and 45.5%, respectively 2/7/18: George Feldenkreis and Fortress Investment Group proposed deal announcement for Commodore at $27.50 a share Indexed Stock Price Performance – LTM Undisturbed Date Median 6-Mo: $23.2 1-Yr: $22.2 3-Yr: $21.8 Stock Price Performance Through June 14, 2018 3-Yr1-Yr6-Mo High Median Low $28.80$28.31$28.31 21.8324.7226.21 16.0916.5422.62 Stock Price Performance Through Undisturbed 3-Yr 1-Yr 6-Mo High Median Low $28.80 $25.99 $25.99 21.83 22.29 23.24 16.09 16.54 16.54 Stock Price Performance – Last 3 Years
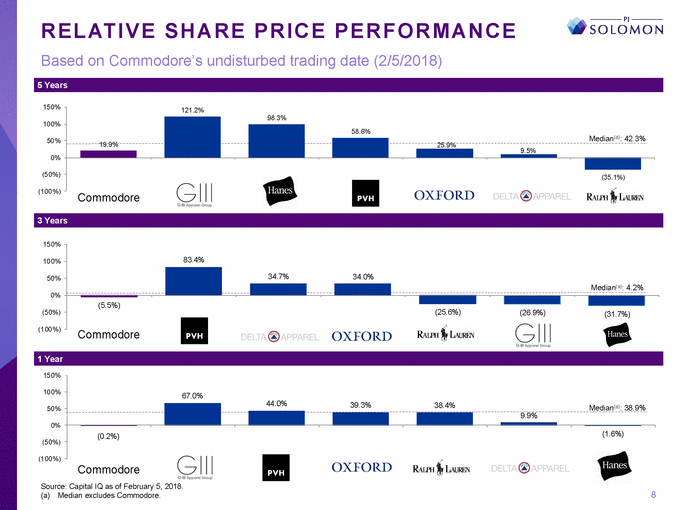
R E L AT I V ES H A R E P R I C EP E R F O R M A N C E Based on Commodore’s undisturbed trading date (2/5/2018) 150% 100% Median : 42.3% (a) 50% 25.9% 0% (50%) (100%) ComPmERoY dore HBI GIII OXM PVH DLA RL 150% 100% 50% 0% (50%) (100%) CommPERoY dore DLA PVH OXM RL HBI GIII 150% 100% 50% 0% (50%) (100%) ComPmERoY dore PVH OXM GIII RL HBI DLA Source: Capital IQ as of February 5, 2018. (a) Median excludes Commodore. 8 67.0% 44.0% 39.3% 38.4% Median(a): 38.9% 9.9% (0.2%) (1.6%) 1 Year 83.4% 34.7% 34.0% Median(a): 4.2% (5.5%) (25.6%) (26.9%) (31.7%) 3 Years 121.2% 98.3% 58.6% 19.9% 9.5% (35.1%) 5 Years
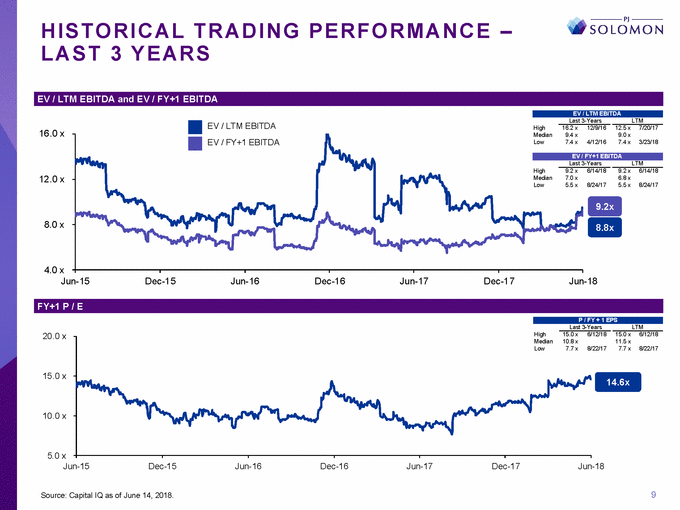
H I S T O R I C A L T R A D I N G P E R F O R M A N C E – L A S T 3 Y E A R S Last 3-Years LTM EV / LTM EBITDA High 16.0 x 9.0 x 7.4 x 3/23/18 4/12/16 3-Years LTM 12.0 x 6.8 x 5.5 x 8/24/17 8/24/17 9.2x 8.0 x 8.8x 4.0 x Jun-15 Dec-15 Jun-16 Dec-16 Jun-17 Dec-17 Jun-18 Last 3-Years LTM High 20.0 x 11.5 x 7.7 x 8/22/17 22/17 15.0 x 14.6x 10.0 x 5.0 x Jun-15 Dec-15 Jun-16 Dec-16 Jun-17 Dec-17 Jun-18 9 Source: Capital IQ as of June 14, 2018. Median10.8 x Low7.7 x 8/ 15.0 x 6/12/18 15.0 x 6/12/18 P / FY + 1 EPS FY+1 P / E 6/14/18 9.2 x 6/14/18 FY+1 EBITDA Median9.4 x EV / FY+1 EBITDALow7.4 x s EV / Last High 9.2 x Median 7.0 x Low 5.5 x 16.2 x 12/9/16 12.5 x 7/20/17 . EV / LTM EBITDA EV / LTM EBITDA and EV / FY+1 EBITDA
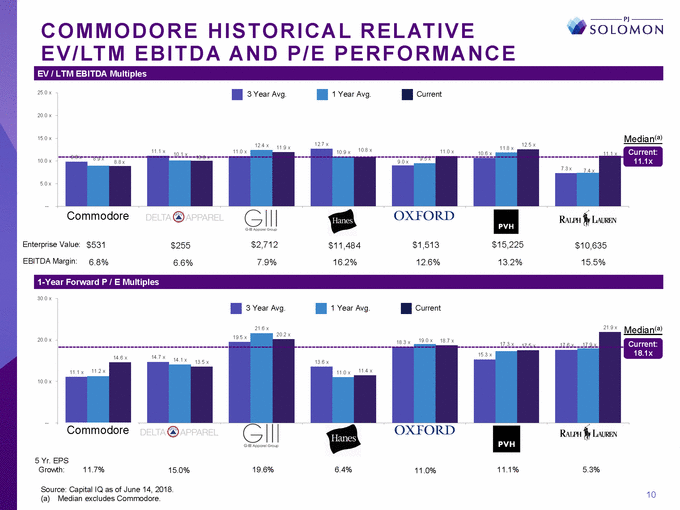
C O M M O D O R EH I S T O R I C A L R E L AT I V E E V / LT M E B I T D A A N DP / E P E R F O R M A N C E 25.0 x 20.0 x an(a) ent: 1x 15.0 x 12.7 x 12.5 x 12.4 x 11.9 x 11.8 x 10.8 x 11.1 x 11.0 x 10.9 x 11.0 x 10.6 x 10.1 x 9.8 x 10.0 x 8.9 x 10.0 x 8.8 x 5.0 x --CommPERoY dore DLA GIII HBI OXM PVH RL Enterprise Value: $531 6.8% $2,712 7.9% $1,513 12.6% $15,225 13.2% $255 6.6% $11,484 16.2% $10,635 15.5% EBITDA Margin: 30.0 x an(a) ent: 20.0 x 19.0 x 18.7 x 18.3 x 17.3 x 17.9 x 17.5 x 17.6 x .1x 14.1 x 13.5 x 10.0 x --CommPERoY dore DLA GIII HBI OXM PVH RL 5 Yr. EPS Growth: 11.7% 19.6% 6.4% 11.1% 5.3% 15.0% 11.0% Source: Capital IQ as of June 14, 2018. (a) Median excludes Commodore. 10 3 Year Avg.1 Year Avg.Current 21.6 x 21.9 x Medi 19.5 x 20.2 x Curr 14.6 x 14.7 x 13.6 x 18 15.3 x 11.1 x 11.2 x 11.0 x 11.4 x 1-Year Forward P / E Multiples 3 Year Avg.1 Year Avg.Current Medi 11.1 x Curr 9.5 x 9.0 x 7.3 x 7.4 x 11. EV / LTM EBITDA Multiples
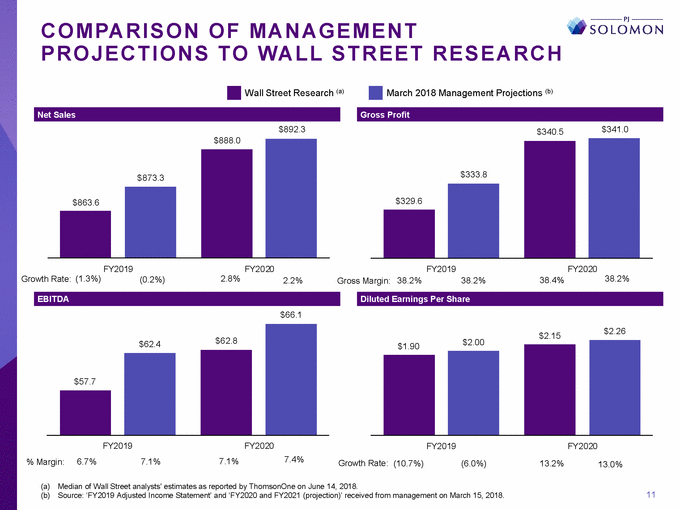
C O M PA R I S O NO FM A N A G E M E N T P R O J E C T I O N S T OWA L L S T R E E T R E S E A R C H Wall Street Research (a) March 2018 Management Projections (b) $892.3 $341.0 $340.5 FY2019 FY2020 FY2019 FY2020 Growth Rate: (1.3%) 2.8% 38.2% (0.2%) 38.4% 2.2% Gross Margin: 38.2% 38.2% $66.1 $2.26 $2.15 $2.00 $1.90 FY2019 FY2020 FY2019 FY2020 7.4% 6.7% 7.1% 7.1% % Margin: Growth Rate: (10.7%) (6.0%) 13.2% 13.0% (a) Median of Wall Street analysts' estimates as reported by ThomsonOne on June 14, 2018. (b) Source: ‘FY2019 Adjusted Income Statement’ and ‘FY2020 and FY2021 (projection)’ received from management on March 15, 2018. 11 $62.4$62.8 $57.7 Diluted Earnings Per Share EBITDA $333.8 $329.6 $888.0 $873.3 $863.6 Gross Profit Net Sales
VALUATION 12

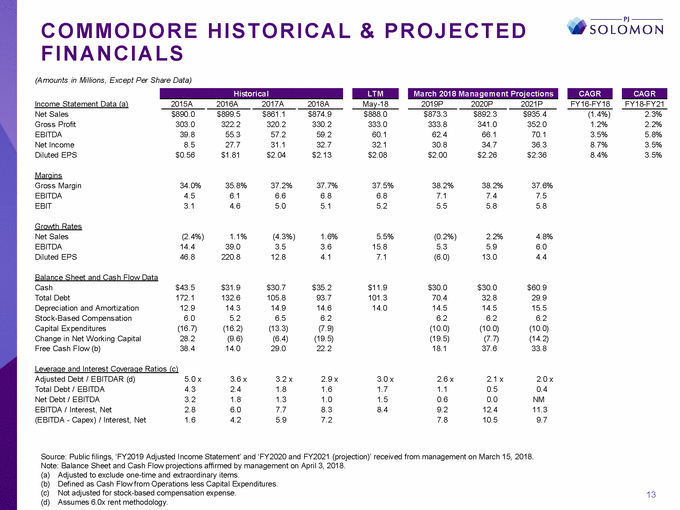
C O M M O D O R E F I N A N C I A L S (Amounts in Millions, Except Per Share Data) H I S T O R I C A L &P R O J E C T E D Income Statement Data (a) 2015A 2016A 2017A 2018A May-18 2019P 2020P 2021P FY16-FY18 FY18-FY21 Net Sales Gross Profit EBITDA Net Income Diluted EPS $888.0 333.0 60.1 32.1 $2.08 (1.4%) 1.2% 3.5% 8.7% 8.4% 2.3% 2.2% 5.8% 3.5% 3.5% 303.0 39.8 8.5 $0.56 322.2 55.3 27.7 $1.81 320.2 57.2 31.1 $2.04 330.2 59.2 32.7 $2.13 333.8 62.4 30.8 $2.00 341.0 66.1 34.7 $2.26 352.0 70.1 36.3 $2.36 Margins Gross Margin EBITDA EBIT 34.0% 4.5 3.1 35.8% 6.1 4.6 37.2% 6.6 5.0 37.7% 6.8 5.1 37.5% 6.8 5.2 38.2% 7.1 5.5 38.2% 7.4 5.8 37.6% 7.5 5.8 Growth Rates Net Sales EBITDA Diluted EPS (2.4%) 14.4 46.8 1.1% 39.0 220.8 (4.3%) 3.5 12.8 1.6% 3.6 4.1 5.5% 15.8 7.1 (0.2%) 5.3 (6.0) 2.2% 5.9 13.0 4.8% 6.0 4.4 Balance Sheet and Cash Flow Data Cash Total Debt Depreciation and Amortization Stock-Based Compensation Capital Expenditures Change in Net Working Capital Free Cash Flow (b) $43.5 172.1 12.9 6.0 (16.7) 28.2 38.4 $31.9 132.6 14.3 5.2 (16.2) (9.6) 14.0 $30.7 105.8 14.9 6.5 (13.3) (6.4) 29.0 $35.2 93.7 14.6 6.2 (7.9) (19.5) 22.2 $11.9 101.3 14.0 $30.0 70.4 14.5 6.2 (10.0) (19.5) 18.1 $30.0 32.8 14.5 6.2 (10.0) (7.7) 37.6 $60.9 29.9 15.5 6.2 (10.0) (14.2) 33.8 Leverage and Interest Coverage Ratios (c) Adjusted Debt / EBITDAR (d) Total Debt / EBITDA Net Debt / EBITDA EBITDA / Interest, Net (EBITDA - Capex) / Interest, Net 5.0 x 4.3 3.2 2.8 1.6 3.6 x 2.4 1.8 6.0 4.2 3.2 x 1.8 1.3 7.7 5.9 2.9 x 1.6 1.0 8.3 7.2 3.0 x 1.7 1.5 8.4 2.6 x 1.1 0.6 9.2 7.8 2.1 x 0.5 0.0 12.4 10.5 2.0 x 0.4 NM 11.3 9.7 Source: Public filings, ‘FY2019 Adjusted Income Statement’ and ‘FY2020 and FY2021 (projection)’ received from management on March 15, 2018. Note: Balance Sheet and Cash Flow projections affirmed by management on April 3, 2018. (a) (b) (c) (d) Adjusted to exclude one-time and extraordinary items. Defined as Cash Flow from Operations less Capital Expenditures. Not adjusted for stock-based compensation expense. Assumes 6.0x rent methodology. 13 $873.3 $892.3 $935.4 $890.0 $899.5 $861.1 $874.9 CAGR CAGR March 2018 Management Projections LTM Historical
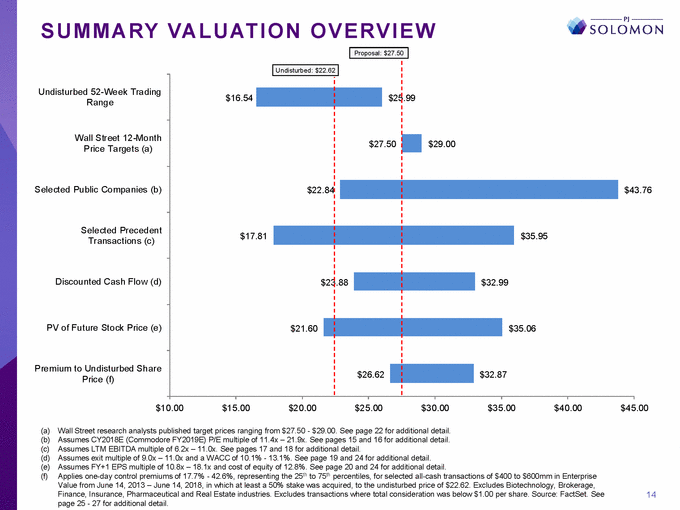
S U M M A RY VA L U AT I O N O V E R V I E W Undisturbed 52-Week Trading Range .99 Wall Street 12-Month Price Targets (a) Selected Public Companies (b) 3.76 Selected Precedent Transactions (c) Discounted Cash Flow (d) PV of Future Stock Price (e) Premium to Undisturbed Share Price (f) $10.00 $15.00 $20.00 $25.00 $30.00 $35.00 $40.00 $45.00 (a) (b) (c) (d) (e) (f) Wall Street research analysts published target prices ranging from $27.50 - $29.00. See page 22 for additional detail. Assumes CY2018E (Commodore FY2019E) P/E multiple of 11.4x – 21.9x. See pages 15 and 16 for additional detail. Assumes LTM EBITDA multiple of 6.2x – 11.0x. See pages 17 and 18 for additional detail. Assumes exit multiple of 9.0x – 11.0x and a WACC of 10.1% - 13.1%. See page 19 and 24 for additional detail. Assumes FY+1 EPS multiple of 10.8x – 18.1x and cost of equity of 12.8%. See page 20 and 24 for additional detail. Applies one-day control premiums of 17.7% - 42.6%, representing the 25th to 75th percentiles, for selected all-cash transactions of $400 to $600mm in Enterprise Value from June 14, 2013 – June 14, 2018, in which at least a 50% stake was acquired, to the undisturbed price of $22.62. Excludes Biotechnology, Brokerage, Finance, Insurance, Pharmaceutical and Real Estate industries. Excludes transactions where total consideration was below $1.00 per share. Source: FactSet. See page 25 - 27 for additional detail. 14 Proposal: $27.50 Undisturbed: $22.62 $16.54 $25 $22.84 $27.50 $29.00 $4 $17.81 $35.95 $23 .88 $32.99 $21.60 $35.06 $26.62 $32.87
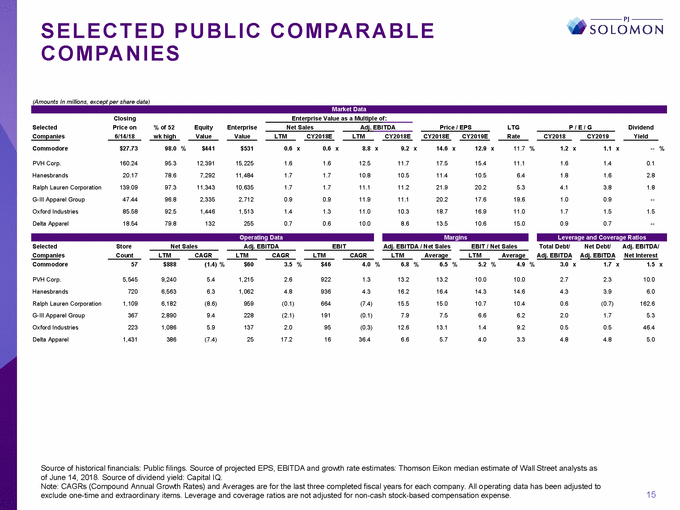
S E L E C T E D P U B L I C C O M PA N I E S C O M PA R A B L E (Amounts In millions, except per share data) Closing Price on 6/14/18 Enterprise Value as a Multiple of: Selected Companies % of 52 wk high Equity Value Enterprise Value Net Sales Adj. EBITDA Price / EPS LTG Rate P / E / G Dividend Yield LTM CY2018E LTM CY2018E CY2018E CY2019E CY2018 CY2019 Commodore $27.73 98.0 % $441 $531 0.6 x 0.6 x 8.8 x 9.2 x 14.6 x 12.9 x 11.7 % 1.2 x 1.1 x --% PVH Corp. Hanesbrands Ralph Lauren Corporation G-III Apparel Group Oxford Industries Delta Apparel 160.24 20.17 139.09 47.44 85.58 18.54 95.3 78.6 97.3 96.8 92.5 79.8 12,391 7,292 11,343 2,335 1,446 132 15,225 11,484 10,635 2,712 1,513 255 1.6 1.7 1.7 0.9 1.4 0.7 1.6 1.7 1.7 0.9 1.3 0.6 12.5 10.8 11.1 11.9 11.0 10.0 11.7 10.5 11.2 11.1 10.3 8.6 17.5 11.4 21.9 20.2 18.7 13.5 15.4 10.5 20.2 17.6 16.9 10.6 11.1 6.4 5.3 19.6 11.0 15.0 1.6 1.8 4.1 1.0 1.7 0.9 1.4 1.6 3.8 0.9 1.5 0.7 0.1 2.8 1.8 --1.5 --Selected Companies Store Count Net Sales Adj. EBITDA EBIT Adj. EBITDA / Net Sales EBIT / Net Sales Total Debt/ Adj. EBITDA Net Debt/ Adj. EBITDA Adj. EBITDA/ Net Interest LTM CAGR LTM CAGR LTM CAGR LTM Average LTM Average Commodore 57 $888 (1.4) % $60 3.5 % $46 4.0 % 6.8 % 6.5 % 5.2 % 4.9 % 3.0 x 1.7 x 1.5 x PVH Corp. Hanesbrands Ralph Lauren Corporation G-III Apparel Group Oxford Industries Delta Apparel 5,545 720 1,109 367 223 1,431 9,240 6,563 6,182 2,890 1,086 386 5.4 6.3 (8.6) 9.4 5.9 (7.4) 1,215 1,062 959 228 137 25 2.6 4.8 (0.1) (2.1) 2.0 17.2 922 936 664 191 95 16 1.3 4.3 (7.4) (0.1) (0.3) 36.4 13.2 16.2 15.5 7.9 12.6 6.6 13.2 16.4 15.0 7.5 13.1 5.7 10.0 14.3 10.7 6.6 1.4 4.0 10.0 14.6 10.4 6.2 9.2 3.3 2.7 4.3 0.6 2.0 0.5 4.8 2.3 3.9 (0.7) 1.7 0.5 4.8 10.0 6.0 162.6 5.3 46.4 5.0 Source of historical financials: Public filings. Source of projected EPS, EBITDA and growth rate estimates: Thomson Eikon median estimate of Wall Street analysts as of June 14, 2018. Source of dividend yield: Capital IQ. Note: CAGRs (Compound Annual Growth Rates) and Averages are for the last three completed fiscal years for each company. All operating data has been adjusted to exclude one-time and extraordinary items. Leverage and coverage ratios are not adjusted for non-cash stock-based compensation expense. 15 Leverage and Coverage Ratios Margins Operating Data Market Data
S U M M A RY VA L U AT I O NB A S E DO NS E L E C T E D P U B L I CC O M PA R A B L EC O M PA N I E S (Amounts in Millions, Except Per Share Data) Adjusted EBITDA Valuation Multiples Implied Enterprise Value Implied Equity Value (a) Implied Per Share Value (b) LTM FY 2019E $60 62 10.0 x 8.6 x - - 12.5 x 11.7 x $604 $537 - - $753 $733 $515 $448 - - $664 $643 $32.35 $28.15 - - $41.73 $40.44 EPS FY 2019E FY 2020E $2.00 2.26 11.4 x 10.5 x - - 21.9 x 20.2 x $22.84 $23.74 - - $43.76 $45.66 Source: 8-K issued May 31, 2018 and ‘FY2019 Adjusted Income Statement’ and ‘FY2020 and FY2021 (projection)’ received from management on March 15, 2018. Note: FY2019 and FY2020 multiple ranges correspond to CY2018 and CY2019 comparable companies, respectively. (a) Based on pro forma cash of $11.9mm and debt of $101.3mm. Represents cash of $50.5mm and total debt of $144.8mm as of May 5, 2018 adjusted for the May 29, 2018 redemption of $49.9mm of senior subordinated notes funded by $4.9mm of investments, $38.6mm of cash and $6.4mm of additional revolver draw as discussed with management on May 30, 2018. (b) 15.9mm shares outstanding as of June 14, 2018. Source: Company provided figures. Includes 0.004mm option equivalent shares utilizing the treasury stock method, 0.01mm SAR equivalent shares utilizing the treasury stock method and 0.01mm restricted stock units. 16

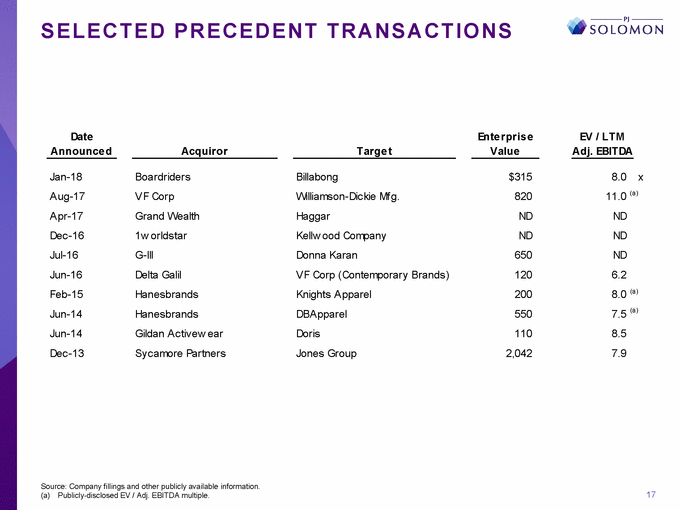
S E L E C T E D P R E C E D E N T T R A N S A C T I O N S Date Announce d Ente rpris e Value EV / LTM Adj. EBITDA Acquiror Targe t Jan-18 Aug-17 Apr-17 Dec-16 Jul-16 Jun-16 Feb-15 Jun-14 Jun-14 Dec-13 Boardriders Billabong $315 820 ND ND 650 120 200 550 110 2,042 8.0 x 11.0 (a) VF Corp Grand Wealth 1w orldstar G-III Delta Galil Hanesbrands Hanesbrands Gildan Activew ear Sycamore Partners Williamson-Dickie Mf g. Haggar Kellw ood Company Donna Karan VF Corp (Contemporary Brands) Knights Apparel DBApparel Doris Jones Group ND ND ND 6.2 8.0 (a) 7.5 (a) 8.5 7.9 Source: Company fillings and other publicly available information. (a) Publicly-disclosed EV / Adj. EBITDA multiple. 17
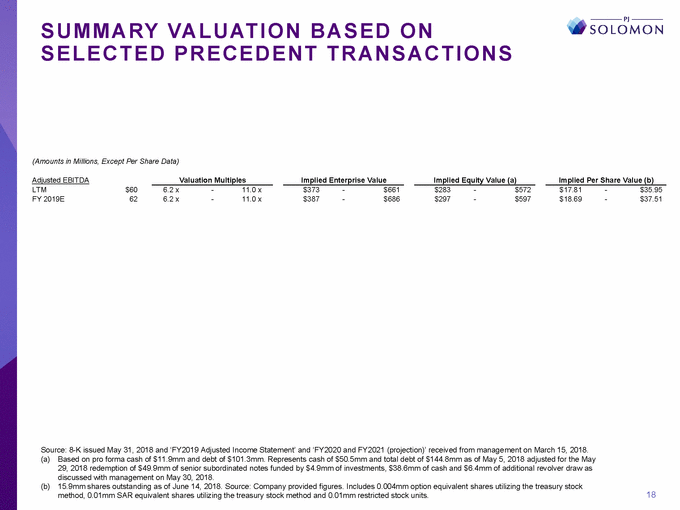
S U M M A RY VA L U AT I O NB A S E DO N S E L E C T E D P R E C E D E N T T R A N S A C T I O N S (Amounts in Millions, Except Per Share Data) Adjusted EBITDA Valuation Multiples Implied Enterprise Value Implied Equity Value (a) Implied Per Share Value (b) LTM FY 2019E $60 62 6.2 x 6.2 x - - 11.0 x 11.0 x $373 $387 - - $661 $686 $283 $297 - - $572 $597 $17.81 $18.69 - - $35.95 $37.51 Source: 8-K issued May 31, 2018 and ‘FY2019 Adjusted Income Statement’ and ‘FY2020 and FY2021 (projection)’ received from management on March 15, 2018. (a) Based on pro forma cash of $11.9mm and debt of $101.3mm. Represents cash of $50.5mm and total debt of $144.8mm as of May 5, 2018 adjusted for the May 29, 2018 redemption of $49.9mm of senior subordinated notes funded by $4.9mm of investments, $38.6mm of cash and $6.4mm of additional revolver draw as discussed with management on May 30, 2018. (b) 15.9mm shares outstanding as of June 14, 2018. Source: Company provided figures. Includes 0.004mm option equivalent shares utilizing the treasury stock method, 0.01mm SAR equivalent shares utilizing the treasury stock method and 0.01mm restricted stock units. 18
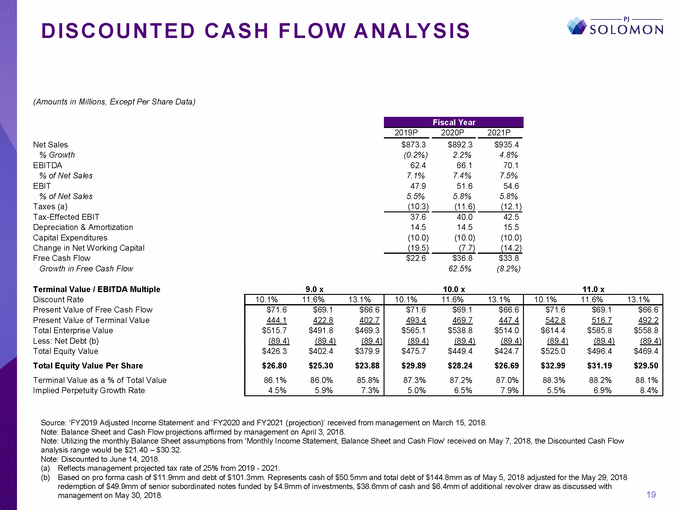
D I S C O U N T E D C A S H F L O W A N A LY S I S (Amounts in Millions, Except Per Share Data) 2019P 2020P 2021P Net Sales % Growth EBITDA % of Net Sales EBIT % of Net Sales Taxes (a) Tax-Effected EBIT Depreciation & Amortization Capital Expenditures Change in Net Working Capital Free Cash Flow Growth in Free Cash Flow (0.2%) 62.4 7.1% 47.9 5.5% (10.3) 2.2% 66.1 7.4% 51.6 5.8% (11.6) 4.8% 70.1 7.5% 54.6 5.8% (12.1) 14.5 (10.0) (19.5) 14.5 (10.0) (7.7) 15.5 (10.0) (14.2) 62.5% (8.2%) Terminal Value / EBITDA Multiple Discount Rate Present Value of Free Cash Flow Present Value of Terminal Value Total Enterprise Value Less: Net Debt (b) Total Equity Value Total Equity Value Per Share Terminal Value as a % of Total Value Implied Perpetuity Growth Rate 9.0 x 10.0 x 11.0 x Source: ‘FY2019 Adjusted Income Statement’ and ‘FY2020 and FY2021 (projection)’ received from management on March 15, 2018. Note: Balance Sheet and Cash Flow projections affirmed by management on April 3, 2018. Note: Utilizing the monthly Balance Sheet assumptions from ‘Monthly Income Statement, Balance Sheet and Cash Flow’ received on May 7, 2018, the Discounted Cash Flow analysis range would be $21.40 – $30.32. Note: Discounted to June 14, 2018. (a) Reflects management projected tax rate of 25% from 2019 - 2021. (b) Based on pro forma cash of $11.9mm and debt of $101.3mm. Represents cash of $50.5mm and total debt of $144.8mm as of May 5, 2018 adjusted for the May 29, 2018 redemption of $49.9mm of senior subordinated notes funded by $4.9mm of investments, $38.6mm of cash and $6.4mm of additional revolver draw as discussed with management on May 30, 2018. 19 10.1%11.6%13.1% 10.1%11.6%13.1% 10.1%11.6%13.1% $71.6$69.1$66.6 444.1422.8402.7 $515.7$491.8$469.3 (89.4)(89.4)(89.4) $426.3$402.4$379.9 $26.80$25.30$23.88 86.1%86.0%85.8% 4.5%5.9%7.3% $71.6$69.1$66.6 493.4469.7447.4 $565.1$538.8$514.0 (89.4)(89.4)(89.4) $475.7$449.4$424.7 $29.89$28.24$26.69 87.3%87.2%87.0% 5.0%6.5%7.9% $71.6$69.1$66.6 542.8516.7492.2 $614.4$585.8$558.8 (89.4)(89.4)(89.4) $525.0$496.4$469.4 $32.99$31.19$29.50 88.3%88.2%88.1% 5.5%6.9%8.4% $22.6 $36.8 $33.8 37.6 40.0 42.5 $873.3 $892.3 $935.4 Fiscal Year
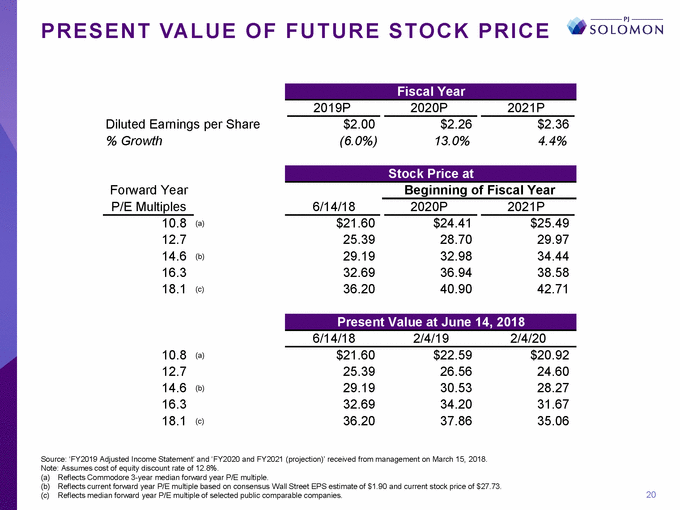
P R E S E N T VA L U EO F F U T U R E S T O C K P R I C E 2019P 2020P 2021P Diluted Earnings per Share % Growth (6.0%) 13.0% 4.4% Forward Year P/E Multiples Beginning of Fiscal Year 6/14/18 2020P 2021P 10.8 12.7 14.6 16.3 18.1 (a) 25.39 29.19 32.69 36.20 28.70 32.98 36.94 40.90 29.97 34.44 38.58 42.71 (b) (c) 6/14/18 2/4/19 2/4/20 10.8 12.7 14.6 16.3 18.1 $21.60 25.39 29.19 32.69 36.20 $22.59 26.56 30.53 34.20 37.86 $20.92 24.60 28.27 31.67 35.06 (a) (b) (c) Source: ‘FY2019 Adjusted Income Statement’ and ‘FY2020 and FY2021 (projection)’ received from management on March 15, 2018. Note: Assumes cost of equity discount rate of 12.8%. (a) (b) (c) Reflects Commodore 3-year median forward year P/E multiple. Reflects current forward year P/E multiple based on consensus Wall Street EPS estimate of $1.90 and current stock price of $27.73. Reflects median forward year P/E multiple of selected public comparable companies. 20 Present Value at June 14, 2018 $21.60 $24.41 $25.49 Stock Price at $2.00 $2.26 $2.36 Fiscal Year
APPENDIX 21

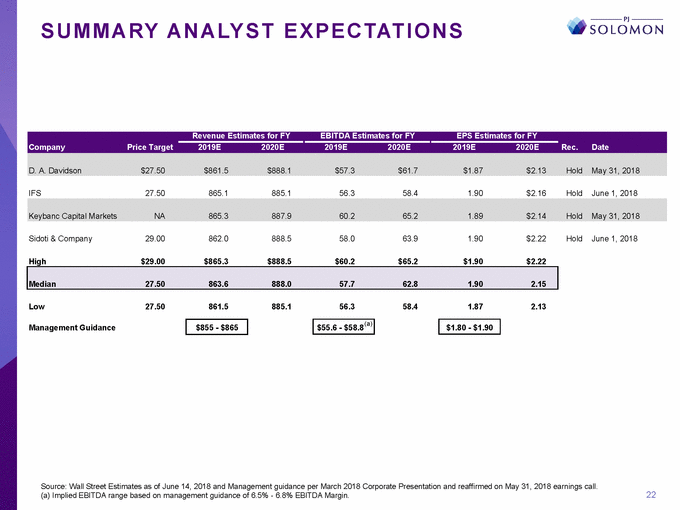
S U M M A RY A N A LY S TE X P E C TAT I O N S IFS 27.50 865.1 885.1 56.3 58.4 1.90 $2.16 Hold June 1, 2018 Sidoti & Company 29.00 862.0 888.5 58.0 63.9 1.90 $2.22 Hold June 1, 2018 High $29.00 $865.3 $888.5 $60.2 $65.2 $1.90 $2.22 Low 27.50 861.5 885.1 56.3 58.4 1.87 2.13 Management Guidance Source: Wall Street Estimates as of June 14, 2018 and Management guidance per March 2018 Corporate Presentation and reaffirmed on May 31, 2018 earnings call. (a) Implied EBITDA range based on management guidance of 6.5% - 6.8% EBITDA Margin. 22 $55.6 - $58.8(a) $855 - $865 $1.80 - $1.90 Median27.50863.6888.057.762.81.902.15 Keybanc Capital MarketsNA865.3887.960.265.21.89$2.14Hold May 31, 2018 Revenue Estimates for FYEBITDA Estimates for FYEPS Estimates for FY CompanyPrice Target2019E2020E2019E2020E2019E2020ERec.Date D. A. Davidson$27.50$861.5$888.1$57.3$61.7$1.87$2.13Hold May 31, 2018
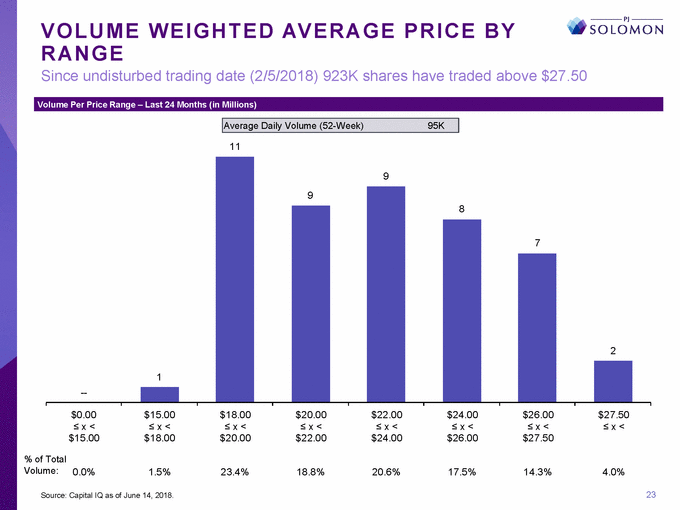
V O L U M EW E I G H T E D AV E R A G EP R I C E B Y R A N G E Since undisturbed trading date (2/5/2018) 923K shares have traded above $27.50 11 $0.00 < x < $15.00 $15.00 < x < $18.00 $18.00 < x < $20.00 $20.00 < x < $22.00 $22.00 < x < $24.00 $24.00 < x < $26.00 $26.00 < x < $27.50 $27.50 < x < % of Total Volume: 0.0% 1.5% 23.4% 18.8% 20.6% 17.5% 14.3% 4.0% 23 Source: Capital IQ as of June 14, 2018. 1 9 9 8 7 2 --Average Daily Volume (52-Week)95K Volume Per Price Range – Last 24 Months (in Millions)
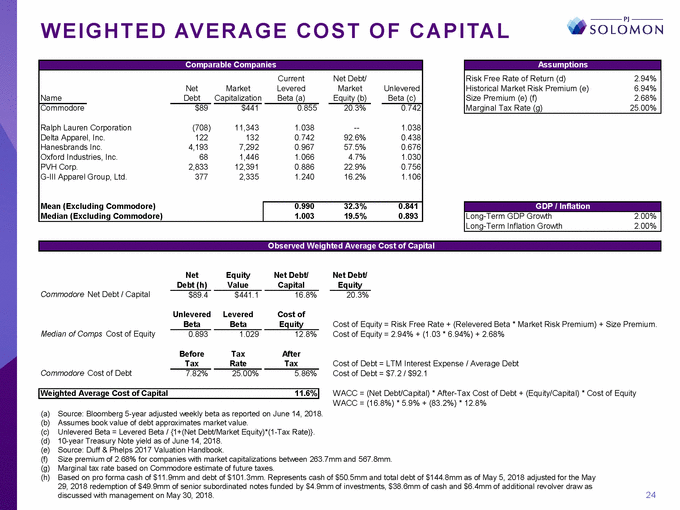
W E I G H T E D AV E R A G E C O S TO FC A P I TA L arel, Inc. 122 132 0.742 92.6% 0.438 Net Debt (h) Equity Value Net Debt/ Capital Net Debt/ Equity Commodore Net Debt / Capital Unlevered Beta Levered Beta Cost of Equity Cost of Equity = Risk Free Rate + (Relevered Beta * Market Risk Premium) + Size Premium. Cost of Equity = 2.94% + (1.03 * 6.94%) + 2.68% Median of Comps Cost of Equity Before Tax Tax Rate After Tax Cost of Debt = LTM Interest Expense / Average Debt Cost of Debt = $7.2 / $92.1 Commodore Cost of Debt WACC = (Net Debt/Capital) * After-Tax Cost of Debt + (Equity/Capital) * Cost of Equity WACC = (16.8%) * 5.9% + (83.2%) * 12.8% (a) (b) (c) (d) (e) (f) (g) (h) Source: Bloomberg 5-year adjusted weekly beta as reported on June 14, 2018. Assumes book value of debt approximates market value. Unlevered Beta = Levered Beta / {1+(Net Debt/Market Equity)*(1-Tax Rate)}. 10-year Treasury Note yield as of June 14, 2018. Source: Duff & Phelps 2017 Valuation Handbook. Size premium of 2.68% for companies with market capitalizations between 263.7mm and 567.8mm. Marginal tax rate based on Commodore estimate of future taxes. Based on pro forma cash of $11.9mm and debt of $101.3mm. Represents cash of $50.5mm and total debt of $144.8mm as of May 5, 2018 adjusted for the May 29, 2018 redemption of $49.9mm of senior subordinated notes funded by $4.9mm of investments, $38.6mm of cash and $6.4mm of additional revolver draw as discussed with management on May 30, 2018. 24 Weighted Average Cost of Capital 11.6% 7.82% 25.00% 5.86% 0.893 1.029 12.8% 20.3% $89.4 $441.1 16.8% Observed Weighted Average Cost of Capital GDP / Inflation Long-Term GDP Growth 2.00% Long-Term Inflation Growth 2.00% Assumptions Risk Free Rate of Return (d) 2.94% Historical Market Risk Premium (e) 6.94% Size Premium (e) (f) 2.68% Marginal Tax Rate (g) 25.00% Comparable Companies Name Current Net Debt/ Net Market Levered Market Unlevered Debt Capitalization Beta (a) Equity (b) Beta (c) Commodore Ralph Lauren Delta App Hanesbrands Oxford Indust PVH Corp. G-III Apparel Mean (Exclu Median (Exc 20.3% 0.742 Corporation (708) 11,343 1.038 --1.038 Inc. 4,193 7,292 0.967 57.5% 0.676 ries, Inc. 68 1,446 1.066 4.7% 1.030 2,833 12,391 0.886 22.9% 0.756 Group, Ltd. 377 2,335 1.240 16.2% 1.106 ding Commodore) luding Commodore) 0.990 32.3% 0.841 1.003 19.5% 0.893 $89 $441 0.855
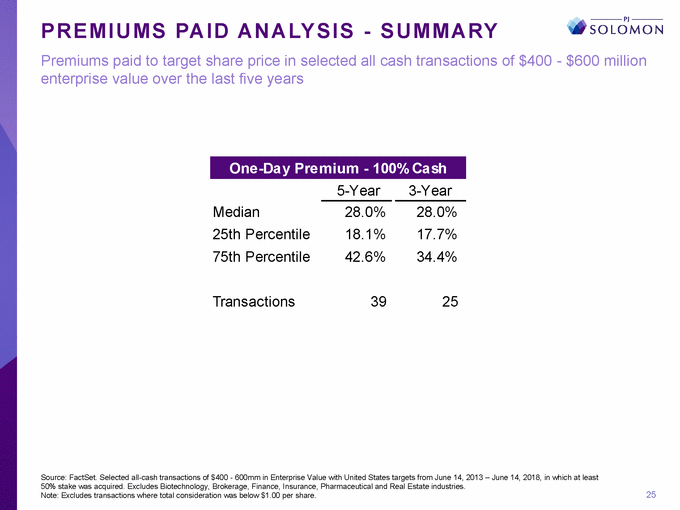
P R E M I U M SPA I D A N A LY S I S-S U M M A RY Premiums paid to target share price in selected all cash transactions of $400 - $600 million enterprise value over the last five years 5-Year 3-Year Median 25th Percentile 75th Percentile 18.1% 42.6% 17.7% 34.4% Transactions 39 25 Source: FactSet. Selected all-cash transactions of $400 - 600mm in Enterprise Value with United States targets from June 14, 2013 – June 14, 2018, in which at least 50% stake was acquired. Excludes Biotechnology, Brokerage, Finance, Insurance, Pharmaceutical and Real Estate industries. Note: Excludes transactions where total consideration was below $1.00 per share. 25 28.0% 28.0% One-Day Premium - 100% Cash
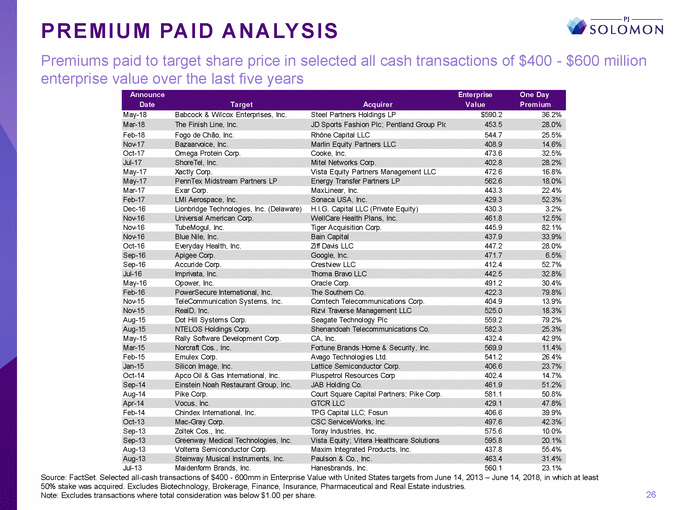
P R E M I U MPA I D A N A LY S I S Premiums paid to target share price in selected all cash transactions of $400 - $600 million enterprise value over the last five years May-18 Babcock & Wilcox Enterprises, Inc. Steel Partners Holdings LP $590.2 36.2% Feb-18 Fogo de Chão, Inc. Rhône Capital LLC 544.7 25.5% Nov-17 Bazaarvoice, Inc. Marlin Equity Partners LLC 408.9 14.6% Oct-17 Omega Protein Corp. Cooke, Inc. 473.6 32.5% Jul-17 ShoreTel, Inc. Mitel Networks Corp. 402.8 28.2% May-17 Xactly Corp. Vista Equity Partners Management LLC 472.6 16.8% May-17 PennTex Midstream Partners LP Energy Transfer Partners LP 562.6 18.0% Mar-17 Exar Corp. MaxLinear, Inc. 443.3 22.4% Feb-17 LMI Aerospace, Inc. Sonaca USA, Inc. 429.3 52.3% Dec-16 Lionbridge Technologies, Inc. (Delaware) H.I.G. Capital LLC (Private Equity) 430.3 3.2% Nov-16 Universal American Corp. WellCare Health Plans, Inc. 461.8 12.5% Nov-16 TubeMogul, Inc. Tiger Acquisition Corp. 445.9 82.1% Nov-16 Blue Nile, Inc. Bain Capital 437.9 33.9% Oct-16 Everyday Health, Inc. Ziff Davis LLC 447.2 28.0% Sep-16 Apigee Corp. Google, Inc. 471.7 6.5% Sep-16 Accuride Corp. Crestview LLC 412.4 52.7% Jul-16 Imprivata, Inc. Thoma Bravo LLC 442.5 32.8% May-16 Opower, Inc. Oracle Corp. 491.2 30.4% Feb-16 PowerSecure International, Inc. The Southern Co. 422.3 79.8% Nov-15 TeleCommunication Systems, Inc. Comtech Telecommunications Corp. 404.9 13.9% Nov-15 RealD, Inc. Rizvi Traverse Management LLC 525.0 18.3% Aug-15 Dot Hill Systems Corp. Seagate Technology Plc 559.2 79.2% Aug-15 NTELOS Holdings Corp. Shenandoah Telecommunications Co. 582.3 25.3% May-15 Rally Software Development Corp. CA, Inc. 432.4 42.9% Mar-15 Norcraft Cos., Inc. Fortune Brands Home & Security, Inc. 569.9 11.4% Feb-15 Emulex Corp. Avago Technologies Ltd. 541.2 26.4% Jan-15 Silicon Image, Inc. Lattice Semiconductor Corp. 406.6 23.7% Oct-14 Apco Oil & Gas International, Inc. Pluspetrol Resources Corp 402.4 14.7% Sep-14 Einstein Noah Restaurant Group, Inc. JAB Holding Co. 461.9 51.2% Aug-14 Pike Corp. Court Square Capital Partners; Pike Corp. 581.1 50.8% Apr-14 Vocus, Inc. GTCR LLC 429.1 47.8% Feb-14 Chindex International, Inc. TPG Capital LLC; Fosun 406.6 39.9% Oct-13 Mac-Gray Corp. CSC ServiceWorks, Inc. 497.6 42.3% Sep-13 Zoltek Cos., Inc. Toray Industries, Inc. 575.6 10.0% Sep-13 Greenway Medical Technologies, Inc. Vista Equity; Vitera Healthcare Solutions 595.8 20.1% Aug-13 Volterra Semiconductor Corp. Maxim Integrated Products, Inc. 437.8 55.4% Aug-13 Steinway Musical Instruments, Inc. Paulson & Co., Inc. 463.4 31.4% Jul-13 Maidenform Brands, Inc. Hanesbrands, Inc. 560.1 23.1% Source: FactSet. Selected all-cash transactions of $400 - 600mm in Enterprise Value with United States targets from June 14, 2013 – June 14, 2018, in which at least 50% stake was acquired. Excludes Biotechnology, Brokerage, Finance, Insurance, Pharmaceutical and Real Estate industries. Note: Excludes transactions where total consideration was below $1.00 per share. 26 Mar-18The Finish Line, Inc.JD Sports Fashion Plc; Pentland Group Plc453.528.0% AnnounceEnterpriseOne Day DateTargetAcquirerValuePremium
D I S C L A I M E R This presentation has been prepared by PJ SOLOMON (“SOLOMON”) from materials and information supplied (whether orally or in writing) by Perry Ellis International, Inc. (“Commodore” or the “Company”) and other sources. This presentation is for discussion purposes only and is incomplete without reference to, and should be viewed in conjunction with, the oral briefing as well as the qualifications, limitations and assumptions in the letter provid ed by SOLOMON. This presentation includes certain statements, estimates and projections provided by the Company with respect to the historic al and anticipated future performance of the Company. Such statements, estimates and projections contain or are based on significant assumptions and subjective judgment s made by the Company’s management. These assumptions and judgments may or may not be correct, and there can be no assurance that any projected results are attainable or will be realized. SOLOMON has not attempted to verify any such statements, estimates and projections, and as such SOLOMON makes no representation or warranty as to, and assumes no responsibility for, their accuracy or completeness and for the effect which any such inaccuracy or incompleteness may have on the results or judgments contained in this presentation. Except where otherwise indicated, this analysis speaks as of the date hereof. Under no circumstances should the delivery of this document imply that the analysis would be the same if made as of any other date. This presentation and the information contained herein do not constitute an offer to sell or the solicitation of an offer to buy a ny security, commodity or instrument or related derivative, nor do they constitute an offer or commitment to lend, syndicate or arrange a financing, underwrite or pu rchase or act as an agent or advisor or in any other capacity with respect to any transaction, or commit capital, or to participate in any trading strategies, and do no t constitute legal, regulatory, accounting or tax advice to the recipient. We recommend that the recipient seek independent third party legal, regulatory, accounting and tax advice regarding the contents of this presentation. This presentation is not a research report and was not prepared by the research department of SOLOMON or any of its affiliates. THIS PRESENTATION HAS BEEN ISSUED FOR THE INFORMATION AND ASSISTANCE OF THE SPECIAL COMMITTEE OF THE BOARD OF DIRECTORS OF THE COMPANY. IT IS NOT INTENDED TO BE USED OR RELIED UPON, AND SHOULD NOT AND CANNOT BE USED OR RELIED UPON, BY ANY OTHER PERSON. THIS PRESENTATION IS CONFIDENTIAL AND SHOULD NOT, WITHOUT PRIOR WRITTEN CONSENT OF SOLOMON, BE COPIED OR MADE AVAILABLE TO ANY PERSON OTHER THAN THE SPECIAL COMMITTEE OF THE BOARD OF DIRECTORS OF THE COMPANY. SOLOMON SHALL NOT HAVE LIABILITY, WHETHER DIRECT OR INDIRECT, IN CONTRACT OR TORT OR OTHERWISE, TO ANY PERSON IN CONNECTION WITH THIS PRESENTATION. 27
