
©2024 Myriad Genetics, Inc. 42nd Annual J.P. Morgan Healthcare Conference J A N U A R Y 1 0 , 2 0 2 4 ©2024 Myriad Genetics, Inc.

©2024 Myriad Genetics, Inc. Some of the information presented here today contains projections or other forward-looking statements regarding future events or the future financial performance of the Company. FORWARD-LOOKING STATEMENTS AND DISCLAIMERS These statements are based on management’s current expectations and the actual events or results may differ materially and adversely from these expectations. We refer you to the documents the Company files from time to time with the Securities and Exchange Commission, specifically, the Company’s annual report on Form 10-K, its quarterly reports on Form 10-Q, and its current reports on Form 8-K. These documents identify important risk factors that could cause the actual results to differ materially from those contained in the Company’s projections or forward-looking statements. All third-party marks—® and ™—are the property of their respective owners. Certain market and industry data has been obtained from third- party sources, which the Company believes are reliable, but the Company has not independently verified the information provided by third-party sources. Unless otherwise noted, market growth rates used in this presentation are estimates based on Company and third-party industry research. NON-GAAP FINANCIAL MEASURES In this presentation, the Company’s financial results and financial guidance are provided in accordance with accounting principles generally accepted in the United States (GAAP) and using certain non-GAAP financial measures. Management believes that presentation of operating results using non-GAAP financial measures provides useful supplemental information to investors and facilitates the analysis of the Company’s core operating results and comparison of operating results across reporting periods. Management also uses non-GAAP financial measures to establish budgets and to manage the Company’s business. Definitions of the non-GAAP financial measures and a reconciliation of the GAAP to non-GAAP financial results are provided in the Appendix to this presentation. Forward-looking statements and Non-GAAP financial measures 2

©2024 Myriad Genetics, Inc. Moving from transformation to innovation and growth Revealing the power of genetic science – for everyone Mission We advance health and well-being for all, empowering every individual by revealing the answers inside each of us. Vision As a leader in genetic testing and precision medicine, we provide insights that help people take control of their health and enable healthcare providers to better detect, treat and prevent disease. 3
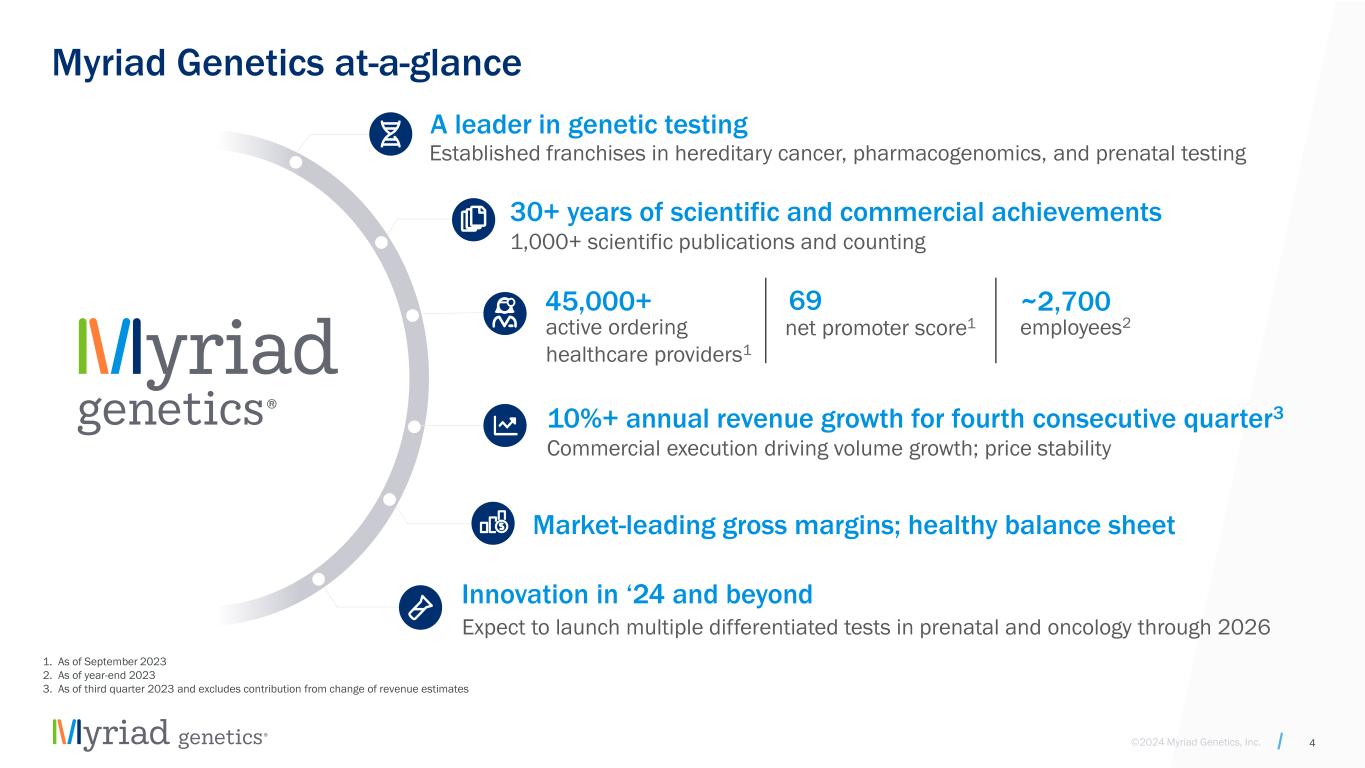
©2024 Myriad Genetics, Inc. Myriad Genetics at-a-glance 45,000+ active ordering healthcare providers1 10%+ annual revenue growth for fourth consecutive quarter3 Commercial execution driving volume growth; price stability A leader in genetic testing Established franchises in hereditary cancer, pharmacogenomics, and prenatal testing 30+ years of scientific and commercial achievements 69 net promoter score1 ~2,700 employees2 1,000+ scientific publications and counting Market-leading gross margins; healthy balance sheet Innovation in ‘24 and beyond Expect to launch multiple differentiated tests in prenatal and oncology through 2026 1. As of September 2023 2. As of year-end 2023 3. As of third quarter 2023 and excludes contribution from change of revenue estimates 4
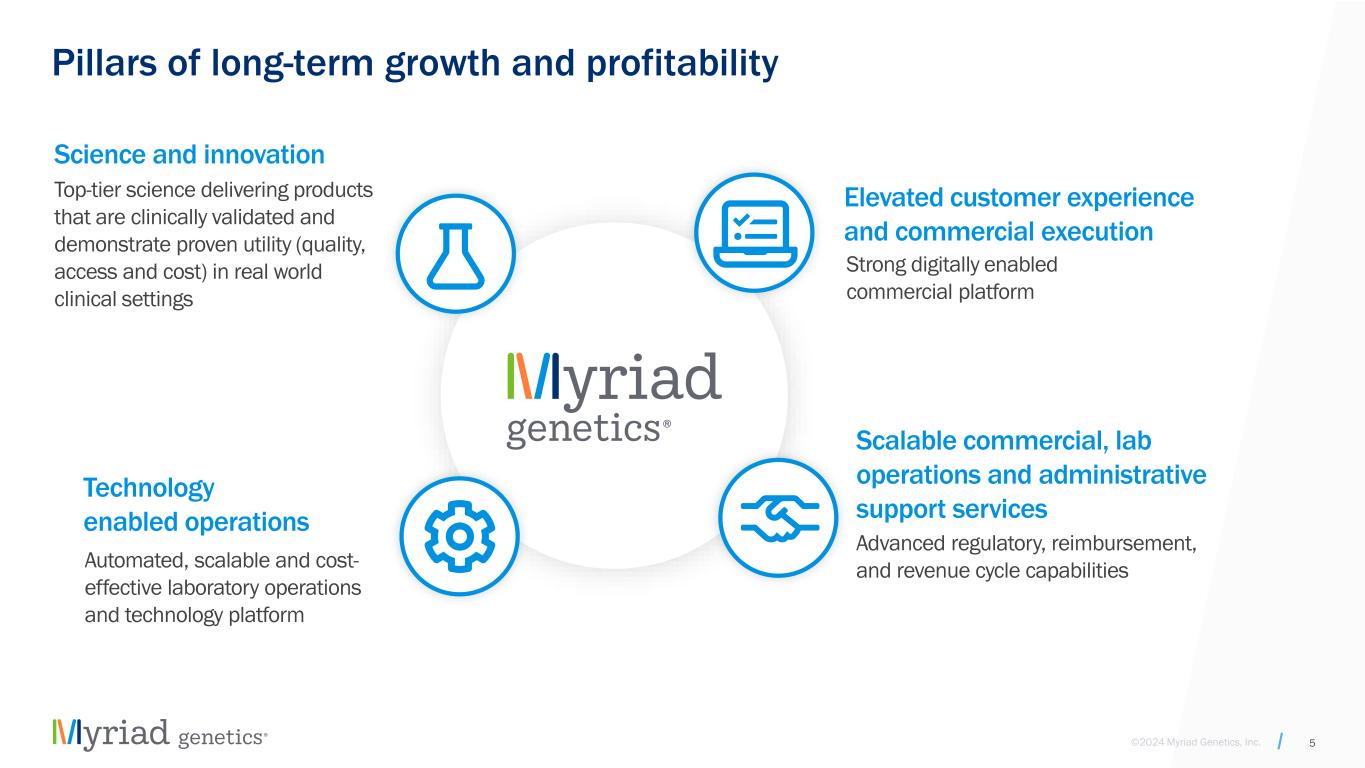
©2024 Myriad Genetics, Inc. Top-tier science delivering products that are clinically validated and demonstrate proven utility (quality, access and cost) in real world clinical settings Automated, scalable and cost- effective laboratory operations and technology platform Strong digitally enabled commercial platform Advanced regulatory, reimbursement, and revenue cycle capabilities Science and innovation Technology enabled operations Elevated customer experience and commercial execution Scalable commercial, lab operations and administrative support services 5 Pillars of long-term growth and profitability

©2024 Myriad Genetics, Inc. 3 focus areas: Oncology, Women's Health and Pharmacogenomics Using genetic insights to help physicians understand how genetic alterations impact patient response to antidepressants and other drugs. Psychiatrist Primary Care Nurse Practitioner/Physician Assistant $5 Billion Pharmacogenomics Actionable Market Size* Business Channel Customer Source: Data as of 2022 from third-party global consulting firm and internal Company estimates 6 A leader in health and wellness with differentiated genetic insights for women of all ancestries, assessing cancer risk and offering prenatal solutions. OB/GYN Maternal Fetal Medicine Primary Care Genetic Counselor $5 Billion Women’s Health Clarifying cancer treatment with genetic and genomic insights and companion diagnostic tests that are designed to work with corresponding drugs and treatments. Oncologist Surgeon Urologist Genetic Counselor $23 Billion Oncology 2024E Launch expected 2024E Launch expected 2025E Launch expected

©2024 Myriad Genetics, Inc. Oncology Women’s Health PGx AFFECTED HCT + GERMLINE TUMOR PROFILING3 MRD HRD2 UROLOGY PRENATAL UNAFFECTED HCT PGx Actionable Market Opp.1 $1.2B $500M $20B+ $350M $600M $2.3B $3B $5B Market Penetration ~65% ~45% <5% ~40% ~35% ~50% <15% ~15% Myriad Products Diversified portfolio within large, fragmented, actionable markets 1: Actionable market indicated against cancers of commercial focus 2: In ovarian, breast, prostate, pancreatic cancers only 3: Reflective of IHC partnership Data as of 2022 from third-party global consulting firm and internal Company estimates <20% of market share concentrated among Top 3 participants <40% average market penetration across all categories Myriad holds Top 3 position in 6 out of 7 active product categories 7 >$30B of actionable market opportunity

©2024 Myriad Genetics, Inc. MyRisk addresses the needs of large and growing markets **Expected ***In cancers of focus Unaffected Market – Hereditary Screening Affected Market – Germline Screening TOTAL U.S. POPULATION ~332M TOTAL U.S. POPULATION WHO WOULD QUALIFY FOR HCT ~50M* TOTAL NUMBER OF WOMEN WHO QUALIFY FOR HCT ~25M WOMEN WHO QUALIFY FOR HCT AND ARE ACTIVELY INVOLVED IN THEIR HEALTHCARE ~13M TOTAL NUMBER OF WOMEN WHO ARE NEWLY ELIGBILE FOR HCT IN THE PAST YEAR ~800K TOTAL NEWLY DX PATIENTS ELIGIBLE TO RECEIVE GERMLINE SCREENING ANNUALLY***~860K PATIENTS RECEIVING GERMLINE TESTING ANNUALLY~550K Actionable market size (US only) Market penetration* Market growth** MYGN market share ~$3B 15% High single digits 30% - 35% Actionable market size (US only) Market penetration Market growth** MYGN market share ~$1.2B 65% Mid single digits ~20% 8 *Data as of 2022 from third-party global consulting firm and internal Company estimates

©2024 Myriad Genetics, Inc. 55 65 Q3 '22 Q4 '22 Q1 '23 Q2 '23 Q3 '23 +24% +20% +18% +16% YOY Growth +4% Significant opportunity to accelerate MyRisk growth across Women’s Health, Imaging, Oncology and Urology Figures in thousands MyRisk patient portal MyRisk Medical Management Tool Enhancements RiskScore studies Breast Cancer Risk Assessment Program Panel Expansion | WES (whole exome sequencing) BRAC CDx to NGS 2024 2025 Q3’23 LTM Volume Growth (YOY) 9 +19% Hereditary cancer test volume Roadmap of expected highlights

©2024 Myriad Genetics, Inc. GeneSight is the market-leading PGx test helping address the Nation’s mental health crisis Ordered by tens of thousands of clinicians to inform medication selection and dosing GeneSight designed to help physicians understand how patients will respond to medications used to treat depression, anxiety, ADHD, and other psychiatric conditions. Designed to help physicians and patients avoid multiple medication trials by informing which medications may require dose adjustments, be less likely to work, or have increased risk of side effects. Market-leading psychiatric PGx test and the only test backed by seven clinical studies published in peer-reviewed journals Measures multiple genomic variants for each individual to categorize medications and provide clinical considerations 2 Million + people have taken the GeneSight test 7 Clinical Studies published in peer reviewed journals, including independent randomized controlled trial in JAMA 10
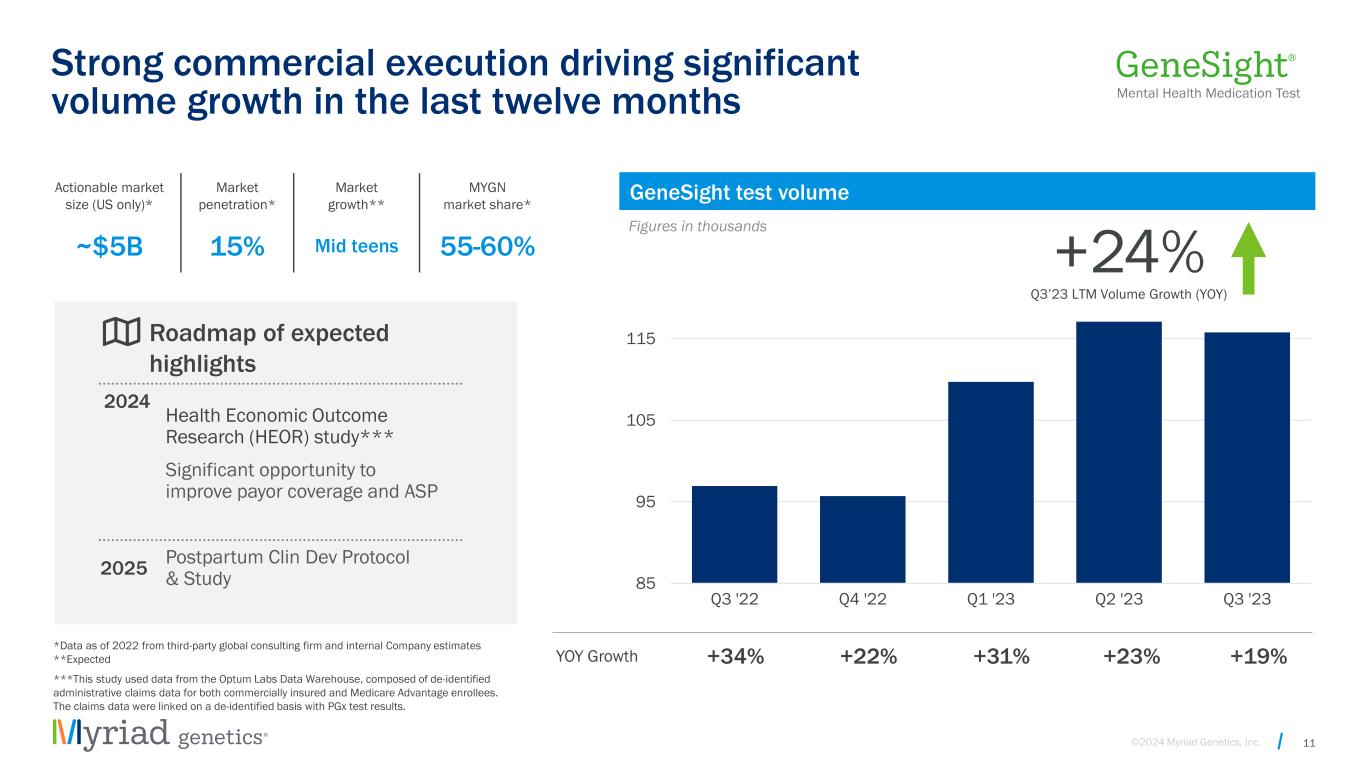
©2024 Myriad Genetics, Inc. 85 95 105 115 125 Q3 '22 Q4 '22 Q1 '23 Q2 '23 Q3 '23 +31% +23% +19% +22% YOY Growth +34% Roadmap of expected highlights 2024 2025 Strong commercial execution driving significant volume growth in the last twelve months Health Economic Outcome Research (HEOR) study*** Significant opportunity to improve payor coverage and ASP Postpartum Clin Dev Protocol & Study Actionable market size (US only)* Market penetration* Market growth** MYGN market share* ~$5B 15% Mid teens 55-60% ***This study used data from the Optum Labs Data Warehouse, composed of de-identified administrative claims data for both commercially insured and Medicare Advantage enrollees. The claims data were linked on a de-identified basis with PGx test results. 11 Figures in thousands Q3’23 LTM Volume Growth (YOY) +24% GeneSight test volume *Data as of 2022 from third-party global consulting firm and internal Company estimates **Expected

©2024 Myriad Genetics, Inc. Prolaris designed to help determine optimal treatment planning for patients with localized prostate cancer Prolaris utilizes two validated thresholds to identify men that are: • Safe for active surveillance (low-risk patients) • Candidates for a singular type of therapy (medium-risk patients) • Candidates for multiple types of therapy at once (high-risk patients) Prolaris identified >86% of low-risk patients as candidates for active surveillance* RESEARCH VALIDATION *Hu, J. C., et al. Clinical Utility of Gene Expression Classifiers in Men With Newly Diagnosed Prostate Cancer. JCO Precision Oncology, 2018; 1-15 doi:10.1200/po.18.00163 1212 Active surveillance (low-risk patients) Single-modal treatment (medium-risk patients) Multi-modal treatment (high-risk patients) LOWER PROLARIS SCORE HIGHER PROLARIS SCORE
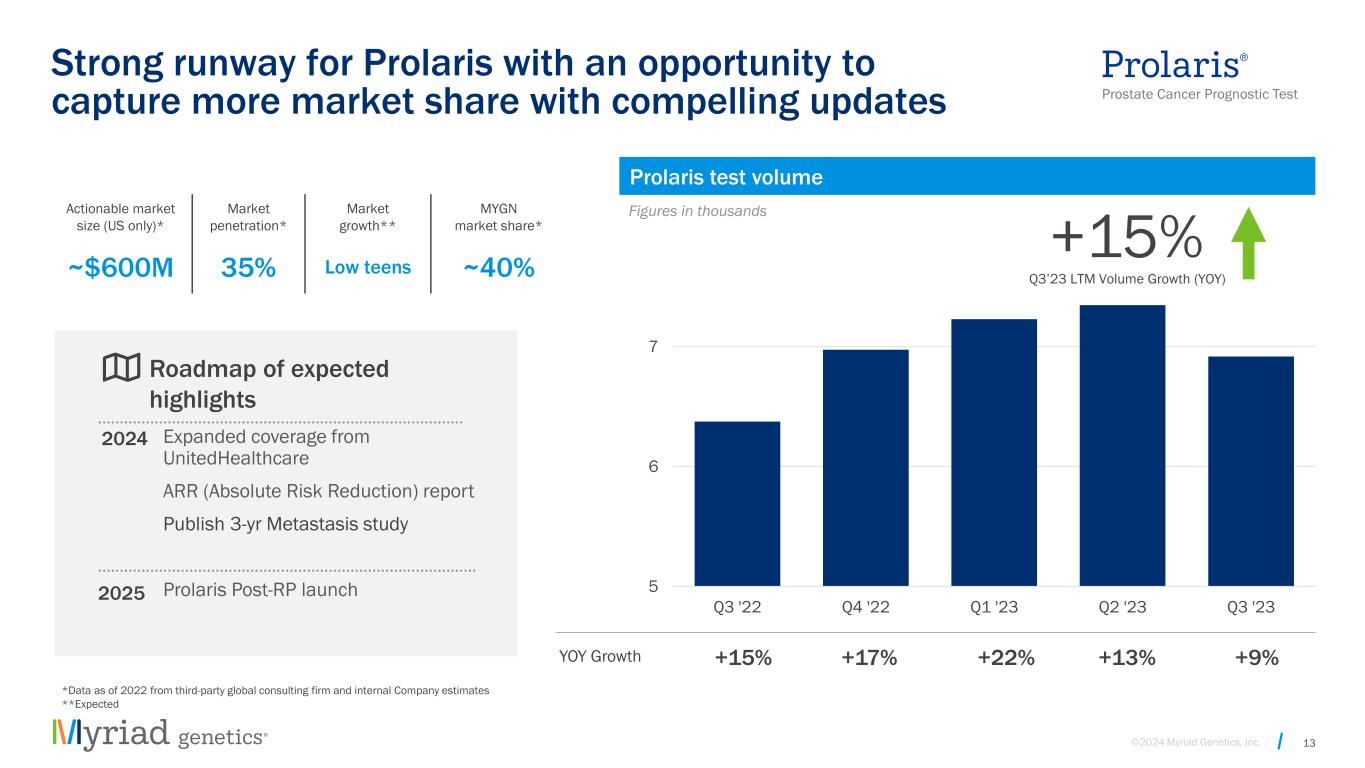
©2024 Myriad Genetics, Inc. 5 6 7 8 Q3 '22 Q4 '22 Q1 '23 Q2 '23 Q3 '23 +22% +13% +9% +17% YOY Growth +15% 2024 2025 Expanded coverage from UnitedHealthcare ARR (Absolute Risk Reduction) report Publish 3-yr Metastasis study Prolaris Post-RP launch Actionable market size (US only)* Market penetration* Market growth** MYGN market share* ~$600M 35% Low teens ~40% 13 Strong runway for Prolaris with an opportunity to capture more market share with compelling updates Figures in thousands Q3’23 LTM Volume Growth (YOY) +15% Prolaris test volume Roadmap of expected highlights *Data as of 2022 from third-party global consulting firm and internal Company estimates **Expected

©2024 Myriad Genetics, Inc. Comprehensive prenatal care with differentiated products and reliable technology Shown to deliver accurate answers to patients regardless of age, ancestry, or body mass index—the Prequel Prenatal Screen with AMPLIFYTM helps determine a pregnancy’s risk for a variety of chromosomal conditions. AMPLIFY fetal fraction amplification delivers first-time accurate results to >99.9% of patients at 10 weeks.* Industry-low screening failure rate** reduces the chance of repeat screens or unnecessary, invasive diagnostics such as amniocentesis. *Welker et al. High-throughput fetal fraction amplification increases analytical performance of noninvasive prenatal screening. Genet Med 23, 443–450 (2021) ** Hancock et al. 2020. Clinical experience across the fetal-fraction spectrum of a non-invasive prenatal screening approach with low test-failure rate. Ultrasound Obstet Gynecol. 2020 Sep;56(3):422-430 ***Hogan et al. Validation of an Expanded Carrier Screen that Optimizes Sensitivity via Full-Exon Sequencing and Panel-wide Copy Number Variant Identification. Clinical Chemistry 2018;doi:10.1373/clinchem.2018.286823 14 Foresight identifies couples at risk of passing down serious, inherited conditions to their children to guide informed planning, preparation and care. Highest published at-risk couple detection rate for serious conditions (1 in 22 couples)*** >99% detection rate for the vast majority of genes in couples across all ancestries

©2024 Myriad Genetics, Inc. 80 85 90 95 100 105 Q3 '22 Q4 '22 Q1 '23 Q2 '23 Q3 '23 +12% +12% +20% (1%) YOY Growth 0% 2024 Actionable market size (US only)* Market penetration* Market growth** MYGN market share* ~$1.3B 45-55% Low single digits Low-to-mid teens ~$950M 40-50% Low single digits Mid teens *Data as of 2022 from third-party global consulting firm and internal Company estimates **Expected Foresight on NovaSeq FirstGene Launch Various Prequel studies Foresight Universal Plus F O R E S IG H T P R E Q U E L 15 A market that continues to grow with potential tailwinds from guideline expansion Figures in thousands Q3’23 LTM Volume Growth (YOY) +10% Prenatal test volume excl. SneakPeek Roadmap of expected highlights
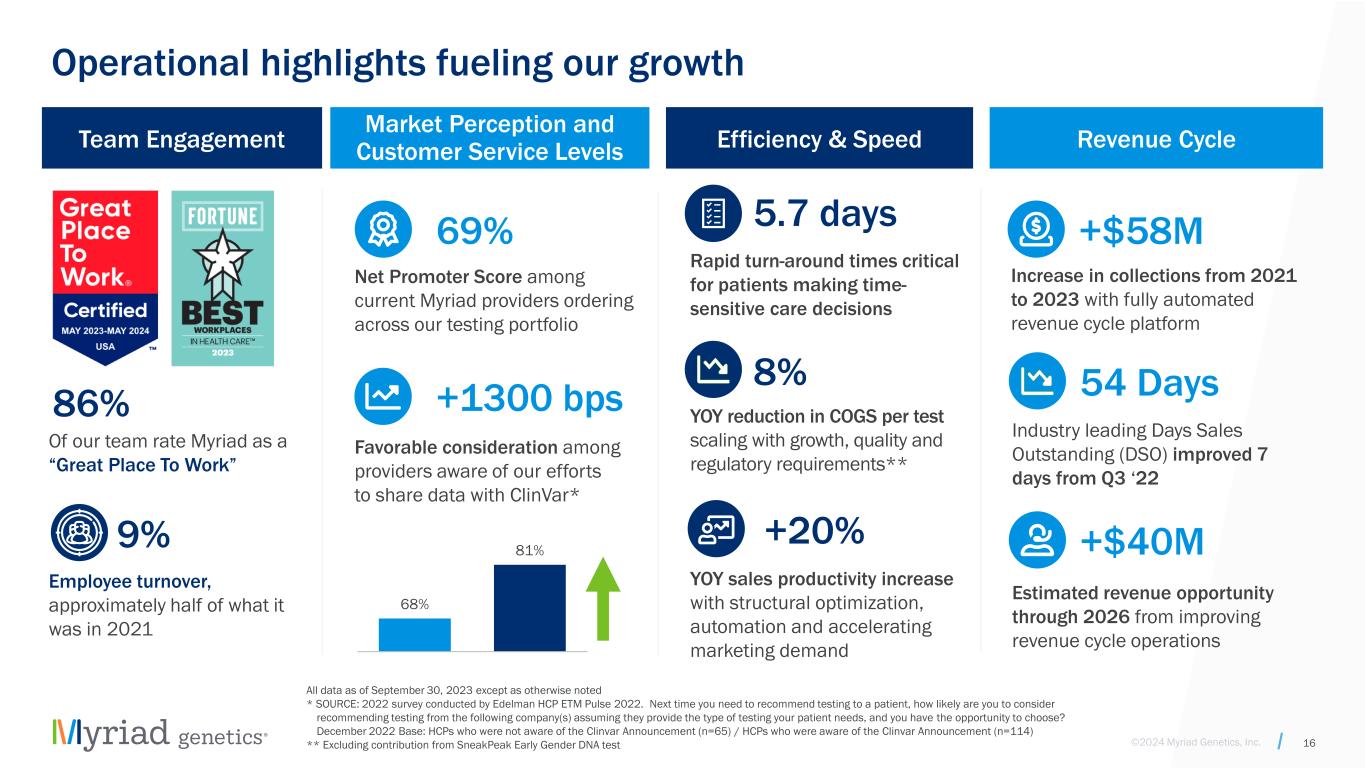
©2024 Myriad Genetics, Inc. Operational highlights fueling our growth Team Engagement Market Perception and Customer Service Levels Efficiency & Speed Revenue Cycle All data as of September 30, 2023 except as otherwise noted * SOURCE: 2022 survey conducted by Edelman HCP ETM Pulse 2022. Next time you need to recommend testing to a patient, how likely are you to consider recommending testing from the following company(s) assuming they provide the type of testing your patient needs, and you have the opportunity to choose? December 2022 Base: HCPs who were not aware of the Clinvar Announcement (n=65) / HCPs who were aware of the Clinvar Announcement (n=114) ** Excluding contribution from SneakPeak Early Gender DNA test 86% 9% Of our team rate Myriad as a “Great Place To Work” Employee turnover, approximately half of what it was in 2021 +$58M Increase in collections from 2021 to 2023 with fully automated revenue cycle platform Estimated revenue opportunity through 2026 from improving revenue cycle operations +$40M Rapid turn-around times critical for patients making time- sensitive care decisions 5.7 days YOY reduction in COGS per test scaling with growth, quality and regulatory requirements** 8% +20% YOY sales productivity increase with structural optimization, automation and accelerating marketing demand 69% Net Promoter Score among current Myriad providers ordering across our testing portfolio +1300 bps Favorable consideration among providers aware of our efforts to share data with ClinVar* 68% 81% 16 54 Days Industry leading Days Sales Outstanding (DSO) improved 7 days from Q3 ‘22
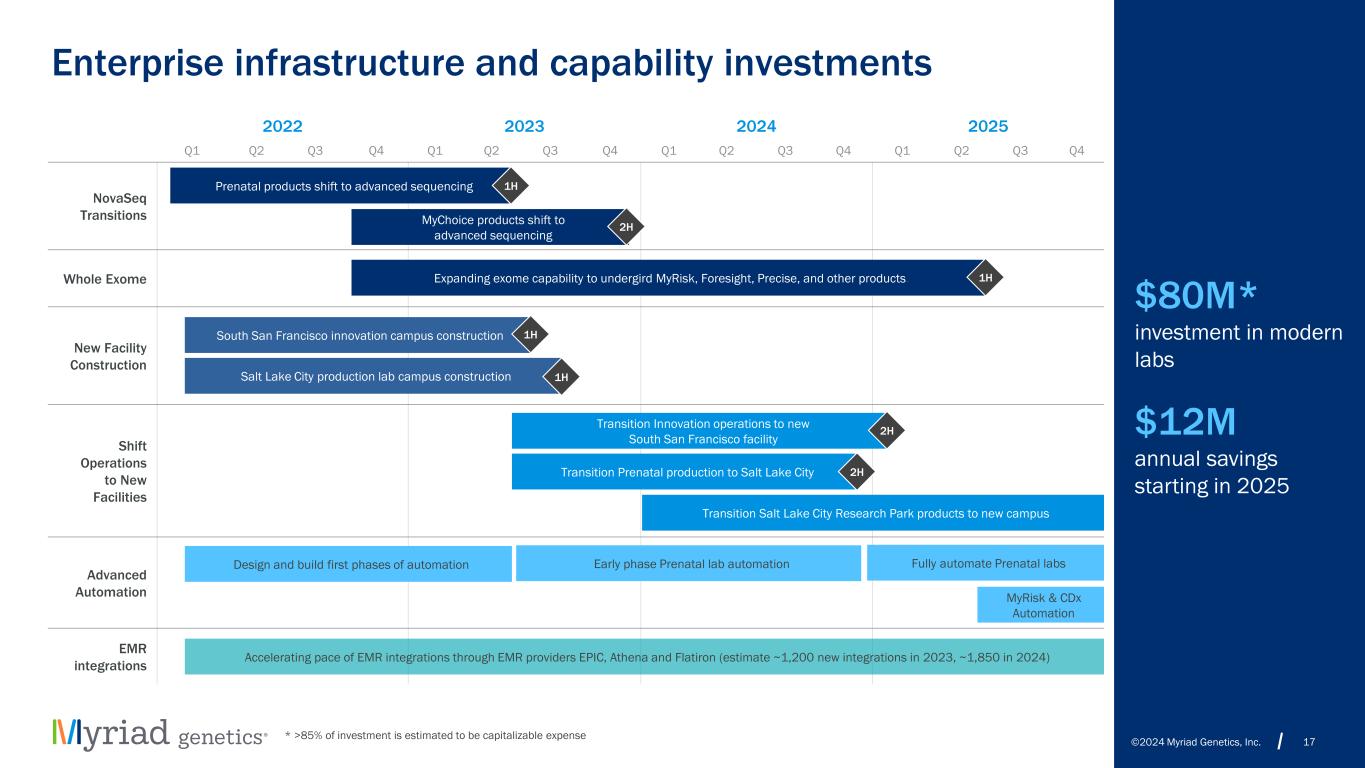
©2024 Myriad Genetics, Inc. $80M* investment in modern labs $12M annual savings starting in 2025 Enterprise infrastructure and capability investments 17 2022 2023 2024 2025 Q1 Q2 Q3 Q4 Q1 Q2 Q3 Q4 Q1 Q2 Q3 Q4 Q1 Q2 Q3 Q4 NovaSeq Transitions Whole Exome New Facility Construction Shift Operations to New Facilities Advanced Automation EMR integrations Prenatal products shift to advanced sequencing South San Francisco innovation campus construction 1H Transition Innovation operations to new South San Francisco facility Transition Prenatal production to Salt Lake City 2H Salt Lake City production lab campus construction 1H Transition Salt Lake City Research Park products to new campus Design and build first phases of automation Early phase Prenatal lab automation MyRisk & CDx Automation 1H 2H Fully automate Prenatal labs * >85% of investment is estimated to be capitalizable expense Accelerating pace of EMR integrations through EMR providers EPIC, Athena and Flatiron (estimate ~1,200 new integrations in 2023, ~1,850 in 2024) MyChoice products shift to advanced sequencing 2H Expanding exome capability to undergird MyRisk, Foresight, Precise, and other products. 1H
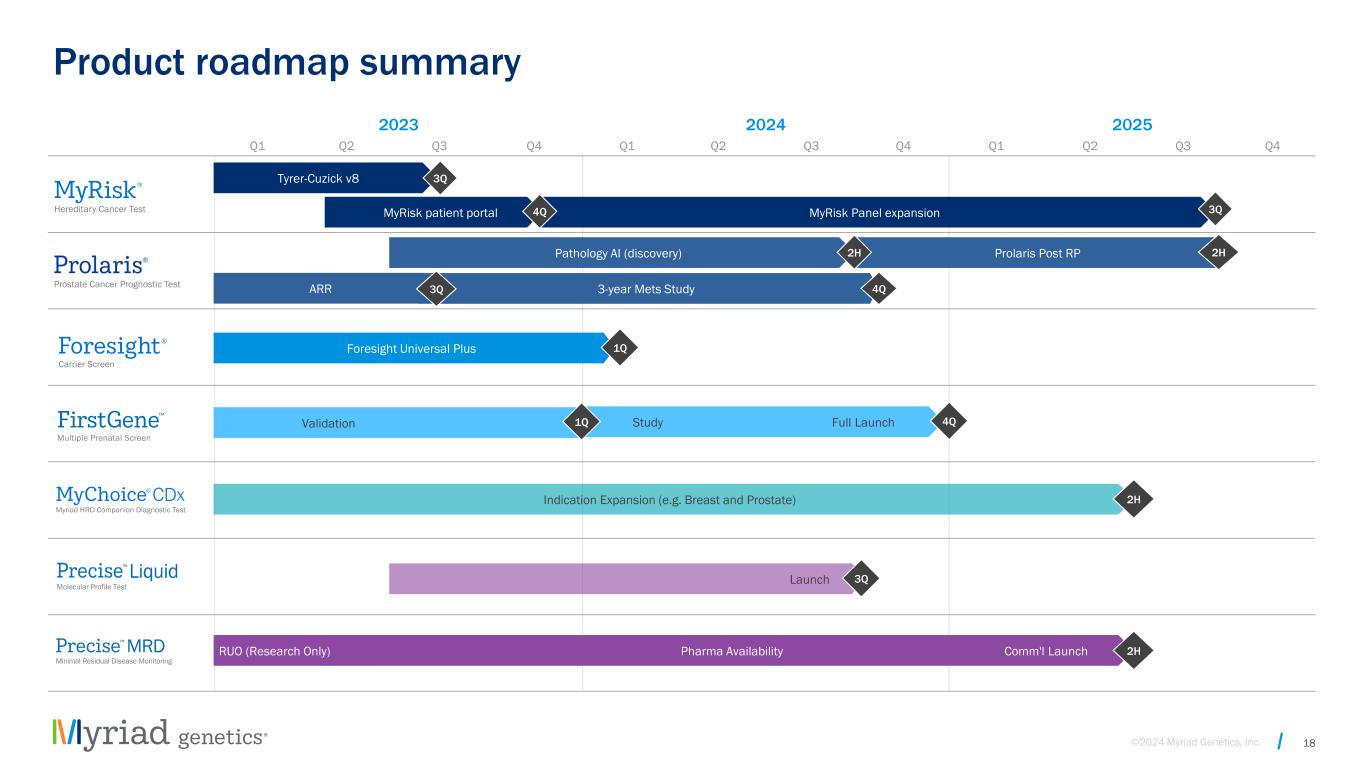
©2024 Myriad Genetics, Inc. 2023 2024 2025 Q1 Q2 Q3 Q4 Q1 Q2 Q3 Q4 Q1 Q2 Q3 Q4 Product roadmap summary Foresight Universal Plus Prolaris Post RP Pathology AI (discovery) Validation 2H Indication Expansion (e.g. Breast and Prostate) 2H Study Full Launch 4Q Tyrer-Cuzick v8 3Q MyRisk Panel expansion 1Q ARR 18 MyRisk patient portal 4Q 3-year Mets Study 4Q Launch 3Q Pharma Availability Comm'l LaunchRUO (Research Only) 2H 2H 1Q 3Q 3Q

©2024 Myriad Genetics, Inc. Active pipeline to better serve patients and providers What is It? Integrated assay for NIPS + carrier screen + fetal recessive status + feto- maternal blood compatibility on a single blood draw on one person Key advantages • Faster turnaround time • 3x lower cost of goods • Established reimbursement FirstGene™ Multiple prenatal screen What is It? Monitoring test based on whole genome sequencing to deeply interrogate tumor, detect recurrence earlier and help guide treatment decisions Key Advantages • Targets 10x variants • Known path to reimbursement Precise™ MRD Minimal residual disease monitoring What is It? Comprehensive genomic profiling test; may serve as first-line offering or as reflex if solid tumor is insufficient Key Advantages • Panel size ~2x size (500 genes) of lead competitor; uses DNA; ease of use as part of Precise Oncology Solutions • Established reimbursement path Precise™ Liquid Robust tumor profiling & therapy selection What is It? Pan-cancer comprehensive genomic profiling test using Illumina TruSight Oncology 500; may serve as first-line offering Key Advantages • Panel size ~2x size (500 genes) of lead competitor; uses both DNA/RNA; ease of use as part of Precise Oncology Solutions • Established reimbursement path Precise™ Tumor Robust tumor profiling & therapy selection Women’s Health Oncology Foresight™ Universal Plus Expanded carrier screen What is It? Pioneering expanded carrier screen that uses NGS to find pathogenic variants underlying recessive disease. 274 gene expansion in ACOG guidelines (anticipated.) Key advantages • Merged couple reporting • Fully automated lab workflow drives low COGS 19

©2024 Myriad Genetics, Inc. FirstGene: Transformative prenatal screen running multiple tests at once 20 Providers don’t have enough time to talk about genetics Current PROBLEMS with prenatal genetic screening Only 50% utilization of carrier screening Only 30% of fathers get screened when mother is a carrier Carrier Screening NIPS Fetal recessive status Blood compatibility New SOLUTION Low gross margins on NIPS and ECS • Easier for providers to administer integrated offering • No need to screen the father • Estimated 30-40% higher gross margins compared to Foresight or Prequel alone
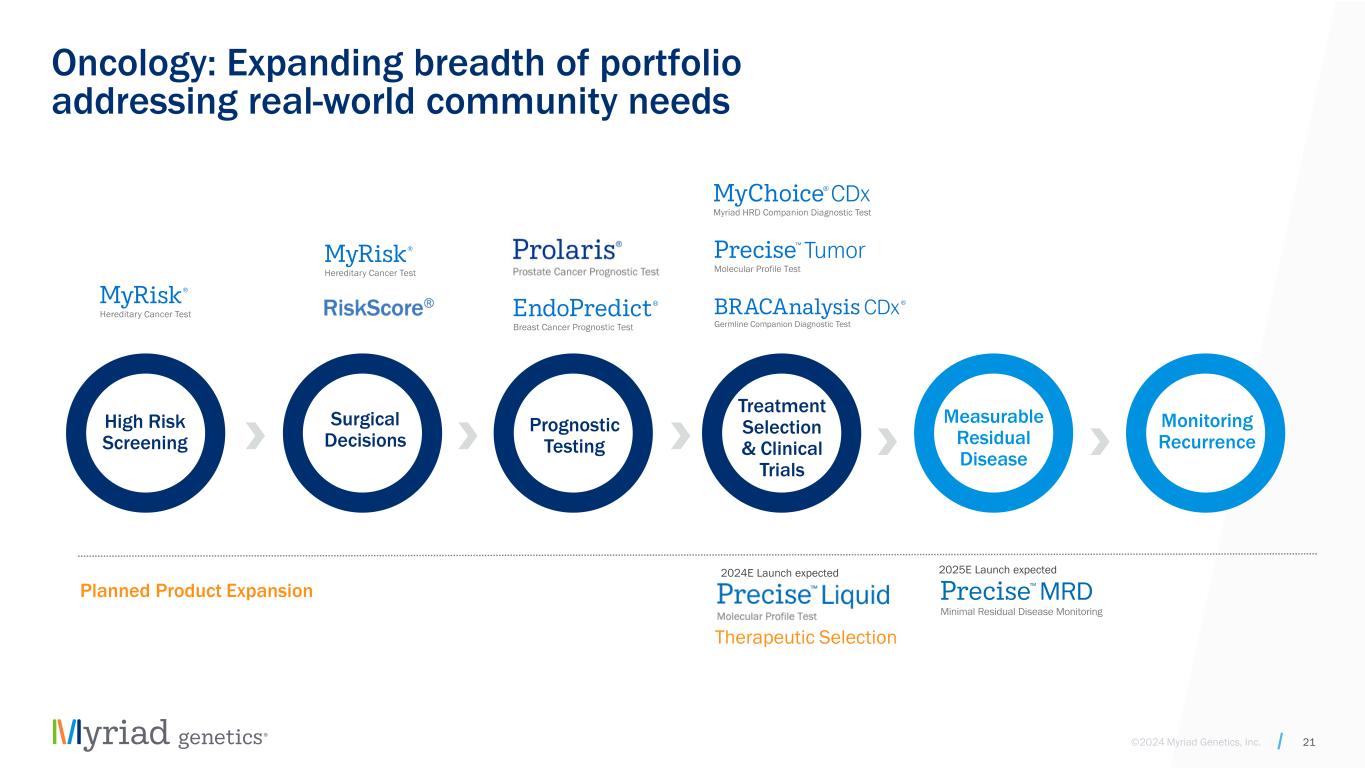
©2024 Myriad Genetics, Inc. Oncology: Expanding breadth of portfolio addressing real-world community needs 21 Therapeutic Selection Prognostic Testing Surgical Decisions High Risk Screening Planned Product Expansion Measurable Residual Disease Monitoring Recurrence Treatment Selection & Clinical Trials 2024E Launch expected 2025E Launch expected
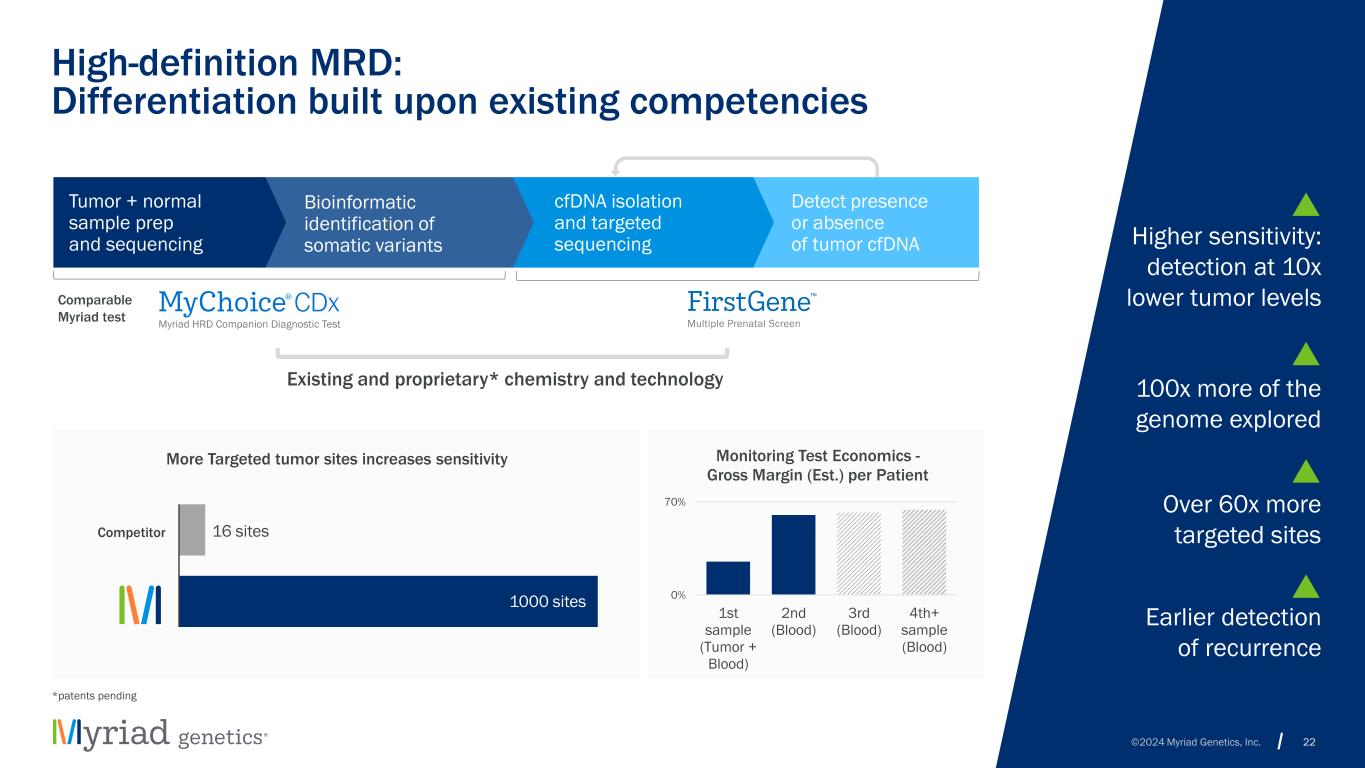
©2024 Myriad Genetics, Inc. High-definition MRD: Differentiation built upon existing competencies 22 Detect presence or absence of tumor cfDNA Comparable Myriad test TM Tumor + normal sample prep and sequencing Bioinformatic identification of somatic variants cfDNA isolation and targeted sequencing Competitor More Targeted tumor sites increases sensitivity 16 sites 1000 sites Existing and proprietary* chemistry and technology *patents pending Over 60x more targeted sites Earlier detection of recurrence Higher sensitivity: detection at 10x lower tumor levels 100x more of the genome explored 0% 70% 1st sample (Tumor + Blood) 2nd (Blood) 3rd (Blood) 4th+ sample (Blood) Monitoring Test Economics - Gross Margin (Est.) per Patient

©2024 Myriad Genetics, Inc. Precise MRD: Partnerships with world-leading collaborators We anticipate the MRD test from Myriad will be more sensitive and specific than many other ctDNA offerings for monitoring the response and, therefore, may more accurately identify the patients who will or will not benefit from certain therapies. Importantly, some of these patients may go undetected on a less-sensitive MRD test.” Dr. Pedram Razavi Director of Liquid Biopsy & Genomics Memorial Sloan Kettering Cancer Center 23 “ Memorial Sloan Kettering Breast cancer: Two-phase study of 100 patients with metastatic breast cancer in neoadjuvant and adjuvant setting MD Anderson Cancer Center Renal cancer: Testing 120 patients with recurrent RCC to assess clinical validity on Radiation + MRD

©2024 Myriad Genetics, Inc. 24 Financial Highlights
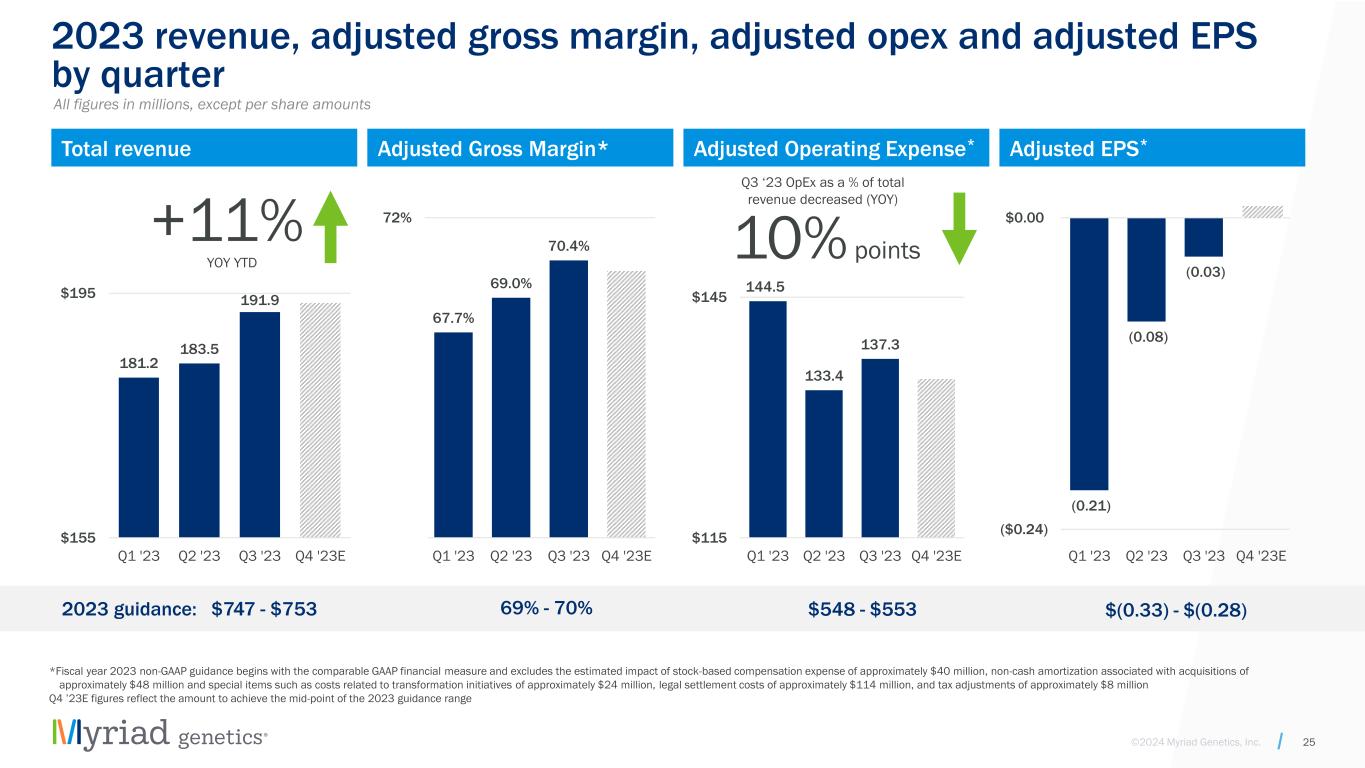
©2024 Myriad Genetics, Inc. 10% points 181.2 183.5 191.9 $155 $195 Q1 '23 Q2 '23 Q3 '23 Q4 '23E 2023 revenue, adjusted gross margin, adjusted opex and adjusted EPS by quarter 25 144.5 133.4 137.3 $115 $145 Q1 '23 Q2 '23 Q3 '23 Q4 '23E (0.21) (0.08) (0.03) ($0.24) $0.00 Q1 '23 Q2 '23 Q3 '23 Q4 '23E All figures in millions, except per share amounts *Fiscal year 2023 non-GAAP guidance begins with the comparable GAAP financial measure and excludes the estimated impact of stock-based compensation expense of approximately $40 million, non-cash amortization associated with acquisitions of approximately $48 million and special items such as costs related to transformation initiatives of approximately $24 million, legal settlement costs of approximately $114 million, and tax adjustments of approximately $8 million Q4 ’23E figures reflect the amount to achieve the mid-point of the 2023 guidance range 67.7% 69.0% 70.4% 60% 72% Q1 '23 Q2 '23 Q3 '23 Q4 '23E 2023 guidance: $747 - $753 $548 - $553 $(0.33) - $(0.28)69% - 70% YOY YTD +11% Total revenue Adjusted Gross Margin* Adjusted Operating Expense* Adjusted EPS* Q3 ‘23 OpEx as a % of total revenue decreased (YOY)

©2024 Myriad Genetics, Inc. 2023 FINANCIAL GUIDANCE 2023 COMMENTS 2024 - 2026 COMMENTARY ADDITIONAL COMMENTS Total revenue $747 - $753 2023 annual growth between 10% - 11% over 2022. 10%+ CAGR Target total revenue of over $1 billion in 2026. This revenue target includes modest contribution from planned new products and no contribution from future M&A. Gross margin % 69% - 70% GM expected to fluctuate in any quarter given seasonality. 70%+ GM expected to fluctuate in any quarter given product mix, pricing trends and seasonality. Adjusted operating expenses* $548 - $553 5-6% CAGR Balance ongoing investment in R&D with ongoing cost controls in SG&A. Adjusted EPS* $(0.33) - $(0.28) Adjusted EPS is expected to reach positive adjusted profitability and adjusted operating cash flow in Q4 '23. Positive adjusted operating income and adjusted cash flow Target adjusted operating income of approximately $100 million in 2026**, or 10% of total revenue in 2026. Adjusted operating cash flow is expected to be in-line with adjusted operating income trend. Reaffirm 2023 revenue and non-GAAP financial guidance and long-term financial targets * Fiscal year 2023 non-GAAP guidance begins with the comparable GAAP financial measure and excludes the estimated impact of stock- based compensation expense of approximately $40 million, non-cash amortization associated with acquisitions of approximately $48 million and special items such as costs related to transformation initiatives of approximately $24 million, legal settlement costs of approximately $114 million, and tax adjustments of approximately $8 million All figures in millions, except per share amounts 26 ** 2026 adjusted operating income target begins with the comparable GAAP financial measure and excludes the estimated impact of stock-based compensation expense of approximately $46.0 million, non-cash amortization associated with acquisitions of approximately $43.0 million and special items such as costs related to transformation initiatives of approximately $4.0 million Assumes currency rates as of November 6, 2023

©2024 Myriad Genetics, Inc. Increased financial flexibility; On-track to achieve positive adjusted operating cash flow in Q4 ‘23 27 Total cash and cash equivalents at end of third quarter of 2023* $86.3 Amount available to draw under the asset-based credit facility** 28.2 Net proceeds from follow-on equity offering 117.6 Cash payment of securities class action settlement and first Ravgen installment in Q4 2023 (62.5) Estimated capital expenditures, capitalization of internal-use software costs and cash flow from operations in Q4 ’23 (7.0) Estimated total available cash and cash equivalents and availability under credit facility at year end 2023 $162.6 Raised net $118 million in upsized and oversubscribed equity offering Increased size of asset- based credit facility to $115 million from $90 million. * * The amount available to draw under the ABL facility is based on the ABL facility of $115 million. In October 2023, Myriad increased the size of the ABL facility by $25 million to $115 million * Cash and cash equivalents at the end of the Q3 ‘23 reflects the initial cash payment of $20 million for the securities class action settlement
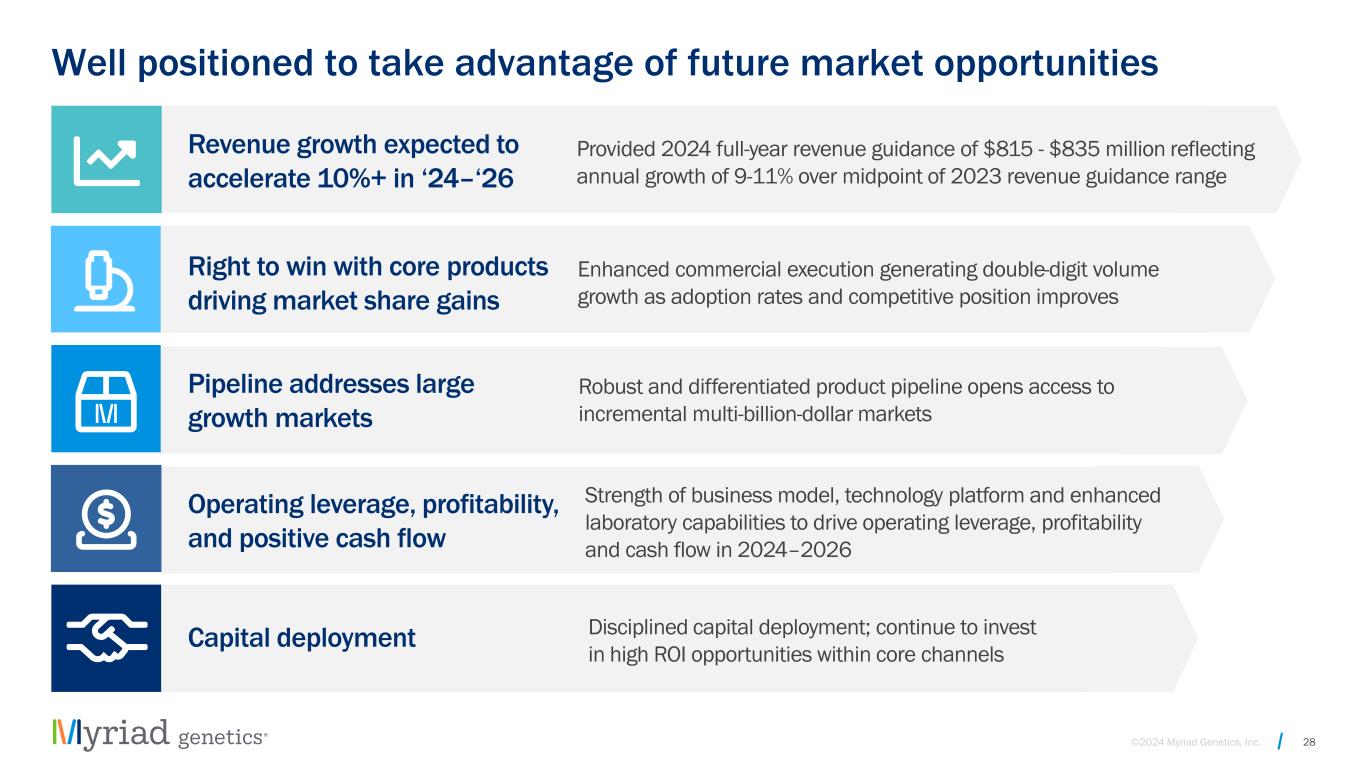
©2024 Myriad Genetics, Inc. Revenue growth expected to accelerate 10%+ in ‘24–‘26 Right to win with core products driving market share gains Pipeline addresses large growth markets Operating leverage, profitability, and positive cash flow Capital deployment Provided 2024 full-year revenue guidance of $815 - $835 million reflecting annual growth of 9-11% over midpoint of 2023 revenue guidance range Enhanced commercial execution generating double-digit volume growth as adoption rates and competitive position improves Robust and differentiated product pipeline opens access to incremental multi-billion-dollar markets Strength of business model, technology platform and enhanced laboratory capabilities to drive operating leverage, profitability and cash flow in 2024–2026 Disciplined capital deployment; continue to invest in high ROI opportunities within core channels 28 Well positioned to take advantage of future market opportunities

©2024 Myriad Genetics, Inc. 29 Q&A

©2024 Myriad Genetics, Inc. 30 Appendix

©2024 Myriad Genetics, Inc. Reconciliation of GAAP to Non-GAAP Financial Measures for the Three and Nine Months ended September 30, 2023 and 2022 31 (unaudited data in millions, except per share amounts)
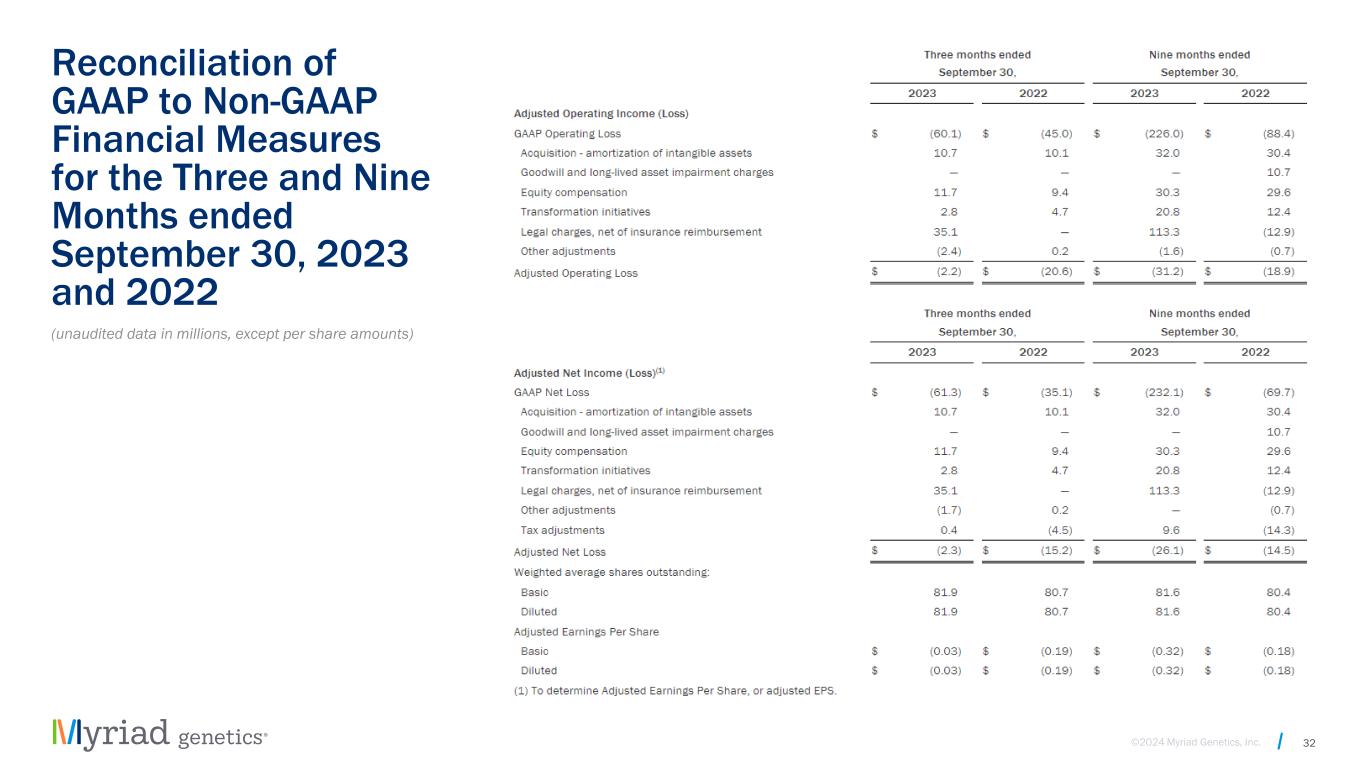
©2024 Myriad Genetics, Inc. 32 (unaudited data in millions, except per share amounts) Reconciliation of GAAP to Non-GAAP Financial Measures for the Three and Nine Months ended September 30, 2023 and 2022
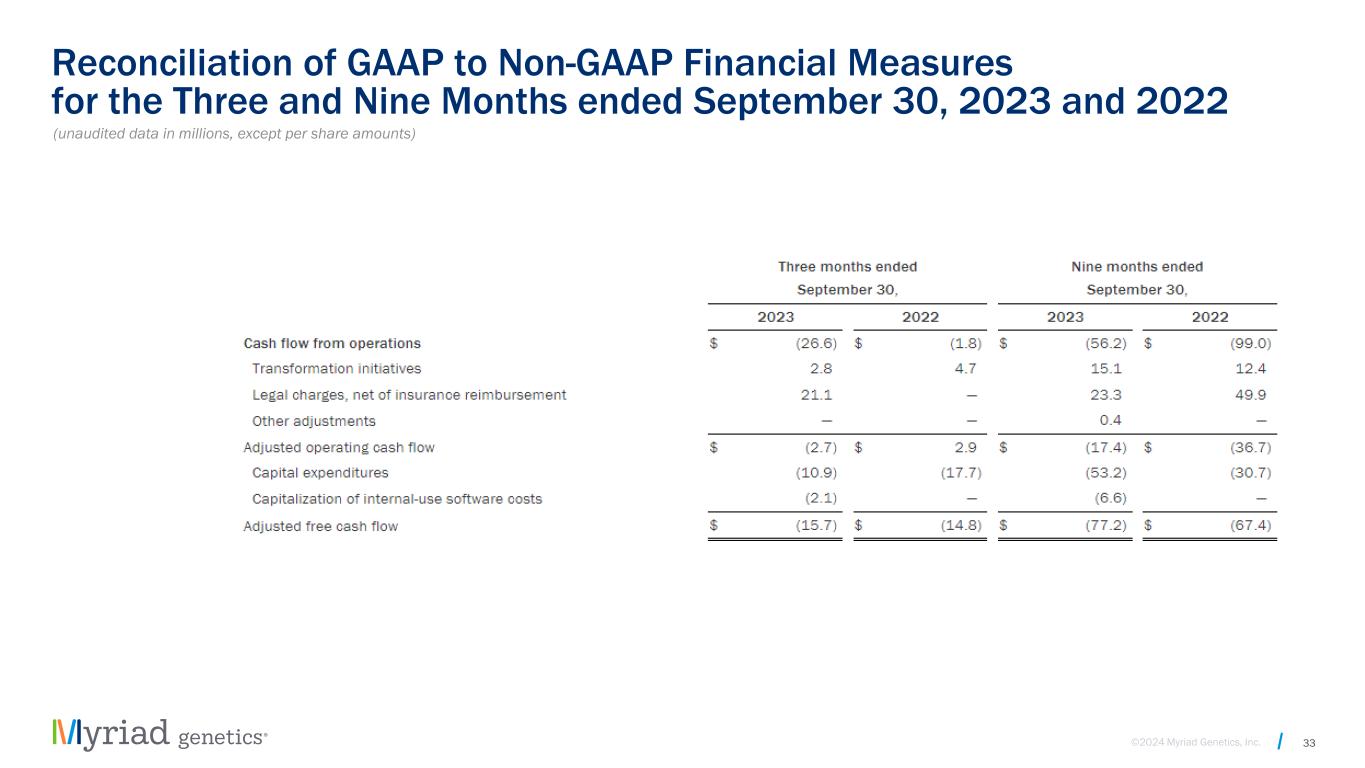
©2024 Myriad Genetics, Inc. 33 (unaudited data in millions, except per share amounts) Reconciliation of GAAP to Non-GAAP Financial Measures for the Three and Nine Months ended September 30, 2023 and 2022
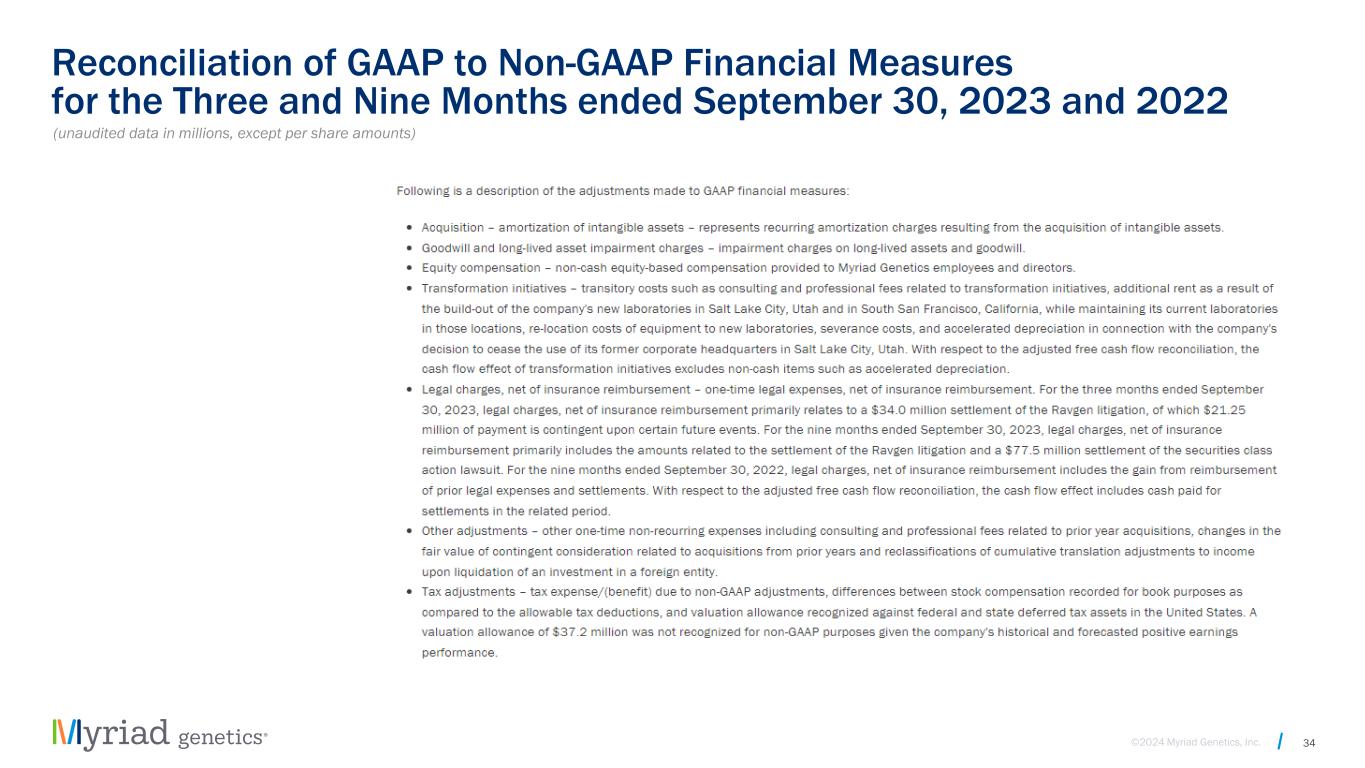
©2024 Myriad Genetics, Inc. 34 (unaudited data in millions, except per share amounts) Reconciliation of GAAP to Non-GAAP Financial Measures for the Three and Nine Months ended September 30, 2023 and 2022