Exhibit 99.2

Tanger Factory Outlet Centers, Inc.
Supplemental Operating and Financial Data
June 30, 2016
1
Supplemental Operating and Financial Data for the
Quarter Ended 6/30/2016

Notice
For a more detailed discussion of the factors that affect our operating results, interested parties should review the Tanger Factory Outlet Centers, Inc. Annual Report on Form 10-K for the fiscal year ended December 31, 2015.
This Supplemental Portfolio and Financial Data is not an offer to sell or a solicitation to buy any securities of the Company. Any offers to sell or solicitations to buy any securities of the Company shall be made only by means of a prospectus.
2
Supplemental Operating and Financial Data for the
Quarter Ended 6/30/2016
Table of Contents
Section | |
Portfolio Data: | |
Geographic Diversification | |
Property Summary - Occupancy at End of Each Period Shown | |
Portfolio Occupancy at the End of Each Period | |
Average Tenant Sales Per Square Foot by Outlet Center Ranking | |
Major Tenants | |
Lease Expirations as of June 30, 2016 | |
Leasing Activity | |
Development Summary | |
Financial Data: | |
Consolidated Balance Sheets | |
Consolidated Statements of Operations | |
Unconsolidated Joint Venture Information | |
Debt Outstanding Summary | |
Future Scheduled Principal Payments | |
Senior Unsecured Notes Financial Covenants | |
Non-GAAP Supplemental Measures: | |
Non-GAAP Definitions | |
FFO and FAD Analysis | |
Portfolio NOI and Same Center NOI | |
Pro Rata Balance Sheet | |
Pro Rata Statement of Operations | |
Investor Information | |
3
Supplemental Operating and Financial Data for the
Quarter Ended 6/30/2016
Geographic Diversification
Consolidated Properties
As of June 30, 2016 | ||||||||
State | # of Centers | GLA | % of GLA | |||||
South Carolina | 5 | 1,598,375 | 13 | % | ||||
New York | 2 | 1,478,808 | 12 | % | ||||
Pennsylvania | 3 | 867,460 | 7 | % | ||||
Georgia | 2 | 692,478 | 6 | % | ||||
Michigan | 2 | 671,539 | 6 | % | ||||
Texas | 2 | 643,497 | 5 | % | ||||
Connecticut | 2 | 601,512 | 5 | % | ||||
Alabama | 1 | 556,984 | 5 | % | ||||
Delaware | 1 | 556,405 | 5 | % | ||||
North Carolina | 3 | 505,123 | 4 | % | ||||
New Jersey | 1 | 489,706 | 4 | % | ||||
Tennessee | 1 | 448,335 | 4 | % | ||||
Ohio | 1 | 411,776 | 3 | % | ||||
Arizona | 1 | 410,673 | 3 | % | ||||
Missouri | 1 | 329,861 | 3 | % | ||||
Mississippi | 1 | 320,337 | 3 | % | ||||
Utah | 1 | 319,661 | 3 | % | ||||
Louisiana | 1 | 318,666 | 3 | % | ||||
Iowa | 1 | 276,331 | 2 | % | ||||
New Hampshire | 1 | 245,698 | 2 | % | ||||
Maryland | 1 | 198,840 | 2 | % | ||||
Total | 34 | 11,942,065 | 100 | % | ||||
Unconsolidated Joint Venture Properties
# of Centers | GLA | Ownership % | ||||||
Savannah, GA | 1 | 419,197 | 50.00 | % | ||||
Charlotte, NC | 1 | 397,839 | 50.00 | % | ||||
Columbus, OH | 1 | 355,220 | 50.00 | % | ||||
Texas City, TX | 1 | 352,705 | 50.00 | % | ||||
National Harbor, MD | 1 | 338,786 | 50.00 | % | ||||
Ottawa, ON | 1 | 316,494 | 50.00 | % | ||||
Cookstown, ON | 1 | 308,517 | 50.00 | % | ||||
Bromont, QC | 1 | 161,307 | 50.00 | % | ||||
Saint-Sauveur, QC | 1 | 115,771 | 50.00 | % | ||||
Total | 9 | 2,765,836 | ||||||
4
Supplemental Operating and Financial Data for the
Quarter Ended 6/30/2016
Property Summary - Occupancy at End of Each Period Shown
Consolidated properties | ||||||||||||||||||
Location | Total GLA 6/30/16 | % Occupied 6/30/16 | % Occupied 3/31/16 | % Occupied 12/31/15 | % Occupied 9/30/15 | % Occupied 6/30/15 | ||||||||||||
Deer Park, NY | 749,074 | 96 | % | 96 | % | 95 | % | 95 | % | 94 | % | |||||||
Riverhead, NY | 729,734 | 99 | % | 99 | % | 99 | % | 98 | % | 97 | % | |||||||
Foley, AL | 556,984 | 96 | % | 94 | % | 96 | % | 93 | % | 96 | % | |||||||
Rehoboth Beach, DE | 556,405 | 100 | % | 99 | % | 100 | % | 100 | % | 99 | % | |||||||
Atlantic City, NJ | 489,706 | 92 | % | 91 | % | 91 | % | 94 | % | 95 | % | |||||||
San Marcos, TX | 465,697 | 98 | % | 98 | % | 98 | % | 98 | % | 95 | % | |||||||
Sevierville, TN | 448,335 | 99 | % | 100 | % | 100 | % | 100 | % | 100 | % | |||||||
Myrtle Beach Hwy 501, SC | 425,247 | 97 | % | 96 | % | 95 | % | 97 | % | 98 | % | |||||||
Jeffersonville, OH | 411,776 | 98 | % | 98 | % | 100 | % | 99 | % | 97 | % | |||||||
Glendale, AZ (Westgate) | 410,673 | 97 | % | N/A | N/A | N/A | N/A | |||||||||||
Myrtle Beach Hwy 17, SC | 402,797 | 100 | % | 98 | % | 100 | % | 99 | % | 100 | % | |||||||
Charleston, SC | 382,117 | 98 | % | 98 | % | 99 | % | 99 | % | 99 | % | |||||||
Pittsburgh, PA | 372,958 | 100 | % | 100 | % | 100 | % | 100 | % | 99 | % | |||||||
Commerce, GA | 371,408 | 99 | % | 94 | % | 97 | % | 97 | % | 96 | % | |||||||
Grand Rapids, MI | 357,080 | 94 | % | 94 | % | 95 | % | 93 | % | N/A | ||||||||
Branson, MO | 329,861 | 100 | % | 100 | % | 100 | % | 100 | % | 99 | % | |||||||
Locust Grove, GA | 321,070 | 100 | % | 100 | % | 100 | % | 100 | % | 99 | % | |||||||
Southaven, MS | 320,337 | 96 | % | 97 | % | 96 | % | N/A | N/A | |||||||||
Park City, UT | 319,661 | 97 | % | 98 | % | 100 | % | 99 | % | 99 | % | |||||||
Mebane, NC | 318,910 | 97 | % | 98 | % | 100 | % | 95 | % | 100 | % | |||||||
Gonzales, LA | 318,666 | 98 | % | 98 | % | 99 | % | 100 | % | 100 | % | |||||||
Howell, MI | 314,459 | 92 | % | 92 | % | 94 | % | 94 | % | 93 | % | |||||||
Mashantucket, CT (Foxwoods) | 311,614 | 96 | % | 96 | % | 95 | % | 94 | % | 91 | % | |||||||
Westbrook, CT | 289,898 | 87 | % | 92 | % | 94 | % | 93 | % | 95 | % | |||||||
Williamsburg, IA | 276,331 | 97 | % | 95 | % | 99 | % | 99 | % | 97 | % | |||||||
Hershey, PA | 247,500 | 100 | % | 99 | % | 100 | % | 98 | % | 95 | % | |||||||
Lancaster, PA | 247,002 | 97 | % | 97 | % | 99 | % | 99 | % | 99 | % | |||||||
Tilton, NH | 245,698 | 97 | % | 97 | % | 98 | % | 98 | % | 96 | % | |||||||
Hilton Head II, SC | 206,544 | 94 | % | 95 | % | 97 | % | 95 | % | 95 | % | |||||||
Ocean City, MD | 198,840 | 81 | % | 79 | % | 79 | % | 99 | % | 99 | % | |||||||
Hilton Head I, SC | 181,670 | 97 | % | 97 | % | 97 | % | 97 | % | 100 | % | |||||||
Terrell, TX | 177,800 | 98 | % | 98 | % | 98 | % | 97 | % | 95 | % | |||||||
Blowing Rock, NC | 104,052 | 99 | % | 100 | % | 100 | % | 100 | % | 97 | % | |||||||
Nags Head, NC | 82,161 | 100 | % | 97 | % | 97 | % | 100 | % | 100 | % | |||||||
Barstow, CA (2) | N/A | N/A | N/A | N/A | 100 | % | 100 | % | ||||||||||
Fort Myers, FL (2) | N/A | N/A | N/A | 91 | % | 90 | % | 91 | % | |||||||||
Kittery I, ME(2) | N/A | N/A | N/A | N/A | N/A | 100 | % | |||||||||||
Kittery II, ME(2) | N/A | N/A | N/A | N/A | N/A | 92 | % | |||||||||||
Tuscola, IL(2) | N/A | N/A | N/A | N/A | N/A | 88 | % | |||||||||||
West Branch, MI(2) | N/A | N/A | N/A | N/A | N/A | 88 | % | |||||||||||
Total | 11,942,065 | 97 | % | (1) | 97 | % | (1) | 98 | % | (1),(3) | 97 | % | (1),(4) | 97 | % | (1) | ||
(1) | Excludes the occupancy rate at our Foxwoods, Grand Rapids and Southaven centers which opened during the second, third and fourth quarters of 2015, respectively, and have not yet stabilized. |
(2) | Sold the Kittery I, Kittery II, Tuscola, and West Branch centers in September 2015, sold the Barstow center in October 2015 and sold Fort Myers center in January 2016. |
(3) | Excludes the occupancy rate of the Fort Myers center which was sold on January 12, 2016. |
(4) | Excludes the occupancy rate at our Barstow center which was sold on October 5, 2015. |
5
Supplemental Operating and Financial Data for the
Quarter Ended 6/30/2016
Unconsolidated joint venture properties | ||||||||||||||||||
Location | Total GLA 6/30/16 | % Occupied 6/30/16 | % Occupied 3/31/16 | % Occupied 12/31/15 | % Occupied 9/30/15 | % Occupied 6/30/15 | ||||||||||||
Savannah, GA | 419,197 | 99 | % | 99 | % | 99 | % | 99 | % | 96 | % | |||||||
Charlotte, NC | 397,839 | 97 | % | 98 | % | 99 | % | 99 | % | 99 | % | |||||||
Columbus, OH (1) | 355,220 | 95 | % | N/A | N/A | N/A | N/A | |||||||||||
Texas City, TX (Galveston/Houston) | 352,705 | 99 | % | 97 | % | 99 | % | 99 | % | 100 | % | |||||||
National Harbor, MD | 338,786 | 98 | % | 99 | % | 99 | % | 99 | % | 99 | % | |||||||
Ottawa, ON | 316,494 | 95 | % | 95 | % | 97 | % | 97 | % | 95 | % | |||||||
Cookstown, ON | 308,517 | 99 | % | 99 | % | 100 | % | 100 | % | 93 | % | |||||||
Bromont, QC | 161,307 | 72 | % | 74 | % | 75 | % | 74 | % | 74 | % | |||||||
Saint-Sauveur, QC | 115,771 | 97 | % | 97 | % | 97 | % | 97 | % | 97 | % | |||||||
Glendale, AZ (Westgate) (2) | N/A | N/A | 96 | % | 100 | % | 100 | % | 99 | % | ||||||||
Total | 2,765,836 | 96 | % | (3) | 96 | % | 98 | % | 97 | % | 96 | % | ||||||
(1) | Center opened in June 2016. |
(2) | The Company acquired our partners' interest in the Westgate outlet center on June 30, 2016. The center is now reported above in the section labeled consolidated properties. |
(3) | Excludes the occupancy rate at our Columbus center which opened on June 24, 2016 and has not yet stabilized. |
6
Supplemental Operating and Financial Data for the
Quarter Ended 6/30/2016
Portfolio Occupancy at the End of Each Period (1)
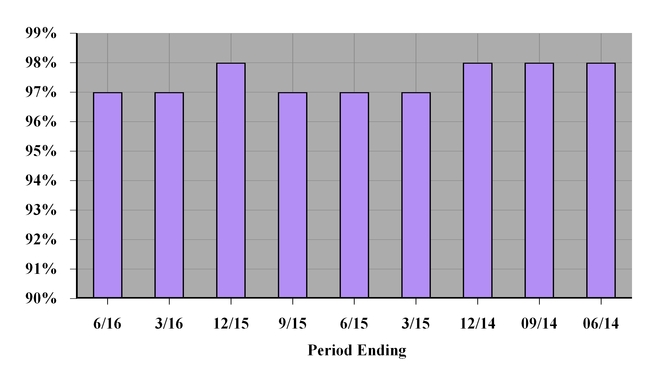
(1) Excludes unconsolidated outlet centers. See table on page 4.
7
Supplemental Operating and Financial Data for the
Quarter Ended 6/30/2016
Average Tenant Sales Per Square Foot by Outlet Center Ranking As of June 30, 2016(1)
12 Months | Period End | Sq Ft | % of | % of Portfolio NOI, as | |||||||||
Ranking (2) | SPSF | Occupancy | (thousands) | Square Feet | adjusted (3) | ||||||||
Consolidated Centers | |||||||||||||
Centers 1 - 5 | $ | 529 | 98 | % | 2,803 | 26 | % | 33 | % | ||||
Centers 6 - 10 | $ | 441 | 99 | % | 1,472 | 13 | % | 13 | % | ||||
Centers 11 - 15 | $ | 397 | 97 | % | 1,622 | 15 | % | 15 | % | ||||
Centers 16 - 20 | $ | 357 | 97 | % | 1,791 | 16 | % | 17 | % | ||||
Centers 21 - 25 | $ | 311 | 95 | % | 1,785 | 16 | % | 13 | % | ||||
Centers 26 - 31 | $ | 273 | 95 | % | 1,480 | 14 | % | 9 | % | ||||
Cumulative | Cumulative | Cumulative | Cumulative | Cumulative % of Portfolio | |||||||||
12 Months | Period End | Sq Ft | % of | NOI, as | |||||||||
Ranking (2) | SPSF | Occupancy | (thousands) | Square Feet | adjusted (3) | ||||||||
Consolidated Centers | |||||||||||||
Centers 1 - 5 | $ | 529 | 98 | % | 2,803 | 26 | % | 33 | % | ||||
Centers 1 - 10 | $ | 495 | 98 | % | 4,275 | 39 | % | 46 | % | ||||
Centers 1 - 15 | $ | 466 | 98 | % | 5,897 | 54 | % | 61 | % | ||||
Centers 1 - 20 | $ | 438 | 98 | % | 7,688 | 70 | % | 78 | % | ||||
Centers 1 - 25 | $ | 415 | 97 | % | 9,473 | 86 | % | 91 | % | ||||
Centers 1 - 31 | $ | 395 | 97 | % | 10,953 | 100 | % | 100 | % | ||||
Unconsolidated centers (4) | $ | 398 | 98 | % | 1,509 | n/a | n/a | ||||||
(1) | Sales are based on reports by retailers leasing outlet center stores for the trailing 12 months for tenants which have occupied such stores for a minimum of 12 months. Sales per square foot are based on all stores less than 20,000 square feet in size. Centers are ranked by sales per square foot for the twelve months ended June 30, 2016. | ||||||||||||
(2) | Outlet centers included in each ranking group above are as follows (in alphabetical order): | ||||||||||||
Centers 1 - 5: | Deer Park, NY | Mebane, NC | Rehoboth Beach, DE | Riverhead, NY | Sevierville, TN | ||||||||
Centers 6 - 10: | Branson, MO | Glendale, AZ | Lancaster, PA | Myrtle Beach 17, SC | Nags Head, NC | ||||||||
Centers 11 - 15: | Atlantic City, NJ | Charleston, SC | Hershey, PA | Hilton Head I, SC | Locust Grove, GA | ||||||||
Centers 16 - 20: | Gonzales, LA | Howell, MI | Park City, UT | Pittsburgh, PA | San Marcos, TX | ||||||||
Centers 21 - 25: | Commerce, GA | Foley, AL | Jeffersonville, OH | Ocean City, MD | Tilton, NH | ||||||||
Centers 26 - 31: | Blowing Rock, NC | Hilton Head II, SC | Myrtle Beach 501, SC | Terrell, TX | Westbrook, CT | Williamsburg, IA | |||||||
Excludes outlet centers not open for 12 full calendar months and the Mashantucket, CT (Foxwoods) center which opened in the second quarter of 2015 and has not yet stabilized. | |||||||||||||
(3) | Based on the Company’s forecast of 2016 Portfolio NOI (see Non-GAAP Definitions), as adjusted to include the Glendale, AZ (Westgate) center, which became a wholly-owned property on June 30, 2016. The Company’s forecast is based on management’s estimates as of June 30, 2016 and may be considered a forward-looking statement which is subject to risks and uncertainties. Actual results could differ materially from those projected due to various factors including, but not limited to, the risks associated with general economic and real estate conditions. For a more detailed discussion of the factors that affect our operating results, interested parties should review the Tanger Factory Outlet Centers, Inc. Annual Report on Form 10-K for the fiscal year ended December 31, 2015. | ||||||||||||
(4) | Includes domestic outlet centers open 12 full calendar months (in alphabetical order): | ||||||||||||
Unconsolidated: | Charlotte, NC | National Harbor, MD | Savannah, GA | Texas City, TX | |||||||||
8
Supplemental Operating and Financial Data for the
Quarter Ended 6/30/2016
Major Tenants (1)
Ten Largest Tenants as of June 30, 2016 | ||||||||
Tenant | # of Stores | GLA | % of Total GLA | |||||
The Gap, Inc. | 86 | 914,368 | 7.7 | % | ||||
Ascena Retail Group, Inc. | 138 | 839,921 | 7.0 | % | ||||
Nike, Inc. | 38 | 404,413 | 3.4 | % | ||||
PVH Corp. | 65 | 390,892 | 3.3 | % | ||||
V. F. Corporation | 38 | 343,807 | 2.9 | % | ||||
Ralph Lauren Corporation | 36 | 338,266 | 2.8 | % | ||||
G-III Apparel Group, Ltd. | 65 | 304,111 | 2.5 | % | ||||
Carter's, Inc. | 59 | 262,388 | 2.2 | % | ||||
Adidas AG | 36 | 226,469 | 1.9 | % | ||||
Hanes Brands | 40 | 221,229 | 1.9 | % | ||||
Total of All Listed Above | 601 | 4,245,864 | 35.6 | % | ||||
(1) | Excludes unconsolidated outlet centers. See table on page 4. |
9
Supplemental Operating and Financial Data for the
Quarter Ended 6/30/2016
Lease Expirations as of June 30, 2016
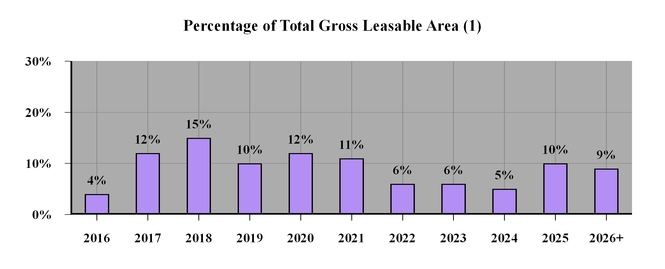
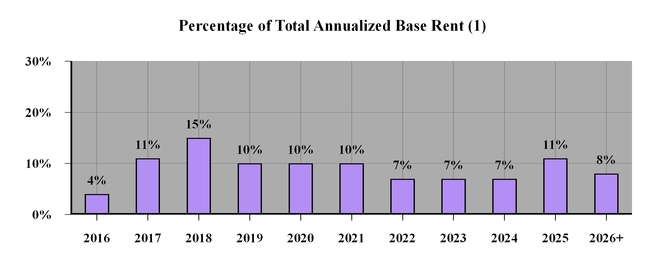
(1) Excludes unconsolidated outlet centers. See table on page 4.
10
Supplemental Operating and Financial Data for the
Quarter Ended 6/30/2016
Leasing Activity (1) (2)
3/31/2016 | 6/30/2016 | 9/30/2016 | 12/31/2016 | Year to Date | Prior Year to Date(3) | ||||||||||||||
Re-tenanted Space : | |||||||||||||||||||
Number of leases | 63 | 35 | 98 | 95 | |||||||||||||||
Gross leasable area | 188,245 | 113,911 | 302,156 | 356,268 | |||||||||||||||
New initial base rent per square foot | $ | 29.80 | $ | 27.62 | $ | 28.98 | $ | 28.30 | |||||||||||
Prior expiring base rent per square foot | $ | 25.95 | $ | 25.87 | $ | 25.92 | $ | 24.67 | |||||||||||
Percent increase | 14.8 | % | 6.8 | % | 11.8 | % | 14.7 | % | |||||||||||
New straight line base rent per square foot | $ | 32.84 | $ | 30.54 | $ | 31.97 | $ | 31.86 | |||||||||||
Prior straight line base rent per square foot | $ | 25.19 | $ | 24.67 | $ | 25.00 | $ | 24.35 | |||||||||||
Percent increase | 30.4 | % | 23.8 | % | 27.9 | % | 30.8 | % | |||||||||||
Renewed Space: | |||||||||||||||||||
Number of leases | 166 | 34 | 200 | 215 | |||||||||||||||
Gross leasable area | 762,300 | 171,736 | 934,036 | 1,017,883 | |||||||||||||||
New initial base rent per square foot | $ | 24.69 | $ | 24.86 | $ | 24.72 | $ | 25.20 | |||||||||||
Prior expiring base rent per square foot | $ | 22.78 | $ | 23.50 | $ | 22.91 | $ | 22.43 | |||||||||||
Percent increase | 8.4 | % | 5.8 | % | 7.9 | % | 12.4 | % | |||||||||||
New straight line base rent per square foot | $ | 25.91 | $ | 26.18 | $ | 25.96 | $ | 26.72 | |||||||||||
Prior straight line base rent per square foot | $ | 21.96 | $ | 22.82 | $ | 22.12 | $ | 21.79 | |||||||||||
Percent increase | 18.0 | % | 14.7 | % | 17.4 | % | 22.6 | % | |||||||||||
Total Re-tenanted and Renewed Space (3): | |||||||||||||||||||
Number of leases | 229 | 69 | 298 | 310 | |||||||||||||||
Gross leasable area | 950,545 | 285,647 | 1,236,192 | 1,374,151 | |||||||||||||||
New initial base rent per square foot | $ | 25.70 | $ | 25.96 | $ | 25.76 | $ | 26.00 | |||||||||||
Prior expiring base rent per square foot | $ | 23.41 | $ | 24.45 | $ | 23.65 | $ | 23.01 | |||||||||||
Percent increase | 9.8 | % | 6.2 | % | 8.9 | % | 13.0 | % | |||||||||||
New straight line base rent per square foot | $ | 27.28 | $ | 27.92 | $ | 27.43 | $ | 28.05 | |||||||||||
Prior straight line base rent per square foot | $ | 22.60 | $ | 23.56 | $ | 22.82 | $ | 22.45 | |||||||||||
Percent increase | 20.7 | % | 18.5 | % | 20.2 | % | 24.9 | % | |||||||||||
(1) | Excludes unconsolidated outlet centers. See table on page 4. |
(2) | All 2016 information excludes the outlet center in Fort Myers, FL, which was sold on January 12, 2016 and includes the Westgate outlet center, which is consolidated as of June 30, 2016 due to our acquisition of our partners' interest. |
(3) | All 2015 information excludes the outlet centers in Kittery I & II, ME; Tuscola, IL; and West Branch, MI, which were sold on September 30, 2015, and Barstow, CA, which was sold on October 5, 2015. |
11
Supplemental Operating and Financial Data for the
Quarter Ended 6/30/2016
External Growth Pipeline Summary as of June 30, 2016
Project/Market | Projected Opening | Approx Size in Sq Ft (000s) | Est Total Net Cost (millions) | Cost to Date (millions) | Tanger Ownership Percentage | Est Total Construction Loan (millions) | Amount Drawn (millions) | Est Future Tanger Capital Requirement (millions) | Projected Stabilized Yield | ||||||||||||
Under construction: | |||||||||||||||||||||
New Developments | |||||||||||||||||||||
Daytona Beach, FL | November 2016 | 352 | 91.3 | 41.9 | 100% | — | — | 49.4 | 9.5% - 10.5% | ||||||||||||
Total New Developments | 352 | $ | 91.3 | $ | 41.9 | $ | — | $ | — | $ | 49.4 | ||||||||||
The company's estimates, projections and judgments with respect to projected opening date, approximate size, estimated total net cost, Tanger ownership percentage, estimated total construction loan, estimated future Tanger capital requirement and projected stabilized yield for new development and expansion projects are subject to adjustment prior to and during the development process. Estimated total net cost shown net of outparcel sales and public financing. There are risks inherent to real estate development, some of which are not under the direct control of the company. Please refer to the company's filings with the Securities and Exchange Commission on Form10-K and Form 10-Q for a discussion of these risks. | |||||||||||||||||||||
12
Supplemental Operating and Financial Data for the
Quarter Ended 6/30/2016
Consolidated Balance Sheets (dollars in thousands)
6/30/2016 | 3/31/2016 | 12/31/2015 | 9/30/2015 | 6/30/2015 | |||||||||||||||
Assets | |||||||||||||||||||
Rental property | |||||||||||||||||||
Land | $ | 254,809 | $ | 235,622 | $ | 240,267 | $ | 225,306 | $ | 217,994 | |||||||||
Buildings, improvements and fixtures | 2,377,765 | 2,219,955 | 2,249,417 | 2,173,499 | 2,078,946 | ||||||||||||||
Construction in progress | 61,038 | 42,287 | 23,533 | 63,445 | 95,167 | ||||||||||||||
2,693,612 | 2,497,864 | 2,513,217 | 2,462,250 | 2,392,107 | |||||||||||||||
Accumulated depreciation | (769,777 | ) | (749,325 | ) | (748,341 | ) | (727,921 | ) | (699,836 | ) | |||||||||
Total rental property, net | 1,923,835 | 1,748,539 | 1,764,876 | 1,734,329 | 1,692,271 | ||||||||||||||
Cash and cash equivalents | 27,107 | 18,877 | 21,558 | 20,661 | 16,949 | ||||||||||||||
Restricted cash | — | — | 121,306 | 42,904 | — | ||||||||||||||
Rental property held for sale | — | — | — | 19,286 | 46,862 | ||||||||||||||
Investments in unconsolidated joint ventures | 210,486 | 218,732 | 201,083 | 197,964 | 212,939 | ||||||||||||||
Deferred lease costs and other intangibles, net | 133,578 | 123,404 | 127,089 | 130,390 | 133,909 | ||||||||||||||
Prepaids and other assets | 84,346 | 81,054 | 78,913 | 74,577 | 74,393 | ||||||||||||||
Total assets (a) | $ | 2,379,352 | $ | 2,190,606 | $ | 2,314,825 | $ | 2,220,111 | $ | 2,177,323 | |||||||||
Liabilities and Equity | |||||||||||||||||||
Liabilities | |||||||||||||||||||
Debt | |||||||||||||||||||
Senior, unsecured notes, net | $ | 789,991 | $ | 789,635 | $ | 789,285 | $ | 788,930 | $ | 788,577 | |||||||||
Unsecured term loans, net | 321,980 | 258,540 | 265,832 | 265,674 | 265,500 | ||||||||||||||
Mortgages payable, net | 235,215 | 167,603 | 310,587 | 280,594 | 275,463 | ||||||||||||||
Unsecured lines of credit, net | 255,661 | 259,890 | 186,220 | 193,338 | 173,533 | ||||||||||||||
Total debt (a) | 1,602,847 | 1,475,668 | 1,551,924 | 1,528,536 | 1,503,073 | ||||||||||||||
Accounts payable and accruals | 62,658 | 67,608 | 97,396 | 90,506 | 83,787 | ||||||||||||||
Deferred financing obligation | — | — | 28,388 | 28,388 | 28,388 | ||||||||||||||
Other liabilities | 53,433 | 31,758 | 31,085 | 31,405 | 30,639 | ||||||||||||||
Total liabilities | 1,718,938 | 1,575,034 | 1,708,793 | 1,678,835 | 1,645,887 | ||||||||||||||
Commitments and contingencies | — | — | — | — | — | ||||||||||||||
Equity | |||||||||||||||||||
Tanger Factory Outlet Centers, Inc. | |||||||||||||||||||
Common shares | 960 | 961 | 959 | 958 | 958 | ||||||||||||||
Paid in capital | 811,853 | 808,779 | 806,379 | 802,638 | 798,587 | ||||||||||||||
Accumulated distributions in excess of net income | (153,465 | ) | (195,654 | ) | (195,486 | ) | (256,180 | ) | (272,948 | ) | |||||||||
Accumulated other comprehensive loss | (32,090 | ) | (29,814 | ) | (36,715 | ) | (33,943 | ) | (22,470 | ) | |||||||||
Equity attributable to Tanger Factory Outlet Centers, Inc. | 627,258 | 584,272 | 575,137 | 513,473 | 504,127 | ||||||||||||||
Equity attributable to noncontrolling interests | |||||||||||||||||||
Noncontrolling interests in Operating Partnership | 32,996 | 30,711 | 30,309 | 27,207 | 26,712 | ||||||||||||||
Noncontrolling interest in other consolidated partnerships | 160 | 589 | 586 | 596 | 597 | ||||||||||||||
Total equity | 660,414 | 615,572 | 606,032 | 541,276 | 531,436 | ||||||||||||||
Total liabilities and equity | $ | 2,379,352 | $ | 2,190,606 | $ | 2,314,825 | $ | 2,220,111 | $ | 2,177,323 | |||||||||
(a) | In accordance with recent accounting guidance, "Simplifying the Presentation of Debt Issuance Costs", our deferred debt origination costs and related accumulated amortization previously recorded in the line item “deferred debt origination costs, net” have been reclassified from assets to the respective debt line items within the liabilities section in the consolidated balance sheet as of December 31, 2015. |
13
Supplemental Operating and Financial Data for the
Quarter Ended 6/30/2016
Consolidated Statements of Operations (dollars and shares in thousands)
Three Months Ended | YTD | |||||||||||||||||||||||||||
6/30/16 | 3/31/16 | 12/31/15 | 9/30/15 | 6/31/15 | 6/30/16 | 6/30/15 | ||||||||||||||||||||||
Revenues | ||||||||||||||||||||||||||||
Base rentals | $ | 75,003 | $ | 72,623 | $ | 73,889 | $ | 75,841 | $ | 72,329 | $ | 147,626 | $ | 139,958 | ||||||||||||||
Percentage rentals | 2,326 | 2,150 | 3,261 | 2,625 | 2,042 | 4,476 | 4,271 | |||||||||||||||||||||
Expense reimbursements | 30,754 | 33,242 | 32,653 | 30,542 | 29,909 | 63,996 | 63,273 | |||||||||||||||||||||
Management, leasing and other services | 1,332 | 1,121 | 1,163 | 1,253 | 1,727 | 2,453 | 3,010 | |||||||||||||||||||||
Other income | 1,918 | 1,669 | 1,835 | 2,645 | 1,729 | 3,587 | 3,150 | |||||||||||||||||||||
Total revenues | 111,333 | 110,805 | 112,801 | 112,906 | 107,736 | 222,138 | 213,662 | |||||||||||||||||||||
Expenses | ||||||||||||||||||||||||||||
Property operating | 35,012 | 37,874 | 37,582 | 36,231 | 34,958 | 72,886 | 72,690 | |||||||||||||||||||||
General and administrative | 11,675 | 11,565 | 10,038 | 11,514 | 11,612 | 23,240 | 22,917 | |||||||||||||||||||||
Depreciation and amortization | 26,306 | 26,567 | 26,890 | 28,785 | 24,272 | 52,873 | 48,261 | |||||||||||||||||||||
Total expenses | 72,993 | 76,006 | 74,510 | 76,530 | 70,842 | 148,999 | 143,868 | |||||||||||||||||||||
Operating income | 38,340 | 34,799 | 38,291 | 36,376 | 36,894 | 73,139 | 69,794 | |||||||||||||||||||||
Other income/(expense) | ||||||||||||||||||||||||||||
Interest expense | (13,800 | ) | (14,884 | ) | (14,078 | ) | (13,933 | ) | (13,088 | ) | (28,684 | ) | (26,177 | ) | ||||||||||||||
Gain on sale of assets and interests in unconsolidated entities | — | 4,887 | 86,506 | 20,215 | — | 4,887 | 13,726 | |||||||||||||||||||||
Gain on previously held interest in acquired joint venture | 49,258 | — | — | — | — | 49,258 | — | |||||||||||||||||||||
Other nonoperating income (expense) | 38 | 316 | 62 | 89 | (493 | ) | 354 | (187 | ) | |||||||||||||||||||
Income before equity in earnings of unconsolidated joint ventures | 73,836 | 25,118 | 110,781 | 42,747 | 23,313 | 98,954 | 57,156 | |||||||||||||||||||||
Equity in earnings of unconsolidated joint ventures | 3,466 | 3,499 | 3,182 | 3,713 | 2,046 | 6,965 | 4,589 | |||||||||||||||||||||
Net income | 77,302 | 28,617 | 113,963 | 46,460 | 25,359 | 105,919 | 61,745 | |||||||||||||||||||||
Noncontrolling interests in Operating Partnership | (3,897 | ) | (1,444 | ) | (5,799 | ) | (2,364 | ) | (1,313 | ) | (5,341 | ) | (3,168 | ) | ||||||||||||||
Noncontrolling interests in other consolidated partnerships | 12 | (23 | ) | (32 | ) | (21 | ) | 435 | (11 | ) | 416 | |||||||||||||||||
Net income attributable to Tanger Factory Outlet Centers, Inc. | 73,417 | 27,150 | 108,132 | 44,075 | 24,481 | 100,567 | 58,993 | |||||||||||||||||||||
Allocation to participating securities | (725 | ) | (294 | ) | (1,198 | ) | (494 | ) | (308 | ) | (1,019 | ) | (716 | ) | ||||||||||||||
Net income available to common shareholders | $ | 72,692 | $ | 26,856 | $ | 106,934 | $ | 43,581 | $ | 24,173 | $ | 99,548 | $ | 58,277 | ||||||||||||||
Basic earnings per common share | ||||||||||||||||||||||||||||
Net income | $ | 0.76 | $ | 0.28 | $ | 1.13 | $ | 0.46 | $ | 0.26 | $ | 1.05 | $ | 0.62 | ||||||||||||||
Diluted earnings per common share | ||||||||||||||||||||||||||||
Net income | $ | 0.76 | $ | 0.28 | $ | 1.13 | $ | 0.46 | $ | 0.26 | $ | 1.04 | $ | 0.62 | ||||||||||||||
Weighted average common shares | ||||||||||||||||||||||||||||
Basic | 95,124 | 94,944 | 94,768 | 94,746 | 94,741 | 95,034 | 94,639 | |||||||||||||||||||||
Diluted | 95,375 | 95,003 | 94,827 | 94,799 | 94,795 | 95,265 | 94,705 | |||||||||||||||||||||
14
Supplemental Operating and Financial Data for the
Quarter Ended 6/30/2016
Unconsolidated Joint Venture Information (1)
The following table details certain information as of June 30, 2016, except for Net Operating Income ("NOI") which is for the six months ended June 30, 2016, about various unconsolidated real estate joint ventures in which we have an ownership interest (dollars in millions):
Joint Venture | Center Location | Tanger's Ownership % | Square Feet | Tanger's Share of Total Assets | Tanger's Share of NOI | Tanger's Share of Net Debt (2) | ||||||||||||||
Charlotte | Charlotte, NC | 50.0 | % | 397,839 | $ | 43.2 | $ | 3.6 | $ | 44.8 | ||||||||||
Columbus (3) | Columbus, OH | 50.0 | % | 355,220 | 43.4 | (0.1 | ) | — | ||||||||||||
Galveston/Houston | Texas City, TX | 50.0 | % | 352,705 | 29.8 | 2.3 | 32.4 | |||||||||||||
National Harbor | National Harbor, MD | 50.0 | % | 338,786 | 49.0 | 2.7 | 43.0 | |||||||||||||
RioCan Canada (4) | Various | 50.0 | % | 902,089 | 133.7 | 3.2 | 5.9 | |||||||||||||
Savannah (5) | Savannah, GA | 50.0 | % | 419,197 | 97.1 | 6.7 | 47.8 | |||||||||||||
Total | $ | 396.2 | $ | 18.4 | $ | 173.9 | ||||||||||||||
(1) | Excludes the Westgate joint venture as we acquired our partners' interest in the center on June 30, 2016. Our share of the joint venture's NOI for the six months ended June 30, 2016 was $3.0 million. |
(2) | Net of debt origination costs and premiums |
(3) | Center opened in June 2016. |
(4) | Includes a 161,307 square foot center in Bromont, Quebec; a 308,517 square foot center in Cookstown, Ontario; a 316,494 square foot center in Ottawa, Ontario; a 115,771 square foot center in Saint-Sauveur, Quebec; as well as due diligence costs for additional potential sites in Canada. |
(5) | Based on capital contribution and distribution provisions in the joint venture agreement, we expect our economic interest in the venture's cash flow to be greater than indicated in the Tanger's Ownership % column, which states our legal interest in this venture. As of June 30, 2016, based upon the liquidation proceeds we would receive from a hypothetical liquidation of our investment based on depreciated book value, our estimated economic interest in the venture was approximately 98%. Our economic interest may fluctuate based on a number of factors, including mortgage financing, partnership capital contributions and distributions, and proceeds from gains or losses of asset sales. |
15
Supplemental Operating and Financial Data for the
Quarter Ended 6/30/2016
Debt Outstanding Summary (dollars in thousands)
As of June 30, 2016 | |||||||||||
Principal Balance | Stated Interest Rate | Effective(1) Interest Rate | Maturity Date | ||||||||
Unsecured debt: | |||||||||||
Unsecured lines of credit (2) | $ | 259,200 | LIBOR + 0.90% | 10/29/2019 | |||||||
2020 Senior unsecured notes | 300,000 | 6.125% | 6.219% | 6/1/2020 | |||||||
2023 Senior unsecured notes | 250,000 | 3.875% | 4.076% | 12/1/2023 | |||||||
2024 Senior unsecured notes | 250,000 | 3.75 | % | 3.819% | 12/1/2024 | ||||||
Unsecured term loan (3) | 325,000 | LIBOR + 0.95% | 4/13/2021 | ||||||||
Net debt discounts and debt origination costs | (16,568 | ) | |||||||||
Total unsecured debt | $ | 1,367,632 | |||||||||
Secured mortgage debt: | |||||||||||
Atlantic City, NJ (4) | $ | 41,911 | 5.14% - 7.65% | 5.05% | 11/15/2021 - 12/8/2026 | ||||||
Foxwoods, CT (5) | 70,250 | LIBOR + 1.65% | 12/5/2017 | ||||||||
Southaven, MS (6) | 58,989 | LIBOR + 1.75% | 4/29/2018 | ||||||||
Westgate, AZ (7) | 62,000 | LIBOR + 1.75% | 6/27/2017 | ||||||||
Debt premium and debt origination costs | 2,065 | ||||||||||
Total secured mortgage debt | $ | 235,215 | |||||||||
Tanger's share of unconsolidated JV debt: | |||||||||||
Charlotte (8) | $ | 45,000 | LIBOR + 1.45% | 11/24/2018 | |||||||
Galveston/Houston (9) | 32,500 | LIBOR + 1.50% | 7/1/2017 | ||||||||
National Harbor (10) | 43,500 | LIBOR + 1.65% | 11/13/2019 | ||||||||
RioCan Canada(11) | 5,610 | 5.75 | % | 4.18 | % | 5/10/2020 | |||||
Savannah (12) | 48,469 | LIBOR + 1.65% | 5/21/2017 | ||||||||
Debt premium and debt origination costs | (1,134 | ) | |||||||||
Total Tanger's share of unconsolidated JV debt | $ | 173,945 | |||||||||
(1) | The effective interest rate excludes interest rate swap agreements that fix the base LIBOR rate at an average of 1.16% on notional amounts aggregating $325.0 million as follows: |
(a) | Interest rate swaps entered into in October 2013 to hedge our variable interest rate exposure on notional amounts aggregating $150.0 million. These interest rate swap agreements fix the base LIBOR rate at an average of 1.30% through August 14, 2018, and |
(b) | Interest rate swaps entered into in April 2016 to hedge our variable interest rate exposure on notional amounts aggregating $175.0 million. These interest rate swap agreements fix the base LIBOR rate at an average of 1.03% through January 1, 2021. |
16
Supplemental Operating and Financial Data for the
Quarter Ended 6/30/2016
(2) | The company has an unsecured, syndicated credit line with a borrowing capacity totaling $500.0 million and a separate cash management line of credit with a borrowing capacity of $20.0 million with one of the participants in the syndication. The syndicated credit line may be increased to $1.0 billion through an accordion feature in certain circumstances. The unsecured lines of credit have an expiration date of October 29, 2019 with an option for a one year extension. |
(3) | On April 13, 2016, the company amended the unsecured term loan to increase the size of the loan from $250 million to $325 million, extend the maturity date from February 23, 2019 to April 13, 2021, and reduce the LIBOR spread from LIBOR plus 105 basis points to LIBOR plus 95 basis points. The additional loan proceeds of $75 million were used to pay down balances under the Operating Partnership's unsecured lines of credit. |
(4) | Represents mortgages assumed in the acquisition of this property. |
(5) | Represents a mortgage loan with the ability to borrow up to $70.3 million. The loan initially matures on December 5, 2017, with two one -year extension options. |
(6) | Represents a mortgage loan with the ability to borrow up to $60.0 million. The loan initially matures on April 29, 2018, with one two-year extension option. The additional $1.0 million is available to fund the remaining construction costs to complete the center which opened in November 2015. |
(7) | Represents a mortgage loan with with the ability to borrow up to $62.0 million. On April 1, 2015, the joint venture exercised the option to extend the maturity date of the loan to June 27, 2017. |
(8) | Represents a mortgage loan of $90.0 million. The loan initially matures on November 24, 2018, with one one -year extension option. As of June 30, 2016, the principal balance on the loan was $90.0 million. |
(9) | Represents a mortgage loan with the ability to borrow up to $70.0 million with a maturity date of July 1, 2017 and the option to extend the maturity for one additional year. As of June 30, 2016, the principal balance on the loan was $65.0 million. The additional $5.0 million is available for future expansion. |
(10) | Represents a mortgage loan with with the ability to borrow up to $87.0 million. As of June 30, 2016, the principal balance on the loan was $87.0 million. |
(11) | Represents the mortgage assumed related to the acquisition of the Saint-Sauveur, Quebec property by the RioCan co-owners in November 2012. The mortgage has a principal balance of $11.2 million and matures on May 10, 2020. |
(12) | Represents a mortgage loan with a with the ability to borrow up to $100.9 million. The mortgage loan has a maturity date of May 21, 2017, with two options to extend the maturity date each for one additional year. As of June 30, 2016, the principal balance on the loan was $96.9 million. The additional $4.0 million is available for future expansion. |
17
Supplemental Operating and Financial Data for the
Quarter Ended 6/30/2016
Future Scheduled Principal Payments (dollars in thousands)
As of June 30, 2016 | |||||||||||
Year | Tanger Consolidated Payments | Tanger's Share of Unconsolidated JV Payments | Total Scheduled Payments | ||||||||
2016 | $ | 1,442 | $ | 134 | $ | 1,576 | |||||
2017 | 135,258 | 81,247 | 216,505 | ||||||||
2018 | 62,172 | 45,294 | 107,466 | ||||||||
2019 (1) | 262,569 | 43,811 | 306,380 | ||||||||
2020 | 303,566 | 4,593 | 308,159 | ||||||||
2021 | 330,793 | — | 330,793 | ||||||||
2022 | 4,436 | — | 4,436 | ||||||||
2023 | 254,768 | — | 254,768 | ||||||||
2024 | 255,140 | — | 255,140 | ||||||||
2025 | 1,501 | — | 1,501 | ||||||||
2026 & thereafter | 5,705 | — | 5,705 | ||||||||
$ | 1,617,350 | $ | 175,079 | $ | 1,792,429 | ||||||
Net debt discounts and debt origination costs | (14,503 | ) | (1,134 | ) | (15,637 | ) | |||||
$ | 1,602,847 | $ | 173,945 | $ | 1,776,792 | ||||||
(1) | Includes principal balance of $259.2 million outstanding under the company's unsecured lines of credit. |
Senior Unsecured Notes Financial Covenants (1)
As of June 30, 2016 | ||||||
Required | Actual | Compliance | ||||
Total Consolidated Debt to Adjusted Total Assets | <60% | 50 | % | Yes | ||
Total Secured Debt to Adjusted Total Assets | <40% | 7 | % | Yes | ||
Total Unencumbered Assets to Unsecured Debt | >150% | 178 | % | Yes | ||
Consolidated Income Available for Debt Service to Annual Debt Service Charge | >1.5 | 5.49 | Yes | |||
(1) | For a complete listing of all debt covenants related to the company's Senior Unsecured Notes, as well as definitions of the above terms, please refer to the company's filings with the Securities and Exchange Commission. |
18
Supplemental Operating and Financial Data for the
Quarter Ended 6/30/2016
NON-GAAP SUPPLEMENTAL MEASURES
Funds From Operations
Funds From Operations ("FFO") is a widely used measure of the operating performance for real estate companies that supplements net income (loss) determined in accordance with GAAP. We determine FFO based on the definition set forth by the National Association of Real Estate Investment Trusts ("NAREIT"), of which we are a member. FFO represents net income (loss) (computed in accordance with GAAP) before extraordinary items and gains (losses) on sale or disposal of depreciable operating properties, plus depreciation and amortization of real estate assets, impairment losses on depreciable real estate of consolidated real estate and after adjustments for unconsolidated partnerships and joint ventures, including depreciation and amortization, and impairment losses on investments in unconsolidated joint ventures driven by a measurable decrease in the fair value of depreciable real estate held by the unconsolidated joint ventures.
FFO is intended to exclude historical cost depreciation of real estate as required by GAAP which assumes that the value of real estate assets diminishes ratably over time. Historically, however, real estate values have risen or fallen with market conditions. Because FFO excludes depreciation and amortization of real estate assets, gains and losses from property dispositions and extraordinary items, it provides a performance measure that, when compared year over year, reflects the impact to operations from trends in occupancy rates, rental rates, operating costs, development activities and interest costs, providing perspective not immediately apparent from net income.
We present FFO because we consider it an important supplemental measure of our operating performance. In addition, a portion of cash bonus compensation to certain members of management is based on our FFO or Adjusted Funds From Operations ("AFFO"), which is described in the section below. We believe it is useful for investors to have enhanced transparency into how we evaluate our performance and that of our management. In addition, FFO is frequently used by securities analysts, investors and other interested parties in the evaluation of REITs, many of which present FFO when reporting their results. FFO is also widely used by us and others in our industry to evaluate and price potential acquisition candidates. NAREIT has encouraged its member companies to report their FFO as a supplemental, industry-wide standard measure of REIT operating performance.
FFO has significant limitations as an analytical tool, and you should not consider it in isolation, or as a substitute for analysis of our results as reported under GAAP. Some of these limitations are:
• | FFO does not reflect our cash expenditures, or future requirements, for capital expenditures or contractual commitments; |
• | FFO does not reflect changes in, or cash requirements for, our working capital needs; |
• | Although depreciation and amortization are non-cash charges, the assets being depreciated and amortized will often have to be replaced in the future, and FFO does not reflect any cash requirements for such replacements; |
• | FFO, which includes discontinued operations, may not be indicative of our ongoing operations; and |
• | Other companies in our industry may calculate FFO differently than we do, limiting its usefulness as a comparative measure. |
Because of these limitations, FFO should not be considered as a measure of discretionary cash available to us to invest in the growth of our business or our dividend paying capacity. We compensate for these limitations by relying primarily on our GAAP results and using FFO only as a supplemental measure.
Adjusted Funds From Operations
We present AFFO, as a supplemental measure of our performance. We define AFFO as FFO further adjusted to eliminate the impact of certain items that we do not consider indicative of our ongoing operating performance. These further adjustments are itemized in the table below. You are encouraged to evaluate these adjustments and the reasons we consider them appropriate for supplemental analysis. In evaluating AFFO you should be aware that in the future we may incur expenses that are the same as or similar to some of the adjustments in this presentation. Our presentation of AFFO should not be construed as an inference that our future results will be unaffected by unusual or non-recurring items.
We present AFFO because we believe it assists investors and analysts in comparing our performance across reporting periods on a consistent basis by excluding items that we do not believe are indicative of our core operating performance. In addition, we believe it is useful for investors to have enhanced transparency into how we evaluate management’s performance and the effectiveness of our business strategies. We use AFFO when certain material, unplanned transactions occur as a factor in evaluating management's performance and to evaluate the effectiveness of our business strategies, and may use AFFO when determining incentive compensation.
AFFO has limitations as an analytical tool. Some of these limitations are:
• | AFFO does not reflect our cash expenditures, or future requirements, for capital expenditures or contractual commitments; |
• | AFFO does not reflect changes in, or cash requirements for, our working capital needs; |
19
Supplemental Operating and Financial Data for the
Quarter Ended 6/30/2016
• | Although depreciation and amortization are non-cash charges, the assets being depreciated and amortized will often have to be replaced in the future, and AFFO does not reflect any cash requirements for such replacements; |
• | AFFO does not reflect the impact of certain cash charges resulting from matters we consider not to be indicative of our ongoing operations; and |
• | Other companies in our industry may calculate AFFO differently than we do, limiting its usefulness as a comparative measure. |
Because of these limitations, AFFO should not be considered in isolation or as a substitute for performance measures calculated in accordance with GAAP. We compensate for these limitations by relying primarily on our GAAP results and using AFFO only as a supplemental measure.
Funds Available for Distribution
Funds Available for Distribution ("FAD") is a non-GAAP financial measure that we define as FFO, excluding corporate depreciation, amortization of finance costs, amortization of net debt discount (premium), amortization of share-based compensation, straight line rent amounts, market rent amounts, less 2nd generation tenant allowances, capital improvement expenditures, and our share of the items listed above for our unconsolidated joint ventures. Investors, analysts and the Company utilize FAD as an indicator of common dividend potential. The FAD payout ratio, which represents regular distributions to common shareholders and unit holders of the Operating Partnership expressed as a percentage of FAD, facilitates the comparison of dividend coverage between REITs.
We believe that net income (loss) is the most directly comparable GAAP financial measure to FAD. FAD does not represent cash generated from operating activities in accordance with GAAP and should not be considered as an alternative to net income (loss) as an indication of our performance or to cash flows as a measure of liquidity or our ability to make distributions. Other companies in our industry may calculate FAD differently than we do, limiting its usefulness as a comparative measure.
Portfolio Net Operating Income and Same Center NOI
We present portfolio net operating income ("Portfolio NOI") and same center net operating income ("Same Center NOI") as supplemental measures of our operating performance. Portfolio NOI represents our property level net operating income which is defined as total operating revenues less property operating expenses and excludes termination fees and non-cash adjustments including straight-line rent, net above and below market rent amortization and gains or losses on the sale of outparcels recognized during the periods presented. Same Center NOI is calculated using Portfolio NOI for the properties that were operational for the entire portion of both comparable reporting periods and which were not acquired, renovated or subject to a material non-recurring event, such as a natural disaster, during the comparable reporting periods.
We believe Portfolio NOI and Same Center NOI are non-GAAP metrics used by industry analysts, investors and management to measure the operating performance of our properties because it provides a performance measure directly related to the revenues and expenses involved in owning and operating real estate assets and provides a perspective not immediately apparent from net income, FFO or AFFO. Because Same Center NOI excludes properties developed, redeveloped, acquired and sold; as well as non-cash adjustments, gains or losses on the sale of outparcels and termination rents; it highlights operating trends such as occupancy levels, rental rates and operating costs on properties that were operational for both comparable periods. Other REITs may use different methodologies for calculating Portfolio NOI and Same Center NOI, and accordingly, our Portfolio NOI and Same Center NOI may not be comparable to other REITs.
Portfolio NOI and Same Center NOI should not be considered alternatives to net income (loss) or as an indicator of our financial performance since they do not reflect the entire operations of our portfolio, nor do they reflect the impact of general and administrative expenses, acquisition-related expenses, interest expense, depreciation and amortization costs, other non-property income and losses, the level of capital expenditures and leasing costs necessary to maintain the operating performance of our properties, or trends in development and construction activities which are significant economic costs and activities that could materially impact our results from operations. Because of these limitations, Portfolio NOI and Same Center NOI should not be viewed in isolation or as a substitute for performance measures calculated in accordance with GAAP. We compensate for these limitations by relying primarily on our GAAP results and using Portfolio NOI and Same Center NOI only as supplemental measures.
Non-GAAP Pro Rata Balance Sheet and Income Statement
The pro rata balance sheet and pro rata income statement data is not, and is not intended to be, a presentation in accordance with GAAP. The pro rata balance sheet and pro rata income statement data reflect our proportionate economic ownership of each asset in our portfolio that we do not wholly own. These assets may be found in the table found earlier in this report entitled, “Unconsolidated Joint Venture Information.” The amounts shown in the column labeled “Consolidated” were prepared on a basis consistent with the Company’s consolidated financial statements as filed with the SEC on the most recent Form 10-Q or 10-K, as applicable. The amounts in the column labeled “Pro Rata Portion Unconsolidated Joint Ventures” were derived on a property-by-property basis by applying to each financial statement line item the ownership percentage interest used to arrive at our share of net income or loss during the period when applying the equity method of accounting. A similar calculation was performed for the amounts in the column labeled “Pro Rata Portion Noncontrolling interests.”
20
Supplemental Operating and Financial Data for the
Quarter Ended 6/30/2016
We do not control the unconsolidated joint ventures and the presentations of the assets and liabilities and revenues and expenses do not represent our legal claim to such items. The operating agreements of the unconsolidated joint ventures generally provide that partners may receive cash distributions (1) quarterly, to the extent there is available cash from operations, (2) upon a capital event, such as a refinancing or sale or (3) upon liquidation of the venture. The amount of cash each partner receives is based upon specific provisions of each operating agreement and vary depending on factors including the amount of capital contributed by each partner and whether any contributions are entitled to priority distributions. Upon liquidation of the joint venture and after all liabilities, priority distributions and initial equity contributions have been repaid, the partners generally would be entitled to any residual cash remaining based on the legal ownership percentage shown in the table found earlier in this report entitled “Unconsolidated Joint Venture Information”.
We provide pro rata balance sheet and income statement information because we believe it assists investors and analysts in estimating our economic interest in our unconsolidated joint ventures when read in conjunction with the Company’s reported results under GAAP. The presentation of pro rata financial statements has limitations as an analytical tool. Some of these limitations include:
• | The amounts shown on the individual line items were derived by applying our overall economic ownership interest percentage determined when applying the equity method of accounting and do not necessarily represent our legal claim to the assets and liabilities, or the revenues and expenses; and |
• | Other companies in our industry may calculate their pro rata interest differently than we do, limiting the usefulness as a comparative measure. |
Because of these limitations, the pro rata balance sheet and income statement should not be considered in isolation or as a substitute for our financial statements as reported under GAAP. We compensate for these limitations by relying primarily on our GAAP results and using the pro rata balance sheet and income statement only supplementally.
21
Supplemental Operating and Financial Data for the
Quarter Ended 6/30/2016
Reconciliation of Net Income to FFO and AFFO (dollars and shares in thousands):
Three Months Ended | YTD | |||||||||||||||||||||||||||
6/30/16 | 3/31/16 | 12/31/15 | 9/30/15 | 6/30/15 | 6/30/16 | 6/30/15 | ||||||||||||||||||||||
Net income | $ | 77,302 | $ | 28,617 | $ | 113,963 | $ | 46,460 | $ | 25,359 | $ | 105,919 | $ | 61,745 | ||||||||||||||
Adjusted for - | ||||||||||||||||||||||||||||
Depreciation and amortization of real estate assets - consolidated | 25,937 | 26,205 | 26,531 | 28,428 | 23,919 | 52,142 | 47,556 | |||||||||||||||||||||
Depreciation and amortization of real estate assets - unconsolidated joint ventures | 5,808 | 5,339 | 5,528 | 5,411 | 5,038 | 11,147 | 9,114 | |||||||||||||||||||||
Gain on sale of assets and interests in unconsolidated entities | — | (4,887 | ) | (86,506 | ) | (20,215 | ) | — | (4,887 | ) | (13,726 | ) | ||||||||||||||||
Gain on previously held interest in acquired joint venture | (49,258 | ) | — | — | — | — | (49,258 | ) | — | |||||||||||||||||||
FFO | 59,789 | 55,274 | 59,516 | 60,084 | 54,316 | 115,063 | 104,689 | |||||||||||||||||||||
FFO attributable to noncontrolling interests in other consolidated partnerships | (12 | ) | (47 | ) | (57 | ) | (45 | ) | 412 | (59 | ) | 370 | ||||||||||||||||
Allocation to participating securities | (564 | ) | (569 | ) | (625 | ) | (640 | ) | (583 | ) | (1,133 | ) | (1,143 | ) | ||||||||||||||
FFO available to common shareholders (1) | $ | 59,213 | $ | 54,658 | $ | 58,834 | $ | 59,399 | $ | 54,145 | $ | 113,871 | $ | 103,916 | ||||||||||||||
As further adjusted for: | ||||||||||||||||||||||||||||
Acceleration (reversal) of share-based compensation (2) (3) | — | 293 | (731 | ) | — | — | 293 | — | ||||||||||||||||||||
Demolition costs | 182 | — | — | — | — | 182 | — | |||||||||||||||||||||
Write-off of debt discount due to repayment of debt prior to maturity (4) | — | 882 | — | — | — | 882 | — | |||||||||||||||||||||
Impact of above adjustments to the allocation of earnings to participating securities | (1 | ) | (12 | ) | 8 | — | — | (13 | ) | — | ||||||||||||||||||
AFFO available to common shareholders (1) | $ | 59,394 | $ | 55,821 | $ | 58,111 | $ | 59,399 | $ | 54,145 | $ | 115,215 | $ | 103,916 | ||||||||||||||
FFO per common share - diluted (1) | $ | 0.59 | $ | 0.55 | $ | 0.59 | $ | 0.59 | $ | 0.54 | $ | 1.14 | $ | 1.04 | ||||||||||||||
AFFO per common share - diluted (1) | $ | 0.59 | $ | 0.56 | $ | 0.58 | $ | 0.59 | $ | 0.54 | $ | 1.15 | $ | 1.04 | ||||||||||||||
Weighted Average Shares | ||||||||||||||||||||||||||||
Basic weighted average common shares | 95,124 | 94,944 | 94,768 | 94,746 | 94,741 | 95,034 | 94,639 | |||||||||||||||||||||
Effect of notional units | 183 | — | — | — | — | 167 | — | |||||||||||||||||||||
Effect of outstanding options and restricted common shares | 68 | 59 | 59 | 53 | 54 | 64 | 66 | |||||||||||||||||||||
Diluted weighted average common shares (for earnings per share computations) | 95,375 | 95,003 | 94,827 | 94,799 | 94,795 | 95,265 | 94,705 | |||||||||||||||||||||
Exchangeable operating partnership units | 5,053 | 5,053 | 5,078 | 5,078 | 5,078 | 5,053 | 5,078 | |||||||||||||||||||||
Diluted weighted average common shares (for FFO and AFFO per share computations) (1) | 100,428 | 100,056 | 99,905 | 99,877 | 99,873 | 100,318 | 99,783 | |||||||||||||||||||||
22
Supplemental Operating and Financial Data for the
Quarter Ended 6/30/2016
Reconciliation of FFO to FAD (dollars and shares in thousands):
Three Months Ended | YTD | |||||||||||||||||||||||||||
6/30/16 | 3/31/16 | 12/31/15 | 9/30/15 | 6/30/15 | 6/30/16 | 6/30/15 | ||||||||||||||||||||||
FFO available to common shareholders | $ | 59,213 | $ | 54,658 | $ | 58,834 | $ | 59,399 | $ | 54,145 | $ | 113,871 | $ | 103,916 | ||||||||||||||
Adjusted for - | ||||||||||||||||||||||||||||
Corporate depreciation excluded above | 369 | 362 | 359 | 357 | 353 | 731 | 705 | |||||||||||||||||||||
Amortization of finance costs | 761 | 744 | 835 | 694 | 603 | 1,505 | 1,202 | |||||||||||||||||||||
Amortization of net debt discount (premium) | 117 | 959 | 191 | 139 | (88 | ) | 1,076 | (74 | ) | |||||||||||||||||||
Amortization of share-based compensation | 3,654 | 4,001 | 3,152 | 3,994 | 3,953 | 7,655 | 7,566 | |||||||||||||||||||||
Straight line rent adjustment | (1,713 | ) | (1,607 | ) | (1,605 | ) | (1,924 | ) | (1,549 | ) | (3,320 | ) | (2,818 | ) | ||||||||||||||
Market rent adjustment | 641 | 663 | 337 | 825 | 383 | 1,304 | 1,299 | |||||||||||||||||||||
2nd generation tenant allowances | (2,804 | ) | (1,671 | ) | (3,960 | ) | (1,428 | ) | (4,128 | ) | (4,475 | ) | (5,084 | ) | ||||||||||||||
Capital improvements | (8,391 | ) | (3,043 | ) | (1,231 | ) | (3,555 | ) | (4,558 | ) | (11,434 | ) | (7,296 | ) | ||||||||||||||
Adjustments from unconsolidated joint ventures | (504 | ) | (384 | ) | (196 | ) | (506 | ) | (399 | ) | (888 | ) | (878 | ) | ||||||||||||||
FAD available to common shareholders (1) | $ | 51,343 | $ | 54,682 | $ | 56,716 | $ | 57,995 | $ | 48,715 | $ | 106,025 | $ | 98,538 | ||||||||||||||
Dividends per share | $ | 0.325 | $ | 0.285 | $ | 0.285 | $ | 0.285 | $ | 0.285 | $ | 0.610 | $ | 0.525 | ||||||||||||||
Special dividends per share | — | — | 0.210 | — | — | — | — | |||||||||||||||||||||
Total dividends per share | $ | 0.325 | $ | 0.285 | $ | 0.495 | $ | 0.285 | $ | 0.285 | $ | 0.610 | $ | 0.525 | ||||||||||||||
FFO payout ratio (5) | 55 | % | 52 | % | 48 | % | 48 | % | 53 | % | 54 | % | 50 | % | ||||||||||||||
FAD payout ratio (5) | 64 | % | 52 | % | 50 | % | 49 | % | 58 | % | 58 | % | 53 | % | ||||||||||||||
Diluted weighted average common shares | 100,428 | 100,056 | 99,905 | 99,877 | 99,873 | 100,318 | 99,783 | |||||||||||||||||||||
(1) | Assumes the Class A common limited partnership units of the Operating Partnership held by the noncontrolling interests are exchanged for common shares of the Company. Each Class A common limited partnership unit is exchangeable for one of the Company's common shares, subject to certain limitations to preserve the Company's REIT status. |
(2) | Represents restricted shares that vested immediately upon the death of Director Donald Drapkin for the three months ended March 31, 2016 and six months ended June 30, 2016. |
(3) | The reversal of certain share-based compensation awards during the three months ended December 31, 2015 previously recognized on awards not expected to vest due to the announcement of the Company’s Chief Financial Officer's retirement in May 2016. |
(4) | Due to the January 28, 2016 early repayment of the $150 million mortgage secured by the Deer Park, New York property, which was scheduled to mature August 30, 2018. |
(5) | Excludes the special dividend of $0.21 per share paid on January 15, 2016 to holders of record on December 31, 2015. |
23
Supplemental Operating and Financial Data for the
Quarter Ended 6/30/2016
Reconciliation of Net Income to Portfolio NOI and Same Center NOI for the consolidated portfolio (in thousands):
Three months ended | Six months ended | |||||||||||||||
June 30, | June 30, | |||||||||||||||
2016 | 2015 | 2016 | 2015 | |||||||||||||
Net income | $ | 77,302 | $ | 25,359 | $ | 105,919 | $ | 61,745 | ||||||||
Adjusted to exclude: | ||||||||||||||||
Equity in earnings of unconsolidated joint ventures | $ | (3,466 | ) | $ | (2,046 | ) | $ | (6,965 | ) | $ | (4,589 | ) | ||||
Interest expense | 13,800 | 13,088 | 28,684 | 26,177 | ||||||||||||
Gain on sale of assets and interests in unconsolidated entities | — | — | (4,887 | ) | (13,726 | ) | ||||||||||
Gain on previously held interest in acquired joint venture | (49,258 | ) | — | (49,258 | ) | — | ||||||||||
Other nonoperating income (expense) | (38 | ) | 493 | (354 | ) | 187 | ||||||||||
Depreciation and amortization | 26,306 | 24,272 | 52,873 | 48,261 | ||||||||||||
Other non-property income and losses | (379 | ) | (590 | ) | (560 | ) | (1,020 | ) | ||||||||
Demolition Costs | 182 | — | 182 | — | ||||||||||||
Corporate general and administrative expenses | 11,448 | 11,357 | 22,913 | 22,622 | ||||||||||||
Non-cash adjustments (1) | (1,049 | ) | (1,142 | ) | (1,971 | ) | (1,471 | ) | ||||||||
Termination rents | (1,487 | ) | (1,698 | ) | (2,042 | ) | (2,836 | ) | ||||||||
Portfolio NOI | 73,361 | 69,093 | 144,534 | 135,350 | ||||||||||||
Non-same center NOI (2) | (5,721 | ) | (3,909 | ) | (11,261 | ) | (7,328 | ) | ||||||||
Same Center NOI | $ | 67,640 | $ | 65,184 | $ | 133,273 | $ | 128,022 | ||||||||
(1) | Non-cash items include straight-line rent, above and below market rent amortization and gains or losses on outparcel sales. |
(2) | Excluded from Same Center NOI: Foxwoods outlet center, which opened in May of 2015; Grand Rapids outlet center, which opened in July of 2015; Southaven outlet center, which opened in November 2015; Kittery I & II, Tuscola and West Branch outlet centers, which were sold in September 2015; Barstow outlet center, which was sold in October 2015; Fort Myers outlet center, which was sold in January 2016; and Glendale outlet center (Westgate), which was acquired in June 2016. |
24
Supplemental Operating and Financial Data for the
Quarter Ended 6/30/2016
Non-GAAP Pro Rata Balance Sheet as of June 30, 2016 (dollars in thousands)
Non-GAAP Pro Rata Adjustments | |||||||||||||||
GAAP Consolidated | Pro Rata Portion Noncontrolling Interests | Pro Rata Portion Unconsolidated Joint Ventures | Non-GAAP Pro Rata Balance Sheet | ||||||||||||
Assets | |||||||||||||||
Rental property | |||||||||||||||
Land | $ | 254,809 | $ | — | $ | 54,147 | $ | 308,956 | |||||||
Buildings, improvements and fixtures | 2,377,765 | (160 | ) | 340,128 | 2,717,733 | ||||||||||
Construction in progress | 61,038 | — | 4,221 | 65,259 | |||||||||||
2,693,612 | (160 | ) | 398,496 | 3,091,948 | |||||||||||
Accumulated depreciation | (769,777 | ) | — | (33,644 | ) | (803,421 | ) | ||||||||
Total rental property, net | 1,923,835 | (160 | ) | 364,852 | 2,288,527 | ||||||||||
Cash and cash equivalents | 27,107 | — | 12,780 | 39,887 | |||||||||||
Investments in unconsolidated joint ventures | 210,486 | — | (210,486 | ) | — | ||||||||||
Deferred lease costs and other intangibles, net | 133,578 | — | 10,005 | 143,583 | |||||||||||
Prepaids and other assets | 84,346 | — | 6,546 | 90,892 | |||||||||||
Total assets | $ | 2,379,352 | $ | (160 | ) | $ | 183,697 | $ | 2,562,889 | ||||||
Liabilities and Equity | |||||||||||||||
Liabilities | |||||||||||||||
Debt | |||||||||||||||
Senior, unsecured notes, net | $ | 789,991 | $ | — | $ | — | $ | 789,991 | |||||||
Unsecured term loans, net | 321,980 | — | — | 321,980 | |||||||||||
Mortgages payable, net | 235,215 | — | 173,945 | 409,160 | |||||||||||
Unsecured lines of credit, net | 255,661 | — | — | 255,661 | |||||||||||
Total debt | 1,602,847 | — | 173,945 | 1,776,792 | |||||||||||
Accounts payable and accruals | 62,658 | — | 14,308 | 76,966 | |||||||||||
Other liabilities | 53,433 | — | (4,556 | ) | 48,877 | ||||||||||
Total liabilities | 1,718,938 | — | 183,697 | 1,902,635 | |||||||||||
Commitments and contingencies | — | — | — | — | |||||||||||
Equity | |||||||||||||||
Tanger Factory Outlet Centers, Inc. | |||||||||||||||
Common shares | 960 | — | — | 960 | |||||||||||
Paid in capital | 811,853 | — | — | 811,853 | |||||||||||
Accumulated distributions in excess of net income | (153,465 | ) | — | — | (153,465 | ) | |||||||||
Accumulated other comprehensive loss | (32,090 | ) | — | — | (32,090 | ) | |||||||||
Equity attributable to Tanger Factory Outlet Centers, Inc. | 627,258 | — | — | 627,258 | |||||||||||
Equity attributable to noncontrolling interests | |||||||||||||||
Noncontrolling interests in Operating Partnership | 32,996 | — | — | 32,996 | |||||||||||
Noncontrolling interest in other consolidated partnerships | 160 | (160 | ) | — | — | ||||||||||
Total equity | 660,414 | (160 | ) | — | 660,254 | ||||||||||
Total liabilities and equity | $ | 2,379,352 | $ | (160 | ) | $ | 183,697 | $ | 2,562,889 | ||||||
25
Supplemental Operating and Financial Data for the
Quarter Ended 6/30/2016
Non-GAAP Pro Rata Statement of Operations year to date June 30, 2016 (dollars in thousands)
Non-GAAP Pro Rata Adjustments | |||||||||||||||
GAAP Consolidated | Pro Rata Portion Noncontrolling Interests | Pro Rata Portion Unconsolidated Joint Ventures | Non-GAAP Pro Rata Statement of Operations | ||||||||||||
Revenues | |||||||||||||||
Base rentals | $ | 147,626 | $ | (6 | ) | $ | 20,682 | $ | 168,302 | ||||||
Percentage rentals | 4,476 | — | 1,008 | 5,484 | |||||||||||
Expense reimbursements | 63,996 | (3 | ) | 10,933 | 74,926 | ||||||||||
Management, leasing and other services | 2,453 | — | — | 2,453 | |||||||||||
Other income | 3,587 | — | 844 | 4,431 | |||||||||||
Total revenues | 222,138 | (9 | ) | 33,467 | 255,596 | ||||||||||
Expense | |||||||||||||||
Property operating | 72,886 | (2 | ) | 11,923 | 84,807 | ||||||||||
General and administrative | 23,240 | — | 161 | 23,401 | |||||||||||
Depreciation and amortization | 52,873 | (3 | ) | 11,102 | 63,972 | ||||||||||
Total expenses | 148,999 | (5 | ) | 23,186 | 172,180 | ||||||||||
Operating income | 73,139 | (4 | ) | 10,281 | 83,416 | ||||||||||
Other income/(expense) | |||||||||||||||
Interest expense | (28,684 | ) | 2 | (3,363 | ) | (32,045 | ) | ||||||||
Gain on sale of assets and interests in unconsolidated entities | 4,887 | — | — | 4,887 | |||||||||||
Gain on previously held interest in acquired joint venture | 49,258 | — | — | 49,258 | |||||||||||
Other nonoperating income (expense) | 354 | — | 2 | 356 | |||||||||||
Income before equity in earnings of unconsolidated joint ventures | 98,954 | (2 | ) | 6,920 | 105,872 | ||||||||||
Equity in earnings of unconsolidated joint ventures | 6,965 | (9 | ) | (6,956 | ) | — | |||||||||
Net income | 105,919 | (11 | ) | (36 | ) | 105,872 | |||||||||
Noncontrolling interests in Operating Partnership | (5,341 | ) | — | — | (5,341 | ) | |||||||||
Noncontrolling interests in other consolidated partnerships | (11 | ) | 11 | — | — | ||||||||||
Net income attributable to Tanger Factory Outlet Centers, Inc. | 100,567 | — | (36 | ) | 100,531 | ||||||||||
Allocation to participating securities | (1,019 | ) | — | — | (1,019 | ) | |||||||||
Net income available to common shareholders | $ | 99,548 | $ | — | $ | (36 | ) | $ | 99,512 | ||||||
26
Supplemental Operating and Financial Data for the
Quarter Ended 6/30/2016
Investor Information
Tanger Outlet Centers welcomes any questions or comments from shareholders, analysts, investment managers, media and prospective investors. Please address all inquiries to our Investor Relations Department.
Tanger Factory Outlet Centers, Inc. | |
Investor Relations | |
Phone: | (336) 834-6892 |
Fax: | (336) 297-0931 |
e-mail: | tangerir@tangeroutlet.com |
Mail: | Tanger Factory Outlet Centers, Inc. |
3200 Northline Avenue | |
Suite 360 | |
Greensboro, NC 27408 | |
27
Supplemental Operating and Financial Data for the
Quarter Ended 6/30/2016