Exhibit 99.3
|
Table of Contents
|
||||
|
First Quarter 2013
|
||||
|
Section I - Financial Information
|
Section II - Core Portfolio Information
|
|||
|
Company Information
|
3
|
Core Properties
|
21
|
|
|
Total Market Capitalization
|
4
|
Core Portfolio by State
|
23
|
|
|
Operating Statements
|
Core Top Tenants
|
24
|
||
|
Pro-rata Consolidation
|
5
|
Core Lease Expirations
|
25
|
|
|
Opportunity Funds
|
6
|
Core New and Renewal Rent Spreads
|
26
|
|
|
Funds from Operations ("FFO"), Adjusted FFO ("AFFO")
|
Core Capital Expenditures
|
27
|
||
|
and Funds Available for Distribution ("FAD")
|
7
|
Portfolio Demographics
|
28
|
|
|
EBITDA
|
8
|
|||
|
Same Property Net Operating Income
|
9
|
|||
|
Fee Income
|
10
|
Section III - Opportunity Fund Information
|
||
|
Balance Sheet - Pro-rata Consolidation
|
11
|
|||
|
Notes Receivable
|
12
|
Opportunity Fund Overview
|
31
|
|
|
Other Information
|
Opportunity Fund Properties
|
32
|
||
|
2013 Guidance
|
13
|
Opportunity Fund Lease Expirations
|
33
|
|
|
Net Asset Valuation Information
|
14
|
Redevelopment Projects - Construction and Design
|
34
|
|
|
Selected Financial Ratios
|
15
|
RCP Venture Investments
|
35
|
|
|
Debt Analysis
|
||||
|
Summary
|
16
|
|||
|
Detail
|
17
|
|||
|
Maturities
|
20
|
Important Notes
|
36
|
Visit www.acadiarealty.com for additional investor and portfolio information
- 2 -
|
Company Information
|
|
Acadia Realty Trust, a fully-integrated equity real estate investment trust, is focused on the acquisition, ownership, management and redevelopment of high-quality retail properties and urban/infill mixed-use properties with a strong retail component located primarily in high-barrier-to-entry, densely-populated metropolitan areas along the East Coast and in Chicago. Acadia owns, or has an ownership interest in, these properties through its core portfolio and its opportunistic/value-add investment funds. Additional information may be found on the Company’s website at www.acadiarealty.com.
|
|
Contact Information
|
|||||
|
Corporate Headquarters
|
Investor Relations
|
New York Stock Exchange
|
|||
|
1311 Mamaroneck Avenue
|
Jon Grisham
|
Symbol AKR
|
|||
|
Suite 260
|
Senior Vice President,
|
||||
|
White Plains, NY 10605
|
Chief Financial Officer
|
||||
|
(914) 288-8142
|
|||||
|
jgrisham@acadiarealty.com
|
|||||
|
Analyst Coverage
|
|||||
|
Bank of America / Merrill Lynch
|
Cowen and Company
|
KeyBanc Capital Markets, Inc.
|
|||
|
Craig Schmidt - (646) 855-3640
|
Michael Gorman - (646) 562-1381
|
Todd Thomas - (917) 368-2286
|
|||
|
craig.schmidt@baml.com
|
michael.gorman@cowen.com
|
tthomas@keybanccm.com
|
|||
|
Bank of Montreal
|
Green Street Advisors
|
RBC Capital Markets
|
|||
|
Paul Adornato, CFA - (212) 885-4170
|
Cedrik LaChance - (949) 640-8780
|
Rich Moore, CFA - (440) 715-2646
|
|||
|
paul.adornato@bmo.com
|
clachance@greenst.com
|
rich.moore@rbccm.com
|
|||
|
Citigroup - Global Markets
|
J.P. Morgan Securities, Inc.
|
UBS
|
|||
|
Quentin Velleley, CFA - (212) 816-6981
|
Michael W. Mueller, CFA - (212) 622-6689
|
Christy McElroy - (203) 719-7831
|
|||
|
quentin.velleley@citi.com
|
michael.w.mueller@jpmorgan.com
|
christy.mcelroy@ubs.com
|
|||
- 3 -
|
Total Market Capitalization
|
||||||||||||||
|
(including pro-rata share of Opportunity Fund debt, dollars in thousands)
|
||||||||||||||
|
Capitalization
|
||||||||||||||
|
Percent of
|
Total Market Capitalization
|
based on
|
||||||||||||
|
Total Equity
|
$ | % |
Net Debt1
|
Total Market Capitalization | ||||||||||
|
Equity Capitalization
|
||||||||||||||
|
Total Common Shares Outstanding
|
98.8% | 54,514 | ||||||||||||
|
Common Operating Partnership ("OP") Units
|
1.2% | 664 | ||||||||||||
|
Combined Common Shares and OP Units
|
55,178 | 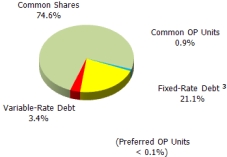 |
||||||||||||
|
Share Price at March 31, 2013
|
$ | 27.77 | ||||||||||||
|
Equity Capitalization - Common Shares and OP Units
|
$ | 1,532,293 | ||||||||||||
|
Preferred OP Units
|
696 | 2 | ||||||||||||
|
Total Equity Capitalization
|
1,532,989 | 76% | 78% | |||||||||||
|
Debt Capitalization
|
||||||||||||||
|
Consolidated debt
|
934,980 | |||||||||||||
|
Adjustment to reflect pro-rata share of debt
|
(438,039 | ) | ||||||||||||
|
Total Debt Capitalization
|
496,941 | 24% | 22% | |||||||||||
|
Total Market Capitalization
|
$ | 2,029,930 | 100% | 100% | ||||||||||
|
Weighted Average Outstanding Common Shares and OP Units
|
||||||||||||||
|
(in thousands)
|
||||||||||||||
|
March 31, 2013
|
March 31, 2012
|
|||||||||||||
| Quarter |
Quarter
|
|||||||||||||
|
Weighted average Common Shares - Basic EPS
|
53,414 | 42,736 | ||||||||||||
|
Dilutive potential Common Shares
|
437 | 410 | ||||||||||||
|
Weighted average Common Shares - Diluted EPS
|
53,851 | 43,146 | ||||||||||||
|
OP Units
|
655 | 621 | ||||||||||||
|
Dilutive potential OP Units
|
25 | 25 | ||||||||||||
|
Weighted average Common Shares and OP Units - Diluted FFO
|
54,531 | 43,792 | ||||||||||||
|
Notes:
|
||||||||||
|
1 Reflects debt net of Core Portfolio and pro-rata share of Opportunity Funds cash balance ("Net Debt") totaling $52,700.
|
||||||||||
|
2 Represents 188 Series A Preferred OP Units convertible into 25,067 Common OP units multiplied by the Common Share price at quarter end.
|
||||||||||
|
3 Fixed-rate debt includes notional principal fixed through interest rate swap transactions.
|
||||||||||
- 4 -
|
Income Statements - Pro-rata Consolidation1
|
||||||||||||||||||||||||
|
(in thousands)
|
||||||||||||||||||||||||
| Three months ended March 31, 2013 | ||||||||||||||||||||||||
| Core Retail | Opportunity Funds |
Total
|
||||||||||||||||||||||
|
Total
|
||||||||||||||||||||||||
|
Wholly
|
Joint
|
Continuing
|
|
Continuing
|
Discontinued | |||||||||||||||||||
|
Owned
|
Ventures 2
|
Operations
|
Operations
|
Operations
|
||||||||||||||||||||
|
CORE PORTFOLIO AND OPPORTUNITY FUND INCOME
|
||||||||||||||||||||||||
|
PROPERTY REVENUES
|
||||||||||||||||||||||||
|
Minimum rents
|
$ | 16,745 | $ | 808 | $ | 17,553 | $ | 2,975 | $ | 204 | $ | 20,732 | ||||||||||||
|
Percentage rents
|
100 | - | 100 | 32 | - | 132 | ||||||||||||||||||
|
Expense reimbursements - CAM
|
1,892 | 94 | 1,986 | 422 | 7 | 2,415 | ||||||||||||||||||
|
Expense reimbursements - Taxes
|
2,511 | 210 | 2,721 | 398 | 7 | 3,126 | ||||||||||||||||||
|
Other property income
|
237 | 3 | 240 | 111 | 12 | 363 | ||||||||||||||||||
|
Total Property Revenues
|
21,485 | 1,115 | 22,600 | 3,938 | 230 | 26,768 | ||||||||||||||||||
|
PROPERTY EXPENSES
|
||||||||||||||||||||||||
|
Property operating - CAM
|
2,031 | 100 | 2,131 | 410 | 8 | 2,549 | ||||||||||||||||||
|
Other property operating (Non-CAM)
|
572 | 60 | 632 | 324 | 133 | 1,089 | ||||||||||||||||||
|
Real estate taxes
|
3,017 | 257 | 3,274 | 495 | 14 | 3,783 | ||||||||||||||||||
|
Total Property Expenses
|
5,620 | 417 | 6,037 | 1,229 | 155 | 7,421 | ||||||||||||||||||
|
NET OPERATING INCOME - PROPERTIES
|
15,865 | 698 | 16,563 | 2,709 | 75 | 19,347 | ||||||||||||||||||
|
OTHER INCOME (EXPENSE)
|
||||||||||||||||||||||||
|
Mezzanine interest income
|
2,367 | - | 2,367 | 106 | - | 2,473 | ||||||||||||||||||
|
Other interest income
|
23 | - | 23 | 4 | - | 27 | ||||||||||||||||||
|
Straight-line rent income
|
371 | (6 | ) | 365 | 302 | 3 | 670 | |||||||||||||||||
|
Straight-line ground rent
|
- | - | - | (21 | ) | - | (21 | ) | ||||||||||||||||
|
Above/below market rent
|
470 | - | 470 | 134 | - | 604 | ||||||||||||||||||
|
Interest expense
|
(4,332 | ) | (512 | ) | (4,844 | ) | (915 | ) | (17 | ) | (5,776 | ) | ||||||||||||
|
Amortization of finance costs
|
(186 | ) | - | (186 | ) | (113 | ) | - | (299 | ) | ||||||||||||||
|
Above/below market interest expense
|
442 | - | 442 | 34 | - | 476 | ||||||||||||||||||
|
Asset and property management expense
|
(25 | ) | (11 | ) | (36 | ) | (37 | ) | (12 | ) | (85 | ) | ||||||||||||
|
Other income
|
462 | - | 462 | 498 | 26 | 986 | ||||||||||||||||||
|
Acquisition costs
|
(703 | ) | - | (703 | ) | (187 | ) | - | (890 | ) | ||||||||||||||
|
CORE PORTFOLIO AND OPPORTUNITY FUND INCOME
|
14,754 | 169 | 14,923 | 2,514 | 75 | 17,512 | ||||||||||||||||||
|
FEE INCOME
|
||||||||||||||||||||||||
|
Asset and property management fees
|
4,303 | - | 4,303 | 58 | - | 4,361 | ||||||||||||||||||
|
Transactional fees3
|
1,252 | 1,252 | - | - | 1,252 | |||||||||||||||||||
|
Income tax benefit (provision)
|
91 | (1 | ) | 90 | 8 | (1 | ) | 97 | ||||||||||||||||
|
Total Fee Income
|
5,646 | (1 | ) | 5,645 | 66 | (1 | ) | 5,710 | ||||||||||||||||
|
PROMOTE, RCP AND OTHER INCOME
|
||||||||||||||||||||||||
|
Equity in earnings (losses) from RCP investments
|
- | - | - | (27 | ) | - | (27 | ) | ||||||||||||||||
|
Total Promote, RCP and Other Income
|
- | - | - | (27 | ) | - | (27 | ) | ||||||||||||||||
|
GENERAL AND ADMINISTRATIVE
|
(6,222 | ) | - | (6,222 | ) | 9 | - | (6,213 | ) | |||||||||||||||
|
Depreciation and amortization
|
(5,910 | ) | (194 | ) | (6,104 | ) | (1,126 | ) | - | (7,230 | ) | |||||||||||||
|
Income before noncontrolling interests
|
8,268 | (26 | ) | 8,242 | 1,436 | 74 | 9,752 | |||||||||||||||||
|
Noncontrolling interest - OP
|
(107 | ) | (2 | ) | (109 | ) | (20 | ) | - | (129 | ) | |||||||||||||
|
NET INCOME
|
$ | 8,161 | $ | (28 | ) | $ | 8,133 | $ | 1,416 | $ | 74 | $ | 9,623 | |||||||||||
|
Notes:
|
||||||||||||||||||||||||
|
1Quarterly results are unaudited, although they reflect all adjustments, which in the opinion of management, are necessary for a fair presentation of operating results for the interim periods.
|
||||||||||||||||||||||||
|
The Company's investments in consolidated and unconsolidated joint ventures are reflected separately for revenues and expenses by calculating its pro-rata share for each of the above line items.
|
||||||||||||||||||||||||
|
In total, net income agrees with net income as reported in the Company's Form 10Q's and 10K for the corresponding periods.
|
||||||||||||||||||||||||
|
2Represents the Company's pro-rata share unconsolidated investments which are detailed on pages 21 and 22.
|
||||||||||||||||||||||||
|
3Consists of development, construction, leasing and legal fees.
|
||||||||||||||||||||||||
- 5 -
|
Income Statements - Opportunity Funds1
|
|||||||||||||||||||||||||||||||||||||||||||
|
(in thousands)
|
|||||||||||||||||||||||||||||||||||||||||||
|
Three months ended March 31, 2013
|
||||||||||||||||||||||||||||||||||||||||||||||||||||||||||||||||||||
|
Continuing
|
Continuing
|
Discontinued
|
Continuing
|
Discontinued
|
||||||||||||||||||||||||||||||||||||||||||||||||||||||||||||||||
|
Operations
|
Operations
|
Operations
|
Operations
|
Operations
|
||||||||||||||||||||||||||||||||||||||||||||||||||||||||||||||||
|
Fund I
|
AKR Pro-
|
AKR Pro-
|
Fund II
|
Fund II
|
Fund II
|
AKR Pro-
|
AKR Pro-
|
AKR Pro-
|
Fund III
|
AKR Pro-
|
AKR Pro-
|
AKR Pro-
|
Total
|
|||||||||||||||||||||||||||||||||||||||||||||||||||||||
|
Continuing
|
rata share4
|
rata share4
|
Continuing
|
Discontinued
|
Consolidated
|
rata share
|
rata share
|
rata share
|
Continuing
|
rata share
|
rata share
|
rata share
|
AKR Pro-
|
|||||||||||||||||||||||||||||||||||||||||||||||||||||||
|
Operations
|
37.78% |
Mervyns I
|
37.78% |
Operations
|
Operations
|
Operations
|
20.00% | 20.00% |
Mervyns II
|
20.00% |
Operations 3
|
19.90% | 19.90% |
Fund IV 3
|
23.12% |
rata share
|
||||||||||||||||||||||||||||||||||||||||||||||||||||
|
PROPERTY REVENUES
|
||||||||||||||||||||||||||||||||||||||||||||||||||||||||||||||||||||
|
Minimum rents
|
$ | 57 | $ | 22 | $ | - | $ | - | $ | 5,966 | $ | 1,022 | $ | 6,988 | $ | 1,193 | $ | 204 | $ | - | $ | - | $ | 7,080 | $ | 1,409 | $ | - | $ | 1,519 | $ | 351 | $ | 3,179 | ||||||||||||||||||||||||||||||||||
|
Percentage rents
|
- | - | - | - | - | - | - | - | - | - | - | 160 | 32 | - | - | - | 32 | |||||||||||||||||||||||||||||||||||||||||||||||||||
|
Expense reimbursements - CAM
|
3 | 1 | - | - | 630 | 36 | 666 | 126 | 7 | - | - | 1,295 | 258 | - | 161 | 37 | 429 | |||||||||||||||||||||||||||||||||||||||||||||||||||
|
Expense reimbursements - Taxes
|
- | - | - | - | 356 | 36 | 392 | 71 | 7 | - | - | 1,442 | 287 | - | 175 | 40 | 405 | |||||||||||||||||||||||||||||||||||||||||||||||||||
|
Other property income
|
- | - | - | - | 91 | 62 | 153 | 18 | 12 | - | - | 456 | 91 | - | 7 | 2 | 123 | |||||||||||||||||||||||||||||||||||||||||||||||||||
|
Total Property Revenues
|
60 | 23 | - | - | 7,043 | 1,156 | 8,199 | 1,408 | 230 | - | - | 10,433 | 2,077 | - | 1,862 | 430 | 4,168 | |||||||||||||||||||||||||||||||||||||||||||||||||||
|
PROPERTY EXPENSES
|
||||||||||||||||||||||||||||||||||||||||||||||||||||||||||||||||||||
|
Property operating - CAM
|
4 | 2 | - | - | 1,056 | 42 | 1,098 | 211 | 8 | - | - | 942 | 187 | - | 43 | 10 | 418 | |||||||||||||||||||||||||||||||||||||||||||||||||||
|
Other property operating (Non-CAM)
|
43 | 16 | - | - | 719 | 678 | 1,397 | 144 | 133 | - | - | 781 | 155 | - | 37 | 9 | 457 | |||||||||||||||||||||||||||||||||||||||||||||||||||
|
Real estate taxes
|
3 | 1 | - | - | 465 | 70 | 535 | 93 | 14 | - | - | 1,816 | 361 | - | 173 | 40 | 509 | |||||||||||||||||||||||||||||||||||||||||||||||||||
|
Total Property Expenses
|
50 | 19 | - | - | 2,240 | 790 | 3,030 | 448 | 155 | - | - | 3,539 | 703 | - | 253 | 59 | 1,384 | |||||||||||||||||||||||||||||||||||||||||||||||||||
|
NET OPERATING INCOME - PROPERTIES
|
10 | 4 | - | - | 4,803 | 366 | 5,169 | 960 | 75 | - | - | 6,894 | 1,374 | - | 1,609 | 371 | 2,784 | |||||||||||||||||||||||||||||||||||||||||||||||||||
|
OTHER INCOME (EXPENSE)
|
||||||||||||||||||||||||||||||||||||||||||||||||||||||||||||||||||||
|
Mezzanine interest income
|
207 | 78 | - | - | - | - | - | - | - | - | - | 143 | 28 | - | - | - | 106 | |||||||||||||||||||||||||||||||||||||||||||||||||||
|
Other interest income
|
- | - | - | - | 6 | - | 6 | 1 | - | - | - | 17 | 3 | - | 1 | - | 4 | |||||||||||||||||||||||||||||||||||||||||||||||||||
|
Straight-line rent income
|
- | - | - | - | 797 | 13 | 810 | 159 | 3 | - | - | 537 | 107 | - | 148 | 36 | 305 | |||||||||||||||||||||||||||||||||||||||||||||||||||
|
Straight-line ground rent
|
- | - | - | - | (104 | ) | 2 | (102 | ) | (21 | ) | - | - | - | - | - | - | - | - | (21 | ) | |||||||||||||||||||||||||||||||||||||||||||||||
|
Above/below market rent
|
- | - | - | - | - | - | - | - | - | - | - | 675 | 134 | - | - | - | 134 | |||||||||||||||||||||||||||||||||||||||||||||||||||
|
Interest expense
|
(1 | ) | - | - | - | (2,136 | ) | (85 | ) | (2,221 | ) | (427 | ) | (17 | ) | - | - | (1,897 | ) | (378 | ) | - | (475 | ) | (110 | ) | (932 | ) | ||||||||||||||||||||||||||||||||||||||||
|
Amortization of finance costs
|
- | - | - | - | (175 | ) | - | (175 | ) | (35 | ) | - | - | - | (225 | ) | (45 | ) | - | (142 | ) | (33 | ) | (113 | ) | |||||||||||||||||||||||||||||||||||||||||||
|
Above/below market interest
|
- | - | - | - | - | - | - | - | - | - | - | 170 | 34 | - | - | - | 34 | |||||||||||||||||||||||||||||||||||||||||||||||||||
|
Asset and property management expense2
|
2 | 1 | - | - | 2 | (61 | ) | (59 | ) | - | (12 | ) | - | - | (114 | ) | (23 | ) | - | (63 | ) | (15 | ) | (49 | ) | |||||||||||||||||||||||||||||||||||||||||||
|
Promote expense2
|
(17 | ) | - | - | - | - | - | - | - | - | - | - | - | - | - | - | - | - | ||||||||||||||||||||||||||||||||||||||||||||||||||
|
Other income
|
- | - | - | - | 1 | 131 | 132 | - | 26 | - | - | 2,501 | 498 | - | - | - | 524 | |||||||||||||||||||||||||||||||||||||||||||||||||||
|
Acquisition costs
|
- | - | - | - | - | - | - | - | - | - | - | (800 | ) | (159 | ) | - | (123 | ) | (28 | ) | (187 | ) | ||||||||||||||||||||||||||||||||||||||||||||||
|
OPPORTUNITY FUND INCOME
|
201 | 83 | - | - | 3,194 | 366 | 3,560 | 637 | 75 | - | - | 7,901 | 1,573 | - | 955 | 221 | 2,589 | |||||||||||||||||||||||||||||||||||||||||||||||||||
|
FEE INCOME
|
||||||||||||||||||||||||||||||||||||||||||||||||||||||||||||||||||||
|
Asset and property management fees
|
- | - | - | - | - | - | - | - | - | - | - | 291 | 58 | - | - | - | 58 | |||||||||||||||||||||||||||||||||||||||||||||||||||
|
Income tax benefit (provision)
|
(4 | ) | (2 | ) | - | - | (10 | ) | (5 | ) | (15 | ) | (2 | ) | (1 | ) | - | - | 60 | 12 | - | - | - | 7 | ||||||||||||||||||||||||||||||||||||||||||||
|
Total Fee Income
|
(4 | ) | (2 | ) | - | - | (10 | ) | (5 | ) | (15 | ) | (2 | ) | (1 | ) | - | - | 351 | 70 | - | - | - | 65 | ||||||||||||||||||||||||||||||||||||||||||||
|
PROMOTE, RCP AND OTHER INCOME
|
||||||||||||||||||||||||||||||||||||||||||||||||||||||||||||||||||||
|
Equity in earnings (losses) from RCP investments
|
- | - | (44 | ) | (17 | ) | - | - | - | - | - | (52 | ) | (10 | ) | - | - | - | - | - | (27 | ) | ||||||||||||||||||||||||||||||||||||||||||||||
|
Promote income - Fund capital transactions
|
- | - | 9 | - | - | - | - | - | - | - | - | - | - | - | - | - | - | |||||||||||||||||||||||||||||||||||||||||||||||||||
|
Total Promote, RCP and Other Income
|
- | - | (35 | ) | (17 | ) | - | - | - | - | - | (53 | ) | (10 | ) | - | - | - | - | - | (27 | ) | ||||||||||||||||||||||||||||||||||||||||||||||
|
GENERAL AND ADMINISTRATIVE
|
(17 | ) | (6 | ) | - | - | 60 | - | 60 | 12 | - | (6 | ) | (1 | ) | (16 | ) | (3 | ) | - | 32 | 7 | 9 | |||||||||||||||||||||||||||||||||||||||||||||
|
Depreciation and amortization
|
(1 | ) | - | - | - | (2,042 | ) | - | (2,042 | ) | (408 | ) | - | - | - | (2,813 | ) | (560 | ) | - | (684 | ) | (158 | ) | (1,126 | ) | ||||||||||||||||||||||||||||||||||||||||||
|
Income before noncontrolling interest
|
179 | 75 | (35 | ) | (17 | ) | 1,202 | 361 | 1,563 | 239 | 74 | (59 | ) | (11 | ) | 5,423 | 1,080 | - | 303 | 70 | 1,510 | |||||||||||||||||||||||||||||||||||||||||||||||
|
Noncontrolling interest - OP
|
(3 | ) | (1 | ) | - | - | (20 | ) | - | (20 | ) | (4 | ) | - | - | - | (70 | ) | (14 | ) | - | (4 | ) | (1 | ) | (20 | ) | |||||||||||||||||||||||||||||||||||||||||
|
NET INCOME
|
$ | 176 | $ | 74 | $ | (35 | ) | $ | (17 | ) | $ | 1,182 | $ | 361 | $ | 1,543 | $ | 235 | $ | 74 | $ | (59 | ) | $ | (11 | ) | $ | 5,353 | $ | 1,066 | $ | - | $ | 299 | $ | 69 | $ | 1,490 | ||||||||||||||||||||||||||||||
|
Notes:
|
|||||||||||||||||||||||||||||||||
|
1 Quarterly results are unaudited, although they reflect all adjustments, which in the opinion of management, are necessary for a fair presentation of operating results for the interim periods. The Company's investments in consolidated and unconsolidated joint ventures are reflected separately for revenues and expenses by calculating it's pro-rata share for each of the above line items. In total, net income agrees with net income as reported in the Company's Form 10Q's and 10K for the corresponding periods. The Company currently invests in Funds I, II, III & IV and Mervyn's which are consolidated with the Company's financial statements.
|
|||||||||||||||||||||||||||||||||
|
2 Funds I, II, III & IV and the Mervyn's entities pay various fees to and promotes the Company. As it is the recipient of such fees, the Company does not recognize its pro-rata share of these expenses.
|
|||||||||||||||||||||||||||||||||
|
3 Represents the Company's pro-rata share unconsolidated investments which are detailed on page 32.
|
|||||||||||||||||||||||||||||||||
|
4 Represents a 20% promote earned by Acadia in addition to our 22.22% pro-rata share of the remaining 80% after promote (20%+22.22%*80% = 37.78%)
|
|||||||||||||||||||||||||||||||||
- 6 -
|
Funds from Operations ("FFO") 1
|
||||||||
|
(in thousands)
|
||||||||
| 2013 | 2012 | |||||||
|
Current
|
Historic
|
|||||||
|
Quarter
|
Quarter
|
|||||||
|
3 months ended
|
3 months ended
|
|||||||
|
Funds from operations ("FFO"):
|
March 31, 2013
|
March 31, 2012
|
||||||
|
Net Income
|
$ | 9,623 | $ | 4,010 | ||||
|
Add back:
|
||||||||
|
Depreciation of real estate and amortization of leasing costs:
|
||||||||
|
(net of noncontrolling interest share)
|
||||||||
|
Consolidated affiliates
|
6,697 | 4,828 | ||||||
|
Unconsolidated affiliates
|
397 | 392 | ||||||
|
Income attributable to noncontrolling interests'
|
||||||||
|
share in Operating Partnership
|
124 | 63 | ||||||
|
Distributions on Preferred OP Units 2
|
5 | 5 | ||||||
|
FFO
|
$ | 16,846 | $ | 9,298 | ||||
|
Adjusted Funds from operations ("AFFO"):
|
||||||||
|
Diluted FFO
|
$ | 16,846 | $ | 9,298 | ||||
|
Straight line rent, net
|
(670 | ) | (628 | ) | ||||
|
Straight-line ground rent
|
21 | 22 | ||||||
|
Above/below market rent
|
(604 | ) | (162 | ) | ||||
|
Amortization of finance costs
|
299 | 207 | ||||||
|
Above/below market interest
|
(476 | ) | (21 | ) | ||||
|
Non real estate depreciation
|
102 | 118 | ||||||
|
Amortization of cost of management contracts
|
- | 20 | ||||||
|
Leasing commissions
|
(647 | ) | (306 | ) | ||||
|
Tenant improvements
|
(1,192 | ) | (1,583 | ) | ||||
|
Capital expenditures
|
(46 | ) | (64 | ) | ||||
|
AFFO
|
$ | 13,633 | $ | 6,901 | ||||
|
Funds Available for Distribution ("FAD")
|
||||||||
|
AFFO
|
$ | 13,633 | $ | 6,901 | ||||
|
Scheduled principal repayments
|
(814 | ) | (906 | ) | ||||
|
FAD
|
$ | 12,819 | $ | 5,995 | ||||
|
Total weighted average shares and OP Units:
|
||||||||
|
Basic
|
54,094 | 43,382 | ||||||
|
Diluted
|
54,531 | 43,792 | ||||||
|
FFO per share:
|
||||||||
|
FFO per share - Basic
|
$ | 0.31 | $ | 0.21 | ||||
|
FFO per share - Diluted
|
$ | 0.31 | $ | 0.21 | ||||
|
AFFO per share - Basic
|
$ | 0.25 | $ | 0.16 | ||||
|
AFFO per share - Diluted
|
$ | 0.25 | $ | 0.16 | ||||
|
FAD per share - Basic
|
$ | 0.24 | $ | 0.14 | ||||
|
FAD per share - Diluted
|
$ | 0.24 | $ | 0.14 | ||||
|
Notes:
|
||||
|
1 Quarterly results are unaudited, although they reflect all adjustments, which in the opinion of management are necessary for a fair presentation of operating results for the interim periods.
|
||||
|
2 Quarterly Preferred OP Unit distributions are added back for the purposes of calculating diluted FFO. Refer to "Market Capitalization" for weighted-average basic and diluted shares.
|
||||
- 7 -
|
EBITDA
|
||||||||||||||||||||||||
|
(in thousands)
|
||||||||||||||||||||||||
|
Current Quarter
|
||||||||||||||||||||||||
|
Three months ended March 31, 2013
|
||||||||||||||||||||||||
|
Core Retail
|
Opportunity Funds
|
|||||||||||||||||||||||
|
Total
|
||||||||||||||||||||||||
|
Wholly
|
Joint
|
Continuing
|
Continuing
|
Discontinued
|
||||||||||||||||||||
|
Owned
|
Ventures
|
Operations
|
Operations
|
Operations
|
TOTAL
|
|||||||||||||||||||
|
NET INCOME
|
$ | 8,161 | $ | (28 | ) | $ | 8,133 | $ | 1,416 | $ | 74 | $ | 9,623 | |||||||||||
|
Add back:
|
||||||||||||||||||||||||
|
Depreciation and amortization
|
5,910 | 194 | 6,104 | 1,126 | - | 7,230 | ||||||||||||||||||
|
Interest expense
|
4,332 | 512 | 4,844 | 915 | 17 | 5,776 | ||||||||||||||||||
|
Amortization of finance costs
|
186 | - | 186 | 113 | - | 299 | ||||||||||||||||||
|
Above/below market interest
|
(442 | ) | - | (442 | ) | (34 | ) | - | (476 | ) | ||||||||||||||
|
Provision for income taxes
|
(91 | ) | 1 | (90 | ) | (8 | ) | 1 | (97 | ) | ||||||||||||||
|
Noncontrolling interest - OP
|
107 | 2 | 109 | 20 | - | 129 | ||||||||||||||||||
|
EBITDA
|
$ | 18,163 | $ | 681 | $ | 18,844 | $ | 3,548 | $ | 92 | $ | 22,484 | ||||||||||||
- 8 -
|
Core Portfolio
|
||||||||||
|
Net Operating Income (NOI) - Same Property Performance 1
|
||||||||||
|
(in thousands)
|
||||||||||
|
Quarter
|
||||||||||
|
Growth in Same
|
||||||||||
|
Three months ended
|
Property NOI -
|
|||||||||
|
Continuing Operations
|
||||||||||
|
March 31, 2013
|
March 31, 2012
|
Favorable (unfavorable)
|
||||||||
|
Reconciliation of total NOI to same property NOI:
|
||||||||||
|
NOI - Core properties - Continuing Operations
|
$ | 16,563 | $ | 12,013 | ||||||
|
NOI - Properties acquired or in redevelopment
|
(4,472 | ) | (1,109 | ) | ||||||
|
Total
|
$ | 12,091 | $ | 10,904 | 10.9% | |||||
|
Same property NOI by revenues/expenses:
|
||||||||||
|
|
||||||||||
|
Revenues
|
$ | 16,655 | $ | 14,980 | 11.2% | |||||
|
Expenses
|
4,564 | 4,076 | -12.0% | |||||||
|
Total Core Portfolio
|
$ | 12,091 | $ | 10,904 | 10.9% | |||||
|
Notes:
|
||||||
|
1 The above amounts include the pro-rata activity related to the Company's Core consolidated and unconsolidated investments.
|
||||||
- 9 -
|
Fee income by Opportunity Fund
|
||||||||||||||||||||||||
|
(in thousands)
|
||||||||||||||||||||||||
|
Fund I
|
Fund II
|
Fund III
|
Fund IV
|
Other
|
Total
|
|||||||||||||||||||
|
Three months ended March 31, 2013
|
||||||||||||||||||||||||
|
Asset and property management fees
|
$ | 67 | $ | 1,090 | $ | 1,417 | $ | 1,587 | $ | 142 | $ | 4,303 | ||||||||||||
|
Transactional fees
|
3 | 638 | 528 | 18 | 65 | 1,252 | ||||||||||||||||||
|
Total management fees
|
$ | 70 | $ | 1,728 | $ | 1,945 | $ | 1,605 | $ | 207 | $ | 5,555 | ||||||||||||
- 10 -
|
Pro-Rata Consolidated Balance Sheet
|
||||||||||||||||||||||||
|
(in thousands)
|
||||||||||||||||||||||||
| Consolidated |
Noncontrolling
|
Company's
|
Pro-Rata
|
|||||||||||||||||||||
|
Balance
|
Interest in
|
Interest in
|
Consolidated | |||||||||||||||||||||
|
Sheet
|
Consolidated
|
Unconsolidated
|
Balance
|
|||||||||||||||||||||
| As Reported 1 |
Subsidiaries
|
Subsidiaries
|
Sheet 2
|
Notes
|
||||||||||||||||||||
|
ASSETS
|
||||||||||||||||||||||||
|
Real estate
|
1 The interim consolidated balance sheet is unaudited, although it | |||||||||||||||||||||||
|
Land
|
$ | 344,178 | $ | (119,893 | ) | $ | 18,518 | $ | 242,803 | reflects all adjustments, which in the opinion of management, | ||||||||||||||
|
Buildings and improvements
|
1,157,960 | (423,164 | ) | 75,496 | 810,292 | are necessary for the fair presentation of the consolidated | ||||||||||||||||||
|
Construction in progress
|
2,747 | (1,324 | ) | 1,363 | 2,786 |
balance sheet for the interim period.
|
||||||||||||||||||
| 1,504,885 | (544,381 | ) | 95,377 | 1,055,881 | ||||||||||||||||||||
|
Less: accumulated depreciation
|
(223,834 | ) | 63,256 | (7,540 | ) | (168,118 | ) | 2 The Company currently invests in Funds I, II, III & IV and Mervyns I & II | ||||||||||||||||
|
Net real estate
|
1,281,051 | (481,125 | ) | 87,837 | 887,763 | which are consolidated with the Company's financial statements. | ||||||||||||||||||
| To provide investors with supplemental information, the Company's | ||||||||||||||||||||||||
|
Net real estate under development
|
262,291 | 3 | (213,407 | ) | 99 | 48,983 | investments in these joint ventures are reflected above on a pro-rata | |||||||||||||||||
| basis by calculating its ownership percentage for each of the asset | ||||||||||||||||||||||||
|
Cash and cash equivalents
|
81,831 | (29,657 | ) | 526 | 52,700 | and liability line items. Similarly, the presentation also includes | ||||||||||||||||||
|
Cash in escrow
|
171,913 | (133,969 | ) | 955 | 38,899 | the Company's pro-rata share of assets and liabilities for | ||||||||||||||||||
|
Investments in and advances to unconsolidated affiliates
|
222,462 | (167,411 | ) | (51,592 | ) | 3,459 | unconsolidated investments which are accounted for under the equity | |||||||||||||||||
|
Rents receivable, net
|
5,048 | (2,013 | ) | 452 | 3,487 | method of accounting for the Company's financial statements |
.
|
|||||||||||||||||
|
Straight-line rents receivable, net
|
27,099 | (14,174 | ) | 996 | 13,921 | |||||||||||||||||||
|
Notes Receivable
|
105,367 | (7,593 | ) | 1,080 | 98,854 | 3 The components of Net real estate under development are as follows: | ||||||||||||||||||
|
Deferred charges, net
|
39,053 | (27,236 | ) | 1,401 | 13,218 |
Fund II
|
$ | 232,032 | ||||||||||||||||
|
Prepaid expenses and other assets
|
45,768 | 10,948 | 877 | 57,593 |
Fund III
|
28,599 | ||||||||||||||||||
|
Acquired lease intangibles
|
31,839 | (11,123 | ) | 1,135 | 21,851 |
Fund IV
|
3 | |||||||||||||||||
|
Accounts receivable from related parties
|
1,133 | - | - | 1,133 | ||||||||||||||||||||
|
Assets of discontinued operations
|
21,014 | (16,811 | ) | - | 4,203 |
Total Opportunity Funds
|
260,634 | |||||||||||||||||
|
Core Portfolio
|
1,657 | |||||||||||||||||||||||
|
Total Assets
|
$ | 2,295,869 | $ | (1,093,571 | ) | $ | 43,766 | $ | 1,246,064 |
Total
|
$ | 262,291 | ||||||||||||
|
LIABILITIES AND SHAREHOLDERS' EQUITY
|
4 The components of Prepaid expenses and other assets are as follows: | |||||||||||||||||||||||
|
Due from Fund Investors
|
$ | 38,957 | ||||||||||||||||||||||
|
Mortgage notes payable
|
$ | 1,100,249 | (656,681 | ) | $ | 52,443 | $ | 496,011 |
Prepaid expenses
|
7,939 | ||||||||||||||
|
Notes payable
|
930 | - | - | 930 |
Unsettled At-The-Market proceeds
|
4,983 | ||||||||||||||||||
|
Valuation of debt at acquisition, net of amortization
|
1,142 | (214 | ) | 97 | 1,025 |
Accrued interest on Notes Receivable
|
2,135 | |||||||||||||||||
|
Acquired lease intangibles
|
16,962 | (5,134 | ) | 1,565 | 13,393 |
Contract deposits
|
1,090 | |||||||||||||||||
|
Accounts payable and accrued expenses
|
31,074 | (13,350 | ) | 1,066 | 18,790 |
Other
|
2,489 | |||||||||||||||||
|
Dividends and distributions payable
|
11,764 | - | - | 11,764 |
Total
|
$ | 57,593 | |||||||||||||||||
|
Share of losses in excess of inv. in unconsolidated affiliates
|
12,488 | - | (12,488 | ) | - | |||||||||||||||||||
|
Accounts payable to related parties
|
- | - | - | - | ||||||||||||||||||||
|
Other liabilities
|
22,657 | (8,667 | ) | 1,083 | 15,073 | |||||||||||||||||||
|
Liabilities of discontinued operations
|
11,911 | (9,529 | ) | - | 2,382 | |||||||||||||||||||
|
Total liabilities
|
1,209,177 | (693,575 | ) | 43,766 | 559,368 | |||||||||||||||||||
|
Shareholders' equity:
|
||||||||||||||||||||||||
|
Common shares
|
54 | - | - | 54 | ||||||||||||||||||||
|
Additional paid-in capital
|
635,414 | - | - | 635,414 | ||||||||||||||||||||
|
Accumulated other comprehensive income
|
(4,932 | ) | - | - | (4,932 | ) | ||||||||||||||||||
|
Retained earnings
|
43,341 | - | - | 43,341 | ||||||||||||||||||||
|
Total controlling interest
|
673,877 | - | - | 673,877 | ||||||||||||||||||||
|
Non-controlling interest in subsidiary
|
412,815 | (399,996 | ) | - | 12,819 | |||||||||||||||||||
|
Total shareholders' equity
|
1,086,692 | (399,996 | ) | - | 686,696 | |||||||||||||||||||
|
Total Liabilities and Shareholders' Equity
|
$ | 2,295,869 | $ | (1,093,571 | ) | $ | 43,766 | $ | 1,246,064 | |||||||||||||||
- 11 -
|
Notes Receivable
|
||||||||||||||||||||||||||||||||
|
(in thousands)
|
||||||||||||||||||||||||||||||||
|
Balance at
|
Balance at
|
Underlying third-party
|
||||||||||||||||||||||||||||||
|
December 31, 2012
|
First
|
March 31, 2013
|
Stated
|
Effective
|
first mortgage
|
|||||||||||||||||||||||||||
|
Quarter
|
Accrued
|
Interest
|
Interest
|
Maturity
|
Extension
|
Maturity | ||||||||||||||||||||||||||
|
Investment
|
Principal
|
Activity
|
Principal2
|
Interest
|
Total
|
Rate
|
Rate 1
|
Dates
|
Options
|
Amount
|
Dates
|
|||||||||||||||||||||
|
First mortgage notes
|
$ | 48,919 | $ | (5,400 | ) | $ | 43,519 | $ | 369 | $ | 43,888 | 7.75% | 9.27% |
2013 to 2014
|
- | n/a | n/a | |||||||||||||||
|
Mezzanine notes
|
49,526 | 119 | 49,645 | 1,720 | 51,365 | 14.11% | 14.79% |
2013 to 2020
|
- | 302,923 |
2014 thru 2019
|
|||||||||||||||||||||
|
Total notes receivable
|
$ | 98,445 | $ | (5,281 | ) | $ | 93,164 | $ | 2,089 | $ | 95,253 | 11.14% | 12.21% | |||||||||||||||||||
|
Notes:
|
||||||||||||||||||||||||||||||||
|
1 Inclusive of points and exit fees.
|
||||||||||||||||||||||||||||||||
|
2 Reconciliation of Notes Receivable to the Consolidated Balance Sheet
|
|
|||||||||||||||||||||||||||||||
|
Total Notes Receivable per above
|
$ | 93,164 | ||||||||||||||||||||||||||||||
|
Fund I first mortgage loan - seller financing for Kroger/Safeway sale
|
12,203 | |||||||||||||||||||||||||||||||
|
Total Notes Receivable per Consolidated Balance Sheet
|
$ | 105,367 | ||||||||||||||||||||||||||||||
- 12 -
|
2013 Guidance
|
||||
|
(in millions except per share amounts, all per share amounts are fully diluted)
|
||||
|
2013 Guidance
|
2012 Actual
|
|||
|
Overall:
|
||||
|
Fully diluted Common Shares and OP Units
|
54,600 - 55,800
|
51,150
|
||
|
Full year Funds from Operations ("FFO") per share
|
$1.17 to $1.25
|
$1.04
|
||
|
Earnings per Share ("EPS")
|
$0.66 to $0.71
|
$0.85
|
||
|
FFO Components:
|
||||
|
Core and pro-rata share of opportunity Fund ("Fund") portfolio income
|
$66.5 to $70.5
|
$47.6
|
||
|
Asset and property management fee income, net of TRS taxes
|
$14.5 to $15.0
|
$16.3
|
||
|
Transactional fee income, net of TRS taxes
|
$6.5 to $7.0
|
$6.8
|
||
|
Promote, RCP and other income, net of TRS taxes
|
$1.0 to $1.5
|
$1.5
|
||
|
General and administrative expense
|
$(24.5) to $(24.0)
|
$(23.4)
|
||
|
Total
|
$64.0 to $70.0
|
$48.8
|
||
- 13 -
|
Net Asset Valuation Information
|
|||||||||||||||||||||||||||||||||||||||||||||||||||||||||||||||
|
(in thousands)
|
|||||||||||||||||||||||||||||||||||||||||||||||||||||||||||||||
|
CORE
|
FUND I
|
FUND II
|
FUND III
|
FUND IV
|
|||||||||||||||||||||||||||||||||||||||||||||||||||||||||||
|
Fund Level
|
AKR pro-rata share
|
Fund Level
|
AKR Pro-rata Share
|
Fund Level
|
AKR pro-rata share
|
Fund Level
|
AKR pro-rata share
|
||||||||||||||||||||||||||||||||||||||||||||||||||||||||
|
Quarterly
|
Annualized (x4)
|
%
|
$ |
Quarterly
|
Annualized (x4)
|
%
|
$ |
Quarterly
|
Annualized (x4)
|
%
|
$ |
Quarterly
|
Annualized (x4)
|
%
|
$ | ||||||||||||||||||||||||||||||||||||||||||||||||
|
Current NOI
|
|||||||||||||||||||||||||||||||||||||||||||||||||||||||||||||||
|
Net Operating Income - Continuing Operations
|
$ | 16,563 | $ | 66,252 |
|
-- | $ | 4,803 | $ | 19,212 | 20.00 | % | $ | 3,842 | $ | 6,894 | $ | 27,576 | 19.90 | % | $ | 5,488 | $ | 1,609 | $ | 6,436 | 23.12 | % | $ | 1,488 | |||||||||||||||||||||||||||||||||
|
Less: Net Operating Income of pre-stabilized assets
|
- | - | - | (1,803 | ) | (7,212 | ) | (1,435 | ) | (1,381 | ) | (5,524 | ) | (1,277 | ) | ||||||||||||||||||||||||||||||||||||||||||||||||
|
Net Operating Income of stabilized assets
|
4,803 | 19,212 | 3,842 | 5,091 | 20,364 | 4,053 | 228 | 912 | 211 | ||||||||||||||||||||||||||||||||||||||||||||||||||||||
|
Cost to Date
|
|||||||||||||||||||||||||||||||||||||||||||||||||||||||||||||||
|
Cost basis of pre-stabilized assets
|
$ | 200,800 | $ | 40,160 | $ | 96,066 | $ | 19,118 | $ | 147,050 | $ | 33,998 | |||||||||||||||||||||||||||||||||||||||||||||||||||
|
Discontinued operations, contract price, net of debt
|
$ | 23,139 | $ | 4,628 | |||||||||||||||||||||||||||||||||||||||||||||||||||||||||||
|
Debt
|
$ | 356,299 | $ | - | $ | 395,230 | $ | 76,095 | $ | 237,068 | $ | 43,034 | $ | 93,050 | $ | 21,513 | |||||||||||||||||||||||||||||||||||||||||||||||
|
Gross asset value1
|
16,000 | ||||||||||||||||||||||||||||||||||||||||||||||||||||||||||||||
|
Net Asset Value
|
$ | 16,000 | 37.78 | % | $ |
6,045
|
|||||||||||||||||||||||||||||||||||||||||||||||||||||||||
|
Notes:
|
|||||||||||||||||||||||||
|
1Fund I value is based on property appraisals. Pro-rata share is 20% (AKR promote) + 22% x 80% (AKR remaining share after promote) = 37.78%.
|
|||||||||||||||||||||||||
- 14 -
|
Selected Financial Ratios
|
|||||||||||||||||||
|
(in thousands)
|
|||||||||||||||||||
|
Three months ended March 31,
|
Three months ended March 31,
|
Three months ended December 31,
|
|||||||||||||||||
|
2013
|
2012
|
2013
|
2012
|
||||||||||||||||
|
COVERAGE RATIOS1
|
LEVERAGE RATIOS
|
||||||||||||||||||
|
Fixed-Charge Coverage Ratios
|
Debt4
|
$ | 496,941 | $ | 445,582 | ||||||||||||||
|
Total Market Capitalization
|
2,029,930 | 1,773,821 | |||||||||||||||||
|
EBITDA2 divided by:
|
$ | 18,844 | $ | 12,357 |
Debt/Total Market Capitalization
|
24 | % | 25 | % | ||||||||||
|
Interest expense
|
4,844 | 4,333 | |||||||||||||||||
|
Principal Amortization
|
607 | 788 |
Debt4, 6
|
$ | 444,241 | $ | 382,653 | ||||||||||||
|
Preferred Dividends
|
5 | 5 |
Total Market Capitalization
|
1,977,230 | 1,710,892 | ||||||||||||||
|
Fixed-Charge Coverage Ratio - Core Portfolio
|
3.5 | x | 2.4 | x |
Net Debt/Total Market Capitalization
|
22 | % | 22 | % | ||||||||||
|
EBITDA divided by:
|
$ | 22,484 | $ | 15,558 |
Debt + Preferred Equity (Preferred O.P. Units)
|
$ | 497,637 | $ | 446,211 | ||||||||||
|
Interest expense
|
5,776 | 5,396 |
Total Market Capitalization
|
2,029,930 | 1,773,821 | ||||||||||||||
|
Principal Amortization
|
814 | 906 |
Debt+Preferred Equity/Total Market Capitalization
|
25 | % | 25 | % | ||||||||||||
|
Preferred Dividends
|
5 | 5 | |||||||||||||||||
|
Fixed-Charge Coverage Ratio - Core Portfolio
|
Debt
|
$ | 356,299 | $ | 341,044 | ||||||||||||||
|
and Opportunity Funds
|
3.4 | x | 2.5 | x |
EBITDA (Annualized)
|
75,376 | 71,764 | ||||||||||||
|
Debt/EBITDA - Core Portfolio
|
4.7 | x | 4.8 | x | |||||||||||||||
|
Payout Ratios
|
|||||||||||||||||||
|
Debt5
|
$ | 311,843 | $ | 287,139 | |||||||||||||||
|
Dividends (Shares) & Distributions (OP Units) paid
|
$ | 11,763 | $ | 7,914 |
EBITDA (Annualized)
|
75,376 | 71,764 | ||||||||||||
|
FFO
|
16,846 | 9,298 |
Net Debt/EBITDA - Core Portfolio
|
4.1 | x | 4.0 | x | ||||||||||||
|
FFO Payout Ratio
|
70 | % | 85 | % | |||||||||||||||
|
Debt
|
$ | 496,941 | $ | 445,582 | |||||||||||||||
|
Dividends (Shares) & Distributions (OP Units) paid
|
$ | 11,763 | $ | 7,914 |
EBITDA (Annualized)
|
89,568 | 82,676 | ||||||||||||
|
AFFO
|
13,633 | 6,901 |
Debt/EBITDA - Core Portfolio and Opportunity Funds
|
5.5 | x | 5.4 | x | ||||||||||||
|
AFFO Payout Ratio
|
86 | % | 115 | % | |||||||||||||||
|
Debt6
|
$ | 444,241 | $ | 382,653 | |||||||||||||||
|
Dividends (Shares) & Distributions (OP Units) paid
|
$ | 11,763 | $ | 7,914 |
EBITDA (Annualized)
|
89,568 | 82,676 | ||||||||||||
|
FAD
|
12,819 | 5,995 |
Net Debt/EBITDA - Core Portfolio and Opportunity Funds
|
5.0 | x | 4.6 | x | ||||||||||||
|
FAD Payout Ratio
|
92 | % | 132 | % | |||||||||||||||
|
NOI (Annualized)
|
$ | 66,252 | $ | 58,056 | |||||||||||||||
|
Debt
|
356,299 | 341,044 | |||||||||||||||||
|
Notes:
|
Debt Yield - Core Portfolio
|
19 | % | 17.0 | % | ||||||||||||||
| 1Quarterly results are unaudited, although they reflect all adjustments, which in the opinion of | |||||||||||||||||||
|
management, are necessary for a fair presentation of operating results for the interim periods.
|
NOI (Annualized)
|
$ | 66,252 | $ | 58,056 | ||||||||||||||
|
The coverage ratios include the Company's pro-rata share of FFO, AFFO, EBITDA, interest
|
Debt5
|
311,843 | 287,139 | ||||||||||||||||
|
expense and principal amortization related to both the Company's consolidated and
|
Net Debt Yield - Core Portfolio
|
21 | % | 20.2 | % | ||||||||||||||
|
unconsolidated investments in joint ventures.
|
|||||||||||||||||||
|
2See page 8 for a calculation of EBITDA.
|
NOI (Annualized)
|
$ | 77,088 | $ | 65,844 | ||||||||||||||
|
3Represents preferred distributions on Preferred Operating partnership Units.
|
Debt
|
496,941 | 445,582 | ||||||||||||||||
|
4Includes the Company's pro-rata share of consolidated and unconsolidated joint venture debt.
|
Debt Yield - Core Portfolio and Opportunity Funds
|
16 | % | 14.8 | % | ||||||||||||||
|
5Reflects debt net of the current Core Portfolio cash balance at end of period.
|
|||||||||||||||||||
|
6Reflects debt net of the current Core Portfolio and pro-rata share of the Opportunity Funds
|
NOI (Annualized)
|
$ | 77,088 | $ | 65,844 | ||||||||||||||
|
cash balance at end of period.
|
Debt6
|
444,241 | 382,653 | ||||||||||||||||
|
Net Debt Yield - Core Portfolio and Opportunity Funds
|
17 | % | 17.2 | % | |||||||||||||||
- 15 -
|
Portfolio Debt - Summary
|
||||||||||||||||||||||||||||||||||||||||
|
Reconciliation from Pro-Rata Share of Debt to GAAP Debt per Financial Statement
|
||||||||||||||||||||||||||||||||||||||||
|
(in thousands)
|
||||||||||||||||||||||||||||||||||||||||
|
Acadia Pro-Rata Share of Debt 2
|
Reconciliation to Consolidated Debt as Reported
|
|||||||||||||||||||||||||||||||||||||||
|
Add:
|
Less:
|
Acadia
|
||||||||||||||||||||||||||||||||||||||
|
Core Portfolio
|
Opportunity Funds
|
Total
|
Noncontrolling
|
Pro-rata Share of
|
Consolidated
|
|||||||||||||||||||||||||||||||||||
|
Principal
|
Interest
|
Principal
|
Interest
|
|
Principal
|
Interest
|
Fixed vs
|
Interest Share of
|
Unconsolidated
|
Debt
|
||||||||||||||||||||||||||||||
|
Mortgage Notes Payable
|
Balance
|
Rate
|
Balance
|
Rate
|
Balance
|
Rate
|
Variable
|
Consolidated Debt 3
|
Debt 4
|
As Reported
|
||||||||||||||||||||||||||||||
|
Fixed-Rate Debt 1
|
$ | 356,299 | 5.5 | % | $ | 71,791 | 4.5 | % | $ | 428,090 | 5.3 | % | 86 | % | $ | 396,501 | $ | (48,370 | ) | $ | 776,221 | |||||||||||||||||||
|
Variable-Rate Debt
|
- | N/A | 68,851 | 2.6 | % | 68,851 | 2.6 | % | 14 | % | 260,179 | (4,072 | ) | 324,958 | ||||||||||||||||||||||||||
|
Total
|
$ | 356,299 | 5.5 | % | $ | 140,642 | 3.6 | % | $ | 496,941 | 4.9 | % | 100 | % | $ | 656,680 | $ | (52,442 | ) | 1,101,179 | ||||||||||||||||||||
|
Unamortized premium
|
1,142 | |||||||||||||||||||||||||||||||||||||||
|
Total debt as reported
|
$ | 1,102,321 | ||||||||||||||||||||||||||||||||||||||
|
Notes:
|
||||||||||||||||||||||||||||||||||||||||
|
1 Fixed-rate debt includes notional principal fixed through swap transactions.
|
||||||||||||||||||||||||||||||||||||||||
|
2 Represents the Company's pro-rata share of debt based on its percent ownership.
|
||||||||||||||||||||||||||||||||||||||||
|
3 Represents the noncontrolling interest pro-rata share of consolidated partnership debt based on its percent ownership.
|
||||||||||||||||||||||||||||||||||||||||
|
4 Represents the Company's pro-rata share of unconsolidated partnership debt based on its percent ownership.
|
||||||||||||||||||||||||||||||||||||||||
- 16 -
|
Portfolio Debt - Detail
|
||||||||||||||||||
|
(in thousands)
|
||||||||||||||||||
|
Principal Balance at
|
Acadia's Pro-rata Share
|
Interest
|
Maturity
|
Extension
|
||||||||||||||
|
Property
|
Entity
|
March 31, 2013
|
Percent
|
Amount
|
Rate
|
Date
|
Options
|
|||||||||||
|
CORE PORTFOLIO
|
||||||||||||||||||
|
Fixed-Rate Debt
|
||||||||||||||||||
|
Clark Diversey
|
Acadia
|
$ | 4,308 | 100.0 | % | $ | 4,308 | 6.35 | % |
7/1/2014
|
None
|
|||||||
|
New Loudon Center
|
Acadia
|
13,566 | 100.0 | % | 13,566 | 5.64 | % |
9/6/2014
|
None
|
|||||||||
|
Crossroads Shopping Center
|
Crossroads JV
|
59,078 | 49.0 | % | 28,948 | 5.37 | % |
12/1/2014
|
None
|
|||||||||
|
Crescent Plaza
|
Acadia
|
16,954 | 100.0 | % | 16,954 | 4.98 | % |
9/6/2015
|
None
|
|||||||||
|
Pacesetter Park Shopping Center
|
Acadia
|
11,688 | 100.0 | % | 11,688 | 5.12 | % |
11/6/2015
|
None
|
|||||||||
|
Elmwood Park Shopping Center
|
Acadia
|
33,125 | 100.0 | % | 33,125 | 5.53 | % |
1/1/2016
|
None
|
|||||||||
|
Chicago Portfolio
|
Acadia
|
15,764 | 100.0 | % | 15,764 | 5.61 | % |
2/1/2016
|
None
|
|||||||||
|
The Gateway Shopping Center
|
Acadia
|
19,962 | 100.0 | % | 19,962 | 5.44 | % |
3/1/2016
|
None
|
|||||||||
|
Cambridge (Whole Foods)
|
Acadia
|
6,903 | 100.0 | % | 6,903 | 6.26 | % |
5/1/2016
|
None
|
|||||||||
|
Cambridge (Rite Aid)
|
Acadia
|
4,170 | 100.0 | % | 4,170 | 3.68 | % |
5/1/2016
|
1 x 60 mos.
|
|||||||||
|
Brandywine Town Center
|
Brandywine JV
|
166,200 | 22.2 | % | 36,933 | 5.99 | % |
7/1/2016
|
None
|
|||||||||
|
Walnut Hill Plaza
|
Acadia
|
23,120 | 100.0 | % | 23,120 | 6.06 | % |
10/1/2016
|
None
|
|||||||||
|
Rhode Island Place Shopping Center
|
Acadia
|
16,369 | 100.0 | % | 16,369 | 6.35 | % |
12/1/2016
|
None
|
|||||||||
|
Acadia Realty Trust (Convertible Notes)
|
Acadia
|
930 | 100.0 | % | 930 | 3.75 | % |
12/15/2016
|
None
|
|||||||||
|
239 Greenwich Avenue
|
Acadia
|
26,000 | 75.0 | % | 19,500 | 5.42 | % |
2/11/2017
|
None
|
|||||||||
|
639 West Diversey
|
Acadia
|
4,409 | 100.0 | % | 4,409 | 6.65 | % |
3/1/2017
|
None
|
|||||||||
|
Merrillville Plaza
|
Acadia
|
26,069 | 100.0 | % | 26,069 | 5.88 | % |
8/1/2017
|
None
|
|||||||||
|
A & P Shopping Plaza
|
Acadia
|
7,934 | 60.0 | % | 4,760 | 4.20 | % |
9/6/2022
|
None
|
|||||||||
|
Georgetown Portfolio
|
Acadia
|
18,406 | 50.0 | % | 9,203 | 4.72 | % |
11/10/2027
|
None
|
|||||||||
|
Interest rate swaps1
|
Acadia
|
59,618 | 100.0 | % | 59,618 | 4.76 | % |
Various
|
||||||||||
|
Sub-Total Fixed-Rate Debt
|
534,573 | 356,299 | 5.46 | % | ||||||||||||||
|
Variable-Rate Debt
|
||||||||||||||||||
|
Branch Plaza
|
Acadia
|
12,467 | 100.0 | % | 12,467 |
Libor + 225
|
9/30/2014
|
1 x 36 mos.
|
||||||||||
|
Unsecured Line of Credit2
|
Acadia
|
- | 100.0 | % | - |
Libor + 155
|
1/31/2016
|
1 x 12 mos.
|
||||||||||
|
Village Commons Shopping Center
|
Acadia
|
9,163 | 100.0 | % | 9,163 |
Libor + 140
|
6/30/2018
|
None
|
||||||||||
|
West Diversey
|
Acadia
|
15,172 | 100.0 | % | 15,172 |
Libor + 190
|
4/27/2019
|
None
|
||||||||||
|
4401 N White Plains Road
|
Acadia
|
6,353 | 100.0 | % | 6,353 |
Libor + 190
|
9/1/2022
|
None
|
||||||||||
|
28 Jericho Turnpike
|
Acadia
|
16,463 | 100.0 | % | 16,463 |
Libor + 190
|
1/23/2023
|
None
|
||||||||||
|
Interest rate swaps1
|
Acadia
|
(59,618 | ) | 100.0 | % | (59,618 | ) |
Libor + 190
|
||||||||||
|
Sub-Total Variable-Rate Debt
|
- | - |
Libor + 190
|
|||||||||||||||
|
Total Core Portfolio Debt
|
$ | 534,573 | $ | 356,299 | 5.46 | % | ||||||||||||
- 17 -
|
Portfolio Debt - Detail (continued)
|
|||||||||||||||||||||
|
(in thousands)
|
|||||||||||||||||||||
|
Principal Balance at
|
Acadia's Pro-rata Share
|
Interest
|
Maturity
|
Extension
|
|||||||||||||||||
|
Property
|
Entity
|
March 31, 2013
|
Percent
|
Amount
|
Rate
|
Date
|
Options
|
||||||||||||||
|
OPPORTUNITY FUNDS
|
|||||||||||||||||||||
|
Fixed-Rate Debt
|
|||||||||||||||||||||
|
Lincoln Park Centre
|
Fund III
|
$ | 19,364 | 19.9 | % | $ | 3,854 | 5.85 | % |
12/1/2013
|
None
|
||||||||||
|
Lincoln Road6
|
Fund III
|
19,764 | 18.9 | % | 3,737 | 6.14 | % |
8/11/2014
|
None
|
||||||||||||
|
CityPoint
|
Fund II
|
20,000 | 18.8 | % | 3,766 | 7.25 | % |
11/1/2014
|
None
|
||||||||||||
|
Arundel Plaza7
|
Fund III
|
9,136 | 17.9 | % | 1,637 | 5.60 | % |
4/1/2015
|
None
|
||||||||||||
|
216th Street3
|
Fund II
|
25,500 | 19.8 | % | 5,054 | 5.80 | % |
10/1/2017
|
None
|
||||||||||||
|
CityPoint
|
Fund II
|
160,000 | 18.8 | % | 30,126 | 4.75 | % | 20198 |
None
|
||||||||||||
|
CityPoint
|
Fund II
|
5,262 | 18.8 | % | 991 | 1.00 | % |
8/23/2019
|
None
|
||||||||||||
|
Interest rate swaps1
|
Funds II & III
|
117,979 | 19.2 | % | 22,626 | 2.96 | % |
Various
|
|||||||||||||
|
Sub-Total Fixed-Rate Debt
|
377,005 | 71,791 | 4.49 | % | |||||||||||||||||
|
Variable-Rate Debt
|
|||||||||||||||||||||
|
Pelham Manor Shopping Plaza3
|
Fund II
|
33,759 | 19.8 | % | 6,691 |
Libor + 275
|
12/1/2013
|
None
|
|||||||||||||
|
Parkway Crossing7
|
Fund III
|
13,654 | 17.9 | % | 2,446 |
Libor + 220
|
1/1/2015
|
2 x 12 mos.
|
|||||||||||||
|
640 Broadway
|
Fund III
|
22,750 | 10.0 | % | 2,264 |
Libor + 295
|
7/1/2015
|
1 x 12 mos.
|
|||||||||||||
|
Heritage Shops
|
Fund III
|
21,000 | 19.9 | % | 4,179 |
Libor + 225
|
8/10/2015
|
2 x 12 mos.
|
|||||||||||||
|
CityPoint
|
Fund II
|
20,650 | 18.8 | % | 3,888 |
Libor + 250
|
8/12/2015
|
None
|
|||||||||||||
|
CityPoint
|
Fund II
|
20,000 | 18.8 | % | 3,766 |
Libor + 500
|
8/23/2015
|
1 x 12 mos.
|
|||||||||||||
|
Fordham Place3
|
Fund II
|
80,559 | 19.8 | % | 15,966 |
Libor + 300
|
9/25/2015
|
2 x 12 mos.
|
|||||||||||||
|
Cortlandt Towne Center
|
Fund III
|
73,303 | 19.9 | % | 14,587 |
Libor + 190
|
10/26/2015
|
None
|
|||||||||||||
|
New Hyde Park Shopping Center
|
Fund III
|
6,437 | 19.9 | % | 1,281 |
Libor + 225
|
11/10/2015
|
2 x 12 mos.
|
|||||||||||||
|
Acadia Strategic Opportunity IV LLC4
|
Fund IV
|
93,050 | 23.1 | % | 21,513 |
Libor + 165
|
11/20/2015
|
1 x 12 mos.
|
|||||||||||||
|
Nostrand Avenue
|
Fund III
|
12,957 | 19.9 | % | 2,578 |
Libor + 265
|
2/1/2016
|
2 x 12 mos.
|
|||||||||||||
|
White City Shopping Center5
|
Fund III
|
38,703 | 16.7 | % | 6,471 |
Libor + 260
|
12/23/2017
|
1 x 36 mos.
|
|||||||||||||
|
161st Street3
|
Fund II
|
29,500 | 19.8 | % | 5,847 |
Libor + 250
|
4/1/2018
|
None
|
|||||||||||||
|
Interest rate swaps1
|
Funds II & III
|
(117,979 | ) | 19.2 | % | (22,626 | ) |
Libor + 232
|
|||||||||||||
|
Sub-Total Variable-Rate Debt
|
348,343 | 68,851 |
Libor + 244
|
||||||||||||||||||
|
Total Opportunity Funds Portfolio Debt
|
$ | 725,348 | $ | 140,642 | 3.59 | % | |||||||||||||||
- 18 -
|
Portfolio Debt - Notes
|
||||||||||||||||
|
(in thousands)
|
||||||||||||||||
|
1The Company has hedged a portion of its variable-rate debt with variable to fixed-rate swap agreements as follows:
|
||||||||||||||||
|
Notional
|
Pro-rata
|
Average
|
Maturity
|
|||||||||||||
|
principal
|
Share
|
Swap rate
|
All-in Rate
|
Date
|
||||||||||||
|
Core Portfolio
|
||||||||||||||||
| $ | 9,163 | $ | 9,163 | 2.90 | % | 4.80 | % |
7/2/2018
|
||||||||
| 15,172 | 15,172 | 1.57 | % | 3.47 | % |
5/1/2019
|
||||||||||
| 6,353 | 6,353 | 1.75 | % | 3.65 | % |
9/1/2022
|
||||||||||
| 12,467 | 12,467 | 3.77 | % | 5.67 | % |
12/1/2022
|
||||||||||
| 16,463 | 16,463 | 3.77 | % | 5.67 | % |
1/23/2023
|
||||||||||
| 59,618 | 59,618 | 2.86 | % | 4.76 | % | |||||||||||
|
Opportunity Funds
|
||||||||||||||||
| 35,418 | 7,084 | 0.70 | % | 2.95 | % |
5/1/2015
|
||||||||||
| 32,589 | 6,518 | 0.70 | % | 2.95 | % |
5/1/2015
|
||||||||||
| 21,000 | 4,179 | 0.52 | % | 2.77 | % |
8/10/2015
|
||||||||||
| 19,315 | 3,230 | 2.90 | % | 5.50 | % |
12/26/2017
|
||||||||||
| 9,657 | 1,615 | 3.02 | % | 5.62 | % |
12/26/2017
|
||||||||||
| 117,979 | 22,626 | 1.15 | % | 2.96 | % | |||||||||||
|
Total Core Portfolio and Opportunity Funds
|
$ | 177,597 | $ | 82,244 | 1.63 | % | 2.99 | % | ||||||||
|
2This is an unsecured revolving facility which has a current capacity up to $150,000 and can be increased to $300,000.
|
|||||
|
The interest rate will vary based on levels of leverage. As of March 31, 2013, the interest rate is LIBOR + 155 basis points.
|
|||||
|
3Fund II is a 99.1% joint venture partner on this investment. As such, Acadia's pro-rata share of the above debt is 99.1% x 20%, or 19.8%.
|
|||||
|
4Total current availability under this facility is $150,000. Fund IV also has the ability to increase the size of this facility to a total of $272,069.
|
|||||
|
5Fund III is an 84.0% joint venture partner on this investment. As such, Acadia's pro-rata share of the above debt is 84.0% x 19.9%, or 16.7%.
|
|||||
|
6Fund III is a 95.0% joint venture partner on this investment. As such, Acadia's pro-rata share of the above debt is 95.0% x 19.9%, or 18.9%.
|
|||||
|
7Fund III is a 90.0% joint venture partner on this investment. As such, Acadia's pro-rata share of the above debt is 90.0% x 19.9%, or 17.9%.
|
|||||
|
8The maturity date of this loan is five years after the final advancing of funds which is anticipated to occur during 2014.
|
|||||
- 19 -
|
Future Debt Maturities1
|
|||||||||||||||||||||||||||||||||
|
(in thousands)
|
|||||||||||||||||||||||||||||||||
|
Core Portfolio
|
|||||||||||||||||||||||||||||||||
|
Total Debt Maturities
|
Acadia's Pro-rata Share
|
Weighted Average Interest Rate of Maturing Debt
|
|||||||||||||||||||||||||||||||
|
Scheduled
|
Scheduled
|
||||||||||||||||||||||||||||||||
|
Year
|
Amortization
|
Maturities
|
Total
|
Amortization
|
Maturities
|
Total
|
Total Debt
|
Fixed-Rate Debt
|
Variable-Rate Debt
|
||||||||||||||||||||||||
|
2013
|
$ | 4,399 | $ | - | $ | 4,399 | $ | 3,838 | $ | - | $ | 3,838 | n/a | n/a | n/a | ||||||||||||||||||
|
2014
|
5,972 | 86,500 | 92,472 | 5,181 | 57,374 | 62,555 | 5.05 | % | 5.47 | % | 2.45 | % | |||||||||||||||||||||
|
2015
|
4,460 | 27,344 | 31,804 | 4,248 | 27,344 | 31,592 | 5.04 | % | 5.04 | % | n/a | ||||||||||||||||||||||
|
2016
|
2,857 | 280,509 | 283,366 | 2,637 | 151,242 | 153,879 | 5.88 | % | 5.88 | % | n/a | ||||||||||||||||||||||
|
2017
|
1,943 | 54,549 | 56,492 | 1,711 | 48,049 | 49,760 | 5.72 | % | 5.72 | % | n/a | ||||||||||||||||||||||
|
Thereafter
|
9,440 | 56,600 | 66,040 | 6,901 | 47,774 | 54,675 | 2.84 | % | 4.55 | % | 1.99 | % | |||||||||||||||||||||
|
Total
|
$ | 29,071 | $ | 505,502 | $ | 534,573 | $ | 24,516 | $ | 331,783 | $ | 356,299 | |||||||||||||||||||||
|
Opportunity Funds
|
|||||||||||||||||||||||||||||||||
|
Total Debt Maturities
|
Acadia's Pro-rata Share
|
Weighted Average Interest Rate of Maturing Debt
|
|||||||||||||||||||||||||||||||
|
Scheduled
|
Scheduled
|
||||||||||||||||||||||||||||||||
|
Year
|
Amortization
|
Maturities
|
Total
|
Amortization
|
Maturities
|
Total
|
Total Debt
|
Fixed-Rate Debt
|
Variable-Rate Debt
|
||||||||||||||||||||||||
|
2013
|
$ | 3,747 | $ | 52,549 | $ | 56,296 | $ | 719 | $ | 10,431 | $ | 11,150 | 4.00 | % | 5.85 | % | 2.95 | % | |||||||||||||||
|
2014
|
4,593 | 39,179 | 43,772 | 850 | 7,393 | 8,243 | 6.71 | % | 6.71 | % | n/a | ||||||||||||||||||||||
|
2015
|
3,595 | 352,780 | 356,375 | 650 | 70,083 | 70,733 | 2.68 | % | 5.60 | % | 2.61 | % | |||||||||||||||||||||
|
2016
|
707 | 11,397 | 12,104 | 120 | 2,269 | 2,389 | 2.85 | % | n/a | 2.85 | % | ||||||||||||||||||||||
|
2017
|
576 | 61,463 | 62,039 | 96 | 11,067 | 11,163 | 4.04 | % | 5.80 | % | 2.80 | % | |||||||||||||||||||||
|
Thereafter
|
- | 194,762 | 194,762 | - | 36,964 | 36,964 | 4.34 | % | 4.63 | % | 2.70 | % | |||||||||||||||||||||
|
Total
|
$ | 13,218 | $ | 712,130 | $ | 725,348 | $ | 2,435 | $ | 138,207 | $ | 140,642 | |||||||||||||||||||||
|
Note:
|
||||||||
|
1 Does not include any applicable extension options
|
||||||||
- 20 -
|
Core Portfolio Retail Properties - Detail
|
||||||||||||||||||||||||||||||||||||||||
|
Leased
|
||||||||||||||||||||||||||||||||||||||||
|
Year
|
Acadia's
|
Gross Leaseable Area
|
In Place Occupancy
|
Occupancy
|
Annualized Base Rent PSF | |||||||||||||||||||||||||||||||||||
|
Property
|
Anchors
|
Acquired
|
interest
|
Anchors
|
Shops
|
Total
|
Anchors
|
Shops
|
Total
|
Total
|
Anchors
|
Shops
|
Total
|
|||||||||||||||||||||||||||
|
NEW YORK
|
||||||||||||||||||||||||||||||||||||||||
|
Connecticut
|
||||||||||||||||||||||||||||||||||||||||
|
239 Greenwich Avenue
|
- | 1998 | 75.0 | % | - | 16,834 | 16,834 | - | 100.0 | % | 100.0 | % | 100.0 | % | $ | - | $ | 92.35 | $ | 92.35 | ||||||||||||||||||||
|
181 Main Street
|
- | 2012 | 100.0 | % | - | 11,350 | 11,350 | - | 100.0 | % | 100.0 | % | 100.0 | % | - | 74.48 | 74.48 | |||||||||||||||||||||||
| - | 28,184 | 28,184 | - | 100.0 | % | 100.0 | % | 100.0 | % | - | 85.15 | 85.15 | ||||||||||||||||||||||||||||
|
New Jersey
|
||||||||||||||||||||||||||||||||||||||||
|
Elmwood Park Shopping Center
|
Walgreens, Pathmark (A&P)
|
1998 | 100.0 | % | 62,610 | 86,652 | 149,262 | 100.0 | % | 94.6 | % | 96.9 | % | 96.9 | % | 25.26 | 25.05 | 25.14 | ||||||||||||||||||||||
|
A & P Shopping Plaza
|
A&P
|
2006 | 60.0 | % | 49,463 | 13,278 | 62,741 | 100.0 | % | 100.0 | % | 100.0 | % | 100.0 | % | 19.21 | 29.71 | 21.43 | ||||||||||||||||||||||
|
60 Orange Street
|
Home Depot
|
2012 | 98.0 | % | 101,715 | - | 101,715 | 100.0 | % | - | 100.0 | % | 100.0 | % | 6.83 | - | 6.83 | |||||||||||||||||||||||
|
Total - New Jersey
|
213,788 | 99,930 | 313,718 | 100.0 | % | 95.3 | % | 98.5 | % | 98.5 | % | 15.09 | 25.70 | 18.36 | ||||||||||||||||||||||||||
|
New York
|
||||||||||||||||||||||||||||||||||||||||
|
Village Commons Shopping Center
|
- | 1998 | 100.0 | % | - | 87,330 | 87,330 | - | 95.4 | % | 95.4 | % | 95.4 | % | - | 30.67 | 30.67 | |||||||||||||||||||||||
|
Branch Plaza
|
LA Fitness, CVS
|
1998 | 100.0 | % | 74,050 | 52,223 | 126,273 | 75.7 | % | 90.0 | % | 81.6 | % | 81.6 | % | 21.35 | 29.44 | 25.04 | ||||||||||||||||||||||
|
Amboy Center
|
Stop & Shop (Ahold)
|
2005 | 100.0 | % | 37,266 | 26,024 | 63,290 | 100.0 | % | 100.0 | % | 100.0 | % | 100.0 | % | 20.00 | 43.90 | 29.83 | ||||||||||||||||||||||
|
Bartow Avenue
|
- | 2005 | 100.0 | % | - | 14,676 | 14,676 | - | 92.8 | % | 92.8 | % | 100.0 | % | - | 30.91 | 30.91 | |||||||||||||||||||||||
|
Pacesetter Park Shopping Center
|
Stop & Shop (Ahold)
|
1999 | 100.0 | % | 52,052 | 45,531 | 97,583 | 100.0 | % | 88.4 | % | 94.6 | % | 94.6 | % | 8.24 | 18.66 | 12.78 | ||||||||||||||||||||||
|
LA Fitness
|
LA Fitness
|
2007 | 100.0 | % | 55,000 | - | 55,000 | 100.0 | % | - | 100.0 | % | 100.0 | % | 25.30 | - | 25.30 | |||||||||||||||||||||||
|
East 17th Street
|
Barnes & Noble
|
2008 | 100.0 | % | 10,382 | - | 10,382 | 100.0 | % | - | 100.0 | % | 100.0 | % | 60.20 | - | 60.20 | |||||||||||||||||||||||
|
Crossroads Shopping Center1
|
Kmart, Home Goods, Modell's
|
1998 | 49.0 | % | 201,296 | 108,227 | 309,523 | 81.0 | % | 70.5 | % | 77.3 | % | 78.1 | % | 9.93 | 45.13 | 21.15 | ||||||||||||||||||||||
|
Third Avenue
|
Planet Fitness
|
2006 | 100.0 | % | 21,650 | 18,670 | 40,320 | 100.0 | % | 55.3 | % | 79.3 | % | 79.3 | % | 21.65 | 19.19 | 20.85 | ||||||||||||||||||||||
|
Mercer Street
|
- | 2011 | 100.0 | % | - | 3,375 | 3,375 | - | 100.0 | % | 100.0 | % | 100.0 | % | - | 116.93 | 116.93 | |||||||||||||||||||||||
|
28 Jericho Turnpike
|
Kohl's
|
2012 | 100.0 | % | 96,363 | - | 96,363 | 100.0 | % | - | 100.0 | % | 100.0 | % | 17.12 | - | 17.12 | |||||||||||||||||||||||
|
4401 White Plains Road
|
Walgreens
|
2011 | 100.0 | % | 12,964 | - | 12,964 | 100.0 | % | - | 100.0 | % | 100.0 | % | 48.21 | - | 48.21 | |||||||||||||||||||||||
|
83 Spring Street
|
- | 2012 | 100.0 | % | - | 3,000 | 3,000 | - | 100.0 | % | 100.0 | % | 100.0 | % | - | 207.96 | 207.96 | |||||||||||||||||||||||
|
Total - New York
|
561,023 | 359,056 | 920,079 | 90.0 | % | 84.4 | % | 87.8 | % | 88.2 | % | 17.33 | 35.99 | 24.33 | ||||||||||||||||||||||||||
|
Total New York
|
774,811 | 487,170 | 1,261,981 | 92.7 | % | 87.6 | % | 90.7 | % | 91.0 | % | $ | 16.67 | $ | 36.94 | $ | 24.22 | |||||||||||||||||||||||
|
NEW ENGLAND
|
||||||||||||||||||||||||||||||||||||||||
|
Connecticut
|
||||||||||||||||||||||||||||||||||||||||
|
Town Line Plaza2
|
Wal-Mart, Stop & Shop (Ahold)
|
1998 | 100.0 | % | 163,159 | 43,187 | 206,346 | 100.0 | % | 88.9 | % | 97.7 | % | 97.7 | % | $ | 14.72 | $ | 17.54 | $ | 15.76 | |||||||||||||||||||
|
Massachusetts
|
||||||||||||||||||||||||||||||||||||||||
|
Methuen Shopping Center
|
Wal-Mart, Market Basket
|
1998 | 100.0 | % | 120,004 | 10,017 | 130,021 | 100.0 | % | 100.0 | % | 100.0 | % | 100.0 | % | 6.66 | 22.84 | 7.91 | ||||||||||||||||||||||
|
Crescent Plaza
|
Home Depot, Shaw's (Supervalu)
|
1993 | 100.0 | % | 156,985 | 61,152 | 218,137 | 100.0 | % | 79.0 | % | 94.1 | % | 94.1 | % | 7.51 | 11.84 | 8.53 | ||||||||||||||||||||||
|
Cambridge
|
Whole Foods, Rite Aid
|
2012 | 100.0 | % | 54,226 | - | 54,226 | 100.0 | % | - | 100.0 | % | 100.0 | % | 20.85 | - | 20.85 | |||||||||||||||||||||||
|
Total - Massachusetts
|
331,215 | 71,169 | 402,384 | 100.0 | % | 81.9 | % | 96.8 | % | 96.8 | % | 9.39 | 13.73 | 10.04 | ||||||||||||||||||||||||||
|
New York
|
||||||||||||||||||||||||||||||||||||||||
|
New Loudon Center
|
Marshalls, Price Chopper,
|
1993 | 100.0 | % | 251,058 | 4,615 | 255,673 | 100.0 | % | 100.0 | % | 100.0 | % | 100.0 | % | 7.28 | 28.26 | 7.66 | ||||||||||||||||||||||
|
Raymour & Flanigan
|
||||||||||||||||||||||||||||||||||||||||
|
Rhode Island
|
||||||||||||||||||||||||||||||||||||||||
|
Walnut Hill Plaza
|
Sears, Shaw's (Supervalu)
|
1998 | 100.0 | % | 187,910 | 96,807 | 284,717 | 100.0 | % | 59.8 | % | 86.3 | % | 86.3 | % | 6.87 | 13.46 | 8.42 | ||||||||||||||||||||||
|
Vermont
|
||||||||||||||||||||||||||||||||||||||||
|
The Gateway Shopping Center
|
Shaw's (Supervalu)
|
1999 | 100.0 | % | 73,184 | 28,471 | 101,655 | 100.0 | % | 100.0 | % | 100.0 | % | 100.0 | % | 18.50 | 21.72 | 19.40 | ||||||||||||||||||||||
|
Total New England
|
1,006,526 | 244,249 | 1,250,775 | 100.0 | % | 76.8 | % | 95.5 | % | 95.5 | % | $ | 9.40 | $ | 15.99 | $ | 10.53 | |||||||||||||||||||||||
|
Notes:
|
||||||||||||||||||||||||||||||||||||||||
|
General note - The above occupancy and rent amounts do not include space which is currently leased, but for which rent payment has not yet commenced. Residential and office GLA is excluded.
|
||||||||||||||||||||||||||||||||||||||||
|
1The Company has a 49% interest in this unconsolidated investment.
|
||||||||||||||||||||||||||||||||||||||||
|
2Anchor GLA includes a 97,300 square foot Wal-Mart store which is not owned by the Company. This square footage has been excluded for calculating annualized
|
||||||||||||||||||||||||||||||||||||||||
|
base rent per square foot.
|
||||||||||||||||||||||||||||||||||||||||
- 21 -
|
Core Portfolio Retail Properties - Detail (continued)
|
||||||||||||||||||||||||||||||||||||||||
|
Leased
|
||||||||||||||||||||||||||||||||||||||||
|
Year
|
Acadia's
|
Gross Leaseable Area
|
Occupancy
|
Occupancy
|
Annualized Base Rent | |||||||||||||||||||||||||||||||||||
|
Property
|
Anchors
|
Acquired
|
interest
|
Anchors
|
Shops
|
Total
|
Anchors
|
Shops
|
Total
|
Total
|
Anchors
|
Shops
|
Per Sq. Ft.
|
|||||||||||||||||||||||||||
|
MIDWEST
|
||||||||||||||||||||||||||||||||||||||||
|
Illinois
|
||||||||||||||||||||||||||||||||||||||||
|
Hobson West Plaza
|
Garden Fresh Markets
|
1998
|
100.0 | % | 51,692 | 47,445 | 99,137 | 100.0 | % | 92.0 | % | 96.2 | % | 96.2 | % | $ | 4.64 | $ | 20.84 | $ | 12.06 | |||||||||||||||||||
|
Clark Diversey
|
Vitamin Shoppe
|
2006
|
100.0 | % | - | 19,265 | 19,265 | - | 100.0 | % | 100.0 | % | 100.0 | % | - | 44.97 | 44.97 | |||||||||||||||||||||||
|
651-671 West Diversey
|
Trader Joe's, Urban Outfitters
|
2011
|
100.0 | % | 16,500 | 29,759 | 46,259 | 100.0 | % | 100.0 | % | 100.0 | % | 100.0 | % | 54.55 | 33.50 | 41.01 | ||||||||||||||||||||||
|
639 West Diversey
|
- | 2012 | 100.0 | % | - | 12,557 | 12,557 | - | 100.0 | % | 100.0 | % | 100.0 | % | - | 53.05 | 53.05 | |||||||||||||||||||||||
|
930 North Rush Street
|
Lululemon
|
2012 | 100.0 | % | - | 2,930 | 2,930 | - | 100.0 | % | 100.0 | % | 100.0 | % | - | 391.59 | 391.59 | |||||||||||||||||||||||
|
664 N. Michigan Avenue
|
Tommy Bahama, Ann Taylor Loft
|
2013 | 100.0 | % | - | 18,141 | 18,141 | - | 100.0 | % | 100.0 | % | 100.0 | % | - | 232.00 | 232.00 | |||||||||||||||||||||||
|
Chicago Street Retail Portfolio1
|
- | 2011/2012 | 100.0 | % | - | 115,017 | 115,017 | - | 88.4 | % | 88.4 | % | 88.9 | % | - | 44.37 | 44.37 | |||||||||||||||||||||||
|
Total - Illinois
|
68,192 | 245,114 | 313,306 | 100.0 | % | 93.0 | % | 94.5 | % | 94.7 | % | 16.72 | 58.37 | 48.78 | ||||||||||||||||||||||||||
|
Indiana
|
||||||||||||||||||||||||||||||||||||||||
|
Merrillville Plaza
|
JC Penney, Office Max,
|
1998 | 100.0 | % | 123,369 | 112,455 | 235,824 | 100.0 | % | 82.2 | % | 91.5 | % | 91.5 | % | 10.40 | 18.02 | 13.66 | ||||||||||||||||||||||
|
TJ Maxx
|
||||||||||||||||||||||||||||||||||||||||
|
Michigan
|
||||||||||||||||||||||||||||||||||||||||
|
Bloomfield Towne Square
|
Best Buy, Home Goods,
|
1998 | 100.0 | % | 153,839 | 82,837 | 236,676 | 100.0 | % | 94.0 | % | 97.9 | % | 97.9 | % | 10.94 | 22.01 | 14.66 | ||||||||||||||||||||||
| TJ Maxx, Dick's Sporting Goods | ||||||||||||||||||||||||||||||||||||||||
|
Ohio
|
||||||||||||||||||||||||||||||||||||||||
|
Mad River Station
|
Babies 'R' Us, Office Depot
|
1999 | 100.0 | % | 58,185 | 67,944 | 126,129 | 100.0 | % | 68.7 | % | 83.1 | % | 83.1 | % | 9.49 | 16.53 | 12.63 | ||||||||||||||||||||||
|
Total Midwest
|
403,585 | 508,350 | 911,935 | 100.0 | % | 87.5 | % | 93.0 | % | 93.1 | % | $ | 11.54 | $ | 39.23 | $ | 26.06 | |||||||||||||||||||||||
|
MID-ATLANTIC
|
||||||||||||||||||||||||||||||||||||||||
|
New Jersey
|
||||||||||||||||||||||||||||||||||||||||
|
Marketplace of Absecon
|
Rite Aid, Dollar Tree
|
1998 | 100.0 | % | 47,915 | 56,847 | 104,762 | 56.7 | % | 92.1 | % | 75.9 | % | 75.9 | % | $ | 20.34 | $ | 14.99 | $ | 16.82 | |||||||||||||||||||
|
Delaware
|
||||||||||||||||||||||||||||||||||||||||
|
Brandywine Town Center2
|
Lowes, Bed Bath & Beyond,
|
2003 | 22.2 | % | 827,471 | 48,208 | 875,679 | 97.0 | % | 92.1 | % | 96.7 | % | 96.7 | % | 15.54 | 17.01 | 15.62 | ||||||||||||||||||||||
| Target, Dick's Sporting Goods | ||||||||||||||||||||||||||||||||||||||||
|
Market Square Shopping Center2
|
TJ Maxx, Trader Joe's
|
2003 | 22.2 | % | 42,850 | 59,197 | 102,047 | 100.0 | % | 93.7 | % | 96.4 | % | 98.1 | % | 16.41 | 31.23 | 24.77 | ||||||||||||||||||||||
|
Naamans Road2
|
- | 2006 | 22.2 | % | - | 19,984 | 19,984 | - | 100.0 | % | 100.0 | % | 100.0 | % | - | 41.91 | 41.91 | |||||||||||||||||||||||
|
Total - Delaware
|
870,321 | 127,389 | 997,710 | 97.1 | % | 94.1 | % | 96.7 | % | 96.9 | % | 15.59 | 27.74 | 17.10 | ||||||||||||||||||||||||||
|
Pennsylvania
|
||||||||||||||||||||||||||||||||||||||||
|
Mark Plaza
|
Kmart
|
1993 | 100.0 | % | 104,956 | 1,900 | 106,856 | 100.0 | % | 100.0 | % | 100.0 | % | 100.0 | % | 1.95 | 18.95 | 2.25 | ||||||||||||||||||||||
|
Plaza 422
|
Home Depot, Dunham Sports
|
1993 | 100.0 | % | 139,968 | 16,311 | 156,279 | 100.0 | % | 100.0 | % | 100.0 | % | 100.0 | % | 4.60 | 9.34 | 5.09 | ||||||||||||||||||||||
|
Route 6 Plaza
|
Kmart
|
1994 | 100.0 | % | 146,498 | 29,021 | 175,519 | 81.7 | % | 94.8 | % | 83.9 | % | 87.8 | % | 5.75 | 13.18 | 7.14 | ||||||||||||||||||||||
|
Chestnut Hill3
|
- | 2006 | 100.0 | % | - | 37,646 | 37,646 | - | 85.8 | % | 85.8 | % | 100.0 | % | - | 19.37 | 19.37 | |||||||||||||||||||||||
|
Abington Towne Center4
|
Target, TJ Maxx
|
1998 | 100.0 | % | 184,616 | 31,662 | 216,278 | 100.0 | % | 70.4 | % | 95.7 | % | 95.7 | % | 10.50 | 31.95 | 20.20 | ||||||||||||||||||||||
|
Total - Pennsylvania
|
576,038 | 116,540 | 692,578 | 95.3 | % | 86.1 | % | 93.8 | % | 95.6 | % | 4.65 | 18.83 | 7.54 | ||||||||||||||||||||||||||
|
District of Columbia
|
||||||||||||||||||||||||||||||||||||||||
|
Rhode Island Place Shopping Center
|
TJ Maxx
|
2012 | 100.0 | % | 24,996 | 32,533 | 57,529 | 100.0 | % | 100.0 | % | 100.0 | % | 100.0 | % | 12.50 | 40.27 | 28.21 | ||||||||||||||||||||||
|
1739-53 & 1801-03 Connecticut Avenue
|
- | 2012 | 100.0 | % | - | 22,907 | 22,907 | - | 92.7 | % | 92.7 | % | 92.7 | % | - | 53.48 | 53.48 | |||||||||||||||||||||||
|
Georgetown Portfolio5
|
- | 2011 | 50.0 | % | - | 27,666 | 27,666 | - | 96.4 | % | 96.4 | % | 96.4 | % | - | 67.95 | 67.95 | |||||||||||||||||||||||
|
Total - District of Columbia
|
24,996 | 83,106 | 108,102 | 100.0 | % | 96.8 | % | 97.5 | % | 97.5 | % | 12.50 | 52.94 | 43.35 | ||||||||||||||||||||||||||
|
Total Mid-Atlantic
|
1,519,270 | 383,882 | 1,903,152 | 95.2 | % | 91.9 | % | 94.6 | % | 95.3 | % | $ | 12.30 | $ | 29.06 | $ | 15.91 | |||||||||||||||||||||||
|
TOTAL CORE PROPERTIES
|
3,704,192 | 1,623,651 | 5,327,843 | 96.5 | % | 87.0 | % | 93.6 | % | 94.0 | % | $ | 12.36 | $ | 32.91 | $ | 18.49 | |||||||||||||||||||||||
|
TOTAL CORE PROPERTIES - weighted based on ownership interest
|
2,902,776 | 1,446,019 | 4,348,795 | 96.9 | % | 86.9 | % | 93.6 | % | 94.0 | % | $ | 10.52 | $ | 32.36 | $ | 17.26 | |||||||||||||||||||||||
|
Notes:
|
||||||||||||||||||||||||||||||||||||||||
|
General note - The above occupancy and rent amounts do not include space which is currently leased, but for which rent payment has not yet commenced. Residential and office GLA is excluded. West 54th Street is under redevelopment.
|
||||||||||||||||||||||||||||||||||||||||
|
1Includes 19 properties
|
||||||||||||||||||||||||||||||||||||||||
|
2The Company has a 22.2% interest in this investment.
|
||||||||||||||||||||||||||||||||||||||||
|
3This consists of two separate buildings.
|
||||||||||||||||||||||||||||||||||||||||
|
4Anchor GLA includes a 157,616 square foot Target store which is not owned by the Company. This square footage has been excluded for calculating annualized
|
||||||||||||||||||||||||||||||||||||||||
|
base rent per square foot.
|
||||||||||||||||||||||||||||||||||||||||
|
5Includes six properties (1533 Wisconsin Ave., 3025 M St., 3034 M St., 3146 M St., 3259-61 M St. and 2809 M St.)
|
||||||||||||||||||||||||||||||||||||||||
|
The Company has a 50% interest in this unconsolidated portfolio.
|
||||||||||||||||||||||||||||||||||||||||
- 22 -
| Core Portfolio Retail Properties by State - Summary | |||||||||||||||||||||
|
|
Annualized Base Rent
|
||||||||||||||||||||
|
Gross Leasable Area
|
Occupancy
|
per Occupied Square Foot
|
|||||||||||||||||||
|
Ownership
|
Percent of
|
Number of
|
|||||||||||||||||||
| State |
%
|
base rent1
|
properties
|
Anchors 2
|
Shops
|
Total
|
Anchors
|
Shops
|
Total
|
Anchors
|
Shops
|
Totals
|
|||||||||
|
Connecticut
|
90.4%
|
5.2%
|
3
|
163,159
|
71,371
|
234,530
|
100.0%
|
93.3%
|
98.0%
|
$ |
14.72
|
$ |
46.16
|
$ |
30.52
|
||||||
|
Delaware
|
22.2%
|
5.2%
|
3
|
870,321
|
127,389
|
997,710
|
97.1%
|
94.1%
|
96.7%
|
15.59
|
27.74
|
17.10
|
|||||||||
|
District of Columbia
|
80.2%
|
5.2%
|
8
|
24,996
|
83,106
|
108,102
|
100.0%
|
96.8%
|
97.5%
|
12.50
|
52.94
|
43.35
|
|||||||||
|
Illinois
|
100.0%
|
20.6%
|
25
|
68,192
|
245,114
|
313,306
|
100.0%
|
93.0%
|
94.5%
|
16.72
|
58.37
|
48.78
|
|||||||||
|
Indiana
|
100.0%
|
4.2%
|
1
|
123,369
|
112,455
|
235,824
|
100.0%
|
82.2%
|
91.5%
|
10.40
|
18.02
|
13.66
|
|||||||||
|
Massachusetts
|
100.0%
|
5.6%
|
3
|
331,215
|
71,169
|
402,384
|
100.0%
|
81.9%
|
96.8%
|
9.39
|
13.73
|
10.04
|
|||||||||
|
Michigan
|
100.0%
|
4.8%
|
1
|
153,839
|
82,837
|
236,676
|
100.0%
|
94.0%
|
97.9%
|
10.94
|
22.01
|
14.66
|
|||||||||
|
New Jersey
|
90.3%
|
9.2%
|
4
|
261,703
|
156,777
|
418,480
|
92.1%
|
94.1%
|
92.9%
|
15.68
|
21.90
|
18.05
|
|||||||||
|
New York
|
86.9%
|
27.1%
|
14
|
812,081
|
363,671
|
1,175,752
|
93.1%
|
84.6%
|
90.5%
|
14.00
|
35.88
|
20.33
|
|||||||||
|
Ohio
|
100.0%
|
1.9%
|
1
|
58,185
|
67,944
|
126,129
|
100.0%
|
68.7%
|
83.1%
|
9.49
|
16.53
|
12.63
|
|||||||||
|
Pennsylvania
|
100.0%
|
5.3%
|
5
|
576,038
|
116,540
|
692,578
|
95.3%
|
86.1%
|
93.8%
|
4.65
|
18.83
|
7.54
|
|||||||||
|
Rhode Island
|
100.0%
|
2.9%
|
1
|
187,910
|
96,807
|
284,717
|
100.0%
|
59.8%
|
86.3%
|
6.87
|
13.46
|
8.42
|
|||||||||
|
Vermont
|
100.0%
|
2.8%
|
1
|
73,184
|
28,471
|
101,655
|
100.0%
|
100.0%
|
100.0%
|
18.50
|
21.72
|
19.40
|
|||||||||
| Total - Core Portfolio |
100.0%
|
70
|
3,704,192
|
1,623,651
|
5,327,843
|
96.5%
|
87.0%
|
93.6%
|
$ |
12.36
|
$ |
32.91
|
$ |
18.49
|
|||||||
|
Notes:
|
|||||||||||||||||||||
|
General note - The above occupancy and rent amounts do not include space which is currently leased, but for which rent payment has not yet commenced.
|
|||||||||||||||||||||
|
1 The Company's pro-rata share of base rent from joint venture properties has been included for the purpose of calculating percentage of base rent by state.
|
|||||||||||||||||||||
|
2 Anchor GLA includes a total of 254,916 square feet which is not owned by the Company. This square footage has been excluded for calculating annualized base rent per square foot.
|
|||||||||||||||||||||
- 23 -
|
Core Portfolio Top Tenants - Ranked by Annual Base Rent (ABR)
|
|||||||||||
|
Pro-Rata
|
|||||||||||
|
Number of stores
|
Combined
|
Percentage of Total
|
|||||||||
|
in Core
|
Percentage of
|
||||||||||
|
Tenant
|
portfolio
|
GLA
|
Base Rent |
Portfolio GLA
|
Base Rent
|
||||||
|
Supervalu (Shaw's)
|
3
|
175,801
|
$ |
2,420,980
|
4.0%
|
3.4%
|
|||||
|
LA Fitness
|
2
|
100,000
|
2,336,500
|
2.3%
|
3.3%
|
||||||
|
Ann Taylor Loft
|
2
|
14,174
|
2,023,938
|
0.3%
|
2.9%
|
||||||
|
Stop and Shop (Ahold)
|
3
|
155,177
|
1,936,339
|
3.6%
|
2.8%
|
||||||
|
Home Depot
|
3
|
312,718
|
1,794,996
|
7.2%
|
2.6%
|
||||||
|
A&P
|
2
|
77,451
|
1,716,552
|
1.8%
|
2.4%
|
||||||
|
Kohl's
|
1
|
96,363
|
1,650,000
|
2.2%
|
2.3%
|
||||||
|
TJX Companies
|
8
|
209,198
|
1,616,339
|
4.8%
|
2.3%
|
||||||
|
-- TJ Maxx
|
5
|
120,123
|
854,724
|
2.8%
|
1.2%
|
||||||
|
-- Marshalls
|
1
|
37,212
|
158,151
|
0.9%
|
0.2%
|
||||||
|
-- Home Goods
|
2
|
51,863
|
603,464
|
1.2%
|
0.9%
|
||||||
|
Sears
|
4
|
334,669
|
1,428,078
|
7.7%
|
2.0%
|
||||||
|
-- Kmart
|
3
|
273,969
|
1,170,078
|
6.3%
|
1.7%
|
||||||
|
-- Sears
|
1
|
60,700
|
258,000
|
1.4%
|
0.4%
|
||||||
|
Walgreens
|
3
|
37,499
|
1,366,748
|
0.9%
|
1.9%
|
||||||
|
TD Bank
|
2
|
14,700
|
1,028,996
|
0.3%
|
1.5%
|
||||||
|
JP Morgan Chase Bank
|
6
|
30,344
|
1,028,751
|
0.7%
|
1.5%
|
||||||
|
Trader Joe's
|
2
|
19,094
|
961,105
|
0.4%
|
1.4%
|
||||||
|
Dicks Sporting Goods
|
2
|
59,805
|
849,471
|
1.4%
|
1.2%
|
||||||
|
Sleepy's
|
5
|
33,441
|
821,102
|
0.8%
|
1.2%
|
||||||
|
Rite Aid
|
2
|
26,633
|
764,030
|
0.6%
|
1.1%
|
||||||
|
Citibank
|
4
|
13,283
|
685,825
|
0.3%
|
1.0%
|
||||||
|
Pier 1 Imports
|
3
|
24,696
|
677,547
|
0.6%
|
1.0%
|
||||||
|
Dollar Tree
|
7
|
63,816
|
653,499
|
1.5%
|
0.9%
|
||||||
|
Capital One Bank
|
2
|
8,778
|
615,036
|
0.2%
|
0.9%
|
||||||
|
TOTAL
|
66
|
1,807,641
|
$ |
26,375,832
|
41.6%
|
37.5%
|
|||||
|
Notes:
|
|||||||||||
|
1Includes the Company's pro-rata share of unconsolidated joint ventures.
|
|||||||||||
- 24 -
|
Core Portfolio Lease Expirations
|
|||||||||||||||||||||
|
Anchor Tenants
|
Shop Tenants
|
Total Tenants
|
|||||||||||||||||||
|
Gross Leased Area
|
Base Rent
|
Gross Leased Area
|
Base Rent
|
Gross Leased Area
|
Base Rent
|
||||||||||||||||
|
No. of Leases
|
Expiring
|
Percent
|
Percent
|
No. of Leases
|
Expiring
|
Percent
|
Percent
|
No. of Leases
|
Expiring
|
Percent
|
Percent
|
||||||||||
|
Year
|
Expiring
|
SF
|
of Total
|
PSF
|
of Total
|
Expiring
|
SF
|
of Total
|
PSF
|
of Total
|
Expiring
|
SF
|
of Total
|
PSF
|
of Total
|
||||||
|
M to M1
|
-
|
-
|
-
|
-
|
-
|
8
|
13,168
|
0.9%
|
$ 24.39
|
0.7%
|
8
|
13,168
|
0.3%
|
$ 24.39
|
0.4%
|
||||||
|
2013
|
7
|
281,204
|
8.5%
|
11.25
|
7.7%
|
41
|
106,953
|
7.6%
|
24.55
|
5.7%
|
48
|
388,157
|
8.2%
|
14.92
|
6.6%
|
||||||
|
2014
|
8
|
319,165
|
9.6%
|
10.48
|
8.1%
|
64
|
237,283
|
16.8%
|
30.02
|
15.3%
|
72
|
556,448
|
11.8%
|
18.81
|
12.0%
|
||||||
|
2015
|
6
|
274,639
|
8.3%
|
13.96
|
9.3%
|
40
|
152,773
|
10.8%
|
22.83
|
7.5%
|
46
|
427,412
|
9.0%
|
17.13
|
8.4%
|
||||||
|
2016
|
7
|
272,962
|
8.2%
|
10.58
|
7.0%
|
53
|
240,375
|
17.0%
|
23.96
|
12.4%
|
60
|
513,337
|
10.8%
|
16.85
|
9.9%
|
||||||
|
2017
|
6
|
311,806
|
9.4%
|
11.80
|
9.0%
|
41
|
178,491
|
12.6%
|
35.45
|
13.6%
|
47
|
490,297
|
10.4%
|
20.41
|
11.4%
|
||||||
|
2018
|
3
|
330,649
|
10.0%
|
11.39
|
9.2%
|
28
|
110,953
|
7.9%
|
34.48
|
8.2%
|
31
|
441,602
|
9.3%
|
17.19
|
8.7%
|
||||||
|
2019
|
6
|
136,521
|
4.1%
|
8.44
|
2.8%
|
17
|
44,335
|
3.1%
|
52.06
|
5.0%
|
23
|
180,856
|
3.8%
|
19.13
|
4.0%
|
||||||
|
2020
|
5
|
329,713
|
9.9%
|
12.08
|
9.7%
|
18
|
54,655
|
3.9%
|
32.74
|
3.9%
|
23
|
384,368
|
8.1%
|
15.02
|
6.6%
|
||||||
|
2021
|
8
|
310,001
|
9.3%
|
11.69
|
8.8%
|
16
|
81,188
|
5.7%
|
28.05
|
4.9%
|
24
|
391,189
|
8.3%
|
15.08
|
6.7%
|
||||||
|
2022
|
2
|
69,837
|
2.1%
|
26.15
|
4.4%
|
23
|
96,644
|
6.8%
|
34.49
|
7.2%
|
25
|
166,481
|
3.5%
|
30.99
|
5.9%
|
||||||
|
2023
|
2
|
98,805
|
3.0%
|
12.61
|
3.0%
|
7
|
33,477
|
2.4%
|
32.37
|
2.3%
|
9
|
132,282
|
2.8%
|
17.61
|
2.7%
|
||||||
|
Thereafter
|
12
|
585,200
|
17.6%
|
14.60
|
20.8%
|
11
|
61,878
|
4.4%
|
100.37
|
13.4%
|
23
|
647,078
|
13.7%
|
22.80
|
16.9%
|
||||||
|
Total
|
72
|
3,320,502
|
100.0%
|
$ 12.36
|
100.0%
|
367
|
1,412,173
|
100.0%
|
$ 32.91
|
100.0%
|
439
|
4,732,675
|
100.0%
|
$ 18.49
|
100.0%
|
||||||
|
|
|||||||||||||||||||||
|
254,916
|
Anchor GLA Owned by Tenants
|
254,916
|
Anchor GLA Owned by Tenants
|
||||||||||||||||||
|
128,774
|
Total Vacant
|
211,478
|
Total Vacant
|
340,252
|
Total Vacant
|
||||||||||||||||
|
3,704,192
|
Total Square Feet
|
1,623,651
|
Total Square Feet
|
5,327,843
|
Total Square Feet
|
||||||||||||||||
|
Notes:
|
|||||||||||||||||||||
|
1 Leases currently under month to month or in process of renewal
|
|||||||||||||||||||||
- 25 -
|
Core Portfolio - New and Renewal Rent Spreads 1
|
|||||
|
Period ended
|
|||||
|
March 31, 2013
|
|||||
|
Cash2
|
GAAP3
|
||||
|
New leases
|
|||||
|
Number of new leases executed
|
3
|
3
|
|||
|
GLA
|
11,676
|
11,676
|
|||
|
New base rent
|
$82.58
|
$109.29
|
|||
|
Previous base rent (and percentage rent)
|
$72.31
|
$72.24
|
|||
|
Percentage growth in base rent
|
14.2%
|
51.3%
|
|||
|
Average cost per square foot
|
$40.05
|
$40.05
|
|||
|
Weighted Average Lease Term (years)
|
11.9
|
11.9
|
|||
|
Renewal leases
|
|||||
|
Number of renewal leases executed
|
13
|
13
|
|||
|
GLA
|
75,493
|
75,493
|
|||
|
New base rent
|
$17.50
|
$17.71
|
|||
|
Expiring base rent (and percentage rent)
|
$17.26
|
$16.90
|
|||
|
Percentage growth in base rent
|
1.4%
|
4.8%
|
|||
|
Average cost per square foot
|
$0.06
|
$0.06
|
|||
|
Weighted Average Lease Term (years)
|
4.2
|
4.2
|
|||
|
Total new and renewal Leases
|
|||||
|
Number of new and renewal leases executed
|
16
|
16
|
|||
|
GLA commencing
|
87,169
|
87,169
|
|||
|
New base rent
|
$26.22
|
$29.98
|
|||
|
Expiring base rent (and percentage rent)
|
$24.63
|
$24.31
|
|||
|
Percentage growth in base rent
|
6.4%
|
23.3%
|
|||
|
Average cost per square foot
|
$5.42
|
$5.42
|
|||
|
Weighted Average Lease Term (years)
|
5.2
|
5.2
|
|||
|
Notes:
|
|||||
|
1Based on lease execution dates. Does not include leased square footage and costs
|
|||||
|
related to first generation space and the Company's major redevelopment
|
|||||
|
projects; renewal leases include exercised options.
|
|||||
|
2Rents have not been calculated on a straight-line basis. Previous/expiring rent is that as of time
|
|||||
|
of expiration and includes any percentage rent paid as well. New rent is that which is paid at commencement.
|
|||||
|
3Rents are calculated on a straight-line basis.
|
|||||
- 26 -
|
Core Portfolio Capital Expenditures
|
||||||||||||
|
Current Quarter
|
||||||||||||
| Current Quarter | ||||||||||||
| 3 months ended | Prior Year ended | |||||||||||
| March 31, 2013 | December 31, 2012 | |||||||||||
|
Leasing Commissions
|
$ |
647
|
$ |
1,916
|
||||||||
|
Tenant Improvements
|
1,192
|
4,274
|
||||||||||
|
Capital Expenditures
|
46
|
1,523
|
||||||||||
|
Total Capital Expenditures
|
$ |
1,885
|
$ |
7,713
|
||||||||
- 27 -
|
Property Demographics - Core
|
|||||||||||||||
|
3-Mile Radius2
|
|||||||||||||||
| Base |
Total
|
Total
|
#
|
Median HH | Avg. HH | ||||||||||
|
Property
|
City
|
State
|
Rent |
GLA
|
Pop.
|
HH
|
Income | Income | |||||||
|
Core
|
|||||||||||||||
|
239 Greenwich Avenue
|
Greenwich
|
CT
|
$ |
1,554,663
|
16,834
|
66,764
|
24,760
|
$ |
126,648
|
$ |
180,475
|
||||
|
Elmwood Park Shopping Center
|
Elmwood Park
|
NJ
|
3,635,326
|
149,262
|
254,598
|
84,884
|
59,534
|
70,827
|
|||||||
|
A & P Shopping Plaza
|
Boonton
|
NJ
|
1,344,488
|
62,741
|
46,839
|
17,923
|
103,943
|
129,441
|
|||||||
|
Village Commons Shopping Center
|
Smithtown
|
NY
|
2,556,308
|
87,330
|
66,766
|
23,288
|
111,019
|
137,242
|
|||||||
|
The Branch Plaza
|
Smithtown
|
NY
|
2,579,339
|
126,273
|
66,916
|
23,389
|
110,173
|
136,382
|
|||||||
|
Amboy Road
|
Staten Island
|
NY
|
1,887,705
|
63,290
|
147,590
|
54,454
|
87,821
|
103,110
|
|||||||
|
Bartow Avenue
|
Bronx
|
NY
|
420,687
|
14,676
|
571,167
|
212,683
|
47,950
|
59,131
|
|||||||
|
Pacesetter Park Shopping Center
|
Pomona
|
NY
|
1,179,819
|
97,583
|
35,902
|
11,177
|
106,212
|
124,240
|
|||||||
|
LA Fitness
|
Staten Island
|
NY
|
1,391,500
|
55,000
|
121,318
|
43,079
|
78,203
|
90,627
|
|||||||
|
West 54th Street
|
Manhattan
|
NY
|
1,360,838
|
5,782
|
1,223,652
|
627,833
|
89,958
|
147,056
|
|||||||
|
East 17th Street
|
Manhattan
|
NY
|
625,000
|
10,382
|
1,059,535
|
542,170
|
91,411
|
144,163
|
|||||||
|
Crossroads Shopping Center
|
White Plains
|
NY
|
5,061,806
|
309,523
|
108,529
|
42,787
|
93,274
|
125,433
|
|||||||
|
Third Avenue
|
Yonkers
|
NY
|
666,631
|
40,320
|
1,218,498
|
437,804
|
35,045
|
51,736
|
|||||||
|
Mercer Street
|
Manhattan
|
NY
|
394,655
|
3,375
|
923,759
|
452,623
|
85,085
|
129,584
|
|||||||
|
4401 White Plains Road
|
White Plains
|
NY
|
623,884
|
3,000
|
565,820
|
212,940
|
52,461
|
66,174
|
|||||||
|
Town Line Plaza
|
Rocky Hill
|
CT
|
1,642,985
|
206,346
|
46,398
|
19,516
|
78,060
|
91,541
|
|||||||
|
Methuen Shopping Center
|
Methuen
|
MA
|
1,027,936
|
130,021
|
93,621
|
33,353
|
51,101
|
60,867
|
|||||||
|
Crescent Plaza
|
Brockton
|
MA
|
1,750,365
|
218,137
|
98,732
|
35,274
|
57,418
|
66,869
|
|||||||
|
Cambridge
|
Cambridge
|
MA
|
1,130,470
|
54,226
|
489,136
|
215,122
|
68,158
|
97,306
|
|||||||
|
New Loudon Center
|
Latham
|
NY
|
1,959,124
|
255,673
|
45,708
|
18,694
|
65,042
|
78,848
|
|||||||
|
Walnut Hill Plaza
|
Woonsocket
|
RI
|
2,069,763
|
284,717
|
63,856
|
25,805
|
56,673
|
65,553
|
|||||||
|
The Gateway Shopping Center
|
So. Burlington
|
VT
|
1,972,173
|
101,655
|
50,684
|
19,217
|
51,090
|
66,456
|
|||||||
|
Hobson West Plaza
|
Naperville
|
IL
|
1,149,510
|
99,137
|
124,307
|
43,292
|
107,747
|
133,753
|
|||||||
|
Clark & Diversey
|
Chicago
|
IL
|
866,302
|
19,265
|
403,737
|
217,875
|
74,156
|
112,282
|
|||||||
- 28 -
|
Property Demographics - Core (continued)
|
|||||||||||||||
|
3-Mile Radius2
|
|||||||||||||||
| Base |
Total
|
Total
|
#
|
Median HH | Avg. HH | ||||||||||
|
Property
|
City
|
State
|
Rent |
GLA
|
Pop.
|
HH
|
Income | Income | |||||||
|
651-671 West Diversey
|
Chicago
|
IL
|
$ |
1,896,925
|
46,259
|
406,188
|
218,945
|
$ |
74,095
|
$ |
112,128
|
||||
|
Chicago Urban/Street Retail Portfolio1
|
Chicago
|
IL
|
4,509,105
|
115,017
|
434,100
|
230,477
|
76,442
|
111,255
|
|||||||
|
930 North Rush St
|
Chicago
|
IL
|
1,147,368
|
2,930
|
322,469
|
180,483
|
80,823
|
123,146
|
|||||||
|
Merrillville Plaza
|
Hobart
|
IN
|
2,948,421
|
235,824
|
28,084
|
11,444
|
51,584
|
58,223
|
|||||||
|
Bloomfield Town Square
|
Bloomfield Hills
|
MI
|
3,396,624
|
236,676
|
56,262
|
22,488
|
70,867
|
102,286
|
|||||||
|
Mad River Station
|
Dayton
|
OH
|
1,323,959
|
126,129
|
63,784
|
27,917
|
58,431
|
70,473
|
|||||||
|
Marketplace of Absecon
|
Absecon
|
NJ
|
1,337,507
|
104,762
|
32,818
|
11,478
|
62,164
|
74,221
|
|||||||
|
Brandywine/Mkt Sq./Naamans Rd 3
|
Wilmington
|
DE
|
16,501,914
|
997,710
|
506,735
|
195,267
|
73,167
|
91,259
|
|||||||
|
Mark Plaza
|
Edwardsville
|
PA
|
240,664
|
106,856
|
88,065
|
37,263
|
37,520
|
47,049
|
|||||||
|
Plaza 422
|
Lebanon
|
PA
|
795,852
|
156,279
|
45,898
|
18,145
|
43,042
|
52,403
|
|||||||
|
Route 6 Plaza
|
Honesdale
|
PA
|
1,050,708
|
175,519
|
45,996
|
18,427
|
97,614
|
119,789
|
|||||||
|
Chestnut Hill
|
Philadelphia
|
PA
|
625,574
|
37,646
|
144,928
|
61,588
|
62,496
|
78,437
|
|||||||
|
Abington Towne Center
|
Abington
|
PA
|
996,012
|
216,278
|
89,061
|
35,063
|
76,999
|
95,632
|
|||||||
|
Georgetown Portfolio
|
Georgetown
|
DC
|
1,812,041
|
27,666
|
310,075
|
155,858
|
85,815
|
118,080
|
|||||||
|
28 Jericho Turnpike
|
Westbury
|
NY
|
1,650,000
|
96,363
|
107,066
|
34,486
|
104,342
|
132,026
|
|||||||
|
Rhode Island Place Shopping Center
|
Washington
|
DC
|
1,622,629
|
57,529
|
336,016
|
153,378
|
65,558
|
87,768
|
|||||||
|
83 Spring Street
|
Manhattan
|
NY
|
623,884
|
3,000
|
963,271
|
475,088
|
85,441
|
130,755
|
|||||||
|
60 Orange Street
|
Bloomfield
|
NJ
|
695,000
|
101,715
|
338,341
|
128,101
|
58,320
|
66,931
|
|||||||
|
639 West Diversey
|
Chicago
|
IL
|
666,091
|
12,557
|
403,961
|
219,828
|
77,275
|
92,129
|
|||||||
|
1739-53 & 1801-03 Connecticut Avenue
|
Washington
|
DC
|
1,135,149
|
22,907
|
333,711
|
162,783
|
84,576
|
111,570
|
|||||||
|
181 Main Street
|
Westport
|
CT
|
845,300
|
11,350
|
46,414
|
17,188
|
160,357
|
196,576
|
|||||||
|
664 N Michigan
|
Chicago
|
IL
|
4,208,688
|
18,141
|
294,108
|
165,234
|
80,658
|
98,142
|
|||||||
|
Total Core 2
|
|||||||||||||||
|
Average - Total
|
$ |
1,851,681
|
110,910
|
271,249
|
125,435
|
$ |
74,079
|
$ |
96,654
|
||||||
|
Weighted Average - Based on base rent
|
242,366
|
110,391
|
$ |
77,652
|
$ |
100,450
|
|||||||||
|
Notes:
|
|||||||||||||||
|
1 Calculations comprised of nineteen individual properties.
|
|||||||||||||||
|
2 Calculations have been pro-rated based on the Company's ownership % in joint ventures.
|
|||||||||||||||
|
3 Calculations based on 10 miles radius2demographics given the unique position of these assets in the market
|
|||||||||||||||
- 29 -
|
Property Demographics - Funds
|
|||||||||||||||
|
3-Mile Radius2
|
|||||||||||||||
| Base |
Total
|
Total
|
#
|
Median HH | Avg. HH | ||||||||||
|
Property
|
City
|
State
|
Rent |
GLA
|
Pop.
|
HH
|
Income | Income | |||||||
|
Fund II
|
|||||||||||||||
|
Pelham Manor Shopping Plaza
|
Westchester
|
NY
|
$ |
5,808,604
|
228,493
|
374,733
|
141,676
|
$ |
57,019
|
$ |
73,516
|
||||
|
400 East Fordham Road
|
Bronx
|
NY
|
10,389,809
|
262,407
|
1,200,592
|
421,615
|
37,257
|
48,075
|
|||||||
|
216th Street
|
Manhattan
|
NY
|
2,574,000
|
60,000
|
935,948
|
329,442
|
37,176
|
55,430
|
|||||||
|
161st Street
|
Bronx
|
NY
|
5,488,062
|
232,252
|
1,251,086
|
444,325
|
32,321
|
47,196
|
|||||||
|
Fund II 2
|
|||||||||||||||
|
Average - Total
|
$ |
6,065,119
|
195,788
|
940,590
|
334,265
|
$ |
40,943
|
$ |
56,054
|
||||||
|
Weighted Average - Based on base rent
|
986,203
|
349,948
|
$ |
40,863
|
$ |
54,748
|
|||||||||
|
Fund III
|
|||||||||||||||
|
Cortlandt Towne Center
|
Mohegan Lake
|
NY
|
$ |
9,521,027
|
639,983
|
49,183
|
17,702
|
$ |
88,812
|
$ |
104,358
|
||||
|
640 Broadway
|
Manhattan
|
NY
|
662,103
|
4,409
|
987,988
|
492,393
|
86,341
|
133,275
|
|||||||
|
New Hyde Park Shopping Center
|
New Hyde Park
|
NY
|
570,423
|
31,431
|
195,564
|
70,172
|
101,624
|
129,444
|
|||||||
|
White City
|
Shrewsbury
|
MA
|
5,408,616
|
256,909
|
101,062
|
40,736
|
52,003
|
64,348
|
|||||||
|
Parkway Crossing
|
Parkville
|
MD
|
1,444,656
|
265,116
|
184,242
|
74,094
|
59,047
|
70,053
|
|||||||
|
Lincoln Road
|
Miami Beach
|
FL
|
3,301,808
|
59,677
|
58,267
|
36,318
|
74,282
|
98,785
|
|||||||
|
Heritage Shops
|
Chicago
|
IL
|
3,127,702
|
95,740
|
289,135
|
155,570
|
76,609
|
116,432
|
|||||||
|
Lincoln Park Center
|
Chicago
|
IL
|
1,631,351
|
62,745
|
438,736
|
235,290
|
77,360
|
116,754
|
|||||||
|
Nostrand Avenue
|
Brooklyn
|
NY
|
1,437,071
|
42,772
|
523,929
|
196,324
|
52,056
|
64,456
|
|||||||
|
Arundel Plaza
|
Glen Burnie
|
MD
|
1,444,656
|
265,116
|
76,060
|
28,613
|
58,913
|
65,941
|
|||||||
|
Fund III 2
|
|||||||||||||||
|
Average - Total
|
$ |
2,854,941
|
172,390
|
290,417
|
134,721
|
$ |
72,705
|
$ |
96,385
|
||||||
|
Weighted Average - Based on base rent
|
176,315
|
80,979
|
$ |
82,585
|
$ |
105,036
|
|||||||||
|
Fund IV
|
|||||||||||||||
|
1701 Belmont Avenue
|
Catonsville
|
MD
|
$ |
936,166
|
58,674
|
109,807
|
43,674
|
$ |
59,150
|
$ |
65,356
|
||||
|
Lincoln Road
|
Miami Beach
|
FL
|
5,259,273
|
54,453
|
58,267
|
36,318
|
74,282
|
98,785
|
|||||||
|
Fund IV 2
|
|||||||||||||||
|
Average - Total
|
$ |
3,097,720
|
56,564
|
84,037
|
39,996
|
$ |
66,716
|
$ |
82,071
|
||||||
|
Weighted Average - Based on base rent
|
65,704
|
37,379
|
$ |
72,098
|
$ |
93,961
|
|||||||||
|
Total - Core and Funds1
|
|||||||||||||||
|
Average - Total
|
$ |
2,310,719
|
124,122
|
309,627
|
137,268
|
$ |
71,563
|
$ |
93,618
|
||||||
|
Weighted Average - Based on base rent
|
278,833
|
121,398
|
$ |
75,711
|
$ |
97,956
|
|||||||||
|
Notes:
|
|||||||||||||||
|
1 Does not include the Kroger/Safeway Portfolio.
|
|||||||||||||||
|
2 Calculations have been pro-rated based on the Company's ownership % in joint ventures.
|
|||||||||||||||
- 30 -
|
Overview of Acadia Strategic Opportunity Funds
|
||||||||||||||||
|
Item
|
FUND I
|
FUND II
|
FUND III
|
FUND IV
|
||||||||||||
|
Date formed
|
September 2001
|
June 2004
|
May 2007
|
May 2012
|
||||||||||||
|
Capital commited
|
$90 million
|
$300 million
|
$475 million
|
$540.6 million
|
||||||||||||
|
(Original was $503 million)
|
||||||||||||||||
|
Capital funded
|
Fully funded
|
Fully funded
|
$341.0 million funded through March 31, 2013
|
$64.6 funded through March 31, 2013
|
||||||||||||
|
Capital returned
|
All original capital and accumulated preference has been paid. Acadia is entitled to a Promote on all future distributions.
|
$84.5 million
|
$166.5 million
|
$0
|
||||||||||||
|
Fund structure
|
||||||||||||||||
|
Equity Contribution and
|
22.22% - Acadia
|
20% - Acadia
|
20% - Acadia
|
23% - Acadia
|
||||||||||||
|
Cash flow distribution:
|
77.78% - Four institutional investors
|
80% - Six institutional investors
|
80% - 14 institutional investors
|
77% - 17 institutional investors
|
||||||||||||
|
Distributions:
|
20% to Acadia once all partners (including Acadia) have received 9% preferred return and return of equity
|
20% to Acadia once all partners (including Acadia) have received 8% preferred return and return of equity
|
20% to Acadia once all partners (including cadia) have received 6% preferred return and return of equity
|
20% to Acadia once all partners (including Acadia) have received 6% preferred return and return of equity
|
||||||||||||
|
Remaining 80% is distributed to all the partners (including Acadia)
|
Remaining 80% is distributed to all the partners (including Acadia)
|
Remaining 80% is distributed to all the partners (including Acadia)
|
Remaining 80% is distributed to all the partners (including Acadia)
|
|||||||||||||
|
All unfunded capital is anticipated to be used to complete existing projects
|
||||||||||||||||
|
Fees to Acadia
|
Priority distribution fee equal to 1.5% of implied capital
|
Priority distribution fee equal to 1.5% of total committed capital
|
Priority distribution fee equal to 1.5% of total committed capital
|
Priority distribution fee equal to 1.5% of total committed capital
|
||||||||||||
|
Priority distribution fee equal to 4% of gross property revenues
|
Priority distribution fee equal to 4% of gross property revenues
|
Priority distribution fee equal to 4% of gross property revenues
|
Property management fee equal to 4% of gross property revenues
|
|||||||||||||
|
Market rate leasing fees
|
Market rate leasing fees
|
Market rate leasing fees
|
Market rate leasing fees
|
|||||||||||||
|
Market rate construction/project management fees
|
Market rate construction/project management fees
|
Market rate construction/project management fees
|
Market rate construction/project management fees
|
|||||||||||||
|
Development fee equal to 3% of total project cost
|
Development fee equal to 3% of total project cost
|
|||||||||||||||
- 31 -
| Opportunity Fund Retail Properties - Detail | ||||||||||||||||||||||||
|
Leased
|
||||||||||||||||||||||||
|
Year
|
Ownership
|
Gross Leasable Area
|
In Place Occupancy
|
Occupancy
|
|
|||||||||||||||||||
|
Anchors
|
Acquired
|
%
|
Anchors
|
Shops
|
Total
|
Anchors
|
Shops
|
Total
|
Total
|
Anchors
|
Shops
|
Total
|
||||||||||||
| Fund I Portfolio Detail | ||||||||||||||||||||||||
| VARIOUS | ||||||||||||||||||||||||
| Total - Fund I |
Kroger/Safeway Portfolio (3 Properties)
|
2003
|
75%
|
97,500
|
-
|
97,500
|
69.2%
|
-
|
69.2%
|
69.2%
|
$ |
4.48
|
$ |
-
|
$ |
4.48
|
||||||||
| Fund II Portfolio Detail | ||||||||||||||||||||||||
| NEW YORK | ||||||||||||||||||||||||
| New York | ||||||||||||||||||||||||
|
Pelham Manor Shopping Plaza
|
BJ's Wholesale Club, PetSmart, Storage Post
|
2004
|
99.1%
|
169,512
|
58,981
|
228,493
|
100.0%
|
78.4%
|
94.4%
|
94.4%
|
$ |
24.82
|
$ |
34.66
|
$ |
26.93
|
||||||||
|
Fordham Place - Retail
|
Walgreens, Best Buy, 24 Hour Fitness, Sears
|
2004
|
99.1%
|
74,899
|
44,547
|
119,446
|
100.0%
|
100.0%
|
100.0%
|
100.0%
|
38.36
|
59.41
|
46.21
|
|||||||||||
|
Fordham Place - Office
|
NYC Dept of Education, PHI, FEGS, Children's Village
|
2004
|
99.1%
|
91,042
|
51,919
|
142,961
|
100.0%
|
100.0%
|
100.0%
|
100.0%
|
34.71
|
32.94
|
34.07
|
|||||||||||
|
216th Street
|
NYC Human Resources Administration
|
2005
|
99.1%
|
60,000
|
-
|
60,000
|
100.0%
|
-
|
100.0%
|
100.0%
|
42.90
|
-
|
42.90
|
|||||||||||
|
161st Street1
|
Various New York City & State agencies
|
2005
|
99.1%
|
107,026
|
125,226
|
232,252
|
100.0%
|
74.4%
|
86.2%
|
93.3%
|
26.50
|
28.45
|
27.41
|
|||||||||||
| Total - Fund II |
502,479
|
280,673
|
783,152
|
100.0%
|
84.0%
|
94.3%
|
96.4%
|
$ |
31.15
|
$ |
36.50
|
$ |
32.86
|
|||||||||||
| Fund III Portfolio Detail | ||||||||||||||||||||||||
| NEW YORK | ||||||||||||||||||||||||
| New York | ||||||||||||||||||||||||
|
Cortlandt Towne Center
|
Wal-Mart, Best Buy, A&P
|
2009
|
100.0%
|
472,901
|
167,082
|
639,983
|
95.6%
|
82.0%
|
92.1%
|
92.1%
|
$ |
13.94
|
$ |
23.46
|
$ |
16.16
|
||||||||
|
640 Broadway
|
Swatch
|
2012
|
50.0%
|
-
|
4,409
|
4,409
|
-
|
73.8%
|
73.8%
|
73.8%
|
-
|
203.54
|
203.54
|
|||||||||||
|
New Hyde Park Shopping Center
|
-
|
2011
|
100.0%
|
16,214
|
15,217
|
31,431
|
0.0%
|
81.9%
|
39.6%
|
82.2%
|
-
|
45.78
|
45.78
|
|||||||||||
| Nostrand Avenue |
-
|
2013
|
100.0%
|
-
|
42,772
|
42,772
|
-
|
76.9%
|
76.9%
|
76.9%
|
-
|
43.67
|
43.67
|
|||||||||||
| NEW ENGLAND | ||||||||||||||||||||||||
| Massachusetts | ||||||||||||||||||||||||
|
White City Shopping Center
|
Shaw's (Supervalu)
|
2010
|
84.0%
|
131,839
|
125,070
|
256,909
|
85.6%
|
88.3%
|
86.9%
|
87.9%
|
15.54
|
33.10
|
24.23
|
|||||||||||
| MID-ATLANTIC | ||||||||||||||||||||||||
| Maryland | ||||||||||||||||||||||||
|
Parkway Crossing
|
Home Depot, Shop Rite, Big Lots
|
2011
|
90.0%
|
192,836
|
67,405
|
260,241
|
100.0%
|
75.4%
|
93.6%
|
93.6%
|
3.65
|
25.12
|
8.13
|
|||||||||||
|
Arundel Plaza
|
Giant Food, Lowe's
|
2012
|
90.0%
|
231,920
|
33,196
|
265,116
|
100.0%
|
78.3%
|
97.3%
|
97.3%
|
3.90
|
20.75
|
5.60
|
|||||||||||
| SOUTHEAST | ||||||||||||||||||||||||
| Florida | ||||||||||||||||||||||||
|
Lincoln Road
|
Starbucks, Sushi Samba
|
2012
|
95.0%
|
-
|
59,677
|
59,677
|
-
|
49.2%
|
49.2%
|
49.2%
|
-
|
112.48
|
112.48
|
|||||||||||
| MIDWEST | ||||||||||||||||||||||||
| Illinois | ||||||||||||||||||||||||
|
Heritage Shops
|
LA Fitness, Loft
|
2011
|
100.0%
|
49,878
|
45,862
|
95,740
|
100.0%
|
63.9%
|
82.7%
|
83.1%
|
21.61
|
69.95
|
39.50
|
|||||||||||
|
Lincoln Park Centre
|
-
|
2012
|
100.0%
|
-
|
62,745
|
62,745
|
-
|
59.8%
|
59.8%
|
59.8%
|
-
|
43.51
|
43.51
|
|||||||||||
| Total - Fund III |
1,095,588
|
623,435
|
1,719,023
|
94.9%
|
75.24%
|
87.77%
|
88.7%
|
$ |
10.34
|
$ |
39.10
|
$ |
19.28
|
|||||||||||
| Fund IV Portfolio Detail | ||||||||||||||||||||||||
| MID-ATLANTIC | ||||||||||||||||||||||||
| Maryland | ||||||||||||||||||||||||
|
1701 Belmont Avenue
|
Best Buy
|
2012
|
90.0%
|
58,674
|
-
|
58,674
|
100.0%
|
-
|
100.0%
|
100.0%
|
$ |
15.96
|
$ |
-
|
$ |
15.96
|
||||||||
| SOUTHEAST | ||||||||||||||||||||||||
| Florida | ||||||||||||||||||||||||
|
Lincoln Road
|
-
|
2012
|
95.0%
|
-
|
54,453
|
54,453
|
-
|
98.8%
|
98.8%
|
98.8%
|
-
|
97.80
|
97.80
|
|||||||||||
| Total - Fund IV |
58,674
|
54,453
|
113,127
|
100.0%
|
98.8%
|
99.4%
|
99.4%
|
$ |
15.96
|
$ |
97.80
|
$ |
55.09
|
|||||||||||
| Notes: | ||||||||||||||||||||||||
| General note - The above occupancy and rent amounts do not include space which is currently leased, but for which rent payment has not yet commenced. | ||||||||||||||||||||||||
| The following Fund II, Fund III and Fund IV properties are currently undergoing construction or are in the design phase as further detailed under Redevelopment Projects. | ||||||||||||||||||||||||
|
Property
|
Fund Ownership %
|
|||||||||||||||||||||||
|
Sherman Avenue
|
99.1%
|
|||||||||||||||||||||||
|
City Point
|
94.2%
|
|||||||||||||||||||||||
|
Sheepshead Bay
|
100.0%
|
|||||||||||||||||||||||
|
654 Broadway
|
100.0%
|
|||||||||||||||||||||||
|
Cortlandt Crossing
|
100.0%
|
|||||||||||||||||||||||
|
Broad Hollow Commons
|
100.0%
|
|||||||||||||||||||||||
|
3104 M Street
|
100.0%
|
|||||||||||||||||||||||
|
210 Bowery
|
100.0%
|
|||||||||||||||||||||||
|
1Currently operating, but redevelopment activities have commenced.
|
||||||||||||||||||||||||
- 32 -
|
Opportunity Funds Lease Expirations
|
|||||||||||||||||||||||||||
|
Fund I:
|
|||||||||||||||||||||||||||
|
Anchor Tenants
|
|||||||||||||||||||||||||||
|
Gross Leased Area
|
Base Rent | ||||||||||||||||||||||||||
|
No. of Leases
|
Expiring
|
Percent
|
Percent
|
||||||||||||||||||||||||
|
Year
|
Expiring
|
SF
|
of Total
|
PSF
|
of Total
|
||||||||||||||||||||||
|
2014
|
2
|
67,500
|
100.0%
|
$ |
4.48
|
100.0%
|
|||||||||||||||||||||
|
Total
|
2
|
67,500
|
100.0%
|
$ |
4.48
|
100.0%
|
|||||||||||||||||||||
|
30,000
|
Total Vacant
|
||||||||||||||||||||||||||
|
97,500
|
Total Square Feet
|
||||||||||||||||||||||||||
|
Fund II:
|
|||||||||||||||||||||||||||
|
Anchor Tenants
|
Shop Tenants
|
Total Tenants
|
|||||||||||||||||||||||||
|
Gross Leased Area
|
Base Rent |
Gross Leased Area
|
Base Rent |
Gross Leased Area
|
Base Rent | ||||||||||||||||||||||
|
No. of Leases
|
Expiring
|
Percent
|
|
Percent
|
No. of Leases
|
Expiring
|
Percent
|
|
Percent
|
No. of Leases
|
Expiring
|
Percent
|
|
Percent
|
|||||||||||||
|
Year
|
Expiring
|
SF
|
of Total
|
PSF
|
of Total
|
Expiring
|
SF
|
of Total
|
PSF
|
of Total
|
Expiring
|
SF
|
of Total
|
PSF
|
of Total
|
||||||||||||
|
M to M1
|
-
|
-
|
-
|
$ |
-
|
-
|
1
|
9,967
|
4.2%
|
$ |
10.00
|
1.2%
|
1
|
9,967
|
1.3%
|
$ |
10.00
|
0.4%
|
|||||||||
|
2013
|
1
|
107,026
|
21.3%
|
26.50
|
18.1%
|
-
|
-
|
0.0%
|
-
|
0.0%
|
1
|
107,026
|
14.5%
|
26.50
|
11.7%
|
||||||||||||
|
2015
|
-
|
-
|
0.0%
|
-
|
0.0%
|
1
|
5,081
|
2.2%
|
38.00
|
2.2%
|
1
|
5,081
|
0.7%
|
38.00
|
0.8%
|
||||||||||||
|
2016
|
-
|
-
|
0.0%
|
-
|
0.0%
|
2
|
4,649
|
2.0%
|
37.63
|
2.0%
|
2
|
4,649
|
0.6%
|
37.63
|
0.7%
|
||||||||||||
|
2018
|
-
|
-
|
0.0%
|
-
|
0.0%
|
2
|
33,321
|
14.1%
|
34.58
|
13.4%
|
2
|
33,321
|
4.5%
|
34.58
|
4.8%
|
||||||||||||
|
2019
|
1
|
39,705
|
7.9%
|
44.00
|
11.2%
|
3
|
4,743
|
2.0%
|
78.94
|
4.3%
|
4
|
44,448
|
6.0%
|
47.73
|
8.7%
|
||||||||||||
|
2020
|
-
|
-
|
0.0%
|
-
|
0.0%
|
3
|
16,309
|
6.9%
|
33.55
|
6.4%
|
3
|
16,309
|
2.2%
|
33.55
|
2.3%
|
||||||||||||
|
2021
|
1
|
19,958
|
4.0%
|
21.20
|
2.7%
|
2
|
9,710
|
4.1%
|
28.25
|
3.2%
|
3
|
29,668
|
4.0%
|
23.51
|
2.9%
|
||||||||||||
|
2022
|
1
|
47,792
|
9.5%
|
29.92
|
9.1%
|
4
|
27,450
|
11.6%
|
33.15
|
10.6%
|
5
|
75,242
|
10.2%
|
31.10
|
9.6%
|
||||||||||||
|
2023
|
2
|
55,343
|
11.0%
|
29.09
|
10.3%
|
1
|
31,417
|
13.3%
|
36.00
|
13.1%
|
3
|
86,760
|
11.8%
|
31.59
|
11.3%
|
||||||||||||
|
Thereafter
|
|
3
|
232,655
|
46.3%
|
32.68
|
48.6%
|
4
|
93,237
|
39.5%
|
40.26
|
43.6%
|
7
|
325,892
|
44.1%
|
34.85
|
46.8%
|
|||||||||||
|
Total
|
9
|
502,479
|
100.0%
|
$ |
31.15
|
100.0%
|
23
|
235,884
|
100.0%
|
$ |
36.50
|
100.0%
|
32
|
738,363
|
100.0%
|
$ |
32.86
|
100.0%
|
|||||||||
|
-
|
Total Vacant
|
44,789
|
Total Vacant
|
44,789
|
Total Vacant
|
||||||||||||||||||||||
|
502,479
|
Total Square Feet
|
280,673
|
Total Square Feet
|
783,152
|
Total Square Feet
|
||||||||||||||||||||||
|
Fund III:
|
|||||||||||||||||||||||||||
|
Anchor Tenants
|
Shop Tenants
|
Total Tenants
|
|||||||||||||||||||||||||
|
Gross Leased Area
|
Base Rent |
Gross Leased Area
|
Base Rent |
Gross Leased Area
|
Base Rent | ||||||||||||||||||||||
|
No. of Leases
|
Expiring
|
Percent
|
|
Percent
|
|
No. of Leases
|
Expiring
|
Percent
|
|
Percent
|
No. of Leases
|
Expiring
|
Percent
|
|
Percent
|
||||||||||||
|
Year
|
Expiring
|
SF
|
of Total
|
PSF
|
of Total
|
Expiring
|
SF
|
of Total
|
PSF
|
of Total
|
Expiring
|
SF
|
of Total
|
PSF
|
of Total
|
||||||||||||
|
M to M1
|
-
|
-
|
-
|
$ |
-
|
-
|
7
|
18,451
|
3.9%
|
$ |
21.10
|
2.1%
|
7
|
18,451
|
1.2%
|
$ |
21.10
|
1.3%
|
|||||||||
|
2013
|
-
|
-
|
-
|
-
|
-
|
14
|
35,463
|
7.6%
|
37.34
|
7.2%
|
14
|
35,463
|
2.4%
|
37.34
|
4.6%
|
||||||||||||
|
2014
|
2
|
56,379
|
5.4%
|
16.12
|
8.5%
|
21
|
73,067
|
15.6%
|
31.73
|
12.6%
|
23
|
129,446
|
8.6%
|
24.93
|
11.1%
|
||||||||||||
|
2015
|
3
|
81,465
|
7.8%
|
7.02
|
5.3%
|
13
|
26,644
|
5.7%
|
36.85
|
5.4%
|
16
|
108,109
|
7.2%
|
14.37
|
5.3%
|
||||||||||||
|
2016
|
2
|
26,561
|
2.6%
|
8.00
|
2.0%
|
21
|
49,595
|
10.6%
|
39.26
|
10.6%
|
23
|
76,156
|
5.0%
|
28.35
|
7.4%
|
||||||||||||
|
2017
|
2
|
52,131
|
5.0%
|
18.36
|
8.9%
|
13
|
54,065
|
11.5%
|
27.61
|
8.1%
|
15
|
106,196
|
7.0%
|
23.07
|
8.4%
|
||||||||||||
|
2018
|
3
|
287,562
|
27.7%
|
12.54
|
33.5%
|
16
|
61,125
|
13.0%
|
34.04
|
11.3%
|
19
|
348,687
|
23.1%
|
16.31
|
19.5%
|
||||||||||||
|
2019
|
1
|
179,944
|
17.3%
|
4.62
|
7.7%
|
9
|
29,959
|
6.4%
|
71.36
|
11.7%
|
10
|
209,903
|
13.9%
|
14.14
|
10.2%
|
||||||||||||
|
2020
|
-
|
-
|
-
|
-
|
-
|
4
|
9,046
|
1.9%
|
23.60
|
1.2%
|
4
|
9,046
|
0.6%
|
23.60
|
0.7%
|
||||||||||||
|
2021
|
1
|
35,601
|
3.4%
|
10.76
|
3.6%
|
6
|
26,174
|
5.6%
|
37.59
|
5.4%
|
7
|
61,775
|
4.1%
|
22.13
|
4.7%
|
||||||||||||
|
2022
|
1
|
65,028
|
6.3%
|
17.00
|
10.3%
|
11
|
36,188
|
7.7%
|
50.37
|
9.9%
|
12
|
101,216
|
6.7%
|
28.93
|
10.1%
|
||||||||||||
|
2023
|
2
|
38,836
|
3.7%
|
15.49
|
5.6%
|
2
|
19,528
|
4.2%
|
44.06
|
4.7%
|
4
|
58,364
|
3.9%
|
25.05
|
5.0%
|
||||||||||||
|
Thereafter
|
|
3
|
216,153
|
20.8%
|
7.26
|
14.6%
|
8
|
29,767
|
6.3%
|
60.02
|
9.7%
|
11
|
245,920
|
16.3%
|
13.65
|
11.5%
|
|||||||||||
|
Total
|
20
|
1,039,660
|
100.0%
|
$ |
10.34
|
100.0%
|
145
|
469,072
|
100.0%
|
$ |
39.10
|
100.0%
|
165
|
1,508,732
|
100.0%
|
$ |
19.28
|
100.0%
|
|||||||||
|
55,928
|
Total Vacant
|
154,363
|
Total Vacant
|
210,291
|
Total Vacant
|
||||||||||||||||||||||
|
1,095,588
|
Total Square Feet
|
623,435
|
Total Square Feet
|
1,719,023
|
Total Square Feet
|
||||||||||||||||||||||
|
Fund IV:
|
|||||||||||||||||||||||||||
|
Anchor Tenants
|
Shop Tenants
|
Total Tenants
|
|||||||||||||||||||||||||
|
Gross Leased Area
|
Base Rent |
Gross Leased Area
|
Base Rent |
Gross Leased Area
|
Base Rent | ||||||||||||||||||||||
|
No. of Leases
|
Expiring
|
Percent
|
|
Percent
|
No. of Leases
|
Expiring
|
Percent
|
|
Percent
|
No. of Leases
|
Expiring
|
Percent
|
|
Percent
|
|||||||||||||
|
Year
|
Expiring
|
SF
|
of Total
|
PSF
|
of Total
|
Expiring
|
SF
|
of Total
|
PSF
|
of Total
|
Expiring
|
SF
|
of Total
|
PSF
|
of Total
|
||||||||||||
|
M to M1
|
-
|
-
|
-
|
$ |
-
|
-
|
1
|
6,860
|
12.6%
|
$ |
82.43
|
10.8%
|
1
|
6,860
|
6.1%
|
$ |
82.43
|
9.1%
|
|||||||||
|
2013
|
-
|
-
|
-
|
-
|
-
|
4
|
5,736
|
10.5%
|
95.37
|
10.4%
|
4
|
5,736
|
5.1%
|
95.37
|
8.8%
|
||||||||||||
|
2014
|
-
|
-
|
-
|
-
|
-
|
2
|
3,278
|
6.0%
|
127.92
|
8.0%
|
2
|
3,278
|
2.9%
|
127.92
|
6.8%
|
||||||||||||
|
2015
|
-
|
-
|
-
|
-
|
-
|
2
|
2,726
|
5.0%
|
116.92
|
6.1%
|
2
|
2,726
|
2.4%
|
116.92
|
5.1%
|
||||||||||||
|
2016
|
-
|
-
|
-
|
-
|
-
|
1
|
3,625
|
6.7%
|
90.64
|
6.2%
|
1
|
3,625
|
3.2%
|
90.64
|
5.3%
|
||||||||||||
|
2017
|
-
|
-
|
-
|
-
|
-
|
1
|
5,288
|
9.7%
|
38.58
|
3.9%
|
1
|
5,288
|
4.7%
|
38.58
|
3.3%
|
||||||||||||
|
2018
|
-
|
-
|
-
|
-
|
-
|
2
|
1,872
|
3.4%
|
104.61
|
3.7%
|
2
|
1,872
|
1.7%
|
104.61
|
3.2%
|
||||||||||||
|
2019
|
-
|
-
|
-
|
-
|
-
|
2
|
2,588
|
4.8%
|
171.54
|
8.4%
|
2
|
2,588
|
2.3%
|
171.54
|
7.2%
|
||||||||||||
|
2021
|
-
|
-
|
-
|
-
|
-
|
2
|
2,835
|
5.2%
|
148.58
|
8.0%
|
2
|
2,835
|
2.5%
|
148.58
|
6.8%
|
||||||||||||
|
2022
|
-
|
-
|
-
|
-
|
-
|
5
|
16,009
|
29.4%
|
107.39
|
32.7%
|
5
|
16,009
|
14.2%
|
107.39
|
27.7%
|
||||||||||||
|
Thereafter
|
|
1
|
58,674
|
100.0%
|
15.96
|
100.0%
|
1
|
2,961
|
5.4%
|
32.42
|
1.8%
|
2
|
61,635
|
54.5%
|
16.75
|
16.7%
|
|||||||||||
|
Total
|
1
|
58,674
|
100.0%
|
$ |
15.96
|
100.0%
|
23
|
53,778
|
98.8%
|
$ |
97.80
|
100.0%
|
24
|
112,452
|
99.4%
|
$ |
55.09
|
100.0%
|
|||||||||
|
-
|
Total Vacant
|
675
|
Total Vacant
|
675
|
Total Vacant
|
||||||||||||||||||||||
|
58,674
|
Total Square Feet
|
54,453
|
Total Square Feet
|
113,127
|
Total Square Feet
|
||||||||||||||||||||||
|
Notes:
|
|||||||||||||||||||||||||||
|
1 Leases currently under month to month or in process of renewal
|
|||||||||||||||||||||||||||
- 33 -
|
Development Activity
|
|||||||||||||||||||||
|
($ in millions)
|
|||||||||||||||||||||
|
Estimated Sq.Ft.
|
Acquisition & Development Costs
|
Outstanding | |||||||||||||||||||
|
Property
|
Location
|
Upon Completion
|
Leased Rate5
|
Anchors
|
Incurred | Estimated Future Range | Estimated Total Range | Debt | |||||||||||||
|
FUND II
|
|||||||||||||||||||||
|
Under Construction
|
|||||||||||||||||||||
|
City Point1
|
Brooklyn, NY
|
675,000
|
37%2
|
Century 21, Armani Exchange
|
$ |
166.0
|
$ |
84.0
|
to
|
$ |
174.0
|
$ |
250.0
|
to
|
$ |
340.0
|
$ |
225.9
|
|||
|
In Design
|
|||||||||||||||||||||
|
Sherman Plaza
|
New York, NY
|
TBD
|
-
|
TBD
|
$ |
34.8
|
TBD
|
TBD
|
TBD
|
TBD
|
$ |
-
|
|||||||||
|
FUND III
|
|||||||||||||||||||||
|
In Design
|
|||||||||||||||||||||
|
Sheepshead Bay
|
Brooklyn, NY
|
TBD
|
-
|
TBD
|
$ |
22.9
|
TBD
|
TBD
|
TBD
|
TBD
|
$ |
-
|
|||||||||
|
723 N. Lincoln Lane3
|
Miami Beach, FL
|
TBD
|
-
|
TBD
|
6.6
|
TBD
|
TBD
|
TBD
|
TBD
|
- 4
|
|||||||||||
|
Cortlandt Crossing
|
Mohegan Lake, NY
|
150,000 - 170,000
|
-
|
TBD
|
11.4
|
35.6
|
to
|
44.6
|
47.0
|
to
|
56.0
|
-
|
|||||||||
|
3104 M Street NW
|
Washington, D.C.
|
10,000
|
-
|
TBD
|
3.0
|
4.0
|
to
|
5.5
|
7.0
|
to
|
8.5
|
-
|
|||||||||
|
Broad Hollow Commons
|
Farmingdale, NY
|
180,000 - 200,000
|
-
|
TBD
|
11.1
|
38.9
|
to
|
48.9
|
50.0
|
to
|
60.0
|
-
|
|||||||||
|
SUBTOTAL - In Design
|
$ |
55.0
|
TBD
|
TBD
|
TBD
|
TBD
|
$ |
-
|
|||||||||||||
|
FUND IV
|
|||||||||||||||||||||
|
In Design
|
|||||||||||||||||||||
|
210 Bowery
|
New York, NY
|
10,000
|
-
|
TBD
|
$ |
7.5
|
$ |
4.0
|
to
|
$ |
4.5
|
$ |
11.5
|
to
|
$ |
12.0
|
$ |
-
|
|||
|
Notes:
|
|||||||||||||||||||||
|
1 Acquired a leasehold interest in this property. The first 50,000 square feet of the project (Phase 1) has been completed. Construction of the next approximately 625,000 square feet (Phase 2) is underway.
|
|||||||||||||||||||||
|
2 Leased rate calculated on approximately 475,000 rentable square feet.
|
|||||||||||||||||||||
|
3 This property is part of a three-property portfolio. The other two are operating properties.
|
|||||||||||||||||||||
|
4 The loan on Fund III's Lincoln Road Portfolio includes this property as collateral. For the purpose of this schedule, the outstanding debt was not allocated among the Portfolio's three properties.
|
|||||||||||||||||||||
|
5 The leased rate excludes pre-redevelopment tenants.
|
|||||||||||||||||||||
- 34 -
|
Retailer Controlled Property ("RCP") Venture - Overview 1
|
||||||||||||||||
|
Item
|
Description
|
|||||||||||||||
|
Date formed
|
August 2004
|
|||||||||||||||
|
Partnership structure
|
||||||||||||||||
|
Equity Contribution:
|
Up to $300 million of total equity
|
|||||||||||||||
|
Up to 20% ($60 million) - AKR Fund I ($20 million) and Fund II ($40 million)
|
||||||||||||||||
|
80% - Klaff Realty LP and Lubert-Adler
|
||||||||||||||||
|
Cash flow distribution:
|
20% - AKR Funds
|
|||||||||||||||
|
80% - Four institutional investors
|
||||||||||||||||
|
Promote:
|
20% to Klaff once all partners (including Klaff) have received 10% preferred return and return
|
|||||||||||||||
|
of equity (50% of first $40 million of AKR Fund equity is not subject to this promote)
|
||||||||||||||||
|
Remaining 80% is distributed to all the partners (including Klaff)
|
||||||||||||||||
|
RCP Venture - Investments
|
||||||||||||||||
|
The following table summarizes the RCP Venture investments from inception through March 31, 2013
|
||||||||||||||||
|
Distributions
|
||||||||||||||||
|
Years
|
Invested | Current | From |
Equity
|
||||||||||||
|
Investor
|
Investment
|
acquired
|
capital | year-to-date | inception |
Multiple
|
||||||||||
|
Mervyns I and Mervyns II
|
Mervyns
|
2004 through |
|
$ |
33,605
|
$ |
-
|
$ |
49,524
|
1.5x
|
||||||
|
2007
|
||||||||||||||||
|
Mervyns II
|
Albertson’s
|
2006 through
|
23,133
|
-
|
86,791
|
3.8x
|
||||||||||
|
2007
|
||||||||||||||||
|
Fund II and Mervyns II
|
Other investments 2
|
2006 through
|
6,476
|
-
|
7,036
|
1.1x
|
||||||||||
|
2008
|
||||||||||||||||
|
Total
|
$ |
63,214
|
$ |
-
|
$ |
143,351
|
2.3x
|
|||||||||
|
Notes:
|
||||||||||||||||
|
1 The RCP Venture is not a separate AKR Fund, rather it is a venture
|
||||||||||||||||
|
in which AKR, Funds I and II have invested approximately $63 million in equity.
|
||||||||||||||||
|
2Represents investments in Shopko, Marsh and Rex Stores.
|
||||||||||||||||
- 35 -
|
Important Notes
|
|
|
SPECIAL NOTE REGARDING FORWARD-LOOKING STATEMENTS
|
|
|
Certain statements contained in this supplemental disclosure may contain forward-looking statements within the meaning of Section 27A of the Securities Act of 1933 and Section 21E of the Securities and Exchange Act of 1934 and as such may involve known and unknown risks, uncertainties and other factors which may cause the Company's actual results, performance or achievements to be materially different from future results, performance or achievements expressed or implied by such forward-looking statements. Forward-looking statements, which are based on certain assumptions and describe the Company’s future plans, strategies and expectations are generally identifiable by use of the words "may," "will," "should," "expect," "anticipate," "estimate," "believe," "intend" or "project" or the negative thereof or other variations thereon or comparable terminology. Factors which could have a material adverse effect on the operations and future prospects of the Company include, but are not limited to those set forth under the heading "Risk Factors" in the Company's Annual Report on Form 10-K. These risks and uncertainties should be considered in evaluating any forward-looking statements contained or incorporated by reference herein.
|
|
|
USE OF FUNDS FROM OPERATIONS AS NON-GAAP FINANCIAL MEASURE
|
|
|
The Company considers funds from operations (“FFO”) as defined by the National Association of Real Estate Investment Trusts (“NAREIT”) to be an appropriate supplemental disclosure of operating performance for an equity REIT due to its widespread acceptance and use within the REIT and analyst communities. FFO is presented to assist investors in analyzing the performance of the Company. It is helpful as it excludes various items included in net income that are not indicative of the operating performance, such as gains (or losses) from sales of property and depreciation and amortization. However, the Company’s method of calculating FFO may be different from methods used by other REITs and, accordingly, may not be comparable to such other REITs. FFO does not represent cash generated from operations as defined by generally accepted accounting principles (“GAAP”) and is not indicative of cash available to fund all cash needs, including distributions. It should not be considered as an alternative to net income for the purpose of evaluating the Company’s performance or to cash flows as a measure of liquidity. Consistent with the NAREIT definition, the Company defines FFO as net income (computed in accordance with GAAP), excluding gains (or losses) from sales of depreciated property, plus depreciation and amortization, and after adjustments for unconsolidated partnerships and joint ventures. In addition, the Company also discloses FFO as adjusted to include the extraordinary gain from its RCP investment in Albertson's. The Company believes that income or gains derived from its RCP investments, including its investment in Albertson's, are private-equity investments and, as such, should be treated as operating income and therefore FFO. The Company believes that this supplement adjustment more appropriately reflects the results of its operations. The Company also provides two other supplemental disclosures of operating performance, adjusted funds from operations ("AFFO") and funds available for distribution ("FAD"). The Company defines AFFO as FFO adjusted for straight line rent, non-real estate depreciation, amortization of finance costs and costs of management contracts, tenant improvements, leasing commissions and capital expenditures. The Company defines FAD as AFFO adjusted for scheduled debt principal payments.
|
|
|
USE OF EBITDA AND NOI AS NON-GAAP FINANCIAL MEASURES
|
|
|
EBITDA and NOI are widely used financial measures in many industries, including the REIT industry, and are presented to assist investors and analysts in analyzing the performance of the Company. They are helpful as they exclude various items included in net income that are not indicative of operating performance, such as gains (or losses) from sales of property and depreciation and amortization and is used in computing various financial ratios as a measure of operational performance. The Company computes EBITDA as the sum of net income before extraordinary items plus interest expense, depreciation, income taxes and amortization, less any gains (losses including impairment charges) on the sale of income producing properties. The Company computes NOI by taking the difference between Property Revenues and Property Expenses as detailed in this reporting supplement. The Company’s method of calculating EBITDA and NOI may be different from methods used by other REITs and, accordingly, may not be comparable to such other REITs. EBITDA and NOI do not represent cash generated from operations as defined by GAAP and are not indicative of cash available to fund all cash needs, including distributions. They should not be considered as an alternative to net income for the purpose of evaluating the Company’s performance or to cash flows as a measure of liquidity.
|
|
- 36 -