UNITED STATES
SECURITIES AND EXCHANGE COMMISSION
Washington, D.C. 20549
FORM N-CSR
CERTIFIED SHAREHOLDER REPORT OF REGISTERED MANAGEMENT INVESTMENT COMPANIES
Investment Company Act file number: 811-07478
| Name of Fund: | BlackRock MuniVest Fund II, Inc. (MVT) |
| Fund Address: | 100 Bellevue Parkway, Wilmington, DE 19809 |
Name and address of agent for service: John M. Perlowski, Chief Executive Officer, BlackRock MuniVest Fund II, Inc., 55 East 52nd Street, New York, NY 10055
Registrant’s telephone number, including area code: (800) 882-0052, Option 4
Date of fiscal year end: 04/30/2022
Date of reporting period: 04/30/2022
Item 1 – Report to Stockholders
(a) The Report to Shareholders is attached herewith.
|
|
APRIL 30, 2022 |

|
|
2022 Annual Report
| |
BlackRock MuniAssets Fund, Inc. (MUA)
BlackRock Municipal Income Fund, Inc. (MUI)
BlackRock MuniHoldings Fund, Inc. (MHD)
BlackRock MuniVest Fund II, Inc. (MVT)
|
Not FDIC Insured • May Lose Value • No Bank Guarantee
|
Dear Shareholder,
The 12-month reporting period as of April 30, 2022 saw the emergence of significant challenges that disrupted the economic recovery and strong financial markets which characterized 2021. The U.S. economy shrank in the first quarter of 2022, ending the run of robust growth which followed reopening and the development of the COVID-19 vaccines. Rapid changes in consumer spending led to supply constraints and elevated inflation, which reached a 40-year high. Moreover, while the foremost effect of Russia’s invasion of Ukraine has been a severe humanitarian crisis, the invasion has presented challenges for both investors and policymakers.
Equity prices were mixed but mostly down, as persistently high inflation drove investors’ expectations for higher interest rates, particularly weighing on relatively high valuation growth stocks and economically sensitive small-capitalization stocks. Overall, small-capitalization U.S. stocks declined, while large-capitalization U.S. stocks were nearly flat. Both emerging market stocks and international equities from developed markets fell significantly, pressured by rising interest rates and a strengthening U.S. dollar.
The 10-year U.S. Treasury yield (which is inversely related to bond prices) rose during the reporting period as increasing inflation drove investors’ expectations for higher interest rates. The corporate bond market also faced inflationary headwinds, and increasing uncertainty led to higher corporate bond spreads (the difference in yield between U.S. Treasuries and similarly-dated corporate bonds).
The U.S. Federal Reserve (the “Fed”), acknowledging that inflation is growing faster than expected, raised interest rates in March 2022, the first increase of this business cycle. Furthermore, the Fed wound down its bond-buying programs and raised the prospect of reversing the flow and reducing its balance sheet. Continued high inflation and the Fed’s new tone led many analysts to anticipate that the Fed will continue to raise interest rates multiple times throughout the year.
Looking ahead, however, the horrific war in Ukraine has significantly clouded the outlook for the global economy, leading to major volatility in energy and metal markets. Sanctions on Russia, Europe’s top energy supplier, and general wartime disruption are likely to drive already-high commodity prices even higher. We believe sharp increases in energy prices will exacerbate inflationary pressure while also constraining economic growth. Combating inflation without stifling a recovery, while buffering against ongoing supply and price shocks amid the ebb and flow of the pandemic, will be an especially challenging environment for setting effective monetary policy. Despite the likelihood of more rate increases on the horizon, we believe the Fed will err on the side of protecting employment, even at the expense of higher inflation.
In this environment, we favor an overweight to equities, as valuations have become more attractive and inflation-adjusted interest rates remain low. Sectors that are better poised to manage the transition to a lower-carbon world, such as technology and healthcare, are particularly attractive in the long term. We favor U.S. equities due to strong earnings momentum, while Japanese equities should benefit from supportive monetary and fiscal policy. We are underweight credit overall, but inflation-protected U.S. Treasuries, Asian fixed income, and emerging market local-currency bonds offer potential opportunities for additional yield. We believe that international diversification and a focus on sustainability and quality can help provide portfolio resilience.
Overall, our view is that investors need to think globally, extend their scope across a broad array of asset classes, and be nimble as market conditions change. We encourage you to talk with your financial advisor and visit blackrock.com for further insight about investing in today’s markets.
Sincerely,

Rob Kapito
President, BlackRock Advisors, LLC

Rob Kapito
President, BlackRock Advisors, LLC
| Total Returns as of April 30, 2022 | ||||||||
| 6-Month | 12-Month | |||||||
| U.S. large cap equities |
(9.65 | )% | 0.21 | % | ||||
| U.S. small cap equities |
(18.38 | ) | (16.87 | ) | ||||
| International equities |
(11.80 | ) | (8.15 | ) | ||||
| Emerging market equities |
(14.15 | ) | (18.33 | ) | ||||
| 3-month Treasury bills |
0.07 | 0.08 | ||||||
| U.S. Treasury securities |
(10.29 | ) | (8.86 | ) | ||||
| U.S. investment grade bonds |
(9.47 | ) | (8.51 | ) | ||||
| Tax-exempt municipal bonds |
(7.90 | ) | (7.88 | ) | ||||
| U.S. high yield bonds |
(7.40 | ) | (5.22 | ) | ||||
| Past performance is not an indication of future results. Index performance is shown for illustrative purposes only. You cannot invest directly in an index. |
| |||||||
| 2 | T H I S P A G E I S N O T P A R T O F Y O U R F U N D R E P O R T |
| Page | ||
| 2 | ||
| Annual Report: |
||
| 4 | ||
| 5 | ||
| 5 | ||
| 6 | ||
| Financial Statements: |
||
| 18 | ||
| 66 | ||
| 67 | ||
| 68 | ||
| 70 | ||
| 72 | ||
| 76 | ||
| 89 | ||
| 90 | ||
| 91 | ||
| 100 | ||
| 102 | ||
| 103 | ||
| 107 | ||
| 110 | ||
| 3 |
Municipal Market Overview For the Reporting Period Ended April 30, 2022
Municipal Market Conditions
Municipal bonds posted negative total returns during the period alongside rising interest rates spurred by waning COVID-19 variant fears, a strong domestic economy, surging inflation, the first Fed rate hike since 2018, and heightened expectations for future interest rate raises. Although credit fundamentals remained strong, bolstered by robust revenue growth and elevated fund balances, supply-and-demand technicals became challenged late in the period and drove considerable municipal underperformance versus comparable U.S. Treasuries. Shorter-duration (i.e., less sensitive to interest rates) and lower-rated bonds performed best, though higher-rated bonds outperformed more recently.
| During the 12 months ended April 30, 2022, municipal bond funds experienced net outflows totaling $2 billion (based on data from the Investment Company Institute). The post-pandemic inflow cycle, which spanned 92-weeks and garnered $149 billion, ended abruptly in early 2022 as performance turned starkly negative. As a result, elevated bid-wanted activity weighed on the market as investors raised cash to meet redemptions. At the same time, the market absorbed $446 billion in issuance, slightly below the $448 billion issued during the prior 12-months. New issue oversubscriptions waned late in the period as sentiment turned less constructive. |
Bloomberg Municipal Bond Index Total Returns as of April 30, 2022 6 months: (7.90)% 12 months: (7.88)% | |||
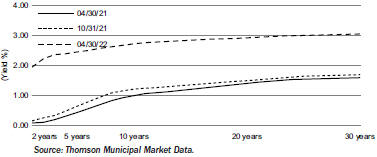
A Closer Look at Yields
| AAA Municipal Yield Curves
|
From April 30, 2021 to April 30, 2022, yields on AAA-rated 30-year municipal bonds increased by 146 basis points (“bps”) from 1.59% to 3.05%, while ten-year rates increased by 173 bps from 0.99% to 2.72% and five-year rates increased by 202 bps from 0.43% to 2.45% (as measured by Thomson Municipal Market Data). As a result, the municipal yield curve flattened over the 12-month period with the spread between two- and 30-year maturities flattening by 66 bps, lagging the 186 bps of flattening experienced in the U.S. Treasury curve.
After maintaining historically tight valuations for most of the reporting period, the selloff experienced in 2022 has restored value to the asset class. Municipal-to- Treasury ratios are through their 5-year averages in the intermediate and long-end of the curve, while yields on municipals exceed yields on both the S&P 500 and investment-grade corporates on an after-tax basis. |
Financial Conditions of Municipal Issuers
Buoyed by successive federal aid injections, vaccine distribution, and the re-opening of the economy, states and many local governments experienced revenue growth above forecasts in 2021 and continue to do so in 2022. While solid revenue collections, particularly sales and personal income tax receipts, continue to grow in this inflationary environment, higher wages, energy costs, and interest rates in the post-Covid recovery will pressure state and local government costs. While overall credit fundamentals are expected to remain sturdy, prolonged inflation could hurt consumer spending and eventually become a headwind to economic growth and employment expansion. At this point, tax receipts could come under pressure, although states with significant oil and gas production would benefit. While municipal utilities typically benefit from autonomous rate-setting that allows them to adjust for rising fuel costs, rising commodity prices over a prolonged period could test affordability and the political will to raise rates to balance operations. State housing authority bonds, flagship universities, and strong national and regional health systems may also be pressured but are better poised to absorb the impact of the economic shock. Critical providers (safety net hospitals, mass transit systems, airports) with limited resources may still experience fiscal strain from the economic fallout from rising inflation, but aid and the re-opening of the economy will continue to support operating results through 2022. Work-from-home policies remain headwinds for mass transit farebox revenue and commercial real estate values. BlackRock anticipates that a small subset of the market, mainly non-rated stand-alone projects, will remain susceptible to credit deterioration.
The opinions expressed are those of BlackRock as of April 30, 2022 and are subject to change at any time due to changes in market or economic conditions. The comments should not be construed as a recommendation of any individual holdings or market sectors. Investing involves risk including loss of principal. Bond values fluctuate in price so the value of your investment can go down depending on market conditions. Fixed income risks include interest-rate and credit risk. Typically, when interest rates rise, there is a corresponding decline in bond values. Credit risk refers to the possibility that the bond issuer will not be able to make principal and interest payments. There may be less information on the financial condition of municipal issuers than for public corporations. The market for municipal bonds may be less liquid than for taxable bonds. Some investors may be subject to Alternative Minimum Tax (“AMT”). Capital gains distributions, if any, are taxable.
The Bloomberg Municipal Bond Index, a broad, market value-weighted index, seeks to measure the performance of the U.S. municipal bond market. All bonds in the index are exempt from U.S. federal income taxes or subject to the AMT. Past performance is not an indication of future results. Index performance is shown for illustrative purposes only. It is not possible to invest directly in an index.
| 4 | 2 0 2 2 B L A C K R O C K A N N U A L R E P O R T T O S H A R E H O L D E R S |
The Benefits and Risks of Leveraging
The Funds may utilize leverage to seek to enhance the distribution rate on, and net asset value (“NAV”) of, their common shares (“Common Shares”). However, there is no guarantee that these objectives can be achieved in all interest rate environments.
In general, the concept of leveraging is based on the premise that the financing cost of leverage, which is based on short-term interest rates, is normally lower than the income earned by a Fund on its longer-term portfolio investments purchased with the proceeds from leverage. To the extent that the total assets of each Fund (including the assets obtained from leverage) are invested in higher-yielding portfolio investments, each Fund’s shareholders benefit from the incremental net income. The interest earned on securities purchased with the proceeds from leverage (after paying the leverage costs) is paid to shareholders in the form of dividends, and the value of these portfolio holdings (less the leverage liability) is reflected in the per share NAV.
To illustrate these concepts, assume a Fund’s Common Shares capitalization is $100 million and it utilizes leverage for an additional $30 million, creating a total value of $130 million available for investment in longer-term income securities. If prevailing short-term interest rates are 3% and longer-term interest rates are 6%, the yield curve has a strongly positive slope. In this case, a Fund’s financing costs on the $30 million of proceeds obtained from leverage are based on the lower short-term interest rates. At the same time, the securities purchased by a Fund with the proceeds from leverage earn income based on longer-term interest rates. In this case, a Fund’s financing cost of leverage is significantly lower than the income earned on a Fund’s longer-term investments acquired from such leverage proceeds, and therefore the holders of Common Shares (“Common Shareholders”) are the beneficiaries of the incremental net income.
However, in order to benefit Common Shareholders, the return on assets purchased with leverage proceeds must exceed the ongoing costs associated with the leverage. If interest and other costs of leverage exceed a Fund’s return on assets purchased with leverage proceeds, income to shareholders is lower than if a Fund had not used leverage. Furthermore, the value of the Funds’ portfolio investments generally varies inversely with the direction of long-term interest rates, although other factors can influence the value of portfolio investments. In contrast, the amount of each Fund’s obligations under its respective leverage arrangement generally does not fluctuate in relation to interest rates. As a result, changes in interest rates can influence the Funds’ NAVs positively or negatively. Changes in the future direction of interest rates are very difficult to predict accurately, and there is no assurance that a Fund’s intended leveraging strategy will be successful.
The use of leverage also generally causes greater changes in each Fund’s NAV, market price and dividend rates than comparable portfolios without leverage. In a declining market, leverage is likely to cause a greater decline in the NAV and market price of a Fund’s Common Shares than if the Fund were not leveraged. In addition, each Fund may be required to sell portfolio securities at inopportune times or at distressed values in order to comply with regulatory requirements applicable to the use of leverage or as required by the terms of leverage instruments, which may cause the Fund to incur losses. The use of leverage may limit a Fund’s ability to invest in certain types of securities or use certain types of hedging strategies. Each Fund incurs expenses in connection with the use of leverage, all of which are borne by Common Shareholders and may reduce income to the Common Shares. Moreover, to the extent the calculation of each Fund’s investment advisory fees includes assets purchased with the proceeds of leverage, the investment advisory fees payable to the Funds’ investment adviser will be higher than if the Funds did not use leverage.
To obtain leverage, each Fund has issued Variable Rate Demand Preferred Shares (“VRDP Shares”) or Variable Rate Muni Term Preferred Shares (“VMTP Shares”) (collectively, “Preferred Shares”) and/or leveraged its assets through the use of tender option bond trusts (“TOB Trusts”) as described in the Notes to Financial Statements.
Under the Investment Company Act of 1940, as amended (the “1940 Act”), each Fund is permitted to issue debt up to 33 1/3% of its total managed assets or equity securities (e.g., Preferred Shares) up to 50% of its total managed assets. A Fund may voluntarily elect to limit its leverage to less than the maximum amount permitted under the 1940 Act. In addition, a Fund may also be subject to certain asset coverage, leverage or portfolio composition requirements imposed by the Preferred Shares’ governing instruments or by agencies rating the Preferred Shares, which may be more stringent than those imposed by the 1940 Act.
If a Fund segregates or designates on its books and records cash or liquid assets having a value not less than the value of a Fund’s obligations under the TOB Trust (including accrued interest), then the TOB Trust is not considered a senior security and is not subject to the foregoing limitations and requirements imposed by the 1940 Act.
Derivative Financial Instruments
The Funds may invest in various derivative financial instruments. These instruments are used to obtain exposure to a security, commodity, index, market, and/or other assets without owning or taking physical custody of securities, commodities and/or other referenced assets or to manage market, equity, credit, interest rate, foreign currency exchange rate, commodity and/or other risks. Derivative financial instruments may give rise to a form of economic leverage and involve risks, including the imperfect correlation between the value of a derivative financial instrument and the underlying asset, possible default of the counterparty to the transaction or illiquidity of the instrument. The Funds’ successful use of a derivative financial instrument depends on the investment adviser’s ability to predict pertinent market movements accurately, which cannot be assured. The use of these instruments may result in losses greater than if they had not been used, may limit the amount of appreciation a Fund can realize on an investment and/or may result in lower distributions paid to shareholders. The Funds’ investments in these instruments, if any, are discussed in detail in the Notes to Financial Statements.
| T H E B E N E F I T S A N D R I S K S O F L E V E R A G I N G / D E R I V A T I V E F I N A N C I A L I N S T R U M E N T S |
5 |
| Fund Summary as of April 30, 2022 | BlackRock MuniAssets Fund, Inc. (MUA) |
Investment Objective
BlackRock MuniAssets Fund, Inc.’s (MUA) (the “Fund”) investment objective is to provide high current income exempt from U.S. federal income taxes by investing primarily in a portfolio of medium- to lower-grade or unrated municipal obligations, the interest on which, in the opinion of bond counsel to the issuer, is exempt from U.S. federal income taxes. The Fund seeks to achieve its investment objective by investing, under normal market conditions, at least 80% of its assets in municipal bonds exempt from U.S. federal income taxes (except that the interest may be subject to the federal alternative minimum tax). The Fund invests at least 65% of its assets in municipal bonds that are rated in the medium to lower rating categories by nationally recognized rating services (for example, Baa or lower by Moody’s Investors Service, Inc. (“Moody’s”) or BBB or lower by S&P Global Ratings, or securities that are unrated but are deemed by the investment adviser to be of comparable quality at the time of investment. The Fund may invest directly in such securities or synthetically through the use of derivatives.
No assurance can be given that the Fund’s investment objective will be achieved.
Fund Information
| Symbol on New York Stock Exchange |
MUA | |
| Initial Offering Date |
June 25, 1993 | |
| Yield on Closing Market Price as of April 30, 2022 ($11.90)(a) |
4.59% | |
| Tax Equivalent Yield(b) |
7.75% | |
| Current Monthly Distribution per Common Share(c) |
$0.0455 | |
| Current Annualized Distribution per Common Share(c) |
$0.5460 | |
| Leverage as of April 30, 2022(d) |
31% | |
| (a) | Yield on closing market price is calculated by dividing the current annualized distribution per share by the closing market price. Past performance is not an indication of future results. |
| (b) | Tax equivalent yield assumes the maximum marginal U.S. federal tax rate of 40.8%, which includes the 3.8% Medicare tax. Actual tax rates will vary based on income, exemptions and deductions. Lower taxes will result in lower tax equivalent yields. |
| (c) | The distribution rate is not constant and is subject to change. |
| (d) | Represents VRDP Shares and TOB Trusts as a percentage of total managed assets, which is the total assets of the Fund, including any assets attributable to VRDP Shares and TOB Trusts, minus the sum of its accrued liabilities. Does not reflect derivatives or other instruments that may give rise to economic leverage. For a discussion of leveraging techniques utilized by the Fund, please see The Benefits and Risks of Leveraging and Derivative Financial Instruments. |
Market Price and Net Asset Value Per Share Summary
| 04/30/22 | 04/30/21 | Change | High | Low | ||||||||||||||||
| Closing Market Price |
$ | 11.90 | $ | 15.26 | (22.02 | )% | $ | 17.46 | $ | 11.70 | ||||||||||
| Net Asset Value |
12.42 | 14.77 | (15.91 | ) | 15.23 | 12.42 | ||||||||||||||
TOTAL RETURN BASED ON A $10,000 INVESTMENT
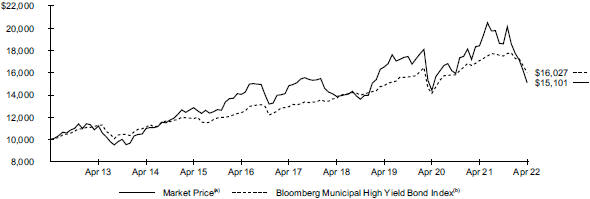
| (a) | Represents the Fund’s closing market price on the NYSE and reflects the reinvestment of dividends and/or distributions at actual reinvestment prices. |
| (b) | An index designed to measure the performance of U.S. dollar-denominated high-yield municipal bonds issued by U.S. states, the District of Columbia, U.S. territories and local governments or agencies. |
| 6 | 2 0 2 2 B L A C K R O C K A N N U A L R E P O R T T O S H A R E H O L D E R S |
| Fund Summary as of April 30, 2022 (continued) | BlackRock MuniAssets Fund, Inc. (MUA) |
Performance
Returns for the period ended April 30, 2022 were as follows:
| Average Annual Total Returns | ||||||||||||
|
|
|
|||||||||||
| 1 Year | 5 Years | 10 Years | ||||||||||
| Fund at NAV(a)(b) |
(11.63 | )% | 2.27 | % | 4.40 | % | ||||||
| Fund at Market Price(a)(b) |
(18.05 | ) | 0.35 | 4.21 | ||||||||
| High Yield Customized Reference Benchmark(c) |
(6.91 | ) | 3.59 | N/A | ||||||||
| Bloomberg Municipal High Yield Bond Index |
(6.23 | ) | 4.35 | 4.83 | ||||||||
| Lipper High Yield Municipal Debt Funds at NAV(d) |
(11.78 | ) | 2.11 | 4.08 | ||||||||
| Lipper High Yield Municipal Debt Funds at Market Price(d) |
(17.01 | ) | 0.95 | 2.87 | ||||||||
| (a) | All returns reflect reinvestment of dividends and/or distributions at actual reinvestment prices. Performance results reflect the Fund’s use of leverage. |
| (b) | The Fund moved from a premium to NAV to a discount during the period, which accounts for the difference between performance based on market price and performance based on NAV. |
| (c) | The High Yield Customized Reference Benchmark is comprised of the Bloomberg Municipal Bond Rated Baa Index (20%), the Bloomberg Municipal Bond: High Yield (non-Investment Grade) Total Return Index (60%) and the Bloomberg Municipal Investment Grade ex BBB Index (20%). Effective October 1, 2021, the Fund changed its reporting benchmark from Lipper High Yield Municipal Debt Funds to the High Yield Customized Reference Benchmark. The investment adviser believes the new benchmark is a more appropriate reporting benchmark for the Fund. The High Yield Customized Reference Benchmark commenced on September 30, 2016. |
| (d) | Average return. Returns reflect reinvestment of dividends and/or distributions at NAV on the ex-dividend date as calculated by Lipper. |
Performance results may include adjustments made for financial reporting purposes in accordance with U.S. generally accepted accounting principles. Past performance is not an indication of future results.
The Fund is presenting the performance of one or more indices for informational purposes only. The Fund is actively managed and does not seek to track or replicate the performance of any index. The index performance shown is not intended to be indicative of the Fund’s investment strategies, portfolio components or past or future performance.
More information about the Fund’s historical performance can be found in the “Closed End Funds” section of blackrock.com.
The following discussion relates to the Fund’s absolute performance based on NAV:
Municipal bonds lost ground in the 12-month period. Rising inflation prompted the Fed to shift toward tighter monetary policy, weighing heavily on the performance of fixed-income assets.
Income contributed to the Fund’s performance, but it was not sufficient to offset the sharp downturn in prices. The Fund’s use of U.S. Treasury futures to manage interest rate risk contributed to results in the rising-rate environment. Holdings in high-quality, short-maturity issues—while producing negative absolute returns—posted smaller losses than the Fund as a whole. The bonds of Puerto Rico Electric Power Authority outperformed, as well. On the other hand, positions in longer-dated bonds generally underperformed due to their above-average interest-rate sensitivity.
The views expressed reflect the opinions of BlackRock as of the date of this report and are subject to change based on changes in market, economic or other conditions. These views are not intended to be a forecast of future events and are no guarantee of future results.
| F U N D S U M M A R Y |
7 |
| Fund Summary as of April 30, 2022 (continued) | BlackRock MuniAssets Fund, Inc. (MUA) |
Overview of the Fund’s Total Investments
SECTOR ALLOCATION
| Sector(a)(b) | 04/30/22 | 04/30/21 | ||||||
| Education |
16 | % | 14 | % | ||||
| County/City/Special District/School District |
14 | 16 | ||||||
| Transportation |
13 | 13 | ||||||
| State |
13 | 13 | ||||||
| Health |
10 | 9 | ||||||
| Utilities |
9 | 12 | ||||||
| Tobacco |
9 | 11 | ||||||
| Housing |
8 | 4 | ||||||
| Corporate |
8 | 8 | ||||||
CALL/MATURITY SCHEDULE
| Calendar Year Ended December 31,(a)(c) | Percentage | |||
| 2022 |
11 | % | ||
| 2023 |
10 | |||
| 2024 |
6 | |||
| 2025 |
5 | |||
| 2026 |
7 | |||
CREDIT QUALITY ALLOCATION
| Credit Rating(a)(d) | 04/30/22 | 04/30/21 | ||||||
| AAA/Aaa |
1 | % | — | % | ||||
| AA/Aa |
15 | 17 | ||||||
| A |
11 | 8 | ||||||
| BBB/Baa |
10 | 12 | ||||||
| BB/Ba |
12 | 9 | ||||||
| B |
3 | 7 | ||||||
| CCC/Caa |
— | (e) | — | |||||
| C |
— | 3 | ||||||
| N/R(f) |
48 | 44 | ||||||
| (a) | Excludes short-term securities. |
| (b) | For Fund compliance purposes, the Fund’s sector classifications refer to one or more of the sector sub-classifications used by one or more widely recognized market indexes or rating group indexes, and/or as defined by the investment adviser. These definitions may not apply for purposes of this report, which may combine such sector sub-classifications for reporting ease. |
| (c) | Scheduled maturity dates and/or bonds that are subject to potential calls by issuers over the next five years. |
| (d) | For financial reporting purposes, credit quality ratings shown above reflect the highest rating assigned by either S&P Global Ratings or Moody’s Investors Service, Inc. if ratings differ. These rating agencies are independent, nationally recognized statistical rating organizations and are widely used. Investment grade ratings are credit ratings of BBB/Baa or higher. Below investment grade ratings are credit ratings of BB/Ba or lower. Investments designated N/R are not rated by either rating agency. Unrated investments do not necessarily indicate low credit quality. Credit quality ratings are subject to change. |
| (e) | Rounds to less than 1% of total investments. |
| (f) | The investment adviser evaluates the credit quality of unrated investments based upon certain factors including, but not limited to, credit ratings for similar investments and financial analysis of sectors and individual investments. Using this approach, the investment adviser has deemed certain of these unrated securities as investment grade quality. As of April 30, 2022 and April 30, 2021, the market value of unrated securities deemed by the investment adviser to be investment grade represents 2% and 2%, respectively, of the Fund’s total investments. |
| 8 | 2 0 2 2 B L A C K R O C K A N N U A L R E P O R T T O S H A R E H O L D E R S |
| Fund Summary as of April 30, 2022 | BlackRock Municipal Income Fund, Inc. (MUI) |
Investment Objective
BlackRock Municipal Income Fund, Inc.’s (MUI) (formerly known as BlackRock Muni Intermediate Duration Fund, Inc.) (the “Fund”) investment objective is to provide common shareholders with high current income exempt from U.S. federal income taxes. The Fund seeks to achieve its investment objective by investing at least 80% of its assets in municipal bonds exempt from U.S. federal income taxes (except that the interest may be subject to the U.S. federal alternative minimum tax). Under normal market conditions, the Fund invests at least 75% of its assets in municipal bonds rated investment grade or, if unrated, are deemed to be of comparable quality by the investment adviser, at the time of investment. The Fund may invest directly in such securities or synthetically through the use of derivatives.
On September 24, 2021, the Board of Directors of the Fund approved a change in the name of the Fund from BlackRock Muni Intermediate Duration Fund, Inc. to BlackRock Municipal Income Fund, Inc. and the elimination of the Fund’s non-fundamental policy to maintain a dollar-weighted average portfolio duration, as calculated by the investment adviser, of three to ten years. Such changes became effective on October 1, 2021.
On September 24, 2021, the Board of Trustees of BlackRock MuniHoldings Investment Quality Fund (MFL) and the Board of Directors of MUI each approved the reorganization of MFL into MUI. The reorganization was approved by each Fund’s shareholders and was completed on April 11, 2022.
No assurance can be given that the Fund’s investment objective will be achieved.
Fund Information
| Symbol on New York Stock Exchange |
MUI | |
| Initial Offering Date |
August 1, 2003 | |
| Yield on Closing Market Price as of April 30, 2022 ($12.26)(a) |
5.29% | |
| Tax Equivalent Yield(b) |
8.94% | |
| Current Monthly Distribution per Common Share(c) |
$0.0540 | |
| Current Annualized Distribution per Common Share(c) |
$0.6480 | |
| Leverage as of April 30, 2022(d) |
43% | |
| (a) | Yield on closing market price is calculated by dividing the current annualized distribution per share by the closing market price. Past performance is not an indication of future results. |
| (b) | Tax equivalent yield assumes the maximum marginal U.S. federal tax rate of 40.8%, which includes the 3.8% Medicare tax. Actual tax rates will vary based on income, exemptions and deductions. Lower taxes will result in lower tax equivalent yields. |
| (c) | The distribution rate is not constant and is subject to change. |
| (d) | Represents VRDP Shares and TOB Trusts as a percentage of total managed assets, which is the total assets of the Fund, including any assets attributable to VRDP Shares and TOB Trusts, minus the sum of its accrued liabilities. Does not reflect derivatives or other instruments that may give rise to economic leverage. For a discussion of leveraging techniques utilized by the Fund, please see The Benefits and Risks of Leveraging and Derivative Financial Instruments. |
Market Price and Net Asset Value Per Share Summary
| 04/30/22 | 04/30/21 | Change | High | Low | ||||||||||||||||
| Closing Market Price |
$ | 12.26 | $ | 15.09 | (18.75 | )% | $ | 16.11 | $ | 12.16 | ||||||||||
| Net Asset Value |
13.45 | 16.11 | (16.51 | ) | 16.29 | 13.45 | ||||||||||||||
TOTAL RETURN BASED ON A $10,000 INVESTMENT
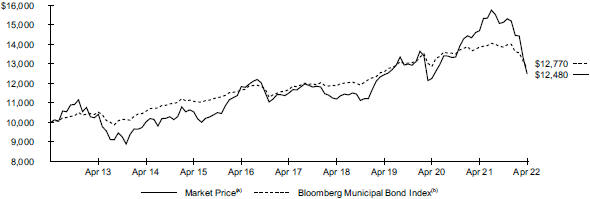
| (a) | Represents the Fund’s closing market price on the NYSE and reflects the reinvestment of dividends and/or distributions at actual reinvestment prices. |
| (b) | An unmanaged index that tracks the U.S. long term tax-exempt bond market, including state and local general obligation bonds, revenue bonds, pre-refunded bonds, and insured bonds. |
| F U N D S U M M A R Y |
9 |
| Fund Summary as of April 30, 2022 (continued) | BlackRock Municipal Income Fund, Inc. (MUI) |
Performance
Returns for the period ended April 30, 2022 were as follows:
| Average Annual Total Returns | ||||||||||||
|
|
|
|||||||||||
| 1 Year | 5 Years | 10 Years | ||||||||||
| Fund at NAV(a)(b) |
(12.79 | )% | 1.83 | % | 3.34 | % | ||||||
| Fund at Market Price(a)(b) |
(15.13 | ) | 1.64 | 2.24 | ||||||||
| National Customized Reference Benchmark(c) |
(7.72 | ) | 2.06 | N/A | ||||||||
| Bloomberg Municipal Bond Index |
(7.88 | ) | 1.80 | 2.47 | ||||||||
| Lipper Intermediate Municipal Debt Funds at NAV(d) |
(10.08 | ) | 1.75 | 2.88 | ||||||||
| Lipper Intermediate Municipal Debt Funds at Market Price(d) |
(12.40 | ) | 1.55 | 2.10 | ||||||||
| (a) | All returns reflect reinvestment of dividends and/or distributions at actual reinvestment prices. Performance results reflect the Fund’s use of leverage. |
| (b) | The Fund’s discount to NAV widened during the period, which accounts for the difference between performance based on market price and performance based on NAV. |
| (c) | The National Customized Reference Benchmark is comprised of the Bloomberg Municipal Bond Index Total Return Index Value Unhedged (90%) and the Bloomberg Municipal Bond: High Yield (non-Investment Grade) Total Return Index (10%). Effective October 1, 2021, the Fund changed its reporting benchmark from Lipper Intermediate Municipal Debt Funds to the National Customized Reference Benchmark. The investment adviser believes the new benchmark is a more appropriate reporting benchmark for the Fund. The National Customized Reference Benchmark commenced on September 30, 2016. |
| (d) | Average return. Returns reflect reinvestment of dividends and/or distributions at NAV on the ex-dividend date as calculated by Lipper. |
Performance results may include adjustments made for financial reporting purposes in accordance with U.S. generally accepted accounting principles. Past performance is not an indication of future results.
The Fund is presenting the performance of one or more indices for informational purposes only. The Fund is actively managed and does not seek to track or replicate the performance of any index. The index performance shown is not intended to be indicative of the Fund’s investment strategies, portfolio components or past or future performance.
More information about the Fund’s historical performance can be found in the “Closed End Funds” section of blackrock.com.
The following discussion relates to the Fund’s absolute performance based on NAV:
Municipal bonds lost ground in the past 12 months. Rising inflation prompted the Fed to shift toward tighter monetary policy, weighing heavily on the performance of fixed-income assets.
The Fund’s long duration positioning detracted from performance at a time of rising yields. (Duration is a measure of interest-rate sensitivity.) Yield curve positioning further detracted, as holdings in bonds with maturities 10 to 15 years lagged, as did those with maturities of 20 years and longer. The Fund’s use of leverage, while augmenting income, amplified the effect of falling prices. Positions in bonds with lower coupons (5% and below) detracted due to their higher interest-rate sensitivity. At the sector level, holdings in transportation, state tax-backed and healthcare issues were the largest detractors.
Portfolio income contributed to performance, as did positions in shorter-dated, pre-refunded bonds. In addition, the Fund’s use of U.S. Treasury futures to manage interest rate risk contributed to results in the rising-rate environment.
The views expressed reflect the opinions of BlackRock as of the date of this report and are subject to change based on changes in market, economic or other conditions. These views are not intended to be a forecast of future events and are no guarantee of future results.
| 10 | 2 0 2 2 B L A C K R O C K A N N U A L R E P O R T T O S H A R E H O L D E R S |
| Fund Summary as of April 30, 2022 (continued) | BlackRock Municipal Income Fund, Inc. (MUI) |
Overview of the Fund’s Total Investments
SECTOR ALLOCATION
| Sector(a)(b) | 04/30/22 | 04/30/21 | ||||||
| Transportation |
31 | % | 24 | % | ||||
| State |
19 | 21 | ||||||
| Health |
14 | 12 | ||||||
| County/City/Special District/School District |
11 | 13 | ||||||
| Education |
9 | 12 | ||||||
| Utilities |
7 | 7 | ||||||
| Corporate |
4 | 4 | ||||||
| Tobacco |
3 | 4 | ||||||
| Housing |
2 | 2 | ||||||
| Other |
— | 1 | ||||||
CALL/MATURITY SCHEDULE
| Calendar Year Ended December 31,(a)(c) | Percentage | |||
| 2022 |
2 | % | ||
| 2023 |
13 | |||
| 2024 |
6 | |||
| 2025 |
6 | |||
| 2026 |
13 | |||
CREDIT QUALITY ALLOCATION
| Credit Rating(a)(d) | 04/30/22 | 04/30/21 | ||||||
| AAA/Aaa |
6 | % | 3 | % | ||||
| AA/Aa |
43 | 33 | ||||||
| A |
32 | 33 | ||||||
| BBB/Baa |
7 | 17 | ||||||
| BB/Ba |
4 | 5 | ||||||
| B |
— | (e) | 1 | |||||
| N/R(f) |
8 | 8 | ||||||
| (a) | Excludes short-term securities. |
| (b) | For Fund compliance purposes, the Fund’s sector classifications refer to one or more of the sector sub-classifications used by one or more widely recognized market indexes or rating group indexes, and/or as defined by the investment adviser. These definitions may not apply for purposes of this report, which may combine such sector sub-classifications for reporting ease. |
| (c) | Scheduled maturity dates and/or bonds that are subject to potential calls by issuers over the next five years. |
| (d) | For financial reporting purposes, credit quality ratings shown above reflect the highest rating assigned by either S&P Global Ratings or Moody’s Investors Service, Inc. if ratings differ. These rating agencies are independent, nationally recognized statistical rating organizations and are widely used. Investment grade ratings are credit ratings of BBB/Baa or higher. Below investment grade ratings are credit ratings of BB/Ba or lower. Investments designated N/R are not rated by either rating agency. Unrated investments do not necessarily indicate low credit quality. Credit quality ratings are subject to change. |
| (e) | Rounds to less than 1% of total investments. |
| (f) | The investment adviser evaluates the credit quality of unrated investments based upon certain factors including, but not limited to, credit ratings for similar investments and financial analysis of sectors and individual investments. Using this approach, the investment adviser has deemed certain of these unrated securities as investment grade quality. As of April 30, 2022 and April 30, 2021, the market value of unrated securities deemed by the investment adviser to be investment grade each represents less than 1% of the Fund’s total investments. |
| F U N D S U M M A R Y |
11 |
| Fund Summary as of April 30, 2022 | BlackRock MuniHoldings Fund, Inc. (MHD) |
Investment Objective
BlackRock MuniHoldings Fund, Inc.’s (MHD) (the “Fund”) investment objective is to provide shareholders with current income exempt from U.S. federal income taxes. The Fund seeks to achieve its investment objective by investing at least 80% of its assets in municipal bonds exempt from U.S. federal income taxes (except that the interest may be subject to the U.S. federal alternative minimum tax). The Fund invests, under normal market conditions, at least 75% of its assets in municipal bonds rated investment grade or, if unrated, are deemed to be of comparable quality by the investment adviser at the time of investment and invests primarily in long-term municipal bonds with a maturity of more than ten years at the time of investment. The Fund may invest directly in such securities or synthetically through the use of derivatives.
No assurance can be given that the Fund’s investment objective will be achieved.
Fund Information
| Symbol on New York Stock Exchange |
MHD | |
| Initial Offering Date |
May 2, 1997 | |
| Yield on Closing Market Price as of April 30, 2022 ($12.87)(a) |
5.64% | |
| Tax Equivalent Yield(b) |
9.53% | |
| Current Monthly Distribution per Common Share(c) |
$0.0605 | |
| Current Annualized Distribution per Common Share(c) |
$0.7260 | |
| Leverage as of April 30, 2022(d) |
41% | |
| (a) | Yield on closing market price is calculated by dividing the current annualized distribution per share by the closing market price. Past performance is not an indication of future results. |
| (b) | Tax equivalent yield assumes the maximum marginal U.S. federal tax rate of 40.8%, which includes the 3.8% Medicare tax. Actual tax rates will vary based on income, exemptions and deductions. Lower taxes will result in lower tax equivalent yields. |
| (c) | The distribution rate is not constant and is subject to change. |
| (d) | Represents VMTP Shares and TOB Trusts as a percentage of total managed assets, which is the total assets of the Fund, including any assets attributable to VMTP Shares and TOB Trusts, minus the sum of its accrued liabilities. Does not reflect derivatives or other instruments that may give rise to economic leverage. For a discussion of leveraging techniques utilized by the Fund, please see The Benefits and Risks of Leveraging and Derivative Financial Instruments. |
Market Price and Net Asset Value Per Share Summary
| 04/30/22 | 04/30/21 | Change | High | Low | ||||||||||||||||
| Closing Market Price |
$ | 12.87 | $ | 16.33 | (21.19 | )% | $ | 17.40 | $ | 12.87 | ||||||||||
| Net Asset Value |
14.27 | 17.30 | (17.51 | ) | 17.70 | 14.27 | ||||||||||||||
TOTAL RETURN BASED ON A $10,000 INVESTMENT
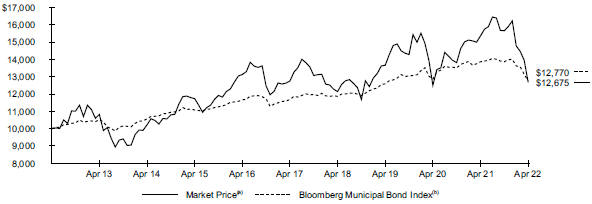
| (a) | Represents the Fund’s closing market price on the NYSE and reflects the reinvestment of dividends and/or distributions at actual reinvestment prices. |
| (b) | An unmanaged index that tracks the U.S. long term tax-exempt bond market, including state and local general obligation bonds, revenue bonds, pre-refunded bonds, and insured bonds. |
| 12 | 2 0 2 2 B L A C K R O C K A N N U A L R E P O R T T O S H A R E H O L D E R S |
| Fund Summary as of April 30, 2022 (continued) | BlackRock MuniHoldings Fund, Inc. (MHD) |
Performance
Returns for the period ended April 30, 2022 were as follows:
| Average Annual Total Returns | ||||||||||||
|
|
|
|||||||||||
| 1 Year | 5 Years | 10 Years | ||||||||||
| Fund at NAV(a)(b) |
(13.64 | )% | 1.72 | % | 3.88 | % | ||||||
| Fund at Market Price(a)(b) |
(17.48 | ) | (0.12 | ) | 2.40 | |||||||
| National Customized Reference Benchmark(c) |
(7.72 | ) | 2.06 | N/A | ||||||||
| Bloomberg Municipal Bond Index |
(7.88 | ) | 1.80 | 2.47 | ||||||||
| Lipper General & Insured Municipal Debt Funds (Leveraged) at NAV(d) |
(11.81 | ) | 2.10 | 3.76 | ||||||||
| Lipper General & Insured Municipal Debt Funds (Leveraged) at Market Price(d) |
(16.63 | ) | 1.62 | 3.09 | ||||||||
| (a) | All returns reflect reinvestment of dividends and/or distributions at actual reinvestment prices. Performance results reflect the Fund’s use of leverage. |
| (b) | The Fund’s discount to NAV widened during the period, which accounts for the difference between performance based on market price and performance based on NAV. |
| (c) | The National Customized Reference Benchmark is comprised of the Bloomberg Municipal Bond Index Total Return Index Value Unhedged (90%) and the Bloomberg Municipal Bond: High Yield (non-Investment Grade) Total Return Index (10%). Effective October 1, 2021, the Fund changed its reporting benchmark from Lipper General & Insured Municipal Debt Funds (Leveraged) to the National Customized Reference Benchmark. The investment adviser believes the new benchmark is a more appropriate reporting benchmark for the Fund. The National Customized Reference Benchmark commenced on September 30, 2016. |
| (d) | Average return. Returns reflect reinvestment of dividends and/or distributions at NAV on the ex-dividend date as calculated by Lipper. |
Performance results may include adjustments made for financial reporting purposes in accordance with U.S. generally accepted accounting principles. Past performance is not an indication of future results.
The Fund is presenting the performance of one or more indices for informational purposes only. The Fund is actively managed and does not seek to track or replicate the performance of any index. The index performance shown is not intended to be indicative of the Fund’s investment strategies, portfolio components or past or future performance.
More information about the Fund’s historical performance can be found in the “Closed End Funds” section of blackrock.com.
The following discussion relates to the Fund’s absolute performance based on NAV:
Municipal bonds lost ground in the 12-month period. Rising inflation prompted the Fed to shift toward tighter monetary policy, weighing heavily on the performance of fixed-income assets.
Income contributed to the Fund’s performance, but it was not sufficient to offset the sharp downturn in prices. The Fund’s use of U.S. Treasury futures to manage interest rate risk contributed to results in the rising-rate environment. Holdings in high-quality, short-maturity bonds—while producing negative absolute returns—posted smaller losses than the Fund as a whole. On the other hand, positions in longer-dated issues generally underperformed due to their above-average interest-rate sensitivity.
The views expressed reflect the opinions of BlackRock as of the date of this report and are subject to change based on changes in market, economic or other conditions. These views are not intended to be a forecast of future events and are no guarantee of future results.
| F U N D S U M M A R Y |
13 |
| Fund Summary as of April 30, 2022 (continued) | BlackRock MuniHoldings Fund, Inc. (MHD) |
Overview of the Fund’s Total Investments
SECTOR ALLOCATION
| Sector(a)(b) | 04/30/22 | 04/30/21 | ||||||
| Transportation |
21 | % | 21 | % | ||||
| Health |
17 | 15 | ||||||
| County/City/Special District/School District |
15 | 16 | ||||||
| State |
13 | 15 | ||||||
| Utilities |
10 | 10 | ||||||
| Housing |
8 | 4 | ||||||
| Education |
8 | 8 | ||||||
| Tobacco |
5 | 6 | ||||||
| Corporate |
3 | 4 | ||||||
| Other |
— | 1 | ||||||
CALL/MATURITY SCHEDULE
| Calendar Year Ended December 31,(a)(c) | Percentage | |||
| 2022 |
6 | % | ||
| 2023 |
11 | |||
| 2024 |
5 | |||
| 2025 |
7 | |||
| 2026 |
5 | |||
CREDIT QUALITY ALLOCATION
| Credit Rating(a)(d) | 04/30/22 | 04/30/21 | ||||||
| AAA/Aaa |
5 | % | 3 | % | ||||
| AA/Aa |
42 | 41 | ||||||
| A |
28 | 26 | ||||||
| BBB/Baa |
9 | 14 | ||||||
| BB/Ba |
5 | 4 | ||||||
| B |
1 | 1 | ||||||
| C |
— | — | (e) | |||||
| N/R(f) |
10 | 11 | ||||||
| (a) | Excludes short-term securities. |
| (b) | For Fund compliance purposes, the Fund’s sector classifications refer to one or more of the sector sub-classifications used by one or more widely recognized market indexes or rating group indexes, and/or as defined by the investment adviser. These definitions may not apply for purposes of this report, which may combine such sector sub-classifications for reporting ease. |
| (c) | Scheduled maturity dates and/or bonds that are subject to potential calls by issuers over the next five years. |
| (d) | For financial reporting purposes, credit quality ratings shown above reflect the highest rating assigned by either S&P Global Ratings or Moody’s Investors Service, Inc. if ratings differ. These rating agencies are independent, nationally recognized statistical rating organizations and are widely used. Investment grade ratings are credit ratings of BBB/Baa or higher. Below investment grade ratings are credit ratings of BB/Ba or lower. Investments designated N/R are not rated by either rating agency. Unrated investments do not necessarily indicate low credit quality. Credit quality ratings are subject to change. |
| (e) | Rounds to less than 1% of total investments. |
| (f) | The investment adviser evaluates the credit quality of unrated investments based upon certain factors including, but not limited to, credit ratings for similar investments and financial analysis of sectors and individual investments. Using this approach, the investment adviser has deemed certain of these unrated securities as investment grade quality. As of April 30, 2022 and April 30, 2021, the market value of unrated securities deemed by the investment adviser to be investment grade represents 2% and 2%, respectively, of the Fund’s total investments. |
| 14 | 2 0 2 2 B L A C K R O C K A N N U A L R E P O R T T O S H A R E H O L D E R S |
| Fund Summary as of April 30, 2022 | BlackRock MuniVest Fund II, Inc. (MVT) |
Investment Objective
BlackRock MuniVest Fund II, Inc.’s (MVT) (the “Fund”) investment objective is to provide shareholders with as high a level of current income exempt from U.S. federal income taxes as is consistent with its investment policies and prudent investment management. The Fund seeks to achieve its investment objective by investing at least 80% of its assets in municipal bonds exempt from U.S. federal income taxes (except that the interest may be subject to the U.S. federal alternative minimum tax). The Fund invests, under normal market conditions, at least 75% of its assets in municipal bonds rated investment grade or, if unrated, are deemed to be of comparable quality by the investment adviser at the time of investment and invests primarily in long-term municipal bonds with a maturity of more than ten years at the time of investment. The Fund may invest directly in such securities or synthetically through the use of derivatives.
No assurance can be given that the Fund’s investment objective will be achieved.
Fund Information
| Symbol on New York Stock Exchange |
MVT | |
| Initial Offering Date |
March 29, 1993 | |
| Yield on Closing Market Price as of April 30, 2022 ($11.89)(a) |
5.90% | |
| Tax Equivalent Yield(b) |
9.97% | |
| Current Monthly Distribution per Common Share(c) |
$0.0585 | |
| Current Annualized Distribution per Common Share(c) |
$0.7020 | |
| Leverage as of April 30, 2022(d) |
42% | |
| (a) | Yield on closing market price is calculated by dividing the current annualized distribution per share by the closing market price. Past performance is not an indication of future results. |
| (b) | Tax equivalent yield assumes the maximum marginal U.S. federal tax rate of 40.8%, which includes the 3.8% Medicare tax. Actual tax rates will vary based on income, exemptions and deductions. Lower taxes will result in lower tax equivalent yields. |
| (c) | The monthly distribution per Common Share, declared on June 1, 2022, was decreased to $0.0500 per share. The yield on closing market price, tax equivalent yield, current monthly distribution per Common Share, and current annualized distribution per Common Share do not reflect the new distribution rate. The new distribution rate is not constant and is subject to change in the future. |
| (d) | Represents VMTP Shares and TOB Trusts as a percentage of total managed assets, which is the total assets of the Fund, including any assets attributable to VMTP Shares and TOB Trusts, minus the sum of its accrued liabilities. Does not reflect derivatives or other instruments that may give rise to economic leverage. For a discussion of leveraging techniques utilized by the Fund, please see The Benefits and Risks of Leveraging and Derivative Financial Instruments. |
Market Price and Net Asset Value Per Share Summary
| 04/30/22 | 04/30/21 | Change | High | Low | ||||||||||||||||
| Closing Market Price |
$ | 11.89 | $ | 15.15 | (21.52 | )% | $ | 16.81 | $ | 11.77 | ||||||||||
| Net Asset Value |
12.91 | 15.60 | (17.24 | ) | 16.01 | 12.91 | ||||||||||||||
TOTAL RETURN BASED ON A $10,000 INVESTMENT
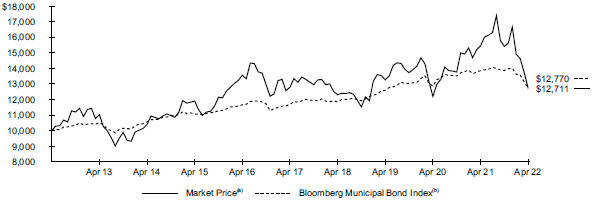
| (a) | Represents the Fund’s closing market price on the NYSE and reflects the reinvestment of dividends and/or distributions at actual reinvestment prices. |
| (b) | An unmanaged index that tracks the U.S. long term tax-exempt bond market, including state and local general obligation bonds, revenue bonds, pre-refunded bonds, and insured bonds. |
| F U N D S U M M A R Y |
15 |
| Fund Summary as of April 30, 2022 (continued) | BlackRock MuniVest Fund II, Inc. (MVT) |
Performance
Returns for the period ended April 30, 2022 were as follows:
| Average Annual Total Returns | ||||||||||||
|
|
|
|||||||||||
| 1 Year | 5 Years | 10 Years | ||||||||||
| Fund at NAV(a)(b) |
(13.19) | % | 1.89 | % | 3.81 | % | ||||||
| Fund at Market Price(a)(b) |
(17.67) | (0.12 | ) | 2.43 | ||||||||
| National Customized Reference Benchmark(c) |
(7.72) | 2.06 | N/A | |||||||||
| Bloomberg Municipal Bond Index |
(7.88) | 1.80 | 2.47 | |||||||||
| Lipper General & Insured Municipal Debt Funds (Leveraged) at NAV(d) |
(11.81) | 2.10 | 3.76 | |||||||||
| Lipper General & Insured Municipal Debt Funds (Leveraged) at Market Price(d) |
(16.63) | 1.62 | 3.09 | |||||||||
| (a) | All returns reflect reinvestment of dividends and/or distributions at actual reinvestment prices. Performance results reflect the Fund’s use of leverage. |
| (b) | The Fund’s discount to NAV widened during the period, which accounts for the difference between performance based on market price and performance based on NAV. |
| (c) | The National Customized Reference Benchmark is comprised of the Bloomberg Municipal Bond Index Total Return Index Value Unhedged (90%) and the Bloomberg Municipal Bond: High Yield (non-Investment Grade) Total Return Index (10%). Effective October 1, 2021, the Fund changed its reporting benchmark from Lipper General & Insured Municipal Debt Funds (Leveraged) to the National Customized Reference Benchmark. The investment adviser believes the new benchmark is a more appropriate reporting benchmark for the Fund. The National Customized Reference Benchmark commenced on September 30, 2016. |
| (d) | Average return. Returns reflect reinvestment of dividends and/or distributions at NAV on the ex-dividend date as calculated by Lipper. |
Performance results may include adjustments made for financial reporting purposes in accordance with U.S. generally accepted accounting principles. Past performance is not an indication of future results.
The Fund is presenting the performance of one or more indices for informational purposes only. The Fund is actively managed and does not seek to track or replicate the performance of any index. The index performance shown is not intended to be indicative of the Fund’s investment strategies, portfolio components or past or future performance.
More information about the Fund’s historical performance can be found in the “Closed End Funds” section of blackrock.com.
The following discussion relates to the Fund’s absolute performance based on NAV:
Municipal bonds lost ground in the 12-month period. Rising inflation prompted the Fed to shift toward tighter monetary policy, weighing heavily on the performance of fixed-income assets.
Income contributed to the Fund’s performance, but it was not sufficient to offset the sharp downturn in prices. The Fund’s use of U.S. Treasury futures to manage interest rate risk contributed to results in the rising-rate environment. Holdings in high-quality, short-maturity bonds—while producing negative absolute returns—posted smaller losses than the Fund as a whole. On the other hand, positions in longer-dated issues generally underperformed due to their above-average interest-rate sensitivity.
The views expressed reflect the opinions of BlackRock as of the date of this report and are subject to change based on changes in market, economic or other conditions. These views are not intended to be a forecast of future events and are no guarantee of future results.
| 16 | 2 0 2 2 B L A C K R O C K A N N U A L R E P O R T T O S H A R E H O L D E R S |
| Fund Summary as of April 30, 2022 (continued) | BlackRock MuniVest Fund II, Inc. (MVT) |
Overview of the Fund’s Total Investments
SECTOR ALLOCATION
| Sector(a)(b) | 04/30/22 | 04/30/21 | ||
| Health |
20% | 18% | ||
| Transportation |
20 | 21 | ||
| State |
15 | 18 | ||
| County/City/Special District/School District |
10 | 11 | ||
| Utilities |
10 | 11 | ||
| Education |
8 | 8 | ||
| Tobacco |
8 | 8 | ||
| Housing |
6 | 1 | ||
| Corporate |
3 | 4 | ||
CALL/MATURITY SCHEDULE
| Calendar Year Ended December 31,(a)(c) | Percentage | |
| 2022 |
7% | |
| 2023 |
7 | |
| 2024 |
6 | |
| 2025 |
8 | |
| 2026 |
6 | |
CREDIT QUALITY ALLOCATION
| Credit Rating(a)(d) | 04/30/22 | 04/30/21 | ||
| AAA/Aaa |
5% | 5% | ||
| AA/Aa |
35 | 32 | ||
| A |
31 | 27 | ||
| BBB/Baa |
9 | 16 | ||
| BB/Ba |
7 | 7 | ||
| B |
2 | 2 | ||
| C |
— | 1 | ||
| N/R(e) |
11 | 10 | ||
| (a) | Excludes short-term securities. |
| (b) | For Fund compliance purposes, the Fund’s sector classifications refer to one or more of the sector sub-classifications used by one or more widely recognized market indexes or rating group indexes, and/or as defined by the investment adviser. These definitions may not apply for purposes of this report, which may combine such sector sub-classifications for reporting ease. |
| (c) | Scheduled maturity dates and/or bonds that are subject to potential calls by issuers over the next five years. |
| (d) | For financial reporting purposes, credit quality ratings shown above reflect the highest rating assigned by either S&P Global Ratings or Moody’s Investors Service, Inc. if ratings differ. These rating agencies are independent, nationally recognized statistical rating organizations and are widely used. Investment grade ratings are credit ratings of BBB/Baa or higher. Below investment grade ratings are credit ratings of BB/Ba or lower. Investments designated N/R are not rated by either rating agency. Unrated investments do not necessarily indicate low credit quality. Credit quality ratings are subject to change. |
| (e) | The investment adviser evaluates the credit quality of unrated investments based upon certain factors including, but not limited to, credit ratings for similar investments and financial analysis of sectors and individual investments. Using this approach, the investment adviser has deemed certain of these unrated securities as investment grade quality. As of April 30, 2022 and April 30, 2021, the market value of unrated securities deemed by the investment adviser to be investment grade represents 2% and 2%, respectively, of the Fund’s total investments. |
| F U N D S U M M A R Y |
17 |
| April 30, 2022 |
BlackRock MuniAssets Fund, Inc. (MUA) (Percentages shown are based on Net Assets) |
| Security | Par (000) |
Value | ||||||
| Corporate Bonds |
||||||||
| Education — 0.5% | ||||||||
| Capital Trust Agency, Inc., RB |
||||||||
| 8.25%, 01/01/44 |
$ | 515 | $ | 10,300 | ||||
| 8.25%, 01/01/49 |
1,105 | 22,100 | ||||||
| Grand Canyon University, 5.13%, 10/01/28 |
2,625 | 2,526,563 | ||||||
|
|
|
|||||||
| Total Corporate Bonds — 0.5% |
2,558,963 | |||||||
|
|
|
|||||||
| Municipal Bonds |
||||||||
| Alabama — 1.6% | ||||||||
| County of Jefferson Alabama Sewer Revenue, Refunding RB, Series D, Sub Lien, 6.00%, 10/01/42 |
3,745 | 4,052,135 | ||||||
| Hoover Industrial Development Board, RB, AMT, 6.38%, 11/01/50(a) |
2,140 | 2,521,496 | ||||||
| MidCity Improvement District, SAB |
||||||||
| 4.25%, 11/01/32 |
160 | 149,809 | ||||||
| 4.50%, 11/01/42 |
255 | 221,973 | ||||||
| 4.75%, 11/01/49 |
270 | 232,500 | ||||||
| Tuscaloosa County Industrial Development Authority, Refunding RB, Series A, 4.50%, 05/01/32(b) |
353 | 338,684 | ||||||
|
|
|
|||||||
| 7,516,597 | ||||||||
| Alaska — 0.2% | ||||||||
| Northern Tobacco Securitization Corp., Refunding RB, Series A, Class 1, 4.00%, 06/01/50 |
1,000 | 929,538 | ||||||
|
|
|
|||||||
| Arizona — 4.7% | ||||||||
| Arizona Industrial Development Authority, RB 7.10%, 01/01/55(b) |
1,705 | 1,487,982 | ||||||
| Class B, 4.00%, 07/01/41 |
160 | 145,164 | ||||||
| Class B, 4.00%, 07/01/51 |
445 | 379,762 | ||||||
| Class B, 4.00%, 07/01/61 |
890 | 743,746 | ||||||
| Series A, 5.00%, 12/15/39(b) |
250 | 252,054 | ||||||
| Series A, 4.00%, 07/01/51 |
445 | 393,352 | ||||||
| Series A, 4.00%, 07/01/61 |
910 | 779,288 | ||||||
| Series B, 5.13%, 07/01/47(b) |
665 | 684,846 | ||||||
| Arizona Industrial Development Authority, Refunding RB(b) |
||||||||
| Series A, 5.13%, 07/01/37 |
960 | 972,672 | ||||||
| Series A, 5.25%, 07/01/47 |
1,765 | 1,778,624 | ||||||
| Series A, 5.50%, 07/01/52 |
1,775 | 1,859,513 | ||||||
| Glendale Industrial Development Authority, RB |
||||||||
| 5.00%, 05/15/41 |
100 | 104,941 | ||||||
| 5.00%, 05/15/56 |
405 | 422,675 | ||||||
| Industrial Development Authority of the City of Phoenix, RB(b) |
||||||||
| Series A, 6.50%, 07/01/34 |
570 | 602,487 | ||||||
| Series A, 6.75%, 07/01/44 |
1,000 | 1,071,837 | ||||||
| Industrial Development Authority of the City of Phoenix, Refunding RB(b) |
||||||||
| 5.00%, 07/01/35 |
625 | 629,603 | ||||||
| 5.00%, 07/01/45 |
1,425 | 1,425,233 | ||||||
| Series A, 5.00%, 07/01/35 |
260 | 261,915 | ||||||
| Industrial Development Authority of the County of Pima, Refunding RB(b) |
||||||||
| 4.00%, 06/15/51 |
1,155 | 992,761 | ||||||
| 5.00%, 07/01/56 |
480 | 466,314 | ||||||
| 4.00%, 06/15/57 |
890 | 737,703 | ||||||
| Security | Par (000) |
Value | ||||||
| Arizona (continued) | ||||||||
| La Paz County Industrial Development Authority, RB, 5.88%, 06/15/48(b) |
$ | 875 | $ | 892,942 | ||||
| Maricopa County Industrial Development Authority, RB(b) |
||||||||
| 5.25%, 10/01/40 |
465 | 497,547 | ||||||
| 5.50%, 10/01/51 |
465 | 497,391 | ||||||
| AMT, 4.00%, 10/15/47 |
2,295 | 2,104,949 | ||||||
| Salt Verde Financial Corp., RB, 5.00%, 12/01/37 |
1,650 | 1,825,779 | ||||||
| Tempe Industrial Development Authority, Refunding RB, 4.00%, 12/01/46 |
330 | 296,984 | ||||||
|
|
|
|||||||
| 22,308,064 | ||||||||
| Arkansas(b) — 2.6% | ||||||||
| Arkansas Development Finance Authority, RB |
||||||||
| Series A, AMT, 4.50%, 09/01/49 |
3,815 | 3,517,716 | ||||||
| Series A, AMT, 4.75%, 09/01/49 |
9,090 | 8,691,204 | ||||||
|
|
|
|||||||
| 12,208,920 | ||||||||
| California — 9.2% | ||||||||
| California Community Housing Agency, RB, M/F Housing(b) |
||||||||
| 3.00%, 08/01/56 |
890 | 624,169 | ||||||
| Series A, 5.00%, 04/01/49 |
240 | 206,276 | ||||||
| Series A-2, 4.00%, 08/01/47 |
1,550 | 1,246,882 | ||||||
| California Municipal Finance Authority, RB |
||||||||
| Series A, 5.50%, 08/01/34(b) |
295 | 300,702 | ||||||
| Series A, 6.00%, 08/01/44(b) |
665 | 680,957 | ||||||
| Series A, 3.00%, 02/01/46 |
315 | 245,459 | ||||||
| Series A, 6.13%, 08/01/49(b) |
580 | 593,856 | ||||||
| Series A, 4.00%, 02/01/51 |
245 | 236,073 | ||||||
| California Public Finance Authority, RB, Series A, 6.25%, 07/01/54(b) |
1,780 | 1,964,444 | ||||||
| California School Finance Authority, RB |
||||||||
| 6.65%, 07/01/33 |
435 | 446,156 | ||||||
| 6.90%, 07/01/43 |
975 | 999,383 | ||||||
| Series A, 6.40%, 07/01/48 |
1,570 | 1,620,198 | ||||||
| California Statewide Communities Development Authority, RB, 5.25%, 12/01/38(b) |
580 | 637,929 | ||||||
| California Statewide Financing Authority, RB, Series B, 6.00%, 05/01/43 |
1,650 | 1,652,628 | ||||||
| CMFA Special Finance Agency I, RB, M/F Housing, Series A, 4.00%, 04/01/56(b) |
3,300 | 2,792,948 | ||||||
| CMFA Special Finance Agency XII, RB, M/F Housing, 4.38%, 08/01/49(b) |
485 | 382,617 | ||||||
| CMFA Special Finance Agency, RB, M/F Housing, Series A-1, 3.00%, 12/01/56(b) |
120 | 79,730 | ||||||
| CSCDA Community Improvement Authority, RB, M/F Housing(b) |
||||||||
| 2.65%, 12/01/46 |
615 | 484,859 | ||||||
| 3.13%, 07/01/56 |
990 | 698,499 | ||||||
| 3.25%, 07/01/56 |
335 | 245,224 | ||||||
| 3.00%, 09/01/56 |
1,570 | 1,105,013 | ||||||
| 4.00%, 12/01/56 |
2,420 | 1,813,088 | ||||||
| 4.00%, 03/01/57 |
700 | 523,190 | ||||||
| 3.25%, 05/01/57 |
505 | 363,280 | ||||||
| 4.00%, 06/01/57 |
2,630 | 1,977,102 | ||||||
| 4.00%, 07/01/58 |
815 | 596,196 | ||||||
| Series B, 4.00%, 12/01/59 |
6,035 | 4,024,941 | ||||||
| Senior Lien, 3.00%, 06/01/47 |
465 | 357,538 | ||||||
| Senior Lien, 3.13%, 06/01/57 |
890 | 620,511 | ||||||
| Series B, Sub Lien, 4.00%, 12/01/59 |
4,000 | 2,487,872 | ||||||
| 18 | 2 0 2 2 B L A C K R O C K A N N U A L R E P O R T T O S H A R E H O L D E R S |
| Schedule of Investments (continued) April 30, 2022 |
BlackRock MuniAssets Fund, Inc. (MUA) (Percentages shown are based on Net Assets) |
| Security | Par (000) |
Value | ||||||
| California (continued) | ||||||||
| Golden State Tobacco Securitization Corp., Refunding RB, Series A-1, 5.25%, 06/01/22(c) |
$ | 610 | $ | 611,845 | ||||
| Golden State Tobacco Securitization Corp., Refunding RB, CAB, Series B, Subordinate, 0.00%, 06/01/66(d) |
28,850 | 3,160,402 | ||||||
| Hastings Campus Housing Finance Authority, RB, CAB, Sub-Series A, |
1,705 | 803,994 | ||||||
| Riverside County Transportation Commission, RB, Series A, Senior Lien, 5.75%, 06/01/23(c) |
2,885 | 2,996,817 | ||||||
| San Diego County Regional Airport Authority, ARB, Series B, AMT, 4.00%, 07/01/56 |
5,000 | 4,613,240 | ||||||
| San Francisco City & County Redevelopment Agency Successor Agency, TA, CAB(b)(d) |
||||||||
| Series D, 0.00%, 08/01/26 |
1,250 | 1,026,292 | ||||||
| Series D, 0.00%, 08/01/43 |
1,500 | 525,926 | ||||||
|
|
|
|||||||
| 43,746,236 | ||||||||
| Colorado — 3.0% | ||||||||
| 9th Avenue Metropolitan District No.2, GO, 5.00%, 12/01/48 |
910 | 912,160 | ||||||
| Arista Metropolitan District, Refunding GO, Series A, 5.00%, 12/01/38 |
1,240 | 1,254,871 | ||||||
| Banning Lewis Ranch Metropolitan District No. 8, GO, 4.88%, 12/01/51(b) |
665 | 536,507 | ||||||
| Centerra Metropolitan District No.1, TA, 5.00%, 12/01/47(b) |
575 | 574,218 | ||||||
| Colorado Health Facilities Authority, RB |
||||||||
| Series A, 5.00%, 05/15/35 |
515 | 492,838 | ||||||
| Series A, 5.00%, 05/15/44 |
385 | 347,575 | ||||||
| Series A, 5.00%, 05/15/49 |
260 | 226,316 | ||||||
| Series A, 5.00%, 05/15/58 |
540 | 452,293 | ||||||
| Fitzsimons Village Metropolitan District No 3, Refunding GO, Series A-1, 4.25%, 12/01/55 |
1,735 | 1,376,568 | ||||||
| Green Valley Ranch East Metropolitan District No.6, GO, Series A, 5.88%, 12/01/50 |
935 | 927,452 | ||||||
| Horizon Metropolitan District No. 2, GO, Series A, 4.50%, 12/01/50 |
520 | 403,715 | ||||||
| Inspiration Metropolitan District, GO, Series B, Subordinate, 5.00%, 12/15/36 |
812 | 692,086 | ||||||
| Karl’s Farm Metropolitan District No.2, GO, Series A, 5.63%, 12/01/50(b) |
545 | 521,964 | ||||||
| Loretto Heights Community Authority, RB, 4.88%, 12/01/51 |
790 | 651,210 | ||||||
| North Holly Metropolitan District, GO, Series A, 5.50%, 12/01/48 |
500 | 502,025 | ||||||
| Palisade Metropolitan District No.2, GO, Subordinate, 7.25%, 12/15/49 |
1,211 | 1,112,470 | ||||||
| Prairie Farm Metropolitan District, GO, Series A, 5.25%, 12/01/48 |
760 | 788,928 | ||||||
| Pueblo Urban Renewal Authority, TA, 4.75%, 12/01/45(b) |
1,365 | 1,323,448 | ||||||
| Southlands Metropolitan District No.1, Refunding GO, Series A-1, 5.00%, 12/01/47 |
410 | 409,443 | ||||||
| Waters’ Edge Metropolitan District No.2, GO, 5.00%, 12/01/51 |
790 | 658,991 | ||||||
|
|
|
|||||||
| 14,165,078 | ||||||||
| Connecticut — 1.3% | ||||||||
| Connecticut Housing Finance Authority, Refunding RB, M/F Housing, 3.00%, 11/15/38 |
1,300 | 1,160,349 | ||||||
| Security | Par (000) |
Value | ||||||
| Connecticut (continued) | ||||||||
| Connecticut State Health & Educational Facilities Authority, RB(b) |
||||||||
| Series A, 5.00%, 01/01/45 |
$ | 325 | $ | 334,361 | ||||
| Series A, 5.00%, 01/01/55 |
435 | 442,998 | ||||||
| Mohegan Tribal Finance Authority, RB, 7.00%, 02/01/45(b) |
1,385 | 1,414,264 | ||||||
| Mohegan Tribe of Indians of Connecticut, RB, Series A, 6.75%, 02/01/45(b) |
957 | 983,221 | ||||||
| Mohegan Tribe of Indians of Connecticut, Refunding RB, Series C, 6.25%, 02/01/30(b) |
1,835 | 1,950,361 | ||||||
|
|
|
|||||||
| 6,285,554 | ||||||||
| Delaware — 0.3% | ||||||||
| Affordable Housing Opportunities Trust, RB, Class B, 6.88%, 05/01/39(b) |
1,220 | 1,220,000 | ||||||
|
|
|
|||||||
| District of Columbia — 0.7% | ||||||||
| District of Columbia Tobacco Settlement Financing Corp., RB, CAB, Series A, 0.00%, 06/15/46(d) |
15,400 | 3,124,444 | ||||||
|
|
|
|||||||
| Florida — 14.2% | ||||||||
| Babcock Ranch Community Independent Special District, SA |
||||||||
| 5.00%, 05/01/42 |
510 | 507,445 | ||||||
| 5.00%, 05/01/53 |
510 | 495,741 | ||||||
| Boggy Creek Improvement District, Refunding SAB, Series 2013, 5.13%, 05/01/43 |
1,290 | 1,304,711 | ||||||
| Brevard County Health Facilities Authority, Refunding RB(b) |
||||||||
| 4.00%, 11/15/23 |
125 | 126,267 | ||||||
| 4.00%, 11/15/24 |
440 | 445,693 | ||||||
| 4.00%, 11/15/25 |
460 | 466,795 | ||||||
| 4.00%, 11/15/27 |
495 | 502,190 | ||||||
| 4.00%, 11/15/29 |
435 | 439,498 | ||||||
| 4.00%, 11/15/32 |
450 | 450,761 | ||||||
| 4.00%, 11/15/35 |
675 | 666,689 | ||||||
| Capital Region Community Development District, Refunding SAB, Series A-1, 5.13%, 05/01/39 |
1,495 | 1,544,899 | ||||||
| Capital Trust Agency, Inc., RB, Series A, 5.75%, 06/01/54(b) |
940 | 922,706 | ||||||
| Capital Trust Agency, Inc., RB, CAB, 0.00%, 07/01/61(b)(d) |
53,225 | 3,508,432 | ||||||
| Charlotte County Industrial Development Authority, RB(b) |
||||||||
| AMT, 5.00%, 10/01/34 |
245 | 251,413 | ||||||
| AMT, 5.00%, 10/01/49 |
1,170 | 1,168,167 | ||||||
| AMT, 4.00%, 10/01/51 |
850 | 714,225 | ||||||
| Collier County Industrial Development Authority, Refunding RB, Series A, |
630 | 430,371 | ||||||
| County of Osceola Florida Transportation Revenue, Refunding RB, CAB(d) |
||||||||
| Series A-2, 0.00%, 10/01/50 |
730 | 199,295 | ||||||
| Series A-2, 0.00%, 10/01/51 |
875 | 227,049 | ||||||
| Series A-2, 0.00%, 10/01/52 |
875 | 219,862 | ||||||
| Series A-2, 0.00%, 10/01/53 |
2,325 | 545,113 | ||||||
| Series A-2, 0.00%, 10/01/54 |
875 | 195,291 | ||||||
| Florida Development Finance Corp., RB |
||||||||
| 5.00%, 06/15/56(b) |
1,150 | 1,039,439 | ||||||
| Series A, 5.75%, 06/15/29 |
690 | 706,865 | ||||||
| Series A, 6.00%, 06/15/34 |
835 | 856,359 | ||||||
| Series A, 6.13%, 06/15/44 |
3,180 | 3,245,441 | ||||||
| Series A, 5.13%, 06/15/55(b) |
3,645 | 3,147,611 | ||||||
| S C H E D U L E O F I N V E S T M E N T S |
19 |
| Schedule of Investments (continued) April 30, 2022 |
BlackRock MuniAssets Fund, Inc. (MUA) (Percentages shown are based on Net Assets) |
| Security | Par (000) |
Value | ||||||
| Florida (continued) | ||||||||
| Florida Development Finance Corp., RB (continued) |
||||||||
| Series B, 4.50%, 12/15/56(b) |
$ | 3,985 | $ | 3,087,721 | ||||
| Series C, 5.75%, 12/15/56(b) |
1,325 | 1,065,394 | ||||||
| AMT, 5.00%, 05/01/29(b) |
2,155 | 2,191,577 | ||||||
| Series A, AMT, 5.00%, 08/01/29(a)(b) |
1,550 | 1,556,456 | ||||||
| Florida Development Finance Corp., Refunding RB, 5.00%, 06/01/51 |
355 | 325,912 | ||||||
| Greeneway Improvement District, SAB, 5.13%, 05/01/43 |
1,280 | 1,292,794 | ||||||
| Lakewood Ranch Stewardship District, SAB |
||||||||
| 4.25%, 05/01/26 |
125 | 125,848 | ||||||
| 4.95%, 05/01/29(b) |
360 | 372,375 | ||||||
| 5.50%, 05/01/39(b) |
365 | 386,203 | ||||||
| 3.00%, 05/01/41 |
275 | 225,326 | ||||||
| 5.13%, 05/01/46 |
770 | 782,050 | ||||||
| 5.65%, 05/01/48(b) |
610 | 643,384 | ||||||
| Series 1B, 4.75%, 05/01/29 |
565 | 579,297 | ||||||
| Series 1B, 5.30%, 05/01/39 |
645 | 674,807 | ||||||
| Series 1B, 5.45%, 05/01/48 |
1,150 | 1,199,372 | ||||||
| Laurel Road Community Development District, SAB |
||||||||
| Series A-1, 2.60%, 05/01/26 |
100 | 96,859 | ||||||
| Series A-1, 3.00%, 05/01/31 |
100 | 92,384 | ||||||
| Series A-1, 3.25%, 05/01/41 |
190 | 159,005 | ||||||
| Series A-1, 4.00%, 05/01/52 |
300 | 265,378 | ||||||
| Series A-2, 3.13%, 05/01/31 |
445 | 402,721 | ||||||
| Miami Beach Health Facilities Authority, RB, 3.00%, 11/15/51 |
8,125 | 5,869,110 | ||||||
| Miami-Dade County Industrial Development Authority, RB, 5.00%, 01/15/48 |
915 | 946,316 | ||||||
| Midtown Miami Community Development District, Refunding SAB |
||||||||
| Series A, 5.00%, 05/01/37 |
845 | 846,351 | ||||||
| Series B, 5.00%, 05/01/37 |
495 | 495,791 | ||||||
| North River Ranch Community Development District, SAB |
||||||||
| Series A-1, 4.00%, 05/01/40 |
310 | 279,881 | ||||||
| Series A-1, 4.25%, 05/01/51 |
530 | 467,125 | ||||||
| Series A-2, 4.20%, 05/01/35 |
450 | 413,298 | ||||||
| Series A-3, 4.75%, 05/01/40 |
600 | 544,970 | ||||||
| Palm Beach County Health Facilities Authority, Refunding RB, Series A, 7.25%, 06/01/34 |
500 | 511,758 | ||||||
| Rolling Hills Community Development District, Refunding SA, 3.65%, 05/01/32 |
1,000 | 909,513 | ||||||
| Santa Rosa Bay Bridge Authority, RB, 6.25%, 07/01/28(f)(g) |
3,321 | 3,036,733 | ||||||
| Sawyers Landing Community Development District, SAB, 4.25%, 05/01/53 |
1,145 | 1,066,209 | ||||||
| Seminole County Industrial Development Authority, Refunding RB, 5.75%, 11/15/54 |
985 | 921,662 | ||||||
| South Broward Hospital District, RB, 3.00%, 05/01/51 |
7,355 | 5,799,678 | ||||||
| Tolomato Community Development District, Refunding SAB, Series 2015-2, 0.00%, 05/01/40(e) |
805 | 584,447 | ||||||
| Tolomato Community Development District, Refunding SAB, CAB, Series A-4, Convertible, 6.61%, 05/01/40. |
305 | 305,000 | ||||||
| Tolomato Community Development District, SAB(f)(g) |
||||||||
| 3rd Series, 6.65%, 05/01/40 |
710 | 7 | ||||||
| Series 2015-3, 6.61%, 05/01/40 |
875 | 9 | ||||||
| Trout Creek Community Development District, SAB 5.38%, 05/01/38 |
430 | 442,995 | ||||||
| Security | Par (000) |
Value | ||||||
| Florida (continued) | ||||||||
| Trout Creek Community Development District, |
|
|||||||
| 5.50%, 05/01/49 |
$ | 1,105 | $ | 1,128,732 | ||||
| Village Community Development District No.9, SAB, 5.50%, 05/01/42 |
1,045 | 1,045,000 | ||||||
| West Villages Improvement District, SAB |
||||||||
| 4.75%, 05/01/39 |
455 | 450,935 | ||||||
| 5.00%, 05/01/50 |
940 | 926,491 | ||||||
| Windward at Lakewood Ranch Community Development District, SAB |
||||||||
| 4.00%, 05/01/42 |
255 | 226,661 | ||||||
| 4.25%, 05/01/52 |
310 | 272,585 | ||||||
|
|
|
|||||||
| 67,344,448 | ||||||||
| Georgia — 1.0% | ||||||||
| Atlanta Urban Redevelopment Agency, RB, 3.88%, 07/01/51(b) |
765 | 668,454 | ||||||
| Main Street Natural Gas, Inc., RB |
||||||||
| Series A, 5.00%, 05/15/35 |
560 | 616,760 | ||||||
| Series A, 5.00%, 05/15/36 |
560 | 618,701 | ||||||
| Series A, 5.00%, 05/15/37 |
615 | 680,956 | ||||||
| Series A, 5.00%, 05/15/38 |
340 | 377,093 | ||||||
| Series A, 5.00%, 05/15/49 |
1,130 | 1,262,815 | ||||||
| Private Colleges & Universities Authority, Refunding RB, 4.00%, 10/01/50 |
345 | 340,368 | ||||||
|
|
|
|||||||
| 4,565,147 | ||||||||
| Guam — 0.1% | ||||||||
| Territory of Guam, Refunding RB, Series A, 5.00%, 11/01/35 |
385 | 404,574 | ||||||
|
|
|
|||||||
| Idaho — 0.1% | ||||||||
| Idaho Housing & Finance Association, RB, Series A, 6.95%, 06/15/55(b) |
580 | 577,635 | ||||||
|
|
|
|||||||
| Illinois — 8.4% | ||||||||
| Chicago Board of Education, GO |
||||||||
| Series A, 5.00%, 12/01/42 |
1,020 | 1,028,345 | ||||||
| Series A, 4.00%, 12/01/47 |
1,665 | 1,470,315 | ||||||
| Series C, 5.25%, 12/01/35 |
1,655 | 1,707,784 | ||||||
| Series D, 5.00%, 12/01/46 |
2,155 | 2,195,676 | ||||||
| Series H, 5.00%, 12/01/46 |
720 | 736,272 | ||||||
| Chicago Board of Education, Refunding GO |
||||||||
| Series B, 4.00%, 12/01/35 |
745 | 746,263 | ||||||
| Series C, 5.00%, 12/01/25 |
725 | 765,883 | ||||||
| Series D, 5.00%, 12/01/31 |
1,000 | 1,051,791 | ||||||
| Series G, 5.00%, 12/01/44 |
2,150 | 2,220,806 | ||||||
| City of Chicago Illinois, Refunding GO |
||||||||
| 4.00%, 01/01/37 |
1,709 | 1,609,003 | ||||||
| Series A, 6.00%, 01/01/38 |
1,260 | 1,350,331 | ||||||
| Illinois Finance Authority, RB(b) |
||||||||
| 5.00%, 07/01/51 |
2,000 | 1,669,376 | ||||||
| 5.00%, 07/01/56 |
2,000 | 1,624,036 | ||||||
| Illinois Finance Authority, Refunding RB |
||||||||
| 6.60%, 07/01/24 |
450 | 444,187 | ||||||
| 6.00%, 02/01/34 |
365 | 373,116 | ||||||
| 6.13%, 02/01/45 |
860 | 873,734 | ||||||
| Illinois State Toll Highway Authority, RB |
||||||||
| Series A, 4.00%, 01/01/46 |
5,680 | 5,651,719 | ||||||
| Series A, 5.00%, 01/01/46 |
1,770 | 1,960,491 | ||||||
| Metropolitan Pier & Exposition Authority, RB Series A, 5.50%, 06/15/53 |
2,370 | 2,449,867 | ||||||
| 20 | 2 0 2 2 B L A C K R O C K A N N U A L R E P O R T T O S H A R E H O L D E R S |
| Schedule of Investments (continued) April 30, 2022 |
BlackRock MuniAssets Fund, Inc. (MUA) (Percentages shown are based on Net Assets) |
| Security | Par (000) |
Value | ||||||
| Illinois (continued) |
||||||||
| Metropolitan Pier & Exposition Authority, RB (continued) |
||||||||
| Series A, 5.00%, 06/15/57 |
$ | 1,020 | $ | 1,042,661 | ||||
| Metropolitan Pier & Exposition Authority, Refunding RB, 4.00%, 06/15/52 |
1,805 | 1,661,055 | ||||||
| Metropolitan Pier & Exposition Authority, Refunding RB, CAB, Series B, 0.00%, 12/15/54(d) |
14,000 | 2,472,596 | ||||||
| Sales Tax Securitization Corp., Refunding RB, Series A, 2nd Lien, 5.00%, 01/01/33 |
725 | 827,185 | ||||||
| State of Illinois, GO |
||||||||
| 5.50%, 05/01/30 |
530 | 589,593 | ||||||
| 5.50%, 05/01/39 |
1,055 | 1,151,190 | ||||||
| Series A, 5.00%, 01/01/33 |
740 | 741,172 | ||||||
| Village of Lincolnshire Illinois, ST, 6.25%, 03/01/34 |
1,374 | 1,375,529 | ||||||
|
|
|
|||||||
| 39,789,976 | ||||||||
| Indiana — 2.7% | ||||||||
| City of Valparaiso Indiana, RB |
||||||||
| AMT, 6.75%, 01/01/34 |
825 | 881,464 | ||||||
| AMT, 7.00%, 01/01/44 |
2,000 | 2,133,094 | ||||||
| City of Vincennes Indiana, Refunding RB, 6.25%, 01/01/29(b) |
1,715 | 1,716,530 | ||||||
| City of Whiting, RB, AMT, 3.00%, 11/01/51 |
5,000 | 3,882,190 | ||||||
| Indiana Finance Authority, RB |
||||||||
| Series A, AMT, 5.00%, 07/01/23(c) |
2,025 | 2,081,384 | ||||||
| Series A, AMT, 6.75%, 05/01/39 |
1,060 | 1,264,675 | ||||||
| Indiana Housing & Community Development Authority, RB, 5.38%, 10/01/40(b) |
1,230 | 1,119,435 | ||||||
|
|
|
|||||||
| 13,078,772 | ||||||||
| Iowa — 0.5% | ||||||||
| Iowa Finance Authority, Refunding RB |
||||||||
| 5.25%, 12/01/25 |
150 | 155,090 | ||||||
| Series B, 5.25%, 12/01/50(a) |
2,085 | 2,184,023 | ||||||
|
|
|
|||||||
| 2,339,113 | ||||||||
| Kansas — 0.3% | ||||||||
| City of Manhattan KS, RB, Series A, 4.00%, 06/01/52 |
480 | 420,551 | ||||||
| City of Shawnee Kansas, RB(b) |
||||||||
| 5.00%, 08/01/41 |
230 | 227,927 | ||||||
| 5.00%, 08/01/56 |
850 | 811,702 | ||||||
|
|
|
|||||||
| 1,460,180 | ||||||||
| Kentucky — 1.0% | ||||||||
| City of Henderson KY, RB, AMT, 4.70%, 01/01/52(b) |
660 | 623,067 | ||||||
| Kentucky Public Transportation Infrastructure Authority, RB, Series A, 5.75%, 07/01/23(c) |
4,000 | 4,163,068 | ||||||
|
|
|
|||||||
| 4,786,135 | ||||||||
| Louisiana — 2.2% | ||||||||
| Juban Crossing Economic Development District, Refunding RB, Series C, 7.00%, 09/15/44(b) |
2,340 | 2,010,369 | ||||||
| Louisiana Local Government Environmental Facilities & Community Development Authority, RB, 5.00%, 07/01/54(b) |
930 | 867,258 | ||||||
| Parish of St. James Louisiana, RB, 2nd Series, 6.35%, 07/01/40(b) |
1,580 | 1,799,849 | ||||||
| Tobacco Settlement Financing Corp., Refunding RB, Series A, 5.25%, 05/15/35 |
5,570 | 5,697,102 | ||||||
|
|
|
|||||||
| 10,374,578 | ||||||||
| Security | Par (000) |
Value | ||||||
| Maine — 0.2% |
||||||||
| Finance Authority of Maine, RB, AMT, 8.00%, 12/01/51(b) |
$ | 1,045 | $ | 869,943 | ||||
|
|
|
|||||||
| Maryland — 1.9% | ||||||||
| County of Frederick Maryland, Refunding TA, 4.63%, 07/01/43(b) |
1,930 | 2,046,387 | ||||||
| Maryland Economic Development Corp., RB |
||||||||
| 5.00%, 07/01/56 |
360 | 368,265 | ||||||
| AMT, 5.25%, 06/30/55 |
1,555 | 1,609,912 | ||||||
| Maryland Health & Higher Educational Facilities Authority, RB, Series A, 7.00%, 03/01/55(b) |
3,010 | 3,199,615 | ||||||
| Montgomery County Housing Opportunities Commission, RB, M/F Housing, Series C, (FHA), 2.85%, 01/01/51 |
2,645 | 2,035,618 | ||||||
|
|
|
|||||||
| 9,259,797 | ||||||||
| Massachusetts — 0.3% | ||||||||
| Massachusetts Development Finance Agency, RB, 4.00%, 06/01/56 |
430 | 400,090 | ||||||
| Massachusetts Development Finance Agency, Refunding RB |
||||||||
| 4.00%, 07/01/45 |
170 | 157,505 | ||||||
| 4.00%, 07/01/50 |
325 | 293,761 | ||||||
| Series B, 4.00%, 06/01/50 |
580 | 552,262 | ||||||
|
|
|
|||||||
| 1,403,618 | ||||||||
| Michigan — 0.7% | ||||||||
| Advanced Technology Academy, Refunding RB, 5.00%, 11/01/44 |
415 | 409,712 | ||||||
| City of Detroit Michigan, GO |
||||||||
| 5.00%, 04/01/34 |
285 | 300,205 | ||||||
| 5.00%, 04/01/35 |
285 | 299,557 | ||||||
| 5.00%, 04/01/36 |
200 | 209,724 | ||||||
| 5.00%, 04/01/37 |
320 | 334,828 | ||||||
| 5.00%, 04/01/38 |
145 | 151,338 | ||||||
| Michigan Finance Authority, RB, Series C-2, AMT, Senior Lien, 5.00%, 07/01/22(c) |
415 | 417,293 | ||||||
| Michigan Strategic Fund, RB, AMT, 5.00%, 06/30/48 |
1,200 | 1,226,716 | ||||||
|
|
|
|||||||
| 3,349,373 | ||||||||
| Minnesota — 0.6% | ||||||||
| City of Minneapolis Minnesota, RB, Series A, 5.75%, 07/01/55 |
1,480 | 1,580,949 | ||||||
| Minnesota Housing Finance Agency, RB, (GNMA/FNMA/FHLMC COLL), 3.00%, 07/01/43 |
1,250 | 1,065,198 | ||||||
|
|
|
|||||||
| 2,646,147 | ||||||||
| Missouri — 0.2% | ||||||||
| Industrial Development Authority of the City of St. Louis Missouri, Refunding RB |
||||||||
| Series A, 4.38%, 11/15/35 |
685 | 575,196 | ||||||
| Series A, 4.75%, 11/15/47 |
760 | 608,844 | ||||||
|
|
|
|||||||
| 1,184,040 | ||||||||
| Nevada — 0.2% | ||||||||
| Tahoe-Douglas Visitors Authority, RB |
||||||||
| 5.00%, 07/01/40 |
315 | 333,066 | ||||||
| 5.00%, 07/01/45 |
395 | 411,819 | ||||||
| 5.00%, 07/01/51 |
420 | 433,304 | ||||||
|
|
|
|||||||
| 1,178,189 | ||||||||
| S C H E D U L E O F I N V E S T M E N T S |
21 |
| Schedule of Investments (continued) April 30, 2022 |
BlackRock MuniAssets Fund, Inc. (MUA) (Percentages shown are based on Net Assets) |
| Security | Par (000) |
Value | ||||||
| New Hampshire — 0.7% |
||||||||
| New Hampshire Business Finance Authority, RB |
||||||||
| Series A, 4.13%, 08/15/40 |
$ | 530 | $ | 469,799 | ||||
| Series A, 4.25%, 08/15/46 |
595 | 512,854 | ||||||
| Series A, 4.50%, 08/15/55 |
1,235 | 1,057,318 | ||||||
| New Hampshire Business Finance Authority, Refunding RB(b) |
||||||||
| Series B, 4.63%, 11/01/42 |
1,015 | 1,031,090 | ||||||
| Series C, AMT, 4.88%, 11/01/42 |
485 | 494,053 | ||||||
|
|
|
|||||||
| 3,565,114 | ||||||||
| New Jersey — 7.4% | ||||||||
| Casino Reinvestment Development Authority, Inc., Refunding RB |
||||||||
| 5.25%, 11/01/39 |
1,065 | 1,099,906 | ||||||
| 5.25%, 11/01/44 |
770 | 793,597 | ||||||
| New Jersey Economic Development Authority, RB |
||||||||
| 6.00%, 10/01/43 |
1,530 | 1,579,343 | ||||||
| Series A, 5.00%, 07/01/32 |
165 | 169,403 | ||||||
| Series A, 5.00%, 07/01/37 |
260 | 265,271 | ||||||
| Series A, 5.25%, 11/01/54(b) |
1,675 | 1,557,961 | ||||||
| Series B, 5.00%, 06/15/43 |
2,245 | 2,374,267 | ||||||
| AMT, 5.38%, 01/01/43 |
2,155 | 2,204,742 | ||||||
| Series B, AMT, 6.50%, 04/01/31 |
1,805 | 1,920,159 | ||||||
| New Jersey Economic Development Authority, Refunding RB, Series A, 6.00%, 08/01/49(b) |
500 | 504,720 | ||||||
| New Jersey Health Care Facilities Financing Authority, RB |
||||||||
| 3.00%, 07/01/51 |
2,655 | 2,227,959 | ||||||
| 4.00%, 07/01/51 |
3,685 | 3,629,522 | ||||||
| New Jersey Transportation Trust Fund Authority, RB |
||||||||
| 4.00%, 06/15/46 |
1,000 | 943,431 | ||||||
| Series A, 0.00%, 12/15/37(d) |
10,000 | 4,947,640 | ||||||
| Series A, 0.00%, 12/15/40(d) |
2,485 | 1,046,886 | ||||||
| Series AA, 5.25%, 06/15/41 |
1,140 | 1,181,491 | ||||||
| Series S, 5.25%, 06/15/43 |
2,345 | 2,513,770 | ||||||
| Tobacco Settlement Financing Corp., Refunding RB, Sub-Series B, 5.00%, 06/01/46 |
5,970 | 6,337,227 | ||||||
|
|
|
|||||||
| 35,297,295 | ||||||||
| New Mexico — 0.8% | ||||||||
| New Mexico Hospital Equipment Loan Council, Refunding RB, 5.50%, 07/01/42 |
2,970 | 2,982,655 | ||||||
| Winrock Town Center Tax Increment Development District No. 1, Refunding TA, Senior Lien, 4.25%, 05/01/40(b) |
1,000 | 881,362 | ||||||
|
|
|
|||||||
| 3,864,017 | ||||||||
| New York — 12.3% | ||||||||
| Albany Capital Resource Corp., Refunding RB, 4.00%, 07/01/51 |
1,500 | 1,316,109 | ||||||
| Erie Tobacco Asset Securitization Corp., Refunding RB, Series A, 5.00%, 06/01/45 |
2,890 | 2,901,375 | ||||||
| Huntington Local Development Corp., RB, Series A, 5.25%, 07/01/56 |
185 | 184,359 | ||||||
| Metropolitan Transportation Authority, Refunding RB |
||||||||
| Series C-1, 4.75%, 11/15/45 |
1,740 | 1,825,594 | ||||||
| Series C-1, 5.00%, 11/15/50 |
565 | 587,759 | ||||||
| Series C-1, 5.25%, 11/15/55 |
840 | 909,046 | ||||||
| New York City Industrial Development Agency, Refunding RB |
||||||||
| Series A, Class A, (AGM), 3.00%, 01/01/37 |
250 | 222,639 | ||||||
| Series A, Class A, (AGM), 3.00%, 01/01/39 |
250 | 220,049 | ||||||
| Security | Par (000) |
Value | ||||||
| New York (continued) |
||||||||
| New York City Industrial Development Agency, Refunding RB (continued) |
||||||||
| Series A, Class A, (AGM), 3.00%, 01/01/40 |
$ | 175 | $ | 153,195 | ||||
| New York Counties Tobacco Trust IV, Refunding RB |
||||||||
| Series A, 6.25%, 06/01/41(b) |
5,100 | 5,169,426 | ||||||
| Series A, 5.00%, 06/01/42 |
3,155 | 3,154,760 | ||||||
| Series A, 5.00%, 06/01/45 |
1,185 | 1,195,157 | ||||||
| New York Counties Tobacco Trust VI, Refunding RB |
||||||||
| Series A-2-B, 5.00%, 06/01/45 |
2,655 | 2,778,373 | ||||||
| Series A-2-B, 5.00%, 06/01/51 |
1,900 | 1,982,397 | ||||||
| New York Liberty Development Corp., Refunding RB |
||||||||
| Series 1, Class 1, 5.00%, 11/15/44(b) |
6,205 | 6,265,399 | ||||||
| Series 2, Class 2, 5.15%, 11/15/34(b) |
455 | 467,865 | ||||||
| Series 2, Class 2, 5.38%, 11/15/40(b) |
1,080 | 1,114,503 | ||||||
| Series A, 2.88%, 11/15/46 |
3,975 | 3,066,510 | ||||||
| New York State Housing Finance Agency, RB, M/F Housing |
||||||||
| Series J-1, (SONYMA HUD SECT 8), 2.45%, 11/01/41. |
800 | 630,970 | ||||||
| Series J-1, (SONYMA HUD SECT 8), 2.65%, 11/01/46 |
1,065 | 787,156 | ||||||
| Series J-1, (SONYMA HUD SECT 8), 2.80%, 11/01/51 |
2,955 | 2,214,994 | ||||||
| Series J-1, (SONYMA HUD SECT 8), 2.88%, 11/01/56 |
2,000 | 1,469,152 | ||||||
| New York State Urban Development Corp., RB, 3.00%, 03/15/48 |
9,655 | 7,886,909 | ||||||
| New York Transportation Development Corp., RB |
||||||||
| AMT, 5.00%, 10/01/35 |
395 | 419,476 | ||||||
| AMT, 5.00%, 10/01/40 |
1,120 | 1,171,001 | ||||||
| New York Transportation Development Corp., Refunding ARB, AMT, 5.38%, 08/01/36 |
1,490 | 1,631,285 | ||||||
| Niagara Area Development Corp., RB, 5.00%, 07/01/52 . |
500 | 480,325 | ||||||
| State of New York Mortgage Agency, RB, S/F Housing |
||||||||
| Series 239, (SONYMA), 2.60%, 10/01/44 |
3,750 | 2,862,656 | ||||||
| Series 239, (SONYMA), 2.70%, 10/01/47 |
3,375 | 2,558,105 | ||||||
| Westchester County Healthcare Corp., RB, Series A, Senior Lien, 5.00%, 11/01/44. |
1,207 | 1,242,198 | ||||||
| Westchester County Local Development Corp., Refunding RB, 5.00%, 07/01/46(b) |
1,625 | 1,549,834 | ||||||
|
|
|
|||||||
| 58,418,576 | ||||||||
| Ohio — 3.8% | ||||||||
| Buckeye Tobacco Settlement Financing Authority, Refunding RB, Series B-2, Class 2, 5.00%, 06/01/55 |
5,715 | 5,556,632 | ||||||
| Cleveland-Cuyahoga County Port Authority, RB |
||||||||
| 4.00%, 07/01/46 |
65 | 65,249 | ||||||
| 4.00%, 07/01/51 |
95 | 95,376 | ||||||
| Cleveland-Cuyahoga County Port Authority, Refunding TA(b) |
||||||||
| 4.00%, 12/01/55 |
255 | 214,350 | ||||||
| 4.50%, 12/01/55 |
215 | 175,701 | ||||||
| County of Hamilton Ohio, Refunding RB, Series C, 5.00%, 01/01/46 |
875 | 897,566 | ||||||
| County of Hardin Ohio, Refunding RB |
||||||||
| 5.00%, 05/01/30 |
240 | 237,895 | ||||||
| 5.25%, 05/01/40 |
480 | 460,720 | ||||||
| 5.50%, 05/01/50 |
1,130 | 1,048,503 | ||||||
| Jefferson County Port Authority, RB, AMT, 3.50%, 12/01/51(b) |
1,125 | 830,352 | ||||||
| 22 | 2 0 2 2 B L A C K R O C K A N N U A L R E P O R T T O S H A R E H O L D E R S |
| Schedule of Investments (continued) April 30, 2022 |
BlackRock MuniAssets Fund, Inc. (MUA) (Percentages shown are based on Net Assets) |
| Security | Par (000) |
Value | ||||||
| Ohio (continued) |
||||||||
| Ohio Air Quality Development Authority, RB, AMT, 5.00%, 07/01/49(b) |
$ | 840 | $ | 821,521 | ||||
| Ohio Higher Educational Facility Commission, Refunding RB, 4.00%, 10/01/47 |
2,500 | 2,457,953 | ||||||
| Ohio State University/The, 4.00%, 12/01/48 |
2,435 | 2,516,597 | ||||||
| Port of Greater Cincinnati Development Authority, RB, 4.25%, 12/01/50(b) |
385 | 295,740 | ||||||
| Southern Ohio Port Authority, RB, Series A, AMT, 7.00%, 12/01/42(b) |
2,315 | 2,171,442 | ||||||
|
|
|
|||||||
| 17,845,597 | ||||||||
| Oklahoma — 2.5% | ||||||||
| Oklahoma Development Finance Authority, RB |
||||||||
| 7.25%, 09/01/51(b) |
4,615 | 4,981,002 | ||||||
| Series B, 5.00%, 08/15/38 |
2,990 | 3,073,959 | ||||||
| Series B, 5.25%, 08/15/43 |
2,690 | 2,804,556 | ||||||
| Tulsa Authority for Economic Opportunity, TA, 4.38%, 12/01/41(b) |
330 | 277,142 | ||||||
| Tulsa County Industrial Authority, Refunding RB, 5.25%, 11/15/37 |
750 | 790,285 | ||||||
|
|
|
|||||||
| 11,926,944 | ||||||||
| Oregon — 0.7% | ||||||||
| Hospital Facilities Authority of Multnomah County Oregon, Refunding RB, Series A, 5.50%, 10/01/49 |
1,765 | 1,797,026 | ||||||
| Oregon State Facilities Authority, RB(b) |
||||||||
| Series A, 5.00%, 06/15/29 |
115 | 115,828 | ||||||
| Series A, 5.00%, 06/15/39 |
565 | 554,201 | ||||||
| Salem Hospital Facility Authority, Refunding RB, 4.00%, 05/15/47 |
1,000 | 937,495 | ||||||
|
|
|
|||||||
| 3,404,550 | ||||||||
| Pennsylvania — 2.5% | ||||||||
| Allentown Neighborhood Improvement Zone Development Authority, Refunding RB, Series A, 5.00%, 05/01/42 |
2,140 | 2,140,000 | ||||||
| Bucks County Industrial Development Authority, RB |
||||||||
| 4.00%, 07/01/46 |
100 | 91,344 | ||||||
| 4.00%, 07/01/51 |
100 | 90,482 | ||||||
| Northampton County Industrial Development Authority, TA, 7.00%, 07/01/32 |
1,655 | 1,700,567 | ||||||
| Pennsylvania Economic Development Financing Authority, Refunding RB, AMT, 5.50%, 11/01/44 |
2,710 | 2,763,541 | ||||||
| Pennsylvania Turnpike Commission, Refunding RB, Series B, 4.00%, 12/01/51 |
5,000 | 4,922,080 | ||||||
|
|
|
|||||||
| 11,708,014 | ||||||||
| Puerto Rico — 16.2% | ||||||||
| Children’s Trust Fund, RB, Series A, 0.00%, 05/15/57(d) |
44,330 | 2,580,937 | ||||||
| Children’s Trust Fund, Refunding RB, 5.63%, 05/15/43 |
850 | 864,586 | ||||||
| Commonwealth of Puerto Rico, GO |
||||||||
| 0.00%, 11/01/43(d) |
5,267 | 2,750,117 | ||||||
| 0.00%, 11/01/51(d) |
10,037 | 4,768,734 | ||||||
| Series A1, Restructured, 5.25%, 07/01/23 |
698 | 706,810 | ||||||
| Series A1, Restructured, 5.38%, 07/01/25 |
696 | 720,108 | ||||||
| Series A1, Restructured, 5.63%, 07/01/27 |
690 | 732,342 | ||||||
| Series A1, Restructured, 5.63%, 07/01/29 |
2,454 | 2,646,059 | ||||||
| Series A1, Restructured, 5.75%, 07/01/31 |
659 | 715,459 | ||||||
| Series A1, Restructured, 4.00%, 07/01/33 |
625 | 583,881 | ||||||
| Series A1, Restructured, 4.00%, 07/01/35 |
562 | 518,939 | ||||||
| Series A1, Restructured, 4.00%, 07/01/37 |
482 | 434,585 | ||||||
| Series A1, Restructured, 4.00%, 07/01/41 |
656 | 588,936 | ||||||
| Security | Par (000) |
Value | ||||||
| Puerto Rico (continued) |
||||||||
| Commonwealth of Puerto Rico, GO (continued) Series A1, Restructured, 4.00%, 07/01/46 |
$ | 682 | $ | 599,946 | ||||
| Commonwealth of Puerto Rico, GO, CAB(d) |
||||||||
| Series A, Restructured, 0.00%, 07/01/24 |
322 | 292,465 | ||||||
| Series A, Restructured, 0.00%, 07/01/33 |
805 | 459,155 | ||||||
| Puerto Rico Commonwealth Aqueduct & Sewer Authority, Refunding RB |
||||||||
| Series A, Senior Lien, 5.00%, 07/01/33 |
170 | 170,654 | ||||||
| Series A, Senior Lien, 5.00%, 07/01/35(b) |
1,780 | 1,875,639 | ||||||
| Series A, Senior Lien, 5.13%, 07/01/37 |
200 | 200,802 | ||||||
| Series A, Senior Lien, 5.75%, 07/01/37 |
1,290 | 1,296,496 | ||||||
| Series A, Senior Lien, 5.00%, 07/01/47(b) |
3,135 | 3,264,861 | ||||||
| Puerto Rico Electric Power Authority, RB |
||||||||
| 3rd Series, 5.40%, 01/01/23(a)(f) |
90 | 87,927 | ||||||
| Series A, 5.00%, 07/01/29(f)(g) |
660 | 646,248 | ||||||
| Series A, 7.00%, 07/01/33(f)(g) |
3,295 | 3,229,100 | ||||||
| Series A, 6.75%, 07/01/36(f)(g) |
1,335 | 1,308,300 | ||||||
| Series A, 5.00%, 07/01/42(f)(g) |
1,315 | 1,287,599 | ||||||
| Series A, 7.00%, 07/01/43(f)(g) |
375 | 367,500 | ||||||
| Series A-1, 10.00%, 07/01/19(f)(g) |
75 | 81,478 | ||||||
| Series A-2, 10.00%, 07/01/19(f)(g) |
379 | 411,061 | ||||||
| Series A-3, 10.00%, 07/01/19(f)(g) |
323 | 350,466 | ||||||
| Series B-3, 10.00%, 07/01/19(f)(g) |
323 | 350,466 | ||||||
| Series C-1, 5.40%, 01/01/18(f)(g) |
887 | 869,704 | ||||||
| Series C-2, 5.40%, 07/01/18(f)(g) |
888 | 869,845 | ||||||
| Series C-4, 5.40%, 07/01/20(f)(g) |
90 | 87,927 | ||||||
| Series CCC, 5.25%, 07/01/26(f)(g) |
260 | 254,582 | ||||||
| Series CCC, 5.25%, 07/01/28(f)(g) |
145 | 141,979 | ||||||
| Series D-1, 7.50%, 01/01/20(f)(g) |
761 | 745,558 | ||||||
| Series TT, 5.00%, 07/01/25(f)(g) |
100 | 97,916 | ||||||
| Series TT, 5.00%, 07/01/26(f)(g) |
225 | 220,312 | ||||||
| Series TT, 5.00%, 07/01/49(f)(g) |
295 | 288,853 | ||||||
| Series WW, 5.50%, 07/01/19(f)(g) |
200 | 195,833 | ||||||
| Series WW, 5.50%, 07/01/21 |
1,595 | 1,468,261 | ||||||
| Series WW, 5.38%, 07/01/22(f)(g) |
1,310 | 1,282,703 | ||||||
| Series WW, 5.25%, 07/01/33(f)(g) |
120 | 117,500 | ||||||
| Series WW, 5.50%, 07/01/38(f)(g) |
205 | 200,728 | ||||||
| Series WW, 5.50%, 07/01/49(f)(g) |
1,320 | 1,292,496 | ||||||
| Series XX, 5.25%, 07/01/27(f)(g) |
110 | 107,708 | ||||||
| Series XX, 5.25%, 07/01/35 |
585 | 538,516 | ||||||
| Series XX, 5.25%, 07/01/35(f)(g) |
60 | 58,750 | ||||||
| Series XX, 5.75%, 07/01/36(f)(g) |
860 | 842,080 | ||||||
| Series XX, 5.25%, 07/01/40(f)(g) |
1,020 | 998,746 | ||||||
| Puerto Rico Electric Power Authority,
Refunding |
||||||||
| Series AAA, 5.25%, 07/01/22 |
2,545 | 2,491,970 | ||||||
| Series AAA, 5.25%, 07/01/29 |
95 | 93,020 | ||||||
| Series UU, 1.00%, 07/01/19(a) |
115 | 103,500 | ||||||
| Series UU, 1.00%, 07/01/20(a) |
495 | 445,500 | ||||||
| Series UU, 1.35%, 07/01/31(a) |
580 | 522,000 | ||||||
| Series ZZ, 5.25%, 07/01/19 |
455 | 445,519 | ||||||
| Series ZZ, 5.25%, 07/01/24 |
345 | 337,811 | ||||||
| Series ZZ, 5.00%, 07/01/49 |
145 | 141,979 | ||||||
| Puerto Rico Electric Power Authority, Refunding RB, BAB, 6.13%, 07/01/40 |
1,085 | 998,786 | ||||||
| Puerto Rico Sales Tax Financing Corp. Sales Tax Revenue, RB |
||||||||
| Series A-1, Restructured, 4.75%, 07/01/53 |
2,453 | 2,483,466 | ||||||
| Series A-1, Restructured, 5.00%, 07/01/58 |
6,234 | 6,380,998 | ||||||
| Series A-2, Restructured, 4.33%, 07/01/40 |
6,129 | 6,077,565 | ||||||
| Series A-2, Restructured, 4.54%, 07/01/53 |
21 | 21,098 | ||||||
| S C H E D U L E O F I N V E S T M E N T S |
23 |
| Schedule of Investments (continued) April 30, 2022 |
BlackRock MuniAssets Fund, Inc. (MUA) (Percentages shown are based on Net Assets) |
| Security | Par (000) |
Value | ||||||
| Puerto Rico (continued) |
||||||||
| Puerto Rico Sales Tax Financing Corp. Sales Tax Revenue, RB (continued) |
||||||||
| Series A-2, Restructured, 4.78%, 07/01/58 |
$ | 2,080 | $ | 2,115,304 | ||||
| Series B-1, Restructured, 4.55%, 07/01/40 |
2,402 | 2,425,381 | ||||||
| Puerto Rico Sales Tax Financing Corp. Sales Tax Revenue, RB, CAB(d) |
||||||||
| Series A-1, Restructured, 0.00%, 07/01/24 |
1,406 | 1,323,421 | ||||||
| Series A-1, Restructured, 0.00%, 07/01/29 |
1,079 | 878,706 | ||||||
| Series A-1, Restructured, 0.00%, 07/01/31 |
686 | 513,583 | ||||||
| Series A-1, Restructured, 0.00%, 07/01/33 |
337 | 228,425 | ||||||
| Series A-1, Restructured, 0.00%, 07/01/46 |
10,261 | 2,882,900 | ||||||
| Series A-1, Restructured, 0.00%, 07/01/51 |
2,333 | 488,717 | ||||||
| Series B-1, Restructured, 0.00%, 07/01/46 |
883 | 248,146 | ||||||
|
|
|
|||||||
| 77,219,448 | ||||||||
| Rhode Island — 2.1% | ||||||||
| Central Falls Detention Facility Corp., Refunding RB, 7.25%, 07/15/35(f)(g) |
4,190 | 628,500 | ||||||
| Tobacco Settlement Financing Corp., Refunding RB |
||||||||
| Series A, 5.00%, 06/01/40 |
980 | 1,010,265 | ||||||
| Series B, 4.50%, 06/01/45 |
5,055 | 5,109,291 | ||||||
| Series B, 5.00%, 06/01/50 |
3,330 | 3,452,531 | ||||||
|
|
|
|||||||
| 10,200,587 | ||||||||
| South Carolina — 0.1% |
||||||||
| South Carolina Jobs-Economic Development Authority, RB, Series A, 5.00%, 11/15/54 |
345 | 323,878 | ||||||
|
|
|
|||||||
| Tennessee — 0.5% | ||||||||
| Memphis-Shelby County Industrial Development Board, Refunding TA |
||||||||
| Series A, 5.50%, 07/01/37 |
925 | 682,874 | ||||||
| Series A, 5.63%, 01/01/46 |
1,085 | 820,303 | ||||||
| Metropolitan Government Nashville & Davidson County Industrial Development Board, SAB, CAB, 0.00%, 06/01/43(b)(d) |
3,270 | 1,032,987 | ||||||
|
|
|
|||||||
| 2,536,164 | ||||||||
| Texas — 7.7% | ||||||||
| Angelina & Neches River Authority, RB, Series A, AMT, 7.50%, 12/01/45(b) |
715 | 614,703 | ||||||
| Arlington Higher Education Finance Corp., RB, 5.00%, 06/15/51 |
715 | 655,775 | ||||||
| Arlington Higher Education Finance Corp., Refunding RB, Series S, 5.00%, 08/15/41 |
370 | 370,931 | ||||||
| Brazoria County Industrial Development Corp., RB, AMT, 7.00%, 03/01/39 |
675 | 705,850 | ||||||
| Central Texas Regional Mobility Authority, Refunding RB, CAB(d) |
||||||||
| 0.00%, 01/01/28 |
1,000 | 824,485 | ||||||
| 0.00%, 01/01/29 |
2,000 | 1,583,716 | ||||||
| 0.00%, 01/01/30 |
1,170 | 886,881 | ||||||
| 0.00%, 01/01/33 |
3,690 | 2,418,559 | ||||||
| 0.00%, 01/01/34 |
4,000 | 2,489,528 | ||||||
| City of Houston Texas Airport System Revenue, RB, Series A, AMT, 6.63%, 07/15/38 |
2,890 | 2,896,566 | ||||||
| City of Houston Texas Airport System Revenue, Refunding ARB, AMT, 5.00%, 07/15/27 |
250 | 264,487 | ||||||
| City of Houston Texas Airport System Revenue, Refunding RB |
||||||||
| AMT, 5.00%, 07/01/29 |
730 | 751,891 | ||||||
| Series C, AMT, 5.00%, 07/15/27 |
1,615 | 1,707,804 | ||||||
| Security | Par (000) |
Value | ||||||
| Texas (continued) |
||||||||
| City of Houston TX Airport System Revenue, Refunding RB, Series A, AMT, 4.00%, 07/01/46 |
$ | 3,000 | $ | 2,930,061 | ||||
| City of San Marcos, SAB(b) |
||||||||
| 4.00%, 09/01/32 |
100 | 91,281 | ||||||
| 4.50%, 09/01/51 |
480 | 389,200 | ||||||
| City of Sinton TX, Refunding SAB(b) |
||||||||
| 5.13%, 09/01/42 |
858 | 744,437 | ||||||
| 5.25%, 09/01/51 |
1,195 | 1,004,265 | ||||||
| Harris County Cultural Education Facilities Finance Corp., RB, Series B, 7.00%, 01/01/23(c) |
475 | 491,199 | ||||||
| Hidalgo County Regional Mobility Authority, RB |
||||||||
| Series A, Senior Lien, 4.00%, 12/01/39 |
255 | 239,693 | ||||||
| Series A, Senior Lien, 4.00%, 12/01/40 |
255 | 238,247 | ||||||
| Series A, Senior Lien, 4.00%, 12/01/41 |
255 | 236,937 | ||||||
| Hidalgo County Regional Mobility Authority, Refunding RB |
||||||||
| Junior Lien, 4.00%, 12/01/37 |
820 | 772,026 | ||||||
| Series B, Junior Lien, 4.00%, 12/01/38 |
415 | 389,607 | ||||||
| Mission Economic Development Corp., Refunding RB, AMT, Senior Lien, 4.63%, 10/01/31(b) |
785 | 821,360 | ||||||
| New Hope Cultural Education Facilities Finance Corp., RB |
||||||||
| Series A, 5.88%, 04/01/23(c) |
1,210 | 1,250,871 | ||||||
| Series A, 6.00%, 04/01/23(c) |
1,845 | 1,909,394 | ||||||
| Series A, 0.00%, 12/01/25(b)(d) |
1,140 | 1,276,800 | ||||||
| New Hope Higher Education Finance Corp., RB, Series A, 5.75%, 06/15/51(b) |
1,650 | 1,354,747 | ||||||
| Newark Higher Education Finance Corp., RB(b) |
||||||||
| Series A, 5.50%, 08/15/35 |
290 | 301,221 | ||||||
| Series A, 5.75%, 08/15/45 |
580 | 600,729 | ||||||
| Port Beaumont Navigation District, RB, AMT, 2.75%, 01/01/36(b) |
700 | 566,384 | ||||||
| Tarrant County Cultural Education Facilities Finance Corp., Refunding RB, 5.00%, 10/01/49 |
865 | 892,859 | ||||||
| Texas Transportation Commission, RB, CAB(d) |
||||||||
| 0.00%, 08/01/46 |
1,420 | 445,897 | ||||||
| 0.00%, 08/01/47 |
2,120 | 632,672 | ||||||
| 0.00%, 08/01/48 |
2,235 | 633,710 | ||||||
| 0.00%, 08/01/49 |
2,100 | 565,982 | ||||||
| 0.00%, 08/01/50 |
3,015 | 768,502 | ||||||
| 0.00%, 08/01/51 |
1,770 | 427,059 | ||||||
| 0.00%, 08/01/52 |
1,770 | 403,887 | ||||||
| 0.00%, 08/01/53 |
160 | 34,576 | ||||||
|
|
|
|||||||
| 36,584,779 | ||||||||
| Utah — 1.8% | ||||||||
| City of Salt Lake City Utah Airport Revenue, ARB, Series A, AMT, 4.00%, 07/01/51 |
8,500 | 8,065,242 | ||||||
| Utah Charter School Finance Authority, RB(b) |
||||||||
| Series A, 5.00%, 06/15/41 |
205 | 208,324 | ||||||
| Series A, 5.00%, 06/15/52 |
265 | 261,534 | ||||||
|
|
|
|||||||
| 8,535,100 | ||||||||
| Vermont — 0.7% | ||||||||
| East Central Vermont Telecommunications District, RB, Series A, 4.50%, 12/01/44(b) |
4,000 | 3,430,116 | ||||||
|
|
|
|||||||
| Virginia — 2.8% | ||||||||
| Albemarle County Economic Development Authority, Refunding RB, 4.00%, 06/01/42 |
2,030 | 2,022,534 | ||||||
| 24 | 2 0 2 2 B L A C K R O C K A N N U A L R E P O R T T O S H A R E H O L D E R S |
| Schedule of Investments (continued) April 30, 2022 |
BlackRock MuniAssets Fund, Inc. (MUA) (Percentages shown are based on Net Assets) |
| Security | Par (000) |
Value | ||||||
| Virginia (continued) |
||||||||
| Lower Magnolia Green Community Development Authority, SAB(b) |
||||||||
| 5.00%, 03/01/35 |
$ | 495 | $ | 501,970 | ||||
| 5.00%, 03/01/45 |
505 | 507,627 | ||||||
| Norfolk Redevelopment & Housing Authority, RB |
||||||||
| Series A, 4.00%, 01/01/29 |
300 | 300,396 | ||||||
| Series A, 5.00%, 01/01/34 |
485 | 507,642 | ||||||
| Series A, 5.00%, 01/01/49 |
955 | 988,021 | ||||||
| Tobacco Settlement Financing Corp., Refunding RB, Series B-1, 5.00%, 06/01/47 |
2,370 | 2,295,428 | ||||||
| Virginia Housing Development Authority, RB, M/F Housing, Series K, (FHLMC, FNMA, GNMA), 2.38%, 12/01/41 |
1,000 | 786,625 | ||||||
| Virginia Small Business Financing Authority, Refunding RB |
||||||||
| AMT, Senior Lien, 6.00%, 01/01/37 |
4,440 | 4,468,256 | ||||||
| AMT, Senior Lien, 4.00%, 01/01/48 |
840 | 770,378 | ||||||
|
|
|
|||||||
| 13,148,877 | ||||||||
| Washington — 1.2% |
||||||||
| Greater Wenatchee Regional Events Center Public District, RB, Series A, 5.50%, 09/01/22(c) |
1,495 | 1,513,749 | ||||||
| Washington State Convention Center Public Facilities District, RB |
||||||||
| 4.00%, 07/01/31 |
1,315 | 1,283,971 | ||||||
| 3.00%, 07/01/58 |
2,115 | 1,355,685 | ||||||
| Washington State Housing Finance Commission, RB(b) |
||||||||
| Series A, 5.00%, 07/01/50 |
225 | 230,010 | ||||||
| Series A, 5.00%, 07/01/56 |
255 | 258,274 | ||||||
| Washington State Housing Finance Commission, Refunding RB(b) |
||||||||
| 5.75%, 01/01/35 |
315 | 324,920 | ||||||
| 6.00%, 01/01/45 |
850 | 875,116 | ||||||
|
|
|
|||||||
| 5,841,725 | ||||||||
| Wisconsin — 6.8% | ||||||||
| Public Finance Authority, ARB, AMT, 4.25%, 07/01/54 |
1,595 | 1,341,486 | ||||||
| Public Finance Authority, RB |
||||||||
| 5.00%, 06/15/39 |
175 | 188,862 | ||||||
| 5.00%, 06/15/41(b) |
345 | 317,375 | ||||||
| 5.00%, 01/01/42(b) |
605 | 604,234 | ||||||
| 6.85%, 11/01/46(b) |
900 | 900,263 | ||||||
| 7.00%, 11/01/46(b) |
570 | 573,427 | ||||||
| 5.00%, 06/15/49 |
530 | 561,363 | ||||||
| 5.63%, 06/15/49(b) |
2,500 | 2,311,667 | ||||||
| 5.00%, 04/01/50(b) |
115 | 116,310 | ||||||
| 5.25%, 12/01/51(b) |
1,470 | 1,125,313 | ||||||
| 5.00%, 06/15/53 |
355 | 375,423 | ||||||
| 5.00%, 06/15/55(b) |
895 | 767,667 | ||||||
| 5.00%, 01/01/56(b) |
1,470 | 1,401,594 | ||||||
| 4.75%, 06/15/56(b) |
3,000 | 2,346,798 | ||||||
| 5.00%, 06/15/56(b) |
495 | 410,880 | ||||||
| Series A, 6.25%, 10/01/31(b) |
605 | 592,136 | ||||||
| Series A, 5.38%, 06/01/44(b) |
555 | 488,602 | ||||||
| Series A, 7.00%, 10/01/47(b) |
605 | 582,957 | ||||||
| Series A, 5.63%, 06/15/49(b) |
2,950 | 2,881,737 | ||||||
| Series A, 5.50%, 06/01/54(b) |
680 | 583,290 | ||||||
| Series A, 5.00%, 06/15/55(b) |
4,030 | 3,430,259 | ||||||
| Series A-1, 4.50%, 01/01/35(b) |
1,225 | 1,128,486 | ||||||
| Series A-1, 5.50%, 12/01/48(b)(f)(g) |
20 | 6,578 | ||||||
| Series A-1, 5.00%, 01/01/55(b) |
2,640 | 2,411,421 | ||||||
| Security | Par (000) |
Value | ||||||
| Wisconsin (continued) |
||||||||
| Public Finance Authority, RB (continued) |
||||||||
| Series B, 0.00%, 01/01/35(b)(d) |
$ | 1,720 | $ | 655,138 | ||||
| Series B, 0.00%, 01/01/60(b)(d) |
35,940 | 1,882,933 | ||||||
| AMT, 4.00%, 09/30/51 |
980 | 933,356 | ||||||
| AMT, 4.00%, 03/31/56 |
1,025 | 958,864 | ||||||
| Public Finance Authority, Refunding RB(b) |
||||||||
| 4.00%, 04/01/32 |
205 | 203,612 | ||||||
| 4.00%, 04/01/42 |
225 | 205,659 | ||||||
| 4.00%, 04/01/52 |
275 | 239,105 | ||||||
| Wisconsin Health & Educational Facilities Authority, Refunding RB |
||||||||
| 5.00%, 11/01/46 |
470 | 458,699 | ||||||
| 4.00%, 01/01/47 |
1,300 | 1,120,304 | ||||||
| 4.00%, 01/01/57 |
350 | 281,624 | ||||||
|
|
|
|||||||
| 32,387,422 | ||||||||
|
|
|
|||||||
| Total Municipal Bonds — 128.8% |
|
612,354,299 | ||||||
|
|
|
|||||||
| Municipal Bonds Transferred to Tender Option Bond Trusts(h) |
| |||||||
| Illinois — 1.4% | ||||||||
| Illinois Finance Authority, Refunding RB |
||||||||
| Series C, 4.00%, 02/15/27(c) |
4 | 3,757 | ||||||
| Series C, 4.00%, 02/15/41 |
1,495 | 1,497,779 | ||||||
| Illinois State Toll Highway Authority, RB, Series A, 5.00%, 01/01/40 |
5,056 | 5,278,224 | ||||||
|
|
|
|||||||
| 6,779,760 | ||||||||
| Massachusetts — 0.5% | ||||||||
| Commonwealth of Massachusetts Transportation Fund Revenue, RB, Series A, 4.00%, 06/01/45 |
2,268 | 2,283,159 | ||||||
|
|
|
|||||||
| New Jersey — 0.8% | ||||||||
| New Jersey Health Care Facilities Financing Authority, RB, 4.00%, 07/01/51 |
3,687 | 3,641,577 | ||||||
|
|
|
|||||||
| New York — 8.4% | ||||||||
| New York City Housing Development Corp., RB, M/F Housing |
||||||||
| Series C-1A, 4.15%, 11/01/39 |
1,893 | 1,876,975 | ||||||
| Series C-1A, 4.20%, 11/01/44 |
3,470 | 3,440,036 | ||||||
| Series C-1A, 4.30%, 11/01/47 |
2,840 | 2,815,462 | ||||||
| Series D-1B, 4.25%, 11/01/45 |
8,995 | 8,910,780 | ||||||
| New York City Water & Sewer System, Refunding RB |
||||||||
| Series CC, 5.00%, 06/15/23(c) |
6,665 | 6,835,262 | ||||||
| Series CC, 5.00%, 06/15/47 |
7,516 | 7,708,788 | ||||||
| New York Power Authority, Refunding RB, Series A, 4.00%, 11/15/60 |
1,444 | 1,404,920 | ||||||
| New York State Dormitory Authority, Refunding RB, Series D, 4.00%, 02/15/47 |
6,956 | 6,892,547 | ||||||
|
|
|
|||||||
| 39,884,770 | ||||||||
| Pennsylvania — 0.6% | ||||||||
| Pennsylvania Turnpike Commission, RB, Sub-Series A, 5.50%, 12/01/42 |
2,505 | 2,681,827 | ||||||
|
|
|
|||||||
| Rhode Island — 0.3% | ||||||||
| Narragansett Bay Commission, Refunding RB, Series A, 4.00%, 09/01/22(c) |
1,710 | 1,724,256 | ||||||
|
|
|
|||||||
| S C H E D U L E O F I N V E S T M E N T S |
25 |
| Schedule of Investments (continued) April 30, 2022 |
BlackRock MuniAssets Fund, Inc. (MUA) (Percentages shown are based on Net Assets) |
| Security | Par (000) |
Value | ||||||
|
|
||||||||
| Texas — 0.5% |
||||||||
| Lower Colorado River Authority, Refunding, RB, 4.00%, 05/15/43 |
$ | 2,271 | $ | 2,272,478 | ||||
|
|
|
|||||||
| Wisconsin — 0.2% | ||||||||
| Wisconsin Health & Educational Facilities Authority, Refunding RB, 4.00%, 12/01/46 |
1,142 | 1,146,215 | ||||||
|
|
|
|||||||
| Total Municipal Bonds Transferred to Tender Option Bond Trusts — 12.7% |
|
60,414,042 | ||||||
|
|
|
|||||||
| Total Long-Term Investments — 142.0% |
|
675,327,304 | ||||||
|
|
|
|||||||
| Shares | ||||||||
|
|
||||||||
| Short-Term Securities |
| |||||||
| Money Market Funds — 1.4% | ||||||||
| BlackRock Liquidity Funds, MuniCash, Institutional Class, 0.25%(i)(j) |
6,592,558 | 6,592,558 | ||||||
|
|
|
|||||||
| Total Short-Term Securities — 1.4% |
|
6,592,558 | ||||||
|
|
|
|||||||
| Total Investments — 143.4% |
|
681,919,862 | ||||||
| Other Assets Less Liabilities — 2.2% |
|
10,276,063 | ||||||
| Liability for TOB Trust Certificates, Including Interest Expense and Fees Payable — (8.8)% |
|
(41,755,096 | ) | |||||
| VRDP Shares at Liquidation Value, Net of Deferred Offering Costs — (36.8)% |
|
(174,914,674 | ) | |||||
|
|
|
|||||||
| Net Assets Applicable to Common Shares — 100.0% |
|
$ | 475,526,155 | |||||
|
|
|
|||||||
| (a) | Variable rate security. Interest rate resets periodically. The rate shown is the effective interest rate as of period end. Security description also includes the reference rate and spread if published and available. |
| (b) | Security exempt from registration pursuant to Rule 144A under the Securities Act of 1933, as amended. These securities may be resold in transactions exempt from registration to qualified institutional investors. |
| (c) | U.S. Government securities held in escrow, are used to pay interest on this security as well as to retire the bond in full at the date indicated, typically at a premium to par. |
| (d) | Zero-coupon bond. |
| (e) | Step coupon security. Coupon rate will either increase (step-up bond) or decrease (step-down bond) at regular intervals until maturity. Interest rate shown reflects the rate currently in effect. |
| (f) | Issuer filed for bankruptcy and/or is in default. |
| (g) | Non-income producing security. |
| (h) | Represent bonds transferred to a TOB Trust in exchange of cash and residual certificates received by the Fund. These bonds serve as collateral in a secured borrowing. See Note 4 of the Notes to Financial Statements for details. |
| (i) | Affiliate of the Fund. |
| (j) | Annualized 7-day yield as of period end. |
Affiliates
Investments in issuers considered to be affiliate(s) of the Fund during the year ended April 30, 2022 for purposes of Section 2(a)(3) of the Investment Company Act of 1940, as amended, were as follows:
| Affiliated Issuer | Value at 04/30/21 |
Purchases at Cost |
Proceeds from Sales |
Net Realized |
Change in Unrealized Appreciation (Depreciation) |
Value at 04/30/22 |
Shares Held at 04/30/22 |
Income | Capital Gain Distributions from Underlying Funds |
|||||||||||||||||||||||||||
| BlackRock Liquidity Funds, MuniCash, Institutional Class |
$ | — | $ | 6,605,630 | (a) | $ | — | $ | (13,731 | ) | $ | 659 | $ | 6,592,558 | 6,592,558 | $ | 7,876 | $ | — | |||||||||||||||||
|
|
|
|
|
|
|
|
|
|
|
|||||||||||||||||||||||||||
| (a) | Represents net amount purchased (sold). |
Derivative Financial Instruments Outstanding as of Period End
Futures Contracts
| Description | Number of Contracts |
Expiration Date |
Notional Amount (000) |
Value/ Unrealized Appreciation (Depreciation) |
||||||||||||
| Short Contracts |
||||||||||||||||
| 10-Year U.S. Treasury Note |
151 | 06/21/22 | $ | 17,976 | $ | 738,521 | ||||||||||
| U.S. Long Bond |
200 | 06/21/22 | 28,100 | 1,615,316 | ||||||||||||
| 5-Year U.S. Treasury Note |
131 | 06/30/22 | 14,746 | 382,896 | ||||||||||||
|
|
|
|||||||||||||||
| $ | 2,736,733 | |||||||||||||||
|
|
|
|||||||||||||||
| 26 | 2 0 2 2 B L A C K R O C K A N N U A L R E P O R T T O S H A R E H O L D E R S |
| Schedule of Investments (continued) April 30, 2022 |
BlackRock MuniAssets Fund, Inc. (MUA) |
Derivative Financial Instruments Categorized by Risk Exposure
As of period end, the fair values of derivative financial instruments located in the Statements of Assets and Liabilities were as follows:
| Commodity Contracts |
Credit Contracts |
Equity Contracts |
Foreign Currency Exchange Contracts |
Interest Rate Contracts |
Other Contracts |
Total | ||||||||||||||||||||||
| Assets — Derivative Financial Instruments |
|
|||||||||||||||||||||||||||
| Futures contracts |
||||||||||||||||||||||||||||
| Unrealized appreciation on futures contracts(a) |
$ | — | $ | — | $ | — | $ | — | $ | 2,736,733 | $ | — | $ | 2,736,733 | ||||||||||||||
|
|
|
|
|
|
|
|
|
|
|
|
|
|
|
|||||||||||||||
| (a) | Net cumulative unrealized appreciation (depreciation) on futures contracts and centrally cleared swaps, if any, are reported in the Schedule of Investments. In the Statements of Assets and Liabilities, only current day’s variation margin is reported in receivables or payables and the net cumulative unrealized appreciation (depreciation) is included in accumulated earnings (loss). |
For the period ended April 30, 2022, the effect of derivative financial instruments in the Statements of Operations was as follows:
| Commodity Contracts |
Credit Contracts |
Equity Contracts |
Foreign Currency Exchange Contracts |
Interest Rate Contracts |
Other Contracts |
Total | ||||||||||||||||||||||
| Net Realized Gain (Loss) from: |
||||||||||||||||||||||||||||
| Futures contracts |
$ | — | $ | — | $ | — | $ | — | $ | 296,340 | $ | — | $ | 296,340 | ||||||||||||||
|
|
|
|
|
|
|
|
|
|
|
|
|
|
|
|||||||||||||||
| Net Change in Unrealized Appreciation (Depreciation) on: |
||||||||||||||||||||||||||||
| Futures contracts |
$ | — | $ | — | $ | — | $ | — | $ | 2,824,866 | $ | — | $ | 2,824,866 | ||||||||||||||
|
|
|
|
|
|
|
|
|
|
|
|
|
|
|
|||||||||||||||
Average Quarterly Balances of Outstanding Derivative Financial Instruments
| Futures contracts: |
||||
| Average notional value of contracts — short |
$ | 18,738,035 | ||
For more information about the Fund’s investment risks regarding derivative financial instruments, refer to the Notes to Financial Statements.
Fair Value Hierarchy as of Period End
Various inputs are used in determining the fair value of financial instruments. For a description of the input levels and information about the Fund’s policy regarding valuation of financial instruments, refer to the Notes to Financial Statements.
The following table summarizes the Fund’s financial instruments categorized in the fair value hierarchy. The breakdown of the Fund’s financial instruments into major categories is disclosed in the Schedule of Investments above.
| Level 1 | Level 2 | Level 3 | Total | |||||||||||||
| Assets |
||||||||||||||||
| Investments |
||||||||||||||||
| Long-Term Investments |
||||||||||||||||
| Corporate Bonds |
$ | — | $ | 2,558,963 | $ | — | $ | 2,558,963 | ||||||||
| Municipal Bonds |
— | 612,354,299 | — | 612,354,299 | ||||||||||||
| Municipal Bonds Transferred to Tender Option Bond Trusts |
— | 60,414,042 | — | 60,414,042 | ||||||||||||
| Short-Term Securities |
||||||||||||||||
| Money Market Funds |
6,592,558 | — | — | 6,592,558 | ||||||||||||
|
|
|
|
|
|
|
|
|
|||||||||
| $ | 6,592,558 | $ | 675,327,304 | $ | — | $ | 681,919,862 | |||||||||
|
|
|
|
|
|
|
|
|
|||||||||
| Derivative Financial Instruments(a) |
||||||||||||||||
| Assets |
||||||||||||||||
| Interest Rate Contracts |
$ | 2,736,733 | $ | — | $ | — | $ | 2,736,733 | ||||||||
|
|
|
|
|
|
|
|
|
|||||||||
| (a) | Derivative financial instruments are futures contracts. Futures contracts are valued at the unrealized appreciation (depreciation) on the instrument. |
| S C H E D U L E O F I N V E S T M E N T S |
27 |
| Schedule of Investments (continued) April 30, 2022 |
BlackRock MuniAssets Fund, Inc. (MUA) |
The Fund may hold assets and/or liabilities in which the fair value approximates the carrying amount for financial statement purposes. As of period end, such assets and/or liabilities are categorized within the fair value hierarchy as follows:
|
|
||||||||||||||||
| Level 1 | Level 2 | Level 3 | Total | |||||||||||||
|
|
||||||||||||||||
| Liabilities |
||||||||||||||||
| TOB Trust Certificates |
$ | — | $ | (41,711,683 | ) | $ | — | $ | (41,711,683 | ) | ||||||
| VRDP Shares at Liquidation Value |
— | (175,000,000 | ) | — | (175,000,000 | ) | ||||||||||
|
|
|
|
|
|
|
|
|
|||||||||
| $ | — | $ | (216,711,683 | ) | $ | — | $ | (216,711,683 | ) | |||||||
|
|
|
|
|
|
|
|
|
|||||||||
See notes to financial statements.
| 28 | 2 0 2 2 B L A C K R O C K A N N U A L R E P O R T T O S H A R E H O L D E R S |
| Schedule of Investments April 30, 2022 |
BlackRock Municipal Income Fund, Inc. (MUI) (Percentages shown are based on Net Assets) |
| Security | Par (000) |
Value | ||||||
| Municipal Bonds |
||||||||
| Alabama(a) — 0.7% |
||||||||
| Black Belt Energy Gas District, RB, Series A, 4.00%, 12/01/52 |
$ | 3,015 | $ | 3,127,375 | ||||
| Southeast Energy Authority A Cooperative District, RB, Series B, 4.00%, 12/01/51 |
3,700 | 3,727,824 | ||||||
|
|
|
|||||||
| 6,855,199 | ||||||||
| Arizona — 3.7% | ||||||||
| Arizona Industrial Development Authority, RB(b) |
||||||||
| 4.00%, 07/01/29 |
500 | 503,076 | ||||||
| 4.38%, 07/01/39 |
1,015 | 1,026,534 | ||||||
| Series A, 3.55%, 07/15/29 |
1,300 | 1,249,106 | ||||||
| Series A, 5.00%, 07/01/39 |
855 | 864,567 | ||||||
| Series A, 5.00%, 07/01/49 |
965 | 965,983 | ||||||
| Series A, 5.00%, 07/01/54 |
745 | 738,504 | ||||||
| Series B, 4.25%, 07/01/27 |
385 | 390,169 | ||||||
| City of Phoenix Civic Improvement Corp., ARB, Series B, AMT, Junior Lien, 5.00%, 07/01/35 |
4,000 | 4,305,428 | ||||||
| Glendale Union High School District No.205, GO |
||||||||
| Series C, (BAM), 5.00%, 07/01/24 |
1,945 | 2,009,160 | ||||||
| Series C, (BAM), 5.00%, 07/01/27 |
500 | 515,812 | ||||||
| Industrial Development Authority of the City of Phoenix, RB, Series A, 5.75%, 07/01/24(b) |
475 | 484,076 | ||||||
| Industrial Development Authority of the City of Phoenix, Refunding RB, Series A, 5.00%, 07/01/25 |
300 | 317,149 | ||||||
| Industrial Development Authority of the County of Pima, RB(b) |
||||||||
| 5.00%, 07/01/29 |
300 | 302,613 | ||||||
| 5.00%, 06/15/47 |
1,480 | 1,483,392 | ||||||
| Industrial Development Authority of the County of Pima, Refunding RB(b) |
||||||||
| 4.13%, 06/15/29 |
350 | 350,450 | ||||||
| 5.00%, 06/15/52 |
825 | 826,470 | ||||||
| Maricopa County Industrial Development Authority, Refunding RB |
||||||||
| 4.00%, 07/01/29(b) |
295 | 286,721 | ||||||
| 5.00%, 07/01/39(b) |
360 | 363,841 | ||||||
| 5.00%, 07/01/54(b) |
820 | 796,866 | ||||||
| Series A, 5.00%, 09/01/32 |
1,000 | 1,097,332 | ||||||
| Series A, 5.00%, 09/01/33 |
800 | 874,146 | ||||||
| Series A, 5.00%, 09/01/34 |
1,000 | 1,088,519 | ||||||
| Series A, 5.00%, 01/01/38 |
3,000 | 3,172,926 | ||||||
| Phoenix-Mesa Gateway Airport Authority, ARB |
||||||||
| AMT, 5.00%, 07/01/27 |
700 | 703,077 | ||||||
| AMT, 5.00%, 07/01/32 |
1,925 | 1,932,660 | ||||||
| Salt River Project Agricultural Improvement & Power District, RB, 4.00%, 01/01/41 |
10,000 | 10,487,900 | ||||||
|
|
|
|||||||
| 37,136,477 | ||||||||
| Arkansas — 0.6% | ||||||||
| Arkansas Development Finance Authority, RB, Series A, AMT, 4.50%, 09/01/49(b) |
2,395 | 2,208,370 | ||||||
| City of Benton Arkansas, RB, (AGM), 5.00%, 06/01/29 |
1,055 | 1,103,160 | ||||||
| University of Arkansas, Refunding RB, 5.00%, 03/01/31 |
2,315 | 2,461,090 | ||||||
|
|
|
|||||||
| 5,772,620 | ||||||||
| California — 13.9% | ||||||||
| California Community Choice Financing Authority, RB, Series B-1, 4.00%, 02/01/52(a) |
4,390 | 4,442,768 | ||||||
| Security | Par (000) |
Value | ||||||
| California (continued) |
||||||||
| California Community Housing Agency, RB, M/F Housing(b) |
||||||||
| Series A, 5.00%, 04/01/49 |
$ | 370 | $ | 318,009 | ||||
| Series A-2, 4.00%, 08/01/47 |
2,380 | 1,914,567 | ||||||
| California Housing Finance Agency, RB, M/F Housing, Class A, 3.25%, 08/20/36 |
2,171 | 2,078,647 | ||||||
| California Municipal Finance Authority, RB |
||||||||
| Series A, 4.00%, 10/01/29(b) |
420 | 415,078 | ||||||
| Series A, 3.00%, 02/01/46 |
485 | 377,929 | ||||||
| Series A, 4.00%, 02/01/51 |
375 | 361,337 | ||||||
| California School Finance Authority, RB, 5.00%, 08/01/42(b)(c) |
875 | 901,305 | ||||||
| California State Public Works Board, RB |
||||||||
| Series I, 5.50%, 11/01/30 |
4,500 | 4,705,056 | ||||||
| Series I, 5.50%, 11/01/33 |
2,000 | 2,094,732 | ||||||
| California State University, Refunding RB, Series A, 5.00%, 11/01/42 |
3,500 | 3,746,820 | ||||||
| City of Los Angeles Department of Airports, ARB |
||||||||
| AMT, 4.00%, 05/15/39 |
355 | 352,936 | ||||||
| AMT, 4.00%, 05/15/40 |
390 | 386,123 | ||||||
| AMT, 4.00%, 05/15/41 |
450 | 442,409 | ||||||
| AMT, 5.00%, 05/15/45 |
8,500 | 9,235,054 | ||||||
| City of Los Angeles Department of Airports, Refunding ARB |
||||||||
| Series A, AMT, 5.00%, 05/15/46 |
3,670 | 3,962,246 | ||||||
| Series D, AMT, 4.00%, 05/15/39 |
7,000 | 6,959,309 | ||||||
| CMFA Special Finance Agency XII, RB, M/F Housing, Series A, 3.25%, 02/01/57(b) |
1,110 | 832,779 | ||||||
| County of Santa Barbara California, COP, Series B, AMT, 5.25%, 12/01/33 |
10,330 | 11,393,928 | ||||||
| CSCDA Community Improvement Authority, RB, M/F Housing(b) |
||||||||
| 5.00%, 09/01/37 |
190 | 171,335 | ||||||
| Class 2, 4.00%, 06/01/58 |
4,185 | 3,312,859 | ||||||
| Senior Lien, 3.13%, 06/01/57 |
1,320 | 920,308 | ||||||
| Class 2, Senior Lien, 4.00%, 12/01/58 |
4,050 | 3,253,110 | ||||||
| CSCDA Community Improvement Authority, RB, S/F Housing, 3.00%, 03/01/57(b) |
760 | 537,675 | ||||||
| Glendale Community College District/CA, GO, Series B, 4.00%, 08/01/50 |
6,750 | 6,988,964 | ||||||
| Golden State Tobacco Securitization Corp., Refunding RB, Series A-1, 5.00%, 06/01/28(d) |
12,500 | 14,226,483 | ||||||
| Golden State Tobacco Securitization Corp., Refunding RB, CAB, Series B, Subordinate, 0.00%, 06/01/66(e) |
6,675 | 731,220 | ||||||
| Manteca Financing Authority, RB, Series A, (AGC-ICC), 5.75%, 12/01/36 |
3,285 | 3,293,587 | ||||||
| Regents of the University of California Medical Center Pooled Revenue, RB, 4.00%, 05/15/53(c) |
6,155 | 5,956,304 | ||||||
| Regents of the University of California Medical Center Pooled Revenue, Refunding RB, Series J, 5.25%, 05/15/38 |
2,705 | 2,778,338 | ||||||
| Riverside County Transportation Commission, Refunding RB |
||||||||
| 2nd Lien, 4.00%, 06/01/47 |
590 | 557,014 | ||||||
| Senior Lien, 4.00%, 06/01/40 |
1,400 | 1,408,179 | ||||||
| Senior Lien, 3.00%, 06/01/49 |
410 | 300,462 | ||||||
| San Diego County Regional Airport Authority, Refunding ARB |
||||||||
| AMT, Subordinate, 5.00%, 07/01/32 |
1,000 | 1,089,622 | ||||||
| AMT, Subordinate, 5.00%, 07/01/33 |
1,030 | 1,116,700 | ||||||
| S C H E D U L E O F I N V E S T M E N T S |
29 |
| Schedule of Investments (continued) April 30, 2022 |
BlackRock Municipal Income Fund, Inc. (MUI) (Percentages shown are based on Net Assets) |
| Security | Par (000) |
Value | ||||||
| California (continued) |
||||||||
| San Diego County Regional Airport Authority, Refunding ARB (continued) |
||||||||
| AMT, Subordinate, 5.00%, 07/01/34 |
$ | 1,000 | $ | 1,083,110 | ||||
| San Francisco City & County Airport Comm-San Francisco International Airport, Refunding ARB |
||||||||
| Series A, AMT, 5.25%, 05/01/33 |
6,370 | 6,504,139 | ||||||
| Series A, AMT, 5.00%, 05/01/38 |
3,040 | 3,231,204 | ||||||
| Series A, AMT, 5.00%, 05/01/44 |
3,430 | 3,504,294 | ||||||
| Series B, AMT, 5.00%, 05/01/46 |
7,855 | 8,129,729 | ||||||
| State of California, GO, 5.50%, 04/01/28 |
15 | 15,038 | ||||||
| Transbay Joint Powers Authority, TA |
||||||||
| Series A, 5.00%, 10/01/35 |
700 | 766,659 | ||||||
| Series A, 5.00%, 10/01/36 |
800 | 875,047 | ||||||
| Series A, 5.00%, 10/01/37 |
1,000 | 1,091,982 | ||||||
| University of California, Refunding RB, Series AR, 5.00%, 05/15/38 |
10,200 | 10,943,957 | ||||||
|
|
|
|||||||
| 137,708,351 | ||||||||
| Colorado — 2.7% | ||||||||
| City & County of Denver Colorado Airport System Revenue, ARB |
||||||||
| Series A, AMT, 5.50%, 11/15/28 |
2,700 | 2,802,411 | ||||||
| Series A, AMT, 5.50%, 11/15/30 |
1,040 | 1,078,733 | ||||||
| Series A, AMT, 5.50%, 11/15/31 |
1,250 | 1,296,139 | ||||||
| City & County of Denver Colorado Airport System Revenue, Refunding ARB |
||||||||
| Series A, AMT, 5.00%, 12/01/32 |
5,000 | 5,361,360 | ||||||
| Series A, AMT, 5.00%, 12/01/43 |
10,500 | 11,232,553 | ||||||
| Colorado Health Facilities Authority, Refunding RB |
||||||||
| Series A, 5.00%, 11/09/22(d) |
270 | 274,825 | ||||||
| Series A, 5.00%, 08/01/34 |
1,500 | 1,624,788 | ||||||
| Park Creek Metropolitan District, Refunding RB, Series A, Senior Lien, 5.00%, 12/01/34. |
500 | 529,183 | ||||||
| Thompson Crossing Metropolitan District No.4, Refunding GO, 3.50%, 12/01/29 |
515 | 487,942 | ||||||
| University of Northern Colorado, Refunding RB, Series A, (NPFGC), 5.00%, 06/01/24(d) |
2,000 | 2,104,410 | ||||||
|
|
|
|||||||
| 26,792,344 | ||||||||
| Connecticut — 2.0% | ||||||||
| Connecticut Housing Finance Authority, Refunding RB, S/F Housing, Series C-2, AMT, 2.20%, 11/15/34 |
1,190 | 1,006,200 | ||||||
| Connecticut State Health & Educational Facilities Authority, RB |
||||||||
| Series A, 5.00%, 01/01/30(b) |
130 | 138,032 | ||||||
| Series A, 4.00%, 07/01/51 |
4,500 | 4,341,019 | ||||||
| Series A-1, 5.00%, 10/01/54(b) |
235 | 235,748 | ||||||
| Connecticut State Health & Educational Facilities Authority, Refunding RB(b) |
||||||||
| Series G-1, 5.00%, 07/01/27 |
100 | 109,316 | ||||||
| Series G-1, 5.00%, 07/01/28 |
100 | 110,587 | ||||||
| Series G-1, 5.00%, 07/01/29 |
100 | 111,623 | ||||||
| Series G-1, 5.00%, 07/01/30 |
100 | 111,257 | ||||||
| Series G-1, 5.00%, 07/01/32 |
150 | 165,981 | ||||||
| Series G-1, 5.00%, 07/01/34 |
125 | 137,667 | ||||||
| State of Connecticut Special Tax Revenue, RB, Series A, 5.00%, 05/01/35 |
1,750 | 1,968,918 | ||||||
| State of Connecticut, GO |
||||||||
| Series A, 5.00%, 04/15/30 |
5,000 | 5,551,410 | ||||||
| Security | Par (000) |
Value | ||||||
| Connecticut (continued) |
||||||||
| State of Connecticut, GO (continued) |
||||||||
| Series A, 5.00%, 04/15/31 |
$ | 4,000 | $ | 4,422,396 | ||||
| Series A, 5.00%, 04/15/34 |
1,185 | 1,311,328 | ||||||
|
|
|
|||||||
| 19,721,482 | ||||||||
| Delaware — 0.5% | ||||||||
| County of Kent Delaware, RB |
||||||||
| Series A, 5.00%, 07/01/29 |
880 | 954,820 | ||||||
| Series A, 5.00%, 07/01/30 |
1,030 | 1,115,088 | ||||||
| Series A, 5.00%, 07/01/31 |
750 | 810,282 | ||||||
| Series A, 5.00%, 07/01/32 |
375 | 404,553 | ||||||
| Series A, 5.00%, 07/01/33 |
1,190 | 1,282,323 | ||||||
|
|
|
|||||||
| 4,567,066 | ||||||||
| District of Columbia — 1.4% | ||||||||
| District of Columbia, RB, AMT, 5.50%, 02/28/37(c) |
880 | 976,660 | ||||||
| District of Columbia, Refunding GO |
||||||||
| Series D, 4.00%, 02/01/39 |
1,520 | 1,600,531 | ||||||
| Series D, 4.00%, 02/01/40 |
1,000 | 1,049,474 | ||||||
| Metropolitan Washington Airports Authority Aviation Revenue, Refunding ARB |
||||||||
| Series A, AMT, 5.00%, 10/01/46 |
5,000 | 5,423,865 | ||||||
| Series A, AMT, 4.00%, 10/01/51 |
5,500 | 5,240,824 | ||||||
|
|
|
|||||||
| 14,291,354 | ||||||||
| Florida — 5.9% | ||||||||
| Brevard County Health Facilities Authority, Refunding RB, 5.00%, 04/01/52 |
2,745 | 2,919,393 | ||||||
| Capital Projects Finance Authority, RB, |
1,500 | 1,653,679 | ||||||
| Capital Region Community Development District, Refunding SAB, Series A-1, 4.63%, 05/01/28 |
500 | 510,472 | ||||||
| Capital Trust Agency, Inc., RB |
||||||||
| 5.50%, 06/01/57(b) |
305 | 282,980 | ||||||
| Series A, 4.00%, 06/15/29(b) |
605 | 591,542 | ||||||
| Series A, 5.00%, 12/15/29 |
400 | 415,892 | ||||||
| Series A, 5.00%, 06/01/45(b) |
850 | 779,726 | ||||||
| Series SE, 3.00%, 07/01/31(b) |
125 | 112,988 | ||||||
| Series SE, 4.00%, 07/01/41(b) |
285 | 248,564 | ||||||
| Series SE, 4.00%, 07/01/51(b) |
335 | 269,467 | ||||||
| Series SE, 4.00%, 07/01/56(b) |
280 | 218,311 | ||||||
| Charlotte County Industrial Development Authority, RB, AMT, 5.00%, 10/01/29(b) |
1,000 | 1,041,239 | ||||||
| County of Miami-Dade Seaport Department, ARB(d) |
||||||||
| Series B, AMT, 6.00%, 10/01/23 |
8,835 | 9,273,318 | ||||||
| Series B, AMT, 6.25%, 10/01/23 |
1,405 | 1,478,739 | ||||||
| County of Osceola Florida Transportation Revenue, Refunding RB, CAB(e) |
||||||||
| Series A-2, 0.00%, 10/01/28 |
500 | 395,581 | ||||||
| Series A-2, 0.00%, 10/01/29 |
800 | 605,260 | ||||||
| Escambia County Health Facilities Authority, Refunding RB |
||||||||
| 5.00%, 08/15/35 |
3,100 | 3,373,039 | ||||||
| Series A, 5.00%, 08/15/31 |
1,000 | 1,106,675 | ||||||
| Esplanade Lake Club Community Development District, SAB |
||||||||
| Series A-1, 3.63%, 11/01/30 |
370 | 355,682 | ||||||
| Series A-1, 4.00%, 11/01/40 |
1,080 | 1,009,059 | ||||||
| Series A-1, 4.13%, 11/01/50 |
385 | 349,761 | ||||||
| Series A-2, 3.63%, 11/01/30 |
200 | 192,263 | ||||||
| Series A-2, 4.00%, 11/01/40 |
400 | 373,726 | ||||||
| Series A-2, 4.13%, 11/01/50 |
435 | 395,184 | ||||||
| 30 | 2 0 2 2 B L A C K R O C K A N N U A L R E P O R T T O S H A R E H O L D E R S |
| Schedule of Investments (continued) April 30, 2022 |
BlackRock Municipal Income Fund, Inc. (MUI) (Percentages shown are based on Net Assets) |
| Security | Par (000) |
Value | ||||||
| Florida (continued) | ||||||||
| Florida Development Finance Corp., RB(b) |
||||||||
| AMT, 5.00%, 05/01/29 |
$ | 3,080 | $ | 3,132,277 | ||||
| Series A, AMT, 5.00%, 08/01/29(a) |
325 | 326,354 | ||||||
| Florida Development Finance Corp., Refunding RB |
||||||||
| 5.00%, 06/01/31 |
450 | 435,660 | ||||||
| 5.00%, 06/01/35 |
225 | 221,991 | ||||||
| Series C, 5.00%, 09/15/50(b) |
475 | 480,638 | ||||||
| Florida Gulf Coast University Financing Corp., Refunding RB |
||||||||
| 5.00%, 02/01/34 |
800 | 888,218 | ||||||
| 5.00%, 02/01/35 |
850 | 940,561 | ||||||
| Harbor Bay Community Development District, Refunding SAB, Series A-2, 3.30%, 05/01/29 |
960 | 922,941 | ||||||
| Harbor Bay Community Development District, SAB, Series A-1, 3.30%, 05/01/29 |
600 | 576,860 | ||||||
| Hills Minneola Community Development District, SAB, 3.50%, 05/01/31(b) |
1,100 | 1,060,621 | ||||||
| Hillsborough County Aviation Authority, Refunding RB(d) |
||||||||
| Series A, AMT, 5.25%, 10/01/23 |
3,255 | 3,380,965 | ||||||
| Sub-Series A, AMT, 5.50%, 10/01/23 |
5,360 | 5,585,897 | ||||||
| Lakewood Ranch Stewardship District, SAB |
||||||||
| 3.65%, 05/01/22(b) |
145 | 145,000 | ||||||
| 4.00%, 05/01/22 |
350 | 350,000 | ||||||
| 3.60%, 05/01/24 |
220 | 219,367 | ||||||
| 4.30%, 05/01/27(b) |
520 | 523,931 | ||||||
| 3.80%, 05/01/29 |
635 | 623,768 | ||||||
| Lee County Housing Finance Authority, RB, S/F Housing, Series A-2, AMT, (FHLMC, FNMA, GNMA), 6.00%, 09/01/40 |
130 | 130,209 | ||||||
| Miami Beach Health Facilities Authority, RB, 3.00%, 11/15/51 |
435 | 314,223 | ||||||
| Miami-Dade County Educational Facilities Authority, Refunding RB, Series A, 5.00%, 04/01/32 |
5,020 | 5,261,126 | ||||||
| Midtown Miami Community Development District, Refunding SAB, Series A, 4.25%, 05/01/24 |
470 | 469,907 | ||||||
| Osceola Chain Lakes Community Development District, SAB, 3.50%, 05/01/30 |
350 | 338,017 | ||||||
| Pinellas County Industrial Development Authority, RB, 5.00%, 07/01/29 |
2,005 | 2,071,440 | ||||||
| Sarasota County Health Facilities Authority, RB, 5.00%, 05/15/33 |
610 | 644,708 | ||||||
| Southern Groves Community Development District No.5, Refunding SAB, 3.25%, 05/01/29 |
290 | 278,168 | ||||||
| Sterling Hill Community Development District, Refunding SAB, Series B, |
143 | 90,783 | ||||||
| Talavera Community Development District, SAB |
||||||||
| 3.50%, 05/01/25 |
280 | 278,115 | ||||||
| 3.85%, 05/01/30 |
540 | 528,627 | ||||||
| Tolomato Community Development District, Refunding SAB, Sub-Series A-2, 3.85%, 05/01/29 |
180 | 177,525 | ||||||
|
|
|
|||||||
| 58,350,437 | ||||||||
| Georgia — 3.8% | ||||||||
| City of Atlanta Georgia Water & Wastewater Revenue, Refunding RB, 5.00%, 11/01/32 |
8,315 | 8,875,273 | ||||||
| Cobb County Kennestone Hospital Authority, Refunding RB |
||||||||
| 5.00%, 04/01/32 |
1,250 | 1,371,558 | ||||||
| 4.00%, 04/01/33 |
200 | 210,399 | ||||||
| 4.00%, 04/01/34 |
275 | 287,190 | ||||||
| 4.00%, 04/01/35 |
275 | 285,583 | ||||||
| Security | Par (000) |
Value | ||||||
| Georgia (continued) | ||||||||
| Cobb County Kennestone Hospital Authority, Refunding RB (continued) |
||||||||
| 4.00%, 04/01/36 |
$ | 300 | $ | 309,855 | ||||
| George L Smith II Congress Center Authority, RB, 4.00%, 01/01/36 |
1,750 | 1,674,467 | ||||||
| Georgia Housing & Finance Authority, Refunding RB, S/F Housing, Series A, 2.75%, 12/01/35 |
3,000 | 2,665,620 | ||||||
| Main Street Natural Gas, Inc., RB |
||||||||
| Series A, 5.50%, 09/15/28 |
2,500 | 2,762,308 | ||||||
| Series A, 5.00%, 05/15/33 |
5,000 | 5,320,850 | ||||||
| Series A, 5.00%, 05/15/34 |
5,250 | 5,581,427 | ||||||
| Series C, 4.00%, 05/01/52(a) |
960 | 977,921 | ||||||
| Series C, RB, 4.00%, 03/01/50(a) |
2,280 | 2,312,866 | ||||||
| Municipal Electric Authority of Georgia, RB |
||||||||
| 5.00%, 01/01/34 |
700 | 754,752 | ||||||
| 5.00%, 01/01/35 |
1,225 | 1,318,754 | ||||||
| Municipal Electric Authority of Georgia, Refunding RB |
||||||||
| Sub-Series A, 5.00%, 01/01/34 |
2,295 | 2,507,593 | ||||||
| Sub-Series A, 5.00%, 01/01/35 |
925 | 1,006,796 | ||||||
|
|
|
|||||||
| 38,223,212 | ||||||||
| Guam — 0.2% | ||||||||
| Territory of Guam, Refunding RB, Series F, 5.00%, 01/01/29 |
1,500 | 1,554,691 | ||||||
|
|
|
|||||||
| Hawaii — 1.0% | ||||||||
| State of Hawaii Airports System Revenue, ARB, Series A, AMT, 5.00%, 07/01/45 |
5,985 | 6,163,563 | ||||||
| State of Hawaii Airports System Revenue, ARB COP |
||||||||
| AMT, 5.25%, 08/01/25 |
1,350 | 1,395,114 | ||||||
| AMT, 5.25%, 08/01/26 |
2,500 | 2,579,870 | ||||||
|
|
|
|||||||
| 10,138,547 | ||||||||
| Idaho — 1.8% | ||||||||
| Idaho Health Facilities Authority, RB, 4.00%, 12/01/43 |
10,000 | 10,092,360 | ||||||
| Idaho Health Facilities Authority, Refunding RB, 3.00%, 03/01/51 |
2,355 | 1,831,248 | ||||||
| Idaho Housing & Finance Association, RB |
||||||||
| 5.00%, 08/15/41 |
1,425 | 1,624,136 | ||||||
| 5.00%, 08/15/42 |
565 | 643,618 | ||||||
| 5.00%, 08/15/47 |
1,455 | 1,636,385 | ||||||
| Idaho Housing & Finance Association, Refunding RB |
||||||||
| 4.00%, 05/01/42 |
1,160 | 1,094,294 | ||||||
| 4.00%, 05/01/52 |
905 | 831,134 | ||||||
|
|
|
|||||||
| 17,753,175 | ||||||||
| Illinois — 17.4% | ||||||||
| Chicago Board of Education, GO |
||||||||
| Series A, 5.00%, 12/01/37 |
1,760 | 1,839,524 | ||||||
| Series A, 5.00%, 12/01/38 |
715 | 750,357 | ||||||
| Series A, 5.00%, 12/01/39 |
1,915 | 2,009,377 | ||||||
| Series A, 5.00%, 12/01/47 |
835 | 863,311 | ||||||
| Chicago Board of Education, Refunding GO |
||||||||
| Series A, 5.00%, 12/01/30 |
3,065 | 3,250,822 | ||||||
| Series C, 5.00%, 12/01/26 |
4,730 | 5,021,950 | ||||||
| Series D, 5.00%, 12/01/26 |
4,185 | 4,443,311 | ||||||
| Chicago Board of Education, Refunding GO, CAB, Series A, 0.00%, 12/01/25(e) |
815 | 707,761 | ||||||
| Chicago Midway International Airport, Refunding ARB |
||||||||
| Series A, 2nd Lien, AMT, 5.00%, 01/01/41 |
8,020 | 8,169,116 | ||||||
| Series A, AMT, 2nd Lien, 5.00%, 01/01/32 |
5,000 | 5,174,150 | ||||||
| Chicago Midway International Airport, Refunding RB |
||||||||
| Series A, 2nd Lien, AMT, 5.50%, 01/01/30 |
6,500 | 6,620,952 | ||||||
| S C H E D U L E O F I N V E S T M E N T S |
31 |
| Schedule of Investments (continued) April 30, 2022 |
BlackRock Municipal Income Fund, Inc. (MUI) (Percentages shown are based on Net Assets) |
| Security | Par (000) |
Value | ||||||
| Illinois (continued) | ||||||||
| Chicago Midway International Airport, Refunding RB (continued) |
||||||||
| Series A, 2nd Lien, AMT, 5.50%, 01/01/32 |
$ | 7,775 | $ | 7,915,790 | ||||
| Chicago O’Hare International Airport, ARB, Series D, Senior Lien, 5.25%, 01/01/42 |
2,630 | 2,791,853 | ||||||
| Chicago O’Hare International Airport, Refunding ARB |
||||||||
| Series C, AMT, Senior Lien, 5.25%, 01/01/28 |
1,350 | 1,371,442 | ||||||
| Series C, AMT, Senior Lien, 5.25%, 01/01/29 |
3,020 | 3,067,082 | ||||||
| Series B, Senior Lien, 5.00%, 01/01/35 |
4,400 | 4,679,699 | ||||||
| Series C, Senior Lien, 4.00%, 01/01/38 |
3,820 | 3,853,295 | ||||||
| Series E, Senior Lien, (AGM), 4.00%, 01/01/39 |
5,000 | 5,170,160 | ||||||
| Chicago O’Hare International Airport, Refunding RB |
||||||||
| Series B, 5.00%, 01/01/32 |
3,745 | 3,915,682 | ||||||
| Series A, AMT, Senior Lien, 5.00%, 01/01/23 |
11,000 | 11,193,457 | ||||||
| Chicago Transit Authority Sales Tax Receipts Fund, Refunding RB |
||||||||
| Series A, 2nd Lien, 4.00%, 12/01/49 |
1,830 | 1,713,552 | ||||||
| Series A, 2nd Lien, 5.00%, 12/01/52 |
1,000 | 1,071,574 | ||||||
| Cook County Community College District No. 508, GO, 5.13%, 12/01/38 |
1,000 | 1,022,537 | ||||||
| Illinois Finance Authority, RB |
||||||||
| Series A, 5.00%, 02/15/28 |
810 | 884,979 | ||||||
| Series A, 5.00%, 02/15/29 |
400 | 436,725 | ||||||
| Series A, 5.00%, 02/15/30 |
500 | 542,998 | ||||||
| Series A, 5.00%, 02/15/31 |
500 | 539,928 | ||||||
| Series A, 5.00%, 02/15/32 |
500 | 536,987 | ||||||
| Illinois Finance Authority, Refunding RB |
||||||||
| 5.00%, 03/01/30 |
550 | 601,040 | ||||||
| 5.00%, 03/01/32 |
920 | 998,830 | ||||||
| Series A, 4.00%, 01/01/42 |
9,970 | 10,116,041 | ||||||
| Illinois State Toll Highway Authority, RB |
||||||||
| Series A, 5.00%, 01/01/34 |
9,140 | 9,287,556 | ||||||
| Series A, 5.00%, 01/01/40 |
5,000 | 5,219,945 | ||||||
| Series A, 4.00%, 01/01/46 |
1,740 | 1,731,336 | ||||||
| Series A, 5.00%, 01/01/46 |
10,470 | 11,596,802 | ||||||
| Illinois State Toll Highway Authority, Refunding RB, Series A, 5.00%, 12/01/31 |
4,220 | 4,520,591 | ||||||
| Metropolitan Pier & Exposition Authority, Refunding RB, 5.00%, 12/15/28 |
1,200 | 1,275,695 | ||||||
| State of Illinois, GO |
||||||||
| 5.25%, 07/01/29 |
5,000 | 5,148,895 | ||||||
| 5.00%, 04/01/31 |
1,000 | 1,039,271 | ||||||
| 5.00%, 05/01/31 |
5,010 | 5,212,629 | ||||||
| 5.00%, 11/01/34 |
5,000 | 5,185,540 | ||||||
| 5.50%, 05/01/39 |
15,000 | 16,367,625 | ||||||
| 5.75%, 05/01/45 |
2,000 | 2,207,346 | ||||||
| Series A, 5.00%, 03/01/35 |
2,000 | 2,132,700 | ||||||
| Series D, 5.00%, 11/01/28 |
350 | 374,786 | ||||||
| State of Illinois, Refunding GO, Series B, 5.00%, 10/01/27 |
120 | 129,081 | ||||||
|
|
|
|||||||
| 172,704,080 | ||||||||
| Indiana — 0.3% | ||||||||
| Indiana Finance Authority, RB |
||||||||
| Series A, 5.00%, 06/01/41 |
550 | 546,207 | ||||||
| Series A, 5.00%, 06/01/51 |
405 | 388,231 | ||||||
| Security | Par (000) |
Value | ||||||
| Indiana (continued) | ||||||||
| Indiana Finance Authority, RB (continued) Series A, 5.00%, 06/01/56 |
$ | 360 | $ | 339,434 | ||||
| Indiana Finance Authority, Refunding RB, Series A, 4.13%, 12/01/26 |
1,270 | 1,318,846 | ||||||
|
|
|
|||||||
| 2,592,718 | ||||||||
| Iowa — 0.1% | ||||||||
| Iowa Student Loan Liquidity Corp., Refunding RB, Series A, AMT, 5.00%, 12/01/26 |
775 | 831,572 | ||||||
|
|
|
|||||||
| Kansas — 0.2% | ||||||||
| Seward County Unified School District No.480 Liberal, Refunding GO, 5.00%, 09/01/33 |
2,010 | 2,032,287 | ||||||
|
|
|
|||||||
| Kentucky — 0.3% | ||||||||
| City of Henderson KY, RB, AMT, 4.70%, 01/01/52(b) |
815 | 769,393 | ||||||
| Kentucky Public Energy Authority, RB, Series A-1, 4.00%, 08/01/52(a) |
2,305 | 2,346,811 | ||||||
| Louisville/Jefferson County Metropolitan Government, Refunding RB, 5.00%, 06/01/22(d) |
120 | 120,335 | ||||||
|
|
|
|||||||
| 3,236,539 | ||||||||
| Louisiana — 1.0% | ||||||||
| City of Bossier City Louisiana Utilities Revenue, Refunding RB, 5.00%, 10/01/24(d) |
2,000 | 2,122,792 | ||||||
| New Orleans Aviation Board, ARB, Series A, 5.00%, 01/01/33 |
1,000 | 1,054,932 | ||||||
| State of Louisiana Gasoline & Fuels Tax Revenue, Refunding RB, Series A-1, 4.00%, 05/01/34 |
3,000 | 3,000,621 | ||||||
| Terrebonne Levee & Conservation District, RB, 5.00%, 07/01/23(d) |
3,660 | 3,779,104 | ||||||
|
|
|
|||||||
| 9,957,449 | ||||||||
| Maine — 0.2% | ||||||||
| Finance Authority of Maine, Refunding RB |
||||||||
| Series A-1, AMT, (AGM), 5.00%, 12/01/28 |
1,000 | 1,086,158 | ||||||
| Series A-1, AMT, (AGM), 3.00%, 12/01/29 |
845 | 806,282 | ||||||
|
|
|
|||||||
| 1,892,440 | ||||||||
| Maryland — 0.9% | ||||||||
| City of Baltimore Maryland, Refunding TA(b) |
| |||||||
| Series A, Senior Lien, 2.95%, 06/01/27 |
175 | 171,072 | ||||||
| Series A, Senior Lien, 3.05%, 06/01/28 |
190 | 185,387 | ||||||
| Series A, Senior Lien, 3.15%, 06/01/29 |
200 | 194,762 | ||||||
| City of Baltimore Maryland, TA, Series B, 3.38%, 06/01/29(b) |
285 | 281,515 | ||||||
| Maryland Economic Development Corp., RB, AMT, 5.25%, 06/30/47 |
2,500 | 2,639,547 | ||||||
| Maryland Economic Development Corp., Refunding RB |
||||||||
| Series A, 5.00%, 06/01/29 |
1,835 | 2,032,899 | ||||||
| Series A, 5.00%, 06/01/30 |
1,015 | 1,119,448 | ||||||
| Series A, 5.00%, 06/01/31 |
1,000 | 1,097,862 | ||||||
| Series A, 5.00%, 06/01/32 |
1,000 | 1,093,452 | ||||||
|
|
|
|||||||
| 8,815,944 | ||||||||
| Massachusetts — 4.6% | ||||||||
| Commonwealth of Massachusetts, GO |
||||||||
| Series E, 5.00%, 11/01/50 |
1,250 | 1,399,652 | ||||||
| Series G, 4.00%, 09/01/42 |
20,000 | 20,257,160 | ||||||
| Massachusetts Development Finance Agency, Refunding RB |
||||||||
| 5.00%, 07/01/29 |
2,700 | 2,889,478 | ||||||
| 5.00%, 07/01/30 |
3,125 | 3,333,041 | ||||||
| 32 | 2 0 2 2 B L A C K R O C K A N N U A L R E P O R T T O S H A R E H O L D E R S |
| Schedule of Investments (continued) April 30, 2022 |
BlackRock Municipal Income Fund, Inc. (MUI) (Percentages shown are based on Net Assets) |
| Security | Par (000) |
Value | ||||||
| Massachusetts (continued) | ||||||||
| Massachusetts Development Finance Agency, Refunding RB (continued) |
||||||||
| 5.00%, 07/01/41 |
$ | 4,710 | $ | 4,942,095 | ||||
| Series A, 5.00%, 01/01/31 |
1,730 | 1,799,861 | ||||||
| Massachusetts Educational Financing Authority, RB, AMT, 5.00%, 01/01/27 |
1,000 | 1,045,604 | ||||||
| Massachusetts Housing Finance Agency, Refunding RB, M/F Housing, Series G, 3.45%, 12/01/30 |
3,100 | 3,113,987 | ||||||
| Massachusetts Port Authority, ARB, Series E, AMT, 5.00%, 07/01/46 |
215 | 231,754 | ||||||
| Massachusetts School Building Authority, RB, Sub- Series B, 4.00%, 02/15/42 |
6,200 | 6,272,360 | ||||||
|
|
|
|||||||
| 45,284,992 | ||||||||
| Michigan — 2.8% | ||||||||
| City of Detroit Michigan Water Supply System Revenue, RB, Series B, 2nd Lien, (AGM), 6.25%, 07/01/36 |
10 | 10,027 | ||||||
| City of Detroit Michigan, GO |
||||||||
| 5.00%, 04/01/26 |
265 | 280,174 | ||||||
| 5.00%, 04/01/27 |
210 | 223,705 | ||||||
| 5.00%, 04/01/28 |
235 | 252,170 | ||||||
| 5.00%, 04/01/29 |
235 | 250,958 | ||||||
| 5.00%, 04/01/30 |
180 | 191,583 | ||||||
| 5.00%, 04/01/31 |
265 | 281,156 | ||||||
| 5.00%, 04/01/32 |
225 | 238,095 | ||||||
| 5.00%, 04/01/33 |
295 | 311,586 | ||||||
| Michigan Finance Authority, RB, 4.00%, 12/01/40 |
2,140 | 2,164,790 | ||||||
| Michigan Finance Authority, Refunding RB |
||||||||
| 4.00%, 02/15/44 |
10,000 | 9,825,910 | ||||||
| Series C-3, Senior Lien, (AGM), 5.00%, 07/01/31 |
4,000 | 4,190,400 | ||||||
| Michigan State Housing Development Authority, RB, M/F Housing, Series A, 2.13%, 10/01/36 |
4,275 | 3,561,661 | ||||||
| Michigan Strategic Fund, RB |
||||||||
| AMT, 5.00%, 06/30/33 |
2,415 | 2,522,620 | ||||||
| AMT, 5.00%, 12/31/33 |
2,000 | 2,087,866 | ||||||
| Michigan Strategic Fund, Refunding RB |
||||||||
| 5.00%, 11/15/29 |
440 | 480,527 | ||||||
| 5.00%, 11/15/34 |
490 | 530,996 | ||||||
|
|
|
|||||||
| 27,404,224 | ||||||||
| Minnesota — 1.0% | ||||||||
| City of Minneapolis Minnesota, RB |
||||||||
| 4.00%, 06/01/30 |
150 | 150,757 | ||||||
| 4.00%, 06/01/31 |
50 | 50,160 | ||||||
| City of Minneapolis Minnesota, Refunding RB, Series A, 5.00%, 11/15/33 |
2,370 | 2,582,170 | ||||||
| Duluth Economic Development Authority, Refunding RB |
||||||||
| Series A, 5.00%, 02/15/33 |
1,000 | 1,092,112 | ||||||
| Series A, 5.00%, 02/15/34 |
1,185 | 1,290,881 | ||||||
| Housing & Redevelopment Authority of The City of St. Paul Minnesota, RB, Series A, 4.75%, 07/01/29(b) |
250 | 256,622 | ||||||
| University of Minnesota, RB, Series C, 5.00%, 08/01/23(d) |
4,520 | 4,668,649 | ||||||
|
|
|
|||||||
| 10,091,351 | ||||||||
| Mississippi — 1.3% | ||||||||
| Mississippi Development Bank, RB (AGM), 6.75%, 12/01/31 |
3,775 | 4,014,678 | ||||||
| Security | Par (000) | Value | ||||||
| Mississippi (continued) | ||||||||
| Mississippi Development Bank, RB (continued) |
||||||||
| (AGM), 6.75%, 12/01/33 |
$ | 2,350 | $ | 2,497,413 | ||||
| (AGM), 6.88%, 12/01/40 |
6,405 | 6,790,972 | ||||||
|
|
|
|||||||
| 13,303,063 | ||||||||
| Missouri — 0.3% | ||||||||
| Industrial Development Authority of the City of St. Louis Missouri, Refunding RB, Series A, 3.88%, 11/15/29 |
350 | 314,148 | ||||||
| Kansas City Industrial Development Authority, ARB, AMT, 4.00%, 03/01/35 |
1,480 | 1,469,400 | ||||||
| St. Louis County Industrial Development Authority, Refunding RB |
||||||||
| 5.00%, 09/01/27 |
360 | 389,364 | ||||||
| 5.00%, 09/01/32 |
1,015 | 1,071,311 | ||||||
|
|
|
|||||||
| 3,244,223 | ||||||||
| Montana — 0.0% | ||||||||
| Yellowstone County School District No.2 Billings, GO, 5.00%, 06/15/24(d) |
500 | 526,991 | ||||||
|
|
|
|||||||
| Nebraska — 0.1% | ||||||||
| Douglas County Hospital Authority No.3, Refunding RB, 5.00%, 11/01/30 |
800 | 864,817 | ||||||
|
|
|
|||||||
| Nevada — 0.7% | ||||||||
| City of Las Vegas Nevada Special Improvement District No.814, SAB |
||||||||
| 3.50%, 06/01/28 |
160 | 159,221 | ||||||
| 3.25%, 06/01/30 |
350 | 334,077 | ||||||
| City of Reno Nevada, Refunding RB, Series A-1, (AGM), 5.00%, 06/01/31 |
1,000 | 1,096,339 | ||||||
| County of Clark Department of Aviation, Refunding RB, Series A-2, Sub Lien, 5.00%, 07/01/33 |
5,000 | 5,216,355 | ||||||
|
|
|
|||||||
| 6,805,992 | ||||||||
| New Hampshire(b) — 0.2% | ||||||||
| New Hampshire Business Finance Authority, RB, AMT, 2.95%, 04/01/29 |
1,000 | 945,448 | ||||||
| New Hampshire Business Finance Authority, Refunding RB, Series A, AMT, 4.00%, 11/01/27 |
795 | 767,552 | ||||||
|
|
|
|||||||
| 1,713,000 | ||||||||
| New Jersey — 18.2% | ||||||||
| New Jersey Economic Development Authority, RB |
||||||||
| AMT, 5.13%, 09/15/23 |
3,210 | 3,246,543 | ||||||
| AMT, 5.50%, 01/01/26 |
1,500 | 1,556,273 | ||||||
| AMT, 5.50%, 01/01/27 |
1,000 | 1,037,233 | ||||||
| AMT, (AGM), 5.00%, 01/01/31 |
2,425 | 2,522,165 | ||||||
| AMT, 5.38%, 01/01/43 |
7,000 | 7,161,574 | ||||||
| New Jersey Economic Development Authority, Refunding ARB |
||||||||
| AMT, 5.00%, 10/01/26 |
2,135 | 2,339,650 | ||||||
| AMT, 5.00%, 10/01/27 |
1,680 | 1,869,104 | ||||||
| New Jersey Economic Development Authority, Refunding RB, Series BBB, 5.50%, 12/15/26(d) |
4,080 | 4,595,178 | ||||||
| New Jersey Educational Facilities Authority, RB, 5.00%, 06/15/28 |
10,000 | 10,441,000 | ||||||
| New Jersey Educational Facilities Authority, Refunding RB |
||||||||
| 5.00%, 07/01/25(d) |
1,966 | 2,113,613 | ||||||
| 5.00%, 07/01/30 |
3,034 | 3,233,974 | ||||||
| S C H E D U L E O F I N V E S T M E N T S |
33 |
| Schedule of Investments (continued) April 30, 2022 |
BlackRock Municipal Income Fund, Inc. (MUI) (Percentages shown are based on Net Assets) |
| Security | Par (000) |
Value | ||||||
| New Jersey (continued) | ||||||||
| New Jersey Health Care Facilities Financing Authority, RB, 3.00%, 07/01/51 |
$ | 6,110 | $ | 5,127,243 | ||||
| New Jersey Higher Education Student Assistance Authority, RB, Series B, AMT, 3.50%, 12/01/39 |
2,130 | 1,917,884 | ||||||
| New Jersey Higher Education Student Assistance Authority, Refunding RB |
||||||||
| 1st Series, AMT, 5.50%, 12/01/26 |
540 | 540,072 | ||||||
| 1st Series, AMT, 5.75%, 12/01/28 |
1,450 | 1,450,187 | ||||||
| Series B, AMT, 5.00%, 12/01/27 |
1,000 | 1,084,277 | ||||||
| Series B, AMT, 5.00%, 12/01/28 |
1,000 | 1,075,658 | ||||||
| Series B, AMT, 4.00%, 12/01/41(c) |
4,820 | 4,706,200 | ||||||
| New Jersey Transportation Trust Fund Authority, RB |
||||||||
| Series A, 5.00%, 06/15/30 |
2,000 | 2,141,616 | ||||||
| Series AA, 5.25%, 06/15/31 |
12,000 | 12,322,608 | ||||||
| Series AA, 5.25%, 06/15/32 |
2,250 | 2,357,167 | ||||||
| Series AA, 5.00%, 06/15/35 |
3,000 | 3,180,573 | ||||||
| Series AA, 5.50%, 06/15/39 |
8,175 | 8,358,161 | ||||||
| Series AA, 4.00%, 06/15/40 |
4,000 | 3,874,904 | ||||||
| Series BB, 5.00%, 06/15/44 |
5,000 | 5,264,620 | ||||||
| Series C, 5.25%, 06/15/32 |
10,000 | 10,424,840 | ||||||
| Series S, 5.25%, 06/15/43 |
10,000 | 10,719,700 | ||||||
| New Jersey Transportation Trust Fund Authority, Refunding RB |
||||||||
| Series A, 5.00%, 06/15/30 |
1,695 | 1,815,075 | ||||||
| Series A, 5.00%, 12/15/33 |
2,285 | 2,422,182 | ||||||
| New Jersey Turnpike Authority, RB, Series E, 5.00%, 01/01/32 |
12,000 | 12,736,476 | ||||||
| Newark Housing Authority Scholarship Foundation A New Jersey Non, RB, M/F Housing |
||||||||
| Series A, 5.00%, 12/01/23 |
1,230 | 1,259,329 | ||||||
| Series A, 5.00%, 12/01/25 |
1,345 | 1,385,358 | ||||||
| South Jersey Port Corp., ARB |
||||||||
| Series B, AMT, 5.00%, 01/01/29 |
250 | 270,903 | ||||||
| Series B, AMT, 5.00%, 01/01/30 |
200 | 215,928 | ||||||
| Series B, AMT, 5.00%, 01/01/31 |
350 | 375,967 | ||||||
| Series B, AMT, 5.00%, 01/01/32 |
425 | 453,579 | ||||||
| State of New Jersey, GO |
||||||||
| 5.00%, 06/01/28 |
5,000 | 5,309,430 | ||||||
| 2.00%, 06/01/34 |
12,520 | 10,071,000 | ||||||
| Tobacco Settlement Financing Corp., Refunding RB |
||||||||
| Series A, 5.00%, 06/01/30 |
850 | 924,483 | ||||||
| Series A, 5.00%, 06/01/32 |
11,980 | 12,879,339 | ||||||
| Series A, 5.00%, 06/01/33 |
220 | 235,821 | ||||||
| Sub-Series B, 5.00%, 06/01/46 |
15,000 | 15,922,680 | ||||||
|
|
|
|||||||
| 180,939,567 | ||||||||
| New Mexico — 0.7% | ||||||||
| Albuquerque Bernalillo County Water Utility Authority, Refunding RB, 4.00%, 07/01/33 |
2,510 | 2,571,231 | ||||||
| Albuquerque Municipal School District No.12, GO, Series 2017, (SAW), 5.00%, 08/01/30 |
1,250 | 1,367,764 | ||||||
| City of Santa Fe New Mexico, RB |
||||||||
| Series A, 5.00%, 05/15/34 |
170 | 182,158 | ||||||
| Series A, 5.00%, 05/15/39 |
310 | 328,740 | ||||||
| New Mexico Hospital Equipment Loan Council, Refunding RB, Series A, 5.00%, 08/01/31 |
2,500 | 2,659,590 | ||||||
|
|
|
|||||||
| 7,109,483 | ||||||||
| Security | Par (000) |
Value | ||||||
| New York — 15.9% | ||||||||
| Buffalo & Erie County Industrial Land Development Corp., Refunding RB |
||||||||
| Series A, 4.00%, 06/01/22 |
$ | 410 | $ | 410,638 | ||||
| Series A, 4.50%, 06/01/27 |
1,710 | 1,792,877 | ||||||
| Series A, 5.00%, 06/01/35 |
415 | 435,001 | ||||||
| Build NYC Resource Corp., RB, Series A, 4.88%, 05/01/31(b) |
420 | 429,586 | ||||||
| Build NYC Resource Corp., Refunding RB, 5.00%, 08/01/35 |
665 | 726,284 | ||||||
| City of New York, GO, Series A -1, 4.00%, 08/01/50 |
3,910 | 3,895,623 | ||||||
| Huntington Local Development Corp., RB, Series A, 5.00%, 07/01/36 |
940 | 937,067 | ||||||
| Metropolitan Transportation Authority, RB |
||||||||
| Series A-1, 5.25%, 11/15/39 |
7,005 | 7,149,380 | ||||||
| Series B, 5.25%, 11/15/38 |
3,145 | 3,230,736 | ||||||
| Series C, 5.00%, 11/15/38 |
4,450 | 4,500,632 | ||||||
| Sub-Series A-1, 5.00%, 11/15/40 |
2,355 | 2,429,861 | ||||||
| Metropolitan Transportation Authority, Refunding RB, Series A, 4.00%, 11/15/51 |
2,250 | 2,217,560 | ||||||
| Monroe County Industrial Development Corp., Refunding RB, Series A, 5.00%, 07/01/23(d) |
5,695 | 5,884,159 | ||||||
| New York City Industrial Development Agency, Refunding RB |
||||||||
| Series-A, Class A, (AGM), 3.00%, 01/01/35 |
500 | 460,162 | ||||||
| Series-A, Class A, (AGM), 3.00%, 01/01/36 |
1,000 | 909,797 | ||||||
| New York City Municipal Water Finance Authority, RB |
||||||||
| Series CC-1, 4.00%, 06/15/52 |
2,000 | 1,992,298 | ||||||
| Series CC-1, 5.00%, 06/15/52 |
5,400 | 5,992,396 | ||||||
| New York City Transitional Finance Authority Future Tax Secured Revenue, RB |
||||||||
| Series C-3, Subordinate, 4.00%, 05/01/43 |
5,000 | 5,115,055 | ||||||
| Series F-1, Subordinate, 4.00%, 02/01/51 |
2,915 | 2,864,798 | ||||||
| Series F-1, Subordinate, 5.00%, 02/01/51 |
3,975 | 4,360,495 | ||||||
| New York Convention Center Development Corp., RB, CAB, Series B, Sub Lien, (BAM-TCRS), 0.00%, 11/15/40(e) |
7,000 | 2,961,861 | ||||||
| New York Liberty Development Corp., Refunding RB |
||||||||
| 3.13%, 09/15/50 |
6,970 | 5,793,826 | ||||||
| Series 1, Class 1, 5.00%, 11/15/44(b) |
1,730 | 1,746,840 | ||||||
| Series A, 2.88%, 11/15/46 |
16,310 | 12,582,333 | ||||||
| Series-A, 3.00%, 11/15/51 |
990 | 790,289 | ||||||
| New York Power Authority, RB, (AGM), 4.00%, 11/15/47 |
570 | 575,069 | ||||||
| New York Power Authority, Refunding RB, Series A, 4.00%, 11/15/50 |
10,135 | 10,005,475 | ||||||
| New York State Dormitory Authority, Refunding RB |
||||||||
| 5.00%, 12/01/27(b) |
900 | 976,638 | ||||||
| 5.00%, 12/01/28(b) |
1,800 | 1,953,121 | ||||||
| Series A, 5.00%, 05/01/32 |
3,060 | 3,248,046 | ||||||
| Series A, 5.00%, 07/01/32 |
9,000 | 9,580,437 | ||||||
| Series A, 4.00%, 03/15/46(c) |
10,000 | 9,917,600 | ||||||
| Series E, 4.00%, 03/15/45 |
10,000 | 9,874,060 | ||||||
| New York State Urban Development Corp., RB |
||||||||
| Series A, 3.00%, 03/15/41 |
8,515 | 7,417,442 | ||||||
| Series A, 4.00%, 03/15/45 |
2,500 | 2,482,250 | ||||||
| New York Transportation Development Corp., ARB, AMT, 5.00%, 12/01/39 |
1,865 | 1,994,728 | ||||||
| New York Transportation Development Corp., RB |
||||||||
| AMT, 4.00%, 10/01/30 |
2,775 | 2,725,130 | ||||||
| AMT, 5.00%, 10/01/35 |
630 | 669,037 | ||||||
| 34 | 2 0 2 2 B L A C K R O C K A N N U A L R E P O R T T O S H A R E H O L D E R S |
| Schedule of Investments (continued) April 30, 2022 |
BlackRock Municipal Income Fund, Inc. (MUI) (Percentages shown are based on Net Assets) |
| Security | Par (000) |
Value | ||||||
| New York (continued) | ||||||||
| New York Transportation Development Corp., RB (continued) |
||||||||
| AMT, 5.00%, 10/01/40 |
$ | 1,775 | $ | 1,855,828 | ||||
| Niagara Area Development Corp., Refunding RB, Series B, 3.50%, 11/01/24(b) |
1,000 | 1,009,576 | ||||||
| Port Authority of New York & New Jersey, ARB, Consolidated, 221st Series, AMT, 4.00%, 07/15/36 |
2,650 | 2,656,803 | ||||||
| Port Authority of New York & New Jersey, Refunding ARB |
||||||||
| Series 223, AMT, 4.00%, 07/15/36 |
1,625 | 1,629,602 | ||||||
| Series 223, AMT, 4.00%, 07/15/37 |
3,250 | 3,235,095 | ||||||
| State of New York Mortgage Agency, RB, S/F Housing, Series 239, (SONYMA), 2.60%, 10/01/44 |
1,770 | 1,351,174 | ||||||
| Triborough Bridge & Tunnel Authority, Refunding RB, Series B, 5.00%, 11/15/38. |
4,400 | 4,761,434 | ||||||
| Troy Capital Resource Corp., Refunding RB, Series A, 5.00%, 09/01/33 |
860 | 968,046 | ||||||
|
|
|
|||||||
| 158,496,145 | ||||||||
| North Dakota — 0.2% | ||||||||
| North Dakota Housing Finance Agency, RB, S/F Housing, Series B, 2.60%, 01/01/43 |
2,110 | 1,676,062 | ||||||
|
|
|
|||||||
| Ohio — 4.2% | ||||||||
| Buckeye Tobacco Settlement Financing Authority, Refunding RB |
||||||||
| Series A-2, Class 1, 4.00%, 06/01/37 |
1,000 | 977,341 | ||||||
| Series A-2, Class 1, 4.00%, 06/01/38 |
1,000 | 976,464 | ||||||
| Series A-2, Class 1, 4.00%, 06/01/39 |
1,000 | 975,650 | ||||||
| Series B-2, Class 2, 5.00%, 06/01/55 |
8,490 | 8,254,734 | ||||||
| County of Allen Ohio Hospital Facilities Revenue, Refunding RB, 5.00%, 12/01/35 |
850 | 928,696 | ||||||
| Montgomery County, Refunding RB, 4.00%, 08/01/51 |
4,250 | 4,187,793 | ||||||
| Ohio Air Quality Development Authority, Refunding RB, 3.25%, 09/01/29 |
1,550 | 1,451,986 | ||||||
| Ohio Housing Finance Agency, RB, S/F Housing, Series C, (FHLMC, FNMA, GNMA), 2.70%, 09/01/46 |
5,890 | 4,608,312 | ||||||
| Ohio Turnpike & Infrastructure Commission, RB |
||||||||
| Series A-1, Junior Lien, 5.25%, 02/15/31 |
11,145 | 11,392,040 | ||||||
| Series A-1, Junior Lien, 5.25%, 02/15/32 |
2,250 | 2,298,877 | ||||||
| State of Ohio, RB, 4.00%, 01/01/41 |
6,000 | 6,086,154 | ||||||
| State of Ohio, Refunding RB, Series A, 4.00%, 01/01/28(d) |
25 | 26,879 | ||||||
|
|
|
|||||||
| 42,164,926 | ||||||||
| Oklahoma — 0.7% | ||||||||
| Oklahoma City Public Property Authority, Refunding RB |
||||||||
| 5.00%, 10/01/27 |
1,190 | 1,288,709 | ||||||
| 5.00%, 10/01/28 |
1,265 | 1,369,178 | ||||||
| 5.00%, 10/01/29 |
1,400 | 1,514,495 | ||||||
| Oklahoma Development Finance Authority, RB |
||||||||
| Series B, 5.00%, 08/15/29 |
1,200 | 1,253,000 | ||||||
| Series B, 5.00%, 08/15/33 |
1,305 | 1,346,057 | ||||||
|
|
|
|||||||
| 6,771,439 | ||||||||
| Oregon — 0.6% | ||||||||
| Klamath County School District, GO, (GTY), 5.00%, 06/15/23(d) |
2,000 | 2,063,274 | ||||||
| Security | Par (000) |
Value | ||||||
| Oregon (continued) | ||||||||
| Oregon State Facilities Authority, Refunding RB, Series A, 4.13%, 06/01/52(c) |
$ | 1,550 | $ | 1,514,830 | ||||
| Umatilla County School District No.16R Pendleton, GO, Series A, (GTY), 5.00%, 06/15/24(d) |
2,000 | 2,109,638 | ||||||
|
|
|
|||||||
| 5,687,742 | ||||||||
| Pennsylvania — 5.7% | ||||||||
| Allentown Neighborhood Improvement Zone Development Authority, RB(b) |
||||||||
| 5.00%, 05/01/22 |
550 | 550,000 | ||||||
| 5.00%, 05/01/23 |
160 | 163,142 | ||||||
| 5.00%, 05/01/28 |
835 | 909,312 | ||||||
| Bucks County Industrial Development Authority, RB |
||||||||
| 5.00%, 07/01/35 |
1,100 | 1,178,327 | ||||||
| 5.00%, 07/01/36 |
1,250 | 1,334,729 | ||||||
| 4.00%, 07/01/46 |
145 | 132,448 | ||||||
| 4.00%, 07/01/51 |
100 | 90,482 | ||||||
| Commonwealth Financing Authority, RB |
||||||||
| 5.00%, 06/01/33 |
2,000 | 2,174,148 | ||||||
| 5.00%, 06/01/34 |
3,750 | 4,066,646 | ||||||
| Montgomery County Higher Education and Health Authority, Refunding RB |
||||||||
| 4.00%, 09/01/49 |
4,145 | 4,042,938 | ||||||
| Class B, 4.00%, 05/01/56 |
1,245 | 1,190,280 | ||||||
| Pennsylvania Economic Development Financing Authority, RB |
||||||||
| Series A-1, 5.00%, 04/15/35 |
1,450 | 1,598,990 | ||||||
| Series A-1, 4.00%, 04/15/36 |
1,545 | 1,565,799 | ||||||
| AMT, 5.00%, 12/31/28 |
115 | 123,281 | ||||||
| Pennsylvania Economic Development Financing Authority, Refunding RB(c) |
||||||||
| Series A, 4.00%, 02/15/40 |
1,480 | 1,465,523 | ||||||
| Series A, 4.00%, 02/15/52 |
950 | 925,903 | ||||||
| Pennsylvania Turnpike Commission, RB |
||||||||
| Sub-Series A, 5.50%, 12/01/46 |
18,570 | 19,810,142 | ||||||
| Series A, Subordinate, 4.00%, 12/01/50 |
3,000 | 2,863,803 | ||||||
| Pennsylvania Turnpike Commission, Refunding RB |
||||||||
| 2nd Series, 5.00%, 12/01/30 |
2,620 | 2,873,113 | ||||||
| Sub-Series B-2, 5.00%, 06/01/32 |
5,000 | 5,425,090 | ||||||
| School District of Philadelphia, GO |
||||||||
| Series A, (SAW), 5.00%, 09/01/30 |
1,200 | 1,326,358 | ||||||
| Series A, (SAW), 5.00%, 09/01/31 |
1,000 | 1,100,276 | ||||||
| Series A, (SAW), 5.00%, 09/01/32 |
1,200 | 1,315,490 | ||||||
|
|
|
|||||||
| 56,226,220 | ||||||||
| Puerto Rico — 5.1% | ||||||||
| Puerto Rico Sales Tax Financing Corp. Sales Tax Revenue, RB |
||||||||
| Series A-1, Restructured, 4.50%, 07/01/34 |
4,365 | 4,547,501 | ||||||
| Series A-1, Restructured, 4.75%, 07/01/53 |
1,069 | 1,082,277 | ||||||
| Series A-1, Restructured, 5.00%, 07/01/58 |
8,412 | 8,610,355 | ||||||
| Series A-2, Restructured, 4.33%, 07/01/40 |
14,403 | 14,291,130 | ||||||
| Series A-2, Restructured, 4.78%, 07/01/58 |
488 | 496,283 | ||||||
| Series B-1, Restructured, 4.75%, 07/01/53 |
749 | 758,169 | ||||||
| Series B-2, Restructured, 4.78%, 07/01/58 |
726 | 734,713 | ||||||
| Puerto Rico Sales Tax Financing Corp. Sales Tax Revenue, RB, CAB(e) |
||||||||
| Series A-1, Restructured, 0.00%, 07/01/27 |
11,890 | 10,266,623 | ||||||
| Series A-1, Restructured, 0.00%, 07/01/29 |
446 | 363,209 | ||||||
| Series A-1, Restructured, 0.00%, 07/01/31 |
1,464 | 1,096,044 | ||||||
| Series A-1, Restructured, 0.00%, 07/01/46 |
7,903 | 2,220,403 | ||||||
| S C H E D U L E O F I N V E S T M E N T S |
35 |
| Schedule of Investments (continued) April 30, 2022 |
BlackRock Municipal Income Fund, Inc. (MUI) (Percentages shown are based on Net Assets) |
| Security | Par (000) |
Value | ||||||
| Puerto Rico (continued) | ||||||||
| Puerto Rico Sales Tax Financing Corp. Sales Tax Revenue, RB, CAB(e) (continued) |
||||||||
| Series B-1, Restructured, 0.00%, 07/01/27 |
$ | 2,521 | $ | 2,178,066 | ||||
| Series B-1, Restructured, 0.00%, 07/01/29 |
4,466 | 3,637,619 | ||||||
|
|
|
|||||||
| 50,282,392 | ||||||||
| Rhode Island — 0.7% | ||||||||
| Providence Redevelopment Agency, Refunding RB, Series A, 5.00%, 04/01/29 |
1,000 | 1,049,085 | ||||||
| Rhode Island Health and Educational Building Corp., Refunding RB, 5.00%, 09/01/32 |
2,000 | 2,067,058 | ||||||
| Rhode Island Student Loan Authority, RB |
||||||||
| Series A, AMT, 5.00%, 12/01/27 |
1,000 | 1,081,939 | ||||||
| Series A, AMT, 5.00%, 12/01/28 |
1,000 | 1,089,130 | ||||||
| Rhode Island Student Loan Authority, Refunding RB |
||||||||
| Series A, AMT, 5.00%, 12/01/24 |
750 | 786,641 | ||||||
| Series A, AMT, 5.00%, 12/01/25 |
850 | 902,777 | ||||||
|
|
|
|||||||
| 6,976,630 | ||||||||
| South Carolina — 4.5% | ||||||||
| Charleston County Airport District, ARB |
||||||||
| Series A, AMT, 5.25%, 07/01/25 |
4,490 | 4,624,969 | ||||||
| Series A, AMT, 5.50%, 07/01/38 |
3,000 | 3,085,362 | ||||||
| Series A, AMT, 6.00%, 07/01/38 |
5,270 | 5,452,700 | ||||||
| Series A, AMT, 5.50%, 07/01/41 |
4,170 | 4,258,029 | ||||||
| County of Charleston South Carolina, ARB, 5.25%, 12/01/23(d) |
6,735 | 7,050,562 | ||||||
| South Carolina Jobs-Economic Development Authority, Refunding RB |
||||||||
| 4.00%, 11/15/27 |
625 | 603,846 | ||||||
| Series A, 5.00%, 05/01/37 |
4,480 | 4,849,815 | ||||||
| South Carolina Public Service Authority, Refunding RB |
||||||||
| Series A, 5.00%, 12/01/30 |
5,500 | 5,929,380 | ||||||
| Series A, 5.00%, 12/01/31 |
5,660 | 6,078,399 | ||||||
| Series A, 5.00%, 12/01/32 |
200 | 214,298 | ||||||
| Series A, 5.00%, 12/01/33 |
800 | 853,930 | ||||||
| Series A, 4.00%, 12/01/34 |
2,100 | 2,161,433 | ||||||
|
|
|
|||||||
| 45,162,723 | ||||||||
| Tennessee — 1.5% | ||||||||
| Memphis-Shelby County Industrial Development Board, Refunding TA, Series A, 4.75%, 07/01/27 |
170 | 147,956 | ||||||
| Metropolitan Government Nashville & Davidson County Health & Educational Facilities Board, RB, Series A, 5.00%, 07/01/35 |
4,000 | 4,223,588 | ||||||
| Metropolitan Government Nashville & Davidson County Health & Educational Facilities Board, Refunding RB |
||||||||
| 5.00%, 10/01/29 |
350 | 370,746 | ||||||
| 5.00%, 10/01/34 |
450 | 473,714 | ||||||
| Tennessee Energy Acquisition Corp., RB, Series A, 5.00%, 05/01/52(a) |
9,260 | 10,052,285 | ||||||
|
|
|
|||||||
| 15,268,289 | ||||||||
| Texas — 9.0% | ||||||||
| City of Dallas TX Waterworks & Sewer System Revenue Refunding RB, Series C, 3.00%, 10/01/46 |
5,110 | 4,347,292 | ||||||
| City of Grapevine Texas, GO, 5.00%, 02/15/23(d) |
5,685 | 5,818,723 | ||||||
| City of Houston Texas Airport System Revenue, RB, Series A, AMT, 6.63%, 07/15/38 |
700 | 701,590 | ||||||
| City of Houston Texas Airport System Revenue, Refunding ARB |
||||||||
| AMT, 5.00%, 07/15/27 |
410 | 433,758 | ||||||
| Sub-Series A, AMT, 5.00%, 07/01/31 |
1,430 | 1,552,747 | ||||||
| Security | Par (000) |
Value | ||||||
| Texas (continued) | ||||||||
| City of Houston Texas Airport System Revenue, Refunding ARB (continued) |
||||||||
| Sub-Series A, AMT, 5.00%, 07/01/32 |
$ | 1,515 | $ | 1,632,661 | ||||
| City of Houston Texas Airport System Revenue, Refunding RB, Series A, AMT, 5.00%, 07/01/27 |
400 | 421,670 | ||||||
| Harris County Cultural Education Facilities Finance Corp., Refunding RB, 4.00%, 10/01/47 |
8,000 | 7,779,552 | ||||||
| Love Field Airport Modernization Corp., ARB, AMT, 5.00%, 11/01/28 |
1,000 | 1,009,853 | ||||||
| Lower Colorado River Authority, Refunding RB, 5.50%, 05/15/33 |
3,735 | 3,847,905 | ||||||
| Mission Economic Development Corp., Refunding RB, AMT, Senior Lien, 4.63%, 10/01/31(b) |
1,360 | 1,422,994 | ||||||
| New Hope Cultural Education Facilities Finance Corp., RB, Series A, 5.00%, 08/15/50(b) |
800 | 807,283 | ||||||
| Red River Education Finance Corp., RB(d) |
||||||||
| 5.00%, 03/15/23 |
1,340 | 1,373,733 | ||||||
| 5.25%, 03/15/23 |
7,170 | 7,365,813 | ||||||
| San Jacinto River Authority, RB, (AGM), 5.25%, 10/01/25 |
2,910 | 2,916,664 | ||||||
| State of Texas, GO, 5.00%, 04/01/43 |
15,550 | 16,545,822 | ||||||
| Tarrant County Cultural Education Facilities Finance Corp., RB |
||||||||
| 4.00%, 10/01/42 |
420 | 416,141 | ||||||
| 4.00%, 10/01/52 |
1,160 | 1,136,473 | ||||||
| Series B, 5.00%, 07/01/33 |
8,485 | 9,274,351 | ||||||
| Texas City Industrial Development Corp., RB, Series 2012, 4.13%, 12/01/45 |
445 | 446,259 | ||||||
| Texas Municipal Gas Acquisition & Supply Corp. III, Refunding RB |
||||||||
| 5.00%, 12/15/29 |
1,265 | 1,360,854 | ||||||
| 5.00%, 12/15/31 |
1,950 | 2,110,670 | ||||||
| Texas Water Development Board, RB |
||||||||
| 5.25%, 10/15/46 |
4,780 | 5,194,613 | ||||||
| Series B, 4.00%, 10/15/43 |
5,000 | 5,165,275 | ||||||
| Via Metropolitan Transit, Refunding RB(d) |
||||||||
| 5.25%, 08/01/23 |
4,720 | 4,891,525 | ||||||
| Series A, 5.25%, 08/01/23 |
1,585 | 1,642,599 | ||||||
|
|
|
|||||||
| 89,616,820 | ||||||||
| Utah — 2.0% | ||||||||
| County of Utah, RB |
||||||||
| Series A, 5.00%, 05/15/50 |
2,275 | 2,482,678 | ||||||
| Series B, 5.00%, 05/15/46 |
8,590 | 9,040,245 | ||||||
| Salt Lake City Corp. Utah Airport Revenue, ARB, Series A, AMT, 5.00%, 07/01/33 |
3,500 | 3,752,735 | ||||||
| Utah Charter School Finance Authority, RB(b) |
||||||||
| Series A, 3.63%, 06/15/29 |
410 | 388,452 | ||||||
| Series A, 5.00%, 06/15/49 |
320 | 307,196 | ||||||
| Utah Charter School Finance Authority, Refunding RB, 4.50%, 06/15/27(b) |
1,290 | 1,297,891 | ||||||
| Utah State University, RB, Series B, (AGM), 4.00%, 12/01/45 |
3,000 | 3,083,538 | ||||||
|
|
|
|||||||
| 20,352,735 | ||||||||
| Vermont — 0.6% | ||||||||
| University of Vermont and State Agricultural College, Refunding RB, 4.00%, 10/01/30 |
5,565 | 5,698,081 | ||||||
|
|
|
|||||||
| 36 | 2 0 2 2 B L A C K R O C K A N N U A L R E P O R T T O S H A R E H O L D E R S |
| Schedule of Investments (continued) April 30, 2022 |
BlackRock Municipal Income Fund, Inc. (MUI) (Percentages shown are based on Net Assets) |
| Security | Par (000) |
Value | ||||||
| Virginia — 0.1% | ||||||||
| Henrico County Economic Development Authority, Refunding RB, 4.00%, 10/01/33 |
$ | 495 | $ | 502,435 | ||||
| Lynchburg Economic Development Authority, Refunding RB, 4.00%, 01/01/55 |
305 | 294,390 | ||||||
|
|
|
|||||||
| 796,825 | ||||||||
| Washington — 0.8% | ||||||||
| State of Washington, GO, Series C, 5.00%, 02/01/41 |
2,500 | 2,732,745 | ||||||
| Washington State Convention Center Public Facilities District, RB, 4.00%, 07/01/31 |
1,730 | 1,689,179 | ||||||
| Washington State Housing Finance Commission, RB, M/F Housing, Series A-1, 3.50%, 12/20/35 |
1,619 | 1,473,407 | ||||||
| Washington State Housing Finance Commission, Refunding RB(b) |
||||||||
| 5.00%, 01/01/27 |
1,560 | 1,687,647 | ||||||
| 5.00%, 01/01/28 |
750 | 813,487 | ||||||
|
|
|
|||||||
| 8,396,465 | ||||||||
| Wisconsin — 1.9% | ||||||||
| Public Finance Authority, RB |
||||||||
| 5.00%, 04/01/30(b) |
500 | 523,684 | ||||||
| 5.00%, 06/15/34 |
430 | 469,750 | ||||||
| 5.00%, 06/15/56(b) |
1,000 | 842,956 | ||||||
| 5.00%, 10/15/56(b) |
385 | 351,660 | ||||||
| Series A, 4.00%, 03/01/30(b) |
445 | 446,028 | ||||||
| Series A, 5.00%, 07/15/39(b) |
165 | 171,451 | ||||||
| Series A, 5.00%, 07/15/49(b) |
630 | 647,044 | ||||||
| Series A, 5.00%, 10/15/50(b) |
1,695 | 1,713,582 | ||||||
| Series A, 5.00%, 07/15/54(b) |
300 | 306,889 | ||||||
| Series A-1, 5.00%, 01/01/55(b) |
945 | 863,179 | ||||||
| AMT, 4.00%, 09/30/51 |
1,520 | 1,447,654 | ||||||
| AMT, 4.00%, 03/31/56 |
1,595 | 1,492,086 | ||||||
| Public Finance Authority, Refunding RB |
||||||||
| 4.00%, 09/01/29(b) |
140 | 138,533 | ||||||
| 4.00%, 12/01/31 |
700 | 728,214 | ||||||
| 5.00%, 09/01/49(b) |
520 | 514,910 | ||||||
| Series B, AMT, 5.25%, 07/01/28 |
4,765 | 4,782,635 | ||||||
| Wisconsin Health & Educational Facilities Authority, RB, 4.00%, 08/15/46 |
2,720 | 2,654,326 | ||||||
| Wisconsin Health & Educational Facilities Authority, Refunding RB, (AGM), 4.00%, 02/15/35 |
750 | 767,669 | ||||||
|
|
|
|||||||
| 18,862,250 | ||||||||
|
|
|
|||||||
| Total Municipal Bonds — 142.0% |
1,410,651,431 | |||||||
|
|
|
|||||||
| Municipal Bonds Transferred to Tender Option Bond Trusts(h) |
| |||||||
| Alabama — 4.2% | ||||||||
| Alabama Special Care Facilities Financing Authority- Birmingham AL, Refunding RB, Series B, 5.00%, 11/15/46 |
39,718 | 41,992,116 | ||||||
|
|
|
|||||||
| California — 4.6% | ||||||||
| Bay Area Toll Authority, Refunding RB, 4.00%, 04/01/31(i) |
8,080 | 8,314,136 | ||||||
| Los Angeles Ca Waste Water System Revenue, 4.00%, 06/01/52 |
8,500 | 8,510,534 | ||||||
| Security | Par (000) |
Value | ||||||
| California (continued) | ||||||||
| San Diego County Regional Airport Authority, ARB(i) |
||||||||
| Series B, AMT, Subordinate, 4.00%, 07/01/56 |
$ | 1,201 | $ | 1,107,914 | ||||
| Series B, AMT, Subordinate, 5.00%, 07/01/56 |
2,836 | 3,024,315 | ||||||
| State of California, Refunding GO |
||||||||
| 5.00%, 10/01/35 |
12,500 | 13,401,292 | ||||||
| 4.00%, 11/01/38 |
10,775 | 11,147,718 | ||||||
|
|
|
|||||||
| 45,505,909 | ||||||||
| District of Columbia — 1.5% | ||||||||
| Washington Dc Met Area Transit RB, Series A, 4.00%, 07/15/45 |
15,000 | 15,398,782 | ||||||
|
|
|
|||||||
| Iowa — 0.8% | ||||||||
| Iowa Finance Authority, Refunding RB, Series C, 4.13%, 02/15/35 |
7,500 | 7,546,175 | ||||||
|
|
|
|||||||
| Massachusetts — 3.1% | ||||||||
| Commonwealth of Massachusetts, GOL, Series E, 5.25%, 09/01/43 |
20,000 | 22,283,580 | ||||||
| Massachusetts Development Finance Agency, Refunding RB, 5.00%, 07/01/32 |
7,500 | 8,183,323 | ||||||
|
|
|
|||||||
| 30,466,903 | ||||||||
| Michigan — 1.0% | ||||||||
| Michigan Finance Authority, Refunding RB, Series A, 4.00%, 12/01/40 |
10,100 | 9,961,635 | ||||||
|
|
|
|||||||
| Nevada — 1.0% | ||||||||
| County of Clark Nevada, GO, 4.00%, 07/01/47 |
10,000 | 10,138,475 | ||||||
|
|
|
|||||||
| New Jersey — 0.7% | ||||||||
| New Jersey Housing & Mortgage Finance Agency, Refunding RB |
||||||||
| Series BB, AMT, 3.65%, 04/01/28 |
3,940 | 3,969,767 | ||||||
| Series BB, AMT, 3.70%, 10/01/28 |
3,055 | 3,078,082 | ||||||
|
|
|
|||||||
| 7,047,849 | ||||||||
| New York — 11.3% | ||||||||
| City of New York, GO, Sub-Series 1-I, 5.00%, 03/01/32 |
7,009 | 7,296,989 | ||||||
| Hudson Yards Infrastructure Corp., Refunding RB, Series A, 4.00%, 02/15/44 |
30,165 | 30,691,977 | ||||||
| New York City Transitional Finance Authority Building Aid Revenue, RB, Series S-1, Subordinate, (SAW), 5.00%, 07/15/43 |
11,825 | 12,690,904 | ||||||
| New York City Transitional Finance Authority Future Tax Secured Revenue, RB |
||||||||
| Sub-Series B-1, 5.00%, 08/01/36 |
9,444 | 10,080,971 | ||||||
| Sub-Series B-1, 4.00%, 11/01/41 |
20,000 | 20,055,590 | ||||||
| New York State Dormitory Authority, Refunding RB |
||||||||
| Series A, 5.00%, 03/15/36(i) |
5,505 | 5,876,811 | ||||||
| Series A, 4.00%, 03/15/49 |
10,530 | 10,384,377 | ||||||
| New York State Urban Development Corp., RB, Series A-1, 5.00%, 03/15/32. |
5,501 | 5,623,047 | ||||||
| Port Authority of New York & New Jersey, Refunding ARB, 178th Series, AMT, 5.00%, 12/01/32 |
4,009 | 4,127,524 | ||||||
| Sales Tax Asset Receivable Corp., Refunding RB, Series A, 5.00%, 10/15/24. |
5,010 | 5,332,252 | ||||||
|
|
|
|||||||
| 112,160,442 | ||||||||
| S C H E D U L E O F I N V E S T M E N T S |
37 |
| Schedule of Investments (continued) April 30, 2022 |
BlackRock Municipal Income Fund, Inc. (MUI) (Percentages shown are based on Net Assets) |
| Security | Par (000) |
Value | ||||||
|
|
||||||||
| Pennsylvania — 1.0% | ||||||||
| Geisinger Authority, Refunding RB, Series A, 4.00%, 06/01/41 |
$ | 10,000 | $ | 9,922,915 | ||||
|
|
|
|||||||
| Texas — 1.8% | ||||||||
| Pflugerville Independent School District, GO, (PSF-GTD), 5.00%, 02/15/24 |
7,500 | 7,837,940 | ||||||
| Texas Water Development Board, RB, 4.00%, 10/15/51 |
10,000 | 10,344,245 | ||||||
|
|
|
|||||||
| 18,182,185 | ||||||||
| Washington — 1.6% | ||||||||
| Port of Seattle Washington, ARB, Series A, AMT, 5.00%, 05/01/34 |
15,000 | 15,872,760 | ||||||
|
|
|
|||||||
| Total Municipal Bonds Transferred to Tender Option Bond Trusts — 32.6% |
324,196,146 | |||||||
|
|
|
|||||||
| Total Long-Term Investments — 174.6% |
1,734,847,577 | |||||||
|
|
|
|||||||
| Shares | ||||||||
|
|
||||||||
| Short-Term Securities |
||||||||
| Money Market Funds — 0.0% | ||||||||
| BlackRock Liquidity Funds, MuniCash, Institutional Class, 0.25%(j)(k) |
309,107 | 309,107 | ||||||
|
|
|
|||||||
| Total Short-Term Securities — 0.0% |
309,107 | |||||||
|
|
|
|||||||
| Total Investments — 174.6% |
|
1,735,156,684 | ||||||
| Other Assets Less Liabilities — 0.1% |
|
876,638 | ||||||
| Liability for TOB Trust Certificates, Including Interest Expense and Fees Payable — (18.2)% |
|
(181,000,760 | ) | |||||
| VRDP Shares at Liquidation Value, Net of Deferred Offering Costs — (56.5)% |
|
(561,375,145 | ) | |||||
|
|
|
|||||||
| Net Assets Applicable to Common Shares — 100.0% |
|
$ | 993,657,417 | |||||
|
|
|
|||||||
| (a) | Variable rate security. Interest rate resets periodically. The rate shown is the effective interest rate as of period end. Security description also includes the reference rate and spread if published and available. |
| (b) | Security exempt from registration pursuant to Rule 144A under the Securities Act of 1933, as amended. These securities may be resold in transactions exempt from registration to qualified institutional investors. |
| (c) | When-issued security. |
| (d) | U.S. Government securities held in escrow, are used to pay interest on this security as well as to retire the bond in full at the date indicated, typically at a premium to par. |
| (e) | Zero-coupon bond. |
| (f) | Issuer filed for bankruptcy and/or is in default. |
| (g) | Non-income producing security. |
| (h) | Represent bonds transferred to a TOB Trust in exchange of cash and residual certificates received by the Fund. These bonds serve as collateral in a secured borrowing. See Note 4 of the Notes to Financial Statements for details. |
| (i) | All or a portion of the security is subject to a recourse agreement. The aggregate maximum potential amount the Fund could ultimately be required to pay under the agreements, which expire between September 15, 2024 to July 1, 2029, is $12,826,553. See Note 4 of the Notes to Financial Statements for details. |
| (j) | Affiliate of the Fund. |
| (k) | Annualized 7-day yield as of period end. |
Affiliates
Investments in issuers considered to be affiliate(s) of the Fund during the year ended April 30, 2022 for purposes of Section 2(a)(3) of the Investment Company Act of 1940, as amended, were as follows:
| Affiliated Issuer | Value at 04/30/21 |
Purchases at Cost |
Proceeds from Sales |
Net Realized Gain (Loss) |
Change in Unrealized Appreciation (Depreciation) |
Value at 04/30/22 |
Shares Held at 04/30/22 |
Income | Capital Gain Distributions from Underlying Funds |
|||||||||||||||||||||||||||
| BlackRock Liquidity Funds, MuniCash, Institutional Class |
$ | 126,519 | $ | 183,463 | (a) | $ | — | $ | (875 | ) | $ | — | $ | 309,107 | 309,107 | $ | 2,552 | $ | — | |||||||||||||||||
|
|
|
|
|
|
|
|
|
|
|
|||||||||||||||||||||||||||
| (a) | Represents net amount purchased (sold). |
| 38 | 2 0 2 2 B L A C K R O C K A N N U A L R E P O R T T O S H A R E H O L D E R S |
| Schedule of Investments (continued) April 30, 2022 |
BlackRock Municipal Income Fund, Inc. (MUI) |
Derivative Financial Instruments Outstanding as of Period End
Futures Contracts
| Description | Number of Contracts |
Expiration Date |
Notional Amount (000) |
Value/ Unrealized Appreciation (Depreciation) |
||||||||||||
| Short Contracts |
||||||||||||||||
| 10-Year U.S. Treasury Note |
566 | 06/21/22 | $ | 67,381 | $ | 1,753,439 | ||||||||||
| U.S. Long Bond |
447 | 06/21/22 | 62,804 | 1,471,600 | ||||||||||||
| 5-Year U.S. Treasury Note |
740 | 06/30/22 | 83,296 | 1,545,910 | ||||||||||||
|
|
|
|||||||||||||||
| $ | 4,770,949 | |||||||||||||||
|
|
|
|||||||||||||||
Derivative Financial Instruments Categorized by Risk Exposure
As of period end, the fair values of derivative financial instruments located in the Statements of Assets and Liabilities were as follows:
| Commodity Contracts |
Credit Contracts |
Equity Contracts |
Foreign Currency Exchange Contracts |
Interest Rate Contracts |
Other Contracts |
Total | ||||||||||||||||||||||
| Assets — Derivative Financial Instruments |
||||||||||||||||||||||||||||
| Futures contracts |
||||||||||||||||||||||||||||
| Unrealized appreciation on futures contracts(a) |
$ | — | $ | — | $ | — | $ | — | $ | 4,770,949 | $ | — | $ | 4,770,949 | ||||||||||||||
|
|
|
|
|
|
|
|
|
|
|
|
|
|
|
|||||||||||||||
| (a) | Net cumulative unrealized appreciation (depreciation) on futures contracts and centrally cleared swaps, if any, are reported in the Schedule of Investments. In the Statements of Assets and Liabilities, only current day’s variation margin is reported in receivables or payables and the net cumulative unrealized appreciation (depreciation) is included in accumulated earnings (loss). |
For the period ended April 30, 2022, the effect of derivative financial instruments in the Statements of Operations was as follows:
| Commodity Contracts |
Credit Contracts |
Equity Contracts |
Foreign Currency Exchange Contracts |
Interest Rate Contracts |
Other Contracts |
Total | ||||||||||||||||||||||
| Net Realized Gain (Loss) from: |
||||||||||||||||||||||||||||
| Futures contracts |
$ | — | $ | — | $ | — | $ | — | $ | 1,744,066 | $ | — | $ | 1,744,066 | ||||||||||||||
|
|
|
|
|
|
|
|
|
|
|
|
|
|
|
|||||||||||||||
| Net Change in Unrealized Appreciation (Depreciation) on: |
||||||||||||||||||||||||||||
| Futures contracts |
$ | — | $ | — | $ | — | $ | — | $ | 4,202,988 | $ | — | $ | 4,202,988 | ||||||||||||||
|
|
|
|
|
|
|
|
|
|
|
|
|
|
|
|||||||||||||||
Average Quarterly Balances of Outstanding Derivative Financial Instruments
| Futures contracts: |
||||
| Average notional value of contracts — short |
$ | 89,971,840 | ||
For more information about the Fund’s investment risks regarding derivative financial instruments, refer to the Notes to Financial Statements.
Fair Value Hierarchy as of Period End
Various inputs are used in determining the fair value of financial instruments. For a description of the input levels and information about the Fund’s policy regarding valuation of financial instruments, refer to the Notes to Financial Statements.
The following table summarizes the Fund’s financial instruments categorized in the fair value hierarchy. The breakdown of the Fund’s financial instruments into major categories is disclosed in the Schedule of Investments above.
| Level 1 | Level 2 | Level 3 | Total | |||||||||||||
| Assets |
||||||||||||||||
| Investments |
||||||||||||||||
| Long-Term Investments |
||||||||||||||||
| Municipal Bonds |
$ | — | $ | 1,410,651,431 | $ | — | $ | 1,410,651,431 | ||||||||
| Municipal Bonds Transferred to Tender Option Bond Trusts |
— | 324,196,146 | — | 324,196,146 | ||||||||||||
| S C H E D U L E O F I N V E S T M E N T S |
39 |
| Schedule of Investments (continued) April 30, 2022 |
BlackRock Municipal Income Fund, Inc. (MUI) |
Fair Value Hierarchy as of Period End (continued)
| Level 1 | Level 2 | Level 3 | Total | |||||||||||||
| Short-Term Securities |
||||||||||||||||
| Money Market Funds |
$ | 309,107 | $ | — | $ | — | $ | 309,107 | ||||||||
|
|
|
|
|
|
|
|
|
|||||||||
| $ | 309,107 | $ | 1,734,847,577 | $ | — | $ | 1,735,156,684 | |||||||||
|
|
|
|
|
|
|
|
|
|||||||||
| Derivative Financial Instruments(a) |
||||||||||||||||
| Assets |
||||||||||||||||
| Interest Rate Contracts |
$ | 4,770,949 | $ | — | $ | — | $ | 4,770,949 | ||||||||
|
|
|
|
|
|
|
|
|
|||||||||
| (a) | Derivative financial instruments are futures contracts. Futures contracts are valued at the unrealized appreciation (depreciation) on the instrument. |
The Fund may hold assets and/or liabilities in which the fair value approximates the carrying amount for financial statement purposes. As of period end, such assets and/or liabilities are categorized within the fair value hierarchy as follows:
|
|
||||||||||||||||
| Level 1 | Level 2 | Level 3 | Total | |||||||||||||
|
|
||||||||||||||||
| Liabilities |
||||||||||||||||
| TOB Trust Certificates |
$ | — | $ | (180,857,841 | ) | $ | — | $ | (180,857,841 | ) | ||||||
| VRDP Shares at Liquidation Value |
— | (561,700,000 | ) | — | (561,700,000 | ) | ||||||||||
|
|
|
|
|
|
|
|
|
|||||||||
| $ | — | $ | (742,557,841 | ) | $ | — | $ | (742,557,841 | ) | |||||||
|
|
|
|
|
|
|
|
|
|||||||||
See notes to financial statements.
| 40 | 2 0 2 2 B L A C K R O C K A N N U A L R E P O R T T O S H A R E H O L D E R S |
| Schedule of Investments April 30, 2022 |
BlackRock MuniHoldings Fund, Inc. (MHD) (Percentages shown are based on Net Assets) |
| Security | Par (000) |
Value | ||||||
| Municipal Bonds |
||||||||
| Alabama — 1.1% | ||||||||
| County of Jefferson Alabama Sewer Revenue, Refunding RB |
||||||||
| Series A, Senior Lien, (AGM), 5.00%, 10/01/44 |
$ | 570 | $ | 591,699 | ||||
| Series A, Senior Lien, (AGM), 5.25%, 10/01/48 |
1,090 | 1,134,203 | ||||||
| Series D, Sub Lien, 6.00%, 10/01/42 |
2,875 | 3,110,785 | ||||||
| Series D, Sub Lien, 7.00%, 10/01/51 |
1,545 | 1,696,615 | ||||||
| Health Care Authority of the City of Huntsville, RB |
||||||||
| Series B1, 4.00%, 06/01/45 |
315 | 307,820 | ||||||
| Series B1, (AGM), 3.00%, 06/01/50 |
865 | 717,649 | ||||||
| Opelika Utilities Board, Refunding RB, 4.00%, 06/01/41 |
960 | 975,756 | ||||||
|
|
|
|||||||
| 8,534,527 | ||||||||
| Alaska — 0.2% | ||||||||
| Northern Tobacco Securitization Corp., Refunding RB, Series A, Class 1, 4.00%, 06/01/50 |
1,890 | 1,756,827 | ||||||
|
|
|
|||||||
| Arizona — 2.8% | ||||||||
| Arizona Industrial Development Authority, RB |
||||||||
| 4.38%, 07/01/39(a) |
575 | 581,534 | ||||||
| Series A, 5.00%, 07/01/39(a) |
480 | 485,371 | ||||||
| Series A, (BAM), 4.00%, 06/01/44 |
425 | 430,080 | ||||||
| Series A, 5.00%, 07/01/49(a) |
550 | 550,561 | ||||||
| Series A, 5.00%, 07/01/54(a) |
425 | 421,294 | ||||||
| Arizona Industrial Development Authority, Refunding RB(a) |
||||||||
| Series A, 5.50%, 07/01/52 |
130 | 136,190 | ||||||
| Series G, 5.00%, 07/01/47 |
435 | 432,498 | ||||||
| Glendale Industrial Development Authority, RB |
||||||||
| 5.00%, 05/15/41 |
65 | 68,212 | ||||||
| 5.00%, 05/15/56 |
575 | 600,094 | ||||||
| Industrial Development Authority of the City of Phoenix, RB, Series A, 5.00%, 07/01/46(a) |
2,120 | 2,113,822 | ||||||
| Industrial Development Authority of the County of Pima, RB(a) |
||||||||
| 5.00%, 07/01/34 |
400 | 401,763 | ||||||
| 5.00%, 06/15/47 |
840 | 841,925 | ||||||
| Industrial Development Authority of the County of Pima, Refunding RB, 5.00%, 06/15/52(a) |
260 | 260,463 | ||||||
| Maricopa County Industrial Development Authority, Refunding RB |
||||||||
| 5.00%, 07/01/39(a) |
215 | 217,294 | ||||||
| 5.00%, 07/01/54(a) |
490 | 476,176 | ||||||
| Series A, 4.13%, 09/01/38 |
775 | 787,653 | ||||||
| Maricopa County Pollution Control Corp., Refunding RB, Series B, 3.60%, 04/01/40 |
1,400 | 1,339,241 | ||||||
| Salt Verde Financial Corp., RB |
||||||||
| 5.00%, 12/01/32 |
3,500 | 3,821,451 | ||||||
| 5.00%, 12/01/37 |
6,845 | 7,574,218 | ||||||
|
|
|
|||||||
| 21,539,840 | ||||||||
| Arkansas — 1.1% | ||||||||
| Arkansas Development Finance Authority, RB |
||||||||
| 5.00%, 12/01/47 |
385 | 412,295 | ||||||
| Series A, AMT, 4.50%, 09/01/49(a) |
4,925 | 4,541,219 | ||||||
| City of Benton Arkansas, RB, (AGM), 4.00%, 06/01/39 |
505 | 509,155 | ||||||
| Security | Par (000) |
Value | ||||||
| Arkansas (continued) | ||||||||
| City of Fort Smith Arkansas Water & Sewer Revenue, Refunding RB, Subordinate, 4.00%, 10/01/40 |
$ | 840 | $ | 843,553 | ||||
| City of Little Rock Arkansas, RB, 4.00%, 07/01/41 |
1,835 | 1,849,798 | ||||||
| Pulaski County Public Facilities Board, RB, 5.00%, 12/01/42 |
465 | 480,060 | ||||||
|
|
|
|||||||
| 8,636,080 | ||||||||
| California — 10.0% | ||||||||
| California Health Facilities Financing Authority, Refunding RB |
||||||||
| Series A, 5.00%, 07/01/23(b) |
1,320 | 1,363,462 | ||||||
| Series A, 4.00%, 04/01/45 |
1,030 | 999,670 | ||||||
| Series A, 4.00%, 08/15/48 |
1,660 | 1,643,890 | ||||||
| California Municipal Finance Authority, ARB, AMT, Senior Lien, 5.00%, 12/31/43 |
800 | 835,713 | ||||||
| California Municipal Finance Authority, RB, S/F Housing |
||||||||
| Series A, 5.25%, 08/15/39 |
185 | 187,692 | ||||||
| Series A, 5.25%, 08/15/49 |
460 | 466,284 | ||||||
| California Municipal Finance Authority, Refunding RB, Series A, 5.00%, 02/01/42 |
285 | 300,528 | ||||||
| California Pollution Control Financing Authority, RB, Series A, AMT, 5.00%, 11/21/45(a) |
1,755 | 1,756,645 | ||||||
| California State Public Works Board, RB |
||||||||
| 4.00%, 11/01/41 |
1,230 | 1,260,753 | ||||||
| Series F, 5.25%, 09/01/33 |
1,230 | 1,272,650 | ||||||
| Series I, 5.50%, 11/01/30 |
2,500 | 2,613,920 | ||||||
| Series I, 5.50%, 11/01/31 |
3,965 | 4,140,713 | ||||||
| Series I, 5.00%, 11/01/38 |
955 | 989,458 | ||||||
| California Statewide Communities Development Authority, Refunding RB |
||||||||
| 4.00%, 03/01/42 |
1,000 | 1,013,754 | ||||||
| 4.00%, 03/01/48 |
1,345 | 1,350,110 | ||||||
| Carlsbad Unified School District, GO, Series B, 6.00%, 05/01/34 |
1,000 | 1,066,364 | ||||||
| City of Los Angeles Department of Airports, ARB |
||||||||
| AMT, 5.00%, 05/15/45 |
245 | 266,187 | ||||||
| Series A, AMT, 4.00%, 05/15/49 |
5,750 | 5,548,313 | ||||||
| City of Los Angeles Department of Airports, Refunding ARB |
||||||||
| Series A, AMT, 5.00%, 05/15/38 |
210 | 230,821 | ||||||
| Series A, AMT, 5.00%, 05/15/39 |
225 | 246,319 | ||||||
| Series A, AMT, 5.00%, 05/15/46 |
585 | 631,584 | ||||||
| CMFA Special Finance Agency XII, RB, M/F Housing, Series A, 3.25%, 02/01/57(a) |
655 | 491,414 | ||||||
| CSCDA Community Improvement Authority, RB, M/F Housing(a) |
||||||||
| Class 2, 4.00%, 06/01/58 |
2,165 | 1,713,821 | ||||||
| Senior Lien, 3.13%, 06/01/57 |
2,070 | 1,443,210 | ||||||
| Class 2, Senior Lien, 4.00%, 12/01/58 |
945 | 759,059 | ||||||
| Hartnell Community College District, GO, CAB, Series D, 7.00%, 08/01/34 |
1,650 | 1,949,846 | ||||||
| Kern Community College District, GO, Series C, 5.50%, 11/01/33(b) |
2,445 | 2,562,101 | ||||||
| Norwalk-La Mirada Unified School District, Refunding GO, CAB, Series E, Election 2002, (AGC), 0.00%, 08/01/38(c) |
8,000 | 4,103,456 | ||||||
| S C H E D U L E O F I N V E S T M E N T S |
41 |
| Schedule of Investments (continued) April 30, 2022 |
BlackRock MuniHoldings Fund, Inc. (MHD) (Percentages shown are based on Net Assets) |
| Security | Par (000) |
Value | ||||||
| California (continued) | ||||||||
| Palomar Community College District, GO, CAB |
||||||||
| Series B, 0.00%, 08/01/30(c) |
$ | 1,500 | $ | 1,158,639 | ||||
| Series B, Convertible, 6.20%, 08/01/39 |
2,605 | 2,730,923 | ||||||
| Regents of the University of California Medical Center Pooled Revenue, Refunding RB |
||||||||
| Series J, 5.25%, 05/15/38(b) |
5,005 | 5,165,445 | ||||||
| Series J, 5.25%, 05/15/38 |
1,420 | 1,458,499 | ||||||
| Riverside County Public Financing Authority, RB, 5.25%, 11/01/40(b) |
2,500 | 2,732,710 | ||||||
| Riverside County Redevelopment Successor Agency, Refunding TA, Series A, (BAM), 4.00%, 10/01/39 |
1,550 | 1,594,763 | ||||||
| San Diego Community College District, GO, CAB, 6.00%, 08/01/27(b) |
2,800 | 3,276,596 | ||||||
| San Diego County Regional Airport Authority, ARB, Series B, AMT, 5.00%, 07/01/47 |
1,405 | 1,467,486 | ||||||
| San Diego Unified School District, GO, CAB(c) |
||||||||
| Series A, 0.00%, 07/01/29 |
5,315 | 4,249,832 | ||||||
| Series A, 0.00%, 07/01/29(d) |
685 | 543,393 | ||||||
| San Francisco City & County Airport Comm-San Francisco International Airport, Refunding ARB |
||||||||
| Series A, AMT, 5.50%, 05/01/28 |
1,085 | 1,112,690 | ||||||
| Series A, AMT, 5.25%, 05/01/33 |
850 | 867,899 | ||||||
| Series A, AMT, 5.00%, 05/01/44 |
1,090 | 1,113,609 | ||||||
| San Francisco City & County Airport Comm-San Francisco International Airport, Refunding RB, Series A, AMT, 4.00%, 05/01/52 |
1,705 | 1,598,785 | ||||||
| State of California, Refunding GO |
||||||||
| 5.00%, 02/01/38 |
3,000 | 3,055,245 | ||||||
| 3.00%, 12/01/46 |
1,395 | 1,170,475 | ||||||
| Stockton Public Financing Authority, RB, Series A, 6.25%, 10/01/23(b) |
440 | 464,798 | ||||||
| Washington Township Health Care District, GO, Series B, Election 2004, 5.50%, 08/01/40 |
920 | 955,380 | ||||||
|
|
|
|||||||
| 75,924,904 | ||||||||
| Colorado — 2.4% | ||||||||
| Arapahoe County School District No.6 Littleton, GO, Series A, (SAW), 5.50%, 12/01/43 |
1,260 | 1,427,539 | ||||||
| City & County of Denver Colorado Airport System Revenue, ARB |
||||||||
| Series B, 5.25%, 11/15/32 |
3,250 | 3,366,665 | ||||||
| Series A, AMT, 5.50%, 11/15/28 |
1,000 | 1,037,930 | ||||||
| Series A, AMT, 5.50%, 11/15/30 |
340 | 352,663 | ||||||
| Series A, AMT, 5.50%, 11/15/31 |
405 | 419,949 | ||||||
| City & County of Denver Colorado, RB, CAB(c) |
||||||||
| Series A-2, 0.00%, 08/01/37 |
1,490 | 795,212 | ||||||
| Series A-2, 0.00%, 08/01/38 |
915 | 467,216 | ||||||
| Colorado Educational & Cultural Facilities Authority, RB |
||||||||
| (NPFGC), 5.50%, 07/01/40 |
2,510 | 2,515,565 | ||||||
| 5.00%, 03/01/50(a) |
360 | 365,940 | ||||||
| Colorado Educational & Cultural Facilities Authority, Refunding RB, Class A, 5.00%, 10/01/59(a) |
1,690 | 1,658,125 | ||||||
| Colorado Health Facilities Authority, Refunding RB |
||||||||
| Series A, 4.00%, 08/01/44 |
1,285 | 1,244,303 | ||||||
| Series A, 3.25%, 08/01/49 |
1,415 | 1,155,582 | ||||||
| Security | Par (000) |
Value | ||||||
| Colorado (continued) | ||||||||
| Colorado Housing and Finance Authority, Refunding RB, S/F Housing, Series B, (GNMA), 3.25%, 05/01/52 |
$ | 1,605 | $ | 1,584,719 | ||||
| Denver International Business Center Metropolitan District No.1, GO, Series A, 4.00%, 12/01/48 |
555 | 525,331 | ||||||
| State of Colorado, COP, Series O, 4.00%, 03/15/44 |
930 | 937,979 | ||||||
|
|
|
|||||||
| 17,854,718 | ||||||||
| Connecticut — 0.9% | ||||||||
| Connecticut Housing Finance Authority, Refunding RB, M/F Housing, Series A-1, 3.50%, 11/15/51 |
1,290 | 1,294,152 | ||||||
| Connecticut State Health & Educational Facilities Authority, Refunding RB, Series I-1, 5.00%, 07/01/42 |
590 | 622,995 | ||||||
| State of Connecticut Special Tax Revenue, RB |
||||||||
| Series A, 4.00%, 05/01/36 |
240 | 248,535 | ||||||
| Series A, 4.00%, 05/01/39 |
150 | 154,649 | ||||||
| State of Connecticut, GO |
||||||||
| Series A, 4.00%, 01/15/38 |
2,260 | 2,321,709 | ||||||
| Series A, 5.00%, 04/15/38 |
985 | 1,070,246 | ||||||
| State of Connecticut, Refunding GO, Series E, 5.00%, 09/15/37 |
970 | 1,059,892 | ||||||
|
|
|
|||||||
| 6,772,178 | ||||||||
| Delaware — 0.7% | ||||||||
| County of Kent Delaware, RB |
||||||||
| Series A, 5.00%, 07/01/40 |
330 | 350,242 | ||||||
| Series A, 5.00%, 07/01/48 |
900 | 941,487 | ||||||
| Delaware State Health Facilities Authority, RB |
||||||||
| 5.00%, 06/01/43 |
820 | 904,331 | ||||||
| 5.00%, 06/01/48 |
1,395 | 1,526,381 | ||||||
| Delaware Transportation Authority, RB, 5.00%, 06/01/55 |
1,790 | 1,866,977 | ||||||
|
|
|
|||||||
| 5,589,418 | ||||||||
| District of Columbia — 3.6% | ||||||||
| District of Columbia, Refunding RB |
||||||||
| 5.00%, 04/01/35 |
315 | 336,340 | ||||||
| Catholic Health Services, 5.00%, 10/01/48 |
1,695 | 1,840,780 | ||||||
| District of Columbia, TA, 5.13%, 06/01/41 |
1,520 | 1,522,925 | ||||||
| Metropolitan Washington Airports Authority Aviation Revenue, Refunding ARB |
||||||||
| Series A, AMT, 4.00%, 10/01/37 |
955 | 951,065 | ||||||
| Series A, AMT, 4.00%, 10/01/38 |
955 | 943,558 | ||||||
| Series A, AMT, 4.00%, 10/01/40 |
1,150 | 1,138,441 | ||||||
| Series A, AMT, 4.00%, 10/01/41 |
2,470 | 2,439,567 | ||||||
| Metropolitan Washington Airports Authority Dulles Toll Road Revenue, Refunding RB, Series B, Subordinate, 4.00%, 10/01/49 |
1,255 | 1,241,585 | ||||||
| Metropolitan Washington Airports Authority Dulles Toll Road Revenue, Refunding RB, CAB(c) |
||||||||
| Series B, 2nd Senior Lien, (AGC), 0.00%, 10/01/34 |
10,170 | 6,208,816 | ||||||
| Series B, 2nd Senior Lien, (AGC), 0.00%, 10/01/35 |
13,485 | 7,841,487 | ||||||
| Washington Metropolitan Area Transit Authority, 5.00%, 07/01/42 |
3,000 | 3,222,168 | ||||||
|
|
|
|||||||
| 27,686,732 | ||||||||
| 42 | 2 0 2 2 B L A C K R O C K A N N U A L R E P O R T T O S H A R E H O L D E R S |
| Schedule of Investments (continued) April 30, 2022 |
BlackRock MuniHoldings Fund, Inc. (MHD) (Percentages shown are based on Net Assets) |
| Security | Par (000) |
Value | ||||||
| Florida — 7.3% | ||||||||
| Broward County FL Water & Sewer Utility Revenue, RB, Series A, 4.00%, 10/01/47 |
$ | 585 | $ | 593,736 | ||||
| Capital Projects Finance Authority, Refunding RB |
||||||||
| Series A-1, 5.00%, 10/01/32 |
140 | 152,868 | ||||||
| Series A-1, 5.00%, 10/01/33 |
155 | 168,300 | ||||||
| Series A-1, 5.00%, 10/01/34 |
155 | 167,811 | ||||||
| Series A-1, 5.00%, 10/01/35 |
50 | 53,969 | ||||||
| Capital Trust Agency, Inc., RB |
||||||||
| 5.50%, 06/01/57(a) |
170 | 157,727 | ||||||
| Series A, 5.00%, 06/01/45(a) |
480 | 440,316 | ||||||
| Series A, 5.00%, 12/15/49 |
160 | 161,503 | ||||||
| Series A, 5.00%, 12/15/54 |
140 | 141,094 | ||||||
| Central Florida Expressway Authority, Refunding RB, Senior Lien, 5.00%, 07/01/48 |
2,760 | 2,983,927 | ||||||
| City of Tampa Florida, RB, CAB(c) |
||||||||
| Series A, 0.00%, 09/01/49 |
285 | 89,822 | ||||||
| Series A, 0.00%, 09/01/53 |
300 | 79,849 | ||||||
| Collier County Health Facilities Authority, Refunding RB, Series A, 5.00%, 05/01/45 |
1,755 | 1,820,326 | ||||||
| County of Broward Florida Airport System Revenue, ARB, Series A, AMT, 5.00%, 10/01/45 |
2,845 | 2,946,299 | ||||||
| County of Broward Florida Port Facilities Revenue, ARB, Series B, AMT, 4.00%, 09/01/49 |
1,070 | 1,014,134 | ||||||
| County of Lee FL Airport Revenue, ARB, Series B, AMT, 5.00%, 10/01/46 |
3,515 | 3,819,536 | ||||||
| County of Miami-Dade Florida Aviation Revenue, Refunding RB |
||||||||
| Series A, 4.00%, 10/01/37 |
235 | 236,931 | ||||||
| Series A, 4.00%, 10/01/38 |
235 | 236,327 | ||||||
| Series A, 4.00%, 10/01/39 |
175 | 175,685 | ||||||
| County of Miami-Dade Seaport Department, ARB(b) |
||||||||
| Series A, 6.00%, 10/01/23 |
5,215 | 5,488,558 | ||||||
| Series A, 5.38%, 10/01/33 |
1,015 | 1,058,745 | ||||||
| Series B, AMT, 6.00%, 10/01/23 |
4,750 | 4,984,582 | ||||||
| Series B, AMT, 6.25%, 10/01/23 |
460 | 484,142 | ||||||
| County of Miami-Dade Seaport Department, Refunding RB, Series B-1, AMT, Subordinate, 4.00%, 10/01/46 |
2,130 | 2,030,212 | ||||||
| County of Osceola Florida Transportation Revenue, Refunding RB, CAB(c) |
||||||||
| Series A-2, 0.00%, 10/01/41 |
275 | 114,837 | ||||||
| Series A-2, 0.00%, 10/01/42 |
370 | 147,621 | ||||||
| Series A-2, 0.00%, 10/01/43 |
335 | 127,376 | ||||||
| Series A-2, 0.00%, 10/01/44 |
345 | 124,888 | ||||||
| Series A-2, 0.00%, 10/01/45 |
285 | 98,399 | ||||||
| Series A-2, 0.00%, 10/01/46 |
625 | 206,086 | ||||||
| Series A-2, 0.00%, 10/01/47 |
605 | 190,218 | ||||||
| Series A-2, 0.00%, 10/01/48 |
430 | 128,899 | ||||||
| Series A-2, 0.00%, 10/01/49 |
355 | 101,608 | ||||||
| Cypress Bluff Community Development District, SAB, Series A, 3.80%, 05/01/50(a) |
430 | 347,325 | ||||||
| Escambia County Health Facilities Authority, Refunding RB, 4.00%, 08/15/45 |
1,725 | 1,644,998 | ||||||
| Esplanade Lake Club Community Development District, SAB, Series A-1, 4.13%, 11/01/50 |
615 | 558,708 | ||||||
| Florida Development Finance Corp., RB |
||||||||
| Series A, 5.00%, 06/15/40 |
155 | 161,396 | ||||||
| Series A, 5.00%, 06/15/50 |
520 | 536,475 | ||||||
| Series A, 5.00%, 06/15/55 |
310 | 318,704 | ||||||
| AMT, 5.00%, 05/01/29(a) |
270 | 274,583 | ||||||
| Security | Par (000) |
Value | ||||||
| Florida (continued) | ||||||||
| Florida Development Finance Corp., RB (continued) |
||||||||
| Series A, AMT, 5.00%, 08/01/29(a)(e) |
$ | 105 | $ | 105,437 | ||||
| Florida Development Finance Corp., Refunding RB, Series C, 5.00%, 09/15/50(a) |
270 | 273,205 | ||||||
| Florida Housing Finance Corp., RB, S/F Housing, Series 1, (FHLMC, FNMA, GNMA), 3.50%, 07/01/52 |
3,515 | 3,526,002 | ||||||
| Hillsborough County Aviation Authority, Refunding RB, Sub-Series A, AMT, 5.50%, 10/01/23(b) |
1,735 | 1,808,122 | ||||||
| Lee County Housing Finance Authority, RB, S/F Housing, Series A-2, AMT, (FHLMC, FNMA, GNMA), 6.00%, 09/01/40 |
40 | 40,064 | ||||||
| Miami-Dade County Educational Facilities Authority, Refunding RB, Series A, 5.00%, 04/01/40 |
3,465 | 3,592,034 | ||||||
| Orange County Health Facilities Authority, Refunding RB, 5.00%, 08/01/41 |
1,305 | 1,372,709 | ||||||
| Palm Beach County Health Facilities Authority, RB, Series B, 5.00%, 11/15/42. |
210 | 230,725 | ||||||
| Palm Beach County Health Facilities Authority, Refunding RB, 4.00%, 08/15/49 |
1,185 | 1,157,845 | ||||||
| Reedy Creek Improvement District, GO, Series A, 5.25%, 06/01/32(b) |
1,785 | 1,843,352 | ||||||
| Sarasota County Florida Utility System Revenue, RB, Series A, 5.00%, 10/01/50. |
465 | 521,197 | ||||||
| Southern Groves Community Development District No.5, Refunding SAB, 4.00%, 05/01/43 |
220 | 202,338 | ||||||
| Stevens Plantation Community Development District, SAB, Series A, 7.10%, 05/01/35(f)(g) |
800 | 506,893 | ||||||
| Trout Creek Community Development District, SAB |
||||||||
| 4.00%, 05/01/40 |
635 | 569,765 | ||||||
| 4.00%, 05/01/51 |
1,055 | 879,140 | ||||||
| Village Community Development District No.10, SAB, 5.13%, 05/01/43 |
2,320 | 2,320,000 | ||||||
| Volusia County Educational Facility Authority, Refunding RB, 5.00%, 10/15/49 |
1,265 | 1,400,899 | ||||||
| Westside Community Development District, SAB, 4.00%, 05/01/50 |
815 | 752,805 | ||||||
|
|
|
|||||||
| 55,671,052 | ||||||||
| Georgia — 2.7% | ||||||||
| Development Authority for Fulton County, RB, 4.00%, 06/15/49 |
470 | 478,555 | ||||||
| Georgia Housing & Finance Authority, RB, S/F Housing |
||||||||
| Series A, 3.95%, 12/01/43. |
120 | 121,597 | ||||||
| Series A, 4.00%, 12/01/48 |
170 | 172,174 | ||||||
| Series B, 2.50%, 06/01/50 |
520 | 381,014 | ||||||
| Georgia Housing & Finance Authority, Refunding RB, S/F Housing, Series A, 4.00%, 06/01/49(h) |
1,645 | 1,699,260 | ||||||
| Griffin-Spalding County Hospital Authority, RB, 4.00%, 04/01/42 |
2,310 | 2,313,948 | ||||||
| Main Street Natural Gas, Inc., RB |
||||||||
| Series A, 5.00%, 05/15/35 |
360 | 396,489 | ||||||
| Series A, 5.00%, 05/15/36 |
1,860 | 2,054,971 | ||||||
| Series A, 5.00%, 05/15/37 |
400 | 442,898 | ||||||
| Series A, 5.00%, 05/15/38 |
1,265 | 1,403,008 | ||||||
| Series A, 5.00%, 05/15/43 |
330 | 346,965 | ||||||
| Series A, 5.00%, 05/15/49 |
4,575 | 5,112,723 | ||||||
| Municipal Electric Authority of Georgia, RB |
||||||||
| 5.00%, 01/01/48 |
835 | 886,117 | ||||||
| 4.00%, 01/01/49 |
2,105 | 2,049,653 | ||||||
| S C H E D U L E O F I N V E S T M E N T S |
43 |
| Schedule of Investments (continued) April 30, 2022 |
BlackRock MuniHoldings Fund, Inc. (MHD) (Percentages shown are based on Net Assets) |
| Security | Par (000) |
Value | ||||||
| Georgia (continued) | ||||||||
| Municipal Electric Authority of Georgia, RB (continued) |
||||||||
| 5.00%, 01/01/56 |
$ | 350 | $ | 374,410 | ||||
| 4.00%, 01/01/59 |
1,335 | 1,308,716 | ||||||
| Municipal Electric Authority of Georgia, Refunding RB |
||||||||
| Sub-Series A, 4.00%, 01/01/49 |
700 | 692,359 | ||||||
| Series A, Subordinate, 4.00%, 01/01/51 |
615 | 615,445 | ||||||
|
|
|
|||||||
| 20,850,302 | ||||||||
| Hawaii — 0.4% | ||||||||
| State of Hawaii Airports System Revenue, ARB, Series A, AMT, 5.00%, 07/01/45 |
1,500 | 1,544,752 | ||||||
| State of Hawaii Airports System Revenue, ARB COP |
||||||||
| AMT, 5.25%, 08/01/25 |
425 | 439,203 | ||||||
| AMT, 5.25%, 08/01/26 |
460 | 474,696 | ||||||
| State of Hawaii Department of Budget & Finance, Refunding RB, 5.25%, 11/15/37 |
400 | 404,843 | ||||||
|
|
|
|||||||
| 2,863,494 | ||||||||
| Idaho — 0.5% | ||||||||
| Idaho Health Facilities Authority, RB |
||||||||
| 4.00%, 12/01/43 |
670 | 676,188 | ||||||
| Series 2017, 5.00%, 12/01/46 |
540 | 576,432 | ||||||
| Series A, 5.00%, 03/01/39 |
500 | 511,584 | ||||||
| Power County Industrial Development Corp., RB, AMT, 6.45%, 08/01/32 |
2,000 | 2,004,920 | ||||||
|
|
|
|||||||
| 3,769,124 | ||||||||
| Illinois — 9.9% | ||||||||
| Chicago Board of Education, GO |
||||||||
| Series A, 5.00%, 12/01/37 |
985 | 1,029,506 | ||||||
| Series A, 5.00%, 12/01/38 |
610 | 640,164 | ||||||
| Series A, 5.00%, 12/01/39 |
730 | 765,977 | ||||||
| Series A, 5.00%, 12/01/47 |
480 | 496,274 | ||||||
| Series C, 5.25%, 12/01/35 |
2,655 | 2,739,679 | ||||||
| Series D, 5.00%, 12/01/46 |
3,480 | 3,545,696 | ||||||
| Series H, 5.00%, 12/01/36 |
585 | 611,412 | ||||||
| Series H, 5.00%, 12/01/46 |
240 | 245,424 | ||||||
| Chicago Board of Education, Refunding GO |
||||||||
| Series C, 5.00%, 12/01/25 |
1,120 | 1,183,157 | ||||||
| Series C, 5.00%, 12/01/27 |
500 | 532,278 | ||||||
| Series C, 5.00%, 12/01/30 |
605 | 637,860 | ||||||
| Series C, 5.00%, 12/01/34 |
475 | 497,259 | ||||||
| Series D, 5.00%, 12/01/25 |
435 | 459,530 | ||||||
| Series F, 5.00%, 12/01/22 |
455 | 462,100 | ||||||
| Series F, 5.00%, 12/01/23 |
310 | 319,768 | ||||||
| Series F, 5.00%, 12/01/24 |
340 | 355,731 | ||||||
| Series G, 5.00%, 12/01/34 |
315 | 329,762 | ||||||
| Chicago Midway International Airport, Refunding ARB, Series A, 2nd Lien, AMT, 5.00%, 01/01/41 |
1,870 | 1,904,769 | ||||||
| Chicago O’Hare International Airport, ARB, Series D, AMT, Senior Lien, 5.00%, 01/01/42 |
430 | 445,995 | ||||||
| Chicago O’Hare International Airport, Refunding ARB, Series A, Senior Lien, 4.00%, 01/01/36 |
675 | 682,287 | ||||||
| Chicago O’Hare International Airport, Refunding RB, Series B, AMT, 4.00%, 01/01/29 |
1,600 | 1,601,502 | ||||||
| City of Chicago Illinois Wastewater Transmission Revenue, RB, 2nd Lien, 5.00%, 01/01/42 |
2,530 | 2,533,633 | ||||||
| City of Chicago Illinois Waterworks Revenue, Refunding RB, 2nd Lien, 5.00%, 11/01/42 |
1,000 | 1,009,376 | ||||||
| Cook County Community College District No. 508, GO |
||||||||
| 5.50%, 12/01/38 |
3,075 | 3,167,893 | ||||||
| Security | Par (000) |
Value | ||||||
| Illinois (continued) | ||||||||
| Cook County Community College District No. 508, GO (continued) |
||||||||
| 5.25%, 12/01/43 |
$ | 2,935 | $ | 3,000,104 | ||||
| County of Will Illinois, GO, 5.00%, 11/15/25(b) |
600 | 649,406 | ||||||
| Illinois Finance Authority, RB |
||||||||
| Series A, 5.00%, 02/15/37 |
820 | 866,996 | ||||||
| Series A, 5.00%, 02/15/47 |
240 | 251,251 | ||||||
| Series A, 5.00%, 02/15/50 |
130 | 135,901 | ||||||
| Illinois Finance Authority, Refunding RB |
||||||||
| 4.00%, 03/01/35 |
1,290 | 1,311,231 | ||||||
| Series A, 5.00%, 11/15/45 |
1,205 | 1,249,983 | ||||||
| Series C, 5.00%, 02/15/41 |
555 | 586,673 | ||||||
| Illinois State Toll Highway Authority, RB |
||||||||
| Series A, 5.00%, 01/01/40 |
2,980 | 3,111,087 | ||||||
| Series A, 5.00%, 01/01/45 |
930 | 1,023,341 | ||||||
| Series A, 4.00%, 01/01/46 |
1,585 | 1,577,108 | ||||||
| Series A, 5.00%, 01/01/46 |
4,125 | 4,568,941 | ||||||
| Series C, 5.00%, 01/01/37 |
2,000 | 2,084,786 | ||||||
| Metropolitan Pier & Exposition Authority, RB, Series A, 5.00%, 06/15/57 |
2,370 | 2,422,654 | ||||||
| Metropolitan Pier & Exposition Authority, Refunding RB, CAB(c) |
||||||||
| Series B, (AGM), 0.00%, 06/15/43 |
3,765 | 1,414,074 | ||||||
| Series B, (AGM), 0.00%, 06/15/47 |
22,775 | 6,931,002 | ||||||
| State of Illinois, GO |
||||||||
| 5.25%, 02/01/31 |
1,485 | 1,545,982 | ||||||
| 5.25%, 02/01/32 |
2,365 | 2,462,119 | ||||||
| 5.50%, 07/01/33 |
3,000 | 3,097,854 | ||||||
| 5.50%, 07/01/38 |
695 | 717,670 | ||||||
| 5.00%, 02/01/39 |
1,910 | 1,941,880 | ||||||
| 5.50%, 05/01/39 |
795 | 867,484 | ||||||
| Series A, 5.00%, 04/01/38 |
4,545 | 4,647,699 | ||||||
| Series D, 5.00%, 11/01/28 |
900 | 963,735 | ||||||
| State of Illinois, Refunding GO, Series B, 5.00%, 10/01/27 |
90 | 96,811 | ||||||
| University of Illinois, RB, Series A, 5.00%, 04/01/44 |
1,225 | 1,255,777 | ||||||
| Upper Illinois River Valley Development Authority, Refunding RB, 5.00%, 01/01/55(a) |
390 | 381,585 | ||||||
|
|
|
|||||||
| 75,360,166 | ||||||||
| Indiana — 1.2% | ||||||||
| City of Valparaiso Indiana, RB |
||||||||
| AMT, 6.75%, 01/01/34 |
975 | 1,041,730 | ||||||
| AMT, 7.00%, 01/01/44 |
2,355 | 2,511,718 | ||||||
| Indiana Finance Authority, RB(b) |
||||||||
| Series A, AMT, 5.00%, 07/01/23 |
2,305 | 2,369,181 | ||||||
| Series A, AMT, 5.25%, 07/01/23 |
500 | 513,922 | ||||||
| Series A, AMT, 5.00%, 07/01/40 |
565 | 581,497 | ||||||
| Indiana Housing & Community Development Authority, RB, S/F Housing, Series A, (FHLMC, FNMA, GNMA), 3.00%, 07/01/52 |
780 | 772,932 | ||||||
| Indianapolis Local Public Improvement Bond Bank, RB, Series A, 5.00%, 01/15/40 |
1,520 | 1,545,727 | ||||||
|
|
|
|||||||
| 9,336,707 | ||||||||
| Iowa — 1.0% | ||||||||
| Iowa Finance Authority, RB, Series A, 5.00%, 05/15/48 |
1,900 | 1,925,095 | ||||||
| Iowa Finance Authority, Refunding RB |
||||||||
| 5.25%, 12/01/25 |
1,260 | 1,302,761 | ||||||
| 44 | 2 0 2 2 B L A C K R O C K A N N U A L R E P O R T T O S H A R E H O L D E R S |
| Schedule of Investments (continued) April 30, 2022 |
BlackRock MuniHoldings Fund, Inc. (MHD) (Percentages shown are based on Net Assets) |
| Security | Par (000) |
Value | ||||||
| Iowa (continued) | ||||||||
| Iowa Finance Authority, Refunding RB (continued) |
||||||||
| Series B, 5.25%, 12/01/50(e) |
$ | 2,445 | $ | 2,561,120 | ||||
| Iowa Student Loan Liquidity Corp., Refunding RB, Series B, AMT, 3.00%, 12/01/39 |
1,715 | 1,464,025 | ||||||
|
|
|
|||||||
| 7,253,001 | ||||||||
| Kansas — 0.1% | ||||||||
| Seward County Unified School District No.480 Liberal, Refunding GO, 5.00%, 09/01/39 |
720 | 727,983 | ||||||
|
|
|
|||||||
| Kentucky — 1.2% | ||||||||
| County of Boyle Kentucky, Refunding RB, 5.00%, 06/01/37 |
2,500 | 2,700,557 | ||||||
| Kentucky Economic Development Finance Authority, RB(b) |
||||||||
| Series A, 5.38%, 01/01/23 |
1,830 | 1,873,818 | ||||||
| Series A, Catholic Health Services, 5.25%, 01/01/23 |
1,230 | 1,258,446 | ||||||
| Kentucky Public Transportation Infrastructure Authority, RB, CAB |
||||||||
| Series C, Convertible, 6.45%, 07/01/34 |
500 | 541,367 | ||||||
| Series C, Convertible, 6.60%, 07/01/39 |
830 | 901,756 | ||||||
| Series C, Convertible, 6.75%, 07/01/43 |
1,770 | 1,933,677 | ||||||
|
|
|
|||||||
| 9,209,621 | ||||||||
| Louisiana — 1.0% | ||||||||
| City of Alexandria Louisiana Utilities Revenue, RB, 5.00%, 05/01/24(b) |
860 | 904,661 | ||||||
| Lake Charles Harbor & Terminal District, ARB, Series B, AMT, (AGM), 5.50%, 01/01/29 |
1,500 | 1,566,208 | ||||||
| Louisiana Public Facilities Authority, Refunding RB, 5.00%, 05/15/47 |
1,635 | 1,703,050 | ||||||
| Tobacco Settlement Financing Corp., Refunding RB |
||||||||
| Series A, 5.25%, 05/15/31 |
375 | 375,461 | ||||||
| Series A, 5.25%, 05/15/32 |
1,320 | 1,321,509 | ||||||
| Series A, 5.25%, 05/15/33 |
1,235 | 1,236,400 | ||||||
| Series A, 5.25%, 05/15/35 |
605 | 618,806 | ||||||
|
|
|
|||||||
| 7,726,095 | ||||||||
| Maryland — 1.5% | ||||||||
| Anne Arundel County Consolidated Special Taxing District, ST |
||||||||
| 5.13%, 07/01/36 |
170 | 173,736 | ||||||
| 5.25%, 07/01/44 |
170 | 173,219 | ||||||
| Howard County Housing Commission, RB, M/F Housing, 5.00%, 12/01/42 |
1,430 | 1,525,927 | ||||||
| Maryland Health & Higher Educational Facilities Authority, RB |
||||||||
| Series 2017, 5.00%, 12/01/46 |
305 | 322,233 | ||||||
| Series A, 5.00%, 05/15/42 |
1,760 | 1,885,754 | ||||||
| Series B, 4.00%, 04/15/45 |
795 | 797,844 | ||||||
| Maryland Stadium Authority, RB, (NPFGC), 5.00%, 05/01/34 |
2,700 | 2,992,502 | ||||||
| Maryland State Transportation Authority, Refunding RB, Series A, 2.50%, 07/01/47 |
4,915 | 3,431,869 | ||||||
|
|
|
|||||||
| 11,303,084 | ||||||||
| Massachusetts — 2.7% | ||||||||
| Massachusetts Development Finance Agency, RB |
||||||||
| 5.00%, 01/01/48 |
1,115 | 1,176,051 | ||||||
| 5.00%, 10/01/48 |
830 | 852,407 | ||||||
| Series A, 5.25%, 01/01/42 |
1,110 | 1,178,299 | ||||||
| Security | Par (000) |
Value | ||||||
| Massachusetts (continued) | ||||||||
| Massachusetts Development Finance Agency, RB (continued) |
||||||||
| Series A, 5.00%, 01/01/47 |
$ | 1,570 | $ | 1,643,300 | ||||
| Massachusetts Development Finance Agency, Refunding RB |
||||||||
| 4.00%, 07/01/39 |
1,140 | 1,125,096 | ||||||
| 5.00%, 04/15/40 |
400 | 406,056 | ||||||
| 5.00%, 09/01/43 |
750 | 795,913 | ||||||
| Series A, 5.00%, 10/01/35 |
500 | 524,773 | ||||||
| Series A, 5.00%, 01/01/40 |
435 | 462,268 | ||||||
| Series A, 5.00%, 10/01/43 |
750 | 783,957 | ||||||
| Series A, 4.00%, 06/01/49 |
225 | 227,014 | ||||||
| Series P, 5.45%, 05/15/59 |
2,010 | 2,300,236 | ||||||
| Massachusetts Educational Financing Authority, RB |
||||||||
| Series B, AMT, 2.63%, 07/01/36 |
265 | 232,437 | ||||||
| AMT, Subordinate, 3.75%, 07/01/47 |
1,865 | 1,509,264 | ||||||
| Massachusetts Educational Financing Authority, Refunding RB |
||||||||
| Series A, AMT, 3.63%, 07/01/32 |
765 | 764,665 | ||||||
| Series B, AMT, 3.63%, 07/01/34 |
270 | 262,873 | ||||||
| Massachusetts Housing Finance Agency, RB, M/F Housing |
||||||||
| 3.10%, 06/01/60 |
1,110 | 861,590 | ||||||
| Series A, 3.80%, 12/01/43 |
160 | 153,919 | ||||||
| Series A, 3.85%, 06/01/46 |
205 | 195,808 | ||||||
| Series C-1, 3.15%, 12/01/49 |
400 | 332,145 | ||||||
| Series C-1, 3.25%, 12/01/54 |
1,475 | 1,214,367 | ||||||
| Series D-1, 2.55%, 12/01/50 |
420 | 321,056 | ||||||
| Massachusetts Port Authority, ARB, Series E, AMT, 5.00%, 07/01/51 |
3,100 | 3,329,791 | ||||||
|
|
|
|||||||
| 20,653,285 | ||||||||
| Michigan — 2.4% | ||||||||
| City of Detroit Michigan Water Supply System Revenue, RB, Series B, 2nd Lien, (AGM), 6.25%, 07/01/36 |
5 | 5,013 | ||||||
| Eastern Michigan University, RB, Series A, 4.00%, 03/01/47 |
1,170 | 1,147,091 | ||||||
| Michigan Finance Authority, RB |
||||||||
| Series S, 5.00%, 11/01/44 |
1,555 | 1,654,138 | ||||||
| Series C-2, AMT, Senior Lien, 5.00%, 07/01/22(b) |
240 | 241,326 | ||||||
| Series C-1, Senior Lien, 5.00%, 07/01/22(b) |
455 | 457,636 | ||||||
| Michigan Finance Authority, Refunding RB |
||||||||
| 5.00%, 11/15/41 |
5,560 | 5,929,584 | ||||||
| 4.00%, 11/15/46 |
570 | 578,528 | ||||||
| Series A, 4.00%, 12/01/49 |
590 | 574,702 | ||||||
| Michigan State Hospital Finance Authority, Refunding RB, 5.00%, 11/15/47 |
215 | 234,491 | ||||||
| Michigan State Housing Development Authority, RB, M/F Housing |
||||||||
| Series A, 3.80%, 10/01/38 |
1,690 | 1,696,569 | ||||||
| Series A, 4.15%, 10/01/53 |
940 | 941,699 | ||||||
| Series A, 2.70%, 10/01/56 |
2,655 | 1,955,729 | ||||||
| Michigan State University, Refunding RB, Series B, 5.00%, 02/15/48 |
730 | 801,703 | ||||||
| Michigan Strategic Fund, RB, AMT, 5.00%, 06/30/48 |
1,795 | 1,834,962 | ||||||
|
|
|
|||||||
| 18,053,171 | ||||||||
| S C H E D U L E O F I N V E S T M E N T S |
45 |
| Schedule of Investments (continued) April 30, 2022 |
BlackRock MuniHoldings Fund, Inc. (MHD) (Percentages shown are based on Net Assets) |
| Security | Par (000) |
Value | ||||||
| Minnesota — 2.3% | ||||||||
| City of Maple Grove Minnesota, Refunding RB, 4.00%, 05/01/37 |
$ | 880 | $ | 880,463 | ||||
| City of Minneapolis Minnesota, Refunding RB, Series A, 5.00%, 11/15/49 |
560 | 592,363 | ||||||
| City of Otsego MN, Refunding RB, COP, Series A, 5.00%, 09/01/44 |
425 | 429,551 | ||||||
| City of Spring Lake Park Minnesota, RB, 5.00%, 06/15/39 |
1,080 | 1,111,499 | ||||||
| Duluth Economic Development Authority, Refunding RB |
||||||||
| Series A, 4.25%, 02/15/48 |
3,800 | 3,868,590 | ||||||
| Series A, 5.25%, 02/15/53 |
1,500 | 1,618,449 | ||||||
| Series A, 5.25%, 02/15/58 |
520 | 561,115 | ||||||
| Housing & Redevelopment Authority of The City of St. Paul Minnesota, Refunding RB, Series A, 4.00%, 11/15/43 |
575 | 561,516 | ||||||
| Minneapolis-St. Paul Metropolitan Airports Commission, Refunding RB, Sub Series D, AMT, 5.00%, 01/01/41 |
290 | 303,845 | ||||||
| Minnesota Higher Education Facilities Authority, RB, Series 8-K, 4.00%, 03/01/43 |
385 | 372,387 | ||||||
| Minnesota Housing Finance Agency, RB |
||||||||
| (FHLMC, FNMA, GNMA), 3.50%, 07/01/52 |
4,920 | 4,954,066 | ||||||
| Series A, (FHLMC, FNMA, GNMA), 2.75%, 07/01/42 |
940 | 774,828 | ||||||
| Series A, (FHLMC, FNMA, GNMA), 3.00%, 07/01/52 |
1,755 | 1,731,617 | ||||||
|
|
|
|||||||
| 17,760,289 | ||||||||
| Mississippi — 1.0% | ||||||||
| Mississippi Development Bank, RB, (AGM), 6.88%, 12/01/40 |
3,595 | 3,811,638 | ||||||
| Mississippi State University Educational Building Corp., Refunding RB, 5.25%, 08/01/38(b) |
2,000 | 2,077,070 | ||||||
| State of Mississippi, RB |
||||||||
| Series A, 5.00%, 10/15/37 |
330 | 360,121 | ||||||
| Series A, 4.00%, 10/15/38 |
1,650 | 1,673,371 | ||||||
|
|
|
|||||||
| 7,922,200 | ||||||||
| Missouri — 2.0% | ||||||||
| Health & Educational Facilities Authority of the State of Missouri, RB |
||||||||
| 4.13%, 02/15/43 |
300 | 299,999 | ||||||
| 4.00%, 06/01/53 |
2,075 | 2,019,620 | ||||||
| Series A, 5.00%, 10/01/23(b) |
500 | 518,738 | ||||||
| Series A, 5.00%, 06/01/42 |
540 | 574,037 | ||||||
| Series C-2, 5.00%, 10/01/34 |
1,000 | 1,031,497 | ||||||
| Health & Educational Facilities Authority of the State of Missouri, Refunding RB |
||||||||
| 5.50%, 05/01/43 |
305 | 313,404 | ||||||
| Series A, 4.00%, 07/01/46 |
1,670 | 1,616,487 | ||||||
| Kansas City Industrial Development Authority, ARB, AMT, (AGM), 4.00%, 03/01/57 |
615 | 583,695 | ||||||
| Missouri Housing Development Commission, RB, S/F Housing |
||||||||
| (FHLMC, FNMA, GNMA), 2.35%, 11/01/46 |
1,080 | 822,862 | ||||||
| Security | Par (000) |
Value | ||||||
| Missouri (continued) | ||||||||
| Missouri Housing Development Commission, RB, S/F Housing (continued) |
||||||||
| (FHLMC, FNMA, GNMA), 2.40%, 11/01/51 |
$ | 1,130 | $ | 808,889 | ||||
| (FHLMC, FNMA, GNMA), 3.50%, 05/01/52 |
6,380 | 6,426,204 | ||||||
|
|
|
|||||||
| 15,015,432 | ||||||||
| Montana — 0.0% | ||||||||
| Montana Board of Housing, RB, S/F Housing |
||||||||
| Series B-2, 3.50%, 12/01/42 |
75 | 73,828 | ||||||
| Series B-2, 3.60%, 12/01/47 |
120 | 121,115 | ||||||
|
|
|
|||||||
| 194,943 | ||||||||
| Nebraska — 0.4% | ||||||||
| Central Plains Energy Project, RB |
||||||||
| 5.25%, 09/01/37 |
575 | 580,883 | ||||||
| 5.00%, 09/01/42 |
600 | 605,982 | ||||||
| Douglas County Hospital Authority No.3, Refunding RB, 5.00%, 11/01/45 |
400 | 418,988 | ||||||
| Nebraska Investment Finance Authority, RB, (FHLMC, FNMA, GNMA), 3.00%, 03/01/52 |
1,755 | 1,722,534 | ||||||
|
|
|
|||||||
| 3,328,387 | ||||||||
| Nevada — 1.4% | ||||||||
| City of Carson City Nevada, Refunding RB, 5.00%, 09/01/42 |
650 | 684,829 | ||||||
| City of Las Vegas Nevada Special Improvement District No.809, SAB, 5.65%, 06/01/23 |
80 | 80,247 | ||||||
| City of Reno Nevada, Refunding RB |
||||||||
| Series A-1, (AGM), 4.00%, 06/01/43 |
1,570 | 1,587,912 | ||||||
| Series A-1, (AGM), 4.00%, 06/01/46 |
1,250 | 1,260,881 | ||||||
| County of Clark Department of Aviation, Refunding RB, Series A-2, Sub Lien, 4.25%, 07/01/36 |
1,000 | 1,020,278 | ||||||
| County of Clark Nevada, GO |
||||||||
| Series A, 5.00%, 06/01/36 |
1,205 | 1,330,230 | ||||||
| Series A, 5.00%, 06/01/37 |
3,000 | 3,305,139 | ||||||
| Tahoe-Douglas Visitors Authority, RB |
||||||||
| 5.00%, 07/01/40 |
285 | 301,345 | ||||||
| 5.00%, 07/01/45 |
350 | 364,903 | ||||||
| 5.00%, 07/01/51 |
380 | 392,037 | ||||||
|
|
|
|||||||
| 10,327,801 | ||||||||
| New Hampshire — 0.6% | ||||||||
| New Hampshire Business Finance Authority, Refunding RB(a) |
||||||||
| Series A, 3.63%, 07/01/43(e) |
430 | 356,182 | ||||||
| Series B, 4.63%, 11/01/42 |
2,095 | 2,128,210 | ||||||
| Series B, AMT, 3.75%, 07/01/45(e) |
395 | 325,982 | ||||||
| Series C, AMT, 4.88%, 11/01/42 |
1,140 | 1,161,278 | ||||||
| New Hampshire Housing Finance Authority, RB, M/F Housing, Series 1, (FHA), 4.00%, 07/01/52 |
800 | 775,856 | ||||||
|
|
|
|||||||
| 4,747,508 | ||||||||
| New Jersey — 12.9% | ||||||||
| Casino Reinvestment Development Authority, Inc., Refunding RB |
||||||||
| 5.25%, 11/01/39 |
1,265 | 1,306,462 | ||||||
| 5.25%, 11/01/44 |
1,885 | 1,942,768 | ||||||
| Hudson County Improvement Authority, RB, 4.00%, 10/01/46 |
1,195 | 1,191,163 | ||||||
| 46 | 2 0 2 2 B L A C K R O C K A N N U A L R E P O R T T O S H A R E H O L D E R S |
| Schedule of Investments (continued) April 30, 2022 |
BlackRock MuniHoldings Fund, Inc. (MHD) (Percentages shown are based on Net Assets) |
| Security | Par (000) |
Value | ||||||
| New Jersey (continued) | ||||||||
| New Jersey Economic Development Authority, RB |
||||||||
| 5.00%, 06/15/36 |
$ | 460 | $ | 491,962 | ||||
| 4.00%, 11/01/38 |
370 | 359,668 | ||||||
| 4.00%, 11/01/39 |
295 | 285,427 | ||||||
| 5.00%, 06/15/49 |
1,670 | 1,767,889 | ||||||
| Series A, 5.00%, 06/15/47 |
2,500 | 2,617,360 | ||||||
| Series B, 4.50%, 06/15/40 |
1,270 | 1,298,819 | ||||||
| Series EEE, 5.00%, 06/15/43 |
160 | 169,213 | ||||||
| Series EEE, 5.00%, 06/15/48 |
2,705 | 2,847,348 | ||||||
| Series LLL, 5.00%, 06/15/34 |
365 | 389,917 | ||||||
| Series UU, 5.00%, 06/15/24(b) |
80 | 84,239 | ||||||
| Series UU, 5.00%, 06/15/40 |
345 | 352,072 | ||||||
| Series WW, 5.00%, 06/15/36 |
210 | 216,493 | ||||||
| AMT, 5.13%, 09/15/23 |
1,300 | 1,314,799 | ||||||
| AMT, (AGM), 5.00%, 01/01/31 |
790 | 821,654 | ||||||
| AMT, (AGM), 5.13%, 07/01/42 |
200 | 208,076 | ||||||
| AMT, 5.38%, 01/01/43 |
3,000 | 3,069,246 | ||||||
| Series B, AMT, 5.63%, 11/15/30 |
660 | 672,217 | ||||||
| New Jersey Economic Development Authority, Refunding ARB, AMT, 5.00%, 10/01/47 |
1,060 | 1,136,040 | ||||||
| New Jersey Economic Development Authority, Refunding SAB |
||||||||
| 6.50%, 04/01/28 |
4,807 | 5,067,727 | ||||||
| 5.75%, 04/01/31 |
2,675 | 2,650,596 | ||||||
| New Jersey Educational Facilities Authority, Refunding RB, Series A, 5.00%, 07/01/42 |
1,450 | 1,533,430 | ||||||
| New Jersey Health Care Facilities Financing Authority, RB |
||||||||
| 4.00%, 07/01/47 |
300 | 294,335 | ||||||
| 4.00%, 07/01/51 |
8,620 | 8,490,226 | ||||||
| New Jersey Health Care Facilities Financing Authority, Refunding RB, 5.00%, 10/01/37 |
685 | 723,269 | ||||||
| New Jersey Higher Education Student Assistance Authority, RB, Series B, AMT, 3.50%, 12/01/39 |
680 | 612,282 | ||||||
| New Jersey Higher Education Student Assistance Authority, Refunding RB(h) |
||||||||
| Series B, AMT, 4.00%, 12/01/41 |
3,390 | 3,309,962 | ||||||
| Series C, AMT, Subordinate, 5.00%, 12/01/52 |
3,425 | 3,538,248 | ||||||
| New Jersey Housing & Mortgage Finance Agency, Refunding RB, Series A, AMT, 3.80%, 10/01/32 |
1,130 | 1,118,294 | ||||||
| New Jersey Transportation Trust Fund Authority, RB |
||||||||
| Series AA, 4.13%, 06/15/39 |
1,040 | 1,029,206 | ||||||
| Series AA, 5.50%, 06/15/39 |
3,510 | 3,588,642 | ||||||
| Series AA, 5.00%, 06/15/44 |
1,835 | 1,860,241 | ||||||
| Series AA, 5.00%, 06/15/45 |
1,325 | 1,378,441 | ||||||
| Series AA, 5.00%, 06/15/46 |
400 | 411,169 | ||||||
| Series AA, 3.00%, 06/15/50 |
130 | 100,004 | ||||||
| Series BB, 4.00%, 06/15/50 |
1,980 | 1,877,398 | ||||||
| Series BB, 5.00%, 06/15/50 |
3,720 | 3,913,127 | ||||||
| Series S, 5.25%, 06/15/43 |
2,810 | 3,012,236 | ||||||
| Series S, 5.00%, 06/15/46 |
2,070 | 2,176,651 | ||||||
| New Jersey Transportation Trust Fund Authority, RB, CAB, Series A, 0.00%, 12/15/35(c) |
1,000 | 549,746 | ||||||
| New Jersey Transportation Trust Fund Authority, Refunding RB |
||||||||
| 4.00%, 12/15/39 |
510 | 493,141 | ||||||
| Series A, 5.00%, 12/15/32 |
1,600 | 1,697,603 | ||||||
| Series A, 5.00%, 12/15/36 |
720 | 764,517 | ||||||
| New Jersey Turnpike Authority, RB |
||||||||
| Series A, 4.00%, 01/01/42 |
845 | 856,681 | ||||||
| Security | Par (000) |
Value | ||||||
| New Jersey (continued) | ||||||||
| New Jersey Turnpike Authority, RB (continued) |
||||||||
| Series A, 4.00%, 01/01/48 |
$ | 270 | $ | 268,115 | ||||
| Series E, 5.00%, 01/01/45 |
4,450 | 4,600,877 | ||||||
| South Jersey Port Corp., ARB, Series B, AMT, 5.00%, 01/01/35 |
625 | 662,617 | ||||||
| South Jersey Transportation Authority, RB, Series A, 4.00%, 11/01/50 |
275 | 275,848 | ||||||
| State of New Jersey, GO, Series A, 4.00%, 06/01/31 |
925 | 967,394 | ||||||
| Tobacco Settlement Financing Corp., Refunding RB |
||||||||
| Series A, 5.00%, 06/01/35 |
1,340 | 1,429,844 | ||||||
| Series A, 4.00%, 06/01/37 |
500 | 495,041 | ||||||
| Series A, 5.25%, 06/01/46 |
4,955 | 5,249,961 | ||||||
| Sub-Series B, 5.00%, 06/01/46 |
10,110 | 10,731,886 | ||||||
|
|
|
|||||||
| 98,271,587 | ||||||||
| New Mexico — 0.6% | ||||||||
| City of Santa Fe New Mexico, RB, Series A, 5.00%, 05/15/44 |
200 | 208,997 | ||||||
| New Mexico Hospital Equipment Loan Council, Refunding RB, Series VIC, 5.00%, 08/01/44 |
450 | 467,580 | ||||||
| New Mexico Mortgage Finance Authority, RB, S/F Housing |
||||||||
| Class A, (FHLMC, FNMA, GNMA), 3.00%, 03/01/53 |
1,315 | 1,305,182 | ||||||
| Series C, (FHLMC, FNMA, GNMA), 4.25%, 03/01/53(h) |
2,110 | 2,218,612 | ||||||
|
|
|
|||||||
| 4,200,371 | ||||||||
| New York — 9.9% | ||||||||
| City of New York, GO, Series C, 5.00%, 08/01/42 |
805 | 888,078 | ||||||
| Erie Tobacco Asset Securitization Corp., Refunding RB, Series A, 5.00%, 06/01/45 |
3,585 | 3,599,111 | ||||||
| Metropolitan Transportation Authority, RB |
||||||||
| Series A-1, 5.25%, 11/15/39 |
1,000 | 1,020,611 | ||||||
| Series B, 5.25%, 11/15/38 |
2,970 | 3,050,965 | ||||||
| Metropolitan Transportation Authority, Refunding RB |
||||||||
| Series C-1, 4.75%, 11/15/45 |
1,950 | 2,045,924 | ||||||
| Series C-1, 5.00%, 11/15/50 |
370 | 384,904 | ||||||
| Series C-1, 5.25%, 11/15/55 |
1,040 | 1,125,486 | ||||||
| Series C-1, 5.00%, 11/15/56 |
2,670 | 2,784,439 | ||||||
| Series C-1, 5.25%, 11/15/56 |
10 | 10,735 | ||||||
| Monroe County Industrial Development Corp., Refunding RB |
||||||||
| 4.00%, 12/01/46 |
1,000 | 944,137 | ||||||
| Series A, 4.00%, 07/01/50 |
770 | 760,013 | ||||||
| New York City Housing Development Corp., RB, M/F Housing |
||||||||
| Series A, 3.00%, 11/01/55 |
1,505 | 1,157,791 | ||||||
| Series F-1, (FHA), 2.40%, 11/01/46 |
7,050 | 5,161,016 | ||||||
| Series F-1, (FHA), 2.50%, 11/01/51 |
4,860 | 3,439,952 | ||||||
| Series I-1, (FHA), 2.55%, 11/01/45 |
1,200 | 907,195 | ||||||
| Series I-1, (FHA), 2.65%, 11/01/50 |
3,205 | 2,303,049 | ||||||
| Series I-1, (FHA), 2.70%, 11/01/55 |
950 | 681,872 | ||||||
| New York City Industrial Development Agency, Refunding RB |
||||||||
| (AGM), 3.00%, 03/01/49 |
775 | 625,519 | ||||||
| 3.00%, 03/01/49 |
605 | 470,207 | ||||||
| Series A, Class A, (AGM), 3.00%, 01/01/37 |
155 | 138,037 | ||||||
| Series A, Class A, (AGM), 3.00%, 01/01/39 |
155 | 136,430 | ||||||
| Series A, Class A, (AGM), 3.00%, 01/01/40 |
110 | 96,294 | ||||||
| S C H E D U L E O F I N V E S T M E N T S |
47 |
| Schedule of Investments (continued) April 30, 2022 |
BlackRock MuniHoldings Fund, Inc. (MHD) (Percentages shown are based on Net Assets) |
| Security | Par (000) |
Value | ||||||
| New York (continued) | ||||||||
| New York City Transitional Finance Authority Future Tax Secured Revenue, RB |
||||||||
| Sub-Series E-1, 5.00%, 02/01/42 |
$ | 280 | $ | 280,435 | ||||
| Series C, Subordinate, 4.00%, 05/01/45 |
1,615 | 1,603,498 | ||||||
| Series F-1, Subordinate, 4.00%, 02/01/51 |
1,105 | 1,085,970 | ||||||
| Sub-Series C-1, Subordinate, 4.00%, 05/01/40 |
310 | 313,432 | ||||||
| New York City Water & Sewer System, Refunding RB, Series CC, 5.00%, 06/15/47 |
1,000 | 1,021,604 | ||||||
| New York Counties Tobacco Trust IV, Refunding RB |
||||||||
| Series A, 5.00%, 06/01/38. |
1,410 | 1,410,730 | ||||||
| Series A, 6.25%, 06/01/41(a) |
3,200 | 3,243,562 | ||||||
| New York Counties Tobacco Trust VI, Refunding RB, Series A-2-B, 5.00%, 06/01/45 |
500 | 523,234 | ||||||
| New York Liberty Development Corp., Refunding RB |
||||||||
| 3.13%, 09/15/50 |
5,005 | 4,160,416 | ||||||
| Series 1, Class 1, 5.00%, 11/15/44(a) |
6,005 | 6,063,453 | ||||||
| Series 2, Class 2, 5.15%, 11/15/34(a) |
420 | 431,875 | ||||||
| Series 2, Class 2, 5.38%, 11/15/40(a) |
1,450 | 1,496,323 | ||||||
| Series A, 2.88%, 11/15/46 |
9,305 | 7,178,333 | ||||||
| New York Power Authority, Refunding RB, Series A, 4.00%, 11/15/60 |
670 | 652,052 | ||||||
| New York State Environmental Facilities Corp., RB, Series B, Subordinate, 5.00%, 06/15/48 |
1,305 | 1,418,886 | ||||||
| New York State Housing Finance Agency, RB, M/F Housing, Series L-1, (SONYMA), 2.50%, 11/01/45 |
1,605 | 1,200,994 | ||||||
| New York State Thruway Authority, Refunding RB, Series B, Subordinate, 3.00%, 01/01/46 |
900 | 700,894 | ||||||
| New York State Urban Development Corp., RB, Series A, 3.00%, 03/15/50 |
930 | 767,753 | ||||||
| New York Transportation Development Corp., RB |
||||||||
| AMT, 5.00%, 10/01/35 |
640 | 679,657 | ||||||
| AMT, 5.00%, 10/01/40 |
1,825 | 1,908,105 | ||||||
| Port Authority of New York & New Jersey, Refunding ARB, Series 223, AMT, 4.00%, 07/15/41 |
1,075 | 1,049,618 | ||||||
| State of New York Mortgage Agency, Refunding RB, S/F Housing, Series 211, 3.75%, 10/01/43 |
1,190 | 1,091,431 | ||||||
| Triborough Bridge & Tunnel Authority, RB |
||||||||
| Series A, 5.00%, 11/15/49 |
620 | 675,122 | ||||||
| Series A, 4.00%, 11/15/54 |
710 | 700,499 | ||||||
| Series A, 5.00%, 11/15/54 |
— | — | ||||||
| Series A, 5.00%, 11/15/56 |
2,480 | 2,703,676 | ||||||
| TSASC, Inc., Refunding RB, Series A, 5.00%, 06/01/41 |
535 | 566,410 | ||||||
| Westchester County Healthcare Corp., RB, Series A, Senior Lien, 5.00%, 11/01/44 |
456 | 469,777 | ||||||
| Westchester Tobacco Asset Securitization Corp., Refunding RB, Sub-Series C, 4.00%, 06/01/42 |
365 | 369,208 | ||||||
|
|
|
|||||||
| 75,498,712 | ||||||||
| North Carolina — 1.0% | ||||||||
| County of Union North Carolina Enterprise System Revenue, RB, 3.00%, 06/01/51 |
5,740 | 4,709,768 | ||||||
| North Carolina Housing Finance Agency, RB, S/F Housing, (FHLMC, FNMA, GNMA), 3.75%, 07/01/52 |
1,735 | 1,762,923 | ||||||
| North Carolina Medical Care Commission, RB |
||||||||
| 4.00%, 11/01/52 |
400 | 391,541 | ||||||
| Series A, 4.00%, 10/01/50 |
115 | 103,210 | ||||||
| Security | Par (000) |
Value | ||||||
| North Carolina (continued) | ||||||||
| North Carolina Medical Care Commission, RB (continued) |
||||||||
| Series A, 5.00%, 10/01/50. |
$ | 305 | $ | 319,471 | ||||
| University of North Carolina at Chapel Hill, RB, 5.00%, 02/01/49 |
550 | 632,294 | ||||||
|
|
|
|||||||
| 7,919,207 | ||||||||
| North Dakota — 0.3% | ||||||||
| County of Cass North Dakota, Refunding RB, Series B, 5.25%, 02/15/58 |
695 | 743,225 | ||||||
| North Dakota Housing Finance Agency, RB, M/F Housing, Series A, 4.00%, 01/01/53 |
1,300 | 1,325,900 | ||||||
|
|
|
|||||||
| 2,069,125 | ||||||||
| Ohio — 5.3% | ||||||||
| Buckeye Tobacco Settlement Financing Authority, Refunding RB |
||||||||
| Series A-2, Class 1, 4.00%, 06/01/37 |
210 | 205,242 | ||||||
| Series A-2, Class 1, 4.00%, 06/01/38 |
210 | 205,057 | ||||||
| Series A-2, Class 1, 4.00%, 06/01/39 |
210 | 204,886 | ||||||
| Series A-2, Class 1, 3.00%, 06/01/48 |
1,505 | 1,106,043 | ||||||
| Series A-2, Class 1, 4.00%, 06/01/48 |
550 | 514,319 | ||||||
| Series B-2, Class 2, 5.00%, 06/01/55 |
10,715 | 10,418,077 | ||||||
| City of Dayton Ohio Airport Revenue, Refunding RB, Series A, AMT, (AGM), 4.00%, 12/01/32 |
2,000 | 2,000,432 | ||||||
| County of Franklin Ohio, RB |
||||||||
| Series 2017, 5.00%, 12/01/46 |
290 | 306,362 | ||||||
| Series A, 6.13%, 07/01/22(b) |
820 | 825,878 | ||||||
| Series A, 4.00%, 12/01/49 |
365 | 360,188 | ||||||
| County of Hamilton Ohio, Refunding RB |
||||||||
| 4.00%, 08/15/50 |
1,085 | 1,003,760 | ||||||
| Series A, 3.75%, 08/15/50 |
755 | 655,997 | ||||||
| County of Montgomery Ohio, Refunding RB |
||||||||
| 4.00%, 11/15/42 |
655 | 636,376 | ||||||
| 4.00%, 08/01/46 |
2,525 | 2,485,676 | ||||||
| 4.00%, 08/01/51 |
810 | 776,025 | ||||||
| Northwest Local School District/Hamilton & Butler Counties, GO, 4.00%, 12/01/50 |
1,135 | 1,148,148 | ||||||
| Ohio Air Quality Development Authority, RB, AMT, 5.00%, 07/01/49(a) |
1,235 | 1,207,831 | ||||||
| Ohio Housing Finance Agency, RB, S/F Housing, Series A, (FHLMC, FNMA, GNMA), 4.00%, 09/01/48 |
60 | 58,373 | ||||||
| Ohio Housing Finance Agency, Refunding RB, (FHLMC, FNMA, GNMA), 3.25%, 09/01/52 |
4,565 | 4,538,710 | ||||||
| Ohio State University/The, 4.00%, 12/01/48 |
5,700 | 5,891,007 | ||||||
| Ohio Turnpike & Infrastructure Commission, RB, Series A-1, Junior Lien, 5.25%, 02/15/31 |
2,470 | 2,524,750 | ||||||
| State of Ohio, RB, AMT, 5.00%, 06/30/53 |
1,000 | 1,028,664 | ||||||
| State of Ohio, Refunding RB, Series A, 4.00%, 01/15/50 |
2,250 | 2,184,043 | ||||||
|
|
|
|||||||
| 40,285,844 | ||||||||
| Oklahoma — 0.9% | ||||||||
| Oklahoma City Public Property Authority, Refunding RB, 5.00%, 10/01/39 |
720 | 768,638 | ||||||
| Oklahoma Development Finance Authority, RB |
||||||||
| Series B, 5.25%, 08/15/48 |
1,460 | 1,516,220 | ||||||
| Series B, 5.50%, 08/15/57 |
625 | 653,872 | ||||||
| Oklahoma State University, RB, Series A, 4.00%, 09/01/46 |
500 | 504,138 | ||||||
| 48 | 2 0 2 2 B L A C K R O C K A N N U A L R E P O R T T O S H A R E H O L D E R S |
| Schedule of Investments (continued) April 30, 2022 |
BlackRock MuniHoldings Fund, Inc. (MHD) (Percentages shown are based on Net Assets) |
| Security | Par (000) |
Value | ||||||
| Oklahoma (continued) | ||||||||
| Oklahoma Turnpike Authority, RB |
||||||||
| Series A, 4.00%, 01/01/48 |
$ | 1,780 | $ | 1,804,023 | ||||
| Series C, 4.00%, 01/01/42 |
1,420 | 1,454,574 | ||||||
|
|
|
|||||||
| 6,701,465 | ||||||||
| Oregon — 1.0% | ||||||||
| Clackamas County School District No.12 North Clackamas, GO, CAB, Series A, (GTD), 0.00%, 06/15/38(c) |
510 | 259,908 | ||||||
| Medford Hospital Facilities Authority, Refunding RB, Series A, 4.00%, 08/15/50 |
1,210 | 1,169,225 | ||||||
| Multnomah & Clackamas Counties School District No.10JT Gresham-Barlow, GO, CAB, Series A, (GTY), 0.00%, 06/15/38(c) |
530 | 282,737 | ||||||
| Oregon Health & Science University, RB |
||||||||
| Series A, 4.00%, 07/01/37 |
675 | 686,289 | ||||||
| Series A, 5.00%, 07/01/42 |
600 | 637,890 | ||||||
| Oregon State Facilities Authority, Refunding RB, Series A, 5.00%, 04/01/45 |
1,475 | 1,537,578 | ||||||
| Port of Portland Oregon Airport Revenue, Refunding ARB, Series 27-A, AMT, 5.00%, 07/01/45 |
1,290 | 1,388,903 | ||||||
| Salem-Keizer School District No.24J, GO, CAB, Series A, (GTY), 0.00%, 06/15/40(c) |
1,980 | 931,143 | ||||||
| State of Oregon Housing & Community Services Department, RB, S/F Housing, Series C, 3.95%, 07/01/43 |
115 | 105,154 | ||||||
| Warm Springs Reservation Confederated Tribe, Refunding RB, Series B, 5.00%, 11/01/39(a) |
650 | 718,064 | ||||||
|
|
|
|||||||
| 7,716,891 | ||||||||
| Pennsylvania — 6.4% | ||||||||
| Altoona Area School District, GO, (BAM, SAW), 5.00%, 12/01/25(b) |
110 | 50,330 | ||||||
| Bristol Township School District, GO, (SAW), 5.25%, 06/01/37(b) |
2,500 | 2,582,393 | ||||||
| Bucks County Industrial Development Authority, RB, 4.00%, 08/15/50 |
1,305 | 1,293,241 | ||||||
| Commonwealth Financing Authority, RB |
||||||||
| 5.00%, 06/01/33 |
335 | 364,170 | ||||||
| 5.00%, 06/01/34 |
750 | 813,329 | ||||||
| (AGM), 4.00%, 06/01/39 |
1,365 | 1,414,827 | ||||||
| County of Lehigh Pennsylvania, Refunding RB, Series A, 4.00%, 07/01/49 |
420 | 407,307 | ||||||
| Delaware River Port Authority, RB, 4.50%, 01/01/24(b) |
1,500 | 1,547,676 | ||||||
| Hospitals & Higher Education Facilities Authority of Philadelphia, RB, Series A, 5.63%, 07/01/42 |
795 | 799,048 | ||||||
| Lancaster Industrial Development Authority, RB, 5.00%, 12/01/49 |
950 | 1,010,255 | ||||||
| Montgomery County Higher Education and Health Authority, Refunding RB |
||||||||
| 4.00%, 09/01/49 |
715 | 697,395 | ||||||
| 4.00%, 05/01/52 |
5,860 | 5,662,752 | ||||||
| Series A, 5.00%, 09/01/43 |
905 | 970,375 | ||||||
| Series A, 5.00%, 09/01/48 |
980 | 1,043,209 | ||||||
| Series A, 4.00%, 09/01/49 |
1,380 | 1,368,303 | ||||||
| Pennsylvania Economic Development Financing Authority, RB |
||||||||
| Series A-1, 4.00%, 04/15/50 |
470 | 455,203 | ||||||
| AMT, 5.00%, 12/31/38 |
390 | 406,463 | ||||||
| AMT, 5.00%, 06/30/42 |
2,455 | 2,557,005 | ||||||
| Pennsylvania Economic Development Financing Authority, Refunding RB, AMT, 5.50%, 11/01/44 |
1,905 | 1,942,637 | ||||||
| Security | Par (000) |
Value | ||||||
| Pennsylvania (continued) | ||||||||
| Pennsylvania Higher Education Assistance Agency, RB, Series B, AMT, Subordinate, 3.00%, 06/01/47 |
$ | 100 | $ | 77,929 | ||||
| Pennsylvania Higher Educational Facilities Authority, RB, 4.00%, 08/15/49 |
1,680 | 1,686,812 | ||||||
| Pennsylvania Housing Finance Agency, RB, S/F Housing, Series 125B, AMT, 3.65%, 10/01/42 |
1,000 | 932,679 | ||||||
| Pennsylvania Housing Finance Agency, Refunding RB, S/F Housing |
||||||||
| 4.25%, 10/01/52(h) |
3,125 | 3,237,044 | ||||||
| Series 119, AMT, 3.50%, 10/01/36 |
1,030 | 978,019 | ||||||
| Pennsylvania Turnpike Commission, RB |
||||||||
| Series A, 5.00%, 12/01/44 |
1,380 | 1,429,445 | ||||||
| Series C, 5.00%, 12/01/43 |
415 | 423,781 | ||||||
| Sub-Series B-1, 5.25%, 06/01/47 |
1,170 | 1,242,218 | ||||||
| Series A, Subordinate, 5.00%, 12/01/44 |
2,080 | 2,235,272 | ||||||
| Series A, Subordinate, 4.00%, 12/01/49 |
1,075 | 1,039,148 | ||||||
| Series A, Subordinate, 4.00%, 12/01/50 |
610 | 582,307 | ||||||
| Pennsylvania Turnpike Commission, Refunding RB, 2nd Series, 5.00%, 12/01/41 |
1,250 | 1,362,749 | ||||||
| Pottsville Hospital Authority, Refunding RB, Series B, 5.00%, 07/01/45 |
1,250 | 1,311,738 | ||||||
| School District of Philadelphia, GO, Series A, (SAW), 4.00%, 09/01/46 |
1,870 | 1,901,700 | ||||||
| Springfield School District/Delaware County, GO |
||||||||
| (SAW), 5.00%, 03/01/40 |
865 | 946,275 | ||||||
| (SAW), 5.00%, 03/01/43 |
590 | 643,151 | ||||||
| Swarthmore Borough Authority, RB, 5.00%, 09/15/48 |
1,900 | 2,102,567 | ||||||
| Westmoreland County Municipal Authority, Refunding RB, (BAM), 5.00%, 08/15/36 |
1,290 | 1,402,568 | ||||||
|
|
|
|||||||
| 48,921,320 | ||||||||
| Puerto Rico — 6.1% | ||||||||
| Children’s Trust Fund, Refunding RB |
||||||||
| 5.50%, 05/15/39 |
1,115 | 1,141,148 | ||||||
| 5.63%, 05/15/43 |
1,200 | 1,220,592 | ||||||
| Puerto Rico Commonwealth Aqueduct & Sewer Authority, Refunding RB |
||||||||
| Series A, Senior Lien, 5.00%, 07/01/33 |
4,505 | 4,522,322 | ||||||
| Series A, Senior Lien, 5.13%, 07/01/37 |
1,270 | 1,275,094 | ||||||
| Puerto Rico Sales Tax Financing Corp. Sales Tax Revenue, RB |
||||||||
| Series A-1, Restructured, 4.75%, 07/01/53 |
9,061 | 9,173,538 | ||||||
| Series A-1, Restructured, 5.00%, 07/01/58 |
17,440 | 17,851,235 | ||||||
| Series A-2, Restructured, 4.33%, 07/01/40 |
2,508 | 2,486,953 | ||||||
| Series A-2, Restructured, 4.78%, 07/01/58 |
2,097 | 2,132,592 | ||||||
| Series B-1, Restructured, 4.75%, 07/01/53 |
425 | 430,203 | ||||||
| Series B-2, Restructured, 4.78%, 07/01/58 |
412 | 416,944 | ||||||
| Puerto Rico Sales Tax Financing Corp. Sales Tax Revenue, RB, CAB(c) |
||||||||
| Series A-1, Restructured, 0.00%, 07/01/46 |
18,474 | 5,190,400 | ||||||
| Series A-1, Restructured, 0.00%, 07/01/51 |
1,442 | 302,070 | ||||||
|
|
|
|||||||
| 46,143,091 | ||||||||
| Rhode Island — 2.6% | ||||||||
| Rhode Island Health and Educational Building Corp., Refunding RB, Series A, (AGM, GTD), 3.75%, 05/15/32 |
1,155 | 1,177,866 | ||||||
| Rhode Island Housing and Mortgage Finance Corp., RB, M/F Housing, Series 3-B, (FHA), 4.13%, 10/01/49 |
480 | 461,354 | ||||||
| Rhode Island Housing and Mortgage Finance Corp., RB, S/F Housing, Series 76-A, 3.00%, 10/01/51 |
3,330 | 3,229,104 | ||||||
| S C H E D U L E O F I N V E S T M E N T S |
49 |
| Schedule of Investments (continued) April 30, 2022 |
BlackRock MuniHoldings Fund, Inc. (MHD) (Percentages shown are based on Net Assets) |
| Security | Par (000) |
Value | ||||||
| Rhode Island (continued) | ||||||||
| Rhode Island Student Loan Authority, RB, Series A, AMT, 3.63%, 12/01/37 |
$ | 760 | $ | 672,323 | ||||
| Tobacco Settlement Financing Corp., Refunding RB |
||||||||
| Series A, 5.00%, 06/01/35 |
1,000 | 1,034,033 | ||||||
| Series A, 5.00%, 06/01/40 |
2,050 | 2,113,310 | ||||||
| Series B, 4.50%, 06/01/45 |
6,005 | 6,069,494 | ||||||
| Series B, 5.00%, 06/01/50 |
4,500 | 4,665,582 | ||||||
|
|
|
|||||||
| 19,423,066 | ||||||||
| South Carolina — 4.5% | ||||||||
| Charleston County Airport District, ARB |
||||||||
| Series A, AMT, 5.50%, 07/01/38 |
1,000 | 1,028,454 | ||||||
| Series A, AMT, 6.00%, 07/01/38 |
1,695 | 1,753,762 | ||||||
| Series A, AMT, 5.50%, 07/01/41 |
1,000 | 1,021,110 | ||||||
| County of Berkeley South Carolina, SAB |
||||||||
| 4.25%, 11/01/40 |
315 | 317,828 | ||||||
| 4.38%, 11/01/49 |
470 | 469,970 | ||||||
| South Carolina Jobs-Economic Development Authority, RB(a) |
||||||||
| 5.00%, 01/01/40 |
485 | 460,504 | ||||||
| 5.00%, 01/01/55 |
845 | 754,632 | ||||||
| South Carolina Jobs-Economic Development Authority, RB, COP |
||||||||
| 5.00%, 04/01/44 |
200 | 209,281 | ||||||
| 4.00%, 04/01/49 |
200 | 181,835 | ||||||
| 5.00%, 04/01/49 |
270 | 281,790 | ||||||
| 4.00%, 04/01/54 |
210 | 189,755 | ||||||
| 5.00%, 04/01/54 |
490 | 511,515 | ||||||
| South Carolina Jobs-Economic Development Authority, Refunding RB |
||||||||
| 5.00%, 02/01/38 |
2,875 | 2,997,541 | ||||||
| Series A, 5.00%, 05/01/43 |
1,680 | 1,804,352 | ||||||
| Series A, 4.25%, 05/01/48 |
1,445 | 1,478,247 | ||||||
| Series A, 5.00%, 05/01/48 |
3,030 | 3,238,870 | ||||||
| South Carolina Ports Authority, ARB |
||||||||
| AMT, 5.25%, 07/01/25(b) |
555 | 595,587 | ||||||
| AMT, 5.00%, 07/01/55 |
710 | 744,486 | ||||||
| South Carolina Public Service Authority, RB |
||||||||
| Series A, 5.00%, 12/01/36 |
175 | 185,397 | ||||||
| Series A, 5.50%, 12/01/54 |
4,450 | 4,594,852 | ||||||
| Series E, 5.00%, 12/01/48 |
440 | 453,448 | ||||||
| Series E, 5.50%, 12/01/53 |
2,500 | 2,562,452 | ||||||
| South Carolina Public Service Authority, Refunding RB |
||||||||
| Series A, 5.00%, 12/01/50 |
1,035 | 1,069,155 | ||||||
| Series E, 5.25%, 12/01/55 |
4,685 | 4,898,659 | ||||||
| South Carolina State Housing Finance & Development Authority, RB, S/F Housing, Series A, 4.00%, 01/01/52 |
2,400 | 2,460,187 | ||||||
|
|
|
|||||||
| 34,263,669 | ||||||||
| South Dakota — 0.2% | ||||||||
| City of Rapid City South Dakota Sales Tax Revenue, RB, 4.00%, 12/01/26(b) |
740 | 781,900 | ||||||
| South Dakota Health & Educational Facilities Authority, Refunding RB, Series A, 4.00%, 09/01/50 |
705 | 682,446 | ||||||
|
|
|
|||||||
| 1,464,346 | ||||||||
| Security | Par (000) |
Value | ||||||
| Tennessee — 1.9% | ||||||||
| Chattanooga Health Educational & Housing Facility Board, RB(b) |
||||||||
| Series A, 5.25%, 01/01/23 |
$ | 1,950 | $ | 1,989,074 | ||||
| Series A, Catholic Health Services, 5.25%, 01/01/23 |
1,700 | 1,734,124 | ||||||
| Chattanooga Health Educational & Housing Facility Board, Refunding RB, Series A, 4.00%, 08/01/44 |
115 | 111,306 | ||||||
| Chattanooga-Hamilton County Hospital Authority, Refunding RB, Series A, 5.00%, 10/01/44 |
875 | 892,329 | ||||||
| Greeneville Health & Educational Facilities Board, Refunding RB, Series A, 4.00%, 07/01/40 |
375 | 378,032 | ||||||
| Johnson City Health & Educational Facilities Board, RB, Series A, 5.00%, 08/15/42 |
800 | 802,700 | ||||||
| Metropolitan Government Nashville & Davidson County Health & Educational Facilities Board, RB, Series A, 5.00%, 07/01/40 |
1,530 | 1,608,529 | ||||||
| Metropolitan Government Nashville & Davidson County Health & Educational Facilities Board, Refunding RB |
||||||||
| Series A, 4.00%, 10/01/49 |
230 | 214,838 | ||||||
| Series A, 5.25%, 10/01/58 |
2,860 | 3,049,915 | ||||||
| Metropolitan Nashville Airport Authority, ARB, Series B, AMT, 5.00%, 07/01/40 |
2,500 | 2,638,563 | ||||||
| Tennessee Housing Development Agency, Refunding RB, S/F Housing, Series 1, 3.75%, 07/01/52 |
1,335 | 1,359,512 | ||||||
|
|
|
|||||||
| 14,778,922 | ||||||||
| Texas — 7.1% | ||||||||
| Brazos Higher Education Authority, Inc., RB, Series 1B, AMT, Subordinate, 3.00%, 04/01/40 |
65 | 49,605 | ||||||
| Central Texas Regional Mobility Authority, RB, Series E, Senior Lien, 4.00%, 01/01/50 |
1,555 | 1,509,083 | ||||||
| Central Texas Regional Mobility Authority, Refunding RB, Sub Lien, 5.00%, 01/01/23(b) |
430 | 438,933 | ||||||
| City of Austin Texas Airport System Revenue, ARB, AMT, 5.00%, 11/15/39 |
440 | 451,345 | ||||||
| City of Austin Texas Electric Utility Revenue, Refunding RB, Series A, 5.00%, 11/15/37 |
1,500 | 1,520,111 | ||||||
| City of Beaumont Texas, GO, 5.25%, 03/01/37(b) |
2,340 | 2,402,347 | ||||||
| City of Houston Texas Airport System Revenue, RB, Series A, AMT, 6.63%, 07/15/38 |
225 | 225,511 | ||||||
| City of Houston Texas Airport System Revenue, Refunding ARB, AMT, 5.00%, 07/15/27 |
130 | 137,533 | ||||||
| City of Houston Texas Airport System Revenue, Refunding RB |
||||||||
| Sub-Series D, 5.00%, 07/01/37 |
1,175 | 1,273,600 | ||||||
| Series A, AMT, 5.00%, 07/01/27 |
125 | 131,772 | ||||||
| Sub-Series A, AMT, 4.00%, 07/01/47 |
690 | 673,740 | ||||||
| City of San Antonio Texas Electric & Gas Systems Revenue, Refunding RB, Series A, 5.00%, 02/01/48 |
850 | 923,422 | ||||||
| El Paso Independent School District GO, (PSF), 4.00%, 08/15/48 |
3,000 | 3,071,160 | ||||||
| El Paso Independent School District, GO, |
890 | 914,821 | ||||||
| Harris County Cultural Education Facilities Finance Corp., RB, Series B, 7.00%, 01/01/23(b) |
565 | 584,268 | ||||||
| Harris County-Houston Sports Authority, Refunding RB, Series G, Senior Lien, (NPFGC), 0.00%, 11/15/41(c) |
11,690 | 4,048,539 | ||||||
| 50 | 2 0 2 2 B L A C K R O C K A N N U A L R E P O R T T O S H A R E H O L D E R S |
| Schedule of Investments (continued) April 30, 2022 |
BlackRock MuniHoldings Fund, Inc. (MHD) (Percentages shown are based on Net Assets) |
| Security | Par (000) |
Value | ||||||
| Texas (continued) | ||||||||
| Leander Independent School District, Refunding GO, CAB, Series D, (PSF-GTD), 0.00%, 08/15/24(b)(c) |
$ | 4,000 | $ | 2,260,884 | ||||
| Lower Colorado River Authority, Refunding RB, 5.50%, 05/15/33 |
2,240 | 2,307,713 | ||||||
| Midland County Fresh Water Supply District No.1, RB, CAB(c) |
||||||||
| Series A, 0.00%, 09/15/38 |
10,760 | 5,029,353 | ||||||
| Series A, 0.00%, 09/15/40 |
2,525 | 1,084,475 | ||||||
| Series A, 0.00%, 09/15/41 |
1,395 | 568,701 | ||||||
| New Hope Cultural Education Facilities Finance Corp., RB |
||||||||
| Series A, 5.00%, 04/01/25(b) |
145 | 154,795 | ||||||
| Series A, 5.00%, 08/15/50(a) |
455 | 459,142 | ||||||
| North Texas Tollway Authority, RB, CAB, Series B, 0.00%, 09/01/31(b)(c) |
2,415 | 1,132,299 | ||||||
| North Texas Tollway Authority, Refunding RB |
||||||||
| 4.25%, 01/01/49 |
3,165 | 3,244,378 | ||||||
| Series A, 5.00%, 01/01/48 |
1,060 | 1,131,371 | ||||||
| Port Authority of Houston of Harris County Texas, ARB, 4.00%, 10/01/46 |
2,635 | 2,618,452 | ||||||
| Red River Education Finance Corp., RB, 5.25%, 03/15/23(b) |
1,820 | 1,869,704 | ||||||
| San Antonio Public Facilities Corp., Refunding RB, Convertible, 4.00%, 09/15/42 |
1,355 | 1,356,333 | ||||||
| San Antonio Water System, Refunding RB, Series A, Junior Lien, 5.00%, 05/15/48 |
945 | 1,026,924 | ||||||
| Tarrant County Cultural Education Facilities Finance Corp., RB |
||||||||
| 4.00%, 10/01/47 |
290 | 286,268 | ||||||
| Series B, 5.00%, 07/01/35 |
1,500 | 1,626,978 | ||||||
| Series B, 5.00%, 07/01/48 |
3,330 | 3,567,649 | ||||||
| Texas City Industrial Development Corp., RB, Series 2012, 4.13%, 12/01/45 |
255 | 255,722 | ||||||
| Texas Department of Housing & Community Affairs, RB, S/F Housing |
||||||||
| Series A, (GNMA), 4.25%, 09/01/43 |
145 | 147,536 | ||||||
| Series A, (GNMA), 3.00%, 09/01/45(h) |
680 | 565,604 | ||||||
| Series A, (GNMA), 3.00%, 03/01/50(h) |
1,130 | 917,594 | ||||||
| Texas Private Activity Bond Surface Transportation Corp., RB, AMT, 5.00%, 06/30/58 |
1,095 | 1,128,759 | ||||||
| Texas Transportation Commission, RB, Series A, 5.00%, 08/01/57 |
1,085 | 1,152,401 | ||||||
| Texas Transportation Commission, RB, CAB(c) |
||||||||
| 0.00%, 08/01/35 |
270 | 148,600 | ||||||
| 0.00%, 08/01/36 |
145 | 76,166 | ||||||
| 0.00%, 08/01/37 |
195 | 97,866 | ||||||
| 0.00%, 08/01/38 |
200 | 95,467 | ||||||
| 0.00%, 08/01/39 |
1,000 | 454,068 | ||||||
| 0.00%, 08/01/43 |
795 | 292,287 | ||||||
| 0.00%, 08/01/44 |
870 | 302,715 | ||||||
| 0.00%, 08/01/45 |
1,135 | 374,761 | ||||||
|
|
|
|||||||
| 54,090,755 | ||||||||
| Utah — 0.6% | ||||||||
| City of Salt Lake City Utah Airport Revenue, ARB, Series A, AMT, 5.00%, 07/01/43 |
530 | 558,871 | ||||||
| County of Utah UT, RB |
||||||||
| Series A, 4.00%, 05/15/43 |
155 | 156,930 | ||||||
| Series A, 3.00%, 05/15/50 |
710 | 572,714 | ||||||
| Salt Lake City Corp. Airport Revenue, ARB |
||||||||
| Series A, AMT, 5.00%, 07/01/47 |
665 | 697,174 | ||||||
| Security | Par (000) |
Value | ||||||
| Utah (continued) | ||||||||
| Salt Lake City Corp. Airport Revenue, ARB (continued) |
||||||||
| Series A, AMT, 5.00%, 07/01/48 |
$ | 640 | $ | 672,285 | ||||
| Utah Charter School Finance Authority, RB |
||||||||
| 5.00%, 10/15/48 |
360 | 379,019 | ||||||
| Series A, 5.00%, 06/15/39(a) |
200 | 200,066 | ||||||
| Utah Charter School Finance Authority, Refunding RB |
||||||||
| 5.00%, 06/15/40(a) |
150 | 151,555 | ||||||
| 4.00%, 04/15/42 |
400 | 398,377 | ||||||
| 5.00%, 06/15/55(a) |
385 | 373,046 | ||||||
|
|
|
|||||||
| 4,160,037 | ||||||||
| Vermont — 0.3% | ||||||||
| University of Vermont and State Agricultural College, Refunding RB |
||||||||
| 4.00%, 10/01/37 |
500 | 506,044 | ||||||
| 5.00%, 10/01/43 |
1,470 | 1,599,000 | ||||||
| Vermont Student Assistance Corp., RB, Series A, AMT, 4.13%, 06/15/30 |
295 | 296,223 | ||||||
|
|
|
|||||||
| 2,401,267 | ||||||||
| Virginia — 1.7% | ||||||||
| Ballston Quarter Community Development Authority, TA, Series A, 5.38%, 03/01/36 |
490 | 396,424 | ||||||
| Hanover County Economic Development Authority, Refunding RB, Series A, 5.00%, 07/01/47 |
970 | 970,275 | ||||||
| Henrico County Economic Development Authority, Refunding RB, 4.00%, 10/01/45 |
160 | 153,452 | ||||||
| Virginia Beach Development Authority, Refunding RB |
||||||||
| 5.00%, 09/01/44 |
585 | 609,094 | ||||||
| 4.00%, 09/01/48 |
375 | 352,824 | ||||||
| Virginia Housing Development Authority, RB, M/F Housing |
||||||||
| Series 1, (FHLMC, FNMA, GNMA), 2.55%, 11/01/50 |
840 | 611,714 | ||||||
| Series B, 4.00%, 06/01/53 |
385 | 366,379 | ||||||
| Series D, 3.90%, 10/01/48 |
1,430 | 1,384,432 | ||||||
| Virginia Small Business Financing Authority, RB |
||||||||
| AMT, 5.00%, 01/01/48(a)(e) |
470 | 479,267 | ||||||
| AMT, 5.00%, 12/31/52 |
2,330 | 2,405,431 | ||||||
| Virginia Small Business Financing Authority, Refunding RB |
||||||||
| AMT, Senior Lien, 5.25%, 01/01/32 |
950 | 955,695 | ||||||
| AMT, Senior Lien, 6.00%, 01/01/37 |
3,900 | 3,924,820 | ||||||
|
|
|
|||||||
| 12,609,807 | ||||||||
| Washington — 2.6% | ||||||||
| King County Housing Authority, Refunding RB, 3.00%, 06/01/40 |
440 | 370,507 | ||||||
| Port of Seattle Washington, ARB |
||||||||
| Series A, AMT, 5.00%, 05/01/43 |
1,470 | 1,533,964 | ||||||
| Series C, AMT, 5.00%, 04/01/40 |
930 | 961,160 | ||||||
| Series C, AMT, Intermediate Lien, 5.00%, 05/01/37 |
1,450 | 1,526,208 | ||||||
| State of Washington, COP |
||||||||
| Series B, 5.00%, 07/01/36 |
1,000 | 1,105,681 | ||||||
| Series B, 5.00%, 07/01/37 |
3,910 | 4,313,903 | ||||||
| Series B, 5.00%, 07/01/38 |
650 | 715,520 | ||||||
| State of Washington, GO, Series C, 5.00%, 02/01/36 |
1,300 | 1,431,590 | ||||||
| Washington Health Care Facilities Authority, RB, Series A, 5.75%, 01/01/23(b) |
2,820 | 2,893,210 | ||||||
| Washington Health Care Facilities Authority, Refunding RB |
||||||||
| 5.00%, 09/01/55 |
285 | 308,413 | ||||||
| S C H E D U L E O F I N V E S T M E N T S |
51 |
| Schedule of Investments (continued) April 30, 2022 |
BlackRock MuniHoldings Fund, Inc. (MHD) (Percentages shown are based on Net Assets) |
| Security | Par (000) |
Value | ||||||
| Washington (continued) | ||||||||
| Washington Health Care Facilities Authority, Refunding RB (continued) |
||||||||
| Series A, 4.00%, 08/01/44 |
$ | 250 | $ | 240,607 | ||||
| Washington State Convention Center Public Facilities District RB, 3.00%, (h) |
3,715 | 2,524,012 | ||||||
| Washington State Housing Finance Commission, Refunding RB(a) |
||||||||
| 5.00%, 01/01/38 |
600 | 635,330 | ||||||
| 5.00%, 01/01/43 |
900 | 950,358 | ||||||
|
|
|
|||||||
| 19,510,463 | ||||||||
| West Virginia — 0.9% | ||||||||
| West Virginia Hospital Finance Authority, RB, Series A, 4.00%, 06/01/51 |
2,910 | 2,723,804 | ||||||
| West Virginia Parkways Authority, RB, Senior Lien, 4.00%, 06/01/51 |
4,055 | 4,059,456 | ||||||
|
|
|
|||||||
| 6,783,260 | ||||||||
| Wisconsin — 1.3% | ||||||||
| Public Finance Authority, RB |
||||||||
| Series A, 4.00%, 11/15/37 |
100 | 102,771 | ||||||
| Series A, 5.00%, 07/15/39(a) |
100 | 103,910 | ||||||
| Series A, 5.00%, 10/15/40(a) |
425 | 435,589 | ||||||
| Series A, 5.00%, 11/15/41 |
270 | 296,944 | ||||||
| Series A, 5.00%, 07/15/49(a) |
245 | 251,628 | ||||||
| Series A, 5.00%, 10/15/50(a) |
540 | 545,920 | ||||||
| Series A, 5.00%, 07/15/54(a) |
115 | 117,641 | ||||||
| Series A, 5.00%, 07/01/55(a) |
300 | 300,029 | ||||||
| Series A, 5.00%, 10/15/55(a) |
560 | 563,519 | ||||||
| Series A-1, 4.50%, 01/01/35(a) |
230 | 211,879 | ||||||
| Series A-1, 5.00%, 01/01/55(a) |
305 | 278,592 | ||||||
| Public Finance Authority, Refunding RB |
||||||||
| 5.00%, 09/01/49(a) |
165 | 163,385 | ||||||
| 5.00%, 09/01/54(a) |
130 | 127,772 | ||||||
| Series A, 4.00%, 10/01/49 |
2,000 | 1,953,122 | ||||||
| Series A, 5.00%, 11/15/49 |
335 | 355,506 | ||||||
| AMT, 4.00%, 08/01/35 |
280 | 253,218 | ||||||
| Wisconsin Health & Educational Facilities Authority, Refunding RB, 5.00%, 04/01/44 |
2,005 | 2,186,376 | ||||||
| Wisconsin Housing & Economic Development Authority, RB, M/F Housing |
||||||||
| Series A, 3.15%, 11/01/44 |
480 | 424,663 | ||||||
| Series A, 4.45%, 05/01/57 |
575 | 578,379 | ||||||
| WPPI Energy, Refunding RB, Series A, 5.00%, 07/01/37 |
665 | 691,250 | ||||||
|
|
|
|||||||
| 9,942,093 | ||||||||
| Wyoming — 0.4% | ||||||||
| Wyoming Community Development Authority, RB, S/F Housing, Series 1, (FHLMC, FNMA, GNMA), 3.50%, 06/01/52 |
2,460 | 2,456,834 | ||||||
| Wyoming Municipal Power Agency, Inc., Refunding RB, Series A, (BAM), 5.00%, 01/01/42(b) |
330 | 365,453 | ||||||
|
|
|
|||||||
| 2,822,287 | ||||||||
|
|
|
|||||||
| Total Municipal Bonds — 130.9% |
|
996,346,454 | ||||||
|
|
|
|||||||
| Security | Par (000) |
Value | ||||||
| Municipal Bonds Transferred to Tender Option Bond Trusts(i) |
| |||||||
| Arizona — 0.1% |
||||||||
| Maricopa County Industrial Development Authority, RB, Series A, 4.00%, 01/01/41 |
$ | 915 | $ | 916,388 | ||||
|
|
|
|||||||
| California — 3.0% | ||||||||
| Bay Area Toll Authority, Refunding RB, 4.00%, 04/01/42(j) |
3,896 | 3,914,281 | ||||||
| Los Angeles Unified School District, GO, Series B-1, Election 2008, 5.25%, 07/01/42(j) |
1,451 | 1,588,930 | ||||||
| Sacramento Area Flood Control Agency, Refunding SAB |
||||||||
| 5.00%, 10/01/47 |
8,384 | 9,057,784 | ||||||
| Series A, 5.00%, 10/01/43 |
2,775 | 3,000,828 | ||||||
| San Diego County Regional Airport Authority, ARB(j) |
||||||||
| Series B, AMT, Subordinate, 4.00%, 07/01/56 |
1,592 | 1,485,597 | ||||||
| Series B, AMT, Subordinate, 5.00%, 07/01/56 |
3,526 | 3,760,391 | ||||||
|
|
|
|||||||
| 22,807,811 | ||||||||
| Colorado — 1.7% | ||||||||
| City & County of Denver Colorado Airport System Revenue, Refunding ARB(j) |
||||||||
| Series A, AMT, 5.25%, 12/01/43 |
1,901 | 2,061,491 | ||||||
| Series A, AMT, 5.25%, 12/01/48 |
1,664 | 1,798,020 | ||||||
| Colorado Health Facilities Authority, Refunding RB(j) |
||||||||
| Series A, 5.00%, 08/01/44 |
1,950 | 2,089,094 | ||||||
| Series A, 4.00%, 08/01/49 |
2,490 | 2,358,707 | ||||||
| County of Adams Colorado, Refunding COP, 4.00%, 12/01/45 |
4,650 | 4,661,665 | ||||||
|
|
|
|||||||
| 12,968,977 | ||||||||
| Connecticut — 0.8% | ||||||||
| Connecticut State Health & Educational Facilities Authority, Refunding RB, 5.00%, 12/01/45 |
5,687 | 5,970,146 | ||||||
|
|
|
|||||||
| District of Columbia — 0.3% | ||||||||
| District of Columbia Housing Finance Agency, RB, M/F Housing, Series B-2, (FHA), 4.10%, 09/01/39 |
1,300 | 1,303,832 | ||||||
| Metropolitan Washington Airports Authority Dulles Toll Road Revenue, Refunding RB, Series B, Subordinate, (AGM), 4.00%, 10/01/53 |
1,299 | 1,285,437 | ||||||
|
|
|
|||||||
| 2,589,269 | ||||||||
| Florida — 1.4% | ||||||||
| City of South Miami Health Facilities Authority, Inc., Refunding RB, 5.00%, 08/15/47 |
1,290 | 1,397,369 | ||||||
| City of Tampa Florida, RB, Series A, 4.00%, 11/15/46 |
1,932 | 1,942,981 | ||||||
| County of Broward Florida Port Facilities Revenue, ARB, Series B, AMT, 4.00%, 09/01/49 |
2,350 | 2,227,305 | ||||||
| Escambia County Health Facilities Authority, Refunding RB, 4.00%, 08/15/45(j) |
1,771 | 1,688,569 | ||||||
| Greater Orlando Aviation Authority, ARB, Series A, AMT, 4.00%, 10/01/49(j) |
3,543 | 3,332,681 | ||||||
|
|
|
|||||||
| 10,588,905 | ||||||||
| Georgia — 0.7% | ||||||||
| Dalton Whitfield County Joint Development Authority, RB, 4.00%, 08/15/48 |
3,647 | 3,567,850 | ||||||
| Georgia Housing & Finance Authority, Refunding RB |
||||||||
| Series A, 3.60%, 12/01/44 |
1,042 | 986,220 | ||||||
| Series A, 3.70%, 06/01/49 |
1,012 | 954,014 | ||||||
|
|
|
|||||||
| 5,508,084 | ||||||||
| 52 | 2 0 2 2 B L A C K R O C K A N N U A L R E P O R T T O S H A R E H O L D E R S |
| Schedule of Investments (continued) April 30, 2022 |
BlackRock MuniHoldings Fund, Inc. (MHD) (Percentages shown are based on Net Assets) |
| Security | Par (000) |
Value | ||||||
| Idaho — 0.2% | ||||||||
| Idaho State Building Authority, RB, Series A, 4.00%, 09/01/48 |
$ | 1,700 | $ | 1,710,839 | ||||
|
|
|
|||||||
| Illinois — 1.2% | ||||||||
| City of Chicago IIllinois Waterworks Revenue, Refunding RB, 2nd Lien, (AGM), 5.25%, 11/01/33 |
480 | 481,002 | ||||||
| Illinois Finance Authority, Refunding RB |
||||||||
| Series C, 4.00%, 02/15/27 |
5 | 5,109 | ||||||
| Series C, 4.00%, 02/15/41 |
2,033 | 2,036,979 | ||||||
| Illinois State Toll Highway Authority, RB |
||||||||
| Series A, 5.00%, 01/01/40 |
825 | 861,431 | ||||||
| Series B, 5.00%, 01/01/40 |
3,329 | 3,496,006 | ||||||
| Series C, 5.00%, 01/01/38 |
2,252 | 2,343,383 | ||||||
|
|
|
|||||||
| 9,223,910 | ||||||||
| Iowa — 0.2% | ||||||||
| Iowa Finance Authority, Refunding RB, Series E, 4.00%, 08/15/46 |
1,455 | 1,421,180 | ||||||
|
|
|
|||||||
| Louisiana — 1.0% | ||||||||
| City of Shreveport Louisiana Water & Sewer Revenue, RB |
||||||||
| Series B, Junior Lien, (AGM), 4.00%, 12/01/44 |
2,043 | 2,062,011 | ||||||
| Series B, Junior Lien, (AGM), 4.00%, 12/01/49 |
4,105 | 4,142,503 | ||||||
| State of Louisiana Gasoline & Fuels Tax Revenue, Refunding RB, Series A, 1st Lien, 4.00%, 05/01/25 |
1,245 | 1,294,026 | ||||||
|
|
|
|||||||
| 7,498,540 | ||||||||
| Maryland — 1.8% | ||||||||
| City of Baltimore Maryland, RB |
||||||||
| Series A, 5.00%, 07/01/46 |
3,014 | 3,217,617 | ||||||
| Series A, 4.00%, 07/01/49 |
3,122 | 3,128,034 | ||||||
| Maryland Stadium Authority, RB |
||||||||
| (NPFGC), 5.00%, 05/01/42 |
1,740 | 1,905,502 | ||||||
| (NPFGC), 5.00%, 05/01/47 |
4,894 | 5,403,734 | ||||||
|
|
|
|||||||
| 13,654,887 | ||||||||
| Massachusetts — 1.0% | ||||||||
| Commonwealth of Massachusetts Transportation Fund Revenue, RB, Series A, 4.00%, 06/01/45 |
1,502 | 1,512,026 | ||||||
| Commonwealth of Massachusetts, GO, Series A, 5.00%, 01/01/46 |
1,982 | 2,145,533 | ||||||
| Massachusetts Development Finance Agency, Refunding RB, 5.00%, 07/01/47 |
3,359 | 3,510,984 | ||||||
|
|
|
|||||||
| 7,168,543 | ||||||||
| Michigan — 2.0% | ||||||||
| Michigan Finance Authority, RB(j) |
||||||||
| 4.00%, 02/15/47 |
5,486 | 5,358,650 | ||||||
| Series A, 4.00%, 02/15/44 |
1,912 | 1,871,072 | ||||||
| Michigan State Building Authority, Refunding RB, Series I, 5.00%, 10/15/45 |
5,670 | 5,946,665 | ||||||
| Michigan State Housing Development Authority, RB, M/F Housing, Series A, 4.05%, 10/01/48 |
2,337 | 2,323,211 | ||||||
|
|
|
|||||||
| 15,499,598 | ||||||||
| Nevada — 0.3% | ||||||||
| County of Clark Nevada, GO, Series A, 5.00%, 05/01/48 |
2,261 | 2,460,237 | ||||||
|
|
|
|||||||
| New Jersey — 1.1% | ||||||||
| New Jersey Health Care Facilities Financing Authority, RB, 4.00%, 07/01/51 |
8,610 | 8,480,379 | ||||||
|
|
|
|||||||
| Security | Par (000) |
Value | ||||||
| New York — 7.4% | ||||||||
| City of New York, GO |
||||||||
| Series A-1, 4.00%, 08/01/50 |
$ | 10,000 | $ | 9,963,222 | ||||
| Sub-Series-D1, Series D, 5.00%, 12/01/43(j) |
2,620 | 2,837,039 | ||||||
| City of New York, Refunding GO, Series B, 4.00%, 08/01/32 |
3,990 | 4,041,463 | ||||||
| New York City Housing Development Corp., Refunding RB, Series A, 4.15%, 11/01/38 |
2,907 | 2,926,772 | ||||||
| New York City Transitional Finance Authority Building Aid Revenue, RB, Series S-1, Subordinate, (SAW), 4.00%, 07/15/42(j) |
1,395 | 1,395,094 | ||||||
| New York City Water & Sewer System, Refunding RB |
||||||||
| Series BB, 4.00%, 06/15/47 |
3,660 | 3,682,344 | ||||||
| Series CC, 5.00%, 06/15/23 |
2,820 | 2,892,212 | ||||||
| Series CC, 5.00%, 06/15/47 |
3,181 | 3,261,829 | ||||||
| Series FF, 5.00%, 06/15/45 |
3,019 | 3,031,767 | ||||||
| New York Power Authority, Refunding RB, Series A, 4.00%, 11/15/60 |
947 | 921,979 | ||||||
| New York State Dormitory Authority, Refunding RB, Series D, 4.00%, 02/15/47 |
4,317 | 4,278,133 | ||||||
| New York State Thruway Authority, Refunding RB, Series B, Subordinate, 4.00%, 01/01/50 |
2,083 | 2,023,812 | ||||||
| New York State Urban Development Corp., RB |
||||||||
| Series A, 4.00%, 03/15/46 |
4,846 | 4,916,520 | ||||||
| Series A, 4.00%, 03/15/49 |
5,696 | 5,647,095 | ||||||
| Port Authority of New York & New Jersey, ARB, Series 221, AMT, 4.00%, 07/15/60 |
854 | 808,363 | ||||||
| Port Authority of New York & New Jersey, Refunding ARB, 194th Series, 5.25%, 10/15/55 |
3,210 | 3,370,145 | ||||||
|
|
|
|||||||
| 55,997,789 | ||||||||
| North Carolina — 0.8% | ||||||||
| North Carolina Capital Facilities Finance Agency, Refunding RB, Series B, 5.00%, 10/01/25 |
5,550 | 6,001,712 | ||||||
| North Carolina Housing Finance Agency, RB, S/F Housing, Series 39-B, (FHLMC, FNMA, GNMA), 4.00%, 01/01/48 |
365 | 365,937 | ||||||
|
|
|
|||||||
| 6,367,649 | ||||||||
| Pennsylvania — 2.6% | ||||||||
| Commonwealth of Pennsylvania, GO(j) |
||||||||
| 1st Series, 4.00%, 03/01/36 |
1,559 | 1,597,096 | ||||||
| 1st Series, 4.00%, 03/01/38 |
3,650 | 3,721,655 | ||||||
| County of Lehigh Pennsylvania, Refunding RB, Series A, 4.00%, 07/01/49(j) |
2,996 | 2,905,187 | ||||||
| Northampton County General Purpose Authority, Refunding RB, 4.00%, 11/01/38(j) |
2,596 | 2,646,079 | ||||||
| Pennsylvania Turnpike Commission, RB, Sub- Series A, 5.50%, 12/01/42 |
4,019 | 4,302,288 | ||||||
| Pennsylvania Turnpike Commission, Refunding RB, Sub-Series B-2, (AGM), 5.00%, 06/01/35 |
1,640 | 1,763,271 | ||||||
| Westmoreland County Municipal Authority, Refunding RB, (BAM), 5.00%, 08/15/38 |
2,533 | 2,672,436 | ||||||
|
|
|
|||||||
| 19,608,012 | ||||||||
| Rhode Island — 0.4% | ||||||||
| Narragansett Bay Commission, Refunding RB, Series A, 4.00%, 09/01/22 |
1,140 | 1,149,504 | ||||||
| Rhode Island Health and Educational Building Corp., RB, Series A, 4.00%, 09/15/47 |
1,982 | 1,969,987 | ||||||
|
|
|
|||||||
| 3,119,491 | ||||||||
| S C H E D U L E O F I N V E S T M E N T S |
53 |
| Schedule of Investments (continued) April 30, 2022 |
BlackRock MuniHoldings Fund, Inc. (MHD) (Percentages shown are based on Net Assets) |
| Security | Par (000) |
Value | ||||||
|
|
||||||||
| South Carolina — 0.2% | ||||||||
| South Carolina Ports Authority, ARB, Series B, AMT, 4.00%, 07/01/49(j) |
$ | 1,665 | $ | 1,557,234 | ||||
|
|
|
|||||||
| Texas — 4.9% | ||||||||
| Board of Regents of the University of Texas System, Refunding RB, Series B, 5.00%, 08/15/43 |
3,842 | 3,881,039 | ||||||
| City of San Antonio Texas Electric & Gas Systems Revenue, RB, Junior Lien, 5.00%, 02/01/23 |
4,560 | 4,659,484 | ||||||
| County of Hidalgo Texas, GO, Series A, 4.00%, 08/15/43 |
2,297 | 2,363,096 | ||||||
| Harris County Toll Road Authority, Refunding RB, Series A, Senior Lien, 5.00%, 08/15/43 |
1,858 | 2,023,211 | ||||||
| Houston Community College System, GO, 4.00%, 02/15/23 |
4,394 | 4,462,880 | ||||||
| Howe Independent School District, GO, (PSF-GTD), 4.00%, 08/15/43 |
1,095 | 1,121,788 | ||||||
| Lower Colorado River Authority, Refunding, RB, 4.00%, 05/15/43 |
1,504 | 1,504,952 | ||||||
| San Antonio Public Facilities Corp., Refunding RB, 4.00%, 09/15/42 |
3,794 | 3,797,899 | ||||||
| San Antonio Water System, Refunding RB, Series C, Junior Lien, 5.00%, 05/15/46 |
1,515 | 1,617,919 | ||||||
| Tarrant County Cultural Education Facilities Finance Corp., RB, Series A, 5.00%, 11/15/38 |
4,456 | 4,582,324 | ||||||
| Texas Department of Housing & Community Affairs, RB, S/F Housing |
||||||||
| Series A, (GNMA), 3.63%, 09/01/44 |
1,498 | 1,366,662 | ||||||
| Series A, (GNMA), 3.75%, 09/01/49 |
994 | 906,655 | ||||||
| Texas Water Development Board, RB, Series A, 4.00%, 10/15/49 |
5,020 | 5,181,176 | ||||||
|
|
|
|||||||
| 37,469,085 | ||||||||
| Virginia — 2.2% | ||||||||
| Fairfax County Economic Development Authority, RB, 5.00%, 04/01/47(j) |
2,320 | 2,482,038 | ||||||
| Fairfax County Industrial Development Authority, 4.00%, 05/15/42 |
4,868 | 4,988,455 | ||||||
| Hampton Roads Transportation Accountability Commission, RB(j) |
||||||||
| Series A, Senior Lien, 5.50%, 01/01/28 |
1,338 | 1,541,947 | ||||||
| Series A, Senior Lien, 4.00%, 07/01/60 |
2,175 | 2,106,864 | ||||||
| Virginia Small Business Financing Authority, Refunding RB, Series A, 4.00%, 12/01/49 |
5,320 | 5,184,563 | ||||||
|
|
|
|||||||
| 16,303,867 | ||||||||
| Washington — 0.2% | ||||||||
| Washington Health Care Facilities Authority, Refunding RB, Series B, 4.13%, 08/15/43 |
1,445 | 1,460,061 | ||||||
|
|
|
|||||||
| West Virginia — 0.2% | ||||||||
| Morgantown Utility Board, Inc., RB, Series B, 4.00%, 12/01/48(j) |
1,511 | 1,522,667 | ||||||
|
|
|
|||||||
| Wisconsin — 1.1% | ||||||||
| Wisconsin Health & Educational Facilities Authority, Refunding RB |
||||||||
| 4.00%, 12/01/46 |
2,059 | 2,066,204 | ||||||
| Security | Par (000) |
Value | ||||||
|
|
||||||||
| Wisconsin (continued) | ||||||||
| Wisconsin Health & Educational Facilities Authority, Refunding RB (continued) |
||||||||
| 4.00%, 12/15/49(j) |
$ | 2,140 | $ | 2,078,886 | ||||
| Wisconsin Housing & Economic Development Authority, RB, M/F Housing |
||||||||
| Series A, 4.10%, 11/01/43 |
1,342 | 1,347,966 | ||||||
| Series A, 4.30%, 11/01/53 |
1,395 | 1,400,146 | ||||||
| Series A, 4.45%, 05/01/57 |
1,678 | 1,684,957 | ||||||
|
|
|
|||||||
| 8,578,159 | ||||||||
|
|
|
|||||||
| Total Municipal Bonds Transferred to Tender Option Bond Trusts — 36.8% |
|
280,451,707 | ||||||
|
|
|
|||||||
| Total Long-Term Investments — 167.7% |
|
1,276,798,161 | ||||||
|
|
|
|||||||
| Shares | ||||||||
|
|
||||||||
| Short-Term Securities |
||||||||
| Money Market Funds — 1.6% | ||||||||
| BlackRock Liquidity Funds, MuniCash, Institutional Class, 0.25%(k)(l) |
11,998,307 | 11,998,307 | ||||||
|
|
|
|||||||
| Total Short-Term Securities — 1.6% |
|
11,998,307 | ||||||
|
|
|
|||||||
| Total Investments — 169.3% |
|
1,288,796,468 | ||||||
| Liabilities in Excess of Other Assets — (0.5)% |
|
(3,656,442 | ) | |||||
| Liability for TOB Trust Certificates, Including Interest Expense and Fees Payable — (23.1)% |
|
(176,192,716 | ) | |||||
| VMTP Shares at Liquidation Value, Net of Deferred Offering Costs — (45.7)% |
|
(347,800,000 | ) | |||||
|
|
|
|||||||
| Net Assets Applicable to Common Shares — 100.0% |
|
$ | 761,147,310 | |||||
|
|
|
|||||||
| (a) | Security exempt from registration pursuant to Rule 144A under the Securities Act of 1933, as amended. These securities may be resold in transactions exempt from registration to qualified institutional investors. |
| (b) | U.S. Government securities held in escrow, are used to pay interest on this security as well as to retire the bond in full at the date indicated, typically at a premium to par. |
| (c) | Zero-coupon bond. |
| (d) | Security is collateralized by municipal bonds or U.S. Treasury obligations. |
| (e) | Variable rate security. Interest rate resets periodically. The rate shown is the effective interest rate as of period end. Security description also includes the reference rate and spread if published and available. |
| (f) | Issuer filed for bankruptcy and/or is in default. |
| (g) | Non-income producing security. |
| (h) | When-issued security. |
| (i) | Represent bonds transferred to a TOB Trust in exchange of cash and residual certificates received by the Fund. These bonds serve as collateral in a secured borrowing. See Note 4 of the Notes to Financial Statements for details. |
| (j) | All or a portion of the security is subject to a recourse agreement. The aggregate maximum potential amount the Fund could ultimately be required to pay under the agreements, which expire between October 1, 2024 to July 15, 2042, is $33,650,516. See Note 4 of the Notes to Financial Statements for details. |
| (k) | Affiliate of the Fund. |
| (l) | Annualized 7-day yield as of period end. |
| 54 | 2 0 2 2 B L A C K R O C K A N N U A L R E P O R T T O S H A R E H O L D E R S |
| Schedule of Investments (continued) April 30, 2022 |
BlackRock MuniHoldings Fund, Inc. (MHD) |
Affiliates
Investments in issuers considered to be affiliate(s) of the Fund during the year ended April 30, 2022 for purposes of Section 2(a)(3) of the Investment Company Act of 1940, as amended, were as follows:
| Affiliated Issuer | Value at 04/30/21 |
Purchases at Cost |
Proceeds from Sales |
Net Realized Gain (Loss) |
Change in Unrealized Appreciation (Depreciation) |
Value at 04/30/22 |
Shares Held at 04/30/22 |
Income | Capital Gain Distributions from Underlying Funds |
|||||||||||||||||||||||||||
| BlackRock Liquidity Funds, MuniCash, Institutional Class |
$ | 7,843,901 | $ | 4,158,310 | (a) | $ | — | $ | (4,273 | ) | $ | 369 | $ | 11,998,307 | 11,998,307 | $ | 3,807 | $ | — | |||||||||||||||||
|
|
|
|
|
|
|
|
|
|
|
|||||||||||||||||||||||||||
| (a) | Represents net amount purchased (sold). |
Derivative Financial Instruments Outstanding as of Period End
Futures Contracts
| Description | Number of Contracts |
Expiration Date |
Notional Amount (000) |
Value/ Unrealized Appreciation (Depreciation) |
||||||||||||
| Short Contracts |
||||||||||||||||
| 10-Year U.S. Treasury Note |
278 | 06/21/22 | $ | 33,095 | $ | 1,310,096 | ||||||||||
| U.S. Long Bond |
321 | 06/21/22 | 45,101 | 2,278,966 | ||||||||||||
| 5-Year U.S. Treasury Note |
294 | 06/30/22 | 33,093 | 917,993 | ||||||||||||
|
|
|
|||||||||||||||
| $ | 4,507,055 | |||||||||||||||
|
|
|
|||||||||||||||
Derivative Financial Instruments Categorized by Risk Exposure
As of period end, the fair values of derivative financial instruments located in the Statements of Assets and Liabilities were as follows:
| Commodity Contracts |
Credit Contracts |
Equity Contracts |
Foreign Currency Exchange Contracts |
Interest Rate Contracts |
Other Contracts |
Total | ||||||||||||||||||||||
| Assets — Derivative Financial Instruments |
||||||||||||||||||||||||||||
| Futures contracts |
||||||||||||||||||||||||||||
| Unrealized appreciation on futures contracts(a) |
$ | — | $ | — | $ | — | $ | — | $ | 4,507,055 | $ | — | $ | 4,507,055 | ||||||||||||||
|
|
|
|
|
|
|
|
|
|
|
|
|
|
|
|||||||||||||||
| (a) | Net cumulative unrealized appreciation (depreciation) on futures contracts and centrally cleared swaps, if any, are reported in the Schedule of Investments. In the Statements of Assets and Liabilities, only current day’s variation margin is reported in receivables or payables and the net cumulative unrealized appreciation (depreciation) is included in accumulated earnings (loss). |
For the period ended April 30, 2022, the effect of derivative financial instruments in the Statements of Operations was as follows:
| Commodity Contracts |
Credit Contracts |
Equity Contracts |
Foreign Currency Exchange Contracts |
Interest Rate Contracts |
Other Contracts |
Total | ||||||||||||||||||||||
| Net Realized Gain (Loss) from: |
||||||||||||||||||||||||||||
| Futures contracts |
$ | — | $ | — | $ | — | $ | — | $ | 615,457 | $ | — | $ | 615,457 | ||||||||||||||
|
|
|
|
|
|
|
|
|
|
|
|
|
|
|
|||||||||||||||
| Net Change in Unrealized Appreciation (Depreciation) on: |
||||||||||||||||||||||||||||
| Futures contracts |
$ | — | $ | — | $ | — | $ | — | $ | 4,746,936 | $ | — | $ | 4,746,936 | ||||||||||||||
|
|
|
|
|
|
|
|
|
|
|
|
|
|
|
|||||||||||||||
Average Quarterly Balances of Outstanding Derivative Financial Instruments
| Futures contracts: |
||||
| Average notional value of contracts — short |
$ | 55,375,633 | ||
For more information about the Fund’s investment risks regarding derivative financial instruments, refer to the Notes to Financial Statements.
| S C H E D U L E O F I N V E S T M E N T S |
55 |
| Schedule of Investments (continued) April 30, 2022 |
BlackRock MuniHoldings Fund, Inc. (MHD) |
Fair Value Hierarchy as of Period End
Various inputs are used in determining the fair value of financial instruments. For a description of the input levels and information about the Fund’s policy regarding valuation of financial instruments, refer to the Notes to Financial Statements.
The following table summarizes the Fund’s financial instruments categorized in the fair value hierarchy. The breakdown of the Fund’s financial instruments into major categories is disclosed in the Schedule of Investments above.
| Level 1 | Level 2 | Level 3 | Total | |||||||||||||
| Assets |
||||||||||||||||
| Investments |
||||||||||||||||
| Long-Term Investments |
||||||||||||||||
| Municipal Bonds |
$ | — | $ | 996,346,454 | $ | — | $ | 996,346,454 | ||||||||
| Municipal Bonds Transferred to Tender Option Bond Trusts |
— | 280,451,707 | — | 280,451,707 | ||||||||||||
| Short-Term Securities |
||||||||||||||||
| Money Market Funds |
11,998,307 | — | — | 11,998,307 | ||||||||||||
|
|
|
|
|
|
|
|
|
|||||||||
| $ | 11,998,307 | $ | 1,276,798,161 | $ | — | $ | 1,288,796,468 | |||||||||
|
|
|
|
|
|
|
|
|
|||||||||
| Derivative Financial Instruments(a) |
||||||||||||||||
| Assets |
||||||||||||||||
| Interest Rate Contracts |
$ | 4,507,055 | $ | — | $ | — | $ | 4,507,055 | ||||||||
|
|
|
|
|
|
|
|
|
|||||||||
| (a) | Derivative financial instruments are futures contracts. Futures contracts are valued at the unrealized appreciation (depreciation) on the instrument. |
The Fund may hold assets and/or liabilities in which the fair value approximates the carrying amount for financial statement purposes. As of period end, such assets and/or liabilities are categorized within the fair value hierarchy as follows:
|
|
||||||||||||||||
| Level 1 | Level 2 | Level 3 | Total | |||||||||||||
|
|
||||||||||||||||
| Liabilities |
||||||||||||||||
| TOB Trust Certificates |
$ | — | $ | (176,042,422 | ) | $ | — | $ | (176,042,422 | ) | ||||||
| VMTP Shares at Liquidation Value |
— | (347,800,000 | ) | — | (347,800,000 | ) | ||||||||||
|
|
|
|
|
|
|
|
|
|||||||||
| $ | — | $ | (523,842,422 | ) | $ | — | $ | (523,842,422 | ) | |||||||
|
|
|
|
|
|
|
|
|
|||||||||
See notes to financial statements.
| 56 | 2 0 2 2 B L A C K R O C K A N N U A L R E P O R T T O S H A R E H O L D E R S |
| Schedule of Investments April 30, 2022 |
BlackRock MuniVest Fund II, Inc. (MVT) (Percentages shown are based on Net Assets) |
| Security | Par (000) |
Value | ||||||
| Municipal Bonds |
| |||||||
| Alabama — 1.7% | ||||||||
| County of Jefferson Alabama Sewer Revenue, Refunding RB |
||||||||
| Series A, Senior Lien, (AGM), 5.00%, 10/01/44 |
$ | 805 | $ | 835,646 | ||||
| Series D, Sub Lien, 6.00%, 10/01/42 |
3,575 | 3,868,193 | ||||||
|
|
|
|||||||
| 4,703,839 | ||||||||
| Arizona — 0.8% | ||||||||
| Glendale Industrial Development Authority, RB |
||||||||
| 5.00%, 05/15/41 |
90 | 94,447 | ||||||
| 5.00%, 05/15/56 |
360 | 375,711 | ||||||
| Industrial Development Authority of the City of Phoenix, RB, Series A, 5.00%, 07/01/46(a) |
1,685 | 1,680,090 | ||||||
|
|
|
|||||||
| 2,150,248 | ||||||||
| Arkansas — 0.8% | ||||||||
| Arkansas Development Finance Authority, RB, Series A, AMT, 4.50%, 09/01/49(a) |
2,455 | 2,263,694 | ||||||
|
|
|
|||||||
| California — 5.4% | ||||||||
| California Educational Facilities Authority, RB, Series V-1, 5.00%, 05/01/49 |
920 | 1,117,244 | ||||||
| California Health Facilities Financing Authority, Refunding RB |
||||||||
| Series A, 5.00%, 07/01/23(b) |
890 | 919,304 | ||||||
| Series A, 4.00%, 04/01/45 |
390 | 378,516 | ||||||
| Series A, 4.00%, 08/15/48 |
1,335 | 1,322,044 | ||||||
| California Municipal Finance Authority, ARB, AMT, Senior Lien, 4.00%, 12/31/47 |
1,475 | 1,349,458 | ||||||
| California Municipal Finance Authority, RB, S/F Housing |
||||||||
| Series A, 5.25%, 08/15/39 |
145 | 147,110 | ||||||
| Series A, 5.25%, 08/15/49 |
370 | 375,054 | ||||||
| California Municipal Finance Authority, Refunding RB, Series A, 5.00%, 02/01/42 |
225 | 237,259 | ||||||
| California Pollution Control Financing Authority, RB, Series A, AMT, 5.00%, 11/21/45(a) |
1,495 | 1,496,401 | ||||||
| California State Public Works Board, RB |
||||||||
| 4.00%, 11/01/41 |
445 | 456,126 | ||||||
| Series I, 5.00%, 11/01/38 |
775 | 802,964 | ||||||
| City of Los Angeles Department of Airports, ARB, Series A, AMT, 4.00%, 05/15/49 |
2,085 | 2,011,867 | ||||||
| City of Los Angeles Department of Airports, Refunding ARB |
||||||||
| Series A, AMT, 5.00%, 05/15/38 |
290 | 318,753 | ||||||
| Series A, AMT, 5.00%, 05/15/39 |
310 | 339,374 | ||||||
| Series A, AMT, 5.00%, 05/15/46 |
1,160 | 1,252,372 | ||||||
| San Francisco City & County Airport Comm-San Francisco International Airport, Refunding RB, Series A, AMT, 4.00%, 05/01/52 |
615 | 576,688 | ||||||
| San Marcos Unified School District, GO, CAB, Series B, 0.00%, 08/01/42(c) |
2,000 | 894,570 | ||||||
| State of California, Refunding GO, 3.00%, 12/01/46 |
500 | 419,525 | ||||||
| Stockton Public Financing Authority, RB, Series A, 6.25%, 10/01/23(b) |
360 | 380,205 | ||||||
|
|
|
|||||||
| 14,794,834 | ||||||||
| Colorado — 2.0% | ||||||||
| Arapahoe County School District No.6 Littleton, GO, Series A, (SAW), 5.50%, 12/01/43 |
1,705 | 1,931,709 | ||||||
| Security | Par (000) |
Value | ||||||
| Colorado (continued) | ||||||||
| Colorado Health Facilities Authority, Refunding RB, Series A, 4.00%, 08/01/44 |
$ | 1,765 | $ | 1,709,101 | ||||
| Colorado Housing and Finance Authority, Refunding RB, S/F Housing, Series B, (GNMA), 3.25%, 05/01/52 |
585 | 577,608 | ||||||
| State of Colorado, COP, Series O, 4.00%, 03/15/44 |
1,275 | 1,285,939 | ||||||
|
|
|
|||||||
| 5,504,357 | ||||||||
| Connecticut — 0.4% | ||||||||
| Connecticut Housing Finance Authority, Refunding RB, M/F Housing, Series A-1, 3.50%, 11/15/51 |
470 | 471,513 | ||||||
| State of Connecticut Special Tax Revenue, RB |
||||||||
| Series A, 4.00%, 05/01/36 |
330 | 341,736 | ||||||
| Series A, 4.00%, 05/01/39 |
210 | 216,508 | ||||||
|
|
|
|||||||
| 1,029,757 | ||||||||
| Delaware — 0.4% | ||||||||
| Delaware Transportation Authority, RB, 5.00%, 06/01/55 |
1,165 | 1,215,100 | ||||||
|
|
|
|||||||
| District of Columbia — 6.1% | ||||||||
| District of Columbia, Refunding RB |
||||||||
| 5.00%, 04/01/35 |
435 | 464,469 | ||||||
| Series A, 6.00%, 07/01/23(b) |
240 | 249,716 | ||||||
| Catholic Health Services, 5.00%, 10/01/48 |
2,315 | 2,514,104 | ||||||
| Metropolitan Washington Airports Authority Aviation Revenue, Refunding ARB |
||||||||
| Series A, AMT, 4.00%, 10/01/37 |
340 | 338,599 | ||||||
| Series A, AMT, 4.00%, 10/01/38 |
340 | 335,926 | ||||||
| Series A, AMT, 4.00%, 10/01/40 |
410 | 405,879 | ||||||
| Series A, AMT, 4.00%, 10/01/41 |
885 | 874,096 | ||||||
| Metropolitan Washington Airports Authority Dulles Toll Road Revenue, Refunding RB, Series B, Subordinate, 4.00%, 10/01/49 |
765 | 756,823 | ||||||
| Metropolitan Washington Airports Authority Dulles Toll Road Revenue, Refunding RB, CAB(c) |
||||||||
| Series B, 2nd Senior Lien, (AGC), 0.00%, 10/01/33 |
6,590 | 4,215,999 | ||||||
| Series B, 2nd Senior Lien, (AGC), 0.00%, 10/01/34 |
4,830 | 2,948,730 | ||||||
| Series B, 2nd Senior Lien, (AGC), 0.00%, 10/01/35 |
6,515 | 3,788,453 | ||||||
|
|
|
|||||||
| 16,892,794 | ||||||||
| Florida — 6.6% | ||||||||
| Broward County FL Water & Sewer Utility Revenue, RB, Series A, 4.00%, 10/01/47 |
210 | 213,136 | ||||||
| Capital Projects Finance Authority, Refunding RB |
||||||||
| Series A-1, 5.00%, 10/01/32 |
195 | 212,923 | ||||||
| Series A-1, 5.00%, 10/01/33 |
215 | 233,448 | ||||||
| Series A-1, 5.00%, 10/01/34 |
215 | 232,770 | ||||||
| Series A-1, 5.00%, 10/01/35 |
75 | 80,953 | ||||||
| Celebration Pointe Community Development District, SAB(a) |
||||||||
| 5.00%, 05/01/32 |
450 | 463,603 | ||||||
| 5.00%, 05/01/48 |
1,120 | 1,134,603 | ||||||
| Collier County Health Facilities Authority, RB, Series A, 5.00%, 05/01/48 |
1,190 | 1,270,724 | ||||||
| Collier County Health Facilities Authority, Refunding RB, Series A, 5.00%, 05/01/45 |
1,340 | 1,389,879 | ||||||
| County of Lee FL Airport Revenue, ARB, Series B, AMT, 5.00%, 10/01/46 |
1,275 | 1,385,465 | ||||||
| County of Miami-Dade Florida Aviation Revenue, Refunding RB |
||||||||
| Series A, 4.00%, 10/01/37 |
325 | 327,670 | ||||||
| S C H E D U L E O F I N V E S T M E N T S |
57 |
| Schedule of Investments (continued) April 30, 2022 |
BlackRock MuniVest Fund II, Inc. (MVT) (Percentages shown are based on Net Assets) |
| Security | Par (000) |
Value | ||||||
| Florida (continued) | ||||||||
| County of Miami-Dade Florida Aviation Revenue, Refunding RB (continued) |
||||||||
| Series A, 4.00%, 10/01/38 |
$ | 325 | $ | 326,835 | ||||
| Series A, 4.00%, 10/01/39 |
240 | 240,940 | ||||||
| Florida Development Finance Corp., RB |
||||||||
| Series A, 5.00%, 06/15/40 |
215 | 223,872 | ||||||
| Series A, 5.00%, 06/15/50 |
720 | 742,811 | ||||||
| Series A, 5.00%, 06/15/55 |
435 | 447,213 | ||||||
| Florida Housing Finance Corp., RB, S/F Housing, Series 1, (FHLMC, FNMA, GNMA), 3.50%, 07/01/52 |
1,275 | 1,278,991 | ||||||
| Palm Beach County Health Facilities Authority, RB, 5.00%, 11/15/45 |
3,150 | 3,377,638 | ||||||
| Sarasota County Florida Utility System Revenue, RB, Series A, 5.00%, 10/01/50 |
650 | 728,555 | ||||||
| Village Community Development District No.10, SAB, 5.13%, 05/01/43 |
2,030 | 2,030,000 | ||||||
| Volusia County Educational Facility Authority, Refunding RB, 5.00%, 10/15/49 |
1,750 | 1,938,002 | ||||||
|
|
|
|||||||
| 18,280,031 | ||||||||
| Georgia — 5.1% | ||||||||
| Development Authority for Fulton County, Refunding RB, 4.00%, 03/15/44 |
5,000 | 4,950,410 | ||||||
| Georgia Housing & Finance Authority, RB, S/F Housing, Series B, 2.50%, 06/01/50 |
720 | 527,558 | ||||||
| Georgia Housing & Finance Authority, Refunding RB, S/F Housing, Series A, 4.00%, 06/01/49 |
595 | 614,626 | ||||||
| Glynn-Brunswick Memorial Hospital Authority, RB, 5.00%, 08/01/47 |
2,500 | 2,621,955 | ||||||
| Main Street Natural Gas, Inc., RB |
||||||||
| Series A, 5.00%, 05/15/35 |
490 | 539,665 | ||||||
| Series A, 5.00%, 05/15/36 |
490 | 541,363 | ||||||
| Series A, 5.00%, 05/15/37 |
540 | 597,913 | ||||||
| Series A, 5.00%, 05/15/38 |
295 | 327,184 | ||||||
| Series A, 5.00%, 05/15/49 |
985 | 1,100,772 | ||||||
| Municipal Electric Authority of Georgia, RB, 4.00%, 01/01/49 |
1,560 | 1,486,299 | ||||||
| Municipal Electric Authority of Georgia, Refunding RB |
||||||||
| Sub-Series A, 4.00%, 01/01/49 |
610 | 603,341 | ||||||
| Series A, Subordinate, 4.00%, 01/01/51 |
225 | 225,163 | ||||||
|
|
|
|||||||
| 14,136,249 | ||||||||
| Idaho — 0.3% | ||||||||
| Idaho Health Facilities Authority, RB, Series 2017, 5.00%, 12/01/46 |
745 | 795,263 | ||||||
|
|
|
|||||||
| Illinois — 10.7% | ||||||||
| Chicago Board of Education, GO |
||||||||
| Series C, 5.25%, 12/01/35 |
1,465 | 1,511,725 | ||||||
| Series D, 5.00%, 12/01/46 |
1,915 | 1,951,164 | ||||||
| Series H, 5.00%, 12/01/36 |
450 | 470,317 | ||||||
| Chicago Board of Education, Refunding GO |
||||||||
| Series C, 5.00%, 12/01/25 |
1,460 | 1,542,330 | ||||||
| Series F, 5.00%, 12/01/24 |
615 | 643,455 | ||||||
| Series G, 5.00%, 12/01/34 |
450 | 471,088 | ||||||
| Chicago O’Hare International Airport, Refunding ARB, Series A, Senior Lien, 4.00%, 01/01/36 |
935 | 945,094 | ||||||
| Security | Par (000) |
Value | ||||||
| Illinois (continued) | ||||||||
| City of Chicago Illinois Waterworks Revenue, Refunding RB |
||||||||
| 2nd Lien, (AGM), 5.25%, 11/01/33 |
$ | 260 | $ | 260,543 | ||||
| 2nd Lien, 5.00%, 11/01/42 |
915 | 923,579 | ||||||
| Cook County Community College District No. 508, GO, 5.50%, 12/01/38 |
805 | 829,318 | ||||||
| Illinois Finance Authority, RB |
||||||||
| Series A, 5.00%, 02/15/47 |
235 | 246,017 | ||||||
| Series A, 5.00%, 02/15/50 |
130 | 135,901 | ||||||
| Illinois State Toll Highway Authority, RB |
||||||||
| Series A, 5.00%, 01/01/45 |
1,290 | 1,419,473 | ||||||
| Series A, 4.00%, 01/01/46 |
575 | 572,137 | ||||||
| Series A, 5.00%, 01/01/46 |
1,500 | 1,661,433 | ||||||
| Series C, 5.00%, 01/01/37 |
2,800 | 2,918,700 | ||||||
| Metropolitan Pier & Exposition Authority, RB, Series A, 5.00%, 06/15/57 |
870 | 889,329 | ||||||
| Metropolitan Pier & Exposition Authority, Refunding RB, CAB, Series B, (AGM), 0.00%, 06/15/43(c) |
5,175 | 1,943,647 | ||||||
| State of Illinois, GO |
||||||||
| 5.00%, 02/01/39 |
1,540 | 1,565,704 | ||||||
| Series A, 5.00%, 04/01/35 |
3,000 | 3,067,788 | ||||||
| Series A, 5.00%, 04/01/38 |
3,490 | 3,568,860 | ||||||
| University of Illinois, RB, Series A, 5.00%, 04/01/44 |
985 | 1,009,747 | ||||||
| Village of Hodgkins Illinois, RB, AMT, 6.00%, 11/01/23 |
1,045 | 1,047,945 | ||||||
|
|
|
|||||||
| 29,595,294 | ||||||||
| Indiana — 2.5% | ||||||||
| City of Valparaiso Indiana, RB |
||||||||
| AMT, 6.75%, 01/01/34 |
790 | 844,068 | ||||||
| AMT, 7.00%, 01/01/44 |
1,905 | 2,031,772 | ||||||
| Indiana Finance Authority, RB(b) |
||||||||
| Series A, AMT, 5.00%, 07/01/23 |
1,880 | 1,932,347 | ||||||
| Series A, AMT, 5.25%, 07/01/23 |
405 | 416,277 | ||||||
| Indiana Housing & Community Development Authority, RB, S/F Housing, Series A, (FHLMC, FNMA, GNMA), 3.00%, 07/01/52 |
285 | 282,417 | ||||||
| Indianapolis Local Public Improvement Bond Bank, RB, Series A, 5.00%, 01/15/40 |
1,270 | 1,291,496 | ||||||
|
|
|
|||||||
| 6,798,377 | ||||||||
| Iowa — 1.1% | ||||||||
| Iowa Finance Authority, Refunding RB, Series B, |
2,810 | 2,943,455 | ||||||
|
|
|
|||||||
| Kentucky — 1.4% | ||||||||
| Kentucky Economic Development Finance Authority, RB, Series A, Catholic Health Services, 5.25%, 01/01/23(b) |
995 | 1,018,011 | ||||||
| Kentucky Economic Development Finance Authority, Refunding RB, Series A, (AGM), 5.00%, 12/01/45 |
1,235 | 1,396,018 | ||||||
| Kentucky Public Transportation Infrastructure Authority, RB, CAB, Series C, Convertible, 6.75%, 07/01/43 |
1,200 | 1,310,968 | ||||||
|
|
|
|||||||
| 3,724,997 | ||||||||
| Louisiana — 1.8% | ||||||||
| Louisiana Public Facilities Authority, Refunding RB, 4.00%, 12/15/50 |
2,000 | 2,023,452 | ||||||
| Tobacco Settlement Financing Corp., Refunding RB |
||||||||
| Series A, 5.25%, 05/15/31 |
315 | 315,387 | ||||||
| Series A, 5.25%, 05/15/32 |
1,110 | 1,111,269 | ||||||
| 58 | 2 0 2 2 B L A C K R O C K A N N U A L R E P O R T T O S H A R E H O L D E R S |
| Schedule of Investments (continued) April 30, 2022 |
BlackRock MuniVest Fund II, Inc. (MVT) (Percentages shown are based on Net Assets) |
| Security | Par (000) |
Value | ||||||
| Louisiana (continued) | ||||||||
| Tobacco Settlement Financing Corp., Refunding RB (continued) |
||||||||
| Series A, 5.25%, 05/15/33 |
$ | 1,040 | $ | 1,041,179 | ||||
| Series A, 5.25%, 05/15/35 |
505 | 516,523 | ||||||
|
|
|
|||||||
| 5,007,810 | ||||||||
| Maryland — 0.7% | ||||||||
| Maryland Health & Higher Educational Facilities Authority, RB |
||||||||
| Series 2017, 5.00%, 12/01/46 |
420 | 443,731 | ||||||
| Series B, (NPFGC), 7.00%, 07/01/22(e) |
370 | 373,205 | ||||||
| Maryland State Transportation Authority, Refunding RB, Series A, 2.50%, 07/01/47 |
1,755 | 1,225,418 | ||||||
|
|
|
|||||||
| 2,042,354 | ||||||||
| Massachusetts — 1.5% | ||||||||
| Massachusetts Development Finance Agency, Refunding RB(a) |
||||||||
| 4.00%, 10/01/32 |
215 | 227,437 | ||||||
| 4.13%, 10/01/42 |
470 | 496,459 | ||||||
| Massachusetts Housing Finance Agency, RB, M/F Housing |
||||||||
| Series C-1, 3.15%, 12/01/49 |
550 | 456,699 | ||||||
| Series C-1, 3.25%, 12/01/54 |
2,030 | 1,671,299 | ||||||
| Massachusetts Port Authority, ARB, Series E, AMT, 5.00%, 07/01/51 |
1,110 | 1,192,280 | ||||||
|
|
|
|||||||
| 4,044,174 | ||||||||
| Michigan — 2.1% | ||||||||
| Michigan Finance Authority, Refunding RB |
||||||||
| 5.00%, 12/01/48 |
2,000 | 2,135,352 | ||||||
| Series A, 4.00%, 12/01/49 |
810 | 788,998 | ||||||
| Michigan State Housing Development Authority, RB, M/F Housing, Series A, 2.70%, 10/01/56 |
950 | 699,790 | ||||||
| Michigan State University, Refunding RB, Series B, 5.00%, 02/15/48 |
990 | 1,087,241 | ||||||
| Michigan Strategic Fund, RB, AMT, 5.00%, 06/30/48 |
1,070 | 1,093,821 | ||||||
|
|
|
|||||||
| 5,805,202 | ||||||||
| Minnesota — 2.5% | ||||||||
| Duluth Economic Development Authority, Refunding RB |
||||||||
| Series A, 4.25%, 02/15/48 |
2,020 | 2,056,461 | ||||||
| Series A, 5.25%, 02/15/53 |
2,045 | 2,206,486 | ||||||
| Minnesota Housing Finance Agency, RB |
||||||||
| (FHLMC, FNMA, GNMA), 3.50%, 07/01/52 |
1,785 | 1,797,359 | ||||||
| Series A, (FHLMC, FNMA, GNMA), 2.75%, 07/01/42 |
340 | 280,257 | ||||||
| Series A, (FHLMC, FNMA, GNMA), 3.00%, 07/01/52 |
635 | 626,539 | ||||||
|
|
|
|||||||
| 6,967,102 | ||||||||
| Mississippi — 2.2% | ||||||||
| State of Mississippi, RB |
||||||||
| Series A, 5.00%, 10/15/37 |
1,000 | 1,091,275 | ||||||
| Series A, 4.00%, 10/15/38 |
5,000 | 5,070,820 | ||||||
|
|
|
|||||||
| 6,162,095 | ||||||||
| Missouri — 4.2% | ||||||||
| Health & Educational Facilities Authority of the State of Missouri, RB, 4.00%, 06/01/53 |
2,885 | 2,808,002 | ||||||
| Security | Par (000) |
Value | ||||||
| Missouri (continued) | ||||||||
| Health & Educational Facilities Authority of the State of Missouri, Refunding RB |
||||||||
| 5.50%, 05/01/43 |
$ | 245 | $ | 251,751 | ||||
| 5.00%, 09/01/48 |
2,610 | 2,773,472 | ||||||
| Series A, 4.00%, 07/01/46 |
595 | 575,934 | ||||||
| Series C, 5.00%, 11/15/47 |
2,570 | 2,725,215 | ||||||
| Missouri Housing Development Commission, RB, S/F Housing, (FHLMC, FNMA, GNMA), 3.50%, 05/01/52 |
2,315 | 2,331,765 | ||||||
|
|
|
|||||||
| 11,466,139 | ||||||||
| Nebraska — 1.1% | ||||||||
| Central Plains Energy Project, RB |
||||||||
| 5.25%, 09/01/37 |
825 | 833,441 | ||||||
| 5.00%, 09/01/42 |
1,445 | 1,459,405 | ||||||
| Nebraska Investment Finance Authority, RB, (FHLMC, FNMA, GNMA), 3.00%, 03/01/52 |
640 | 628,161 | ||||||
|
|
|
|||||||
| 2,921,007 | ||||||||
| New Hampshire(a) — 0.9% | ||||||||
| New Hampshire Business Finance Authority, Refunding RB |
||||||||
| Series B, 4.63%, 11/01/42 |
1,545 | 1,569,492 | ||||||
| Series C, AMT, 4.88%, 11/01/42 |
805 | 820,025 | ||||||
|
|
|
|||||||
| 2,389,517 | ||||||||
| New Jersey — 16.6% | ||||||||
| Casino Reinvestment Development Authority, Inc., Refunding RB |
||||||||
| 5.25%, 11/01/39 |
1,675 | 1,729,900 | ||||||
| 5.25%, 11/01/44 |
1,525 | 1,571,735 | ||||||
| Hudson County Improvement Authority, RB, 4.00%, 10/01/46 |
1,655 | 1,649,686 | ||||||
| New Jersey Economic Development Authority, RB |
||||||||
| 4.00%, 11/01/38 |
510 | 495,759 | ||||||
| 4.00%, 11/01/39 |
405 | 391,857 | ||||||
| 5.00%, 06/15/49 |
2,295 | 2,429,524 | ||||||
| Series EEE, 5.00%, 06/15/48 |
3,690 | 3,884,183 | ||||||
| New Jersey Economic Development Authority, Refunding ARB, AMT, 5.00%, 10/01/47 |
1,425 | 1,527,224 | ||||||
| New Jersey Economic Development Authority, Refunding SAB, 5.75%, 04/01/31 |
2,240 | 2,219,564 | ||||||
| New Jersey Health Care Facilities Financing Authority, RB, 4.00%, 07/01/51 |
3,120 | 3,073,028 | ||||||
| New Jersey Higher Education Student Assistance Authority, Refunding RB |
||||||||
| Series B, AMT, 4.00%, 12/01/41 |
1,230 | 1,200,960 | ||||||
| Series C, AMT, Subordinate, 5.00%, 12/01/52 |
1,245 | 1,286,166 | ||||||
| New Jersey Transportation Trust Fund Authority, RB |
||||||||
| Series AA, 5.00%, 06/15/44 |
1,270 | 1,287,456 | ||||||
| Series BB, 5.00%, 06/15/50 |
4,120 | 4,333,894 | ||||||
| New Jersey Turnpike Authority, RB |
||||||||
| Series A, 4.00%, 01/01/42 |
730 | 740,091 | ||||||
| Series E, 5.00%, 01/01/45 |
2,615 | 2,703,662 | ||||||
| State of New Jersey, GO, Series A, 4.00%, 06/01/31 |
560 | 585,665 | ||||||
| Tobacco Settlement Financing Corp., Refunding RB |
||||||||
| Series A, 5.25%, 06/01/46 |
525 | 556,252 | ||||||
| Sub-Series B, 5.00%, 06/01/46 |
13,345 | 14,165,878 | ||||||
|
|
|
|||||||
| 45,832,484 | ||||||||
| S C H E D U L E O F I N V E S T M E N T S |
59 |
| Schedule of Investments (continued) April 30, 2022 |
BlackRock MuniVest Fund II, Inc. (MVT) (Percentages shown are based on Net Assets) |
| Security | Par (000) |
Value | ||||||
| New Mexico — 0.5% | ||||||||
| New Mexico Mortgage Finance Authority, RB, S/F Housing |
||||||||
| Class A, (FHLMC, FNMA, GNMA), 3.00%, 03/01/53 |
$ | 480 | $ | 476,416 | ||||
| Series C, (FHLMC, FNMA, GNMA), 4.25%, 03/01/53 |
765 | 804,379 | ||||||
|
|
|
|||||||
| 1,280,795 | ||||||||
| New York — 12.3% | ||||||||
| City of New York, GO, Series C, 5.00%, 08/01/42 |
1,115 | 1,230,071 | ||||||
| Erie Tobacco Asset Securitization Corp., Refunding RB, Series A, 5.00%, 06/01/45 |
1,960 | 1,967,715 | ||||||
| Metropolitan Transportation Authority, Refunding RB |
||||||||
| Series C-1, 4.75%, 11/15/45 |
1,585 | 1,662,969 | ||||||
| Series C-1, 5.00%, 11/15/50 |
515 | 535,745 | ||||||
| Series C-1, 5.25%, 11/15/55 |
760 | 822,471 | ||||||
| Monroe County Industrial Development Corp., Refunding RB |
||||||||
| 4.00%, 12/01/46 |
520 | 490,951 | ||||||
| Series A, 4.00%, 07/01/50 |
1,065 | 1,051,187 | ||||||
| New York City Housing Development Corp., RB, M/F Housing |
||||||||
| Series A, 3.00%, 11/01/55 |
1,055 | 811,607 | ||||||
| Series F-1, (FHA), 2.40%, 11/01/46 |
2,530 | 1,852,109 | ||||||
| Series F-1, (FHA), 2.50%, 11/01/51 |
1,745 | 1,235,127 | ||||||
| New York City Industrial Development Agency, Refunding RB |
||||||||
| Series A, Class A, (AGM), 3.00%, 01/01/37 |
215 | 191,470 | ||||||
| Series A, Class A, (AGM), 3.00%, 01/01/39 |
215 | 189,242 | ||||||
| Series A, Class A, (AGM), 3.00%, 01/01/40 |
150 | 131,310 | ||||||
| New York City Transitional Finance Authority Future Tax Secured Revenue, RB |
||||||||
| Sub-Series E-1, 5.00%, 02/01/42 |
525 | 525,816 | ||||||
| Series C, Subordinate, 4.00%, 05/01/45 |
1,080 | 1,072,308 | ||||||
| Series F-1, Subordinate, 4.00%, 02/01/51 |
400 | 393,111 | ||||||
| Sub-Series C-1, Subordinate, 4.00%, 05/01/40 |
430 | 434,761 | ||||||
| New York Counties Tobacco Trust IV, Refunding RB |
||||||||
| Series A, 5.00%, 06/01/38 |
1,905 | 1,905,987 | ||||||
| Series A, 6.25%, 06/01/41(a) |
1,800 | 1,824,504 | ||||||
| New York Liberty Development Corp., Refunding RB |
||||||||
| 3.13%, 09/15/50 |
1,815 | 1,508,722 | ||||||
| Series 1, Class 1, 5.00%, 11/15/44(a) |
2,860 | 2,887,839 | ||||||
| Series 2, Class 2, 5.15%, 11/15/34(a) |
340 | 349,613 | ||||||
| Series 2, Class 2, 5.38%, 11/15/40(a) |
850 | 877,155 | ||||||
| Series A, 2.88%, 11/15/46 |
3,365 | 2,595,926 | ||||||
| New York State Environmental Facilities Corp., RB, Series B, Subordinate, 5.00%, 06/15/48 |
1,780 | 1,935,339 | ||||||
| New York State Urban Development Corp., RB, Series A, 3.00%, 03/15/50 |
1,285 | 1,060,820 | ||||||
| New York Transportation Development Corp., RB |
||||||||
| AMT, 5.00%, 10/01/35 |
350 | 371,688 | ||||||
| AMT, 5.00%, 10/01/40 |
1,000 | 1,045,537 | ||||||
| Triborough Bridge & Tunnel Authority, RB |
||||||||
| Series A, 5.00%, 11/15/49 |
850 | 925,571 | ||||||
| Series A, 4.00%, 11/15/54 |
985 | 971,819 | ||||||
| Series A, 5.00%, 11/15/56 |
885 | 964,820 | ||||||
|
|
|
|||||||
| 33,823,310 | ||||||||
| Security | Par (000) |
Value | ||||||
| North Carolina — 1.1% | ||||||||
| County of Union North Carolina Enterprise System Revenue, RB, 3.00%, 06/01/51 |
$ | 2,055 | $ | 1,686,163 | ||||
| North Carolina Housing Finance Agency, RB, S/F Housing, (FHLMC, FNMA, GNMA), 3.75%, 07/01/52 |
630 | 640,139 | ||||||
| University of North Carolina at Chapel Hill, RB, 5.00%, 02/01/49 |
530 | 609,301 | ||||||
|
|
|
|||||||
| 2,935,603 | ||||||||
| North Dakota — 0.5% | ||||||||
| County of Cass North Dakota, Refunding RB, Series B, 5.25%, 02/15/58 |
950 | 1,015,919 | ||||||
| North Dakota Housing Finance Agency, RB, M/F Housing, Series A, 4.00%, 01/01/53 |
470 | 479,364 | ||||||
|
|
|
|||||||
| 1,495,283 | ||||||||
| Ohio — 4.5% | ||||||||
| Buckeye Tobacco Settlement Financing Authority, Refunding RB |
||||||||
| Series A-2, Class 1, 4.00%, 06/01/37 |
285 | 278,542 | ||||||
| Series A-2, Class 1, 4.00%, 06/01/38 |
285 | 278,292 | ||||||
| Series A-2, Class 1, 4.00%, 06/01/39 |
285 | 278,060 | ||||||
| Series A-2, Class 1, 4.00%, 06/01/48 |
755 | 706,019 | ||||||
| Series B-2, Class 2, 5.00%, 06/01/55 |
2,725 | 2,649,487 | ||||||
| County of Franklin Ohio, RB |
||||||||
| Series 2017, 5.00%, 12/01/46 |
400 | 422,569 | ||||||
| Series A, 6.13%, 07/01/22(b) |
660 | 664,731 | ||||||
| Series A, 4.00%, 12/01/49 |
505 | 498,342 | ||||||
| County of Hamilton Ohio, Refunding RB |
||||||||
| 4.00%, 08/15/50 |
590 | 545,823 | ||||||
| Series A, 3.75%, 08/15/50 |
1,040 | 903,625 | ||||||
| County of Montgomery Ohio, Refunding RB, 4.00%, 08/01/46 |
915 | 900,750 | ||||||
| Ohio Air Quality Development Authority, RB, AMT, 5.00%, 07/01/49(a) |
230 | 224,940 | ||||||
| Ohio Housing Finance Agency, Refunding RB, (FHLMC, FNMA, GNMA), 3.25%, 09/01/52 |
1,655 | 1,645,469 | ||||||
| Ohio State University/The, 4.00%, 12/01/48 |
2,065 | 2,134,198 | ||||||
| State of Ohio, RB, AMT, 5.00%, 06/30/53 |
275 | 282,883 | ||||||
|
|
|
|||||||
| 12,413,730 | ||||||||
| Oklahoma — 1.9% | ||||||||
| Oklahoma Development Finance Authority, RB, Series B, 5.50%, 08/15/57 |
1,155 | 1,208,355 | ||||||
| Oklahoma Turnpike Authority, RB |
||||||||
| Series A, 4.00%, 01/01/48 |
2,050 | 2,077,667 | ||||||
| Series C, 4.00%, 01/01/42 |
1,950 | 1,997,479 | ||||||
|
|
|
|||||||
| 5,283,501 | ||||||||
| Oregon — 1.3% | ||||||||
| Medford Hospital Facilities Authority, Refunding RB, Series A, 4.00%, 08/15/50 |
1,680 | 1,623,387 | ||||||
| Port of Portland Oregon Airport Revenue, Refunding ARB, Series 27-A, AMT, 5.00%, 07/01/45 |
1,795 | 1,932,621 | ||||||
|
|
|
|||||||
| 3,556,008 | ||||||||
| Pennsylvania — 5.1% | ||||||||
| Allentown Neighborhood Improvement Zone Development Authority, RB(a) Subordinate, 5.00%, 05/01/28 |
160 | 178,435 | ||||||
| 60 | 2 0 2 2 B L A C K R O C K A N N U A L R E P O R T T O S H A R E H O L D E R S |
| Schedule of Investments (continued) April 30, 2022 |
BlackRock MuniVest Fund II, Inc. (MVT) (Percentages shown are based on Net Assets) |
| Security | Par (000) |
Value | ||||||
| Pennsylvania (continued) | ||||||||
| Allentown Neighborhood Improvement Zone Development Authority, RB(a) (continued) |
||||||||
| Subordinate, 5.13%, 05/01/32 |
$ | 230 | $ | 252,680 | ||||
| Subordinate, 5.38%, 05/01/42 |
435 | 473,037 | ||||||
| Hospitals & Higher Education Facilities Authority of Philadelphia, RB, Series A, 5.63%, 07/01/42 |
635 | 638,233 | ||||||
| Lancaster Industrial Development Authority, RB, 5.00%, 12/01/49 |
1,300 | 1,382,454 | ||||||
| Montgomery County Higher Education and Health Authority, Refunding RB |
||||||||
| 4.00%, 05/01/52 |
2,125 | 2,053,472 | ||||||
| Series A, 5.00%, 09/01/43 |
1,220 | 1,308,130 | ||||||
| Series A, 4.00%, 09/01/49 |
555 | 550,296 | ||||||
| Pennsylvania Economic Development Financing Authority, RB, AMT, 5.00%, 06/30/42 |
850 | 885,318 | ||||||
| Pennsylvania Economic Development Financing Authority, Refunding RB, AMT, 5.50%, 11/01/44 |
1,035 | 1,055,449 | ||||||
| Pennsylvania Higher Educational Facilities Authority, RB, 4.00%, 08/15/49 |
2,305 | 2,314,347 | ||||||
| Pennsylvania Housing Finance Agency, Refunding RB, S/F Housing, 4.25%, 10/01/52 |
1,135 | 1,175,694 | ||||||
| Pennsylvania Turnpike Commission, RB, Series A, 5.00%, 12/01/44 |
1,105 | 1,144,592 | ||||||
| School District of Philadelphia, GO, Series A, (SAW), 4.00%, 09/01/46 |
675 | 686,443 | ||||||
|
|
|
|||||||
| 14,098,580 | ||||||||
| Puerto Rico — 6.5% | ||||||||
| Children’s Trust Fund, Refunding RB |
||||||||
| 5.50%, 05/15/39 |
675 | 690,829 | ||||||
| 5.63%, 05/15/43 |
690 | 701,840 | ||||||
| Puerto Rico Commonwealth Aqueduct & Sewer Authority, Refunding RB |
||||||||
| Series A, Senior Lien, 5.00%, 07/01/33 |
2,430 | 2,439,343 | ||||||
| Series A, Senior Lien, 5.13%, 07/01/37 |
695 | 697,788 | ||||||
| Puerto Rico Sales Tax Financing Corp. Sales Tax Revenue, RB |
||||||||
| Series A-1, Restructured, 4.75%, 07/01/53 |
1,843 | 1,865,890 | ||||||
| Series A-1, Restructured, 5.00%, 07/01/58 |
6,807 | 6,967,509 | ||||||
| Series A-2, Restructured, 4.33%, 07/01/40 |
85 | 84,287 | ||||||
| Series A-2, Restructured, 4.78%, 07/01/58 |
2,941 | 2,990,918 | ||||||
| Puerto Rico Sales Tax Financing Corp. Sales Tax Revenue, RB, CAB(c) |
||||||||
| Series A-1, Restructured, 0.00%, 07/01/46 |
3,564 | 1,001,331 | ||||||
| Series A-1, Restructured, 0.00%, 07/01/51 |
1,971 | 412,885 | ||||||
|
|
|
|||||||
| 17,852,620 | ||||||||
| Rhode Island — 2.8% | ||||||||
| Rhode Island Housing and Mortgage Finance Corp., RB, S/F Housing, Series 76-A, 3.00%, 10/01/51 |
1,210 | 1,173,338 | ||||||
| Tobacco Settlement Financing Corp., Refunding RB |
||||||||
| Series A, 5.00%, 06/01/35 |
820 | 847,907 | ||||||
| Series B, 4.50%, 06/01/45 |
2,645 | 2,673,408 | ||||||
| Series B, 5.00%, 06/01/50 |
2,945 | 3,053,364 | ||||||
|
|
|
|||||||
| 7,748,017 | ||||||||
| South Carolina — 6.5% | ||||||||
| South Carolina Jobs-Economic Development Authority, Refunding RB |
||||||||
| 5.00%, 02/01/36 |
2,505 | 2,619,010 | ||||||
| 5.00%, 11/15/47 |
1,350 | 1,445,921 | ||||||
| Security | Par (000) |
Value | ||||||
| South Carolina (continued) | ||||||||
| South Carolina Jobs-Economic Development Authority, Refunding RB (continued) |
||||||||
| Series A, 5.00%, 05/01/48 |
$ | 3,060 | $ | 3,270,938 | ||||
| South Carolina Public Service Authority, RB, Series A, 5.50%, 12/01/54 |
6,180 | 6,381,165 | ||||||
| South Carolina Public Service Authority, Refunding RB |
||||||||
| Series A, 5.00%, 12/01/50 |
1,430 | 1,477,190 | ||||||
| Series E, 5.25%, 12/01/55 |
1,735 | 1,814,125 | ||||||
| South Carolina State Housing Finance & Development Authority, RB, S/F Housing, Series A, 4.00%, 01/01/52 |
870 | 891,818 | ||||||
|
|
|
|||||||
| 17,900,167 | ||||||||
| Tennessee — 1.2% | ||||||||
| Chattanooga Health Educational & Housing Facility Board, RB, Series A, Catholic Health Services, 5.25%, 01/01/23(b) |
995 | 1,014,973 | ||||||
| Chattanooga Health Educational & Housing Facility Board, Refunding RB, Series A, 4.00%, 08/01/44 |
160 | 154,860 | ||||||
| Metropolitan Government Nashville & Davidson County Health & Educational Facilities Board, RB, Series A, 5.00%, 07/01/40 |
690 | 725,415 | ||||||
| Metropolitan Government Nashville & Davidson County Health & Educational Facilities Board, Refunding RB, Series A, 5.25%, 10/01/58 |
955 | 1,018,416 | ||||||
| Tennessee Housing Development Agency, Refunding RB, S/F Housing, Series 1, 3.75%, 07/01/52 |
485 | 493,905 | ||||||
|
|
|
|||||||
| 3,407,569 | ||||||||
| Texas — 6.0% | ||||||||
| Central Texas Regional Mobility Authority, RB, Series E, Senior Lien, 4.00%, 01/01/50 |
2,160 | 2,096,217 | ||||||
| City of Houston Texas Airport System Revenue, Refunding RB, AMT, 5.00%, 07/01/29 |
775 | 798,240 | ||||||
| City of San Antonio Texas Electric & Gas Systems Revenue, Refunding RB, Series A, 5.00%, 02/01/48 |
1,155 | 1,254,768 | ||||||
| Clifton Higher Education Finance Corp., RB, 6.00%, 08/15/43 |
745 | 774,007 | ||||||
| Fort Bend County Industrial Development Corp., RB, Series B, 4.75%, 11/01/42 |
670 | 672,108 | ||||||
| Harris County Cultural Education Facilities Finance Corp., RB, Series B, 7.00%, 01/01/23(b) |
455 | 470,516 | ||||||
| North Texas Tollway Authority, Refunding RB, Series A, 5.00%, 01/01/38 |
925 | 968,573 | ||||||
| Port Authority of Houston of Harris County Texas, ARB, 4.00%, 10/01/46 |
955 | 949,003 | ||||||
| San Antonio Water System, Refunding RB, Series A, Junior Lien, 5.00%, 05/15/48 |
1,245 | 1,352,932 | ||||||
| Tarrant County Cultural Education Facilities Finance Corp., RB |
||||||||
| 4.00%, 10/01/47 |
105 | 103,649 | ||||||
| Series B, 5.00%, 07/01/48 |
4,545 | 4,869,358 | ||||||
| Tarrant County Cultural Education Facilities Finance Corp., Refunding RB, 5.00%, 10/01/49 |
1,000 | 1,032,207 | ||||||
| Texas Transportation Commission, RB, Series A, 5.00%, 08/01/57 |
1,140 | 1,210,818 | ||||||
|
|
|
|||||||
| 16,552,396 | ||||||||
| S C H E D U L E O F I N V E S T M E N T S |
61 |
| Schedule of Investments (continued) April 30, 2022 |
BlackRock MuniVest Fund II, Inc. (MVT) (Percentages shown are based on Net Assets) |
| Security | Par (000) |
Value | ||||||
| Utah — 1.0% | ||||||||
| County of Utah UT, RB |
||||||||
| Series A, 4.00%, 05/15/43 |
$ | 215 | $ | 217,677 | ||||
| Series A, 3.00%, 05/15/50 |
985 | 794,539 | ||||||
| Salt Lake City Corp. Airport Revenue, ARB |
||||||||
| Series A, AMT, 5.00%, 07/01/47 |
915 | 959,270 | ||||||
| Series A, AMT, 5.00%, 07/01/48 |
875 | 919,140 | ||||||
|
|
|
|||||||
| 2,890,626 | ||||||||
| Virginia — 2.0% | ||||||||
| Front Royal & Warren County Industrial Development Authority, RB, 4.00%, 01/01/50 |
1,160 | 1,126,727 | ||||||
| Lexington Industrial Development Authority, RB, Series A, 5.00%, 01/01/48 |
820 | 853,731 | ||||||
| Virginia Small Business Financing Authority, Refunding RB |
||||||||
| AMT, Senior Lien, 5.25%, 01/01/32 |
1,615 | 1,624,682 | ||||||
| AMT, Senior Lien, 6.00%, 01/01/37 |
1,940 | 1,952,346 | ||||||
|
|
|
|||||||
| 5,557,486 | ||||||||
| Washington — 1.8% | ||||||||
| Port of Seattle Washington, ARB |
||||||||
| Series A, AMT, 5.00%, 05/01/43 |
1,465 | 1,528,747 | ||||||
| Series C, AMT, 5.00%, 04/01/40 |
755 | 780,297 | ||||||
| Washington Health Care Facilities Authority, RB, Series A, 5.75%, 01/01/23(b) |
2,290 | 2,349,451 | ||||||
| Washington Health Care Facilities Authority, Refunding RB, Series A, 4.00%, 08/01/44 |
340 | 327,225 | ||||||
|
|
|
|||||||
| 4,985,720 | ||||||||
| West Virginia — 0.5% | ||||||||
| West Virginia Parkways Authority, RB, Senior Lien, 4.00%, 06/01/51 |
1,455 | 1,456,599 | ||||||
|
|
|
|||||||
| Wyoming — 0.3% | ||||||||
| Wyoming Community Development Authority, RB, S/F Housing, Series 1, (FHLMC, FNMA, GNMA), 3.50%, 06/01/52 |
895 | 893,848 | ||||||
|
|
|
|||||||
| Total Municipal Bonds — 134.7% |
|
371,598,031 | ||||||
|
|
|
|||||||
| Municipal Bonds Transferred to Tender Option Bond Trusts(f) |
| |||||||
| California — 3.0% | ||||||||
| Bay Area Toll Authority, Refunding RB, 4.00%, 04/01/42(g) |
3,056 | 3,071,205 | ||||||
| Sacramento Area Flood Control Agency, Refunding SAB, 5.00%, 10/01/47 |
3,075 | 3,321,728 | ||||||
| San Diego County Regional Airport Authority, ARB(g) |
||||||||
| Series B, AMT, Subordinate, 4.00%, 07/01/56 |
579 | 534,297 | ||||||
| Series B, AMT, Subordinate, 5.00%, 07/01/56 |
1,274 | 1,358,679 | ||||||
|
|
|
|||||||
| 8,285,909 | ||||||||
| Colorado — 0.9% | ||||||||
| City & County of Denver Colorado Airport System Revenue, Refunding ARB, Series A, AMT, 5.25%, 12/01/48(g) |
2,252 | 2,433,471 | ||||||
|
|
|
|||||||
| Security | Par (000) |
Value | ||||||
| District of Columbia — 0.6% | ||||||||
| Metropolitan Washington Airports Authority Dulles Toll Road Revenue, Refunding RB, Series B, Subordinate, (AGM), 4.00%, 10/01/53 |
$ | 1,798 | $ | 1,779,836 | ||||
|
|
|
|||||||
| Georgia — 1.1% | ||||||||
| Dalton Whitfield County Joint Development Authority, RB, 4.00%, 08/15/48 |
1,821 | 1,781,912 | ||||||
| Georgia Housing & Finance Authority, Refunding RB, Series A, 3.60%, 12/01/44 |
1,442 | 1,365,535 | ||||||
|
|
|
|||||||
| 3,147,447 | ||||||||
| Illinois — 1.2% | ||||||||
| Illinois Finance Authority, Refunding RB |
||||||||
| Series C, 4.00%, 02/15/27 |
6 | 6,237 | ||||||
| Series C, 4.00%, 02/15/41 |
3,219 | 3,224,647 | ||||||
|
|
|
|||||||
| 3,230,884 | ||||||||
| Massachusetts — 2.5% | ||||||||
| Commonwealth of Massachusetts Transportation Fund Revenue, RB, Series A, 4.00%, 06/01/45 |
2,043 | 2,056,355 | ||||||
| Massachusetts Development Finance Agency, Refunding RB, 5.00%, 07/01/47 |
4,574 | 4,780,581 | ||||||
|
|
|
|||||||
| 6,836,936 | ||||||||
| New Jersey — 1.1% | ||||||||
| New Jersey Health Care Facilities Financing Authority, RB, 4.00%, 07/01/51 |
3,118 | 3,079,057 | ||||||
|
|
|
|||||||
| New York — 9.9% | ||||||||
| New York Power Authority, Refunding RB, Series A, 4.00%, 11/15/60 |
1,308 | 1,273,208 | ||||||
| New York State Dormitory Authority, Refunding RB, Series D, 4.00%, 02/15/47 |
5,956 | 5,902,239 | ||||||
| New York State Thruway Authority, Refunding RB, Series B, Subordinate, 4.00%, 01/01/50 |
2,884 | 2,802,202 | ||||||
| New York State Urban Development Corp., RB |
||||||||
| Series A, 4.00%, 03/15/46 |
6,617 | 6,712,648 | ||||||
| Series A, 4.00%, 03/15/49 |
7,899 | 7,831,628 | ||||||
| Port Authority of New York & New Jersey, Refunding ARB, 194th Series, 5.25%, 10/15/55 |
2,595 | 2,724,463 | ||||||
|
|
|
|||||||
| 27,246,388 | ||||||||
| North Carolina — 1.0% | ||||||||
| North Carolina Capital Facilities Finance Agency, Refunding RB, Series B, 5.00%, 10/01/25 |
2,550 | 2,757,543 | ||||||
|
|
|
|||||||
| Pennsylvania — 0.9% | ||||||||
| Pennsylvania Turnpike Commission, RB, Sub- Series A, 5.50%, 12/01/42 |
2,340 | 2,505,180 | ||||||
|
|
|
|||||||
| Rhode Island — 0.6% | ||||||||
| Narragansett Bay Commission, Refunding RB, Series A, 4.00%, 09/01/22 |
1,530 | 1,542,756 | ||||||
|
|
|
|||||||
| Texas — 4.9% | ||||||||
| Board of Regents of the University of Texas System, Refunding RB, Series B, 5.00%, 08/15/43 |
1,831 | 1,849,558 | ||||||
| City of San Antonio Texas Electric & Gas Systems Revenue, RB, Junior Lien, 5.00%, 02/01/23 |
2,520 | 2,574,978 | ||||||
| 62 | 2 0 2 2 B L A C K R O C K A N N U A L R E P O R T T O S H A R E H O L D E R S |
| Schedule of Investments (continued) April 30, 2022 |
BlackRock MuniVest Fund II, Inc. (MVT) (Percentages shown are based on Net Assets) |
| Security | Par (000) |
Value | ||||||
|
|
||||||||
| Texas (continued) | ||||||||
| Lower Colorado River Authority, Refunding, RB, 4.00%, 05/15/43 |
$ | 2,030 | $ | 2,031,685 | ||||
| Texas Water Development Board, RB, Series A, 4.00%, 10/15/49 |
6,900 | 7,121,537 | ||||||
|
|
|
|||||||
| 13,577,758 | ||||||||
| Virginia — 3.1% | ||||||||
| Fairfax County Industrial Development Authority, 4.00%, 05/15/42 |
1,771 | 1,814,758 | ||||||
| Hampton Roads Transportation Accountability Commission, RB, Series A, Senior Lien, 4.00%, 07/01/60(g) |
2,145 | 2,077,804 | ||||||
| Virginia Small Business Financing Authority, Refunding RB, Series A, 4.00%, 12/01/49 |
4,780 | 4,658,311 | ||||||
|
|
|
|||||||
| 8,550,873 | ||||||||
| Wisconsin — 2.1% | ||||||||
| Wisconsin Health & Educational Facilities Authority, Refunding RB |
||||||||
| 4.00%, 12/01/46 |
2,833 | 2,842,280 | ||||||
| 4.00%, 12/15/49(g) |
2,940 | 2,856,039 | ||||||
|
|
|
|||||||
| 5,698,319 | ||||||||
|
|
|
|||||||
| Total Municipal Bonds Transferred to Tender Option Bond Trusts — 32.9% |
|
90,672,357 | ||||||
|
|
|
|||||||
| Total Long-Term Investments — 167.6% |
|
462,270,388 | ||||||
|
|
|
|||||||
| Shares | ||||||||
|
|
||||||||
| Short-Term Securities |
||||||||
| Money Market Funds — 5.2% | ||||||||
| BlackRock Liquidity Funds, MuniCash, Institutional Class, 0.25%(h)(i) |
14,235,220 | 14,235,220 | ||||||
|
|
|
|||||||
| Total Short-Term Securities — 5.2% |
|
14,235,220 | ||||||
|
|
|
|||||||
| Total Investments — 172.8% |
|
476,505,608 | ||||||
| Other Assets Less Liabilities — 0.0% |
|
97,203 | ||||||
| Liability for TOB Trust Certificates, Including Interest Expense and Fees Payable — (22.0)% |
|
(60,773,846 | ) | |||||
| VMTP Shares at Liquidation Value, Net of Deferred Offering Costs — (50.8)% |
|
(140,000,000 | ) | |||||
|
|
|
|||||||
| Net Assets Applicable to Common Shares — 100.0% |
|
$ | 275,828,965 | |||||
|
|
|
|||||||
| (a) | Security exempt from registration pursuant to Rule 144A under the Securities Act of 1933, as amended. These securities may be resold in transactions exempt from registration to qualified institutional investors. |
| (b) | U.S. Government securities held in escrow, are used to pay interest on this security as well as to retire the bond in full at the date indicated, typically at a premium to par. |
| (c) | Zero-coupon bond. |
| (d) | Variable rate security. Interest rate resets periodically. The rate shown is the effective interest rate as of period end. Security description also includes the reference rate and spread if published and available. |
| (e) | Security is collateralized by municipal bonds or U.S. Treasury obligations. |
| (f) | Represent bonds transferred to a TOB Trust in exchange of cash and residual certificates received by the Fund. These bonds serve as collateral in a secured borrowing. See Note 4 of the Notes to Financial Statements for details. |
| (g) | All or a portion of the security is subject to a recourse agreement. The aggregate maximum potential amount the Fund could ultimately be required to pay under the agreements, which expire between April 1, 2025 to July 1, 2029, is $8,199,786. See Note 4 of the Notes to Financial Statements for details. |
| (h) | Affiliate of the Fund. |
| (i) | Annualized 7-day yield as of period end. |
Affiliates
Investments in issuers considered to be affiliate(s) of the Fund during the year ended April 30, 2022 for purposes of Section 2(a)(3) of the Investment Company Act of 1940, as amended, were as follows:
| Affiliated Issuer | Value at 04/30/21 |
Purchases at Cost |
Proceeds from Sales |
Net Realized Gain (Loss) |
Change in Unrealized Appreciation (Depreciation) |
Value at 04/30/22 |
Shares Held at 04/30/22 |
Income | Capital Gain Distributions from Underlying Funds |
|||||||||||||||||||||||||||
| BlackRock Liquidity Funds, MuniCash, Institutional Class |
$ | 655,154 | $ | 13,581,350 | (a) | $ | — | $ | (2,622 | ) | $ | 1,338 | $ | 14,235,220 | 14,235,220 | $ | 4,185 | $ | — | |||||||||||||||||
|
|
|
|
|
|
|
|
|
|
|
|||||||||||||||||||||||||||
| (a) | Represents net amount purchased (sold). |
| S C H E D U L E O F I N V E S T M E N T S |
63 |
| Schedule of Investments (continued) April 30, 2022 |
BlackRock MuniVest Fund II, Inc. (MVT) |
Derivative Financial Instruments Outstanding as of Period End
Futures Contracts
|
|
||||||||||||||||
| Description | Number of Contracts |
Expiration Date |
Notional Amount (000) |
Value/ Unrealized Appreciation (Depreciation) |
||||||||||||
|
|
||||||||||||||||
| Short Contracts |
||||||||||||||||
| 10-Year U.S. Treasury Note |
110 | 06/21/22 | $ | 13,095 | $ | 526,014 | ||||||||||
| U.S. Long Bond |
123 | 06/21/22 | 17,282 | 872,573 | ||||||||||||
| 5-Year U.S. Treasury Note |
98 | 06/30/22 | 11,031 | 296,296 | ||||||||||||
|
|
|
|||||||||||||||
| $ | 1,694,883 | |||||||||||||||
|
|
|
|||||||||||||||
Derivative Financial Instruments Categorized by Risk Exposure
As of period end, the fair values of derivative financial instruments located in the Statements of Assets and Liabilities were as follows:
|
|
||||||||||||||||||||||||||||
| Commodity Contracts |
Credit Contracts |
Equity Contracts |
Foreign Currency Exchange Contracts |
Interest Rate |
Other Contracts |
Total | ||||||||||||||||||||||
|
|
||||||||||||||||||||||||||||
| Assets — Derivative Financial Instruments |
||||||||||||||||||||||||||||
| Futures contracts |
||||||||||||||||||||||||||||
| Unrealized appreciation on futures contracts(a) |
$ | — | $ | — | $ | — | $ | — | $ | 1,694,883 | $ | — | $ | 1,694,883 | ||||||||||||||
|
|
|
|
|
|
|
|
|
|
|
|
|
|
|
|||||||||||||||
| (a) | Net cumulative unrealized appreciation (depreciation) on futures contracts and centrally cleared swaps, if any, are reported in the Schedule of Investments. In the Statements of Assets and Liabilities, only current day’s variation margin is reported in receivables or payables and the net cumulative unrealized appreciation (depreciation) is included in accumulated earnings (loss). |
For the period ended April 30, 2022, the effect of derivative financial instruments in the Statements of Operations was as follows:
|
|
||||||||||||||||||||||||||||
| Commodity Contracts |
Credit Contracts |
Equity Contracts |
Foreign Currency Exchange Contracts |
Interest Rate |
Other Contracts |
Total | ||||||||||||||||||||||
|
|
||||||||||||||||||||||||||||
| Net Realized Gain (Loss) from: |
||||||||||||||||||||||||||||
| Futures contracts |
$ | — | $ | — | $ | — | $ | — | $ | 189,101 | $ | — | $ | 189,101 | ||||||||||||||
|
|
|
|
|
|
|
|
|
|
|
|
|
|
|
|||||||||||||||
| Net Change in Unrealized Appreciation (Depreciation) on: |
||||||||||||||||||||||||||||
| Futures contracts |
$ | — | $ | — | $ | — | $ | — | $ | 1,786,485 | $ | — | $ | 1,786,485 | ||||||||||||||
|
|
|
|
|
|
|
|
|
|
|
|
|
|
|
|||||||||||||||
Average Quarterly Balances of Outstanding Derivative Financial Instruments
|
|
||||
| Futures contracts: |
||||
| Average notional value of contracts — short |
$ | 20,644,781 | ||
|
|
||||
For more information about the Fund’s investment risks regarding derivative financial instruments, refer to the Notes to Financial Statements.
Fair Value Hierarchy as of Period End
Various inputs are used in determining the fair value of financial instruments. For a description of the input levels and information about the Fund’s policy regarding valuation of financial instruments, refer to the Notes to Financial Statements.
The following table summarizes the Fund’s financial instruments categorized in the fair value hierarchy. The breakdown of the Fund’s financial instruments into major categories is disclosed in the Schedule of Investments above.
|
|
||||||||||||||||
| Level 1 | Level 2 | Level 3 | Total | |||||||||||||
|
|
||||||||||||||||
| Assets |
||||||||||||||||
| Investments |
||||||||||||||||
| Long-Term Investments |
||||||||||||||||
| Municipal Bonds |
$ | — | $ | 371,598,031 | $ | — | $ | 371,598,031 | ||||||||
| Municipal Bonds Transferred to Tender Option Bond Trusts |
— | 90,672,357 | — | 90,672,357 | ||||||||||||
| 64 | 2 0 2 2 B L A C K R O C K A N N U A L R E P O R T T O S H A R E H O L D E R S |
| Schedule of Investments (continued) April 30, 2022 |
BlackRock MuniVest Fund II, Inc. (MVT) |
Fair Value Hierarchy as of Period End (continued)
|
|
||||||||||||||||
| Level 1 | Level 2 | Level 3 | Total | |||||||||||||
|
|
||||||||||||||||
| Short-Term Securities |
||||||||||||||||
| Money Market Funds |
$ | 14,235,220 | $ | — | $ | — | $ | 14,235,220 | ||||||||
|
|
|
|
|
|
|
|
|
|||||||||
| $ | 14,235,220 | $ | 462,270,388 | $ | — | $ | 476,505,608 | |||||||||
|
|
|
|
|
|
|
|
|
|||||||||
| Derivative Financial Instruments(a) |
||||||||||||||||
| Assets |
||||||||||||||||
| Interest Rate Contracts |
$ | 1,694,883 | $ | — | $ | — | $ | 1,694,883 | ||||||||
|
|
|
|
|
|
|
|
|
|||||||||
| (a) | Derivative financial instruments are futures contracts. Futures contracts are valued at the unrealized appreciation (depreciation) on the instrument. |
The Fund may hold assets and/or liabilities in which the fair value approximates the carrying amount for financial statement purposes. As of period end, such assets and/or liabilities are categorized within the fair value hierarchy as follows:
|
|
||||||||||||||||
| Level 1 | Level 2 | Level 3 | Total | |||||||||||||
|
|
||||||||||||||||
| Liabilities |
||||||||||||||||
| TOB Trust Certificates |
$ | — | $ | (60,725,900 | ) | $ | — | $ | (60,725,900 | ) | ||||||
| VMTP Shares at Liquidation Value |
— | (140,000,000 | ) | — | (140,000,000 | ) | ||||||||||
|
|
|
|
|
|
|
|
|
|||||||||
| $ | — | $ | (200,725,900 | ) | $ | — | $ | (200,725,900 | ) | |||||||
|
|
|
|
|
|
|
|
|
|||||||||
See notes to financial statements.
| S C H E D U L E O F I N V E S T M E N T S |
65 |
Statements of Assets and Liabilities
April 30, 2022
| MUA | MUI | MHD | MVT | |||||||||||||
|
|
||||||||||||||||
| ASSETS |
||||||||||||||||
| Investments, at value — unaffiliated(a) |
$ | 675,327,304 | $ | 1,734,847,577 | $ | 1,276,798,161 | $ | 462,270,388 | ||||||||
| Investments, at value — affiliated(b) |
6,592,558 | 309,107 | 11,998,307 | 14,235,220 | ||||||||||||
| Cash |
— | 617,292 | — | — | ||||||||||||
| Cash pledged for futures contracts |
1,126,000 | 3,449,000 | 1,969,000 | 743,000 | ||||||||||||
| Receivables: |
||||||||||||||||
| Investments sold |
835,104 | 18,425,795 | 4,156,407 | 1,124,722 | ||||||||||||
| Dividends — affiliated |
1,949 | 1,172 | 1,411 | 2,888 | ||||||||||||
| Interest — unaffiliated |
10,227,820 | 24,183,481 | 16,700,102 | 6,046,081 | ||||||||||||
| Variation margin on futures contracts |
398,288 | 706,311 | 716,362 | 268,300 | ||||||||||||
| Deferred offering costs |
66,159 | — | — | — | ||||||||||||
| Prepaid expenses |
93,874 | 13,627 | — | — | ||||||||||||
|
|
|
|
|
|
|
|
|
|||||||||
| Total assets |
694,669,056 | 1,782,553,362 | 1,312,339,750 | 484,690,599 | ||||||||||||
|
|
|
|
|
|
|
|
|
|||||||||
| ACCRUED LIABILITIES |
||||||||||||||||
| Bank overdraft |
4,790 | — | 1,185,485 | 458,059 | ||||||||||||
| Payables: |
||||||||||||||||
| Investments purchased |
— | 33,806,796 | 15,611,712 | 6,041,301 | ||||||||||||
| TOB Trust |
— | 6,673,947 | 6,262,204 | — | ||||||||||||
| Accounting services fees |
49,160 | 126,575 | 85,262 | 44,262 | ||||||||||||
| Custodian fees |
3,364 | 11,960 | 6,979 | 3,025 | ||||||||||||
| Income dividend distributions — Common Shares |
1,741,836 | 3,962,809 | 3,228,086 | 1,250,133 | ||||||||||||
| Interest expense and fees |
43,413 | 142,919 | 150,294 | 47,946 | ||||||||||||
| Investment advisory fees |
328,323 | 794,670 | 596,661 | 199,950 | ||||||||||||
| Offering costs |
73,586 | — | — | — | ||||||||||||
| Directors’ and Officer’s fees |
2,097 | 579,675 | 49,098 | 1,317 | ||||||||||||
| Other accrued expenses |
15,249 | 31,922 | 28,913 | 12,341 | ||||||||||||
| Professional fees |
235,068 | 111,743 | 76,302 | 63,061 | ||||||||||||
| Reorganization costs |
— | 395,681 | 51,472 | — | ||||||||||||
| Transfer agent fees |
19,658 | 24,262 | 17,550 | 14,339 | ||||||||||||
|
|
|
|
|
|
|
|
|
|||||||||
| Total accrued liabilities |
2,516,544 | 46,662,959 | 27,350,018 | 8,135,734 | ||||||||||||
|
|
|
|
|
|
|
|
|
|||||||||
| OTHER LIABILITIES |
||||||||||||||||
| TOB Trust Certificates |
41,711,683 | 180,857,841 | 176,042,422 | 60,725,900 | ||||||||||||
| VRDP Shares, at liquidation value of $ 100,000 per share, net of deferred offering costs(c)(d)(e) |
174,914,674 | 561,375,145 | — | — | ||||||||||||
| VMTP Shares, at liquidation value of $ 100,000 per share, net of deferred offering costs(c)(d)(e) |
— | — | 347,800,000 | 140,000,000 | ||||||||||||
|
|
|
|
|
|
|
|
|
|||||||||
| Total other liabilities |
216,626,357 | 742,232,986 | 523,842,422 | 200,725,900 | ||||||||||||
|
|
|
|
|
|
|
|
|
|||||||||
| Total liabilities |
219,142,901 | 788,895,945 | 551,192,440 | 208,861,634 | ||||||||||||
|
|
|
|
|
|
|
|
|
|||||||||
| NET ASSETS APPLICABLE TO COMMON SHAREHOLDERS |
$ | 475,526,155 | $ | 993,657,417 | $ | 761,147,310 | $ | 275,828,965 | ||||||||
|
|
|
|
|
|
|
|
|
|||||||||
| NET ASSETS APPLICABLE TO COMMON SHAREHOLDERS CONSIST OF |
||||||||||||||||
| Paid-in capital(f)(g)(h) |
$ | 512,580,433 | $ | 1,056,229,362 | $ | 808,007,673 | $ | 290,433,291 | ||||||||
| Accumulated loss |
(37,054,278 | ) | (62,571,945 | ) | (46,860,363 | ) | (14,604,326 | ) | ||||||||
|
|
|
|
|
|
|
|
|
|||||||||
| NET ASSETS APPLICABLE TO COMMON SHAREHOLDERS |
$ | 475,526,155 | $ | 993,657,417 | $ | 761,147,310 | $ | 275,828,965 | ||||||||
|
|
|
|
|
|
|
|
|
|||||||||
| Net asset value per Common Share |
$ | 12.42 | $ | 13.45 | $ | 14.27 | $ | 12.91 | ||||||||
|
|
|
|
|
|
|
|
|
|||||||||
| (a) Investments, at cost — unaffiliated |
$ | 716,005,663 | $ | 1,787,856,626 | $ | 1,303,778,486 | $ | 473,658,579 | ||||||||
| (b) Investments, at cost — affiliated |
$ | 6,591,899 | $ | 309,107 | $ | 11,997,938 | $ | 14,233,796 | ||||||||
| (c) Preferred Shares outstanding |
1,750 | 5,617 | 3,478 | 1,400 | ||||||||||||
| (d) Preferred Shares authorized |
1,750 | 18,417 | 8,478 | 8,400 | ||||||||||||
| (e) Par value per Preferred Share |
$ | 0.10 | $ | 0.10 | $ | 0.10 | $ | 0.10 | ||||||||
| (f) Common Shares outstanding |
38,282,118 | 73,870,971 | 53,356,788 | 21,369,803 | ||||||||||||
| (g) Common Shares authorized |
199,998,250 | 199,981,583 | 199,991,522 | 199,991,600 | ||||||||||||
| (h) Par value per Common Share |
$ | 0.10 | $ | 0.10 | $ | 0.10 | $ | 0.10 | ||||||||
See notes to financial statements.
| 66 | 2 0 2 2 B L A C K R O C K A N N U A L R E P O R T T O S H A R E H O L D E R S |
Year Ended April 30, 2022
| MUA | MUI | MHD | MVT | |||||||||||||
|
|
||||||||||||||||
| INVESTMENT INCOME |
||||||||||||||||
| Dividends — affiliated |
$ | 7,876 | $ | 2,552 | $ | 3,807 | $ | 4,185 | ||||||||
| Interest — unaffiliated |
27,097,983 | 33,155,263 | 52,163,783 | 18,756,783 | ||||||||||||
|
|
|
|
|
|
|
|
|
|||||||||
| Total investment income |
27,105,859 | 33,157,815 | 52,167,590 | 18,760,968 | ||||||||||||
|
|
|
|
|
|
|
|
|
|||||||||
| EXPENSES |
||||||||||||||||
| Investment advisory |
3,753,495 | 5,609,699 | 8,010,559 | 2,632,912 | ||||||||||||
| Accounting services |
101,878 | 140,602 | 183,276 | 91,573 | ||||||||||||
| Offering |
98,605 | — | — | — | ||||||||||||
| Transfer agent |
59,884 | 46,063 | 52,546 | 31,844 | ||||||||||||
| Directors and Officer |
32,980 | 13,808 | 52,977 | 19,806 | ||||||||||||
| Registration |
12,528 | 13,122 | 11,432 | 8,400 | ||||||||||||
| Custodian |
6,801 | 7,173 | 8,741 | 6,877 | ||||||||||||
| Liquidity fees |
6,690 | 3,455 | — | — | ||||||||||||
| Remarketing fees on Preferred Shares |
6,569 | 3,392 | — | — | ||||||||||||
| Reorganization |
— | 415,990 | — | — | ||||||||||||
| Miscellaneous |
173,720 | 155,245 | 231,370 | 144,730 | ||||||||||||
|
|
|
|
|
|
|
|
|
|||||||||
| Total expenses excluding interest expense, fees and amortization of offering costs |
4,253,150 | 6,408,549 | 8,550,901 | 2,936,142 | ||||||||||||
| Interest expense, fees and amortization of offering costs(a) |
1,183,677 | 4,064,056 | 5,096,859 | 1,900,322 | ||||||||||||
|
|
|
|
|
|
|
|
|
|||||||||
| Total expenses |
5,436,827 | 10,472,605 | 13,647,760 | 4,836,464 | ||||||||||||
| Less: |
||||||||||||||||
| Fees waived and/or reimbursed by the Manager |
(5,207 | ) | (45,629 | ) | (149,753 | ) | (2,158 | ) | ||||||||
|
|
|
|
|
|
|
|
|
|||||||||
| Total expenses after fees waived and/or reimbursed |
5,431,620 | 10,426,976 | 13,498,007 | 4,834,306 | ||||||||||||
|
|
|
|
|
|
|
|
|
|||||||||
| Net investment income |
21,674,239 | 22,730,839 | 38,669,583 | 13,926,662 | ||||||||||||
|
|
|
|
|
|
|
|
|
|||||||||
| REALIZED AND UNREALIZED GAIN (LOSS) |
||||||||||||||||
| Net realized gain (loss) from: |
||||||||||||||||
| Investments — unaffiliated |
3,614,029 | (6,975,329 | ) | (65,024 | ) | 464,210 | ||||||||||
| Investments — affiliated |
(13,731 | ) | (875 | ) | (4,273 | ) | (2,622 | ) | ||||||||
| Futures contracts |
296,340 | 1,744,066 | 615,457 | 189,101 | ||||||||||||
|
|
|
|
|
|
|
|
|
|||||||||
| 3,896,638 | (5,232,138 | ) | 546,160 | 650,689 | ||||||||||||
|
|
|
|
|
|
|
|
|
|||||||||
| Net change in unrealized appreciation (depreciation) on: |
||||||||||||||||
| Investments — unaffiliated |
(91,533,190 | ) | (117,533,094 | ) | (167,087,429 | ) | (58,916,303 | ) | ||||||||
| Investments — affiliated |
659 | — | 369 | 1,338 | ||||||||||||
| Futures contracts |
2,824,866 | 4,202,988 | 4,746,936 | 1,786,485 | ||||||||||||
|
|
|
|
|
|
|
|
|
|||||||||
| (88,707,665 | ) | (113,330,106 | ) | (162,340,124 | ) | (57,128,480 | ) | |||||||||
|
|
|
|
|
|
|
|
|
|||||||||
| Net realized and unrealized loss |
(84,811,027 | ) | (118,562,244 | ) | (161,793,964 | ) | (56,477,791 | ) | ||||||||
|
|
|
|
|
|
|
|
|
|||||||||
| NET DECREASE IN NET ASSETS APPLICABLE TO COMMON SHAREHOLDERS RESULTING FROM OPERATIONS |
$ | (63,136,788 | ) | $ | (95,831,405 | ) | $ | (123,124,381 | ) | $ | (42,551,129 | ) | ||||
|
|
|
|
|
|
|
|
|
|||||||||
| (a) | Related to TOB Trusts, VRDP Shares and/or VMTP Shares. |
See notes to financial statements.
| F I N A N C I A L S T A T E M E N T S |
67 |
Statements of Changes in Net Assets
| MUA | MUI | |||||||||||||||
|
|
|
|
|
|||||||||||||
| Year Ended April 30, | Year Ended April 30, | |||||||||||||||
|
|
|
|
|
|||||||||||||
| 2022 | 2021 | 2022 | 2021 | |||||||||||||
|
|
||||||||||||||||
| INCREASE (DECREASE) IN NET ASSETS APPLICABLE TO COMMON SHAREHOLDERS |
||||||||||||||||
| OPERATIONS |
||||||||||||||||
| Net investment income |
$ | 21,674,239 | $ | 22,721,507 | $ | 22,730,839 | $ | 24,510,091 | ||||||||
| Net realized gain (loss) |
3,896,638 | 2,825,504 | (5,232,138 | ) | (45,151 | ) | ||||||||||
| Net change in unrealized appreciation (depreciation) |
(88,707,665 | ) | 68,045,700 | (113,330,106 | ) | 56,855,315 | ||||||||||
|
|
|
|
|
|
|
|
|
|||||||||
| Net increase (decrease) in net assets applicable to Common Shareholders resulting from operations |
(63,136,788 | ) | 93,592,711 | (95,831,405 | ) | 81,320,255 | ||||||||||
|
|
|
|
|
|
|
|
|
|||||||||
| DISTRIBUTIONS TO COMMON SHAREHOLDERS(a) |
||||||||||||||||
| Decrease in net assets resulting from distributions to Common Shareholders |
(27,559,514 | ) | (23,399,374 | ) | (24,815,980 | ) | (24,222,388 | ) | ||||||||
|
|
|
|
|
|
|
|
|
|||||||||
| CAPITAL SHARE TRANSACTIONS |
||||||||||||||||
| Net proceeds from the issuance of common shares |
12,810,577 | 17,859,043 | — | — | ||||||||||||
| Net proceeds from the issuance of common shares due to reorganization |
— | — | 497,273,284 | — | ||||||||||||
| Reinvestment of common distributions |
1,039,293 | 889,656 | — | — | ||||||||||||
| Redemption of common shares |
— | — | (138 | ) | — | |||||||||||
|
|
|
|
|
|
|
|
|
|||||||||
| Net increase in net assets derived from capital share transactions |
13,849,870 | 18,748,699 | 497,273,146 | — | ||||||||||||
|
|
|
|
|
|
|
|
|
|||||||||
| NET ASSETS APPLICABLE TO COMMON SHAREHOLDERS |
||||||||||||||||
| Total increase (decrease) in net assets applicable to Common Shareholders |
(76,846,432 | ) | 88,942,036 | 376,625,761 | 57,097,867 | |||||||||||
| Beginning of year |
552,372,587 | 463,430,551 | 617,031,656 | 559,933,789 | ||||||||||||
|
|
|
|
|
|
|
|
|
|||||||||
| End of year |
$ | 475,526,155 | $ | 552,372,587 | $ | 993,657,417 | $ | 617,031,656 | ||||||||
|
|
|
|
|
|
|
|
|
|||||||||
| (a) | Distributions for annual periods determined in accordance with U.S. federal income tax regulations. |
See notes to financial statements.
| 68 | 2 0 2 2 B L A C K R O C K A N N U A L R E P O R T T O S H A R E H O L D E R S |
Statements of Changes in Net Assets (continued)
| MHD | MVT | |||||||||||||||
|
|
|
|
|
|||||||||||||
| Year Ended April 30, | Year Ended April 30, | |||||||||||||||
|
|
|
|
|
|||||||||||||
| 2022 | 2021 | 2022 | 2021 | |||||||||||||
|
|
||||||||||||||||
| INCREASE (DECREASE) IN NET ASSETS APPLICABLE TO COMMON SHAREHOLDERS |
||||||||||||||||
| OPERATIONS |
||||||||||||||||
| Net investment income |
$ | 38,669,583 | $ | 15,555,286 | $ | 13,926,662 | $ | 15,359,842 | ||||||||
| Net realized gain |
546,160 | 527,251 | 650,689 | 527,383 | ||||||||||||
| Net change in unrealized appreciation (depreciation) |
(162,340,124 | ) | 38,716,284 | (57,128,480 | ) | 41,455,180 | ||||||||||
|
|
|
|
|
|
|
|
|
|||||||||
| Net increase (decrease) in net assets applicable to Common Shareholders resulting from operations |
(123,124,381 | ) | 54,798,821 | (42,551,129 | ) | 57,342,405 | ||||||||||
|
|
|
|
|
|
|
|
|
|||||||||
| DISTRIBUTIONS TO COMMON SHAREHOLDERS(a) |
||||||||||||||||
| Decrease in net assets resulting from distributions to Common Shareholders |
(38,806,925 | ) | (12,698,865 | ) | (14,996,026 | ) | (14,660,494 | ) | ||||||||
|
|
|
|
|
|
|
|
|
|||||||||
| CAPITAL SHARE TRANSACTIONS |
||||||||||||||||
| Net proceeds from the issuance of common shares due to reorganization |
— | 665,215,154 | — | — | ||||||||||||
| Reinvestment of common distributions |
— | — | 471,214 | — | ||||||||||||
| Redemption of common shares |
— | (424 | ) | — | — | |||||||||||
|
|
|
|
|
|
|
|
|
|||||||||
| Net increase in net assets derived from capital share transactions |
— | 665,214,730 | 471,214 | — | ||||||||||||
|
|
|
|
|
|
|
|
|
|||||||||
| NET ASSETS APPLICABLE TO COMMON SHAREHOLDERS |
||||||||||||||||
| Total increase (decrease) in net assets applicable to Common Shareholders |
(161,931,306 | ) | 707,314,686 | (57,075,941 | ) | 42,681,911 | ||||||||||
| Beginning of year |
923,078,616 | 215,763,930 | 332,904,906 | 290,222,995 | ||||||||||||
|
|
|
|
|
|
|
|
|
|||||||||
| End of year |
$ | 761,147,310 | $ | 923,078,616 | $ | 275,828,965 | $ | 332,904,906 | ||||||||
|
|
|
|
|
|
|
|
|
|||||||||
| (a) | Distributions for annual periods determined in accordance with U.S. federal income tax regulations. |
See notes to financial statements.
| F I N A N C I A L S T A T E M E N T S |
69 |
Year Ended April 30, 2022
| MUA | MUI | MHD | MVT | |||||||||||||
|
|
||||||||||||||||
| CASH PROVIDED BY (USED FOR) OPERATING ACTIVITIES |
||||||||||||||||
| Net decrease in net assets resulting from operations |
$ | (63,136,788 | ) | $ | (95,831,405 | ) | $ | (123,124,381 | ) | $ | (42,551,129 | ) | ||||
| Adjustments to reconcile net decrease in net assets resulting from operations to net cash provided by (used for) operating activities |
||||||||||||||||
| Proceeds from sales of long-term investments |
155,519,525 | 238,881,861 | 230,216,732 | 73,567,681 | ||||||||||||
| Purchases of long-term investments |
(303,864,530 | ) | (257,551,203 | ) | (205,556,972 | ) | (66,423,815 | ) | ||||||||
| Net purchases of short-term securities |
(7,873,055 | ) | (183,463 | ) | (4,158,310 | ) | (13,581,350 | ) | ||||||||
| Amortization of premium and accretion of discount on investments and other fees |
(662,579 | ) | 8,400,276 | 4,721,412 | 2,122,789 | |||||||||||
| Net realized (gain) loss on investments |
(3,600,298 | ) | 6,976,204 | 69,297 | (461,588 | ) | ||||||||||
| Net unrealized depreciation on investments |
91,532,531 | 117,533,094 | 167,087,060 | 58,914,965 | ||||||||||||
| (Increase) Decrease in Assets |
||||||||||||||||
| Receivables |
||||||||||||||||
| Dividends — affiliated |
(1,928 | ) | (811 | ) | (1,326 | ) | (2,874 | ) | ||||||||
| Interest — unaffiliated |
(1,488,559 | ) | (769,787 | ) | 1,470,696 | 480,419 | ||||||||||
| Variation margin on futures contracts |
(398,288 | ) | (706,311 | ) | (716,362 | ) | (268,300 | ) | ||||||||
| Prepaid expenses |
(93,874 | ) | 59,827 | 253,623 | 18,849 | |||||||||||
| Deferred offering costs |
47,679 | — | — | — | ||||||||||||
| Increase (Decrease) in Liabilities |
||||||||||||||||
| Payables |
||||||||||||||||
| Accounting services fees |
(17,683 | ) | (26,022 | ) | (96,280 | ) | (17,744 | ) | ||||||||
| Custodian fees |
(3,767 | ) | (5,704 | ) | (12,586 | ) | (1,201 | ) | ||||||||
| Interest expense and fees |
16,964 | 120,451 | 87,349 | 29,733 | ||||||||||||
| Investment advisory fees |
49,157 | (200,488 | ) | (61,038 | ) | (17,765 | ) | |||||||||
| Directors’ and Officer’s fees |
966 | (101,354 | ) | (13,207 | ) | 373 | ||||||||||
| Other accrued expenses |
1,668 | (96,529 | ) | 7,670 | 5,759 | |||||||||||
| Professional fees |
148,565 | (17,419 | ) | (97,405 | ) | (6,471 | ) | |||||||||
| Reorganization costs |
— | 217,790 | (370,513 | ) | — | |||||||||||
| Transfer agent fees |
3,147 | 3,359 | (6,517 | ) | 3,383 | |||||||||||
| Variation margin on futures contracts |
(14,451 | ) | (40,067 | ) | (39,302 | ) | (14,810 | ) | ||||||||
|
|
|
|
|
|
|
|
|
|||||||||
| Net cash provided by (used for) operating activities |
(133,835,598 | ) | 16,662,299 | 69,659,640 | 11,796,904 | |||||||||||
|
|
|
|
|
|
|
|
|
|||||||||
| CASH PROVIDED BY (USED FOR) FINANCING ACTIVITIES |
||||||||||||||||
| Cash dividends paid to Common Shareholders |
(26,735,590 | ) | (24,815,979 | ) | (38,806,925 | ) | (14,523,062 | ) | ||||||||
| Payments for offering costs |
6,911 | — | — | — | ||||||||||||
| Repayments of TOB Trust Certificates |
(33,603,734 | ) | (18,334,898 | ) | (68,958,455 | ) | (11,420,373 | ) | ||||||||
| Repayments of Loan for TOB Trust Certificates |
— | (1,113,222 | ) | (4,095,777 | ) | (332,251 | ) | |||||||||
| Payments on Common Shares redeemed |
— | (138 | ) | — | — | |||||||||||
| Proceeds from issuance of VRDP Shares |
175,000,000 | — | — | — | ||||||||||||
| Proceeds from TOB Trust Certificates |
6,534,082 | 24,384,691 | 38,159,562 | 14,148,910 | ||||||||||||
| Proceeds from Loan for TOB Trust Certificates |
— | 1,113,222 | 4,095,777 | 332,251 | ||||||||||||
| Increase in bank overdraft |
4,790 | — | 1,185,485 | 458,059 | ||||||||||||
| Amortization of deferred offering costs |
1,304 | 836 | — | — | ||||||||||||
| Proceeds from issuance of Common Shares |
13,455,273 | — | — | — | ||||||||||||
|
|
|
|
|
|
|
|
|
|||||||||
| Net cash provided by (used for) for financing activities |
134,663,036 | (18,765,488 | ) | (68,420,333 | ) | (11,336,466 | ) | |||||||||
|
|
|
|
|
|
|
|
|
|||||||||
| CASH |
||||||||||||||||
| Net increase (decrease) in restricted and unrestricted cash |
827,438 | (2,103,189 | ) | 1,239,307 | 460,438 | |||||||||||
| Restricted and unrestricted cash at beginning of year |
298,562 | 6,169,481 | 729,693 | 282,562 | ||||||||||||
|
|
|
|
|
|
|
|
|
|||||||||
| Restricted and unrestricted cash at end of year |
$ | 1,126,000 | $ | 4,066,292 | $ | 1,969,000 | $ | 743,000 | ||||||||
|
|
|
|
|
|
|
|
|
|||||||||
| SUPPLEMENTAL DISCLOSURE OF CASH FLOW INFORMATION |
||||||||||||||||
| Cash paid during the year for interest expense |
$ | 1,165,409 | $ | 3,942,769 | $ | 5,009,510 | $ | 1,870,589 | ||||||||
|
|
|
|
|
|
|
|
|
|||||||||
| NON-CASH FINANCING ACTIVITIES |
||||||||||||||||
| Reinvestment of common distributions |
$ | 1,039,293 | $ | — | $ | — | $ | 471,214 | ||||||||
|
|
|
|
|
|
|
|
|
|||||||||
| Fair value of investments acquired through reorganization |
— | 846,552,183 | — | — | ||||||||||||
|
|
|
|
|
|
|
|
|
|||||||||
| Net proceeds from the issuance of common shares due to reorganization |
— | 497,273,284 | — | — | ||||||||||||
|
|
|
|
|
|
|
|
|
|||||||||
| Net proceeds from the issuance of preferred shares due to reorganization |
— | 274,600,000 | — | — | ||||||||||||
|
|
|
|
|
|
|
|
|
|||||||||
| 70 | 2 0 2 2 B L A C K R O C K A N N U A L R E P O R T T O S H A R E H O L D E R S |
Statements of Cash Flows (continued)
Year Ended April 30, 2022
| MUA | MUI | MHD | MVT | |||||||||||||
|
|
||||||||||||||||
| RECONCILIATION OF RESTRICTED AND UNRESTRICTED CASH AT THE END OF YEAR TO THE STATEMENTS OF ASSETS AND LIABILITIES |
||||||||||||||||
| Cash |
$ | — | $ | 617,292 | $ | — | $ | — | ||||||||
| Cash pledged |
||||||||||||||||
| Futures contracts |
1,126,000 | 3,449,000 | 1,969,000 | 743,000 | ||||||||||||
|
|
|
|
|
|
|
|
|
|||||||||
| $ | 1,126,000 | $ | 4,066,292 | $ | 1,969,000 | $ | 743,000 | |||||||||
|
|
|
|
|
|
|
|
|
|||||||||
See notes to financial statements.
| F I N A N C I A L S T A T E M E N T S |
71 |
(For a share outstanding throughout each period)
| MUA | ||||||||||||||||||||
| Year Ended April 30, | ||||||||||||||||||||
| 2022 |
2021 |
2020 | 2019 | 2018 | ||||||||||||||||
| Net asset value, beginning of year |
$ | 14.77 | $ | 12.83 | $ | 14.14 | $ | 14.01 | $ | 14.07 | ||||||||||
|
|
|
|
|
|
|
|
|
|
|
|||||||||||
| Net investment income(a) |
0.57 | 0.62 | 0.63 | 0.67 | 0.68 | |||||||||||||||
| Net realized and unrealized gain (loss) |
(2.20 | ) | 1.96 | (1.29 | ) | 0.12 | (0.06 | ) | ||||||||||||
|
|
|
|
|
|
|
|
|
|
|
|||||||||||
| Net increase (decrease) from investment operations |
(1.63 | ) | 2.58 | (0.66 | ) | 0.79 | 0.62 | |||||||||||||
|
|
|
|
|
|
|
|
|
|
|
|||||||||||
| Distributions to Common Shareholders(b) |
||||||||||||||||||||
| From net investment income |
(0.58 | ) | (0.64 | ) | (0.63 | ) | (0.66 | ) | (0.68 | ) | ||||||||||
| From net realized gain |
(0.14 | ) | — | (0.02 | ) | — | — | |||||||||||||
|
|
|
|
|
|
|
|
|
|
|
|||||||||||
| Total distributions to Common Shareholders |
(0.72 | ) | (0.64 | ) | (0.65 | ) | (0.66 | ) | (0.68 | ) | ||||||||||
|
|
|
|
|
|
|
|
|
|
|
|||||||||||
| Net asset value, end of year |
$ | 12.42 | $ | 14.77 | $ | 12.83 | $ | 14.14 | $ | 14.01 | ||||||||||
|
|
|
|
|
|
|
|
|
|
|
|||||||||||
| Market price, end of year |
$ | 11.90 | $ | 15.26 | $ | 12.48 | $ | 14.98 | $ | 13.21 | ||||||||||
|
|
|
|
|
|
|
|
|
|
|
|||||||||||
| Total Return Applicable to Common Shareholders(c) |
||||||||||||||||||||
| Based on net asset value |
(11.63 | )% | 20.41 | % | (5.03 | )% | 5.97 | % | 4.47 | % | ||||||||||
|
|
|
|
|
|
|
|
|
|
|
|||||||||||
| Based on market price |
(18.05 | )% | 27.89 | % | (12.80 | )% | 19.07 | % | (6.48 | )% | ||||||||||
|
|
|
|
|
|
|
|
|
|
|
|||||||||||
| Ratios to Average Net Assets Applicable to Common Shareholders(d) |
||||||||||||||||||||
| Total expenses |
0.98 | % | 0.81 | % | 0.98 | % | 1.01 | % | 0.93 | % | ||||||||||
|
|
|
|
|
|
|
|
|
|
|
|||||||||||
| Total expenses after fees waived and/or reimbursed |
0.98 | % | 0.80 | % | 0.98 | % | 1.01 | % | 0.93 | % | ||||||||||
|
|
|
|
|
|
|
|
|
|
|
|||||||||||
| Total expenses after fees waived and/or reimbursed and excluding interest expense, fees and amortization of offering costs(e) |
0.77 | % | 0.71 | % | 0.69 | % | 0.70 | % | 0.69 | % | ||||||||||
|
|
|
|
|
|
|
|
|
|
|
|||||||||||
| Net investment income to Common Shareholders |
3.90 | % | 4.39 | % | 4.43 | % | 4.77 | % | 4.83 | % | ||||||||||
|
|
|
|
|
|
|
|
|
|
|
|||||||||||
| Supplemental Data |
||||||||||||||||||||
| Net assets applicable to Common Shareholders, end of year (000) |
$ | 475,526 | $ | 552,373 | $ | 463,431 | $ | 509,645 | $ | 504,470 | ||||||||||
|
|
|
|
|
|
|
|
|
|
|
|||||||||||
| VRDP Shares outstanding at $100,000 liquidation value, end of year (000) |
$ | 175,000 | $ | — | $ | — | $ | — | $ | — | ||||||||||
|
|
|
|
|
|
|
|
|
|
|
|||||||||||
| Asset coverage per VRDP Shares at $100,000 liquidation value, end of year |
$ | 371,729 | $ | — | $ | — | $ | — | $ | — | ||||||||||
|
|
|
|
|
|
|
|
|
|
|
|||||||||||
| Borrowings outstanding, end of year (000) |
$ | 41,712 | $ | 68,781 | $ | 69,232 | $ | 71,659 | $ | 71,925 | ||||||||||
|
|
|
|
|
|
|
|
|
|
|
|||||||||||
| Portfolio turnover rate |
24 | % | 19 | % | 21 | % | 19 | % | 15 | % | ||||||||||
|
|
|
|
|
|
|
|
|
|
|
|||||||||||
| (a) | Based on average Common Shares outstanding. |
| (b) | Distributions for annual periods determined in accordance with U.S. federal income tax regulations. |
| (c) | Total returns based on market price, which can be significantly greater or less than the net asset value, may result in substantially different returns. Where applicable, excludes the effects of any sales charges and assumes the reinvestment of distributions at actual reinvestment prices. |
| (d) | Excludes fees and expenses incurred indirectly as a result of investments in underlying funds. |
| (e) | Interest expense, fees and amortization of offering costs related to TOB Trusts and/or VRDP Shares. See Note 4 and Note 10 of the Notes to Financial Statements for details. |
See notes to financial statements.
| 72 | 2 0 2 2 B L A C K R O C K A N N U A L R E P O R T T O S H A R E H O L D E R S |
Financial Highlights (continued)
(For a share outstanding throughout each period)
| MUI | ||||||||||||||||||||
| Year Ended April 30, | ||||||||||||||||||||
|
2022 |
2021 | 2020 | 2019 | 2018 | ||||||||||||||||
| Net asset value, beginning of year |
$ | 16.11 | $ | 14.62 | $ | 15.40 | $ | 14.93 | $ | 15.17 | ||||||||||
|
|
|
|
|
|
|
|
|
|
|
|||||||||||
| Net investment income(a) |
0.56 | 0.64 | 0.56 | 0.56 | 0.59 | |||||||||||||||
| Net realized and unrealized gain (loss) |
(2.57 | ) | 1.48 | (0.81 | ) | 0.47 | (0.23 | ) | ||||||||||||
|
|
|
|
|
|
|
|
|
|
|
|||||||||||
| Net increase (decrease) from investment operations |
(2.01 | ) | 2.12 | (0.25 | ) | 1.03 | 0.36 | |||||||||||||
|
|
|
|
|
|
|
|
|
|
|
|||||||||||
| Distributions to Common Shareholders(b) |
||||||||||||||||||||
| From net investment income |
(0.65 | ) | (0.63 | ) | (0.53 | ) | (0.53 | ) | (0.60 | ) | ||||||||||
| From net realized gain |
— | — | — | (0.03 | ) | (0.00 | )(c) | |||||||||||||
|
|
|
|
|
|
|
|
|
|
|
|||||||||||
| Total distributions to Common Shareholders |
(0.65 | ) | (0.63 | ) | (0.53 | ) | (0.56 | ) | (0.60 | ) | ||||||||||
|
|
|
|
|
|
|
|
|
|
|
|||||||||||
| Net asset value, end of year |
$ | 13.45 | $ | 16.11 | $ | 14.62 | $ | 15.40 | $ | 14.93 | ||||||||||
|
|
|
|
|
|
|
|
|
|
|
|||||||||||
| Market price, end of year |
$ | 12.26 | $ | 15.09 | $ | 13.13 | $ | 13.85 | $ | 13.01 | ||||||||||
|
|
|
|
|
|
|
|
|
|
|
|||||||||||
| Total Return Applicable to Common Shareholders(d) |
||||||||||||||||||||
| Based on net asset value |
(12.79 | )% | 15.08 | % | (1.41 | )% | 7.68 | % | 2.76 | % | ||||||||||
|
|
|
|
|
|
|
|
|
|
|
|||||||||||
| Based on market price |
(15.13 | )% | 20.02 | % | (1.56 | )% | 11.13 | % | (2.69 | )% | ||||||||||
|
|
|
|
|
|
|
|
|
|
|
|||||||||||
| Ratios to Average Net Assets Applicable to Common Shareholders(e) |
||||||||||||||||||||
| Total expenses |
1.67 | %(f) | 1.58 | % | 2.31 | % | 2.63 | % | 2.17 | % | ||||||||||
|
|
|
|
|
|
|
|
|
|
|
|||||||||||
| Total expenses after fees waived and/or reimbursed |
1.67 | %(f) | 1.58 | % | 2.31 | % | 2.63 | % | 2.17 | % | ||||||||||
|
|
|
|
|
|
|
|
|
|
|
|||||||||||
| Total expenses after fees waived and/or reimbursed and excluding interest expense, fees and amortization of offering costs |
1.02 | %(f)(g) | 0.98 | %(h) | 0.97 | %(h) | 1.01 | %(h) | 0.97 | %(h) | ||||||||||
|
|
|
|
|
|
|
|
|
|
|
|||||||||||
| Net investment income to Common Shareholders |
3.63 | % | 4.05 | % | 3.59 | % | 3.73 | % | 3.87 | % | ||||||||||
|
|
|
|
|
|
|
|
|
|
|
|||||||||||
| Supplemental Data |
||||||||||||||||||||
| Net assets applicable to Common Shareholders, end of year (000) |
$ | 993,657 | $ | 617,032 | $ | 559,934 | $ | 589,887 | $ | 571,769 | ||||||||||
|
|
|
|
|
|
|
|
|
|
|
|||||||||||
| VRDP Shares outstanding at $ 100,000 liquidation value, end of year (000) |
$ | 561,700 | $ | — | $ | — | $ | — | $ | — | ||||||||||
|
|
|
|
|
|
|
|
|
|
|
|||||||||||
| Asset coverage per VRDP Shares at $ 100,000 liquidation value, end of year |
$ | 276,902 | $ | — | $ | — | $ | — | $ | — | ||||||||||
|
|
|
|
|
|
|
|
|
|
|
|||||||||||
| VMTP Shares outstanding at $ 100,000 liquidation value, end of year (000) |
$ | — | $ | 287,100 | $ | 287,100 | $ | 287,100 | $ | 287,100 | ||||||||||
|
|
|
|
|
|
|
|
|
|
|
|||||||||||
| Asset coverage per VMTP Shares at $ 100,000 liquidation value, end of year |
$ | — | $ | 314,919 | $ | 295,031 | $ | 305,464 | $ | 299,153 | ||||||||||
|
|
|
|
|
|
|
|
|
|
|
|||||||||||
| Borrowings outstanding, end of year (000) |
$ | 180,858 | $ | 93,069 | $ | 92,014 | $ | 93,421 | $ | 79,136 | ||||||||||
|
|
|
|
|
|
|
|
|
|
|
|||||||||||
| Portfolio turnover rate |
25 | % | 13 | % | 20 | % | 24 | % | 34 | % | ||||||||||
|
|
|
|
|
|
|
|
|
|
|
|||||||||||
| (a) | Based on average Common Shares outstanding. |
| (b) | Distributions for annual periods determined in accordance with U.S. federal income tax regulations. |
| (c) | Amount is greater than $(0.005) per share. |
| (d) | Total returns based on market price, which can be significantly greater or less than the net asset value, may result in substantially different returns. Where applicable, excludes the effects of any sales charges and assumes the reinvestment of distributions at actual reinvestment prices. |
| (e) | Excludes fees and expenses incurred indirectly as a result of investments in underlying funds. |
| (f) | Includes non-recurring expenses of reorganization costs. Without these costs, total expenses, total expenses after fees waived and/or reimbursed and total expenses after fees waived and/or reimbursed and excluding interest expense, fees, and amortization of offering costs, would have been 1.62%, 1.61% and 0.96%, respectively. |
| (g) | Interest expense, fees and amortization of offering costs related to TOB Trusts and/or VRDP/VMTP Shares. See Note 4 and Note 10 of the Notes to Financial Statements for details. |
| (h) | Interest expense, fees and amortization of offering costs related to TOB Trusts and/or VMTP Shares. See Note 4 and Note 10 of the Notes to Financial Statements for details. |
See notes to financial statements.
| F I N A N C I A L H I G H L I G H T S |
73 |
Financial Highlights (continued)
(For a share outstanding throughout each period)
| MHD | ||||||||||||||||||||
| Year Ended April 30, | ||||||||||||||||||||
|
2022 |
2021 | 2020 | 2019 | 2018 | ||||||||||||||||
| Net asset value, beginning of year |
$ | 17.30 | $ | 15.18 | $ | 16.56 | $ | 16.41 | $ | 16.85 | ||||||||||
|
|
|
|
|
|
|
|
|
|
|
|||||||||||
| Net investment income(a) |
0.72 | 0.78 | 0.74 | 0.81 | 0.88 | |||||||||||||||
| Net realized and unrealized gain (loss) |
(3.02 | ) | 2.07 | (1.36 | ) | 0.22 | (0.39 | ) | ||||||||||||
|
|
|
|
|
|
|
|
|
|
|
|||||||||||
| Net increase (decrease) from investment operations |
(2.30 | ) | 2.85 | (0.62 | ) | 1.03 | 0.49 | |||||||||||||
|
|
|
|
|
|
|
|
|
|
|
|||||||||||
| Distributions to Common Shareholders(b) |
||||||||||||||||||||
| From net investment income |
(0.73 | ) | (0.73 | ) | (0.76 | ) | (0.83 | ) | (0.92 | ) | ||||||||||
| From net realized gain |
(0.00 | )(c) | — | — | (0.05 | ) | (0.01 | ) | ||||||||||||
|
|
|
|
|
|
|
|
|
|
|
|||||||||||
| Total distributions to Common Shareholders |
(0.73 | ) | (0.73 | ) | (0.76 | ) | (0.88 | ) | (0.93 | ) | ||||||||||
|
|
|
|
|
|
|
|
|
|
|
|||||||||||
| Net asset value, end of year |
$ | 14.27 | $ | 17.30 | $ | 15.18 | $ | 16.56 | $ | 16.41 | ||||||||||
|
|
|
|
|
|
|
|
|
|
|
|||||||||||
| Market price, end of year |
$ | 12.87 | $ | 16.33 | $ | 13.91 | $ | 15.92 | $ | 14.98 | ||||||||||
|
|
|
|
|
|
|
|
|
|
|
|||||||||||
| Total Return Applicable to Common Shareholders(d) |
||||||||||||||||||||
| Based on net asset value |
(13.64 | )% | 19.31 | % | (4.02 | )% | 6.84 | % | 3.07 | % | ||||||||||
|
|
|
|
|
|
|
|
|
|
|
|||||||||||
| Based on market price |
(17.48 | )% | 22.90 | % | (8.52 | )% | 12.51 | % | (4.79 | )% | ||||||||||
|
|
|
|
|
|
|
|
|
|
|
|||||||||||
| Ratios to Average Net Assets Applicable to Common Shareholders(e) |
||||||||||||||||||||
| Total expenses |
1.52 | % | 1.56 | %(f) | 2.16 | % | 2.47 | % | 2.16 | % | ||||||||||
|
|
|
|
|
|
|
|
|
|
|
|||||||||||
| Total expenses after fees waived and/or reimbursed |
1.50 | % | 1.51 | %(f) | 2.15 | % | 2.47 | % | 2.16 | % | ||||||||||
|
|
|
|
|
|
|
|
|
|
|
|||||||||||
| Total expenses after fees waived and/or reimbursed and excluding interest expense, fees and amortization of offering costs(g) |
0.93 | % | 0.98 | %(f) | 0.97 | % | 1.00 | % | 1.01 | % | ||||||||||
|
|
|
|
|
|
|
|
|
|
|
|||||||||||
| Net investment income to Common Shareholders |
4.30 | % | 4.59 | % | 4.40 | % | 4.98 | % | 5.19 | % | ||||||||||
|
|
|
|
|
|
|
|
|
|
|
|||||||||||
| Supplemental Data |
||||||||||||||||||||
| Net assets applicable to Common Shareholders, end of year (000) |
$ | 761,147 | $ | 923,079 | $ | 215,764 | $ | 235,029 | $ | 232,921 | ||||||||||
|
|
|
|
|
|
|
|
|
|
|
|||||||||||
| VMTP Shares outstanding at $100,000 liquidation value, end of year (000) |
$ | 347,800 | $ | 347,800 | $ | 83,700 | $ | 83,700 | $ | 83,700 | ||||||||||
|
|
|
|
|
|
|
|
|
|
|
|||||||||||
| Asset coverage per VMTP Shares at $100,000 liquidation value, end of year |
$ | 318,846 | $ | 365,405 | $ | 357,782 | $ | 380,799 | $ | 378,281 | ||||||||||
|
|
|
|
|
|
|
|
|
|
|
|||||||||||
| Borrowings outstanding, end of year (000) |
$ | 176,042 | $ | 213,104 | $ | 53,130 | $ | 52,674 | $ | 63,166 | ||||||||||
|
|
|
|
|
|
|
|
|
|
|
|||||||||||
| Portfolio turnover rate |
15 | % | 13 | % | 21 | % | 17 | % | 12 | % | ||||||||||
|
|
|
|
|
|
|
|
|
|
|
|||||||||||
| (a) | Based on average Common Shares outstanding. |
| (b) | Distributions for annual periods determined in accordance with U.S. federal income tax regulations. |
| (c) | Amount is greater than $(0.005) per share. |
| (d) | Total returns based on market price, which can be significantly greater or less than the net asset value, may result in substantially different returns. Where applicable, excludes the effects of any sales charges and assumes the reinvestment of distributions at actual reinvestment prices. |
| (e) | Excludes fees and expenses incurred indirectly as a result of investments in underlying funds. |
| (f) | Includes non-recurring expenses of reorganization costs. Without these costs, total expenses, total expenses after fees waived and/or reimbursed and total expenses after fees waived and/or reimbursed and excluding interest expense, fees, and amortization of offering costs, would have been 1.49%, 1.47% and 0.95%, respectively. |
| (g) | Interest expense, fees and amortization of offering costs related to TOB Trusts and/or VMTP Shares. See Note 4 and Note 10 of the Notes to Financial Statements for details. |
See notes to financial statements.
| 74 | 2 0 2 2 B L A C K R O C K A N N U A L R E P O R T T O S H A R E H O L D E R S |
Financial Highlights (continued)
(For a share outstanding throughout each period)
| MVT | ||||||||||||||||||||
| Year Ended April 30, | ||||||||||||||||||||
|
2022 |
2021 | 2020 | 2019 | 2018 | ||||||||||||||||
| Net asset value, beginning of year |
$ | 15.60 | $ | 13.60 | $ | 14.87 | $ | 14.75 | $ | 15.19 | ||||||||||
|
|
|
|
|
|
|
|
|
|
|
|||||||||||
| Net investment income(a) |
0.65 | 0.72 | 0.68 | 0.74 | 0.83 | |||||||||||||||
| Net realized and unrealized gain (loss) |
(2.64 | ) | 1.97 | (1.27 | ) | 0.20 | (0.41 | ) | ||||||||||||
|
|
|
|
|
|
|
|
|
|
|
|||||||||||
| Net increase (decrease) from investment operations |
(1.99 | ) | 2.69 | (0.59 | ) | 0.94 | 0.42 | |||||||||||||
|
|
|
|
|
|
|
|
|
|
|
|||||||||||
| Distributions to Common Shareholders(b) |
||||||||||||||||||||
| From net investment income |
(0.70 | ) | (0.69 | ) | (0.68 | ) | (0.76 | ) | (0.86 | ) | ||||||||||
| From net realized gain |
— | — | — | (0.06 | ) | — | ||||||||||||||
|
|
|
|
|
|
|
|
|
|
|
|||||||||||
| Total distributions to Common Shareholders |
(0.70 | ) | (0.69 | ) | (0.68 | ) | (0.82 | ) | (0.86 | ) | ||||||||||
|
|
|
|
|
|
|
|
|
|
|
|||||||||||
| Net asset value, end of year |
$ | 12.91 | $ | 15.60 | $ | 13.60 | $ | 14.87 | $ | 14.75 | ||||||||||
|
|
|
|
|
|
|
|
|
|
|
|||||||||||
| Market price, end of year |
$ | 11.89 | $ | 15.15 | $ | 12.55 | $ | 14.29 | $ | 14.05 | ||||||||||
|
|
|
|
|
|
|
|
|
|
|
|||||||||||
| Total Return Applicable to Common Shareholders(c) |
||||||||||||||||||||
| Based on net asset value |
(13.19 | )% | 20.22 | % | (4.21 | )% | 6.83 | % | 2.79 | % | ||||||||||
|
|
|
|
|
|
|
|
|
|
|
|||||||||||
| Based on market price |
(17.67 | )% | 26.52 | % | (8.02 | )% | 7.78 | % | (3.74 | )% | ||||||||||
|
|
|
|
|
|
|
|
|
|
|
|||||||||||
| Ratios to Average Net Assets Applicable to Common Shareholders(d) |
||||||||||||||||||||
| Total expenses |
1.49 | % | 1.47 | % | 2.14 | % | 2.45 | % | 2.11 | % | ||||||||||
|
|
|
|
|
|
|
|
|
|
|
|||||||||||
| Total expenses after fees waived and/or reimbursed |
1.49 | % | 1.47 | % | 2.13 | % | 2.45 | % | 2.11 | % | ||||||||||
|
|
|
|
|
|
|
|
|
|
|
|||||||||||
| Total expenses after fees waived and/or reimbursed and excluding interest expense, fees and amortization of offering costs(e) |
0.90 | % | 0.90 | % | 0.89 | % | 0.91 | % | 0.91 | % | ||||||||||
|
|
|
|
|
|
|
|
|
|
|
|||||||||||
| Net investment income to Common Shareholders |
4.28 | % | 4.75 | % | 4.51 | % | 5.09 | % | 5.44 | % | ||||||||||
|
|
|
|
|
|
|
|
|
|
|
|||||||||||
| Supplemental Data |
||||||||||||||||||||
| Net assets applicable to Common Shareholders, end of year (000) |
$ | 275,829 | $ | 332,905 | $ | 290,223 | $ | 317,175 | $ | 314,261 | ||||||||||
|
|
|
|
|
|
|
|
|
|
|
|||||||||||
| VMTP Shares outstanding at $100,000 liquidation value, end of year (000) |
$ | 140,000 | $ | 140,000 | $ | 140,000 | $ | 140,000 | $ | 140,000 | ||||||||||
|
|
|
|
|
|
|
|
|
|
|
|||||||||||
| Asset coverage per VMTP Shares at $100,000 liquidation value, end of year |
$ | 297,021 | $ | 337,789 | $ | 307,302 | $ | 326,553 | $ | 324,472 | ||||||||||
|
|
|
|
|
|
|
|
|
|
|
|||||||||||
| Borrowings outstanding, end of year (000) |
$ | 60,726 | $ | 57,997 | $ | 56,198 | $ | 47,982 | $ | 61,343 | ||||||||||
|
|
|
|
|
|
|
|
|
|
|
|||||||||||
| Portfolio turnover rate |
14 | % | 13 | % | 18 | % | 25 | % | 11 | % | ||||||||||
|
|
|
|
|
|
|
|
|
|
|
|||||||||||
| (a) | Based on average Common Shares outstanding. |
| (b) | Distributions for annual periods determined in accordance with U.S. federal income tax regulations. |
| (c) | Total returns based on market price, which can be significantly greater or less than the net asset value, may result in substantially different returns. Where applicable, excludes the effects of any sales charges and assumes the reinvestment of distributions at actual reinvestment prices. |
| (d) | Excludes fees and expenses incurred indirectly as a result of investments in underlying funds. |
| (e) | Interest expense, fees and amortization of offering costs related to TOB Trusts and/or VMTP Shares. See Note 4 and Note 10 of the Notes to Financial Statements for details. |
See notes to financial statements.
| F I N A N C I A L H I G H L I G H T S |
75 |
| 1. | ORGANIZATION |
The following are registered under the Investment Company Act of 1940, as amended (the “1940 Act”), as closed-end management investment companies and are referred to herein collectively as the “Funds”, or individually as a “Fund”:
|
|
||||||||||||
| Fund Name | Herein Referred To As | Organized | Diversification Classification |
|||||||||
|
|
||||||||||||
| BlackRock MuniAssets Fund, Inc. |
MUA | Maryland | Diversified | |||||||||
| BlackRock Municipal Income Fund, Inc. |
MUI | Maryland | Diversified | |||||||||
| BlackRock MuniHoldings Fund, Inc. |
MHD | Maryland | Diversified | |||||||||
| BlackRock MuniVest Fund II, Inc. |
MVT | Maryland | Diversified | |||||||||
|
|
||||||||||||
The Boards of Directors of the Funds are collectively referred to throughout this report as the “Board,” and the directors thereof are collectively referred to throughout this report as “Directors”. The Funds determine and make available for publication the net asset values (“NAVs”) of their Common Shares on a daily basis.
On September 24, 2021, the Board of Directors of the Fund approved a change in the name of BlackRock Muni Intermediate Duration Fund, Inc., effective as of October 1, 2021, to BlackRock Municipal Income Fund, Inc.
The Funds, together with certain other registered investment companies advised by BlackRock Advisors, LLC (the “Manager”) or its affiliates, are included in a complex of open-end non-index fixed-income funds and all BlackRock-advised closed-end funds referred to as the BlackRock Fixed-Income Complex.
Reorganization: The Board and shareholders of MUI (the “Acquiring Fund”) and the Board and shareholders of BlackRock MuniHoldings Investment Quality Fund (“MFL”), (the “Target Fund”) approved the reorganization of the Target Fund into the Acquiring Fund. As a result, the Acquiring Fund acquired substantially all of the assets and assumed substantially all of the liabilities of the Target Fund in exchange for an equal aggregate value of newly-issued Common Shares and Preferred Shares of the Acquiring Fund.
Each Common Shareholder of the Target Fund received Common Shares of the Acquiring Fund in an amount equal to the aggregate NAV of such Common Shareholder’s Target Fund Common Shares, as determined at the close of business on April 8, 2022, less the costs of the Target Fund’s reorganization. Cash was distributed for any fractional shares.
Each Preferred Shareholder of the Target Fund received Preferred Shares of the Acquiring Fund in an amount equal to the aggregate liquidation preference of the Target Fund’s Preferred Shares held by such Preferred Shareholder prior to the Target Fund’s reorganization.
The reorganization was accomplished by a tax-free exchange of Common Shares and Preferred Shares of the Acquiring Fund in the following amounts and at the following conversion ratios:
|
|
||||||||||||||||||||
| Target Fund | Target Fund’s Share Class |
Shares Prior to Reorganization |
Conversion Ratio |
MUI’s Share Class |
Shares of MUI |
|||||||||||||||
|
|
||||||||||||||||||||
| MFL |
Common | 37,896,208 | 0.93874076 | Common | 35,574,705(a) | |||||||||||||||
| MFL |
VRDP | 2,746 | 1 | VRDP | 2,746 | |||||||||||||||
|
|
||||||||||||||||||||
| (a) | Net of fractional shares redeemed. |
The Target Fund’s net assets and composition of net assets on April 8, 2022, the valuation date of the reorganization were as follows:
|
|
||||
| MFL | ||||
|
|
||||
| Net assets applicable to Common Shareholders |
$ | 497,273,284 | ||
| Paid-in-capital |
513,150,872 | |||
| Accumulated loss |
(15,877,588 | ) | ||
|
|
||||
For financial reporting purposes, assets received and shares issued by the Acquiring Fund were recorded at fair value. However, the cost basis of the investments received from the Target Funds was carried forward to align ongoing reporting of the Acquiring Fund’s realized and unrealized gains and losses with amounts distributable to shareholders for tax purposes.
The net assets applicable to Common Shareholders of the Acquiring Fund before the reorganization was $535,317,061. The aggregate net assets applicable to Common Shareholders of the Acquiring Fund immediately after the reorganization amounted to $1,032,590,345. The Target Fund’s fair value and cost of financial instruments prior to the reorganization was as follows:
|
|
||||||||||||||||
| Target Fund | Fair Value of Investments |
Cost of Investments |
TOB Trust Certificates |
Preferred Shares Value |
||||||||||||
|
|
||||||||||||||||
| MFL |
$ | 846,552,183 | $ | 858,217,170 | $ | 88,413,120 | $ | 274,600,000 | ||||||||
|
|
||||||||||||||||
The purpose of these transactions was to combine two funds managed by the Manager with similar investment objectives, investment policies, strategies, risks and restrictions. The reorganization was a tax-free event and was effective on April 11, 2022.
Assuming the reorganization had been completed on May 1, 2021, the beginning of the fiscal reporting period of the Acquiring Fund, the pro forma results of operations for the year ended April 30, 2022, are as follows:
| 76 | 2 0 2 2 B L A C K R O C K A N N U A L R E P O R T T O S H A R E H O L D E R S |
Notes to Financial Statements (continued)
• Net investment income (loss): $42,471,276
• Net realized and change in unrealized gain/loss on investments: $(198,977,307)
• Net decrease in net assets resulting from operations: $(156,506,031)
Because the combined investment portfolios have been managed as a single integrated portfolio since the reorganization was completed, it is not practicable to separate the amounts of revenue and earnings of the Target Fund that have been included in the Acquiring Fund’s Statements of Operations since April 11, 2022.
Reorganization costs incurred by MUI in connection with the reorganization were expensed by MUI. The Manager reimbursed MUI $42,542, which is included in fees waived and/or reimbursed by the Manager in the Statements of Operations.
Prior Year Reorganization: The Board and shareholders of MHD (the “Acquiring Fund”) and the Board and shareholders of each of BlackRock Municipal Income Investment Quality Trust (“BAF”), BlackRock Municipal Bond Trust (“BBK”), BlackRock MuniHoldings Fund II, Inc. (“MUH”) and BlackRock MuniHoldings Quality Fund, Inc. (“MUS”) (individually, a “Target Fund” and collectively the “Target Funds”) approved the reorganization of each Target Fund into the Acquiring Fund. As a result, the Acquiring Fund acquired substantially all of the assets and assumed substantially all of the liabilities of each Target Fund in exchange for an equal aggregate value of newly-issued Common Shares and Preferred Shares of the Acquiring Fund.
Each Common Shareholder of a Target Fund received Common Shares of the Acquiring Fund in an amount equal to the aggregate NAV of such Common Shareholder’s Target Fund Common Shares, as determined at the close of business on March 5, 2021. Cash was distributed for any fractional shares.
Each Preferred Shareholder of a Target Fund received Preferred Shares of the Acquiring Fund in an amount equal to the aggregate liquidation preference of the Target Fund’s Preferred Shares held by such Preferred Shareholder prior to the Target Fund’s reorganization.
The reorganizations were accomplished by a tax-free exchange of Common Shares and Preferred Shares of the Acquiring Fund in the following amounts and at the following conversion ratios:
| Target Funds | Target Fund’s Share Class |
Shares Prior to Reorganization |
Conversion Ratio |
MHD’s Share Class |
Shares of MHD |
|||||||||||||||
| BAF |
Common | 8,749,418 | 0.89746185 | Common | 7,852,259 | (a) | ||||||||||||||
| BBK |
Common | 10,522,957 | 0.96696817 | Common | 10,175,357 | (a) | ||||||||||||||
| MUH |
Common | 11,336,282 | 0.92578578 | Common | 10,494,965 | (a) | ||||||||||||||
| MUS |
Common | 13,018,276 | 0.81612104 | Common | 10,624,485 | (a) | ||||||||||||||
| BAF |
VMTP | 422 | 1 | VMTP | 422 | |||||||||||||||
| BBK |
VMTP | 799 | 1 | VMTP | 799 | |||||||||||||||
| MUH |
VMTP | 550 | 1 | VMTP | 550 | |||||||||||||||
| MUS |
VMTP | 870 | 1 | VMTP | 870 | |||||||||||||||
| (a) | Net of fractional shares redeemed. |
Each Target Fund’s net assets and composition of net assets on March 5, 2021, the valuation date of the reorganization were as follows:
| BAF | BBK | MUH | MUS | |||||||||||
| Net assets applicable to Common Shareholders |
$ | 133,431,549 | $ | 172,906,686 | $ | 178,338,366 | $180,538,553 | |||||||
| Paid-in-capital |
123,568,480 | 148,932,221 | 155,728,501 | 167,933,515 | ||||||||||
| Accumulated earnings |
9,863,069 | 23,974,465 | 22,609,865 | 12,605,038 | ||||||||||
For financial reporting purposes, assets received and shares issued by the Acquiring Fund were recorded at fair value. However, the cost basis of the investments received from the Target Funds was carried forward to align ongoing reporting of the Acquiring Fund’s realized and unrealized gains and losses with amounts distributable to shareholders for tax purposes.
The net assets applicable to Common Shareholders of the Acquiring Fund before the reorganizations were $241,462,174. The aggregate net assets applicable to Common Shareholders of the Acquiring Fund immediately after the reorganizations amounted to $906,677,328. Each Target Fund’s fair value and cost of financial instruments prior to the reorganization were as follows:
| Target Funds | Fair Value of Investments |
Cost of Investments |
TOB Trust Certificates |
Preferred Shares Value | ||||||||||
| BAF |
$ | 223,936,158 | $ | 207,836,363 | $ | 49,618,622 | $42,200,000 | |||||||
| BBK |
277,541,340 | 250,542,078 | 33,649,476 | 79,900,000 | ||||||||||
| MUH |
278,307,330 | 252,425,263 | 49,204,091 | 55,000,000 | ||||||||||
| MUS |
291,481,501 | 268,355,737 | 29,367,864 | 87,000,000 | ||||||||||
The purpose of these transactions was to combine five funds managed by the Manager with the same, substantially similar (but not identical) or similar investment objectives, investment policies, strategies, risks and restrictions. Each reorganization was a tax-free event and was effective on March 8, 2021.
| N O T E S T O F I N A N C I A L S T A T E M E N T S |
77 |
Notes to Financial Statements (continued)
Assuming the reorganization had been completed on May 1, 2020, the beginning of the fiscal reporting period of MHD, the pro forma results of operations for the year ended April 30, 2021, are as follows:
• Net investment income (loss): $41,679,250
• Net realized and change in unrealized gain/loss on investments: $101,416,927
• Net increase in net assets resulting from operations: $143,096,177
Because the combined investment portfolios have been managed as a single integrated portfolio since the reorganization was completed, it is not practicable to separate the amounts of revenue and earnings of each Target Fund that have been included in MHD’s Statement of Operations since March 8, 2021.
Reorganization costs incurred by MHD in connection with the reorganization were expensed by MHD. The Manager reimbursed the Fund $123,963.
| 2. | SIGNIFICANT ACCOUNTING POLICIES |
The financial statements are prepared in conformity with accounting principles generally accepted in the United States of America (“U.S. GAAP”), which may require management to make estimates and assumptions that affect the reported amounts of assets and liabilities in the financial statements, disclosure of contingent assets and liabilities at the date of the financial statements and the reported amounts of increases and decreases in net assets from operations during the reporting period. Actual results could differ from those estimates. Each Fund is considered an investment company under U.S. GAAP and follows the accounting and reporting guidance applicable to investment companies. Below is a summary of significant accounting policies:
Investment Transactions and Income Recognition: For financial reporting purposes, investment transactions are recorded on the dates the transactions are executed. Realized gains and losses on investment transactions are determined using the specific identification method. Dividend income and capital gain distributions, if any, are recorded on the ex-dividend dates. Non-cash dividends, if any, are recorded on the ex-dividend dates at fair value. Interest income, including amortization and accretion of premiums and discounts on debt securities, is recognized daily on an accrual basis.
Segregation and Collateralization: In cases where a Fund enters into certain investments (e.g., futures contracts) or certain borrowings (e.g., TOB Trust transactions) that would be treated as “senior securities” for 1940 Act purposes, a Fund may segregate or designate on its books and records cash or liquid assets having a market value at least equal to the amount of its future obligations under such investments or borrowings. Doing so allows the investments or borrowings to be excluded from treatment as a “senior security.” Furthermore, if required by an exchange or counterparty agreement, the Funds may be required to deliver/deposit cash and/or securities to/with an exchange, or broker-dealer or custodian as collateral for certain investments or obligations.
Distributions: Distributions from net investment income are declared and paid monthly. Distributions of capital gains are recorded on the ex-dividend dates and made at least annually. The character and timing of distributions are determined in accordance with U.S. federal income tax regulations, which may differ from U.S. GAAP.
Distributions to Preferred Shareholders are accrued and determined as described in Note 10.
Deferred Compensation Plan: Under the Deferred Compensation Plan (the “Plan”) approved by each Fund’s Board, the directors who are not “interested persons” of the Funds, as defined in the 1940 Act (“Independent Directors”), may defer a portion of their annual complex-wide compensation. Deferred amounts earn an approximate return as though equivalent dollar amounts had been invested in common shares of certain funds in the BlackRock Fixed-Income Complex selected by the Independent Directors. This has the same economic effect for the Independent Directors as if the Independent Directors had invested the deferred amounts directly in certain funds in the BlackRock Fixed-Income Complex.
The Plan is not funded and obligations thereunder represent general unsecured claims against the general assets of each Fund, as applicable. Deferred compensation liabilities, if any, are included in the Directors’ and Officer’s fees payable in the Statements of Assets and Liabilities and will remain as a liability of the Funds until such amounts are distributed in accordance with the Plan.
Indemnifications: In the normal course of business, a Fund enters into contracts that contain a variety of representations that provide general indemnification. A Fund’s maximum exposure under these arrangements is unknown because it involves future potential claims against a Fund, which cannot be predicted with any certainty.
Other: Expenses directly related to a Fund are charged to that Fund. Other operating expenses shared by several funds, including other funds managed by the Manager, are prorated among those funds on the basis of relative net assets or other appropriate methods.
| 3. | INVESTMENT VALUATION AND FAIR VALUE MEASUREMENTS |
Investment Valuation Policies: Each Fund’s investments are valued at fair value (also referred to as “market value” within the financial statements) each day that the Fund is open for business and, for financial reporting purposes, as of the report date. U.S. GAAP defines fair value as the price a fund would receive to sell an asset or pay to transfer a liability in an orderly transaction between market participants at the measurement date. Each Fund determines the fair values of its financial instruments using various independent dealers or pricing services under policies approved by the Board. If a security’s market price is not readily available or does not otherwise accurately represent the fair value of the security, the security will be valued in accordance with a policy approved by the Board as reflecting fair value. The BlackRock Global Valuation Methodologies Committee (the “Global Valuation Committee”) is the committee formed by management to develop global pricing policies and procedures and to oversee the pricing function for all financial instruments.
| 78 | 2 0 2 2 B L A C K R O C K A N N U A L R E P O R T T O S H A R E H O L D E R S |
Notes to Financial Statements (continued)
Fair Value Inputs and Methodologies: The following methods and inputs are used to establish the fair value of each Fund’s assets and liabilities:
| • | Fixed-income investments for which market quotations are readily available are generally valued using the last available bid price or current market quotations provided by independent dealers or third-party pricing services. Pricing services generally value fixed-income securities assuming orderly transactions of an institutional round lot size, but a fund may hold or transact in such securities in smaller, odd lot sizes. Odd lots may trade at lower prices than institutional round lots. The pricing services may use matrix pricing or valuation models that utilize certain inputs and assumptions to derive values, including transaction data (e.g., recent representative bids and offers), market data, credit quality information, perceived market movements, news, and other relevant information. Certain fixed-income securities, including asset-backed and mortgage related securities may be valued based on valuation models that consider the estimated cash flows of each tranche of the entity, establish a benchmark yield and develop an estimated tranche specific spread to the benchmark yield based on the unique attributes of the tranche. The amortized cost method of valuation may be used with respect to debt obligations with sixty days or less remaining to maturity unless the Manager determines such method does not represent fair value. |
| • | Investments in open-end U.S. mutual funds (including money market funds) are valued at that day’s published NAV. |
| • | Futures contracts are valued based on that day’s last reported settlement or trade price on the exchange where the contract is traded. |
If events (e.g., market volatility, company announcement or a natural disaster) occur that are expected to materially affect the value of such investment, or in the event that application of these methods of valuation results in a price for an investment that is deemed not to be representative of the market value of such investment, or if a price is not available, the investment will be valued by the Global Valuation Committee, or its delegate, in accordance with a policy approved by the Board as reflecting fair value (“Fair Valued Investments”). The fair valuation approaches that may be used by the Global Valuation Committee include market approach, income approach and cost approach. Valuation techniques such as discounted cash flow, use of market comparables and matrix pricing are types of valuation approaches and are typically used in determining fair value. When determining the price for Fair Valued Investments, the Global Valuation Committee, or its delegate, seeks to determine the price that each Fund might reasonably expect to receive or pay from the current sale or purchase of that asset or liability in an arm’s-length transaction. Fair value determinations shall be based upon all available factors that the Global Valuation Committee, or its delegate, deems relevant and consistent with the principles of fair value measurement. The pricing of all Fair Valued Investments is subsequently reported to the Board or a committee thereof on a quarterly basis.
Fair Value Hierarchy: Various inputs are used in determining the fair value of financial instruments. These inputs to valuation techniques are categorized into a fair value hierarchy consisting of three broad levels for financial reporting purposes as follows:
| • | Level 1 – Unadjusted price quotations in active markets/exchanges for identical assets or liabilities that each Fund has the ability to access; |
| • | Level 2 – Other observable inputs (including, but not limited to, quoted prices for similar assets or liabilities in markets that are active, quoted prices for identical or similar assets or liabilities in markets that are not active, inputs other than quoted prices that are observable for the assets or liabilities (such as interest rates, yield curves, volatilities, prepayment speeds, loss severities, credit risks and default rates) or other market–corroborated inputs); and |
| • | Level 3 – Unobservable inputs based on the best information available in the circumstances, to the extent observable inputs are not available (including the Global Valuation Committee’s assumptions used in determining the fair value of financial instruments). |
The hierarchy gives the highest priority to unadjusted quoted prices in active markets for identical assets or liabilities (Level 1 measurements) and the lowest priority to unobservable inputs (Level 3 measurements). Accordingly, the degree of judgment exercised in determining fair value is greatest for instruments categorized in Level 3. The inputs used to measure fair value may fall into different levels of the fair value hierarchy. In such cases, for disclosure purposes, the fair value hierarchy classification is determined based on the lowest level input that is significant to the fair value measurement in its entirety. Investments classified within Level 3 have significant unobservable inputs used by the Global Valuation Committee in determining the price for Fair Valued Investments. Level 3 investments include equity or debt issued by privately held companies or funds that may not have a secondary market and/or may have a limited number of investors. The categorization of a value determined for financial instruments is based on the pricing transparency of the financial instruments and is not necessarily an indication of the risks associated with investing in those securities.
| 4. | SECURITIES AND OTHER INVESTMENTS |
Zero-Coupon Bonds: Zero-coupon bonds are normally issued at a significant discount from face value and do not provide for periodic interest payments. These bonds may experience greater volatility in market value than other debt obligations of similar maturity which provide for regular interest payments.
Forward Commitments, When-Issued and Delayed Delivery Securities: The Funds may purchase securities on a when-issued basis and may purchase or sell securities on a forward commitment basis. Settlement of such transactions normally occurs within a month or more after the purchase or sale commitment is made. The Funds may purchase securities under such conditions with the intention of actually acquiring them but may enter into a separate agreement to sell the securities before the settlement date. Since the value of securities purchased may fluctuate prior to settlement, the Funds may be required to pay more at settlement than the security is worth. In addition, a fund is not entitled to any of the interest earned prior to settlement. When purchasing a security on a delayed delivery basis, the Funds assume the rights and risks of ownership of the security, including the risk of price and yield fluctuations. In the event of default by the counterparty, the Funds’ maximum amount of loss is the unrealized appreciation of unsettled when-issued transactions.
Municipal Bonds Transferred to TOB Trusts: Certain Funds leverage their assets through the use of “TOB Trust” transactions. The funds transfer municipal bonds into a special purpose trust (a “TOB Trust”). A TOB Trust issues two classes of beneficial interests: short-term floating rate interests (“TOB Trust Certificates”), which are sold to third-party investors, and residual inverse floating rate interests (“TOB Residuals”), which are issued to the participating funds that contributed the municipal bonds to the TOB Trust. The TOB Trust Certificates have interest rates that reset weekly and their holders have the option to tender such certificates to the TOB Trust for redemption at par and any accrued interest at each reset date. The TOB Residuals held by a fund provide the fund with the right to cause the holders of a proportional share of the TOB Trust
| N O T E S T O F I N A N C I A L S T A T E M E N T S |
79 |
Notes to Financial Statements (continued)
Certificates to tender their certificates to the TOB Trust at par plus accrued interest. The funds may withdraw a corresponding share of the municipal bonds from the TOB Trust. Other funds managed by the investment adviser may also contribute municipal bonds to a TOB Trust into which a fund has contributed bonds. If multiple BlackRock-advised funds participate in the same TOB Trust, the economic rights and obligations under the TOB Residuals will be shared among the funds ratably in proportion to their participation in the TOB Trust.
TOB Trusts are supported by a liquidity facility provided by a third-party bank or other financial institution (the “Liquidity Provider”) that allows the holders of the TOB Trust Certificates to tender their certificates in exchange for payment of par plus accrued interest on any business day. The tendered TOB Trust Certificates are remarketed by a Remarketing Agent. In the event of a failed remarketing, the TOB Trust may draw upon a loan from the Liquidity Provider to purchase the tendered TOB Trust Certificates. Any loans made by the Liquidity Provider will be secured by the purchased TOB Trust Certificates held by the TOB Trust and will be subject to an increased interest rate based on number of days the loan is outstanding.
The TOB Trust may be collapsed without the consent of a fund, upon the occurrence of a termination event as defined in the TOB Trust agreement. Upon the occurrence of a termination event, a TOB Trust would be liquidated with the proceeds applied first to any accrued fees owed to the trustee of the TOB Trust, the Remarketing Agent and the Liquidity Provider. Upon certain termination events, TOB Trust Certificates holders will be paid before the TOB Residuals holders (i.e., the Funds) whereas in other termination events, TOB Trust Certificates holders and TOB Residuals holders will be paid pro rata.
While a fund’s investment policies and restrictions expressly permit investments in inverse floating rate securities, such as TOB Residuals, they restrict the ability of a fund to borrow money for purposes of making investments. MUA and MVT management believes that a fund’s restrictions on borrowings do not apply to the Funds’ TOB Trust transactions. Each Fund’s transfer of the municipal bonds to a TOB Trust is considered a secured borrowing for financial reporting purposes. The cash received by the TOB Trust from the sale of the TOB Trust Certificates, less certain transaction expenses, is paid to a Fund. A Fund typically invests the cash received in additional municipal bonds.
Accounting for TOB Trusts: The municipal bonds deposited into a TOB Trust are presented in a Fund’s Schedule of Investments and the TOB Trust Certificates are shown in Other Liabilities in the Statements of Assets and Liabilities. Any loans drawn by the TOB Trust pursuant to the liquidity facility to purchase tendered TOB Trust Certificates are shown as Loan for TOB Trust Certificates. The carrying amount of a Fund’s payable to the holder of the TOB Trust Certificates, as reported in the Statements of Assets and Liabilities as TOB Trust Certificates, approximates its fair value.
Interest income, including amortization and accretion of premiums and discounts, from the underlying municipal bonds is recorded by a Fund on an accrual basis. Interest expense incurred on the TOB Trust transaction and other expenses related to remarketing, administration, trustee, liquidity and other services to a TOB Trust are shown as interest expense, fees and amortization of offering costs in the Statements of Operations. Fees paid upon creation of the TOB Trust are recorded as debt issuance costs and are amortized to interest expense, fees and amortization of offering costs in the Statements of Operations to the expected maturity of the TOB Trust. In connection with the restructurings of the TOB Trusts to non-bank sponsored TOB Trusts, a Fund incurred non-recurring, legal and restructuring fees, which are recorded as interest expense, fees and amortization of offering costs in the Statements of Operations. Amounts recorded within interest expense, fees and amortization of offering costs in the Statements of Operations are:
|
|
||||||||||||||||
| Fund Name | Interest Expense | Liquidity Fees | Other Expenses | Total | ||||||||||||
|
|
||||||||||||||||
| MUA |
$ | 76,077 | $ | 236,677 | $ | 72,627 | $ | 385,381 | ||||||||
| MUI |
157,316 | 393,628 | 109,408 | 660,352 | ||||||||||||
| MHD |
301,492 | 805,432 | 278,850 | 1,385,774 | ||||||||||||
| MVT |
93,979 | 239,030 | 74,555 | 407,564 | ||||||||||||
|
|
||||||||||||||||
For the year ended April 30, 2022, the following table is a summary of each Fund’s TOB Trusts:
|
|
||||||||||||||||||||
| Fund Name |
|
Underlying Municipal Bonds Transferred to TOB Trusts |
(a) |
|
Liability for TOB Trust Certificates |
(b) |
|
Range of Interest Rates on TOB Trust Certificates at Period End |
|
|
Average TOB Trust Certificates Outstanding |
|
|
Daily Weighted Average Rate of Interest and Other Expenses |
| |||||
|
|
||||||||||||||||||||
| MUA |
$ | 60,414,042 | $ | 41,711,683 | 0.45% — 0.57% | $ | 55,683,686 | 0.69% | ||||||||||||
| MUI |
324,196,146 | 180,857,841 | 0.47 — 0.54 | 92,932,034 | 0.71 | |||||||||||||||
| MHD |
280,451,707 | 176,042,422 | 0.45 — 0.64 | 198,663,878 | 0.70 | |||||||||||||||
| MVT |
90,672,357 | 60,725,900 | 0.45 — 0.61 | 59,464,490 | 0.68 | |||||||||||||||
|
|
||||||||||||||||||||
| (a) | The municipal bonds transferred to a TOB Trust are generally high grade municipal bonds. In certain cases, when municipal bonds transferred are lower grade municipal bonds, the TOB Trust transaction may include a credit enhancement feature that provides for the timely payment of principal and interest on the bonds to the TOB Trust by a credit enhancement provider in the event of default of the municipal bond. The TOB Trust would be responsible for the payment of the credit enhancement fee and the Funds, as TOB Residuals holders, would be responsible for reimbursement of any payments of principal and interest made by the credit enhancement provider. The maximum potential amounts owed by the Funds, for such reimbursements, as applicable, are included in the maximum potential amounts disclosed for recourse TOB Trusts in the Schedules of Investments. |
| (b) | TOB Trusts may be structured on a non-recourse or recourse basis. When a Fund invests in TOB Trusts on a non-recourse basis, the Liquidity Provider may be required to make a payment under the liquidity facility to allow the TOB Trust to repurchase TOB Trust Certificates. The Liquidity Provider will be reimbursed from the liquidation of bonds held in the TOB Trust. If a Fund invests in a TOB Trust on a recourse basis, a Fund enters into a reimbursement agreement with the Liquidity Provider where a Fund is required to reimburse the Liquidity Provider for any shortfall between the amount paid by the Liquidity Provider and proceeds received from liquidation of municipal bonds held in the TOB Trust (the “Liquidation Shortfall”). As a result, if a Fund invests in a recourse TOB Trust, a Fund will bear the risk of loss with respect to any Liquidation Shortfall. If multiple funds participate in any such TOB Trust, these losses will be shared ratably, including the maximum potential amounts owed by a Fund at April 30, 2022, in proportion to their participation in the TOB Trust. The recourse TOB Trusts are identified in the Schedules of Investments including the maximum potential amounts owed by a Fund at April 30, 2022. |
| 80 | 2 0 2 2 B L A C K R O C K A N N U A L R E P O R T T O S H A R E H O L D E R S |
Notes to Financial Statements (continued)
For the year ended April 30, 2022, the following table is a summary of each Fund’s Loan for TOB Trust Certificates:
| Fund Name | Loans Outstanding at Period End |
Range of Interest Rates on Loans at Period End |
Average Loans Outstanding |
Daily Weighted Average Rate of Interest and Other Expenses on Loans |
||||||||||||
| MUI |
$ | — | — | % | $ | 21,349 | 0.71 | % | ||||||||
| MHD |
— | — | 89,770 | 0.69 | ||||||||||||
| MVT |
— | — | 7,282 | 0.71 | ||||||||||||
| 5. | DERIVATIVE FINANCIAL INSTRUMENTS |
The Funds engage in various portfolio investment strategies using derivative contracts both to increase the returns of the Funds and/or to manage their exposure to certain risks such as credit risk, equity risk, interest rate risk, foreign currency exchange rate risk, commodity price risk or other risks (e.g., inflation risk). Derivative financial instruments categorized by risk exposure are included in the Schedules of Investments. These contracts may be transacted on an exchange or over-the-counter (“OTC”).
Futures Contracts: Futures contracts are purchased or sold to gain exposure to, or manage exposure to, changes in interest rates (interest rate risk) and changes in the value of equity securities (equity risk) or foreign currencies (foreign currency exchange rate risk).
Futures contracts are exchange-traded agreements between the Funds and a counterparty to buy or sell a specific quantity of an underlying instrument at a specified price and on a specified date. Depending on the terms of a contract, it is settled either through physical delivery of the underlying instrument on the settlement date or by payment of a cash amount on the settlement date. Upon entering into a futures contract, the Funds are required to deposit initial margin with the broker in the form of cash or securities in an amount that varies depending on a contract’s size and risk profile. The initial margin deposit must then be maintained at an established level over the life of the contract. Amounts pledged, which are considered restricted, are included in cash pledged for futures contracts in the Statements of Assets and Liabilities.
Securities deposited as initial margin are designated in the Schedules of Investments and cash deposited, if any, are shown as cash pledged for futures contracts in the Statements of Assets and Liabilities. Pursuant to the contract, the Funds agree to receive from or pay to the broker an amount of cash equal to the daily fluctuation in market value of the contract (“variation margin”). Variation margin is recorded as unrealized appreciation (depreciation) and, if any, shown as variation margin receivable (or payable) on futures contracts in the Statements of Assets and Liabilities. When the contract is closed, a realized gain or loss is recorded in the Statements of Operations equal to the difference between the notional amount of the contract at the time it was opened and the notional amount at the time it was closed. The use of futures contracts involves the risk of an imperfect correlation in the movements in the price of futures contracts and interest rates, foreign currency exchange rates or underlying assets.
| 6. | INVESTMENT ADVISORY AGREEMENT AND OTHER TRANSACTIONS WITH AFFILIATES |
Investment Advisory: Each Fund entered into an Investment Advisory Agreement with the Manager, the Funds’ investment adviser and an indirect, wholly-owned subsidiary of BlackRock, Inc. (“BlackRock”), to provide investment advisory and administrative services. The Manager is responsible for the management of each Fund’s portfolio and provides the personnel, facilities, equipment and certain other services necessary to the operations of each Fund.
For such services, each Fund, except MUI, pays the Manager a monthly fee at an annual rate equal to the following percentages of the average daily value of each Fund’s net assets:
| Fund Name | Investment Advisory Fees |
|||
| MUA |
0.55 | % | ||
| MHD |
0.55 | |||
| MVT |
0.50 | |||
For such services, MUI pays the Manager a monthly fee of 0.55% of (i) the average daily value of MUI’s net assets and (ii) the proceeds of any outstanding debt securities and borrowings used for leverage.
For purposes of calculating these fees, “net assets” mean the total assets of the Fund minus the sum of its accrued liabilities (which does not include liabilities represented by TOB Trusts and the liquidation preference of any outstanding preferred shares). It is understood that the liquidation preference of any outstanding preferred stock (other than accumulated dividends) and TOB Trusts is not considered a liability in determining a Fund’s NAV.
Distribution Fees: MUA has entered into a Distribution Agreement with BlackRock Investments, LLC (“BRIL”), an affiliate of the Manager, to provide for distribution of MUA common shares on a reasonable best efforts basis through an equity shelf offering (a “Shelf Offering”) (the “Distribution Agreement”). Pursuant to the Distribution Agreement, BRIL will receive commissions with respect to sales of common shares at a commission rate of 1.00% of the gross proceeds of the sale of MUA’s common shares and a portion of such commission is re-allowed to broker-dealers engaged by BRIL. The commissions retained by BRIL during the period ended April 30, 2022 amounted to $25,940.
Waivers: With respect to each Fund, the Manager contractually agreed to waive its investment advisory fees by the amount of investment advisory fees each Fund pays to the Manager indirectly through its investment in affiliated money market funds (the “affiliated money market fund waiver”) through June 30, 2023. The contractual agreement may
| N O T E S T O F I N A N C I A L S T A T E M E N T S |
81 |
Notes to Financial Statements (continued)
be terminated upon 90 days’ notice by a majority of the Independent Directors, or by a vote of a majority of the outstanding voting securities of a Fund. These amounts are included in fees waived and/or reimbursed by the Manager in the Statements of Operations. For the year ended April 30, 2022, the amounts waived were as follows:
|
|
||||
| Fund Name | Fees Waived and/or Reimbursed by the Manager |
|||
|
|
||||
| MUA |
$ | 5,207 | ||
| MUI |
3,087 | |||
| MHD |
4,106 | |||
| MVT |
2,158 | |||
|
|
||||
The Manager contractually agreed to waive its investment advisory fee with respect to any portion of each Fund’s assets invested in affiliated equity and fixed-income mutual funds and affiliated exchange-traded funds that have a contractual management fee through June 30, 2023. The agreement can be renewed for annual periods thereafter, and may be terminated on 90 days’ notice, each subject to approval by a majority of the Funds’ Independent Directors. For the year ended April 30, 2022, there were no fees waived by the Manager pursuant to this arrangement.
With respect to MHD, the Manager contractually agreed to waive a portion of its investment advisory fees equal to the annual rate of 0.01% of the average daily value of net assets through June 30, 2022. The contractual agreement may be terminated upon 90 days’ notice by a majority of the Independent Directors, or by a vote of a majority of the outstanding voting securities of the Fund. This amount is included in fees waived and/or reimbursed by the Manager in the Statements of Operations. For the year ended April 30, 2022, the amounts waived was $145,647.
Directors and Officers: Certain directors and/or officers of the Funds are directors and/or officers of BlackRock or its affiliates. The Funds reimburse the Manager for a portion of the compensation paid to the Funds’ Chief Compliance Officer, which is included in Directors and Officer in the Statements of Operations.
| 7. | PURCHASES AND SALES |
For the year ended April 30, 2022, purchases and sales of investments, excluding short-term investments, were as follows:
|
|
||||||||
| Fund Name | Purchases | Sales | ||||||
|
|
||||||||
| MUA |
$ | 303,864,530 | $ | 156,179,629 | ||||
| MUI |
291,357,999 | 255,292,656 | ||||||
| MHD |
220,570,354 | 234,134,455 | ||||||
| MVT |
72,465,116 | 74,537,403 | ||||||
|
|
||||||||
| 8. | INCOME TAX INFORMATION |
It is each Fund’s policy to comply with the requirements of the Internal Revenue Code of 1986, as amended, applicable to regulated investment companies, and to distribute substantially all of its taxable income to its shareholders. Therefore, no U.S. federal income tax provision is required.
Each Fund files U.S. federal and various state and local tax returns. No income tax returns are currently under examination. The statute of limitations on each Fund’s U.S. federal tax returns generally remains open for a period of three fiscal years after they are filed. The statutes of limitations on each Fund’s state and local tax returns may remain open for an additional year depending upon the jurisdiction.
Management has analyzed tax laws and regulations and their application to the Funds as of April 30, 2022, inclusive of the open tax return years, and does not believe that there are any uncertain tax positions that require recognition of a tax liability in the Funds’ financial statements.
U.S. GAAP requires that certain components of net assets be adjusted to reflect permanent differences between financial and tax reporting. These reclassifications have no effect on net assets or NAVs per share. As of period end, permanent differences attributable to non-deductible expenses were reclassified to the following accounts:
|
|
||||||||
| Fund Name | Paid-in Capital | Accumulated Earnings (Loss) |
||||||
|
|
||||||||
| MUA |
$ | (99,907 | ) | $ | 99,907 | |||
| MUI |
(374,284 | ) | 374,284 | |||||
|
|
||||||||
The tax character of distributions paid was as follows:
|
|
||||||||
| Fund Name | Year Ended 04/30/22 |
Year Ended 04/30/21 |
||||||
|
|
||||||||
| MUA |
||||||||
| Tax-exempt income |
$ | 22,728,368 | $ | 23,078,942 | ||||
| Ordinary income |
1,134,817 | 320,432 | ||||||
| Long-term capital gains |
4,493,321 | — | ||||||
|
|
|
|
|
|||||
| $ | 28,356,506 | $ | 23,399,374 | |||||
| 82 | 2 0 2 2 B L A C K R O C K A N N U A L R E P O R T T O S H A R E H O L D E R S |
Notes to Financial Statements (continued)
|
|
||||||||
| Fund Name (continued) | Year Ended 04/30/22 |
Year Ended 04/30/21 |
||||||
|
|
||||||||
| MUI |
||||||||
| Tax-exempt income |
$ | 28,218,624 | $ | 27,173,482 | ||||
| Ordinary income |
224 | 647 | ||||||
|
|
|
|
|
|||||
| $ | 28,218,848 | $ | 27,174,129 | |||||
| MHD |
||||||||
| Tax-exempt income |
$ | 42,440,742 | $ | 13,947,656 | ||||
| Ordinary income |
29,438 | 15,907 | ||||||
| Long-term capital gains |
47,830 | — | ||||||
|
|
|
|
|
|||||
| $ | 42,518,010 | $ | 13,963,563 | |||||
| MVT |
||||||||
| Tax-exempt income |
$ | 16,482,423 | $ | 16,096,972 | ||||
| Ordinary income |
6,361 | 2,894 | ||||||
|
|
|
|
|
|||||
| $ | 16,488,784 | $ | 16,099,866 | |||||
|
|
|
|
|
|||||
As of April 30, 2022, the tax components of accumulated earnings (loss) were as follows:
|
|
||||||||||||||||||||||||||||
| Fund Name |
|
Undistributed Tax-Exempt Income |
|
|
Undistributed Ordinary Income |
|
|
Undistributed Long-Term Capital Gains |
|
|
Non-Expiring Capital Loss Carryforwards(a) |
|
|
Net Unrealized Gains (Losses)(b) |
|
|
Qualified Late-Year Loss(c) |
|
Total | |||||||||
|
|
||||||||||||||||||||||||||||
| MUA |
$ | — | $ | 1,006,339 | $ | 6,857,840 | $ | — | $ | (41,470,867 | ) | $ | (3,447,590 | ) | $ | (37,054,278 | ) | |||||||||||
| MUI |
1,393,670 | — | — | (10,360,706 | ) | (53,604,909 | ) | — | (62,571,945 | ) | ||||||||||||||||||
| MHD |
2,356,459 | 100,776 | — | (22,280,647 | ) | (27,036,951 | ) | — | (46,860,363 | ) | ||||||||||||||||||
| MVT |
— | 55,092 | — | (3,040,843 | ) | (11,618,575 | ) | — | (14,604,326 | ) | ||||||||||||||||||
|
|
||||||||||||||||||||||||||||
| (a) | Subject to limitation, amounts available to offset future realized capital gains. |
| (b) | The difference between book-basis and tax-basis net unrealized gains were attributable primarily to the tax deferral of losses on wash sales and straddles, amortization and accretion methods of premiums and discounts on fixed income securities, the realization for tax purposes of unrealized gains (losses) on certain futures contracts, the accrual of income on securities in default, the treatment of residual interests in tender option bond trusts and the deferral of compensation to Directors. |
| (c) | The Fund has elected to defer certain qualified late-year losses and recognize such losses in the next taxable year. |
During the year ended April 30, 2022, the Funds listed below utilized the following amounts of their respective capital loss carryforward:
|
|
||||
| Fund Name | Amounts | |||
|
|
||||
| MHD |
$ | 5,015,541 | ||
| MVT |
2,228,618 | |||
|
|
||||
As of April 30, 2022, gross unrealized appreciation and depreciation based on cost of investments (including short positions and derivatives, if any) for U.S. federal income tax purposes were as follows:
|
|
||||||||||||||||
| Fund Name | Tax Cost | Gross Unrealized Appreciation |
Gross Unrealized Depreciation |
Net Unrealized Appreciation (Depreciation) |
||||||||||||
|
|
||||||||||||||||
| MUA |
$ | 680,752,975 | $ | 21,735,963 | $ | (62,280,759 | ) | $ | (40,544,796 | ) | ||||||
| MUI |
1,607,322,891 | 21,150,006 | (74,174,054 | ) | (53,024,048 | ) | ||||||||||
| MHD |
1,139,673,330 | 33,436,183 | (60,427,150 | ) | (26,990,967 | ) | ||||||||||
| MVT |
427,084,969 | 11,583,407 | (22,888,668 | ) | (11,305,261 | ) | ||||||||||
|
|
||||||||||||||||
| 9. | PRINCIPAL RISKS |
In the normal course of business, the Funds invest in securities or other instruments and may enter into certain transactions, and such activities subject each Fund to various risks, including among others, fluctuations in the market (market risk) or failure of an issuer to meet all of its obligations. The value of securities or other instruments may also be affected by various factors, including, without limitation: (i) the general economy; (ii) the overall market as well as local, regional or global political and/or social instability; (iii) regulation, taxation or international tax treaties between various countries; or (iv) currency, interest rate and price fluctuations. Local, regional or global events such as war, acts of terrorism, the spread of infectious illness or other public health issues, recessions, or other events could have a significant impact on the Funds and their investments. MUA’s prospectus provides details of the risks to which the Fund is subject.
The Funds may hold a significant amount of bonds subject to calls by the issuers at defined dates and prices. When bonds are called by issuers and the Funds reinvest the proceeds received, such investments may be in securities with lower yields than the bonds originally held, and correspondingly, could adversely impact the yield and total return performance of a Fund.
A Fund structures and “sponsors” the TOB Trusts in which it holds TOB Residuals and has certain duties and responsibilities, which may give rise to certain additional risks including, but not limited to, compliance, securities law and operational risks.
| N O T E S T O F I N A N C I A L S T A T E M E N T S |
83 |
Notes to Financial Statements (continued)
Should short-term interest rates rise, the Funds’ investments in the TOB Trusts may adversely affect the Funds’ net investment income and dividends to Common Shareholders. Also, fluctuations in the market value of municipal bonds deposited into the TOB Trust may adversely affect the Funds’ NAVs per share.
The U.S. Securities and Exchange Commission (“SEC”) and various federal banking and housing agencies have adopted credit risk retention rules for securitizations (the “Risk Retention Rules”). The Risk Retention Rules would require the sponsor of a TOB Trust to retain at least 5% of the credit risk of the underlying assets supporting the TOB Trust’s municipal bonds. The Risk Retention Rules may adversely affect the Funds’ ability to engage in TOB Trust transactions or increase the costs of such transactions in certain circumstances.
TOB Trusts constitute an important component of the municipal bond market. Any modifications or changes to rules governing TOB Trusts may adversely impact the municipal market and the Funds, including through reduced demand for and liquidity of municipal bonds and increased financing costs for municipal issuers. The ultimate impact of any potential modifications on the TOB Trust market and the overall municipal market is not yet certain.
Each Fund may invest without limitation in illiquid or less liquid investments or investments in which no secondary market is readily available or which are otherwise illiquid, including private placement securities. A Fund may not be able to readily dispose of such investments at prices that approximate those at which a Fund could sell such investments if they were more widely traded and, as a result of such illiquidity, a Fund may have to sell other investments or engage in borrowing transactions if necessary to raise funds to meet its obligations. Limited liquidity can also affect the market price of investments, thereby adversely affecting a Fund’s NAV and ability to make dividend distributions. Privately issued debt securities are often of below investment grade quality, frequently are unrated and present many of the same risks as investing in below investment grade public debt securities.
Market Risk: Each Fund may be exposed to prepayment risk, which is the risk that borrowers may exercise their option to prepay principal earlier than scheduled during periods of declining interest rates, which would force each Fund to reinvest in lower yielding securities. Each Fund may also be exposed to reinvestment risk, which is the risk that income from each Fund’s portfolio will decline if each Fund invests the proceeds from matured, traded or called fixed-income securities at market interest rates that are below each Fund portfolio’s current earnings rate.
Municipal securities are subject to the risk that litigation, legislation or other political events, local business or economic conditions, credit rating downgrades, or the bankruptcy of the issuer could have a significant effect on an issuer’s ability to make payments of principal and/or interest or otherwise affect the value of such securities. Municipal securities can be significantly affected by political or economic changes, including changes made in the law after issuance of the securities, as well as uncertainties in the municipal market related to, taxation, legislative changes or the rights of municipal security holders, including in connection with an issuer insolvency. Municipal securities backed by current or anticipated revenues from a specific project or specific assets can be negatively affected by the discontinuance of the tax benefits supporting the project or assets or the inability to collect revenues for the project or from the assets. Municipal securities may be less liquid than taxable bonds, and there may be less publicly available information on the financial condition of municipal security issuers than for issuers of other securities.
An outbreak of respiratory disease caused by a novel coronavirus has developed into a global pandemic and has resulted in closing borders, quarantines, disruptions to supply chains and customer activity, as well as general concern and uncertainty. The impact of this pandemic, and other global health crises that may arise in the future, could affect the economies of many nations, individual companies and the market in general in ways that cannot necessarily be foreseen at the present time. This pandemic may result in substantial market volatility and may adversely impact the prices and liquidity of a fund’s investments. Although vaccines have been developed and approved for use by various governments, the duration of this pandemic and its effects cannot be determined with certainty.
Counterparty Credit Risk: The Funds may be exposed to counterparty credit risk, or the risk that an entity may fail to or be unable to perform on its commitments related to unsettled or open transactions, including making timely interest and/or principal payments or otherwise honoring its obligations. The Funds manage counterparty credit risk by entering into transactions only with counterparties that the Manager believes have the financial resources to honor their obligations and by monitoring the financial stability of those counterparties. Financial assets, which potentially expose the Funds to market, issuer and counterparty credit risks, consist principally of financial instruments and receivables due from counterparties. The extent of the Funds’ exposure to market, issuer and counterparty credit risks with respect to these financial assets is approximately their value recorded in the Statements of Assets and Liabilities, less any collateral held by the Funds.
A derivative contract may suffer a mark-to-market loss if the value of the contract decreases due to an unfavorable change in the market rates or values of the underlying instrument. Losses can also occur if the counterparty does not perform under the contract.
With exchange-traded futures, there is less counterparty credit risk to the Funds since the exchange or clearinghouse, as counterparty to such instruments, guarantees against a possible default. The clearinghouse stands between the buyer and the seller of the contract; therefore, credit risk is limited to failure of the clearinghouse. While offset rights may exist under applicable law, a Fund does not have a contractual right of offset against a clearing broker or clearinghouse in the event of a default (including the bankruptcy or insolvency). Additionally, credit risk exists in exchange-traded futures with respect to initial and variation margin that is held in a clearing broker’s customer accounts. While clearing brokers are required to segregate customer margin from their own assets, in the event that a clearing broker becomes insolvent or goes into bankruptcy and at that time there is a shortfall in the aggregate amount of margin held by the clearing broker for all its clients, typically the shortfall would be allocated on a pro rata basis across all the clearing broker’s customers, potentially resulting in losses to the Funds.
Concentration Risk: A diversified portfolio, where this is appropriate and consistent with a fund’s objectives, minimizes the risk that a price change of a particular investment will have a material impact on the NAV of a fund. The investment concentrations within each Fund’s portfolio are disclosed in its Schedule of Investments.
Certain Funds invest a significant portion of their assets in securities within a single or limited number of market sectors. When a Fund concentrates its investments in this manner, it assumes the risk that economic, regulatory, political and social conditions affecting such sectors may have a significant impact on the Fund and could affect the income from, or the value or liquidity of, the Fund’s portfolio. Investment percentages in specific sectors are presented in the Schedules of Investments.
Certain Funds invest a significant portion of their assets in high yield securities. High yield securities that are rated below investment-grade (commonly referred to as “junk bonds”) or are unrated may be deemed speculative, involve greater levels of risk than higher-rated securities of similar maturity and are more likely to default. High yield
| 84 | 2 0 2 2 B L A C K R O C K A N N U A L R E P O R T T O S H A R E H O L D E R S |
Notes to Financial Statements (continued)
securities may be issued by less creditworthy issuers, and issuers of high yield securities may be unable to meet their interest or principal payment obligations. High yield securities are subject to extreme price fluctuations, may be less liquid than higher rated fixed-income securities, even under normal economic conditions, and frequently have redemption features.
Certain Funds invest a significant portion of their assets in fixed-income securities and/or use derivatives tied to the fixed-income markets. Changes in market interest rates or economic conditions may affect the value and/or liquidity of such investments. Interest rate risk is the risk that prices of bonds and other fixed-income securities will increase as interest rates fall and decrease as interest rates rise. The Funds may be subject to a greater risk of rising interest rates due to the current period of historically low rates.
LIBOR Transition Risk: The United Kingdom’s Financial Conduct Authority announced a phase out of the London Interbank Offered Rate (“LIBOR”). Although many LIBOR rates ceased to be published or no longer are representative of the underlying market they seek to measure after December 31, 2021, a selection of widely used USD LIBOR rates will continue to be published through June 2023 in order to assist with the transition. The Funds may be exposed to financial instruments tied to LIBOR to determine payment obligations, financing terms, hedging strategies or investment value. The transition process away from LIBOR might lead to increased volatility and illiquidity in markets for, and reduce the effectiveness of new hedges placed against instruments whose terms currently include LIBOR. The ultimate effect of the LIBOR transition process on the Funds is uncertain.
| 10. | CAPITAL SHARE TRANSACTIONS |
Each Fund is authorized to issue 200 million shares, all of which were initially classified as Common Shares. The par value for each Fund’s Common Shares is $0.10. The par value for each of Fund’s Preferred Shares outstanding is $0.10. Each Board is authorized, however, to reclassify any unissued Common Shares to Preferred Shares without the approval of Common Shareholders.
Common Shares
For the periods shown, shares issued and outstanding increased by the following amounts as a result of dividend reinvestment:
|
|
||||||||
| Year Ended | ||||||||
|
|
|
|||||||
| Fund Name | 04/30/22 | 04/30/21 | ||||||
|
|
||||||||
| MUA |
68,542 | 62,648 | ||||||
| MVT |
29,928 | — | ||||||
|
|
||||||||
For the year ended April 30, 2022, shares issued and outstanding remained constant for MHD.
For the year ended April 30, 2022, Common Shares of MUI issued and outstanding increased by 35,574,715 as a result of the reorganization of MFL with and into MUI.
For the year ended April 30, 2022, Common Shares of MUI issued and outstanding decreased by 10 as a result of a redemption of fractional shares from the reorganization of MFL with and into MUI.
For the year ended April 30, 2021, Common Shares of MHD issued and outstanding increased by 39,147,091 as a result of the reorganization of BAF, BBK, MUH and MUS with and into MHD.
For the year ended April 30, 2021, Common Shares of MHD issued and outstanding decreased by 25 as a result of a redemption of fractional shares from the reorganization of BAF, BBK, MUH and MUS with and into MHD.
The Funds participate in an open market share repurchase program (the “Repurchase Program”). From December 1, 2020 through November 30, 2021, each Fund may repurchase up to 5% of its outstanding common shares under the Repurchase Program, based on common shares outstanding as of the close of business on November 30, 2020, subject to certain conditions. From December 1, 2021 through November 30, 2022, each Fund may repurchase up to 5% of its outstanding common shares under the Repurchase Program, based on common shares outstanding as of the close of business on November 30, 2021, subject to certain conditions. The Repurchase Program has an accretive effect as shares are purchased at a discount to the Fund’s NAV. There is no assurance that the Funds will purchase shares in any particular amounts. For the year ended April 30, 2022, the Funds did not repurchase any shares.
MUA has filed a prospectus with the SEC allowing it to issue an additional 5,500,000 Common Shares through an equity shelf program (a “Shelf Offering”). Under the Shelf Offering, MUA, subject to market conditions, may raise additional equity capital from time to time in varying amounts and utilizing various offering methods at a net price at or above the Fund’s NAV per Common Share (calculated within 48 hours of pricing). As of period end, 5,129,166 Common Shares remain available for issuance under the Shelf Offering. During the year ended April 30, 2022, MUA issued 813,604 shares under the Shelf Offering. See Additional Information - Shelf Offering Program for additional information.
Initial costs incurred by MUA in connection with its shelf offering are recorded as “Deferred offering costs” in the Statements of Assets and Liabilities. As shares are sold, a portion of the costs attributable to the shares sold will be charged against paid-in-capital. Any remaining deferred charges at the end of the shelf offering period will be charged to expense.
Preferred Shares
A Fund’s Preferred Shares rank prior to its Common Shares as to the payment of dividends by the Fund and distribution of assets upon dissolution or liquidation of the Fund. The 1940 Act prohibits the declaration of any dividend on Common Shares or the repurchase of Common Shares if the Fund fails to maintain asset coverage of at least 200% of the liquidation preference of the Fund’s outstanding Preferred Shares. In addition, pursuant to the Preferred Shares’ governing instruments, a Fund is restricted from
| N O T E S T O F I N A N C I A L S T A T E M E N T S |
85 |
Notes to Financial Statements (continued)
declaring and paying dividends on classes of shares ranking junior to or on parity with its Preferred Shares or repurchasing such shares if the Fund fails to declare and pay dividends on the Preferred Shares, redeem any Preferred Shares required to be redeemed under the Preferred Shares’ governing instruments or comply with the basic maintenance amount requirement of the ratings agencies rating the Preferred Shares.
Holders of Preferred Shares have voting rights equal to the voting rights of holders of Common Shares (one vote per share) and vote together with holders of Common Shares (one vote per share) as a single class on certain matters. Holders of Preferred Shares, voting as a separate class, are also entitled to (i) elect two members of the Board, (ii) elect the full Board if dividends on the Preferred Shares are not paid for a period of two years and (iii) a separate class vote to amend the Preferred Share governing documents. In addition, the 1940 Act requires the approval of the holders of a majority of any outstanding Preferred Shares, voting as a separate class, to (a) adopt any plan of reorganization that would adversely affect the Preferred Shares, (b) change a Fund’s sub-classification as a closed-end investment company or change its fundamental investment restrictions or (c) change its business so as to cease to be an investment company.
VRDP Shares
MUA and MUI (for purposes of this section, each “VRDP Fund”) have issued Series W-7 VRDP Shares, $100,000 liquidation preference per share, in one or more privately negotiated offerings to qualified institutional buyers as defined pursuant to Rule 144A under the Securities Act of 1933, as amended (the “Securities Act”). The VRDP Shares include a liquidity feature and may be subject to a special rate period. As of period end, the VRDP Shares outstanding were as follows:
|
|
||||||||||||||||
| Fund Name |
|
Issue Date |
|
|
Shares Issued |
|
|
Aggregate Principal |
|
|
Maturity Date |
| ||||
|
|
||||||||||||||||
| MUA |
12/15/21 | 1,750 | $ | 175,000,000 | 01/01/52 | |||||||||||
| MUI |
04/07/22 | 2,871 | 287,100,000 | 04/07/52 | ||||||||||||
| 04/11/22 | 2,746 | 274,600,000 | 04/07/52 | |||||||||||||
|
|
||||||||||||||||
Redemption Terms: A VRDP Fund is required to redeem its VRDP Shares on the maturity date, unless earlier redeemed or repurchased. Six months prior to the maturity date, a VRDP Fund is required to begin to segregate liquid assets with the Fund’s custodian to fund the redemption. In addition, a VRDP Fund is required to redeem certain of its outstanding VRDP Shares if it fails to comply with certain asset coverage, basic maintenance amount or leverage requirements.
Subject to certain conditions, the VRDP Shares may also be redeemed, in whole or in part, at any time at the option of a VRDP Fund. The redemption price per VRDP Share is equal to the liquidation preference per share plus any outstanding unpaid dividends.
Liquidity Feature: VRDP Shares are subject to a fee agreement between the VRDP Fund and the liquidity provider that requires a per annum liquidity fee and, in some cases, an upfront or initial commitment fee, payable to the liquidity provider. These fees, if applicable, are shown as liquidity fees in the Statements of Operations. As of period end, the fee agreement is set to expire, unless renewed or terminated in advance, as follows:
|
|
||||||||
| MUA | MUI | |||||||
|
|
||||||||
| Expiration date |
04/30/24 | 04/30/23 | ||||||
|
|
||||||||
The VRDP Shares are also subject to a purchase agreement in connection with the liquidity feature. In the event a purchase agreement is not renewed or is terminated in advance, and the VRDP Shares do not become subject to a purchase agreement with an alternate liquidity provider, the VRDP Shares will be subject to mandatory purchase by the liquidity provider prior to the termination of the purchase agreement. In the event of such mandatory purchase, a VRDP Fund is required to redeem the VRDP Shares six months after the purchase date. Immediately after such mandatory purchase, the VRDP Fund is required to begin to segregate liquid assets with its custodian to fund the redemption. There is no assurance that a VRDP Fund will replace such redeemed VRDP Shares with any other preferred shares or other form of leverage.
Remarketing: A VRDP Fund may incur remarketing fees on the aggregate principal amount of all its VRDP Shares, which, if any, are included in remarketing fees on Preferred Shares in the Statements of Operations. During any special rate period (as described below), a VRDP Fund may incur nominal or no remarketing fees.
Ratings: As of period end, the VRDP Shares were assigned the following ratings:
|
|
||||||||
| Fund Name |
|
Moody’s Investors Service, Inc. Long-Term Ratings |
|
|
Fitch Ratings, Inc. Long-Term Ratings |
| ||
|
|
||||||||
| MUA |
Aa2 | N/A | ||||||
| MUI |
Aa1 | AA | ||||||
|
|
||||||||
Special Rate Period: A VRDP Fund has commenced a “special rate period” with respect to its VRDP Shares, during which the VRDP Shares will not be subject to any remarketing and the dividend rate will be based on a predetermined methodology. During a special rate period, short-term ratings on VRDP Shares are withdrawn. As of period end, the following VRDP Funds have commenced a special rate period:
|
|
||||||||
| Fund Name |
|
Commencement Date |
|
|
Expiration Date as of Period Ended 04/30/22 |
| ||
|
|
||||||||
| MUA |
12/15/21 | 04/15/24 | ||||||
| MUI |
04/07/22 | 04/15/23 | ||||||
|
|
||||||||
| 86 | 2 0 2 2 B L A C K R O C K A N N U A L R E P O R T T O S H A R E H O L D E R S |
Notes to Financial Statements (continued)
Prior to the expiration date, the VRDP Fund and the VRDP Shares holder may mutually agree to extend the special rate period. If a special rate period is not extended, the VRDP Shares will revert to remarketable securities upon the termination of the special rate period and will be remarketed and available for purchase by qualified institutional investors.
During the special rate period: (i) the liquidity and fee agreements remain in effect, (ii) VRDP Shares remain subject to mandatory redemption by the VRDP Fund on the maturity date, (iii) VRDP Shares will not be remarketed or subject to optional or mandatory tender events, (iv) the VRDP Fund is required to comply with the same asset coverage, basic maintenance amount and leverage requirements for the VRDP Shares as is required when the VRDP Shares are not in a special rate period, (v) the VRDP Fund will pay dividends monthly based on the sum of an agreed upon reference rate and a percentage per annum based on the long-term ratings assigned to the VRDP Shares and (vi) the VRDP Fund will pay nominal or no fees to the liquidity provider and remarketing agent.
Dividends: Except during the Special Rate Period as described above, dividends on the VRDP Shares are payable monthly at a variable rate set weekly by the remarketing agent. Such dividend rates are generally based upon a spread over a base rate and cannot exceed a maximum rate. A change in the short-term credit rating of the liquidity provider or the VRDP Shares may adversely affect the dividend rate paid on such shares, although the dividend rate paid on the VRDP Shares is not directly based upon either short-term rating. In the event of a failed remarketing, the dividend rate of the VRDP Shares will be reset to a maximum rate. The maximum rate is determined based on, among other things, the long-term preferred share rating assigned to the VRDP Shares and the length of time that the VRDP Shares fail to be remarketed.
For the year ended April 30, 2022, the annualized dividend rate for the VRDP Shares were as follows:
| MUA | MUI | |||||
| Dividend rates |
1.21 | % | 1.31% | |||
During the year ended April 30, 2022, MUA issued 1,750 shares.
During the year ended April 30, 2022, issued and outstanding VRDP Shares for MUI increased by 2,871 from the exchange of VMTP Shares and 2,746 due to the reorganization of MFL with and into MUI.
VMTP Shares
MHD and MVT (for purposes of this section, each a “VMTP Fund”), have issued Series W-7 VMTP Shares, $100,000 liquidation preference per share, in one or more privately negotiated offerings to qualified institutional buyers as defined pursuant to Rule 144A under the Securities Act of 1933, as amended (the “Securities Act”). The VMTP Shares are subject to certain restrictions on transfer, and a VMTP Fund may also be required to register its VMTP Shares for sale under the Securities Act under certain circumstances. As of period end, the VMTP Shares outstanding and assigned long-term ratings were as follows:
|
|
||||||||||||||||||||||||
| Fund Name |
|
Issue Date |
|
|
Shares Issued |
|
|
Aggregate Principal |
|
|
Term Redemption Date |
|
|
Moody’s Rating |
|
|
Fitch Rating |
| ||||||
|
|
||||||||||||||||||||||||
| MHD |
12/16/11 | 837 | $ | 83,700,000 | 07/02/23 | Aa1 | AA | |||||||||||||||||
| 03/08/21 | 2,641 | 264,100,000 | 07/02/23 | Aa1 | AA | |||||||||||||||||||
| MVT |
12/16/11 | 1,400 | 140,000,000 | 07/02/23 | Aa1 | AA | ||||||||||||||||||
|
|
||||||||||||||||||||||||
Redemption Terms: Each VMTP Fund is required to redeem its VMTP Shares on the term redemption date, unless earlier redeemed or repurchased or unless extended. There is no assurance that a term will be extended further or that any VMTP Shares will be replaced with any other preferred shares or other form of leverage upon the redemption or repurchase of the VMTP Shares. Six months prior to the term redemption date, a VMTP Fund is required to begin to segregate liquid assets with its custodian to fund the redemption. In addition, a VMTP Fund is required to redeem certain of its outstanding VMTP Shares if it fails to comply with certain asset coverage, basic maintenance amount or leverage requirements.
Subject to certain conditions, VMTP Shares may be redeemed, in whole or in part, at any time at the option of the VMTP Fund. With respect to MHD and MVT, the redemption price per VMTP Share is equal to the liquidation preference per share plus any outstanding unpaid dividends and applicable redemption premium. If MHD and MVT redeems the VMTP Shares prior to the term redemption date and the VMTP Shares have long-term ratings above A1/A+ or its equivalent by the ratings agencies then rating the VMTP Shares, then such redemption may be subject to a prescribed redemption premium (up to 2% of the liquidation preference) payable to the holder of the VMTP Shares based on the time remaining until the term redemption date, subject to certain exceptions for redemptions that are required to comply with minimum asset coverage requirements.
Dividends: Dividends on the VMTP Shares are declared daily and payable monthly at a variable rate set weekly at a fixed rate spread to the Securities Industry and Financial Markets Association (“SIFMA”) Municipal Swap Index or to a percentage of the one-month LIBOR rate, as set forth in the VMTP Shares governing instrument. The fixed spread is determined based on the long-term preferred share rating assigned to the VMTP Shares by the ratings agencies then rating the VMTP Shares.
The dividend rate on VMTP Shares is subject to a step-up spread if the VMTP Fund fails to comply with certain provisions, including, among other things, the timely payment of dividends, redemptions or gross-up payments, and complying with certain asset coverage and leverage requirements.
For the year ended April 30, 2022, the average annualized dividend rates for the VMTP Shares were as follows:
| MHD | MVT | |||||
| Dividend rates |
1.07 | % | 1.07% | |||
For the year ended April 30, 2022, VMTP Shares issued and outstanding of each VMTP Fund remained constant.
During the year ended April 30, 2022, all issued and outstanding VMTP Shares of MUI were redeemed in full in exchange for VRDP Shares.
| N O T E S T O F I N A N C I A L S T A T E M E N T S |
87 |
Notes to Financial Statements (continued)
Offering Costs: The Funds incurred costs in connection with the issuance of VRDP and VMTP Shares, which were recorded as a direct deduction from the carrying value of the related debt liability and will be amortized over the life of the VRDP and VMTP Shares with the exception of any upfront fees paid by a VRDP Fund to the liquidity provider which, if any, were amortized over the life of the liquidity agreement. Amortization of these costs is included in interest expense, fees and amortization of offering costs in the Statements of Operations.
Financial Reporting: The VRDP and VMTP Shares are considered debt of the issuer; therefore, the liquidation preference, which approximates fair value of the VRDP and VMTP Shares, is recorded as a liability in the Statements of Assets and Liabilities net of deferred offering costs. Unpaid dividends are included in interest expense and fees payable in the Statements of Assets and Liabilities, and the dividends accrued and paid on the VRDP and VMTP Shares are included as a component of interest expense, fees and amortization of offering costs in the Statements of Operations. The VRDP and VMTP Shares are treated as equity for tax purposes. Dividends paid to holders of the VRDP and VMTP Shares are generally classified as tax-exempt income for tax-reporting purposes. Dividends and amortization of deferred offering costs on VRDP and VMTP Shares are included in interest expense, fees and amortization of offering costs in the Statements of Operations:
|
|
||||||||
| Fund Name |
Dividends Accrued | |
Deferred Offering Costs Amortization |
| ||||
|
|
||||||||
| MUA |
$ | 796,992 | $ 1,304 | |||||
| MUI |
3,402,868 | 836 | ||||||
| MHD |
3,711,085 | — | ||||||
| MVT |
1,492,758 | — | ||||||
|
|
||||||||
| 11. | SUBSEQUENT EVENTS |
Management’s evaluation of the impact of all subsequent events on the Funds’ financial statements was completed through the date the financial statements were issued and the following items were noted:
The Funds declared and paid or will pay distributions to Common Shareholders as follows:
|
|
||||||||||||||||
| Fund Name |
|
Declaration Date |
|
|
Record Date |
|
|
Payable/ Paid Date |
|
|
Dividend Per Common Share |
| ||||
|
|
||||||||||||||||
| MUA |
05/02/22 | 05/16/22 | 06/01/22 | $ 0.045500 | ||||||||||||
| 06/01/22 | 06/15/22 | 07/01/22 | 0.045500 | |||||||||||||
| MUI |
05/02/22 | 05/16/22 | 06/01/22 | 0.054000 | ||||||||||||
| 06/01/22 | 06/15/22 | 07/01/22 | 0.054000 | |||||||||||||
| MHD |
05/02/22 | 05/16/22 | 06/01/22 | 0.060500 | ||||||||||||
| 06/01/22 | 06/15/22 | 07/01/22 | 0.060500 | |||||||||||||
| MVT |
05/02/22 | 05/16/22 | 06/01/22 | 0.058500 | ||||||||||||
| 06/01/22 | 06/15/22 | 07/01/22 | 0.050000 | |||||||||||||
|
|
||||||||||||||||
The Funds declared and paid or will pay distributions to Preferred Shareholders as follows:
|
|
||||||||||||
| Preferred Shares(a) | ||||||||||||
|
|
|
|||||||||||
| Fund Name |
Shares | Series | Declared | |||||||||
|
|
||||||||||||
| MUA |
VRDP | W-7 | $ | 243,178 | ||||||||
| MUI |
VRDP | W-7 | 720,515 | |||||||||
| MHD |
VMTP | W-7 | 475,847 | |||||||||
| MVT |
VMTP | W-7 | 191,543 | |||||||||
|
|
||||||||||||
| (a) | Dividends declared for period May 1, 2022 to May 31, 2022. |
On May 20, 2022, the Board approved a change in the fiscal year end (“FYE”) of MUA, MUI, MHD and MVT, effective as of July 31, 2022, as follows:
|
|
||||||||
| Fund Name |
Current FYE | Approved FYE | ||||||
|
|
||||||||
| MUA |
April 30 | July 31 | ||||||
| MUI |
April 30 | July 31 | ||||||
| MHD |
April 30 | July 31 | ||||||
| MVT |
April 30 | July 31 | ||||||
|
|
||||||||
| 88 | 2 0 2 2 B L A C K R O C K A N N U A L R E P O R T T O S H A R E H O L D E R S |
Report of Independent Registered Public Accounting Firm
To the Shareholders and Board of Directors of BlackRock MuniAssets Fund, Inc., BlackRock Municipal Income Fund, Inc., BlackRock MuniHoldings Fund, Inc., and BlackRock MuniVest Fund II, Inc.:
Opinion on the Financial Statements and Financial Highlights
We have audited the accompanying statements of assets and liabilities of BlackRock MuniAssets Fund, Inc., BlackRock Municipal Income Fund, Inc. (formerly, BlackRock Muni Intermediate Duration Fund, Inc.), BlackRock MuniHoldings Fund, Inc., and BlackRock MuniVest Fund II, Inc. (the “Funds”), including the schedules of investments, as of April 30, 2022, the related statements of operations and cash flows for the year then ended, the statements of changes in net assets for each of the two years in the period then ended, the financial highlights for each of the five years in the period then ended, and the related notes. In our opinion, the financial statements and financial highlights present fairly, in all material respects, the financial position of the Funds as of April 30, 2022, and the results of their operations and their cash flows for the year then ended, the changes in their net assets for each of the two years in the period then ended, and the financial highlights for each of the five years in the period then ended, in conformity with accounting principles generally accepted in the United States of America.
Basis for Opinion
These financial statements and financial highlights are the responsibility of the Funds’ management. Our responsibility is to express an opinion on the Funds’ financial statements and financial highlights based on our audits. We are a public accounting firm registered with the Public Company Accounting Oversight Board (United States) (PCAOB) and are required to be independent with respect to the Funds in accordance with the U.S. federal securities laws and the applicable rules and regulations of the Securities and Exchange Commission and the PCAOB.
We conducted our audits in accordance with the standards of the PCAOB. Those standards require that we plan and perform the audit to obtain reasonable assurance about whether the financial statements and financial highlights are free of material misstatement, whether due to error or fraud. The Funds are not required to have, nor were we engaged to perform, an audit of their internal control over financial reporting. As part of our audits we are required to obtain an understanding of internal control over financial reporting but not for the purpose of expressing an opinion on the effectiveness of the Funds’ internal control over financial reporting. Accordingly, we express no such opinion.
Our audits included performing procedures to assess the risks of material misstatement of the financial statements and financial highlights, whether due to error or fraud, and performing procedures that respond to those risks. Such procedures included examining, on a test basis, evidence regarding the amounts and disclosures in the financial statements and financial highlights. Our audits also included evaluating the accounting principles used and significant estimates made by management, as well as evaluating the overall presentation of the financial statements and financial highlights. Our procedures included confirmation of securities owned as of April 30, 2022, by correspondence with the custodians or counterparties; when replies were not received, we performed other auditing procedures. We believe that our audits provide a reasonable basis for our opinion.
Deloitte & Touche LLP
Boston, Massachusetts
June 28, 2022
We have served as the auditor of one or more BlackRock investment companies since 1992.
| R E P O R T O F I N D E P E N D E N T R E G I S T E R E D P U B L I C A C C O U N T I N G F I R M |
89 |
Important Tax Information (unaudited)
The following amounts, or maximum amounts allowable by law, are hereby designated as tax-exempt interest dividends for the fiscal year ended April 30, 2022:
| Fund Name | Exempt-Interest Dividends |
|||
| MUA |
$ | 22,215,183 | ||
| MUI |
26,345,005 | |||
| MHD |
42,286,522 | |||
| MVT |
15,384,867 | |||
| MFL |
14,483,292 | (a) | ||
| (a) | For the fiscal period ended April 8, 2022. |
The Fund hereby designates the following amount, or maximum amount allowable by law, as capital gain dividends, subject to a long-term capital gains tax rate as noted below, for the fiscal year ended April 30, 2022:
|
|
||||
| Fund Name | 20% Rate Long-Term Capital Gain Dividends |
|||
|
|
||||
| MHD |
$ | 47,830 | ||
|
|
||||
The Funds hereby designate the following amounts, or maximum amounts allowable by law, as interest income eligible to be treated as a Section 163(j) interest dividend for the fiscal year ended April 30, 2022:
| Fund Name | Interest Dividend |
|||
| MUA |
$ | 629,264 | ||
| MUI |
224 | |||
| MHD |
130,214 | |||
| MVT |
58,583 | |||
| MFL |
212 | (a) | ||
| (a) | For the fiscal period ended April 8, 2022. |
The Funds hereby designate the following amounts, or maximum amounts allowable by law, as interest-related dividends and qualified short-term capital gains eligible for exemption from U.S. withholding tax for nonresident aliens and foreign corporations for the fiscal year ended April 30, 2022:
|
|
||||||||
| Fund Name |
|
Interest Related Dividends |
|
|
Qualified Short-Term Capital Gains |
| ||
|
|
||||||||
| MUA |
$ | 629,264 | $ | 970,012 | ||||
| MUI |
224 | — | ||||||
| MHD |
130,214 | — | ||||||
| MVT |
58,583 | — | ||||||
| MFL |
212 | (a) | — | |||||
|
|
||||||||
| (a) | For the fiscal period ended April 8, 2022. |
| 90 | 2 0 2 2 B L A C K R O C K A N N U A L R E P O R T T O S H A R E H O L D E R S |
Investment Objectives, Policies and Risks
Recent Changes
The following information is a summary of certain changes since April 30, 2021. This information may not reflect all of the changes that have occurred since you purchased the relevant Fund.
BlackRock MuniAssets Fund, Inc. issued Variable Rate Demand Preferred Shares on December 15, 2021. The Fund’s limit on economic leverage of up to 25% of its total assets was removed in connection with the Fund’s issuance of Variable Rate Demand Preferred Shares.
Effective October 1, 2021, BlackRock Municipal Income Fund, Inc.’s non-fundamental policy to maintain a dollar-weighted average portfolio duration, as calculated by BlackRock Advisors, LLC, of three to ten years was eliminated.
Except as noted above, during each Fund’s most recent fiscal year, there were no material changes in the Fund’s investment objectives or policies that have not been approved by shareholders or in the principal risk factors associated with investment in the Fund.
Investment Objectives and Policies
BlackRock MuniAssets Fund, Inc. (MUA)
The Fund’s investment objective is to provide high current income exempt from Federal income taxes by investing primarily in a portfolio of medium to lower grade or unrated municipal obligations the interest on which, in the opinion of bond counsel to the issuer, is exempt from Federal income taxes. The Fund seeks to achieve its investment objective by investing at least 80% of its assets, except during temporary defensive periods, in a portfolio of obligations issued by or on behalf of states, territories and possessions of the United States and their political subdivisions, agencies or instrumentalities paying interest which, in the opinion of bond counsel to the issuer, is exempt from Federal income taxes (“Municipal Bonds”). The Fund at all times, except during temporary defensive periods, will maintain at least 65% of its assets in Municipal Bonds which are rated in any one of the medium and lower rating categories of a nationally recognized statistical rating organization or are unrated. These ratings are currently Baa (Moody’s Investor Service Inc. (“Moody’s”)) or BBB (S&P Global Ratings (“S&P”) and Fitch Ratings, Inc. (“Fitch”)) or lower. These are fundamental policies of the Fund and, therefore, may not be changed without the approval of a majority of the Fund’s outstanding common stock and the outstanding preferred stock, including the Fund’s outstanding Variable Rate Demand Preferred Shares (the “VRDP Shares”), voting together as a single class, and of the holders of a majority of the outstanding preferred stock, including the VRDP Shares, voting as a separate class. A majority of the outstanding means (1) 67% or more of the shares present at a meeting, if the holders of more than 50% of the outstanding shares are present or represented by proxy, or (2) more than 50% of the outstanding shares, whichever is less. The Fund may invest directly in such securities or synthetically through the use of derivatives. The Fund is not intended as, and you should not construe it to be, a complete investment program. There can be no assurance that the Fund’s investment objective will be achieved or that the Fund’s investment program will be successful.
The Fund has the authority to invest as much as 35% of its total assets in Municipal Bonds in the higher rating categories of nationally recognized statistical rating organizations (ratings of A or higher by Moody’s, S&P or Fitch or comparable unrated securities). In addition, the Fund reserves the right to temporarily invest more than 20% of its total assets in short-term municipal securities, or short-term taxable money market securities (including commercial paper, certificates of deposit and repurchase agreements) for defensive purposes when, in the opinion of BlackRock Advisors, LLC (the “Manager”), prevailing market or financial conditions warrant. The Fund does not invest more than 25% of its total assets (taken at market value) in Municipal Bonds whose issuers are located in the same state. “Total assets” of the Fund means the Fund’s net assets plus the amount of any borrowings for investment purposes.
Ordinarily, the Fund does not intend to realize significant interest income that is subject to Federal income taxes. However, the Fund may invest all or a portion of its assets in certain tax-exempt securities classified as “private activity bonds” (“PABs”) (in general, bonds that benefit non-governmental entities) that may subject certain investors in the Fund to a Federal alternative minimum tax.
The Fund may invest in securities not issued by or on behalf of a state or territory or by an agency or instrumentality thereof, if the Fund receives an opinion of counsel to the issuer that such securities pay interest that is excludable from gross income for federal income tax purposes (“Non-Municipal Tax-Exempt Securities”), which could include trust certificates, partnership interests or other instruments evidencing interest in one or more long-term Municipal Bonds. Non-Municipal Tax-Exempt Securities also may include securities issued by other investment companies that invest in Municipal Bonds, to the extent such investments are permitted by the Fund’s investment restrictions and applicable law.
The Fund ordinarily does not intend to realize significant investment income not exempt from federal income taxes. From time to time, the Fund may realize taxable capital gains.
Investments in lower rated Municipal Bonds generally provide a higher yield and are less affected by interest rate fluctuations than higher rated tax-exempt securities of similar maturity but are subject to greater overall market risk and are also subject to a greater degree of risk with respect to the ability of the issuer to meet its principal and interest obligations.
The Fund seeks to reduce risk through investing in multiple issuers, credit analysis and monitoring of current developments regarding the obligor and trends in both the economy and financial markets. The Manager will use various means to research the stability and/or potential for improvement of various municipal issuers in connection with the proposed purchase of their securities by the Fund. Evaluation of each Municipal Bond may include the analysis of financial performance, debt structure, economic factors and the administrative structure of the issuer. Additionally, the priority of liens and the overall structure of the particular issue may be factors that will determine suitability for purchase. Further investigation may be performed and may include, among other things, discussions with project management, corporate officers and industry experts as well as site inspections, area analysis, and project and financial projection analysis. All purchases and sales also may be subject to the review of market data, economic projections and the performance of the financial markets. Certain economic indicators also may be monitored. Additionally, the Manager will vary the average maturity of the Fund’s portfolio securities based upon its assessment of economic and market conditions.
| I N V E S T M E N T O B J E C T I V E S , P O L I C I E S A N D R I S K S |
91 |
Investment Objectives, Policies and Risks (continued)
Leverage: The Fund currently leverages its assets through the use of VRDP Shares and residual interest municipal tender option bonds (“TOB Residuals”), which are derivative interests in municipal bonds. The TOB Residuals in which the Fund will invest pay interest or income that, in the opinion of counsel to the issuer of such TOB Residuals, is exempt from regular U.S. federal income tax. The Fund currently does not intend to borrow money or issue debt securities. Although it has no present intention to do so, the Fund reserves the right to borrow money from banks or other financial institutions, or issue debt securities, in the future if it believes that market conditions would be conducive to the successful implementation of a leveraging strategy through borrowing money or issuing debt securities. Any such leveraging will not be fully achieved until the proceeds resulting from the use of leverage have been invested in accordance with the Fund’s investment objective and policies.
The Fund may enter into derivative transactions that have economic leverage embedded in them.
The Fund may also borrow money as a temporary measure for extraordinary or emergency purposes, including the payment of dividends and the settlement of securities transactions which otherwise might require untimely dispositions of Fund securities.
BlackRock Municipal Income Fund, Inc. (MUI)
The Fund’s investment objective is to provide common stockholders with high current income exempt from federal income taxes. The Fund seeks to achieve its investment objective by investing at least 80% of its net assets (including assets acquired from the sale of preferred stock) plus the amount of any borrowings for investment purposes, in a portfolio of municipal obligations issued by or on behalf of states, territories and possessions of the United States and their political subdivisions, agencies or instrumentalities, each of which pays interest that, in the opinion of bond counsel to the issuer, is excludable from gross income for federal income tax purposes (except that the interest may be includable in taxable income for purposes of the federal alternative minimum tax) (“Municipal Bonds”). The Fund’s investment objective and its policy of investing at least 80% of its net assets (including assets acquired from the sale of preferred stock) plus the amount of any borrowings for investment purposes, in Municipal Bonds are fundamental policies that may not be changed without the approval of a majority of the outstanding common stock and the outstanding preferred stock, including the Fund’s outstanding Series W-7 Variable Rate Demand Preferred Shares (“VRDP Shares”), voting together as a single class, and of the holders of a majority of the outstanding preferred stock, including the VRDP Shares, voting as a separate class. A majority of the outstanding means (1) 67% or more of the stock present at a meeting, if the holders of more than 50% of the outstanding stock are present or represented by proxy, or (2) more than 50% of the outstanding stock, whichever is less.
There can be no assurance that the Fund’s investment objective will be realized.
The Fund may invest in certain tax exempt securities classified as “private activity bonds” (or industrial development bonds, under pre-1986 law) (“PABs”) (in general, bonds that benefit non-governmental entities) that may subject certain investors in the Fund to an alternative minimum tax. The percentage of the Fund’s total assets invested in PABs will vary from time to time. The Fund has not established any limit on the percentage of its portfolio that may be invested in PABs. The Fund expects that a portion of the interest or income it produces will be includable in alternative minimum taxable income.
Under normal market conditions, the Fund invests at least 75% of its total assets in a portfolio of Municipal Bonds that are commonly referred to as “investment grade” securities, which are obligations rated at the time of purchase within the four highest quality ratings as determined by either Moody’s Investor Service Inc. (“Moody’s”) (currently Aaa, Aa, A and Baa), S&P Global Ratings (“S&P”) (currently AAA, AA, A and BBB) or Fitch Ratings (“Fitch”) (currently AAA, AA, A and BBB). In the case of short-term notes, the investment grade rating categories are SP-1+ through SP-2 for S&P, MIG-1 through MIG-3 for Moody’s and F- 1+ through F-3 for Fitch. In the case of tax exempt commercial paper, the investment grade rating categories are A- 1+ through A-3 for S&P, Prime-1 through Prime-3 for Moody’s and F-1+ through F-3 for Fitch. Obligations ranked in the lowest investment grade rating category (BBB, SP-2 and A-3 for S&P; Baa, MIG-3 and Prime-3 for Moody’s and BBB and F-3 for Fitch), while considered “investment grade,” may have certain speculative characteristics. There may be sub-categories or gradations indicating relative standing within the rating categories set forth above. In assessing the quality of Municipal Bonds with respect to the foregoing requirements, the Manager takes into account the nature of any letters of credit or similar credit enhancement to which particular Municipal Bonds are entitled and the creditworthiness of the financial institution that provided such credit enhancement. If unrated, such securities will possess creditworthiness comparable, in the opinion of the Manager, to other obligations in which the Fund may invest.
The Fund may invest up to 25% of its total assets in Municipal Bonds that are rated below Baa by Moody’s or below BBB by S&P or Fitch or, if unrated, are considered by the Manager to possess similar credit characteristics. Such securities, sometimes referred to as “high yield” or “junk” bonds, are predominantly speculative with respect to the capacity to pay interest and repay principal in accordance with the terms of the security and generally involve a greater volatility of price than securities in higher rating categories. The Fund does not intend to purchase Municipal Bonds that are in default or which the Manager believes will soon be in default. Below investment grade securities and comparable unrated securities involve substantial risk of loss, are considered speculative with respect to the issuer’s ability to pay interest and any required redemption or principal payments and are susceptible to default or decline in market value due to adverse economic and business developments.
The Fund may invest 25% or more of its total assets in tax exempt securities of issuers in the industries comprising the same economic sector, such as hospitals or life care facilities and transportation-related issuers. However, the Fund will not invest 25% or more of its total assets in any one of the industries comprising an economic sector. In addition, a substantial part of the Fund’s portfolio may be comprised of securities credit enhanced by banks, insurance companies or companies with similar characteristics. Emphasis on these sectors may subject the Fund to certain risks.
If a percentage restriction on investment policies is adhered to at the time a transaction is effected, later changes in percentage resulting from changing values will not be considered a violation.
The value of bonds and other fixed income obligations may fall when interest rates rise and rise when interest rates fall. In general, bonds and other fixed income obligations with longer maturities will be subject to greater volatility resulting from interest rate fluctuations than will similar obligations with shorter maturities. “Duration” measures the sensitivity of a security’s price to changes in interest rates. Unlike final maturity, duration takes account of all payments made over the life of the security. Typically, with a 1% change in interest rates, an investment’s value may be expected to move in the opposite direction approximately 1% for each year of its duration. The greater a portfolio’s duration, the greater the change in the portfolio’s value in response to changes in interest rates. The Manager increases or reduces the Fund’s portfolio duration based on its interest rate outlook. When the Manager expects interest rates to fall, it attempts to maintain a longer portfolio duration. When the Manager expects interest rates to increase, it attempts to shorten the portfolio’s duration. Generally, as is the case with any investment grade fixed income obligations, Municipal Bonds with longer maturities tend to
| 92 | 2 0 2 2 B L A C K R O C K A N N U A L R E P O R T T O S H A R E H O L D E R S |
Investment Objectives, Policies and Risks (continued)
produce higher yields. Under normal market conditions, however, such yield-to-maturity increases tend to decline in the longer maturities (i.e., the slope of the yield curve flattens). At the same time, due to their longer exposure to interest rate risk, prices of longer term obligations are subject to greater market fluctuations as a result of changes in interest rates. Based on the foregoing premises, the Manager believes that the yield and price volatility characteristics of an intermediate duration portfolio generally offer an attractive trade-off between return and risk. There may be market conditions, however, where an intermediate duration portfolio may be less attractive due to the fact that the Municipal Bond yield curve changes from time to time depending on supply and demand forces, monetary and tax policies and investor expectations. As a result, there may be situations where investments in individual Municipal Bonds with longer durations may be more attractive than individual intermediate duration Municipal Bonds.
For temporary periods or to provide liquidity, the Fund has the authority to invest as much as 20% of its total assets in tax exempt and taxable money market obligations with a maturity of one year or less (such short-term obligations being referred to herein as “Temporary Investments”). In addition, the Fund reserves the right as a defensive measure to invest temporarily a greater portion of its assets in Temporary Investments, when, in the opinion of the Manager, prevailing market or financial conditions warrant. Taxable money market obligations will yield taxable income.
The Fund also may invest in variable rate demand obligations (“VRDOs”) and VRDOs in the form of participation interests (“Participating VRDOs”) in variable rate tax exempt obligations held by a financial institution. The Fund’s hedging strategies are not fundamental policies and may be modified by the Fund’s Board of Directors (the “Board”) without the approval of the Fund’s stockholders. The Fund is also authorized to invest in indexed and inverse floating obligations for hedging purposes and to seek to enhance return.
Certain Municipal Bonds may be entitled to the benefits of letters of credit or similar credit enhancements issued by financial institutions. In such instances, the Board of Directors of the Fund and the Manager will take into account, in assessing the quality of such bonds, both the creditworthiness of the issuer of such bonds and the creditworthiness of the financial institution that provides the credit enhancement.
The Fund may invest in securities not issued by or on behalf of a state or territory or by an agency or instrumentality thereof, if the Fund receives an opinion of counsel to the issuer that such securities pay interest that is excludable from gross income for federal income tax purposes (“Non-Municipal Tax Exempt Securities”). Non- Municipal Tax Exempt Securities could include trust certificates, partnership interests or other instruments evidencing interest in one or more long-term Municipal Bonds. Non-Municipal Tax Exempt Securities also may include securities issued by other investment companies that invest in Municipal Bonds, to the extent such investments are permitted by the Fund’s investment restrictions and applicable law. Non-Municipal Tax Exempt Securities are subject to the same risks associated with an investment in Municipal Bonds as well as many of the risks associated with investments in derivatives. While the Fund receives opinions of legal counsel to the effect that the income from the Non-Municipal Tax Exempt Securities in which the Fund invests is excludable from gross income for federal income tax purposes to the same extent as the underlying Municipal Bonds, the Internal Revenue Service (“IRS”) has not issued a ruling on this subject. Were the IRS to issue an adverse ruling or take an adverse position with respect to the taxation of these types of securities, there is a risk that the interest paid on such securities would be deemed taxable at the federal level.
The Fund ordinarily does not intend to realize significant investment income not exempt from federal income tax. From time to time, the Fund may realize taxable capital gains. Interest received on certain otherwise tax exempt securities that are classified as “private activity bonds” (in general, bonds that benefit non-governmental entities) may be subject to a federal alternative minimum tax. The percentage of the Fund’s total assets invested in “private activity bonds” will vary from time to time. Federal tax legislation has limited the types and volume of bonds the interest on which qualifies for a federal income tax exemption. As a result, this legislation and legislation that may be enacted in the future may affect the availability of Municipal Bonds for investment by the Fund.
Leverage: The Fund may utilize leverage to seek to enhance the yield and net asset value of its common shares. However, this objective cannot be achieved in all interest rate environments. The Fund currently leverages its assets through the use of VRDP Shares and residual interest municipal tender option bonds (“TOB Residuals”), which are derivative interests in municipal bonds. The TOB Residuals in which the Fund will invest pay interest or income that, in the opinion of counsel to the issuer of such TOB Residuals, is exempt from regular U.S. federal income tax.
BlackRock MuniHoldings Fund, Inc. (MHD)
The Fund’s investment objective is to provide stockholders with current income exempt from federal income taxes. There can be no assurance that the Fund’s investment objective will be realized. The Fund’s investment policies provide that it seeks to achieve its investment objective by investing, as a fundamental policy at least 80% of an aggregate of the Fund’s net assets (including proceeds from the issuance of any preferred stock) and the proceeds of any borrowings for investment purposes, in a portfolio of municipal obligations issued by or on behalf of states, territories and possessions of the United States and their political subdivisions, agencies or instrumentalities, each of which pays interest that, in the opinion of bond counsel to the issuer, is excludable from gross income for federal income tax purposes (except that the interest may be includable in taxable income for purposes of the federal alternative minimum tax).
The Fund’s investment objective and its policy of investing at least 80% of an aggregate of the Fund’s net assets (including proceeds from the issuance of any preferred stock) and the proceeds of any borrowings for investment purposes, in municipal bonds are fundamental policies that may not be changed without the approval of the holders of a majority of the outstanding common stock and the outstanding preferred stock, including the Fund’s outstanding Series W-7 Variable Rate Muni Term Preferred Shares (“VMTP Shares”), voting together as a single class, and of the holders of a majority of the outstanding preferred stock, including the VMTP Shares, voting as a separate class. A majority of the outstanding means (1) 67% or more of the shares present at a meeting, if the holders of more than 50% of the outstanding shares are present or represented by proxy, or (2) more than 50% of the outstanding shares, whichever is less.
The Fund’s investment policies provide that it will invest at least 75% of its total assets in a portfolio of municipal bonds that are commonly referred to as “investment grade” securities, which are obligations rated at the time of purchase within the four highest quality ratings as determined by either Moody’s Investor Service Inc. (“Moody’s”) (currently Aaa, Aa, A and Baa), S&P Global Ratings (“S&P”) (currently AAA, AA, A and BBB) or Fitch Ratings (“Fitch”) (currently AAA, AA, A and BBB). In the case of short-term notes, the investment grade rating categories are SP-1+ through SP-2 for S&P, MIG-1 through MIG-3 for Moody’s and F-1+ through F-3 for Fitch. In the case of tax exempt commercial paper, the investment grade rating categories are A-1+ through A-3 for S&P, Prime-1 through Prime-3 for Moody’s and F-1+ through F-3 for Fitch. Obligations ranked in the lowest investment grade rating category (BBB, SP-2 and A-3 for S&P; Baa, MIG-3 and Prime-3 for Moody’s and BBB and F-3 for Fitch), while considered “investment grade,”
| I N V E S T M E N T O B J E C T I V E S , P O L I C I E S A N D R I S K S |
93 |
Investment Objectives, Policies and Risks (continued)
may have certain speculative characteristics. There may be sub-categories or gradations indicating relative standing within the rating categories set forth above. In assessing the quality of municipal bonds with respect to the foregoing requirements, BlackRock Advisors, LLC (the “Manager”) takes into account the nature of any letters of credit or similar credit enhancement to which particular municipal bonds are entitled and the creditworthiness of the financial institution that provided such credit enhancement. If unrated, such securities will possess creditworthiness comparable, in the opinion of the Manager, to other obligations in which the Fund may invest.
The Fund may invest up to 25% of its total assets in municipal bonds that are rated below Baa by Moody’s or below BBB by S&P or Fitch or, if unrated, are considered by the Manager to possess similar credit characteristics. Bonds of below investment grade quality are regarded as having predominantly speculative characteristics with respect to the issuer’s capacity to pay interest and repay principal. Such securities, sometimes referred to as “high yield” or “junk” bonds, are predominantly speculative with respect to the capacity to pay interest and repay principal in accordance with the terms of the security and generally involve a greater volatility of price than securities in higher rating categories. Below investment grade securities and comparable unrated securities involve substantial risk of loss, are considered speculative with respect to the issuer’s ability to pay interest and any required redemption or principal payments and are susceptible to default or decline in market value due to adverse economic and business developments.
The foregoing credit quality policies apply only at the time a security is purchased, and the Fund is not required to dispose of a security if a rating agency downgrades its assessment of the credit characteristics of a particular issue. In determining whether to retain or sell a security that a rating agency has downgraded, the Manager may consider such factors as the Manager’s assessment of the credit quality of the issuer of the security, the price at which the security could be sold and the rating, if any, assigned to the security by other rating agencies. In the event that the Fund disposes of a portfolio security subsequent to its being downgraded, the Fund may experience a greater risk of loss than if such security had been sold prior to such downgrade.
The Fund may also purchase municipal bonds that are additionally secured by insurance, bank credit agreements or escrow accounts. The credit quality of companies which provide these credit enhancements will affect the value of those securities. Although the insurance feature reduces certain financial risks, the premiums for insurance and the higher market price paid for insured obligations may reduce the Fund’s income. The insurance feature does not guarantee the market value of the insured obligations or the net asset value of the common stock. The Fund may purchase insured bonds and may purchase insurance for bonds in its portfolio.
The Fund may invest in certain tax exempt securities classified as “private activity bonds” (or industrial development bonds, under pre-1986 law) (in general, bonds that benefit non-governmental entities) that may subject certain investors in the Fund to an alternative minimum tax. The percentage of the Fund’s total assets invested in private activity bonds will vary from time to time. The Fund has not established any limit on the percentage of its portfolio that may be invested in municipal bonds subject to the federal alternative minimum tax provisions of federal tax law, and the Fund expects that a portion of the income it produces will be includable in alternative minimum taxable income.
The Fund also may not invest more than 25% of its total assets (taken at market value at the time of each investment) in municipal bonds whose issuers are located in the same state.
The average maturity of the Fund’s portfolio securities varies from time to time based upon an assessment of economic and market conditions by the Manager. The Fund’s portfolio at any given time may include both long-term, intermediate-term and short-term municipal bonds.
The Fund’s stated expectation is that it will invest in municipal bonds that, in the Manager’s opinion, are underrated or undervalued. Underrated municipal bonds are those whose ratings do not, in the opinion of the Manager, reflect their true higher creditworthiness. Undervalued municipal bonds are bonds that, in the opinion of the Manager, are worth more than the value assigned to them in the marketplace. The Manager may at times believe that bonds associated with a particular municipal market sector (for example, but not limited to electric utilities), or issued by a particular municipal issuer, are undervalued. The Manager may purchase those bonds for the Fund’s portfolio because they represent a market sector or issuer that the Manager considers undervalued, even if the value of those particular bonds appears to be consistent with the value of similar bonds. Municipal bonds of particular types (for example, but not limited to hospital bonds, industrial revenue bonds or bonds issued by a particular municipal issuer) may be undervalued because there is a temporary excess of supply in that market sector, or because of a general decline in the market price of municipal bonds of the market sector for reasons that do not apply to the particular municipal bonds that are considered undervalued. The Fund’s investment in underrated or undervalued municipal bonds will be based on the Manager’s belief that their yield is higher than that available on bonds bearing equivalent levels of interest rate risk, credit risk and other forms of risk, and that their prices will ultimately rise, relative to the market, to reflect their true value. Any capital appreciation realized by the Fund will generally result in capital gain distributions subject to federal capital gains taxation.
The Fund ordinarily does not intend to realize significant investment income not exempt from federal income tax. From time to time, the Fund may realize taxable capital gains.
Federal tax legislation has limited the types and volume of bonds the interest on which qualifies for a federal income tax exemption. As a result, this legislation and legislation that may be enacted in the future may affect the availability of municipal bonds for investment by the Fund.
Leverage: The Fund may utilize leverage to seek to enhance the yield and net asset value of its common shares. However, this objective cannot be achieved in all interest rate environments. The Fund currently leverages its assets through the use of VMTP Shares and residual interest municipal tender option bonds (“TOB Residuals”), which are derivative interests in municipal bonds. The TOB Residuals in which the Fund will invest pay interest or income that, in the opinion of counsel to the issuer of such TOB Residuals, is exempt from regular U.S. federal income tax.
The Fund currently does not intend to borrow money or issue debt securities. Although it has no present intention to do so, the Fund reserves the right to borrow money from banks or other financial institutions, or issue debt securities, in the future if it believes that market conditions would be conducive to the successful implementation of a leveraging strategy through borrowing money or issuing debt securities or preferred stock.
The Fund may enter into derivative transactions that have economic leverage embedded in them.
The Fund may also borrow money as a temporary measure for extraordinary or emergency purposes, including the payment of dividends and the settlement of securities transactions which otherwise might require untimely dispositions of Fund securities.
| 94 | 2 0 2 2 B L A C K R O C K A N N U A L R E P O R T T O S H A R E H O L D E R S |
Investment Objectives, Policies and Risks (continued)
BlackRock MuniVest Fund II, Inc. (MVT)
The Fund’s investment objective is to provide stockholders with as high a level of current income exempt from federal income taxes as is consistent with its investment policies and prudent investment management. There can be no assurance that the Fund’s investment objective will be realized. The Fund’s investment policies provide that it seeks to achieve its investment objective by investing, as a fundamental policy at least 80% of an aggregate of the Fund’s net assets (including proceeds from the issuance of any preferred stock) and the proceeds of any borrowings for investment purposes, in a portfolio of municipal obligations issued by or on behalf of states, territories and possessions of the United States and their political subdivisions, agencies or instrumentalities, each of which pays interest that, in the opinion of bond counsel to the issuer, is excludable from gross income for federal income tax purposes (except that the interest may be includable in taxable income for purposes of the federal alternative minimum tax) (“Municipal Bonds”).
The Fund’s investment objective and its policy of investing at least 80% of an aggregate of the Fund’s net assets (including proceeds from the issuance of any preferred stock) and the proceeds of any borrowings for investment purposes, in Municipal Bonds are fundamental policies that may not be changed without the approval of the holders of a majority of the outstanding common shares and the outstanding preferred shares, including the Fund’s outstanding Series W-7 Variable Rate Muni Term Preferred Shares (the “VMTP Shares”), voting together as a single class, and of the holders of a majority of the outstanding preferred shares, including the VMTP Shares, voting as a separate class. A majority of the outstanding means (1) 67% or more of the shares present at a meeting, if the holders of more than 50% of the outstanding shares are present or represented by proxy, or (2) more than 50% of the outstanding shares, whichever is less.
The Fund’s investment policies provide that under normal market conditions, the Fund expects to invest at least 75% of its total assets in a portfolio of Municipal Bonds that are commonly referred to as “investment grade” securities, which are obligations rated at the time of purchase within the four highest quality ratings as determined by either Moody’s Investors Service, Inc. (“Moody’s”) (currently Aaa, Aa, A and Baa), Standard & Poor’s (“S&P”) (currently AAA, AA, A and BBB) or Fitch Ratings (“Fitch”) (currently AAA, AA, A and BBB). In the case of short term notes, the investment grade rating categories are SP-1+ through SP-2 for S&P, MIG-1 through MIG-3 for Moody’s and F-1+ through F-3 for Fitch. In the case of tax exempt commercial paper, the investment grade rating categories are A-1+ through A-3 for S&P, Prime-1 through Prime-3 for Moody’s and F-1+ through F-3 for Fitch.
Obligations ranked in the lowest investment grade rating category (BBB, SP-2 and A-3 for S&P; Baa, MIG-3 and Prime-3 for Moody’s and BBB and F-3 for Fitch), while considered “investment grade,” may have certain speculative characteristics. There may be sub-categories or gradations indicating relative standing within the rating categories set forth above. In assessing the quality of Municipal Bonds with respect to the foregoing requirements, BlackRock Advisors, LLC (the ”Manager”) takes into account the nature of any letters of credit or similar credit enhancement to which particular Municipal Bonds are entitled and the creditworthiness of the financial institution that provided such credit enhancement. If unrated, such securities will possess creditworthiness comparable, in the opinion of the Manager, to other obligations in which the Fund may invest.
The Fund may invest up to 25% of its total assets in Municipal Bonds that are rated below Baa by Moody’s or below BBB by S&P or Fitch or, if unrated, are considered by the Manager to possess similar credit characteristics. Bonds of below investment grade quality are regarded as having predominantly speculative characteristics with respect to the issuer’s capacity to pay interest and repay principal. Such securities, sometimes referred to as “high yield” or “junk” bonds, are predominantly speculative with respect to the capacity to pay interest and repay principal in accordance with the terms of the security and generally involve a greater volatility of price than securities in higher rating categories. Below investment grade securities and comparable unrated securities involve substantial risk of loss, are considered speculative with respect to the issuer’s ability to pay interest and any required redemption or principal payments and are susceptible to default or decline in market value due to adverse economic and business developments.
The foregoing credit quality policies apply only at the time a security is purchased, and the Fund is not required to dispose of a security if a rating agency downgrades its assessment of the credit characteristics of a particular issue. In determining whether to retain or sell a security that a rating agency has downgraded, the Manager may consider such factors as the Manager’s assessment of the credit quality of the issuer of the security, the price at which the security could be sold and the rating, if any, assigned to the security by other rating agencies. In the event that the Fund disposes of a portfolio security subsequent to its being downgraded, the Fund may experience a greater risk of loss than if such security had been sold prior to such downgrade.
The Fund may also purchase Municipal Bonds that are additionally secured by insurance, bank credit agreements or escrow accounts. The credit quality of companies which provide these credit enhancements will affect the value of those securities. Although the insurance feature reduces certain financial risks, the premiums for insurance and the higher market price paid for insured obligations may reduce the Fund’s income. The insurance feature does not guarantee the market value of the insured obligations or the net asset value of the common shares. The Fund may purchase insured bonds and may purchase insurance for bonds in its portfolio.
The Fund may invest in certain tax exempt securities classified as “private activity bonds” (or industrial development bonds, under pre-1986 law) (“PABs”) (in general, bonds that benefit non-governmental entities) that may subject certain investors in the Fund to an alternative minimum tax. The percentage of the Fund’s total assets invested in PABs will vary from time to time. The Fund has not established any limit on the percentage of its portfolio that may be invested in Municipal Bonds subject to the federal alternative minimum tax provisions of federal tax law, and the Fund expects that a portion of the income it produces will be includable in alternative minimum taxable income.
The Fund also may not invest more than 25% of its total assets (taken at market value at the time of each investment) in Municipal Bonds whose issuers are located in the same state.
The average maturity of the Fund’s portfolio securities varies from time to time based upon an assessment of economic and market conditions by the Manager. The Fund’s portfolio at any given time may include both long-term, intermediate-term and short-term Municipal Bonds.
The Fund’s stated expectation is that it will invest in Municipal Bonds that, in the Manager’s opinion, are underrated or undervalued. Underrated Municipal Bonds are those whose ratings do not, in the opinion of the Manager, reflect their true higher creditworthiness. Undervalued Municipal Bonds are bonds that, in the opinion of the Manager, are worth more than the value assigned to them in the marketplace. The Manager may at times believe that bonds associated with a particular municipal market sector (for example, but not limited to electric utilities), or issued by a particular municipal issuer, are undervalued. The Manager may purchase those bonds for the Fund’s portfolio
| I N V E S T M E N T O B J E C T I V E S , P O L I C I E S A N D R I S K S |
95 |
Investment Objectives, Policies and Risks (continued)
because they represent a market sector or issuer that the Manager considers undervalued, even if the value of those particular bonds appears to be consistent with the value of similar bonds. Municipal Bonds of particular types (for example, but not limited to hospital bonds, industrial revenue bonds or bonds issued by a particular municipal issuer) may be undervalued because there is a temporary excess of supply in that market sector, or because of a general decline in the market price of Municipal Bonds of the market sector for reasons that do not apply to the particular Municipal Bonds that are considered undervalued. The Fund’s investment in underrated or undervalued Municipal Bonds will be based on the Managers’ belief that their yield is higher than that available on bonds bearing equivalent levels of interest rate risk, credit risk and other forms of risk, and that their prices will ultimately rise, relative to the market, to reflect their true value. Any capital appreciation realized by the Fund will generally result in capital gain distributions subject to federal capital gains taxation.
The Fund ordinarily does not intend to realize significant investment income not exempt from federal income tax. From time to time, the Fund may realize taxable capital gains.
Federal tax legislation has limited the types and volume of bonds the interest on which qualifies for a federal income tax exemption. As a result, this legislation and legislation that may be enacted in the future may affect the availability of Municipal Bonds for investment by the Fund.
Leverage: The Fund may utilize leverage to seek to enhance the yield and net asset value of its common shares. However, this objective cannot be achieved in all interest rate environments. The Fund currently leverages its assets through the use of VMTP Shares and residual interest municipal tender option bonds (“TOB Residuals”), which are derivative interests in municipal bonds. The TOB Residuals in which the Fund will invest pay interest or income that, in the opinion of counsel to the issuer of such TOB Residuals, is exempt from regular U.S. federal income tax.
Risk Factors
This section contains a discussion of the general risks of investing in each Fund. The net asset value and market price of, and dividends paid on, the common shares will fluctuate with and be affected by, among other things, the risks more fully described below. As with any fund, there can be no guarantee that a Fund will meet its investment objective or that the Fund’s performance will be positive for any period of time. Each risk noted below is applicable to each Fund unless the specific Fund or Funds are noted in a parenthetical.
Investment and Market Discount Risk: An investment in the Fund’s common shares is subject to investment risk, including the possible loss of the entire amount that you invest. As with any stock, the price of the Fund’s common shares will fluctuate with market conditions and other factors. If shares are sold, the price received may be more or less than the original investment. Common shares are designed for long-term investors and the Fund should not be treated as a trading vehicle. Shares of closed-end management investment companies frequently trade at a discount from their net asset value. This risk is separate and distinct from the risk that the Fund’s net asset value could decrease as a result of its investment activities. At any point in time an investment in the Fund’s common shares may be worth less than the original amount invested, even after taking into account distributions paid by the Fund. During periods in which the Fund may use leverage, the Fund’s investment, market discount and certain other risks will be magnified.
Debt Securities Risk: Debt securities, such as bonds, involve interest rate risk, credit risk, extension risk, and prepayment risk, among other things.
| • | Interest Rate Risk — The market value of bonds and other fixed-income securities changes in response to interest rate changes and other factors. Interest rate risk is the risk that prices of bonds and other fixed-income securities will increase as interest rates fall and decrease as interest rates rise. |
The Fund may be subject to a greater risk of rising interest rates due to the current period of historically low rates. For example, if interest rates increase by 1%, assuming a current portfolio duration of ten years, and all other factors being equal, the value of the Fund’s investments would be expected to decrease by 10%. (Duration is a measure of the price sensitivity of a debt security or portfolio of debt securities to relative changes in interest rates.) The magnitude of these fluctuations in the market price of bonds and other fixed-income securities is generally greater for those securities with longer maturities. Fluctuations in the market price of the Fund’s investments will not affect interest income derived from instruments already owned by the Fund, but will be reflected in the Fund’s net asset value. The Fund may lose money if short-term or long-term interest rates rise sharply in a manner not anticipated by Fund management.
Rates on certain floating rate debt securities typically reset only periodically, changes in prevailing interest rates (and particularly sudden and significant changes) can be expected to cause some fluctuations in the net asset value of the Fund to the extent that it invests in floating rate debt securities.
These basic principles of bond prices also apply to U.S. Government securities. A security backed by the “full faith and credit” of the U.S. Government is guaranteed only as to its stated interest rate and face value at maturity, not its current market price. Just like other fixed-income securities, government-guaranteed securities will fluctuate in value when interest rates change.
A general rise in interest rates has the potential to cause investors to move out of fixed-income securities on a large scale, which may increase redemptions from funds that hold large amounts of fixed-income securities. Heavy redemptions could cause the Fund to sell assets at inopportune times or at a loss or depressed value and could hurt the Fund’s performance.
| • | Credit Risk — Credit risk refers to the possibility that the issuer of a debt security (i.e., the borrower) will not be able to make payments of interest and principal when due. Changes in an issuer’s credit rating or the market’s perception of an issuer’s creditworthiness may also affect the value of the Fund’s investment in that issuer. The degree of credit risk depends on both the financial condition of the issuer and the terms of the obligation. |
| • | Extension Risk — When interest rates rise, certain obligations will be paid off by the obligor more slowly than anticipated, causing the value of these obligations to fall. |
| • | Prepayment Risk — When interest rates fall, certain obligations will be paid off by the obligor more quickly than originally anticipated, and the Fund may have to invest the proceeds in securities with lower yields. |
| 96 | 2 0 2 2 B L A C K R O C K A N N U A L R E P O R T T O S H A R E H O L D E R S |
Investment Objectives, Policies and Risks (continued)
Municipal Securities Risks: Municipal securities risks include the ability of the issuer to repay the obligation, the relative lack of information about certain issuers of municipal securities, and the possibility of future legislative changes which could affect the market for and value of municipal securities. These risks include:
| • | General Obligation Bonds Risks — Timely payments depend on the issuer’s credit quality, ability to raise tax revenues and ability to maintain an adequate tax base. |
| • | Revenue Bonds Risks — These payments depend on the money earned by the particular facility or class of facilities, or the amount of revenues derived from another source. |
| • | Private Activity Bonds Risks — Municipalities and other public authorities issue private activity bonds to finance development of industrial facilities for use by a private enterprise. The private enterprise pays the principal and interest on the bond, and the issuer does not pledge its full faith, credit and taxing power for repayment. |
| • | Moral Obligation Bonds Risks — Moral obligation bonds are generally issued by special purpose public authorities of a state or municipality. If the issuer is unable to meet its obligations, repayment of these bonds becomes a moral commitment, but not a legal obligation, of the state or municipality. |
| • | Municipal Notes Risks — Municipal notes are shorter term municipal debt obligations. If there is a shortfall in the anticipated proceeds, the notes may not be fully repaid and the Fund may lose money. |
| • | Municipal Lease Obligations Risks — In a municipal lease obligation, the issuer agrees to make payments when due on the lease obligation. Although the issuer does not pledge its unlimited taxing power for payment of the lease obligation, the lease obligation is secured by the leased property. |
| • | Tax-Exempt Status Risk — The Fund and its investment manager will rely on the opinion of issuers’ bond counsel and, in the case of certain derivative securities, sponsors’ counsel, on the tax-exempt status of interest on municipal bonds and payments under derivative securities. Neither the Fund nor its investment manager will independently review the bases for those tax opinions, which may ultimately be determined to be incorrect and subject the Fund and its shareholders to substantial tax liabilities. |
Taxability Risk: The Fund intends to minimize the payment of taxable income to shareholders by investing in tax-exempt or municipal securities in reliance at the time of purchase on an opinion of bond counsel to the issuer that the interest paid on those securities will be excludable from gross income for U.S. federal income tax purposes. Such securities, however, may be determined to pay, or have paid, taxable income subsequent to the Fund’s acquisition of the securities. In that event, the Internal Revenue Service may demand that the Fund pay U.S. federal income taxes on the affected interest income, and, if the Fund agrees to do so, the Fund’s yield could be adversely affected. In addition, the treatment of dividends previously paid or to be paid by the Fund as “exempt interest dividends” could be adversely affected, subjecting the Fund’s shareholders to increased U.S. federal income tax liabilities. Federal tax legislation may limit the types and volume of bonds the interest on which qualifies for a federal income tax-exemption. As a result, current legislation and legislation that may be enacted in the future may affect the availability of municipal bonds for investment by the Fund. In addition, future laws, regulations, rulings or court decisions may cause interest on municipal securities to be subject, directly or indirectly, to U.S. federal income taxation or interest on state municipal securities to be subject to state or local income taxation, or the value of state municipal securities to be subject to state or local intangible personal property tax, or may otherwise prevent the Fund from realizing the full current benefit of the tax-exempt status of such securities. Any such change could also affect the market price of such securities, and thus the value of an investment in the Fund.
Insurance Risk: Insurance guarantees that interest payments on a municipal security will be made on time and that the principal will be repaid when the security matures. However, insurance does not protect against losses caused by declines in a municipal security’s value. The Fund cannot be certain that any insurance company will make the payments it guarantees. If a municipal security’s insurer fails to fulfill its obligations or loses its credit rating, the value of the security could drop.
Junk Bonds Risk: Although junk bonds generally pay higher rates of interest than investment grade bonds, junk bonds are high risk investments that are considered speculative and may cause income and principal losses for the Fund.
Variable Rate Demand Obligations Risk (MUI): Variable rate demand obligations are floating rate securities that combine an interest in a long term municipal bond with a right to demand payment before maturity from a bank or other financial institution. If the bank or financial institution is unable to pay, the Fund may lose money.
Repurchase Agreements and Purchase and Sale Contracts Risk (MUA): If the other party to a repurchase agreement or purchase and sale contract defaults on its obligation under the agreement, the Fund may suffer delays and incur costs or lose money in exercising its rights under the agreement. If the seller fails to repurchase the security in either situation and the market value of the security declines, the Fund may lose money.
Sector Risk (MUI): Sector risk is the risk that the Fund’s concentration in the securities of companies in a specific market sector or industry will cause the Fund to be more exposed to the price movements of companies in and developments affecting that sector than a more broadly diversified fund. To the extent that the Fund concentrates its investments in a particular sector, there is the risk that the Fund will perform poorly during a downturn in that sector.
Leverage Risk: With respect to MUA and MUI, the Fund uses leverage for investment purposes through the issuance of VRDP Shares. With respect to MHD and MVT, the Fund uses leverage for investment purposes through the issuance of VMTP Shares. The Fund also utilizes leverage for investment purposes by entering into derivative instruments with leverage embedded in them, such as TOB Residuals. The Fund’s use of leverage may increase or decrease from time to time in its discretion and the Fund may, in the future, determine not to use leverage.
The use of leverage creates an opportunity for increased common share net investment income dividends, but also creates risks for the holders of common shares. The Fund cannot assure you that the use of leverage will result in a higher yield on the common shares. Any leveraging strategy the Fund employs may not be successful.
Leverage involves risks and special considerations for common shareholders, including:
| • | the likelihood of greater volatility of net asset value, market price and dividend rate of the common shares than a comparable portfolio without leverage; |
| I N V E S T M E N T O B J E C T I V E S , P O L I C I E S A N D R I S K S |
97 |
Investment Objectives, Policies and Risks (continued)
| • | the risk that fluctuations in interest rates or dividend rates on any leverage that the Fund must pay will reduce the return to the common shareholders; |
| • | the effect of leverage in a declining market, which is likely to cause a greater decline in the net asset value of the common shares than if the Fund were not leveraged, which may result in a greater decline in the market price of the common shares; |
| • | leverage may increase operating costs, which may reduce total return. |
Any decline in the net asset value of the Fund’s investments will be borne entirely by the holders of common shares. Therefore, if the market value of the Fund’s portfolio declines, leverage will result in a greater decrease in net asset value to the holders of common shares than if the Fund were not leveraged. This greater net asset value decrease will also tend to cause a greater decline in the market price for the common shares..
Derivatives Risk: The Fund’s use of derivatives may increase its costs, reduce the Fund’s returns and/or increase volatility. Derivatives involve significant risks, including:
| • | Volatility Risk — Volatility is defined as the characteristic of a security, an index or a market to fluctuate significantly in price within a short time period. A risk of the Fund’s use of derivatives is that the fluctuations in their values may not correlate with the overall securities markets. |
| • | Counterparty Risk — Derivatives are also subject to counterparty risk, which is the risk that the other party in the transaction will not fulfill its contractual obligation. |
| • | Market and Illiquidity Risk — The possible lack of a liquid secondary market for derivatives and the resulting inability of the Fund to sell or otherwise close a derivatives position could expose the Fund to losses and could make derivatives more difficult for the Fund to value accurately. |
| • | Valuation Risk — Valuation may be more difficult in times of market turmoil since many investors and market makers may be reluctant to purchase complex instruments or quote prices for them. |
| • | Hedging Risk — Hedges are sometimes subject to imperfect matching between the derivative and the underlying security, and there can be no assurance that the Fund’s hedging transactions will be effective. The use of hedging may result in certain adverse tax consequences. |
| • | Tax Risk — Certain aspects of the tax treatment of derivative instruments, including swap agreements and commodity-linked derivative instruments, are currently unclear and may be affected by changes in legislation, regulations or other legally binding authority. Such treatment may be less favorable than that given to a direct investment in an underlying asset and may adversely affect the timing, character and amount of income the Fund realizes from its investments. |
| • | Regulatory Risk — Derivative contracts, including, without limitation, swaps, currency forwards and non-deliverable forwards, are subject to regulation under the Dodd-Frank Wall Street Reform and Consumer Protection Act (the “Dodd-Frank Act”) in the United States and under comparable regimes in Europe, Asia and other non-U.S. jurisdictions. Under the Dodd-Frank Act, with respect to uncleared swaps, swap dealers are required to collect variation margin from the Fund and may be required by applicable regulations to collect initial margin from the Fund. Both initial and variation margin may be comprised of cash and/or securities, subject to applicable regulatory haircuts. Shares of investment companies (other than certain money market funds) may not be posted as collateral under applicable regulations. In addition, regulations adopted by global prudential regulators that are now in effect require certain bank-regulated counterparties and certain of their affiliates to include in certain financial contracts, including many derivatives contracts, terms that delay or restrict the rights of counterparties, such as the Fund, to terminate such contracts, foreclose upon collateral, exercise other default rights or restrict transfers of credit support in the event that the counterparty and/or its affiliates are subject to certain types of resolution or insolvency proceedings. The implementation of these requirements with respect to derivatives, as well as regulations under the Dodd-Frank Act regarding clearing, mandatory trading and margining of other derivatives, may increase the costs and risks to the Fund of trading in these instruments and, as a result, may affect returns to investors in the Fund. |
On October 28, 2020, the Securities and Exchange Commission adopted new regulations governing the use of derivatives by registered investment companies (“Rule 18f-4”). The Fund will be required to implement and comply with Rule 18f-4 by August 19, 2022. Once implemented, Rule 18f-4 will impose limits on the amount of derivatives a fund can enter into, eliminate the asset segregation framework currently used by funds to comply with Section 18 of the Investment Company Act of 1940, as amended, treat derivatives as senior securities and require funds whose use of derivatives is more than a limited specified exposure amount to establish and maintain a comprehensive derivatives risk management program and appoint a derivatives risk manager.
Tender Option Bonds Risk: The Fund’s participation in tender option bond transactions may reduce the Fund’s returns and/or increase volatility. Investments in tender option bond transactions expose the Fund to counterparty risk and leverage risk. An investment in a tender option bond transaction typically will involve greater risk than an investment in a municipal fixed rate security, including the risk of loss of principal. Distributions on TOB Residuals will bear an inverse relationship to short-term municipal security interest rates. Distributions on TOB Residuals paid to the Fund will be reduced or, in the extreme, eliminated as short-term municipal interest rates rise and will increase when short-term municipal interest rates fall. TOB Residuals generally will underperform the market for fixed rate municipal securities in a rising interest rate environment. The Fund may invest in TOB Trusts on either a non-recourse or recourse basis. If the Fund invests in a TOB Trust on a recourse basis, it could suffer losses in excess of the value of its TOB Residuals.
Illiquid Investments Risk: The Fund may invest without limitation in illiquid or less liquid investments or investments in which no secondary market is readily available or which are otherwise illiquid, including private placement securities. The Fund may not be able to readily dispose of such investments at prices that approximate those at which the Fund could sell such investments if they were more widely traded and, as a result of such illiquidity, the Fund may have to sell other investments or engage in borrowing transactions if necessary to raise cash to meet its obligations. Limited liquidity can also affect the market price of investments, thereby adversely affecting the Fund’s net asset value and ability to make dividend distributions. The financial markets in general, and certain segments of the mortgage-related securities markets in particular, have in recent years experienced periods of extreme secondary market supply and demand imbalance, resulting in a loss of liquidity during which market prices were suddenly and substantially below traditional measures of intrinsic value. During such periods, some investments could be sold only at arbitrary prices and with substantial losses. Periods of
| 98 | 2 0 2 2 B L A C K R O C K A N N U A L R E P O R T T O S H A R E H O L D E R S |
Investment Objectives, Policies and Risks (continued)
such market dislocation may occur again at any time. Privately issued debt securities are often of below investment grade quality, frequently are unrated and present many of the same risks as investing in below investment grade public debt securities.
Market Risk and Selection Risk: Market risk is the risk that one or more markets in which the Fund invests will go down in value, including the possibility that the markets will go down sharply and unpredictably. The value of a security or other asset may decline due to changes in general market conditions, economic trends or events that are not specifically related to the issuer of the security or other asset, or factors that affect a particular issuer or issuers, exchange, country, group of countries, region, market, industry, group of industries, sector or asset class. Local, regional or global events such as war, acts of terrorism, the spread of infectious illness or other public health issues like pandemics or epidemics, recessions, or other events could have a significant impact on the Fund and its investments. Selection risk is the risk that the securities selected by Fund management will underperform the markets, the relevant indices or the securities selected by other funds with similar investment objectives and investment strategies. This means you may lose money.
An outbreak of an infectious coronavirus (COVID-19) that was first detected in December 2019 developed into a global pandemic that has resulted in numerous disruptions in the market and has had significant economic impact leaving general concern and uncertainty. Although vaccines have been developed and approved for use by various governments, the duration of the pandemic and its effects cannot be predicted with certainty. The impact of this coronavirus, and other epidemics and pandemics that may arise in the future, could affect the economies of many nations, individual companies and the market in general ways that cannot necessarily be foreseen at the present time.
| I N V E S T M E N T O B J E C T I V E S , P O L I C I E S A N D R I S K S |
99 |
The following includes additional required disclosures for MUA, which has an effective shelf offering registration statement as of the fiscal year ended April 30, 2022.
Summary of Fund Expenses
The following table and example are intended to assist shareholders in understanding the various costs and expenses directly or indirectly associated with investing in MUA’s common shares.
| MUA | ||||
| Shareholder Transaction Expenses |
||||
| Maximum Sales Load (as a percentage of offering price)(a) |
1.00 | % | ||
| Offering expenses borne by MUA (as a percentage of offering price)(a) |
0.01 | |||
| Dividend Reinvestment Plan Fees |
|
$0.02 per share for open market purchases
of |
| |
| Estimated Annual Expenses (as a percentage of net assets attributable to common shares) |
||||
| Investment advisory fees |
0.68 | % | ||
| Other expenses |
0.30 | |||
| Miscellaneous |
0.09 | |||
| Interest expense(c) |
0.21 | |||
| Total annual expenses |
0.98 | |||
| Fee waiver(d) |
— | |||
| Total annual fund operating expenses after fee waiver(d) |
0.98 | |||
| (a) | If the common shares are sold to or through underwriters, the Prospectus Supplement will set forth any applicable sales load and the estimated offering expenses. Fund shareholders will pay all offering expenses involved with an offering. |
| (b) | Computershare Trust Company, N.A. (the “Reinvestment Plan Agent”) fees for the handling of the reinvestment of dividends will be paid by MUA. However, shareholders will pay a $0.02 per share fee incurred in connection with open-market purchases, which will be deducted from the value of the dividend. Shareholders will also be charged a $0.02 per share fee if a shareholder directs the Reinvestment Plan Agent to sell the common shares held in a dividend reinvestment account. Per share fees include any applicable brokerage commissions the Reinvestment Plan Agent is required to pay. |
| (c) | Assumes the use of leverage in the form of tender option bond transactions and preferred shares representing 31% of Managed Assets at an annual cost of leverage to MUA of 0.98%, which is based on current market conditions. The actual amount of interest expense borne by MUA will vary over time in accordance with the level of MUA’s use of tender option bond transactions and variations in market interest rates, as well as preferred shares transactions and changes to agreement terms with counterparties. Interest expense is required to be treated as an expense of MUA for accounting purposes. |
| (d) | MUA and the Manager have entered into a fee waiver agreement (the “Fee Waiver Agreement”), pursuant to which the Manager has contractually agreed to waive the investment advisory fees with respect to any portion of MUA’s assets attributable to investments in any equity and fixed-income mutual funds and ETFs managed by the Manager or its affiliates that have a contractual management fee, through June 30, 2023. In addition, pursuant to the Fee Waiver Agreement, the Manager has contractually agreed to waive its investment advisory fees by the amount of investment advisory fees MUA pays to the Manager indirectly through its investment in money market funds managed by the Manager or its affiliates, through June 30, 2023. The Fee Waiver Agreement may be terminated at any time, without the payment of any penalty, only by MUA (upon the vote of a majority of the Directors who are not “interested persons” (as defined in the Investment Company Act of 1940, as amended (the “Investment Company Act”), of MUA (the “Independent Directors”)) or a majority of the outstanding voting securities of MUA), upon 90 days’ written notice by MUA to the Manager. |
Expense Example
The following example illustrates MUA’s expenses (including the sales load of $10.00 and offering costs of $0.12) that shareholders would pay on a $1,000 investment in common shares, assuming (i) total net annual expenses of 0.98% of net assets attributable to common shares and (ii) a 5% annual return:
| 1 Year | 3 Years | 5 Years | 10 Years | |||||||||||||
| Total expenses incurred |
$ | 20 | $ | 41 | $ | 64 | $ | 129 | ||||||||
The example should not be considered a representation of future expenses. The example assumes that the estimated “Other expenses” set forth in the Estimated Annual Expenses table are accurate and that all dividends and distributions are reinvested at NAV. Actual expenses may be greater or less than those assumed. Moreover, MUA’s actual rate of return may be greater or less than the hypothetical 5% return shown in the example.
| 100 | 2 0 2 2 B L A C K R O C K A N N U A L R E P O R T T O S H A R E H O L D E R S |
Shareholder Update (continued)
Share Price Data
The following table summarizes MUA’s highest and lowest daily closing market prices on the NYSE per common share, the NAV per common share, and the premium to or discount from NAV, on the date of each of the high and low market prices. The trading volume indicates the number of common shares traded on the NYSE during the respective quarters.
| |
NYSE Market Price Per Common Share |
|
|
NAV per Common Share on Date of Market Price |
|
|
Premium/ (Discount) on Date of Market Price |
|
||||||||||||||||||||
|
|
|
|
|
|
|
|||||||||||||||||||||||
| During Quarter Ended |
High | Low | High | Low | High | Low | Trading Volume | |||||||||||||||||||||
| April 30, 2022 |
$ | 14.44 | $ | 11.70 | $ | 14.36 | $ | 12.75 | 0.56 | % | (8.24 | )% | 4,880,887 | |||||||||||||||
| January 31, 2022 |
16.43 | 13.96 | 15.02 | 14.57 | 9.39 | (4.19 | ) | 3,487,411 | ||||||||||||||||||||
| October 31, 2021 |
16.77 | 14.76 | 15.08 | 14.83 | 11.21 | (0.47 | ) | 2,704,969 | ||||||||||||||||||||
| July 31, 2021 |
17.46 | 15.25 | 15.04 | 14.78 | 16.09 | 3.18 | 2,765,542 | |||||||||||||||||||||
| April 30, 2021 |
15.91 | 14.23 | 14.84 | 14.53 | 7.21 | (2.06 | ) | 3,335,653 | ||||||||||||||||||||
| January 31, 2021 |
15.28 | 13.55 | 14.66 | 13.92 | 4.23 | (2.66 | ) | 3,179,354 | ||||||||||||||||||||
| October 31, 2020 |
14.74 | 13.49 | 14.01 | 13.92 | 5.21 | (3.09 | ) | 2,844,590 | ||||||||||||||||||||
| July 31, 2020 |
14.27 | 12.58 | 14.00 | 12.91 | 1.93 | (2.56 | ) | 3,317,978 | ||||||||||||||||||||
As of April 30, 2022, MUA’s market price, NAV per Common Share, and premium/(discount) to NAV per Common Share are $11.90, $12.42, and (4.19)% respectively.
Common shares of MUA have historically traded at both a premium and discount to NAV.
Shares of closed-end funds frequently trade at a discount to their NAV. Because of this possibility and the recognition that any such discount may not be in the interest of shareholders, the Board might consider from time to time engaging in open-market repurchases, managed distribution plans, or other programs intended to reduce the discount. We cannot guarantee or assure, however, that the Board will decide to engage in any of these actions. Nor is there any guarantee or assurance that such actions, if undertaken, would result in the shares trading at a price equal or close to the NAV.
Senior Securities
The following table sets forth information regarding MUA’s outstanding senior securities as of the end of each of MUA’s last ten fiscal years, as applicable. The information in this table has been audited by Deloitte & Touche LLP, independent registered public accounting firm. MUA’s audited financial statements, including Deloitte & Touche LLP’s Report of Independent Registered Public Accounting Firm, and accompanying notes to financial statements, are included in this annual report.
| Fiscal Year Ended April 30, |
|
Total Amount Outstanding (000) |
|
|
Asset Coverage |
(a) |
|
Liquidating Preference |
(b) |
|
Type of Senior Security |
| ||||
| 2022 |
$ | 175,000 | $ | 371,729 | $ | 100,000 | VRDP Shares | |||||||||
| (a) | Calculated by subtracting MUA’s total liabilities (not including VRDP Shares) from MUA’s total assets and dividing this by the amount of VRDP Shares outstanding, and by multiplying the results by 100,000. |
| (b) | Represents the amount to which a holder of preferred shares would be entitled upon the liquidation of MUA in preference to common shareholders, expressed as a dollar amount per preferred share. VRDP Shares are considered debt of the issuer; therefore, the liquidation preference approximates fair value. |
| S H A R E H O L D E R U P D A T E |
101 |
Automatic Dividend Reinvestment Plan
Pursuant to MUA, MUI, MHD and MVT’s Dividend Reinvestment Plan (the “Reinvestment Plan”), Common Shareholders are automatically enrolled to have all distributions of dividends and capital gains and other distributions reinvested by Computershare Trust Company, N.A. (the “Reinvestment Plan Agent”) in the respective Fund’s Common Shares pursuant to the Reinvestment Plan. Shareholders who do not participate in the Reinvestment Plan will receive all distributions in cash paid by check and mailed directly to the shareholders of record (or if the shares are held in street name or other nominee name, then to the nominee) by the Reinvestment Plan Agent, which serves as agent for the shareholders in administering the Reinvestment Plan.
After MUA, MUI, MHD and MVT declare a dividend or determine to make a capital gain or other distribution, the Reinvestment Plan Agent will acquire shares for the participants’ accounts, depending upon the following circumstances, either (i) through receipt of unissued but authorized shares from the Funds (“newly issued shares”) or (ii) by purchase of outstanding shares on the open market or on the Fund’s primary exchange (“open-market purchases”). If, on the dividend payment date, the net asset value (“NAV”) per share is equal to or less than the market price per share plus estimated brokerage commissions (such condition often referred to as a “market premium”), the Reinvestment Plan Agent will invest the dividend amount in newly issued shares acquired on behalf of the participants. The number of newly issued shares to be credited to each participant’s account will be determined by dividing the dollar amount of the dividend by the NAV on the date the shares are issued. However, if the NAV is less than 95% of the market price on the dividend payment date, the dollar amount of the dividend will be divided by 95% of the market price on the dividend payment date. If, on the dividend payment date, the NAV is greater than the market price per share plus estimated brokerage commissions (such condition often referred to as a “market discount”), the Reinvestment Plan Agent will invest the dividend amount in shares acquired on behalf of the participants in open-market purchases. If the Reinvestment Plan Agent is unable to invest the full dividend amount in open-market purchases, or if the market discount shifts to a market premium during the purchase period, the Reinvestment Plan Agent will invest any un-invested portion in newly issued shares. Investments in newly issued shares made in this manner would be made pursuant to the same process described above and the date of issue for such newly issued shares will substitute for the dividend payment date.
You may elect not to participate in the Reinvestment Plan and to receive all dividends in cash by contacting the Reinvestment Plan Agent, at the address set forth below.
Participation in the Reinvestment Plan is completely voluntary and may be terminated or resumed at any time without penalty by notice if received and processed by the Reinvestment Plan Agent prior to the dividend record date. Additionally, the Reinvestment Plan Agent seeks to process notices received after the record date but prior to the payable date and such notices often will become effective by the payable date. Where late notices are not processed by the applicable payable date, such termination or resumption will be effective with respect to any subsequently declared dividend or other distribution.
The Reinvestment Plan Agent’s fees for the handling of the reinvestment of distributions will be paid by each Fund. However, each participant will pay a pro rata share of brokerage commissions incurred with respect to the Reinvestment Plan Agent’s open-market purchases in connection with the reinvestment of all distributions. The automatic reinvestment of all distributions will not relieve participants of any U.S. federal, state or local income tax that may be payable on such dividends or distributions.
Each Fund reserves the right to amend or terminate the Reinvestment Plan. There is no direct service charge to participants in the Reinvestment Plan; however, each Fund reserves the right to amend the Reinvestment Plan to include a service charge payable by the participants. Participants in MUI that request a sale of shares are subject to a $2.50 sales fee and a $0.15 per share fee. Per share fees include any applicable brokerage commissions the Reinvestment Plan Agent is required to pay. Participants in MUA, MHD and MVT that request a sale of shares are subject to a $0.02 per share sold brokerage commission. All correspondence concerning the Reinvestment Plan should be directed to Computershare Trust Company, N.A. through the internet at computershare.com/blackrock, or in writing to Computershare, P.O. Box 505000, Louisville, KY 40233, Telephone: (800) 699-1236. Overnight correspondence should be directed to the Reinvestment Plan Agent at Computershare, 462 South 4th Street, Suite 1600, Louisville, KY 40202.
| 102 | 2 0 2 2 B L A C K R O C K A N N U A L R E P O R T T O S H A R E H O L D E R S |
Director and Officer Information
| Independent Directors(a) | ||||||||
| Name Year of Birth(b) |
Position(s) Held (Length of Service)(c) |
Principal Occupation(s) During Past Five Years | Number of BlackRock-Advised Registered Investment Companies (“RICs”) Consisting of Investment Portfolios (“Portfolios”) Overseen |
Public Company and Other Investment Company Directorships Held During Past Five Years | ||||
| R. Glenn Hubbard 1958 |
Chair of the Board (Since 2022) Director (Since 2007) |
Dean, Columbia Business School from 2004 to 2019; Faculty member, Columbia Business School since 1988. | 69 RICs consisting of 99 Portfolios | ADP (data and information services) 2004-2020; Metropolitan Life Insurance Company (insurance); KKR Financial Corporation (finance) from 2004 until 2014. | ||||
| W. Carl Kester(d) 1951 |
Vice Chair of the Board (Since 2022) Director (Since 2007) |
George Fisher Baker Jr. Professor of Business Administration, Harvard Business School since 2008; Deputy Dean for Academic Affairs from 2006 to 2010; Chairman of the Finance Unit, from 2005 to 2006; Senior Associate Dean and Chairman of the MBA Program from 1999 to 2005; Member of the faculty of Harvard Business School since 1981. | 71 RICs consisting of 101 Portfolios | None | ||||
| Cynthia L. Egan 1955 |
Director (Since 2016) |
Advisor, U.S. Department of the Treasury from 2014 to 2015; President, Retirement Plan Services, for T. Rowe Price Group, Inc. from 2007 to 2012; executive positions within Fidelity Investments from 1989 to 2007. | 69 RICs consisting of 99 Portfolios | Unum (insurance); The Hanover Insurance Group (Board Chair) (insurance); Huntsman Corporation (Lead Independent Director and non Executive Vice Chair of the Board) (chemical products); Envestnet (investment platform) from 2013 until 2016. | ||||
| Frank J. Fabozzi(d) 1948 |
Director (Since 2007) |
Editor of The Journal of Portfolio Management since 1986; Professor of Finance, EDHEC Business School (France) since 2011; Professor of Practice, Johns Hopkins University since 2021; Visiting Professor, Princeton University for the 2013 to 2014 academic year and Spring 2017 semester; Professor in the Practice of Finance, Yale University School of Management from 1994 to 2011 and currently a Teaching Fellow in Yale’s Executive Programs; Board Member, BlackRock Equity- Liquidity Funds from 2014 to 2016; affiliated professor Karlsruhe Institute of Technology from 2008 to 2011; Visiting Professor, Rutgers University for the Spring 2019 semester; Visiting Professor, New York University for the 2019 academic year; Adjunct Professor of Finance, Carnegie Mellon University in fall 2020 semester. | 71 RICs consisting of 101 Portfolios | None | ||||
| Lorenzo A. Flores 1964 |
Director (Since 2021) |
Vice Chairman, Kioxia, Inc. since 2019; Chief Financial Officer, Xilinx, Inc. from 2016 to 2019; Corporate Controller, Xilinx, Inc. from 2008 to 2016. | 69 RICs consisting of 99 Portfolios | None | ||||
| Stayce D. Harris 1959 |
Director (Since 2021) |
Lieutenant General, Inspector General, Office of the Secretary of the United States Air Force from 2017 to 2019; Lieutenant General, Assistant Vice Chief of Staff and Director, Air Staff, United States Air Force from 2016 to 2017; Major General, Commander, 22nd Air Force, AFRC, Dobbins Air Reserve Base, Georgia from 2014 to 2016; Pilot, United Airlines from 1990 to 2020. | 69 RICs consisting of 99 Portfolios | The Boeing Company. | ||||
| D I R E C T O R A N D O F F I C E R I N F O R M A T I O N |
103 |
Director and Officer Information (continued)
| Independent Directors(a) (continued) | ||||||||
| Name Year of Birth(b) |
Position(s) Held (Length of Service)(c) |
Principal Occupation(s) During Past Five Years | Number of BlackRock-Advised Registered Investment Companies (“RICs”) Consisting of Investment Portfolios (“Portfolios”) Overseen |
Public Company and Other Investment Company Directorships Held During Past Five Years | ||||
| J. Phillip Holloman 1955 |
Director (Since 2021) |
President and Chief Operating Officer, Cintas Corporation from 2008 to 2018. | 69 RICs consisting of 99 Portfolios | PulteGroup, Inc. (home construction); Rockwell Automation Inc. (industrial automation). | ||||
| Catherine A. Lynch(d) 1961 |
Director (Since 2016) |
Chief Executive Officer, Chief Investment Officer and various other positions, National Railroad Retirement Investment Trust from 2003 to 2016; Associate Vice President for Treasury Management, The George Washington University from 1999 to 2003; Assistant Treasurer, Episcopal Church of America from 1995 to 1999. | 71 RICs consisting of 101 Portfolios | PennyMac Mortgage Investment Trust. | ||||
| Karen P. Robards 1950 |
Director (Since 2007) |
Principal of Robards & Company, LLC (consulting and private investing) since 1987; Co-founder and Director of the Cooke Center for Learning and Development (a not-for-profit organization) since 1987; Director of Enable Injections, LLC (medical devices) since 2019; Investment Banker at Morgan Stanley from 1976 to 1987. | 69 RICs consisting of 99 Portfolios | Greenhill & Co., Inc.; AtriCure, Inc. (medical devices) from 2000 until 2017. | ||||
| 104 | 2 0 2 2 B L A C K R O C K A N N U A L R E P O R T T O S H A R E H O L D E R S |
Director and Officer Information (continued)
| Interested Directors(a)(e) | ||||||||
| Name Year of Birth(b) |
Position(s) Held (Length of Service)(c) |
Principal Occupation(s) During Past Five Years | Number of BlackRock-Advised Registered Investment Companies (“RICs”) Consisting of Investment Portfolios (“Portfolios”) Overseen |
Public Company and Other Investment Company Directorships Held During Past Five Years | ||||
| Robert Fairbairn 1965 |
Director (Since 2018) |
Vice Chairman of BlackRock, Inc. since 2019; Member of BlackRock’s Global Executive and Global Operating Committees; Co-Chair of BlackRock’s Human Capital Committee; Senior Managing Director of BlackRock, Inc. from 2010 to 2019; oversaw BlackRock’s Strategic Partner Program and Strategic Product Management Group from 2012 to 2019; Member of the Board of Managers of BlackRock Investments, LLC from 2011 to 2018; Global Head of BlackRock’s Retail and iShares® businesses from 2012 to 2016. | 98 RICs consisting of 262 Portfolios | None | ||||
| John M. Perlowski(d) 1964 |
Director (Since 2015) President and Chief Executive Officer (Since 2010) |
Managing Director of BlackRock, Inc. since 2009; Head of BlackRock Global Accounting and Product Services since 2009; Advisory Director of Family Resource Network (charitable foundation) since 2009. | 100 RICs consisting of 264 Portfolios | None | ||||
|
(a) The address of each Director is c/o BlackRock, Inc., 55 East 52nd Street, New York, New York 10055. | ||||||||
| (b) Each Independent Director holds office until his or her successor is duly elected and qualifies or until his or her earlier death, resignation, retirement or removal as provided by the Fund’s by-laws or charter or statute, or until December 31 of the year in which he or she turns 75. Directors who are “interested persons,” as defined in the Investment Company Act serve until their successor is duly elected and qualifies or until their earlier death, resignation, retirement or removal as provided by the Fund’s by-laws or statute, or until December 31 of the year in which they turn 72. The Board may determine to extend the terms of Independent Directors on a case-by-case basis, as appropriate. | ||||||||
|
(c) Following the combination of Merrill Lynch Investment Managers, L.P. (“MLIM”) and BlackRock, Inc. in September 2006, the various legacy MLIM and legacy BlackRock fund boards were realigned and consolidated into three new fund boards in 2007. Certain Independent Directors first became members of the boards of other legacy MLIM or legacy BlackRock funds as follows: Frank J. Fabozzi, 1988; R. Glenn Hubbard, 2004; W. Carl Kester, 1995; and Karen P. Robards, 1998. | ||||||||
| (d) Dr. Fabozzi, Dr. Kester, Ms. Lynch and Mr. Perlowski are also trustees of the BlackRock Credit Strategies Fund and BlackRock Private Investments Fund. | ||||||||
|
(e) Mr. Fairbairn and Mr. Perlowski are both “interested persons,” as defined in the 1940 Act, of the Fund based on their positions with BlackRock, Inc. and its affiliates. Mr. Fairbairn and Mr. Perlowski are also board members of the BlackRock Multi-Asset Complex. | ||||||||
| D I R E C T O R A N D O F F I C E R I N F O R M A T I O N |
105 |
Director and Officer Information (continued)
| Officers Who Are Not Directors(a) | ||||
| Name Year of Birth(b) |
Position(s) Held (Length of Service) |
Principal Occupation(s) During Past Five Years | ||
| Jonathan Diorio 1980 |
Vice President (Since 2015) |
Managing Director of BlackRock, Inc. since 2015; Director of BlackRock, Inc. from 2011 to 2015. | ||
| Trent Walker 1974 |
Chief Financial Officer (Since 2021) |
Managing Director of BlackRock, Inc. since September 2019; Executive Vice President of PIMCO from 2016 to 2019; Senior Vice President of PIMCO from 2008 to 2015; Treasurer from 2013 to 2019 and Assistant Treasurer from 2007 to 2017 of PIMCO Funds, PIMCO Variable Insurance Trust, PIMCO ETF Trust, PIMCO Equity Series, PIMCO Equity Series VIT, PIMCO Managed Accounts Trust, 2 PIMCO-sponsored interval funds and 21 PIMCO-sponsored closed-end funds. | ||
| Jay M. Fife 1970 |
Treasurer (Since 2007) |
Managing Director of BlackRock, Inc. since 2007. | ||
| Charles Park 1967 |
Chief Compliance Officer (Since 2014) |
Anti-Money Laundering Compliance Officer for certain BlackRock-advised Funds from 2014 to 2015; Chief Compliance Officer of BlackRock Advisors, LLC and the BlackRock-advised Funds in the BlackRock Multi-Asset Complex and the BlackRock Fixed-Income Complex since 2014; Principal of and Chief Compliance Officer for iShares® Delaware Trust Sponsor LLC since 2012 and BlackRock Fund Advisors (“BFA”) since 2006; Chief Compliance Officer for the BFA-advised iShares® exchange traded funds since 2006; Chief Compliance Officer for BlackRock Asset Management International Inc. since 2012. | ||
| Janey Ahn 1975 |
Secretary (Since 2012) |
Managing Director of BlackRock, Inc. since 2018; Director of BlackRock, Inc. from 2009 to 2017. | ||
|
(a) The address of each Officer is c/o BlackRock, Inc., 55 East 52nd Street, New York, New York 10055. | ||||
|
(b) Officers of the Fund serve at the pleasure of the Board. | ||||
Effective July 30, 2021, Lorenzo A. Flores was appointed to serve as a Director of the Funds.
Effective December 31, 2021, Richard E. Cavanagh and Michael J. Castellano retired as Directors of the Funds.
Effective May 31, 2022, Karen P. Robards retired as a Director of the Funds.
| 106 | 2 0 2 2 B L A C K R O C K A N N U A L R E P O R T T O S H A R E H O L D E R S |
Proxy Results
At a Joint Special Meeting of Shareholders of BlackRock Municipal Income Fund, Inc. (the “Acquiring Fund”), held on February 4, 2022, Fund shareholders were asked to vote on the following proposals:
Common and Preferred Shareholders
Proposal 2. The common shareholders and VMTP Holders of the Acquiring Fund were being asked to vote as a single class on a proposal to approve the issuance of additional common shares of the Acquiring Fund in connection with the Reorganization Agreement.
With respect to this Proposal, the shares of the Fund were voted as follows:
|
|
||||||||||||||
| Fund Name | For | Against | Abstain | |||||||||||
|
|
||||||||||||||
| MUI |
18,947,177 | 1,312,463 | 476,265 | |||||||||||
|
|
||||||||||||||
Preferred Shareholders
Proposal 1(C). The holders of VMTP Shares (“VMTP Holders”) of the Acquiring Fund are being asked to vote as a separate class on a proposal to approve an Agreement and Plan of Reorganization between BlackRock MuniHoldings Investment Quality Fund (“MFL”) and the Acquiring Fund (the “Reorganization Agreement”) and the transactions contemplated therein.
With respect to this Proposal, the shares of the Fund were voted as follows:
|
|
||||||||||||||
| Fund Name | For | Against | Abstain | |||||||||||
|
|
||||||||||||||
| MUI |
2,871 | — | — | |||||||||||
|
|
||||||||||||||
Fund Certification
The Funds are listed for trading on the NYSE and have filed with the NYSE their annual chief executive officer certification regarding compliance with the NYSE’s listing standards. The Funds filed with the SEC the certification of its chief executive officer and chief financial officer required by Section 302 of the Sarbanes-Oxley Act.
Regulation Regarding Derivatives
On October 28, 2020, the Securities and Exchange Commission (the “SEC”) adopted regulations governing the use of derivatives by registered investment companies (“Rule 18f-4”). The Funds will be required to implement and comply with Rule 18f-4 by August 19, 2022. Once implemented, Rule 18f-4 will impose limits on the amount of derivatives a fund can enter into, eliminate the asset segregation framework currently used by funds to comply with Section 18 of the 1940 Act, treat derivatives as senior securities and require funds whose use of derivatives is more than a limited specified exposure amount to establish and maintain a comprehensive derivatives risk management program and appoint a derivatives risk manager.
Environmental, Social and Governance (“ESG”) Integration
Although a Fund does not seek to implement a specific ESG, impact or sustainability strategy unless otherwise disclosed, Fund management will consider ESG characteristics as part of the investment process for actively managed Funds. These considerations will vary depending on a Fund’s particular investment strategies and may include consideration of third-party research as well as consideration of proprietary BlackRock research across the ESG risks and opportunities regarding an issuer. Fund management will consider those ESG characteristics it deems relevant or additive when making investment decisions for a Fund. The ESG characteristics utilized in a Fund’s investment process are anticipated to evolve over time and one or more characteristics may not be relevant with respect to all issuers that are eligible for investment. ESG characteristics are not the sole considerations when making investment decisions for a Fund. Further, investors can differ in their views of what constitutes positive or negative ESG characteristics. As a result, a Fund may invest in issuers that do not reflect the beliefs and values with respect to ESG of any particular investor. ESG considerations may affect a Fund’s exposure to certain companies or industries and a Fund may forego certain investment opportunities. While Fund management views ESG considerations as having the potential to contribute to a Fund’s long-term performance, there is no guarantee that such results will be achieved.
Dividend Policy
Each Fund’s dividend policy is to distribute all or a portion of its net investment income to its shareholders on a monthly basis. In order to provide shareholders with a more stable level of distributions, the Funds may at times pay out less than the entire amount of net investment income earned in any particular month and may at times in any particular month pay out such accumulated but undistributed income in addition to net investment income earned in that month. As a result, the distributions paid by the Funds for any particular month may be more or less than the amount of net investment income earned by the Funds during such month. The Funds’ current accumulated but undistributed net investment income, if any, is disclosed as accumulated earnings (loss) in the Statements of Assets and Liabilities, which comprises part of the financial information included in this report.
| A D D I T I O N A L I N F O R M A T I O N |
107 |
Additional Information (continued)
General Information
The Funds (other than MUA) do not make available copies of their Statements of Additional Information because the Funds’ (other than MUA’s) shares are not continuously offered, which means that the Statement of Additional Information of each Fund (other than MUA) has not been updated after completion of the respective Fund’s offerings and the information contained in each Fund’s (other than MUA’s) Statement of Additional Information may have become outdated.
MUA’s Statement of Additional Information includes additional information about its Board and is available, without charge upon request by calling (800)-882-0052.
The following information is a summary of certain changes since April 30, 2021. This information may not reflect all of the changes that have occurred since you purchased the relevant Fund.
On November 2, 2021, MUI, MHD and MVT divided its Board of Directors into three classes, with one class standing for election each year, effective November 18, 2021. In addition, on November 2, 2021, each Fund amended and restated its Bylaws, with respect to MUI, MHD and MVT, to classify its Board of Directors and, with respect to MUA, MUI, MHD and MVT, to adopt a voting standard of a majority of the outstanding shares for the election of directors in a contested election.
Effective November 2, 2021, MHD has elected to be subject to the Maryland Control Share Acquisition Act (the “MCSAA”). In general, the MCSAA limits the ability of holders of “control shares” to vote those shares above various threshold levels that start at 10% unless the other stockholders of MHD, as applicable, reinstate those voting rights at a meeting of stockholders as provided in the MCSAA. “Control shares” are generally defined in the MCSAA as shares of stock that, if aggregated with all other shares of stock that are either (i) owned by a person or (ii) as to which that person is entitled to exercise or direct the exercise of voting power, except solely by virtue of a revocable proxy, would entitle that person to exercise voting power in electing directors above various thresholds of voting power starting at 10%. MHD’s Bylaws also provide that the provisions of the MCSAA shall not apply to, among other things, the voting rights of the holders of any shares of preferred stock of MHD, but the MCSAA would apply to any common stock held by the same holder.
Except if noted otherwise herein, there were no changes to the Funds’ charters or by-laws that would delay or prevent a change of control of the Funds that were not approved by the shareholders. Except if noted otherwise herein, there have been no changes in the persons who are primarily responsible for the day-to-day management of the Funds’ portfolios.
In accordance with Section 23(c) of the Investment Company Act of 1940, each Fund may from time to time purchase shares of its common stock in the open market or in private transactions.
Quarterly performance, semi-annual and annual reports, current net asset value and other information regarding the Funds may be found on BlackRock’s website, which can be accessed at blackrock.com. Any reference to BlackRock’s website in this report is intended to allow investors public access to information regarding the Funds and does not, and is not intended to, incorporate BlackRock’s website in this report.
Electronic Delivery
Shareholders can sign up for e-mail notifications of quarterly statements, annual and semi-annual shareholder reports and, for MUA only, prospectuses, by enrolling in the electronic delivery program. Electronic copies of shareholder reports and, for MUA only, prospectuses, are available on BlackRock’s website.
To enroll in electronic delivery:
Shareholders Who Hold Accounts with Investment Advisers, Banks or Brokerages:
Please contact your financial adviser. Please note that not all investment advisers, banks or brokerages may offer this service.
Householding
The Funds will mail only one copy of shareholder documents, including for MUA only, prospectuses, annual and semi-annual reports, Rule 30e-3 notices and proxy statements, to shareholders with multiple accounts at the same address. This practice is commonly called “householding” and is intended to reduce expenses and eliminate duplicate mailings of shareholder documents. Mailings of your shareholder documents may be householded indefinitely unless you instruct us otherwise. If you do not want the mailing of these documents to be combined with those for other members of your household, please call the Funds at (800) 882-0052.
Availability of Quarterly Schedule of Investments
The Funds file their complete schedules of portfolio holdings with the SEC for the first and third quarters of each fiscal year as an exhibit to their reports on Form N-PORT. The Funds’ Forms N-PORT are available on the SEC’s website at sec.gov. Additionally, each Fund makes its portfolio holdings for the first and third quarters of each fiscal year available at blackrock.com/fundreports.
Availability of Proxy Voting Policies, Procedures and Voting Records
A description of the policies and procedures that the Funds use to determine how to vote proxies relating to portfolio securities and information about how the Funds voted proxies relating to securities held in the Funds’ portfolios during the most recent 12-month period ended June 30 is available without charge, upon request (1) by calling (800) 882-0052; (2) on the BlackRock website at blackrock.com; and (3) on the SEC’s website at sec.gov.
| 108 | 2 0 2 2 B L A C K R O C K A N N U A L R E P O R T T O S H A R E H O L D E R S |
Additional Information (continued)
Availability of Fund Updates
BlackRock will update performance and certain other data for the Funds on a monthly basis on its website in the “Closed-end Funds” section of blackrock.com as well as certain other material information as necessary from time to time. Investors and others are advised to check the website for updated performance information and the release of other material information about the Funds. This reference to BlackRock’s website is intended to allow investors public access to information regarding the Funds and does not, and is not intended to, incorporate BlackRock’s website in this report.
Shelf Offering Program
From time to time, MUA may seek to raise additional equity capital through a Shelf Offering. In a Shelf Offering, MUA may, subject to market conditions, raise additional equity capital by issuing new Common Shares from time to time in varying amounts at a net price at or above MUA’s net asset value (“NAV”) per Common Share (calculated within 48 hours of pricing). While any such Shelf Offering may allow MUA to pursue additional investment opportunities without the need to sell existing portfolio investments, it could also entail risks – including that the issuance of additional Common Shares may limit the extent to which the Common Shares are able to trade at a premium to NAV in the secondary market.
On August 26, 2021, MUA filed a final prospectus with the SEC in connection with its Shelf Offering. This report and the prospectus of MUA are not offers to sell MUA Common Shares or solicitations of an offer to buy MUA Common Shares in any jurisdiction where such offers or sales are not permitted. The prospectus of MUA contains important information about the Fund, including its investment objective, risks, charges and expenses. Investors are urged to read the prospectus of MUA carefully and in its entirety before investing. Copies of the final prospectus for MUA can be obtained from BlackRock at blackrock.com.
BlackRock Privacy Principles
BlackRock is committed to maintaining the privacy of its current and former fund investors and individual clients (collectively, “Clients”) and to safeguarding their non-public personal information. The following information is provided to help you understand what personal information BlackRock collects, how we protect that information and why in certain cases we share such information with select parties.
If you are located in a jurisdiction where specific laws, rules or regulations require BlackRock to provide you with additional or different privacy-related rights beyond what is set forth below, then BlackRock will comply with those specific laws, rules or regulations.
BlackRock obtains or verifies personal non-public information from and about you from different sources, including the following: (i) information we receive from you or, if applicable, your financial intermediary, on applications, forms or other documents; (ii) information about your transactions with us, our affiliates, or others; (iii) information we receive from a consumer reporting agency; and (iv) from visits to our websites.
BlackRock does not sell or disclose to non-affiliated third parties any non-public personal information about its Clients, except as permitted by law or as is necessary to respond to regulatory requests or to service Client accounts. These non-affiliated third parties are required to protect the confidentiality and security of this information and to use it only for its intended purpose.
We may share information with our affiliates to service your account or to provide you with information about other BlackRock products or services that may be of interest to you. In addition, BlackRock restricts access to non-public personal information about its Clients to those BlackRock employees with a legitimate business need for the information. BlackRock maintains physical, electronic and procedural safeguards that are designed to protect the non-public personal information of its Clients, including procedures relating to the proper storage and disposal of such information.
Fund and Service Providers
Investment Adviser
BlackRock Advisors, LLC
Wilmington, DE 19809
Accounting Agent and Custodian
State Street Bank and Trust Company
Boston, MA 02111
Transfer Agent
Computershare Trust Company, N.A.
Canton, MA 02021
VRDP Liquidity Provider
Bank of America, N.A.
New York, NY 10036
VRDP Remarketing Agent
BofA Securities, Inc.
New York, NY 10036
VRDP Tender and Paying Agent and VMTP Redemption and Paying Agent
The Bank of New York Mellon
New York, NY 10286
Independent Registered Public Accounting Firm
Deloitte & Touche LLP
Boston, MA 02116
Legal Counsel
Willkie Farr & Gallagher LLP
New York, NY 10019
Address of the Funds
100 Bellevue Parkway
Wilmington, DE 19809
| A D D I T I O N A L I N F O R M A T I O N |
109 |
Glossary of Terms Used in this Report
| Portfolio Abbreviation | ||
| AGC | Assured Guaranty Corp. | |
| AGC-ICC | Assured Guaranty Corp. – Insured Custody Certificate | |
| AGM | Assured Guaranty Municipal Corp. | |
| AMT | Alternative Minimum Tax | |
| ARB | Airport Revenue Bonds | |
| BAB | Build America Bond | |
| BAM | Build America Mutual Assurance Co. | |
| BAM-TCRS | Build America Mutual Assurance Co.- Transferable Custodial Receipts | |
| CAB | Capital Appreciation Bonds | |
| COP | Certificates of Participation | |
| FHA | Federal Housing Administration | |
| FHLMC | Federal Home Loan Mortgage Corp. | |
| FNMA | Federal National Mortgage Association | |
| GNMA | Government National Mortgage Association | |
| GO | General Obligation Bonds | |
| GOL | General Obligation Ltd. | |
| GTD | GTD Guaranteed | |
| HUD SECT 8 | U.S. Department of Housing and Urban Development Section 8 | |
| M/F | Multi-Family | |
| NPFGC | National Public Finance Guarantee Corp. | |
| PSF | Permanent School Fund | |
| PSF-GTD | Permanent School Fund Guaranteed | |
| RB | Revenue Bond | |
| S/F | Single-Family | |
| SAB | Special Assessment Bonds | |
| SAW | State Aid Withholding | |
| SONYMA | State of New York Mortgage Agency | |
| ST | Special Tax | |
| TA | Tax Allocation | |
| 110 | 2 0 2 2 B L A C K R O C K A N N U A L R E P O R T T O S H A R E H O L D E R S |
Want to know more?
blackrock.com | 800-882-0052
This report is intended for current holders. It is not a prospectus. Past performance results shown in this report should not be considered a representation of future performance. The Funds have leveraged their Common Shares, which creates risks for Common Shareholders, including the likelihood of greater volatility of NAV and market price of the Common Shares, and the risk that fluctuations in short-term interest rates may reduce the Common Shares’ yield. Statements and other information herein are as dated and are subject to change.
CEMUNI7-04/22-AR
|
|

|
(b) Not Applicable
Item 2 – Code of Ethics – The registrant (or the “Fund”) has adopted a code of ethics, as of the end of the period covered by this report, applicable to the registrant’s principal executive officer, principal financial officer, principal accounting officer or controller, or persons performing similar functions. During the period covered by this report, the code of ethics was amended to update certain information and to make other non-material changes. During the period covered by this report, there have been no waivers granted under the code of ethics. The registrant undertakes to provide a copy of the code of ethics to any person upon request, without charge, who calls 1-800-882-0052, option 4.
Item 3 – Audit Committee Financial Expert – The registrant’s board of directors (the “board of directors”), has determined that (i) the registrant has the following audit committee financial experts serving on its audit committee and (ii) each audit committee financial expert is independent:
Frank J. Fabozzi
Lorenzo A. Flores
Catherine A. Lynch
Karen P. Robards
The registrant’s board of directors has determined that Karen P. Robards qualifies as an audit committee financial expert pursuant to Item 3(c)(4) of Form N-CSR.
Ms. Robards has a thorough understanding of generally accepted accounting principles, financial statements and internal control over financial reporting as well as audit committee functions. Ms. Robards has been President of Robards & Company, a financial advisory firm, since 1987. Ms. Robards was formerly an investment banker for more than 10 years where she was responsible for evaluating and assessing the performance of companies based on their financial results. Ms. Robards has over 30 years of experience analyzing financial statements. She also is a member of the audit committee of one publicly held company and a non-profit organization.
Under applicable securities laws, a person determined to be an audit committee financial expert will not be deemed an “expert” for any purpose, including without limitation for the purposes of Section 11 of the Securities Act of 1933, as a result of being designated or identified as an audit committee financial expert. The designation or identification as an audit committee financial expert does not impose on such person any duties, obligations, or liabilities greater than the duties, obligations, and liabilities imposed on such person as a member of the audit committee and board of directors in the absence of such designation or identification. The designation or identification of a person as an audit committee financial expert does not affect the duties, obligations, or liability of any other member of the audit committee or board of directors.
Item 4 – Principal Accountant Fees and Services
The following table presents fees billed by Deloitte & Touche LLP (“D&T”) in each of the last two fiscal years for the services rendered to the Fund:
2
| (a) Audit Fees |
(b) Audit-Related Fees1 |
(c) Tax Fees2 |
(d) All Other Fees | |||||||||||||
| Entity Name | Current Fiscal Year End |
Previous Fiscal Year End |
Current Fiscal Year End |
Previous Fiscal Year End |
Current Fiscal Year End |
Previous Fiscal Year End |
Current Fiscal Year End |
Previous Fiscal Year End | ||||||||
| BlackRock MuniVest Fund II, Inc. | $36,006 | $35,653 | $0 | $0 | $16,000 | $14,000 | $420 | $0 | ||||||||
The following table presents fees billed by D&T that were required to be approved by the registrant’s audit committee (the “Committee”) for services that relate directly to the operations or financial reporting of the Fund and that are rendered on behalf of BlackRock Advisors, LLC (the “Investment Adviser” or “BlackRock”) and entities controlling, controlled by, or under common control with BlackRock (not including any sub-adviser whose role is primarily portfolio management and is subcontracted with or overseen by another investment adviser) that provide ongoing services to the Fund (“Affiliated Service Providers”):
|
Current Fiscal Year End |
Previous Fiscal Year End | |||
|
(b) Audit-Related Fees1 |
$0 | $0 | ||
|
(c) Tax Fees2 |
$0 | $0 | ||
|
(d) All Other Fees3 |
$2,098,000 | $2,032,000 |
1 The nature of the services includes assurance and related services reasonably related to the performance of the audit or review of financial statements not included in Audit Fees, including accounting consultations, agreed-upon procedure reports, attestation reports, comfort letters, out-of-pocket expenses and internal control reviews not required by regulators.
2 The nature of the services includes tax compliance and/or tax preparation, including services relating to the filing or amendment of federal, state or local income tax returns, regulated investment company qualification reviews, taxable income and tax distribution calculations.
3 Non-audit fees of $2,098,000 and $2,032,000 for the current fiscal year and previous fiscal year, respectively, were paid to the Fund’s principal accountant in their entirety by BlackRock, in connection with services provided to the Affiliated Service Providers of the Fund and of certain other funds sponsored and advised by BlackRock or its affiliates for a service organization review and an accounting research tool subscription. These amounts represent aggregate fees paid by BlackRock and were not allocated on a per fund basis.
(e)(1) Audit Committee Pre-Approval Policies and Procedures:
The Committee has adopted policies and procedures with regard to the pre-approval of services. Audit, audit-related and tax compliance services provided to the registrant on an annual basis require specific pre-approval by the Committee. The Committee also must approve other non-audit services provided to the registrant and those non-audit services provided to the Investment Adviser and Affiliated Service Providers that relate directly to the operations and the financial reporting of the registrant. Certain of these non-audit services that the Committee believes are (a) consistent with the SEC’s auditor independence rules and (b) routine and recurring services that will not impair the independence of the independent accountants may be approved by the Committee without consideration on a specific case-by-case basis (“general pre-approval”). The term of any general pre-approval is 12 months from the date of the pre-approval, unless the Committee provides for a different period. Tax or other non-audit services provided to the registrant which have a direct impact on the operations or financial reporting of the registrant will only be deemed pre-approved provided that any individual project does not exceed $10,000 attributable to the registrant or $50,000 per project. For this purpose, multiple projects will be aggregated to determine if they exceed the previously mentioned cost levels.
Any proposed services exceeding the pre-approved cost levels will require specific pre-approval by the Committee, as will any other services not subject to general pre-approval (e.g., unanticipated but permissible services). The Committee is informed of each service approved
3
subject to general pre-approval at the next regularly scheduled in-person board meeting. At this meeting, an analysis of such services is presented to the Committee for ratification. The Committee may delegate to the Committee Chairman the authority to approve the provision of and fees for any specific engagement of permitted non-audit services, including services exceeding pre-approved cost levels.
(e)(2) None of the services described in each of Items 4(b) through (d) were approved by the Committee pursuant to the de minimis exception in paragraph (c)(7)(i)(C) of Rule 2-01 of Regulation S-X.
(f) Not Applicable
(g) The aggregate non-audit fees, defined as the sum of the fees shown under “Audit-Related Fees,” “Tax Fees” and “All Other Fees,” paid to the accountant for services rendered by the accountant to the registrant, the Investment Adviser and the Affiliated Service Providers were:
| Entity Name |
Current Fiscal Year End |
Previous Fiscal Year End |
||||
| BlackRock MuniVest Fund II, Inc. | $16,420 | $14,000 |
Additionally, the amounts billed by D&T in connection with services provided to the Affiliated Service Providers of the Fund and of other funds sponsored or advised by BlackRock or its affiliates during the current and previous fiscal years for a service organization review and an accounting research tool subscription were:
|
Current Fiscal Year End |
Previous Fiscal Year End | |
|
$2,098,000 |
$2,032,000 |
These amounts represent aggregate fees paid by BlackRock and were not allocated on a per fund basis.
(h) The Committee has considered and determined that the provision of non-audit services that were rendered to the Investment Adviser, and the Affiliated Service Providers that were not pre-approved pursuant to paragraph (c)(7)(ii) of Rule 2-01 of Regulation S-X is compatible with maintaining the principal accountant’s independence.
(i) – Not Applicable
(j) – Not Applicable
Item 5 – Audit Committee of Listed Registrant
| (a) | The following individuals are members of the registrant’s separately designated standing audit committee established in accordance with Section 3(a)(58)(A) of the Securities Exchange Act of |
4
| 1934 (15 U.S.C. 78c(a)(58)(A)): |
Frank J. Fabozzi
Lorenzo A. Flores
J. Phillip Holloman
Catherine A. Lynch
Karen P. Robards
| (b) | Not Applicable |
Item 6 – Investments
(a) The registrant’s Schedule of Investments is included as part of the Report to Stockholders filed under Item 1(a) of this Form.
(b) Not Applicable due to no such divestments during the semi-annual period covered since the previous Form N-CSR filing.
Item 7 – Disclosure of Proxy Voting Policies and Procedures for Closed-End Management Investment Companies – The board of directors has delegated the voting of proxies for the Fund’s portfolio securities to the Investment Adviser pursuant to the Investment Adviser’s proxy voting guidelines. Under these guidelines, the Investment Adviser will vote proxies related to Fund securities in the best interests of the Fund and its stockholders. From time to time, a vote may present a conflict between the interests of the Fund’s stockholders, on the one hand, and those of the Investment Adviser, or any affiliated person of the Fund or the Investment Adviser, on the other. In such event, provided that the Investment Adviser’s Equity Investment Policy Oversight Committee, or a sub-committee thereof (the “Oversight Committee”) is aware of the real or potential conflict or material non-routine matter and if the Oversight Committee does not reasonably believe it is able to follow its general voting guidelines (or if the particular proxy matter is not addressed in the guidelines) and vote impartially, the Oversight Committee may retain an independent fiduciary to advise the Oversight Committee on how to vote or to cast votes on behalf of the Investment Adviser’s clients. If the Investment Adviser determines not to retain an independent fiduciary, or does not desire to follow the advice of such independent fiduciary, the Oversight Committee shall determine how to vote the proxy after consulting with the Investment Adviser’s Portfolio Management Group and/or the Investment Adviser’s Legal and Compliance Department and concluding that the vote cast is in its client’s best interest notwithstanding the conflict. A copy of the Fund’s Proxy Voting Policy and Procedures are attached as Exhibit 99.PROXYPOL , a copy of the Fund’s Global Corporate Governance & Engagement Principles are attached as Exhibit 99.GLOBAL.CORP.GOV and a copy of the Fund’s Corporate Governance and Proxy Voting Guidelines for U.S. Securities are attached as Exhibit 99.US.CORP.GOV. Information on how the Fund voted proxies relating to portfolio securities during the most recent 12-month period ended June 30 is available without charge, (i) at www.blackrock.com and (ii) on the SEC’s website at http://www.sec.gov.
Item 8 – Portfolio Managers of Closed-End Management Investment Companies
(a)(1) As of the date of filing this Report:
5
The registrant is managed by a team of investment professionals comprised of Theodore R. Jaeckel, Jr., CFA, Managing Director at BlackRock, and Walter O’Connor, Managing Director at BlackRock. Each is a member of BlackRock’s municipal tax-exempt management group. Each is jointly responsible for the day-to-day management of the registrant’s portfolio, which includes setting the registrant’s overall investment strategy, overseeing the management of the registrant and the selection of its investments. Messrs. Jaeckel and O’Connor have both been members of the registrant’s portfolio management team since 2006.
| Portfolio Manager | Biography | |
| Theodore R. Jaeckel, Jr. | Managing Director of BlackRock since 2006; Managing Director of Merrill Lynch Investment Managers, L.P. (“MLIM”) from 2005 to 2006; Director of MLIM from 1997 to 2005. | |
| Walter O’Connor | Managing Director of BlackRock since 2006; Managing Director of MLIM from 2003 to 2006; Director of MLIM from 1998 to 2003. | |
(a)(2) As of April 30, 2022:
|
(ii) Number of Other Accounts Managed and Assets by Account Type |
(iii) Number of Other Accounts and Assets for Which Advisory Fee is Performance-Based | |||||||||||
|
(i) Name of Portfolio Manager |
Other Registered Investment Companies |
Other Pooled Investment Vehicles |
Other Accounts |
Other Registered Investment Companies |
Other Pooled Investment Vehicles |
Other Accounts | ||||||
| Theodore R. Jaeckel, Jr. | 20 | 0 | 0 | 0 | 0 | 0 | ||||||
| $23.69 Billion | $0 | $0 | $0 | $0 | $0 | |||||||
| Walter O’Connor | 19 | 0 | 0 | 0 | 0 | 0 | ||||||
| $28.64 Billion | $0 | $0 | $0 | $0 | $0 | |||||||
(iv) Potential Material Conflicts of Interest
BlackRock has built a professional working environment, firm-wide compliance culture and compliance procedures and systems designed to protect against potential incentives that may favor one account over another. BlackRock has adopted policies and procedures that address the allocation of investment opportunities, execution of portfolio transactions, personal trading by employees and other potential conflicts of interest that are designed to ensure that all client accounts are treated equitably over time. Nevertheless, BlackRock furnishes investment management and advisory services to numerous clients in addition to the Fund, and BlackRock may, consistent with applicable law, make investment recommendations to other clients or accounts (including accounts which are hedge funds or have performance or higher fees paid to BlackRock, or in which portfolio managers have a personal interest in the receipt of such fees), which may be the same as or different from those made to the Fund. In addition, BlackRock, Inc., its affiliates and significant shareholders and any officer, director, shareholder or employee may or may not have an interest in the securities whose purchase and sale BlackRock recommends to the Fund. BlackRock, Inc. or any of its affiliates or significant shareholders, or any officer, director, shareholder, employee or any member of their families may take different actions than those recommended to the Fund by BlackRock with respect to the same securities. Moreover, BlackRock may refrain from rendering any advice or
6
services concerning securities of companies of which any of BlackRock, Inc.’s (or its affiliates’ or significant shareholders’) officers, directors or employees are directors or officers, or companies as to which BlackRock, Inc. or any of its affiliates or significant shareholders or the officers, directors and employees of any of them has any substantial economic interest or possesses material non-public information. Certain portfolio managers also may manage accounts whose investment strategies may at times be opposed to the strategy utilized for a fund. It should also be noted that a portfolio manager may be managing certain hedge fund and/or long only accounts, or may be part of a team managing certain hedge fund and/or long only accounts, subject to incentive fees. Such portfolio managers may therefore be entitled to receive a portion of any incentive fees earned on such accounts. Currently, the portfolio managers of this fund are not entitled to receive a portion of incentive fees of other accounts.
As a fiduciary, BlackRock owes a duty of loyalty to its clients and must treat each client fairly. When BlackRock purchases or sells securities for more than one account, the trades must be allocated in a manner consistent with its fiduciary duties. BlackRock attempts to allocate investments in a fair and equitable manner among client accounts, with no account receiving preferential treatment. To this end, BlackRock, Inc. has adopted policies that are intended to ensure reasonable efficiency in client transactions and provide BlackRock with sufficient flexibility to allocate investments in a manner that is consistent with the particular investment discipline and client base, as appropriate.
(a)(3) As of April 30, 2022:
Portfolio Manager Compensation Overview
The discussion below describes the portfolio managers’ compensation as of April 30, 2022.
BlackRock’s financial arrangements with its portfolio managers, its competitive compensation and its career path emphasis at all levels reflect the value senior management places on key resources. Compensation may include a variety of components and may vary from year to year based on a number of factors. The principal components of compensation include a base salary, a performance-based discretionary bonus, participation in various benefits programs and one or more of the incentive compensation programs established by BlackRock.
Base Compensation. Generally, portfolio managers receive base compensation based on their position with the firm.
Discretionary Incentive Compensation
Discretionary incentive compensation is a function of several components: the performance of BlackRock, Inc., the performance of the portfolio manager’s group within BlackRock, the investment performance, including risk-adjusted returns, of the firm’s assets under management or supervision by that portfolio manager relative to predetermined benchmarks, and the individual’s performance and contribution to the overall performance of these portfolios and BlackRock. In most cases, these benchmarks are the same as the benchmark or benchmarks against which the performance of the Fund or other accounts managed by the portfolio managers are measured. Among other things, BlackRock’s Chief Investment Officers make a subjective determination with
7
respect to each portfolio manager’s compensation based on the performance of the Fund and other accounts managed by each portfolio manager relative to the various benchmarks. Performance of fixed income funds is measured on a pre-tax and/or after-tax basis over various time periods including 1-, 3- and 5- year periods, as applicable. With respect to these portfolio managers, such benchmarks for the Fund and other accounts are: a combination of market-based indices (e.g., Bloomberg Municipal Bond Index), certain customized indices and certain fund industry peer groups..
Distribution of Discretionary Incentive Compensation. Discretionary incentive compensation is distributed to portfolio managers in a combination of cash, deferred BlackRock, Inc. stock awards, and/or deferred cash awards that notionally track the return of certain BlackRock investment products.
Portfolio managers receive their annual discretionary incentive compensation in the form of cash. Portfolio managers whose total compensation is above a specified threshold also receive deferred BlackRock, Inc. stock awards annually as part of their discretionary incentive compensation. Paying a portion of discretionary incentive compensation in the form of deferred BlackRock, Inc. stock puts compensation earned by a portfolio manager for a given year “at risk” based on BlackRock’s ability to sustain and improve its performance over future periods. In some cases, additional deferred BlackRock, Inc. stock may be granted to certain key employees as part of a long-term incentive award to aid in retention, align interests with long-term shareholders and motivate performance. Deferred BlackRock, Inc. stock awards are generally granted in the form of BlackRock, Inc. restricted stock units that vest pursuant to the terms of the applicable plan and, once vested, settle in BlackRock, Inc. common stock. The portfolio managers of this Fund have deferred BlackRock, Inc. stock awards.
For certain portfolio managers, a portion of the discretionary incentive compensation is also distributed in the form of deferred cash awards that notionally track the returns of select BlackRock investment products they manage, which provides direct alignment of portfolio manager discretionary incentive compensation with investment product results. Deferred cash awards vest ratably over a number of years and, once vested, settle in the form of cash. Only portfolio managers who manage specified products and whose total compensation is above a specified threshold are eligible to participate in the deferred cash award program.
Other Compensation Benefits. In addition to base salary and discretionary incentive compensation, portfolio managers may be eligible to receive or participate in one or more of the following:
Incentive Savings Plans — BlackRock, Inc. has created a variety of incentive savings plans in which BlackRock, Inc. employees are eligible to participate, including a 401(k) plan, the BlackRock Retirement Savings Plan (RSP), and the BlackRock Employee Stock Purchase Plan (ESPP). The employer contribution components of the RSP include a company match equal to 50% of the first 8% of eligible pay contributed to the plan capped at $5,000 per year, and a company retirement contribution equal to 3-5% of eligible compensation up to the Internal Revenue Service limit ($305,000 for 2022). The RSP offers a range of investment options, including registered investment companies and collective investment funds managed by the firm. BlackRock, Inc. contributions follow the investment direction set by participants for their own contributions or,
8
absent participant investment direction, are invested into a target date fund that corresponds to, or is closest to, the year in which the participant attains age 65. The ESPP allows for investment in BlackRock, Inc. common stock at a 5% discount on the fair market value of the stock on the purchase date. Annual participation in the ESPP is limited to the purchase of 1,000 shares of common stock or a dollar value of $25,000 based on its fair market value on the purchase date. All of the eligible portfolio managers are eligible to participate in these plans.
(a)(4) Beneficial Ownership of Securities – As of April 30, 2022:
| Portfolio Manager |
Dollar Range of Equity Securities of the Fund Beneficially Owned | |
|
Theodore R. Jaeckel, Jr. |
None | |
|
Walter O’Connor |
None |
(b) Not Applicable
Item 9 – Purchases of Equity Securities by Closed-End Management Investment Company and Affiliated Purchasers – Not Applicable due to no such purchases during the period covered by this report.
Item 10 – Submission of Matters to a Vote of Security Holders – There have been no material changes to these procedures.
Item 11 – Controls and Procedures
(a) The registrant’s principal executive and principal financial officers, or persons performing similar functions, have concluded that the registrant’s disclosure controls and procedures (as defined in Rule 30a-3(c) under the Investment Company Act of 1940, as amended (the “1940 Act”)) are effective as of a date within 90 days of the filing of this report based on the evaluation of these controls and procedures required by Rule 30a-3(b) under the 1940 Act and Rule 13a-15(b) under the Securities Exchange Act of 1934, as amended.
(b) There were no changes in the registrant’s internal control over financial reporting (as defined in Rule 30a-3(d) under the 1940 Act) that occurred during the period covered by this report that have materially affected, or are reasonably likely to materially affect, the registrant’s internal control over financial reporting.
Item 12 – Disclosure of Securities Lending Activities for Closed-End Management Investment Companies –Not Applicable
Item 13 – Exhibits attached hereto
(a)(1) Code of Ethics – See Item 2
(a)(2) Section 302 Certifications are attached
(a)(3) Any written solicitation to purchase securities under Rule 23c-1 – Not Applicable
(a)(4) Change in Registrant’s independent public accountant – Not Applicable
9
(b) Section 906 Certifications are attached
10
Pursuant to the requirements of the Securities Exchange Act of 1934 and the Investment Company Act of 1940, the registrant has duly caused this report to be signed on its behalf by the undersigned, thereunto duly authorized.
BlackRock MuniVest Fund II, Inc.
| By: | /s/ John M. Perlowski | |||
| John M. Perlowski | ||||
| Chief Executive Officer (principal executive officer) of | ||||
| BlackRock MuniVest Fund II, Inc. |
Date: June 28, 2022
Pursuant to the requirements of the Securities Exchange Act of 1934 and the Investment Company Act of 1940, this report has been signed below by the following persons on behalf of the registrant and in the capacities and on the dates indicated.
| By: | /s/ John M. Perlowski | |||
| John M. Perlowski | ||||
| Chief Executive Officer (principal executive officer) of | ||||
| BlackRock MuniVest Fund II, Inc. |
Date: June 28, 2022
| By: | /s/ Trent Walker | |||
| Trent Walker | ||||
| Chief Financial Officer (principal financial officer) of | ||||
| BlackRock MuniVest Fund II, Inc. |
Date: June 28, 2022
11