FY
2024
--06-30
false
0000896156
true
false
false
false
false
2
10
2
3
3
0
0
0
0
2018 2019 2020 2021 2022 2023 2024
2020 2021 2022 2023 2024
2018 2019 2020 2021 2022 2023 2024
2021 2022 2023 2024
3,888
3,888
0
0
0
0
0
0
1.0
0.10
false
2,243
false
false
http://fasb.org/us-gaap/2024#OtherLiabilitiesNoncurrent
http://fasb.org/us-gaap/2024#OtherLiabilitiesNoncurrent
http://fasb.org/us-gaap/2024#OtherLiabilitiesCurrent
http://fasb.org/us-gaap/2024#OtherLiabilitiesCurrent
http://fasb.org/us-gaap/2024#PropertyPlantAndEquipmentNet
http://fasb.org/us-gaap/2024#PropertyPlantAndEquipmentNet
5
3
0
0
0
0
5
3
20
3
0
0
0
0
00008961562023-07-012024-06-30
thunderdome:item
iso4217:USD
00008961562024-06-30
00008961562022-06-30
00008961562023-06-30
0000896156country:CA2022-06-30
0000896156country:CA2023-06-30
0000896156country:CA2024-06-30
0000896156country:HN2022-06-30
0000896156country:HN2023-06-30
0000896156country:HN2024-06-30
0000896156country:MX2022-06-30
0000896156country:MX2023-06-30
0000896156country:MX2024-06-30
0000896156country:US2022-06-30
0000896156country:US2023-06-30
0000896156country:US2024-06-30
xbrli:pure
0000896156us-gaap:SalesRevenueNetMemberus-gaap:GeographicConcentrationRiskMemberus-gaap:NonUsMember2021-07-012022-06-30
0000896156us-gaap:SalesRevenueNetMemberus-gaap:GeographicConcentrationRiskMemberus-gaap:NonUsMember2022-07-012023-06-30
0000896156us-gaap:SalesRevenueNetMemberus-gaap:GeographicConcentrationRiskMemberus-gaap:NonUsMember2023-07-012024-06-30
0000896156us-gaap:SalesRevenueNetMemberus-gaap:GeographicConcentrationRiskMembercountry:US2021-07-012022-06-30
0000896156us-gaap:SalesRevenueNetMemberus-gaap:GeographicConcentrationRiskMembercountry:US2022-07-012023-06-30
0000896156us-gaap:SalesRevenueNetMemberus-gaap:GeographicConcentrationRiskMembercountry:US2023-07-012024-06-30
0000896156eth:InventoryProfitEliminationMember2022-06-30
0000896156eth:InventoryProfitEliminationMember2023-06-30
0000896156eth:InventoryProfitEliminationMember2024-06-30
0000896156eth:RetailSegmentMember2022-06-30
0000896156eth:RetailSegmentMember2023-06-30
0000896156eth:RetailSegmentMember2024-06-30
0000896156eth:WholesaleSegmentMember2022-06-30
0000896156eth:WholesaleSegmentMember2023-06-30
0000896156eth:WholesaleSegmentMember2024-06-30
00008961562021-07-012022-06-30
00008961562022-07-012023-06-30
0000896156eth:RetailSegmentMember2021-07-012022-06-30
0000896156eth:RetailSegmentMember2022-07-012023-06-30
0000896156eth:RetailSegmentMember2023-07-012024-06-30
0000896156eth:WholesaleSegmentMember2021-07-012022-06-30
0000896156eth:WholesaleSegmentMember2022-07-012023-06-30
0000896156eth:WholesaleSegmentMember2023-07-012024-06-30
0000896156us-gaap:IntersegmentEliminationMember2021-07-012022-06-30
0000896156us-gaap:IntersegmentEliminationMember2022-07-012023-06-30
0000896156us-gaap:IntersegmentEliminationMember2023-07-012024-06-30
0000896156us-gaap:OperatingSegmentsMembereth:RetailSegmentMember2021-07-012022-06-30
0000896156us-gaap:OperatingSegmentsMembereth:RetailSegmentMember2022-07-012023-06-30
0000896156us-gaap:OperatingSegmentsMembereth:RetailSegmentMember2023-07-012024-06-30
0000896156us-gaap:OperatingSegmentsMembereth:WholesaleSegmentMember2021-07-012022-06-30
0000896156us-gaap:OperatingSegmentsMembereth:WholesaleSegmentMember2022-07-012023-06-30
0000896156us-gaap:OperatingSegmentsMembereth:WholesaleSegmentMember2023-07-012024-06-30
0000896156us-gaap:OperatingSegmentsMembereth:ExternalCustomersMembereth:WholesaleSegmentMember2021-07-012022-06-30
0000896156us-gaap:OperatingSegmentsMembereth:ExternalCustomersMembereth:WholesaleSegmentMember2022-07-012023-06-30
0000896156us-gaap:OperatingSegmentsMembereth:ExternalCustomersMembereth:WholesaleSegmentMember2023-07-012024-06-30
0000896156us-gaap:IntersegmentEliminationMembereth:WholesaleSegmentMember2021-07-012022-06-30
0000896156us-gaap:IntersegmentEliminationMembereth:WholesaleSegmentMember2022-07-012023-06-30
0000896156us-gaap:IntersegmentEliminationMembereth:WholesaleSegmentMember2023-07-012024-06-30
0000896156us-gaap:SalesRevenueProductLineMemberus-gaap:ProductConcentrationRiskMembereth:HomeAccentsAndOtherMembereth:RetailSegmentMember2023-07-012024-06-30
0000896156us-gaap:SalesRevenueProductLineMemberus-gaap:ProductConcentrationRiskMembereth:CaseGoodsMembereth:RetailSegmentMember2023-07-012024-06-30
0000896156us-gaap:SalesRevenueProductLineMemberus-gaap:ProductConcentrationRiskMembereth:UpholsteredProductsMembereth:RetailSegmentMember2023-07-012024-06-30
00008961562018-07-012023-06-30
00008961562013-07-012023-06-30
0000896156eth:CompanyOperatedDesignCentersMember2024-06-30
0000896156us-gaap:SalesRevenueNetMemberus-gaap:CustomerConcentrationRiskMembereth:RetailSegmentMember2022-07-012023-06-30
0000896156us-gaap:SalesRevenueNetMemberus-gaap:CustomerConcentrationRiskMembereth:RetailSegmentMember2023-07-012024-06-30
0000896156us-gaap:SalesRevenueProductLineMemberus-gaap:ProductConcentrationRiskMembereth:HomeAccentsAndOtherMembereth:WholesaleSegmentMember2023-07-012024-06-30
0000896156us-gaap:SalesRevenueProductLineMemberus-gaap:ProductConcentrationRiskMembereth:CaseGoodsMembereth:WholesaleSegmentMember2023-07-012024-06-30
0000896156us-gaap:SalesRevenueProductLineMemberus-gaap:ProductConcentrationRiskMembereth:UpholsteredProductsMembereth:WholesaleSegmentMember2023-07-012024-06-30
0000896156us-gaap:SalesRevenueNetMemberus-gaap:CustomerConcentrationRiskMembereth:UnitedStatesGovernmentGSAMember2023-07-012024-06-30
0000896156us-gaap:SalesRevenueNetMemberus-gaap:CustomerConcentrationRiskMembereth:TenLargestIndependentRetailersMembereth:WholesaleSegmentMember2022-07-012023-06-30
0000896156us-gaap:SalesRevenueNetMemberus-gaap:CustomerConcentrationRiskMembereth:TenLargestIndependentRetailersMembereth:WholesaleSegmentMember2022-07-012023-06-03
0000896156us-gaap:SalesRevenueNetMemberus-gaap:CustomerConcentrationRiskMembereth:WholesaleSegmentMember2023-07-012024-06-30
0000896156us-gaap:SalesRevenueNetMemberus-gaap:CustomerConcentrationRiskMembereth:WholesaleSegmentMember2022-07-012023-06-30
utr:Y
0000896156us-gaap:PerformanceSharesMember2021-07-012022-06-30
0000896156us-gaap:PerformanceSharesMember2022-07-012023-06-30
0000896156us-gaap:PerformanceSharesMember2023-07-012024-06-30
xbrli:shares
0000896156us-gaap:PerformanceSharesMember2024-06-30
0000896156eth:GrantedWithinTheFiscalYearEndedJune302024Memberus-gaap:PerformanceSharesMember2021-07-012022-06-30
0000896156eth:GrantedWithinTheFiscalYearEndedJune302024Memberus-gaap:PerformanceSharesMember2022-07-012023-06-30
0000896156eth:GrantedWithinTheFiscalYearEndedJune302024Memberus-gaap:PerformanceSharesMember2023-07-012024-06-30
0000896156eth:GrantedWithinTheFiscalYearEndedJune302023Memberus-gaap:PerformanceSharesMember2021-07-012022-06-30
0000896156eth:GrantedWithinTheFiscalYearEndedJune302023Memberus-gaap:PerformanceSharesMember2022-07-012023-06-30
0000896156eth:GrantedWithinTheFiscalYearEndedJune302023Memberus-gaap:PerformanceSharesMember2023-07-012024-06-30
0000896156eth:GrantedWithinTheFiscalYearEndedJune302022Memberus-gaap:PerformanceSharesMember2021-07-012022-06-30
0000896156eth:GrantedWithinTheFiscalYearEndedJune302022Memberus-gaap:PerformanceSharesMember2022-07-012023-06-30
0000896156eth:GrantedWithinTheFiscalYearEndedJune302022Memberus-gaap:PerformanceSharesMember2023-07-012024-06-30
0000896156eth:GrantedWithinTheFiscalYearEndedJune302021Memberus-gaap:PerformanceSharesMember2021-07-012022-06-30
0000896156eth:GrantedWithinTheFiscalYearEndedJune302021Memberus-gaap:PerformanceSharesMember2022-07-012023-06-30
0000896156eth:GrantedWithinTheFiscalYearEndedJune302021Memberus-gaap:PerformanceSharesMember2023-07-012024-06-30
iso4217:USDxbrli:shares
0000896156us-gaap:PerformanceSharesMember2023-06-30
0000896156us-gaap:PerformanceSharesMember2022-06-30
0000896156us-gaap:PerformanceSharesMember2021-06-30
0000896156us-gaap:RestrictedStockUnitsRSUMember2022-07-012023-06-30
0000896156us-gaap:RestrictedStockUnitsRSUMember2023-07-012024-06-30
0000896156us-gaap:RestrictedStockUnitsRSUMember2024-06-30
0000896156us-gaap:RestrictedStockUnitsRSUMember2023-06-30
0000896156us-gaap:RestrictedStockUnitsRSUMember2022-06-30
0000896156us-gaap:RestrictedStockUnitsRSUMember2021-07-012022-06-30
0000896156us-gaap:RestrictedStockUnitsRSUMember2021-06-30
0000896156us-gaap:ShareBasedPaymentArrangementNonemployeeMember2022-06-30
0000896156us-gaap:ShareBasedPaymentArrangementNonemployeeMember2023-06-30
0000896156us-gaap:ShareBasedPaymentArrangementNonemployeeMember2024-06-30
0000896156us-gaap:ShareBasedPaymentArrangementNonemployeeMember2021-07-012022-06-30
0000896156us-gaap:ShareBasedPaymentArrangementNonemployeeMember2022-07-012023-06-30
0000896156us-gaap:ShareBasedPaymentArrangementNonemployeeMember2023-07-012024-06-30
0000896156us-gaap:ShareBasedPaymentArrangementEmployeeMember2022-07-012023-06-30
0000896156us-gaap:ShareBasedPaymentArrangementEmployeeMember2023-07-012024-06-30
0000896156us-gaap:EmployeeStockOptionMember2023-07-012024-06-30
0000896156us-gaap:EmployeeStockOptionMember2024-06-30
0000896156srt:MaximumMember2022-07-012023-06-30
00008961562021-06-30
00008961562020-07-012021-06-30
00008961562020-06-012021-06-30
0000896156eth:StockOptionPlan1992Membersrt:MaximumMember2021-06-30
0000896156us-gaap:AccumulatedOtherComprehensiveIncomeMember2023-06-30
0000896156us-gaap:AccumulatedOtherComprehensiveIncomeMember2024-06-30
0000896156us-gaap:AociIncludingPortionAttributableToNoncontrollingInterestMember2022-07-012023-06-30
0000896156us-gaap:AociIncludingPortionAttributableToNoncontrollingInterestMember2023-07-012024-06-30
0000896156us-gaap:AccumulatedOtherComprehensiveIncomeMember2022-06-30
0000896156us-gaap:AccumulatedNetUnrealizedInvestmentGainLossMember2023-06-30
0000896156us-gaap:AccumulatedNetUnrealizedInvestmentGainLossMember2024-06-30
0000896156us-gaap:AccumulatedTranslationAdjustmentMember2023-06-30
0000896156us-gaap:AccumulatedTranslationAdjustmentMember2024-06-30
0000896156us-gaap:PerformanceSharesMember2021-07-012022-06-30
0000896156us-gaap:PerformanceSharesMember2022-07-012023-06-30
0000896156us-gaap:PerformanceSharesMember2023-07-012024-06-30
0000896156us-gaap:EmployeeStockOptionMember2021-07-012022-06-30
0000896156us-gaap:EmployeeStockOptionMember2022-07-012023-06-30
0000896156us-gaap:EmployeeStockOptionMember2023-07-012024-06-30
0000896156us-gaap:ForeignCountryMemberus-gaap:MexicanTaxAuthorityMember2023-07-012024-06-30
0000896156us-gaap:ForeignCountryMemberus-gaap:CanadaRevenueAgencyMember2023-07-012024-06-30
0000896156us-gaap:StateAndLocalJurisdictionMember2023-07-012024-06-30
0000896156us-gaap:DomesticCountryMember2023-07-012024-06-30
0000896156us-gaap:ForeignCountryMember2023-07-012024-06-30
0000896156us-gaap:StandbyLettersOfCreditMembereth:TheFacilityMember2023-06-30
0000896156us-gaap:StandbyLettersOfCreditMembereth:TheFacilityMember2024-06-30
0000896156us-gaap:RevolvingCreditFacilityMembereth:TheFacilityMember2023-07-012024-06-30
0000896156us-gaap:RevolvingCreditFacilityMembereth:TheFacilityMember2018-12-122018-12-12
0000896156us-gaap:RevolvingCreditFacilityMembereth:TheFacilityMember2018-12-212018-12-21
0000896156us-gaap:RevolvingCreditFacilityMembereth:TheFacilityMember2022-07-012023-06-30
0000896156us-gaap:RevolvingCreditFacilityMembereth:TheFacilityMember2023-06-30
0000896156us-gaap:RevolvingCreditFacilityMembereth:TheFacilityMember2024-06-30
0000896156us-gaap:RevolvingCreditFacilityMembereth:TheFacilityMembersrt:MaximumMembereth:OneMonthAdditionalMarginOnVariableRateOptionMember2022-01-262022-01-26
0000896156us-gaap:RevolvingCreditFacilityMembereth:TheFacilityMembersrt:MinimumMembereth:OneMonthAdditionalMarginOnVariableRateOptionMember2022-01-262022-01-26
0000896156us-gaap:RevolvingCreditFacilityMembereth:TheFacilityMembereth:OneMonthAdjustedTermSofrRateMember2022-01-262022-01-26
0000896156us-gaap:RevolvingCreditFacilityMembereth:TheFacilityMemberus-gaap:FederalFundsEffectiveSwapRateMember2022-01-262022-01-26
0000896156us-gaap:RevolvingCreditFacilityMembereth:TheFacilityMembersrt:MaximumMembereth:AdditionalMarginOnVariableRateOptionMember2022-01-262022-01-26
0000896156us-gaap:RevolvingCreditFacilityMembereth:TheFacilityMembersrt:MinimumMembereth:AdditionalMarginOnVariableRateOptionMember2022-01-262022-01-26
0000896156us-gaap:RevolvingCreditFacilityMembereth:TheFacilityMemberus-gaap:SecuredOvernightFinancingRateSofrOvernightIndexSwapRateMember2022-01-262022-01-26
0000896156us-gaap:RevolvingCreditFacilityMembereth:TheFacilityMember2022-06-30
0000896156us-gaap:RevolvingCreditFacilityMember2022-06-30
0000896156us-gaap:RevolvingCreditFacilityMembereth:TheFacilityMember2022-01-26
0000896156us-gaap:FloodMember2023-07-012024-06-30
0000896156eth:BusinessEmergencyGapAssistanceProgramFromVermontDepartmentOfEconomicDevelopmentMemberus-gaap:FloodMember2023-07-012024-06-30
0000896156eth:EmployeeSeveranceAndOtherChargesIncomeMember2024-06-30
0000896156eth:EmployeeSeveranceAndOtherChargesIncomeMember2023-07-012024-06-30
0000896156eth:EmployeeSeveranceAndOtherChargesIncomeMember2023-06-30
0000896156eth:SaleleasebackTransactionMember2024-06-30
0000896156eth:SaleleasebackTransactionMember2023-07-012024-06-30
0000896156eth:SaleleasebackTransactionMember2023-06-30
0000896156us-gaap:FloodMember2024-06-30
0000896156us-gaap:FloodMember2023-06-30
0000896156eth:InsuranceRecoveriesAndGrantProceedsMemberus-gaap:FloodMember2024-06-30
0000896156eth:InsuranceRecoveriesAndGrantProceedsMemberus-gaap:FloodMember2023-07-012024-06-30
0000896156eth:InsuranceRecoveriesAndGrantProceedsMemberus-gaap:FloodMember2023-06-30
0000896156eth:RepairAndRemediationCostsMemberus-gaap:FloodMember2024-06-30
0000896156eth:RepairAndRemediationCostsMemberus-gaap:FloodMember2023-07-012024-06-30
0000896156eth:RepairAndRemediationCostsMemberus-gaap:FloodMember2023-06-30
0000896156eth:InventoryWritedownsAndOverheadManufacturingCostsMemberus-gaap:FloodMember2024-06-30
0000896156eth:InventoryWritedownsAndOverheadManufacturingCostsMemberus-gaap:FloodMember2023-07-012024-06-30
0000896156eth:InventoryWritedownsAndOverheadManufacturingCostsMemberus-gaap:FloodMember2023-06-30
00008961562022-08-01
00008961562022-08-012022-08-01
0000896156us-gaap:SellingGeneralAndAdministrativeExpensesMember2023-07-012024-06-30
0000896156us-gaap:SellingGeneralAndAdministrativeExpensesMember2022-07-012023-06-30
0000896156us-gaap:InterestIncomeMember2023-07-012024-06-30
0000896156us-gaap:InterestIncomeMember2022-07-012023-06-30
0000896156srt:MaximumMember2024-06-30
0000896156srt:MinimumMember2024-06-30
00008961562023-12-31
0000896156us-gaap:FairValueInputsLevel3Member2023-06-30
0000896156us-gaap:FairValueInputsLevel2Member2023-06-30
0000896156us-gaap:FairValueInputsLevel1Member2023-06-30
0000896156us-gaap:USTreasuryBillSecuritiesMember2023-12-31
0000896156us-gaap:FairValueInputsLevel3Memberus-gaap:USTreasuryBillSecuritiesMember2023-06-30
0000896156us-gaap:FairValueInputsLevel2Memberus-gaap:USTreasuryBillSecuritiesMember2023-06-30
0000896156us-gaap:FairValueInputsLevel1Memberus-gaap:USTreasuryBillSecuritiesMember2023-06-30
0000896156us-gaap:MoneyMarketFundsMember2023-12-31
0000896156us-gaap:MoneyMarketFundsMemberus-gaap:FairValueInputsLevel3Member2023-06-30
0000896156us-gaap:MoneyMarketFundsMemberus-gaap:FairValueInputsLevel2Member2023-06-30
0000896156us-gaap:MoneyMarketFundsMemberus-gaap:FairValueInputsLevel1Member2023-06-30
0000896156us-gaap:FairValueInputsLevel3Member2024-06-30
0000896156us-gaap:FairValueInputsLevel2Member2024-06-30
0000896156us-gaap:FairValueInputsLevel1Member2024-06-30
0000896156us-gaap:USTreasuryNotesSecuritiesMember2024-06-30
0000896156us-gaap:FairValueInputsLevel3Memberus-gaap:USTreasuryNotesSecuritiesMember2024-06-30
0000896156us-gaap:FairValueInputsLevel2Memberus-gaap:USTreasuryNotesSecuritiesMember2024-06-30
0000896156us-gaap:FairValueInputsLevel1Memberus-gaap:USTreasuryNotesSecuritiesMember2024-06-30
0000896156us-gaap:USTreasuryBillSecuritiesMember2024-06-30
0000896156us-gaap:FairValueInputsLevel3Memberus-gaap:USTreasuryBillSecuritiesMember2024-06-30
0000896156us-gaap:FairValueInputsLevel2Memberus-gaap:USTreasuryBillSecuritiesMember2024-06-30
0000896156us-gaap:FairValueInputsLevel1Memberus-gaap:USTreasuryBillSecuritiesMember2024-06-30
0000896156us-gaap:MoneyMarketFundsMember2024-06-30
0000896156us-gaap:MoneyMarketFundsMemberus-gaap:FairValueInputsLevel3Member2024-06-30
0000896156us-gaap:MoneyMarketFundsMemberus-gaap:FairValueInputsLevel2Member2024-06-30
0000896156us-gaap:MoneyMarketFundsMemberus-gaap:FairValueInputsLevel1Member2024-06-30
0000896156srt:ConsolidationEliminationsMember2021-07-012022-06-30
0000896156us-gaap:ManufacturedProductOtherMember2021-07-012022-06-30
0000896156srt:ConsolidationEliminationsMemberus-gaap:ManufacturedProductOtherMember2021-07-012022-06-30
0000896156us-gaap:OperatingSegmentsMemberus-gaap:ManufacturedProductOtherMembereth:RetailSegmentMember2021-07-012022-06-30
0000896156us-gaap:OperatingSegmentsMemberus-gaap:ManufacturedProductOtherMembereth:WholesaleSegmentMember2021-07-012022-06-30
0000896156eth:AccentMember2021-07-012022-06-30
0000896156srt:ConsolidationEliminationsMembereth:AccentMember2021-07-012022-06-30
0000896156us-gaap:OperatingSegmentsMembereth:AccentMembereth:RetailSegmentMember2021-07-012022-06-30
0000896156us-gaap:OperatingSegmentsMembereth:AccentMembereth:WholesaleSegmentMember2021-07-012022-06-30
0000896156eth:CaseGoodsFurnitureMember2021-07-012022-06-30
0000896156srt:ConsolidationEliminationsMembereth:CaseGoodsFurnitureMember2021-07-012022-06-30
0000896156us-gaap:OperatingSegmentsMembereth:CaseGoodsFurnitureMembereth:RetailSegmentMember2021-07-012022-06-30
0000896156us-gaap:OperatingSegmentsMembereth:CaseGoodsFurnitureMembereth:WholesaleSegmentMember2021-07-012022-06-30
0000896156eth:UpholsteryFurnitureMember2021-07-012022-06-30
0000896156srt:ConsolidationEliminationsMembereth:UpholsteryFurnitureMember2021-07-012022-06-30
0000896156us-gaap:OperatingSegmentsMembereth:UpholsteryFurnitureMembereth:RetailSegmentMember2021-07-012022-06-30
0000896156us-gaap:OperatingSegmentsMembereth:UpholsteryFurnitureMembereth:WholesaleSegmentMember2021-07-012022-06-30
0000896156srt:ConsolidationEliminationsMember2022-07-012023-06-30
0000896156us-gaap:ManufacturedProductOtherMember2022-07-012023-06-30
0000896156srt:ConsolidationEliminationsMemberus-gaap:ManufacturedProductOtherMember2022-07-012023-06-30
0000896156us-gaap:OperatingSegmentsMemberus-gaap:ManufacturedProductOtherMembereth:RetailSegmentMember2022-07-012023-06-30
0000896156us-gaap:OperatingSegmentsMemberus-gaap:ManufacturedProductOtherMembereth:WholesaleSegmentMember2022-07-012023-06-30
0000896156eth:AccentMember2022-07-012023-06-30
0000896156srt:ConsolidationEliminationsMembereth:AccentMember2022-07-012023-06-30
0000896156us-gaap:OperatingSegmentsMembereth:AccentMembereth:RetailSegmentMember2022-07-012023-06-30
0000896156us-gaap:OperatingSegmentsMembereth:AccentMembereth:WholesaleSegmentMember2022-07-012023-06-30
0000896156eth:CaseGoodsFurnitureMember2022-07-012023-06-30
0000896156srt:ConsolidationEliminationsMembereth:CaseGoodsFurnitureMember2022-07-012023-06-30
0000896156us-gaap:OperatingSegmentsMembereth:CaseGoodsFurnitureMembereth:RetailSegmentMember2022-07-012023-06-30
0000896156us-gaap:OperatingSegmentsMembereth:CaseGoodsFurnitureMembereth:WholesaleSegmentMember2022-07-012023-06-30
0000896156eth:UpholsteryFurnitureMember2022-07-012023-06-30
0000896156srt:ConsolidationEliminationsMembereth:UpholsteryFurnitureMember2022-07-012023-06-30
0000896156us-gaap:OperatingSegmentsMembereth:UpholsteryFurnitureMembereth:RetailSegmentMember2022-07-012023-06-30
0000896156us-gaap:OperatingSegmentsMembereth:UpholsteryFurnitureMembereth:WholesaleSegmentMember2022-07-012023-06-30
0000896156srt:ConsolidationEliminationsMember2023-07-012024-06-30
0000896156us-gaap:ManufacturedProductOtherMember2023-07-012024-06-30
0000896156srt:ConsolidationEliminationsMemberus-gaap:ManufacturedProductOtherMember2023-07-012024-06-30
0000896156us-gaap:OperatingSegmentsMemberus-gaap:ManufacturedProductOtherMembereth:RetailSegmentMember2023-07-012024-06-30
0000896156us-gaap:OperatingSegmentsMemberus-gaap:ManufacturedProductOtherMembereth:WholesaleSegmentMember2023-07-012024-06-30
0000896156eth:AccentMember2023-07-012024-06-30
0000896156srt:ConsolidationEliminationsMembereth:AccentMember2023-07-012024-06-30
0000896156us-gaap:OperatingSegmentsMembereth:AccentMembereth:RetailSegmentMember2023-07-012024-06-30
0000896156us-gaap:OperatingSegmentsMembereth:AccentMembereth:WholesaleSegmentMember2023-07-012024-06-30
0000896156eth:CaseGoodsFurnitureMember2023-07-012024-06-30
0000896156srt:ConsolidationEliminationsMembereth:CaseGoodsFurnitureMember2023-07-012024-06-30
0000896156us-gaap:OperatingSegmentsMembereth:CaseGoodsFurnitureMembereth:RetailSegmentMember2023-07-012024-06-30
0000896156us-gaap:OperatingSegmentsMembereth:CaseGoodsFurnitureMembereth:WholesaleSegmentMember2023-07-012024-06-30
0000896156eth:UpholsteryFurnitureMember2023-07-012024-06-30
0000896156srt:ConsolidationEliminationsMembereth:UpholsteryFurnitureMember2023-07-012024-06-30
0000896156us-gaap:OperatingSegmentsMembereth:UpholsteryFurnitureMembereth:RetailSegmentMember2023-07-012024-06-30
0000896156us-gaap:OperatingSegmentsMembereth:UpholsteryFurnitureMembereth:WholesaleSegmentMember2023-07-012024-06-30
0000896156eth:LetterOfCreditIssuedForWorkersCompensationObligationMember2023-06-30
0000896156eth:LetterOfCreditIssuedForWorkersCompensationObligationMember2024-06-30
0000896156us-gaap:SoftwareAndSoftwareDevelopmentCostsMembersrt:MaximumMember2024-06-30
0000896156us-gaap:SoftwareAndSoftwareDevelopmentCostsMembersrt:MinimumMember2024-06-30
0000896156us-gaap:MachineryAndEquipmentMembersrt:MaximumMember2024-06-30
0000896156us-gaap:MachineryAndEquipmentMembersrt:MinimumMember2024-06-30
0000896156us-gaap:BuildingAndBuildingImprovementsMembersrt:MaximumMember2024-06-30
0000896156us-gaap:BuildingAndBuildingImprovementsMembersrt:MinimumMember2024-06-30
0000896156eth:ProductProductionMemberus-gaap:GeographicConcentrationRiskMembersrt:NorthAmericaMember2023-07-012024-06-30
0000896156us-gaap:NoncontrollingInterestMember2024-06-30
0000896156us-gaap:RetainedEarningsMember2024-06-30
0000896156us-gaap:TreasuryStockCommonMember2024-06-30
0000896156us-gaap:AdditionalPaidInCapitalMember2024-06-30
0000896156us-gaap:CommonStockMember2024-06-30
0000896156us-gaap:NoncontrollingInterestMember2023-07-012024-06-30
0000896156us-gaap:RetainedEarningsMember2023-07-012024-06-30
0000896156us-gaap:AccumulatedOtherComprehensiveIncomeMember2023-07-012024-06-30
0000896156us-gaap:TreasuryStockCommonMember2023-07-012024-06-30
0000896156us-gaap:AdditionalPaidInCapitalMember2023-07-012024-06-30
0000896156us-gaap:CommonStockMember2023-07-012024-06-30
0000896156us-gaap:NoncontrollingInterestMember2023-06-30
0000896156us-gaap:RetainedEarningsMember2023-06-30
0000896156us-gaap:TreasuryStockCommonMember2023-06-30
0000896156us-gaap:AdditionalPaidInCapitalMember2023-06-30
0000896156us-gaap:CommonStockMember2023-06-30
0000896156us-gaap:NoncontrollingInterestMember2022-07-012023-06-30
0000896156us-gaap:RetainedEarningsMember2022-07-012023-06-30
0000896156us-gaap:AccumulatedOtherComprehensiveIncomeMember2022-07-012023-06-30
0000896156us-gaap:TreasuryStockCommonMember2022-07-012023-06-30
0000896156us-gaap:AdditionalPaidInCapitalMember2022-07-012023-06-30
0000896156us-gaap:CommonStockMember2022-07-012023-06-30
0000896156us-gaap:NoncontrollingInterestMember2022-06-30
0000896156us-gaap:RetainedEarningsMember2022-06-30
0000896156us-gaap:TreasuryStockCommonMember2022-06-30
0000896156us-gaap:AdditionalPaidInCapitalMember2022-06-30
0000896156us-gaap:CommonStockMember2022-06-30
0000896156us-gaap:NoncontrollingInterestMember2021-07-012022-06-30
0000896156us-gaap:RetainedEarningsMember2021-07-012022-06-30
0000896156us-gaap:AccumulatedOtherComprehensiveIncomeMember2021-07-012022-06-30
0000896156us-gaap:TreasuryStockCommonMember2021-07-012022-06-30
0000896156us-gaap:AdditionalPaidInCapitalMember2021-07-012022-06-30
0000896156us-gaap:CommonStockMember2021-07-012022-06-30
0000896156us-gaap:NoncontrollingInterestMember2021-06-30
0000896156us-gaap:RetainedEarningsMember2021-06-30
0000896156us-gaap:AccumulatedOtherComprehensiveIncomeMember2021-06-30
0000896156us-gaap:TreasuryStockCommonMember2021-06-30
0000896156us-gaap:AdditionalPaidInCapitalMember2021-06-30
0000896156us-gaap:CommonStockMember2021-06-30
00008961562024-08-16
UNITED STATES
SECURITIES AND EXCHANGE COMMISSION
Washington, D.C. 20549
FORM 10-K
(Mark One)
|
☒
|
ANNUAL REPORT PURSUANT TO SECTION 13 OR 15(d) OF THE SECURITIES EXCHANGE ACT OF 1934
|
For the fiscal year ended June 30, 2024
OR
|
☐
|
TRANSITION REPORT PURSUANT TO SECTION 13 OR 15(d) OF THE SECURITIES EXCHANGE ACT OF 1934
|
For the transition period from to
Commission file number 1-11692

Ethan Allen Interiors Inc.
(Exact name of registrant as specified in its charter)
|
Delaware
|
|
06-1275288
|
|
(State or other jurisdiction of incorporation or organization)
|
|
(I.R.S. Employer Identification No.)
|
|
25 Lake Avenue Ext., Danbury, Connecticut
|
|
06811-5286
|
|
(Address of principal executive offices)
|
|
(Zip Code)
|
(203) 743-8000
(Registrant's telephone number, including area code)
Securities registered pursuant to Section 12(b) of the Act:
| |
Title of each class
|
|
Trading symbol
|
|
Name of exchange on which registered
|
|
| |
Common stock, $0.01 par value
|
|
ETD
|
|
New York Stock Exchange
|
|
Securities registered pursuant to Section 12(g) of the Act: None
Indicate by check mark if the registrant is a well-known seasoned issuer, as defined in Rule 405 of the Securities Act. ☐ Yes ☒ No
Indicate by check mark if the registrant is not required to file reports pursuant to Section 13 or Section 15(d) of the Act. ☐ Yes ☒ No
Indicate by check mark whether the registrant (1) has filed all reports required to be filed by Section 13 or 15(d) of the Securities Exchange Act of 1934 during the preceding 12 months (or for such shorter period that the registrant was required to file such reports), and (2) has been subject to such filing requirements for the past 90 days. ☒ Yes ☐ No
Indicate by check mark whether the registrant has submitted electronically every Interactive Data File required to be submitted pursuant to Rule 405 of Regulation S-T (§232.405 of this chapter) during the preceding 12 months (or for such shorter period that the registrant was required to submit such files). ☒ Yes ☐ No
Indicate by check mark whether the registrant is a large accelerated filer, an accelerated filer, a non-accelerated filer, smaller reporting company or an emerging growth company. See the definitions of “large accelerated filer,” “accelerated filer,” “smaller reporting company,” and “emerging growth company” in Rule 12b-2 of the Exchange Act.
| |
Large accelerated filer
|
☒ |
Accelerated filer
|
☐ |
| |
Non-accelerated filer
|
☐ |
Smaller reporting company
|
☐ |
| |
Emerging growth company
|
☐ |
|
|
If an emerging growth company, indicate by check mark if the registrant has elected not to use the extended transition period for complying with any new or revised financial accounting standards provided pursuant to Section 13(a) of the Exchange Act. ☐
Indicate by check mark whether the registrant has filed a report on and attestation to its management’s assessment of the effectiveness of its internal control over financial reporting under Section 404(b) of the Sarbanes-Oxley Act (15 U.S.C. 7262(b)) by the registered public accounting firm that prepared or issued its audit report. ☒
If securities are registered pursuant to Section 12(b) of the Act, indicate by check mark whether the financial statements of the registrant included in the filing reflect the correction of an error to previously issued financial statements. ☐
Indicate by check mark whether any of those error corrections are restatements that required a recovery analysis of incentive-based compensation received by any of the registrant's executive officers during the relevant recovery period pursuant to §240.10D-1(b). ☐
Indicate by check mark whether the registrant is a shell company (as defined in Rule 12b-2 of the Act). ☐ Yes ☒ No
Based on the closing price as reported on the New York Stock Exchange on December 31, 2023, the last business day of the registrant’s most recently completed second fiscal quarter, the aggregate market value of the registrant's common stock held by non-affiliates of the registrant on that date was $724 million.
The number of shares outstanding of the registrant’s common stock, $0.01 par value, as of August 16, 2024 was 25,423,374.
DOCUMENTS INCORPORATED BY REFERENCE
Certain information required by Part III of this Annual Report on Form 10-K is incorporated by reference to the registrant’s definitive Proxy Statement for its 2024 Annual Meeting of Stockholders, which will be filed with the Securities and Exchange Commission (“SEC”) not later than 120 days after June 30, 2024.
ETHAN ALLEN INTERIORS INC. AND SUBSIDIARIES
TABLE OF CONTENTS
| Cautionary Note Regarding Forward-Looking Statements |
4 |
| |
|
|
| |
|
|
| PART I |
|
|
| |
|
|
| Item 1. |
Business |
5 |
| |
|
|
| |
Information about our Executive Officers |
10 |
| |
|
|
| Item 1A. |
Risk Factors |
11 |
| |
|
|
| Item 1B. |
Unresolved Staff Comments |
18 |
| |
|
|
| Item 1C. |
Cybersecurity |
18 |
| |
|
|
| Item 2. |
Properties |
19 |
| |
|
|
| Item 3. |
Legal Proceedings |
20 |
| |
|
|
| Item 4. |
Mine Safety Disclosures |
20 |
| |
|
|
| |
|
|
| PART II |
|
|
| |
|
|
| Item 5. |
Market for Registrant's Common Equity, Related Stockholder Matters and Issuer Purchases of Equity Securities |
21 |
| |
|
|
| Item 6. |
[Reserved] |
22 |
| |
|
|
| Item 7. |
Management's Discussion and Analysis of Financial Condition and Results of Operations |
22 |
| |
|
|
| Item 7A. |
Quantitative and Qualitative Disclosures About Market Risk |
35 |
| |
|
|
| Item 8. |
Financial Statements and Supplementary Data |
36 |
| |
|
|
| Item 9. |
Changes in and Disagreements with Accountants on Accounting and Financial Disclosure |
70 |
| |
|
|
| Item 9A. |
Controls and Procedures |
70 |
| |
|
|
| Item 9B. |
Other Information |
70 |
| |
|
|
| Item 9C. |
Disclosure Regarding Foreign Jurisdictions that Prevent Inspections |
70 |
| |
|
|
| |
|
|
| PART III |
|
|
| |
|
|
| Item 10. |
Directors, Executive Officers and Corporate Governance |
71 |
| |
|
|
| Item 11. |
Executive Compensation |
71 |
| |
|
|
| Item 12. |
Security Ownership of Certain Beneficial Owners and Management and Related Stockholder Matters |
71 |
| |
|
|
| Item 13. |
Certain Relationships and Related Transactions, and Director Independence |
72 |
| |
|
|
| Item 14. |
Principal Accountant Fees and Services |
72 |
| |
|
|
| |
|
|
| PART IV |
|
|
| |
|
|
| Item 15. |
Exhibits and Financial Statement Schedules |
73 |
| |
|
|
| Item 16. |
Form 10-K Summary |
74 |
| |
|
|
| Signatures |
75 |
ETHAN ALLEN INTERIORS INC. AND SUBSIDIARIES
CAUTIONARY NOTE REGARDING FORWARD-LOOKING STATEMENTS
This Annual Report on Form 10-K contains certain statements which may constitute “forward-looking statements” within the meaning of the Private Securities Litigation Reform Act of 1995, Section 27A of the Securities Act of 1933 and Section 21E of the Securities Exchange Act of 1934, as amended (the “Exchange Act”). Generally, forward-looking statements include information concerning current expectations, projections or trends relating to results of operations, financial results, financial condition, strategic objectives and plans, expenses, dividends, share repurchases, liquidity, use of cash and cash requirements, borrowing capacity, investments, future economic performance, and our business and industry. Forward-looking statements can be identified by the fact that they do not relate strictly to historical or current facts. These forward-looking statements may include words such as “anticipate,” “estimate,” “expect,” “project,” “plan,” “intend,” “believe,” “continue,” “may,” “will,” “short-term,” “target,” “outlook,” “forecast,” “future,” “strategy,” “opportunity,” “would,” “guidance,” “non-recurring,” “one-time,” “unusual,” “should,” “likely,” and other words and terms of similar meaning in connection with any discussion of the timing or nature of future operating or financial performance or other events.
Forward-looking statements are subject to risks and uncertainties that may cause actual results to differ materially from those that are expected. Ethan Allen Interiors Inc. and its subsidiaries (the “Company”) derive many of its forward-looking statements from operating budgets and forecasts, which are based upon many detailed assumptions. While the Company believes that its assumptions are reasonable, it cautions that it is very difficult to predict the impact of known factors and it is impossible for the Company to anticipate all factors that could affect actual results and matters that are identified as “short term,” “non-recurring,” “unusual,” “one-time,” or other words and terms of similar meaning may in fact recur in one or more future financial reporting periods. Important factors that could cause actual results to differ materially from the Company’s expectations, or cautionary statements, are disclosed in Item 1A, Risk Factors, Item 7, Management’s Discussion and Analysis of Financial Condition and Results of Operations, and elsewhere in this Annual Report on Form 10-K. All forward-looking statements attributable to the Company, or persons acting on its behalf, are expressly qualified in their entirety by these cautionary statements, as well as other cautionary statements. A reader should evaluate all forward-looking statements made in this Annual Report on Form 10-K in the context of these risks and uncertainties. Given the risks and uncertainties surrounding forward-looking statements, you should not place undue reliance on these statements. Many of these factors are beyond our ability to control or predict.
The forward-looking statements included in this Annual Report on Form 10-K are made only as of the date hereof. The Company undertakes no obligation to publicly update or revise any forward-looking statement, whether as a result of new information, future events or otherwise, except as otherwise required by law.
ETHAN ALLEN INTERIORS INC. AND SUBSIDIARIES
PART I
ITEM 1. BUSINESS
Overview
Ethan Allen Interiors Inc., through its wholly-owned subsidiary, Ethan Allen Global, Inc., and Ethan Allen Global, Inc.’s subsidiaries (collectively, “we,” “us,” “our,” “Ethan Allen” or the “Company”), is a leading interior design company, manufacturer and retailer in the home furnishings marketplace. We are a global luxury home fashion brand that is vertically integrated from product design through home delivery, which offers our customers stylish product offerings, artisanal quality, and personalized service. We are known for the quality and craftsmanship of our products as well as for the exceptional personal service from design to delivery, and for our commitment to social responsibility and sustainable operations. Our strong network of entrepreneurial leaders and interior designers provide complimentary interior design service to our clients and sell a full range of home furnishing products through a retail network of design centers located throughout the United States and abroad as well as online at ethanallen.com.
Ethan Allen design centers represent a mix of locations operated by independent licensees and Company-operated locations. At June 30, 2024, the Company operates 142 retail design centers with 138 located in the United States and four in Canada. Our 45 independently operated design centers are located in the United States, Asia, the Middle East and Europe. We manufacture approximately 75% of our furniture in our North American manufacturing plants and have been recognized for product quality and craftsmanship since we were founded in 1932. At June 30, 2024, we own and operate ten manufacturing facilities, including four manufacturing plants, one sawmill, one rough mill and one kiln dry lumberyard in the United States, two manufacturing plants in Mexico and one manufacturing plant in Honduras. We also partner with suppliers located in Europe, Asia, and other countries to produce and import various products that support our business.
Business Strategy
We strive to deliver value to our shareholders through the execution of our strategic initiatives focused on the concept of constant reinvention. Ethan Allen has a distinct vision of classic American style with a modern perspective, which we believe differentiates us from our competitors. Our business model is to maintain continued focus on (i) providing relevant product offerings, (ii) capitalizing on the professional and personal service offered to our clients by our interior design professionals, (iii) leveraging the benefits of our vertical integration including a strong manufacturing presence in North America, (iv) regularly investing in new technologies across all aspects of our vertically integrated business, (v) maintaining a strong logistics network, (vi) communicating our messages with strong marketing campaigns, and (vii) utilizing our website, ethanallen.com, as a key marketing tool to drive traffic to our retail design centers.
We aim to position Ethan Allen as a premier interior design destination and a preferred brand offering products of superior style, quality, and value to clients with a comprehensive solution for their home furnishing and interior design needs. We operate our business with an entrepreneurial attitude, staying focused on long-term growth, and treating our employees, vendors, and clients with dignity and respect, which we believe are important amidst the constant changes taking place in the world.
For the second year in a row Ethan Allen was named to Newsweek’s list of America’s Best Retailers, including the #1 retailer of Premium Furniture. The assessment and rankings were the result of an independent survey of more than 7,000 customers who have shopped at retail stores in person in the past three years and based on the likelihood of recommendation and the evaluation of products, customer service, atmosphere, accessibility and store layout.
Product
By harnessing the expertise of skilled artisans within our North American facilities, we manufacture 75% of the furniture we offer. Every product bears the distinctive quality of the Ethan Allen brand. Meticulously hand-guided stitching dress our upholstery frames and our case goods wood furniture is crafted from premium lumber and veneers, which are individually finished and customized. Our commitment to using leading construction techniques is evident, including using mortise and tenon joinery and four-corner glued dovetail joinery for drawers. These elements are part of Ethan Allen's identity, solidifying our reputation for quality and style in home furnishings.
Our vertically integrated approach empowers us to seamlessly introduce new products, oversee design specifications, and uphold consistent levels of excellence across all product lines. Alongside our seven manufacturing facilities in the United States, we possess two upholstery manufacturing plants in Mexico and a case goods manufacturing facility in Honduras. We selectively outsource the remaining 25% of our products, primarily from Asia. Our sourcing partners must adhere to our quality standards, specifications and social responsibility. If any of these suppliers experience financial or other difficulties, we believe we have alternative sources of supply to prevent temporary disruptions in our imported product flow. We believe our strategic investments in manufacturing facilities and the sourcing from foreign and domestic suppliers positions us to accommodate future growth while retaining control over costs, quality and customer service.
ETHAN ALLEN INTERIORS INC. AND SUBSIDIARIES
Projection
Our design centers are interior design destinations, with technology-driven projections and dedicated workstations that foster collaboration between designers and clients. When clients enter, they see a gallery showroom with a certain number of room projections depending on the design center’s square footage. Touchscreens located throughout the sales floor enable clients to browse at their own pace or with a designer’s guidance. In-store presentations often take place at freestanding designer workstations that are equipped with large flat-panel touchscreen displays to share floorplans and 3D renderings. These workstations also provide space for designers to showcase samples. The overall structure of each location equips designers with the tools they need to create personalized presentations for each client, while also giving clients the sense that what they need to realize their design vision is at their fingertips.
During fiscal 2024, new state-of-the-art design centers were opened in The Villages, FL, Avon, OH, New York, NY, Albuquerque, NM and Louisville, KY that showcase the Company’s unique vision of American style while combining complimentary interior design services with technology. We plan to further expand our retail design center footprint in fiscal 2025 through the addition of new design centers. We ended the fiscal 2024 year with 172 retail design centers in North America, including 142 Company-operated and 30 independently owned and operated locations as well as 15 additional design centers outside North America.
Combining Technology with Personal Service
Our unique combination of personal service and technology enhances the clients’ Ethan Allen experience, including the use of virtual design appointment capabilities at ethanallen.com. We leverage EA inHome®, an augmented reality mobile app, which empowers clients to preview Ethan Allen products in their homes, at scale, in a wide-variety of fabrics and finishes. With the 3D Room Planner, our designers generate both 2D floor plans and immersive 4K, realistic 3D walk-throughs of the interior designs they create. In addition, our website offers a virtual design center, which enables clients to access our home furnishings while either co-browsing live with a designer or browsing on their own, at their own pace. Clients can view items in 3D, read product details, share, and save item lists, and utilize augmented reality views in their homes, either via a QR code on their desktop or directly when browsing on a mobile device. With so much of our product customizable, we encourage our customers to get personalized help from our interior design professionals either in person or through virtual chat. The recent implementation of a state-of-the-art fabric-to-frame configurator empowers designers to visualize nearly 1,000 fabrics and a wide range of construction options on upholstered frames. This cutting-edge addition to our technology stack offers clients a real-time preview of what their custom upholstery will look like. All of these technologies have been pivotal to our ability to serve clients and provide even more ways for us to collaborate and create a timely and exceptional experience.
Marketing
Ethan Allen’s marketing emphasizes our core brand values of quality and craftsmanship, combining personal service with technology, and a commitment to social responsibility. We amplify those values through our dynamic brand story built around a core projection and philosophy: Classics with a Modern Perspective. By adopting a fresh, ever-evolving creative approach, using digital marketing to drive traffic to our retail locations, we continue to broaden our reach and enhance desirability and visibility. Our combination of creative and analytics-driven strategies enables us to secure both new and repeat client traffic to our design centers and to our website at ethanallen.com. Our creative messaging is relevant and aspirational and conveyed through a variety of media, including digital marketing that includes social media and email marketing campaigns, plus direct mail, TV and radio. Additionally, grassroots marketing efforts led by our local design center teams further drive interest in our product offerings. Taken together, these strategies help ensure that we are continuing to add to our client base while maintaining existing relationships.
E-Commerce
We consider our website an extension of our retail design centers and not a separate segment of our business. Recent improvements to our ethanallen.com website include enhanced search capabilities, expanded live chat services, online appointment booking capability, and product listing and display page enhancements. Most clients will use the internet for inspiration and as a start to their shopping process to view products and prices. With so much of our product customizable, we encourage our website customers to get personalized help from our interior design professionals either in person or by chatting online. We believe this complimentary direct contact creates a competitive advantage through our excellent personal service.
ETHAN ALLEN INTERIORS INC. AND SUBSIDIARIES
Raw Materials and Supply Chain
The principal raw materials we use in manufacturing are lumber, logs, veneers, plywood, hardware, glue, finishing materials, glass, steel, fabrics, leather, frames, foam and filling material. The various types of wood used in our products include soft maple, wormy maple, red oak, prima vera, birch, rubber wood and cherry. These raw materials used for manufacturing are for cover (primarily fabrics and leather), polyester batting and polyurethane foam for cushioning and padding, lumber and plywood for frames, steel for motion mechanisms and various other metal components for fabrication of product.
Our raw materials are purchased both domestically and outside the United States. We have no significant long-term supply contracts and believe we have sufficient alternate sources of supply to prevent significant long-term disruption to our operations. Appropriate amounts of inventory are typically stocked to maintain adequate production levels. We believe that our sources of supply for these materials are sufficient and that we are not dependent on any one supplier. Our vertically integrated structure, whereby we manufacture approximately 75% of the furniture we sell, leaves Ethan Allen with reduced exposure to any one particular country on the remaining 25% of products that are imported. We enter into standard purchase agreements with foreign and domestic suppliers to source selected products. The terms of these arrangements are customary for the industry and do not contain any long-term contractual obligations on our behalf. We believe we maintain good relationships with our suppliers.
Segments
We have strategically aligned our business into two reportable segments: wholesale and retail. Our operating segments are aligned with how the Company, including our chief executive officer (defined as our chief operating decision maker), manages the business. These two segments represent strategic business areas of our vertically integrated enterprise that operate separately and provide their own distinctive services. This vertical structure enables us to offer home furnishings while better controlling quality and cost. We evaluate the performance of our respective segments based upon net sales and operating income. Intersegment transactions result, primarily, from the wholesale sale of inventory to the retail segment, including the related profit margin. Financial information, including sales, operating income and long-lived assets related to our segments are disclosed in Note 20, Segment Information, of the notes to our consolidated financial statements included under Item 8 of this Annual Report on Form 10-K.
Seasonality
We believe that the demand for home furnishings generally reflects sensitivity to overall economic conditions, including consumer confidence, discretionary spending, housing starts, sales of new and existing homes, housing values, interest and inflationary rates, the level of mortgage refinancing, retail trends and unemployment rates. In a typical year, we schedule production to maintain consistent manufacturing activity throughout the year. We typically shut down our domestic plants for one week at the beginning of each fiscal year to perform routine maintenance. Historically no one particular fiscal quarter contributes more than 28% of annual net sales volume, thus limiting our exposure to seasonality. Our sales volume and production schedules were impacted by the pandemic and thus did not follow the aforementioned historical trends. As a result of heightened post-pandemic demand during fiscal years 2021 and 2022, significant backlog was built. During fiscal 2023, our wholesale and retail business sales volumes began trending to more historical levels and at June 30, 2024, backlogs were near pre-pandemic levels.
Backlog
We define backlog as any written order received that has not yet been delivered. Our wholesale backlog consists of written orders received from our retail network of independently operated design centers, Company-operated design centers, and contract business customers that have not yet been delivered. Our retail backlog is undelivered written orders associated with end retail customers. Our backlog fluctuates based on the timing of net orders booked, manufacturing production, the timing of imported product receipts, the timing and volume of shipments, and the timing of various promotional events. Historically, the size of our backlog at a given time varies and may not be indicative of our future sales, and therefore, we do not rely entirely on backlogs to predict future sales. At June 30, 2024 our wholesale backlog was $53.5 million, down 27.7% from a year ago and nearing pre-pandemic levels.
Distribution and Logistics
We distribute our products through three national distribution centers, owned by the Company and strategically located in North Carolina and Virginia. These distribution centers provide efficient and effective cross-dock operations to receive and ship Ethan Allen product from our manufacturing facilities and third-party suppliers to our retail network of Company and independently operated retail home delivery centers. Retail home delivery centers prepare products for delivery into clients’ homes. At June 30, 2024, our Company-operated retail design centers were supported by 17 Company-operated retail home delivery centers and five home delivery centers operated by third parties. We utilize independent carriers to ship our products. Our practice has been to sell our products at the same delivered cost to all Company and independently operated design centers throughout the United States, regardless of their shipping point. This policy creates pricing credibility with our wholesale customers while providing our retail segment the opportunity to achieve more consistent margins by removing fluctuations attributable to the cost of shipping.
ETHAN ALLEN INTERIORS INC. AND SUBSIDIARIES
Human Capital Management
We operate our business with an entrepreneurial attitude, staying focused on long-term growth, and treating our employees, vendors, and clients with dignity and respect. At June 30, 2024, our employee count totaled 3,404, with 2,376 employees in our wholesale segment and 1,028 in our retail segment. The majority of our employees are employed on a full-time basis and none of our employees are represented by unions or collective bargaining agreements. In managing our business, we focus on a number of key human capital objectives, which are rooted in our core values and include the following.
Culture and Values
Our employees are vital to our success and are one of the main reasons we continue to perform well. Since our founding, we have aimed to build a collaborative culture that emphasizes treating people with dignity and respect while offering employees a variety of opportunities and experiences. We believe our employees have an entrepreneurial spirit, a passion for style, a drive for excellence, and creativity that has fostered a culture that embraces integrity, diversity, innovation and inclusion of people from all backgrounds. We continue to maintain and enforce our policy prohibiting discrimination and harassment in our workplace.
Ethan Allen is dedicated to upholding the highest ethical standards in all aspects of our business operations. The Company’s Code of Conduct provides a clear and thorough ethics standard for all employees, officers, and directors with respect to interactions with clients, vendors, and other employees. Ethan Allen provides multiple avenues through which to report inappropriate behavior, including a confidential whistleblower hotline.
Diversity and Inclusion
Diversity and inclusion are part of our core values, as we recognize that our employees’ unique backgrounds, experiences and perspectives enable us to create and deliver high-quality products and provide outstanding service to meet the needs of our client base and the communities we serve. We believe in creating and fostering a workplace in which all our employees feel valued, included and empowered to do their best work and contribute their ideas and perspectives. We are committed to recruiting and retaining diverse talent so that our workforce better reflects the communities in which we live and work. Our diversity initiatives include developing impactful practices to advance our Company’s diversity and inclusion policies, supporting diversity awareness across our organization, maintaining an inclusive environment free from discrimination or harassment of any kind, and continuing to offer our employees equal employment opportunities based solely on merit and qualifications. The Company participates in various surveys, which we use as benchmarking tools on corporate policies, practices and benefits, as a commitment to build a diverse and inclusive workforce mirroring the diversity of our clients and the communities we serve. Aligning with our purpose and values, we work every day to support the advancement of women, promoting them to leadership positions throughout our enterprise. We are proud to report that as of June 30, 2024, 71% of our retail division leaders and 67% of our Company-wide leaders are women.
Health and Safety
Ethan Allen is committed to protecting the health and safety of our employees. We have safety programs in place for our employees to receive the proper training and education to ensure they are able to work in a safe environment each day. In addition, we have partnered with local communities in some of our North American manufacturing workshops to provide transportation to and from work and offer daily low-cost meals. In coordination with national healthcare systems for our manufacturing facilities outside of the United States, we provide on-site medical clinics staffed by a doctor and a team of experienced nurses, who also provide a pharmacy to prescribe over-the-counter medications. This commitment and focus enables us to run our business operations without sacrificing the safety of our employees and customers.
A Culture of Social Responsibility
Throughout our history, philanthropy has been a core value to Ethan Allen. We strive to develop exceptional programs based on partnerships where employees feel a sense of connection and pride in their communities and our mission is to enhance the quality of life in the communities in which we work and live. During fiscal 2024, and for the fifth year in a row, the Mexican Center for Corporate Philanthropy and the Alliance for Corporate Social Responsibility recognized Ethan Allen’s upholstery manufacturing operations in Silao, as “Environmentally and Socially Responsible” for our ongoing commitment to socially responsible management.
ETHAN ALLEN INTERIORS INC. AND SUBSIDIARIES
Compensation and Other Benefits
Our compensation programs are designed to attract, retain and motivate team members to achieve strong results. We benchmark our compensation practices and benefits programs against those of comparable industries and in the geographic areas where our facilities are located. We believe that our compensation and employee benefits are competitive and allow us to attract and retain skilled labor. Certain of the benefits we offer include access to healthcare plans, financial and physical wellness programs, paid time off, parental leave and retirement benefits, including a 401(k) plan with Company matching contributions.
Competition
The home furnishings industry is a highly fragmented and competitive business. There has been increased competition from both internet only retailers and those with a brick-and-mortar presence. We compete with numerous individual retail home furnishing stores as well as national and regional chains. We believe the home furnishings industry competes primarily on the basis of product styling and quality, personal service, prompt delivery, product availability and price. We further believe that we are well-positioned to compete on the basis of each of these factors and that, more specifically under our vertical integration structure, our complimentary interior design service, direct manufacturing, a logistics network including white glove delivery service and relevant product offerings, create a competitive advantage. We also believe that we differentiate ourselves further with the caliber of our interior design professionals, who combine personal service with technology.
Sustainability
Ethan Allen’s view of sustainability and protecting the environment has been a cornerstone of our mission statement. We are committed to sustainable business practices that incorporate social, environmental, health and safety programs into our global manufacturing, distribution, home delivery and retail design centers.
Our environmental initiatives include but are not limited to:
| |
●
|
Use of responsibly harvested Appalachian woods, including the establishment of a wood sourcing policy and the sourcing of reclaimed/recycled wood; we are proud that Ethan Allen reports more than 25% of its wood furniture sold is from materials sourced from reclaimed/recycled wood
|
| |
●
|
Use of finishes that are low in both volatile organic compounds and hazardous air pollutants
|
| |
●
|
Eliminate the use of heavy metals and hydrochlorofluorocarbons in all packaging; our mattresses and custom upholstery use foam made without harmful chemicals and substances
|
| |
●
|
Convert, where and when reasonably feasible, to becoming per- and polyfluoroalkyl substances (“PFAS”) free throughout all our products including area rugs, broadloom, draperies and fabrics
|
| |
●
|
Invest in machinery and technology to cut down the landfill waste we generate by packaging our furniture with custom-sized plastic wrap and cartons to reduce excess packaging waste
|
| |
●
|
Continually review and investigate ways to reduce our carbon footprint and greenhouse gas emissions
|
The Company requires its sourcing facilities that manufacture Ethan Allen branded products to implement a labor compliance program and meet or exceed the standards established for preventing child labor, involuntary labor, coercion and harassment, discrimination, and restrictions to freedom of association. These facilities are also required to provide a safe and healthy environment in all workspaces, compliance with all local wage and hour laws and regulations, compliance with all applicable environmental laws and regulations, and are required to authorize Ethan Allen or its designated agents (including third-party auditing companies) to engage in monitoring activities to confirm compliance.
ETHAN ALLEN INTERIORS INC. AND SUBSIDIARIES
Intellectual Property
We currently hold, or have registration applications pending for, trademarks, service marks and copyrights for the Ethan Allen name, logos and designs in a broad range of classes for both products and services in the United States and in many foreign countries. We also have registered, or have applications pending, for certain of our slogans utilized in connection with promoting brand awareness, retail sales and other services and certain collection names. In addition, we have registered and maintain the internet domain name of ethanallen.com. We view such trademarks, logos, service marks and domain names as valuable assets and have an ongoing program to diligently monitor and defend, through appropriate action, against their unauthorized use. The Company regularly reviews the necessity for renewal as registrations expire.
Corporate Contact Information
Ethan Allen Interiors Inc. is a Delaware corporation with its principal executive office located in Danbury, Connecticut.
| |
●
|
Founded in 1932 and Incorporated in Delaware in 1989
|
| |
●
|
Mailing address of the Company’s headquarters: 25 Lake Avenue Ext., Danbury, Connecticut 06811-5286
|
| |
●
|
Telephone number: +1 (203) 743-8000
|
| |
●
|
Website address: ethanallen.com
|
Information about our Executive Officers
Listed below are the names, ages and positions of our current executive officers and, if they had not held those positions for the past five years, their former positions during that period with Ethan Allen or other companies. This information is presented as of August 23, 2024, the date of this Annual Report on Form 10-K.
M. Farooq Kathwari*, age 80
| |
●
|
Chairman of the Board, President and Chief Executive Officer since 1988
|
Amy Franks, age 50
| |
●
|
Executive Vice President, Retail Division since August 2024
|
| |
●
|
Executive Vice President, Retail Network and Business Development from December 2021 to August 2024
|
| |
●
|
Senior Vice President, Retail from March 2021 to December 2021
|
| |
●
|
Previously held senior retail leadership position at Bassett Furniture Industries, Inc. from 2019 to 2021
|
| |
●
|
Prior to joining Bassett in 2019, she was Vice President, Retail at Ethan Allen from 2013 to 2019
|
Matthew J. McNulty, age 45
| |
●
|
Senior Vice President, Chief Financial Officer and Treasurer since December 2021
|
| |
●
|
Vice President, Finance and Treasurer from February 2020 to December 2021
|
| |
●
|
Joined the Company in February 2019 as Vice President, Corporate Controller
|
Rebecca L. Thompson, age 52
| |
●
|
Senior Vice President, Merchandising and Product Development since October 2023
|
| |
●
|
Vice President, Merchandising and Product Development from September 2022 to October 2023
|
| |
●
|
Senior Director of Accents from March 2021 to September 2022
|
| |
●
|
Joined the Company in October 2019 as Director of Wall Decor
|
* Mr. Kathwari is the sole executive officer of the Company who operates under a written employment agreement.
Available Information
Information contained in our Investor Relations section of our website at https://ir.ethanallen.com is not part of this Annual Report on Form 10-K. Information that we furnish or file with the SEC, including our Annual Reports on Form 10-K, Quarterly Reports on Form 10-Q, Current Reports on Form 8-K or exhibits included in these reports are available for download, free of charge, on our Investor Relations website soon after such reports are filed with or furnished to the SEC. Our SEC filings, including exhibits filed therewith, are also available free of charge through the SEC’s website at www.sec.gov.
Additionally, we broadcast live our quarterly earnings calls via the News & Events section of our Investor Relations website. We also provide notifications of news or announcements regarding our financial performance, including SEC filings, press and earnings releases, and investor events as part of our Investor Relations website. The contents of this website section are not intended to be incorporated by reference into this Annual Report on Form 10-K or in any other report or document the Company files with the SEC and any reference to this section of our website is intended to be inactive textual references only.
ETHAN ALLEN INTERIORS INC. AND SUBSIDIARIES
Additional Information
Additional information with respect to the Company’s business is included within the following pages and is incorporated herein by reference:
| |
Page
|
|
Management’s Discussion and Analysis of Financial Condition and Results of Operations
|
22
|
|
Quantitative and Qualitative Disclosures about Market Risk
|
35
|
|
Note 1 to Consolidated Financial Statements entitled Organization and Nature of Business
|
44
|
|
Note 20 to Consolidated Financial Statements entitled Segment Information
|
65
|
ITEM 1A. RISK FACTORS
The following risks could materially and adversely affect our business, financial condition, cash flows, results of operations and the trading price of our common stock could decline. These risk factors do not identify all risks that we face; our operations could also be affected by factors that are not presently known to us or that we currently consider to be immaterial to our operations. Investors should also refer to the other information set forth in this Annual Report on Form 10-K, including Management’s Discussion and Analysis of Financial Condition and Results of Operations and our financial statements including the related notes. Investors should carefully consider all risks, including those disclosed, before making an investment decision.
Home Furnishings Industry Risks
Declines in certain economic conditions, which impact consumer confidence and consumer spending, could negatively impact our sales, results of operations and liquidity.
Historically, the home furnishings industry has been subject to cyclical variations in the general economy and to uncertainty regarding future economic prospects. Should current economic conditions weaken, the current rate of housing starts further decline, or elevated inflation persist, consumer confidence and demand for home furnishings could deteriorate which has in the past and could in the future adversely affect our business through its impact on the performance of our Company-operated design centers, as well as on our independent licensees and the ability of a number of them to meet their obligations to us. Our principal products are consumer goods that may be considered discretionary purchases. Economic downturns and prolonged negative conditions in the economy have in the past and could in the future affect consumer spending habits by decreasing the overall demand for discretionary items, including home furnishings. Factors influencing consumer spending include general economic and financial market conditions, consumer disposable income, fuel prices, recession and fears of recession, United States government default or shutdown or the risk of such default or shutdown, unemployment, war and fears of war, availability of consumer credit, consumer debt levels, conditions in the housing market, increased interest rates, sales tax rates and rate increases, inflation, civil disturbances and terrorist activities, consumer confidence in future economic and political conditions, natural disasters and inclement weather and consumer perceptions of personal well‑being and security, including health epidemics or pandemics.
Other financial or operational difficulties due to competition may result in a decrease in our sales, earnings and liquidity.
The residential home furnishings industry is highly competitive and fragmented. We currently compete with many other manufacturers and retailers, including online retailers, some of which offer widely advertised products, and others, several of which are large retail dealers offering their own store-branded products. Competition in the residential home furnishings industry is based on quality, style of products, perceived value, price, service to the customer, promotional activities, and advertising. The highly competitive nature of the industry means we are constantly subject to the risk of losing market share, which would likely decrease our future sales, earnings and liquidity.
A significant shift in consumer preference toward purchasing products online could have a materially adverse impact on our sales and operating margin.
A majority of our business relies on physical design centers that merchandise and sell our products and a significant shift in consumer preference towards exclusively purchasing products online could have a materially adverse impact on our sales and operating margin. We are attempting to meet consumers where they prefer to shop by expanding our online capabilities and improving the user experience at ethanallen.com including our virtual design center.
Evolving technologies are altering the manner in which the Company and its competitors communicate and transact with customers. Adoption of new technology and related changes in customer behavior present a specific risk in the event we are unable to successfully execute our technology plans or adjust them over time if needed.
ETHAN ALLEN INTERIORS INC. AND SUBSIDIARIES
Risks Related to our Brand and Product Offerings
Inability to maintain and enhance our brand may materially adversely impact our business.
Maintaining and enhancing our brand is critical to our ability to expand our base of customers and may require us to make substantial investments. Our advertising campaigns utilize direct mail, digital, newspapers, magazines, television, and radio to maintain and enhance our existing brand equity. We cannot provide assurance that our advertising and other efforts to promote and maintain awareness of our brand will not require us to incur substantial costs. If these efforts are unsuccessful or we incur substantial costs in connection with these efforts, our business, operating results and financial condition could be materially adversely affected.
Failure to successfully anticipate or respond to changes in consumer tastes and trends in a timely manner could materially adversely impact our business, operating results and financial condition.
Sales of our products are dependent upon consumer acceptance of our product designs, styles, quality and price. We continuously monitor changes in home design trends through attendance at trade shows, industry events, internal and external marketing research, and regular communication with our retailers and design professionals who provide valuable input on consumer tendencies. However, as with many retailers, our business is susceptible to changes in consumer tastes and trends. Such tastes and trends can change rapidly and any delay or failure to anticipate or respond to changing consumer tastes and trends in a timely manner could materially adversely impact our business and operating results.
We may not be able to maintain our current design center locations at current costs. We may also fail to successfully select and secure design center locations.
Our design centers are typically located in busy urban settings as freestanding destinations or as part of suburban shopping malls, depending upon the real estate opportunities in a particular market. Our business competes with other retailers and as a result, our success may be affected by our ability to renew current design center leases and to select and secure appropriate retail locations for existing and future design centers.
We have potential exposure to market risk related to conditions in the commercial real estate market. At June 30, 2024, there were 142 Company-operated retail design centers averaging approximately 13,800 square feet in size per location. Of these 142 properties, we own 49 and lease 93. Our retail segment real estate holdings could suffer significant impairment in value if we are forced to close design centers and sell or lease the related properties during periods of weakness in certain markets. We are also exposed to risk related to conditions in the commercial real estate rental market with respect to the right-of-use assets we carry on our balance sheet for leased design centers and retail service centers. At June 30, 2024, the unamortized balance of such right-of-use assets totaled $114.2 million. Should we have to close or abandon one of these leased locations, we could incur additional impairment charges if rental market conditions do not support a fair value for the right of use asset in excess of carrying value.
Supply Chain Risks
Disruptions of our supply chain and supply chain management could have a material adverse effect on our operating and financial results.
Disruption of the Company’s supply chain capabilities due to trade restrictions, political instability, severe weather, natural disasters, public health crises, terrorism, product recalls, global unrest, war, labor supply or stoppages, the financial and/or operational instability of key suppliers and carriers, or other reasons could impair the Company’s ability to distribute its products. To the extent we are unable to mitigate the likelihood or potential impact of such events, there could be a material adverse effect on our operating and financial results.
For example, the COVID-19 pandemic, resulted in supply chain challenges for the entire home furnishings industry, including the Company. While the pandemic-era disruptions have subsided, if in the future there are transportation delays, increases on shipping containers, more extensive travel restrictions, closures or disruptions of businesses and facilities or social, economic, political or labor instability in the affected areas, as a result of pandemics or otherwise, it could impact either our or our suppliers’ operations and have a material adverse effect on our consolidated results of operations.
ETHAN ALLEN INTERIORS INC. AND SUBSIDIARIES
Fluctuations in the price, availability and quality of raw materials and imported finished goods could result in increased costs and cause production delays which could result in a decline in sales, either of which could materially adversely impact our earnings.
In manufacturing furniture we use various types of logs, lumber, fabrics, plywood, frames, leathers, finishing materials, foam, steel and other raw materials. Fluctuations in the price, availability and quality of raw materials could result in increased costs or a delay in manufacturing our products, which in turn could result in a delay in delivering products to our customers. Although we have instituted measures to ensure our supply chain remains open to us, higher raw material prices and costs of sourced products could have an adverse effect on our future margins. While we strive to maintain a number of sources for our raw materials, decreased availability on raw materials may create additional pricing and availability pressures.
Imported finished goods represent approximately 25% of our consolidated sales. The prices paid for these imported products include inbound freight. Elevated ocean freight container rates may be impacted by container supply and elevated demand. To the extent that we experience incremental costs in any of these areas, we may increase our selling prices to offset the impact. However, increases in selling prices may not fully mitigate the impact of the cost increases which would adversely impact operating income. Furthermore, supply chain disruptions could materially adversely impact our manufacturing production and fulfillment of backlog.
Manufacturing Risks
Competition from overseas manufacturers and domestic retailers may materially adversely affect our business, operating results or financial condition.
Our wholesale business segment is involved in the development of our brand, which encompasses the design, manufacture, sourcing, sales and distribution of our home furnishings products, and competes with other United States and foreign manufacturers. Our retail network sells home furnishings to consumers through a network of independently operated and Company-operated design centers, and competes against a diverse group of retailers ranging from specialty stores to traditional home furnishings and department stores, any of which may operate locally, regionally, nationally or globally, as well as over the internet. We also compete with these and other retailers for retail locations as well as for qualified design professionals and management personnel. Such competition could adversely affect our future financial performance.
Industry globalization has led to increased competitive pressures brought about by the increasing volume of imported finished goods and components, particularly for case good products, and the development of manufacturing capabilities in other countries, specifically within Asia. In addition, because many foreign manufacturers are able to maintain lower production costs, including the cost of labor and overhead, imported product may be capable of being sold at a lower price to consumers, which, in turn, could lead to some measure of further industry‐wide price deflation.
We cannot provide assurance that we will be able to establish or maintain relationships with sufficient or appropriate manufacturers, whether foreign or domestic, to supply us with selected case goods, upholstery and home accent items to enable us to maintain our competitive advantage. In addition, the emergence of foreign manufacturers has served to broaden the competitive landscape. Some of these competitors produce products not manufactured by us and may have greater financial resources available to them or lower costs of operating. This competition could materially adversely affect our future financial performance.
Our number of manufacturing sites may increase our exposure to business disruptions and could result in higher costs.
We have a limited number of manufacturing sites within our case goods and upholstery operations. Our upholstery operations consist of three upholstery plants in North Carolina and two plants in Mexico. Our case goods operations is supported by two manufacturing plants in Vermont and Honduras and one sawmill, one rough mill and one kiln dry lumberyard. If any of our manufacturing sites experience significant business interruption, our ability to manufacture or deliver our products in a timely manner would likely be impacted. For example, in July 2023, our wood furniture manufacturing operations located in Orleans, Vermont sustained damage from flooding, which resulted in losses of $2.2 million, net of insurance recoveries and grant proceeds, and a temporary work stoppage for many Vermont associates and a disruption and delay of shipments. Fewer locations have also resulted in longer distances for delivery and could result in higher costs to transport products if fuel costs significantly increase.
Environmental, Health and Safety Risks
Our current and former manufacturing and retail operations and products are subject to environmental, health and safety requirements.
We use and generate hazardous substances in our manufacturing operations. In addition, the manufacturing properties on which we currently operate and those on which we have ceased operations are and have been used for industrial purposes. Our manufacturing operations and, to a lesser extent, our retail operations involve risk of personal injury or death. We are subject to environmental, health and safety laws and regulations relating to our products, current and former properties and our current operations. These laws and regulations provide for substantial fines and criminal sanctions for violations and sometimes require the installation of costly pollution control or safety equipment, or costly changes in operations to limit pollution or decrease the likelihood of injuries. In addition, we may become subject to potentially material liabilities for the investigation and cleanup of contaminated properties and to claims alleging personal injury or property damage resulting from exposure to or releases of hazardous substances or personal injury because of an unsafe workplace. In addition, noncompliance with, or stricter enforcement of, existing laws and regulations, adoption of more stringent new laws and regulations, discovery of previously unknown contamination or imposition of new or increased requirements could require us to incur costs or become the basis of new or increased liabilities that could be material.
ETHAN ALLEN INTERIORS INC. AND SUBSIDIARIES
Product recalls or product safety concerns could materially adversely affect our sales and operating results.
If the Company's merchandise offerings do not meet applicable safety standards or consumers' expectations regarding safety, the Company could experience decreased sales, increased costs and/or be exposed to legal and reputational risk. Although we require that all of our vendors comply with applicable product safety laws and regulations, we are dependent on them to ensure that the products we buy comply with all safety standards. Events that give rise to actual, potential or perceived product safety concerns could expose the Company to government enforcement action and/or private litigation. Reputational damage caused by real or perceived product safety concerns or product recalls could negatively affect the Company's business and results of operations.
We may incur significant increased costs and become subject to additional potential liabilities under environmental and other laws and regulations aimed at combating climate change.
We believe it is likely that the increased focus by the United States and other governmental authorities on climate change and other environmental matters will lead to enhanced regulation in these areas, which could also result in increased compliance costs and subject us to additional potential liabilities. The extent of these costs and risks is difficult to predict and will depend in large part on the extent of new regulations and the ways in which those regulations are enforced. We operate manufacturing facilities in multiple regions across the globe, and the impact of additional regulations in this area is likely to vary by region. It is possible the costs we incur to comply with any such new regulations and implementation of our own sustainability goals could be material.
Our practices and future disclosures related to Environmental, Social and Governance (“ESG”) matters may expose us to numerous risks, including risks to our reputation and stock price.
There has been an increased focus on ESG practices within the general markets. Our efforts to accomplish and accurately report on ESG matters present numerous operational, reputational, financial, legal, and other risks, any of which could have a material negative impact, including on our reputation, stock price and results of operation. We could also incur additional costs and require additional resources to implement various ESG initiatives and to monitor and track performance with respect to such initiatives.
The standards for tracking and reporting on ESG matters are relatively new and continue to evolve. In March 2024, the SEC finalized new rules that would require public companies to include extensive climate-related disclosures in their SEC filings, which the SEC voluntarily stayed in April 2024 pending completion of a judicial review that is currently pending in the U.S. Court of Appeals for the Eighth Circuit. While we continue to assess the materiality of climate-related topics to our operations, we could incur substantial additional compliance costs to the extent these or similar rules are implemented and we determine such topics are material. Collecting, measuring, and reporting ESG information and metrics can be difficult and time consuming. Our current selected disclosure framework or standards may need to be changed from time to time, including as a result of new rules, which may result in a lack of consistent or meaningful comparative data from period to period. In addition, our interpretation of reporting frameworks, standards or rules may differ from those of others and such frameworks, standards or rules may change over time, any of which could result in significant revisions to our goals or reported progress in achieving such goals.
Our ability to achieve any ESG-related objective is subject to numerous risks, many of which are outside of our control, including the availability and cost of low-or non-carbon-based energy sources and technologies, evolving regulatory requirements affecting ESG standards or disclosures, the availability of vendors and suppliers that can meet our sustainability, diversity and other standards, and the availability of raw materials that meet and further sustainability objectives. If our ESG practices do not meet evolving standards, then our reputation, our ability to attract or retain employees and our competitiveness, could be negatively impacted. Furthermore, if our competitors’ ESG performance is perceived to be better than ours, potential or current customers and investors may elect to do business with our competitors instead, and our ability to attract or retain employees could be negatively impacted. Our failure, or perceived failure to pursue or fulfill ESG objectives or to satisfy various reporting standards could also expose us to government enforcement actions and litigation.
ETHAN ALLEN INTERIORS INC. AND SUBSIDIARIES
Technology and Data Security Risks
We rely extensively on information technology systems to process transactions, summarize results, and manage our business and that of certain independent retailers. Disruptions in both our primary and back-up systems could adversely affect our business and operating results.
Our primary and back-up information technology systems are subject to damage or interruption from power outages, computer and telecommunications failures, viruses, phishing attempts, cyberattacks, malware and ransomware attacks, security breaches, severe weather, natural disasters, and errors by employees or third-party contractors. Though losses arising from some of these issues may be covered by insurance, interruptions of our critical business information technology systems or failure of our back-up systems could result in longer production times or negatively impact customers resulting in damage to our reputation and a reduction in sales. If our critical information technology systems or back-up systems were damaged or ceased to function properly, we might have to make a significant investment to repair or replace them.
Further, information systems of our suppliers or service providers may be vulnerable to attacks by hackers and other security breaches, including computer viruses and malware, through the internet, email attachments and persons with access to these information systems. If our suppliers or service providers were to experience a system disruption, attack or security breach that impacts a critical function, it could result in disruptions in our supply chain, the loss of sales and customers, potential liability for damages to our customers, reputational damage and incremental costs, which could adversely affect our business, results of operations and profitability.
Successful cyberattacks and the failure to maintain adequate cybersecurity systems and procedures could materially harm our operations.
Cyberattacks designed to gain access to and extract sensitive information or otherwise affect or compromise the confidentially, integrity, and availability of information, including phishing attempts, denial of service attacks, and malware or ransomware incidents, have occurred over the last several years at a number of major global companies and have resulted in, among other things, the unauthorized release of confidential information, system failures including material business disruptions, and negative brand and reputational impacts. Despite widespread recognition of the cyberattack threat and improved data protection methods, cyberattacks on organizations continue to be sophisticated, persistent, and ever-changing, making it difficult to prevent and detect these attacks. Additionally, we rely on third-party service providers to execute certain business processes and maintain certain information technology systems and infrastructure, and we supply such third-party providers with the personal information required for those services.
Cyberattacks are becoming more sophisticated, and in some cases have caused significant harm. Computer hackers and others routinely attempt to breach the security of technology products, services and systems, and to fraudulently induce employees, customers, or others to disclose information or unwittingly provide access to systems or data. We operate many aspects of our business through server and web‐based technologies, and store various types of data on such servers or with third parties who in turn store it on servers and in the cloud. Any disruption to the internet or to the Company's or its service providers' global technology infrastructure, including malware, insecure coding, “Acts of God,” attempts to penetrate networks, data theft or loss and human error, could have adverse effects on the Company's operations.
A cyberattack of our systems or networks that impairs our information technology systems could disrupt our business operations and result in loss of service to customers. We believe we have a comprehensive cybersecurity program designed to protect and preserve the integrity of our information technology systems. We expect to continue to experience attempted cyberattacks of our IT systems or networks, through malware, ransomware, computer viruses, phishing attempts, social engineering and other means of unauthorized access; however, none of the attempted cyberattacks has had a material impact on our operations or financial condition to date. If a computer security breach or cyberattack affects our systems or results in the unauthorized release of proprietary or personally identifiable information, our reputation could be materially damaged, our customer confidence could be diminished, and our operations, including technical support for our devices, could be impaired. We would also be exposed to litigation and potential liability, which could have a material adverse effect on our business, results of operations, cash flows and financial condition. Moreover, the costs to eliminate or alleviate network security problems, bugs, viruses, worms, malicious software programs and security vulnerabilities could be significant, and our efforts to address these problems may not be successful, resulting potentially in the theft, loss, destruction or corruption of information we store electronically, as well as unexpected interruptions, delays or cessation of service, any of which could cause harm to our business operations.
ETHAN ALLEN INTERIORS INC. AND SUBSIDIARIES
Where necessary and applicable, we have enabled certain employees to arrange for a hybrid work approach. Although we continue to implement strong physical and cybersecurity measures to ensure that our business operations remain functional and to ensure uninterrupted service to our customers, our systems and our operations remain vulnerable to cyberattacks and other disruptions due to the fact that certain employees work remotely and we cannot guarantee that our mitigation efforts will be effective.
Loss, corruption and misappropriation of data and information relating to customers could materially adversely affect our operations.
We have access to customer information in the ordinary course of business. If a significant data breach occurred, the loss, disclosure or misappropriation of our business information may adversely affect our reputation, customer confidence may be diminished, or we may be subject to legal claims, or legal proceedings, including regulatory investigations and actions, which may lead to regulatory enforcement actions against us, and may materially adversely affect our business, operating results and financial condition.
Legal and Regulatory Risks
Global and local economic uncertainty may materially adversely affect our manufacturing operations or sources of merchandise and international operations.
Economic uncertainty, as well as other variations in global economic conditions such as fuel costs, wage and benefit inflation, and currency fluctuations, may cause inconsistent and unpredictable consumer spending habits, while increasing our own input costs. These risks resulting from global and local economic uncertainty could also severely disrupt our manufacturing operations, which could have a material adverse effect on our financial performance. We import approximately 25% of our merchandise from outside of the United States as well as operate manufacturing plants in Mexico and Honduras and retail design centers in Canada. As a result, our ability to obtain adequate supplies or to control our costs may be adversely affected by events affecting international commerce and businesses located outside the United States, including natural disasters, public health crises, changes in international trade including tariffs, central bank actions, changes in the relationship of the U.S. dollar versus other currencies, labor availability and cost, and other domestic governmental policies and the countries from which we import our merchandise or in which we operate facilities.
Changes in the United States trade and tax policy could materially adversely affect our business and results of operations.
Changes in the political environment in the United States may require us to modify our current business practices. We are subject to risks relating to increased tariffs on United States imports, and other changes affecting imports, as we manufacture components and finished goods in Mexico and Honduras and purchase components and finished goods manufactured in foreign countries. We may not be able to fully or substantially mitigate the impact of tariffs, pass price increases on to our customers, or secure adequate alternative sources of products or materials. The tariffs, along with any additional tariffs or retaliatory trade restrictions implemented by other countries, could negatively impact customer sales, including potential delays in product received from our vendors, our cost of goods sold and results of operations.
Our business may be materially adversely affected by changes to tax policies.
Changes in United States or international income tax laws and regulations may have a material adverse effect on our business in the future or require us to modify our current business practices. In the ordinary course of business, we are subject to tax examinations by various governmental tax authorities. The global and diverse nature of our business means that there could be additional examinations by governmental tax authorities and the resolution of ongoing and other probable audits, which could impose a future risk to the results of our business.
Human Capital Risk
Our business is dependent on certain key personnel; if we lose key personnel or are unable to hire additional qualified personnel, our business may be harmed.
The success of our business depends upon our ability to retain continued service of certain key personnel, including our Chairman of the Board, President and Chief Executive Officer, M. Farooq Kathwari, whose employment agreement was amended on July 30, 2024, extending his term for an additional two years, ending June 30, 2027. We face risks related to loss of any key personnel and we also face risks related to any changes that may occur in key senior leadership executive positions. Any disruption in the services of our key personnel could make it more difficult to successfully operate our business and achieve our business goals and could adversely affect our results of operation and financial condition. These changes could also increase the volatility of our stock price.
ETHAN ALLEN INTERIORS INC. AND SUBSIDIARIES
The market for qualified employees and personnel in the retail and manufacturing industries is highly competitive. Our success depends upon our ability to attract, retain and motivate qualified artisans, professional and clerical employees and upon the continued contributions of these individuals. We cannot provide assurance that we will be successful in attracting and retaining qualified personnel. A shortage of qualified personnel may require us to enhance our wage and benefits package in order to compete effectively in the hiring and retention of qualified employees. This could have a material adverse effect on our business, operating results and financial condition.
Labor challenges could have a material adverse effect on our business and results of operations.
In our current operating environment, due in part to macroeconomic factors, we continue to experience various labor challenges, including, for example significant competition for skilled manufacturing and production employees; pressure to increase wages as a result of inflationary pressures, and at times, a shortage of qualified full-time labor. Outside suppliers that we rely on have also experienced similar labor challenges. The future success of our operations depends on our ability, and the ability of third parties on which we rely, to identify, recruit, develop and retain qualified and talented individuals in order to supply and deliver our products. A prolonged shortage or inability to retain qualified labor could decrease our ability to effectively produce and meet customer demand and efficiently operate our facilities, which could negatively impact our business and have a material adverse effect on our results of operations. Higher wages to attract new and retain existing employees, as well as higher costs to purchase services from third parties, could negatively impact our results of operations.
Financial Risks
Our total assets include substantial amounts of long-lived assets. Changes to estimates or projections used to assess the fair value of these assets, financial results that are lower than current estimates at certain design center locations or determinations to close underperforming locations may cause us to incur future impairment charges, negatively affecting our financial results.
We make certain accounting estimates and projections with regards to individual design center operations as well as overall Company performance in connection with our impairment analysis for long-lived assets in accordance with applicable accounting guidance. An impairment charge may be required if the impairment analysis indicates that the carrying value of an asset exceeds the sum of the expected undiscounted cash flows of the asset. The projection of future cash flows used in this analysis requires the use of judgment and a number of estimates and projections of future operating results, including sales growth rates. If actual results differ from Company estimates, additional charges for asset impairments may be required in the future. If impairment charges are significant, our financial results could be negatively affected.
Access to consumer credit could be interrupted as a result of conditions outside of our control, which could reduce sales and profitability.
Our ability to continue to access consumer credit for our customers could be negatively affected by conditions outside our control. If capital market conditions have a material negative change, there is a risk that our business partner that issues our private label credit card program may not be able to fulfill its obligations under that agreement. In addition, the tightening of credit markets as well as increased borrowing rates has in the past and may in the future restrict the ability and willingness of customers to make purchases.
We are subject to self-insurance risks.
We are self-insured for our health benefits and maintain per employee stop loss coverage; however, we retain the insurable risk at an aggregate level. Therefore, unforeseen or significant losses in excess of our insured limits could have a material adverse effect on the Company’s financial condition and operating results.
General Risk Factors
Failure to protect our intellectual property could materially adversely affect us.
We believe that our copyrights, trademarks, service marks, trade secrets, and all of our other intellectual property are important to our success. We rely on patent, trademark, copyright and trade secret laws, and confidentiality and restricted use agreements, to protect our intellectual property and may seek licenses to intellectual property of others. Some of our intellectual property is not covered by any patent, trademark, or copyright or any applications for the same. We cannot provide assurance that agreements designed to protect our intellectual property will not be breached, that we will have adequate remedies for any such breach, or that the efforts we take to protect our proprietary rights will be sufficient or effective. Any significant impairment of our intellectual property rights or failure to obtain licenses of intellectual property from third parties could harm our business or our ability to compete. Moreover, we cannot provide assurance that the use of our technology or proprietary know‐how or information does not infringe the intellectual property rights of others. If we have to litigate to protect or defend any of our rights, such litigation could result in significant expense.
ETHAN ALLEN INTERIORS INC. AND SUBSIDIARIES
Our operations present hazards and risks which may not be fully covered by insurance, if insured.
As protection against operational hazards and risks, we maintain business insurance against many, but not all, potential losses or liabilities arising from such risks. We may incur costs in repairing any damage beyond our applicable insurance coverage. Uninsured losses and liabilities from operating risks could reduce the funds available to us for capital and investment spending and could have a material adverse impact on the results of operations.
ITEM 1B. UNRESOLVED STAFF COMMENTS
None.
ITEM 1C. CYBERSECURITY
Cybersecurity Risk Management and Strategy
We have policies, procedures and processes in place to identify, assess and monitor material risks from cybersecurity threats. These plans are part of our overall enterprise risk management strategy and are part of our operating procedures, internal controls, and information systems. Cybersecurity risks include, among other things, fraud, extortion, harm to employees or customers, violation of privacy or security laws and other litigation and legal risks, and reputational risks. We have developed and implemented a cybersecurity framework intended to assess, identify and manage risks from threats to the security of our information, systems, and network using a risk-based approach. The framework is informed in part by the National Institute of Standards and Technology (“NIST”) Cybersecurity Framework, although this does not imply that we meet all technical standards, specifications or requirements under the NIST.
Our key cybersecurity processes include the following:
| |
●
|
Risk-based controls for information systems and information on our networks: We seek to maintain an information technology infrastructure that implements physical, administrative and technical controls that are calibrated based on risk and designed to protect the confidentiality, integrity and availability of our information systems and information stored on our networks, including customer and employee information.
|
| |
●
|
Cybersecurity incident response plan and testing: We have a cybersecurity incident response plan and dedicated teams to respond to cybersecurity incidents. When a cybersecurity incident occurs or we identify a vulnerability, we have cross-functional teams that are responsible for leading the initial assessment of priority and severity, and external experts may also be engaged as appropriate. Our cybersecurity teams assist in responding to incidents depending on severity levels and seek to improve our cybersecurity incident management plan through periodic tabletops or simulations. Our Vice President of Information Technology and other members of his team oversee the implementation of this plan and are made aware of ongoing risks and incidents.
|
| |
●
|
Training: We provide security awareness training to our employees so they may better understand their information protection and cybersecurity responsibilities. We also provide additional training to certain employees based on their roles.
|
| |
●
|
Supplier risk assessments: Our processes also address cybersecurity threat risks associated with our use of third-party service providers, including those in our supply-chain or who have access to our customer and employee data on our systems. Third-party risks are included within our enterprise risk management assessment program, as well as our cybersecurity-specific risk identification program. These considerations affect the selection and access to our systems, data, or facilities. We also seek contractual commitments from key suppliers to appropriately secure and maintain their information technology systems and protect our information that is processed on their systems.
|
| |
●
|
Third-party assessments: We have engaged third-party vendors to periodically assess our cybersecurity posture, to assist in identifying and remediating risks from cybersecurity threats. We also regularly engage with consultants, auditors, and other third-parties to help identify areas for continued focus, improvement and compliance.
|
ETHAN ALLEN INTERIORS INC. AND SUBSIDIARIES
While the Company has experienced cybersecurity incidents, we are not aware of any cybersecurity incidents to date, including as a result of any previous cybersecurity incidents, that has materially affected or is reasonably likely to materially affect us, including our business strategy, results of operations, or financial condition. However, the sophistication of and risks from cybersecurity threats and incidents continue to increase and the preventative actions we have taken and continue to take to reduce these risks and protect our systems and information may not successfully protect against all cybersecurity threats and incidents in the future. For more information, see Item 1A. Risk Factors under the heading of “Technology and Data Security Risks”, of this Annual Report on Form 10-K.
Cybersecurity Governance
The Company’s Board of Directors (the “Board”), as a whole, has oversight responsibility for our strategic and operational risks. The Board regularly reviews and discusses with management the strategies, processes and controls pertaining to the management of our information technology operations, including updates on the internal and external cybersecurity threat landscape, incident response, assessment and training activities, and relevant legislative, regulatory, and technical developments. Our Vice President of Information Technology presents, at least annually, to the Board, an overview of our cybersecurity threat risk management and strategy as well as provides reports regarding the evolving cybersecurity landscape, including emerging risk. Our Vice President of Information Technology and other members of his team remain informed about cybersecurity threats through the reporting framework as described above under Cybersecurity Risk Management and Security – Cybersecurity incident response plan and testing.
The Information Technology team is responsible for the day-to-day assessment and management of cybersecurity risks. Our cybersecurity risk management and strategy are led by our Vice President of Information Technology, and our Manager of Security. Such individuals have over 50 years of work experience, collectively, in various roles managing information security, developing cybersecurity strategy, and implementing effective information and cybersecurity programs.
ITEM 2. PROPERTIES
Ethan Allen’s corporate headquarters is located at 25 Lake Avenue Ext. in Danbury, Connecticut. We believe that all our properties are well maintained, in good condition, are being used productively and are adequate to meet our requirements for the foreseeable future.
At June 30, 2024, we own and operate 10 manufacturing facilities located in the United States, Mexico and Honduras and three national distribution centers in the United States. There are 142 Company-operated retail design centers located in the United States and Canada, averaging approximately 13,800 square feet in size per location, of which 49 are owned and 93 are leased with a weighted average remaining lease term of 5.6 years. We also own three and lease 14 retail home delivery centers located throughout North America that support our various retail design centers.
The following table sets forth the size of our properties, including both owned and leased locations:
|
Properties Owned or Leased
|
|
Square Footage
(in thousands)
|
|
|
Corporate Headquarters
|
|
|
144 |
|
|
Case Goods manufacturing facilities
|
|
|
1,305 |
|
|
Upholstery manufacturing facilities
|
|
|
1,308 |
|
|
Distribution centers
|
|
|
1,175 |
|
|
Retail
|
|
|
2,800 |
|
|
Total Property
|
|
|
6,732 |
|
ETHAN ALLEN INTERIORS INC. AND SUBSIDIARIES
Design center activity and geographic distribution of our retail network for fiscal years ended June 30, 2024 and 2023, respectively, are as follows:
| |
|
Fiscal 2024
|
|
|
Fiscal 2023
|
|
| |
|
Independent
|
|
|
Company-
|
|
|
|
|
|
|
Independent
|
|
|
Company-
|
|
|
|
|
|
| |
|
retailers
|
|
|
operated
|
|
|
Total
|
|
|
retailers
|
|
|
operated
|
|
|
Total
|
|
| |
|
|
|
|
|
|
|
|
|
|
|
|
|
|
|
|
|
|
|
Retail Design Center activity:
|
|
|
|
|
|
|
|
|
|
|
|
|
|
|
|
|
|
|
|
|
|
|
|
|
|
Balance at July 1
|
|
|
48 |
|
|
|
139 |
|
|
|
187 |
|
|
|
50 |
|
|
|
141 |
|
|
|
191 |
|
|
New locations
|
|
|
- |
|
|
|
5 |
|
|
|
5 |
|
|
|
2 |
|
|
|
2 |
|
|
|
4 |
|
|
Closures
|
|
|
(3 |
) |
|
|
(2 |
) |
|
|
(5 |
) |
|
|
(4 |
) |
|
|
(4 |
) |
|
|
(8 |
) |
|
Balance at June 30
|
|
|
45 |
|
|
|
142 |
|
|
|
187 |
|
|
|
48 |
|
|
|
139 |
|
|
|
187 |
|
|
Relocations (in new and closures)
|
|
|
- |
|
|
|
2 |
|
|
|
2 |
|
|
|
1 |
|
|
|
2 |
|
|
|
3 |
|
| |
|
|
|
|
|
|
|
|
|
|
|
|
|
|
|
|
|
|
|
|
|
|
|
|
|
Retail Design Center geographic locations:
|
|
|
|
|
|
|
|
|
|
|
|
|
|
|
|
|
|
|
|
|
|
|
|
|
|
United States
|
|
|
30 |
|
|
|
138 |
|
|
|
168 |
|
|
|
33 |
|
|
|
135 |
|
|
|
168 |
|
|
Canada
|
|
|
- |
|
|
|
4 |
|
|
|
4 |
|
|
|
- |
|
|
|
4 |
|
|
|
4 |
|
|
Middle East and Asia
|
|
|
14 |
|
|
|
- |
|
|
|
14 |
|
|
|
14 |
|
|
|
- |
|
|
|
14 |
|
|
Europe
|
|
|
1 |
|
|
|
- |
|
|
|
1 |
|
|
|
1 |
|
|
|
- |
|
|
|
1 |
|
|
Total
|
|
|
45 |
|
|
|
142 |
|
|
|
187 |
|
|
|
48 |
|
|
|
139 |
|
|
|
187 |
|
For additional information regarding leases for our properties, see Note 6, Leases, of the notes to our consolidated financial statements included under Item 8 of this Annual Report on Form 10-K.
ITEM 3. LEGAL PROCEEDINGS
From time to time, we are subject to legal proceedings, claims, litigation and other proceedings arising in the ordinary course of business. Based on a review of all currently known facts and our experience with previous legal matters, we have recorded expense in respect of probable and reasonably estimable losses arising from legal matters. We currently do not believe it is probable that we will have any additional loss that would have a material adverse effect on our consolidated financial position, our results of operations or our cash flows. However, these matters are subject to inherent uncertainties and our view of these matters may change in the future.
ITEM 4. MINE SAFETY DISCLOSURES
Not applicable.
ETHAN ALLEN INTERIORS INC. AND SUBSIDIARIES
PART II
ITEM 5. MARKET FOR REGISTRANT’S COMMON EQUITY, RELATED STOCKHOLDER MATTERS AND ISSUER PURCHASES OF EQUITY SECURITIES
|
(a)
|
Market Information, Holders of Record, Dividends, Securities Authorized for Issuance and Stock Performance Graph
|
Market Information. Ethan Allen common stock is traded on the New York Stock Exchange (the “NYSE”) under ticker symbol “ETD”.
Holders of Record. As of August 16, 2024, there were 261 registered holders of record of our Ethan Allen common stock. A substantially greater number of holders of our common stock are “street name” or beneficial holders, whose shares of record are held by banks, brokers, and other financial institutions.
Dividends. In August 2023 we paid a special cash dividend of $0.50 per share. In April 2024, our Board of Directors increased the regular quarterly cash dividend by 8.3% to $0.39 per share. In addition to the special cash dividend of $0.50 per share, we paid four regular quarterly cash dividends during fiscal 2024. Total cash dividends paid to shareholders in fiscal 2024 were $1.97 per share and totaled $50.3 million. Although we expect to continue to declare and pay comparable quarterly cash dividends for the foreseeable future, the payment of future cash dividends is within the discretion of our Board of Directors and will depend on our earnings, operations, financial condition, capital requirements and general business outlook, among other factors. Our credit agreement also includes covenants that include limitations on our ability to pay dividends.
Securities Authorized for Issuance under Equity Compensation Plans. Refer to Part III of this Annual Report on Form 10-K.
Stock Performance Graph. The annual changes for the five-year period shown in the graph below are based on the assumption that $100 had been invested in our common stock, the S&P 500® Index and the Dow Jones U.S. Furnishings Index on June 30, 2019. The total cumulative dollar returns shown on the graph represent the value that such investments would have had on June 30, 2024. Stockholder returns over the indicated period are based on historical data and should not be considered indicative of future stockholder returns.
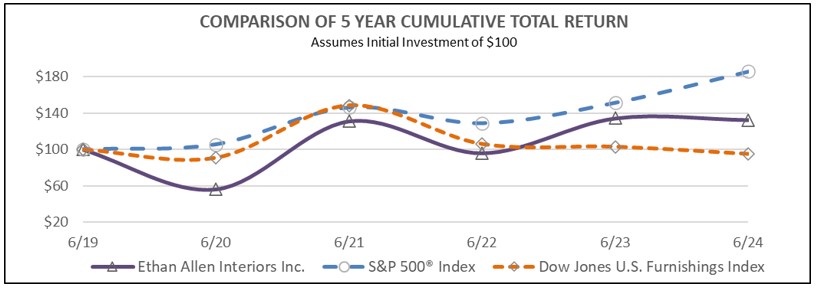
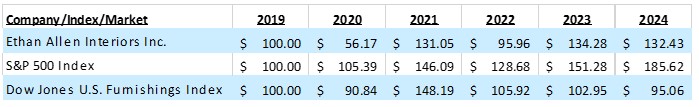
*This performance graph shall not be deemed “soliciting material” or to be “filed” with the SEC for purposes of Section 18 of the Exchange Act, or otherwise subject to the liabilities under that Section, and shall not be deemed to be incorporated by reference into any filing of Ethan Allen under the Securities Act of 1933, as amended, or the Exchange Act whether made before or after the date hereof and irrespective of any general incorporation language in any such filing.
|
(b)
|
Recent Sales of Unregistered Securities
|
There were no sales of unregistered equity securities during fiscal 2024.
ETHAN ALLEN INTERIORS INC. AND SUBSIDIARIES
|
(c)
|
Purchases of Equity Securities by the Issuer
|
We did not repurchase any shares of our outstanding common stock during the fourth quarter of fiscal 2024 under our existing Share Repurchase Program. At June 30, 2024, we had a remaining Board authorization to repurchase 2,007,364 shares of our common stock pursuant to the Share Repurchase Program. In the future we may from time to time make repurchases in the open market and through privately negotiated transactions, subject to market conditions, including pursuant to our previously announced Share Repurchase Program. There is no expiration date on the repurchase authorization.
ITEM 6. RESERVED
ITEM 7. MANAGEMENT’S DISCUSSION AND ANALYSIS OF FINANCIAL CONDITION AND RESULTS OF OPERATIONS
This Management’s Discussion and Analysis of Financial Condition and Results of Operations (“MD&A”) is designed to provide a reader of our financial statements with a narrative from the perspective of our management on our financial condition, results of operations, liquidity and certain other factors that may affect our future results.
The MD&A is based upon, and should be read in conjunction with, our Consolidated Financial Statements and related Notes included under Item 8 of this Annual Report on Form 10-K.
Executive Overview
Who We Are. Founded in 1932, Ethan Allen is a leading interior design company, manufacturer and retailer in the home furnishings marketplace. We are a global luxury home fashion brand that is vertically integrated from product design through home delivery, which offers clients stylish product offerings, artisanal quality and personalized service. We are known for the quality and craftsmanship of our products as well as for the exceptional personal service from design to delivery. We provide complimentary interior design service to our clients and sell a full range of home furnishings through a retail network of design centers located throughout the United States and internationally as well as online at ethanallen.com.
Ethan Allen design centers represent a mix of locations operated by independent licensees and Company-operated locations. At June 30, 2024, the Company operates 142 retail design centers, 138 located in the United States and four in Canada. Our independently operated design centers are located in the United States, Asia, the Middle East and Europe. We also own and operate ten manufacturing facilities, including four manufacturing plants, one sawmill, one rough mill and a kiln dry lumberyard in the United States, two upholstery manufacturing plants in Mexico and one case goods manufacturing plant in Honduras. Approximately 75% of our furniture is manufactured in our North American plants. We also contract with various suppliers located in Europe, Asia and other various countries to import products that support our business.
We recently launched the important initiative as a leading Interior Design Destination, which involved major enhancements to elevate a consistent level of presentation across our retail design center network. New state-of-the-art design centers in The Villages, FL, Avon, OH, New York, NY, Albuquerque, NM and Louisville, KY were also opened during fiscal 2024 and showcase our unique vision of American style while combining complimentary interior design services with technology. We continued to strengthen our talent, introduce new products, have strong marketing campaigns, invest in our North American manufacturing, which make about 75% of our furniture, and maintain our logistics network providing white glove delivery service to our clients at one cost throughout North America. These areas of focus along with our interior design professionals combining personal service with technology contributed to Ethan Allen being named to Newsweek’s list of America’s Best Retailers 2024, for the second year in a row.
Business Model. Ethan Allen has a distinct vision of American style, rooted in the kind of substance that we believe differentiates us from our competitors. Our business model is to maintain continued focus on (i) providing relevant product offerings, (ii) capitalizing on the professional and personal service offered to our customers by our interior design professionals, (iii) leveraging the benefits of our vertical integration including a manufacturing presence in North America, (iv) investing in new technologies across key aspects of our vertically integrated business, (v) maintaining a strong logistics network, (vi) communicating our messages with strong marketing campaigns, and (vii) utilizing our website, ethanallen.com, as a key marketing tool to drive traffic to our retail design centers.
We aim to position Ethan Allen as a premier interior design destination and a preferred brand offering products of superior style, quality, and value to customers with a comprehensive, one-stop shopping solution for their home furnishing and interior design needs. We seek to constantly reinvent our projection and product offerings through a broad selection of products, designed to complement one another, reflecting current fashion trends in home furnishing. Our vertical integration is a competitive advantage for us. Our North American manufacturing and logistics operations are an integral part of an overall strategy to maximize production efficiencies and maintain this competitive advantage.
ETHAN ALLEN INTERIORS INC. AND SUBSIDIARIES
Talent. At June 30, 2024, our employee count totaled 3,404, with 2,376 employees in our wholesale segment and 1,028 in our retail segment. We are pleased with the continued strengthening of our teams and the performance of our employees during fiscal 2024 while at the same time being able to reduce headcount through operational efficiencies. Our employee count decreased 9.2% during fiscal 2024, with 46 fewer employees in retail and 298 fewer employees in wholesale.
Fiscal 2024 Financial Year in Review (1). Our vertically integrated business delivered positive operating results during a period marked by industry-wide softer demand and challenging headwinds. Our financial results were highlighted by double-digit operating margins, disciplined expense management, strong operating cash flow and a robust balance sheet. We ended the fiscal 2024 year with a strong balance sheet, including cash, cash equivalents and investments of $195.8 million, no outstanding debt, and $80.2 million of cash generated from operating activities. Our Board increased our regular quarterly cash dividend by 8.3% to $0.39 per share and declared a special cash dividend of $0.50 per share, bringing the total amount of dividends paid to $50.3 million during the fiscal year. Consolidated net sales of $646.2 million were down 18.3% compared to the prior year due to lower delivered unit volumes, reduced manufacturing from lower backlogs, softening demand and a strong prior year comparable. Our consolidated gross margin of 60.8% was comparable to the prior year as benefits from lower raw material input costs, reduced headcount, and disciplined promotional activity were offset by lower delivered unit volume. Adjusted operating margin of 12.1% remained above pre-pandemic levels primarily due to strong gross margins and lower operating expenses from disciplined cost control initiatives. Adjusted diluted earnings per share was $2.49. We ended the fiscal year with wholesale backlog of $53.5 million, down 27.7% from a year ago. However, backlog is now more reflective of historical norms and near pre-pandemic levels.
We achieved these financial results and generated strong cash flows while protecting our margin gains through disciplined investments and solid execution. We are building a fundamentally stronger company, protecting our profitability and enhancing our operational efficiency. As we move into fiscal 2025, we will continue to carefully manage our expense structure while investing in growth initiatives that we believe will further our business. While we understand the challenges of a slower economy and the reduction of consumer focus on the home, we remain cautiously optimistic that our current business model, strategy, and balance sheet has us well positioned.
Refer to the Regulation G Reconciliation of Non-GAAP Financial Measures section within this MD&A for the reconciliation of U.S. generally accepted accounting principles (“GAAP”) to adjusted key financial metrics.
Key Operating Metrics
A summary of our key operating metrics is presented in the following table (in millions, except per share data).
| |
|
Fiscal Year Ended June 30,
|
|
|
|
|
|
| |
|
2024
|
|
|
% of Sales
|
|
|
% Chg
|
|
|
2023
|
|
|
% of Sales
|
|
|
% Chg
|
|
|
2022
|
|
|
% of Sales
|
|
|
% Chg
|
|
|
Net sales
|
|
$ |
646.2 |
|
|
|
100.0 |
% |
|
|
(18.3 |
%) |
|
$ |
791.4 |
|
|
|
100.0 |
% |
|
|
(3.2 |
%) |
|
$ |
817.8 |
|
|
|
100.0 |
% |
|
|
19.4 |
% |
|
Gross profit
|
|
$ |
393.1 |
|
|
|
60.8 |
% |
|
|
(18.2 |
%) |
|
$ |
480.4 |
|
|
|
60.7 |
% |
|
|
(0.9 |
%) |
|
$ |
484.7 |
|
|
|
59.3 |
% |
|
|
23.3 |
% |
|
Operating income
|
|
$ |
78.0 |
|
|
|
12.1 |
% |
|
|
(43.2 |
%) |
|
$ |
137.2 |
|
|
|
17.3 |
% |
|
|
(0.8 |
%) |
|
$ |
138.3 |
|
|
|
16.9 |
% |
|
|
78.9 |
% |
|
Adjusted operating income(1)
|
|
$ |
77.9 |
|
|
|
12.1 |
% |
|
|
(41.6 |
%) |
|
$ |
133.5 |
|
|
|
16.9 |
% |
|
|
(0.5 |
%) |
|
$ |
134.2 |
|
|
|
16.4 |
% |
|
|
67.1 |
% |
|
Net income
|
|
$ |
63.8 |
|
|
|
9.9 |
% |
|
|
(39.7 |
%) |
|
$ |
105.8 |
|
|
|
13.4 |
% |
|
|
2.4 |
% |
|
$ |
103.3 |
|
|
|
12.6 |
% |
|
|
72.1 |
% |
|
Adjusted net income(1)
|
|
$ |
63.8 |
|
|
|
9.9 |
% |
|
|
(38.1 |
%) |
|
$ |
103.1 |
|
|
|
13.0 |
% |
|
|
2.8 |
% |
|
$ |
100.3 |
|
|
|
12.3 |
% |
|
|
67.0 |
% |
|
Diluted EPS
|
|
$ |
2.49 |
|
|
|
|
|
|
|
(39.7 |
%) |
|
$ |
4.13 |
|
|
|
|
|
|
|
2.0 |
% |
|
$ |
4.05 |
|
|
|
|
|
|
|
70.9 |
% |
|
Adjusted diluted EPS(1)
|
|
$ |
2.49 |
|
|
|
|
|
|
|
(38.2 |
%) |
|
$ |
4.03 |
|
|
|
|
|
|
|
2.5 |
% |
|
$ |
3.93 |
|
|
|
|
|
|
|
65.8 |
% |
|
Cash flow from operating activities
|
|
$ |
80.2 |
|
|
|
|
|
|
|
(20.3 |
%) |
|
$ |
100.7 |
|
|
|
|
|
|
|
45.1 |
% |
|
$ |
69.4 |
|
|
|
|
|
|
|
(46.6 |
%) |
|
Return on equity
|
|
|
13.4 |
% |
|
|
|
|
|
|
|
|
|
|
23.5 |
% |
|
|
|
|
|
|
|
|
|
|
26.4 |
% |
|
|
|
|
|
|
|
|
|
Wholesale written orders
|
|
|
|
|
|
|
|
|
|
|
(10.9 |
%) |
|
|
|
|
|
|
|
|
|
|
(9.0 |
%) |
|
|
|
|
|
|
|
|
|
|
(0.5 |
%) |
|
Retail written orders
|
|
|
|
|
|
|
|
|
|
|
(8.4 |
%) |
|
|
|
|
|
|
|
|
|
|
(12.3 |
%) |
|
|
|
|
|
|
|
|
|
|
(4.6 |
%) |
|
(1)
|
Refer to the Regulation G Reconciliation of Non-GAAP Financial Measures section within this MD&A for the reconciliation of GAAP to adjusted key financial metrics.
|
Results of Operations
For an understanding of the significant factors that influenced our financial performance in fiscal 2024 compared with fiscal 2023, the following discussion should be read in conjunction with the consolidated financial statements and related notes presented under Item 8 in this Annual Report on Form 10-K. Refer to Results of Operations under Item 7, Management’s Discussion and Analysis of Financial Condition and Results of Operations, contained in Part II of our Annual Report on Form 10-K for the fiscal year ended June 30, 2023, filed with the SEC on August 24, 2023, for an analysis of the fiscal 2023 results as compared to fiscal 2022.
|
(in thousands)
|
|
Fiscal Year Ended June 30,
|
|
| |
|
2024
|
|
|
2023
|
|
|
% Change
|
|
|
Consolidated net sales
|
|
$ |
646,221 |
|
|
$ |
791,382 |
|
|
|
(18.3% |
) |
|
Wholesale net sales
|
|
$ |
371,087 |
|
|
$ |
449,591 |
|
|
|
(17.5% |
) |
|
Retail net sales
|
|
$ |
540,550 |
|
|
$ |
662,555 |
|
|
|
(18.4% |
) |
|
Consolidated gross profit
|
|
$ |
393,062 |
|
|
$ |
480,370 |
|
|
|
(18.2% |
) |
|
Consolidated gross margin
|
|
|
60.8 |
% |
|
|
60.7 |
% |
|
|
|
|
ETHAN ALLEN INTERIORS INC. AND SUBSIDIARIES
Net Sales
Consolidated net sales in fiscal 2024 decreased $145.2 million or 18.3% compared to the prior year period due to an 18.4% reduction in retail sales through our Company-operated design centers and a decline of 17.5% in wholesale net sales. Our consolidated net sales were impacted by a decline in delivered unit volume, a challenging consumer environment for home furnishings that led to lower incoming written orders, a relatively difficult prior year comparative period and reduced available backlog partially offset by selective price increases to maintain competitiveness. Consolidated net sales in the prior year were higher than historical norms as we benefited from delivery of significant backlog driven by heightened demand in prior periods.
Wholesale net sales in fiscal 2024 decreased $78.5 million or 17.5% compared to the prior year primarily due to decreases in intersegment sales to our Company-operated design centers, sales to our independent dealers and contract sales. Lower sales primarily reflect lower incoming written orders, a decline in delivered unit volume and backlog returning to near pre-pandemic levels. Excluding intersegment sales to our retail segment, wholesale net sales decreased $23.2 million or 18.0% compared to the prior year period. Our contract sales, including shipments to the United States government General Services Administration (“GSA”), decreased due to lower backlog, timing of purchases and a slowdown in government spending. Our international sales, which represent 1.9% of total wholesale net sales, decreased primarily from lower net sales to our international retailers in Southeast Asia and the Middle East partially offset by improving sales to China.
Wholesale written orders, which represent orders booked through all of our channels, were down 10.9% in fiscal 2024 compared to the prior year period as a result of the softening in the home furnishings market, ongoing inflationary pressures, high interest rates, a slow housing market and a slower contract business. Orders from our independent U.S. retail network decreased 10.4% while our international retailers decreased 1.7%. Orders from our intersegment Company-operated design centers were down 9.5% and our contract orders were down 23.1%.
Wholesale backlog was $53.5 million at June 30, 2024, down 27.7% from a year ago; however, it is more reflective of pre-pandemic levels. The number of weeks of wholesale backlog at June 30, 2024 was fewer than last year as we improved our delivery times with notable improvements seen across each product category. As we head into fiscal 2025, we expect incoming order trends to approximate outgoing delivered sales.
Retail net sales from Company-operated design centers decreased $122.0 million or 18.4% during fiscal 2024 compared to the prior year period. There was an 18.6% decrease in net sales in the United States, while sales from our Canadian design centers decreased 9.1%. The decline in retail net sales was primarily from a decline in delivered unit volume as a result of lower manufacturing levels, combined with lower written orders, reduced backlog and decreased premier home delivery revenue partially offset by higher designer floor sample sales and selective price increases.
Retail written orders declined 8.4% year over year due to weaker traffic, softening of consumer interest in home furnishings, ongoing inflationary pressures and elevated interest rates. To help drive traffic and related business to our retail design centers, we hosted grand reopening celebrations throughout fiscal 2024 to unveil the repositioning of our retail network as the Interior Design Destination, offering guests a chance to view new products, meet each location’s interior designers and experience the refreshed design centers. We also utilized extended financing terms over select promotional periods, which helped drive traffic around these periods. At June 30, 2024, there were 142 Company-operated design centers compared to 139 a year ago, with new locations in The Villages, FL, Avon, OH and Albuquerque, NM, in addition to relocations of our New York, NY and Louisville, KY design centers.
Gross Profit and Margin
Consolidated gross profit in fiscal 2024 decreased $87.3 million or 18.2% compared with the prior year period due to sales declines within both our wholesale and retail segments, including lower delivered unit volume. Wholesale gross profit decreased 19.2% due to the 17.5% decline in sales and a 70-basis point reduction in gross margin. Retail gross profit decreased 18.8% due to the 18.4% decrease in net shipments combined with a 30-basis point reduction in gross margin.
ETHAN ALLEN INTERIORS INC. AND SUBSIDIARIES
Consolidated gross margin was 60.8%, a 10-basis point improvement over the prior year period due to reduced headcount, disciplined promotional activity, lower manufacturing raw material input costs and favorable intercompany inventory profit eliminations partially offset by deleveraging from lower delivered sales and increased designer floor sample sales. Our sales mix was comparable to the prior year. Retail sales, when expressed as a percentage of total consolidated net sales, was 83.6% in fiscal 2024, comparable to 83.7% in the prior year period, which had a neutral effect on our consolidated gross margin.
Wholesale gross margin was down 70 basis points over the prior year period due to reduced production volumes which led to increased plant inefficiencies and related manufacturing variances, inflationary pressure on labor and rising fuel costs partially offset by lower raw material input costs, reduced headcount and investments in technology, which helped streamline production workflows. Lower raw material input costs were led by reduced commodity prices and improved sourcing.
Retail gross margin decreased 30 basis points compared to the prior year due to incremental designer floor sample sales partially offset by selective price increases, improved premier home delivery margin and lower financing costs from reduced special financing.
Selling, General & Administrative (“SG&A”) Expenses
|
(in thousands)
|
|
Fiscal Year Ended June 30,
|
|
| |
|
2024
|
|
|
2023
|
|
|
% Change
|
|
|
SG&A expenses
|
|
$ |
315,148 |
|
|
$ |
346,894 |
|
|
|
(9.2% |
) |
|
Restructuring and other impairment charges, net of gains
|
|
$ |
(77 |
) |
|
$ |
(3,720 |
) |
|
|
(97.9% |
) |
|
Consolidated operating income
|
|
$ |
77,991 |
|
|
$ |
137,196 |
|
|
|
(43.2% |
) |
|
Consolidated operating margin
|
|
|
12.1 |
% |
|
|
17.3 |
% |
|
|
|
|
|
Wholesale operating income
|
|
$ |
48,707 |
|
|
$ |
68,792 |
|
|
|
(29.2% |
) |
|
Retail operating income
|
|
$ |
24,704 |
|
|
$ |
67,256 |
|
|
|
(63.3% |
) |
SG&A expenses for fiscal 2024 decreased $31.7 million or 9.2% compared to the prior year period due to lower selling expenses from less delivered net sales and a reduction in general and administrative costs. When expressed as a percentage of sales, SG&A expenses were 48.8% compared to 43.8% in the prior year period, an increase of 500 basis points due to fixed cost deleveraging from lower delivered sales partially offset by lower headcount and a disciplined approach to cost savings. SG&A expenses were down 9.2% while consolidated sales decreased 18.3%, which led to a decrease in operating leverage.
Consolidated selling expenses were down 14.4% during fiscal 2024. Wholesale selling expenses, which include our logistics operation, decreased 16.8% primarily from a 17.1% decline in wholesale units shipped, lower freight costs including fuel, and less outgoing distribution costs combined with reduced headcount partially offset by an increase in technology spend. Retail selling expenses were down 13.6% due to lower designer variable compensation and reduced delivery costs from the 18.4% decrease in retail net sales partially offset by increased occupancy expenses and costs associated with our design center refreshes completed during fiscal 2024. Our consolidated advertising expenses were equal to 2.5% of net sales, up from 2.2% in the prior year period as we increased our direct mail campaigns focusing on being the premier interior design destination with new product introductions.
General and administrative expenses decreased 0.8% during fiscal 2024 as Wholesale expenses declined 9.2% while Retail expenses grew 2.1%. Wholesale general and administrative expenses were lower due to less employee compensation, favorable employee benefit costs and lower professional fees. Retail general and administrative expenses rose due to costs incurred for the design center refreshes and higher occupancy expenses from the addition of three net new design centers in the last twelve months. As part of our fiscal 2024 design center refresh initiative as the Interior Design Destination, we incurred expenditures for new product swatches, samples, floor displays, painting, lighting and flooring.
Compared to a year ago, our consolidated headcount is down 9.2% or 344 associates (298 wholesale and 46 retail) as we continue to identify operational efficiencies and leverage the use of technology to streamline workflows to help reduce our human capital costs throughout our vertically-integrated enterprise.
Restructuring and Other Charges, Net of Gains
Restructuring and other charges, net of gains for fiscal 2024 was a gain of $0.1 million compared to a gain of $3.7 million in the prior year period. The fiscal 2024 restructuring credit was due to a $2.6 million gain related to the amortization of the deferred liability generated from the August 1, 2022 sale-leaseback transaction partially offset by a $2.2 million net loss incurred from the damage sustained in the July 2023 Vermont flooding and severance costs of $0.4 million. Vermont flood losses incurred from the disposal of damaged inventory, inoperable machinery equipment from water damage, facility cleanup, and restoration, were $2.2 million, net of insurance recoveries and grant proceeds. In the prior year period, we recognized a gain of $4.2 million on the sale-leaseback transaction as well as a gain of $0.3 million on the sale of a property partially offset by severance costs of $0.7 million.
ETHAN ALLEN INTERIORS INC. AND SUBSIDIARIES
Consolidated Operating Income
Consolidated operating income for fiscal 2024 decreased $59.2 million or 43.2%. Adjusted operating income, which excludes restructuring and other charges, net of gains, was $77.9 million, or 12.1% of net sales compared with $133.5 million, or 16.9% of net sales in the prior year period. The decrease in operating income was driven by lower consolidated net sales partially offset by lower SG&A expenses. We remain focused on a disciplined approach to cost savings and expense control in a declining net sales environment, which helped mitigate the impact of the reduction in consolidated net sales.
Wholesale operating income for fiscal 2024 was $48.7 million or 13.1% of net sales, compared to $68.8 million or 15.3% in the prior year period. Adjusted wholesale operating income, which excludes restructuring and other charges, net of gains, was $51.1 million, or 13.8% of net sales compared with $69.0 million, or 15.3% of net sales in the prior year period. The decrease in adjusted wholesale operating income was driven primarily by the 17.5% decline in wholesale net sales partially offset by the 13.8% reduction in wholesale SG&A expenses.
Retail operating income for fiscal 2024 was $24.7 million or 4.6% of retail net sales, compared to $67.3 million or 10.2% in the prior year period. Adjusted retail operating income, which excludes restructuring and other charges, net of gains, was $22.2 million, or 4.1% of net sales compared with $63.4 million, or 9.6% of net sales in the prior year period. The decrease in adjusted retail operating income is driven primarily by the 18.4% decrease in retail net sales partially offset by the 7.6% reduction in retail SG&A expenses.
Non-Operating Income (Expense)
|
(in thousands)
|
|
Fiscal Year Ended June 30,
|
|
| |
|
2024
|
|
|
2023
|
|
|
% Change
|
|
|
Interest and other income, net
|
|
$ |
7,700 |
|
|
$ |
4,042 |
|
|
|
90.5 |
% |
|
Interest and other financing costs
|
|
$ |
245 |
|
|
$ |
213 |
|
|
|
15.0 |
% |
Interest and other income, net includes interest income on investments, foreign currency gains or losses and other income or expense incurred outside our normal course of business. Interest and other income, net increased 90.5% to $7.7 million during fiscal 2024 due to incremental interest income driven by higher investment balances.
Income Taxes, Net Income and Diluted Earnings per Share (“EPS”)
|
(in thousands)
|
|
Fiscal Year Ended June 30,
|
|
| |
|
2024
|
|
|
2023
|
|
|
% Change
|
|
|
Income tax expense
|
|
$ |
21,630 |
|
|
$ |
35,218 |
|
|
|
(38.6% |
) |
|
Effective tax rate
|
|
|
25.3 |
% |
|
|
25.0 |
% |
|
|
|
|
|
Net income
|
|
$ |
63,816 |
|
|
$ |
105,807 |
|
|
|
(39.7% |
) |
|
Adjusted net income
|
|
$ |
63,758 |
|
|
$ |
103,057 |
|
|
|
(38.1% |
) |
|
Diluted EPS
|
|
$ |
2.49 |
|
|
$ |
4.13 |
|
|
|
(39.7% |
) |
|
Adjusted diluted EPS
|
|
$ |
2.49 |
|
|
$ |
4.03 |
|
|
|
(38.2% |
) |
Income Tax Expense
Income tax expense was $21.6 million compared with $35.2 million in the prior year due to the $55.6 million decrease in income before income taxes as our consolidated effective tax rate was 25.3% compared with 25.0% in the prior year. Our effective tax rate of 25.3% varies from the 21% federal statutory rate primarily due to state taxes.
Net Income and Diluted EPS
Net income for fiscal 2024 was $63.8 million compared with $105.8 million in the prior year period. Adjusted net income, which removes the after-tax impact of restructuring and other charges, net of gains, was $63.8 million, a decrease of 38.1% compared to $103.1 million in the prior year period. The decrease in net income and adjusted net income was driven by the $145.2 million reduction in consolidated net sales partially offset by lower operating expenses.
Diluted EPS for fiscal 2024 was $2.49 compared to $4.13 per diluted share in the prior year period. Adjusted diluted EPS was $2.49, down 38.2% compared with the prior year period. The decrease in diluted EPS was primarily due to lower consolidated net sales partially offset by lower operating expenses.
ETHAN ALLEN INTERIORS INC. AND SUBSIDIARIES
Regulation G Reconciliations of Non-GAAP Financial Measures
To supplement the financial measures prepared in accordance with GAAP, we use non-GAAP financial measures, including adjusted operating income and margin, adjusted wholesale operating income and margin, adjusted retail operating income and margin, adjusted net income and adjusted diluted EPS. The reconciliations of these non-GAAP financial measures to the most directly comparable financial measures calculated and presented in accordance with GAAP are shown in the tables below.
These non-GAAP measures are derived from the consolidated financial statements but are not presented in accordance with GAAP. We believe these non-GAAP measures provide a meaningful comparison of our results to others in our industry and our prior year results. Investors should consider these non-GAAP financial measures in addition to, and not as a substitute for, our financial performance measures prepared in accordance with GAAP. Moreover, these non-GAAP financial measures have limitations in that they do not reflect all the items associated with the operations of the business as determined in accordance with GAAP. Other companies may calculate similarly titled non-GAAP financial measures differently than we do, limiting the usefulness of those measures for comparative purposes. Despite the limitations of these non-GAAP financial measures, we believe these adjusted financial measures and the information they provide are useful in viewing our performance using the same tools that management uses to assess progress in achieving our goals. Adjusted measures may also facilitate comparisons to our historical performance.
The following tables below show a reconciliation of non-GAAP financial measures used in this filing to the most directly comparable GAAP financial measures.
|
(in thousands, except per share amounts)
|
|
Fiscal Year Ended June 30,
|
|
| |
|
2024
|
|
|
2023
|
|
|
% Change
|
|
|
Consolidated Adjusted Operating Income / Operating Margin
|
|
|
|
|
|
|
|
|
|
|
|
|
|
GAAP Operating income
|
|
$ |
77,991 |
|
|
$ |
137,196 |
|
|
|
(43.2% |
) |
|
Adjustments (pre-tax) *
|
|
|
(77 |
) |
|
|
(3,682 |
) |
|
|
|
|
|
Adjusted operating income *
|
|
$ |
77,914 |
|
|
$ |
133,514 |
|
|
|
(41.6% |
) |
| |
|
|
|
|
|
|
|
|
|
|
|
|
|
Consolidated Net sales
|
|
$ |
646,221 |
|
|
$ |
791,382 |
|
|
|
(18.3% |
) |
|
GAAP Operating margin
|
|
|
12.1 |
% |
|
|
17.3 |
% |
|
|
|
|
|
Adjusted operating margin *
|
|
|
12.1 |
% |
|
|
16.9 |
% |
|
|
|
|
| |
|
|
|
|
|
|
|
|
|
|
|
|
|
Consolidated Adjusted Net Income / Adjusted Diluted EPS
|
|
|
|
|
|
|
|
|
|
|
|
|
|
GAAP Net income
|
|
$ |
63,816 |
|
|
$ |
105,807 |
|
|
|
(39.7% |
) |
|
Adjustments, net of tax *
|
|
|
(58 |
) |
|
|
(2,750 |
) |
|
|
|
|
|
Adjusted net income
|
|
$ |
63,758 |
|
|
$ |
103,057 |
|
|
|
(38.1% |
) |
|
Diluted weighted average common shares
|
|
|
25,644 |
|
|
|
25,604 |
|
|
|
|
|
|
GAAP Diluted EPS
|
|
$ |
2.49 |
|
|
$ |
4.13 |
|
|
|
(39.7% |
) |
|
Adjusted diluted EPS *
|
|
$ |
2.49 |
|
|
$ |
4.03 |
|
|
|
(38.2% |
) |
| |
|
|
|
|
|
|
|
|
|
|
|
|
|
Wholesale Adjusted Operating Income / Adjusted Operating Margin
|
|
|
|
|
|
|
|
|
|
|
|
|
|
Wholesale GAAP operating income
|
|
$ |
48,707 |
|
|
$ |
68,792 |
|
|
|
(29.2% |
) |
|
Adjustments (pre-tax) *
|
|
|
2,385 |
|
|
|
190 |
|
|
|
|
|
|
Adjusted wholesale operating income *
|
|
$ |
51,092 |
|
|
$ |
68,982 |
|
|
|
(25.9% |
) |
| |
|
|
|
|
|
|
|
|
|
|
|
|
|
Wholesale net sales
|
|
$ |
371,087 |
|
|
$ |
449,591 |
|
|
|
(17.5% |
) |
|
Wholesale GAAP operating margin
|
|
|
13.1 |
% |
|
|
15.3 |
% |
|
|
|
|
|
Adjusted wholesale operating margin *
|
|
|
13.8 |
% |
|
|
15.3 |
% |
|
|
|
|
| |
|
|
|
|
|
|
|
|
|
|
|
|
|
Retail Adjusted Operating Income / Adjusted Operating Margin
|
|
|
|
|
|
|
|
|
|
|
|
|
|
Retail GAAP operating income
|
|
$ |
24,704 |
|
|
$ |
67,256 |
|
|
|
(63.3% |
) |
|
Adjustments (pre-tax) *
|
|
|
(2,462 |
) |
|
|
(3,872 |
) |
|
|
|
|
|
Adjusted retail operating income *
|
|
$ |
22,242 |
|
|
$ |
63,384 |
|
|
|
(64.9% |
) |
| |
|
|
|
|
|
|
|
|
|
|
|
|
|
Retail net sales
|
|
$ |
540,550 |
|
|
$ |
662,555 |
|
|
|
(18.4% |
) |
|
Retail GAAP operating margin
|
|
|
4.6 |
% |
|
|
10.2 |
% |
|
|
|
|
|
Adjusted retail operating margin *
|
|
|
4.1 |
% |
|
|
9.6 |
% |
|
|
|
|
ETHAN ALLEN INTERIORS INC. AND SUBSIDIARIES
* Adjustments to reported GAAP financial measures including operating income and margin, net income, and diluted EPS have been adjusted by the following:
|
(in thousands)
|
|
Fiscal Year Ended June 30,
|
|
| |
|
2024
|
|
|
2023
|
|
| |
|
|
|
|
|
|
|
|
|
Gain on sale-leaseback transaction (retail)
|
|
$ |
(2,620 |
) |
|
$ |
(4,222 |
) |
|
Orleans, VT flood (wholesale)
|
|
|
2,243 |
|
|
|
- |
|
|
Gain on sale of property, plant and equipment (retail)
|
|
|
- |
|
|
|
(311 |
) |
|
Severance and other charges (wholesale)
|
|
|
141 |
|
|
|
169 |
|
|
Severance and other charges (retail)
|
|
|
159 |
|
|
|
644 |
|
|
Disposal of long-lived assets and lease exit costs (retail)
|
|
|
- |
|
|
|
38 |
|
|
Adjustments to operating income
|
|
|
(77 |
) |
|
|
(3,682 |
) |
|
Related income tax effects on non-recurring items(1)
|
|
|
19 |
|
|
|
932 |
|
|
Adjustments to net income
|
|
$ |
(58 |
) |
|
$ |
(2,750 |
) |
|
(1)
|
Calculated using the marginal tax rate for each period presented
|
Liquidity
Our sources of liquidity include cash and cash equivalents, short-term and long-term investments, cash generated from operations and amounts available under our credit facility. We believe these sources remain adequate to meet our short-term and long-term liquidity requirements, finance our long-term growth plans, invest in capital expenditures and fulfill other cash requirements for day-to-day operations and contractual obligations. We are committed to maintaining a strong balance sheet and monitoring our liquidity closely.
As of June 30, 2024, the Company had available liquidity of $316.8 million as summarized below (in thousands).
| |
|
June 30,
|
|
|
June 30,
|
|
| |
|
2024
|
|
|
2023
|
|
| |
|
|
|
|
|
|
|
|
|
Cash and cash equivalents
|
|
$ |
69,710 |
|
|
$ |
62,130 |
|
|
Investments, short-term
|
|
|
91,319 |
|
|
|
110,577 |
|
|
Investments, long-term (1)
|
|
|
34,772 |
|
|
|
- |
|
|
Availability under existing credit facility
|
|
|
120,952 |
|
|
|
120,952 |
|
|
Total Available Liquidity
|
|
$ |
316,753 |
|
|
$ |
293,659 |
|
|
(1)
|
Our long-term investments in U.S. Treasury notes are classified as non-current as they have stated maturities greater than one year.
|
At June 30, 2024, we had working capital of $179.0 million compared with $196.4 million at June 30, 2023 and a current ratio of 2.16 at June 30, 2024, comparable to 2.20 a year ago. Our non-U.S. subsidiaries held $4.3 million in cash and cash equivalents at June 30, 2024, which we have determined to be permanently reinvested.
Summary of Cash Flows
At June 30, 2024, we held cash and cash equivalents of $69.7 million compared with $62.1 million at June 30, 2023. Cash and cash equivalents aggregated to 9.4% of our total assets at June 30, 2024, compared with 8.3% a year ago. In addition to cash and cash equivalents of $69.7 million, we had aggregated investments of $126.1 million at June 30, 2024 compared with $110.6 million at June 30, 2023. Our investments at June 30, 2024 are within U.S. Treasury bills and notes, which we expect will further enhance our returns on excess cash. Our U.S. Treasury bills totaled $91.3 million with maturities of less than one year while our U.S. Treasury notes totaled $34.8 million with maturities ranging between one and two years. We believe our cash, cash equivalents and investments are available to meet short-term liquidity needs.
ETHAN ALLEN INTERIORS INC. AND SUBSIDIARIES
The following table illustrates the main components of our cash flows for each of the last three fiscal years.
|
(in millions)
|
|
Fiscal Year Ended June 30,
|
|
| |
|
2024
|
|
|
2023
|
|
|
2022
|
|
|
Operating activities
|
|
|
|
|
|
|
|
|
|
|
|
|
|
Net income
|
|
$ |
63.8 |
|
|
$ |
105.8 |
|
|
$ |
103.3 |
|
|
Non-cash operating lease cost
|
|
|
32.0 |
|
|
|
30.2 |
|
|
|
30.3 |
|
|
Restructuring and other charges, net of gains
|
|
|
(0.1 |
) |
|
|
(3.7 |
) |
|
|
(4.4 |
) |
|
Payments on restructuring and other charges, net of proceeds
|
|
|
(1.0 |
) |
|
|
(1.0 |
) |
|
|
(1.6 |
) |
|
Depreciation and amortization and other non-cash items
|
|
|
17.4 |
|
|
|
17.4 |
|
|
|
17.3 |
|
|
Deferred income taxes
|
|
|
(0.2 |
) |
|
|
(1.2 |
) |
|
|
(0.4 |
) |
|
Changes in operating assets and liabilities
|
|
|
(31.7 |
) |
|
|
(46.8 |
) |
|
|
(75.1 |
) |
|
Total provided by operating activities
|
|
$ |
80.2 |
|
|
$ |
100.7 |
|
|
$ |
69.4 |
|
| |
|
|
|
|
|
|
|
|
|
|
|
|
|
Investing activities
|
|
|
|
|
|
|
|
|
|
|
|
|
|
Capital expenditures
|
|
$ |
(9.6 |
) |
|
$ |
(13.9 |
) |
|
$ |
(13.4 |
) |
|
Proceeds from sales of property, plant and equipment
|
|
|
- |
|
|
|
9.9 |
|
|
|
10.6 |
|
|
Purchases of investments, net of sales
|
|
|
(10.4 |
) |
|
|
(97.5 |
) |
|
|
(11.2 |
) |
|
Total used in investing activities
|
|
$ |
(20.0 |
) |
|
$ |
(101.5 |
) |
|
$ |
(14.0 |
) |
| |
|
|
|
|
|
|
|
|
|
|
|
|
|
Financing activities
|
|
|
|
|
|
|
|
|
|
|
|
|
|
Taxes paid related to net share settlement of equity awards
|
|
$ |
(2.1 |
) |
|
$ |
(0.8 |
) |
|
$ |
(0.8 |
) |
|
Dividend payments
|
|
|
(50.3 |
) |
|
|
(46.4 |
) |
|
|
(48.3 |
) |
|
Proceeds from employee stock plans
|
|
|
0.5 |
|
|
|
0.1 |
|
|
|
1.1 |
|
|
Payments for debt issuance costs
|
|
|
- |
|
|
|
- |
|
|
|
(0.5 |
) |
|
Payments on financing leases and other
|
|
|
(0.4 |
) |
|
|
(0.5 |
) |
|
|
(0.5 |
) |
|
Total used in financing activities
|
|
$ |
(52.3 |
) |
|
$ |
(47.6 |
) |
|
$ |
(49.0 |
) |
Our cash and cash equivalents increased $7.6 million or 12.2% during fiscal 2024 due to net cash provided by operating activities of $80.2 million partially offset by $50.3 million in cash dividends paid, capital expenditures of $9.6 million, $10.4 million in net purchases of investments and $2.1 million in taxes paid related to net share settlement of vested RSUs and PSUs.
Cash Provided by Operating Activities
During fiscal 2024 we generated $80.2 million in cash from operating activities, a decrease from $100.7 million in the prior year period due to lower net income partially offset by improvements in net working capital. Restructuring payments made during fiscal 2024 of $1.0 million related primarily to the Orleans flood restoration. Net working capital improved due to lower inventory carrying levels combined with a decrease in accounts receivable from strong cash collections and lower contract sales. Our inventory balances continue to decline as we adjust our operating inventory amounts to reflect lower backlog while also ensuring appropriate levels are maintained to service customer orders. These improvements were partially offset by a reduction in customer deposits, reflecting lower backlog and incoming orders.
Cash Used in Investing Activities
Cash used in investing activities was $20.0 million during fiscal 2024, compared with cash used of $101.5 million in the prior year period. During fiscal 2024, we had $10.4 million of net purchases of investments, which represent $124.5 million of U.S. Treasuries that matured during the year and were subsequently reinvested at a higher amount totaling $134.9 million. The prior year period included $97.5 million of net purchases of investments to further enhance our returns on our cash as well as to fund future obligations. In addition, the prior year included $8.1 million in proceeds received from the sale-leaseback transaction completed in August 2022 as well as the sale of a property for $1.8 million in April 2023. Capital expenditures during fiscal 2024 were $9.6 million compared with $13.9 million in the prior year period. Fiscal 2024 capital expenditures primarily related to design center openings, relocations and improvements, replacement of machinery and equipment used within our manufacturing and distribution facilities, and investments in technology. Capital expenditures a year ago were higher as we made significant safety and efficiency upgrades within our manufacturing plants.
Cash Used in Financing Activities
Cash used in financing activities was $52.3 million during fiscal 2024, an increase from $47.6 million in the prior year period primarily due to the $3.9 million increase in dividends paid. Effective May 2024, the regular quarterly dividend increased 8.3%, from $0.36 to $0.39 per share. A special cash dividend of $0.50 per share was also paid in both the current and prior year periods. In addition, during fiscal 2024 a total of 67,824 shares valued at $2.1 million were repurchased from employees to satisfy their withholding tax obligations upon vesting of RSUs and PSUs. This compared to $0.8 million repurchased for tax obligations upon vesting of RSUs and PSUs in the prior year period. There were no share repurchases under our existing multi-year share repurchase program during fiscal 2024 or 2023.
ETHAN ALLEN INTERIORS INC. AND SUBSIDIARIES
Restricted Cash
We present restricted cash as a component of total cash and cash equivalents on our consolidated statements of cash flows and within Other assets on our consolidated balance sheets. At both June 30, 2024 and 2023, we held $0.5 million of restricted cash related to the Ethan Allen insurance captive.
Exchange Rate Changes
Due to changes in exchange rates, our cash and cash equivalents were negatively impacted by $0.3 million during fiscal 2024 compared with a $0.2 million positive impact in the prior year period. These changes had an immaterial impact on our cash balances held in Canada, Mexico and Honduras.
Capital Resources, including Material Cash Requirements
Sources of Liquidity
Capital Needs. On January 26, 2022, we entered into a Third Amended and Restated Credit Agreement (the “Credit Agreement”) with JPMorgan Chase Bank, N.A. as administrative agent and syndication agent and Capital One, National Association, as documentation agent. The Credit Agreement amended and restated the Second Amended and Restated Credit Agreement, dated as of December 21, 2018, as amended. The Credit Agreement provides for a $125 million revolving credit facility (the “Facility”), subject to borrowing base availability, with a maturity date of January 26, 2027. The Credit Agreement also provides us with an option to increase the size of the Facility up to an additional amount of $60 million. Availability under the Facility fluctuates according to a borrowing base calculated on eligible accounts receivable and inventory, net of customer deposits and reserves. The Facility includes covenants that apply under certain circumstances, including a fixed-charge coverage ratio requirement that applies when excess availability under the credit line is less than certain thresholds. As of June 30, 2024, we were not subject to the fixed-charge coverage ratio requirement, had no borrowings outstanding under the Facility, were in compliance with all other covenants, and had borrowing availability of $121.0 million of the $125.0 million credit commitment. We incurred financing costs of $0.5 million during fiscal 2022, which are being amortized as interest expense over the remaining life of the Facility using the effective interest method. See Note 12, Credit Agreement, to the consolidated financial statements included under Item 8 of this Annual Report on Form 10-K, for a further description of the Credit Agreement.
Letters of Credit. At both June 30, 2024 and 2023 there were $4.0 million of standby letters of credit outstanding under the Facility.
Uses of Liquidity
Capital Expenditures. Capital expenditures during fiscal 2024 totaled $9.6 million compared with $13.9 million in the prior year period. Current year capital expenditures included $5.4 million for retail design center openings, relocations and renovations and $4.2 million to further improve our manufacturing facilities, including replacing equipment damaged in the Orleans, Vermont flood.
We have no material contractual commitments outstanding for future capital expenditures and anticipate that cash from operations will be sufficient to fund future capital expenditures.
Dividends. Our Board has the sole authority to determine if and when we will declare future dividends and on what terms. We have a strong history of returning capital to shareholders and continued this practice during fiscal 2024 as the following actions were taken pertaining to dividends.
| |
●
|
On August 1, 2023, our Board declared a $0.50 per share special cash dividend in addition to our regular quarterly cash dividend of $0.36 per share, both paid on August 31, 2023
|
| |
●
|
On October 24, 2023, our Board declared a regular quarterly cash dividend of $0.36 per share, which was paid on November 22, 2023
|
| |
●
|
On January 23, 2024, our Board declared a regular quarterly cash dividend of $0.36 per share, which was paid on February 22, 2024
|
| |
●
|
On April 22, 2024, our Board increased our regular quarterly cash dividend by 8.3% to $0.39 per share, which was paid on May 23, 2024
|
ETHAN ALLEN INTERIORS INC. AND SUBSIDIARIES
During fiscal 2024 we paid a total of $1.97 per share in cash dividends for an aggregate total of $50.3 million. This included the special dividend paid in August 2023 totaling $12.7 million. In the prior year period, total dividends paid were $46.4 million. With our dividends, we have returned $671.2 million to shareholders since our initial public offering in 1993.
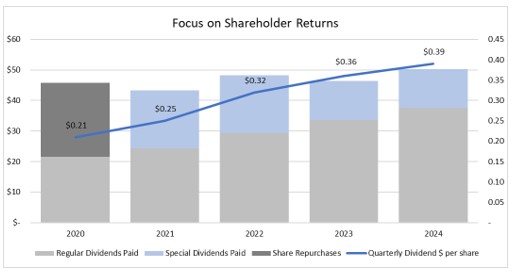
We have paid a special cash dividend each of the past four years and paid an annual cash dividend every year since 1996. Although we expect to continue to declare and pay quarterly cash dividends for the foreseeable future, the payment of future cash dividends is within the discretion of our Board of Directors and will depend on our earnings, operations, financial condition, capital requirements and general business outlook, among other factors. Our credit agreement also includes covenants that include limitations on our ability to pay dividends.
Share Repurchase Program. There were no share repurchases under our existing multi-year share repurchase program during fiscal 2024 or 2023. At June 30, 2024, we had a remaining Board authorization to repurchase 2,007,364 shares of our common stock pursuant to our share repurchase program. The timing and amount of any future share repurchases in the open market and through privately negotiated transactions will be determined by the Company’s officers at their discretion and based on a number of factors, including an evaluation of market and economic conditions while also maintaining financial flexibility.
Material Cash Requirements from Contractual Obligations
Fluctuations in our operating results, levels of inventory on hand, operating lease commitments, the degree of success of our accounts receivable collection efforts, the timing of tax and other material payments, the rate of written orders and net sales, levels of customer deposits on hand, as well as capital expenditures will impact our liquidity and cash flows in future periods. The effect of our contractual obligations on our liquidity and capital resources in future periods should be considered in conjunction with the factors mentioned here. At June 30, 2024, we had total contractual obligations of $197.9 million, comparable to $199.1 million a year ago as there were no material changes during fiscal 2024.
Our material cash requirements for our contractual obligations at June 30, 2024 were as follows:
| |
●
|
Lease Obligations. We lease real estate for retail stores, distribution centers and office space and also have equipment leases for IT and office equipment. At June 30, 2024, we had operating and finance lease obligations of $151.3 million and $1.1 million, respectively, with $33.9 million and $0.4 million payable within 12 months, respectively. For more information, see Note 6, Leases, in the notes to consolidated financial statements included in Item 8 of this Annual Report on Form 10-K.
|
| |
●
|
Open Purchase Orders. We had purchase obligations, defined as agreements that are enforceable and legally binding that specify all significant terms, including fixed or minimum quantities to be purchased, of $30.7 million at June 30, 2024, comparable to $29.2 million in the prior year period. Our purchase obligations at June 30, 2024, all payable within 12 months, related to purchase orders for the procurement of selected finished goods sourced from third-party suppliers, lumber, fabric, leather and other raw materials used in our manufacturing.
|
| |
●
|
Long-term Debt. We had no outstanding borrowings under our revolving credit facility at June 30, 2024. Further discussion of our contractual obligations associated with long-term debt can be found in Note 12, Credit Agreement, to the consolidated financial statements included under Item 8 of this Annual Report on Form 10-K.
|
| |
●
|
Other Purchase Obligations. Other purchase commitments for services such as telecommunication, computer-related software, web development, financial and accounting software services, insurance and other maintenance contracts was $14.9 million at June 30, 2024, down from $16.9 million in the prior year period primarily due to timing of contract signing and extensions combined with use of other more-cost effective services.
|
ETHAN ALLEN INTERIORS INC. AND SUBSIDIARIES
For a discussion of our liquidity and capital resources and our cash flow activities for the fiscal year ended June 30, 2023, see Item 7,Management’s Discussion and Analysis of Financial Condition and Results of Operations, of our Annual Report on Form 10-K for the fiscal year ended June 30, 2023, filed with the SEC on August 24, 2023.
Other Arrangements
We do not utilize or employ any other arrangements in operating our business. As such, we do not maintain any retained or contingent interests, derivative instruments or variable interests which could serve as a source of potential risk to our future liquidity, capital resources and results of operations.
Product Warranties. At June 30, 2024 and 2023, our product warranty liability totaled $1.0 million and $1.3 million, respectively. Our products, including our case goods, upholstery and home accents, generally carry explicit product warranties and are provided based on terms that are generally accepted in the industry. All our domestic independent retailers are required to enter into and perform in accordance with the terms and conditions of a warranty service agreement. We record provisions for estimated warranty and other related costs at time of sale based on historical warranty loss experience and make periodic adjustments to those provisions to reflect actual experience.
Government Contracts
Other than standard provisions contained in our contracts with the United States government, we do not believe that any significant portion of our business is subject to material renegotiation of profits or termination of contracts or subcontracts at the election of government entities. Ethan Allen sells to the United States government both through GSA Multiple Award Schedule Contracts and through competitive bids. The GSA Multiple Award Schedule Contract pricing is principally based upon our commercial price list in effect when the contract is initiated. We are required to receive GSA approval to apply list price increases during the term of the Multiple Award Schedule Contract period.
Contingencies
We are involved in various claims and litigation as well as environmental matters, which arise in the normal course of business. Although the final outcome of these legal and environmental matters cannot be determined, based on the facts presently known, it is our opinion that the final resolution of these matters will not have a material adverse effect on our financial position or future results of operations.
Critical Accounting Estimates
We prepare our consolidated financial statements in conformity with GAAP. In some cases, these principles require management to make difficult and subjective judgments regarding uncertainties and, as a result, such estimates and assumptions may significantly impact our financial results and disclosures. We consider an accounting estimate to be critical if: (i) the accounting estimate requires us to make assumptions about matters that were highly uncertain at the time the accounting estimate was made, and (ii) changes in the estimate that are reasonably likely to occur from period to period, or use of different estimates that we reasonably could have used in the current period, would have a material impact on our financial condition or results of operations. We base our estimates on currently known facts and circumstances, prior experience and other assumptions we believe to be reasonable. We use our best judgment in valuing these estimates and may, as warranted, use external advice. Actual results could differ from these estimates, assumptions, and judgments and these differences could be significant. We make frequent comparisons throughout the year of actual experience to our assumptions to reduce the likelihood of significant adjustments and will record adjustments when differences are known.
The following critical accounting estimates affect our consolidated financial statements.
Impairment of Long-Lived Assets
The recoverability of long-lived assets, including those held by our retail design centers, is evaluated for impairment whenever events or changes in circumstances indicate that we may not be able to recover the carrying amount of an asset or asset group. Conditions that may indicate impairment include, but are not limited to, a significant adverse change in customer demand or business climate that could affect the value of an asset, change in the intended use of an asset, a product recall or an adverse action or assessment by a regulator. If the sum of the estimated undiscounted future cash flows over the remaining life of the primary asset is less than the carrying value, we recognize a loss equal to the difference between the carrying value and the fair value, usually determined by the estimated discounted cash flow analysis or independent third-party appraisal of the asset or asset group. While determining fair value requires a variety of input assumptions and judgment, we believe our estimates of fair value are reasonable. The asset group is defined as the lowest level for which identifiable cash flows are available and largely independent of the cash flows of other groups of assets, which for our retail segment is the individual design center. For retail design center level long-lived assets, expected cash flows are determined based on our estimate of future net sales, margin rates and expenses over the remaining expected terms of the leases.
ETHAN ALLEN INTERIORS INC. AND SUBSIDIARIES
Goodwill and Indefinite-Lived Intangible Assets
We review the carrying value of our goodwill and intangible assets with indefinite lives at least annually, during the fourth quarter, or more frequently if an event occurs or circumstances change, for possible impairment. Both goodwill and indefinite-lived intangible assets are assigned to our wholesale reporting unit which is principally involved in the development of the Ethan Allen brand and encompasses all aspects of design, manufacturing, sourcing, marketing, sale and distribution of the Company’s broad range of home furnishings and accents.
Goodwill. We may elect to evaluate qualitative factors to determine if it is more likely than not that the fair value of a reporting unit or fair value of indefinite lived intangible assets is less than its carrying value. If the qualitative evaluation indicates that it is more likely than not that the fair value of a reporting unit or indefinite lived intangible asset is less than its carrying amount, a quantitative impairment test is required. Alternatively, we may bypass the qualitative assessment for a reporting unit or indefinite lived intangible asset and directly perform a quantitative assessment.
A quantitative impairment test involves estimating the fair value of each reporting unit and indefinite lived intangible asset and comparing these estimated fair values with the respective reporting unit or indefinite lived intangible asset carrying value. If the carrying value of a reporting unit exceeds its fair value, an impairment loss will be recognized in an amount equal to such excess, limited to the total amount of goodwill allocated to the reporting unit. If the carrying value of an individual indefinite lived intangible asset exceeds its fair value, such individual indefinite lived intangible asset is written down by an amount equal to such excess. Estimating the fair value of reporting units and indefinite lived intangible assets involves the use of significant assumptions, estimates and judgments with respect to a number of factors, including sales, gross margin, general and administrative expenses, capital expenditures, operating income and cash flows, the selection of an appropriate discount rate, as well as market values and multiples of earnings and revenue of comparable public companies.
To evaluate goodwill in a quantitative impairment test, the fair value of the reporting units is estimated using a combination of Market and Income approaches. The Market approach uses prices and other relevant information generated by market transactions involving identical or comparable assets or liabilities (including a business). In the Market approach, the method focuses on comparing the Company’s risk profile and growth prospects to reasonably similar publicly traded companies. Key assumptions used include multiples for revenues, operating income and operating cash flows, as well as consideration of control premiums. The selected multiples are determined based on public companies within our peer group, and if appropriate, recent comparable transactions are also considered. Control premiums are determined using recent comparable transactions in the open market. Under the Income approach, a discounted cash flow method is used, which includes a terminal value, and is based on management’s forecasts and budgets. The long-term terminal growth rate assumptions reflect our current long-term view of the market in which we compete. Discount rates use the weighted average cost of capital for companies within our peer group, adjusted for specific company risk premium factors.
The Company performed its annual goodwill impairment test during the fourth quarter of fiscal 2024 utilizing a qualitative analysis and concluded it was more likely than not the fair value of our wholesale reporting unit was greater than its respective carrying value and no impairment charge was required. In performing the qualitative assessment, we considered such factors as macroeconomic conditions, industry and market conditions in which we operate including the competitive environment and any significant changes in demand. We also considered our stock price both in absolute terms and in relation to peer companies.
Indefinite-Lived Intangible Assets. We also annually evaluate whether our trade name continues to have an indefinite life. Our trade name is reviewed for impairment annually in the fourth quarter and may be reviewed more frequently if indicators of impairment are present. Conditions that may indicate impairment include, but are not limited to, a significant adverse change in customer demand or business climate that could affect the value of an asset, a product recall or an adverse action or assessment by a regulator. Factors used in the valuation of intangible assets with indefinite lives include, but are not limited to, management’s plans for future operations, recent results of operations and projected future cash flows.
ETHAN ALLEN INTERIORS INC. AND SUBSIDIARIES
Similar to goodwill, we may elect to perform a qualitative assessment. If the qualitative evaluation indicates that it is more likely than not that the fair value of our trade name was less than its carrying value, a quantitative impairment test is required. Alternatively, we may bypass the qualitative assessment for our indefinite lived intangible asset and directly perform a quantitative assessment. To evaluate our trade name using a quantitative analysis, its fair value is calculated using the relief-from-royalty method. Significant factors used in the trade name valuation are rates for royalties, future revenue growth and a discount factor. Royalty rates are determined using an average of recent comparable values, review of the operating margins and consideration of the specific characteristics of the trade name. Future growth rates are based on the Company’s perception of the long-term values in the market in which we compete, and the discount rate is determined using the weighted average cost of capital for companies within our peer group, adjusted for specific company risk premium factors.
We performed our annual indefinite-lived intangible asset impairment test during the fourth quarter of fiscal 2024 utilizing a qualitative analysis and concluded it was more likely than not the fair value of our trade name was greater than its carrying value and no impairment charge was required. Qualitative factors reviewed included a review for significant adverse changes in customer demand or business climate that could affect the value of the asset, a product recall or an adverse action or assessment by a regulator.
Inventories
Inventories (finished goods, work in process and raw materials) are stated at the lower of cost, determined on a first-in, first-out basis, and net realizable value. Cost is determined based solely on those charges incurred in the acquisition and production of the related inventory (i.e. material, labor and manufacturing overhead costs). At June 30, 2024 our inventory reserves totaled $1.8 million, which we estimate for excess quantities and obsolete items based on specific identification and historical write-downs, taking into account future demand and market conditions. Our inventory reserves contain uncertainties that require management to make assumptions and to apply judgment regarding a number of factors, including market conditions, the selling environment, historical results and current inventory trends. We adjust our inventory reserves for net realizable value and obsolescence based on trends, aging reports, specific identification and estimates of future retail sales prices. If actual demand or market conditions change from our prior estimates, we adjust our inventory reserves accordingly throughout the period. We have not made any material changes to our assumptions included in the calculations of the lower of cost or net realizable value reserves during the periods presented.
Income Taxes
We are subject to income taxes in the United States and other foreign jurisdictions. Our tax provision is an estimate based on our understanding of laws in Federal, state and foreign tax jurisdictions. These laws can be complicated and are difficult to apply to any business, including ours. The tax laws also require us to allocate our taxable income to many jurisdictions based on subjective allocation methodologies and information collection processes.
We use the asset and liability method to account for income taxes. We recognize deferred tax assets and liabilities based on the estimated future tax consequences attributable to differences between the financial statement carrying amounts of existing assets and liabilities and their respective tax bases and operating loss and tax credit carryforwards. We measure deferred tax assets and liabilities using enacted tax rates in effect for the year in which we expect to recover or settle those temporary differences. When we record deferred tax assets, we are required to estimate, based on forecasts of taxable earnings in the relevant tax jurisdiction, whether we are more likely than not to recover them. In making judgments about realizing the value of our deferred tax assets, we consider historic and projected future operating results, the eligible carry-forward period, tax law changes and other relevant considerations.
The Company evaluates, on a quarterly basis, uncertain tax positions taken or expected to be taken on tax returns for recognition, measurement, presentation and disclosure in its financial statements. If an income tax position exceeds a 50% probability of success upon tax audit, based solely on the technical merits of the position, the Company recognizes an income tax benefit in its financial statements. The tax benefits recognized are measured based on the largest benefit that has a greater than 50% likelihood of being realized upon ultimate settlement. The liability associated with an unrecognized tax benefit is classified as a long-term liability except for the amount for which a cash payment is expected to be made or tax positions settled within one year.
Business Insurance Reserves
We have insurance programs in place for workers’ compensation and healthcare under certain employee benefit plans provided by the Company. The programs, which are funded through self-insured retention, are subject to stop-loss limitations. We accrue estimated losses using actuarial models and assumptions based on historical loss experience. At June 30, 2024, we recorded a liability of $1.5 million for incurred but not reported healthcare claims and $3.9 million related to workers’ compensation claims. These business insurance reserves are recorded within Accrued compensation and benefits on our consolidated balance sheets. Although we believe that the reserves are adequate, the estimates are based on historical experience, which may not be indicative of current and future losses. In addition, the actuarial calculations used to estimate reserves are based on numerous assumptions, some of which are subjective. We adjust insurance reserves, as needed, in the event that future loss experience differs from historical loss patterns.
ETHAN ALLEN INTERIORS INC. AND SUBSIDIARIES
Significant Accounting Policies
See Note 3, Summary of Significant Accounting Policies, in the notes to our consolidated financial statements included under Part II, Item 8, for a full description of our significant accounting policies.
Recent Accounting Pronouncements
See Note 3, Summary of Significant Accounting Policies, in the notes to our consolidated financial statements included under Part II, Item 8, for a full description of recent accounting pronouncements, including the expected dates of adoption.
ITEM 7A. QUANTITATIVE AND QUALITATIVE DISCLOSURES ABOUT MARKET RISK
In the normal course of business, we are exposed to the following market risks, which could impact our financial position and results of operations.
Interest Rate Risk
Debt
Interest rate risk exists primarily through our borrowing activities. Short-term debt, if required, is used to meet working capital requirements and long-term debt, if required, is generally used to finance long-term investments. There is inherent rollover risk for borrowings as they mature and are renewed at current market rates. The extent of this risk is not quantifiable or predictable because of the variability of future interest rates and our future financing requirements. While we had no fixed or variable rate borrowings outstanding at June 30, 2024, we could be exposed to market risk from changes in risk-free interest rates if we incur variable rate debt in the future as interest expense will fluctuate with changes in the Secured Overnight Financing Rate (“SOFR”). Based on our current and expected levels of exposed liabilities, we estimate that a hypothetical 100 basis point change (up or down) in interest rates based on one-month SOFR would not have a material impact on our results of operations and financial condition.
Cash and Cash Equivalents and Investments
The fair market value of our cash and cash equivalents at June 30, 2024 was $69.7 million while our investments (both current and non-current) totaled $126.1 million. Our cash and cash equivalents consist of demand deposits and money market funds with original maturities of three months or less and are reported at fair value. Our investments consist of U.S. treasuries with maturities ranging up to two years and are reported at fair value based on observable inputs. Our primary objective for holding available-for-sale securities is to achieve appropriate investment returns consistent with preserving principal and managing risk. Pursuant to our established investment policy guidelines, we try to achieve high levels of credit quality, liquidity and diversification. At any time, a sharp rise in market interest rates could have an impact on the fair value of our available-for-sale securities portfolio. Conversely, declines in interest rates, including the impact from lower credit spreads, could have an adverse impact on interest income for our investment portfolio. However, because of our investment policy and the nature of our investments, our financial exposure to fluctuations in interest rates is expected to remain low. We do not believe that the value or liquidity of our cash equivalents and investments have been materially impacted by current market events. Our available-for-sale securities are held for purposes other than trading and are not leveraged at June 30, 2024. We monitor our interest rate and credit risks and believe the overall credit quality of our portfolio is strong. It is anticipated that the fair market value of our cash equivalents and investments will continue to be immaterially affected by fluctuations in interest rates.
Foreign Currency Exchange Risk
Foreign currency exchange risk is primarily limited to our four Company-operated retail design centers located in Canada and our manufacturing plants in Mexico and Honduras, as substantially all purchases of imported parts and finished goods are denominated in U.S. dollars. As such, foreign exchange gains or losses resulting from market changes in the value of foreign currencies have not had, nor are they expected to have, a material effect on our consolidated results of operations. A decrease in the value of foreign currencies relative to the U.S. dollar may affect the profitability of our vendors, but as we employ a balanced sourcing strategy, we believe any impact would be moderate relative to peers in our industry.
The financial statements of our foreign locations are translated into U.S. dollars using period-end rates of exchange for assets and liabilities and average rates for the period for revenues and expenses. Translation gains and losses that arise from translating assets, liabilities, revenues and expenses of foreign operations are recorded in accumulated other comprehensive loss as a component of shareholders’ equity. Foreign exchange gains or losses resulting from market changes in the value of foreign currencies did not have a material impact during any of the fiscal periods presented.
ETHAN ALLEN INTERIORS INC. AND SUBSIDIARIES
A hypothetical 10% weaker United States dollar against all foreign currencies at June 30, 2024 would have had an immaterial impact on our consolidated results of operations and financial condition. We currently do not engage in any foreign currency hedging activity and we have no intention of doing so in the foreseeable future.
Duties and Tariffs Market Risk
We are exposed to market risk with respect to duties and tariffs assessed on raw materials, component parts, and finished goods we import. Additionally, we are exposed to duties and tariffs on our finished goods that we export from our manufacturing plants. As these tariffs and duties increase, we determine whether a price increase to our customers to offset these costs is warranted. To the extent that an increase in these costs would have a material impact on our results of operations, we believe that our competitors would experience a similar impact.
Raw Materials and other Commodity Price Risk
We are exposed to market risk from changes in the cost of raw materials used in our manufacturing processes, principally wood, fabric and foam products. The cost of foam products, which are petroleum-based, is sensitive to changes in the price of oil. We are also exposed to risk with respect to transportation costs, including fuel prices, for delivering our products. As commodity prices and transportation costs rise, we determine whether a price increase to our customers to offset these costs is warranted. To the extent that an increase in these costs would have a material impact on our results of operations, we believe that our competitors would experience a similar impact.
Inflation Risk
Our results of operations and financial condition are presented based on historical cost. We believe any material inflationary impact on our product and operating costs would be partially offset by our ability to increase selling prices, create operational efficiencies and seek lower cost alternatives. During fiscal 2024, a period marked by ongoing high inflation, we have been able to reduce certain manufacturing input costs by identifying lower cost alternatives in raw materials as well as implemented operational efficiencies, including reduced headcount, which have helped to minimize the impact of high inflation.
Commercial Real Estate Market Risk
We have potential exposure to market risk related to conditions in the commercial real estate market. At June 30, 2024, there were 142 Company-operated retail design centers, of which 49 are owned and 93 leased. Our retail real estate holdings could suffer significant impairment in value if we are forced to close design centers and sell or lease the related properties during periods of weakness in certain markets. We are also exposed to risk related to conditions in the commercial real estate rental market with respect to the right-of-use assets we carry on our balance sheet for leased design center and service center locations. At June 30, 2024, the unamortized balance of such right-of-use assets totaled $114.2 million. Should we have to close or otherwise abandon one of these leased locations, we could incur additional impairment charges if rental market conditions do not support a fair value for the right of use asset in excess of its carrying value.
ITEM 8. FINANCIAL STATEMENTS AND SUPPLEMENTARY DATA
Index to Consolidated Financial Statements and Supplementary Data
|
Consolidated Financial Statements
|
Page
|
|
Management’s Report on Internal Control over Financial Reporting
|
37
|
|
Report of Independent Registered Public Accounting Firms
|
38
|
|
Consolidated Balance Sheets at June 30, 2024 and 2023
|
40
|
|
Consolidated Statements of Comprehensive Income for the years ended June 30, 2024, 2023 and 2022
|
41
|
|
Consolidated Statements of Cash Flows for the years ended June 30, 2024, 2023 and 2022
|
42
|
|
Consolidated Statements of Shareholders’ Equity for the years ended June 30, 2024, 2023 and 2022
|
43
|
|
Notes to Consolidated Financial Statements
|
44
|
ETHAN ALLEN INTERIORS INC. AND SUBSIDIARIES
Management’s Report on Internal Control over Financial Reporting
Management's Responsibility for Financial Information
Management is responsible for the consistency, integrity and preparation of the information contained in this Annual Report on Form 10-K. The consolidated financial statements and other information contained in this Annual Report on Form 10-K have been prepared in accordance with GAAP and include amounts based on management’s estimates and judgments. All financial information in this Annual Report on Form 10-K has been presented on a basis consistent with the information included in the accompanying consolidated financial statements.
To fulfill our responsibility, we maintain comprehensive accounting systems, including internal accounting controls, designed to provide reasonable assurance that assets are safeguarded and transactions are executed in accordance with established procedures. The concept of reasonable assurance is based upon recognition that the cost of the controls should not exceed the related benefits. We believe our systems of internal control provide this reasonable assurance.
Our Board of Directors exercised its oversight role with respect to our systems of internal control primarily through its audit committee, which is comprised of independent directors. The committee oversees our systems of internal control, accounting practices, financial reporting and audits to assess whether their quality, integrity, and objectivity are sufficient to protect shareholders' investments.
In addition, our consolidated financial statements as of June 30, 2024 and 2023 and for each of the years in the three-year period ended June 30, 2024, and the related notes, have been audited by CohnReznick LLP, an independent registered public accounting firm, whose report also appears in this Annual Report on Form 10-K.
Management's Report on Internal Control over Financial Reporting
Management is responsible for establishing and maintaining adequate internal control over financial reporting, as such term is defined in Rule 13a-15(f) and Rule 15a-15(f) of the Exchange Act. Our internal control over financial reporting is a process designed to provide reasonable assurance regarding the reliability of financial reporting and the preparation of consolidated financial statements for external purposes in accordance with GAAP.
Our internal control over financial reporting includes those policies and procedures that:
| |
●
|
pertain to the maintenance of records that, in reasonable detail, accurately and fairly reflect the transactions and dispositions of our assets;
|
| |
●
|
provide reasonable assurance that transactions are recorded as necessary to permit preparation of financial statements in accordance with GAAP, and that our receipts and expenditures are being made only in accordance with authorizations of our management and directors; and
|
| |
●
|
provide reasonable assurance regarding prevention or timely detection of unauthorized acquisition, use, or disposition of our assets that could have a material effect on our consolidated financial statements.
|
Because of its inherent limitations, internal control over financial reporting may not prevent or detect misstatements. Also, projections of any evaluation of effectiveness to future periods are subject to the risk that controls may become inadequate because of changes in conditions or that the degree of compliance with the policies or procedures may deteriorate.
Management (with the participation of the Chief Executive Officer and Chief Financial Officer) conducted an evaluation of the effectiveness of our internal control over financial reporting based on the framework in Internal Control – Integrated Framework (2013) issued by the Committee of Sponsoring Organizations of the Treadway Commission. Based on this evaluation, management has concluded that our internal control over financial reporting was effective as of June 30, 2024 to provide reasonable assurance regarding the reliability of financial reporting and the preparation of consolidated financial statements for external reporting purposes in accordance with GAAP. The effectiveness of our internal control over financial reporting as of June 30, 2024 has been audited by CohnReznick LLP, an independent registered public accounting firm, as stated in their report, which is included herein.
ETHAN ALLEN INTERIORS INC. AND SUBSIDIARIES
Report of Independent Registered Public Accounting Firm
Board of Directors and Shareholders
Ethan Allen Interiors Inc.
Opinion on the Consolidated Financial Statements and Internal Control Over Financial Reporting
We have audited the accompanying consolidated balance sheets of Ethan Allen Interiors Inc. and subsidiaries (the “Company”) as of June 30, 2024 and 2023, the related consolidated statements of comprehensive income, shareholders’ equity, and cash flows for each of the years in the three-year period ended June 30, 2024, and the related notes (collectively referred to as the “consolidated financial statements”). We have also audited the Company’s internal control over financial reporting as of June 30, 2024, based on criteria established in Internal Control-Integrated Framework (2013) issued by the Committee of Sponsoring Organizations of the Treadway Commission.
In our opinion, the consolidated financial statements referred to above present fairly, in all material respects, the financial position of the Company as of June 30, 2024 and 2023, and the results of its operations and its cash flows for each of the years in the three-year period ended June 30, 2024, in conformity with accounting principles generally accepted in the United States of America. Also in our opinion, the Company maintained, in all material respects, effective internal control over financial reporting as of June 30, 2024, based on criteria established in Internal Control-Integrated Framework (2013) issued by the Committee of Sponsoring Organizations of the Treadway Commission.
Basis for Opinions
The Company’s management is responsible for these consolidated financial statements, for maintaining effective internal control over financial reporting, and for its assessment of the effectiveness of internal control over financial reporting, included in the accompanying Management’s Report on Internal Control over Financial Reporting. Our responsibility is to express an opinion on the Company’s consolidated financial statements and an opinion on the Company’s internal control over financial reporting based on our audits. We are a public accounting firm registered with the Public Company Accounting Oversight Board (United States) (“PCAOB”) and are required to be independent with respect to the Company in accordance with the U.S. federal securities laws and the applicable rules and regulations of the Securities and Exchange Commission and the PCAOB.
We conducted our audits in accordance with the standards of the PCAOB. Those standards require that we plan and perform the audits to obtain reasonable assurance about whether the consolidated financial statements are free of material misstatement, whether due to error or fraud, and whether effective internal control over financial reporting was maintained in all material respects.
Our audits of the consolidated financial statements included performing procedures to assess the risks of material misstatement of the consolidated financial statements, whether due to error or fraud, and performing procedures that responds to those risks. Such procedures included examining, on a test basis, evidence regarding the amounts and disclosures in the consolidated financial statements. Our audits also included evaluating the accounting principles used and significant estimates made by management, as well as evaluating the overall presentation of the consolidated financial statements. Our audit of internal control over financial reporting included obtaining an understanding of internal control over financial reporting, assessing the risk that a material weakness exists, and testing and evaluating the design and operating effectiveness of internal control based on the assessed risk. Our audits also included performing such other procedures as we considered necessary in the circumstances. We believe that our audits provide a reasonable basis for our opinions.
Definition and Limitations of Internal Control Over Financial Reporting
An entity’s internal control over financial reporting is a process designed to provide reasonable assurance regarding the reliability of financial reporting and the preparation of consolidated financial statements for external purposes in accordance with accounting principles generally accepted in the United States of America. An entity’s internal control over financial reporting includes those policies and procedures that (1) pertain to the maintenance of records that, in reasonable detail, accurately and fairly reflect the transactions and dispositions of the assets of the entity; (2) provide reasonable assurance that transactions are recorded as necessary to permit preparation of consolidated financial statements in accordance with accounting principles generally accepted in the United States of America, and that receipts and expenditures of the entity are being made only in accordance with authorizations of management and directors of the entity; and (3) provide reasonable assurance regarding prevention or timely detection of unauthorized acquisition, use, or disposition of the entity’s assets that could have a material effect on the consolidated financial statements.
ETHAN ALLEN INTERIORS INC. AND SUBSIDIARIES
Because of its inherent limitations, internal control over financial reporting may not prevent or detect misstatements. Also, projections of any evaluation of effectiveness to future periods are subject to the risk that controls may become inadequate because of changes in conditions, or that the degree of compliance with the policies or procedures may deteriorate.
Critical Audit Matter
The critical audit matter communicated below is a matter arising from the current period audit of the consolidated financial statements that was communicated or required to be communicated to the audit committee and that: (1) relates to accounts or disclosures that are material to the consolidated financial statements and (2) involved our especially challenging, subjective, or complex judgments. The communication of critical audit matters does not alter in any way our opinion on the consolidated financial statements, taken as a whole, and we are not, by communicating the critical audit matter below, providing a separate opinion on the critical audit matter or on the accounts or disclosures to which it relates.
Assessment of impairment of retail design center long-lived assets, including right-of-use lease assets (Note 3 to the Consolidated Financial Statements)
The Company reviews the carrying value of retail design center long-lived assets, which includes the right-of-use lease assets, for impairment whenever events or changes in circumstances indicate that the carrying amounts of these assets may not be recoverable. If the sum of the estimated undiscounted future cash flows related to the asset is less than the carrying value, the Company recognizes a loss equal to the difference between the carrying value and the fair value. As discussed in Note 3 to the consolidated financial statements, as of June 30, 2024, Property, plant and equipment, net, was $215.3 million and the Operating lease right-of-use assets were $114.2 million. During the year ended June 30, 2024, the Company did not recognize any impairment charges.
We identified the assessment of impairment of the retail design center long-lived assets, including right-of-use lease assets, as a critical audit matter given the complexity of management’s judgments relating to the assessment of impairment indicators, including recurring negative cash flows. Given these factors, the related audit effort in evaluating management's judgments in assessing impairment indicators was complex, subjective, and challenging, and required a high degree of auditor judgment.
How our Audit Addressed the Critical Audit Matter
Our principal audit procedures related to this critical audit matter included the following:
| |
●
|
We evaluated the design and tested the operating effectiveness of internal controls pertaining to the retail design center impairment analysis, inclusive of those controls pertaining to the identification of triggering events.
|
| |
●
|
We evaluated management’s significant accounting policies related to the consideration of impairment for long-lived assets for reasonableness.
|
| |
●
|
We tested the reasonableness of the underlying data used to determine if triggering events were identified.
|
| |
●
|
We evaluated the reasonableness of management’s conclusion that no impairment charges were appropriate during the year.
|
We have served as the Company’s auditor since 2022.
/s/ CohnReznick LLP
New York, New York
August 23, 2024
ETHAN ALLEN INTERIORS INC. AND SUBSIDIARIES
CONSOLIDATED BALANCE SHEETS
(In thousands, except par value)
| |
|
June 30,
|
|
| |
|
2024
|
|
|
2023
|
|
|
ASSETS
|
|
|
|
|
|
|
|
|
|
Current assets:
|
|
|
|
|
|
|
|
|
|
Cash and cash equivalents
|
|
$ |
69,710 |
|
|
$ |
62,130 |
|
|
Investments, short-term
|
|
|
91,319 |
|
|
|
110,577 |
|
|
Accounts receivable, net
|
|
|
6,766 |
|
|
|
11,577 |
|
|
Inventories, net
|
|
|
142,040 |
|
|
|
149,195 |
|
|
Prepaid expenses and other current assets
|
|
|
22,848 |
|
|
|
25,974 |
|
|
Total current assets
|
|
|
332,683 |
|
|
|
359,453 |
|
| |
|
|
|
|
|
|
|
|
|
Property, plant and equipment, net
|
|
|
215,258 |
|
|
|
222,167 |
|
|
Goodwill
|
|
|
25,388 |
|
|
|
25,388 |
|
|
Intangible assets
|
|
|
19,740 |
|
|
|
19,740 |
|
|
Operating lease right-of-use assets
|
|
|
114,242 |
|
|
|
115,861 |
|
|
Deferred income taxes
|
|
|
824 |
|
|
|
640 |
|
|
Investments, long-term
|
|
|
34,772 |
|
|
|
- |
|
|
Other assets
|
|
|
2,010 |
|
|
|
2,204 |
|
|
TOTAL ASSETS
|
|
$ |
744,917 |
|
|
$ |
745,453 |
|
| |
|
|
|
|
|
|
|
|
|
LIABILITIES
|
|
|
|
|
|
|
|
|
|
Current liabilities:
|
|
|
|
|
|
|
|
|
|
Accounts payable and accrued expenses
|
|
$ |
27,400 |
|
|
$ |
28,565 |
|
|
Customer deposits
|
|
|
73,471 |
|
|
|
77,765 |
|
|
Accrued compensation and benefits
|
|
|
20,702 |
|
|
|
23,534 |
|
|
Current operating lease liabilities
|
|
|
27,387 |
|
|
|
26,045 |
|
|
Other current liabilities
|
|
|
4,736 |
|
|
|
7,188 |
|
|
Total current liabilities
|
|
|
153,696 |
|
|
|
163,097 |
|
|
Operating lease liabilities, long-term
|
|
|
100,897 |
|
|
|
104,301 |
|
|
Deferred income taxes
|
|
|
3,035 |
|
|
|
3,056 |
|
|
Other long-term liabilities
|
|
|
4,373 |
|
|
|
3,993 |
|
|
TOTAL LIABILITIES
|
|
$ |
262,001 |
|
|
$ |
274,447 |
|
| |
|
|
|
|
|
|
|
|
|
Commitments and contingencies (See Note 21)
|
|
|
|
|
|
|
|
|
| |
|
|
|
|
|
|
|
|
|
SHAREHOLDERS' EQUITY
|
|
|
|
|
|
|
|
|
|
Preferred stock, $0.01 par value; 1,055 shares authorized; none issued
|
|
$ |
- |
|
|
$ |
- |
|
|
Common stock, $0.01 par value; 150,000 shares authorized; 49,550 and 49,426 shares issued; 25,412 and 25,356 shares outstanding at June 30, 2024 and 2023, respectively
|
|
|
495 |
|
|
|
494 |
|
|
Additional paid-in-capital
|
|
|
388,104 |
|
|
|
386,146 |
|
|
Treasury stock, at cost: 24,138 and 24,070 shares at June 30, 2024 and 2023, respectively
|
|
|
(684,796 |
) |
|
|
(682,646 |
) |
|
Retained earnings
|
|
|
783,366 |
|
|
|
769,819 |
|
|
Accumulated other comprehensive loss
|
|
|
(4,189 |
) |
|
|
(2,785 |
) |
|
Total Ethan Allen Interiors Inc. shareholders' equity
|
|
|
482,980 |
|
|
|
471,028 |
|
|
Noncontrolling interests
|
|
|
(64 |
) |
|
|
(22 |
) |
|
TOTAL SHAREHOLDERS' EQUITY
|
|
|
482,916 |
|
|
|
471,006 |
|
|
TOTAL LIABILITIES AND SHAREHOLDERS' EQUITY
|
|
$ |
744,917 |
|
|
$ |
745,453 |
|
See accompanying notes to consolidated financial statements.
ETHAN ALLEN INTERIORS INC. AND SUBSIDIARIES
CONSOLIDATED STATEMENTS OF COMPREHENSIVE INCOME
(In thousands, except share data)
| |
|
Fiscal Year Ended June 30,
|
|
| |
|
2024
|
|
|
2023
|
|
|
2022
|
|
|
Net sales
|
|
$ |
646,221 |
|
|
$ |
791,382 |
|
|
$ |
817,762 |
|
|
Cost of sales
|
|
|
253,159 |
|
|
|
311,012 |
|
|
|
333,056 |
|
|
Gross profit
|
|
|
393,062 |
|
|
|
480,370 |
|
|
|
484,706 |
|
| |
|
|
|
|
|
|
|
|
|
|
|
|
|
Selling, general and administrative expenses
|
|
|
315,148 |
|
|
|
346,894 |
|
|
|
350,917 |
|
|
Restructuring and other charges, net of gains
|
|
|
(77 |
) |
|
|
(3,720 |
) |
|
|
(4,461 |
) |
|
Operating income
|
|
|
77,991 |
|
|
|
137,196 |
|
|
|
138,250 |
|
| |
|
|
|
|
|
|
|
|
|
|
|
|
|
Interest and other income, net
|
|
|
7,700 |
|
|
|
4,042 |
|
|
|
72 |
|
|
Interest and other financing costs
|
|
|
245 |
|
|
|
213 |
|
|
|
201 |
|
|
Income before income taxes
|
|
|
85,446 |
|
|
|
141,025 |
|
|
|
138,121 |
|
| |
|
|
|
|
|
|
|
|
|
|
|
|
|
Income tax expense
|
|
|
21,630 |
|
|
|
35,218 |
|
|
|
34,841 |
|
|
Net income
|
|
$ |
63,816 |
|
|
$ |
105,807 |
|
|
$ |
103,280 |
|
| |
|
|
|
|
|
|
|
|
|
|
|
|
|
Per share data
|
|
|
|
|
|
|
|
|
|
|
|
|
|
Basic earnings per common share:
|
|
|
|
|
|
|
|
|
|
|
|
|
|
Net income per basic share
|
|
$ |
2.50 |
|
|
$ |
4.15 |
|
|
$ |
4.06 |
|
|
Basic weighted average common shares
|
|
|
25,525 |
|
|
|
25,473 |
|
|
|
25,413 |
|
| |
|
|
|
|
|
|
|
|
|
|
|
|
|
Diluted earnings per common share:
|
|
|
|
|
|
|
|
|
|
|
|
|
|
Net income per diluted share
|
|
$ |
2.49 |
|
|
$ |
4.13 |
|
|
$ |
4.05 |
|
|
Diluted weighted average common shares
|
|
|
25,644 |
|
|
|
25,604 |
|
|
|
25,522 |
|
| |
|
|
|
|
|
|
|
|
|
|
|
|
|
Comprehensive income
|
|
|
|
|
|
|
|
|
|
|
|
|
|
Net income
|
|
$ |
63,816 |
|
|
$ |
105,807 |
|
|
$ |
103,280 |
|
|
Other comprehensive (loss) income, net of tax
|
|
|
|
|
|
|
|
|
|
|
|
|
|
Foreign currency translation adjustments
|
|
|
(1,866 |
) |
|
|
3,178 |
|
|
|
(466 |
) |
|
Other
|
|
|
420 |
|
|
|
503 |
|
|
|
(66 |
) |
|
Other comprehensive (loss) income, net of tax
|
|
|
(1,446 |
) |
|
|
3,681 |
|
|
|
(532 |
) |
|
Comprehensive income
|
|
$ |
62,370 |
|
|
$ |
109,488 |
|
|
$ |
102,748 |
|
See accompanying notes to consolidated financial statements.
ETHAN ALLEN INTERIORS INC. AND SUBSIDIARIES
CONSOLIDATED STATEMENTS OF CASH FLOWS
(In thousands)
| |
|
Fiscal Year Ended June 30,
|
|
| |
|
2024
|
|
|
2023
|
|
|
2022
|
|
|
Cash Flows from Operating Activities
|
|
|
|
|
|
|
|
|
|
|
|
|
|
Net income
|
|
$ |
63,816 |
|
|
$ |
105,807 |
|
|
$ |
103,280 |
|
|
Adjustments to reconcile net income to net cash provided by operating activities:
|
|
|
|
|
|
|
|
|
|
|
|
|
|
Depreciation and amortization
|
|
|
15,956 |
|
|
|
15,614 |
|
|
|
15,987 |
|
|
Share-based compensation expense
|
|
|
1,450 |
|
|
|
1,288 |
|
|
|
1,139 |
|
|
Non-cash operating lease cost
|
|
|
31,959 |
|
|
|
30,235 |
|
|
|
30,261 |
|
|
Deferred income taxes
|
|
|
(205 |
) |
|
|
(1,182 |
) |
|
|
(352 |
) |
|
Restructuring and other charges, net of gains
|
|
|
(77 |
) |
|
|
(3,720 |
) |
|
|
(4,461 |
) |
|
Payments on restructuring and other charges, net of proceeds
|
|
|
(1,019 |
) |
|
|
(1,045 |
) |
|
|
(1,556 |
) |
|
Loss on disposal of property, plant and equipment
|
|
|
76 |
|
|
|
43 |
|
|
|
44 |
|
|
Other
|
|
|
(115 |
) |
|
|
455 |
|
|
|
70 |
|
|
Changes in operating assets and liabilities:
|
|
|
|
|
|
|
|
|
|
|
|
|
|
Accounts receivable, net
|
|
|
4,811 |
|
|
|
5,442 |
|
|
|
(7,993 |
) |
|
Inventories, net
|
|
|
6,194 |
|
|
|
27,309 |
|
|
|
(32,526 |
) |
|
Prepaid expenses and other current assets
|
|
|
(869 |
) |
|
|
5,570 |
|
|
|
6,659 |
|
|
Customer deposits
|
|
|
(4,294 |
) |
|
|
(43,315 |
) |
|
|
(9,555 |
) |
|
Accounts payable and accrued expenses
|
|
|
(1,732 |
) |
|
|
(8,787 |
) |
|
|
123 |
|
|
Accrued compensation and benefits
|
|
|
(2,833 |
) |
|
|
948 |
|
|
|
(1,053 |
) |
|
Operating lease liabilities
|
|
|
(32,981 |
) |
|
|
(31,013 |
) |
|
|
(33,588 |
) |
|
Other assets and liabilities
|
|
|
58 |
|
|
|
(2,985 |
) |
|
|
2,877 |
|
|
Net cash provided by operating activities
|
|
|
80,195 |
|
|
|
100,664 |
|
|
|
69,356 |
|
| |
|
|
|
|
|
|
|
|
|
|
|
|
|
Cash Flows from Investing Activities
|
|
|
|
|
|
|
|
|
|
|
|
|
|
Proceeds from sales of property, plant and equipment
|
|
|
49 |
|
|
|
9,914 |
|
|
|
10,613 |
|
|
Capital expenditures
|
|
|
(9,606 |
) |
|
|
(13,885 |
) |
|
|
(13,387 |
) |
|
Purchases of investments
|
|
|
(134,911 |
) |
|
|
(234,949 |
) |
|
|
(63,861 |
) |
|
Proceeds from sales of investments
|
|
|
124,477 |
|
|
|
137,397 |
|
|
|
52,664 |
|
|
Net cash used in investing activities
|
|
|
(19,991 |
) |
|
|
(101,523 |
) |
|
|
(13,971 |
) |
| |
|
|
|
|
|
|
|
|
|
|
|
|
|
Cash Flows from Financing Activities
|
|
|
|
|
|
|
|
|
|
|
|
|
|
Payment of cash dividends
|
|
|
(50,269 |
) |
|
|
(46,357 |
) |
|
|
(48,257 |
) |
|
Payment for debt issuance costs
|
|
|
- |
|
|
|
- |
|
|
|
(505 |
) |
|
Proceeds from employee stock plans
|
|
|
509 |
|
|
|
75 |
|
|
|
1,117 |
|
|
Taxes paid related to net share settlement of equity awards
|
|
|
(2,150 |
) |
|
|
(812 |
) |
|
|
(843 |
) |
|
Payments on financing leases and other
|
|
|
(421 |
) |
|
|
(497 |
) |
|
|
(512 |
) |
|
Net cash used in financing activities
|
|
|
(52,331 |
) |
|
|
(47,591 |
) |
|
|
(49,000 |
) |
| |
|
|
|
|
|
|
|
|
|
|
|
|
|
Effect of exchange rate changes on cash and cash equivalents
|
|
|
(279 |
) |
|
|
201 |
|
|
|
(110 |
) |
|
Net increase (decrease) in cash, cash equivalents and restricted cash
|
|
|
7,594 |
|
|
|
(48,249 |
) |
|
|
6,275 |
|
|
Cash, cash equivalents and restricted cash at beginning of period
|
|
|
62,622 |
|
|
|
110,871 |
|
|
|
104,596 |
|
|
Cash, cash equivalents and restricted cash at end of period
|
|
$ |
70,216 |
|
|
$ |
62,622 |
|
|
$ |
110,871 |
|
| |
|
|
|
|
|
|
|
|
|
|
|
|
|
Supplemental Disclosure on Cash Flow Information
|
|
|
|
|
|
|
|
|
|
|
|
|
|
Cash paid during the year for income taxes, net of refunds
|
|
$ |
19,947 |
|
|
$ |
41,933 |
|
|
$ |
28,795 |
|
|
Cash paid during the year for interest
|
|
$ |
58 |
|
|
$ |
31 |
|
|
$ |
25 |
|
See accompanying notes to consolidated financial statements.
ETHAN ALLEN INTERIORS INC. AND SUBSIDIARIES
CONSOLIDATED STATEMENTS OF SHAREHOLDERS' EQUITY
(In thousands)
| |
|
|
|
|
|
|
|
|
|
|
|
|
|
|
|
|
|
|
|
|
|
Accumulated
|
|
|
|
|
|
|
|
|
|
|
|
|
|
| |
|
|
|
|
|
|
|
|
|
Additional
|
|
|
|
|
|
|
|
|
|
|
Other
|
|
|
|
|
|
|
Non-
|
|
|
|
|
|
| |
|
Common Stock
|
|
|
Paid-in
|
|
|
Treasury Stock
|
|
|
Comprehensive
|
|
|
Retained
|
|
|
Controlling
|
|
|
Total
|
|
| |
|
Shares
|
|
|
Par Value
|
|
|
Capital
|
|
|
Shares
|
|
|
Amount
|
|
|
Loss
|
|
|
Earnings
|
|
|
Interests
|
|
|
Equity
|
|
|
Balance at June 30, 2021
|
|
|
49,240 |
|
|
$ |
492 |
|
|
$ |
382,527 |
|
|
|
24,003 |
|
|
$ |
(680,991 |
) |
|
$ |
(5,931 |
) |
|
$ |
655,346 |
|
|
$ |
(25 |
) |
|
$ |
351,418 |
|
|
Net income
|
|
|
- |
|
|
|
- |
|
|
|
- |
|
|
|
- |
|
|
|
- |
|
|
|
- |
|
|
|
103,280 |
|
|
|
- |
|
|
|
103,280 |
|
|
Common stock issued on share-based awards
|
|
|
55 |
|
|
|
1 |
|
|
|
1,116 |
|
|
|
- |
|
|
|
- |
|
|
|
- |
|
|
|
- |
|
|
|
- |
|
|
|
1,117 |
|
|
Share-based compensation expense
|
|
|
- |
|
|
|
- |
|
|
|
1,139 |
|
|
|
- |
|
|
|
- |
|
|
|
- |
|
|
|
- |
|
|
|
- |
|
|
|
1,139 |
|
|
Restricted stock unit vesting
|
|
|
65 |
|
|
|
1 |
|
|
|
- |
|
|
|
34 |
|
|
|
(843 |
) |
|
|
- |
|
|
|
- |
|
|
|
- |
|
|
|
(842 |
) |
|
Cash dividends declared
|
|
|
- |
|
|
|
- |
|
|
|
- |
|
|
|
- |
|
|
|
- |
|
|
|
- |
|
|
|
(48,257 |
) |
|
|
- |
|
|
|
(48,257 |
) |
|
Other comprehensive (loss) income
|
|
|
- |
|
|
|
- |
|
|
|
- |
|
|
|
- |
|
|
|
- |
|
|
|
(531 |
) |
|
|
- |
|
|
|
(1 |
) |
|
|
(532 |
) |
|
Balance at June 30, 2022
|
|
|
49,360 |
|
|
$ |
494 |
|
|
$ |
384,782 |
|
|
|
24,037 |
|
|
$ |
(681,834 |
) |
|
$ |
(6,462 |
) |
|
$ |
710,369 |
|
|
$ |
(26 |
) |
|
$ |
407,323 |
|
|
Net income
|
|
|
- |
|
|
|
- |
|
|
|
- |
|
|
|
- |
|
|
|
- |
|
|
|
- |
|
|
|
105,807 |
|
|
|
- |
|
|
|
105,807 |
|
|
Common stock issued on share-based awards
|
|
|
2 |
|
|
|
- |
|
|
|
75 |
|
|
|
- |
|
|
|
- |
|
|
|
- |
|
|
|
- |
|
|
|
- |
|
|
|
75 |
|
|
Share-based compensation expense
|
|
|
- |
|
|
|
- |
|
|
|
1,288 |
|
|
|
- |
|
|
|
- |
|
|
|
- |
|
|
|
- |
|
|
|
- |
|
|
|
1,288 |
|
|
Restricted stock unit vesting
|
|
|
64 |
|
|
|
- |
|
|
|
1 |
|
|
|
33 |
|
|
|
(812 |
) |
|
|
- |
|
|
|
- |
|
|
|
- |
|
|
|
(811 |
) |
|
Cash dividends declared
|
|
|
- |
|
|
|
- |
|
|
|
- |
|
|
|
- |
|
|
|
- |
|
|
|
- |
|
|
|
(46,357 |
) |
|
|
- |
|
|
|
(46,357 |
) |
|
Other comprehensive (loss) income
|
|
|
- |
|
|
|
- |
|
|
|
- |
|
|
|
- |
|
|
|
- |
|
|
|
3,677 |
|
|
|
- |
|
|
|
4 |
|
|
|
3,681 |
|
|
Balance at June 30, 2023
|
|
|
49,426 |
|
|
$ |
494 |
|
|
$ |
386,146 |
|
|
|
24,070 |
|
|
$ |
(682,646 |
) |
|
$ |
(2,785 |
) |
|
$ |
769,819 |
|
|
$ |
(22 |
) |
|
$ |
471,006 |
|
|
Net income
|
|
|
- |
|
|
|
- |
|
|
|
- |
|
|
|
- |
|
|
|
- |
|
|
|
- |
|
|
|
63,816 |
|
|
|
- |
|
|
|
63,816 |
|
|
Common stock issued on share-based awards
|
|
|
20 |
|
|
|
- |
|
|
|
508 |
|
|
|
- |
|
|
|
- |
|
|
|
- |
|
|
|
- |
|
|
|
- |
|
|
|
508 |
|
|
Share-based compensation expense
|
|
|
- |
|
|
|
- |
|
|
|
1,450 |
|
|
|
- |
|
|
|
- |
|
|
|
- |
|
|
|
- |
|
|
|
- |
|
|
|
1,450 |
|
|
Restricted stock unit vesting
|
|
|
104 |
|
|
|
1 |
|
|
|
- |
|
|
|
68 |
|
|
|
(2,150 |
) |
|
|
- |
|
|
|
- |
|
|
|
- |
|
|
|
(2,149 |
) |
|
Cash dividends declared
|
|
|
- |
|
|
|
- |
|
|
|
- |
|
|
|
- |
|
|
|
- |
|
|
|
- |
|
|
|
(50,269 |
) |
|
|
- |
|
|
|
(50,269 |
) |
|
Other comprehensive (loss) income
|
|
|
- |
|
|
|
- |
|
|
|
- |
|
|
|
- |
|
|
|
- |
|
|
|
(1,404 |
) |
|
|
- |
|
|
|
(42 |
) |
|
|
(1,446 |
) |
|
Balance at June 30, 2024
|
|
|
49,550 |
|
|
$ |
495 |
|
|
$ |
388,104 |
|
|
|
24,138 |
|
|
$ |
(684,796 |
) |
|
$ |
(4,189 |
) |
|
$ |
783,366 |
|
|
$ |
(64 |
) |
|
$ |
482,916 |
|
See accompanying notes to consolidated financial statements.
ETHAN ALLEN INTERIORS INC. AND SUBSIDIARIES
NOTES TO CONSOLIDATED FINANCIAL STATEMENTS
|
(1)
|
Organization and Nature of Business
|
Organization
Ethan Allen Interiors Inc., through its wholly-owned subsidiary, Ethan Allen Global, Inc., and Ethan Allen Global, Inc.’s subsidiaries (collectively, “we,” “us,” “our,” “Ethan Allen” or the “Company”), is a Delaware Corporation and leading interior design company, manufacturer and retailer in the home furnishings marketplace.
Nature of Business
We are a global luxury home fashion brand that is vertically integrated from product design through home delivery, which offers our customers stylish product offerings, artisanal quality and personalized service. We are known for the quality and craftsmanship of our products as well as for the exceptional personal service from design to delivery. We provide complimentary interior design service to our clients and sell a full range of home furnishings through a retail network of design centers located throughout the United States and abroad as well as online at ethanallen.com.
Ethan Allen design centers represent a mix of locations operated by independent licensees and Company-operated locations. At June 30, 2024, there were 142 Company-operated retail design centers with 138 located in the United States and four in Canada. We also have 45 independently owned and operated Ethan Allen design centers located in the United States, Asia, the Middle East and Europe.
We manufacture approximately 75% of our furniture in our North American manufacturing plants and have been recognized for product quality and craftsmanship since 1932. At June 30, 2024, we own and operate ten manufacturing facilities, including four manufacturing plants, one sawmill, one rough mill and one kiln dry lumberyard in the United States, two manufacturing plants in Mexico and one manufacturing plant in Honduras. We also partner with various suppliers located in Europe, Asia, and other countries to import products that support our business.
|
(2)
|
Basis of Presentation
|
Principles of Consolidation
The accompanying consolidated financial statements include the accounts of the Company and its wholly-owned subsidiaries. Our consolidated financial statements also include the accounts of an entity in which we are a majority shareholder with the power to direct the activities that most significantly impact the entity’s performance. Noncontrolling interest amounts in the entity are immaterial and included in the consolidated statements of comprehensive income within Interest and other income, net. All intercompany activity and balances, including any related profit on intercompany sales, have been eliminated from the consolidated financial statements.
Use of Estimates
We prepare our consolidated financial statements in accordance with U.S. GAAP, which requires management to make estimates and assumptions that affect the reported amounts of assets and liabilities and disclosure of contingent assets and liabilities at the date of the consolidated financial statements and the reported amounts of net sales and expenses during the reporting period. Due to the inherent uncertainty involved in making those estimates, actual results could differ from those estimates. Areas in which significant estimates have been made include, but are not limited to, goodwill and indefinite-lived intangible asset impairment analyses, recoverability and useful lives for property, plant and equipment, inventory obsolescence, tax valuation allowances, the evaluation of uncertain tax positions and business insurance reserves.
|
(3)
|
Summary of Significant Accounting Policies
|
Our significant accounting policies are summarized below.
Cash and Cash Equivalents
Cash and short-term, highly liquid investments with original maturities of three months or less are considered cash and cash equivalents and are reported at fair value. Our corporate money market funds are readily convertible into cash and the net asset value of each fund on the last day of the month is used to determine its fair value. We maintain our cash and cash equivalent accounts in various financial institutions and as such, perform ongoing evaluations of these institutions to limit our concentration of credit risk.
ETHAN ALLEN INTERIORS INC. AND SUBSIDIARIES
Restricted Cash
We present restricted cash as a component of total cash and cash equivalents on our consolidated statements of cash flows and within Other assets on our consolidated balance sheets. At both June 30, 2024 and 2023, we held $0.5 million of restricted cash related to the Ethan Allen insurance captive.
Investments
Our investments at June 30, 2024 consist solely of United States Treasury bills and notes with maturities of two years or less. We classify our investments as available-for-sale debt investments and are held in the custody of major financial institutions. These short-term and long-term investments are recorded in our consolidated balance sheets at fair value. The fair value of our underlying investments is based on observable inputs and classified as Level 2. Unrealized gains and losses on these investments are included, net of tax, as a separate component of Accumulated other comprehensive loss. There were no material gross unrealized gains or losses on the investments at June 30, 2024 or 2023.
Accounts Receivable
Accounts receivable arise from the sale of products on trade credit terms and is presented net of allowance for credit losses. The allowance for credit losses is based on a review of specifically identified accounts in addition to an overall aging analysis. On a monthly basis, we review all accounts as to their past due balances, as well as collectability of the outstanding trade accounts receivable for possible write-off. It is our policy to write-off accounts receivable against the allowance account when we deem the receivable to be uncollectible. Additionally, we ship product only when our ability to collect payment from our customer is deemed probable. At June 30, 2024 and 2023, the allowance for credit losses was immaterial.
Inventories
Inventories are stated at the lower of cost (on first-in, first-out basis) or net realizable value. Cost is determined based solely on those charges incurred in the acquisition and production of the related inventory (i.e., material, labor and manufacturing overhead costs). We estimate inventory reserves for excess quantities and obsolete items based on specific identification and historical write-offs, taking into account future demand and market conditions. If actual demand or market conditions in the future are less favorable than those estimated, additional inventory write-downs may be required. At June 30, 2024 and 2023, our inventory reserves were $1.8 million and $1.9 million, respectively.
Property, Plant and Equipment
Property, plant and equipment are stated at cost, less accumulated depreciation and amortization. Depreciation of property, plant and equipment is provided over the estimated useful lives of the respective assets on a straight-line basis. Estimated useful lives of the respective assets typically range from 20-40 years for buildings and improvements and from three to twenty years for machinery and equipment. Information systems, computer hardware and software, which are included within the machinery and equipment category, are typically depreciated from three to five years. Leasehold improvements are amortized over the shorter of the underlying lease term or the estimated useful life. Repairs and maintenance expenditures, which are not considered leasehold improvements and do not extend the useful life of the property and equipment, are expensed as incurred.
Retirement, sales or dispositions of long-lived assets are recorded based on carrying value and proceeds received. Any resulting gains or losses are recorded as a component of operating expenses.
Property, plant and equipment is reviewed for impairment whenever events or changes in circumstances indicate that the carrying amount of assets may not be recoverable. For further discussion regarding impairments refer to the Impairment of Long-Lived Assets accounting policy below.
Assets Held for Sale
An asset is considered to be held for sale when all of the following criteria are met: (i) management commits to a plan to sell the property; (ii) it is unlikely that the disposal plan will be significantly modified or discontinued; (iii) the property is available for immediate sale in its present condition; (iv) actions required to complete the sale of the property have been initiated; (v) sale of the asset is probable and the completed sale is expected to occur within one year; and (vi) the property is actively being marketed for sale at a price that is reasonable given its current market value.
Upon designation as an asset held for sale, the carrying value of the asset is recorded at the lower of its carrying value or its estimated fair value less estimated costs to sell, and the Company ceases depreciating the asset. As of June 30, 2024 and 2023, we did not have any assets held for sale.
ETHAN ALLEN INTERIORS INC. AND SUBSIDIARIES
Impairment of Long-Lived Assets
We review the carrying value of our long-lived assets, which includes our right-of-use lease assets, for impairment whenever events or changes in circumstances indicate that their carrying amounts may not be recoverable. Our assessment of recoverability is based on our best estimates using either quoted market prices or an analysis of the undiscounted projected future cash flows by asset group in order to determine if there is any indicator of impairment requiring us to further assess the fair value of our long-lived assets. If the sum of the estimated undiscounted future cash flows related to the asset is less than the carrying value, we recognize a loss equal to the difference between the carrying value and the fair value, usually determined by the estimated discounted cash flow analysis of the assets. Our asset groups consist of our operating segments within our wholesale reportable segment, each of our retail design centers and other corporate assets. The asset group is defined as the lowest level for which identifiable cash flows are available and largely independent of the cash flows of other groups of assets, which for our retail segment is the individual retail design center and for our wholesale segment is the manufacturing plant level. We estimate future cash flows based on design center-level historical results, current trends, third-party appraisals and operating and cash flow projections. Our estimates are subject to uncertainty and may be affected by a number of factors outside our control, including general economic conditions and the competitive environment. While we believe our estimates and judgments about future cash flows are reasonable, future impairment charges may be required if the expected cash flow estimates, as projected, do not occur or if events change requiring us to revise our estimates. Refer to Note 11, Restructuring and other charges, net of gains, for further disclosure on long-lived asset impairments.
Goodwill and Indefinite-Lived Intangible Assets
Our goodwill and intangible assets are comprised primarily of goodwill, which represents the excess of cost over the fair value of net assets acquired, and our Ethan Allen trade name and related trademarks. Both goodwill and indefinite-lived intangible assets are assigned to our wholesale reporting unit, which is principally involved in the development of the Ethan Allen brand and encompasses all aspects of design, manufacturing, sourcing, marketing, sale and distribution of the Company’s broad range of home furnishings and accents, and are not amortized as they are estimated to have an indefinite life.
We are required to test goodwill and indefinite-lived intangibles for potential impairment annually, or more frequently if impairment indicators occur. Goodwill and indefinite-lived intangible assets are evaluated for impairment on an annual basis during the fourth quarter of each fiscal year, and between annual tests whenever events or circumstances indicate that the carrying value of the goodwill or other intangible asset may exceed its fair value.
Goodwill. When testing goodwill for impairment, we may elect to perform a qualitative analysis to determine whether it is more likely than not the fair value of the reporting unit is greater than its carrying value. In performing a qualitative assessment, we consider such factors as macro-economic conditions, industry and market conditions in which we operate including the competitive environment and significant changes in demand. We also consider our stock price both in absolute terms and in relation to peer companies. If the qualitative analysis indicates that it is more likely than not the fair value of our wholesale reporting unit is less than its carrying amount or if we elect not to perform a qualitative analysis, a quantitative analysis is performed to determine whether a goodwill impairment exists. The quantitative goodwill impairment analysis is used to identify potential impairment by comparing fair value of a reporting unit with its carrying amount using an income approach, along with other relevant market information, derived from a discounted cash flow model to estimate fair value of our reporting units. We performed our annual goodwill impairment test during the fourth quarter of fiscal 2024 using a qualitative analysis and concluded it was more likely than not the fair value of our wholesale reporting unit was greater than its respective carrying value and no impairment charge was required.
Indefinite-Lived Intangible Assets (trade name). The fair value of our trade name, which is the Company’s only indefinite-lived intangible asset other than goodwill, is assessed annually in the fourth quarter and may be reviewed more frequently if indicators of impairment are present. Conditions that may indicate impairment include, but are not limited to, a significant adverse change in customer demand or business climate that could affect the value of an asset, a product recall or an adverse action or assessment by a regulator. When testing for impairment, we may elect to perform a qualitative analysis to determine whether it is more likely than not the fair value of our trade name is greater than its carrying value. We performed our annual indefinite-lived intangible asset impairment test during the fourth quarter of fiscal 2024 utilizing a qualitative analysis and concluded it was more likely than not the fair value of our trade name was greater than its carrying value and no impairment charge was required.
ETHAN ALLEN INTERIORS INC. AND SUBSIDIARIES
Leases
We determine if an arrangement contains a lease at inception based on our right to control the use of an identified asset and our right to obtain substantially all of the economic benefits from the use of that identified asset. Lease right-of-use (“ROU”) assets represent the right to use an underlying asset pursuant to the lease for the lease term, and lease liabilities represent the obligation to make lease payments arising from the lease. Lease ROU assets and lease liabilities are recognized at the commencement of an arrangement where it is determined at inception that a lease exists. These assets and liabilities are initially recognized based on the present value of lease payments over the lease term calculated using our incremental borrowing rate generally applicable to the location of the lease ROU asset, unless an implicit rate is readily determinable. As most of our leases do not provide an implicit rate, we generally use our incremental borrowing rate based on the estimated rate of interest for collateralized borrowing over a similar term of the lease payments at commencement date. As we do not have any outstanding public debt, we estimated the incremental borrowing rate based on our estimated credit rating and available market information. The incremental borrowing rate is subsequently reassessed upon a modification to the lease agreement. We combine lease and certain non-lease components for our design center real estate leases in determining the lease payments subject to the initial present value calculation. Lease ROU assets include upfront lease payments and exclude lease incentives, where applicable. Certain operating leases have renewal options and rent escalation clauses as well as various purchase options. We assess these options to determine if we are reasonably certain of exercising these options based on all relevant economic and financial factors. Any options that meet these criteria are included in the lease term at lease commencement.
Operating leases are included within Operating lease right-of-use assets, Current operating lease liabilities and Operating lease liabilities, long-term in our consolidated balance sheets. Financing leases are included within Property, plant and equipment, net, Other current liabilities, and Other long-term liabilities in our consolidated balance sheets.
Lease expense for operating leases consists of both fixed and variable components. Expenses related to fixed lease payments are recognized on a straight-line basis over the lease term. Variable lease payments are generally expensed as incurred and include certain index-based changes in rent, certain non-lease components, such as maintenance and other services provided by the lessor, and other charges included in the lease. We have elected the short-term lease exemption, whereby leases with initial terms of one year or less are not capitalized and instead expensed on a straight-line basis over the lease term. In addition, certain of our equipment lease agreements include variable lease payments, which are based on the usage of the underlying asset. The variable portion of payments are not included in the initial measurement of the asset or lease liability due to uncertainty of the payment amount and are recorded as lease expense in the period incurred.
Refer to Note 6, Leases, for further lease accounting details.
Customer Deposits
In most cases we collect deposits from customers on a portion of the total purchase price at the time a written order is placed, but before we have transferred control of our product to our customers, resulting in contract liabilities. These customer deposits are reported as a current liability in Customer deposits on our consolidated balance sheets. At June 30, 2024, we had customer deposits of $73.5 million compared with $77.8 million a year ago. During fiscal 2024, we recognized $76.1 million of revenue related to our contract liabilities reported at June 30, 2023. We expect that substantially all of the customer deposits received as of June 30, 2024 will be recognized as revenue within the next twelve months as the performance obligations are satisfied.
Deferred Financing Fees
Deferred financing fees related to our credit facility are included in Prepaid expenses and other current assets (current portion) and Other assets (non-current portion) on our consolidated balance sheets and amortized utilizing the effective interest method. Such amortization is included in Interest and other financing costs on the consolidated statements of comprehensive income.
Insurance
We maintain insurance coverage for significant exposures, as well as those risks that, by law, must be insured. In the case of the Company’s healthcare coverage for employees, we have an insurance program that includes a stop-loss insurance policy to protect from individual losses over a specified dollar value. Expenses related to this insured program are computed on an actuarial basis, based on claims experience, regulatory requirements, an estimate of claims incurred but not yet reported (“IBNR”) and other relevant factors. The projections involved in this process are subject to uncertainty related to the timing and the amount of claims filed, levels of IBNR, fluctuations in healthcare costs and changes to regulatory requirements. We recorded an estimated liability related to healthcare coverage of $1.5 million and $2.4 million, as of June 30, 2024 and 2023, respectively. These liabilities are recorded within Accrued compensation and benefits on our consolidated balance sheets.
ETHAN ALLEN INTERIORS INC. AND SUBSIDIARIES
We also carry workers’ compensation insurance subject to a deductible amount for which the Company is responsible on each claim. We recorded an estimated liability related to workers’ compensation claims, primarily for claims that do not meet the per-incident deductible, of $3.9 million and $4.2 million as of June 30, 2024 and 2023, respectively. The workers’ compensation insurance reserve is recorded within Accrued compensation and benefits on our consolidated balance sheets.
Fair Value of Financial Instruments
Because of their short-term nature, the carrying value of our cash and cash equivalents, restricted cash, investments, receivables and payables, and customer deposit liabilities approximates fair value. We believe the fair value of any future borrowings under our credit facility will approximate its carrying amount as the terms and interest rate approximate market rates given its floating interest rate basis.
Income Taxes
Income taxes are accounted for under the asset and liability method. Deferred tax assets and liabilities are recognized for the future tax consequences attributable to differences between the financial statement carrying amounts of existing assets and liabilities and their respective tax bases and operating loss and tax credit carryforwards. Deferred tax assets and liabilities are measured using enacted tax rates expected to apply to taxable income in the years in which those temporary differences are expected to be recovered or settled. The effect on deferred tax assets and liabilities of a change in tax rates is recognized in income in the period that includes the enactment date. A valuation allowance must be established for deferred tax assets when it is more likely than not that the assets will not be realized.
We recognize the tax benefit from an uncertain tax position only if it is more likely than not that the tax position will be sustained on examination by the taxing authorities, based on the technical merits of the position. Most of the unrecognized tax benefits, if recognized, would be recorded as a benefit to income tax expense. The liability associated with an unrecognized tax benefit is classified as a long-term liability except for the amount for which a cash payment is expected to be made or tax positions settled within one year. We recognize interest and penalties related to income tax matters as a component of income tax expense.
Revenue Recognition
Our reported revenue (net sales) consist substantially of product sales. We report product sales net of discounts and recognize them at the point in time when control transfers to the customer. For sales to our customers in our wholesale segment, control typically transfers when the product is shipped. The majority of our shipping agreements are freight-on-board shipping point and risk of loss transfers to our wholesale customer once the product is out of our control. Accordingly, revenue is recognized for product shipments on third-party carriers at the point in time that our product is loaded onto the third-party container or truck. For sales in our retail segment, control generally transfers upon delivery to the customer. We recognize the promised amount of consideration without adjusting for the effects of a significant financing component if the contract has a duration of one year or less. As our contracts typically are less than one year in length and do not have significant financing components, we have not adjusted consideration.
Shipping and Handling. Our practice has been to sell our products at the same delivered cost to all retailers and customers nationwide, regardless of shipping point. Costs incurred by the Company to deliver finished goods are expensed and recorded in selling, general and administrative expenses. We recognize shipping and handling expense as fulfillment activities (rather than as a promised good or service) when the activities are performed even if those activities are performed after the control of the good has been transferred. Accordingly, we record the expenses for shipping and handling activities at the same time we recognize net sales.
Sales Taxes. We exclude from the measurement of the transaction price all taxes imposed on and concurrent with a specific revenue-producing transaction and collected by the entity from a customer, including sales, use, excise, value-added, and franchise taxes (collectively referred to as sales taxes). Sales tax collected is not recognized as revenue but is included in Accounts payable and accrued expenses on the consolidated balance sheets as it is ultimately remitted to governmental authorities.
Returns and Allowances. Estimated refunds for returns and allowances are based on our historical return patterns. We record these estimated sales refunds on a gross basis rather than on a net basis and have recorded an asset for product we expect to receive back from customers in Prepaid expenses and other current assets and a corresponding refund liability in Other current liabilities on our consolidated balance sheets. At June 30, 2024 and 2023, these amounts were immaterial.
ETHAN ALLEN INTERIORS INC. AND SUBSIDIARIES
Commissions. We capitalize commissions paid to our associates as contract assets within Prepaid expenses and other current assets on our consolidated balance sheets. These prepaid commissions are subsequently recognized as a selling expense upon delivery (when we have transferred control of our product to our customer). At June 30, 2024, we had prepaid commissions of $11.5 million, which we expect to recognize to selling expense in the next twelve months within our consolidated statements of comprehensive income. Prepaid commissions totaled $12.3 million a year ago, which were fully recognized in selling expenses during fiscal 2024.
Customer Financing Program
The Ethan Allen Platinum Card consumer credit program offers clients a menu of custom financing options. Financing offered through this program is administered by a third-party financial institution and is granted to our clients on a non-recourse basis to the Company. Clients may apply for an Ethan Allen Platinum Card at a design center or online at ethanallen.com. During fiscal 2024 and 2023, we periodically offered no interest financing options.
Cost of Sales
Our cost of sales consist of the cost to manufacture our merchandise including materials, direct labor and overhead costs as well as the cost to purchase import products, including inbound freight.
Selling, General and Administrative (SG&A) Expenses
SG&A expenses include the costs of selling our products and general and administrative costs. Selling expenses primarily consist of warehousing, delivery, commissions, advertising and compensation of employees performing various sales and designer functions. Occupancy costs, depreciation, compensation for administrative employees and other administrative costs are included in SG&A. All store pre-opening costs are included in SG&A expenses and are expensed as incurred.
Advertising Expenses
Advertising expenses represent costs associated with our digital marketing, direct mailings, national television spots, on-air radio and other mediums as well as those employees supporting our advertising campaigns. Total advertising costs were $16.4 million in fiscal 2024, $17.2 million in fiscal 2023 and $15.6 million in fiscal 2022. These amounts also include advertising media expenses, outside agency fees, certain website related costs and photo and video production. Advertising costs from our direct mailers are expensed when provided to the carrier for distribution. Website, print and other advertising expenses, which include e-commerce advertising, web creative content, national television and direct marketing activities such as print media and radio, are expensed as incurred or upon the release of the content or initial advertisement. Prepaid advertising costs were immaterial at June 30, 2024 and 2023, respectively.
Research and Development Costs
Research and development costs are charged to expense in the periods incurred and are included as a component of SG&A. Expenditures for research and development costs were immaterial in each fiscal year presented.
Interest and Other Income, Net
Interest and other income, net includes interest income on investments, foreign currency gains or losses and other income or expense incurred outside our normal course of business. Total interest income on investments were $7.4 million, $4.4 million and $0.2 million, respectively, in fiscal 2024, 2023 and 2022.
Interest and Other Financing Costs
Interest expense and other financing costs are primarily from the amortization of deferred financing fees. Interest expense was immaterial for fiscal 2024, 2023 and 2022.
Supplemental Cash Flow Information
The Company’s supplemental cash flow information is presented at the bottom of its consolidated statements of cash flows, with the exception of required lease disclosures. Refer to Note 6, Leases for cash flow impacts from leasing transactions during each of the past three fiscal years. There were no other material non-cash investing or financing activities during each period presented.
ETHAN ALLEN INTERIORS INC. AND SUBSIDIARIES
Share-Based Compensation
Share-based compensation expense is included within SG&A expenses. Tax benefits associated with our share-based compensation arrangements are included within income tax expense.
We estimate, as of the date of grant, the fair value of stock options awarded using the Black-Scholes option pricing model. Use of a valuation model requires management to make certain assumptions with respect to selected model inputs, including anticipated changes in the underlying stock price (i.e., expected volatility) and option exercise activity (i.e., expected life). Expected volatility is based on the historical volatility of our stock and other contributing factors. The risk-free rate of return is based on the United States Treasury bill rate extrapolated to the term matching the expected life of the grant. The dividend yield is based on the annualized dividend rate at the grant date relative to the grant date stock price. The expected life of options granted, which represents the period of time that the options are expected to be outstanding, is based, primarily, on historical data.
We estimate, as of the date of grant, the fair value of non-performance based restricted stock units awarded using a discounted cash flow model, which requires management to make certain assumptions with respect to model inputs including anticipated future dividends not paid during the restriction period, and a discount for lack of marketability for a one-year holding period after vesting. The lack of marketability discount used is the present value of a future put option using the Chaffe model. We account for these restricted stock units as equity-based awards because when they vest, they will be settled in shares of our common stock.
We estimate, as of the date of grant, the fair value of performance units with a discounted cash flow model, using as model inputs the risk-free rate of return as the discount rate, dividend yield for dividends not paid during the restriction period, and a discount for lack of marketability for a one-year post-vest holding period. Performance units require management to make assumptions regarding the likelihood of achieving Company performance targets on a quarterly basis. The number of performance units that vest will be predicated on the Company achieving certain performance levels. A change in the financial performance levels the Company achieves could result in changes to our current estimate of the vesting percentage and related share-based compensation.
As share-based compensation expense recognized is based on awards ultimately expected to vest, it has been reduced for estimated forfeitures. Forfeitures are estimated at the time of grant and revised, if necessary, in subsequent periods if actual forfeitures differ from those estimates. Forfeitures are estimated based primarily on historical experience. Windfall tax benefits, defined as tax deductions that exceed recorded share-based compensation, are classified as cash inflows from operating activities. The value of the portion of the equity-based awards that are ultimately expected to vest is recognized as expense over the requisite service periods in our consolidated statements of comprehensive income.
Earnings Per Share
We compute basic EPS by dividing net income by the weighted average number of common shares outstanding during the period. Diluted EPS is calculated similarly, except that the weighted average outstanding shares are adjusted to include the effects of converting all potentially dilutive share-based awards issued under our employee stock plans. The number of potential common shares outstanding are determined in accordance with the treasury stock method to the extent they are dilutive. For the purpose of calculating EPS, common shares outstanding include common shares issuable upon the exercise of outstanding share-based compensation awards. Under the treasury stock method, the exercise price paid by the optionee and future share-based compensation expense that the Company has not yet recognized are assumed to be used to repurchase shares.
Foreign Currency Translation
The functional currency of each Company-operated foreign location is the respective local currency. Assets and liabilities are translated into U.S. dollars using the current period-end exchange rate and income and expense amounts are translated using the average exchange rate for the period in which the transaction occurred. Resulting translation adjustments are reported as a component of Accumulated other comprehensive loss within shareholders’ equity.
Treasury Stock
The Company accounts for repurchased common stock on a trade date basis under the cost method and includes such treasury stock as a component of its shareholders’ equity. We account for the formal retirement of treasury stock by deducting its par value from common stock, reducing additional paid-in capital (“APIC”) by the average amount recorded in APIC when the stock was originally issued and any remaining excess of cost deducted from retained earnings.
ETHAN ALLEN INTERIORS INC. AND SUBSIDIARIES
Recent Accounting Pronouncements
The Company evaluates all Accounting Standards Updates (“ASUs”) issued by the Financial Accounting Standards Board (“FASB”) for consideration of their applicability to our consolidated financial statements.
New Accounting Standards or Updates Adopted in Fiscal 2024
Business Combinations. In October 2021, the FASB issued ASU 2021-08, Business Combinations (Topic 805): Accounting for Contract Assets and Contract Liabilities from Contracts with Customers, which requires an acquirer to recognize and measure contract assets and liabilities acquired in a business combination in accordance with Revenue from Contracts with Customers (Topic 606) rather than adjust them to fair value at the acquisition date. The adoption of this accounting standard in the first quarter of fiscal 2024 did not have an impact on our consolidated financial statements.
Derivatives and Hedging. In March 2022, the FASB issued ASU 2022-01, Derivatives and Hedging (Topic 801): Fair Value Hedging – Portfolio Layer Method, which expands the current single-layer hedging model to allow multiple-layer hedges of a single closed portfolio of prepayable financial assets or one or more beneficial interests secured by a portfolio of prepayable financial instruments under the method. The adoption of this accounting standard in the first quarter of fiscal 2024 did not have an impact on our consolidated financial statements.
Recent Accounting Standards or Updates Not Yet Effective
Disclosure Improvements. In October 2023, the FASB issued ASU 2023-06, Disclosure Improvements: Codification Amendment in Response to the SEC’s Disclosure Update and Simplification Initiative. The ASU incorporates several disclosure and presentation requirements currently residing in the SEC Regulations S-X and S-K. The amendments will be applied prospectively and are effective when the SEC removes the related requirements from Regulations S-X or S-K. Any amendments the SEC does not remove by June 30, 2027 will not be effective. As we are currently subject to these SEC requirements, this ASU is not expected to have a material impact on our consolidated financial statements or related disclosures.
Segment Reporting. In November 2023, the FASB issued ASU 2023-07, Segment Reporting (Topic 280): Improvements to Reportable Segment Disclosures, which requires all public entities to provide enhanced disclosures about significant segment expenses. The amendments in this ASU are to be applied retrospectively and are effective for our annual financial statements starting in fiscal 2025 and interim periods starting in fiscal 2026, with early adoption permitted. We are currently evaluating the impact of this accounting standard, but do not expect it to have a material impact on our consolidated financial statements or related disclosures.
Income Taxes. In December 2023, the FASB issued ASU 2023-09, Income Taxes (Topic 740): Improvements to Income Tax Disclosures, which enhances transparency about income tax information through improvements to income tax disclosures primarily related to the rate reconciliation and income taxes paid and to improve the effectiveness of income tax disclosures. This ASU will be effective for us for fiscal 2026 and interim periods beginning in the first quarter of fiscal 2027, with early adoption permitted. We are currently evaluating the impact of this accounting standard, but do not expect it to have a material impact on our consolidated financial statements or related disclosures.
Climate-Related Disclosures. In March 2024, the SEC adopted final rules that would require registrants to provide certain climate-related information in their registration statements and annual reports. The new rules require information about a registrant's climate-related risks that are reasonably likely to have a material impact on its business, results of operations, or financial condition. The rules also require disclosure of a registrant’s greenhouse gas emissions and certain climate-related financial metrics in their audited financial statements. In April 2024, the SEC voluntarily stayed the rules pending completion of a judicial review that is currently pending in the U.S. Court of Appeals for the Eighth Circuit. We are currently evaluating the impact of these rules on our consolidated financial statements and related disclosures.
No other new accounting pronouncements issued or effective as of June 30, 2024 have had or are expected to have a material impact on our consolidated financial statements and related disclosures.
ETHAN ALLEN INTERIORS INC. AND SUBSIDIARIES
The following table disaggregates our net sales by product category by segment for each fiscal year (in thousands):
| |
|
Fiscal Year Ended June 30,
|
|
| |
|
Wholesale
|
|
|
Retail
|
|
|
Eliminations(1)
|
|
|
Total
|
|
|
Upholstery(2)
|
|
$ |
184,699 |
|
|
$ |
255,607 |
|
|
$ |
(132,708 |
) |
|
$ |
307,598 |
|
|
Case goods(3)
|
|
|
120,743 |
|
|
|
141,737 |
|
|
|
(74,316 |
) |
|
|
188,164 |
|
|
Accents(4)
|
|
|
70,518 |
|
|
|
113,021 |
|
|
|
(58,392 |
) |
|
|
125,147 |
|
|
Other(5)
|
|
|
(4,873 |
) |
|
|
30,185 |
|
|
|
- |
|
|
|
25,312 |
|
|
Fiscal 2024
|
|
$ |
371,087 |
|
|
$ |
540,550 |
|
|
$ |
(265,416 |
) |
|
$ |
646,221 |
|
| |
|
|
|
|
|
|
|
|
|
|
|
|
|
|
|
|
|
Upholstery(2)
|
|
$ |
224,272 |
|
|
$ |
318,131 |
|
|
$ |
(163,589 |
) |
|
$ |
378,814 |
|
|
Case goods(3)
|
|
|
149,664 |
|
|
|
180,079 |
|
|
|
(93,022 |
) |
|
|
236,721 |
|
|
Accents(4)
|
|
|
82,181 |
|
|
|
129,385 |
|
|
|
(64,153 |
) |
|
|
147,413 |
|
|
Other(5)
|
|
|
(6,526 |
) |
|
|
34,960 |
|
|
|
- |
|
|
|
28,434 |
|
|
Fiscal 2023
|
|
$ |
449,591 |
|
|
$ |
662,555 |
|
|
$ |
(320,764 |
) |
|
$ |
791,382 |
|
| |
|
|
|
|
|
|
|
|
|
|
|
|
|
|
|
|
|
Upholstery(2)
|
|
$ |
262,592 |
|
|
$ |
350,737 |
|
|
$ |
(188,661 |
) |
|
$ |
424,668 |
|
|
Case goods(3)
|
|
|
148,536 |
|
|
|
175,697 |
|
|
|
(96,110 |
) |
|
|
228,123 |
|
|
Accents(4)
|
|
|
80,665 |
|
|
|
133,354 |
|
|
|
(71,193 |
) |
|
|
142,826 |
|
|
Other(5)
|
|
|
(7,951 |
) |
|
|
30,096 |
|
|
|
- |
|
|
|
22,145 |
|
|
Fiscal 2022
|
|
$ |
483,842 |
|
|
$ |
689,884 |
|
|
$ |
(355,964 |
) |
|
$ |
817,762 |
|
| |
(1)
|
The Eliminations column in the table above represents the elimination of all intercompany wholesale segment sales to the retail segment in each period presented.
|
| |
(2)
|
Upholstery includes fabric-covered items such as sleepers, recliners and other motion furniture, chairs, ottomans, custom pillows, sofas, loveseats, cut fabrics and leather.
|
| |
(3)
|
Case goods includes items such as beds, dressers, armoires, tables, chairs, buffets, entertainment units, home office furniture and wooden accents.
|
| |
(4)
|
Accents includes items such as window treatments and drapery hardware, wall décor, florals, lighting, clocks, mattresses, bedspreads, throws, pillows, decorative accents, area rugs, flooring, wall coverings and outdoor furnishings.
|
| |
(5)
|
Other includes product delivery sales, the Ethan Allen Hotel revenues, sales of third-party furniture protection plans and other miscellaneous product sales less prompt payment discounts, sales allowances and other incentives.
|
|
(5)
|
Fair Value Measurements
|
Fair value is defined as the price that would be received from selling an asset or paid to transfer a liability (i.e., the “exit price”) in an orderly transaction between market participants at the measurement date. In determining fair value, the use of various valuation methodologies, including market, income, and cost approaches is permissible. We consider the principal or most advantageous market in which it would transact and assumptions that market participants would use when pricing the asset or liability.
Fair Value Hierarchy. The accounting guidance for fair value measurements establishes a fair value hierarchy that requires an entity to maximize the use of observable inputs and minimize the use of unobservable inputs when measuring fair value. There are three levels of inputs that may be used to measure fair value based on the reliability of inputs. A financial instrument’s categorization within the fair value hierarchy is based upon the lowest level of input that is significant to the fair value measurement. Our assessment of the significance of a particular input to the fair value measurement requires judgment and may affect their placement within the fair value hierarchy levels.
We have categorized our cash equivalents and investments within the fair value hierarchy as follows:
Level 1 – applies to assets or liabilities for which there are quoted prices in active markets for identical assets or liabilities. These Level 1 assets include our corporate money market funds that are classified as cash equivalents. We have categorized our cash equivalents as Level 1 assets as there are quoted prices in active markets for identical assets or liabilities.
ETHAN ALLEN INTERIORS INC. AND SUBSIDIARIES
Level 2 – applies to assets or liabilities for which there are inputs other than quoted prices that are observable for the asset or liability such as quoted prices for similar assets or liabilities in active markets; quoted prices for identical assets or liabilities in markets with insufficient volume or infrequent transactions (less active markets); or model-derived valuations in which significant inputs are observable or can be derived principally from, or corroborated by, observable market data. At June 30, 2024 and 2023, we have categorized our investments as Level 2 assets.
Level 3 – applies to assets or liabilities for which there are unobservable inputs to the valuation methodology that are significant to the measurement of the fair value of the assets or liabilities. We held no Level 3 assets or liabilities at June 30, 2024 or 2023.
Assets and Liabilities Measured at Fair Value on a Recurring Basis. The following tables show, by level within the fair value hierarchy, our assets and liabilities that are measured at fair value on a recurring basis at June 30, 2024 and 2023. We did not have any transfers between levels of fair value measurements during the periods presented.
| |
|
|
Fair Value Measurements at June 30, 2024
|
|
|
Financial Assets
|
Balance Sheet Location
|
|
Level 1
|
|
|
Level 2
|
|
|
Level 3
|
|
|
Total
|
|
|
Corporate money market funds (1)
|
Cash and cash equivalents
|
|
$ |
33,487 |
|
|
$ |
- |
|
|
$ |
- |
|
|
$ |
33,487 |
|
|
U.S. Treasury bills (2)
|
Investments, short-term
|
|
|
- |
|
|
|
91,319 |
|
|
|
- |
|
|
|
91,319 |
|
|
U.S. Treasury notes (2)
|
Investments, long-term
|
|
|
- |
|
|
|
34,772 |
|
|
|
- |
|
|
|
34,772 |
|
|
Total
|
|
$ |
33,487 |
|
|
$ |
126,091 |
|
|
$ |
- |
|
|
$ |
159,578 |
|
| |
|
|
Fair Value Measurements at June 30, 2023
|
|
|
Financial Assets
|
Balance Sheet Location
|
|
Level 1
|
|
|
Level 2
|
|
|
Level 3
|
|
|
Total
|
|
|
Corporate money market funds (1)
|
Cash and cash equivalents
|
|
$ |
23,923 |
|
|
$ |
- |
|
|
$ |
- |
|
|
$ |
23,923 |
|
|
U.S. Treasury bills (2)
|
Investments, short-term
|
|
|
- |
|
|
|
110,577 |
|
|
|
- |
|
|
|
110,577 |
|
|
Total
|
|
$ |
23,923 |
|
|
$ |
110,577 |
|
|
$ |
- |
|
|
$ |
134,500 |
|
| |
(1)
|
Our corporate money market funds are readily convertible into cash and the net asset value of each fund on the last day of the quarter is used to determine its fair value.
|
| |
(2)
|
We have current and non-current debt securities (U.S. Treasury bills and notes) intended to enhance returns on our cash as well as to fund future obligations.
|
There were no investments that have been in a continuous loss position for more than one year, and there have been no other-than-temporary impairments recognized.
Assets and Liabilities Measured at Fair Value on a Non-Recurring Basis. We did not record any other-than-temporary impairments on assets required to be measured at fair value on a non-recurring basis during fiscal 2024 or 2023.
Assets and Liabilities Measured at Fair Value for Disclosure Purposes Only. We had no outstanding bank borrowings at June 30, 2024 and 2023. We have historically categorized our outstanding bank borrowings as a Level 2 liability.
We recognize leases on our consolidated balance sheets as a ROU asset and a lease liability. We have operating leases for many of our design centers that expire at various dates through fiscal 2040. We also lease certain tangible assets, including computer equipment and vehicles with initial lease terms ranging from three to five years. We determine if a contract contains a lease at inception based on our right to control the use of an identified asset and our right to obtain substantially all of the economic benefits from the use of that identified asset. For purposes of measuring our ROU asset and lease liability, we determine our incremental borrowing rate by computing the rate of interest that we would have to pay to (i) borrow on a collateralized basis (ii) over a similar term (iii) at an amount equal to the total lease payments and (iv) in a similar economic environment.
ETHAN ALLEN INTERIORS INC. AND SUBSIDIARIES
The Company's lease terms and discount rates are as follows:
| |
|
June 30,
|
|
| |
|
2024
|
|
|
2023
|
|
|
Weighted average remaining lease term (in years)
|
|
|
|
|
|
|
|
|
|
Operating leases
|
|
|
5.6 |
|
|
|
5.8 |
|
|
Financing leases
|
|
|
2.8 |
|
|
|
2.1 |
|
|
Weighted average discount rate
|
|
|
|
|
|
|
|
|
|
Operating leases
|
|
|
5.8% |
|
|
|
5.5% |
|
|
Financing leases
|
|
|
5.6% |
|
|
|
3.5% |
|
The following table discloses the location and amount of our operating and financing lease assets and liabilities within our consolidated balance sheets (in thousands):
| |
|
|
June 30,
|
|
| |
Consolidated Balance Sheet Location
|
|
2024
|
|
|
2023
|
|
|
Assets
|
|
|
|
|
|
|
|
|
|
|
Operating leases
|
Operating lease right-of-use assets (non-current)
|
|
$ |
114,242 |
|
|
$ |
115,861 |
|
|
Financing leases
|
Property, plant and equipment, net
|
|
|
930 |
|
|
|
550 |
|
|
Total lease assets
|
|
$ |
115,172 |
|
|
$ |
116,411 |
|
| |
|
|
|
|
|
|
|
|
|
Liabilities
|
|
|
|
|
|
|
|
|
|
|
Current:
|
|
|
|
|
|
|
|
|
|
|
Operating leases
|
Current operating lease liabilities
|
|
$ |
27,387 |
|
|
$ |
26,045 |
|
|
Financing leases
|
Other current liabilities
|
|
|
336 |
|
|
|
378 |
|
|
Noncurrent:
|
|
|
|
|
|
|
|
|
|
|
Operating leases
|
Operating lease liabilities, long-term
|
|
|
100,897 |
|
|
|
104,301 |
|
|
Financing leases
|
Other long-term liabilities
|
|
|
658 |
|
|
|
204 |
|
|
Total lease liabilities
|
|
$ |
129,278 |
|
|
$ |
130,928 |
|
The ROU assets by segment are as follows (in thousands):
| |
|
June 30,
|
|
| |
|
2024
|
|
|
2023
|
|
|
Retail
|
|
$ |
114,242 |
|
|
$ |
115,861 |
|
|
Wholesale
|
|
|
930 |
|
|
|
550 |
|
|
Total ROU assets
|
|
$ |
115,172 |
|
|
$ |
116,411 |
|
The following table discloses the location and amount of our operating and financing lease costs within our consolidated statements of comprehensive income (in thousands):
| |
|
|
Fiscal Year Ended
June 30,
|
|
| |
Statements of Comprehensive Income Location
|
|
2024
|
|
|
2023
|
|
|
Operating lease cost(1)
|
SG&A expenses
|
|
$ |
31,959 |
|
|
$ |
30,235 |
|
|
Financing lease cost
|
|
|
|
|
|
|
|
|
|
|
Depreciation of property
|
SG&A expenses
|
|
|
453 |
|
|
|
503 |
|
|
Interest on lease liabilities
|
Interest expense and other financing costs
|
|
|
33 |
|
|
|
26 |
|
|
Short-term lease cost(2)
|
SG&A expenses
|
|
|
85 |
|
|
|
1,099 |
|
|
Variable lease cost(3)
|
SG&A expenses
|
|
|
9,710 |
|
|
|
9,117 |
|
|
Less: Sublease income
|
SG&A expenses
|
|
|
(1,371 |
) |
|
|
(1,162 |
) |
|
Total lease expense
|
|
$ |
40,869 |
|
|
$ |
39,818 |
|
| |
(1)
|
Lease expense for operating leases consists of both fixed and variable components. Expenses related to fixed lease payments are recognized on a straight-line basis over the lease term.
|
| |
(2)
|
Leases with an initial term of 12 months or less are not recorded on the consolidated balance sheets and instead expensed on a straight-line basis over the lease term.
|
| |
(3)
|
Variable lease payments are generally expensed as incurred, where applicable, and include certain index-based changes in rent, certain non-lease components such as maintenance, real estate taxes, insurance and other services provided by the lessor, and other charges included in the lease. In addition, certain of our equipment lease agreements include variable lease payments, which are based on the usage of the underlying asset. The variable portion of payments are not included in the initial measurement of the asset or lease liability due to uncertainty of the payment amount and are recorded as expense in the period incurred.
|
ETHAN ALLEN INTERIORS INC. AND SUBSIDIARIES
The table below reconciles the undiscounted future minimum lease payments (by year and in the aggregate) under noncancelable leases with terms of more than one year to the total lease liabilities recognized on the consolidated balance sheets at June 30, 2024 (in thousands):
|
Fiscal Year
|
|
Operating Leases
|
|
|
Financing Leases
|
|
|
2025
|
|
$ |
33,942 |
|
|
$ |
381 |
|
|
2026
|
|
|
30,527 |
|
|
|
374 |
|
|
2027
|
|
|
23,854 |
|
|
|
317 |
|
|
2028
|
|
|
20,605 |
|
|
|
- |
|
|
2029
|
|
|
16,064 |
|
|
|
- |
|
|
Thereafter
|
|
|
26,259 |
|
|
|
- |
|
|
Total undiscounted future minimum lease payments
|
|
|
151,251 |
|
|
|
1,072 |
|
|
Less: imputed interest
|
|
|
(22,967 |
) |
|
|
(78 |
) |
|
Total present value of lease obligations(1)
|
|
$ |
128,284 |
|
|
$ |
994 |
|
| |
(1)
|
Excludes future commitments under short-term operating lease agreements of less than $0.1 million as of June 30, 2024.
|
At June 30, 2024, we have two operating leases for retail design centers which have not yet commenced and are therefore not part of the tables above nor included in the lease ROU assets and liabilities. These leases will commence when we obtain possession of the underlying leased asset, which is expected to be during fiscal 2025. The two operating leases are both for a period of ten years, respectively, and have aggregate undiscounted future lease payments of $4.9 million. At June 30, 2024, we did not have any financing leases that had not commenced.
Other supplemental information for our leases is as follows (in thousands):
| |
|
Fiscal Year Ended
June 30,
|
|
| |
|
2024
|
|
|
2023
|
|
|
Cash paid for amounts included in the measurement of lease liabilities
|
|
|
|
|
|
|
|
|
|
Operating cash flows from operating leases
|
|
$ |
32,981 |
|
|
$ |
31,013 |
|
|
Operating cash flows from financing leases
|
|
$ |
421 |
|
|
$ |
525 |
|
|
Operating lease assets obtained in exchange for new operating lease liabilities
|
|
$ |
23,690 |
|
|
$ |
40,240 |
|
|
Financing lease obligations obtained in exchange for new financing lease assets
|
|
$ |
780 |
|
|
$ |
- |
|
We sublease a select number of our leased locations, which generally match those of the leases we have with the lessor. At June 30, 2024, future minimum leases payments due to us under those subleases were as follows (in thousands):
| |
|
Sublease
|
|
|
Fiscal Year
|
|
Income
|
|
|
2025
|
|
$ |
1,637 |
|
|
2026
|
|
|
1,504 |
|
|
2027
|
|
|
1,194 |
|
|
2028
|
|
|
791 |
|
|
2029
|
|
|
785 |
|
|
Thereafter
|
|
|
1,659 |
|
|
Total future minimum sublease income
|
|
$ |
7,570 |
|
Sale-leaseback transaction. On August 1, 2022, we completed a sale-leaseback transaction with an independent third party for the land, building and related fixed assets of a retail design center. The design center was leased back to Ethan Allen via a multi-year operating lease agreement. As part of the transaction, we received net proceeds of $8.1 million, which resulted in a pre-tax gain of $1.8 million recorded within Restructuring and other charges, net of gains and $5.2 million deferred as a liability to be amortized to Restructuring and other charges, net of gains over the term of the related lease. For the year ended June 30, 2024, we amortized $2.6 million of this deferred liability as a gain within Restructuring and other charges, net of gains. As of June 30, 2024, the deferred liability balance was $0.2 million within Other current liabilities.
ETHAN ALLEN INTERIORS INC. AND SUBSIDIARIES
We have investments in debt securities intended to enhance returns on our cash as well as to fund future obligations. Our short-term investments consist of U.S. Treasury bills, with maturities of less than one year, and total $91.3 million as of June 30, 2024. Our long-term investments consist of U.S. Treasury notes, with maturities ranging between one and two years, and total $34.8 million at June 30, 2024. During fiscal 2024, we had $124.5 million of U.S. Treasuries that matured during the fiscal year, which were subsequently reinvested for $134.9 million. All unrealized gains and losses are included in Accumulated other comprehensive loss within our consolidated balance sheets.
Our debt securities are presented below in accordance with their stated maturities:
| |
|
June 30, 2024
|
|
| |
|
Amortized cost
|
|
|
Gross unrealized gains
|
|
|
Gross unrealized losses
|
|
|
Fair Value
|
|
|
Due within one year
|
|
$ |
89,997 |
|
|
$ |
1,322 |
|
|
$ |
- |
|
|
$ |
91,319 |
|
|
Due within one and two years
|
|
|
34,894 |
|
|
|
- |
|
|
|
(122 |
) |
|
|
34,772 |
|
|
Total
|
|
$ |
124,891 |
|
|
$ |
1,322 |
|
|
$ |
(122 |
) |
|
$ |
126,091 |
|
| |
|
June 30, 2023
|
|
| |
|
Amortized cost
|
|
|
Gross unrealized gains
|
|
|
Gross unrealized losses
|
|
|
Fair Value
|
|
|
Due within one year
|
|
$ |
109,996 |
|
|
$ |
581 |
|
|
$ |
- |
|
|
$ |
110,577 |
|
|
Total
|
|
$ |
109,996 |
|
|
$ |
581 |
|
|
$ |
- |
|
|
$ |
110,577 |
|
Inventories are summarized as follows (in thousands):
| |
|
June 30,
|
|
| |
|
2024
|
|
|
2023
|
|
| |
|
|
|
|
|
|
|
|
|
Finished goods
|
|
$ |
107,835 |
|
|
$ |
108,873 |
|
|
Work in process
|
|
|
11,752 |
|
|
|
12,606 |
|
|
Raw materials
|
|
|
24,249 |
|
|
|
29,653 |
|
|
Inventory reserves
|
|
|
(1,796 |
) |
|
|
(1,937 |
) |
|
Inventories, net
|
|
$ |
142,040 |
|
|
$ |
149,195 |
|
|
(9)
|
Property, Plant and Equipment
|
Property, plant and equipment are summarized as follows (in thousands):
| |
|
June 30,
|
|
| |
|
2024
|
|
|
2023
|
|
| |
|
|
|
|
|
|
|
|
|
Land and improvements
|
|
$ |
77,049 |
|
|
$ |
77,940 |
|
|
Building and improvements
|
|
|
365,380 |
|
|
|
352,582 |
|
|
Machinery and equipment
|
|
|
119,434 |
|
|
|
126,203 |
|
|
Property, plant and equipment, gross
|
|
|
561,863 |
|
|
|
556,725 |
|
|
Less: accumulated depreciation and amortization
|
|
|
(346,605 |
) |
|
|
(334,558 |
) |
|
Property, plant and equipment, net
|
|
$ |
215,258 |
|
|
$ |
222,167 |
|
We recorded depreciation and amortization expense of $16.0 million, $15.6 million and $16.0 million in fiscal 2024, 2023 and 2022, respectively.
|
(10)
|
Goodwill and Intangible Assets
|
Our goodwill and intangible assets are comprised of goodwill, which represents the excess of cost over the fair value of net assets acquired, and our Ethan Allen trade name and related trademarks. Both goodwill and indefinite-lived intangible assets are not amortized as they are estimated to have an indefinite life. At June 30, 2024 and 2023, we had $25.4 million of goodwill and $19.7 million of indefinite-lived intangible assets, all of which are assigned to our wholesale reporting unit. Our wholesale reporting unit is principally involved in the development of the Ethan Allen brand and encompasses all aspects of design, manufacturing, sourcing, marketing, sale and distribution of the Company’s broad range of home furnishings and accents.
ETHAN ALLEN INTERIORS INC. AND SUBSIDIARIES
We test our wholesale goodwill and indefinite-lived intangibles for impairment on an annual basis in the fourth quarter of each fiscal year, and more frequently if events or changes in circumstances indicate that it might be impaired. We performed our annual goodwill impairment test during the fourth quarter of fiscal 2024 utilizing a qualitative analysis and concluded it was more likely than not the fair value of our wholesale reporting unit was greater than its respective carrying value and no impairment charge was required. We also performed our annual indefinite-lived intangible asset impairment test during the fourth quarter of fiscal 2024 utilizing a qualitative analysis and concluded it was more likely than not the fair value of our trade name was greater than its carrying value and no impairment charge was required. In performing the qualitative assessments, we considered such factors as macroeconomic conditions, industry and market conditions in which we operate including the competitive environment, significant adverse changes in customer demand, a product recall or an adverse action or assessment by a regulator. We also considered our stock price both in absolute terms and in relation to peer companies.
|
(11)
|
Restructuring and Other Charges, Net of Gains
|
Restructuring and other charges, net of gains, were as follows (in thousands):
| |
|
Fiscal Year Ended June 30,
|
|
| |
|
2024
|
|
|
2023
|
|
|
Gain on sale-leaseback transaction
|
|
$ |
(2,620 |
) |
|
$ |
(4,222 |
) |
|
Orleans, Vermont flood
|
|
|
2,243 |
|
|
|
- |
|
|
Gain on sale of property, plant and equipment
|
|
|
- |
|
|
|
(311 |
) |
|
Severance and other charges
|
|
|
300 |
|
|
|
813 |
|
|
Total Restructuring and other charges, net of gains
|
|
$ |
(77 |
) |
|
$ |
(3,720 |
) |
Activity within restructuring and other charges, net of gains is summarized in the table below (in thousands):
| |
|
Balance
|
|
|
Fiscal 2024 Activity
|
|
|
Balance
|
|
| |
|
June 30, 2023
|
|
|
Expense (Gain)
|
|
|
Non-Cash
|
|
|
Payments
|
|
|
Proceeds
|
|
|
June 30, 2024
|
|
|
Orleans, Vermont flood (1)
|
|
|
|
|
|
|
|
|
|
|
|
|
|
|
|
|
|
|
|
|
|
|
|
|
|
Inventory write-downs and overhead manufacturing costs
|
|
$ |
- |
|
|
$ |
1,426 |
|
|
$ |
1,426 |
|
|
$ |
- |
|
|
$ |
- |
|
|
$ |
- |
|
|
Repair and remediation costs
|
|
|
- |
|
|
|
2,416 |
|
|
|
- |
|
|
|
(2,215 |
) |
|
|
- |
|
|
|
201 |
(1) |
|
Insurance recoveries and grant proceeds (2)
|
|
|
- |
|
|
|
(1,599 |
) |
|
|
- |
|
|
|
- |
|
|
|
1,599 |
|
|
|
- |
|
|
Sub-total
|
|
$ |
- |
|
|
$ |
2,243 |
|
|
$ |
1,426 |
|
|
$ |
(2,215 |
) |
|
$ |
1,599 |
|
|
$ |
201 |
|
| |
|
|
|
|
|
|
|
|
|
|
|
|
|
|
|
|
|
|
|
|
|
|
|
|
|
Gain on sale-leaseback transaction
|
|
$ |
2,838 |
|
|
$ |
(2,620 |
) |
|
$ |
- |
|
|
$ |
- |
|
|
$ |
- |
|
|
$ |
218 |
(3) |
|
Severance and other charges
|
|
|
321 |
|
|
|
300 |
|
|
|
- |
|
|
|
(403 |
) |
|
|
- |
|
|
|
218 |
|
|
Total Restructuring and other charges, net of gains
|
|
$ |
3,159 |
|
|
$ |
(77 |
) |
|
$ |
1,426 |
|
|
$ |
(2,618 |
) |
|
$ |
1,599 |
|
|
$ |
637 |
|
|
(1)
|
In July 2023 our wood furniture manufacturing operations located in Orleans, Vermont sustained damage from flooding. In addition to losses related to wood furniture inventory parts and state-of-the-art manufacturing equipment, the flooding also resulted in a temporary work stoppage for many of our Vermont employees and a delay of shipments. Losses incurred from the disposal of damaged inventory, inoperable machinery equipment from water damage, facility cleanup, and restoration, was $2.2 million, net of insurance recoveries and grant proceeds. The remaining amount of repair costs to be paid at June 30, 2024 is accrued for within Accounts payable and accrued expenses.
|
|
(2)
|
The Vermont Department of Economic Development awarded Ethan Allen a $0.5 million grant through its Business Emergency Gap Assistance Program. Additional insurance proceeds totaling $1.1 million were received during fiscal 2024 from existing insurance policies. All of these proceeds were used toward the cleanup and restoration efforts.
|
|
(3)
|
In August 2022 we sold and subsequently leased back a retail design center and recognized a net gain of $4.2 million for the year ended June 30, 2023. The remaining deferred liability of $0.2 million at June 30, 2024 will be recognized over the remaining life of the lease. Refer to Note 6, Leases, for further discussion on the sale-leaseback transaction.
|
On January 26, 2022, the Company and most of its domestic subsidiaries (the “Loan Parties”) entered into a Third Amended and Restated Credit Agreement (the “Credit Agreement”) with JPMorgan Chase Bank, N.A. as administrative agent and syndication agent and Capital One, National Association, as documentation agent. The Credit Agreement amends and restates the Second Amended and Restated Credit Agreement, dated as of December 21, 2018, as amended. The Credit Agreement provides for a $125 million revolving credit facility (the “Facility”), subject to borrowing base availability, with a maturity date of January 26, 2027. The Credit Agreement also provides the Company with an option to increase the size of the facility up to an additional amount of $60 million. We incurred financing costs of $0.5 million during fiscal 2022, which are being amortized as interest expense within Interest expense and other financing costs in the consolidated statements of comprehensive income over the remaining life of the Credit Agreement using the effective interest method.
ETHAN ALLEN INTERIORS INC. AND SUBSIDIARIES
Availability. The availability of credit at any given time under the Facility will be constrained by the terms and conditions of the Credit Agreement, including the amount of collateral available, a borrowing base formula based upon numerous factors including the value of eligible inventory and eligible accounts receivable, and other restrictions contained in the Facility. All obligations under the Facility are secured by assets of the Loan Parties including inventory, receivables and certain types of intellectual property. Total borrowing base availability under the Facility was $121.0 million at June 30, 2024 and 2023.
Borrowings. At the Company’s option, borrowings under the Facility bear interest, based on the average quarterly availability, at an annual rate of either (a) Adjusted Term SOFR Rate (defined as the Term SOFR Rate for such interest period plus 0.10%) plus 1.25% to 2.0%, or (b) Alternate Base Rate (defined as the greatest of (i) the prime rate, (ii) the Federal Reserve Bank of New York (NYFRB) rate plus 0.5%, or (iii) the Adjusted Term SOFR Rate for a one-month interest period plus 1.0%) plus 0.25% to 1.0%. We had no outstanding borrowings under the Facility as of June 30, 2024 and 2023 or at any time during fiscal 2024 and 2023. Since we had no outstanding borrowings during fiscal 2024 and 2023, there was no associated interest expense during fiscal 2024 and 2023.
Covenants and Other Ratios. The Facility contains various restrictive and affirmative covenants, including required financial reporting, limitations on the ability to grant liens, make loans or other investments, incur additional debt, issue additional equity, merge or consolidate with or into another person, sell assets, pay dividends or make other distributions or enter into transactions with affiliates, along with other restrictions and limitations similar to those frequently found in credit agreements of this type and size. Loans under the Facility may become immediately due and payable upon certain events of default (including failure to comply with covenants, change of control or cross-defaults) as set forth in the Facility.
The Facility does not contain any significant financial ratio covenants or coverage ratio covenants other than a fixed charge coverage ratio covenant based on the ratio of (a) EBITDA, plus cash Rentals, minus Unfinanced Capital Expenditures to (b) Fixed Charges, as such terms are defined in the Facility. The fixed charge coverage ratio covenant, set at 1.0 to 1.0 and measured on a trailing period of four consecutive fiscal quarters, only applies in certain limited circumstances, including when the unused availability under the Facility drops below $14.0 million. At no point during fiscal 2024 or 2023, did the unused availability under the Facility fall below $14.0 million, thus the Fixed-Charge Coverage Ratio (FCCR) Covenant did not apply. At both June 30, 2024 and 2023, we were in compliance with all the covenants under the Facility.
Letters of Credit. At both June 30, 2024 and 2023, there were $4.0 million of standby letters of credit outstanding under the Facility.
|
(13)
|
Other Current and Long-term Liabilities
|
The following table summarizes the nature of the amounts within Other current liabilities (in thousands):
| |
|
June 30,
|
|
| |
|
2024
|
|
|
2023
|
|
| |
|
|
|
|
|
|
|
|
|
Income taxes payable
|
|
$ |
541 |
|
|
$ |
266 |
|
|
Deferred liability, short-term (1)
|
|
|
218 |
|
|
|
2,620 |
|
|
Financing lease liabilities, short-term
|
|
|
336 |
|
|
|
378 |
|
|
Customer financing program rebate
|
|
|
250 |
|
|
|
433 |
|
|
Other current liabilities
|
|
|
3,391 |
|
|
|
3,491 |
|
|
Other current liabilities
|
|
$ |
4,736 |
|
|
$ |
7,188 |
|
|
(1)
|
As of June 30, 2024, the deferred liability balance associated with the sale-leaseback transaction completed on August 1, 2022 was $0.2 million located in Other current liabilities on our consolidated balance sheets.
|
The following table summarizes the nature of the amounts within Other long-term liabilities (in thousands):
| |
|
June 30,
|
|
| |
|
2024
|
|
|
2023
|
|
| |
|
|
|
|
|
|
|
|
|
Unrecognized tax benefits
|
|
$ |
3,044 |
|
|
$ |
2,654 |
|
|
Customer financing program rebate
|
|
|
479 |
|
|
|
730 |
|
|
Financing lease liabilities, long-term
|
|
|
658 |
|
|
|
204 |
|
|
Other long-term liabilities
|
|
|
192 |
|
|
|
405 |
|
|
Other long-term liabilities
|
|
$ |
4,373 |
|
|
$ |
3,993 |
|
ETHAN ALLEN INTERIORS INC. AND SUBSIDIARIES
Income tax expense is based on taxable income determined in accordance with current enacted laws and tax rates. Deferred income taxes are recorded for the temporary differences between the financial statement and tax bases of assets and liabilities using currently enacted tax rates.
Income tax expense for the fiscal years ended June 30 were as follows (in thousands):
| |
|
2024
|
|
|
2023
|
|
|
2022
|
|
|
U.S. operations
|
|
$ |
83,362 |
|
|
$ |
138,941 |
|
|
$ |
135,077 |
|
|
Non-U.S. operations
|
|
|
2,084 |
|
|
|
2,084 |
|
|
|
3,044 |
|
|
Income before income taxes
|
|
$ |
85,446 |
|
|
$ |
141,025 |
|
|
$ |
138,121 |
|
| |
|
|
|
|
|
|
|
|
|
|
|
|
|
U.S. operations
|
|
$ |
21,001 |
|
|
$ |
34,679 |
|
|
$ |
34,682 |
|
|
Non-U.S. operations
|
|
|
629 |
|
|
|
539 |
|
|
|
159 |
|
|
Total income tax expense
|
|
$ |
21,630 |
|
|
$ |
35,218 |
|
|
$ |
34,841 |
|
|
Effective tax rate
|
|
|
25.3 |
% |
|
|
25.0 |
% |
|
|
25.2 |
% |
The components of income tax expense for the fiscal years ended June 30 were as follows (in thousands):
| |
|
2024
|
|
|
2023
|
|
|
2022
|
|
|
Current:
|
|
|
|
|
|
|
|
|
|
|
|
|
|
U.S. Federal
|
|
$ |
16,754 |
|
|
$ |
29,139 |
|
|
$ |
28,144 |
|
|
U.S. State and Local
|
|
|
4,150 |
|
|
|
7,076 |
|
|
|
6,474 |
|
|
Foreign
|
|
|
931 |
|
|
|
185 |
|
|
|
575 |
|
|
Total current
|
|
|
21,835 |
|
|
|
36,400 |
|
|
|
35,193 |
|
|
Deferred:
|
|
|
|
|
|
|
|
|
|
|
|
|
|
U.S. Federal
|
|
|
(20 |
) |
|
|
(1,362 |
) |
|
|
(610 |
) |
|
U.S. State and Local
|
|
|
117 |
|
|
|
(174 |
) |
|
|
674 |
|
|
Foreign
|
|
|
(302 |
) |
|
|
354 |
|
|
|
(416 |
) |
|
Total deferred
|
|
|
(205 |
) |
|
|
(1,182 |
) |
|
|
(352 |
) |
|
Total income tax expense
|
|
$ |
21,630 |
|
|
$ |
35,218 |
|
|
$ |
34,841 |
|
The following is a reconciliation of our effective tax rate to the U.S. federal income tax rate for the fiscal years ended June 30 (in thousands):
| |
|
2024
|
|
|
2023
|
|
|
2022
|
|
|
Income tax expense at U.S. Federal statutory tax rate
|
|
$ |
17,944 |
|
|
|
21.0 |
% |
|
$ |
29,616 |
|
|
|
21.0 |
% |
|
$ |
29,005 |
|
|
|
21.0 |
% |
|
Increase (decrease) in income taxes resulting from:
|
|
|
|
|
|
|
|
|
|
|
|
|
|
|
|
|
|
|
|
|
|
|
|
|
|
State and local income taxes, net of U.S. federal income benefit
|
|
|
2,749 |
|
|
|
3.2 |
% |
|
|
5,203 |
|
|
|
3.7 |
% |
|
|
5,208 |
|
|
|
3.8 |
% |
|
Change in valuation allowance
|
|
|
491 |
|
|
|
0.6 |
% |
|
|
- |
|
|
|
- |
|
|
|
(591 |
) |
|
|
(0.4% |
) |
|
Foreign derived intangible income ("FDII") deduction
|
|
|
(137 |
) |
|
|
(0.2% |
) |
|
|
428 |
|
|
|
0.3 |
% |
|
|
(289 |
) |
|
|
(0.2% |
) |
|
Unrecognized tax benefits
|
|
|
709 |
|
|
|
0.8 |
% |
|
|
(229 |
) |
|
|
(0.2% |
) |
|
|
390 |
|
|
|
0.3 |
% |
|
Share-based compensation
|
|
|
228 |
|
|
|
0.3 |
% |
|
|
5 |
|
|
|
- |
|
|
|
189 |
|
|
|
0.1 |
% |
|
Other, net
|
|
|
(354 |
) |
|
|
(0.4% |
) |
|
|
195 |
|
|
|
0.2 |
% |
|
|
929 |
|
|
|
0.6 |
% |
|
Total income tax expense (and corresponding effective tax rate)
|
|
$ |
21,630 |
|
|
|
25.3 |
% |
|
$ |
35,218 |
|
|
|
25.0 |
% |
|
$ |
34,841 |
|
|
|
25.2 |
% |
ETHAN ALLEN INTERIORS INC. AND SUBSIDIARIES
The significant components of deferred tax assets and liabilities were as follows (in thousands):
| |
|
June 30,
|
|
| |
|
2024
|
|
|
2023
|
|
|
Assets
|
|
|
|
|
|
|
|
|
|
Lease liabilities
|
|
$ |
32,050 |
|
|
$ |
32,411 |
|
|
Employee compensation
|
|
|
2,196 |
|
|
|
2,218 |
|
|
Share-based compensation
|
|
|
119 |
|
|
|
139 |
|
|
Net operating loss carryforwards
|
|
|
837 |
|
|
|
318 |
|
|
Property, plant and equipment
|
|
|
915 |
|
|
|
151 |
|
|
Valuation allowance
|
|
|
(491 |
) |
|
|
- |
|
|
Other
|
|
|
3,185 |
|
|
|
3,802 |
|
|
Total deferred tax assets
|
|
$ |
38,811 |
|
|
$ |
39,039 |
|
| |
|
|
|
|
|
|
|
|
|
Liabilities
|
|
|
|
|
|
|
|
|
|
Operating lease right-of-use assts
|
|
$ |
(28,490 |
) |
|
$ |
(28,724 |
) |
|
Intangible assets other than goodwill
|
|
|
(9,014 |
) |
|
|
(9,047 |
) |
|
Commissions
|
|
|
(2,868 |
) |
|
|
(3,032 |
) |
|
Other
|
|
|
(650 |
) |
|
|
(652 |
) |
|
Total deferred tax liabilities
|
|
|
(41,022 |
) |
|
|
(41,455 |
) |
|
Net deferred tax liabilities
|
|
$ |
(2,211 |
) |
|
$ |
(2,416 |
) |
The deferred tax assets at June 30, 2024 associated with net operating loss carryforwards and the related expiration dates are as follows (in thousands):
| |
|
Deferred
|
|
|
Net Operating
|
|
|
| |
|
Tax Assets
|
|
|
Loss Carryforwards
|
|
Expiration
|
|
Various U.S. net operating losses
|
|
$ |
657 |
|
|
$ |
8,907 |
|
Fiscal 2031-2040
|
|
Canada net operating loss
|
|
$ |
180 |
|
|
$ |
680 |
|
Fiscal 2039
|
We evaluate our deferred taxes to determine if the “more likely than not” standard of evidence has not been met thereby supporting the need for a valuation allowance. The evaluation of the amount of net deferred tax assets expected to be realized necessarily involves forecasting the amount of taxable income that will be generated in future years. We have forecasted future results using estimates management believes to be reasonable. Our forecasts are based on our best estimate of expected trends resulting from certain leading economic indicators. The realization of deferred income tax assets is dependent on future events. Actual results inevitably will vary from management's forecasts which may be impacted by a sustained economic downturn, or significantly extended economic recovery. Such variances could result in adjustments to the valuation allowance on deferred tax assets in future periods, and such adjustments could be material to the financial statements. A valuation allowance must be established for deferred tax assets when it is more likely than not that assets will not be realized. During fiscal 2024, we recorded a $0.5 million valuation allowance in our U.S. wholesale segment on deferred tax assets that are now not considered more likely than not to be realized.
Uncertain Tax Positions
We recognize interest and penalties related to income tax matters as a component of income tax expense. At June 30, 2024, we had gross unrecognized tax benefits totaling $3.9 million, an increase from $3.0 million as of June 30, 2023. A reconciliation of the beginning and ending amount of unrecognized tax benefits including related interest is as follows (in thousands):
| |
|
June 30,
|
|
| |
|
2024
|
|
|
2023
|
|
|
Beginning balance
|
|
$ |
3,000 |
|
|
$ |
2,474 |
|
|
Additions for tax positions related to the current year
|
|
|
891 |
|
|
|
817 |
|
|
Additions for tax positions of prior years
|
|
|
335 |
|
|
|
170 |
|
|
Reductions resulting from a lapse of the applicable statute of limitations
|
|
|
(338 |
) |
|
|
(461 |
) |
|
Ending balance
|
|
$ |
3,888 |
|
|
$ |
3,000 |
|
We had approximately $0.5 million and $0.3 million accrued for interest at June 30, 2024 and 2023, respectively. If the $3.9 million of unrecognized tax benefits and related interest and penalties at June 30, 2024 were recognized, approximately $3.1 million would be recorded as a benefit to income tax expense. It is reasonably possible that various issues relating to approximately $0.8 million of the total gross unrecognized tax benefits at June 30, 2024 will be resolved within the next twelve months as exams are completed or statutes expire. If recognized, approximately $0.7 million of unrecognized tax benefits would reduce our income tax expense in the period realized.
ETHAN ALLEN INTERIORS INC. AND SUBSIDIARIES
The Company conducts business globally and, as a result, the Company or one or more of its subsidiaries files income tax returns in the United States, various state, and foreign jurisdictions. In the normal course of business, our tax filings are subject to examination by federal, state, and foreign taxing authorities. As of June 30, 2024, our U.S. federal income tax return for the tax year of 2021 through the current period remain subject to examination. In addition, we conduct business in various states which are subject to audit from fiscal year 2018 to the current year. Our foreign operations in Canada are subject to examination from the 2020 year through the current period and from the 2018 year through the current period in Mexico. We are not subject to income tax in Honduras as we operate in a special economic zone.
|
(15)
|
Shareholders’ Equity
|
Shares Authorized for Issuance
Our authorized capital stock consists of 150,000,000 shares of common stock, par value $0.01 per share, and 1,055,000 shares of Preferred Stock, par value $0.01 per share. The Board of Directors may provide for the issuance of all or any shares of Preferred Stock in one or more classes or series, and to fix for each such class or series such voting powers, full or limited, or no voting powers, and such distinctive designations, preferences and relative, participating, optional or other special rights and such qualifications, limitations or restrictions thereof, as shall be stated and expressed in the resolution or resolutions adopted by the Board of Directors providing for the issuance of such class or series and as may be permitted by the General Corporation Law of the State of Delaware. At June 30, 2024 and 2023, there were no shares of Preferred Stock issued or outstanding.
Share Repurchase Program
There were no share repurchases under the Company’s existing multi-year share repurchase program during fiscal 2024, 2023 or 2022. At June 30, 2024, we had a remaining Board authorization to repurchase 2,007,364 shares of our common stock pursuant to our share repurchase program. There is no expiration date on the repurchase authorization. The timing and amount of any future share repurchases in the open market and through privately negotiated transactions will be determined by the Company’s officers at their discretion and based on a number of factors, including an evaluation of market and economic conditions while also maintaining financial flexibility.
Dividends
We paid four regular quarterly cash dividends and a special cash dividend during fiscal 2024. Total cash dividends paid to shareholders in fiscal 2024 were $1.97 per share and totaled $50.3 million. During fiscal 2023, total cash dividends paid were $46.4 million.
The following is a reconciliation of the numerators and denominators we used in our computations of basic and diluted EPS:
| |
|
Fiscal Year Ended June 30,
|
|
|
|
|
2024
|
|
|
2023
|
|
|
2022
|
|
| (in thousands, except per share data) |
|
|
|
|
|
|
|
|
|
|
Numerator (basic and diluted):
|
|
|
|
|
|
|
|
|
|
|
|
|
|
Net income available to common Shareholders
|
|
$ |
63,816 |
|
|
$ |
105,807 |
|
|
$ |
103,280 |
|
| |
|
|
|
|
|
|
|
|
|
|
|
|
|
Denominator:
|
|
|
|
|
|
|
|
|
|
|
|
|
|
Basic weighted average shares common shares outstanding
|
|
|
25,525 |
|
|
|
25,473 |
|
|
|
25,413 |
|
|
Dilutive effect of stock options and other share-based awards (1)
|
|
|
119 |
|
|
|
131 |
|
|
|
109 |
|
|
Diluted weighted average shares common shares outstanding
|
|
|
25,644 |
|
|
|
25,604 |
|
|
|
25,522 |
|
| |
|
|
|
|
|
|
|
|
|
|
|
|
|
Earnings per share:
|
|
|
|
|
|
|
|
|
|
|
|
|
|
Basic
|
|
$ |
2.50 |
|
|
$ |
4.15 |
|
|
$ |
4.06 |
|
|
Diluted
|
|
$ |
2.49 |
|
|
$ |
4.13 |
|
|
$ |
4.05 |
|
(1) Dilutive potential common shares consist of stock options, restricted stock units and performance units.
At June 30, 2024, 2023 and 2022, total share-based awards of 26,582, 39,065 and 65,545, respectively, were excluded from the diluted EPS calculations because their inclusion would have been anti-dilutive.
At June 30, 2024, 2023 and 2022, the number of performance units excluded from the calculation of diluted EPS was 142,535, 92,638 and 89,969, respectively. Contingently issuable shares with performance conditions are evaluated for inclusion in diluted EPS if, at the end of the current period, conditions would be satisfied as if it were the end of the contingency period.
ETHAN ALLEN INTERIORS INC. AND SUBSIDIARIES
|
(17)
|
Accumulated Other Comprehensive Loss
|
Accumulated other comprehensive loss consists of foreign currency translation adjustments and unrealized gains or losses on investments, net of tax. Foreign currency translation adjustments are the result of changes in foreign currency exchange rates related to our operations in Canada, Honduras and Mexico. Assets and liabilities are translated into U.S. dollars using the current period-end exchange rate and income and expense amounts are translated using the average exchange rate for the period in which the transaction occurred. Our investments at June 30, 2024 consist of United States Treasury Bills and Notes with maturities of two years or less. At June 30, 2023, our investments consisted of United States Treasury Bills with maturities of one year or less. All unrealized gains and losses are included, net of tax, in Accumulated other comprehensive loss, within the consolidated balance sheets. The tax effect of unrealized gains included in accumulated other comprehensive loss was $0.3 million and $0.2 million as of June 30, 2024 and 2023, respectively.
The components of accumulated other comprehensive loss are as follows (in thousands):
| |
|
June 30,
|
|
| |
|
2024
|
|
|
2023
|
|
|
Accumulated foreign currency translation adjustments
|
|
$ |
(5,085 |
) |
|
$ |
(3,219 |
) |
|
Accumulated unrealized gains on investments, net of tax
|
|
|
896 |
|
|
|
434 |
|
| |
|
$ |
(4,189 |
) |
|
$ |
(2,785 |
) |
The tax effect of unrealized gains on investments included in accumulated other comprehensive loss was $0.3 million and $0.2 million at June 30, 2024 and 2023, respectively.
The following table sets forth the activity in accumulated other comprehensive loss (in thousands):
| |
|
Fiscal Year Ended June 30,
|
|
| |
|
2024
|
|
|
2023
|
|
|
Beginning balance at July 1
|
|
$ |
(2,785 |
) |
|
$ |
(6,462 |
) |
|
Other comprehensive income (loss), net of tax
|
|
|
(1,446 |
) |
|
|
3,681 |
|
|
Less amounts attributable to noncontrolling interests
|
|
|
42 |
|
|
|
(4 |
) |
|
Ending balance at June 30
|
|
$ |
(4,189 |
) |
|
$ |
(2,785 |
) |
|
(18)
|
Share-Based Compensation
|
We recognized total share-based compensation expense of $1.4 million, $1.3 million and $1.1 million in fiscal 2024, 2023 and 2022, respectively. These amounts have been included in the consolidated statements of comprehensive income within SG&A expenses. At June 30, 2024, $1.5 million of total unrecognized compensation expense related to non-vested equity awards is expected to be recognized over a weighted average period of 1.6 years. There was no share-based compensation capitalized at June 30, 2024 and 2023.
At June 30, 2024, there were 1,262,786 shares of common stock available for future issuance pursuant to the Ethan Allen Interiors Inc. Stock Incentive Plan (the “Plan”). Under this Plan, the initial aggregate number of shares of common stock that may be issued through awards of any form was 6,487,867 shares. The Plan provides for the grant of stock options, restricted stock and stock units. The Plan also provides for the issuance of stock appreciation rights (“SARs”) on issued options, however no SARs have been issued to date. All share-based awards are approved by the Compensation Committee of the Board of Directors after consideration of recommendations proposed by the Chief Executive Officer. Stock options are granted with an exercise price equal to the market price of our common stock at the date of grant, vest ratably over a specified service period and have a contractual term of 10 years. Equity awards can also include performance vesting conditions. Company policy further requires an additional one-year holding period beyond the service vest date for executive officers and Board of Directors.
ETHAN ALLEN INTERIORS INC. AND SUBSIDIARIES
Stock Option Activity
A summary of stock option activity is presented below.
| |
|
|
|
|
|
|
|
|
|
Weighted
|
|
|
|
|
|
| |
|
|
|
|
|
Weighted
|
|
|
Average
|
|
|
|
|
|
| |
|
|
|
|
|
Average
|
|
|
Remaining
|
|
|
Aggregate
|
|
| |
|
|
|
|
|
Exercise
|
|
|
Contractual
|
|
|
Intrinsic Value
|
|
| |
|
Options
|
|
|
Price
|
|
|
Term (yrs)
|
|
|
($ in thousands)
|
|
|
Outstanding at June 30, 2021
|
|
|
253,955 |
|
|
$ |
23.10 |
|
|
|
5.6 |
|
|
$ |
1,368 |
|
|
Granted
|
|
|
25,410 |
|
|
$ |
23.61 |
|
|
|
n/a |
|
|
|
n/a |
|
|
Exercised
|
|
|
(55,220 |
) |
|
$ |
20.23 |
|
|
|
n/a |
|
|
$ |
287 |
|
|
Canceled (forfeited/expired)
|
|
|
(117,105 |
) |
|
$ |
23.98 |
|
|
|
n/a |
|
|
|
n/a |
|
|
Outstanding at June 30, 2022
|
|
|
107,040 |
|
|
$ |
23.75 |
|
|
|
4.4 |
|
|
$ |
120 |
|
|
Granted
|
|
|
23,970 |
|
|
$ |
25.03 |
|
|
|
n/a |
|
|
|
n/a |
|
|
Exercised
|
|
|
(2,666 |
) |
|
$ |
28.05 |
|
|
|
n/a |
|
|
$ |
4 |
|
|
Canceled (forfeited/expired)
|
|
|
(13,507 |
) |
|
$ |
23.64 |
|
|
|
n/a |
|
|
|
n/a |
|
|
Outstanding at June 30, 2023
|
|
|
114,837 |
|
|
$ |
23.93 |
|
|
|
4.8 |
|
|
$ |
560 |
|
|
Granted
|
|
|
14,330 |
|
|
$ |
34.89 |
|
|
|
n/a |
|
|
|
n/a |
|
|
Exercised
|
|
|
(19,998 |
) |
|
$ |
25.43 |
|
|
|
n/a |
|
|
$ |
102 |
|
|
Canceled (forfeited/expired)
|
|
|
(5,022 |
) |
|
$ |
28.60 |
|
|
|
n/a |
|
|
|
n/a |
|
|
Outstanding at June 30, 2024
|
|
|
104,147 |
|
|
$ |
23.93 |
|
|
|
5.4 |
|
|
$ |
470 |
|
|
Exercisable at June 30, 2024
|
|
|
73,678 |
|
|
$ |
24.22 |
|
|
|
4.2 |
|
|
$ |
421 |
|
The aggregate intrinsic value of stock options exercised during fiscal 2024, 2023 and 2022 was $0.1 million, less than $0.1 million and $0.3 million, respectively. We received proceeds from employee stock option exercises of $0.5 million, $0.1 million, and $1.1 million during fiscal 2024, 2023 and 2022, respectively.
A summary of the nonvested shares at June 30, 2024 and changes during the fiscal year then ended is presented below.
| |
|
|
|
|
|
Weighted Average
|
|
| |
|
Options
|
|
|
Exercise Price
|
|
|
Nonvested at June 30, 2023
|
|
|
29,733 |
|
|
$ |
23.09 |
|
|
Granted
|
|
|
14,330 |
|
|
$ |
34.89 |
|
|
Vested
|
|
|
(13,594 |
) |
|
$ |
21.09 |
|
|
Canceled (forfeited)
|
|
|
- |
|
|
$ |
- |
|
|
Nonvested at June 30, 2024
|
|
|
30,469 |
|
|
$ |
29.54 |
|
At June 30, 2024, $0.1 million of total unrecognized compensation expense related to non-vested stock options is expected to be recognized over a weighted average remaining period of 1.8 years.
Employee Stock Option Grants. There were no stock option awards granted to employees during fiscal 2024, 2023 or 2022.
Non-Employee Stock Option Grants. The Plan also provides for the grant of share-based awards to non-employee (independent) directors of the Company. During the first quarter of fiscal 2024, we granted 14,330 stock options at an exercise price of $34.89 to our non-employee directors. These stock options vest in three annual installments beginning on the first anniversary of the date of grant so long as the director continues to serve on our Board. All options granted to directors have an exercise price equal to the fair market value of our common stock on the date of grant and remain exercisable for a period of up to ten years, subject to continuous service on our Board.
Non-employee (independent) directors were granted stock options during the first quarter of each fiscal year presented and valued using the Black-Scholes option pricing model with the following assumptions:
| |
|
2024
|
|
|
2023
|
|
|
2022
|
|
|
Volatility
|
|
|
40.5 |
% |
|
|
41.6 |
% |
|
|
39.3 |
% |
|
Risk-free rate of return
|
|
|
3.98 |
% |
|
|
2.92 |
% |
|
|
0.73 |
% |
|
Dividend yield
|
|
|
4.70 |
% |
|
|
4.25 |
% |
|
|
3.79 |
% |
|
Expected average life (years)
|
|
|
5.5 |
|
|
|
4.9 |
|
|
|
5.5 |
|
|
Grant date fair value
|
|
$ |
8.65 |
|
|
$ |
5.98 |
|
|
$ |
5.04 |
|
|
Fair value as a % of exercise price
|
|
|
24.8 |
% |
|
|
23.9 |
% |
|
|
21.3 |
% |
ETHAN ALLEN INTERIORS INC. AND SUBSIDIARIES
There were no other non-employee stock option grants during fiscal 2024, 2023 or 2022.
Restricted Stock Unit (“RSU”) Activity
A summary of RSU activity is presented below.
| |
|
Restricted
|
|
|
Weighted
Average
|
|
| |
|
Stock Units
|
|
|
Fair Value
|
|
|
Outstanding at June 30, 2021
|
|
|
71,000 |
|
|
$ |
9.38 |
|
|
Granted
|
|
|
51,100 |
|
|
$ |
20.71 |
|
|
Vested
|
|
|
(29,000 |
) |
|
$ |
9.43 |
|
|
Canceled (forfeited)
|
|
|
(17,000 |
) |
|
$ |
12.66 |
|
|
Outstanding at June 30, 2022
|
|
|
76,100 |
|
|
$ |
16.23 |
|
|
Granted
|
|
|
21,257 |
|
|
$ |
19.48 |
|
|
Vested
|
|
|
(32,150 |
) |
|
$ |
13.47 |
|
|
Canceled (forfeited)
|
|
|
(11,344 |
) |
|
$ |
18.16 |
|
|
Outstanding at June 30, 2023
|
|
|
53,863 |
|
|
$ |
18.76 |
|
|
Granted
|
|
|
17,232 |
|
|
$ |
28.58 |
|
|
Vested
|
|
|
(22,037 |
) |
|
$ |
16.98 |
|
|
Canceled (forfeited)
|
|
|
(2,750 |
) |
|
$ |
16.18 |
|
|
Outstanding at June 30, 2024
|
|
|
46,308 |
|
|
$ |
23.42 |
|
During fiscal 2024 we granted 17,232 non-performance based RSUs with a weighted average grant date fair value of $28.58. The RSUs granted to employees entitle the holder to receive the underlying shares of common stock as the unit vests over the relevant vesting period. The RSUs do not entitle the holder to receive dividends declared on the underlying shares while the RSUs remain unvested and vest in three equal annual installments on the anniversary of the date of grant. We account for these RSUs as equity-based awards because when they vest, they will be settled in shares of our common stock. The grant date fair value of RSUs is measured by reducing the grant date price of the Company's common stock by the present value of the dividends expected to be paid on the underlying stock during the requisite service period, discounted at the appropriate risk-free interest rate.
As of June 30, 2024, $0.7 million of total unrecognized compensation expense related to non-vested RSUs is expected to be recognized over a weighted average remaining period of 1.6 years. A total of 22,037 RSUs vested with an aggregate fair value of $0.7 million during fiscal 2024 compared to 32,150 RSUs vesting in fiscal 2023 with a total fair value of $0.9 million.
Performance Stock Unit (“PSU”) Activity
The following table summarizes PSU activity at the maximum award amounts:
| |
|
|
|
|
|
Weighted Average
|
|
| |
|
|
|
|
|
Grant Date
|
|
| |
|
Units
|
|
|
Fair Value
|
|
|
Outstanding at June 30, 2021
|
|
|
377,867 |
|
|
$ |
15.98 |
|
|
Granted
|
|
|
90,367 |
|
|
$ |
17.15 |
|
|
Vested
|
|
|
(35,124 |
) |
|
$ |
18.19 |
|
|
Canceled (forfeited)
|
|
|
(112,975 |
) |
|
$ |
11.86 |
|
|
Outstanding at June 30, 2022
|
|
|
320,135 |
|
|
$ |
17.53 |
|
|
Granted
|
|
|
103,096 |
|
|
$ |
18.75 |
|
|
Vested
|
|
|
(31,635 |
) |
|
$ |
12.53 |
|
|
Canceled (forfeited)
|
|
|
(4,600 |
) |
|
$ |
18.75 |
|
|
Outstanding at June 30, 2023
|
|
|
386,996 |
|
|
$ |
18.25 |
|
|
Granted
|
|
|
73,095 |
|
|
$ |
27.58 |
|
|
Vested
|
|
|
(81,250 |
) |
|
$ |
8.77 |
|
|
Canceled (forfeited)
|
|
|
(13,000 |
) |
|
$ |
16.88 |
|
|
Outstanding at June 30, 2024
|
|
|
365,841 |
|
|
$ |
22.27 |
|
ETHAN ALLEN INTERIORS INC. AND SUBSIDIARIES
Share-based compensation expense related to PSUs recognized in our consolidated statements of comprehensive income are presented in the following table (in thousands).
| |
|
Fiscal Year Ended June 30,
|
|
| |
|
2024
|
|
|
2023
|
|
|
2022
|
|
|
Fiscal 2021 grants
|
|
$ |
- |
|
|
$ |
236 |
|
|
$ |
143 |
|
|
Fiscal 2022 grants
|
|
|
384 |
|
|
|
317 |
|
|
|
413 |
|
|
Fiscal 2023 grants
|
|
|
321 |
|
|
|
280 |
|
|
|
- |
|
|
Fiscal 2024 grants
|
|
|
167 |
|
|
|
- |
|
|
|
- |
|
|
Total expense
|
|
$ |
872 |
|
|
$ |
833 |
|
|
$ |
556 |
|
As of June 30, 2024, $0.7 million of total unrecognized compensation expense related to non-vested PSUs is expected to be recognized over a weighted average remaining period of 1.5 years.
Under the Plan, the Compensation Committee of the Board of Directors is authorized to award common shares to certain employees based on the attainment of certain financial goals over a given performance period. The awards are offered at no cost to the employees. In the event of an employee's termination during the performance period, the right to earn shares under this program is forfeited.
Payout of PSU grants depend on the attainment of certain financial and shareholder-return goals over a specific performance period, which is generally three fiscal years. The number of awards that will vest, as well as unearned and canceled awards, depend on the achievement of certain financial and shareholder-return goals over the three-year performance periods, and will be settled in shares if service conditions are met, requiring employees to remain employed with us through the end of the three-year performance periods. We account for PSU awards as equity-based awards because upon vesting, they will be settled in common shares. We expense as compensation cost the fair value of the PSUs as of the grant date and amortize expense ratably over the total performance and time vest period, considering the probability that we will satisfy the performance goals.
During fiscal 2024 we granted 73,095 PSUs. The weighted average assumptions used for PSUs granted during fiscal 2024, 2023 and 2022, respectively, are presented below.
| |
|
Fiscal Year Ended June 30,
|
|
| |
|
2024
|
|
|
2023
|
|
|
2022
|
|
|
Volatility
|
|
|
37.9 |
% |
|
|
47.7 |
% |
|
|
43.3 |
% |
|
Risk-free rate of return
|
|
|
4.28 |
% |
|
|
3.16 |
% |
|
|
0.62 |
% |
|
Dividend yield
|
|
|
4.70 |
% |
|
|
4.25 |
% |
|
|
3.79 |
% |
|
(19)
|
Employee Retirement Programs
|
The Company established its Ethan Allen Retirement Savings Plan (the “401(k) Plan”) in 1994. The 401(k) Plan is a defined contribution plan subject to the provisions of the Employee Retirement Income Security Act of 1974 and the Internal Revenue Code of 1986 (“IRC”). All full-time U.S. employees of the Company are eligible to participate in the Plan on the first day of employment. Each year, participants may contribute up to 100% of their eligible annual compensation, subject to annual limitations established by the IRC. We may, at our discretion, make matching and profit-sharing contributions to the 401(k) Plan on behalf of each eligible participant. All participants shall cliff vest 100% of Company matching and profit-sharing contributions received after three years of service. Total defined contribution plan expense incurred by the Company in matching and profit-sharing contributions to employee 401(k) accounts during fiscal 2024, 2023 and 2022, was $2.3 million, $2.7 million and $2.6 million, respectively.
Ethan Allen conducts business globally and has strategically aligned its business into two reportable segments: Wholesale and Retail. These two segments represent strategic business areas of our vertically integrated enterprise that operate separately and provide their own distinctive services. Our operating segments are aligned with how the Company, including our chief operating decision maker, manages the business. We evaluate performance of the respective segments based upon sales and operating income. The accounting policies of the operating segments are the same as those described in Note 3, Summary of Significant Accounting Policies.
ETHAN ALLEN INTERIORS INC. AND SUBSIDIARIES
Wholesale Segment. The wholesale segment is principally involved in the development of the Ethan Allen brand and encompasses all aspects of design, manufacturing, sourcing, marketing, sale and distribution of our broad range of home furnishings and accents. Wholesale revenue is recorded upon the shipment of our products to our retail network of independently operated design centers, Company-operated design centers, and other third-party contract business customers and accounted for 16.4% of net sales during fiscal 2024 compared to 16.3% in the prior year period. Our wholesale segment’s net sales include sales to our retail segment, which are eliminated in consolidation. Our ten largest customers were all within our wholesale segment and accounted for 22% of wholesale sales during fiscal 2024 compared with 21% of wholesale sales during fiscal 2023. These customers were nine independent retailers and the United States government GSA, which individually represented 7% of our consolidated net sales in fiscal 2024.
Within the wholesale segment, we record revenue information according to each respective product line (i.e. case goods, upholstery and home accents). Wholesale profitability includes (i) the wholesale gross margin, which represents the difference between the wholesale net sales price and the cost associated with manufacturing and/or sourcing the related product, and (ii) other operating costs associated with wholesale segment activities. The wholesale segment’s product line revenue, expressed as a percentage of net sales during fiscal 2024, is comprised of 49% upholstered products, 32% case goods and the remaining 19% home accents and other.
Our independent retailers are required to enter into license agreements with us, which authorize the use of certain Ethan Allen trademarks and require adherence to certain standards of operation, including a requirement to fulfill related warranty service agreements. We are not subject to any territorial or exclusive retailer agreements in North America.
Retail Segment. The retail segment sells home furnishings and accents to clients through 142 Company-operated design centers and accounted for 83.6% of net sales during fiscal 2024 compared to 83.7% in the prior year period. Ethan Allen design centers are typically located in busy retail settings as freestanding destinations or as part of town centers, lifestyle centers, and suburban shopping malls, and average approximately 13,800 square feet in size. Over the past 10 years, 43% of our design centers are new or have been relocated as we continually evaluate our retail footprint. Other initiatives include regularly updating presentations and floor plans, strengthening the qualifications of our designers through training and certifications and combining technology with personal service in our design centers, which has also allowed us to reduce headcount and the size of our design centers. In the past five years, we have either opened or relocated 20 design centers with an average size of 7,600 square feet. These smaller footprint design centers reflect our shift to lifestyle centers that better project our brand and offer increased traffic opportunities. During fiscal 2024, we strategically relocated two design centers (New York, NY and Louisville, KY), to locations that have bright, open, and modern layout designs. The geographic distribution of our retail design center locations is disclosed under Item 2, Properties, contained in Part I of this Annual Report on Form 10-K.
Retail segment revenue is recorded upon the delivery of our products to our retail customers. Retail profitability reflects (i) the retail gross margin, which represents the difference between the retail net sales price and the cost of goods, purchased from the wholesale segment, and (ii) other operating costs associated with retail segment activities. We measure the performance of our design centers primarily based on net sales and operating income on a comparable period basis. The frequency and timing of our promotional events can affect comparability during a given period. Due to the nature of the business in which the retail segment operates, there are no customer concentration risks. The retail segment’s product line revenue, expressed as a percentage of net sales during fiscal 2024, is comprised of 50% upholstered products, 28% case goods and the remaining 22% home accents and other.
Intersegment. We account for intersegment sales transactions between our segments consistent with independent third-party transactions, that is, at current market prices. As a result, the manufacturing profit related to sales to our retail segment is included within our wholesale segment. Operating income realized on intersegment revenue transactions is therefore generally consistent with the operating income realized on our revenue from independent third-party transactions. Segment operating income is based on profit or loss from operations before interest and other financing costs, interest and other income, net and income taxes. Sales are attributed to countries on the basis of the customer's location.
ETHAN ALLEN INTERIORS INC. AND SUBSIDIARIES
Information for each of the last three fiscal years is provided below (in thousands):
| |
|
Fiscal Year Ended June 30,
|
|
| |
|
2024
|
|
|
2023
|
|
|
2022
|
|
|
Net sales
|
|
|
|
|
|
|
|
|
|
|
|
|
|
Wholesale segment
|
|
$ |
371,087 |
|
|
$ |
449,591 |
|
|
$ |
483,842 |
|
|
Less: intersegment sales
|
|
|
(265,416 |
) |
|
|
(320,764 |
) |
|
|
(355,964 |
) |
|
Wholesale sales to external customers
|
|
|
105,671 |
|
|
|
128,827 |
|
|
|
127,878 |
|
|
Retail segment
|
|
|
540,550 |
|
|
|
662,555 |
|
|
|
689,884 |
|
|
Consolidated total
|
|
$ |
646,221 |
|
|
$ |
791,382 |
|
|
$ |
817,762 |
|
| |
|
|
|
|
|
|
|
|
|
|
|
|
|
Income before income taxes
|
|
|
|
|
|
|
|
|
|
|
|
|
|
Wholesale segment
|
|
$ |
48,707 |
|
|
$ |
68,792 |
|
|
$ |
63,930 |
|
|
Retail segment
|
|
|
24,704 |
|
|
|
67,256 |
|
|
|
80,496 |
|
|
Elimination of intercompany profit(a)
|
|
|
4,580 |
|
|
|
1,148 |
|
|
|
(6,176 |
) |
|
Operating income
|
|
|
77,991 |
|
|
|
137,196 |
|
|
|
138,250 |
|
|
Interest and other income, net
|
|
|
7,700 |
|
|
|
4,042 |
|
|
|
72 |
|
|
Interest and other financing costs
|
|
|
245 |
|
|
|
213 |
|
|
|
201 |
|
|
Consolidated total
|
|
$ |
85,446 |
|
|
$ |
141,025 |
|
|
$ |
138,121 |
|
| |
|
|
|
|
|
|
|
|
|
|
|
|
|
Depreciation and amortization
|
|
|
|
|
|
|
|
|
|
|
|
|
|
Wholesale segment
|
|
$ |
6,336 |
|
|
$ |
6,328 |
|
|
$ |
6,439 |
|
|
Retail segment
|
|
|
9,620 |
|
|
|
9,286 |
|
|
|
9,548 |
|
|
Consolidated total
|
|
$ |
15,956 |
|
|
$ |
15,614 |
|
|
$ |
15,987 |
|
| |
|
|
|
|
|
|
|
|
|
|
|
|
|
Capital expenditures
|
|
|
|
|
|
|
|
|
|
|
|
|
|
Wholesale segment
|
|
$ |
4,240 |
|
|
$ |
6,787 |
|
|
$ |
8,125 |
|
|
Retail segment
|
|
|
5,366 |
|
|
|
7,098 |
|
|
|
5,262 |
|
|
Consolidated total
|
|
$ |
9,606 |
|
|
$ |
13,885 |
|
|
$ |
13,387 |
|
|
(a)
|
Represents the change in wholesale profit contained in the retail segment inventory at the end of the period.
|
| |
|
June 30,
|
|
|
(in thousands)
|
|
2024
|
|
|
2023
|
|
|
2022
|
|
|
Total Assets
|
|
|
|
|
|
|
|
|
|
|
|
|
|
Wholesale segment
|
|
$ |
379,693 |
|
|
$ |
373,921 |
|
|
$ |
341,466 |
|
|
Retail segment
|
|
|
392,243 |
|
|
|
403,651 |
|
|
|
412,176 |
|
|
Inventory profit elimination(a)
|
|
|
(27,019 |
) |
|
|
(32,119 |
) |
|
|
(33,747 |
) |
|
Consolidated total
|
|
$ |
744,917 |
|
|
$ |
745,453 |
|
|
$ |
719,895 |
|
|
(a)
|
Represents the wholesale profit contained in the retail segment inventory that has not yet been realized. These profits are realized when the related inventory is sold.
|
Geographic Information
Our international net sales are comprised of our wholesale segment sales to independent retailers and our retail segment sales to customers through our Company-operated design centers in Canada.
The following table sets forth consolidated net sales by geographic area for each of the past three fiscal years:
| |
|
Fiscal Year Ended June 30,
|
|
|
|
|
2024
|
|
|
2023
|
|
|
2022
|
|
| Sales by Country |
|
|
|
|
|
|
|
|
|
|
United States
|
|
|
96.7 |
% |
|
|
97.0 |
% |
|
|
96.0 |
% |
|
All Others
|
|
|
3.3 |
% |
|
|
3.0 |
% |
|
|
4.0 |
% |
ETHAN ALLEN INTERIORS INC. AND SUBSIDIARIES
The following table sets forth long-lived assets by geographic area at June 30 (in thousands):
| |
|
2024
|
|
|
2023
|
|
|
2022
|
|
|
United States
|
|
$ |
296,849 |
|
|
$ |
301,951 |
|
|
$ |
295,747 |
|
|
Mexico
|
|
|
17,986 |
|
|
|
20,695 |
|
|
|
15,085 |
|
|
Honduras
|
|
|
11,245 |
|
|
|
10,686 |
|
|
|
9,967 |
|
|
Canada
|
|
|
3,420 |
|
|
|
4,696 |
|
|
|
3,513 |
|
|
Total long-lived assets(1)
|
|
$ |
329,500 |
|
|
$ |
338,028 |
|
|
$ |
324,312 |
|
|
(1)
|
Long-lived assets consist of property, plant and equipment and operating lease right-of-use assets and exclude goodwill, intangible assets, deferred income taxes and other assets.
|
|
(21)
|
Commitments and Contingencies
|
Commitments represent obligations, such as those for future purchases of goods or services that are not yet recorded on the balance sheet as liabilities. We record liabilities for commitments when incurred (specifically when the goods or services are received). Fluctuations in our operating results, levels of inventory on hand, the degree of success of our accounts receivable collection efforts, the timing of tax and other payments, as well as capital expenditures will impact our liquidity and cash flows in future periods. The effect of our commitments, including contractual obligations, on our liquidity and capital resources in future periods should be considered in conjunction with the factors mentioned here.
Lease Commitments
We enter into operating and financing leases in the normal course of business. Most lease arrangements provide us with the option to renew the leases at defined terms. Refer to Note 6, Leases, for further lease details.
Purchase Commitments with Suppliers
Purchase obligations are defined as agreements that are enforceable and legally binding that specify all significant terms, including fixed or minimum quantities to be purchased; fixed, minimum or variable price provisions; and the approximate timing of the transaction. We do, in the normal course of business, initiate purchase orders for the procurement of selected finished goods sourced from third-party suppliers, lumber, fabric, leather and other raw materials used in production, and certain outsourced services. All purchase orders are based on current needs and are fulfilled by suppliers. Our open purchase orders with respect to such goods and services was $30.7 million at June 30, 2024 and are expected to be paid in the next 12 months.
Other Purchase Commitments
Other purchase commitments represent payment due for services such as telecommunication, computer-related software, finance and accounting services, web development, insurance and other maintenance contracts. These commitments are generally payable within one year and totaled $14.9 million at June 30, 2024.
Legal Matters
We are routinely party to various legal proceedings in the ordinary course of business, including investigations or as a defendant in litigation. Such legal proceedings may include claims related to our employment practices; wage and hour claims; claims of intellectual property infringement, including with respect to patents; and consumer action claims relating to our consumer products and practices. In addition, from time to time, we are subject to actions commenced by third-parties such as product liability claims for products we manufacture and sell, personal injury claims and allegations that properties we operate do not comply with legally required access requirements for persons with disabilities. We could also face a wide variety of employee claims against us, including general discrimination, privacy, labor and employment, ERISA and disability claims. We are also subject to various federal, state and local environmental protection laws and regulations and are involved, from time to time, in investigations and proceedings regarding environmental matters. Such environmental investigations and proceedings typically concern air emissions, water discharges, and/or management of solid and hazardous wastes. We believe that our facilities are in material compliance with all such applicable laws and regulations.
On a quarterly basis, we review our litigation activities and determine if an unfavorable outcome to us is considered “remote”, “reasonably possible” or “probable” as defined by ASC 450, Contingencies. Where we determine an unfavorable outcome is probable and is reasonably estimable, we accrue for potential litigation losses. Although the outcome of the various claims and proceedings against us cannot be predicted with certainty, management believes that, based on information available at June 30, 2024, the likelihood is remote that any existing claims or proceedings, individually or in the aggregate, will have a material adverse effect on our financial position, results of operations or cash flows.
ETHAN ALLEN INTERIORS INC. AND SUBSIDIARIES
Indemnifications
As permitted or required under Delaware law and to the maximum extent allowable under that law, the Company has certain obligations to indemnify its current and former officers and directors for certain events or occurrences while the officer or director is, or was serving, at our request in such capacity. These indemnification obligations are valid as long as the director or officer acted in good faith and in a manner the person reasonably believed to be in, or not opposed to, the best interests of the Company, and with respect to any criminal action or proceeding, had no reasonable cause to believe his or her conduct was unlawful. The maximum potential amount of future payments Ethan Allen could be required to make under these indemnification obligations is unlimited; however, the Company has a director and officer insurance policy that it believes mitigates our exposure and may enable us to recover a portion of any future amounts paid.
ETHAN ALLEN INTERIORS INC. AND SUBSIDIARIES
ITEM 9. CHANGES IN AND DISAGREEMENTS WITH ACCOUNTANTS ON ACCOUNTING AND FINANCIAL DISCLOSURE
None.
ITEM 9A. CONTROLS AND PROCEDURES
Disclosure Controls and Procedures
Our management, with the participation of our Chairman of the Board, President and Chief Executive Officer (“CEO”) and Senior Vice President, Chief Financial Officer and Treasurer (“CFO”), has evaluated the effectiveness of the design and operation of our disclosure controls and procedures pursuant to Rules 13a-15(e) and 15d-15(e) under the Exchange Act, as of the end of the period covered by this Annual Report on Form 10-K. Based on that evaluation, our CEO and CFO have concluded that, as of June 30, 2024, our disclosure controls and procedures are effective to provide reasonable assurance that information relating to us (including our consolidated subsidiaries), which is required to be disclosed by us in reports that we file or submit under the Exchange Act is recorded, processed, summarized and reported within the time periods specified in the SEC’s rules and forms, and is accumulated and communicated to our management, including the CEO and CFO, as appropriate, to allow timely decisions regarding required disclosure.
Management's Report on Internal Control over Financial Reporting
Our management report on internal control over financial reporting is included under Part II, Item 8 of this Annual Report on Form 10-K.
Report of Independent Registered Public Accounting Firm
The effectiveness of our internal control over financial reporting as of June 30, 2024 has been audited by CohnReznick LLP, an independent registered public accounting firm, as stated in their report which appears under Part II, Item 8 of this Annual Report on Form 10-K.
Changes in Internal Control over Financial Reporting
There were no changes in our internal control over financial reporting (as such term is defined in Rules 13a-15(f) and 15d-15(f) under the Exchange Act) during the fourth quarter of fiscal 2024 that have materially affected, or are reasonably likely to materially affect, our internal control over financial reporting.
ITEM 9B. OTHER INFORMATION
During the fourth quarter of fiscal 2024, none of our directors or officers (as defined in Section 16 of the Securities Exchange Act of 1934, as amended), adopted or terminated a “Rule 10b5-1 trading arrangement” or “non-Rule 10b5-1 trading arrangement” (as defined in Item 408 of Regulation S-K).
ITEM 9C. DISCLOSURE REGARDING FOREIGN JURISDICTIONS THAT PREVENT INSPECTIONS
Not applicable.
ETHAN ALLEN INTERIORS INC. AND SUBSIDIARIES
PART III
ITEM 10. DIRECTORS, EXECUTIVE OFFICERS AND CORPORATE GOVERNANCE
Code of Ethics
We have adopted a Code of Business Conduct and Ethics that applies to all of our directors, officers and employees. A copy of this code of conduct is available at the Investor Relations section of our website at https://ir.ethanallen.com/corporate-governance/governance-documents. We intend to satisfy any disclosure requirements of Form 8-K and/or the NYSE rules regarding disclosure of certain amendments to, or waivers from, a provision of this Code of Business Conduct and Ethics (to the extent covered by such requirements/rules) by posting such information on our website at the address and general location specified above within four business days of the date of such amendment or waiver.
Information contained on, or connected to, our website is not incorporated by reference into this Annual Report on Form 10-K and should not be considered part of this or any other report that we file with, or furnish to, the SEC.
Policy Prohibiting Insider Trading and Related Procedures
Ethan Allen is committed to promoting high standards of ethical business conduct and compliance with applicable laws, rules and regulations. As part of this commitment, we have an Insider Trading Policy governing the purchase, sale, and/or other dispositions of our securities by our directors, officers, employees and third-party contractors, that we believe is reasonably designed to promote compliance with insider trading laws, rules and regulations, and the exchange listing standards applicable to us. A copy of our Insider Trading Policy was previously filed with the SEC on August 24, 2023 as Exhibit 19.1 to our Annual Report on Form 10-K for the fiscal year ended June 30, 2023 and is incorporated herein by reference.
Executive Officers of the Company
We have provided information about our executive officers under the heading Information about our Executive Officers in Part I of this Annual Report on Form 10-K. All other remaining information required by this item will be included in our proxy statement for our 2024 Annual Meeting of Stockholders and is incorporated in this item by reference.
Directors of the Company
The information required by this item will be included in our proxy statement for our 2024 Annual Meeting of Stockholders and is incorporated in this item by reference.
ITEM 11. EXECUTIVE COMPENSATION
The information required by this item will be included in our proxy statement for our 2024 Annual Meeting of Stockholders and is incorporated in this item by reference.
ITEM 12. SECURITY OWNERSHIP OF CERTAIN BENEFICIAL OWNERS AND MANAGEMENT AND RELATED STOCKHOLDER MATTERS
Security Ownership of Certain Beneficial Owners and Management
The information required by this item relating to security ownership of certain beneficial owners and management will be included in our proxy statement for our 2024 Annual Meeting of Stockholders and is incorporated herein by reference.
ETHAN ALLEN INTERIORS INC. AND SUBSIDIARIES
Equity Compensation Plan Information
The following table summarizes, as of June 30, 2024, the number of outstanding equity awards granted to employees and non-employee directors, as well as the number of equity awards remaining available for future issuance, under our equity compensation plans:
|
Plan Category
|
(a)
Number of securities to
be issued upon exercise
of outstanding options,
warrants and rights
|
|
(b)
Weighted average
exercise price of
outstanding options,
warrants and rights
|
|
(c)
Number of securities remaining
available for future issuance under
equity compensation plans (excluding
securities reflected in column (a))
|
|
|
Equity compensation plans approved by security holders
|
516,296(1)
|
|
$24.92(2)
|
|
1,262,786
|
|
|
Equity compensation plans not approved by security holders(3)
|
-
|
|
-
|
|
-
|
|
|
Total
|
516,296
|
|
$24.92
|
|
1,262,786
|
|
| |
(1)
|
Amount includes stock options outstanding under the Company’s Stock Incentive Plan as well as outstanding restricted stock units and performance units which have been provided for under the Company’s Stock Incentive Plan.
|
| |
(2)
|
Calculated without taking into account shares of Company common stock subject to outstanding restricted stock units and performance units that will become issuable as they vest, without any cash consideration or other payment required for such shares.
|
| |
(3)
|
As of June 30, 2024, we did not maintain any equity compensation plans that have not been approved by our shareholders.
|
ITEM 13. CERTAIN RELATIONSHIPS AND RELATED TRANSACTIONS, AND DIRECTOR INDEPENDENCE
The information required by this item will be included in our proxy statement and is incorporated in this item by reference.
ITEM 14. PRINCIPAL ACCOUNTANT FEES AND SERVICES
Information concerning fees and services provided by our principal accountant, CohnReznick LLP, New York, New York (PCAOB ID: 596), will be included in our proxy statement for our 2024 Annual Meeting of Stockholders and is incorporated herein by reference.
ETHAN ALLEN INTERIORS INC. AND SUBSIDIARIES
PART IV
ITEM 15. EXHIBITS AND FINANCIAL STATEMENT SCHEDULES
|
(a)
|
The following documents are filed as part of this Annual Report on Form 10-K:
|
The information required by this item is included in Item 8. Financial Statements and Supplementary Data, of this Annual Report on Form 10-K which is incorporated herein.
| |
(2)
|
Financial Statement Schedules
|
Separate financial statement schedules have been omitted either because they are not applicable or because the required information is included in the consolidated financial statements or notes described in Item 15(a)(1) above.
The information required by this item is set forth below.
| |
|
|
Incorporated by Reference
|
|
|
Exhibit
Number
|
|
Exhibit Description
|
|
Form
|
File No.
|
Exhibit
|
Filing
Date
|
Filed
Herewith
|
|
3.1
|
|
Amended and Restated Certificate of Incorporation
|
|
8-K
|
001-11692
|
3(a)
|
11/18/2016
|
-
|
|
3.2
|
|
Amended and Restated By-laws of the Company
|
|
8-K
|
001-11692
|
3(d)
|
11/18/2016
|
-
|
|
4.1
|
|
Description of Securities of the Registrant
|
|
10-K
|
001-11692
|
4.1
|
8/29/2022
|
-
|
|
10.1
|
|
Restated Directors Indemnification Agreement dated March 1993, among the Company and Ethan Allen and their Directors (incorporated by reference to Exhibit 10(c) to the Registration Statement on Form S-1 of the Company filed with the SEC on March 16, 1993)
|
|
S-1
|
33-57216
|
10(c)
|
3/16/1993
|
-
|
|
10.2*
|
|
Employment Agreement between the Company and M. Farooq Kathwari dated October 1, 2015
|
|
8-K
|
001-11692
|
10.1
|
10/2/2015
|
-
|
|
10.3*
|
|
Change in Control Severance Plan
|
|
8-K
|
001-11692
|
10.3
|
10/2/2015
|
-
|
|
10.4*
|
|
Ethan Allen Interiors Inc. Stock Incentive Plan
|
|
DEFC14A
|
001-11692
|
Appendix A
|
10/27/2015
|
-
|
|
10.5*
|
|
Form of Option Agreement for Grants to Independent Directors
|
|
10-K
|
001-11692
|
10(h)-4
|
9/13/2005
|
-
|
|
10.6*
|
|
Form of Option Agreement for Grants to Employees
|
|
10-K
|
001-11692
|
10(h)-5
|
9/13/2005
|
-
|
|
10.7*
|
|
Form of Restricted Stock Agreement for Executives
|
|
8-K
|
001-11692
|
10(f)-1
|
11/19/2007
|
-
|
|
10.8*
|
|
Form of Stock Option Agreement for Grants to Employees that include performance conditions
|
|
10-Q
|
001-11692
|
10(g)-5
|
5/1/2014
|
-
|
|
10.9
|
|
Third Amended and Restated Credit Agreement among Ethan Allen Interiors Inc., most of its domestic subsidiaries, and J.P. Morgan Chase Bank, N.A., as Administrative Agent and Syndication Agent, and Capital One, National Association, as Documentation Agent, dated as of January 26, 2022
|
|
10-Q
|
001-11692
|
10.1
|
1/27/2022
|
-
|
|
10.10*
|
|
Employment Agreement between the Company and M. Farooq Kathwari dated February 3, 2022
|
|
8-K
|
001-11692
|
10.1
|
2/3/2022
|
-
|
|
10.11*
|
|
Amended Employment Agreement between the Company and M. Farooq Kathwari dated July 30, 2024
|
|
8-K
|
001-11692
|
10.1
|
7/31/2024
|
-
|
|
10.12*
|
|
Form of Performance-Based Stock Unit Agreement for M. Farooq Kathwari
|
|
8-K
|
001-11692
|
10.2
|
2/3/2022
|
-
|
ETHAN ALLEN INTERIORS INC. AND SUBSIDIARIES
* Management contract or compensatory plan, contract or arrangement
† Furnished herewith
ITEM 16. FORM 10-K SUMMARY
None.
ETHAN ALLEN INTERIORS INC. AND SUBSIDIARIES
SIGNATURES
Pursuant to the requirements of Section 13 or 15(d) of the Securities Exchange Act of 1934, the registrant has duly caused this report to be signed on its behalf by the undersigned, thereunto duly authorized.
|
|
ETHAN ALLEN INTERIORS INC.
|
|
|
|
(Registrant)
|
|
|
|
|
|
|
|
Date: August 23, 2024
|
By:
|
/s/ M. Farooq Kathwari
|
|
|
|
|
M. Farooq Kathwari
|
|
|
|
|
Chairman, President and Chief Executive Officer
|
|
POWER OF ATTORNEY
Know all persons by these presents, that each person whose signature appears below constitutes and appoints M. Farooq Kathwari and Matthew J. McNulty, and each of them, as such person’s true and lawful attorneys-in-fact and agents, with full power of substitution and resubstitution, for such person and in such person’s name, place and stead, in any and all capacities, to sign any and all amendments to this Annual Report on Form 10-K, and to file the same, with all exhibits thereto, and all other documents in connection therewith, with the Securities and Exchange Commission, granting unto each said attorneys-in-fact and agents, and each of them, full power and authority to do and perform each and every act and thing requisite and necessary to be done in connection therewith, as fully to all intents and purposes as such person might or could do in person, hereby ratifying and confirming all that said attorneys-in-fact and agents, or any of them or their or such person’s substitute or substitutes, may lawfully do or cause to be done by virtue thereof.
Pursuant to the requirements of the Securities Exchange Act of 1934, this report has been signed below by the following persons on behalf of the Registrant and in the capacities and on the dates indicated.
|
Name
|
|
Title
|
Date
|
| |
|
|
|
|
/s/ M. Farooq Kathwari
|
|
Chairman, President and Chief Executive Officer
|
August 23, 2024
|
|
M. Farooq Kathwari
|
|
(Principal Executive Officer)
|
|
| |
|
|
|
|
/s/ Matthew J. McNulty
|
|
Senior Vice President, Chief Financial Officer and Treasurer
|
August 23, 2024
|
|
Matthew J. McNulty
|
|
(Principal Financial Officer and Principal Accounting Officer)
|
|
| |
|
|
|
|
/s/ María Eugenia Casar
|
|
Director
|
August 23, 2024
|
| María Eugenia Casar |
|
|
|
| |
|
|
|
|
/s/ John J. Dooner Jr.
|
|
Director
|
August 23, 2024
|
| John J. Dooner Jr. |
|
|
|
| |
|
|
|
|
/s/ David M. Sable
|
|
Director
|
August 23, 2024
|
| David M. Sable |
|
|
|
| |
|
|
|
|
/s/ Tara I. Stacom
|
|
Director
|
August 23, 2024
|
| Tara I. Stacom |
|
|
|
| |
|
|
|
|
/s/ Cynthia Ekberg Tsai
|
|
Director
|
August 23, 2024
|
| Cynthia Ekberg Tsai |
|
|
|