Exhibit 99.1
Investor Relations Contact: David Humphrey | Media Contact: Autumnn Mahar |
Title: Vice President – Investor Relations Phone: 479-785-6200 | Title: Director External Communications and Public Relations |
Email: dhumphrey@arcb.com | Phone: 479-494-8221 |
| Email: amahar@arcb.com |
ArcBest Announces First Quarter 2024 Results
Continued focus on service excellence, disciplined pricing, growth, and efficiency
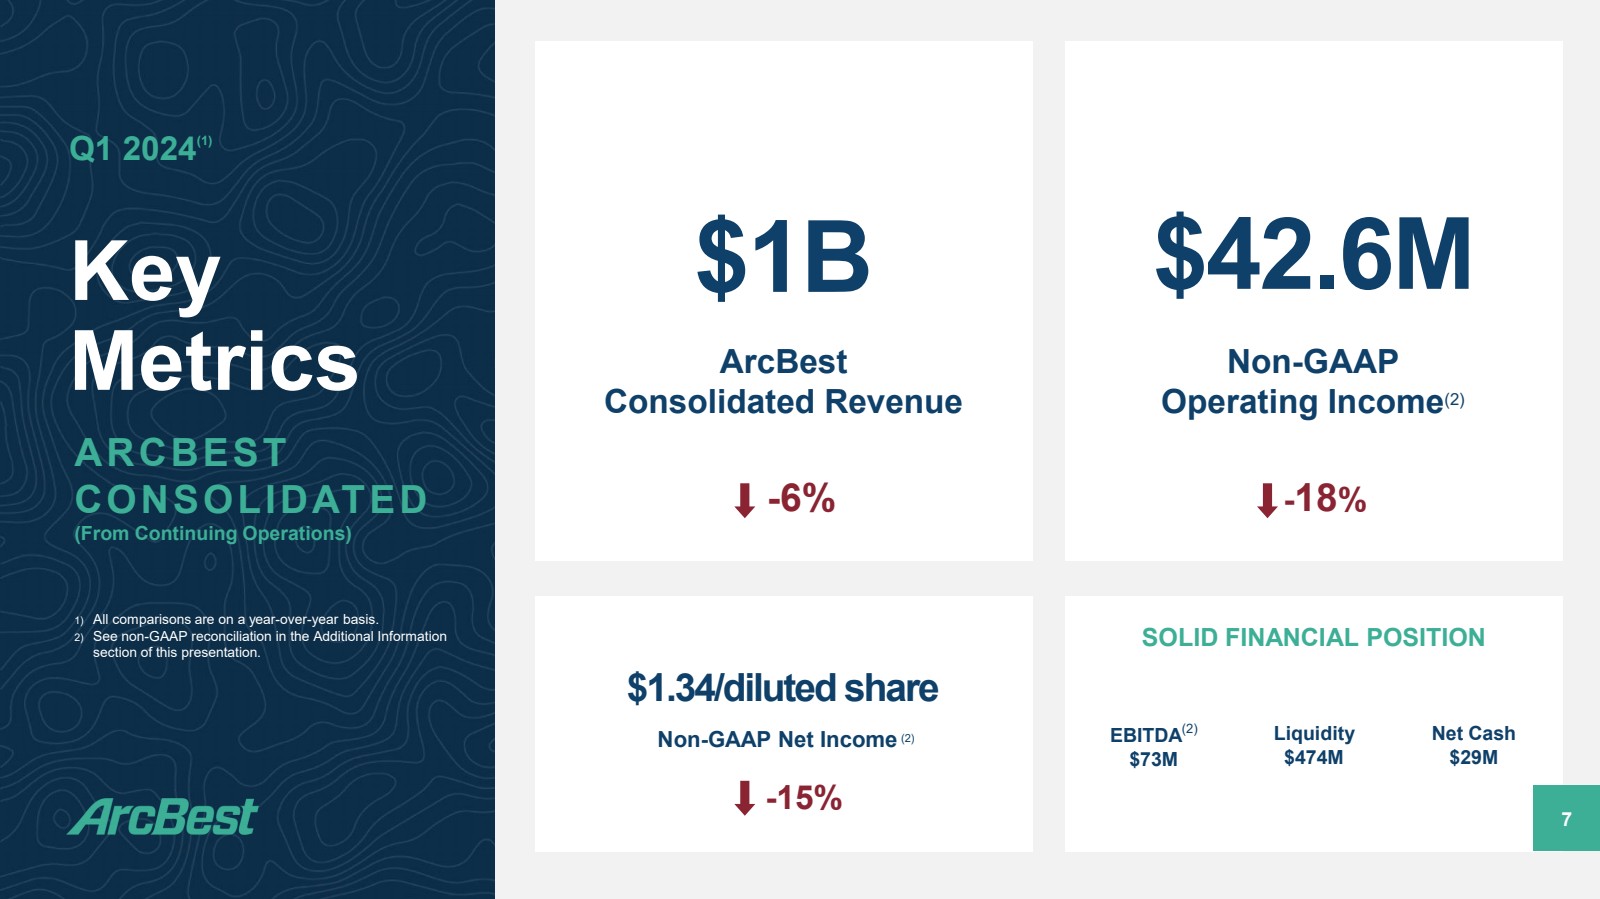
FORT SMITH, Arkansas, April 30, 2024 — ArcBest® (Nasdaq: ARCB), a leader in supply chain logistics, today reported first quarter 2024 revenue from continuing operations of $1.0 billion, compared to $1.1 billion in the first quarter of 2023. First quarter 2024 operating income from continuing operations was $22.4 million, compared to $21.2 million in the prior year period, and net loss from continuing operations was $2.9 million, or $0.12 per diluted share, compared to net income of $18.8 million, or $0.75 per diluted share, in 2023. Included in the first quarter net loss from continuing operations is a $21.6 million after-tax, noncash impairment charge associated with ArcBest’s equity investment in Phantom Auto, which ceased operations during the first quarter of 2024.
Excluding certain items in both periods as identified in the attached reconciliation tables, first quarter 2024 non-GAAP operating income from continuing operations was $42.6 million, compared to $51.9 million in the prior-year period. While the non-GAAP operating income for the Asset-Based segment was unchanged versus the prior-year period, Asset-Light non-GAAP operating income declined $8.9 million compared to the prior-year period, reflecting the current macro weakness impacting demand combined with excess capacity serving the full truckload market.
On a non-GAAP basis, net income from continuing operations was $32.3 million, or $1.34 per diluted share, compared to $39.5 million, or $1.58 per diluted share, in the first quarter of 2023.
“Reflecting on the past quarter, I am proud of our employees for their commitment to excellence, which resulted in better customer service and operational efficiency gains,” said Judy R. McReynolds, ArcBest Chairman, President and CEO. “This commitment was also evident in our performance in this softer freight environment and the receipt of numerous customer and industry recognitions, including ABF’s recent receipt of the prestigious ATA Excellence in Security Award.”
1
First Quarter Results of Operations Comparisons
Asset-Based
First Quarter 2024 Versus First Quarter 2023
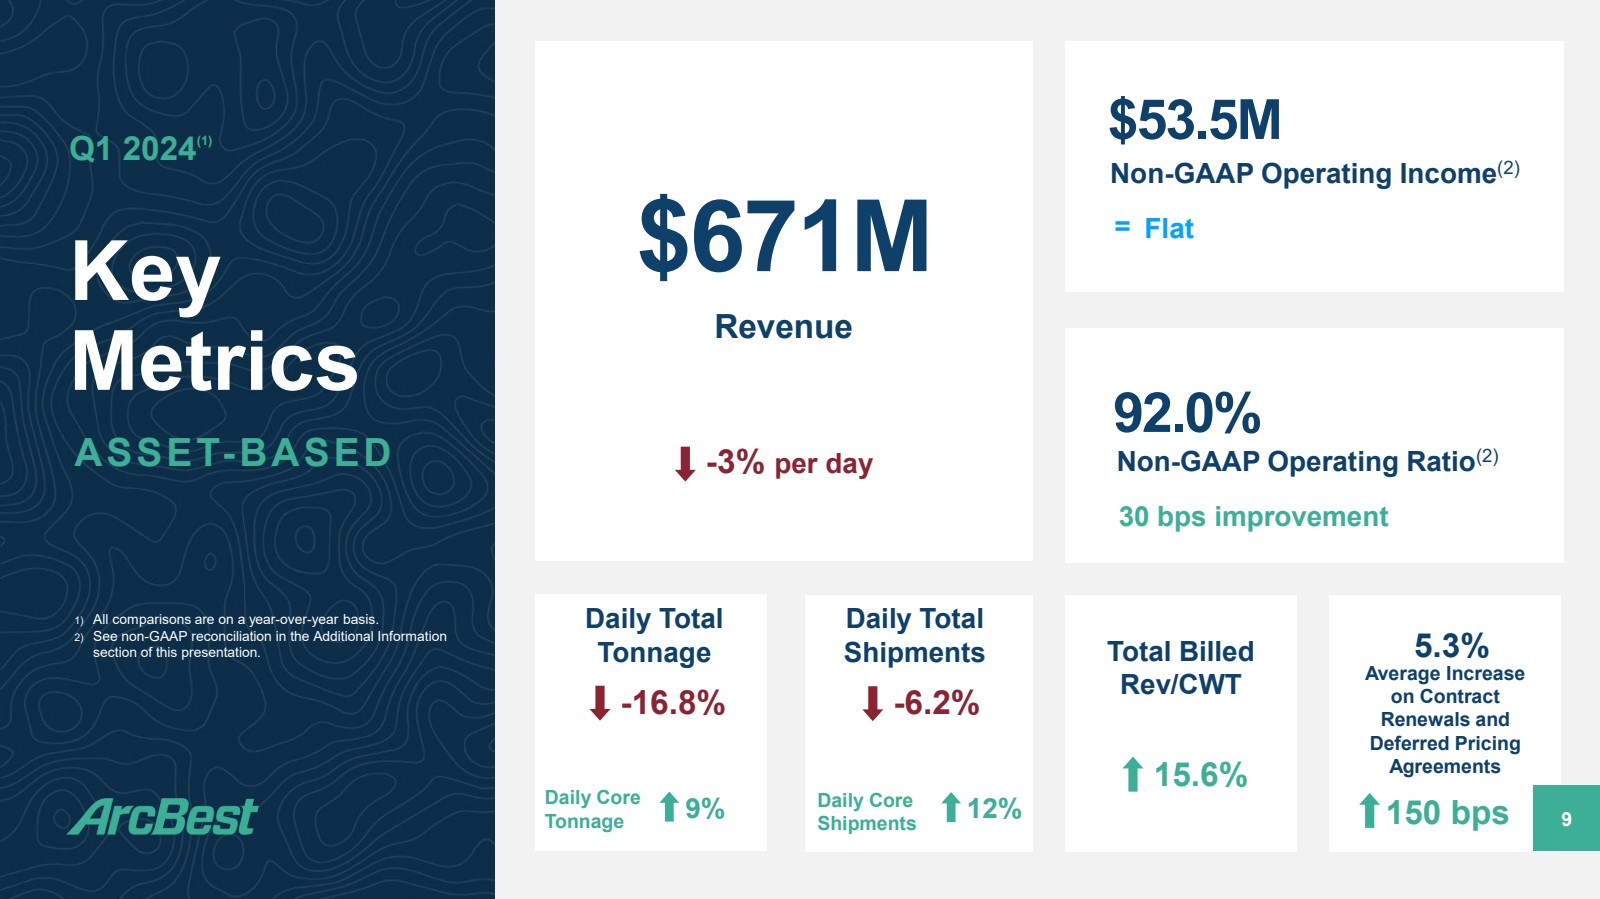
| ● | Revenue of $671.5 million compared to $697.8 million, a per-day decrease of 3.0 percent. |
| ● | Total tonnage per day decrease of 16.8 percent. |
| ● | Total shipments per day decrease of 6.2 percent. |
| ● | Total billed revenue per hundredweight increase of 15.6 percent. |
| ● | Core daily shipments increase of 12 percent and tonnage increase of 9 percent. |
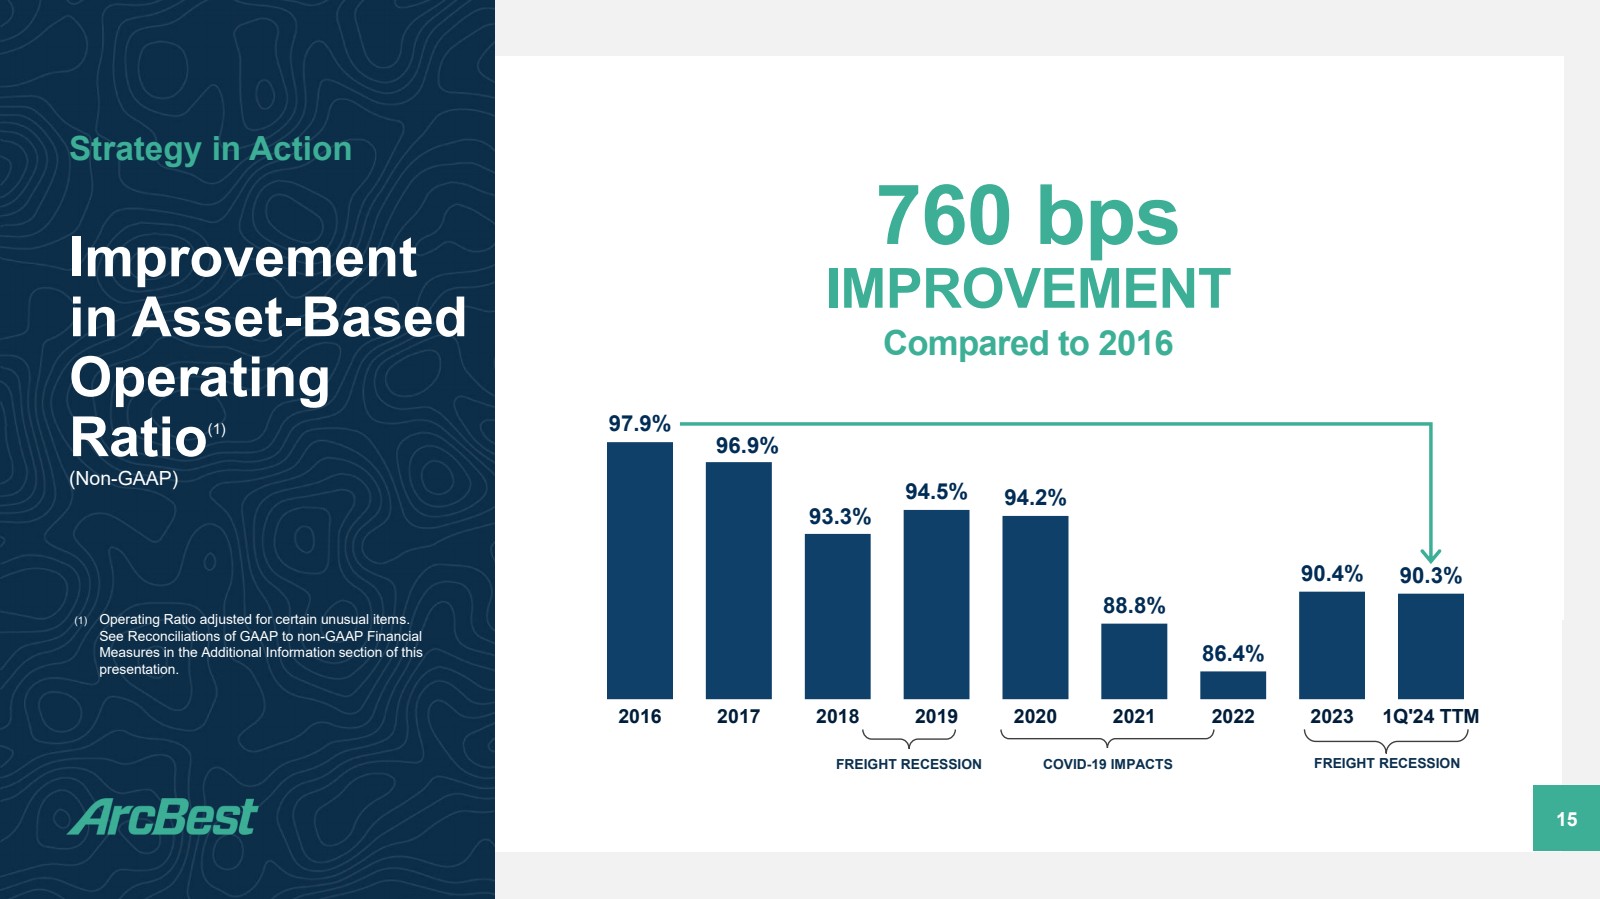
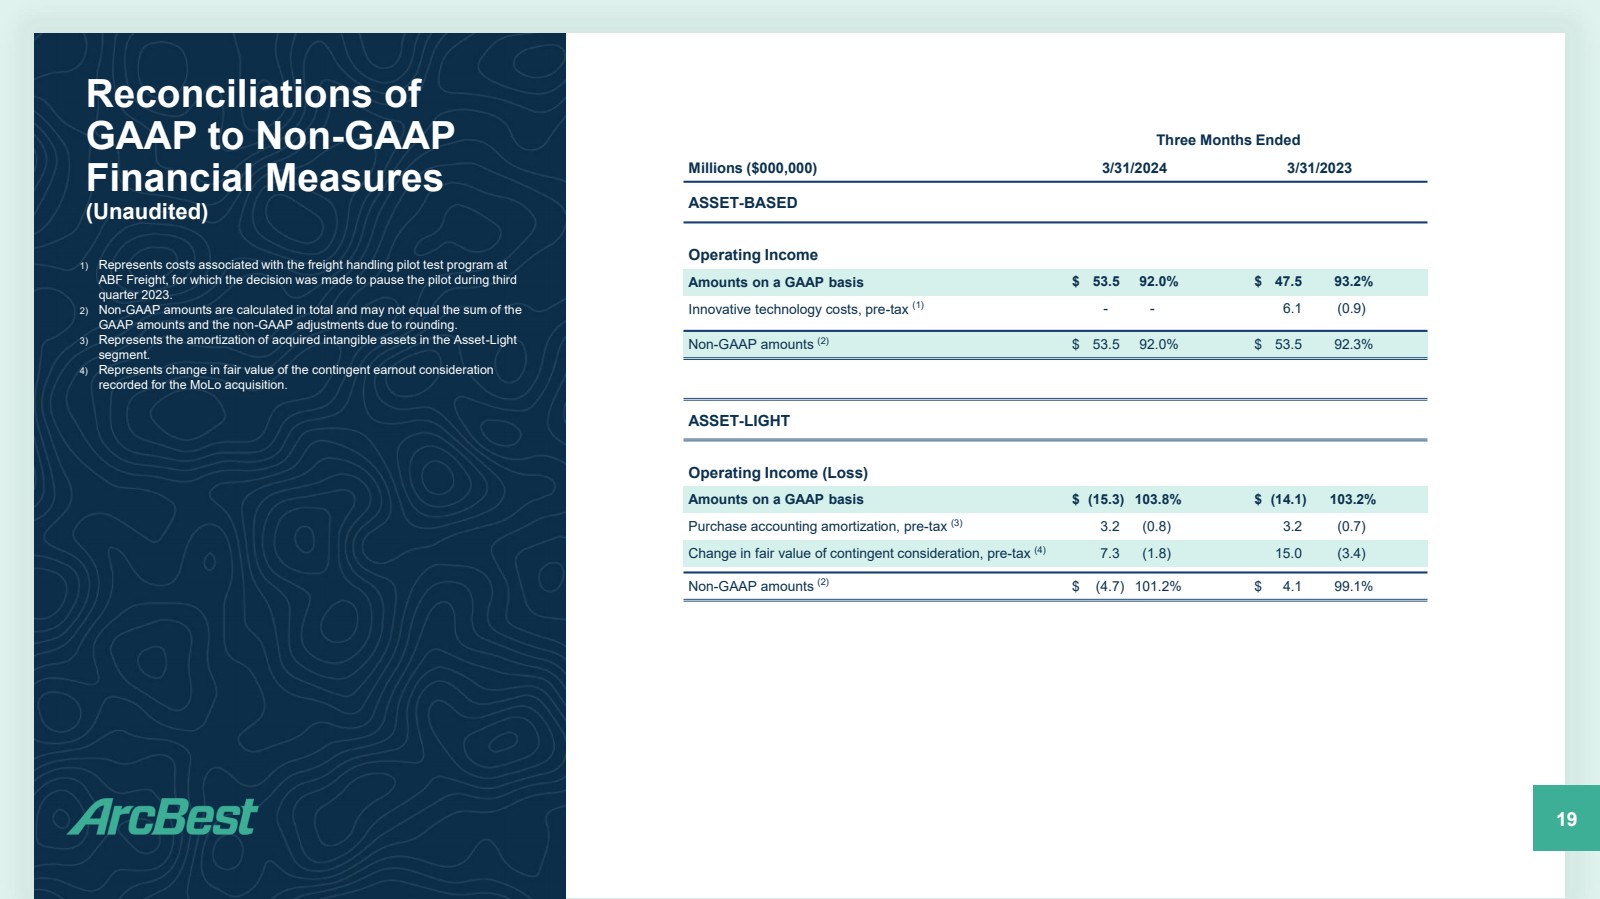
| ● | Operating income of $53.5 million and an operating ratio of 92.0 percent, on both a GAAP and non-GAAP basis, compared to prior-year GAAP operating income of $47.5 million and an operating ratio of 93.2 percent and prior-year non-GAAP operating income of $53.5 million and an operating ratio of 92.3 percent. |
On a non-GAAP basis, the Asset-Based segment generated the same operating income as first quarter 2023 on lower revenue levels, which highlights the Company’s continued focus on serving core customers well and improving efficiencies in our operations. Total first quarter daily shipment and tonnage levels were below the prior year, as we continued to adjust freight mix, which positively impacted productivity and contributed to an improved operating ratio.
Pricing momentum continued in the quarter, driven by improved freight mix, higher pricing on transactional shipments and contract renewal increases of 5.3 percent. Overall, LTL industry pricing remains rational.
Compared sequentially to the strong fourth quarter of 2023, first quarter 2024 was impacted by weather in January and fewer workdays in March. Revenue per day was down 8.4 percent, tons per day declined 5.7 percent and shipments per day were down 1.8 percent, sequentially. First quarter billed revenue per hundredweight decreased 0.9 percent, compared to fourth quarter 2023. Although union benefit costs were higher in first quarter 2024, continued focus on operational efficiency resulted in improved productivity and lower overall operating expenses. The operating ratio increased 430 basis points sequentially, which was generally in-line with seasonal changes seen during previous soft freight environments.
Asset-Light
First Quarter 2024 Versus First Quarter 2023
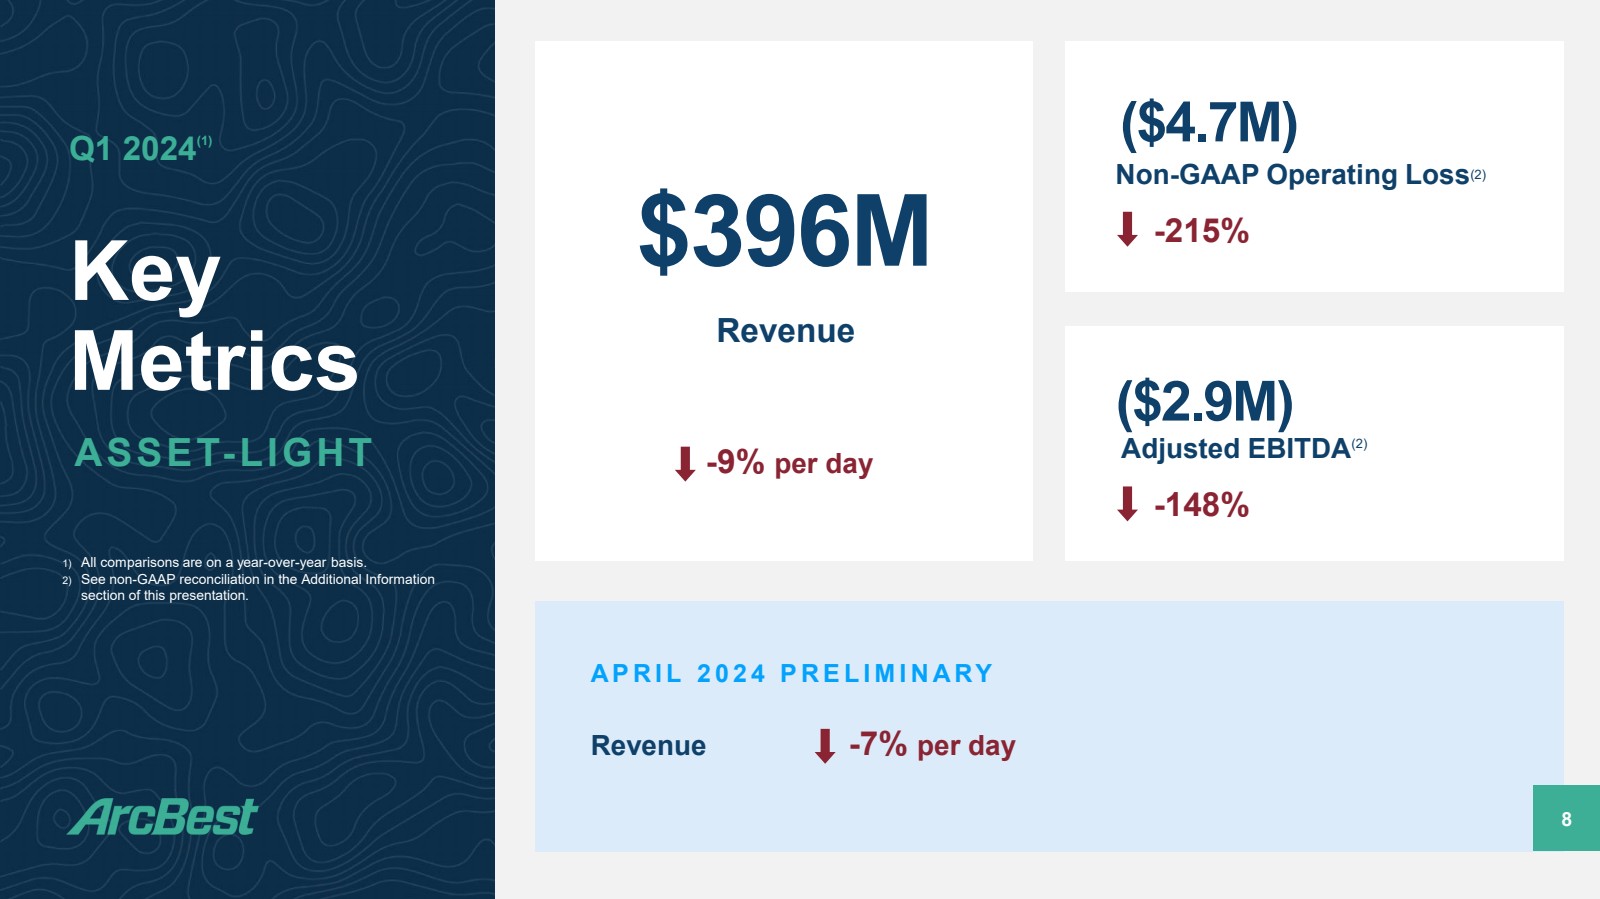
| ● | Revenue of $396.4 million compared to $438.1 million, a per-day decrease of 8.8 percent. |
| ● | Operating loss of $15.3 million compared to operating loss of $14.1 million. On a non-GAAP basis, operating loss of $4.7 million compared to operating income of $4.1 million. |
| ● | Adjusted earnings before interest, taxes, depreciation and amortization (“Adjusted EBITDA”) of negative $2.9 million compared to $6.0 million, as detailed in the attached non-GAAP reconciliation tables. |
Compared to the first quarter of 2023, Asset-Light results were impacted by lower revenue per shipment and reduced margins associated with changes in business mix and the soft rate environment. Shipments per day grew by 13.6 percent, as the managed transportation solution successfully partnered with more customers to optimize their logistics spend. Our biggest challenge to profitability resulted from lower rates and margins for truckload solutions. However, increased productivity mitigated market softness as shipments per employee per day and SG&A cost per shipment both significantly improved on a year-over-year basis.
Compared sequentially to the fourth quarter 2023, first quarter 2024 revenue per day was down 7.1 percent. Weather events in January resulted in significantly higher purchased transportation costs as a percentage of revenue. The non-GAAP operating loss in the first quarter was primarily attributable to performance in the month of January, as the segment saw improvements throughout the rest of the quarter. Total shipments per day were flat compared to fourth quarter 2023, with managed transportation seeing sequential growth. Operating expenses were slightly lower as employee productivity and cost per shipment metrics improved from fourth quarter levels. With a focus on growth and efficiency, the Company remains well-positioned for an eventual recovery of the full truckload and ground expedite markets.
2
Conference Call
ArcBest will host a conference call with company executives to discuss the first quarter 2024 results. The call will be today, Tuesday, April 30, 2024 at 9:30 a.m. EDT (8:30 a.m. CDT). Interested parties are invited to listen by calling (800) 715-9871 or by joining the webcast which can be found on ArcBest’s website at arcb.com. Slides to accompany this call are included in Exhibit 99.3 of the Form 8-K filed on April 30, 2024, will be posted and available to download on the company’s website prior to the scheduled conference time, and will be included in the webcast. Following the call, a recorded playback will be available through the end of the day on May 15, 2024. To listen to the playback, dial (800) 770-2030. The conference call ID for the live conference call and the playback is 6865438. The conference call and playback can also be accessed through May 15, 2024 on ArcBest’s website at arcb.com.
About ArcBest
ArcBest® (Nasdaq: ARCB) is a multibillion-dollar integrated logistics company that helps keep the global supply chain moving. Founded in 1923 and now with 15,000 employees across 250 campuses and service centers, the company is a logistics powerhouse, using its technology, expertise and scale to connect shippers with the solutions they need — from ground, air and ocean transportation to fully managed supply chains. ArcBest has a long history of innovation that is enriched by deep customer relationships. With a commitment to helping customers navigate supply chain challenges now and in the future, the company is developing ground-breaking technology like Vaux™, one of TIME’s Best Inventions of 2023. For more information, visit arcb.com.
3
The following is a “safe harbor” statement under the Private Securities Litigation Reform Act of 1995: Certain statements and information in this press release concerning results for the three months ended March 31, 2024 may constitute “forward-looking statements” within the meaning of the Private Securities Litigation Reform Act of 1995, including, among others, statements regarding (i) our expectations about our intrinsic value or our prospects for growth and value creation and (ii) our financial outlook, position, strategies, goals, and expectations. Terms such as “anticipate,” “believe,” “could,” “estimate,” “expect,” “forecast,” “foresee,” “intend,” “may,” “plan,” “predict,” “project,” “scheduled,” “should,” “would,” and similar expressions and the negatives of such terms are intended to identify forward-looking statements. These statements are based on management’s beliefs, assumptions, and expectations based on currently available information, are not guarantees of future performance, and involve certain risks and uncertainties (some of which are beyond our control). Although we believe that the expectations reflected in these forward-looking statements are reasonable as and when made, we cannot provide assurance that our expectations will prove to be correct. Actual outcomes and results could materially differ from what is expressed, implied, or forecasted in these statements due to a number of factors, including, but not limited to: the effects of a widespread outbreak of an illness or disease or any other public health crisis, as well as regulatory measures implemented in response to such events; external events which may adversely affect us or the third parties who provide services for us, for which our business continuity plans may not adequately prepare us, including, but not limited to, acts of war or terrorism, or military conflicts; data privacy breaches, cybersecurity incidents, and/or failures of our information systems, including disruptions or failures of services essential to our operations or upon which our information technology platforms rely; interruption or failure of third-party software or information technology systems or licenses; untimely or ineffective development and implementation of, or failure to realize the potential benefits associated with, new or enhanced technology or processes, including our customer pilot offering of Vaux; the loss or reduction of business from large customers or an overall reduction in our customer base; the timing and performance of growth initiatives and the ability to manage our cost structure; the cost, integration, and performance of any recent or future acquisitions and the inability to realize the anticipated benefits of the acquisition within the expected time period or at all; unsolicited takeover proposals, proxy contests, and other proposals/actions by activist investors; maintaining our corporate reputation and intellectual property rights; nationwide or global disruption in the supply chain resulting in increased volatility in freight volumes; competitive initiatives and pricing pressures; increased prices for and decreased availability of equipment, including new revenue equipment, decreases in value of used revenue equipment, and higher costs of equipment-related operating expenses such as maintenance, fuel, and related taxes; availability of fuel, the effect of volatility in fuel prices and the associated changes in fuel surcharges on securing increases in base freight rates, and the inability to collect fuel surcharges; relationships with employees, including unions, and our ability to attract, retain, and upskill employees; unfavorable terms of, or the inability to reach agreement on, future collective bargaining agreements or a workforce stoppage by our employees covered under ABF Freight’s collective bargaining agreement; union employee wages and benefits, including changes in required contributions to multiemployer plans; availability and cost of reliable third-party services; our ability to secure independent owner-operators and/or operational or regulatory issues related to our use of their services; litigation or claims asserted against us; governmental regulations; environmental laws and regulations, including emissions-control regulations; default on covenants of financing arrangements and the availability and terms of future financing arrangements; our ability to generate sufficient cash from operations to support significant ongoing capital expenditure requirements and other business initiatives; self-insurance claims, insurance premium costs, and loss of our ability to self-insure; potential impairment of long-lived assets and goodwill and intangible assets; general economic conditions and related shifts in market demand that impact the performance and needs of industries we serve and/or limit our customers’ access to adequate financial resources; increasing costs due to inflation and higher interest rates; seasonal fluctuations, adverse weather conditions, natural disasters, and climate change; and other financial, operational, and legal risks and uncertainties detailed from time to time in ArcBest Corporation’s public filings with the Securities and Exchange Commission (“SEC”).
For additional information regarding known material factors that could cause our actual results to differ from those expressed in these forward-looking statements, please see our filings with the SEC, including our Annual Report on Form 10-K, Quarterly Reports on Form 10-Q, and Current Reports on Form 8K.
Readers are cautioned not to place undue reliance on forward-looking statements, which speak only as of the date hereof. We undertake no obligation to publicly update or revise any forward-looking statements after the date they are made, whether as a result of new information, future events, or otherwise.
Financial Data and Operating Statistics
The following tables show financial data and operating statistics on ArcBest® and its reportable segments.
4
ARCBEST CORPORATION
CONSOLIDATED STATEMENTS OF OPERATIONS
| | Three Months Ended | | ||||
| | March 31 | | ||||
|
| 2024 |
| 2023 |
| ||
| | (Unaudited) | | ||||
| | ($ thousands, except share and per share data) | | ||||
REVENUES | | $ | 1,036,419 | | $ | 1,106,094 | |
| | | | | | | |
OPERATING EXPENSES | |
| 1,013,984 | | | 1,084,935 | |
| | | | | | | |
OPERATING INCOME | |
| 22,435 | |
| 21,159 | |
| | | | | | | |
OTHER INCOME (COSTS) | | | | | | | |
Interest and dividend income | |
| 3,315 | |
| 2,933 | |
Interest and other related financing costs | |
| (2,228) | |
| (2,327) | |
Other, net | |
| (28,199) | |
| 1,780 | |
| |
| (27,112) | |
| 2,386 | |
| | | | | | | |
INCOME (LOSS) FROM CONTINUING OPERATIONS BEFORE INCOME TAXES | |
| (4,677) | |
| 23,545 | |
| | | | | | | |
INCOME TAX PROVISION (BENEFIT) | |
| (1,765) | |
| 4,698 | |
| | | | | | | |
NET INCOME (LOSS) FROM CONTINUING OPERATIONS | | | (2,912) | | | 18,847 | |
| | | | | | | |
INCOME FROM DISCONTINUED OPERATIONS, NET OF TAX(1) | | | 600 | | | 52,436 | |
| | | | | | | |
NET INCOME (LOSS) | | $ | (2,312) | | $ | 71,283 | |
| | | | | | | |
BASIC EARNINGS PER COMMON SHARE(2) | | | | | | | |
Continuing operations | | $ | (0.12) | | $ | 0.78 | |
Discontinued operations(1) | | | 0.03 | | | 2.16 | |
| | $ | (0.10) | | $ | 2.93 | |
| | | | | | | |
DILUTED EARNINGS PER COMMON SHARE(2) | | | | | | | |
Continuing operations | | $ | (0.12) | | $ | 0.75 | |
Discontinued operations(1) | | | 0.03 | | | 2.09 | |
| | $ | (0.10) | | $ | 2.84 | |
| | | | | | | |
AVERAGE COMMON SHARES OUTSTANDING | | | | | | | |
Basic | |
| 23,561,309 | |
| 24,288,138 | |
Diluted | |
| 23,561,309 | |
| 25,057,726 | |
| 1) | Represents the discontinued operations of FleetNet America® (“FleetNet”), which sold on February 28, 2023. The 2024 period represents adjustments related to the prior year gain on sale of FleetNet. The 2023 period includes the net gain on sale of FleetNet of $51.4 million after-tax, or $2.12 basic earnings per share and $2.05 diluted earnings per share, recognized in the first quarter of 2023. |
| 2) | Earnings per common share is calculated in total and may not equal the sum of earnings per common share from continuing operations and discontinued operations due to rounding. |
5
ARCBEST CORPORATION
| | March 31 | | December 31 | | ||
|
| 2024 |
| 2023 |
| ||
| | (Unaudited) | | Note | | ||
| | ($ thousands, except share data) | | ||||
ASSETS | | | | | | | |
CURRENT ASSETS | | | | | | | |
Cash and cash equivalents | | $ | 172,855 | | $ | 262,226 | |
Short-term investments | |
| 68,065 | |
| 67,842 | |
Accounts receivable, less allowances (2024 - $9,184; 2023 - $10,346) | |
| 433,717 | |
| 430,122 | |
Other accounts receivable, less allowances (2024 - $733; 2023 - $731) | |
| 11,389 | |
| 52,124 | |
Prepaid expenses | |
| 39,232 | |
| 37,034 | |
Prepaid and refundable income taxes | |
| 22,084 | |
| 24,319 | |
Other | |
| 11,136 | |
| 11,116 | |
TOTAL CURRENT ASSETS | |
| 758,478 | |
| 884,783 | |
| | | | | | | |
PROPERTY, PLANT AND EQUIPMENT | | | | | | | |
Land and structures | |
| 491,555 | |
| 460,068 | |
Revenue equipment | |
| 1,119,446 | |
| 1,126,055 | |
Service, office, and other equipment | |
| 318,252 | |
| 319,466 | |
Software | |
| 176,988 | |
| 173,354 | |
Leasehold improvements | |
| 25,173 | |
| 24,429 | |
| | | 2,131,414 | | | 2,103,372 | |
Less allowances for depreciation and amortization | |
| 1,193,584 | |
| 1,188,548 | |
PROPERTY, PLANT AND EQUIPMENT, NET | |
| 937,830 | |
| 914,824 | |
| | | | | | | |
GOODWILL | |
| 304,753 | |
| 304,753 | |
INTANGIBLE ASSETS, NET | |
| 97,940 | |
| 101,150 | |
OPERATING RIGHT-OF-USE ASSETS | | | 174,987 | | | 169,999 | |
DEFERRED INCOME TAXES | |
| 10,032 | |
| 8,140 | |
OTHER LONG-TERM ASSETS | | | 73,123 | | | 101,445 | |
TOTAL ASSETS | | $ | 2,357,143 | | $ | 2,485,094 | |
| | | | | | | |
LIABILITIES AND STOCKHOLDERS’ EQUITY | | | | | | | |
CURRENT LIABILITIES | | | | | | | |
Accounts payable | | $ | 209,908 | | $ | 214,004 | |
Income taxes payable | |
| 8 | |
| 10,410 | |
Accrued expenses | |
| 313,494 | |
| 378,029 | |
Current portion of long-term debt | |
| 63,179 | |
| 66,948 | |
Current portion of operating lease liabilities | | | 31,986 | | | 32,172 | |
TOTAL CURRENT LIABILITIES | |
| 618,575 | |
| 701,563 | |
| | | | | | | |
LONG-TERM DEBT, less current portion | |
| 148,992 | |
| 161,990 | |
OPERATING LEASE LIABILITIES, less current portion | | | 174,085 | | | 176,621 | |
POSTRETIREMENT LIABILITIES, less current portion | |
| 13,318 | |
| 13,319 | |
CONTINGENT CONSIDERATION | | | 100,220 | | | 92,900 | |
OTHER LONG-TERM LIABILITIES | |
| 34,422 | |
| 40,553 | |
DEFERRED INCOME TAXES | |
| 44,798 | |
| 55,785 | |
| | | | | | | |
STOCKHOLDERS’ EQUITY | | | | | | | |
Common stock, $0.01 par value, authorized 70,000,000 shares; | |
| 300 | |
| 300 | |
Additional paid-in capital | |
| 343,102 | |
| 340,961 | |
Retained earnings | |
| 1,267,444 | |
| 1,272,584 | |
Treasury stock, at cost, 2024: 6,580,818 shares; 2023: 6,460,137 shares | |
| (391,458) | |
| (375,806) | |
Accumulated other comprehensive income | |
| 3,345 | |
| 4,324 | |
TOTAL STOCKHOLDERS’ EQUITY | |
| 1,222,733 | |
| 1,242,363 | |
TOTAL LIABILITIES AND STOCKHOLDERS' EQUITY | | $ | 2,357,143 | | $ | 2,485,094 | |
Note: The balance sheet at December 31, 2023 has been derived from the audited financial statements at that date but does not include all of the information and footnotes required by generally accepted accounting principles for complete financial statements.
6
ARCBEST CORPORATION
CONSOLIDATED STATEMENTS OF CASH FLOWS
| | Three Months Ended | | ||||
| | March 31 | | ||||
|
| 2024 |
| 2023 |
| ||
| | (Unaudited) | | ||||
| | ($ thousands) | | ||||
OPERATING ACTIVITIES | | | | | | | |
Net income (loss) | | $ | (2,312) | | $ | 71,283 | |
Adjustments to reconcile net income (loss) to net cash provided by operating activities: | | | | | | | |
Depreciation and amortization | |
| 33,616 | |
| 32,187 | |
Amortization of intangibles | |
| 3,217 | |
| 3,203 | |
Share-based compensation expense | |
| 2,889 | |
| 2,235 | |
Provision for losses on accounts receivable | |
| 1,055 | |
| 1,427 | |
Change in deferred income taxes | |
| (12,548) | |
| (9,814) | |
(Gain) loss on sale of property and equipment | |
| 217 | |
| (9) | |
Pre-tax gain on sale of discontinued operations | | | (806) | | | (69,083) | |
Change in fair value of contingent consideration | | | 7,320 | | | 15,040 | |
Change in fair value of equity investment | | | 28,739 | | | — | |
Changes in operating assets and liabilities: | | | | | | | |
Receivables | |
| 35,059 | |
| 43,977 | |
Prepaid expenses | |
| (2,198) | |
| (1,464) | |
Other assets | |
| (1,218) | |
| 3,874 | |
Income taxes | |
| (8,305) | |
| 6,221 | |
Operating right-of-use assets and lease liabilities, net | |
| (7,710) | |
| 1,570 | |
Accounts payable, accrued expenses, and other liabilities | |
| (70,548) | |
| (79,984) | |
NET CASH PROVIDED BY OPERATING ACTIVITIES | |
| 6,467 | |
| 20,663 | |
| | | | | | | |
INVESTING ACTIVITIES | | | | | | | |
Purchases of property, plant and equipment, net of financings | |
| (55,049) | |
| (34,657) | |
Proceeds from sale of property and equipment | |
| 1,292 | |
| 1,833 | |
Proceeds from sale of discontinued operations | | | — | | | 101,138 | |
Purchases of short-term investments | |
| (5,236) | |
| (35,588) | |
Proceeds from sale of short-term investments | |
| 5,635 | |
| 41,865 | |
Capitalization of internally developed software | |
| (3,635) | |
| (3,631) | |
NET CASH PROVIDED BY (USED IN) INVESTING ACTIVITIES | |
| (56,993) | |
| 70,960 | |
| | | | | | | |
FINANCING ACTIVITIES | | | | | | | |
Payments on long-term debt | |
| (16,767) | |
| (17,649) | |
Net change in book overdrafts | |
| (2,850) | |
| (10,493) | |
Deferred financing costs | |
| — | | | 63 | |
Payment of common stock dividends | |
| (2,828) | |
| (2,915) | |
Purchases of treasury stock | | | (15,652) | | | (14,092) | |
Payments for tax withheld on share-based compensation | |
| (748) | |
| (1,590) | |
NET CASH USED IN FINANCING ACTIVITIES | |
| (38,845) | |
| (46,676) | |
| | | | | | | |
NET INCREASE (DECREASE) IN CASH AND CASH EQUIVALENTS | |
| (89,371) | |
| 44,947 | |
Cash and cash equivalents of continuing operations at beginning of period | |
| 262,226 | |
| 158,264 | |
Cash and cash equivalents of discontinued operations at beginning of period | | | — | |
| 108 | |
CASH AND CASH EQUIVALENTS AT END OF PERIOD | | $ | 172,855 | | $ | 203,319 | |
| | | | | | | |
NONCASH INVESTING ACTIVITIES | | | | | | | |
Equipment financed | | $ | — | | $ | 3,478 | |
Accruals for equipment received | | $ | 915 | | $ | 1,453 | |
Lease liabilities arising from obtaining right-of-use assets | | $ | 5,694 | | $ | 30,581 | |
Note: The statements of cash flows for the three months ended March 31, 2024 and 2023 include cash flows from continuing operations and cash flows from discontinued operations of FleetNet, which sold on February 28, 2023.
7
ARCBEST CORPORATION
FINANCIAL STATEMENT OPERATING SEGMENT DATA AND OPERATING RATIOS
| Three Months Ended | | | |||||||||
| March 31 | | | |||||||||
| 2024 |
| | 2023 |
| | ||||||
| (Unaudited) | | | |||||||||
| ($ thousands, except percentages) | | | |||||||||
REVENUES FROM CONTINUING OPERATIONS | | | | | | | | | | | | |
Asset-Based | $ | 671,467 |
| |
|
| $ | 697,817 |
| |
|
|
Asset-Light |
| 396,363 | | | | |
| 438,092 | | | | |
Other and eliminations |
| (31,411) | | | | |
| (29,815) | | | | |
Total consolidated revenues from continuing operations | $ | 1,036,419 |
| |
|
| $ | 1,106,094 | | |
|
|
| | | | | | | | | | | | |
OPERATING EXPENSES FROM CONTINUING OPERATIONS | | | | | | | | | | | | |
Asset-Based | | | | | | | | | | | | |
Salaries, wages, and benefits | $ | 344,999 | | 51.4 | % | | $ | 335,605 | | 48.1 | % | |
Fuel, supplies, and expenses |
| 81,044 | | 12.1 | | |
| 94,288 | | 13.5 | | |
Operating taxes and licenses |
| 13,529 | | 2.0 | | |
| 13,979 | | 2.0 | | |
Insurance |
| 14,482 | | 2.1 | | |
| 13,273 | | 1.9 | | |
Communications and utilities |
| 4,799 | | 0.7 | | |
| 5,304 | | 0.8 | | |
Depreciation and amortization |
| 27,007 | | 4.0 | | |
| 24,911 | | 3.6 | | |
Rents and purchased transportation |
| 65,671 | | 9.8 | | |
| 90,744 | | 13.0 | | |
Shared services |
| 64,914 | | 9.7 | | |
| 64,613 | | 9.2 | | |
(Gain) loss on sale of property and equipment |
| 149 | | — | | |
| (51) | | — | | |
Innovative technology costs(1) |
| — | | — | | |
| 6,068 | | 0.9 | | |
Other |
| 1,417 | | 0.2 | | |
| 1,612 | | 0.2 | | |
Total Asset-Based | | 618,011 | | 92.0 | % | | | 650,346 | | 93.2 | % | |
| | | | | | | | | | | | |
Asset-Light | | | | | | | | | | | | |
Purchased transportation | $ | 344,122 | | 86.8 | % | | $ | 370,163 | | 84.5 | % | |
Salaries, wages, and benefits(2) | | 30,304 | | 7.6 | | | | 34,894 | | 8.0 | | |
Supplies and expenses(2) | | 2,809 | | 0.7 | | |
| 3,629 | | 0.8 | | |
Depreciation and amortization(3) |
| 5,078 | | 1.3 | | |
| 5,068 | | 1.2 | | |
Shared services(2) | | 16,274 | | 4.1 | | |
| 16,535 | | 3.8 | | |
Contingent consideration(4) | | 7,320 | | 1.8 | | |
| 15,040 | | 3.4 | | |
Other(2) |
| 5,714 | | 1.5 | | |
| 6,854 | | 1.5 | | |
Total Asset-Light |
| 411,621 | | 103.8 | % | |
| 452,183 | | 103.2 | % | |
| | | | | | | | | | | | |
Other and eliminations(5) |
| (15,648) | | | | |
| (17,594) | | | | |
Total consolidated operating expenses from continuing operations | $ | 1,013,984 | | 97.8 | % | | $ | 1,084,935 | | 98.1 | % | |
| | | | | | | | | | | | |
OPERATING INCOME (LOSS) FROM CONTINUING OPERATIONS | | | | | | | | | | | | |
Asset-Based | $ | 53,456 | | | | | $ | 47,471 | | | | |
Asset-Light |
| (15,258) | | | | |
| (14,091) | | | | |
Other and eliminations(5) |
| (15,763) | | | | |
| (12,221) | | | | |
Total consolidated operating income from continuing operations | $ | 22,435 | | | | | $ | 21,159 | | | | |
| 1) | Represents costs associated with the freight handling pilot test program at ABF Freight, for which the decision was made to pause the pilot during third quarter 2023. |
| 2) | For the 2023 period, certain expenses have been reclassed to conform to the current year presentation, including amounts previously reported in “Shared services” that were reclassed to present “Salaries, wages, and benefits” expenses in a separate line item. |
| 3) | Depreciation and amortization includes amortization of intangibles associated with acquired businesses. |
| 4) | Represents the change in fair value of the contingent earnout consideration recorded for the MoLo acquisition. The liability for contingent consideration is remeasured at each quarterly reporting date, and any change in fair value as a result of the recurring assessments is recognized in operating loss. The contingent consideration for the MoLo acquisition will be paid based on achievement of certain targets of adjusted earnings before interest, taxes, depreciation, and amortization, as adjusted for certain items pursuant to the merger agreement, for years 2023 through 2025, including catch-up provisions. |
| 5) | “Other and eliminations” includes corporate costs for certain unallocated shared service costs which are not attributable to any segment, additional investments to offer comprehensive transportation and logistics services across multiple operating segments, costs related to our customer pilot offering of Vaux, and other investments in ArcBest technology and innovations. |
8
ARCBEST CORPORATION
RECONCILIATIONS OF GAAP TO NON-GAAP FINANCIAL MEASURES
Non-GAAP Financial Measures
We report our financial results in accordance with U.S. generally accepted accounting principles (“GAAP”). However, management believes that certain non-GAAP performance measures and ratios utilized for internal analysis provide analysts, investors, and others the same information that we use internally for purposes of assessing our core operating performance and provides meaningful comparisons between current and prior period results, as well as important information regarding performance trends. Accordingly, non-GAAP results are presented on a continuing operations basis, excluding the discontinued operations of FleetNet, which sold on February 28, 2023. The use of certain non-GAAP measures improves comparability in analyzing our performance because it removes the impact of items from operating results that, in management's opinion, do not reflect our core operating performance. Other companies may calculate non-GAAP measures differently; therefore, our calculation may not be comparable to similarly titled measures of other companies. Certain information discussed in the scheduled conference call could be considered non-GAAP measures. Non-GAAP financial measures should be viewed in addition to, and not as an alternative for, our reported results. These financial measures should not be construed as better measurements than operating income (loss), operating cash flow, net income (loss) or earnings per share, as determined under GAAP.
| | Three Months Ended | | ||||
| | March 31 | | ||||
|
| 2024 | | 2023 |
| ||
ArcBest Corporation - Consolidated | | (Unaudited) | | ||||
| | ($ thousands, except per share data) | | ||||
Operating Income from Continuing Operations | | | | | | | |
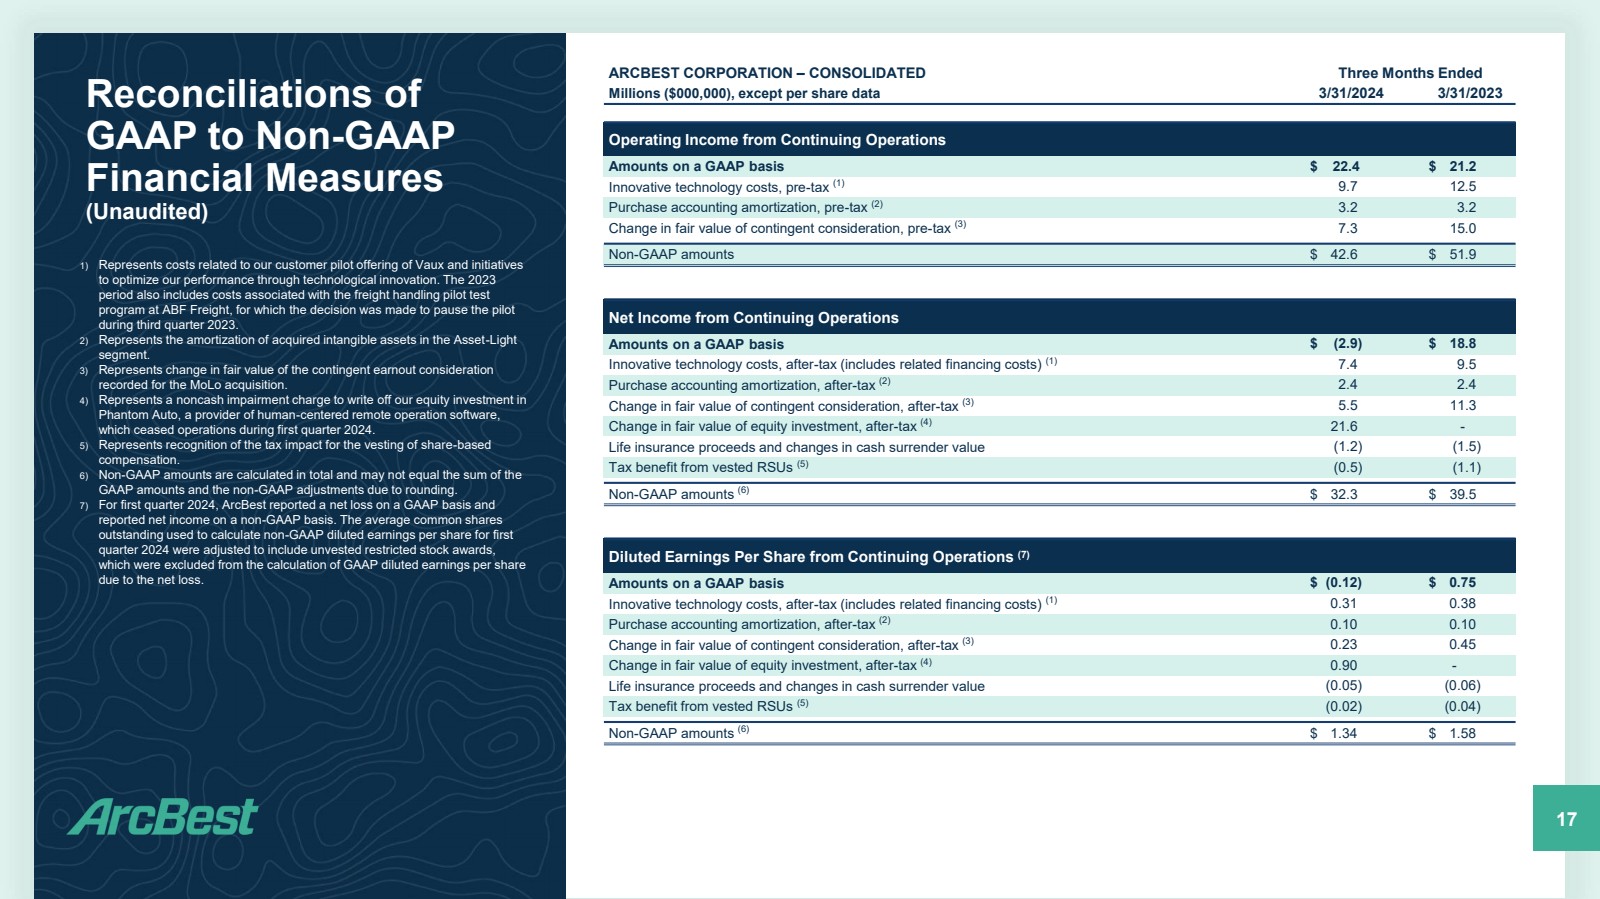
Amounts on GAAP basis | | $ | 22,435 | | $ | 21,159 | |
Innovative technology costs, pre-tax(1) | | | 9,698 | | | 12,478 | |
Purchase accounting amortization, pre-tax(2) | | | 3,192 | | | 3,192 | |
Change in fair value of contingent consideration, pre-tax(3) | | | 7,320 | | | 15,040 | |
Non-GAAP amounts | | $ | 42,645 | | $ | 51,869 | |
| | | | | | | |
Net Income (Loss) from Continuing Operations | | | | | | | |
Amounts on GAAP basis | | $ | (2,912) | | $ | 18,847 | |
Innovative technology costs, after-tax (includes related financing costs)(1) | | | 7,440 | | | 9,480 | |
Purchase accounting amortization, after-tax(2) | | | 2,401 | | | 2,398 | |
Change in fair value of contingent consideration, after-tax(3) | | | 5,505 | | | 11,299 | |
Change in fair value of equity investment, after-tax(4) | | | 21,603 | | | — | |
Life insurance proceeds and changes in cash surrender value | | | (1,233) | | | (1,496) | |
Tax benefit from vested RSUs(5) | | | (487) | | | (1,051) | |
Non-GAAP amounts | | $ | 32,317 | | $ | 39,477 | |
| | | | | | | |
Diluted Earnings Per Share from Continuing Operations(6) | | | | | | | |
Amounts on GAAP basis | | $ | (0.12) | | $ | 0.75 | |
Innovative technology costs, after-tax (includes related financing costs)(1) | | | 0.31 | | | 0.38 | |
Purchase accounting amortization, after-tax(2) | | | 0.10 | | | 0.10 | |
Change in fair value of contingent consideration, after-tax(3) | | | 0.23 | | | 0.45 | |
Change in fair value of equity investment, after-tax(4) | | | 0.90 | | | — | |
Life insurance proceeds and changes in cash surrender value | | | (0.05) | | | (0.06) | |
Tax benefit from vested RSUs(5) | | | (0.02) | | | (0.04) | |
Non-GAAP amounts(7) | | $ | 1.34 | | $ | 1.58 | |
See “Notes to Non-GAAP Financial Tables” for footnotes to this ArcBest Corporation – Consolidated non-GAAP table.
9
ARCBEST CORPORATION
RECONCILIATIONS OF GAAP TO NON-GAAP FINANCIAL MEASURES – Continued
| | Three Months Ended | | ||||||||||
| | March 31 | | ||||||||||
|
| 2024 | | 2023 | | ||||||||
Segment Operating Income (Loss) Reconciliations | | (Unaudited) | | ||||||||||
| | ($ thousands, except percentages) | | ||||||||||
Asset-Based Segment | | | | ||||||||||
Operating Income ($) and Operating Ratio (% of revenues) | | | | ||||||||||
Amounts on GAAP basis | | $ | 53,456 | | 92.0 | % | | $ | 47,471 | | 93.2 | % | |
Innovative technology costs, pre-tax(8) | | | — | | — | | | | 6,068 | | (0.9) | | |
Non-GAAP amounts(7) | | $ | 53,456 | | 92.0 | % | | $ | 53,539 | | 92.3 | % | |
| | | | ||||||||||
Asset-Light Segment | | | | ||||||||||
Operating Income (Loss) ($) and Operating Ratio (% of revenues) | | | | ||||||||||
Amounts on GAAP basis | | $ | (15,258) | | 103.8 | % | | $ | (14,091) | | 103.2 | % | |
Purchase accounting amortization, pre-tax(2) | | | 3,192 | | (0.8) | | | | 3,192 | | (0.7) | | |
Change in fair value of contingent consideration, pre-tax(3) | | | 7,320 | | (1.8) | | | | 15,040 | | (3.4) | | |
Non-GAAP amounts(7) | | $ | (4,746) | | 101.2 | % | | $ | 4,141 | | 99.1 | % | |
| | | | ||||||||||
Other and Eliminations | | | | ||||||||||
Operating Income (Loss) ($) | | | | ||||||||||
Amounts on GAAP basis | | $ | (15,763) | | | | | $ | (12,221) | | | | |
Innovative technology costs, pre-tax(1) | | | 9,698 | | | | | | 6,410 | | | | |
Non-GAAP amounts(7) | | $ | (6,065) | | | | | $ | (5,811) | | | | |
Note: See “Notes to Non-GAAP Financial Tables” for footnotes to this Segment Operating Income (Loss) Reconciliations non-GAAP table.
10
ARCBEST CORPORATION
RECONCILIATIONS OF GAAP TO NON-GAAP FINANCIAL MEASURES – Continued
Effective Tax Rate Reconciliation | | | | | | | | | | | | | | | ||||
ArcBest Corporation - Consolidated | | | | | | | | | | | | | | | | | | |
| | | | | | | | | | | | | | | | | | |
(Unaudited) | | | | | | | | | | | | | | | | | | |
($ thousands, except percentages) | | Three Months Ended March 31, 2024 | ||||||||||||||||
| | | | | Other | | Income (Loss) | | Income Tax | | Net | | | | ||||
CONTINUING OPERATIONS | | Operating | | Income | | Before Income | | Provision | | Income | | | ||||||
| | Income | | (Costs) | | Taxes | | (Benefit) | | (Loss) | | Tax Rate(9) | ||||||
Amounts on GAAP basis | | $ | 22,435 | | $ | (27,112) | | $ | (4,677) | | $ | (1,765) | | $ | (2,912) | | (37.7) | % |
Innovative technology costs(1) | | | 9,698 | | | 195 | | | 9,893 | | | 2,453 | | | 7,440 | | 24.8 | |
Purchase accounting amortization(2) | | | 3,192 | | | — | | | 3,192 | | | 791 | | | 2,401 | | 24.8 | |
Change in fair value of contingent consideration(3) | | | 7,320 | | | — | | | 7,320 | | | 1,815 | | | 5,505 | | 24.8 | |
Change in fair value of equity investment(4) | | | — | | | 28,739 | | | 28,739 | | | 7,136 | | | 21,603 | | 24.8 | |
Life insurance proceeds and changes in cash surrender value | | | — | | | (1,233) | | | (1,233) | | | — | | | (1,233) | | — | |
Tax benefit from vested RSUs(5) | | | — | | | — | | | — | | | 487 | | | (487) | | — | |
Non-GAAP amounts | | $ | 42,645 | | $ | 589 | | $ | 43,234 | | $ | 10,917 | | $ | 32,317 | | 25.3 | % |
| | Three Months Ended March 31, 2023 | ||||||||||||||||
| | | | Other | | Income | | Income | | | | | | |||||
CONTINUING OPERATIONS | | Operating | | Income | | Before Income | | Tax | | Net | | | ||||||
| | Income | | (Costs) | | Taxes | | Provision | | Income | | Tax Rate(9) | ||||||
Amounts on GAAP basis | | $ | 21,159 | | $ | 2,386 | | $ | 23,545 | | $ | 4,698 | | $ | 18,847 | | 20.0 | % |
Innovative technology costs(1) | | | 12,478 | | | 259 | | | 12,737 | | | 3,257 | | | 9,480 | | 25.6 | |
Purchase accounting amortization(2) | | | 3,192 | | | — | | | 3,192 | | | 794 | | | 2,398 | | 24.9 | |
Change in fair value of contingent consideration(3) | | | 15,040 | | | — | | | 15,040 | | | 3,741 | | | 11,299 | | 24.9 | |
Life insurance proceeds and changes in cash surrender value | | | — | | | (1,496) | | | (1,496) | | | — | | | (1,496) | | — | |
Tax benefit from vested RSUs(5) | | | — | | | — | | | — | | | 1,051 | | | (1,051) | | — | |
Non-GAAP amounts | | $ | 51,869 | | $ | 1,149 | | $ | 53,018 | | $ | 13,541 | | $ | 39,477 | | 25.5 | % |
Note: See “Notes to Non-GAAP Financial Tables” for footnotes to this Effective Tax Rate Reconciliation non-GAAP table.
11
ARCBEST CORPORATION
RECONCILIATIONS OF GAAP TO NON-GAAP FINANCIAL MEASURES – Continued
Adjusted Earnings Before Interest, Taxes, Depreciation, and Amortization (Adjusted EBITDA)
Management uses Adjusted EBITDA as a key measure of performance and for business planning. The measure is particularly meaningful for analysis of operating performance because it excludes amortization of acquired intangibles and software of the Asset-Light segment and changes in the fair values of contingent consideration and our equity investment, which are significant expenses resulting from strategic decisions or other factors rather than core daily operations. Additionally, Adjusted EBITDA is a primary component of the financial covenants contained in our credit agreement. The calculation of Consolidated Adjusted EBITDA as presented below begins with net income (loss) from continuing operations, which is the most directly comparable GAAP measure. The calculation of Asset-Light Adjusted EBITDA as presented below begins with operating income (loss), as other income (costs), income taxes, and net income (loss) from continuing operations are reported at the consolidated level and not included in the operating segment financial information evaluated by management to make operating decisions.
| | Three Months Ended | | ||||
| | March 31 | | ||||
|
| 2024 |
| 2023 |
| ||
| | (Unaudited) | |||||
| | ($ thousands) | |||||
ArcBest Corporation - Consolidated Adjusted EBITDA from Continuing Operations | | | |||||
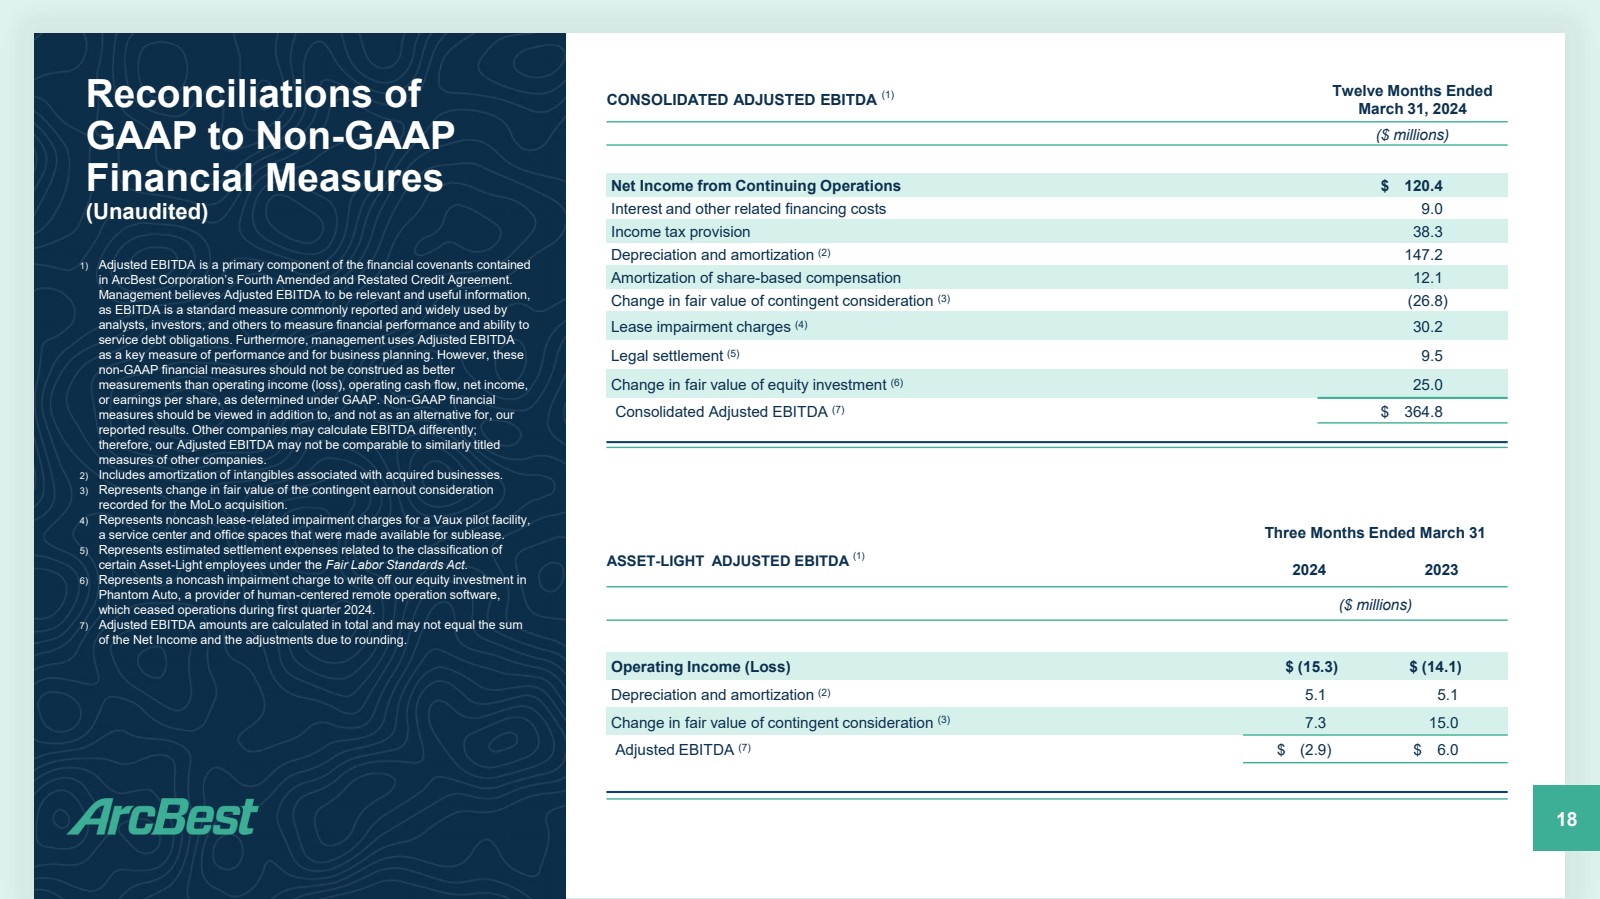
Net Income (Loss) from Continuing Operations | | $ | (2,912) | | $ | 18,847 | |
Interest and other related financing costs | |
| 2,228 | |
| 2,327 | |
Income tax provision (benefit) | |
| (1,765) | |
| 4,698 | |
Depreciation and amortization(10) | |
| 36,833 | |
| 35,010 | |
Amortization of share-based compensation | |
| 2,889 | |
| 2,182 | |
Change in fair value of contingent consideration(3) | |
| 7,320 | |
| 15,040 | |
Change in fair value of equity investment(4) | | | 28,739 | |
| — | |
Consolidated Adjusted EBITDA from Continuing Operations | | $ | 73,332 | | $ | 78,104 | |
Note: See “Notes to Non-GAAP Financial Tables” for footnotes to this ArcBest Corporation – Consolidated Adjusted EBITDA from Continuing Operations non-GAAP table.
| | Three Months Ended | | ||||
| | March 31 | | ||||
|
| 2024 | | 2023 | | ||
| | (Unaudited) | | ||||
| | ($ thousands) | | ||||
Asset-Light Adjusted EBITDA | | | | | | | |
Operating Income (Loss) | | $ | (15,258) | | $ | (14,091) | |
Depreciation and amortization(10) | | | 5,078 | | | 5,068 | |
Change in fair value of contingent consideration(3) | | | 7,320 | | | 15,040 | |
Asset-Light Adjusted EBITDA | | $ | (2,860) | | $ | 6,017 | |
Note: See “Notes to Non-GAAP Financial Tables” for footnotes to this Asset-Light Adjusted EBITDA non-GAAP table.
12
ARCBEST CORPORATION
RECONCILIATIONS OF GAAP TO NON-GAAP FINANCIAL MEASURES – Continued
Notes to Non-GAAP Financial Tables
The following footnotes apply to the non-GAAP financial tables presented in this press release.
| 1) | Represents costs related to our customer pilot offering of Vaux and initiatives to optimize our performance through technological innovation. The 2023 period also includes costs associated with the freight handling pilot test program at ABF Freight, for which the decision was made to pause the pilot during third quarter 2023. |
| 2) | Represents the amortization of acquired intangible assets in the Asset-Light segment. |
| 3) | Represents change in fair value of the contingent earnout consideration recorded for the MoLo acquisition, as previously described in the footnotes to the Financial Statement Operating Segment Data and Operating Ratios table. |
| 4) | Represents a noncash impairment charge to write off our equity investment in Phantom Auto, a provider of human-centered remote operation software, which ceased operations during first quarter 2024. |
| 5) | Represents recognition of the tax impact for the vesting of share-based compensation. |
| 6) | For first quarter 2024, ArcBest reported a net loss on a GAAP basis and reported net income on a non-GAAP basis. The average common shares outstanding used to calculate non-GAAP diluted earnings per share for first quarter 2024 were adjusted to include unvested restricted stock awards, which were excluded from the calculation of GAAP diluted earnings per share due to the net loss. |
|
| Three Months Ended | | |
| | March 31, 2024 | | |
Average Common Shares Outstanding | | | | |
Diluted shares on GAAP basis | | | 23,561,309 | |
Effect of unvested restricted stock awards | |
| 568,770 | |
Non-GAAP diluted shares | | | 24,130,079 | |
| 7) | Non-GAAP amounts are calculated in total and may not equal the sum of the GAAP amounts and the non-GAAP adjustments due to rounding. |
| 8) | Represents costs associated with the freight handling pilot test program at ABF Freight, for which the decision was made to pause the pilot during third quarter 2023. |
| 9) | Tax rate for total “Amounts on GAAP basis” represents the effective tax rate. The tax effects of non-GAAP adjustments are calculated based on the statutory rate applicable to each item based on tax jurisdiction unless the nature of the item requires the tax effect to be estimated by applying a specific tax treatment. |
| 10) | Includes amortization of intangibles associated with acquired businesses. |
13
ARCBEST CORPORATION
OPERATING STATISTICS
| | Three Months Ended | | ||||||
| | March 31 | | ||||||
|
| 2024 |
| 2023 |
| % Change |
| ||
| | (Unaudited) | | ||||||
Asset-Based | | | | | | | | | |
| | | | | | | | | |
Workdays |
| | 63.5 |
| | 64.0 | | |
|
| | | | | | | | | |
Billed Revenue(1) / CWT | | $ | 48.56 | | $ | 41.99 |
| 15.6% | |
| | | | | | | | | |
Billed Revenue(1) / Shipment | | $ | 542.84 | | $ | 529.43 |
| 2.5% | |
| | | | | | | | | |
Shipments / Day | |
| 19,566 | |
| 20,856 |
| (6.2%) | |
| | | | | | | | | |
Tons / Day | |
| 10,937 | |
| 13,149 |
| (16.8%) | |
| | | | | | | | | |
Pounds / Shipment | |
| 1,118 | |
| 1,261 | | (11.3%) | |
| | | | | | | | | |
Average Length of Haul (Miles) | |
| 1,110 | |
| 1,096 |
| 1.3% | |
| | | | | | | | | |
| 1) | Revenue for undelivered freight is deferred for financial statement purposes in accordance with the Asset-Based segment revenue recognition policy. Billed revenue used for calculating revenue per hundredweight measurements has not been adjusted for the portion of revenue deferred for financial statement purposes. |
| | Year Over Year % Change | ||
| | Three Months Ended | ||
|
| March 31, 2024 | ||
| | (Unaudited) | ||
Asset-Light(2) | | | | |
| | | | |
Revenue / Shipment | | | (19.7%) | |
| | | | |
Shipments / Day | | | 13.6% | |
| 2) | Statistical data for the periods presented include transactions related to managed transportation solutions which were previously excluded from the presentation of operating statistics for the Asset-Light segment for the three months ended March 31, 2023. |
###
14