Exhibit 99.1
Investor Relations Contact: David Humphrey | Media Contact: Autumnn Mahar |
Title: Vice President – Investor Relations | Title: Senior Manager, PR and Social |
Phone: 479-785-6200 | Phone: 479-494-8221 |
Email: dhumphrey@arcb.com | Email: amahar@arcb.com |
ArcBest® Announces Record Third Quarter 2021 Results
Successful growth strategy driving superior performance
Advancing strategic vision to better serve customers
and further enhance value for shareholders
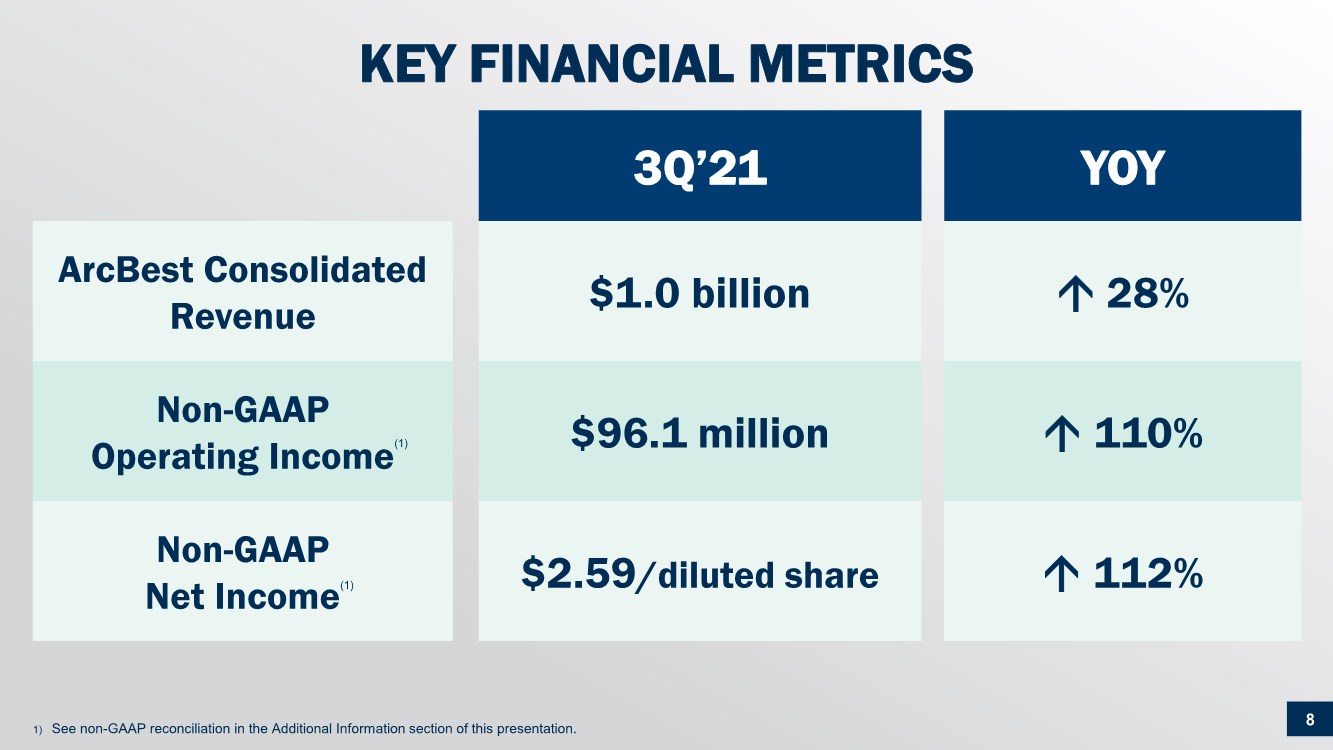
| ● | Third quarter 2021 revenue of $1.0 billion increased 27.9 percent over third quarter 2020. |
| ● | Net income improved to $63.7 million, or $2.38 per diluted share. On a non-GAAP basis, third quarter 2021 net income was $69.2 million, or $2.59 per diluted share. |
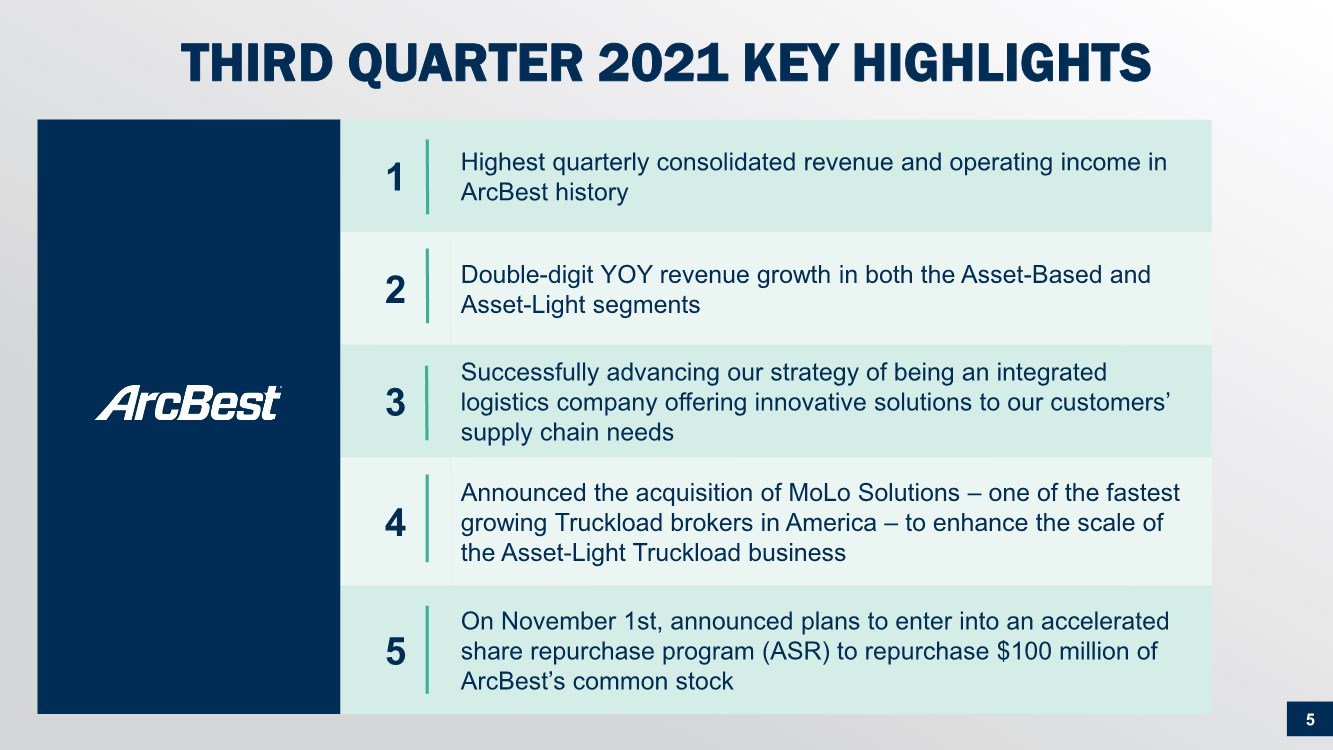
| ● | Highest quarterly revenue and operating income in ArcBest’s history. |
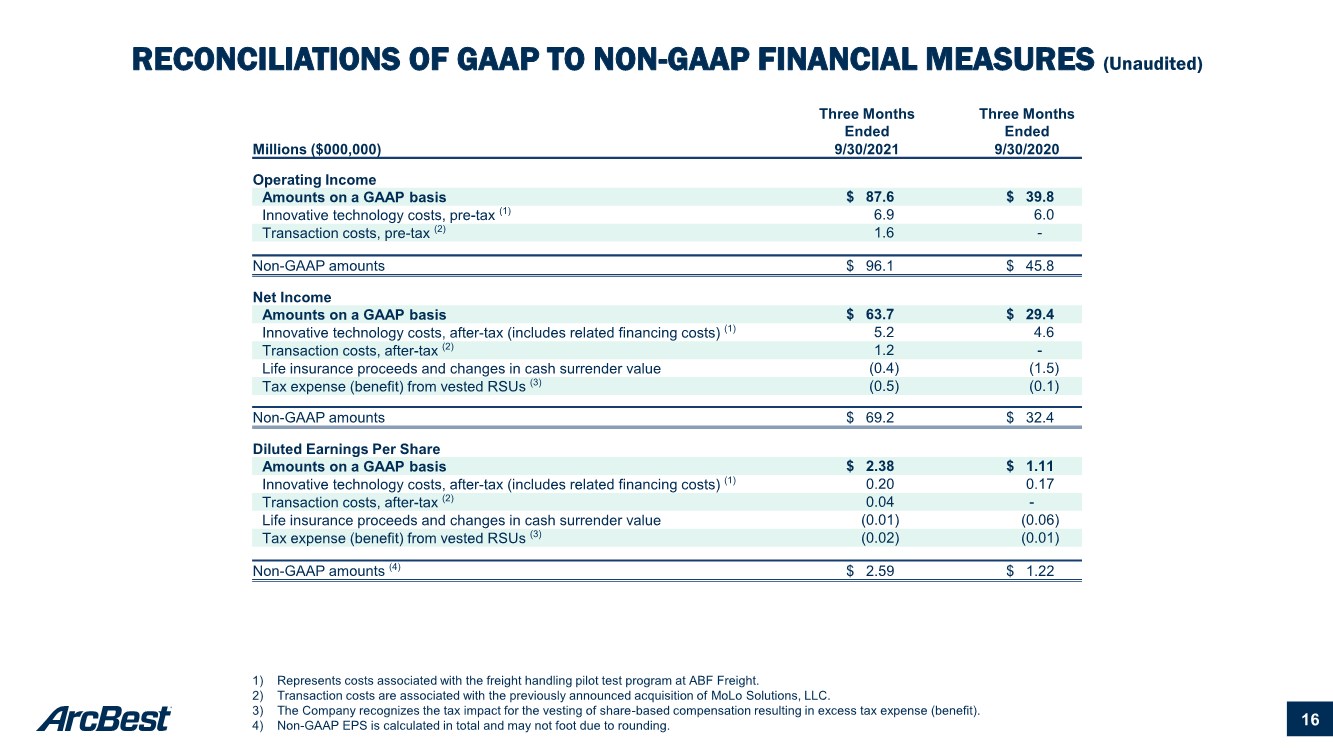
FORT SMITH, Ark., November 2, 2021 — ArcBest® (Nasdaq: ARCB), a leader in supply chain logistics, today reported third quarter 2021 revenue of $1.0 billion compared to third quarter 2020 revenue of $795.0 million. Each of ArcBest’s operating segments achieved double-digit percentage revenue growth over the prior year. ArcBest’s third quarter 2021 operating income was $87.6 million and net income was $63.7 million, or $2.38 per diluted share, compared to third quarter 2020 operating income of $39.8 million and net income of $29.4 million, or $1.11 per diluted share.
Excluding certain items in both periods as identified in the attached reconciliation tables, non-GAAP operating income was $96.1 million in third quarter 2021 compared to $45.8 million in the prior year period. On a non-GAAP basis, net income was $69.2 million, or $2.59 per diluted share, in third quarter 2021 compared to $32.4 million, or $1.22 per diluted share, in third quarter 2020.
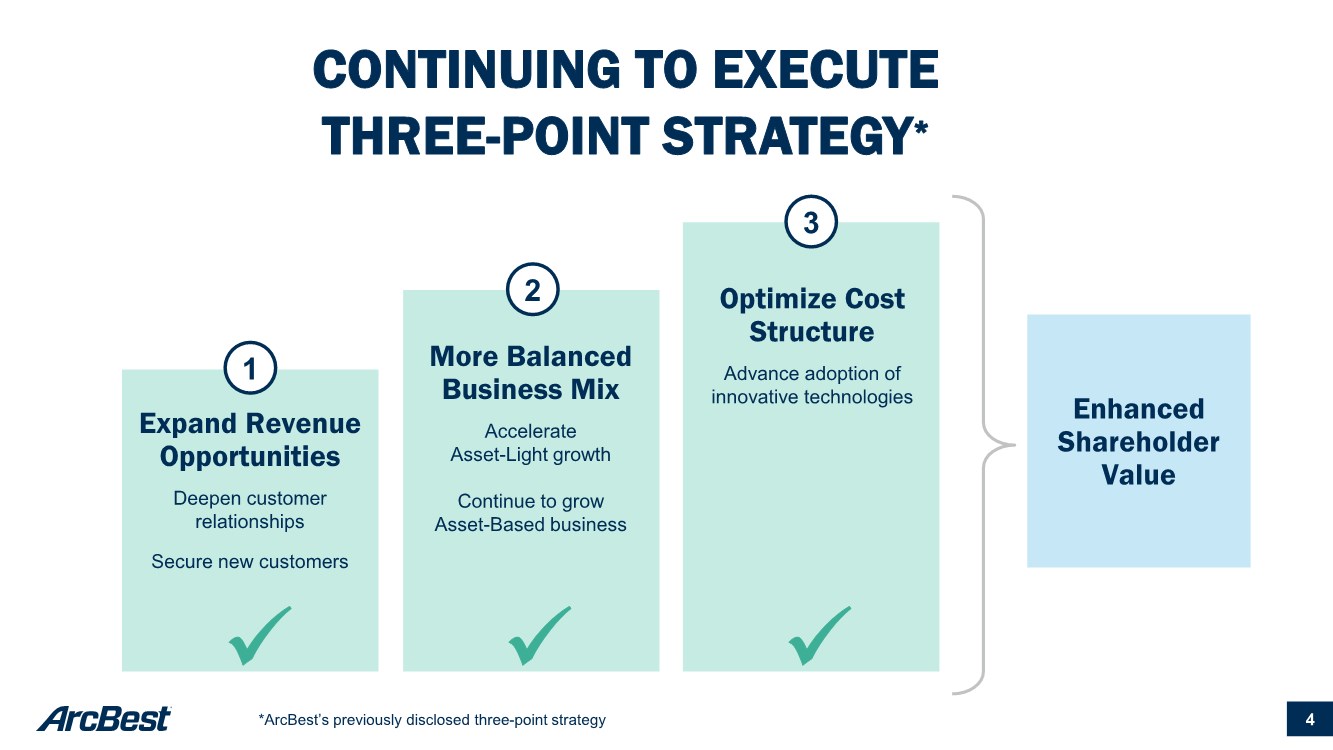
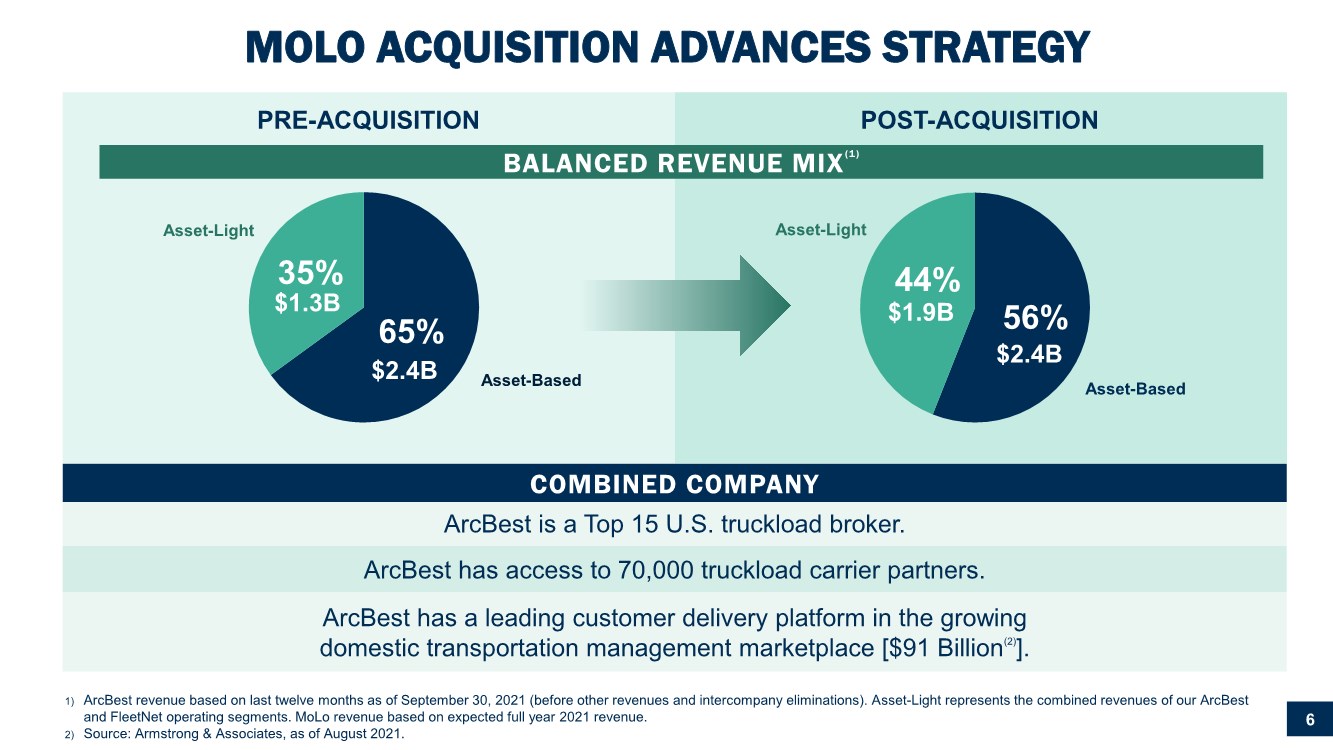
“ArcBest continues to capitalize on the power of our integrated solutions to respond to today’s rapidly evolving market environment,” said Judy R. McReynolds, ArcBest chairman, president and CEO. “Our strategic vision, which is centered on accelerating growth through targeted investments in innovation, technology, logistics solutions and our people, continues to pay off. Furthering these efforts, yesterday’s closing of the MoLo Solutions acquisition is expected to build and amplify our powerful portfolio of shipping and logistics services to help our customers drive the economy forward and unlock incremental value for our shareholders.”
McReynolds added, “We wouldn’t be where we are today – announcing record quarterly results – without ArcBest’s talented and committed people, who are at the heart of our success. Our proven ability to operate safely and efficiently while advancing our strategic vision and generating strong financial results is due to our team’s consistency and the trusted relationships they have built with our customers. Looking ahead, we are focused on continuing to successfully execute our growth strategy and creating sustainable value for our stakeholders, including our shareholders.”
1
Third Quarter Results of Operations Comparisons
Asset-Based
Third Quarter 2021 Versus Third Quarter 2020
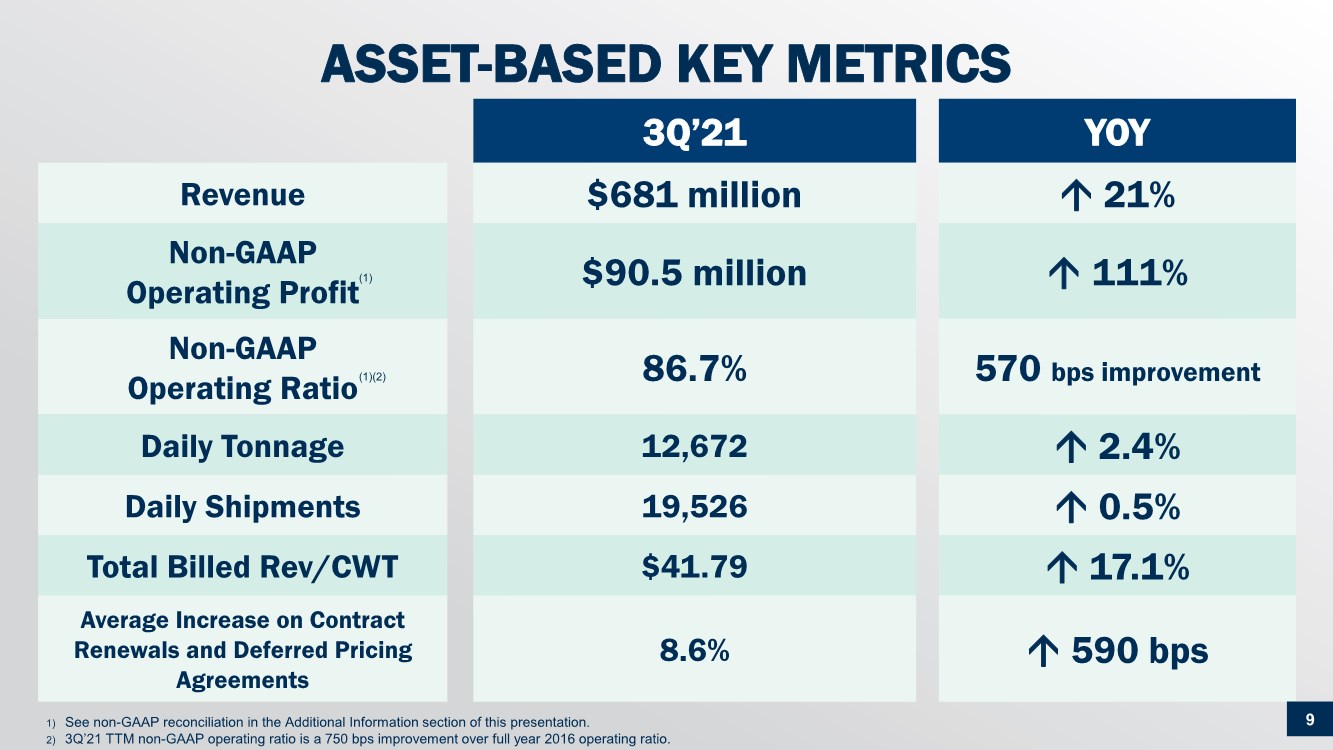
| ● | Revenue of $681.2 million compared to $561.9 million, a per-day increase of 21.2 percent. |
| ● | Total tonnage per day increase of 2.4 percent, including an increase of 2.5 percent in LTL-rated weight per shipment. |
| ● | Total shipments per day increase of 0.5 percent. |
| ● | Total billed revenue per hundredweight increased 17.1 percent and was positively impacted by higher fuel surcharges. Revenue per hundredweight on LTL-rated business, excluding fuel surcharge, improved by a percentage in the double digits. |
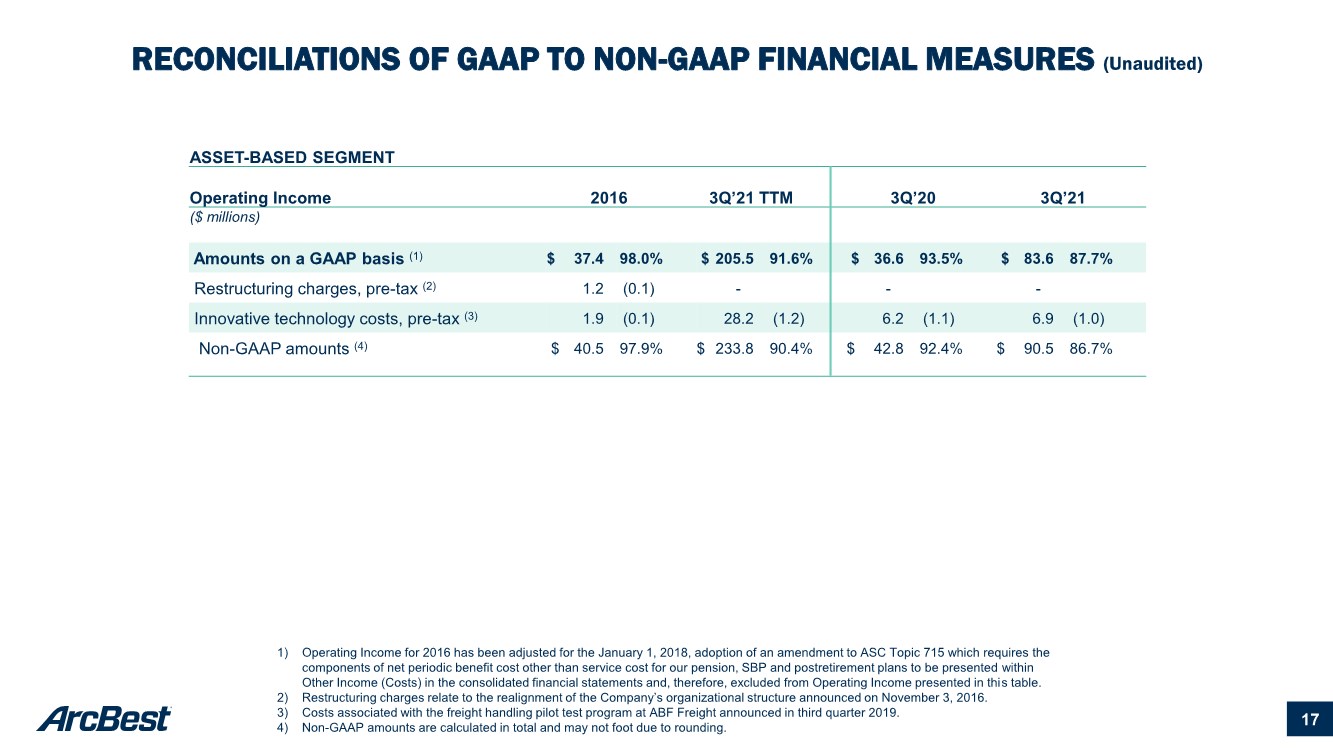
| ● | Operating income of $83.6 million and an operating ratio of 87.7 percent compared to the prior-year quarter operating income of $36.6 million and an operating ratio of 93.5 percent. On a non-GAAP basis, operating income of $90.5 million and an operating ratio of 86.7 percent compared to the prior-year quarter operating income of $42.8 million and an operating ratio of 92.4 percent. |
Strong shipper demand and a solid pricing environment coupled with ArcBest’s deep understanding of customer needs resulted in the third record-setting quarter in a row this year for ArcBest’s Asset-Based business. Year-over-year tonnage and shipment growth was the result of an emphasis on allocating network resources to serving core LTL customers. Shippers have continued to benefit from ArcBest’s assets and facilities throughout its Asset-Based network being used to help solve supply chain challenges. Third quarter 2021 operating income more than doubled compared to the prior-year period and reflected a healthy sequential increase compared to the recent second quarter.
Asset-Light‡
Third Quarter 2021 Versus Third Quarter 2020
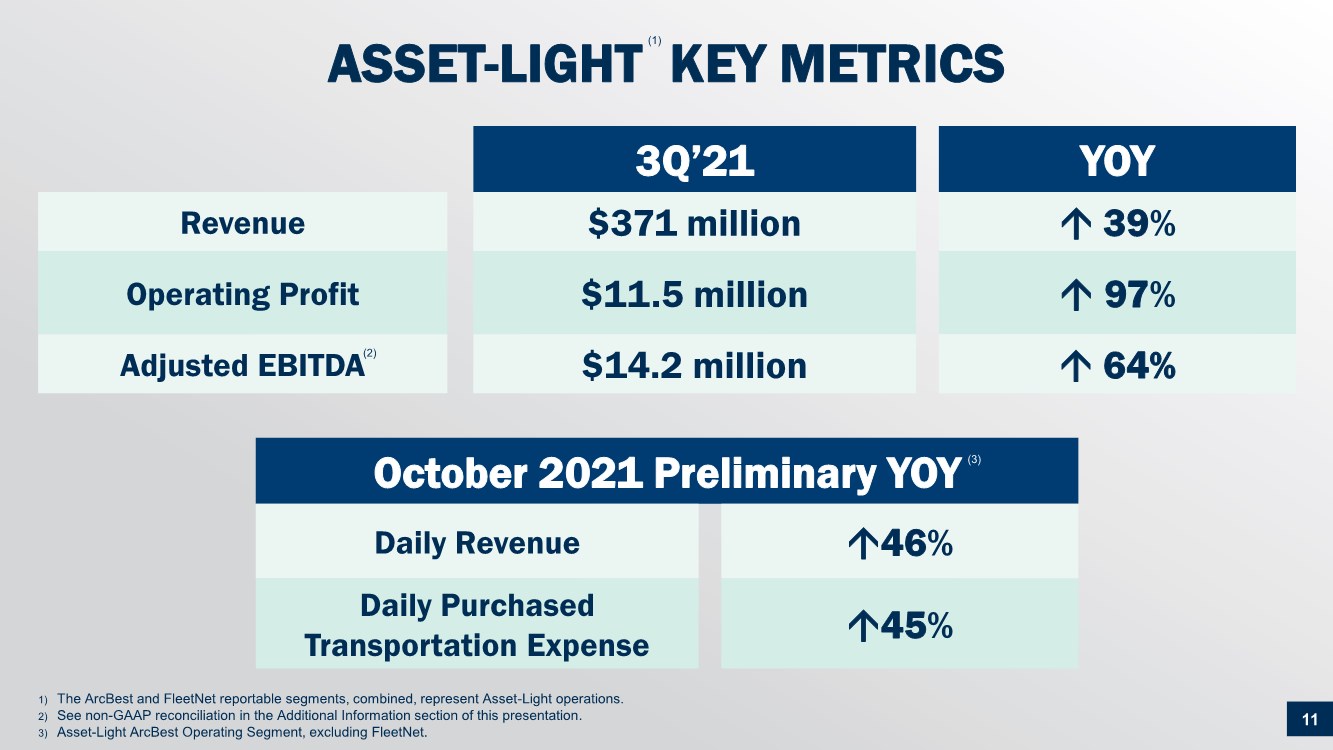
| ● | Revenue of $371.7 million compared to $267.8 million, a per-day increase of 38.8 percent. |
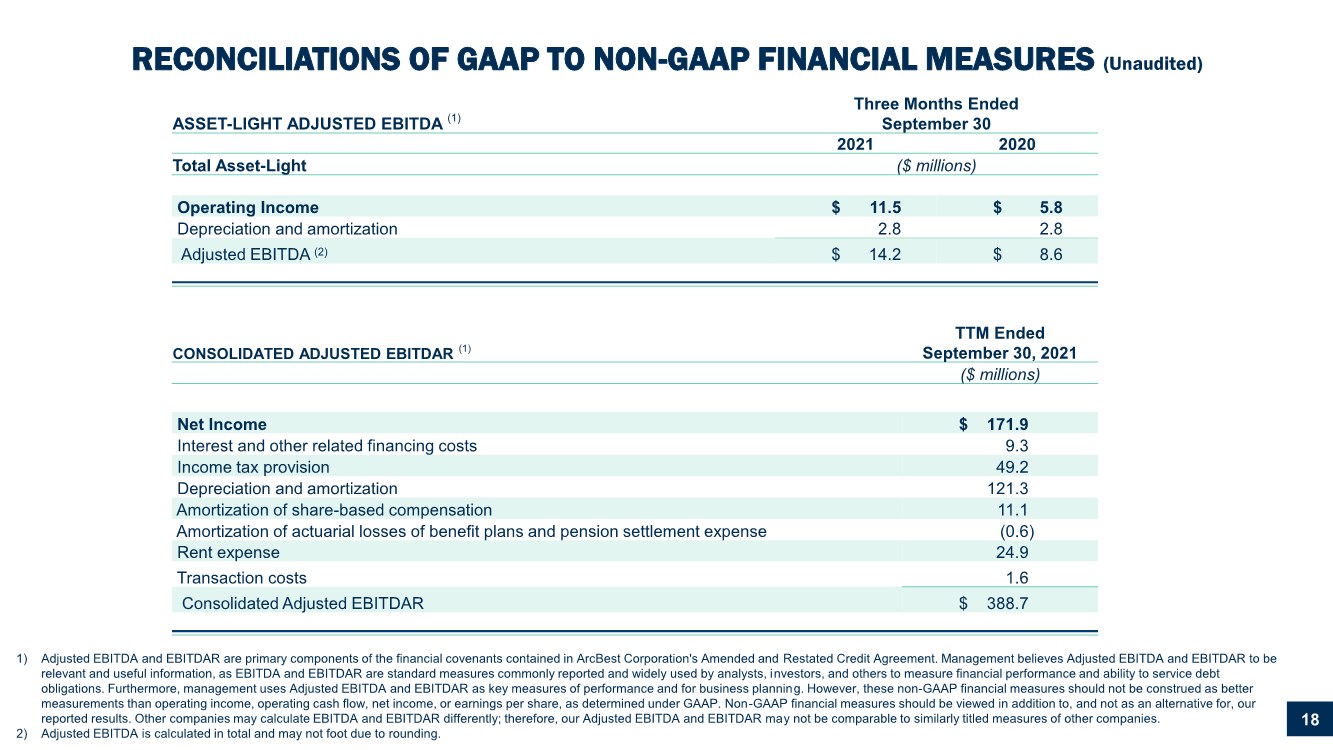
| ● | Operating income of $11.5 million compared to the prior-year quarter operating income of $5.8 million. |
| ● | Adjusted earnings before interest, taxes, depreciation and amortization (“Adjusted EBITDA”) of $14.2 million compared to the prior-year quarter Adjusted EBITDA of $8.6 million, as detailed in the attached non-GAAP reconciliation tables. |
Positive momentum in the ArcBest segment continued in the third quarter with record-setting quarterly revenue and operating income. The ability to positively respond to strong customer demand with innovative solutions contributed to solid revenue growth in the ArcBest segment. Increased demand for expedited and truckload logistics services resulted in higher shipment levels and higher average revenue per shipment. Customers’ needs for managed transportation solutions also contributed to third quarter revenue growth and improved operating results. The increase in operating income reflects the benefits of higher revenue, partially offset by increased personnel costs in response to shipment growth and continued investments in technology.
Increased business volume combined with higher revenue per event contributed to record quarterly revenue for the FleetNet segment and an increase in operating income over the prior year’s third quarter.
NOTE
‡ - The ArcBest and FleetNet reportable segments, combined, represent Asset-Light operations.
2
Conference Call
ArcBest will host a conference call with company executives to discuss the 2021 third quarter results. The call will be today, Tuesday, November 2, at 9:30 a.m. EDT (8:30 a.m. CDT). Interested parties are invited to listen by calling (800) 669-4993 or by joining the webcast which can be found on ArcBest’s website at arcb.com. Slides to accompany this call are included in Exhibit 99.3 of the Form 8-K filed on November 2, 2021, will be posted and available to download on the company’s website prior to the scheduled conference time, and will be included in the webcast. Following the call, a recorded playback will be available through the end of the day on December 15, 2021. To listen to the playback, dial (800) 633-8284 or (402) 977-9140 (for international callers). The conference call ID for the playback is 21998422. The conference call and playback can also be accessed, through December 15, 2021, on ArcBest’s website at arcb.com.
About ArcBest
ArcBest® (Nasdaq: ARCB) is a multibillion-dollar integrated logistics company that helps keep the global supply chain moving. Founded in 1923 and now with over 14,000 employees across more than 250 campuses and service centers, the company is a logistics powerhouse, fueled by the simple notion of finding a way to get the job done. Through innovative thinking, agility and trust, ArcBest leverages their full suite of shipping and logistics solutions to meet customers’ critical needs, each and every day. For more information, visit arcb.com.
The following is a “safe harbor” statement under the Private Securities Litigation Reform Act of 1995: Certain statements and information in this press release concerning results for the three months ended September 30, 2021 may constitute “forward-looking statements” within the meaning of the Private Securities Litigation Reform Act of 1995. Terms such as “anticipate,” “believe,” “could,” “estimate,” “expect,” “forecast,” “foresee,” “int end,” “may,” “plan,” “predict,” “project,” “scheduled,” “should,” “would,” and similar expressions and the negatives of such terms are intended to identify forward-looking statements. These statements are based on management’s beliefs, assumptions, and expectations based on currently available information, are not guarantees of future performance, and involve certain risks and uncertainties (some of which are beyond our control). Although we believe that the expectations reflected in these forward-looking statements are reasonable as and when made, we cannot provide assurance that our expectations will prove to be correct. Actual outcomes and results could materially differ from what is expressed, implied, or forecasted in these statements due to a number of factors, including, but not limited to: widespread outbreak of an illness or disease, including the COVID-19 pandemic and its effects, or any other public health crisis, as well as regulatory measures implemented in response to such events; external events which may adversely affect us or the third parties who provide services for us, for which our business continuity plans may not adequately prepare us; a failure of our information systems, including disruptions or failures of services essential to our operations or upon which our information technology platforms rely, data breach, and/or cybersecurity incidents; interruption or failure of third-party software or information technology systems or licenses; untimely or ineffective development and implementation of, or failure to realize potential benefits associated with, new or enhanced technology or processes, including the pilot test program at ABF Freight; the loss or reduction of business from large customers; the ability to manage our cost structure, and the timing and performance of growth initiatives; the cost, integration, and performance of any recent or future acquisitions, including the MoLo acquisition, and the inability to realize the anticipated benefits of the acquisition within the expected time period or at all; the timing or amount of the earnout payments for the MoLo acquisition, if any; maintaining our corporate reputation and intellectual property rights; competitive initiatives and pricing pressures; increased prices for and decreased availability of new revenue equipment, decreases in value of used revenue equipment, and higher costs of equipment-related operating expenses such as maintenance, fuel, and related taxes; availability of fuel, the effect of volatility in fuel prices and the associated changes in fuel surcharges on securing increases in base freight rates, and the inability to collect fuel surcharges; relationships with employees, including unions, and our ability to attract, retain, and develop employees; unfavorable terms of, or the inability to reach agreement on, future collective bargaining agreements or a workforce stoppage by our employees covered under ABF Freight’s collective bargaining agreement; union employee wages and benefits, including changes in required contributions to multiemployer plans; availability and cost of reliable third-party services; our ability to secure independent owner operators and/or operational or regulatory issues related to our use of their services; litigation or claims asserted against us; governmental regulations; environmental laws and regulations, including emissions-control regulations; default on covenants of financing arrangements and the availability and terms of future financing arrangements; self-insurance claims and insurance premium costs; potential impairment of goodwill and intangible assets; general economic conditions and related shifts in market demand that impact the performance and needs of industries we serve and/or limit our customers’ access to adequate financial resources; seasonal fluctuations and adverse weather conditions; and other financial, operational, and legal risks and uncertainties detailed from time to time in ArcBest Corporation’s public filings with the Securities and Exchange Commission (the “SEC”).
For additional information regarding known material factors that could cause our actual results to differ from our projected results, please see our filings with the SEC, including our Annual Report on Form 10-K, Quarterly Reports on Form 10-Q, and Current Reports on Form 8-K.
Readers are cautioned not to place undue reliance on forward-looking statements, which speak only as of the date hereof. We undertake no obligation to publicly update or revise any forward-looking statements after the date they are made, whether as a result of new information, future events, or otherwise.
3
Financial Data and Operating Statistics
The following tables show financial data and operating statistics on ArcBest® and its reportable segments.
4
ARCBEST CORPORATION
CONSOLIDATED STATEMENTS OF OPERATIONS
| | Three Months Ended | | Nine Months Ended | | ||||||||
| | September 30 | | September 30 | | ||||||||
|
| 2021 |
| 2020 |
| 2021 |
| 2020 |
| ||||
| | (Unaudited) | | ||||||||||
| | ($ thousands, except share and per share data) | | ||||||||||
REVENUES | | $ | 1,016,657 | | $ | 794,980 | | $ | 2,794,843 | | $ | 2,123,749 | |
| | | | | | | | | | | | | |
OPERATING EXPENSES | |
| 929,096 | | | 755,198 | |
| 2,600,792 | | | 2,055,723 | |
| | | | | | | | | | | | | |
OPERATING INCOME | |
| 87,561 | |
| 39,782 | |
| 194,051 | |
| 68,026 | |
| | | | | | | | | | | | | |
OTHER INCOME (COSTS) | | | | | | | | | | | | | |
Interest and dividend income | |
| 323 | |
| 756 | |
| 1,037 | |
| 3,122 | |
Interest and other related financing costs | |
| (2,072) | |
| (2,860) | |
| (6,774) | |
| (9,185) | |
Other, net | |
| 338 | |
| 1,500 | |
| 2,641 | |
| 334 | |
| |
| (1,411) | |
| (604) | |
| (3,096) | |
| (5,729) | |
| | | | | | | | | | | | | |
INCOME BEFORE INCOME TAXES | |
| 86,150 | |
| 39,178 | |
| 190,955 | |
| 62,297 | |
| | | | | | | | | | | | | |
INCOME TAX PROVISION | |
| 22,459 | |
| 9,774 | |
| 42,922 | |
| 15,111 | |
| | | | | | | | | | | | | |
NET INCOME | | $ | 63,691 | | $ | 29,404 | | $ | 148,033 | | $ | 47,186 | |
| | | | | | | | | | | | | |
EARNINGS PER COMMON SHARE | | | | | | | | | | | | | |
Basic | | $ | 2.48 | | $ | 1.15 | | $ | 5.79 | | $ | 1.86 | |
Diluted | | $ | 2.38 | | $ | 1.11 | | $ | 5.51 | | $ | 1.79 | |
| | | | | | | | | | | | | |
AVERAGE COMMON SHARES OUTSTANDING | | | | | | | | | | | | | |
Basic | |
| 25,632,805 | |
| 25,470,094 | |
| 25,559,642 | |
| 25,403,786 | |
Diluted | |
| 26,770,146 | |
| 26,592,457 | |
| 26,872,381 | |
| 26,289,946 | |
| | | | | | | | | | | | | |
CASH DIVIDENDS DECLARED PER COMMON SHARE | | $ | 0.08 | | $ | 0.08 | | $ | 0.24 | | $ | 0.24 | |
5
ARCBEST CORPORATION
| | September 30 | | December 31 | | ||
|
| 2021 |
| 2020 |
| ||
| | (Unaudited) | | Note | | ||
| | ($ thousands, except share data) | | ||||
ASSETS | | | | | | | |
CURRENT ASSETS | | | | | | | |
Cash and cash equivalents | | $ | 408,207 | | $ | 303,954 | |
Short-term investments | |
| 60,289 | |
| 65,408 | |
Accounts receivable, less allowances (2021 - $6,847; 2020 - $7,851) | |
| 425,006 | |
| 320,870 | |
Other accounts receivable, less allowances (2021 - $671; 2020 - $660) | |
| 13,827 | |
| 14,343 | |
Prepaid expenses | |
| 30,120 | |
| 37,774 | |
Prepaid and refundable income taxes | |
| 9,258 | |
| 11,397 | |
Other | |
| 6,419 | |
| 4,422 | |
TOTAL CURRENT ASSETS | |
| 953,126 | |
| 758,168 | |
| | | | | | | |
PROPERTY, PLANT AND EQUIPMENT | | | | | | | |
Land and structures | |
| 347,771 | |
| 342,178 | |
Revenue equipment | |
| 965,263 | |
| 916,760 | |
Service, office, and other equipment | |
| 243,601 | |
| 233,810 | |
Software | |
| 170,045 | |
| 163,193 | |
Leasehold improvements | |
| 15,970 | |
| 15,156 | |
| | | 1,742,650 | | | 1,671,097 | |
Less allowances for depreciation and amortization | |
| 1,058,343 | |
| 992,407 | |
| |
| 684,307 | |
| 678,690 | |
| | | | | | | |
GOODWILL | |
| 86,368 | |
| 88,320 | |
INTANGIBLE ASSETS, NET | |
| 52,135 | |
| 54,981 | |
OPERATING RIGHT-OF-USE ASSETS | | | 105,219 | | | 115,195 | |
DEFERRED INCOME TAXES | |
| 6,544 | |
| 6,158 | |
OTHER LONG-TERM ASSETS | | | 74,729 | | | 77,496 | |
| | $ | 1,962,428 | | $ | 1,779,008 | |
| | | | | | | |
LIABILITIES AND STOCKHOLDERS’ EQUITY | | | | | | | |
| | | | | | | |
CURRENT LIABILITIES | | | | | | | |
Accounts payable | | $ | 227,893 | | $ | 170,898 | |
Income taxes payable | |
| 6,535 | |
| 316 | |
Accrued expenses | |
| 291,586 | |
| 246,746 | |
Current portion of long-term debt | |
| 67,897 | |
| 67,105 | |
Current portion of operating lease liabilities | | | 21,765 | | | 21,482 | |
TOTAL CURRENT LIABILITIES | |
| 615,676 | |
| 506,547 | |
| | | | | | | |
LONG-TERM DEBT, less current portion | |
| 176,545 | |
| 217,119 | |
OPERATING LEASE LIABILITIES, less current portion | | | 88,232 | | | 97,839 | |
POSTRETIREMENT LIABILITIES, less current portion | |
| 18,506 | |
| 18,555 | |
OTHER LONG-TERM LIABILITIES | |
| 38,208 | |
| 37,948 | |
DEFERRED INCOME TAXES | |
| 64,218 | |
| 72,407 | |
| | | | | | | |
STOCKHOLDERS’ EQUITY | | | | | | | |
Common stock, $0.01 par value, authorized 70,000,000 shares; | |
| 294 | |
| 290 | |
Additional paid-in capital | |
| 340,315 | |
| 342,354 | |
Retained earnings | |
| 737,820 | |
| 595,932 | |
Treasury stock, at cost, 2021: 3,783,227 shares; 2020: 3,656,938 shares | |
| (119,273) | |
| (111,173) | |
Accumulated other comprehensive income | |
| 1,887 | |
| 1,190 | |
TOTAL STOCKHOLDERS’ EQUITY | |
| 961,043 | |
| 828,593 | |
| | $ | 1,962,428 | | $ | 1,779,008 | |
Note: The balance sheet at December 31, 2020 has been derived from the audited financial statements at that date but does not include all of the information and footnotes required by generally accepted accounting principles for complete financial statements.
6
ARCBEST CORPORATION
CONSOLIDATED STATEMENTS OF CASH FLOWS
| | Nine Months Ended | | ||||
| | September 30 | | ||||
|
| 2021 |
| 2020 |
| ||
| | Unaudited | | ||||
| | ($ thousands) | | ||||
OPERATING ACTIVITIES | | | | | | | |
Net income | | $ | 148,033 | | $ | 47,186 | |
Adjustments to reconcile net income to net cash provided by operating activities: | | | | | | | |
Depreciation and amortization | |
| 88,113 | |
| 85,189 | |
Amortization of intangibles | |
| 2,882 | |
| 2,942 | |
Pension settlement expense | |
| — | |
| 89 | |
Share-based compensation expense | |
| 8,567 | |
| 7,956 | |
Provision for losses on accounts receivable | |
| (57) | |
| 2,170 | |
Change in deferred income taxes | |
| (8,593) | |
| 2,831 | |
Gain on sale of property and equipment and lease termination | |
| (8,389) | |
| (3,280) | |
Gain on sale of subsidiaries | | | (6,923) | | | — | |
Changes in operating assets and liabilities: | | | | | | | |
Receivables | |
| (103,886) | |
| (38,905) | |
Prepaid expenses | |
| 7,655 | |
| 809 | |
Other assets | |
| 539 | |
| 3,918 | |
Income taxes | |
| 8,174 | |
| 3,065 | |
Operating right-of-use assets and lease liabilities, net | |
| 650 | |
| 234 | |
Accounts payable, accrued expenses, and other liabilities | |
| 101,577 | |
| 37,062 | |
NET CASH PROVIDED BY OPERATING ACTIVITIES | |
| 238,342 | |
| 151,266 | |
| | | | | | | |
INVESTING ACTIVITIES | | | | | | | |
Purchases of property, plant and equipment, net of financings | |
| (43,506) | |
| (20,146) | |
Proceeds from sale of property and equipment | |
| 11,509 | |
| 8,943 | |
Proceeds from sale of subsidiaries | |
| 9,013 | | | — | |
Purchases of short-term investments | |
| (56,011) | |
| (159,253) | |
Proceeds from sale of short-term investments | |
| 61,174 | |
| 192,563 | |
Capitalization of internally developed software | |
| (14,308) | |
| (9,568) | |
NET CASH PROVIDED BY (USED IN) INVESTING ACTIVITIES | |
| (32,129) | |
| 12,539 | |
| | | | | | | |
FINANCING ACTIVITIES | | | | | | | |
Borrowings under credit facilities | |
| — | |
| 180,000 | |
Borrowings under accounts receivable securitization program | | | — | | | 45,000 | |
Payments on long-term debt | |
| (76,513) | |
| (309,640) | |
Net change in book overdrafts | |
| (305) | |
| 349 | |
Deferred financing costs | |
| (295) | |
| — | |
Payment of common stock dividends | |
| (6,145) | |
| (6,122) | |
Purchases of treasury stock | | | (8,100) | | | (5,667) | |
Payments for tax withheld on share-based compensation | |
| (10,602) | |
| (1,989) | |
NET CASH USED IN FINANCING ACTIVITIES | |
| (101,960) | |
| (98,069) | |
| | | | | | | |
NET INCREASE IN CASH AND CASH EQUIVALENTS | |
| 104,253 | |
| 65,736 | |
Cash and cash equivalents at beginning of period | |
| 303,954 | |
| 201,909 | |
CASH AND CASH EQUIVALENTS AT END OF PERIOD | | $ | 408,207 | | $ | 267,645 | |
| | | | | | | |
NONCASH INVESTING ACTIVITIES | | | | | | | |
Equipment financed | | $ | 36,731 | | $ | 53,045 | |
Accruals for equipment received | | $ | 3,158 | | $ | 2,146 | |
Lease liabilities arising from obtaining right-of-use assets | | $ | 7,280 | | $ | 60,535 | |
7
ARCBEST CORPORATION
FINANCIAL STATEMENT OPERATING SEGMENT DATA AND OPERATING RATIOS
| | Three Months Ended | | | Nine Months Ended |
| ||||||||||||||||||
| | September 30 | | | September 30 |
| ||||||||||||||||||
|
| 2021 |
| | 2020 |
| | 2021 |
| | 2020 |
| ||||||||||||
| | Unaudited |
| |||||||||||||||||||||
| | ($ thousands, except percentages) |
| |||||||||||||||||||||
REVENUES | | | | | | | | | | | | | | | | | | | | | | | | |
Asset-Based |
| $ | 681,164 |
| |
|
| $ | 561,856 |
| |
|
| $ | 1,890,288 |
| |
|
| $ | 1,537,639 |
| | |
| | | | | | | | | | | | | | | | | | | | | | | | |
ArcBest | |
| 305,207 | | | | |
| 217,294 | | | | |
| 828,291 | | | | |
| 533,536 | | | |
FleetNet | |
| 66,514 | | | | |
| 50,545 | | | | |
| 185,224 | | | | |
| 149,424 | | | |
Total Asset-Light | | | 371,721 | | | | | | 267,839 | | | | | | 1,013,515 | | | | | | 682,960 | | | |
| | | | | | | | | | | | | | | | | | | | | | | | |
Other and eliminations | |
| (36,228) | | | | |
| (34,715) | | | | |
| (108,960) | | | | |
| (96,850) | | | |
Total consolidated revenues |
| $ | 1,016,657 |
| |
|
| $ | 794,980 |
| |
|
| $ | 2,794,843 |
| |
|
| $ | 2,123,749 |
| | |
| | | | | | | | | | | | | | | | | | | | | | | | |
OPERATING EXPENSES | | | | | | | | | | | | | | | | | | | | | | | | |
Asset-Based | | | | | | | | | | | | | | | | | | | | | | | | |
Salaries, wages, and benefits |
| $ | 305,839 |
| 44.9 | % |
| $ | 287,385 |
| 51.2 | % |
| $ | 893,903 |
| 47.3 | % |
| $ | 820,218 | | 53.3 | % |
Fuel, supplies, and expenses | |
| 66,947 | | 9.8 | | |
| 50,144 | | 8.9 | | |
| 192,477 | | 10.2 | | |
| 157,044 | | 10.2 | |
Operating taxes and licenses | |
| 12,426 | | 1.8 | | |
| 12,296 | | 2.2 | | |
| 36,977 | | 2.0 | | |
| 36,719 | | 2.4 | |
Insurance | |
| 10,175 | | 1.5 | | |
| 8,587 | | 1.5 | | |
| 28,568 | | 1.5 | | |
| 24,658 | | 1.6 | |
Communications and utilities | |
| 4,559 | | 0.7 | | |
| 4,373 | | 0.8 | | |
| 14,192 | | 0.7 | | |
| 13,426 | | 0.9 | |
Depreciation and amortization | |
| 23,233 | | 3.4 | | |
| 24,054 | | 4.3 | | |
| 70,025 | | 3.7 | | |
| 70,651 | | 4.6 | |
Rents and purchased transportation | |
| 95,855 | | 14.1 | | |
| 69,442 | | 12.4 | | |
| 266,525 | | 14.1 | | |
| 171,364 | | 11.2 | |
Shared services | | | 71,017 | | 10.4 | | | | 60,664 | | 10.8 | | | | 196,255 | | 10.4 | | | | 155,154 | | 10.1 | |
Gain on sale of property and equipment(1) | |
| — | | — | | |
| 133 | | — | | |
| (8,624) | | (0.5) | | |
| (3,206) | | (0.2) | |
Innovative technology costs(2) | | | 6,903 | | 1.0 | | |
| 6,199 | | 1.1 | | |
| 21,303 | | 1.1 | | |
| 15,521 | | 1.0 | |
Other | |
| 592 | | 0.1 | | |
| 1,933 | | 0.3 | | |
| 1,103 | | 0.1 | | |
| 5,168 | | 0.3 | |
Total Asset-Based | |
| 597,546 | | 87.7 | % | |
| 525,210 | | 93.5 | % | |
| 1,712,704 | | 90.6 | % | |
| 1,466,717 | | 95.4 | % |
| | | | | | | | | | | | | | | | | | | | | | | | |
ArcBest | | | | | | | | | | | | | | | | | | | | | | | | |
Purchased transportation | |
| 256,900 | | 84.2 | % | |
| 181,129 | | 83.4 | % | |
| 694,498 | | 83.8 | % | |
| 443,401 | | 83.1 | % |
Supplies and expenses | | | 2,741 | | 0.9 | | |
| 2,746 | | 1.3 | | |
| 7,785 | | 0.9 | | |
| 7,015 | | 1.3 | |
Depreciation and amortization(3) | |
| 2,352 | | 0.8 | | |
| 2,413 | | 1.1 | | |
| 7,104 | | 0.9 | | |
| 7,332 | | 1.4 | |
Shared services | | | 31,048 | | 10.2 | | | | 24,217 | | 11.1 | | | | 86,198 | | 10.4 | | | | 64,784 | | 12.1 | |
Gain on sale of subsidiary(4) | | | — | | — | | | | — | | — | | |
| (6,923) | | (0.8) | | |
| — | | — | |
Other | |
| 1,984 | | 0.6 | | |
| 1,958 | | 0.9 | | |
| 6,055 | | 0.7 | | |
| 6,279 | | 1.2 | |
| |
| 295,025 | | 96.7 | % | |
| 212,463 | | 97.8 | % | |
| 794,717 | | 95.9 | % | |
| 528,811 | | 99.1 | % |
FleetNet | |
| 65,245 | | 98.1 | % | |
| 49,558 | | 98.0 | % | |
| 181,794 | | 98.1 | % | |
| 146,615 | | 98.1 | % |
Total Asset-Light | | | 360,270 | | | | | | 262,021 | | | | | | 976,511 | | | | | | 675,426 | | | |
| | | | | | | | | | | | | | | | | | | | | | | | |
Other and eliminations(5) | |
| (28,720) | | | | |
| (32,033) | | | | |
| (88,423) | | | | |
| (86,420) | | | |
Total consolidated operating expenses |
| $ | 929,096 |
| 91.4 | % |
| $ | 755,198 |
| 95.0 | % |
| $ | 2,600,792 |
| 93.1 | % |
| $ | 2,055,723 |
| 96.8 | % |
| | | | | | | | | | | | | | | | | | | | | | | | |
OPERATING INCOME | | | | | | | | | | | | | | | | | | | | | | | | |
Asset-Based | | $ | 83,618 | | | | | $ | 36,646 | | | | | $ | 177,584 | | | | | $ | 70,922 | | | |
| | | | | | | | | | | | | | | | | | | | | | | | |
ArcBest | |
| 10,182 | | | | |
| 4,831 | | | | | | 33,574 | | | | | | 4,725 | | | |
FleetNet | |
| 1,269 | | | | |
| 987 | | | | | | 3,430 | | | | | | 2,809 | | | |
Total Asset-Light | | | 11,451 | | | | | | 5,818 | | | | | | 37,004 | | | | | | 7,534 | | | |
| | | | | | | | | | | | | | | | | | | | | | | | |
Other and eliminations(5) | |
| (7,508) | | | | |
| (2,682) | | | | |
| (20,537) | | | | |
| (10,430) | | | |
Total consolidated operating income | | $ | 87,561 | | | | | $ | 39,782 | | | | | $ | 194,051 | | | | | $ | 68,026 | | | |
| 1) | The nine months ended September 30, 2021 includes an $8.6 million gain on the sale of an unutilized service center property. |
| 2) | Represents costs associated with the freight handling pilot test program at ABF Freight. |
| 3) | Depreciation and amortization includes amortization of intangibles associated with acquired businesses. |
| 4) | Gain relates to the sale of the labor services portion of the ArcBest segment’s moving business in second quarter 2021. |
| 5) | “Other and eliminations” includes corporate costs for certain unallocated shared service costs which are not attributable to any segment, additional investments to offer comprehensive transportation and logistics services across multiple operating segments, and other investments in ArcBest technology and innovations, including innovative technology costs. |
8
ARCBEST CORPORATION
RECONCILIATIONS OF GAAP TO NON-GAAP FINANCIAL MEASURES
Non-GAAP Financial Measures
We report our financial results in accordance with generally accepted accounting principles (“GAAP”). However, management believes that certain non-GAAP performance measures and ratios utilized for internal analysis provide analysts, investors, and others the same information that we use internally for purposes of assessing our core operating performance and provides meaningful comparisons between current and prior period results, as well as important information regarding performance trends. The use of certain non-GAAP measures improves comparability in analyzing our performance because it removes the impact of items from operating results that, in management's opinion, do not reflect our core operating performance. Other companies may calculate non-GAAP measures differently; therefore, our calculation may not be comparable to similarly titled measures of other companies. Certain information discussed in the scheduled conference call could be considered non-GAAP measures. Non-GAAP financial measures should be viewed in addition to, and not as an alternative for, our reported results. These financial measures should not be construed as better measurements than operating income, operating cash flow, net income or earnings per share, as determined under GAAP.
| | Three Months Ended | | Nine Months Ended | |||||||||
| | September 30 | | | September 30 | | |||||||
|
| 2021 | | 2020 |
|
| 2021 | | | 2020 | | ||
ArcBest Corporation - Consolidated | | (Unaudited) | | ||||||||||
| | ($ thousands, except per share data) | | ||||||||||
Operating Income | | | | | | | | | | | | | |
Amounts on GAAP basis | | $ | 87,561 | | $ | 39,782 | | $ | 194,051 | | $ | 68,026 | |
Innovative technology costs, pre-tax(1) | | | 6,893 | | | 6,041 | | | 21,235 | | | 15,340 | |
Gain on sale of subsidiary, pre-tax(2) | | | — | | | — | | | (6,923) | | | — | |
Transaction costs, pre-tax(3) | | | 1,607 | | | — | | | 1,607 | | | — | |
Non-GAAP amounts | | $ | 96,061 | | $ | 45,823 | | $ | 209,970 | | $ | 83,366 | |
| | | | | | | | | | | | | |
Net Income | | | | | | | | | | | | | |
Amounts on GAAP basis | | $ | 63,691 | | $ | 29,404 | | $ | 148,033 | | $ | 47,186 | |
Innovative technology costs, after-tax (includes related financing costs)(1) | | | 5,236 | | | 4,627 | | | 16,139 | | | 11,834 | |
Gain on sale of subsidiary, after-tax(2) | | | — | | | — | | | (5,437) | | | — | |
Transaction costs, after-tax(3) | | | 1,187 | | | — | | | 1,187 | | | — | |
Nonunion pension expense, including settlement expense, after-tax(4) | | | — | | | — | | | — | | | 66 | |
Life insurance proceeds and changes in cash surrender value | | | (394) | | | (1,503) | | | (2,908) | | | (258) | |
Tax expense (benefit) from vested RSUs(5) | | | (480) | | | (138) | | | (7,411) | | | 541 | |
Non-GAAP amounts | | $ | 69,240 | | $ | 32,390 | | $ | 149,603 | | $ | 59,369 | |
| | | | | | | | | | | | | |
Diluted Earnings Per Share | | | | | | | | | | | | | |
Amounts on GAAP basis | | $ | 2.38 | | $ | 1.11 | | $ | 5.51 | | $ | 1.79 | |
Innovative technology costs, after-tax (includes related financing costs)(1) | | | 0.20 | | | 0.17 | | | 0.60 | | | 0.45 | |
Gain on sale of subsidiary, after-tax(2) | | | — | | | — | | | (0.20) | | | — | |
Transaction costs, after-tax(3) | | | 0.04 | | | — | | | 0.04 | | | — | |
Nonunion pension expense, including settlement expense, after-tax(4) | | | — | | | — | | | — | | | — | |
Life insurance proceeds and changes in cash surrender value | | | (0.01) | | | (0.06) | | | (0.11) | | | (0.01) | |
Tax expense (benefit) from vested RSUs(5) | | | (0.02) | | | (0.01) | | | (0.28) | | | 0.02 | |
Non-GAAP amounts(6) | | $ | 2.59 | | $ | 1.22 | | $ | 5.57 | | $ | 2.26 | |
| 1) | Represents costs associated with the freight handling pilot test program at ABF Freight. |
| 2) | Gain relates to the sale of the labor services portion of ArcBest segment’s moving business in second quarter 2021. |
| 3) | Transaction costs are associated with the previously announced acquisition of MoLo Solutions, LLC. |
| 4) | Represents pension settlement expense related to the Company’s supplemental benefit plan. |
| 5) | The Company recognizes the tax impact for the vesting of share-based compensation resulting in excess tax expense (benefit). |
| 6) | Non-GAAP EPS is calculated in total and may not foot due to rounding. |
9
ARCBEST CORPORATION
RECONCILIATIONS OF GAAP TO NON-GAAP FINANCIAL MEASURES – Continued
| | Three Months Ended | | Nine Months Ended | | ||||||||||||||||||||
| | September 30 | | September 30 | | ||||||||||||||||||||
|
| 2021 | | 2020 | | 2021 | | 2020 | | ||||||||||||||||
Segment Operating Income Reconciliations | | (Unaudited) | | ||||||||||||||||||||||
| | ($ thousands, except percentages) | | ||||||||||||||||||||||
Asset-Based Segment | | | | | | ||||||||||||||||||||
Operating Income ($) and Operating Ratio (% of revenues) | | | | | | | | | | | | | | | | ||||||||||
Amounts on GAAP basis | | $ | 83,618 | | 87.7 | % | | $ | 36,646 | | 93.5 | % | | $ | 177,584 | | 90.6 | % | | $ | 70,922 | | 95.4 | % | |
Innovative technology costs, pre-tax(1) | | | 6,903 | | (1.0) | | | | 6,199 | | (1.1) | | | | 21,303 | | (1.1) | | | | 15,521 | | (1.0) | | |
Non-GAAP amounts | | $ | 90,521 | | 86.7 | % | | $ | 42,845 | | 92.4 | % | | $ | 198,887 | | 89.5 | % | | $ | 86,443 | | 94.4 | % | |
| | | | | | ||||||||||||||||||||
Asset-Light | | | | | | ||||||||||||||||||||
| | | | | | ||||||||||||||||||||
ArcBest Segment | | | | | | ||||||||||||||||||||
Operating Income ($) and Operating Ratio (% of revenues) | | | | | | | | | | | | | | | | ||||||||||
Amounts on GAAP basis | | $ | 10,182 | | 96.7 | % | | $ | 4,831 | | 97.8 | % | | $ | 33,574 | | 95.9 | % | | $ | 4,725 | | 99.1 | % | |
Gain on sale of subsidiary, pre-tax(2) | | | — | | — | | | | — | | — | | | | (6,923) | | 0.8 | | | | — | | — | | |
Non-GAAP amounts | | $ | 10,182 | | 96.7 | % | | $ | 4,831 | | 97.8 | % | | $ | 26,651 | | 96.7 | % | | $ | 4,725 | | 99.1 | % | |
| | | | | | ||||||||||||||||||||
FleetNet Segment | | | | | | ||||||||||||||||||||
Operating Income ($) and Operating Ratio (% of revenues) | | | | | | | | | | | | | | | | ||||||||||
Amounts on GAAP basis | | $ | 1,269 | | 98.1 | % | | $ | 987 | | 98.0 | % | | $ | 3,430 | | 98.1 | % | | $ | 2,809 | | 98.1 | % | |
| | | | | | ||||||||||||||||||||
Total Asset-Light | | | | | | ||||||||||||||||||||
Operating Income ($) and Operating Ratio (% of revenues) | | | | | | | | | | | | | | | | ||||||||||
Amounts on GAAP basis | | $ | 11,451 | | 96.9 | % | | $ | 5,818 | | 97.8 | % | | $ | 37,004 | | 96.3 | % | | $ | 7,534 | | 98.9 | % | |
Gain on sale of subsidiary, pre-tax(2) | | | — | | — | | | | — | | — | | | | (6,923) | | 0.7 | | | | — | | — | | |
Non-GAAP amounts | | $ | 11,451 | | 96.9 | % | | $ | 5,818 | | 97.8 | % | | $ | 30,081 | | 97.0 | % | | $ | 7,534 | | 98.9 | % | |
| | | | | | ||||||||||||||||||||
Other and Eliminations | | | | | | ||||||||||||||||||||
Operating Loss ($) | | | | | | | | | | | | | | | | ||||||||||
Amounts on GAAP basis | | $ | (7,508) | | | | | $ | (2,682) | | | | | $ | (20,537) | | | | | $ | (10,430) | | | | |
Innovative technology costs, pre-tax(1) | | | (10) | | | | | | (158) | | | | | | (68) | | | | | | (181) | | | | |
Transaction costs, pre-tax(3) | | | 1,607 | | | | | | — | | | | | | 1,607 | | | | | | — | | | | |
Non-GAAP amounts | | $ | (5,911) | | | | | $ | (2,840) | | | | | $ | (18,998) | | | | | $ | (10,611) | | | | |
| 1) | Represents costs associated with the freight handling pilot test program at ABF Freight. |
| 2) | Gain relates to the sale of the labor services portion of the ArcBest segment’s moving business in second quarter 2021. |
| 3) | Transaction costs are associated with the previously announced acquisition of MoLo Solutions, LLC. |
10
ARCBEST CORPORATION
RECONCILIATIONS OF GAAP TO NON-GAAP FINANCIAL MEASURES – Continued
Effective Tax Rate Reconciliation | | | | | | | | | | | | | | | ||||
ArcBest Corporation - Consolidated | | | | | | | | | | | | | | | | | | |
| | | | | | | | | | | | | | | | | | |
(Unaudited) | | | | | | | | | | | | | | | | | | |
($ thousands, except percentages) | | Three Months Ended September 30, 2021 | ||||||||||||||||
| | | | | Other | | Income | | Income | | | | | | | |||
| | Operating | | Income | | Before Income | | Tax | | Net | | | ||||||
| | Income | | (Costs) | | Taxes | | Provision | | Income | | Tax Rate(6) | ||||||
Amounts on GAAP basis | | $ | 87,561 | | $ | (1,411) | | $ | 86,150 | | $ | 22,459 | | $ | 63,691 | | 26.1 | % |
Innovative technology costs(1) | | | 6,893 | | | 158 | | | 7,051 | | | 1,815 | | | 5,236 | | 25.7 | |
Transaction costs(2) | | | 1,607 | | | — | | | 1,607 | | | 420 | | | 1,187 | | 26.1 | |
Life insurance proceeds and changes in cash surrender value | | | — | | | (394) | | | (394) | | | — | | | (394) | | — | |
Tax benefit from vested RSUs(3) | | | — | | | — | | | — | | | 480 | | | (480) | | — | |
Non-GAAP amounts | | $ | 96,061 | | $ | (1,647) | | $ | 94,414 | | $ | 25,174 | | $ | 69,240 | | 26.7 | % |
| | Nine Months Ended September 30, 2021 | ||||||||||||||||
| | | | Other | | Income Before | | Income | | | | | | | ||||
| | Operating | | Income | | Income | | Tax | | Net | | | ||||||
| | Income | | (Costs) | | Taxes | | Provision | | Income | | Tax Rate(6) | ||||||
Amounts on GAAP basis | | $ | 194,051 | | $ | (3,096) | | $ | 190,955 | | $ | 42,922 | | $ | 148,033 | | 22.5 | % |
Innovative technology costs(1) | | | 21,235 | | | 498 | | | 21,733 | | | 5,594 | | | 16,139 | | 25.7 | |
Gain on sale of subsidiary(4) | | | (6,923) | | | — | | | (6,923) | | | (1,486) | | | (5,437) | | (21.5) | |
Transaction costs(2) | | | 1,607 | | | — | | | 1,607 | | | 420 | | | 1,187 | | 26.1 | |
Life insurance proceeds and changes in cash surrender value | | | — | | | (2,908) | | | (2,908) | | | — | | | (2,908) | | — | |
Tax benefit from vested RSUs(3) | | | — | | | — | | | — | | | 7,411 | | | (7,411) | | — | |
Non-GAAP amounts | | $ | 209,970 | | $ | (5,506) | | $ | 204,464 | | $ | 54,861 | | $ | 149,603 | | 26.8 | % |
| | Three Months Ended September 30, 2020 | ||||||||||||||||
| | | | Other | | Income | | | | | | | | |||||
| | Operating | | Income | | Before Income | | Income | | Net | | | ||||||
| | Income | | (Costs) | | Taxes | | Tax Provision | | Income | | Tax Rate(6) | ||||||
Amounts on GAAP basis | | $ | 39,782 | | $ | (604) | | $ | 39,178 | | $ | 9,774 | | $ | 29,404 | | 24.9 | % |
Innovative technology costs(1) | | | 6,041 | | | 191 | | | 6,232 | | | 1,605 | | | 4,627 | | 25.8 | |
Life insurance proceeds and changes in cash surrender value | | | — | | | (1,503) | | | (1,503) | | | — | | | (1,503) | | — | |
Tax benefit from vested RSUs(3) | | | — | | | — | | | — | | | 138 | | | (138) | | — | |
Non-GAAP amounts | | $ | 45,823 | | $ | (1,916) | | $ | 43,907 | | $ | 11,517 | | $ | 32,390 | | 26.2 | % |
| | Nine Months Ended September 30, 2020 | ||||||||||||||||
| | | | Other | | Income Before | | Income | | | | | | | ||||
| | Operating | | Income | | Income | | Tax | | Net | | | ||||||
| | Income | | (Costs) | | Taxes | | Provision | | Income | | Tax Rate(6) | ||||||
Amounts on GAAP basis | | $ | 68,026 | | $ | (5,729) | | $ | 62,297 | | $ | 15,111 | | $ | 47,186 | | 24.3 | % |
Innovative technology costs(1) | | | 15,340 | | | 597 | | | 15,937 | | | 4,103 | | | 11,834 | | 25.7 | |
Nonunion pension expense, including settlement (5) | | | — | | | 89 | | | 89 | | | 23 | | | 66 | | 25.8 | |
Life insurance proceeds and changes in cash surrender value | | | — | | | (258) | | | (258) | | | — | | | (258) | | — | |
Tax expense from vested RSUs(3) | | | — | | | — | | | — | | | (541) | | | 541 | | — | |
Non-GAAP amounts | | $ | 83,366 | | $ | (5,301) | | $ | 78,065 | | $ | 18,696 | | $ | 59,369 | | 23.9 | % |
| 1) | Represents costs associated with the freight handling pilot test program at ABF Freight. |
| 2) | Transaction costs are associated with the previously announced acquisition of MoLo Solutions, LLC. |
| 3) | The Company recognizes the tax impact for the vesting of share-based compensation resulting in excess tax expense (benefit). |
| 4) | Gain relates to the sale of the labor services portion of the ArcBest segment’s moving business in second quarter 2021. |
| 5) | Represents pension settlement expense related to the Company’s supplemental benefit plan. |
| 6) | Tax rate for total “Amounts on GAAP basis” represents the effective tax rate. The tax effects of non-GAAP adjustments are calculated based on the statutory rate applicable to each item based on tax jurisdiction, unless the nature of the item requires the tax effect to be estimated by applying a specific tax treatment. |
11
ARCBEST CORPORATION
RECONCILIATIONS OF GAAP TO NON-GAAP FINANCIAL MEASURES – Continued
Adjusted Earnings Before Interest, Taxes, Depreciation, and Amortization (Adjusted EBITDA)
Management uses Adjusted EBITDA as a key measure of performance and for business planning. The measure is particularly meaningful for analysis of operating performance because it excludes amortization of acquired intangibles and software of the Asset-Light businesses, which are significant expenses resulting from strategic decisions rather than core daily operations. Additionally, Adjusted EBITDA is a primary component of the financial covenants contained in our credit agreement. The calculation of Asset-Light Adjusted EBITDA as presented below begins with operating income (loss), as other income (costs), income taxes, and net income are reported at the consolidated level and not included in the operating segment financial information evaluated by management to make operating decisions.
| | Three Months Ended | | Nine Months Ended | |||||||||
| | September 30 | | | September 30 | | |||||||
|
| 2021 |
| 2020 |
| 2021 |
| 2020 |
| ||||
| | (Unaudited) |
| ||||||||||
ArcBest Corporation - Consolidated Adjusted EBITDA | | ($ thousands) |
| ||||||||||
| | | |||||||||||
Net Income | | $ | 63,691 | | $ | 29,404 | | $ | 148,033 | | $ | 47,186 | |
Interest and other related financing costs | |
| 2,072 | |
| 2,860 | |
| 6,774 | |
| 9,185 | |
Income tax provision | |
| 22,459 | |
| 9,774 | |
| 42,922 | |
| 15,111 | |
Depreciation and amortization | |
| 30,359 | |
| 30,032 | |
| 90,995 | |
| 88,131 | |
Amortization of share-based compensation | |
| 2,889 | |
| 2,885 | |
| 8,567 | |
| 7,956 | |
Amortization of net actuarial gains of benefit plans and pension settlement expense(1) | |
| (135) | |
| (148) | |
| (404) | |
| (352) | |
Transaction costs(2) | | | 1,607 | | | — | | | 1,607 | | | — | |
Consolidated Adjusted EBITDA | | $ | 122,942 | | $ | 74,807 | | $ | 298,494 | | $ | 167,217 | |
| 1) | The nine months ended September 30, 2020 includes pre-tax pension settlement expense of $0.1 million related to the Company’s supplemental benefit plan. |
| 2) | Transaction costs are associated with the previously announced acquisition of MoLo Solutions, LLC. |
| | Three Months Ended | | Nine Months Ended | | ||||||||
| | September 30 | | September 30 | | ||||||||
|
| 2021 | | 2020 | | 2021 | | 2020 | | ||||
Asset-Light Adjusted EBITDA | | (Unaudited) | | ||||||||||
| | ($ thousands) | | ||||||||||
| | | | | |||||||||
ArcBest | | | | | | | | | | | | | |
Operating Income | | $ | 10,182 | | $ | 4,831 | | $ | 33,574 | | $ | 4,725 | |
Depreciation and amortization(3) | | | 2,352 | | | 2,413 | | | 7,104 | | | 7,332 | |
Adjusted EBITDA | | $ | 12,534 | | $ | 7,244 | | $ | 40,678 | | $ | 12,057 | |
| | | | | |||||||||
FleetNet | | | | | |||||||||
Operating Income | | $ | 1,269 | | $ | 987 | | $ | 3,430 | | $ | 2,809 | |
Depreciation and amortization(3) | | | 413 | | | 411 | | | 1,241 | | | 1,204 | |
Adjusted EBITDA | | $ | 1,682 | | $ | 1,398 | | $ | 4,671 | | $ | 4,013 | |
| | | | | |||||||||
Total Asset-Light | | | | | | | | | | | | | |
Operating Income | | $ | 11,451 | | $ | 5,818 | | $ | 37,004 | | $ | 7,534 | |
Depreciation and amortization(3) | | | 2,765 | | | 2,824 | | | 8,345 | | | 8,536 | |
Adjusted EBITDA | | $ | 14,216 | | $ | 8,642 | | $ | 45,349 | | $ | 16,070 | |
| 3) | Depreciation and amortization includes amortization of intangibles associated with acquired businesses. |
12
ARCBEST CORPORATION
OPERATING STATISTICS
| | Three Months Ended | | Nine Months Ended | | ||||||||||||
| | September 30 | | September 30 | | ||||||||||||
|
| 2021 |
| 2020 |
| % Change |
| 2021 |
| 2020 |
| % Change | | ||||
| | (Unaudited) | | | | | | | | | | ||||||
Asset-Based | | | | | | | | | | | | | | | | | |
| | | | | | | | | | | | | | | | | |
Workdays |
| | 64.0 |
| | 64.0 | | |
| | 190.5 |
| | 191.5 | | | |
| | | | | | | | | | | | | | | | | |
Billed Revenue(1) / CWT | | $ | 41.79 | | $ | 35.69 |
| 17.1% | | $ | 38.95 | | $ | 34.21 |
| 13.9% | |
| | | | | | | | | | | | | | | | | |
Billed Revenue(1) / Shipment | | $ | 542.38 | | $ | 454.94 |
| 19.2% | | $ | 511.43 | | $ | 435.96 |
| 17.3% | |
| | | | | | | | | | | | | | | | | |
Shipments | |
| 1,249,645 | |
| 1,242,943 |
| 0.5% | |
| 3,716,852 | |
| 3,549,465 |
| 4.7% | |
| | | | | | | | | | | | | | | | | |
Shipments / Day | |
| 19,526 | |
| 19,421 |
| 0.5% | |
| 19,511 | |
| 18,535 |
| 5.3% | |
| | | | | | | | | | | | | | | | | |
Tonnage (Tons) | |
| 810,982 | |
| 792,258 |
| 2.4% | |
| 2,440,214 | |
| 2,261,919 |
| 7.9% | |
| | | | | | | | | | | | | | | | | |
Tons / Day | |
| 12,672 | |
| 12,379 |
| 2.4% | |
| 12,810 | |
| 11,812 |
| 8.4% | |
| | | | | | | | | | | | | | | | | |
Pounds / Shipment | |
| 1,298 | |
| 1,275 | | 1.8% | | | 1,313 | |
| 1,275 | | 3.0% | |
| | | | | | | | | | | | | | | | | |
Average Length of Haul (Miles) | |
| 1,098 | |
| 1,096 |
| 0.2% | |
| 1,099 | |
| 1,074 |
| 2.3% | |
| | | | | | | | | | | | | | | | | |
| 1) | Revenue for undelivered freight is deferred for financial statement purposes in accordance with the Asset-Based segment revenue recognition policy. Billed revenue used for calculating revenue per hundredweight measurements has not been adjusted for the portion of revenue deferred for financial statement purposes. |
| | Year Over Year % Change | ||||
| | Three Months Ended | Nine Months Ended | |||
|
| September 30, 2021 | September 30, 2021 | |||
| | (Unaudited) | ||||
ArcBest(2) | | | | | | |
| | | | | | |
Revenue / Shipment | | | 27.0% | | | 28.0% |
| | | | | | |
Shipments / Day | | | 9.7% | | | 22.4% |
| 2) | Statistical data related to managed transportation solutions transactions are not included in the presentation of operating statistics for the ArcBest segment. |
###
13