UNITED STATES
SECURITIES AND EXCHANGE COMMISSION
Washington, D.C. 20549
FORM N-CSR
CERTIFIED SHAREHOLDER REPORT OF REGISTERED
MANAGEMENT INVESTMENT COMPANIES
Investment Company Act file number 811-07292
North American Government Bond Fund, Inc.
(Exact name of registrant as specified in charter)
|
40 West 57th Street, 18th Floor New York, New York
|
10019 |
|
(Address of principal executive offices)
|
(Zip code) |
R. Alan Medaugh, President
ISI, Inc. 40 West 57th Street, 18th Floor New York, New York 10019
(Name and address of agent for service)
Registrant's telephone number, including area code: (212) 446-5600
Date of fiscal year end: October 31, 2011
Date of reporting period: October 31, 2011
|
Item 1.
|
Reports to Stockholders.
|
 |
||||||
|
ANNUAL REPORT
October 31, 2011
 |
||||||
|
TOTAL RETURN
U.S. TREASURY
FUND, INC.
MANAGED MUNICIPAL
FUND, INC.
NORTH AMERICAN
GOVERNMENT BOND
FUND, INC.
ISI STRATEGY
FUND, INC.
|
||||||
|
ISI Funds Annual Report – Table of Contents
|
|
Investment Advisor’s Message
|
1
|
|
Management Discussion & Analysis
|
3
|
|
Performance Comparisons
|
11
|
|
Shareholder Expense Examples
|
19
|
|
Portfolio Profiles
|
22
|
|
Schedule of Investments
|
23
|
|
Statements of Assets and Liabilities
|
36
|
|
Statements of Operations
|
40
|
|
Statements of Changes in Net Assets
|
42
|
|
Financial Highlights
|
48
|
|
Notes to Financial Statements
|
55
|
|
Report of Independent Registered Public Accounting Firm
|
65
|
|
Fund Directors and Officers
|
66
|
|
Notice to Shareholders
|
69
|
|
Investment Advisory Agreement Approval
|
71
|
|
Investment Advisor’s Message
|
10/31/2011
|
Dear Shareholder:
I am pleased to present the Annual Report to Shareholders for the ISI Funds. This report covers the 12-month reporting period through October 31, 2011 and includes commentary from the Funds’ portfolio managers at International Strategy & Investment, Inc. (“ISI”) (see Management Discussion and Analysis that follows this letter for more details), a complete list of holdings and the financial statements.
Stocks recorded a positive return for the last year and a small positive return for the last five years. For example, the Wilshire 5000 Index was +7.58% for the last year and averaged +0.94% for the past five years. U.S. Treasuries increased over the last year and the last 5 years. The Barclays Capital Treasury Index was +5.27% for the past year and averaged +6.49% for the past five years. Top quality municipal indices were also up for the last year and for the last five years. For example, the Barclays Capital Municipal GO Index was +4.08% for the past year and averaged +5.26% for the past five years. The following is a summary of fund performance during the reporting period. These performance figures assume the reinvestment of dividend and capital gain distributions, and exclude the impact of any sales charges.
During the year ended October 31, 2011, Total Return U.S. Treasury Fund and North American Government Bond Fund continued their policy of paying dividends at a fixed rate, which resulted in dividends consisting of net investment income, short-term capital gains, and long-term capital gains.
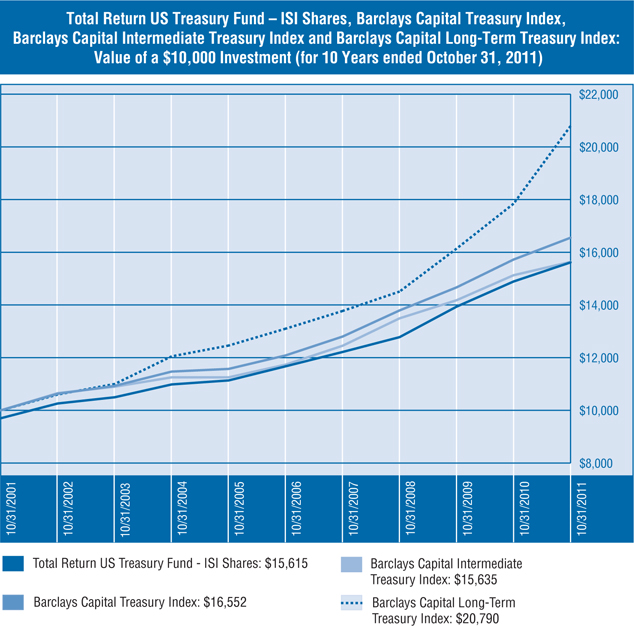
Total Return U.S. Treasury Fund’s investment objective is to achieve a high level of total return with relative stability of principal, and secondarily, high current income consistent with an investment in securities issued by the United States Treasury. For the reporting period, the Fund produced a one-year total return of +4.87% and a five-year average annual total return of +6.00%. From its inception on August 10, 1988 through October 31, 2011, the Fund has posted a cumulative total return of +368.87%, which translates into an average annual total return of +6.88%. The Fund’s net assets totaled $85.49 million at the end of the reporting period.
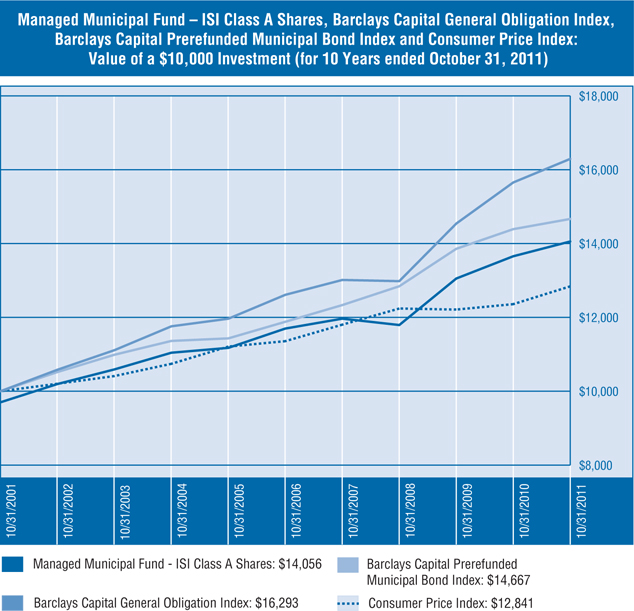
ISI Managed Municipal Fund’s investment objective is to provide a high level of total return with relative stability of principal and, secondarily, high current income exempt from federal income tax through investment in a portfolio consisting primarily of tax-free municipal obligations. For the reporting period, the ISI Class A Shares produced a one-year total return of +2.93% and a five-year average annual total return of +3.74%. From its inception on February 26, 1990 through October 31, 2011, the ISI Class A Shares has posted a cumulative total return of +202.74%, which translates into an average annual total return of +5.24%. From its inception on October 7, 2010 through October 31, 2011, the ISI Class I Shares have posted a cumulative total return of +2.40%, which translates to an average annual total return of +2.24%. The Fund’s net assets totaled $107.95 million at the end of the reporting period.
| 1 |
|
Investment Advisor’s Message (continued)
|
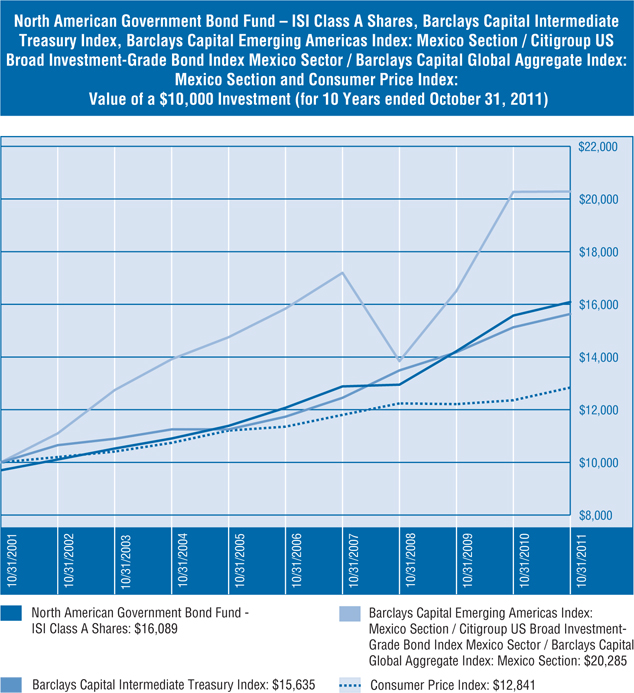
ISI North American Government Bond Fund’s investment objective is to provide a high level of current income, consistent with prudent investment risk, by investing primarily in a portfolio consisting of fixed income securities issued or guaranteed by the governments of the United States, Canada and Mexico. For the reporting period, the ISI Class A Shares produced a one-year total return of +3.30% and a five year average annual total return of +5.91%. From its inception on January 15, 1993 through October 31, 2011, the ISI Class A Shares have posted a cumulative total return of +196.26%, which translates into an average annual total return of +5.95%. For the reporting period, the ISI Class C Shares produced a one-year total return of +2.84% and a five year average annual total return of +5.26%. From its inception on May 16, 2003 through October 31, 2011, the ISI Class C Shares have posted a cumulative total return of +41.48%, which translates into an average annual total return of +4.18%. From its inception on September 16, 2010 through October 31, 2011, the ISI Class I Shares have posted a cumulative total return of +5.69%, which translates to an average annual total return of +5.04%. The Fund’s net assets totaled $147.71 million at the end of the reporting period.
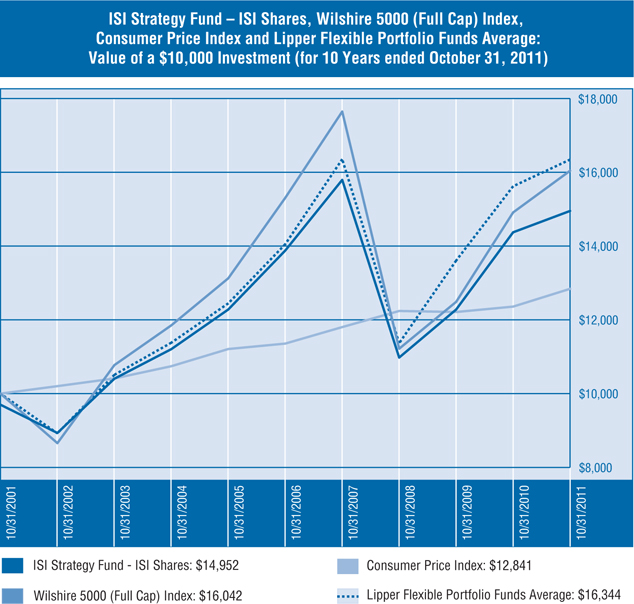
ISI Strategy Fund has an investment objective of maximizing total return through a combination of long-term growth of capital and current income by actively allocating the Fund’s assets between common stocks of U.S. issuers and U.S. Treasury securities. For the reporting period, the Fund produced a one-year total return of +4.03% and a five-year average annual total return of +1.50%. From its inception on September 16, 1997 through October 31, 2011, the Fund has posted a cumulative total return of +81.43%, which translates into an average annual total return of +4.31%. The Fund’s net assets totaled $57.26 million at the end of the reporting period.
We would like to welcome new investors to the ISI Funds and thank those who have been with us for some time. We appreciate your confidence.
Sincerely,

R. Alan Medaugh
President
November 14, 2011
The performance numbers stated above do not include a deduction for the maximum sales charge (3.00%) or maximum deferred sales charge, as applicable to each Fund. If the maximum sales charge or maximum deferred sales charge (as applicable) was deducted for each Fund the stated performance numbers would be lower. Performance data quoted represents past performance and is no guarantee of future results. Current performance may be lower or higher than the performance data quoted. Investment return and principal value will fluctuate so that an investor’s shares, when redeemed, may be worth more or less than original cost. For the most recent month-end performance of a Fund, please call (800) 882-8585. The total annualized operating expense ratios of the Funds as of October 31, 2011 were as follows: Total Return US Treasury Fund, Inc. – 0.84%; Managed Municipal Fund, Inc.-Class A – 1.01%; Managed Municipal Fund, Inc.-Class I – 0.76%; North American Government Bond Fund, Inc.-Class A – 1.18%; North American Government Bond Fund, Inc.-Class C – 1.78% ; North American Government Bond Fund, Inc.-Class I – 0.78% and ISI Strategy Fund, Inc. – 1.04%. The operating expense ratios may vary over time.
| 2 |
|
Management Discussion & Analysis (Unaudited)
|
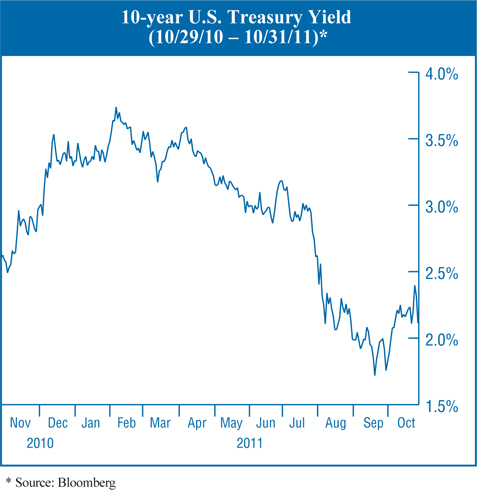
The Total Return U.S. Treasury Fund
This fiscal year, the Treasury market rallied from February through the end of the year. The drop in yield was caused by (1) The stalling of the U.S. economic recovery; (2) The building financial crisis in Europe; and (3) The move by the Federal Reserve to do “Operation Twist”, i.e. selling some of their short maturity (1 – 5 year) issues, replacing them with longer issues, predominantly in the 5 – 10 year maturity range. The Fund’s active maturity management anticipated the Federal Reserve’s move by increasing the Fund’s holdings of 5 – 10 year issues. At the end of the fiscal year, the Fund had 70.4% of its maturities in the 5 – 10 year range. By comparison, the Treasury market as a whole, according to Barclays Capital Treasury Index, the 5 – 10 year maturity range represented only 25.8% of the Treasury market.
| 3 |
|
Management Discussion & Analysis (Unaudited)
(continued)
|
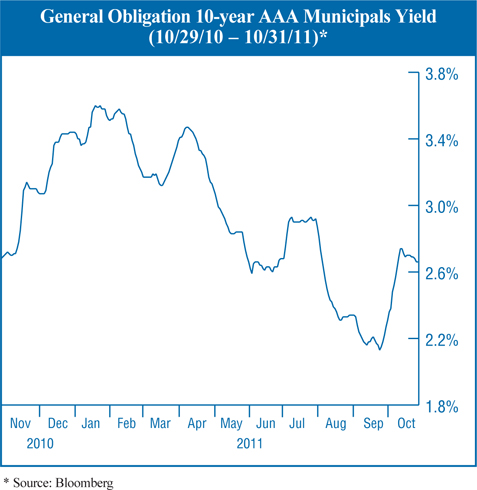
The Managed Municipal Fund
Municipal yields, although volatile during the year, were basically unchanged from the beginning of the fiscal year to the end of the fiscal year. Please see 10-year AAA yield chart for fiscal year 2011 below.
| 4 |
|
Management Discussion & Analysis (Unaudited)
(continued)
|
The Fund purchased issues primarily in the 10+ year range during the fiscal year. The reason was the attractive yield on tax free, high quality municipals when compared to U.S. Treasuries. Treasury yields moved down significantly because of the European financial crisis and Federal Reserve action. The result is that municipal yields as a percentage of Treasury yields moved up from generally attractive levels to very attractive levels during the Fiscal year. Please see table below.
Comparison of AAA Municipal Yields
as a Percentage of U.S. Treasury Yields
(10/29/10 and 10/31/11)
|
% of Treasury Yield
|
||||||
|
Maturity
|
10/29/10
|
10/31/11
|
Change
|
|||
|
5 Year
|
111.24
|
136.86
|
+25.62
|
|||
|
10 year
|
101.15
|
121.86
|
+20.71
|
|||
|
15 year
|
109.14
|
130.41
|
+21.27
|
|||
|
20 year
|
107.58
|
133.77
|
+26.19
|
|||
| 5 |
|
Management Discussion & Analysis (Unaudited)
(continued)
|
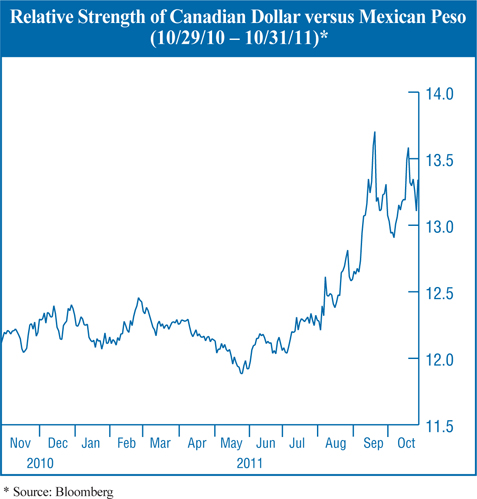
The North American Government Bond Fund
The Fund’s positive performance in the fiscal year was due to it’s roughly 70% investment in U.S. Treasuries, which rallied strongly. Please see the U.S. Treasury Fund write-up for details.
The 30% in Canada and Mexico remained steady during the year (30.1% at the beginning of the fiscal year and 30.1% at fiscal year end). The mix between Canada and Mexico shifted during the year. Canada began the fiscal year representing 21.7% of the Fund and was reduced to 18.4% by the end of the fiscal year. Mexico moved up a bit during the fiscal year from 8.4% to 11.7% at fiscal year end. Mexico’s currency was under more pressure than Canada during the year due to the higher reliance by Mexico on goods production than products from natural resources which are the hallmark of Canadian exports. As a result, the Canadian dollar outperformed the Mexico peso during the fiscal year. Please see relative strength of the Canadian dollar in the chart below.
| 6 |
|
Management Discussion & Analysis (Unaudited)
(continued)
|
ISI believes that the U.S. reliance on Mexico’s manufacturing products will continue and represents a solid base for Mexico in 2012. The yields in Mexico are significantly higher than those in Canada, adding another aspect to their investment attraction. Please see table below showing the Mexican versus Canadian yield advantage for various maturities.
Mexican Government Bond Yield Advantage over Canadian Government Bonds
for various short maturities as of Fiscal Year End 10/31/11
|
Maturity
|
Mexican
Yield
|
Canadian
Yield
|
Mexico’s Yield Advantage
|
|||
|
2 Year
|
4.51
|
0.99
|
+352 bps
|
|||
|
3 Year
|
4.63
|
1.14
|
+349 bps
|
|||
|
5 Year
|
5.01
|
1.50
|
+351 bps
|
|||
|
7 Year
|
5.62
|
1.79
|
+383 bps
|
|||
|
10 Year
|
6.18
|
2.28
|
+390 bps
|
| 7 |
|
Management Discussion & Analysis (Unaudited)
(continued)
|
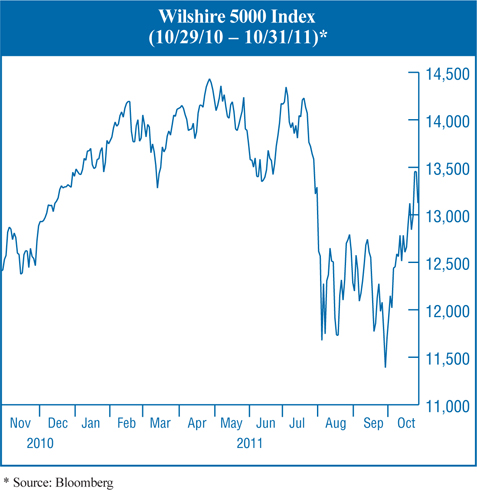
The Strategy Fund
Both stocks and bonds rallied this fiscal year, with the result the Fund was positive for the Fiscal year. Stocks somewhat outpaced bonds (Wilshire 5000 +7.58% while the Barclays Treasury Index +5.27%). The stock market was principally driven by rising corporate earnings reports. Treasury bonds were helped by a slowing recovery, a financial crisis in Europe, and prospects for Federal Reserve’s next steps in quantitative easing. The charts on the Treasury 10-year bond yield and the stock market are below.

| 8 |
|
Management Discussion & Analysis (Unaudited)
(continued)
|
The Fund’s performance was helped by having a majority weighting in stocks this fiscal year. At the beginning of the year the mix favored stocks 81% to 19%. Stocks remained in the majority over the fiscal year ending at 94% to 6%.
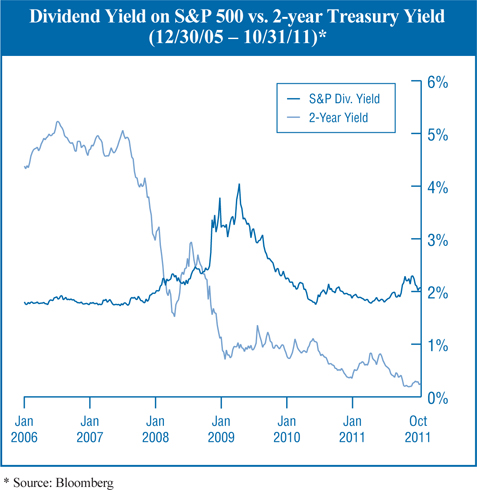
A more recent help for stocks is their dividend yield versus short maturity Treasuries. Please see chart below as reference. With corporate earnings rising, the dividend payout rate could rise further adding to the yield support for equities.
| 9 |
|
Management Discussion & Analysis (Unaudited)
(continued)
|
| 10 |
|
Total Return US Treasury Fund –
Performance Comparison1 (Unaudited)
|
| 11 |
|
Total Return US Treasury Fund –
Performance Comparison1 (Unaudited) (continued)
|
|
Cumulative Total Returns (With Sales Charge)
|
Average Annual Total Returns (With Sales Charge)
|
|||||||||
|
Periods Ended
October 31, 2011
|
1 Year
|
3 Years
|
5 Years
|
10 Years
|
Since Inception2
|
1 Year
|
3 Years
|
5 Years
|
10 Years
|
Since Inception2
|
|
Total Return US
Treasury Fund |
1.75%
|
18.49%
|
29.81%
|
56.12%
|
354.77%
|
1.75%
|
5.82%
|
5.36%
|
4.55%
|
6.74%
|
|
Barclays Capital
Treasury Index3 |
5.27%
|
20.00%
|
36.96%
|
65.52%
|
402.14%
|
5.27%
|
6.27%
|
6.49%
|
5.17%
|
7.21%
|
|
Barclays Capital Intermediate
Treasury Index3 |
3.35%
|
15.88%
|
33.24%
|
56.35%
|
333.77%
|
3.35%
|
5.03%
|
5.91%
|
4.57%
|
6.53%
|
|
Barclays Capital
Long-Term Treasury Index3 |
16.52%
|
43.29%
|
58.70%
|
107.90%
|
698.21%
|
16.52%
|
12.74%
|
9.68%
|
7.59%
|
9.37%
|
|
1
|
Past performance is not indicative of future results. Investment return and principal value will fluctuate so that an investor’s shares, when redeemed, may be worth more or less than their original cost. The performance information presented in the graph and table above does not reflect the deduction of taxes that a shareholder would pay on Fund distributions or the redemption of Fund shares. All performance assumes the reinvestment of dividends and capital gain distributions and includes the Fund’s maximum 3.00% sales charge. Distributions of the Fund’s capital gains and non-US Treasury income may be subject to state and local taxes. Management is not aware of any single index that is truly representative of the Fund since its active maturity management policy allows the manager to adjust the weighted average maturity throughout each US Treasury sector. Currently, the Fund’s weighted average maturity is approximately 5.95 years.
|
|
2
|
The Fund’s inception date is August 10, 1988. Benchmark returns are for the periods beginning August 31, 1988.
|
|
3
|
The Barclays Capital Treasury Index is an unmanaged index reflecting the performance of all public Treasury obligations and does not focus on one particular segment of the Treasury market. The Barclays Capital Intermediate Treasury Index is an unmanaged index reflecting the performance of US Treasury securities in the intermediate-term Treasury sector. The Barclays Capital Long-Term Treasury Index is an unmanaged index reflecting the performance of US Treasury securities in the long-term Treasury sector. Benchmark returns do not reflect expenses or sales charges that have been deducted from the Fund’s returns.
|
|
Expense Ratio Information as of:
|
October 31, 2011
|
|
Gross Expense Ratio
|
0.84%
|
| 12 |
|
Managed Municipal Fund –
Performance Comparison1 (Unaudited)
|
| 13 |
|
Managed Municipal Fund –
Performance Comparison1 (Unaudited) (continued)
|
|
Cumulative Total Returns (With Sales Charge)
|
Average Annual Total Returns (With Sales Charge)
|
|||||||||
|
Periods Ended
October 31, 2011
|
1 Year
|
3 Years
|
5 Years
|
10 Years
|
Since Inception
|
1 Year
|
3 Years
|
5 Years
|
10 Years
|
Since Inception
|
|
Managed Municipal
Fund - ISI Class A Shares2 |
-0.11%
|
15.58%
|
16.60%
|
40.56%
|
193.63%
|
-0.11%
|
4.95%
|
3.12%
|
3.46%
|
5.09%
|
|
Managed Municipal
Fund - ISI Class I Shares3 |
3.28%
|
—
|
—
|
—
|
2.40%
|
3.28%
|
—
|
—
|
—
|
2.24%
|
|
Barclays Capital General Obligation Index4
|
4.08%
|
25.51%
|
29.19%
|
62.93%
|
269.04%
|
4.08%
|
7.87%
|
5.26%
|
5.00%
|
6.21%
|
|
Barclays Capital
Prerefunded Municipal Bond Index4 |
1.92%
|
14.19%
|
23.44%
|
46.67%
|
203.66%
|
1.92%
|
4.52%
|
4.30%
|
3.90%
|
5.26%
|
|
Consumer Price Index5
|
3.90%
|
4.90%
|
13.07%
|
28.41%
|
47.22%
|
3.90%
|
1.61%
|
2.49%
|
2.53%
|
1.80%
|
|
1
|
Past performance is not indicative of future results. Investment return and principal value will fluctuate so that an investor’s shares, when redeemed, may be worth more or less than their original cost. The performance information presented in the graph and table above does not reflect the deduction of taxes that a shareholder would pay on Fund distributions or the redemption of Fund shares. All performance assumes the reinvestment of dividends and capital gain distributions and includes the sales charge, if applicable. ISI Class A Shares have a maximum 3.00% sales charges. Distributions of the Fund’s income and capital gains may be subject to state and local taxes.
|
|
2
|
The ISI Class A Shares inception date is February 26, 1990. Benchmark returns are for the periods beginning February 28, 1990.
|
|
3
|
The ISI Class I Shares inception date is October 7, 2010. Benchmark returns are for the period beginning October 31, 2010.
|
|
4
|
The Barclays Capital General Obligation Index is an unmanaged index reflecting general municipal bond market performance. The Barclays Capital Prerefunded Municipal Bond Index, an unmanaged index, is a subcomponent of the general Barclays Capital Municipal Bond Index, and contains only bonds from that index that have been prerefunded or escrowed to maturity. Benchmark returns do not reflect expenses or sales charges that have been deducted from the Fund’s returns.
|
|
5
|
The Consumer Price Index is a widely used measure of inflation.
|
|
Expense Ratio Information as of:
|
October 31, 2011
|
|
Gross Expense Ratio – Class A
|
1.01%
|
|
Gross Expense Ratio – Class I
|
0.76%
|
| 14 |
|
North American Government Bond Fund –
Performance Comparison1 (Unaudited)
|
| 15 |
|
North American Government Bond Fund –
Performance Comparison1 (Unaudited) (continued)
|
|
Cumulative Total Returns (With Sales Charge)
|
Average Annual Total Returns (With Sales Charge)
|
|||||||||
|
Periods Ended
October 31, 2011
|
1 Year
|
3 Years
|
5 Years
|
10 Years
|
Since Inception
|
1 Year
|
3 Years
|
5 Years
|
10 Years
|
Since Inception
|
|
North American Government Bond Fund - ISI Class A Shares2
|
0.25%
|
20.56%
|
29.24%
|
60.88%
|
187.35%
|
0.25%
|
6.43%
|
5.26%
|
4.87%
|
5.78%
|
|
North American Government Bond Fund - ISI Class C Shares3
|
1.84%
|
21.98%
|
29.19%
|
—
|
41.48%
|
1.84%
|
6.85%
|
5.26%
|
—
|
4.18%
|
|
North American Government Bond Fund - ISI Class I Shares4
|
3.88%
|
—
|
—
|
—
|
5.69%
|
3.88%
|
—
|
—
|
—
|
5.04%
|
|
Barclays Capital Intermediate Treasury Index5
|
3.35%
|
15.88%
|
33.24%
|
56.35%
|
176.55%
|
3.35%
|
5.03%
|
5.91%
|
4.57%
|
5.57%
|
|
Barclays Capital Emerging Americas Index: Mexico Section / Citigroup US
Broad Investment-Grade Bond Index Mexico Sector / Barclays Capital Global Aggregate Index: Mexico Section6 |
0.07%
|
46.54%
|
28.07%
|
102.85%
|
501.67%
|
0.07%
|
13.58%
|
5.07%
|
7.33%
|
10.04%
|
|
Consumer Price Index7
|
3.90%
|
4.90%
|
13.07%
|
28.41%
|
65.37%
|
3.90%
|
1.61%
|
2.49%
|
2.53%
|
2.72%
|
|
1
|
Past performance is not indicative of future results. Investment return and principal value will fluctuate so that an investor’s shares, when redeemed, may be worth more or less than their original cost. The performance information presented in the graph and table above does not reflect the deduction of taxes that a shareholder would pay on Fund distributions or the redemption of Fund shares. All performance assumes the reinvestment of dividends and capital gain distributions and includes sales charges, if applicable. ISI Class A shares have a maximum 3.00% sales charge. ISI Class C Shares have a maximum 1.00% contingent deferred sales charge in the first year, which is eliminated thereafter.
|
|
2
|
ISI Class A Shares inception date is January 15, 1993. Benchmark returns are for the periods beginning January 31, 1993.
|
|
3
|
ISI Class C Shares inception date is May 16, 2003. Cumulative and annualized returns for the Barclays Capital Intermediate Treasury Index from May 31, 2003 through October 31, 2011 were 41.81% and 4.24%, respectively.
|
|
4
|
ISI Class I Shares inception date is September 16, 2010. Benchmark returns are for the periods beginning September 30, 2010.
|
|
5
|
The Barclays Capital Intermediate Treasury Index is an unmanaged index reflecting the performance of US Treasury securities in the intermediate-term Treasury sector. Benchmark returns do not reflect expenses or sales charges that have been deducted from the Fund’s returns.
|
|
6
|
Reflects the performance of the Barclays Capital Emerging Americas Index: Mexico Section through October 31, 2004 and the Citigroup US Broad Investment-Grade Bond Index Mexico Sector from that date through October 31, 2006 and the Barclays Capital Global Aggregate Index: Mexico from October 31, 2006 through October 31, 2011. The Barclays Capital Emerging Americas Index: Mexico Section has been discontinued. Barclays Capital Emerging Americas Index: Mexico Section was an unmanaged sub-index of the Barclays Capital Emerging Americas Index reflecting the performance of selected Mexican debt instruments with maturities of one year or more. The Citigroup US Broad Investment-Grade Bond Index Mexico Sector is an unmanaged sub-index of the Citigroup US Broad Investment-Grade Bond Index reflecting the performance of selected Mexican debt instruments with maturities of one year or more. The Barclays Capital Global Aggregate Index: Mexico Section is an unmanaged sub-index of Barclays Capital Global Aggregate Index which provides broad-based measure of global investment-grade fixed income markets. The Mexico Section reflects the US dollar performance of selected Mexican government peso-denominated debt instruments with maturities of one year or more. Benchmark returns do not reflect expenses or sales charges that have been deducted from the Fund’s returns.
|
|
7
|
The Consumer Price Index is a widely used measure of inflation.
|
|
Expense Ratio Information as of:
|
October 31, 2011
|
|
Gross Expense Ratio – Class A
|
1.18%
|
|
Gross Expense Ratio – Class C
|
1.78%
|
|
Gross Expense Ratio – Class I
|
0.78%
|
| 16 |
|
ISI Strategy Fund –
Performance Comparison1 (Unaudited)
|
| 17 |
|
ISI Strategy Fund –
Performance Comparison1 (Unaudited) (continued)
|
|
Cumulative Total Returns (With Sales Charge)
|
Average Annual Total Returns (With Sales Charge)
|
|||||||||
|
Periods Ended
October 31, 2011
|
1 Year
|
3 Years
|
5 Years
|
10 Years
|
Since Inception2
|
1 Year
|
3 Years
|
5 Years
|
10 Years
|
Since Inception2
|
|
ISI Strategy Fund
|
0.91%
|
32.07%
|
4.48%
|
49.49%
|
75.97%
|
0.91%
|
9.72%
|
0.88%
|
4.10%
|
4.08%
|
|
Wilshire 5000
(Full Cap) Index3 |
7.58%
|
43.00%
|
4.80%
|
60.42%
|
186.56%
|
7.58%
|
12.66%
|
0.94%
|
4.84%
|
7.76%
|
|
Consumer Price Index4
|
3.90%
|
4.90%
|
13.07%
|
28.41%
|
35.67%
|
3.90%
|
1.61%
|
2.49%
|
2.53%
|
2.19%
|
|
Lipper Flexible Portfolio Funds Average5
|
4.63%
|
43.78%
|
16.32%
|
63.43%
|
85.03%
|
4.63%
|
12.87%
|
3.07%
|
5.03%
|
4.47%
|
|
1
|
Past performance is not indicative of future results. Investment return and principal value will fluctuate so that an investor’s shares, when redeemed, may be worth more or less than their original cost. The performance information presented in the graph and table above does not reflect the deduction of taxes that a shareholder would pay on Fund distributions or the redemption of Fund shares. All performance assumes the reinvestment of dividends and capital gain distributions and includes the Fund’s maximum 3.00% sales charge.
|
|
2
|
The Fund’s inception date is September 16, 1997. Benchmark returns are for the periods beginning September 30, 1997.
|
|
3
|
The Wilshire 5000 (Full Cap) Index is an unmanaged index that represents the broadest measure of the US equity market. Benchmark returns do not reflect expenses or sales charges that have been deducted from the Fund’s returns.
|
|
4
|
The Consumer Price Index is a widely used measure of inflation.
|
|
5
|
Lipper figures represent the average total returns by all mutual funds designated by Lipper as falling into the category indicated. The Lipper Flexible Portfolio Funds Average category includes funds that allocate their investments across various asset classes, including domestic common stocks, bonds and money market instruments with a focus on total return.
|
|
Expense Ratio Information as of:
|
October 31, 2011
|
|
Gross Expense Ratio
|
1.04%
|
| 18 |
|
Shareholder Expense Examples (Unaudited)
|
As a shareholder of the Funds, you may incur two types of cost; (1) transaction costs, including sales charges (loads); and (2) ongoing costs, including management fees, Rule 12b-1 distribution/shareholder service fees and other Fund expenses. This example is intended to help you understand your ongoing costs (in dollars) of investing in each Fund and to compare these costs with the ongoing costs of investing in other mutual funds.
A mutual fund’s ongoing costs are expressed as a percentage of its average net assets. This figure is known as the expense ratio. The expenses in the tables below are based on an investment of $1,000 made at the beginning of the period shown (May 1, 2011) and held for the entire period (October 31, 2011).
Actual Expenses – “Actual Return” in the following table provides information about actual account values and actual expenses. You may use the information here, together with the amount you invested, to estimate the expenses that you paid over the period. Simply divide your account value by $1,000 (for example, an $8,600 account value divided by $1,000 = 8.6), then multiply the result by the number in the “Expenses Paid During Period” column to estimate the expenses you paid on your account during this period.
Hypothetical Example for Comparison Purposes – “Hypothetical Returns” in the following table provides information about hypothetical account values and hypothetical expenses based on each Fund’s actual expense ratio and an assumed rate of return of 5% per year before expenses, which is not the actual return of each Fund. The hypothetical account values and expenses may not be used to estimate the actual ending account balance or expenses you paid for the period. You may use this information to compare the ongoing costs of investing in a Fund and other funds. To do so, compare this 5% hypothetical example with the 5% hypothetical examples that appear in the shareholder reports of other funds.
Expenses shown in the tables are meant to highlight your ongoing costs only and do not reflect any transactional costs, such as sales charges (loads). Therefore, “Hypothetical Returns” in the table are useful in comparing ongoing costs only, and will not help you determine the relative total costs of owning different funds. If these transactional costs were included, your costs would have been higher.
| 19 |
|
Shareholder Expense Examples (Unaudited) (continued)
|
|
Total Return US Treasury Fund
|
||||
|
|
Beginning
Account Value
May 1, 2011
|
Ending
Account Value
October 31, 2011
|
Expenses Paid
During Period(1)
|
Annualized
Expense Ratio
|
|
Based on Actual Fund Return
|
$1,000.00
|
$1,075.20
|
$4.08
|
0.78%
|
|
Based on Hypothetical 5% Return
|
$1,000.00
|
$1,021.27
|
$3.97
|
0.78%
|
|
Managed Municipal Fund – Class A
|
||||
|
|
Beginning
Account Value
May 1, 2011
|
Ending
Account Value
October 31, 2011
|
Expenses Paid
During Period(1)
|
Annualized
Expense Ratio
|
|
Based on Actual Fund Return
|
$1,000.00
|
$1,040.20
|
$5.25
|
1.02%
|
|
Based on Hypothetical 5% Return
|
$1,000.00
|
$1,020.06
|
$5.19
|
1.02%
|
|
Managed Municipal Fund – Class I
|
||||
|
|
Beginning
Account Value
May 1, 2011
|
Ending
Account Value
October 31, 2011
|
Expenses Paid
During Period(1)
|
Annualized
Expense Ratio
|
|
Based on Actual Fund Return
|
$1,000.00
|
$1,041.50
|
$3.96
|
0.77%
|
|
Based on Hypothetical 5% Return
|
$1,000.00
|
$1,021.32
|
$3.92
|
0.77%
|
|
North American Government Bond Fund – Class A
|
||||
|
|
Beginning
Account Value
May 1, 2011
|
Ending
Account Value
October 31, 2011
|
Expenses Paid
During Period(1)
|
Annualized
Expense Ratio
|
|
Based on Actual Fund Return
|
$1,000.00
|
$1,034.40
|
$6.00
|
1.17%
|
|
Based on Hypothetical 5% Return
|
$1,000.00
|
$1,019.31
|
$5.96
|
1.17%
|
|
North American Government Bond Fund – Class C
|
||||
|
|
Beginning
Account Value
May 1, 2011
|
Ending
Account Value
October 31, 2011
|
Expenses Paid
During Period(1)
|
Annualized
Expense Ratio
|
|
Based on Actual Fund Return
|
$1,000.00
|
$1,032.20
|
$9.07
|
1.77%
|
|
Based on Hypothetical 5% Return
|
$1,000.00
|
$1,016.28
|
$9.00
|
1.77%
|
|
(1)
|
Expenses are equal to the Fund’s annualized expense ratio for the period, multiplied by the average account value over the period, multiplied by 184/365 (to reflect the one-half year period).
|
| 20 |
|
Shareholder Expense Examples (Unaudited) (continued)
|
|
North American Government Bond Fund – Class I
|
||||
|
|
Beginning
Account Value
May 1, 2011
|
Ending
Account Value
October 31, 2011
|
Expenses Paid
During Period(1)
|
Annualized
Expense Ratio
|
|
Based on Actual Fund Return
|
$1,000.00
|
$1,037.20
|
$3.95
|
0.77%
|
|
Based on Hypothetical 5% Return
|
$1,000.00
|
$1,021.32
|
$3.92
|
0.77%
|
|
ISI Strategy Fund
|
||||
|
|
Beginning
Account Value
May 1, 2011
|
Ending
Account Value
October 31, 2011
|
Expenses Paid
During Period(1)
|
Annualized
Expense Ratio
|
|
Based on Actual Fund Return
|
$1,000.00
|
$ 914.80
|
$5.07
|
1.05%
|
|
Based on Hypothetical 5% Return
|
$1,000.00
|
$1,019.91
|
$5.35
|
1.05%
|
|
(1)
|
Expenses are equal to the Fund’s annualized expense ratio for the period, multiplied by the average account value over the period, multiplied by 184/365 (to reflect the one-half year period).
|
| 21 |
|
Portfolio Profiles (Unaudited)
|
|
Portfolio Profiles (as a % of Net Assets)
|
October 31, 2011
|
|
Total Return US Treasury Fund
|
|
|
US Treasury Obligations
|
88.96%
|
|
Repurchase Agreements
|
9.53%
|
|
Other Assets and Liabilities
|
1.51%
|
|
100.00%
|
|
|
Managed Municipal Fund
|
|
|
Aaa Municipal Obligations*
|
80.81%
|
|
Aa Municipal Obligations*
|
12.30%
|
|
US Treasury Obligations
|
4.64%
|
|
Repurchase Agreements
|
1.36%
|
|
Other Assets and Liabilities
|
0.89%
|
|
100.00%
|
|
|
* Ratings are based on Moody’s Investors Service, Inc.
|
|
|
North American Government Bond Fund
|
|
|
Canadian Securities
|
18.38%
|
|
Mexican Securities
|
11.69%
|
|
US Treasury Obligations
|
65.57%
|
|
Repurchase Agreements
|
3.26%
|
|
Other Assets and Liabilities
|
1.10%
|
|
100.00%
|
|
|
ISI Strategy Fund
|
|
|
Consumer Discretionary
|
13.09%
|
|
Consumer Staples
|
11.47%
|
|
Energy
|
10.23%
|
|
Financials
|
13.19%
|
|
Health Care
|
11.92%
|
|
Industrials
|
9.91%
|
|
Information Technology
|
16.45%
|
|
Materials
|
3.68%
|
|
Telecommunication Services
|
1.60%
|
|
Utilities
|
2.89%
|
|
US Treasury Obligations
|
5.15%
|
|
Repurchase Agreements
|
0.50%
|
|
Other Assets and Liabilities
|
(0.08)%
|
|
100.00%
|
|
| 22 |
|
Total Return US Treasury Fund
|
|
Schedule of Investments
|
October 31, 2011
|
|
Security
|
Interest
Rate
|
Maturity
Date
|
Principal
Amount
|
Market
Value
|
||||||||
|
US TREASURY OBLIGATIONS - 88.96%
|
||||||||||||
|
US Treasury Notes
|
0.625% |
07/31/12
|
$ | 1,500,000 | $ | 1,505,799 | ||||||
|
US Treasury Notes
|
0.375% |
08/31/12
|
10,000,000 | 10,020,710 | ||||||||
|
US Treasury Notes
|
2.250% |
11/30/17
|
16,600,000 | 17,474,089 | ||||||||
|
US Treasury Notes
|
3.750% |
11/15/18
|
1,370,000 | 1,567,580 | ||||||||
|
US Treasury Notes
|
2.625% |
08/15/20
|
7,000,000 | 7,365,862 | ||||||||
|
US Treasury Bonds
|
8.125% |
08/15/19
|
10,000,000 | 14,692,190 | ||||||||
|
US Treasury Bonds
|
8.750% |
08/15/20
|
11,300,000 | 17,545,013 | ||||||||
|
US Treasury Bonds
|
7.875% |
02/15/21
|
1,000,000 | 1,496,719 | ||||||||
|
US Treasury Bonds
|
6.375% |
08/15/27
|
3,000,000 | 4,384,218 | ||||||||
|
Total US Treasury Obligations (Cost $70,993,001)
|
$ | 76,052,180 | ||||||||||
|
Security
|
Principal
Amount
|
Market
Value
|
||||||
|
REPURCHASE AGREEMENTS - 9.53%
|
||||||||
|
JPMorgan Chase, N.A.
|
||||||||
|
Dated 10/31/11, 0.03%, principal and interest in the amount of $8,152,007 to be repurchased 11/01/11, collateralized by US Treasury Inflation-Protected Note, par value of $6,355,000 due 07/15/16 with a value of $8,320,530 (Cost $8,152,000)
|
$ | 8,152,000 | $ | 8,152,000 | ||||
|
Total Investments - 98.49% (Cost $79,145,001)*
|
$ | 84,204,180 | ||||||
|
Other Assets in Excess of Liabilities - 1.51%
|
1,289,598 | |||||||
|
Net Assets - 100.00%
|
$ | 85,493,778 | ||||||
|
*
|
Cost for Federal income tax purposes is $79,145,001 and net unrealized appreciation on a tax basis consists of:
|
|
Gross Unrealized Appreciation
|
$ | 5,060,807 | ||
|
Gross Unrealized Depreciation
|
(1,628 | ) | ||
|
Net Unrealized Appreciation
|
$ | 5,059,179 |
See Notes to Financial Statements.
| 23 |
|
Managed Municipal Fund
|
|
Schedule of Investments
|
October 31, 2011
|
|
Security
|
Interest
Rate
|
Maturity
Date
|
Ratings
(Moody’s/
S&P)1
|
Principal
Amount
|
Market
Value
|
|||||||||
|
MUNICIPAL BONDS - 93.11%
|
||||||||||||||
|
General Obligation - 57.27%
|
||||||||||||||
|
Alexandria, VA, Capital Improvements
|
4.250% |
06/15/21
|
Aaa/AAA
|
$ | 3,300,000 | $ | 3,542,517 | |||||||
|
Arlington County, VA, Public Improvements
|
4.500% |
01/15/28
|
Aaa/AAA
|
1,600,000 | 1,620,640 | |||||||||
|
Austin, TX, Public Improvements, Series A
|
3.500% |
09/01/30
|
Aaa/AAA
|
2,500,000 | 2,319,625 | |||||||||
|
Baltimore County, MD
|
4.000% |
08/01/22
|
Aaa/AAA
|
1,665,000 | 1,862,636 | |||||||||
|
Delaware State, Series B
|
3.000% |
07/01/19
|
Aaa/AAA
|
1,400,000 | 1,507,814 | |||||||||
|
Delaware State, Series B
|
3.250% |
01/01/21
|
Aaa/AAA
|
2,000,000 | 2,096,500 | |||||||||
|
Du Page County, IL, Jail Project
|
5.600% |
01/01/21
|
Aaa/AAA
|
1,600,000 | 1,862,816 | |||||||||
|
Florida State, Board of Education, Public Education, Series I
|
4.125% |
06/01/21
|
Aa1/AAA
|
3,000,000 | 3,098,220 | |||||||||
|
Georgia State, Series B
|
4.250% |
04/01/25
|
Aaa/AAA
|
1,120,000 | 1,183,750 | |||||||||
|
Georgia State, Series G
|
4.125% |
10/01/23
|
Aaa/AAA
|
2,000,000 | 2,128,740 | |||||||||
|
Henrico County, VA, Public Improvements
|
4.250% |
07/15/24
|
Aaa/AAA
|
2,830,000 | 2,963,519 | |||||||||
|
Mecklenburg County, NC
|
3.500% |
02/01/26
|
Aaa/AAA
|
2,000,000 | 2,018,980 | |||||||||
|
Mecklenburg County, NC, Public Improvements, Series B
|
4.000% |
03/01/27
|
Aaa/AAA
|
1,000,000 | 1,036,970 | |||||||||
|
Minnesota State, State Trunk Highway,
Series B |
4.000% |
08/01/30
|
Aa1/AA+
|
2,830,000 | 2,943,313 | |||||||||
|
Missouri State, Fourth State Building, Series A
|
4.125% |
10/01/19
|
Aaa/AAA
|
2,000,000 | 2,039,300 | |||||||||
|
Oregon State, State Property, ODOT Building, Public Improvements, Series K
|
5.000% |
05/01/30
|
Aa1/AA+
|
1,915,000 | 2,145,796 | |||||||||
|
Prince Georges County, MD, Public Improvements
|
4.125% |
07/15/26
|
Aaa/AAA
|
2,000,000 | 2,094,160 | |||||||||
|
South Carolina State, Coastal Carolina University, Series A
|
4.000% |
04/01/28
|
Aaa/AA+
|
1,000,000 | 1,034,310 | |||||||||
|
South Carolina State, Highway, Series A
|
3.000% |
08/01/22
|
Aaa/AA+
|
1,475,000 | 1,485,812 | |||||||||
|
Tennessee State, Series A
|
5.000% |
05/01/26
|
Aaa/AA+
|
500,000 | 552,355 | |||||||||
|
Tennessee State, Series A
|
5.000% |
05/01/27
|
Aaa/AA+
|
2,075,000 | 2,292,958 | |||||||||
|
Tennessee State, Series A
|
4.000% |
05/01/28
|
Aaa/AA+
|
2,000,000 | 2,047,740 | |||||||||
|
Tennessee State, Series A
|
3.625% |
05/01/31
|
Aaa/AA+
|
2,000,000 | 1,928,820 | |||||||||
|
Texas, Water Financial Assistance, Series C-1
|
5.000% |
08/01/39
|
Aaa/AA+
|
3,515,000 | 3,755,496 | |||||||||
|
Utah State, Series A
|
3.000% |
07/01/18
|
Aaa/AAA
|
1,000,000 | 1,073,100 | |||||||||
|
Utah State, Series A
|
5.000% |
07/01/23
|
Aaa/AAA
|
2,785,000 | 3,358,264 | |||||||||
|
Virginia State, Series B
|
4.250% |
06/01/26
|
Aaa/AAA
|
2,500,000 | 2,606,150 | |||||||||
|
Washington State, Series F
|
4.500% |
07/01/27
|
Aa1/AA+
|
2,500,000 | 2,616,250 | |||||||||
|
Washington, Suburban Sanitation District, Water Supply
|
4.250% |
06/01/26
|
Aaa/AAA
|
2,500,000 | 2,603,975 | |||||||||
| $ | 61,820,526 | |||||||||||||
See Notes to Financial Statements.
| 24 |
|
Managed Municipal Fund
|
|
Schedule of Investments (continued)
|
October 31, 2011
|
|
Security
|
Interest
Rate
|
Maturity
Date
|
Ratings
(Moody’s/
S&P)1
|
Principal
Amount
|
Market
Value
|
|||||||||
|
MUNICIPAL BONDS - 93.11% (continued)
|
||||||||||||||
|
Prerefunded2 Issues - 17.25%
|
||||||||||||||
|
Arlington County, VA, Public Improvements, 01/15/13 @ 100
|
4.500% |
01/15/28
|
Aaa/AA+
|
$ | 400,000 | $ | 420,012 | |||||||
|
Dallas, TX, 02/15/12 @ 100
|
4.000% |
02/15/16
|
Aa1/AA+
|
2,450,000 | 2,476,828 | |||||||||
|
Delaware State, Series A, 01/01/12 @ 100
|
4.200% |
01/01/20
|
Aaa/AAA
|
1,675,000 | 1,686,223 | |||||||||
|
Gwinnett County, GA, Water & Sewer Authority, 08/01/12 @ 100
|
5.250% |
08/01/24
|
Aaa/AAA
|
1,500,000 | 1,556,295 | |||||||||
|
Maryland State, Capital Improvements, Series A, 02/15/12 @ 100
|
4.000% |
02/15/20
|
Aaa/AAA
|
4,000,000 | 4,411,600 | |||||||||
|
Mecklenburg County, NC, Public Improvements, Series A,
02/01/14 @ 100 |
4.000% |
02/01/20
|
Aaa/AAA
|
3,000,000 | 3,123,540 | |||||||||
|
Montgomery County, MD, Public Improvements, Series A,
05/01/13 @ 100 |
4.000% |
05/01/21
|
Aaa/AAA
|
2,450,000 | 2,583,745 | |||||||||
|
Salt Lake City, UT, School District, School Board Guaranty, Series A, 03/01/13 @ 100
|
4.500% |
03/01/20
|
Aaa/NR
|
2,240,000 | 2,363,290 | |||||||||
| $ | 18,621,533 | |||||||||||||
|
Revenue Bonds - 18.59%
|
||||||||||||||
|
Colorado, Water Resources & Power Development Authority, Series A
|
4.000% |
09/01/29
|
Aaa/AAA
|
$ | 2,000,000 | $ | 2,012,500 | |||||||
|
Fairfax County, VA, Water Authority Water Revenue
|
4.500% |
04/01/27
|
Aaa/AAA
|
2,500,000 | 2,636,850 | |||||||||
|
Florida, Water Pollution Control Financing, Series A
|
5.000% |
01/15/29
|
Aaa/AAA
|
500,000 | 548,210 | |||||||||
|
Florida, Water Pollution Control Financing, Series A
|
5.100% |
01/15/29
|
Aaa/AAA
|
550,000 | 606,507 | |||||||||
|
Gwinnett County, GA, Water & Sewer Authority, Series A
|
4.000% |
08/01/28
|
Aaa/AAA
|
2,000,000 | 2,061,100 | |||||||||
|
Kansas State, Development Finance Authority, Series DW-1
|
3.000% |
04/01/20
|
Aaa/AAA
|
2,865,000 | 2,956,938 | |||||||||
|
Kansas State, Development Finance Authority, Series DW-1
|
3.125% |
04/01/22
|
Aaa/AAA
|
2,975,000 | 3,022,481 | |||||||||
|
Texas, Water Development Board Revenue, State Revolving Fund-Senior Lien, Series A
|
4.750% |
07/15/20
|
Aaa/AAA
|
3,000,000 | 3,005,760 | |||||||||
|
Virginia State Resources Authority Clean Water Revenue
|
4.500% |
10/01/28
|
Aaa/AAA
|
3,000,000 | 3,211,140 | |||||||||
| $ | 20,061,486 | |||||||||||||
|
Total Municipal Bonds (Cost $95,892,628)
|
$ | 100,503,545 | ||||||||||||
|
US TREASURY OBLIGATIONS - 4.64%
|
||||||||||||||
|
US Treasury Notes (Cost $5,011,169)
|
0.375% |
08/31/12
|
—
|
$ | 5,000,000 | $ | 5,010,355 | |||||||
See Notes to Financial Statements.
| 25 |
|
Managed Municipal Fund
|
|
Schedule of Investments (continued)
|
October 31, 2011
|
|
Security
|
Principal
Amount
|
Market
Value
|
||||||
|
REPURCHASE AGREEMENTS - 1.36%
|
||||||||
|
JPMorgan Chase, N.A.
|
||||||||
|
Dated 10/31/11, 0.03%, principal and interest in the amount of $1,467,001 to be repurchased 11/01/11, collateralized by US Treasury Inflation-Protected Note, par value of $1,145,000 due 07/15/16 with a value of $1,499,136 (Cost $1,467,000)
|
$ | 1,467,000 | $ | 1,467,000 | ||||
|
Total Investments - 99.11% (Cost $102,370,797)*
|
$ | 106,980,900 | ||||||
|
Other Assets in Excess of Liabilities - 0.89%
|
965,447 | |||||||
|
Net Assets - 100.00%
|
$ | 107,946,347 | ||||||
|
1
|
Moody’s Municipal Bond Ratings:
|
||
|
Aaa
|
Judged to be of the best quality.
|
||
|
Aa
|
Judged to be of high quality by all standards. Issues are sometimes denoted with a 1, 2 or 3, which denote a high, medium or low ranking within the rating.
|
||
|
S&P Municipal Bond Ratings:
|
|||
|
AAA
|
Of the highest quality.
|
||
|
AA
|
The second strongest capacity of payment of debt services. Those issues determined to possess very strong safety characteristics are denoted with a plus (+) sign.
|
||
|
NR
|
Bond is not rated by this rating organization.
|
||
|
2
|
Prerefunded: Bonds which are prerefunded are collateralized by US Treasury securities which are held in escrow and are used to pay principal and interest on tax-exempt issues and to retire the bonds in full at the earliest refunding date.
|
||
|
*
|
Cost for Federal income tax purposes is $102,370,797 and net unrealized appreciation on a tax basis consists of:
|
||
|
Gross Unrealized Appreciation
|
$ | 4,754,026 | ||
|
Gross Unrealized Depreciation
|
(143,923 | ) | ||
|
Net Unrealized Appreciation
|
$ | 4,610,103 |
See Notes to Financial Statements.
| 26 |
|
North American Government Bond Fund
|
|
Schedule of Investments
|
October 31, 2011
|
|
Security
|
Interest
Rate
|
Maturity
Date
|
Principal
Amount1
|
Market
Value
|
||||||||
|
CANADIAN SECURITIES - 18.38%
|
||||||||||||
|
Canadian Government Bonds
|
1.500% |
03/01/12
|
CAD |
2,000,000
|
$ | 2,010,414 | ||||||
|
Canadian Government Bonds
|
1.500% |
06/01/12
|
2,000,000 | 2,013,082 | ||||||||
|
Canadian Government Bonds
|
3.750% |
06/01/12
|
7,500,000 | 7,646,802 | ||||||||
|
Canadian Government Bonds
|
3.500% |
06/01/13
|
3,100,000 | 3,232,304 | ||||||||
|
Canadian Government Bonds
|
4.000% |
06/01/17
|
9,000,000 | 10,140,045 | ||||||||
|
Canadian Government Bonds
|
3.250% |
06/01/21
|
1,950,000 | 2,111,400 | ||||||||
|
Total Canadian Securities (Cost $25,402,646)
|
$ | 27,154,047 | ||||||||||
|
MEXICAN SECURITIES - 11.69%
|
||||||||||||
|
Mexican Bono2
|
9.000% |
12/20/12
|
MXN |
31,782,400
|
$ | 2,504,370 | ||||||
|
Mexican Bono2
|
8.000% |
12/19/13
|
17,850,000 | 1,433,651 | ||||||||
|
Mexican Bono2
|
6.000% |
06/18/15
|
23,850,000 | 1,863,285 | ||||||||
|
Mexican Bono2
|
8.000% |
12/17/15
|
93,907,000 | 7,833,128 | ||||||||
|
Mexican Bono2
|
7.250% |
12/15/16
|
44,050,000 | 3,630,854 | ||||||||
|
Total Mexican Securities (Cost $18,509,286)
|
$ | 17,265,288 | ||||||||||
|
US TREASURY OBLIGATIONS - 65.57%
|
||||||||||||
|
US Treasury Notes
|
0.375% |
08/31/12
|
$ | 4,000,000 | $ | 4,008,284 | ||||||
|
US Treasury Notes
|
2.250% |
11/30/17
|
24,200,000 | 25,474,275 | ||||||||
|
US Treasury Notes
|
2.625% |
08/15/20
|
10,850,000 | 11,417,086 | ||||||||
|
US Treasury Bonds
|
8.750% |
05/15/17
|
12,800,000 | 18,033,997 | ||||||||
|
US Treasury Bonds
|
8.875% |
08/15/17
|
10,300,000 | 14,723,366 | ||||||||
|
US Treasury Bonds
|
8.125% |
08/15/19
|
6,500,000 | 9,549,924 | ||||||||
|
US Treasury Bonds
|
8.500% |
02/15/20
|
6,000,000 | 9,102,186 | ||||||||
|
US Treasury Bonds
|
8.750% |
08/15/20
|
2,300,000 | 3,571,109 | ||||||||
|
US Treasury Bonds
|
7.875% |
02/15/21
|
650,000 | 972,867 | ||||||||
|
Total US Treasury Obligations (Cost $90,946,799)
|
$ | 96,853,094 | ||||||||||
See Notes to Financial Statements.
| 27 |
|
North American Government Bond Fund
|
|
Schedule of Investments (continued)
|
October 31, 2011
|
|
Security
|
Principal
Amount
|
Market
Value
|
||||||
|
REPURCHASE AGREEMENTS - 3.26%
|
||||||||
|
JPMorgan Chase, N.A.
|
||||||||
|
Dated 10/31/11, 0.03%, principal and interest in the amount of $4,817,004 to be repurchased 11/01/11, collateralized by US Treasury Inflation-Protected Note, par value of $3,755,000 due 07/15/16 with a value of $4,916,379 (Cost $4,817,000)
|
$ | 4,817,000 | $ | 4,817,000 | ||||
|
Total Investments - 98.90% (Cost $139,675,731)*
|
$ | 146,089,429 | ||||||
|
Other Assets in Excess of Liabilities - 1.10%
|
1,621,791 | |||||||
|
Net Assets - 100.00%
|
$ | 147,711,220 | ||||||
|
CAD
|
Canadian dollar
|
|
MXN
|
Mexican peso
|
|
1
|
Principal Amount is shown in US dollars unless otherwise noted.
|
|
2
|
Bonos are fixed rate, local currency-denominated coupon bonds issued by the Mexican government.
|
|
*
|
Cost for Federal income tax purposes is $139,675,731 and net unrealized appreciation on a tax basis consists of:
|
|
Gross Unrealized Appreciation
|
$ | 7,658,347 | ||
|
Gross Unrealized Depreciation
|
(1,244,649 | ) | ||
|
Net Unrealized Appreciation
|
$ | 6,413,698 |
See Notes to Financial Statements.
| 28 |
|
ISI Strategy Fund
|
|
Schedule of Investments
|
October 31, 2011
|
|
Security
|
Shares
|
Market
Value
|
||||||
|
COMMON STOCKS - 94.43%
|
||||||||
|
Consumer Discretionary - 13.09%
|
||||||||
|
Automobiles - 0.09%
|
||||||||
|
Ford Motor Co.*
|
4,400 | $ | 51,392 | |||||
|
Distributors - 0.22%
|
||||||||
|
LKQ Corp.*
|
4,400 | 128,392 | ||||||
|
Diversified Consumer Services - 0.31%
|
||||||||
|
ITT Educational Services, Inc.*
|
1,700 | 105,332 | ||||||
|
Weight Watchers International, Inc.
|
1,000 | 74,620 | ||||||
| 179,952 | ||||||||
|
Hotels, Restaurants & Leisure - 4.50%
|
||||||||
|
Ameristar Casinos, Inc.
|
10,780 | 199,430 | ||||||
|
Brinker International, Inc.
|
1,170 | 26,793 | ||||||
|
Chipotle Mexican Grill, Inc.*
|
1,000 | 336,120 | ||||||
|
Choice Hotels International, Inc.
|
1,970 | 70,506 | ||||||
|
International Game Technology
|
11,650 | 204,924 | ||||||
|
Las Vegas Sands Corp.*
|
6,880 | 323,016 | ||||||
|
Marriott International, Inc. - Class A
|
4,806 | 151,389 | ||||||
|
McDonald's Corp.
|
12,176 | 1,130,542 | ||||||
|
Wynn Resorts Ltd.
|
1,000 | 132,800 | ||||||
| 2,575,520 | ||||||||
|
Internet & Catalog Retail - 0.42%
|
||||||||
|
Blue Nile, Inc.*
|
1,500 | 67,695 | ||||||
|
Expedia, Inc.
|
3,195 | 83,901 | ||||||
|
HSN, Inc.*
|
1,600 | 57,072 | ||||||
|
Overstock.com, Inc.*
|
4,057 | 33,673 | ||||||
| 242,341 | ||||||||
|
Media - 3.06%
|
||||||||
|
AMC Networks, Inc. - Class A*
|
2,264 | 73,852 | ||||||
|
Cablevision Systems Corp. - New York Group - Class A
|
9,058 | 131,069 | ||||||
|
CBS Corp. - Class B - Non-Voting Shares
|
5,413 | 139,709 | ||||||
|
Comcast Corp. - Class A
|
11,050 | 259,122 | ||||||
|
DIRECTV - Class A*
|
11,760 | 534,610 | ||||||
|
Interpublic Group of Cos., Inc. (The)
|
95 | 901 | ||||||
|
Security
|
Shares
|
Market
Value
|
|
Media - 3.06%(continued)
|
||||||||
|
Liberty Global, Inc. - Class A*
|
4,066 | $ | 163,372 | |||||
|
Liberty Media Corp. - Liberty Starz - Series A*
|
846 | 57,782 | ||||||
|
News Corp. - Class A
|
605 | 10,600 | ||||||
|
Scholastic Corp.
|
1,100 | 29,535 | ||||||
|
Sirius XM Radio, Inc.*
|
41,300 | 73,927 | ||||||
|
Time Warner Cable, Inc.
|
883 | 56,238 | ||||||
|
Virgin Media, Inc.
|
650 | 15,847 | ||||||
|
Walt Disney Co. (The)
|
5,113 | 178,341 | ||||||
|
World Wrestling Entertainment, Inc.
|
2,510 | 26,380 | ||||||
| 1,751,285 | ||||||||
|
Multi-Line Retail - 0.88%
|
||||||||
|
Dollar General Corp.*
|
2,595 | 102,918 | ||||||
|
Dollar Tree, Inc.*
|
1,240 | 99,150 | ||||||
|
Macy's, Inc.
|
3,000 | 91,590 | ||||||
|
Nordstrom, Inc.
|
2,800 | 141,932 | ||||||
|
Target Corp.
|
1,251 | 68,492 | ||||||
| 504,082 | ||||||||
|
Specialty Retail - 3.04%
|
||||||||
|
Abercrombie & Fitch Co. - Class A
|
100 | 7,440 | ||||||
|
AutoZone, Inc.*
|
1,000 | 323,590 | ||||||
|
Bed Bath & Beyond, Inc.*
|
1,800 | 111,312 | ||||||
|
Buckle, Inc. (The)
|
1,000 | 44,560 | ||||||
|
Chico's FAS, Inc.
|
3,000 | 37,080 | ||||||
|
Express, Inc.
|
2,800 | 63,252 | ||||||
|
Finish Line, Inc. (The) - Class A
|
1,100 | 22,110 | ||||||
|
Foot Locker, Inc.
|
3,232 | 70,652 | ||||||
|
Gap, Inc. (The)
|
7,669 | 144,944 | ||||||
|
Hibbett Sports, Inc.*
|
1,500 | 61,785 | ||||||
|
Home Depot, Inc. (The)
|
5,113 | 183,045 | ||||||
|
Limited Brands, Inc.
|
2,500 | 106,775 | ||||||
|
Lowe's Cos., Inc.
|
4,110 | 86,392 | ||||||
|
PetSmart, Inc.
|
2,500 | 117,375 | ||||||
|
Systemax, Inc.*
|
4,121 | 62,351 | ||||||
|
Tiffany & Co.
|
1,100 | 87,703 | ||||||
|
Ulta Salon, Cosmetics & Fragrance, Inc.*
|
1,000 | 67,290 | ||||||
|
Williams-Sonoma, Inc.
|
2,700 | 101,358 | ||||||
|
Zumiez, Inc.*
|
1,800 | 40,950 | ||||||
| 1,739,964 | ||||||||
See Notes to Financial Statements.
| 29 |
|
ISI Strategy Fund
|
|
Schedule of Investments (continued)
|
October 31, 2011
|
|
Security
|
Shares
|
Market
Value
|
|
COMMON STOCKS - 94.43% (continued)
|
||||||||
|
Consumer Discretionary - 13.09% (continued)
|
||||||||
|
Textiles, Apparel & Luxury Goods - 0.57%
|
||||||||
|
NIKE, Inc. - Class B
|
2,500 | $ | 240,875 | |||||
|
Under Armour, Inc. - Class A*
|
1,000 | 84,410 | ||||||
| 325,285 | ||||||||
|
Consumer Staples - 11.47%
|
||||||||
|
Beverages - 2.07%
|
||||||||
|
Beam, Inc.
|
5,113 | 252,736 | ||||||
|
Coca-Cola Co. (The)
|
2,500 | 170,800 | ||||||
|
Coca-Cola Enterprises, Inc.
|
10,720 | 287,510 | ||||||
|
Constellation Brands, Inc.*
|
12,250 | 247,695 | ||||||
|
Hansen Natural Corp.*
|
1,600 | 142,544 | ||||||
|
PepsiCo, Inc.
|
1,328 | 83,598 | ||||||
| 1,184,883 | ||||||||
|
Food & Staples Retailing - 2.69%
|
||||||||
|
CVS Caremark Corp.
|
200 | 7,260 | ||||||
|
Kroger Co. (The)
|
2,600 | 60,268 | ||||||
|
Sysco Corp.
|
2,100 | 58,212 | ||||||
|
Wal-Mart Stores, Inc.
|
18,606 | 1,055,332 | ||||||
|
Walgreen Co.
|
3,700 | 122,840 | ||||||
|
Whole Foods Market, Inc.
|
3,300 | 237,996 | ||||||
| 1,541,908 | ||||||||
|
Food Products - 1.72%
|
||||||||
|
General Mills, Inc.
|
4,926 | 189,799 | ||||||
|
Hershey Co. (The)
|
5,113 | 292,617 | ||||||
|
Hormel Foods Corp.
|
10,226 | 301,360 | ||||||
|
McCormick & Co., Inc. - Non-Voting Shares
|
1,598 | 77,599 | ||||||
|
Smart Balance, Inc.*
|
2,090 | 13,689 | ||||||
|
Tyson Foods, Inc. - Class A
|
5,500 | 106,150 | ||||||
| 981,214 | ||||||||
|
Household Products - 1.23%
|
||||||||
|
Procter & Gamble Co. (The)
|
11,021 | 705,234 | ||||||
|
Personal Products - 0.69%
|
||||||||
|
Herbalife Ltd.
|
6,032 | 376,156 | ||||||
|
Revlon, Inc. - Class A*
|
1,200 | 17,676 | ||||||
| 393,832 | ||||||||
|
Tobacco - 3.07%
|
||||||||
|
Altria Group, Inc.
|
5,252 | 144,693 | ||||||
|
Philip Morris International, Inc.
|
16,689 | 1,166,060 | ||||||
|
Reynolds American, Inc.
|
10,326 | 399,410 | ||||||
|
Vector Group Ltd.
|
2,790 | 49,020 | ||||||
| 1,759,183 | ||||||||
|
Security
|
Shares
|
Market
Value
|
|
Energy - 10.23%
|
||||||||
|
Energy Equipment & Services - 1.35%
|
||||||||
|
Bristow Group, Inc.
|
1,120 | $ | 55,754 | |||||
|
Complete Production Services, Inc.*
|
1,695 | 55,596 | ||||||
|
Diamond Offshore Drilling, Inc.
|
1,000 | 65,540 | ||||||
|
Halliburton Co.
|
4,200 | 156,912 | ||||||
|
McDermott International, Inc.*
|
4,600 | 50,508 | ||||||
|
Newpark Resources, Inc.*
|
1,000 | 8,930 | ||||||
|
Patterson-UTI Energy, Inc.
|
1,270 | 25,806 | ||||||
|
RPC, Inc.
|
11,620 | 215,783 | ||||||
|
SEACOR Holdings, Inc.
|
1,000 | 85,150 | ||||||
|
Unit Corp.*
|
1,100 | 53,966 | ||||||
| 773,945 | ||||||||
|
Oil, Gas & Consumable Fuels - 8.88%
|
||||||||
|
Berry Petroleum Co. - Class A
|
3,060 | 105,723 | ||||||
|
Chesapeake Energy Corp.
|
6,600 | 185,592 | ||||||
|
Chevron Corp.
|
8,502 | 893,135 | ||||||
|
ConocoPhillips
|
8,950 | 623,367 | ||||||
|
Continental Resources, Inc.*
|
4,110 | 249,271 | ||||||
|
Crosstex Energy, Inc.
|
6,500 | 84,695 | ||||||
|
Enbridge Energy Management LLC*
|
1,290 | 39,758 | ||||||
|
Energy XXI (Bermuda) Ltd.*
|
1,900 | 55,803 | ||||||
|
Exxon Mobil Corp.
|
19,841 | 1,549,384 | ||||||
|
Kinder Morgan, Inc.
|
1,310 | 37,466 | ||||||
|
Marathon Oil Corp.
|
8,223 | 214,045 | ||||||
|
Marathon Petroleum Corp.
|
4,111 | 147,585 | ||||||
|
McMoRan Exploration Co.*
|
5,000 | 60,900 | ||||||
|
Murphy Oil Corp.
|
2,400 | 132,888 | ||||||
|
Quicksilver Resources, Inc.*
|
10,000 | 77,000 | ||||||
|
Rex Energy Corp.*
|
1,570 | 24,304 | ||||||
|
Ship Finance International Ltd.
|
5,112 | 73,153 | ||||||
|
Southern Union Co.
|
2,100 | 88,263 | ||||||
|
Southwestern Energy Co.*
|
500 | 21,020 | ||||||
|
Spectra Energy Corp.
|
1,860 | 53,252 | ||||||
|
Tesoro Corp.*
|
3,390 | 87,936 | ||||||
|
W&T Offshore, Inc.
|
2,500 | 49,225 | ||||||
|
Whiting Petroleum Corp.*
|
2,000 | 93,100 | ||||||
|
World Fuel Services Corp.
|
3,500 | 139,475 | ||||||
| 5,086,340 | ||||||||
See Notes to Financial Statements.
| 30 |
|
ISI Strategy Fund
|
|
Schedule of Investments (continued)
|
October 31, 2011
|
|
Security
|
Shares
|
Market
Value
|
|
COMMON STOCKS - 94.43% (continued)
|
||||||||
|
Financials - 13.19%
|
||||||||
|
Capital Markets - 2.33%
|
||||||||
|
American Capital Ltd.*
|
12,300 | $ | 95,571 | |||||
|
Artio Global Investors, Inc.
|
6,600 | 48,312 | ||||||
|
BlackRock, Inc. - Class A
|
2,346 | 370,175 | ||||||
|
Charles Schwab Corp. (The)
|
14,435 | 177,262 | ||||||
|
Invesco Ltd.
|
4,511 | 90,536 | ||||||
|
Morgan Stanley
|
4,612 | 81,356 | ||||||
|
SEI Investments Co.
|
6,566 | 106,303 | ||||||
|
TD AMERITRADE Holding Corp.
|
21,690 | 363,958 | ||||||
| 1,333,473 | ||||||||
|
Commercial Banks - 2.08%
|
||||||||
|
Centerstate Banks, Inc.
|
496 | 2,817 | ||||||
|
Cullen/Frost Bankers, Inc.
|
5,263 | 258,098 | ||||||
|
First Horizon National Corp.
|
11,600 | 81,084 | ||||||
|
FirstMerit Corp.
|
3,500 | 49,035 | ||||||
|
MB Financial, Inc.
|
4,900 | 81,193 | ||||||
|
Susquehanna Bancshares, Inc.
|
6,112 | 44,373 | ||||||
|
SVB Financial Group*
|
4,700 | 215,918 | ||||||
|
Webster Financial Corp.
|
3,000 | 58,920 | ||||||
|
Wells Fargo & Co.
|
15,363 | 398,055 | ||||||
| 1,189,493 | ||||||||
|
Consumer Finance - 0.48%
|
||||||||
|
Advance America Cash Advance Centers, Inc.
|
3,360 | 28,325 | ||||||
|
DFC Global Corp.*
|
2,400 | 52,608 | ||||||
|
Discover Financial Services
|
8,240 | 194,134 | ||||||
| 275,067 | ||||||||
|
Diversified Financial Services - 2.36%
|
||||||||
|
Bank of America Corp.
|
35,721 | 243,974 | ||||||
|
CBOE Holdings, Inc.
|
3,400 | 88,842 | ||||||
|
Citigroup, Inc.
|
1,470 | 46,437 | ||||||
|
CME Group, Inc.
|
852 | 234,777 | ||||||
|
JPMorgan Chase & Co.
|
20,881 | 725,824 | ||||||
|
Leucadia National Corp.
|
500 | 13,415 | ||||||
| 1,353,269 | ||||||||
|
Insurance - 3.36%
|
||||||||
|
Allstate Corp. (The)
|
2,400 | 63,216 | ||||||
|
American Equity Investment Life Holding Co.
|
10,400 | 112,736 | ||||||
|
Brown & Brown, Inc.
|
14,000 | 309,120 | ||||||
|
Cincinnati Financial Corp.
|
4,712 | 136,365 | ||||||
|
Security
|
Shares
|
Market
Value
|
|
Insurance - 3.36% (continued)
|
||||||||
|
CNA Financial Corp.
|
4,100 | $ | 109,060 | |||||
|
CNO Financial Group, Inc.*
|
15,600 | 97,500 | ||||||
|
Loews Corp.
|
7,920 | 314,424 | ||||||
|
MetLife, Inc.
|
75 | 2,637 | ||||||
|
ProAssurance Corp.
|
5,648 | 432,354 | ||||||
|
Protective Life Corp.
|
6,280 | 116,808 | ||||||
|
Prudential Financial, Inc.
|
4,163 | 225,635 | ||||||
|
StanCorp Financial Group, Inc.
|
101 | 3,428 | ||||||
| 1,923,283 | ||||||||
|
Real Estate Investment Trusts - 1.85%
|
||||||||
|
American Capital Agency Corp.
|
14,250 | 392,017 | ||||||
|
Hatteras Financial Corp.
|
9,368 | 240,758 | ||||||
|
National Retail Properties, Inc.
|
2,550 | 69,488 | ||||||
|
Public Storage
|
2,760 | 356,178 | ||||||
| 1,058,441 | ||||||||
|
Thrifts & Mortgage Finance - 0.73%
|
||||||||
|
First Niagara Financial Group, Inc.
|
4,113 | 37,799 | ||||||
|
New York Community Bancorp, Inc.
|
21,800 | 290,158 | ||||||
|
TFS Financial Corp.*
|
10,000 | 92,100 | ||||||
| 420,057 | ||||||||
|
Health Care - 11.92%
|
||||||||
|
Biotechnology - 1.63%
|
||||||||
|
Acorda Therapeutics, Inc.*
|
3,000 | 65,520 | ||||||
|
Amylin Pharmaceuticals, Inc.*
|
7,300 | 84,096 | ||||||
|
Biogen Idec, Inc.*
|
1,910 | 222,248 | ||||||
|
Cepheid, Inc.*
|
5,080 | 182,270 | ||||||
|
Cubist Pharmaceuticals, Inc.*
|
2,160 | 81,670 | ||||||
|
Emergent Biosolutions, Inc.*
|
1,000 | 18,860 | ||||||
|
Incyte Corp.*
|
4,100 | 56,457 | ||||||
|
Maxygen, Inc.
|
10,230 | 60,357 | ||||||
|
Momenta Pharmaceuticals, Inc.*
|
5,410 | 80,068 | ||||||
|
Myriad Genetics, Inc.*
|
3,000 | 63,840 | ||||||
|
Neurocrine Biosciences, Inc.*
|
2,900 | 18,154 | ||||||
| 933,540 | ||||||||
|
Health Care Equipment & Supplies - 1.29%
|
||||||||
|
Baxter International, Inc.
|
502 | 27,600 | ||||||
|
IDEXX Laboratories, Inc.*
|
5,163 | 371,684 | ||||||
|
Meridian Bioscience, Inc.
|
3,105 | 56,573 | ||||||
|
Sirona Dental Systems, Inc.*
|
4,800 | 229,920 | ||||||
|
STERIS Corp.
|
1,748 | 54,153 | ||||||
| 739,930 | ||||||||
See Notes to Financial Statements.
| 31 |
|
ISI Strategy Fund
|
|
Schedule of Investments (continued)
|
October 31, 2011
|
|
Security
|
Shares
|
Market
Value
|
|
COMMON STOCKS - 94.43% (continued)
|
||||||||
|
Health Care - 11.92% (continued)
|
||||||||
|
Health Care Providers & Services - 3.11%
|
||||||||
|
AmerisourceBergen Corp.
|
10,700 | $ | 436,560 | |||||
|
Catalyst Health Solutions, Inc.*
|
2,500 | 137,425 | ||||||
|
Community Health Systems, Inc.*
|
4,900 | 85,652 | ||||||
|
Express Scripts, Inc.*
|
1,500 | 68,595 | ||||||
|
Health Management Associates, Inc. - Class A*
|
12,000 | 105,120 | ||||||
|
Health Net, Inc.*
|
1,800 | 50,022 | ||||||
|
LifePoint Hospitals, Inc.*
|
2,000 | 77,320 | ||||||
|
Magellan Health Services, Inc.*
|
3,100 | 159,557 | ||||||
|
McKesson Corp.
|
1,200 | 97,860 | ||||||
|
Medco Health Solutions, Inc.*
|
1,230 | 67,478 | ||||||
|
MEDNAX, Inc.*
|
2,900 | 190,820 | ||||||
|
Omnicare, Inc.
|
100 | 2,982 | ||||||
|
Owens & Minor, Inc.
|
1,100 | 32,912 | ||||||
|
Select Medical Holdings Corp.*
|
7,900 | 68,730 | ||||||
|
Team Health Holdings, Inc.*
|
6,600 | 134,112 | ||||||
|
Tenet Healthcare Corp.*
|
13,990 | 66,172 | ||||||
| 1,781,317 | ||||||||
|
Health Care Technology - 0.46%
|
||||||||
|
Allscripts Healthcare Solutions, Inc.*
|
12,450 | 238,418 | ||||||
|
Omnicell, Inc.*
|
1,600 | 23,920 | ||||||
| 262,338 | ||||||||
|
Life Sciences Tools & Services - 0.47%
|
||||||||
|
Bruker Corp.*
|
9,470 | 136,652 | ||||||
|
Pharmaceutical Product Development, Inc.
|
4,000 | 131,960 | ||||||
| 268,612 | ||||||||
|
Pharmaceuticals - 4.96%
|
||||||||
|
Abbott Laboratories
|
4,546 | 244,893 | ||||||
|
Allergan, Inc.
|
921 | 77,475 | ||||||
|
Bristol-Myers Squibb Co.
|
2,803 | 88,547 | ||||||
|
Forest Laboratories, Inc.*
|
7,200 | 225,360 | ||||||
|
Johnson & Johnson
|
13,038 | 839,517 | ||||||
|
Medicis Pharmaceutical Corp. - Class A
|
2,500 | 95,725 | ||||||
|
Merck & Co., Inc.
|
13,102 | 452,019 | ||||||
|
Pfizer, Inc.
|
36,340 | 699,908 | ||||||
|
Security
|
Shares
|
Market
Value
|
|
Pharmaceuticals - 4.96% (continued)
|
||||||||
|
Salix Pharmaceuticals Ltd.*
|
1,400 | $ | 47,957 | |||||
|
ViroPharma, Inc.*
|
3,400 | 68,816 | ||||||
| 2,840,217 | ||||||||
|
Industrials - 9.91%
|
||||||||
|
Aerospace & Defense - 2.15%
|
||||||||
|
AAR Corp.
|
2,052 | 40,896 | ||||||
|
Alliant Techsystems, Inc.
|
4,300 | 249,744 | ||||||
|
Boeing Co. (The)
|
1,300 | 85,527 | ||||||
|
Goodrich Corp.
|
1,153 | 141,392 | ||||||
|
Honeywell International, Inc.
|
3,609 | 189,112 | ||||||
|
Huntington Ingalls Industries, Inc.*
|
718 | 21,181 | ||||||
|
Northrop Grumman Corp.
|
4,311 | 248,960 | ||||||
|
Taser International, Inc.*
|
2,110 | 10,487 | ||||||
|
United Technologies Corp.
|
3,108 | 242,362 | ||||||
| 1,229,661 | ||||||||
|
Air Freight & Logistics - 0.43%
|
||||||||
|
FedEx Corp.
|
856 | 70,046 | ||||||
|
United Parcel Service, Inc. - Class B
|
2,500 | 175,600 | ||||||
| 245,646 | ||||||||
|
Airlines - 0.15%
|
||||||||
|
United Continental Holdings, Inc.*
|
4,502 | 86,979 | ||||||
|
Building Products - 0.30%
|
||||||||
|
Fortune Brands Home & Security, Inc.*
|
5,113 | 74,292 | ||||||
|
Griffon Corp.*
|
4,700 | 44,509 | ||||||
|
Simpson Manufacturing Co., Inc.
|
1,710 | 52,428 | ||||||
| 171,229 | ||||||||
|
Commercial Services & Supplies - 0.38%
|
||||||||
|
ABM Industries, Inc.
|
500 | 10,110 | ||||||
|
Geo Group, Inc. (The)*
|
2,900 | 52,867 | ||||||
|
United Stationers, Inc.
|
2,400 | 76,344 | ||||||
|
US Ecology, Inc.
|
540 | 9,752 | ||||||
|
Viad Corp.
|
3,300 | 69,069 | ||||||
| 218,142 | ||||||||
|
Construction & Engineering - 0.22%
|
||||||||
|
Aecom Technology Corp.*
|
2,000 | 41,840 | ||||||
|
Tutor Perini Corp.
|
5,800 | 84,274 | ||||||
| 126,114 | ||||||||
|
Industrial Conglomerates - 1.03%
|
||||||||
|
3M Co.
|
2,456 | 194,073 | ||||||
|
General Electric Co.
|
23,560 | 393,688 | ||||||
| 587,761 | ||||||||
See Notes to Financial Statements.
| 32 |
|
ISI Strategy Fund
|
|
Schedule of Investments (continued)
|
October 31, 2011
|
|
Security
|
Shares
|
Market
Value
|
|
COMMON STOCKS - 94.43% (continued)
|
||||||||
|
Industrials - 9.91% (continued)
|
||||||||
|
Machinery - 2.38%
|
||||||||
|
Actuant Corp. - Class A
|
2,000 | $ | 45,000 | |||||
|
Blount International, Inc.*
|
3,800 | 59,014 | ||||||
|
Briggs & Stratton Corp.
|
2,900 | 42,340 | ||||||
|
Caterpillar, Inc.
|
3,567 | 336,939 | ||||||
|
CLARCOR, Inc.
|
1,790 | 86,779 | ||||||
|
Graco, Inc.
|
3,490 | 149,861 | ||||||
|
Illinois Tool Works, Inc.
|
1,191 | 57,918 | ||||||
|
Joy Global, Inc.
|
5,163 | 450,213 | ||||||
|
Mueller Industries, Inc.
|
3,300 | 133,485 | ||||||
| 1,361,549 | ||||||||
|
Professional Services - 0.99%
|
||||||||
|
Acacia Research - Acacia Technologies*
|
2,800 | 111,552 | ||||||
|
FTI Consulting, Inc.*
|
1,470 | 57,933 | ||||||
|
Mistras Group, Inc.*
|
1,200 | 26,160 | ||||||
|
Verisk Analytics, Inc. - Class A*
|
10,600 | 372,590 | ||||||
| 568,235 | ||||||||
|
Road & Rail - 0.80%
|
||||||||
|
Knight Transportation, Inc.
|
2,850 | 43,320 | ||||||
|
Landstar System, Inc.
|
1,690 | 75,425 | ||||||
|
Union Pacific Corp.
|
3,400 | 338,538 | ||||||
| 457,283 | ||||||||
|
Trading Companies & Distributors - 1.08%
|
||||||||
|
Aircastle Ltd.
|
597 | 7,242 | ||||||
|
Fastenal Co.
|
10,726 | 408,553 | ||||||
|
Titan Machinery, Inc.*
|
500 | 11,665 | ||||||
|
Watsco, Inc.
|
1,330 | 82,008 | ||||||
|
WESCO International, Inc.*
|
2,300 | 111,458 | ||||||
| 620,926 | ||||||||
|
Information Technology - 16.45%
|
||||||||
|
Communications Equipment - 0.21%
|
||||||||
|
Brocade Communications Systems, Inc.*
|
6,230 | 27,287 | ||||||
|
Motorola Solutions, Inc.
|
2,000 | 93,820 | ||||||
| 121,107 | ||||||||
|
Computers & Peripherals - 4.14%
|
||||||||
|
Apple, Inc.*
|
5,113 | 2,069,640 | ||||||
|
Cray, Inc.*
|
1,280 | 8,102 | ||||||
|
Hewlett-Packard Co.
|
1,700 | 45,237 | ||||||
|
Lexmark International, Inc.*
|
1,700 | 53,890 | ||||||
|
NCR Corp.*
|
3,100 | 59,024 | ||||||
|
Security
|
Shares
|
Market
Value
|
|
Computers & Peripherals - 4.14% (continued)
|
||||||||
|
QLogic Corp.*
|
3,700 | $ | 51,689 | |||||
|
STEC, Inc.*
|
4,120 | 46,639 | ||||||
|
Synaptics, Inc.*
|
1,170 | 39,534 | ||||||
| 2,373,755 | ||||||||
|
Electronic Equipment, Instruments & Components - 1.36%
|
||||||||
|
Agilent Technologies, Inc.*
|
1,768 | 65,540 | ||||||
|
Anixter International, Inc.*
|
200 | 11,738 | ||||||
|
AVX Corp.
|
7,480 | 100,307 | ||||||
|
Brightpoint, Inc.*
|
7,250 | 73,588 | ||||||
|
Insight Enterprises, Inc.*
|
4,800 | 81,120 | ||||||
|
Itron, Inc.*
|
3,130 | 115,153 | ||||||
|
Power-One, Inc.*
|
1,000 | 4,950 | ||||||
|
ScanSource, Inc.*
|
1,674 | 58,188 | ||||||
|
Tech Data Corp.*
|
4,669 | 229,621 | ||||||
|
Vishay Intertechnology, Inc.*
|
3,400 | 36,550 | ||||||
| 776,755 | ||||||||
|
Internet Software & Services - 1.92%
|
||||||||
|
Earthlink, Inc.
|
13,300 | 93,233 | ||||||
|
Google, Inc. - Class A*
|
1,166 | 691,018 | ||||||
|
j2 Global Communications, Inc.
|
1,640 | 50,479 | ||||||
|
NIC, Inc.
|
2,270 | 31,349 | ||||||
|
ValueClick, Inc.*
|
1,000 | 17,600 | ||||||
|
WebMD Health Corp.*
|
1,200 | 43,140 | ||||||
|
XO Group, Inc.*
|
11,050 | 101,992 | ||||||
|
Yahoo!, Inc.*
|
4,400 | 68,816 | ||||||
| 1,097,627 | ||||||||
|
IT Services - 3.68%
|
||||||||
|
CACI International, Inc. - Class A*
|
990 | 54,341 | ||||||
|
Cardtronics, Inc.*
|
2,033 | 50,683 | ||||||
|
DST Systems, Inc.
|
2,500 | 125,475 | ||||||
|
Fidelity National Information Services, Inc.
|
280 | 7,330 | ||||||
|
Heartland Payment Systems, Inc.
|
4,062 | 88,389 | ||||||
|
International Business Machines Corp.
|
8,744 | 1,614,405 | ||||||
|
ManTech International Corp. - Class A
|
1,400 | 49,182 | ||||||
|
Teradata Corp.*
|
1,933 | 115,323 | ||||||
| 2,105,128 | ||||||||
See Notes to Financial Statements.
| 33 |
|
ISI Strategy Fund
|
|
Schedule of Investments (continued)
|
October 31, 2011
|
|
Security
|
Shares
|
Market
Value
|
|
COMMON STOCKS - 94.43% (continued)
|
||||||||
|
Information Technology - 16.45% (continued)
|
||||||||
|
Semiconductors & Semiconductor Equipment - 1.93%
|
||||||||
|
Cirrus Logic, Inc.*
|
976 | $ | 16,241 | |||||
|
Intel Corp.
|
22,959 | 563,414 | ||||||
|
Novellus Systems, Inc.*
|
2,200 | 76,010 | ||||||
|
OmniVision Technologies, Inc.*
|
2,600 | 42,406 | ||||||
|
Texas Instruments, Inc.
|
10,275 | 315,751 | ||||||
|
Veeco Instruments, Inc.*
|
3,540 | 94,482 | ||||||
| 1,108,304 | ||||||||
|
Software - 3.21%
|
||||||||
|
ANSYS, Inc.*
|
5,113 | 277,943 | ||||||
|
Blackbaud, Inc.
|
2,910 | 81,567 | ||||||
|
Microsoft Corp.
|
31,122 | 828,779 | ||||||
|
Oracle Corp.
|
7,169 | 234,928 | ||||||
|
Pegasystems, Inc.
|
1,050 | 39,679 | ||||||
|
Quest Software, Inc.*
|
7,000 | 123,130 | ||||||
|
SolarWinds, Inc.*
|
1,060 | 30,592 | ||||||
|
Taleo Corp. - Class A*
|
900 | 29,160 | ||||||
|
Tyler Technologies, Inc.*
|
6,090 | 192,261 | ||||||
| 1,838,039 | ||||||||
|
Materials - 3.68%
|
||||||||
|
Chemicals - 2.61%
|
||||||||
|
A. Schulman, Inc.
|
1,958 | 41,333 | ||||||
|
CF Industries Holdings, Inc.
|
1,900 | 308,313 | ||||||
|
Cytec Industries, Inc.
|
5,113 | 228,398 | ||||||
|
Dow Chemical Co. (The)
|
4,169 | 116,232 | ||||||
|
Olin Corp.
|
4,388 | 82,758 | ||||||
|
PolyOne Corp.
|
4,377 | 48,979 | ||||||
|
Rockwood Holdings, Inc.*
|
3,058 | 140,790 | ||||||
|
RPM International, Inc.
|
12,608 | 283,302 | ||||||
|
W.R. Grace & Co.*
|
5,841 | 244,095 | ||||||
| 1,494,200 | ||||||||
|
Containers & Packaging - 0.16%
|
||||||||
|
Graphic Packaging Holding Co.*
|
335 | 1,481 | ||||||
|
Silgan Holdings, Inc.
|
2,490 | 93,474 | ||||||
| 94,955 | ||||||||
|
Metals & Mining - 0.91%
|
||||||||
|
Freeport-McMoRan Copper & Gold, Inc.
|
2,000 | 80,520 | ||||||
|
Hecla Mining Co.*
|
1,000 | 6,270 | ||||||
|
Metals USA Holdings Corp.*
|
2,600 | 28,314 | ||||||
|
Security
|
Shares
|
Market
Value
|
|
Metals & Mining - 0.91% (continued)
|
||||||||
|
Newmont Mining Corp.
|
1,300 | $ | 86,879 | |||||
|
Royal Gold, Inc.
|
1,595 | 114,170 | ||||||
|
Southern Copper Corp.
|
2,145 | 65,809 | ||||||
|
Titanium Metals Corp.
|
4,512 | 75,576 | ||||||
|
Worthington Industries, Inc.
|
3,559 | 61,499 | ||||||
| 519,037 | ||||||||
|
Telecommunication Services - 1.60%
|
||||||||
|
Diversified Telecommunication Services - 1.20%
|
||||||||
|
AT&T, Inc.
|
1,000 | 29,310 | ||||||
|
CenturyLink, Inc.
|
11,449 | 403,692 | ||||||
|
Cogent Communications Group, Inc.*
|
4,100 | 65,805 | ||||||
|
Premiere Global Services, Inc.*
|
1,010 | 9,150 | ||||||
|
Verizon Communications, Inc.
|
4,800 | 177,504 | ||||||
| 685,461 | ||||||||
|
Wireless Telecommunication Services - 0.40%
|
||||||||
|
American Tower Corp. - Class A*
|
1,900 | 104,690 | ||||||
|
MetroPCS Communications, Inc.*
|
700 | 5,950 | ||||||
|
USA Mobility, Inc.
|
8,970 | 117,238 | ||||||
| 227,878 | ||||||||
|
Utilities - 2.89%
|
||||||||
|
Electric Utilities - 1.28%
|
||||||||
|
Exelon Corp.
|
7,819 | 347,085 | ||||||
|
Northeast Utilities
|
3,270 | 113,044 | ||||||
|
NV Energy, Inc.
|
7,700 | 123,508 | ||||||
|
PPL Corp.
|
5,113 | 150,169 | ||||||
| 733,806 | ||||||||
|
Gas Utilities - 0.32%
|
||||||||
|
National Fuel Gas Co.
|
3,010 | 184,483 | ||||||
|
Multi-Utilities - 0.73%
|
||||||||
|
Alliant Energy Corp.
|
2,300 | 93,794 | ||||||
|
Ameren Corp.
|
10,200 | 325,176 | ||||||
| 418,970 | ||||||||
|
Water Utilities - 0.56%
|
||||||||
|
American Water Works Co., Inc.
|
10,400 | 317,512 | ||||||
|
Total Common Stocks
(Cost $45,331,803) |
$ | 54,074,331 | ||||||
See Notes to Financial Statements.
| 34 |
|
ISI Strategy Fund
|
|
Schedule of Investments (continued)
|
October 31, 2011
|
|
Security
|
Interest
Rate
|
Maturity
Date
|
Principal
Amount
|
Market
Value
|
||||||||
|
US TREASURY OBLIGATIONS - 5.15%
|
||||||||||||
|
US Treasury Notes
|
2.000% |
01/31/16
|
$ | 550,000 | $ | 578,273 | ||||||
|
US Treasury Notes
|
2.625% |
08/15/20
|
300,000 | 315,680 | ||||||||
|
US Treasury Bonds
|
8.125% |
08/15/19
|
1,400,000 | 2,056,907 | ||||||||
|
Total US Treasury Obligations (Cost $2,739,381)
|
$ | 2,950,860 | ||||||||||
|
Security
|
Principal
Amount
|
Market
Value
|
||||||
|
REPURCHASE AGREEMENTS - 0.50%
|
||||||||
|
JPMorgan Chase, N.A.
|
||||||||
|
Dated 10/31/11, 0.03%, principal and interest in the amount of $284,000 to be repurchased 11/01/11, collateralized by US Treasury Inflation-Protected Note, par value of $225,000 due to 07/15/16 with a value of $294,590 (Cost $284,000)
|
$ | 284,000 | $ | 284,000 | ||||
|
Total Investments - 100.08% (Cost $48,355,184)**
|
$ | 57,309,191 | ||||||
|
Liabilities in Excess of Other Assets - (0.08)%
|
(48,068 | ) | ||||||
|
Net Assets - 100.00%
|
$ | 57,261,123 | ||||||
|
*
|
Non-income producing security.
|
|
**
|
Cost for Federal income tax purposes is $48,417,226 and net unrealized appreciation on a tax basis consists of:
|
|
Gross Unrealized Appreciation
|
$ | 12,508,142 | ||
|
Gross Unrealized Depreciation
|
(3,616,177 | ) | ||
|
Net Unrealized Appreciation
|
$ | 8,891,965 |
|
The difference between the federal income tax cost of portfolio investments and the Schedule of Investments cost is due to certain timing differences in the recognition of capital gains and losses under income tax regulations and accounting principles generally accepted in the United States. These timing differences are temporary in nature and are due to the tax deferral of losses on wash sales.
|
See Notes to Financial Statements.
| 35 |
|
ISI FUNDS
|
|
Statements of Assets and Liabilities
|
October 31, 2011
|
|
Total Return
US Treasury
Fund
|
Managed
Municipal
Fund
|
|||||||
|
ASSETS
|
||||||||
|
Investments in securities:
|
||||||||
|
At cost
|
$ | 79,145,001 | $ | 102,370,797 | ||||
|
At value (Note 1)
|
$ | 84,204,180 | $ | 106,980,900 | ||||
|
Cash
|
877 | 606 | ||||||
|
Interest receivable
|
667,614 | 1,101,456 | ||||||
|
Receivable for capital shares sold
|
786,772 | 52,957 | ||||||
|
Other assets
|
26,847 | 43,149 | ||||||
|
TOTAL ASSETS
|
85,686,290 | 108,179,068 | ||||||
|
LIABILITIES
|
||||||||
|
Distributions payable
|
39,557 | 112,216 | ||||||
|
Payable for capital shares redeemed
|
76,880 | 24,999 | ||||||
|
Accrued investment advisory fees (Note 2)
|
19,291 | 36,723 | ||||||
|
Accrued distribution fees (Note 2)
|
18,006 | 22,207 | ||||||
|
Accrued administration fees (Note 2)
|
6,387 | 5,818 | ||||||
|
Accrued transfer agent fees (Note 2)
|
3,564 | 2,459 | ||||||
|
Accrued directors' fees (Note 2)
|
4,541 | 4,834 | ||||||
|
Other accrued expenses and liabilities
|
24,286 | 23,465 | ||||||
|
TOTAL LIABILITIES
|
192,512 | 232,721 | ||||||
|
NET ASSETS
|
$ | 85,493,778 | $ | 107,946,347 | ||||
|
NET ASSETS CONSIST OF:
|
||||||||
|
Paid-in capital
|
$ | 79,167,956 | $ | 103,376,811 | ||||
|
Undistributed (distributions in excess of) net investment income
|
— | 690 | ||||||
|
Accumulated net realized gains (losses) from security transactions
|
1,266,643 | (41,257 | ) | |||||
|
Net unrealized appreciation on investments
|
5,059,179 | 4,610,103 | ||||||
|
Net assets
|
$ | 85,493,778 | $ | 107,946,347 | ||||
See Notes to Financial Statements.
| 36 |
|
ISI FUNDS
|
|
Statements of Assets and Liabilities (continued)
|
October 31, 2011
|
|
Total Return
US Treasury
Fund
|
Managed
Municipal
Fund
|
|||||||
|
SHARES OF CAPITAL STOCK OUTSTANDING OF $0.001 PAR VALUE
|
||||||||
|
ISI Class A Shares (50,000,000 shares authorized)
|
— | 9,685,478 | ||||||
|
ISI Class I Shares (5,000,000 shares authorized)
|
— | 334,404 | ||||||
|
ISI Shares (115,000,000 shares authorized)
|
8,239,136 | — | ||||||
|
NET ASSET VALUE AND REDEMPTION PRICE PER SHARE
|
||||||||
|
ISI Class A Shares (based on net assets of $104,341,764)
|
$ | — | $ | 10.77 | ||||
|
ISI Class I Shares (based on net assets of $3,604,583)
|
$ | — | $ | 10.78 | ||||
|
ISI Shares (based on net assets of $85,493,778)
|
$ | 10.38 | $ | — | ||||
|
MAXIMUM OFFERING PRICE VALUE PER SHARE (100/97) X NET ASSET VALUE PER SHARE
|
||||||||
|
ISI Class A Shares
|
$ | — | $ | 11.10 | ||||
|
ISI Shares
|
$ | 10.70 | $ | — | ||||
See Notes to Financial Statements.
| 37 |
|
ISI FUNDS
|
|
Statements of Assets and Liabilities
|
October 31, 2011
|
|
North American Government
Bond Fund |
ISI
Strategy
Fund
|
|||||||
|
ASSETS
|
||||||||
|
Investments in securities:
|
||||||||
|
At cost
|
$ | 139,675,731 | $ | 48,355,184 | ||||
|
At value (Note 1)
|
$ | 146,089,429 | $ | 57,309,191 | ||||
|
Cash
|
181 | 319 | ||||||
|
Dividends and interest receivable, at value
|
2,084,820 | 65,982 | ||||||
|
Receivable for capital shares sold
|
26,044 | 128 | ||||||
|
Other assets
|
70,461 | 26,876 | ||||||
|
TOTAL ASSETS
|
148,270,935 | 57,402,496 | ||||||
|
LIABILITIES
|
||||||||
|
Distributions payable
|
124,437 | — | ||||||
|
Payable for capital shares redeemed
|
267,883 | 82,535 | ||||||
|
Accrued investment advisory fees (Note 2)
|
49,476 | 18,764 | ||||||
|
Accrued distribution fees (Note 2)
|
48,604 | 11,727 | ||||||
|
Accrued shareholder servicing fees (Note 2)
|
3,644 | — | ||||||
|
Accrued transfer agent fees (Note 2)
|
10,269 | 1,291 | ||||||
|
Accrued administration fees (Note 2)
|
9,146 | 3,804 | ||||||
|
Accrued directors' fees (Note 2)
|
6,658 | 3,073 | ||||||
|
Other accrued expenses and liabilities
|
39,598 | 20,179 | ||||||
|
TOTAL LIABILITIES
|
559,715 | 141,373 | ||||||
|
NET ASSETS
|
$ | 147,711,220 | $ | 57,261,123 | ||||
|
NET ASSETS CONSIST OF:
|
||||||||
|
Paid-in capital
|
$ | 141,023,949 | $ | 51,695,946 | ||||
|
Undistributed (distributions in excess of) net investment income
|
(124,437 | ) | 43,492 | |||||
|
Accumulated net realized gains (losses) from security and foreign currency transactions
|
427,680 | (3,432,322 | ) | |||||
|
Net unrealized appreciation on investments and foreign currency translations
|
6,384,028 | 8,954,007 | ||||||
|
Net assets
|
$ | 147,711,220 | $ | 57,261,123 | ||||
See Notes to Financial Statements.
| 38 |
|
ISI FUNDS
|
|
Statements of Assets and Liabilities (continued)
|
October 31, 2011
|
|
North American
Government
Bond Fund
|
ISI
Strategy
Fund
|
|||||||
|
SHARES OF CAPITAL STOCK OUTSTANDING OF $0.001 PAR VALUE
|
||||||||
|
ISI Class A Shares (50,000,000 shares authorized)
|
14,171,740 | — | ||||||
|
ISI Class C Shares (5,000,000 shares authorized)
|
2,186,704 | — | ||||||
|
ISI Class I Shares (5,000,000 shares authorized)
|
2,272,357 | — | ||||||
|
ISI Shares (25,000,000 shares authorized)
|
— | 4,534,713 | ||||||
|
NET ASSET VALUE AND REDEMPTION PRICE PER SHARE
|
||||||||
|
ISI Class A Shares (based on net assets of $112,407,128)
|
$ | 7.93 | $ | — | ||||
|
ISI Class C Shares (based on net assets of $17,247,974)*
|
$ | 7.89 | $ | — | ||||
|
ISI Class I Shares (based on net assets of $18,056,118)
|
$ | 7.95 | $ | — | ||||
|
ISI Shares (based on net assets of $57,261,123)
|
$ | — | $ | 12.63 | ||||
|
MAXIMUM OFFERING PRICE VALUE PER SHARE (100/97) X NET ASSET VALUE PER SHARE
|
||||||||
|
ISI Class A Shares
|
$ | 8.18 | $ | — | ||||
|
ISI Shares
|
$ | — | $ | 13.02 | ||||
|
*
|
Contingent deferred sales charge of 1.00% is imposed on the sale of shares if redeemed within the first year of purchase.
|
See Notes to Financial Statements.
| 39 |
|
ISI FUNDS
|
|
Statements of Operations
|
Year Ended October 31, 2011
|
|
Total Return
US Treasury
Fund
|
Managed
Municipal
Fund
|
|||||||
|
INVESTMENT INCOME
|
||||||||
|
Interest
|
$ | 2,037,076 | $ | 3,886,637 | ||||
|
Other income
|
681 | — | ||||||
|
TOTAL INVESTMENT INCOME
|
2,037,757 | 3,886,637 | ||||||
|
EXPENSES
|
||||||||
|
Investment advisory fees (Note 2)
|
204,465 | 424,482 | ||||||
|
Distribution fees (Note 2):
|
||||||||
|
ISI Class A Shares
|
— | 258,299 | ||||||
|
ISI Shares
|
217,313 | — | ||||||
|
Administration fees (Note 2)
|
63,557 | 73,813 | ||||||
|
Custody fees
|
55,538 | 77,355 | ||||||
|
Transfer agent fees (Note 2):
|
||||||||
|
ISI Class A Shares
|
— | 39,392 | ||||||
|
ISI Class I Shares
|
— | 947 | ||||||
|
ISI Shares
|
44,727 | — | ||||||
|
Professional fees
|
44,503 | 49,130 | ||||||
|
Registration fees
|
26,241 | 49,652 | ||||||
|
Compliance consulting fees (Note 2)
|
24,937 | 28,814 | ||||||
|
Directors' fees and expenses
|
21,287 | 24,620 | ||||||
|
Other expenses
|
31,165 | 35,592 | ||||||
|
TOTAL EXPENSES
|
733,733 | 1,062,096 | ||||||
|
NET INVESTMENT INCOME
|
1,304,024 | 2,824,541 | ||||||
|
REALIZED AND UNREALIZED GAINS (LOSSES) ON INVESTMENTS
|
||||||||
|
Net realized gains (losses) from security transactions
|
1,634,170 | (41,257 | ) | |||||
|
Net change in unrealized appreciation/depreciation on investments
|
642,385 | 153,003 | ||||||
|
NET REALIZED AND UNREALIZED GAINS ON INVESTMENTS
|
2,276,555 | 111,746 | ||||||
|
NET INCREASE IN NET ASSETS FROM OPERATIONS
|
$ | 3,580,579 | $ | 2,936,287 | ||||
See Notes to Financial Statements.
| 40 |
|
ISI FUNDS
|
|
Statements of Operations
|
Year Ended October 31, 2011
|
|
North American
Government Bond Fund
|
ISI
Strategy
Fund
|
|||||||
|
INVESTMENT INCOME
|
||||||||
|
Dividends
|
$ | — | $ | 1,190,878 | ||||
|
Interest
|
4,409,442 | 167,630 | ||||||
|
TOTAL INVESTMENT INCOME
|
4,409,442 | 1,358,508 | ||||||
|
EXPENSES
|
||||||||
|
Investment advisory fees (Note 2)
|
585,594 | 251,279 | ||||||
|
Distribution fees (Note 2):
|
||||||||
|
ISI Class A Shares
|
465,137 | — | ||||||
|
ISI Class C Shares
|
136,324 | — | ||||||
|
ISI Shares
|
— | 157,049 | ||||||
|
Custody fees
|
112,804 | 60,240 | ||||||
|
Transfer agent fees (Note 2):
|
||||||||
|
ISI Class A Shares
|
85,274 | — | ||||||
|
ISI Class C Shares
|
13,430 | — | ||||||
|
ISI Class I Shares
|
7,932 | — | ||||||
|
ISI Shares
|
— | 34,627 | ||||||
|
Administration fees (Note 2)
|
102,568 | 27,160 | ||||||
|
Professional fees
|
59,093 | 37,527 | ||||||
|
Shareholder servicing fees (Note 2):
|
||||||||
|
ISI Class C Shares
|
45,442 | — | ||||||
|
Compliance consulting fees (Note 2)
|
39,844 | 17,337 | ||||||
|
Registration fees
|
36,751 | 26,618 | ||||||
|
Directors' fees and expenses
|
34,464 | 14,689 | ||||||
|
Other expenses
|
65,334 | 27,044 | ||||||
|
TOTAL EXPENSES
|
1,789,991 | 653,570 | ||||||
|
NET INVESTMENT INCOME
|
2,619,451 | 704,938 | ||||||
|
REALIZED AND UNREALIZED GAINS (LOSSES) ON INVESTMENTS AND FOREIGN CURRENCIES
|
||||||||
|
Net realized gains from:
|
||||||||
|
Security transactions
|
1,418,519 | 2,271,921 | ||||||
|
Foreign currency transactions
|
96,027 | — | ||||||
|
Net change in unrealized appreciation/depreciation on:
|
||||||||
|
Investments
|
441,057 | (403,351 | ) | |||||
|
Foreign currency translation
|
(43,124 | ) | — | |||||
|
NET REALIZED AND UNREALIZED GAINS ON INVESTMENTS AND FOREIGN CURRENCIES
|
1,912,479 | 1,868,570 | ||||||
|
NET INCREASE IN NET ASSETS FROM OPERATIONS
|
$ | 4,531,930 | $ | 2,573,508 | ||||
See Notes to Financial Statements.
| 41 |
|
Total Return US Treasury Fund
|
|
Statements of Changes in Net Assets
|
|
|
Year
Ended
October 31,
2011
|
Year
Ended
October 31,
2010
|
||||||
|
FROM OPERATIONS
|
||||||||
|
Net investment income
|
$ | 1,304,024 | $ | 1,532,943 | ||||
|
Net realized gains from security transactions
|
1,634,170 | 994,042 | ||||||
|
Net change in net unrealized appreciation/depreciation on investments
|
642,385 | 4,202,408 | ||||||
|
Net increase in net assets resulting from operations
|
3,580,579 | 6,729,393 | ||||||
|
DISTRIBUTIONS TO SHAREHOLDERS
|
||||||||
|
From net investment income
|
(1,304,024 | ) | (1,532,943 | ) | ||||
|
From net realized gains from security transactions
|
(381,516 | ) | (5,616,815 | ) | ||||
|
Decrease in net assets resulting from distributions to shareholders
|
(1,685,540 | ) | (7,149,758 | ) | ||||
|
FROM CAPITAL SHARE TRANSACTIONS
|
||||||||
|
Proceeds from shares sold
|
5,744,028 | 5,698,834 | ||||||
|
Net asset value of shares issued in reinvestment of distributions to shareholders
|
1,130,054 | 5,284,575 | ||||||
|
Payments for shares redeemed
|
(21,068,096 | ) | (25,065,786 | ) | ||||
|
Net decrease in net assets resulting from capital share transactions
|
(14,194,014 | ) | (14,082,377 | ) | ||||
|
TOTAL DECREASE IN NET ASSETS
|
(12,298,975 | ) | (14,502,742 | ) | ||||
|
NET ASSETS
|
||||||||
|
Beginning of year
|
97,792,753 | 112,295,495 | ||||||
|
End of year
|
$ | 85,493,778 | $ | 97,792,753 | ||||
|
END OF YEAR UNDISTRIBUTED (DISTRIBUTIONS IN EXCESS OF) NET INVESTMENT INCOME
|
$ | — | $ | — | ||||
|
CAPITAL SHARE ACTIVITY
|
||||||||
|
Shares sold
|
566,944 | 577,733 | ||||||
|
Shares reinvested
|
113,692 | 550,435 | ||||||
|
Shares redeemed
|
(2,131,872 | ) | (2,546,872 | ) | ||||
|
Net decrease in shares outstanding
|
(1,451,236 | ) | (1,418,704 | ) | ||||
|
Shares outstanding, beginning of year
|
9,690,372 | 11,109,076 | ||||||
|
Shares outstanding, end of year
|
8,239,136 | 9,690,372 | ||||||
See Notes to Financial Statements.
| 42 |
|
Managed Municipal Fund
|
|
Statements of Changes in Net Assets
|
|
Year
Ended
October 31,
2011
|
Year
Ended
October 31,
2010
|
|||||||
|
FROM OPERATIONS
|
||||||||
|
Net investment income
|
$ | 2,824,541 | $ | 3,077,914 | ||||
|
Net realized gains (losses) from security transactions
|
(41,257 | ) | 720,306 | |||||
|
Net change in net unrealized appreciation/depreciation on investments
|
153,003 | 985,144 | ||||||
|
Net increase in net assets resulting from operations
|
2,936,287 | 4,783,364 | ||||||
|
DISTRIBUTIONS TO SHAREHOLDERS
|
||||||||
|
From net investment income
|
||||||||
|
ISI Class A Shares
|
(2,740,490 | ) | (3,078,368 | ) | ||||
|
ISI Class I Shares
|
(83,643 | ) | (182 | ) | ||||
|
From net realized gains from security transactions
|
||||||||
|
ISI Class A Shares
|
(702,701 | ) | (345,235 | ) | ||||
|
ISI Class I Shares
|
(17,283 | ) | — | |||||
|
Decrease in net assets resulting from distributions to shareholders
|
(3,544,117 | ) | (3,423,785 | ) | ||||
|
FROM CAPITAL SHARE TRANSACTIONS
|
||||||||
|
Proceeds from shares sold
|
||||||||
|
ISI Class A Shares
|
11,333,587 | 22,551,334 | ||||||
|
ISI Class I Shares
|
4,164,478 | 76,591 | ||||||
|
Net asset value of shares issued in reinvestment of distributions to shareholders
|
||||||||
|
ISI Class A Shares
|
2,108,024 | 2,006,694 | ||||||
|
ISI Class I Shares
|
28,991 | 182 | ||||||
|
Payments for shares redeemed
|
||||||||
|
ISI Class A Shares
|
(20,683,966 | ) | (14,638,906 | ) | ||||
|
ISI Class I Shares
|
(675,412 | ) | (11 | ) | ||||
|
Net increase (decrease) in net assets resulting from capital share transactions
|
(3,724,298 | ) | 9,995,884 | |||||
|
TOTAL INCREASE (DECREASE) IN NET ASSETS
|
(4,332,128 | ) | 11,355,463 | |||||
|
NET ASSETS
|
||||||||
|
Beginning of year
|
112,278,475 | 100,923,012 | ||||||
|
End of year
|
$ | 107,946,347 | $ | 112,278,475 | ||||
|
END OF YEAR UNDISTRIBUTED NET INVESTMENT INCOME
|
$ | 690 | $ | 282 | ||||
See Notes to Financial Statements.
| 43 |
|
Managed Municipal Fund
|
|
Statements of Changes in Net Assets (continued)
|
|
Year
Ended
October 31,
2011
|
Year
Ended
October 31,
2010
|
|||||||
|
CAPITAL SHARE ACTIVITY
|
||||||||
|
Shares sold
|
||||||||
|
ISI Class A Shares
|
1,069,961 | 2,089,357 | ||||||
|
ISI Class I Shares
|
388,654 | 7,001 | ||||||
|
Shares reinvested
|
||||||||
|
ISI Class A Shares
|
201,088 | 186,500 | ||||||
|
ISI Class I Shares
|
2,782 | 17 | ||||||
|
Shares redeemed
|
||||||||
|
ISI Class A Shares
|
(1,953,697 | ) | (1,357,843 | ) | ||||
|
ISI Class I Shares
|
(64,049 | ) | (1 | ) | ||||
|
Net increase (decrease) in shares outstanding
|
||||||||
|
ISI Class A Shares
|
(682,648 | ) | 918,014 | |||||
|
ISI Class I Shares
|
327,387 | 7,017 | ||||||
|
Shares outstanding, beginning of year
|
||||||||
|
ISI Class A Shares
|
10,368,126 | 9,450,112 | ||||||
|
ISI Class I Shares
|
7,017 | — | ||||||
|
Shares outstanding, end of year
|
||||||||
|
ISI Class A Shares
|
9,685,478 | 10,368,126 | ||||||
|
ISI Class I Shares
|
334,404 | 7,017 | ||||||
See Notes to Financial Statements.
| 44 |
|
North American Government Bond Fund
|
|
Statements of Changes in Net Assets
|
|
Year
Ended
October 31,
2011
|
Year
Ended
October 31,
2010
|
|||||||
|
FROM OPERATIONS
|
||||||||
|
Net investment income
|
$ | 2,619,451 | $ | 2,679,004 | ||||
|
Net realized gains from security and foreign currency transactions
|
1,514,546 | 2,892,343 | ||||||
|
Net change in net unrealized appreciation/depreciation on investments and foreign currency translation
|
397,933 | 8,160,933 | ||||||
|
Net increase in net assets resulting from operations
|
4,531,930 | 13,732,280 | ||||||
|
DISTRIBUTIONS TO SHAREHOLDERS
|
||||||||
|
From net investment income
|
||||||||
|
ISI Class A Shares
|
(2,308,484 | ) | (2,397,132 | ) | ||||
|
ISI Class C Shares
|
(276,833 | ) | (281,317 | ) | ||||
|
ISI Class I Shares
|
(303,492 | ) | (555 | ) | ||||
|
From net realized gains from security transactions
|
||||||||
|
ISI Class A Shares
|
(885,079 | ) | (3,838,365 | ) | ||||
|
ISI Class C Shares
|
(141,835 | ) | (740,785 | ) | ||||
|
ISI Class I Shares
|
(66,068 | ) | (586 | ) | ||||
|
Decrease in net assets resulting from distributions to shareholders
|
(3,981,791 | ) | (7,258,740 | ) | ||||
|
FROM CAPITAL SHARE TRANSACTIONS
|
||||||||
|
Proceeds from shares sold
|
||||||||
|
ISI Class A Shares
|
18,444,746 | 31,062,656 | ||||||
|
ISI Class C Shares
|
2,997,040 | 3,451,857 | ||||||
|
ISI Class I Shares
|
19,541,976 | 193,289 | ||||||
|
Net asset value of shares issued in reinvestment of distributions to shareholders
|
||||||||
|
ISI Class A Shares
|
2,045,866 | 4,030,261 | ||||||
|
ISI Class C Shares
|
263,185 | 664,834 | ||||||
|
ISI Class I Shares
|
79,028 | 1,141 | ||||||
|
Payments for shares redeemed
|
||||||||
|
ISI Class A Shares
|
(42,909,330 | ) | (39,092,239 | ) | ||||
|
ISI Class C Shares
|
(8,919,558 | ) | (6,715,972 | ) | ||||
|
ISI Class I Shares
|
(1,924,589 | ) | (8 | ) | ||||
|
Net decrease in net assets resulting from capital share transactions
|
(10,381,636 | ) | (6,404,181 | ) | ||||
|
TOTAL INCREASE (DECREASE) IN NET ASSETS
|
(9,831,497 | ) | 69,359 | |||||
See Notes to Financial Statements.
| 45 |
|
North American Government Bond Fund
|
|
Statements of Changes in Net Assets (continued)
|
|
Year
Ended
October 31,
2011
|
Year
Ended
October 31,
2010
|
|||||||
|
NET ASSETS
|
||||||||
|
Beginning of year
|
157,542,717 | 157,473,358 | ||||||
|
End of year
|
$ | 147,711,220 | $ | 157,542,717 | ||||
|
END OF YEAR UNDISTRIBUTED (DISTRIBUTIONS IN EXCESS OF) NET INVESTMENT INCOME
|
$ | (124,437 | ) | $ | — | |||
|
CAPITAL SHARE ACTIVITY
|
||||||||
|
Shares sold
|
||||||||
|
ISI Class A Shares
|
2,377,677 | 4,064,217 | ||||||
|
ISI Class C Shares
|
386,824 | 452,123 | ||||||
|
ISI Class I Shares
|
2,482,523 | 24,780 | ||||||
|
Shares reinvested
|
||||||||
|
ISI Class A Shares
|
263,122 | 532,705 | ||||||
|
ISI Class C Shares
|
34,019 | 88,248 | ||||||
|
ISI Class I Shares
|
10,193 | 145 | ||||||
|
Shares redeemed
|
||||||||
|
ISI Class A Shares
|
(5,508,903 | ) | (5,136,420 | ) | ||||
|
ISI Class C Shares
|
(1,157,539 | ) | (885,939 | ) | ||||
|
ISI Class I Shares
|
(245,283 | ) | (1 | ) | ||||
|
Net increase (decrease) in shares outstanding
|
||||||||
|
ISI Class A Shares
|
(2,868,104 | ) | (539,498 | ) | ||||
|
ISI Class C Shares
|
(736,696 | ) | (345,568 | ) | ||||
|
ISI Class I Shares
|
2,247,433 | 24,924 | ||||||
|
Shares outstanding, beginning of year
|
||||||||
|
ISI Class A Shares
|
17,039,844 | 17,579,342 | ||||||
|
ISI Class C Shares
|
2,923,400 | 3,268,968 | ||||||
|
ISI Class I Shares
|
24,924 | — | ||||||
|
Shares outstanding, end of year
|
||||||||
|
ISI Class A Shares
|
14,171,740 | 17,039,844 | ||||||
|
ISI Class C Shares
|
2,186,704 | 2,923,400 | ||||||
|
ISI Class I Shares
|
2,272,357 | 24,924 | ||||||
See Notes to Financial Statements.
| 46 |
|
ISI Strategy Fund
|
|
Statements of Changes in Net Assets
|
|
Year
Ended
October 31,
2011
|
Year
Ended
October 31,
2010
|
|||||||
|
FROM OPERATIONS
|
||||||||
|
Net investment income
|
$ | 704,938 | $ | 809,776 | ||||
|
Net realized gains (losses) from security transactions
|
2,271,921 | (488,595 | ) | |||||
|
Net change in net unrealized appreciation/depreciation on investments
|
(403,351 | ) | 8,625,267 | |||||
|
Net increase in net assets resulting from operations
|
2,573,508 | 8,946,448 | ||||||
|
DISTRIBUTIONS TO SHAREHOLDERS
|
||||||||
|
From net investment income
|
(707,064 | ) | (809,407 | ) | ||||
|
FROM CAPITAL SHARE TRANSACTIONS
|
||||||||
|
Proceeds from shares sold
|
6,536,028 | 5,666,622 | ||||||
|
Net asset value of shares issued in reinvestment of distributions to shareholders
|
610,715 | 705,681 | ||||||
|
Payments for shares redeemed
|
(12,196,789 | ) | (7,795,400 | ) | ||||
|
Net decrease in net assets resulting from capital share transactions
|
(5,050,046 | ) | (1,423,097 | ) | ||||
|
TOTAL INCREASE (DECREASE) IN NET ASSETS
|
(3,183,602 | ) | 6,713,944 | |||||
|
NET ASSETS
|
||||||||
|
Beginning of year
|
60,444,725 | 53,730,781 | ||||||
|
End of year
|
$ | 57,261,123 | $ | 60,444,725 | ||||
|
END OF YEAR UNDISTRIBUTED NET INVESTMENT INCOME
|
$ | 43,492 | $ | 9,755 | ||||
|
CAPITAL SHARE ACTIVITY
|
||||||||
|
Shares sold
|
510,245 | 486,397 | ||||||
|
Shares reinvested
|
47,681 | 61,148 | ||||||
|
Shares redeemed
|
(947,151 | ) | (674,109 | ) | ||||
|
Net decrease in shares outstanding
|
(389,225 | ) | (126,564 | ) | ||||
|
Shares outstanding, beginning of year
|
4,923,938 | 5,050,502 | ||||||
|
Shares outstanding, end of year
|
4,534,713 | 4,923,938 | ||||||
See Notes to Financial Statements.
| 47 |
|
Total Return US Treasury Fund
|
Financial Highlights
Selected Per Share Data and Ratios for a Share Outstanding Throughout Each Year
|
Years Ended October 31,
|
||||||||||||||||||||
|
|
2011
|
2010
|
2009
|
2008
|
2007
|
|||||||||||||||
|
Net asset value at beginning of year
|
$ | 10.09 | $ | 10.11 | $ | 9.59 | $ | 9.50 | $ | 9.42 | ||||||||||
|
Income from investment operations:
|
||||||||||||||||||||
|
Net investment income(a)
|
0.15 | 0.15 | 0.17 | 0.28 | 0.35 | |||||||||||||||
|
Net realized and unrealized gains on investments
|
0.33 | 0.50 | 0.70 | 0.16 | 0.08 | |||||||||||||||
|
Total from investment operations
|
0.48 | 0.65 | 0.87 | 0.44 | 0.43 | |||||||||||||||
|
Less distributions:
|
||||||||||||||||||||
|
Dividends from net investment income
|
(0.15 | ) | (0.15 | ) | (0.17 | ) | (0.28 | ) | (0.34 | ) | ||||||||||
|
Distributions from net realized gains
|
(0.04 | ) | (0.52 | ) | (0.18 | ) | (0.07 | ) | (0.00 | )* | ||||||||||
|
Return of capital
|
— | — | — | — | (0.01 | ) | ||||||||||||||
|
Total distributions
|
(0.19 | ) | (0.67 | ) | (0.35 | ) | (0.35 | ) | (0.35 | ) | ||||||||||
|
Net asset value at end of year
|
$ | 10.38 | $ | 10.09 | $ | 10.11 | $ | 9.59 | $ | 9.50 | ||||||||||
|
TOTAL RETURN(b)
|
4.87 | % | 6.85 | % | 9.05 | % | 4.61 | % | 4.66 | % | ||||||||||
|
Net assets at end of year (000's)
|
$ | 85,494 | $ | 97,793 | $ | 112,295 | $ | 119,973 | $ | 124,768 | ||||||||||
|
Ratio of expenses to average net assets
|
0.84 | % | 0.82 | % | 0.80 | % | 0.79 | % | 0.79 | % | ||||||||||
|
Ratio of net investment income to average net assets
|
1.50 | % | 1.49 | % | 1.68 | % | 2.86 | % | 3.68 | % | ||||||||||
|
Portfolio turnover rate
|
51 | % | 44 | % | 109 | % | 70 | % | 29 | % | ||||||||||
|
(a)
|
Calculated using the average shares outstanding for the year.
|
|
(b)
|
Total return is a measure of the change in value of an investment in the Fund over the year covered, which assumes any dividends or capital gains distributions are reinvested in shares of the Fund. Returns shown do not reflect the deduction of taxes a shareholder would pay on Fund distributions or the redemption of Fund shares.
|
|
*
|
Amount less than $0.005 per share.
|
See Notes to Financial Statements.
| 48 |
|
Managed Municipal Fund - Class A
|
Financial Highlights
Selected Per Share Data and Ratios for a Share Outstanding Throughout Each Year
|
Years Ended October 31,
|
||||||||||||||||||||
|
|
2011
|
2010
|
2009
|
2008
|
2007
|
|||||||||||||||
|
Net asset value at beginning of year
|
$ | 10.82 | $ | 10.68 | $ | 9.96 | $ | 10.61 | $ | 10.80 | ||||||||||
|
Income (loss) from investment operations:
|
||||||||||||||||||||
|
Net investment income(a)
|
0.28 | 0.31 | 0.32 | 0.36 | 0.38 | |||||||||||||||
|
Net realized and unrealized gains (losses) on investments
|
0.02 | 0.18 | 0.74 | (0.50 | ) | (0.14 | ) | |||||||||||||
|
Total from investment operations
|
0.30 | 0.49 | 1.06 | (0.14 | ) | 0.24 | ||||||||||||||
|
Less distributions:
|
||||||||||||||||||||
|
Dividends from net investment income
|
(0.28 | ) | (0.31 | ) | (0.32 | ) | (0.47 | ) | (0.34 | ) | ||||||||||
|
Distributions from net realized gains
|
(0.07 | ) | (0.04 | ) | (0.02 | ) | (0.04 | ) | (0.09 | ) | ||||||||||
|
Total distributions
|
(0.35 | ) | (0.35 | ) | (0.34 | ) | (0.51 | ) | (0.43 | ) | ||||||||||
|
Net asset value at end of year
|
$ | 10.77 | $ | 10.82 | $ | 10.68 | $ | 9.96 | $ | 10.61 | ||||||||||
|
TOTAL RETURN(b)
|
2.93 | % | 4.62 | % | 10.68 | % | (1.44 | )% | 2.29 | % | ||||||||||
|
Net assets at end of year (000's)
|
$ | 104,342 | $ | 112,203 | $ | 100,923 | $ | 75,072 | $ | 73,038 | ||||||||||
|
Ratio of expenses to average net assets
|
1.01 | % | 0.97 | % | 0.97 | % | 0.96 | % | 0.94 | % | ||||||||||
|
Ratio of net investment income to average net assets
|
2.65 | % | 2.89 | % | 3.02 | % | 3.48 | % | 3.57 | % | ||||||||||
|
Portfolio turnover rate
|
10 | % | 22 | % | 10 | % | 7 | % | 5 | % | ||||||||||
|
(a)
|
Calculated using the average shares outstanding for the year.
|
|
(b)
|
Total return is a measure of the change in value of an investment in the Fund over the year covered, which assumes any dividends or capital gains distributions are reinvested in shares of the Fund. Returns shown do not reflect the deduction of taxes a shareholder would pay on Fund distributions or the redemption of Fund shares.
|
See Notes to Financial Statements.
| 49 |
|
Managed Municipal Fund - Class I
|
Financial Highlights
Selected Per Share Data and Ratios for a Share Outstanding Throughout Each Period
|
|
Year
Ended
October 31,
2011
|
Period
Ended
October 31,
2010(a)
|
||||||
|
Net asset value at beginning of period
|
$ | 10.82 | $ | 10.94 | ||||
|
Income (loss) from investment operations:
|
||||||||
|
Net investment income(b)
|
0.31 | 0.02 | ||||||
|
Net realized and unrealized gains (losses) on investments
|
0.03 | (0.11 | ) | |||||
|
Total from investment operations
|
0.34 | (0.09 | ) | |||||
|
Less distributions:
|
||||||||
|
Dividends from net investment income
|
(0.31 | ) | (0.03 | ) | ||||
|
Distributions from net realized gains
|
(0.07 | ) | — | |||||
|
Total distributions
|
(0.38 | ) | (0.03 | ) | ||||
|
Net asset value at end of period
|
$ | 10.78 | $ | 10.82 | ||||
|
TOTAL RETURN(c)
|
3.28 | % | (0.86 | )%(d) | ||||
|
Net assets at end of period (000's)
|
$ | 3,605 | $ | 76 | ||||
|
Ratio of expenses to average net assets
|
0.76 | % | 0.70 | %(e) | ||||
|
Ratio of net investment income to average net assets
|
2.92 | % | 2.83 | %(e) | ||||
|
Portfolio turnover rate
|
10 | % | 22 | %(d) | ||||
|
(a)
|
Class I commenced operations on October 7, 2010.
|
|
(b)
|
Calculated using the average shares outstanding for the period.
|
|
(c)
|
Total return is a measure of the change in value of an investment in the Fund over the period covered, which assumes any dividends or capital gains distributions are reinvested in shares of the Fund. Returns shown do not reflect the deduction of taxes a shareholder would pay on Fund distributions or the redemption of Fund shares.
|
|
(d)
|
Not annualized.
|
|
(e)
|
Annualized.
|
See Notes to Financial Statements.
| 50 |
|
North American Government Bond Fund - Class A
|
Financial Highlights
Selected Per Share Data and Ratios for a Share Outstanding Throughout Each Year
|
|
Years Ended October 31,
|
|||||||||||||||||||
|
|
2011
|
2010
|
2009
|
2008
|
2007
|
|||||||||||||||
|
Net asset value at beginning of year
|
$ | 7.89 | $ | 7.56 | $ | 7.22 | $ | 7.53 | $ | 7.41 | ||||||||||
|
Income (loss) from
investment operations: |
||||||||||||||||||||
|
Net investment income(a)
|
0.14 | 0.14 | 0.14 | 0.23 | 0.26 | |||||||||||||||
|
Net realized and unrealized gains (losses) on investments and foreign currencies
|
0.12 | 0.56 | 0.56 | (0.18 | ) | 0.22 | ||||||||||||||
|
Total from investment operations
|
0.26 | 0.70 | 0.70 | 0.05 | 0.48 | |||||||||||||||
|
Less distributions:
|
||||||||||||||||||||
|
Dividends from net investment income
|
(0.16 | ) | (0.14 | ) | (0.08 | ) | (0.19 | ) | (0.35 | ) | ||||||||||
|
Distributions from net realized gains
|
(0.06 | ) | (0.23 | ) | (0.28 | ) | (0.14 | ) | — | |||||||||||
|
Return of capital
|
— | — | — | (0.03 | ) | (0.01 | ) | |||||||||||||
|
Total distributions
|
(0.22 | ) | (0.37 | ) | (0.36 | ) | (0.36 | ) | (0.36 | ) | ||||||||||
|
Net asset value at end of year
|
$ | 7.93 | $ | 7.89 | $ | 7.56 | $ | 7.22 | $ | 7.53 | ||||||||||
|
TOTAL RETURN(b)
|
3.30 | % | 9.53 | % | 9.80 | % | 0.51 | % | 6.71 | % | ||||||||||
|
Net assets at end of year (000's)
|
$ | 112,407 | $ | 134,383 | $ | 132,814 | $ | 140,326 | $ | 131,748 | ||||||||||
|
Ratio of expenses to average net assets
|
1.18 | % | 1.15 | % | 1.13 | % | 1.11 | % | 1.11 | % | ||||||||||
|
Ratio of net investment income to average net assets
|
1.83 | % | 1.85 | % | 1.87 | % | 2.97 | % | 3.54 | % | ||||||||||
|
Portfolio turnover rate
|
46 | % | 48 | % | 131 | % | 108 | % | 49 | % | ||||||||||
|
(a)
|
Calculated using the average shares outstanding for the year.
|
|
(b)
|
Total return is a measure of the change in value of an investment in the Fund over the year covered, which assumes any dividends or capital gains distributions are reinvested in shares of the Fund. Returns shown do not reflect the deduction of taxes a shareholder would pay on Fund distributions or the redemption of Fund shares.
|
See Notes to Financial Statements.
| 51 |
|
North American Government Bond Fund - Class C
|
Financial Highlights
Selected Per Share Data and Ratios for a Share Outstanding Throughout Each Year
|
|
Years Ended October 31,
|
|||||||||||||||||||
|
|
2011
|
2010
|
2009
|
2008
|
2007
|
|||||||||||||||
|
Net asset value at beginning of year
|
$ | 7.85 | $ | 7.54 | $ | 7.21 | $ | 7.52 | $ | 7.40 | ||||||||||
|
Income (loss) from
investment operations:
|
||||||||||||||||||||
|
Net investment income(a)
|
0.10 | 0.09 | 0.09 | 0.18 | 0.21 | |||||||||||||||
|
Net realized and unrealized gains (losses) on investments and foreign currencies
|
0.12 | 0.56 | 0.55 | (0.18 | ) | 0.22 | ||||||||||||||
|
Total from investment operations
|
0.22 | 0.65 | 0.64 | 0.00 | 0.43 | |||||||||||||||
|
Less distributions:
|
||||||||||||||||||||
|
Dividends from net investment income
|
(0.12 | ) | (0.11 | ) | (0.03 | ) | (0.14 | ) | (0.30 | ) | ||||||||||
|
Distributions from net realized gains
|
(0.06 | ) | (0.23 | ) | (0.28 | ) | (0.14 | ) | — | |||||||||||
|
Return of capital
|
— | — | — | (0.03 | ) | (0.01 | ) | |||||||||||||
|
Total distributions
|
(0.18 | ) | (0.34 | ) | (0.31 | ) | (0.31 | ) | (0.31 | ) | ||||||||||
|
Net asset value at end of year
|
$ | 7.89 | $ | 7.85 | $ | 7.54 | $ | 7.21 | $ | 7.52 | ||||||||||
|
TOTAL RETURN(b)
|
2.84 | % | 8.85 | % | 8.97 | % | (0.12 | )% | 6.03 | % | ||||||||||
|
Net assets at end of year (000's)
|
$ | 17,248 | $ | 22,963 | $ | 24,659 | $ | 20,636 | $ | 16,848 | ||||||||||
|
Ratio of expenses to average net assets
|
1.78 | % | 1.78 | % | 1.76 | % | 1.73 | % | 1.74 | % | ||||||||||
|
Ratio of net investment income to average net assets
|
1.23 | % | 1.23 | % | 1.22 | % | 2.34 | % | 2.93 | % | ||||||||||
|
Portfolio turnover rate
|
46 | % | 48 | % | 131 | % | 108 | % | 49 | % | ||||||||||
|
(a)
|
Calculated using the average shares outstanding for the year.
|
|
(b)
|
Total return is a measure of the change in value of an investment in the Fund over the year covered, which assumes any dividends or capital gains distributions are reinvested in shares of the Fund. Returns shown do not reflect the deduction of taxes a shareholder would pay on Fund distributions or the redemption of Fund shares.
|
See Notes to Financial Statements.
| 52 |
|
North American Government Bond Fund - Class I
|
Financial Highlights
Selected Per Share Data and Ratios for a Share Outstanding Throughout Each Period
|
|
Year
Ended
October 31,
2011
|
Period
Ended
October 31,
2010(a)
|
||||||
|
Net asset value at beginning of period
|
$ | 7.89 | $ | 7.80 | ||||
|
Income from investment operations:
|
||||||||
|
Net investment income(b)
|
0.18 | 0.02 | ||||||
|
Net realized and unrealized gains on investments and foreign currencies
|
0.12 | 0.12 | ||||||
|
Total from investment operations
|
0.30 | 0.14 | ||||||
|
Less distributions:
|
||||||||
|
Dividends from net investment income
|
(0.18 | ) | (0.02 | ) | ||||
|
Distributions from net realized gains
|
(0.06 | ) | (0.03 | ) | ||||
|
Total distributions
|
(0.24 | ) | (0.05 | ) | ||||
|
Net asset value at end of period
|
$ | 7.95 | $ | 7.89 | ||||
|
TOTAL RETURN(c)
|
3.88 | % | 1.74 | %(d) | ||||
|
Net assets at end of period (000's)
|
$ | 18,056 | $ | 197 | ||||
|
Ratio of expenses to average net assets
|
0.78 | % | 0.69 | %(e) | ||||
|
Ratio of net investment income to average net assets
|
2.25 | % | 2.25 | %(e) | ||||
|
Portfolio turnover rate
|
46 | % | 48 | %(d) | ||||
|
(a)
|
Class I commenced operations on September 16, 2010.
|
|
(b)
|
Calculated using the average shares outstanding for the period.
|
|
(c)
|
Total return is a measure of the change in value of an investment in the Fund over the period covered, which assumes any dividends or capital gains distributions are reinvested in shares of the Fund. Returns shown do not reflect the deduction of taxes a shareholder would pay on Fund distributions or the redemption of Fund shares.
|
|
(d)
|
Not annualized.
|
|
(e)
|
Annualized.
|
See Notes to Financial Statements.
| 53 |
|
ISI Strategy Fund
|
Financial Highlights
Selected Per Share Data and Ratios for a Share Outstanding Throughout Each Year
|
|
Years Ended October 31,
|
|||||||||||||||||||
|
|
2011
|
2010
|
2009
|
2008
|
2007
|
|||||||||||||||
|
Net asset value at beginning of year
|
$ | 12.28 | $ | 10.64 | $ | 9.63 | $ | 14.82 | $ | 13.54 | ||||||||||
|
Income (loss) from investment operations:
|
||||||||||||||||||||
|
Net investment income(a)
|
0.15 | 0.16 | 0.11 | 0.13 | 0.17 | |||||||||||||||
|
Net realized and unrealized gains (losses) on investments
|
0.35 | 1.64 | 1.02 | (4.39 | ) | 1.65 | ||||||||||||||
|
Total from investment operations
|
0.50 | 1.80 | 1.13 | (4.26 | ) | 1.82 | ||||||||||||||
|
Less distributions:
|
||||||||||||||||||||
|
Dividends from net investment income
|
(0.15 | ) | (0.16 | ) | (0.12 | ) | (0.13 | ) | (0.17 | ) | ||||||||||
|
Distributions from net realized gains
|
— | — | — | (0.80 | ) | (0.37 | ) | |||||||||||||
|
Total distributions
|
(0.15 | ) | (0.16 | ) | (0.12 | ) | (0.93 | ) | (0.54 | ) | ||||||||||
|
Net asset value at end of year
|
$ | 12.63 | $ | 12.28 | $ | 10.64 | $ | 9.63 | $ | 14.82 | ||||||||||
|
TOTAL RETURN(b)
|
4.03 | % | 17.05 | % | 11.84 | % | (30.49 | )% | 13.79 | % | ||||||||||
|
Net assets at end of year (000's)
|
$ | 57,261 | $ | 60,445 | $ | 53,731 | $ | 53,245 | $ | 80,535 | ||||||||||
|
Ratio of expenses to average net assets
|
1.04 | % | 1.06 | % | 1.10 | % | 0.99 | % | 0.96 | % | ||||||||||
|
Ratio of net investment income to average net assets
|
1.12 | % | 1.40 | % | 1.19 | % | 1.02 | % | 1.21 | % | ||||||||||
|
Portfolio turnover rate
|
50 | % | 38 | % | 55 | % | 42 | % | 62 | % | ||||||||||
|
(a)
|
Calculated using the average shares outstanding for the year.
|
|
(b)
|
Total return is a measure of the change in value of an investment in the Fund over the year covered, which assumes any dividends or capital gains distributions are reinvested in shares of the Fund. Returns shown do not reflect the deduction of taxes a shareholder would pay on Fund distributions or the redemption of Fund shares.
|
See Notes to Financial Statements.
| 54 |
|
ISI Funds
|
Notes to Financial Statements
October 31, 2011
Note 1 – Organization and Significant Accounting Policies
|
A.
|
Organization
|
Total Return US Treasury Fund, Inc. (“Total Return”), Managed Municipal Fund, Inc. (“Managed Municipal”), North American Government Bond Fund, Inc. (“North American”) and ISI Strategy Fund, Inc. (“Strategy”) (each a “Fund” and collectively, the “Funds”) are registered under the Investment Company Act of 1940, as amended, as open-end management investment companies. The Funds are organized as corporations under the laws of the State of Maryland.
Total Return’s investment objectives are to provide a high level of total return with relative stability of principal and, secondarily, high current income. Managed Municipal’s investment objectives are to provide a high level of total return with relative stability of principal and, secondarily, high current income exempt from Federal income tax. North American’s investment objective is to provide a high level of current income, consistent with prudent investment risk. Strategy’s investment objective is to maximize total return through a combination of long-term growth of capital and current income.
Total Return and Strategy each currently offer a single class of shares (ISI Shares) to investors. Managed Municipal offers two classes of shares – ISI Class A Shares and ISI Class I Shares. North American offers three classes of shares – ISI Class A Shares, ISI Class C Shares and ISI Class I Shares. ISI Shares and ISI Class A Shares are subject to a maximum front-end sales charge equal to 3.00%. A contingent deferred sales charge of 1.00% is imposed on the sale of ISI Class C Shares if redeemed within the first year of purchase.
Total Return and Strategy are authorized to issue 115,000,000 and 25,000,000 shares, respectively, of ISI Shares at $0.001 par value. Managed Municipal is authorized to issue 50,000,000 ISI Class A Shares and 5,000,000 ISI Class I Shares at $0.001 par value. North American is authorized to issue 50,000,000 ISI Class A Shares, 5,000,000 ISI Class C Shares and 5,000,000 ISI Class I Shares at $0.001 par value.
|
B.
|
Valuation of Securities
|
Exchange traded securities and over-the-counter securities listed on the NASDAQ National Market System for which market quotations are readily available are valued each Fund business day using the last reported sales price or the NASDAQ Official Closing Price (“NOCP”) provided by independent pricing services as of the close of trading on the New York Stock Exchange (normally 4:00 p.m. Eastern time). In the absence of a sale price or NOCP, such securities are valued at the mean of the last bid and the last asked
| 55 |
|
ISI Funds
|
Notes to Financial Statements (continued)
prices. Non-exchange traded securities for which quotations are readily available are generally valued at the mean between the last bid and the last asked prices. Debt securities may be valued at prices supplied by a Fund’s pricing agent based on broker or dealer supplied valuations or matrix pricing, a method of valuing securities by reference to the value of other securities with similar characteristics such as rating, interest rate, and maturity. Money market instruments that mature in 60 days or less may be valued at amortized cost unless the Fund’s investment advisor believes another valuation is more appropriate.
When valuing securities for which market quotations are not readily available or for which the market quotations that are readily available are considered unreliable, the Funds determine a fair value in good faith under procedures established by and under the general supervision of the Funds’ Boards of Directors (the “Board”). The Funds may use these procedures to establish the fair value of securities when, for example, a significant event occurs between the time the market closes and the calculation of the net asset value per share, and the event is likely to affect the Fund’s net asset value per share. Fair valuation may also be used for securities that are subject to legal or contractual restrictions on resale, securities for which no or limited trading activity has occurred for a period of time, or securities that are otherwise deemed to be illiquid (i.e., securities that cannot be disposed of within seven days at approximately the price at which the security is currently priced by the Funds).
If a fair value is required, the investment advisor, or the sub-advisor in the case of Strategy, determines the value of the security until the Board meets to establish the fair value of the security.
As of October 31, 2011, there were no fair valued securities.
Accounting principles generally accepted in the United States (“GAAP”) establish a single authoritative definition of fair value, set out a frame work for measuring fair value and require additional disclosures about fair value measurements.
Various inputs are used in determining the value of each Fund’s investments. These inputs are summarized in the three broad levels listed below:
Level 1 – quoted prices in active markets for identical securities
Level 2 – other significant observable inputs
Level 3 – significant unobservable inputs
The inputs or methodology used for valuing securities are not necessarily an indication of the risks associated with investing in those securities.
In May 2011, the Financial Accounting Standards Board (“FASB”) issued Accounting Standards Update (“ASU”) No. 2011-04 “Amendments to Achieve Common Fair Value Measurement and Disclosure Requirements in U.S. GAAP and International Financial Reporting Standards (“IFRSs”).” ASU 2011-04 includes common requirements for measurement of and disclosure about fair value between U.S. GAAP and IFRS. ASU
| 56 |
|
ISI Funds
|
Notes to Financial Statements (continued)
2011-04 will require reporting entities to make disclosures about amounts and reasons for all transfers in and out of Level 1 and Level 2 fair value measurements. In addition, ASU 2011-04 will require reporting entities to disclose the following information for fair value measurements categorized within Level 3 of the fair value hierarchy: quantitative information about the unobservable inputs used in the fair value measurement, the valuation processes used by the reporting entity and a narrative description of the sensitivity of the fair value measurement to changes in unobservable inputs and the interrelationships between those unobservable inputs. The new and revised disclosures are effective for interim and annual reporting periods beginning after December 15, 2011. Management is currently evaluating the implications of ASU No. 2011-04 and its impact on the financial statements.
The following is a summary of the inputs used to value each Fund’s investments as of October 31, 2011:
|
Total Return
|
||||||||||||||||
|
|
Level 1
|
Level 2
|
Level 3
|
Total
|
||||||||||||
|
US Treasury Obligations
|
$ | — | $ | 76,052,180 | $ | — | $ | 76,052,180 | ||||||||
|
Repurchase Agreements
|
— | 8,152,000 | — | 8,152,000 | ||||||||||||
|
Total
|
$ | — | $ | 84,204,180 | $ | — | $ | 84,204,180 | ||||||||
|
Managed Municipal
|
||||||||||||||||
|
|
Level 1
|
Level 2
|
Level 3
|
Total
|
||||||||||||
|
Municipal Bonds
|
$ | — | $ | 100,503,545 | $ | — | $ | 100,503,545 | ||||||||
|
US Treasury Obligations
|
— | 5,010,355 | — | 5,010,355 | ||||||||||||
|
Repurchase Agreements
|
— | 1,467,000 | — | 1,467,000 | ||||||||||||
|
Total
|
$ | — | $ | 106,980,900 | $ | — | $ | 106,980,900 | ||||||||
|
North American
|
||||||||||||||||
|
|
Level 1
|
Level 2
|
Level 3
|
Total
|
||||||||||||
|
Canadian Securities
|
$ | — | $ | 27,154,047 | $ | — | $ | 27,154,047 | ||||||||
|
Mexican Securities
|
— | 17,265,288 | — | 17,265,288 | ||||||||||||
|
US Treasury Obligations
|
— | 96,853,094 | — | 96,853,094 | ||||||||||||
|
Repurchase Agreements
|
— | 4,817,000 | — | 4,817,000 | ||||||||||||
|
Total
|
$ | — | $ | 146,089,429 | $ | — | $ | 146,089,429 | ||||||||
| 57 |
|
ISI Funds
|
Notes to Financial Statements (continued)
|
Strategy
|
||||||||||||||||
|
|
Level 1
|
Level 2
|
Level 3
|
Total
|
||||||||||||
|
Common Stocks
|
$ | 54,074,331 | $ | — | $ | — | $ | 54,074,331 | ||||||||
|
US Treasury Obligations
|
— | 2,950,860 | — | 2,950,860 | ||||||||||||
|
Repurchase Agreements
|
— | 284,000 | — | 284,000 | ||||||||||||
|
Total
|
$ | 54,074,331 | $ | 3,234,860 | $ | — | $ | 57,309,191 | ||||||||
See Strategy’s Schedule of Investments for a listing of the common stocks valued using Level 1 inputs by industry type.
The Funds’ policy is to disclose significant transfers between Levels based on valuations at the end of the reporting period. The Funds may hold securities which are periodically fair valued in accordance with the Funds’ Fair Value Procedures. This may result in movements between Level 1 and Level 2 throughout the period. There were no transfers between Level 1, 2, or 3 as of October 31, 2011, based on the valuation input Levels on October 31, 2011 for the Funds.
|
C.
|
Securities Transactions and Investment Income
|
Securities transactions are recorded on trade date. Realized gains and losses are determined by comparing the proceeds of a sale or the cost of a purchase with a specific offsetting transaction. Dividend income is recorded on the ex-dividend date. Interest income, including amortization of premiums and accretion of discounts, is accrued daily. Estimated expenses are also accrued daily. With respect to North American and Managed Municipal, income, gains (losses) and common expenses are allocated to each class based on its respective net assets. Class specific expenses are charged directly to each class.
|
D.
|
Distributions
|
Total Return declares distributions daily, and North American declares monthly distributions at fixed rates approved by the Board. These distributions are paid monthly. To the extent that a Fund’s net investment income is less than an approved fixed rate, some of its distributions may be designated as a return of capital. Managed Municipal declares and pays dividends monthly from its net investment income. Strategy declares and pays dividends quarterly from its net investment income. Net realized capital gains, if any, are distributed at least annually. The Funds record dividends and distributions on the ex-dividend date.
|
E.
|
Federal Income Taxes
|
Each Fund has a policy to qualify as a regulated investment company under subchapter M of the Internal Revenue Code. As provided therein in any fiscal year in which a Fund so qualifies and distributes at least 90% of its net taxable income, the Fund (but not its shareholders) will be relieved of Federal income tax on the income distributed. In
| 58 |
|
ISI Funds
|
Notes to Financial Statements (continued)
addition, by distributing in each calendar year substantially all of its net investment income and net realized capital gains, a Fund will not be subject to Federal excise taxes. Accordingly, no Federal income or excise taxes have been accrued.
|
F.
|
Foreign Currency Translation
|
The Funds maintain their accounting records in U.S. dollars. North American determines the U.S. dollar value of foreign currency-denominated assets, liabilities and transactions by using prevailing exchange rates. In valuing security transactions, the receipt of income and the payment of expenses, North American uses the prevailing exchange rate on the transaction date.
Net realized gains and losses on foreign currency transactions shown on North American’s financial statements result from the sale of foreign currencies, currency gains or losses realized between the trade and settlement dates on securities transactions, and from the difference between the amounts of interest recorded on North American’s books and the U.S. dollar equivalent of the amounts actually received or paid. That portion of realized gains (losses) from security transactions that results from fluctuation in foreign currency exchange rates relating to the sale of foreign securities is not separately disclosed but is included in net realized gains (losses) from security transactions. That portion of unrealized gains and losses on investments that results from fluctuations in foreign currency exchange rates is not separately disclosed but is included in the net change in unrealized appreciation/depreciation on investments.
|
G.
|
Forward Foreign Currency Contracts
|
North American may use forward foreign currency contracts to manage foreign exchange rate risk. The Fund may use these contracts to fix the U.S. dollar value of securities transactions for the period between the date of the transaction and the date the security is received or delivered or to hedge the U.S. dollar value of securities that it already owns. The use of forward foreign currency contracts does not eliminate fluctuations in the prices of the underlying securities, but does establish a rate of exchange that can be achieved in the future. North American determines the net U.S. dollar value of the forward foreign currency contracts using prevailing exchange rates.
|
H.
|
Repurchase Agreements
|
Each Fund may make short-term investments in repurchase agreements that are fully collateralized by U.S. government securities. Under the terms of a repurchase agreement, a financial institution sells U.S. government securities to a Fund and agrees to buy them back on a specified day in return for the principal amount of the original sale plus accrued interest. The custodial bank holds the collateral in a separate account until the agreement matures. If the value of the securities falls below the principal amount of the repurchase agreement plus accrued interest, the financial institution deposits additional collateral by the following business day. If the financial institution either fails to deposit the required
| 59 |
|
ISI Funds
|
Notes to Financial Statements (continued)
additional collateral or fails to repurchase the securities as agreed, a Fund has the right to sell the securities and recover any resulting loss from the financial institution. If the financial institution enters into bankruptcy, a Fund’s claim on the collateral may be subject to legal proceedings.
|
I.
|
Estimates
|
In preparing its financial statements in conformity with GAAP, management makes estimates and assumptions that affect the reported amounts of assets and liabilities and disclosure of contingent assets and liabilities at the date of the financial statements and the reported amounts of revenues and expenses during the period. Actual results may be different.
Note 2 – Fees and Transactions with Affiliates
International Strategy & Investment, Inc. (“ISI”) is the Funds’ investment advisor. As compensation for ISI’s advisory services, Total Return pays ISI an annual fee based on the Fund’s average daily net assets, which is calculated daily and paid monthly at the following annual rates: 0.20% of the first $100 million, 0.18% of the next $100 million, 0.16% of the next $100 million, 0.14% of the next $200 million and 0.12% of the amount over $500 million. In addition, Total Return pays ISI 1.50% of the Fund’s gross interest income. As compensation for ISI’s advisory services, Managed Municipal, North American and Strategy each pay ISI a fee, which is calculated daily and paid monthly, at the annual rate of 0.40% of such Fund’s average daily net assets.
ISI has contractually agreed to reimburse expenses with respect to Class C Shares of North American through February 29, 2012 to the extent necessary to limit the annual ordinary operating expenses of ISI Class C Shares to 1.85% of the average daily net assets attributable to such shares. During the year ended October 31, 2011, no expenses were reimbursed by ISI under the expense limitation agreement.
Los Angeles Capital Management and Equity Research, Inc. is Strategy’s Sub-Advisor and is responsible for managing the common stocks in Strategy’s portfolio. The Sub-Advisor is paid by ISI, not Strategy.
International Strategy & Investment Group, Inc. (“ISI Group”), an affiliate of ISI, is the distributor for the Funds. Total Return, Managed Municipal (ISI Class A Shares, only) and Strategy each pay ISI Group a distribution/shareholder service fee, pursuant to Rule 12b-1, that is calculated daily and paid monthly at the annual rate of 0.25% of average daily net assets. North American’s ISI Class A Shares and ISI Class C Shares pay ISI Group a distribution/shareholder service fee, pursuant to Rule 12b-1, that is calculated daily and paid monthly at the annual rates of 0.40% and 1.00% (which may include up to 0.25% for shareholder servicing fees for each class) of their average daily net assets, respectively.
| 60 |
|
ISI Funds
|
Notes to Financial Statements (continued)
During the year ended October 31, 2011, ISI Group earned commissions on sales of ISI Shares of Total Return, Managed Municipal and Strategy of $18,962, $6,862 and $23,435, respectively, and earned commissions of $8,109 on sales of ISI Class A Shares of North American. ISI Group retained $2,466 of contingent deferred sales charges on redemptions of ISI Class C Shares of North American during the year ended October 31, 2011.
State Street Bank and Trust Company (“State Street”) is the administrator of the Funds. State Street is responsible for providing certain administrative services to the Funds, and assists in managing and supervising all aspects of the general day-to-day business activities and operations of the Fund other than investment advisory activities, including maintaining the books and records of the Fund, and preparing certain reports and other documents required by federal and/or state laws and regulations. For the performance of these services, the Funds pay State Street an annual fee of $300,000. This fee is allocated among the Funds based on the relative net assets of each Fund.
State Street is the fund accountant and fund custodian, and State Street is responsible for safeguarding and controlling the Funds’ cash and securities, handling the delivery of securities and collecting interest and dividends on the Fund’s investments. State Street as fund accounting agent is responsible for maintaining the books and records and calculating the daily net asset value of the Fund. For Fund accounting services, the Funds pay State Street an annual base fee of $180,000. For Fund custodian services, the Funds pay State Street an annual base fee of 1 (one) basis point on net assets, plus other asset-based fees that vary according to the number of positions and transactions, plus out-of-pocket fees.
State Street also serves as transfer agent for the Funds and is responsible for the issuance, transfer and redemption of shares and the opening, maintenance and servicing of shareholder accounts. For these services State Street receives an annual amount of $65,000, allocated among the Funds based on the relative net assets of each Fund and a monthly fee from each Fund at an annual rate of $20 for each direct account and $15 for certain accounts established through financial intermediaries. In addition, the Funds reimburse State Street for its out-of-pocket expenses including, but not limited to, postage and supplies.
EJV Financial Services, LLC (“EJV”) provides certain compliance services to the Funds. Edward J. Veilleux, Vice President and Chief Compliance Officer (“CCO”) of the Funds, is also a principal of EJV. The Funds pay EJV $18,750 quarterly for providing CCO services. This fee is allocated among the Funds based on the relative net assets of each Fund. In addition, the Funds reimburse EJV for any reasonable out-of-pocket expenses relating to these compliance services.
The Funds pay each independent Director an annual fee of $15,000. The Audit Committee Chairman and Chairman of the Board receive an additional annual fee of
| 61 |
|
ISI Funds
|
Notes to Financial Statements (continued)
$2,000 and $4,000, respectively. In addition, each independent Director receives $1,000 for each Board meeting attended. The Funds also reimburse each of the Directors for out-of-pocket expenses incurred in connection with attending the Board of Directors’ meetings. Certain officers of the Funds are also officers or employees of the above named service providers, and during their terms of office, receive no compensation from the Funds.
Note 3 – Federal Income Tax
The Funds may periodically make reclassifications among certain capital accounts as a result of differences in the characterization and allocation of certain income and capital gain distributions determined annually in accordance with Federal tax regulations, which may differ from GAAP. These book/tax differences may be either temporary or permanent in nature. To the extent they are permanent, they are charged or credited to paid-in-capital, undistributed net investment income or accumulated net realized gains, as appropriate, in the period that the differences arose. The reclassifications have no impact on the net assets or net asset value per share of the Funds.
The Funds determine their net investment income and capital gain distributions in accordance with income tax regulations, which may differ from GAAP.
During the years ended October 31, 2011 and October 31, 2010, the tax character of distributions paid by each of the Funds was as follows:
|
Ordinary
Income
|
Tax-Exempt
Income
|
Long-Term
Capital Gains
|
||||||||||||||||||||||
|
October 31, 2011
|
October 31, 2010
|
October 31, 2011
|
October 31, 2010
|
October 31, 2011
|
October 31, 2010
|
|||||||||||||||||||
|
Total Return
|
$ | 1,683,591 | * | $ | 3,775,835 | $ | — | $ | — | $ | 1,949 | $ | 3,373,923 | |||||||||||
|
Managed Municipal
|
147,216 | 25,543 | 2,802,639 | 3,053,007 | 594,262 | 345,235 | ||||||||||||||||||
|
North American
|
3,976,050 | * | 5,420,092 | — | — | 5,741 | 1,838,648 | |||||||||||||||||
|
Strategy
|
707,064 | 809,407 | — | — | — | — | ||||||||||||||||||
|
*
|
A portion of the ordinary income is short-term gains that are taxed as ordinary income for tax purposes.
|
The Funds recognize the tax benefits or expenses of uncertain tax positions only when the position is “more likely than not” to be sustained assuming examination by tax authorities. Management has reviewed each Fund’s tax positions taken on Federal and state income tax returns for all open tax years (tax years ended October 31, 2008 through October 31, 2011) and concluded that no provision for unrecognized tax benefits or expenses is required in these financial statements.
As of October 31, 2011, the components of distributable earnings (accumulated deficit) on a tax basis were as follows:
| 62 |
|
ISI Funds
|
Notes to Financial Statements (continued)
|
Total
Return
|
Managed
Municipal
|
North
American
|
Strategy
|
|||||||||||||
|
Undistributed ordinary income
|
$ | 259,329 | $ | 765 | $ | 149,493 | $ | 45,386 | ||||||||
|
Undistributed tax-exempt income
|
— | 112,141 | — | — | ||||||||||||
|
Accumulated undistributed
long-term capital gains |
1,046,872 | — | 278,187 | — | ||||||||||||
|
Capital loss carryforwards
|
— | (41,257 | ) | — | (3,372,174 | ) | ||||||||||
|
Net unrealized appreciation
(depreciation) |
5,059,179 | 4,610,103 | 6,384,028 | 8,891,965 | ||||||||||||
|
Other temporary differences
|
(39,558 | ) | (112,216 | ) | (124,437 | ) | — | |||||||||
|
Total
|
$ | 6,325,822 | $ | 4,569,536 | $ | 6,687,271 | $ | 5,565,177 | ||||||||
As of October 31, 2011, the Funds recorded the following reclassifications primarily due to foreign exchange gains/losses, passive foreign investment company losses, REIT adjustments to increase (decrease) the accounts listed below:
|
Fund
|
Undistributed Net Investment Income/(Loss)
|
Accumulated Net Realized Gain/(Loss)
|
Paid-in Capital
|
|||||||||
|
Total Return US Treasury Fund
|
$ | — | $ | — | $ | — | ||||||
|
Managed Municipal Fund
|
— | — | — | |||||||||
|
North American Government Bond Fund
|
144,921 | (144,921 | ) | — | ||||||||
|
ISI Strategy Fund
|
35,863 | (35,863 | ) | — | ||||||||
As of October 31, 2011, Managed Municipal had $41,257 capital loss carryforwards which expires October 31, 2018, and Strategy had capital loss carryforwards of $3,372,174, of which $2,846,434 expires October 31, 2017, and $525,740 expires October 31, 2018. These capital loss carryforwards may be utilized in the current and future years to offset net realized capital gains, if any, prior to distributing such gains to shareholders.
The difference between the federal income tax cost of portfolio investments and the financial statement cost for Strategy is due to certain timing differences in the recognition of capital gains or losses under income tax reporting regulations and GAAP. These “book/tax” differences are temporary in nature and are primarily due to the tax deferral of losses on wash sales.
| 63 |
|
ISI Funds
|
Notes to Financial Statements (continued)
Note 4 – Investment Transactions
The aggregate cost of purchases and proceeds from sales of investments, other than short-term obligations, for the year ended October 31, 2011 were as follows:
|
|
Non-US Government Obligations
|
US Government Obligations
|
||||||||||||||
|
|
Purchases
|
Sales
|
Purchases
|
Sales
|
||||||||||||
|
Total Return
|
$ | — | $ | — | $ | 38,086,859 | $ | 53,301,789 | ||||||||
|
Managed Municipal
|
11,594,883 | 10,069,861 | 5,013,477 | -- | ||||||||||||
|
North American
|
9,465,343 | 11,817,763 | 55,797,457 | 64,874,750 | ||||||||||||
|
Strategy
|
29,702,762 | 25,918,500 | 800,625 | 4,816,641 | ||||||||||||
Note 5 – Market and Credit Risk
North American invests in Canadian and Mexican government securities. Investing in Canadian and Mexican government securities may have different risks than investing in U.S. government securities. An investment in Canada or Mexico may be affected by developments unique to those countries. These developments may not affect the U.S. economy or the prices of U.S. government securities in the same manner. In addition, the value of bonds issued by non-U.S. governments may be affected by adverse international political and economic developments that may not impact the value of U.S. government securities.
Note 6 – Contractual Obligations
In the ordinary course of business, the Funds enter into contracts that contain a variety of indemnifications. Each Fund’s maximum exposure under these arrangements is unknown. However, the Funds have not had prior claims or losses pursuant to these indemnification provisions and believe the risk of loss thereunder to be remote.
Note 7 – Subsequent Events
GAAP requires the Funds to recognize in the financial statements the effects of all subsequent events that provide additional evidence about conditions that existed as of the date of the Statements of Assets and Liabilities. For non-recognized subsequent events that must be disclosed to keep the financial statements from being misleading, the Funds are required to disclose the nature of the event as well as an estimate of its financial effect, or a statement that such an estimate cannot be made. Management has evaluated subsequent events through the issuance of these financial statements and has determined no disclosure is necessary other than is noted below.
On November 30, 2011, North American Class A Shares, Class C Shares, and Class I Shares, Managed Municipal Class A Shares and Class I Shares, and Total Return ISI Shares paid a distribution of $0.016, $0.013, $0.018, $0.0242, $0.0264, and $0.015, respectively, per share in net investment income related to the period ended November 30, 2011.
| 64 |
|
Report of Independent Registered Public Accounting Firm
|
To the Board of Directors and
Shareholders of Total Return U.S. Treasury Fund, Inc.,
Managed Municipal Fund, Inc., North American Government Bond Fund, Inc.,
and ISI Strategy Fund, Inc.
We have audited the accompanying statements of assets and liabilities of the Total Return U.S. Treasury Fund, Inc., Managed Municipal Fund, Inc., North American Government Bond Fund, Inc., and ISI Strategy Fund, Inc., (the “Funds”) including the schedules of investments, as of October 31, 2011, and the related statements of operations for the year then ended, the statements of changes in net assets for each of the two years in the period then ended, and the financial highlights for each of the five years or periods in the period then ended. These financial statements and financial highlights are the responsibility of the Funds’ management. Our responsibility is to express an opinion on these financial statements and financial highlights based on our audits.
We conducted our audits in accordance with the standards of the Public Company Accounting Oversight Board (United States). Those standards require that we plan and perform the audits to obtain reasonable assurance about whether the financial statements and financial highlights are free of material misstatement. An audit includes examining, on a test basis, evidence supporting the amounts and disclosures in the financial statements. Our procedures included confirmation of securities owned as of October 31, 2011 by correspondence with the custodian and brokers. An audit also includes assessing the accounting principles used and significant estimates made by management, as well as evaluating the overall financial statement presentation. We believe that our audits provide a reasonable basis for our opinion.
In our opinion, the financial statements and financial highlights referred to above present fairly, in all material respects, the financial position of the Total Return U.S. Treasury Fund, Inc., Managed Municipal Fund, Inc., North American Government Bond Fund, Inc., and ISI Strategy Fund, Inc., as of October 31, 2011, the results of their operations for the year then ended, the changes in their net assets for each of the two years in the period then ended, and their financial highlights for each of the five years or periods in the period then ended, in conformity with accounting principles generally accepted in the United States of America.
 |
|
| BBD, LLP |
Philadelphia, Pennsylvania
December 22, 2011
| 65 |
|
Fund Directors and Officers (Unaudited)
|
|
Name and Age
|
Length of
Time Served
|
Business Experience During
the Past Five Years
|
Other
Directorships
Held By Director
|
|
Independent Directors
|
|||
|
W. Murray Jacques
(age 75)
|
since 2002
|
President, WMJ Consulting, LLC (real estate investment management company) (1999 to present); formerly, Principal of CM Coastal Development, LLC (real estate development) (2002 to 2006).
|
None
|
|
Louis E. Levy
(age 79)
|
since 1994
|
Retired Partner, KPMG Peat Marwick (retired 1990); Scudder Group of Mutual Funds (retired 2005).
|
None
|
|
Edward A. Kuczmarski
(age 62)
|
since 2007
|
Certified Public Accountant and Partner of Crowe Horwath LLP (accounting firm) (1980 to present).
|
Board Member of Reich & Tang Funds; Board Member of Brookfield Investment Management Funds; Trustee of Empire Builder Tax Free Bond Fund.
|
|
Interested Director
|
|||
|
R. Alan Medaugh*
(age 68)
President and
Director
|
President
since 1991;
Director
since 2007
|
President, International Strategy & Investment, Inc. (registered investment advisor) (1991 to present). Director, International Strategy & Investment Group, Inc. (registered broker-dealer) (1991 to present).
|
None
|
|
*
|
Mr. Medaugh is deemed to be an Interested Director, as defined in the Investment Company Act of 1940, because he is President of ISI and a Director of ISI Group.
|
| 66 |
|
Fund Directors and Officers (Unaudited) (continued)
|
|
Name and Age
|
Length of
Time Served
|
Business Experience During
the Past Five Years
|
|
Executive Officers
|
||
|
Nancy Lazar
(age 54)
Vice President
|
since 1997
|
Executive Vice President, Assistant Treasurer, and Secretary of International Strategy & Investment, Inc. (registered investment advisor) (1991 to present); Executive Vice President, Assistant Treasurer and Secretary of International Strategy & Investment Group, Inc. (registered broker-dealer) (1991 to present).
|
|
Thomas D. Stevens*
(age 62)
Vice President
|
since 1997
|
Chairman and President, Los Angeles Capital Management and Equity Research, Inc. (registered investment advisor) (March 2002 to present).
|
|
Carrie L. Butler
(age 44)
Vice President
|
since 1991
|
Managing Director, International Strategy & Investment, Inc. (registered investment advisor) (2000 to present).
|
|
Edward J. Veilleux
(age 68)
Vice President and
Chief Compliance
Officer
|
Vice President since 1992; Chief Compliance Officer since 2008
|
President, EJV Financial Services, LLC (2002 to present); Officer of various investment companies for which EJV Financial Services provides consulting and compliance services.
|
|
Stephen V. Killorin
(age 58)
Chief Financial Officer,
Treasurer and
Vice President
|
Vice President since 2002; Chief Financial Officer since 2005; and Treasurer 2005 to 2008 and August 2010 to present
|
Executive Managing Director and Chief Financial Officer of International Strategy & Investment, Inc. (registered investment advisor) (2000 to present); Executive Managing Director and Chief Financial Officer of International Strategy & Investment Group, Inc. (registered broker-dealer) (2000 to present); Vice President of the Funds since 2002; Treasurer of the Funds (2005 to 2008 and August 2010 to present); Chief Financial Officer of the Funds since 2005; formerly, Chief Compliance Officer of the Funds (until April 2008).
|
|
Margaret M. Beeler
(age 44)
Vice President and
Secretary
|
Vice President since 1996; Secretary since 2004
|
Managing Director, International Strategy & Investment, Inc. (registered investment advisor) (July 2004 to present).
|
|
William Cox
(age 44)
Assistant Treasurer
State Street Bank and
Trust Company
4 Copley Place, 5th floor
Boston, MA 02116
|
since 2010
|
Vice President and Department Head, Fund Administration Division, State Street Bank and Trust Company (2003 to present) and officer of various investment companies for which State Street provides mutual fund administrative services.
|
|
*
|
Thomas D. Stevens is an officer for only the ISI Strategy Fund.
|
| 67 |
|
Fund Directors and Officers (Unaudited) (continued)
|
|
Name and Age
|
Length of
Time Served
|
Business Experience During
the Past Five Years
|
|
Executive Officers (Continued)
|
||
|
David James
(age 40)
Assistant Secretary
State Street Bank and
Trust Company
4 Copley Place, 5th floor
Boston, MA 02116
|
since 2010
|
Vice President and Managing Counsel, State Street Bank and Trust Company (fund administrator, transfer agent and custodian) (2009 to present); Vice President and Counsel, PNC Global Investment Servicing (US), Inc. (2006 to 2009); Assistant Vice President and Counsel, State Street Bank and Trust Company, October 2000 to December 2004 and was retired in 2005; and officer of various investment companies for which State Street provides mutual fund administrative services.
|
|
Eun An
(age 35)
Assistant Secretary
State Street Bank and
Trust Company
4 Copley Place, 5th floor
Boston, MA 02116
|
since 2011
|
Assistant Counsel and Assistant Vice President, State Street Bank and Trust Company (2008 to present).
|
|
Heena Dhruv
(age 35)
Assistant Vice President
|
since 2005
|
Managing Director, International Strategy & Investment, Inc. (registered investment advisor) (2005 to present); formerly, Associate Managing Director, International Strategy & Investment, Inc. (January 2003 to July 2005).
|
Directors and officers of the Funds are also directors and officers of all of the other investment companies in the ISI Fund Complex advised by International Strategy & Investment, Inc. (“ISI” or the “Advisor”) or its affiliates. There are currently four funds in the ISI Family of Funds (the “ISI Fund Complex”). Each of the above named persons serves in the capacity noted above for each fund in the ISI Fund Complex.
| 68 |
|
Notice to Shareholders (Unaudited)
|
Federal Tax Information
Certain tax information for the Fund is required to be provided to shareholders based on the Fund’s income and distributions for the taxable year ended October 31, 2011. The amounts shown may differ from those elsewhere in this report due to differences between tax and financial reporting requirements. In January 2012, shareholders will receive Form 1099-DIV which will include their share of qualified dividends, and capital gains distributed during the calendar year 2011. Shareholders are advised to check with their tax advisors for information on the treatment of these amounts on their individual income tax returns.
The Strategy Fund designated 100% of ordinary income dividends as income qualifying for dividends received deduction for the fiscal year ended October 31, 2011.
Strategy Fund designates $1,009,418 of the dividends received by the Fund as qualified dividend income.
Total Return, Managed Municipal, and North America Fund designate $1,949, $594,262 and $5,741 respectively for long term capital gains, for the fiscal year ended October 31, 2011.
Managed Municipal designates 95.01% of distributions paid from ordinary income as tax exempt income.
Proxy Voting Policies and Procedures
A description of the policies and procedures that Strategy uses to determine how to vote proxies relating to securities held in Strategy’s portfolio is available, without charge and upon request, by calling (800) 955-7175. Information regarding how Strategy voted proxies relating to portfolio securities during the most recent twelve-month period ended June 30 is available, without charge, upon request, by calling (800) 955-7175 or on the SEC’s website at http://www.sec.gov.
Availability of Quarterly Portfolio Schedule
The Funds file their complete schedule of portfolio holdings with the SEC for the first and third quarters of each fiscal year on Form N-Q. Each Fund’s Form N-Q is available on the SEC’s website at http://www.sec.gov or may be reviewed and copied at the SEC’s Public Reference Room in Washington, DC. Information on the operation of the Public Reference Room may be obtained by calling (800) SEC-0330.
Privacy Notice for ISI Mutual Funds
Privacy Policy
The mutual funds in the ISI Fund Complex believe that your privacy is extremely important. We are firmly committed to protecting any personal or financial information you provide to us as well as information about your transactions with us, such as transaction amounts, account balance and account holdings (“Personal Information”).
| 69 |
|
Notice to Shareholders (Unaudited) (continued)
|
We use Personal Information only to develop and deliver products and services thatyou request and to fulfill any applicable legal and regulatory requirements. We do not disclose Personal Information about you or our former customers except to our affiliates and service providers. We require our employees, affiliates and service providers to maintain appropriate safeguards to ensure the security of your non-public information.
Limits of Use of Personal Information
We limit the use, collection and retention of customer information to what is necessary to provide personal financial services and related products. We have security practices and procedures in place to ensure the confidentiality and security of your Personal Information.
Accuracy of Personal Information
We strive to keep your personal and financial information accurate. If our records are incorrect or out-of-date, please notify us immediately by contacting the Service Center listed on your account statement.
Change to Our Policies
If you have any privacy or security questions, please contact us at (800) 882-8585. We may, at our discretion, change this Privacy Policy at any time. If we make material changes to the policy, we will provide you with notice of these changes.
| 70 |
|
Investment Advisory Agreement Approval (Unaudited)
|
At the Board meeting held on September 22, 2011, each Board, including the Independent Directors voting separately, unanimously approved the continuance of the Investment Advisory Agreement between ISI and each of the Funds as well as the Sub-Advisory Agreement between ISI and the Sub-Advisor with respect to Strategy. The Independent Directors had previously met with their counsel in executive session to consider the Agreements. In evaluating the Investment Advisory Agreements and the Sub-Advisory Agreement, each Board reviewed materials furnished by ISI and the Sub-Advisor. Specifically, each Board considered: (1) the nature, extent and quality of the services provided to the Funds by ISI and the Sub-Advisor, including information on the investment performance of the Funds; (2) the total expense ratio of each Fund compared to its relevant peer group; (3) the investment advisory fee schedule for each Fund; (4) the cost of the services provided and profitability to ISI and the Sub-Advisor with respect to their relationship with the Fund(s); (5) the extent to which economies of scale would be realized as each Fund grows and whether the advisory fees reflect these economies of scale for the benefit of shareholders of each Fund; and (6) other benefits received by ISI and the Sub-Advisor from their relationship with the Funds. In their deliberations, the Boards did not identify any particular information that was all-important or controlling, and the Boards attributed different weights to the various factors. In particular, each Board focused on the factors discussed below.
NATURE, EXTENT AND QUALITY OF SERVICES. The Directors reviewed information provided by ISI which included statistics on each Fund’s performance, the performance of its peers, its portfolio structure and purchase and sales activity. Each Board noted that senior management of ISI provides each Board, on a quarterly basis, detailed information about its management approach with respect to each Fund, recent economic statistics and reports and its general economic outlook. With respect to Strategy, the Fund’s Board noted that, under the Sub-Advisory Agreement, the Sub-Advisor manages the equity portfolio of Strategy and the Sub-Advisor had presented the Board with detailed information about its operations and investment process. The Board of Directors of Strategy also considered the background and quality of the investment management team of ISI and the Sub-Advisor.
|
|
•
|
Total Return. The Board reviewed the investment objective of the Fund and the information comparing the Fund’s performance to the returns of relevant indices for selected periods ended July 29, 2011. The Board noted that the Fund returned 2.92% during the one-year period ended July 29, 2011, underperforming the Barclays U.S. Treasury Total Return Index, which returned 3.39%, and the CDA/Lipper U.S. Treasury Funds Average, which returned 4.49%, during the same period. The Board indicated that the Fund’s benchmark index and peer groups, including the Morningstar Intermediate Government Average, do not provide a precise comparison because the Fund’s composition differs from the benchmark and its peer groups. The Board compared the Fund’s returns against its benchmark and peer groups over longer-term periods and concluded that the results achieved by the Fund demonstrated a consistent pattern of favorable performance.
|
| 71 |
|
Investment Advisory Agreement Approval (Unaudited)
(continued)
|
|
|
•
|
Managed Municipal. The Board reviewed the investment objective of the Fund and the Fund’s performance for selected periods ended July 29, 2011. The Board noted that the Fund returned 1.61% during the one-year period ended July 29, 2011, underperforming the Barclays AAA High Quality Index, which returned 2.52%, and the CDA/Lipper General Municipal Debt Funds Average, which returned 2.42%, during the same period. The Board indicated that the Fund’s benchmark index and peer groups, including the Morningstar Municipal National Intermediate Average, do not provide a precise comparison because the Fund’s composition differs from the benchmark and its peer groups. The Board noted that the Fund’s benchmark was more heavily weighted in intermediate-term bonds than the Fund. The Board also took into consideration the high credit qualities of the portfolio securities held by the Fund, which invests exclusively in high quality municipal securities bonds. The Board compared the Fund’s returns against its benchmark and peer groups over longer-term periods and concluded that the Fund’s performance was in line with expectations, particularly given the tumultuous macroeconomic environment.
|
|
|
•
|
North American. The Board reviewed the investment objective of the Fund and the Fund’s performance for selected periods ended July 29, 2011. The Board noted that the Fund returned 5.32% during the one-year period ended July 29. 2011, underperforming the blended North American Index which returned 6.15%, but outperformed the CDA/Lipper U.S. Government Funds Average, which returned 3.53%, during the same period. The Board indicated that the Fund’s blended benchmark index and peer groups, including the Morningstar Intermediate Term Bond Average, do not provide a precise comparison because the Fund’s composition differs from the blended benchmark and its peer groups, noting in particular that the peer groups is limited to U.S. Government securities, whereas the Fund invests in a much more diverse universe of North American government bonds. The Board also took into consideration the high credit qualities of the portfolio securities held by the Fund. The Board compared the Fund’s returns against its benchmark and peer groups over longer-term periods and concluded that the Fund’s performance was in line with expectations, particularly given the tumultuous macroeconomic environment.
|
|
|
•
|
Strategy. The Board reviewed the investment objective of the Fund and the Fund’s performance for selected periods ended July 29, 2011. The Board noted that the Fund returned 15.58% during the one-year period ended July 29, 2011, underperforming the blended 80% Wilshire 5000/20% Barclays Treasury Index, which returned 17.17%, but outperformed the CDA/Lipper Flexible Portfolio Funds Average, which returned 14.11%, during the same period. The Board indicated that the Fund’s blended benchmark index and peer groups, including the Morningstar Large Blend Average, do not provide a precise comparison because the Fund’s composition differs from the blended benchmark and its peer groups. The Board took into consideration the high credit qualities of the portfolio securities held by the Fund
|
| 72 |
|
Investment Advisory Agreement Approval (Unaudited)
(continued)
|
|
|
and the Fund’s 90% exposure to equities, compared to the blended index’s 80% exposure. The Board compared the Fund’s returns against its benchmark and peer groups over longer-term periods and concluded that Fund’s performance was in line with expectations, particularly given the tumultuous macroeconomic environment.
|
Each Board considered the short-term and long-term performance information for the Funds as compared to their respective benchmark indices. Each Board determined that ISI and the Sub-Advisor have demonstrated consistency in their investment approach and each provides an extensive array of ancillary services to the Funds in the areas of oversight and administration. Based upon the above information, each Board concluded that it was satisfied with the nature, extent and quality of services provided to the Funds by ISI and the Sub-Advisor.
INVESTMENT ADVISORY FEE SCHEDULES FOR EACH FUND. Each Board considered the investment advisory fees paid by each Fund to ISI. The Board of Directors of Strategy noted that the sub-advisory fee for Strategy is paid by ISI and not the Fund. Each Board concluded that the fee schedules under the Investment Advisory Agreements provide fair compensation to ISI in light of the nature, extent and quality of the services being provided to each of the Funds and the performance of each of the Funds.
COSTS OF SERVICES PROVIDED AND PROFITABILITY. Each Board reviewed the costs associated with ISI’s portfolio management, research and corporate governance and considered the profitability of ISI from the advisory and ancillary services provided to each of the Funds. Each Board was advised by ISI of the methodology it used to assign its costs associated with the portfolio management, research and corporate governance services provided to each of the Funds. The Board of Directors of Strategy was also provided with a report from the Sub-Advisor showing its profitability with respect to its management of Strategy and the methodology used by the Sub-Advisor to prepare its profitability analysis.
Each Board first discussed ISI’s business operations, including its institutional line of business, which encompasses portfolio management responsibilities for a series of off-shore funds. Each Board compared the advisory fees from these two businesses and noted that the asset-based fees for the institutional line are generally higher, as they may include a performance-based fee structure. Having discussed with ISI’s representatives the methodologies used in computing the costs that formed the bases of the profitability calculations, each Board concluded that these methodologies were reasonable and turned to the data provided. After discussion and analysis each Board concluded that, to the extent that ISI’s relationship with each Fund had been profitable during the period for which information had been provided, that the profitability ISI derived from the relationship was vital towards retaining qualified investment professionals and administrative personnel necessary for the Funds’ portfolio management, compliance and operational processes and it was fair and reasonable.
EXPENSE RATIOS AND ECONOMIES OF SCALE. Each Board discussed economy of scale considerations and the expense ratios of the Funds. The Boards of Directors of Managed Municipal, North American and Strategy noted that the investment advisory
| 73 |
|
Investment Advisory Agreement Approval (Unaudited)
(continued)
|
fees for their respective Funds do not contain breakpoints and considered the extent to which economies of scale would be realized as the Funds grow. The Board also reviewed information which compared each Fund’s expense ratio as of July 29, 2011 with the average of comparably managed funds and made the following determinations:
|
|
•
|
Total Return. The Board found the Fund’s total expense ratio of 0.85% was below the average total expense ratio of comparably managed funds, which was 0.93%.
|
|
|
•
|
Managed Municipal. The Board found the Fund’s total expense ratio of 0.99% was slightly above the average total expense ratio of comparably managed funds, which was 0.92%. The Board noted that the total net assets of the Fund ($106 million) was well below the size of the average comparably managed fund ($316 million).
|
|
|
•
|
North American. The Board found the Fund’s total expense ratio of 1.18% was slightly above the average total expense ratio of other government bond funds, which was 1.07%. The Board noted that the total net assets of the Fund ($145 million) is also slightly smaller than the size of the average other government bond fund ($160 million). The Board concluded that because no other mutual fund shares the Fund’s focus of investing exclusively in a diversified portfolio of North American government bonds, at this time, the total expense ratios of other government bond funds do not provide the appropriate counterpoints for comparative purposes.
|
|
|
•
|
Strategy. The Board found that Fund’s total expense ratio of 1.04% was below the average total expense ratio of comparably managed funds, which was 1.19%. The Board noted that the total net assets of the Fund ($63 million) were well below the size of the average comparably managed fund ($194 million).
|
OTHER BENEFITS REVIEWED. Each Board considered the fact that ISI Group, an affiliate of ISI, serves as the distributor of each of the Funds. Each Board reviewed the costs and profitability of ISI Group in rendering distribution services to each of the Funds and noted that ISI Group operates at a loss with respect to distribution services provided to the Funds. Each Board also considered other benefits received by ISI from its relationship with the Funds. Each Board compared the fees charged to each Fund against the fees charged to institutional clients of ISI. Each Board considered the investment management, compliance and administrative services ISI provided to each of the Funds, including its supervisory responsibilities with respect to the selection and oversight of the Sub-Advisor for Strategy. Each Board noted that ISI benefits from the shared costs of its two primary lines of business, but that ISI’s profit margins are considerably higher for its institutional line of business than from its mutual fund business. The Board of Directors of Strategy considered the benefits received by the Sub-Advisor from its relationship with Strategy and concluded that the Sub-Advisor’s profitability from its relationship with Strategy (including fall-out benefits) was fair and reasonable.
| 74 |
THIS PAGE INTENTIONALLY LEFT BLANK.
THIS PAGE INTENTIONALLY LEFT BLANK.
THIS PAGE INTENTIONALLY LEFT BLANK.
 |
|||||
| Louis E. Levy
Chairman
|
Edward J. Veilleux
Vice President
Chief Compliance Officer
|
||||
| W. Murray Jacques
Director
|
Thomas D. Stevens*
Vice President
|
||||
|
Edward A. Kuczmarski
Director
|
Stephen V. Killorin
Vice President
Treasurer
|
||||
|
R. Alan Medaugh
President
Director
|
Margaret M. Beeler
Vice President
Secretary
|
||||
|
Nancy Lazar
Vice President
|
Edward S. Hyman
Senior Economic Advisor
|
||||
|
Carrie L. Butler
Vice President
|
* |
Thomas D. Stevens is an officer
for only the ISI Strategy Fund.
|
|||
| Investment Advisor | |||||
|
ISI, Inc.
40 West 57th Street, 18th Floor
New York, NY 10019
(800) 955-7175
|
|||||
| Shareholder Servicing Agent | |||||
|
State Street Bank & Trust Company
One Lincoln Street
Boston, MA 02111
|
|||||
| Distributor | |||||
|
ISI Group, Inc.
40 West 57th Street, 18th Floor
New York, NY 10019
(800) 955-7175
|
|||||
|
Item 2.
|
Code of Ethics.
|
As of the end of the period covered by this report, the registrant has adopted a code of ethics that applies to the registrant’s principal executive officer, principal financial officer, principal accounting officer or controller, or persons performing similar functions, regardless of whether these individuals are employed by the registrant or a third party. Pursuant to Item 12(a)(1), a copy of registrant’s code of ethics is filed as an exhibit to this Form N-CSR. During the period covered by this report, the code of ethics has not been amended, and the registrant has not granted any waivers, including implicit waivers, from the provisions of the code of ethics.
|
Item 3.
|
Audit Committee Financial Expert.
|
The registrant’s board of directors has determined that the registrant has at least one audit committee financial expert serving on its audit committee. The name of the audit committee financial expert is Edward A. Kuczmarski. Mr. Kuczmarski is “independent” for purposes of this Item as that term is defined in Item 3(a)(2) of Form N-CSR.
An “audit committee financial expert” is not an “expert” for any purpose, including for purposes of Section 11 of the Securities Act of 1933, as a result of being designated as an “audit committee financial expert.” Further, the designation of a person as an “audit committee financial expert” does not mean that the person has any greater duties, obligations, or liability than those imposed on the person without the “audit committee financial expert” designation. Similarly, the designation of a person as an “audit committee financial expert” does not affect the duties, obligations, or liability of any other member of the Audit Committee or Board of Directors.
|
Item 4.
|
Principal Accountant Fees and Services.
|
|
|
(a)
|
Audit Fees. The aggregate fees billed for professional services rendered by BBD, LLP, the Fund’s principal accountant for the audit of the registrant’s annual financial statements or for services that are normally provided by BBD, LLP in connection with the Fund’s statutory and regulatory filings or engagements were $20,500 and $20,500 with respect to the registrant’s fiscal years ended October 31, 2011 and 2010, respectively.
|
|
|
(b)
|
Audit-Related Fees. No fees were billed in either of the last two fiscal years for assurance and related services by the principal accountant that are reasonably related to the performance of the audit of the registrant’s financial statements and are not reported under paragraph (a) of this Item.
|
|
|
(c)
|
Tax Fees. The aggregate fees billed for professional services rendered by the principal accountant for tax compliance, tax advice, and tax planning were $2,000 and $2,000 with respect to the registrant’s fiscal years ended October 31, 2011 and 2010, respectively. The services comprising these fees are the preparation of the registrant’s federal income and excise tax returns.
|
|
|
(d)
|
All Other Fees. No fees were billed in either of the last two fiscal years for products and services provided by the principal accountant to the registrant, other than the services reported in paragraphs (a) through (c) of this Item.
|
|
|
No fees were billed in either of the last two fiscal years] for products and services provided by the principal accountant to International Strategy & Investment Inc., (the “Adviser”) and any entity controlling, controlled by, or under common control with the Adviser that provides ongoing services to the registrant that (i) relate directly to the operations and financial reporting of the registrant and (ii) were pre-approved by the registrant’s audit committee.
|
|
|
(e)(1)
|
Audit Committee Pre-Approval Policies and Procedures. The Committee, pursuant to the Audit Committee Charter, may delegate to one or more of its members authority to pre-approve permissible non-audit services to be provided to the Registrant. Any pre-approval determination of a delegate shall be presented to the full Committee at its next meeting. The Committee shall similarly pre-approve in advance any audit, review or attest engagements required under the securities laws. Pre-approval shall be granted no earlier than one year prior to the commencement of the service.
|
|
|
(e)(2)
|
Percentages of Services. None of the services described in paragraph (b) through (d) of this Item were approved by the audit committee pursuant to paragraph (c)(7)(i)(C) of Rule 2-01 of Regulation S-X.
|
|
|
(f)
|
0% of hours expended on the principal accountant’s engagement to audit the registrant’s financial statements for the most recent fiscal year were attributed to work performed by persons other than the principal accountant’s full-time, permanent employees.
|
|
|
(g)
|
Total Fees Paid By Adviser and Certain Affiliates. During the fiscal years ended October 31, 2011 and 2010, aggregate non-audit fees of $0 and $0, respectively, were billed by the registrant’s accountant for services rendered to the registrant. No non-audit fees were billed in either of the last two fiscal years by the registrant’s accountant for services rendered to the registrant’s investment adviser (not including any sub-adviser whose role is primarily portfolio management and is subcontracted with or overseen by another investment adviser), and any entity controlling, controlled by, or under common control with the adviser that provides ongoing services to the registrant.
|
|
|
(h)
|
The principal accountant has not provided any non-audit services that were not previously approved to the registrant’s investment adviser (not including any sub-adviser whose role is primarily portfolio management and is subcontracted with or overseen by another investment adviser), and any entity controlling, controlled by, or under common control with the investment adviser that provides ongoing services to the registrant.
|
|
Item 5.
|
Audit Committee of Listed Registrants.
|
Not applicable
|
Item 6.
|
Schedule of Investments.
|
|
|
(a)
|
Schedule of Investments is included as part of Item 1 of this Form N-CSR.
|
|
|
(b)
|
Not applicable
|
|
Item 7.
|
Disclosure of Proxy Voting Policies and Procedures for Closed-End Management Investment Companies.
|
Not applicable to the registrant.
|
Item 8.
|
Portfolio Managers of Closed-End Management Investment Companies.
|
Not applicable to the registrant.
|
Item 9.
|
Purchases of Equity Securities by Closed-End Management Investment Company and Affiliated Purchasers.
|
Not applicable to the registrant.
|
Item 10.
|
Submission of Matters to a Vote of Security Holders.
|
The registrant has not adopted procedures by which shareholders may recommend nominees to the registrant’s board of directors.
|
Item 11.
|
Controls and Procedures.
|
(a) Based on their evaluation of the registrant’s disclosure controls and procedures (as defined in Rule 30a-3(c) under the Investment Company Act of 1940, as amended (the “1940 Act”)), the registrant’s principal executive officer and principal financial officer have concluded that such disclosure controls and procedures are reasonably designed and are operating effectively to provide reasonable assurance that material information relating to the registrant, including its consolidated subsidiaries, is made known to them by others within those entities, particularly during the period in which this report is being prepared, and that the information required to be disclosed by the registrant on Form N-CSR is recorded, processed, summarized, and reported as of a date within 90 days of the filing date of this report, that includes the disclosure required by this paragraph, based on their evaluation of these controls and procedures required by Rule 30a-3(b) under the 1940 Act and Rules 13a-15(b) or 15d-15(b) under the Securities Exchange Act of 1934.
(b) There were no changes in the registrant’s internal control over financial reporting (as defined in Rule 30a-3(d) under the 1940 Act) that occurred during the registrant’s second fiscal quarter of the period covered by this Form N-CSR filing that have materially affected, or are reasonably likely to materially affect, the registrant’s internal control over financial reporting.
|
Item 12.
|
Exhibits.
|
|
Exhibit 99.CODE ETH
|
Code of Ethics pursuant to Item 2 of Form N-CSR is attached hereto.
|
|
Exhibit 99.CERT
|
Certifications of principal executive officer and principal financial and accounting officer of the registrant as required by Rule 30a-2(a) under the 1940 Act are attached hereto.
|
|
Exhibit 99.906CERT
|
Certifications of principal executive officer and principal financial and accounting officer of the registrant as required by Rule 30a-2(b) under the 1940 Act and Section 906 of the Sarbanes-Oxley Act of 2002 are attached hereto.
|
SIGNATURES
Pursuant to the requirements of the Securities Exchange Act of 1934 and the Investment Company Act of 1940, the registrant has duly caused this report to be signed on its behalf by the undersigned, thereunto duly authorized.
(Registrant) North American Government Bond Fund, Inc.
|
By
|
/s/ R. Alan Medaugh
|
|
|
R. Alan Medaugh, President
|
||
|
Date
|
January 9, 2012
|
Pursuant to the requirements of the Securities Exchange Act of 1934 and the Investment Company Act of 1940, this report has been signed below by the following persons on behalf of the registrant and in the capacities and on the dates indicated.
|
By
|
/s/ R. Alan Medaugh
|
|
|
R. Alan Medaugh, President (Principal Executive Officer)
|
||
|
Date
|
January 9, 2012
|
|
|
By
|
/s/ Stephen V. Killorin
|
|
|
Stephen V. Killorin, Treasurer (Principal Financial and Accounting Officer)
|
||
|
Date
|
January 9, 2012
|
|