UNITED STATES
SECURITIES AND EXCHANGE COMMISSION
Washington, D.C. 20549
FORM N-CSR
CERTIFIED SHAREHOLDER REPORT OF REGISTERED
MANAGEMENT INVESTMENT COMPANIES
Investment Company Act file number 811-07292
North American Government Bond Fund, Inc.
(Exact name of registrant as specified in charter)
|
40 West 57th Street, 18th Floor New York, New York
|
10019
|
|
(Address of principal executive offices)
|
(Zip code)
|
R. Alan Medaugh, President
ISI, Inc. 40 West 57th Street, 18th Floor New York, New York 10019
(Name and address of agent for service)
Registrant's telephone number, including area code: (212) 446-5600
Date of fiscal year end: October 31, 2011
Date of reporting period: April 30, 2011
|
Item 1.
|
Reports to Stockholders.
|
 |
||||
|
SEMI-ANNUAL REPORT
April 30, 2011
(Unaudited)
 |
||||
|
TOTAL RETURN
U.S. TREASURY
FUND, INC.
MANAGED MUNICIPAL
FUND, INC.
NORTH AMERICAN
GOVERNMENT BOND
FUND, INC.
ISI STRATEGY
FUND, INC.
|
||||
|
|
||||
|
ISI Funds Semi-Annual Report – Table of Contents
|
|
Investment Advisor’s Message
|
1
|
|
Performance Comparisons
|
2
|
|
Shareholder Expense Examples
|
10
|
|
Portfolio Profiles
|
13
|
|
Schedules of Investments
|
14
|
|
Statements of Assets and Liabilities
|
27
|
|
Statements of Operations
|
31
|
|
Statements of Changes in Net Assets
|
33
|
|
Financial Highlights
|
39
|
|
Notes to Financial Statements
|
46
|
|
Notice to Shareholders
|
56
|
|
Investment Advisor’s Message
|
4/30/2011
|
Dear Shareholder:
I am pleased to present the semi-annual report to shareholders for the ISI Funds. This report covers the six-month reporting period ended April 30, 2011. For this period, the Total Return US Treasury Fund, Inc. (‘Total Return’) produced a -2.46% return; Managed Municipal Fund, Inc. (‘Managed Municipal’) produced a -1.05% return in its Class A Shares and a -0.83 return in its Class I Shares; North American Government Bond Fund, Inc. (‘North American’) produced a -0.13% return in its Class A Shares, a -0.37% return in its Class C Shares, and a +0.15% return in its Class I Shares; and ISI Strategy Fund (‘Strategy’) produced a +13.72% return. These figures assume the reinvestment of dividends and capital gain distributions, and exclude the impact of any sales charges.
Performance data quoted represents past performance and is no guarantee of future results. Current performance may be lower or higher than the performance data quoted. Investment return and principal value will fluctuate so that an investor’s shares, when redeemed, may be worth more or less than original cost. For the most recent month-end performance of a Fund, please call (800) 882-8585.
Description of Fund Objectives
Total Return, Managed Municipal, North American and Strategy, (each a ‘Fund’ and collectively, the ‘Funds’) are registered under the Investment Company Act of 1940, as amended, as open-end management investment companies. The Funds are organized as corporations under the laws of the state of Maryland.
International Strategy & Investment, Inc. (‘ISI’) manages all four Funds. Total Return’s investment objective is to achieve a high level of total return with relative stability of principal and, secondarily, high current income consistent with an investment in securities issued by the United States Treasury. Managed Municipal’s investment objective is designed to provide a high level of total return with relative stability of principal and, secondarily, high current income exempt from federal income tax through investment in a portfolio consisting primarily of tax-free municipal obligations. North American’s investment objective is designed to provide a high level of current income, consistent with prudent investment risk. Strategy’s investment objective is designed to maximize total return through a combination of long-term growth of capital and current income.
We would like to welcome new investors to the ISI Funds and thank those who have been with us for some time. We appreciate your confidence.
Sincerely,

R. Alan Medaugh
President
June 9, 2011
| 1 |
|
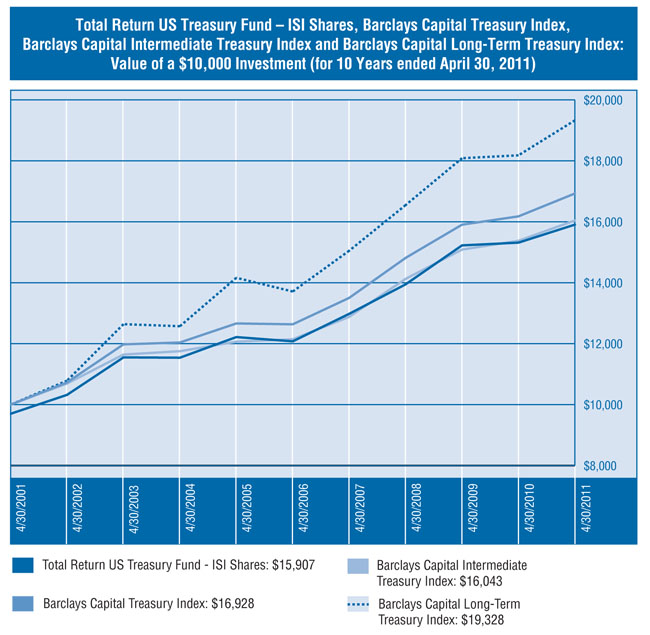
Total Return US Treasury Fund –
Performance Comparison1 (Unaudited)
|
| 2 |
|
Total Return US Treasury Fund –
Performance Comparison1 (Unaudited) (continued)
|
|
Cumulative Total Returns (With Sales Charge)
|
Average Annual Total Returns (With Sales Charge)
|
|||||||||
|
Periods Ended
April 30, 2011
|
1 Year
|
3 Years
|
5 Years
|
10 Years
|
Since Inception2
|
1 Year
|
3 Years
|
5 Years
|
10 Years
|
Since Inception2
|
|
Total Return US Treasury Fund
|
0.71%
|
10.64%
|
27.77%
|
59.03%
|
322.98%
|
0.71%
|
3.43%
|
5.02%
|
4.75%
|
6.55%
|
|
Barclays Capital Treasury Index3
|
4.64%
|
14.26%
|
33.97%
|
69.28%
|
369.75%
|
4.64%
|
4.54%
|
6.02%
|
5.40%
|
7.06%
|
|
Barclays Capital Intermediate Treasury Index3
|
4.33%
|
13.56%
|
32.09%
|
60.43%
|
315.02%
|
4.33%
|
4.33%
|
5.72%
|
4.84%
|
6.48%
|
|
Barclays Capital Long-Term Treasury Index3
|
6.31%
|
16.80%
|
40.96%
|
93.28%
|
556.15%
|
6.31%
|
5.31%
|
7.11%
|
6.81%
|
8.65%
|
|
1
|
Past performance is not indicative of future results. Investment return and principal value will fluctuate so that an investor’s shares, when redeemed, may be worth more or less than their original cost. The performance information presented in the graph and table above does not reflect the deduction of taxes that a shareholder would pay on Fund distributions or the redemption of Fund shares. All performance assumes the reinvestment of dividends and capital gain distributions and includes the Fund’s maximum 3.00% sales charge. Distributions of the Fund’s capital gains and non-US Treasury income may be subject to state and local taxes. Management is not aware of any single index that is truly representative of the Fund since its active maturity management policy allows the manager to adjust the weighted average maturity throughout each US Treasury sector. Currently, the Fund’s weighted average maturity is approximately 6.51 years.
|
|
2
|
The Fund’s inception date is August 10, 1988. Benchmark returns are for the periods beginning August 31, 1988.
|
|
3
|
The Barclays Capital Treasury Index is an unmanaged index reflecting the performance of all public Treasury obligations and does not focus on one particular segment of the Treasury market. The Barclays Capital Intermediate Treasury Index is an unmanaged index reflecting the performance of US Treasury securities in the intermediate-term Treasury sector. The Barclays Capital Long-Term Treasury Index is an unmanaged index reflecting the performance of US Treasury securities in the long-term Treasury sector. Benchmark returns do not reflect expenses or sales charges that have been deducted from the Fund’s returns.
|
|
Expense Ratio Information as of:
|
October 31, 2010
(As disclosed in March 1, 2011 Summary Prospectus)
|
|
Gross Expense Ratio
|
0.82%
|
| 3 |
|
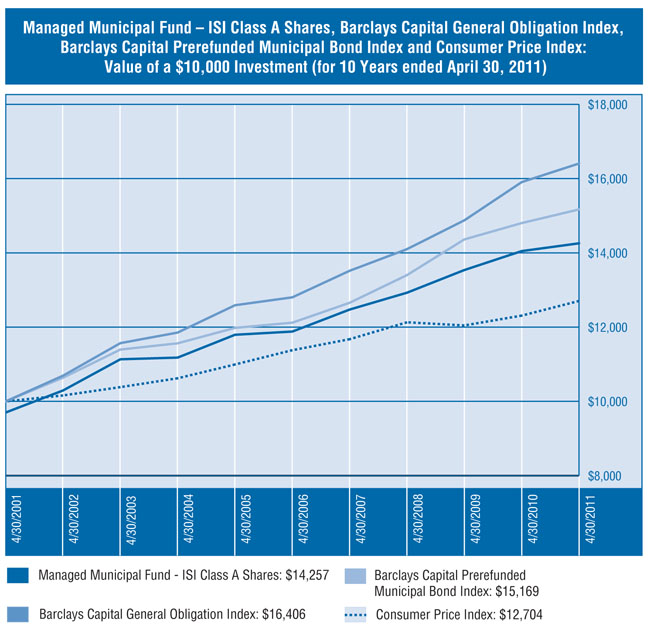
Managed Municipal Fund –
Performance Comparison1 (Unaudited)
|
| 4 |
|
Managed Municipal Fund –
Performance Comparison1 (Unaudited) (continued)
|
|
Cumulative Total Returns (With Sales Charge)
|
Average Annual Total Returns (With Sales Charge)
|
|||||||||
|
Periods Ended
April 30, 2011
|
1 Year
|
3 Years
|
5 Years
|
10 Years
|
Since Inception
|
1 Year
|
3 Years
|
5 Years
|
10 Years
|
Since Inception
|
|
Managed Municipal Fund - ISI Class A Shares2
|
-1.54%
|
6.95%
|
16.37%
|
42.57%
|
182.28%
|
-1.54%
|
2.26%
|
3.08%
|
3.61%
|
5.02%
|
|
Managed Municipal Fund - ISI Class I Shares3
|
—
|
—
|
—
|
—
|
-1.68%
|
—
|
—
|
—
|
—
|
-1.68%*
|
|
Barclays Capital General Obligation Index4
|
3.15%
|
16.35%
|
28.15%
|
64.06%
|
252.05%
|
3.15%
|
5.18%
|
5.09%
|
5.08%
|
6.12%
|
|
Barclays Capital Prerefunded Municipal Bond Index4
|
2.48%
|
13.19%
|
25.16%
|
51.69%
|
199.04%
|
2.48%
|
4.22%
|
4.59%
|
4.25%
|
5.31%
|
|
Consumer Price Index5
|
3.20%
|
4.73%
|
11.65%
|
27.04%
|
63.44%
|
3.20%
|
1.55%
|
2.23%
|
2.42%
|
2.73%
|
|
1
|
Past performance is not indicative of future results. Investment return and principal value will fluctuate so that an investor’s shares, when redeemed, may be worth more or less than their original cost. The performance information presented in the graph and table above does not reflect the deduction of taxes that a shareholder would pay on Fund distributions or the redemption of Fund shares. All performance assumes the reinvestment of dividends and capital gain distributions and includes the sales charges, if applicable. ISI Class A Shares have a maximum 3.00% sales charge. Distributions of the Fund’s income and capital gains may be subject to state and local taxes.
|
|
2
|
The ISI Class A Shares inception date is February 26, 1990. Benchmark returns are for the periods beginning February 28, 1990.
|
|
3
|
The ISI Class I Shares inception date is October 7, 2010. Benchmark returns are for the period beginning October 31, 2010.
|
|
4
|
The Barclays Capital General Obligation Index is an unmanaged index reflecting general municipal bond market performance. The Barclays Capital Prerefunded Municipal Bond Index, an unmanaged index, is a subcomponent of the general Barclays Capital Municipal Bond Index, and contains only bonds from that index that have been prerefunded or escrowed to maturity. Benchmark returns do not reflect expenses or sales charges that have been deducted from the Fund’s returns.
|
|
5
|
The Consumer Price Index is a widely used measure of inflation.
|
|
*
|
Not Annualized.
|
|
Expense Ratio Information as of:
|
October 31, 2010
(As disclosed in March 1, 2011 Summary Prospectus)
|
|
Gross Expense Ratio – Class A
|
0.97%
|
|
Gross Expense Ratio – Class I
|
0.70%
|
| 5 |
|
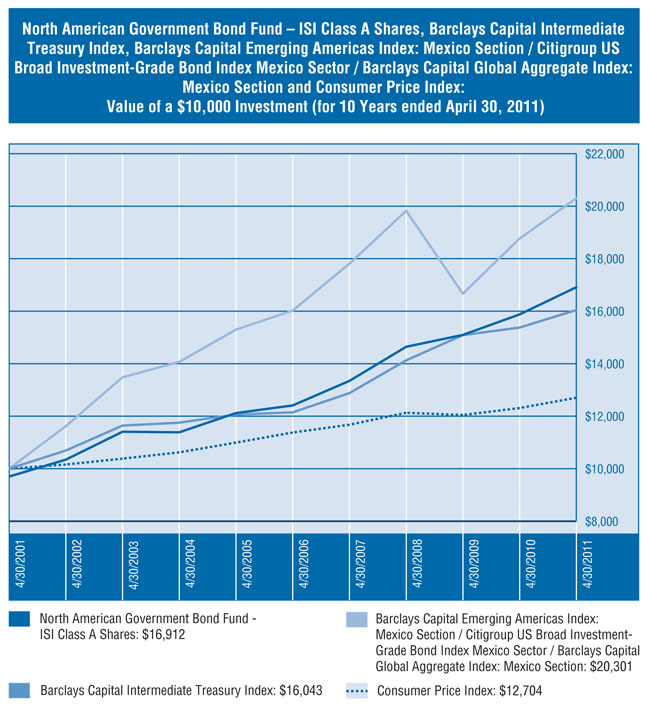
North American Government Bond Fund –
Performance Comparison1 (Unaudited)
|
| 6 |
|
North American Government Bond Fund –
Performance Comparison1 (Unaudited) (continued)
|
|
Cumulative Total Returns (With Sales Charge)
|
Average Annual Total Returns (With Sales Charge)
|
|||||||||
|
Periods Ended
April 30, 2011
|
1 Year
|
3 Years
|
5 Years
|
10 Years
|
Since Inception
|
1 Year
|
3 Years
|
5 Years
|
10 Years
|
Since Inception
|
|
North American Government Bond Fund - ISI Class A Shares2
|
3.36%
|
11.98%
|
32.22%
|
69.09%
|
177.80%
|
3.36%
|
3.85%
|
5.75%
|
5.39%
|
5.75%
|
|
North American Government Bond Fund - ISI Class C Shares3
|
4.71%
|
13.26%
|
31.97%
|
—
|
37.06%
|
4.71%
|
4.24%
|
5.71%
|
—
|
4.04%
|
|
North American Government Bond Fund - ISI Class I Shares4
|
—
|
—
|
—
|
—
|
1.90%
|
—
|
—
|
—
|
—
|
1.90%*
|
|
Barclays Capital Intermediate Treasury Index5
|
4.33%
|
13.56%
|
32.09%
|
60.43%
|
164.60%
|
4.33%
|
4.33%
|
5.72%
|
4.84%
|
5.48%
|
|
Barclays Capital Emerging Americas Index: Mexico Section / Citigroup US Broad Investment-Grade Bond Index Mexico Sector / Barclays Capital Global Aggregate Index: Mexico Section6
|
8.18%
|
2.41%
|
26.68%
|
103.01%
|
468.91%
|
8.18%
|
0.80%
|
4.84%
|
7.34%
|
9.99%
|
|
Consumer Price Index7
|
3.20%
|
4.73%
|
11.65%
|
27.04%
|
63.44%
|
3.20%
|
1.55%
|
2.23%
|
2.42%
|
2.73%
|
|
1
|
Past performance is not indicative of future results. Investment return and principal value will fluctuate so that an investor’s shares, when redeemed, may be worth more or less than their original cost. The performance information presented in the graph and table above does not reflect the deduction of taxes that a shareholder would pay on Fund distributions or the redemption of Fund shares. All performance assumes the reinvestment of dividends and capital gain distributions and includes sales charges, if applicable. ISI Class A shares have a maximum 3.00% sales charge. ISI Class C Shares have a maximum 1.00% contingent deferred sales charge in the first year, which is eliminated thereafter.
|
|
2
|
ISI Class A Shares inception date is January 15, 1993. Benchmark returns are for the periods beginning January 31, 1993.
|
|
3
|
ISI Class C Shares inception date is May 16, 2003. Cumulative and annualized returns for the Barclays Capital Intermediate Treasury Index from May 31, 2003 through April 30, 2011 were 35.68% and 3.93%, respectively.
|
|
4
|
ISI Class I Shares inception date is September 16, 2010. Benchmark returns are for the periods beginning September 30, 2010.
|
|
5
|
The Barclays Capital Intermediate Treasury Index is an unmanaged index reflecting the performance of US Treasury securities in the intermediate-term Treasury sector. Benchmark returns do not reflect expenses or sales charges that have been deducted from the Fund’s returns.
|
|
6
|
Reflects the performance of the Barclays Capital Emerging Americas Index: Mexico Section through October 31, 2004 and the Citigroup US Broad Investment-Grade Bond Index Mexico Sector from that date through October 31, 2006 and the Barclays Capital Global Aggregate Index: Mexico from October 31, 2006 through April 30, 2011. The Barclays Capital Emerging Americas Index: Mexico Section has been discontinued. Barclays Capital Emerging Americas Index: Mexico Section was an unmanaged sub-index of the Barclays Capital Emerging Americas Index reflecting the performance of selected Mexican debt instruments with maturities of one year or more. The Citigroup US Broad Investment-Grade Bond Index Mexico Sector is an unmanaged sub-index of the Citigroup US Broad Investment-Grade Bond Index reflecting the performance of selected Mexican debt instruments with maturities of one year or more. The Barclays Capital Global Aggregate Index: Mexico Section is an unmanaged sub-index of Barclays Capital Global Aggregate Index which provides broad-based measure of global investment-grade fixed income markets. The Mexico Section reflects the US dollar performance of selected Mexican government peso-denominated debt instruments with maturities of one year or more. Benchmark returns do not reflect expenses or sales charges that have been deducted from the Fund’s returns.
|
|
7
|
The Consumer Price Index is a widely used measure of inflation.
|
|
*
|
Not Annualized.
|
|
Expense Ratio Information as of:
|
October 31, 2010
(As disclosed in March 1, 2011 Summary Prospectus)
|
|
Gross Expense Ratio – Class A
|
1.15%
|
|
Gross Expense Ratio – Class C
|
1.78%
|
|
Gross Expense Ratio – Class I
|
0.69%
|
| 7 |
|
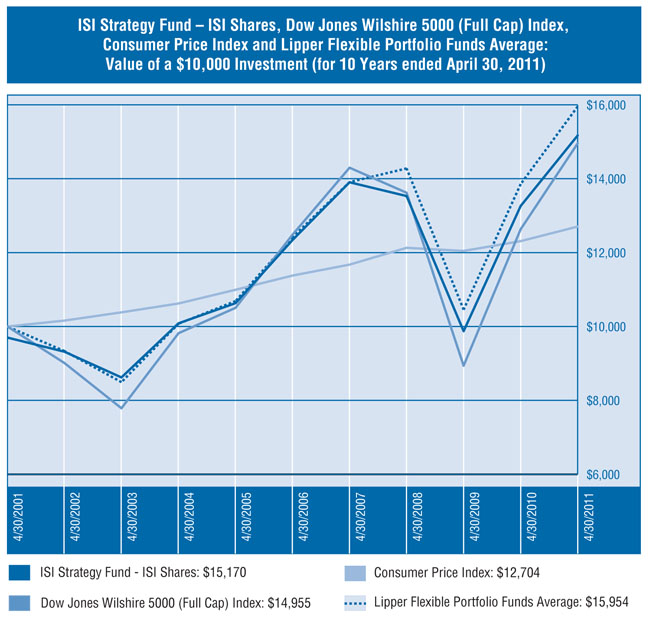
ISI Strategy Fund –
Performance Comparison1 (Unaudited)
|
| 8 |
|
ISI Strategy Fund –
Performance Comparison1 (Unaudited) (continued)
|
|
Cumulative Total Returns (With Sales Charge)
|
Average Annual Total Returns (With Sales Charge)
|
|||||||||
|
Periods Ended
April 30, 2011
|
1 Year
|
3 Years
|
5 Years
|
10 Years
|
Since Inception2
|
1 Year
|
3 Years
|
5 Years
|
10 Years
|
Since Inception2
|
|
ISI Strategy Fund
|
10.97%
|
8.74%
|
19.27%
|
51.77%
|
92.36%
|
10.97%
|
2.83%
|
3.59%
|
4.26%
|
4.92%
|
|
Wilshire 5000 (Full Cap) Index3
|
18.39%
|
9.80%
|
19.79%
|
49.55%
|
211.37%
|
18.39%
|
3.17%
|
3.68%
|
4.11%
|
8.72%
|
|
Consumer Price Index4
|
3.20%
|
4.73%
|
11.65%
|
27.04%
|
63.44%
|
3.20%
|
1.55%
|
2.23%
|
2.42%
|
2.73%
|
|
Lipper Flexible Portfolio Funds Average5
|
15.16%
|
11.73%
|
28.49%
|
59.51%
|
97.64%
|
15.16%
|
3.77%
|
5.14%
|
4.78%
|
5.14%
|
|
1
|
Past performance is not indicative of future results. Investment return and principal value will fluctuate so that an investor’s shares, when redeemed, may be worth more or less than their original cost. The performance information presented in the graph and table above does not reflect the deduction of taxes that a shareholder would pay on Fund distributions or the redemption of Fund shares. All performance assumes the reinvestment of dividends and capital gain distributions and includes the Fund’s maximum 3.00% sales charge.
|
|
2
|
The Fund’s inception date is September 16, 1997. Benchmark returns are for the periods beginning September 30, 1997.
|
|
3
|
The DJ Wilshire 5000 (Full Cap) Index is an unmanaged index that represents the broadest measure of the US equity market. Benchmark returns do not reflect expenses or sales charges that have been deducted from the Fund’s returns.
|
|
4
|
The Consumer Price Index is a widely used measure of inflation.
|
|
5
|
Lipper figures represent the average total returns by all mutual funds designated by Lipper as falling into the category indicated. The Lipper Flexible Portfolio Funds Average category includes funds that allocate their investments across various asset classes, including domestic common stocks, bonds and money market instruments with a focus on total return.
|
|
Expense Ratio Information as of:
|
October 31, 2010
(As disclosed in March 1, 2011 Summary Prospectus)
|
|
Gross Expense Ratio
|
1.06%
|
| 9 |
|
Shareholder Expense Examples (Unaudited)
|
As a shareholder of the Funds, you may incur two types of cost; (1) transaction costs, including sales charges (loads); and (2) ongoing costs, including management fees, Rule 12b-1 distribution/shareholder service fees and other Fund expenses. This example is intended to help you understand your ongoing costs (in dollars) of investing in each Fund and to compare these costs with the ongoing costs of investing in other mutual funds.
A mutual fund’s ongoing costs are expressed as a percentage of its average net assets. This figure is known as the expense ratio. The expenses in the tables below are based on an investment of $1,000 made at the beginning of the period shown (November 1, 2010) and held for the entire period (April 30, 2011).
Actual Expenses – “Actual Return” in the following table provides information about actual account values and actual expenses. You may use the information here, together with the amount you invested, to estimate the expenses that you paid over the period. Simply divide your account value by $1,000 (for example, an $8,600 account value divided by $1,000 = 8.6), then multiply the result by the number in the “Expenses Paid During Period” column to estimate the expenses you paid on your account during this period.
Hypothetical Example for Comparison Purposes – “Hypothetical Returns” in the following table provides information about hypothetical account values and hypothetical expenses based on each Fund’s actual expense ratio and an assumed rate of return of 5% per year before expenses, which is not the actual return of each Fund. The hypothetical account values and expenses may not be used to estimate the actual ending account balance or expenses you paid for the period. You may use this information to compare the ongoing costs of investing in a Fund and other funds. To do so, compare this 5% hypothetical example with the 5% hypothetical examples that appear in the shareholder reports of other funds.
Expenses shown in the tables are meant to highlight your ongoing costs only and do not reflect any transactional costs, such as sales charges (loads). Therefore, “Hypothetical Returns” in the table are useful in comparing ongoing costs only, and will not help you determine the relative total costs of owning different funds. If these transactional costs were included, your costs would have been higher.
| 10 |
|
Shareholder Expense Examples (Unaudited) (continued)
|
|
Total Return US Treasury Fund
|
||||
|
|
Beginning
Account Value
November 1, 2010
|
Ending
Account Value
April 30, 2011
|
Expenses Paid
During Period(1)
|
Annualized
Expense Ratio
|
|
Based on Actual Fund Return
|
$1,000.00
|
$975.40
|
$4.41
|
0.90%
|
|
Based on Hypothetical 5% Return
|
$1,000.00
|
$1,020.33
|
$4.51
|
0.90%
|
|
Managed Municipal Fund – Class A
|
||||
|
|
Beginning
Account Value
November 1, 2010
|
Ending
Account Value
April 30, 2011
|
Expenses Paid
During Period(1)
|
Annualized
Expense Ratio
|
|
Based on Actual Fund Return
|
$1,000.00
|
$989.50
|
$4.93
|
1.00%
|
|
Based on Hypothetical 5% Return
|
$1,000.00
|
$1,019.84
|
$5.01
|
1.00%
|
|
Managed Municipal Fund – Class I
|
||||
|
|
Beginning
Account Value
November 1, 2010
|
Ending
Account Value
April 30, 2011
|
Expenses Paid
During Period(1)
|
Annualized
Expense Ratio
|
|
Based on Actual Fund Return
|
$1,000.00
|
$991.70
|
$3.65
|
0.74%
|
|
Based on Hypothetical 5% Return
|
$1,000.00
|
$1,021.12
|
$3.71
|
0.74%
|
|
North American Government Bond Fund – Class A
|
||||
|
|
Beginning
Account Value
November 1, 2010
|
Ending
Account Value
April 30, 2011
|
Expenses Paid
During Period(1)
|
Annualized
Expense Ratio
|
|
Based on Actual Fund Return
|
$1,000.00
|
$998.70
|
$5.90
|
1.19%
|
|
Based on Hypothetical 5% Return
|
$1,000.00
|
$1,018.89
|
$5.96
|
1.19%
|
|
North American Government Bond Fund – Class C
|
||||
|
|
Beginning
Account Value
November 1, 2010
|
Ending
Account Value
April 30, 2011
|
Expenses Paid
During Period(1)
|
Annualized
Expense Ratio
|
|
Based on Actual Fund Return
|
$1,000.00
|
$996.30
|
$8.86
|
1.79%
|
|
Based on Hypothetical 5% Return
|
$1,000.00
|
$1,015.92
|
$8.95
|
1.79%
|
|
(1)
|
Expenses are equal to the Fund’s annualized expense ratio for the period, multiplied by the average account value over the period, multiplied by 181/365 (to reflect the one-half year period).
|
| 11 |
|
Shareholder Expense Examples (Unaudited) (continued)
|
|
North American Government Bond Fund – Class I
|
||||
|
|
Beginning
Account Value
November 1, 2010
|
Ending
Account Value
April 30, 2011
|
Expenses Paid
During Period(1)
|
Annualized
Expense Ratio
|
|
Based on Actual Fund Return
|
$1,000.00
|
$1,001.50
|
$3.82
|
0.77%
|
|
Based on Hypothetical 5% Return
|
$1,000.00
|
$1,020.98
|
$3.86
|
0.77%
|
|
ISI Strategy Fund
|
||||
|
|
Beginning
Account Value
November 1, 2010
|
Ending
Account Value
April 30, 2011
|
Expenses Paid
During Period(1)
|
Annualized
Expense Ratio
|
|
Based on Actual Fund Return
|
$1,000.00
|
$1,137.20
|
$5.46
|
1.03%
|
|
Based on Hypothetical 5% Return
|
$1,000.00
|
$1,019.69
|
$5.16
|
1.03%
|
|
(1)
|
Expenses are equal to the Fund’s annualized expense ratio for the period, multiplied by the average account value over the period, multiplied by 181/365 (to reflect the one-half year period).
|
| 12 |
|
Portfolio Profiles (Unaudited)
|
|
Portfolio Profiles (as a % of Net Assets)
|
April 30, 2011
|
|
Total Return US Treasury Fund
|
|
|
US Treasury Obligations
|
97.50%
|
|
Repurchase Agreements
|
1.80%
|
|
Other Assets and Liabilities
|
0.70%
|
|
100.00%
|
|
|
Managed Municipal Fund
|
|
|
Aaa Municipal Obligations*
|
77.51%
|
|
Aa Municipal Obligations*
|
10.39%
|
|
NR Municipal Obligations*
|
0.41%
|
|
US Treasury Obligations
|
4.79%
|
|
Repurchase Agreements
|
6.13%
|
|
Other Assets and Liabilities
|
0.77%
|
|
100.00%
|
|
|
* Ratings are based on Moody’s Investors Service, Inc.
|
|
|
North American Government Bond Fund
|
|
|
Canadian Securities
|
18.00%
|
|
Mexican Securities
|
9.45%
|
|
US Treasury Obligations
|
70.42%
|
|
Repurchase Agreements
|
0.94%
|
|
Other Assets and Liabilities
|
1.19%
|
|
100.00%
|
|
|
ISI Strategy Fund
|
|
|
Consumer Discretionary
|
8.72%
|
|
Consumer Staples
|
7.82%
|
|
Energy
|
13.40%
|
|
Financials
|
13.48%
|
|
Health Care
|
11.47%
|
|
Industrials
|
10.03%
|
|
Information Technology
|
16.90%
|
|
Materials
|
4.05%
|
|
Telecommunication Services
|
1.09%
|
|
Utilities
|
2.02%
|
|
US Treasury Obligations
|
9.41%
|
|
Repurchase Agreements
|
1.61%
|
|
Other Assets and Liabilities
|
0.00%
|
|
100.00%
|
|
| 13 |
|
Total Return US Treasury Fund
|
|
Schedule of Investments
|
April 30, 2011 (Unaudited)
|
|
Security
|
Interest
Rate
|
Maturity
Date
|
Principal
Amount
|
Market
Value
|
|||||||||
|
US TREASURY OBLIGATIONS - 97.50%
|
|||||||||||||
|
US Treasury Notes
|
1.000% |
08/31/11
|
$ | 13,500,000 | $ | 13,542,714 | |||||||
|
US Treasury Notes
|
1.000% |
10/31/11
|
3,000,000 | 3,013,359 | |||||||||
|
US Treasury Notes
|
0.625% |
07/31/12
|
2,000,000 | 2,008,212 | |||||||||
|
US Treasury Notes
|
2.000% |
01/31/16
|
11,000,000 | 11,067,034 | |||||||||
|
US Treasury Notes
|
3.750% |
11/15/18
|
1,370,000 | 1,459,693 | |||||||||
|
US Treasury Notes
|
3.125% |
05/15/19
|
5,300,000 | 5,375,361 | |||||||||
|
US Treasury Notes
|
2.625% |
08/15/20
|
7,000,000 | 6,657,112 | |||||||||
|
US Treasury Bonds
|
8.125% |
08/15/19
|
10,000,000 | 13,862,500 | |||||||||
|
US Treasury Bonds
|
8.750% |
08/15/20
|
11,300,000 | 16,428,256 | |||||||||
|
US Treasury Bonds
|
7.875% |
02/15/21
|
1,000,000 | 1,389,219 | |||||||||
|
US Treasury Bonds
|
6.375% |
08/15/27
|
6,000,000 | 7,706,250 | |||||||||
|
Total US Treasury Obligations (Cost $81,560,755)
|
$ | 82,509,710 | |||||||||||
|
Security
|
Principal
Amount
|
Market
Value
|
||||||
|
REPURCHASE AGREEMENTS - 1.80%
|
||||||||
|
JPMorgan Chase, N.A.
|
||||||||
|
Dated 04/29/11, 0.01%, principal and interest in the amount of $1,528,001 to be repurchased 05/02/11, collateralized by US Treasury Inflation-Protected Notes, par value of $1,219,100 due 07/15/14 and 01/15/15 with a combined value of $1,560,270 (Cost $1,528,000)
|
$ | 1,528,000 | $ | 1,528,000 | ||||
|
Total Investments - 99.30% (Cost $83,088,755)*
|
$ | 84,037,710 | ||||||
|
Other Assets in Excess of Liabilities - 0.70%
|
590,847 | |||||||
|
Net Assets - 100.00%
|
$ | 84,628,557 | ||||||
|
*
|
Cost for Federal income tax purposes is $83,088,755 and net unrealized appreciation on a tax basis consists of:
|
|
Gross Unrealized Appreciation
|
$ | 1,446,134 | ||
|
Gross Unrealized Depreciation
|
(497,179 | ) | ||
|
Net Unrealized Appreciation
|
$ | 948,955 |
See Notes to Financial Statements.
| 14 |
|
Managed Municipal Fund
|
|
Schedule of Investments
|
April 30, 2011 (Unaudited)
|
|
Security
|
Interest
Rate
|
Maturity
Date
|
Ratings
(Moody’s/
S&P)1
|
Principal
Amount
|
Market
Value
|
|||||||||
|
MUNICIPAL BONDS - 88.31%
|
||||||||||||||
|
General Obligation - 66.17%
|
||||||||||||||
|
Alexandria, VA, Capital Improvements
|
4.250% |
06/15/21
|
Aaa/AAA
|
$ | 3,300,000 | $ | 3,433,617 | |||||||
|
Arlington County, VA, Public Improvements
|
4.500% |
01/15/28
|
Aaa/AAA
|
1,600,000 | 1,611,568 | |||||||||
|
Austin, TX, Public Improvements, Series A
|
3.500% |
09/01/30
|
Aaa/AAA
|
2,500,000 | 2,164,375 | |||||||||
|
Baltimore County, MD
|
4.000% |
08/01/22
|
Aaa/AAA
|
1,665,000 | 1,785,546 | |||||||||
|
Dallas, TX
|
4.000% |
02/15/16
|
Aa1/AA+
|
2,450,000 | 2,515,121 | |||||||||
|
Delaware State, Series B
|
3.000% |
07/01/19
|
Aaa/AAA
|
1,400,000 | 1,456,784 | |||||||||
|
Delaware State, Series B
|
3.250% |
01/01/21
|
Aaa/AAA
|
2,000,000 | 2,037,900 | |||||||||
|
Du Page County, IL, Jail Project
|
5.600% |
01/01/21
|
Aaa/AAA
|
1,600,000 | 1,835,664 | |||||||||
|
Florida State, Board of Education, Public Education, Series I
|
4.125% |
06/01/21
|
Aa1/AAA
|
3,000,000 | 3,070,980 | |||||||||
|
Georgia State, Series B
|
4.250% |
04/01/25
|
Aaa/AAA
|
1,120,000 | 1,151,438 | |||||||||
|
Georgia State, Series G
|
4.125% |
10/01/23
|
Aaa/AAA
|
2,000,000 | 2,078,740 | |||||||||
|
Henrico County, VA, Public Improvements
|
4.250% |
07/15/24
|
Aaa/AAA
|
2,830,000 | 2,908,844 | |||||||||
|
Maryland State, Capital Improvements, Series A
|
4.000% |
02/15/20
|
Aaa/AAA
|
4,000,000 | 4,196,240 | |||||||||
|
Mecklenburg County, NC
|
3.500% |
02/01/26
|
Aaa/AAA
|
2,000,000 | 1,911,880 | |||||||||
|
Mecklenburg County, NC, Public Improvements, Series A
|
4.000% |
02/01/20
|
Aaa/AAA
|
3,000,000 | 3,108,720 | |||||||||
|
Mecklenburg County, NC, Public Improvements, Series B
|
4.000% |
03/01/27
|
Aaa/AAA
|
1,000,000 | 1,004,980 | |||||||||
|
Minnesota State, State Trunk Highway, Series B
|
4.000% |
08/01/30
|
Aa1/AAA
|
2,830,000 | 2,750,166 | |||||||||
|
Missouri State, Fourth State Building, Series A
|
4.125% |
10/01/19
|
Aaa/AAA
|
2,000,000 | 2,045,160 | |||||||||
|
Montgomery County, MD, Public Improvements, Series A
|
4.000% |
05/01/21
|
Aaa/AAA
|
2,450,000 | 2,502,381 | |||||||||
|
Prince Georges County, MD, Public Improvements
|
4.125% |
07/15/26
|
Aaa/AAA
|
2,000,000 | 2,033,620 | |||||||||
|
Salt Lake City, UT, School District, School Board Guaranty, Series A
|
4.500% |
03/01/20
|
Aaa/NR
|
2,240,000 | 2,401,997 | |||||||||
|
South Carolina State, Coastal Carolina University, Series A
|
4.000% |
04/01/28
|
Aaa/AA+
|
1,000,000 | 992,440 | |||||||||
|
South Carolina State, Highway, Series A
|
3.000% |
08/01/22
|
Aaa/AA+
|
1,475,000 | 1,437,166 | |||||||||
|
Tennessee State, Series A
|
5.000% |
05/01/26
|
Aaa/AA+
|
500,000 | 538,480 | |||||||||
|
Tennessee State, Series A
|
5.000% |
05/01/27
|
Aaa/AA+
|
2,075,000 | 2,221,952 | |||||||||
|
Tennessee State, Series A
|
4.000% |
05/01/28
|
Aaa/AA+
|
2,000,000 | 1,991,440 | |||||||||
|
Tennessee State, Series A
|
3.625% |
05/01/31
|
Aaa/AA+
|
2,000,000 | 1,762,300 | |||||||||
|
Texas, Water Financial Assistance, Series C-1
|
5.000% |
08/01/39
|
Aaa/AA+
|
3,515,000 | 3,611,627 | |||||||||
See Notes to Financial Statements.
| 15 |
|
Managed Municipal Fund
|
|
Schedule of Investments (continued)
|
April 30, 2011 (Unaudited)
|
|
Security
|
Interest
Rate
|
Maturity
Date
|
Ratings
(Moody’s/
S&P)1
|
Principal
Amount
|
Market
Value
|
|||||||||
|
MUNICIPAL BONDS - 88.31% (continued)
|
||||||||||||||
|
General Obligation - 66.17% (continued)
|
||||||||||||||
|
Utah State, Series A
|
3.000% |
07/01/18
|
Aaa/AAA
|
$ | 1,000,000 | $ | 1,036,960 | |||||||
|
Virginia State, Series B
|
4.250% |
06/01/26
|
Aaa/AAA
|
2,500,000 | 2,546,325 | |||||||||
|
Washington State, Series F
|
4.500% |
07/01/27
|
Aa1/AA+
|
2,500,000 | 2,536,875 | |||||||||
|
Washington, MD, Suburban Sanitation District, Water Supply
|
4.250% |
06/01/26
|
Aaa/AAA
|
2,500,000 | 2,545,175 | |||||||||
| $ | 69,226,461 | |||||||||||||
|
Prerefunded2 Issues - 3.57%
|
||||||||||||||
|
Arlington County, VA, Public Improvements, 01/15/13 @ 100
|
4.500% |
01/15/28
|
NR/NR
|
$ | 400,000 | $ | 427,032 | |||||||
|
Delaware State, Series A, 01/01/12 @ 100
|
4.200% |
01/01/20
|
Aaa/AAA
|
1,675,000 | 1,719,237 | |||||||||
|
Gwinnett County, GA, Water & Sewer Authority, 08/01/12 @ 100
|
5.250% |
08/01/24
|
Aaa/AAA
|
1,500,000 | 1,592,205 | |||||||||
| $ | 3,738,474 | |||||||||||||
|
Revenue Bonds - 18.57%
|
||||||||||||||
|
Colorado, Water Resources & Power Development Authority, Series A
|
4.000% |
09/01/29
|
Aaa/AAA
|
$ | 2,000,000 | $ | 1,896,300 | |||||||
|
Fairfax County, VA, Water Authority Water Revenue
|
4.500% |
04/01/27
|
Aaa/AAA
|
2,500,000 | 2,561,950 | |||||||||
|
Florida, Water Pollution Control Financing, Series A
|
5.000% |
01/15/29
|
Aaa/AAA
|
500,000 | 521,230 | |||||||||
|
Florida, Water Pollution Control Financing, Series A
|
5.100% |
01/15/29
|
Aaa/AAA
|
550,000 | 577,549 | |||||||||
|
Gwinnett County, GA, Water & Sewer Authority, Series A
|
4.000% |
08/01/28
|
Aaa/AAA
|
2,000,000 | 1,981,440 | |||||||||
|
Kansas State, Development Finance Authority, Series DW-1
|
3.000% |
04/01/20
|
Aaa/AAA
|
2,865,000 | 2,885,112 | |||||||||
|
Kansas State, Development Finance Authority, Series DW-1
|
3.125% |
04/01/22
|
Aaa/AAA
|
2,975,000 | 2,919,219 | |||||||||
|
Texas, Water Development Board Revenue, State Revolving Fund-Senior Lien, Series A
|
4.750% |
07/15/20
|
Aaa/AAA
|
3,000,000 | 3,004,260 | |||||||||
|
Virginia State Resources Authority Clean Water Revenue
|
4.500% |
10/01/28
|
Aaa/AAA
|
3,000,000 | 3,077,130 | |||||||||
| $ | 19,424,190 | |||||||||||||
|
Total Municipal Bonds (Cost $90,588,991)
|
$ | 92,389,125 | ||||||||||||
|
US TREASURY OBLIGATION - 4.79%
|
||||||||||||||
|
US Treasury Notes (Cost $5,012,432)
|
1.000% |
08/31/11
|
—
|
$ | 5,000,000 | $ | 5,015,820 | |||||||
See Notes to Financial Statements.
| 16 |
|
Managed Municipal Fund
|
|
Schedule of Investments (continued)
|
April 30, 2011 (Unaudited)
|
|
Security
|
Principal
Amount
|
Market
Value
|
||||||
|
REPURCHASE AGREEMENTS - 6.13%
|
||||||||
|
JPMorgan Chase, N.A.
|
||||||||
|
Dated 04/29/11, 0.01%, principal and interest in the amount of $6,413,003 to be repurchased 05/02/11, collateralized by US Treasury Inflation-Protected Notes, par value of $5,649,800 due 01/15/14, 01/15/15, 07/15/16, 07/15/18, 07/15/20, and 01/15/21 with a combined value of $6,543,341 (Cost $6,413,000)
|
$ | 6,413,000 | $ | 6,413,000 | ||||
|
Total Investments - 99.23% (Cost $102,014,423)*
|
$ | 103,817,945 | ||||||
|
Other Assets in Excess of Liabilities - 0.77%
|
800,889 | |||||||
|
Net Assets - 100.00%
|
$ | 104,618,834 | ||||||
|
1
|
Moody’s Municipal Bond Ratings:
|
||
|
Aaa
|
Judged to be of the best quality.
|
||
|
Aa
|
Judged to be of high quality by all standards. Issues are sometimes denoted with a 1, 2 or 3, which denote a high, medium or low ranking within the rating.
|
||
|
S&P Municipal Bond Ratings:
|
|||
|
AAA
|
Of the highest quality.
|
||
|
AA
|
The second strongest capacity of payment of debt services. Those issues determined to possess very strong safety characteristics are denoted with a plus (+) sign.
|
||
|
NR
|
Bond is not rated by this rating organization.
|
||
|
2
|
Prerefunded: Bonds which are prerefunded are collateralized by US Treasury securities which are held in escrow and are used to pay principal and interest on tax-exempt issues and to retire the bonds in full at the earliest refunding date.
|
||
|
*
|
Cost for Federal income tax purposes is $102,014,423 and net unrealized appreciation on a tax basis consists of:
|
||
|
Gross Unrealized Appreciation
|
$ | 2,777,565 | ||
|
Gross Unrealized Depreciation
|
(974,043 | ) | ||
|
Net Unrealized Appreciation
|
$ | 1,803,522 |
See Notes to Financial Statements.
| 17 |
|
North American Government Bond Fund
|
|
Schedule of Investments
|
April 30, 2011 (Unaudited)
|
|
Security
|
Interest
Rate
|
Maturity
Date
|
Principal
Amount1
|
Market
Value
|
|||||||||
|
CANADIAN SECURITIES - 18.00%
|
|||||||||||||
|
Canadian Government Bonds
|
1.500% |
03/01/12
|
CAD 2,000,000
|
$ | 2,117,148 | ||||||||
|
Canadian Government Bonds
|
1.500% |
06/01/12
|
2,000,000 | 2,115,859 | |||||||||
|
Canadian Government Bonds
|
3.750% |
06/01/12
|
7,500,000 | 8,125,112 | |||||||||
|
Canadian Government Bonds
|
3.500% |
06/01/13
|
3,100,000 | 3,390,391 | |||||||||
|
Canadian Government Bonds
|
4.000% |
06/01/17
|
9,000,000 | 10,165,629 | |||||||||
|
Total Canadian Securities (Cost $23,306,504)
|
$ | 25,914,139 | |||||||||||
|
MEXICAN SECURITIES - 9.45%
|
|||||||||||||
|
Mexican Bono2
|
9.000% |
12/20/12
|
MXN 31,782,400
|
$ | 2,926,255 | ||||||||
|
Mexican Bono2
|
6.000% |
06/18/15
|
23,850,000 | 2,045,678 | |||||||||
|
Mexican Bono2
|
8.000% |
12/17/15
|
93,907,000 | 8,630,255 | |||||||||
|
Total Mexican Securities (Cost $13,154,808)
|
$ | 13,602,188 | |||||||||||
|
US TREASURY OBLIGATIONS - 70.42%
|
|||||||||||||
|
US Treasury Notes
|
1.000% |
08/31/11
|
$ | 9,000,000 | $ | 9,028,476 | |||||||
|
US Treasury Notes
|
2.000% |
01/31/16
|
12,000,000 | 12,073,128 | |||||||||
|
US Treasury Notes
|
2.125% |
02/29/16
|
3,750,000 | 3,789,844 | |||||||||
|
US Treasury Notes
|
3.125% |
05/15/19
|
11,600,000 | 11,764,940 | |||||||||
|
US Treasury Notes
|
2.625% |
08/15/20
|
11,850,000 | 11,269,540 | |||||||||
|
US Treasury Bonds
|
8.750% |
05/15/17
|
12,800,000 | 17,462,003 | |||||||||
|
US Treasury Bonds
|
8.875% |
08/15/17
|
10,300,000 | 14,214,804 | |||||||||
|
US Treasury Bonds
|
8.125% |
08/15/19
|
6,500,000 | 9,010,625 | |||||||||
|
US Treasury Bonds
|
8.500% |
02/15/20
|
6,000,000 | 8,547,186 | |||||||||
|
US Treasury Bonds
|
8.750% |
08/15/20
|
2,300,000 | 3,343,804 | |||||||||
|
US Treasury Bonds
|
7.875% |
02/15/21
|
650,000 | 902,992 | |||||||||
|
Total US Treasury Obligations (Cost $100,692,490)
|
$ | 101,407,342 | |||||||||||
See Notes to Financial Statements.
| 18 |
|
North American Government Bond Fund
|
|
Schedule of Investments (continued)
|
April 30, 2011 (Unaudited)
|
|
Security
|
Principal
Amount
|
Market
Value
|
||||||
|
REPURCHASE AGREEMENTS - 0.94%
|
||||||||
|
JPMorgan Chase, N.A.
|
||||||||
|
Dated 04/29/11, 0.01%, principal and interest in the amount of $1,354,001 to be repurchased 05/02/11, collateralized by US Treasury Inflation-Protected Note, par value of $1,055,000 due 07/15/14 with a value of $1,383,030 (Cost $1,354,000)
|
$ | 1,354,000 | $ | 1,354,000 | ||||
|
Total Investments - 98.81% (Cost $138,507,802)*
|
$ | 142,277,669 | ||||||
|
Other Assets in Excess of Liabilities - 1.19%
|
1,713,593 | |||||||
|
Net Assets - 100.00%
|
$ | 143,991,262 | ||||||
|
CAD
|
Canadian dollar
|
|
MXN
|
Mexican peso
|
|
1
|
Principal Amount is shown in US dollars unless otherwise noted.
|
|
2
|
Bonos are fixed rate, local currency-denominated coupon bonds issued by the Mexican government.
|
|
*
|
Cost for Federal income tax purposes is $138,507,802 and net unrealized appreciation on a tax basis consists of:
|
|
Gross Unrealized Appreciation
|
$ | 4,617,793 | ||
|
Gross Unrealized Depreciation
|
(847,926 | ) | ||
|
Net Unrealized Appreciation
|
$ | 3,769,867 |
See Notes to Financial Statements.
| 19 |
|
ISI Strategy Fund
|
|
Schedule of Investments
|
April 30, 2011 (Unaudited)
|
|
Security
|
Shares
|
Market
Value
|
||||||
|
COMMON STOCKS - 88.98%
|
||||||||
|
Consumer Discretionary - 8.72%
|
||||||||
|
Auto Components - 0.01%
|
||||||||
|
Goodyear Tire & Rubber Co. (The)*
|
190 | $ | 3,449 | |||||
|
Automobiles - 0.10%
|
||||||||
|
Ford Motor Co.*
|
4,400 | 68,068 | ||||||
|
Hotels, Restaurants & Leisure - 2.40%
|
||||||||
|
International Game Technology
|
11,650 | 206,088 | ||||||
|
Las Vegas Sands Corp.*
|
9,700 | 455,997 | ||||||
|
Marriott International, Inc. - Class A
|
4,806 | 169,652 | ||||||
|
McDonald's Corp.
|
10,376 | 812,545 | ||||||
| 1,644,282 | ||||||||
|
Household Durables - 0.64%
|
||||||||
|
Fortune Brands, Inc.
|
5,113 | 332,754 | ||||||
|
Whirlpool Corp.
|
1,200 | 103,416 | ||||||
| 436,170 | ||||||||
|
Internet & Catalog Retail - 0.32%
|
||||||||
|
Blue Nile, Inc.*
|
1,500 | 85,500 | ||||||
|
Expedia, Inc.
|
3,195 | 79,971 | ||||||
|
Overstock.com, Inc.*
|
4,057 | 56,392 | ||||||
| 221,863 | ||||||||
|
Media - 2.99%
|
||||||||
|
Cablevision Systems Corp. - New York Group - Class A
|
9,058 | 319,113 | ||||||
|
CBS Corp. - Class B - Non-Voting Shares
|
5,413 | 136,516 | ||||||
|
Comcast Corp. - Class A
|
11,050 | 289,952 | ||||||
|
DIRECTV - Class A*
|
11,760 | 571,419 | ||||||
|
Interpublic Group of Cos., Inc. (The)
|
95 | 1,116 | ||||||
|
Liberty Global, Inc. - Class A*
|
5,666 | 263,469 | ||||||
|
Liberty Media Corp. - Starz - Series A*
|
846 | 65,015 | ||||||
|
News Corp. - Class A
|
605 | 10,781 | ||||||
|
Sirius XM Radio, Inc.*
|
41,300 | 82,187 | ||||||
|
Time Warner Cable, Inc.
|
883 | 68,989 | ||||||
|
Virgin Media, Inc.
|
650 | 19,669 | ||||||
|
Walt Disney Co. (The)
|
5,113 | 220,370 | ||||||
| 2,048,596 | ||||||||
|
Security
|
Shares
|
Market
Value
|
||||||
|
Multi-Line Retail - 0.40%
|
||||||||
|
Dollar General Corp.*
|
2,595 | $ | 84,571 | |||||
|
Macy's, Inc.
|
3,000 | 71,730 | ||||||
|
Sears Holdings Corp.*
|
700 | 60,179 | ||||||
|
Target Corp.
|
1,251 | 61,424 | ||||||
| 277,904 | ||||||||
|
Specialty Retail - 1.56%
|
||||||||
|
Abercrombie & Fitch Co. - Class A
|
2,100 | 148,680 | ||||||
|
Foot Locker, Inc.
|
3,232 | 69,553 | ||||||
|
Gap, Inc. (The)
|
7,669 | 178,227 | ||||||
|
Home Depot, Inc. (The)
|
5,113 | 189,897 | ||||||
|
Limited Brands, Inc.
|
2,500 | 102,900 | ||||||
|
Lowe's Cos., Inc.
|
4,110 | 107,887 | ||||||
|
PetSmart, Inc.
|
2,500 | 105,425 | ||||||
|
Systemax, Inc.*
|
4,121 | 53,367 | ||||||
|
Williams-Sonoma, Inc.
|
2,700 | 117,207 | ||||||
| 1,073,143 | ||||||||
|
Textiles, Apparel & Luxury Goods - 0.30%
|
||||||||
|
NIKE, Inc. - Class B
|
2,500 | 205,800 | ||||||
|
Consumer Staples - 7.82%
|
||||||||
|
Beverages - 0.54%
|
||||||||
|
Coca-Cola Co. (The)
|
2,500 | 168,650 | ||||||
|
Constellation Brands, Inc.*
|
4,900 | 109,711 | ||||||
|
PepsiCo, Inc.
|
1,328 | 91,486 | ||||||
| 369,847 | ||||||||
|
Food & Staples Retailing - 1.77%
|
||||||||
|
CVS Caremark Corp.
|
200 | 7,248 | ||||||
|
Kroger Co. (The)
|
2,600 | 63,206 | ||||||
|
Safeway, Inc.
|
2,700 | 65,637 | ||||||
|
Sysco Corp.
|
2,100 | 60,711 | ||||||
|
Wal-Mart Stores, Inc.
|
13,006 | 715,070 | ||||||
|
Walgreen Co.
|
3,700 | 158,064 | ||||||
|
Whole Foods Market, Inc.
|
2,300 | 144,348 | ||||||
| 1,214,284 | ||||||||
|
Food Products - 1.33%
|
||||||||
|
Dole Food Co., Inc.*
|
3,200 | 44,192 | ||||||
|
General Mills, Inc.
|
4,926 | 190,045 | ||||||
|
Hershey Co. (The)
|
5,113 | 295,071 | ||||||
|
Hormel Foods Corp.
|
10,226 | 300,747 | ||||||
|
McCormick & Co., Inc. - Non-Voting Shares
|
1,598 | 78,494 | ||||||
| 908,549 | ||||||||
See Notes to Financial Statements.
| 20 |
|
ISI Strategy Fund
|
|
Schedule of Investments (continued)
|
April 30, 2011 (Unaudited)
|
|
Security
|
Shares
|
Market
Value
|
||||||
|
COMMON STOCKS - 88.98% (continued)
|
||||||||
|
Consumer Staples - 7.82% (continued)
|
||||||||
|
Household Products - 1.04%
|
||||||||
|
Procter & Gamble Co. (The)
|
11,021 | $ | 715,263 | |||||
|
Personal Products - 0.69%
|
||||||||
|
Avon Products, Inc.
|
5,100 | 149,838 | ||||||
|
Herbalife Ltd.
|
3,576 | 321,053 | ||||||
| 470,891 | ||||||||
|
Tobacco - 2.45%
|
||||||||
|
Altria Group, Inc.
|
5,252 | 140,963 | ||||||
|
Philip Morris International, Inc.
|
16,689 | 1,158,884 | ||||||
|
Reynolds American, Inc.
|
10,326 | 383,198 | ||||||
| 1,683,045 | ||||||||
|
Energy - 13.40%
|
||||||||
|
Energy Equipment & Services - 1.77%
|
||||||||
|
Complete Production Services, Inc.*
|
95 | 3,224 | ||||||
|
Halliburton Co.
|
4,200 | 212,016 | ||||||
|
McDermott International, Inc.*
|
4,600 | 106,214 | ||||||
|
Patterson-UTI Energy, Inc.
|
14,440 | 449,229 | ||||||
|
RPC, Inc.
|
13,800 | 373,290 | ||||||
|
Unit Corp.*
|
1,100 | 69,322 | ||||||
| 1,213,295 | ||||||||
|
Oil, Gas & Consumable Fuels - 11.63%
|
||||||||
|
Alpha Natural Resources, Inc.*
|
6,800 | 395,556 | ||||||
|
Arch Coal, Inc.
|
2,200 | 75,460 | ||||||
|
Berry Petroleum Co. - Class A
|
3,060 | 162,578 | ||||||
|
Chesapeake Energy Corp.
|
6,600 | 222,222 | ||||||
|
Chevron Corp.
|
9,702 | 1,061,787 | ||||||
|
Clean Energy Fuels Corp.*
|
9,990 | 170,229 | ||||||
|
ConocoPhillips
|
8,950 | 706,423 | ||||||
|
Continental Resources, Inc.*
|
4,110 | 282,275 | ||||||
|
Crosstex Energy, Inc.
|
6,500 | 68,575 | ||||||
|
Energy XXI (Bermuda) Ltd.*
|
1,900 | 68,875 | ||||||
|
Exxon Mobil Corp.
|
27,341 | 2,406,008 | ||||||
|
Frontier Oil Corp.*
|
3,200 | 89,408 | ||||||
|
General Maritime Corp.
|
9,100 | 19,474 | ||||||
|
Goodrich Petroleum Corp.*
|
3,200 | 71,904 | ||||||
|
Holly Corp.
|
2,900 | 167,910 | ||||||
|
Marathon Oil Corp.
|
9,223 | 498,411 | ||||||
|
Massey Energy Co.
|
1,100 | 75,064 | ||||||
|
McMoRan Exploration Co.*
|
5,000 | 91,550 | ||||||
|
Security
|
Shares
|
Market
Value
|
||||||
|
Oil, Gas & Consumable Fuels - 11.63% (continued)
|
||||||||
|
Murphy Oil Corp.
|
2,400 | $ | 185,952 | |||||
|
Petrohawk Energy Corp.*
|
3,100 | 83,731 | ||||||
|
Quicksilver Resources, Inc.*
|
10,000 | 148,500 | ||||||
|
Ship Finance International Ltd.
|
5,112 | 102,189 | ||||||
|
Southern Union Co.
|
2,100 | 62,790 | ||||||
|
Southwestern Energy Co.*
|
500 | 21,930 | ||||||
|
Sunoco, Inc.
|
1,400 | 59,724 | ||||||
|
Teekay Corp.
|
1,250 | 42,487 | ||||||
|
Tesoro Corp.*
|
4,400 | 119,328 | ||||||
|
USEC, Inc.*
|
10,015 | 45,869 | ||||||
|
W&T Offshore, Inc.
|
7,100 | 190,351 | ||||||
|
Whiting Petroleum Corp.*
|
2,000 | 139,000 | ||||||
|
World Fuel Services Corp.
|
3,500 | 138,530 | ||||||
| 7,974,090 | ||||||||
|
Financials - 13.48%
|
||||||||
|
Capital Markets - 3.34%
|
||||||||
|
Artio Global Investors, Inc.
|
6,600 | 108,438 | ||||||
|
BlackRock, Inc. - Class A
|
2,346 | 459,675 | ||||||
|
Charles Schwab Corp. (The)
|
14,435 | 264,305 | ||||||
|
E*TRADE Financial Corp.*
|
20,300 | 329,672 | ||||||
|
Invesco Ltd.
|
4,511 | 112,188 | ||||||
|
Morgan Stanley
|
4,612 | 120,604 | ||||||
|
SEI Investments Co.
|
6,566 | 146,619 | ||||||
|
TD AMERITRADE Holding Corp.*
|
34,870 | 751,100 | ||||||
| 2,292,601 | ||||||||
|
Commercial Banks - 1.53%
|
||||||||
|
Centerstate Banks, Inc.
|
496 | 3,085 | ||||||
|
Cullen/Frost Bankers, Inc.
|
5,263 | 311,780 | ||||||
|
FirstMerit Corp.
|
3,500 | 61,145 | ||||||
|
MB Financial, Inc.
|
4,900 | 101,381 | ||||||
|
Susquehanna Bancshares, Inc.
|
6,112 | 56,353 | ||||||
|
Webster Financial Corp.
|
3,000 | 64,560 | ||||||
|
Wells Fargo & Co.
|
15,363 | 447,217 | ||||||
| 1,045,521 | ||||||||
|
Consumer Finance - 0.14%
|
||||||||
|
Advance America Cash Advance Centers, Inc.
|
3,360 | 19,757 | ||||||
|
Dollar Financial Corp.*
|
3,400 | 78,166 | ||||||
| 97,923 | ||||||||
|
Diversified Financial Services - 2.52%
|
||||||||
|
Bank of America Corp.
|
35,721 | 438,654 | ||||||
|
Citigroup, Inc.*
|
14,702 | 67,482 | ||||||
See Notes to Financial Statements.
| 21 |
|
ISI Strategy Fund
|
|
Schedule of Investments (continued)
|
April 30, 2011 (Unaudited)
|
|
Security
|
Shares
|
Market
Value
|
||||||
|
COMMON STOCKS - 88.98% (continued)
|
||||||||
|
Financials - 13.48% (continued)
|
||||||||
|
Diversified Financial Services - 2.52% (continued)
|
||||||||
|
CME Group, Inc.
|
852 | $ | 251,996 | |||||
|
JPMorgan Chase & Co.
|
20,881 | 952,800 | ||||||
|
Leucadia National Corp.
|
500 | 19,330 | ||||||
| 1,730,262 | ||||||||
|
Insurance - 3.52%
|
||||||||
|
Allstate Corp. (The)
|
2,400 | 81,216 | ||||||
|
American Equity Investment Life Holding Co.
|
10,400 | 133,744 | ||||||
|
Brown & Brown, Inc.
|
14,000 | 361,900 | ||||||
|
Cincinnati Financial Corp.
|
4,712 | 149,276 | ||||||
|
CNA Financial Corp.*
|
8,200 | 254,528 | ||||||
|
CNO Financial Group, Inc.*
|
15,600 | 125,736 | ||||||
|
Endurance Specialty Holdings Ltd.
|
3,000 | 133,020 | ||||||
|
Loews Corp.
|
7,920 | 350,539 | ||||||
|
MetLife, Inc.
|
6,275 | 293,607 | ||||||
|
Protective Life Corp.
|
6,280 | 168,995 | ||||||
|
Prudential Financial, Inc.
|
4,163 | 264,017 | ||||||
|
StanCorp Financial Group, Inc.
|
101 | 4,353 | ||||||
|
Unitrin, Inc.
|
2,965 | 89,662 | ||||||
| 2,410,593 | ||||||||
|
Real Estate Investment Trusts - 1.56%
|
||||||||
|
American Capital Agency Corp.
|
14,250 | 414,818 | ||||||
|
Hatteras Financial Corp.
|
23,008 | 653,657 | ||||||
| 1,068,475 | ||||||||
|
Thrifts & Mortgage Finance - 0.87%
|
||||||||
|
First Niagara Financial Group, Inc.
|
5,113 | 73,627 | ||||||
|
Flagstar Bancorp, Inc.*
|
9,500 | 14,820 | ||||||
|
New York Community Bancorp, Inc.
|
21,800 | 361,880 | ||||||
|
Radian Group, Inc.
|
6,200 | 36,766 | ||||||
|
TFS Financial Corp.
|
10,000 | 108,800 | ||||||
| 595,893 | ||||||||
|
Health Care - 11.47%
|
||||||||
|
Biotechnology - 0.75%
|
||||||||
|
Acorda Therapeutics, Inc.*
|
3,000 | 84,120 | ||||||
|
Amylin Pharmaceuticals, Inc.*
|
7,300 | 97,090 | ||||||
|
Cepheid, Inc.*
|
5,080 | 164,135 | ||||||
|
GTx, Inc.*
|
1,000 | 4,260 | ||||||
|
Incyte Corp.*
|
4,100 | 75,768 | ||||||
|
Security
|
Shares
|
Market
Value
|
||||||
|
Biotechnology - 0.75% (continued)
|
||||||||
|
Myriad Genetics, Inc.*
|
3,000 | $ | 64,320 | |||||
|
Neurocrine Biosciences, Inc.*
|
2,900 | 22,301 | ||||||
| 511,994 | ||||||||
|
Health Care Equipment & Supplies - 1.38%
|
||||||||
|
Baxter International, Inc.
|
502 | 28,564 | ||||||
|
Conceptus, Inc.*
|
5,290 | 81,625 | ||||||
|
IDEXX Laboratories, Inc.*
|
5,163 | 420,423 | ||||||
|
Meridian Bioscience, Inc.
|
3,105 | 76,724 | ||||||
|
Sirona Dental Systems, Inc.*
|
4,800 | 273,936 | ||||||
|
STERIS Corp.
|
1,748 | 62,998 | ||||||
| 944,270 | ||||||||
|
Health Care Providers & Services - 4.75%
|
||||||||
|
AmerisourceBergen Corp.
|
10,700 | 434,848 | ||||||
|
Brookdale Senior Living, Inc.*
|
10,000 | 272,400 | ||||||
|
Catalyst Health Solutions, Inc.*
|
2,500 | 148,900 | ||||||
|
Community Health Systems, Inc.*
|
13,800 | 424,074 | ||||||
|
Express Scripts, Inc.*
|
1,500 | 85,110 | ||||||
|
Health Management Associates, Inc. - Class A*
|
12,000 | 135,360 | ||||||
|
Health Net, Inc.*
|
16,500 | 549,450 | ||||||
|
LifePoint Hospitals, Inc.*
|
2,000 | 83,220 | ||||||
|
Magellan Health Services, Inc.*
|
3,100 | 161,262 | ||||||
|
McKesson Corp.
|
1,200 | 99,612 | ||||||
|
Medco Health Solutions, Inc.*
|
1,230 | 72,976 | ||||||
|
MEDNAX, Inc.*
|
2,900 | 205,668 | ||||||
|
Omnicare, Inc.
|
10,000 | 314,200 | ||||||
|
Owens & Minor, Inc.
|
1,100 | 37,895 | ||||||
|
Select Medical Holdings Corp.*
|
7,900 | 70,468 | ||||||
|
Team Health Holdings, Inc.*
|
7,600 | 151,088 | ||||||
|
WellPoint, Inc.
|
171 | 13,131 | ||||||
| 3,259,662 | ||||||||
|
Health Care Technology - 0.43%
|
||||||||
|
Allscripts Healthcare Solutions, Inc.*
|
12,450 | 268,173 | ||||||
|
Omnicell, Inc.*
|
1,600 | 24,608 | ||||||
| 292,781 | ||||||||
|
Life Sciences Tools & Services - 0.84%
|
||||||||
|
Bruker Corp.*
|
22,800 | 450,072 | ||||||
|
Pharmaceutical Product Development, Inc.
|
4,000 | 123,400 | ||||||
| 573,472 | ||||||||
See Notes to Financial Statements.
| 22 |
|
ISI Strategy Fund
|
|
Schedule of Investments (continued)
|
April 30, 2011 (Unaudited)
|
|
Security
|
Shares
|
Market
Value
|
||||||
|
COMMON STOCKS - 88.98% (continued)
|
||||||||
|
Health Care - 11.47% (continued)
|
||||||||
|
Pharmaceuticals - 3.32%
|
||||||||
|
Abbott Laboratories
|
4,546 | $ | 236,574 | |||||
|
Allergan, Inc.
|
921 | 73,275 | ||||||
|
Bristol-Myers Squibb Co.
|
2,803 | 78,764 | ||||||
|
Johnson & Johnson
|
13,038 | 856,857 | ||||||
|
Medicis Pharmaceutical Corp. - Class A
|
2,500 | 88,650 | ||||||
|
Merck & Co., Inc.
|
3,302 | 118,707 | ||||||
|
Pfizer, Inc.
|
36,340 | 761,687 | ||||||
|
ViroPharma, Inc.*
|
3,400 | 65,586 | ||||||
| 2,280,100 | ||||||||
|
Industrials - 10.03%
|
||||||||
|
Aerospace & Defense - 1.99%
|
||||||||
|
AAR Corp.*
|
2,052 | 53,434 | ||||||
|
Alliant Techsystems, Inc.
|
4,300 | 303,795 | ||||||
|
Boeing Co. (The)
|
1,300 | 103,714 | ||||||
|
Goodrich Corp.
|
1,153 | 101,890 | ||||||
|
Honeywell International, Inc.
|
3,609 | 220,979 | ||||||
|
Huntington Ingalls Industries, Inc.*
|
718 | 28,720 | ||||||
|
Northrop Grumman Corp.
|
4,311 | 274,223 | ||||||
|
United Technologies Corp.
|
3,108 | 278,415 | ||||||
| 1,365,170 | ||||||||
|
Air Freight & Logistics - 0.39%
|
||||||||
|
FedEx Corp.
|
856 | 81,894 | ||||||
|
United Parcel Service, Inc. - Class B
|
2,500 | 187,425 | ||||||
| 269,319 | ||||||||
|
Airlines - 0.15%
|
||||||||
|
United Continental Holdings, Inc.*
|
4,502 | 102,736 | ||||||
|
Building Products - 0.09%
|
||||||||
|
Griffon Corp.*
|
4,700 | 59,878 | ||||||
|
Commercial Services & Supplies - 0.36%
|
||||||||
|
ABM Industries, Inc.
|
500 | 12,160 | ||||||
|
ACCO Brands Corp.*
|
95 | 923 | ||||||
|
Cenveo, Inc.*
|
700 | 4,536 | ||||||
|
EnerNOC, Inc.*
|
3,230 | 57,849 | ||||||
|
Geo Group, Inc. (The)*
|
2,900 | 77,372 | ||||||
|
United Stationers, Inc.*
|
1,200 | 86,472 | ||||||
|
Security
|
Shares
|
Market
Value
|
||||||
|
Commercial Services & Supplies - 0.36% (continued)
|
||||||||
|
US Ecology, Inc.
|
540 | $ | 9,914 | |||||
| 249,226 | ||||||||
|
Construction & Engineering - 0.61%
|
||||||||
|
Aecom Technology Corp.*
|
2,000 | 54,520 | ||||||
|
Shaw Group, Inc. (The)*
|
5,300 | 206,170 | ||||||
|
Tutor Perini Corp.
|
5,800 | 154,628 | ||||||
| 415,318 | ||||||||
|
Electrical Equipment - 0.25%
|
||||||||
|
American Superconductor Corp.*
|
3,500 | 41,475 | ||||||
|
General Cable Corp.*
|
2,600 | 126,100 | ||||||
| 167,575 | ||||||||
|
Industrial Conglomerates - 1.05%
|
||||||||
|
3M Co.
|
2,456 | 238,748 | ||||||
|
General Electric Co.
|
23,560 | 481,802 | ||||||
| 720,550 | ||||||||
|
Machinery - 3.13%
|
||||||||
|
Actuant Corp. - Class A
|
2,000 | 55,520 | ||||||
|
Blount International, Inc.*
|
3,800 | 63,080 | ||||||
|
Briggs & Stratton Corp.
|
2,900 | 68,411 | ||||||
|
Caterpillar, Inc.
|
3,567 | 411,667 | ||||||
|
Graco, Inc.
|
3,490 | 174,605 | ||||||
|
Illinois Tool Works, Inc.
|
1,191 | 69,566 | ||||||
|
Joy Global, Inc.
|
5,163 | 521,205 | ||||||
|
Manitowoc Co., Inc. (The)
|
6,700 | 148,673 | ||||||
|
Meritor, Inc.*
|
1,800 | 30,978 | ||||||
|
Mueller Industries, Inc.
|
3,300 | 129,096 | ||||||
|
Navistar International Corp.*
|
5,850 | 406,692 | ||||||
|
Timken Co. (The)
|
1,200 | 67,668 | ||||||
| 2,147,161 | ||||||||
|
Professional Services - 0.71%
|
||||||||
|
Acacia Research - Acacia Technologies*
|
2,800 | 115,108 | ||||||
|
Mistras Group, Inc.*
|
1,200 | 21,984 | ||||||
|
Verisk Analytics, Inc. - Class A*
|
10,600 | 348,740 | ||||||
| 485,832 | ||||||||
|
Road & Rail - 0.51%
|
||||||||
|
Union Pacific Corp.
|
3,400 | 351,798 | ||||||
|
Trading Companies & Distributors - 0.79%
|
||||||||
|
Aircastle Ltd.
|
597 | 7,438 | ||||||
|
Fastenal Co.
|
5,363 | 359,804 | ||||||
See Notes to Financial Statements.
| 23 |
|
ISI Strategy Fund
|
|
Schedule of Investments (continued)
|
April 30, 2011 (Unaudited)
|
|
Security
|
Shares
|
Market
Value
|
||||||
|
COMMON STOCKS - 88.98% (continued)
|
||||||||
|
Industrials - 10.03% (continued)
|
||||||||
|
Trading Companies & Distributors - 0.79% (continued)
|
||||||||
|
Titan Machinery, Inc.*
|
500 | $ | 15,730 | |||||
|
United Rentals, Inc.*
|
500 | 14,710 | ||||||
|
WESCO International, Inc.*
|
2,300 | 142,485 | ||||||
| 540,167 | ||||||||
|
Information Technology - 16.90%
|
||||||||
|
Communications Equipment - 0.31%
|
||||||||
|
Brocade Communications Systems, Inc.*
|
10,500 | 65,625 | ||||||
|
Cisco Systems, Inc.*
|
3,160 | 55,490 | ||||||
|
Motorola Solutions, Inc.*
|
2,000 | 91,760 | ||||||
| 212,875 | ||||||||
|
Computers & Peripherals - 3.60%
|
||||||||
|
Apple, Inc.*
|
6,113 | 2,128,730 | ||||||
|
Hewlett-Packard Co.
|
1,700 | 68,629 | ||||||
|
Lexmark International, Inc.*
|
1,700 | 54,825 | ||||||
|
NCR Corp.*
|
3,100 | 61,411 | ||||||
|
QLogic Corp.*
|
3,700 | 66,526 | ||||||
|
STEC, Inc.*
|
4,120 | 86,190 | ||||||
| 2,466,311 | ||||||||
|
Electronic Equipment, Instruments & Components - 2.60%
|
||||||||
|
Agilent Technologies, Inc.*
|
1,768 | 88,241 | ||||||
|
Anixter International, Inc.
|
4,500 | 338,130 | ||||||
|
AVX Corp.
|
7,480 | 121,999 | ||||||
|
Brightpoint, Inc.*
|
7,250 | 73,370 | ||||||
|
Ingram Micro, Inc. - Class A*
|
12,310 | 230,566 | ||||||
|
Insight Enterprises, Inc.*
|
4,800 | 82,368 | ||||||
|
Itron, Inc.*
|
3,130 | 170,366 | ||||||
|
L-1 Identity Solutions, Inc.*
|
1,142 | 13,395 | ||||||
|
Plexus Corp.*
|
500 | 18,245 | ||||||
|
Sanmina-SCI Corp.*
|
3,900 | 45,708 | ||||||
|
ScanSource, Inc.*
|
1,674 | 59,879 | ||||||
|
SYNNEX Corp.*
|
2,200 | 73,766 | ||||||
|
Tech Data Corp.*
|
4,669 | 248,064 | ||||||
|
TTM Technologies, Inc.*
|
3,700 | 70,744 | ||||||
|
Vishay Intertechnology, Inc.*
|
7,700 | 146,916 | ||||||
| 1,781,757 | ||||||||
|
Internet Software & Services - 1.49%
|
||||||||
|
Earthlink, Inc.
|
13,300 | 109,326 | ||||||
|
Google, Inc. - Class A*
|
1,406 | 765,005 | ||||||
|
Security
|
Shares
|
Market
Value
|
||||||
|
Internet Software & Services - 1.49% (continued)
|
||||||||
|
WebMD Health Corp.*
|
1,200 | $ | 69,444 | |||||
|
Yahoo!, Inc.*
|
4,400 | 78,100 | ||||||
| 1,021,875 | ||||||||
|
IT Services - 3.69%
|
||||||||
|
CACI International, Inc. - Class A*
|
990 | 60,499 | ||||||
|
Cardtronics, Inc.*
|
3,033 | 64,451 | ||||||
|
Convergys Corp.*
|
10,200 | 147,900 | ||||||
|
CoreLogic, Inc.*
|
3,000 | 55,230 | ||||||
|
DST Systems, Inc.
|
2,500 | 123,275 | ||||||
|
Fidelity National Information Services, Inc.
|
280 | 9,268 | ||||||
|
Heartland Payment Systems, Inc.
|
6,122 | 122,195 | ||||||
|
International Business Machines Corp.
|
8,744 | 1,491,552 | ||||||
|
Lender Processing Services, Inc.
|
2,240 | 65,923 | ||||||
|
ManTech International Corp. - Class A*
|
1,400 | 61,446 | ||||||
|
SAIC, Inc.*
|
4,800 | 83,520 | ||||||
|
Teradata Corp.*
|
1,933 | 108,094 | ||||||
|
Unisys Corp.*
|
4,540 | 134,747 | ||||||
| 2,528,100 | ||||||||
|
Office Electronics - 0.08%
|
||||||||
|
Xerox Corp.
|
5,300 | 53,477 | ||||||
|
Semiconductors & Semiconductor Equipment - 2.24%
|
||||||||
|
Amkor Technology, Inc.*
|
10,000 | 67,000 | ||||||
|
Integrated Device Technology, Inc.*
|
28,653 | 233,092 | ||||||
|
Intel Corp.
|
10,099 | 234,196 | ||||||
|
Intersil Corp. - Class A
|
14,555 | 214,977 | ||||||
|
MEMC Electronic Materials, Inc.*
|
6,700 | 79,261 | ||||||
|
OmniVision Technologies, Inc.*
|
2,600 | 87,360 | ||||||
|
Photronics, Inc.*
|
2,600 | 22,698 | ||||||
|
Rambus, Inc.*
|
3,770 | 75,023 | ||||||
|
SunPower Corp. - Class A*
|
3,600 | 78,372 | ||||||
|
Teradyne, Inc.*
|
5,112 | 82,303 | ||||||
|
Texas Instruments, Inc.
|
10,275 | 365,071 | ||||||
| 1,539,353 | ||||||||
See Notes to Financial Statements.
| 24 |
|
ISI Strategy Fund
|
|
Schedule of Investments (continued)
|
April 30, 2011 (Unaudited)
|
|
Security
|
Shares
|
Market
Value
|
||||||
|
COMMON STOCKS - 88.98% (continued)
|
||||||||
|
Information Technology - 16.90% (continued)
|
||||||||
|
Software - 2.89%
|
||||||||
|
ANSYS, Inc.*
|
5,113 | $ | 282,698 | |||||
|
Blackbaud, Inc.
|
2,910 | 80,491 | ||||||
|
Cadence Design Systems, Inc.*
|
16,250 | 168,675 | ||||||
|
Epicor Software Corp.*
|
2,100 | 26,250 | ||||||
|
Microsoft Corp.
|
31,122 | 809,794 | ||||||
|
Oracle Corp.
|
7,169 | 258,442 | ||||||
|
Pegasystems, Inc.
|
2,850 | 105,821 | ||||||
|
Quest Software, Inc.*
|
7,000 | 180,320 | ||||||
|
Taleo Corp. - Class A*
|
1,900 | 68,913 | ||||||
| 1,981,404 | ||||||||
|
Materials - 4.05%
|
||||||||
|
Chemicals - 2.36%
|
||||||||
|
A. Schulman, Inc.
|
3,058 | 77,429 | ||||||
|
Cytec Industries, Inc.
|
5,113 | 300,031 | ||||||
|
Dow Chemical Co. (The)
|
4,169 | 170,887 | ||||||
|
Olin Corp.
|
4,388 | 112,947 | ||||||
|
PolyOne Corp.*
|
4,377 | 63,379 | ||||||
|
Rockwood Holdings, Inc.*
|
3,058 | 173,511 | ||||||
|
RPM International, Inc.
|
12,608 | 296,288 | ||||||
|
Spartech Corp.*
|
3,420 | 24,419 | ||||||
|
W.R. Grace & Co.*
|
8,851 | 401,481 | ||||||
| 1,620,372 | ||||||||
|
Containers & Packaging - 0.32%
|
||||||||
|
Boise, Inc.
|
6,380 | 62,652 | ||||||
|
Graham Packaging Co., Inc.*
|
6,866 | 157,918 | ||||||
|
Graphic Packaging Holding Co.*
|
335 | 1,839 | ||||||
| 222,409 | ||||||||
|
Metals & Mining - 1.37%
|
||||||||
|
Freeport-McMoRan Copper & Gold, Inc.
|
2,000 | 110,060 | ||||||
|
Metals USA Holdings Corp.*
|
2,600 | 44,200 | ||||||
|
Royal Gold, Inc.
|
1,595 | 97,263 | ||||||
|
Southern Copper Corp.
|
8,585 | 321,594 | ||||||
|
Titanium Metals Corp.*
|
4,512 | 90,375 | ||||||
|
United States Steel Corp.
|
95 | 4,532 | ||||||
|
Walter Energy, Inc.
|
1,400 | 193,508 | ||||||
|
Worthington Industries, Inc.
|
3,559 | 76,768 | ||||||
| 938,300 | ||||||||
|
Security
|
Shares
|
Market
Value
|
||||||
|
Telecommunication Services - 1.09%
|
||||||||
|
Diversified Telecommunication Services - 0.84%
|
||||||||
|
CenturyLink, Inc.
|
11,449 | $ | 466,890 | |||||
|
Cogent Communications Group, Inc.*
|
4,100 | 59,491 | ||||||
|
Global Crossing Ltd.*
|
1,820 | 42,552 | ||||||
|
Level 3 Communications, Inc.*
|
1,000 | 1,560 | ||||||
|
PAETEC Holding Corp.*
|
902 | 3,247 | ||||||
| 573,740 | ||||||||
|
Wireless Telecommunication Services - 0.25%
|
||||||||
|
American Tower Corp. - Class A*
|
1,900 | 99,389 | ||||||
|
MetroPCS Communications, Inc.*
|
4,500 | 75,735 | ||||||
| 175,124 | ||||||||
|
Utilities - 2.02%
|
||||||||
|
Electric Utilities - 1.00%
|
||||||||
|
Exelon Corp.
|
7,819 | 329,571 | ||||||
|
NV Energy, Inc.
|
14,400 | 218,736 | ||||||
|
PPL Corp.
|
5,113 | 140,250 | ||||||
| 688,557 | ||||||||
|
Multi-Utilities - 0.57%
|
||||||||
|
Alliant Energy Corp.
|
2,300 | 90,942 | ||||||
|
Ameren Corp.
|
10,200 | 298,962 | ||||||
| 389,904 | ||||||||
|
Water Utilities - 0.45%
|
||||||||
|
American Water Works Co., Inc.
|
10,400 | 305,552 | ||||||
|
Total Common Stocks (Cost $45,956,031)
|
$ | 61,005,926 | ||||||
See Notes to Financial Statements.
| 25 |
|
ISI Strategy Fund
|
|
Schedule of Investments (continued)
|
April 30, 2011 (Unaudited)
|
|
Security
|
Interest
Rate
|
Maturity
Date
|
Principal
Amount
|
Market
Value
|
|||||||||
|
US TREASURY OBLIGATIONS - 9.41%
|
|||||||||||||
|
US Treasury Notes
|
3.875% |
10/31/12
|
$ | 500,000 | $ | 526,094 | |||||||
|
US Treasury Notes
|
2.000% |
01/31/16
|
800,000 | 804,875 | |||||||||
|
US Treasury Notes
|
2.625% |
08/15/20
|
2,000,000 | 1,902,032 | |||||||||
|
US Treasury Bonds
|
8.125% |
08/15/19
|
1,900,000 | 2,633,875 | |||||||||
|
US Treasury Bonds
|
8.750% |
08/15/20
|
400,000 | 581,531 | |||||||||
|
Total US Treasury Obligations (Cost $6,442,280)
|
$ | 6,448,407 | |||||||||||
|
Security
|
Principal
Amount
|
Market
Value
|
||||||
|
REPURCHASE AGREEMENTS - 1.61%
|
||||||||
|
JPMorgan Chase, N.A.
|
||||||||
|
Dated 04/29/11, 0.01%, principal and interest in the amount of $1,102,000 to be repurchased 05/02/11, collateralized by US Treasury Inflation-Protected Note, par value of $860,000 due 07/15/14 with a value of $1,127,399 (Cost $1,102,000)
|
$ | 1,102,000 | $ | 1,102,000 | ||||
|
Total Investments - 100.00% (Cost $53,500,311)**
|
$ | 68,556,333 | ||||||
|
Other Assets in Excess of Liabilities – 0.00%
|
1,184 | |||||||
|
Net Assets - 100.00%
|
$ | 68,557,517 | ||||||
|
*
|
Non-income producing security.
|
|
**
|
Cost for Federal income tax purposes is $53,500,311 and net unrealized appreciation on a tax basis consists of:
|
|
Gross Unrealized Appreciation
|
$ | 16,754,146 | ||
|
Gross Unrealized Depreciation
|
(1,698,124 | ) | ||
|
Net Unrealized Appreciation
|
$ | 15,056,022 |
|
The difference between the federal income tax cost of portfolio investments and the Schedule of Investments cost is due to certain timing differences in the recognition of capital gains and losses under income tax regulations and accounting principles generally accepted in the United States. These timing differences are temporary in nature and are due to the tax deferral of losses on wash sales.
|
See Notes to Financial Statements.
| 26 |
|
ISI FUNDS
|
|
Statements of Assets and Liabilities
|
April 30, 2011 (Unaudited)
|
|
Total Return
US Treasury
Fund
|
Managed
Municipal
Fund
|
|||||||
|
ASSETS
|
||||||||
|
Investments in securities:
|
||||||||
|
At cost
|
$ | 81,560,755 | $ | 95,601,423 | ||||
|
At value (Note 1)
|
$ | 82,509,710 | $ | 97,404,945 | ||||
|
Investments in Repurchase Agreements:
|
||||||||
|
At cost
|
$ | 1,528,000 | $ | 6,413,000 | ||||
|
At value
|
$ | 1,528,000 | $ | 6,413,000 | ||||
|
Total investments in securities:
|
||||||||
|
At cost
|
$ | 83,088,755 | $ | 102,014,423 | ||||
|
At value
|
$ | 84,037,710 | $ | 103,817,945 | ||||
|
Cash
|
265 | 912 | ||||||
|
Interest receivable
|
702,558 | 1,022,673 | ||||||
|
Receivable for capital shares sold
|
2,312 | 24,389 | ||||||
|
Other assets
|
16,130 | 63,219 | ||||||
|
TOTAL ASSETS
|
84,758,975 | 104,929,138 | ||||||
|
LIABILITIES
|
||||||||
|
Distributions payable
|
43,619 | 101,702 | ||||||
|
Payable for capital shares redeemed
|
5,059 | 132,349 | ||||||
|
Accrued investment advisory fees (Note 2)
|
29,580 | 34,366 | ||||||
|
Accrued distribution fees (Note 2)
|
17,339 | 20,916 | ||||||
|
Accrued transfer agent fees (Note 2)
|
10,835 | 3,356 | ||||||
|
Accrued administration fees (Note 2)
|
10,357 | 10,711 | ||||||
|
Other accrued expenses and liabilities
|
13,629 | 6,904 | ||||||
|
TOTAL LIABILITIES
|
130,418 | 310,304 | ||||||
|
NET ASSETS
|
$ | 84,628,557 | $ | 104,618,834 | ||||
|
NET ASSETS CONSIST OF:
|
||||||||
|
Paid-in capital
|
$ | 83,604,862 | $ | 102,856,670 | ||||
|
Undistributed (distributions in excess of) net investment income
|
(288,582 | ) | 92 | |||||
|
Accumulated net realized gains (losses) from security transactions
|
363,322 | (41,450 | ) | |||||
|
Net unrealized appreciation on investments
|
948,955 | 1,803,522 | ||||||
|
Net assets
|
$ | 84,628,557 | $ | 104,618,834 | ||||
See Notes to Financial Statements.
| 27 |
|
ISI FUNDS
|
|
Statements of Assets and Liabilities (continued)
|
April 30, 2011 (Unaudited)
|
|
Total Return
US Treasury
Fund
|
Managed
Municipal
Fund
|
|||||||
|
SHARES OF CAPITAL STOCK OUTSTANDING OF $0.001 PAR VALUE
|
||||||||
|
ISI Class A Shares (50,000,000 shares authorized)
|
— | 9,703,254 | ||||||
|
ISI Class I Shares (5,000,000 shares authorized)
|
— | 268,104 | ||||||
|
ISI Shares (115,000,000 shares authorized)
|
8,686,163 | — | ||||||
|
NET ASSET VALUE AND REDEMPTION PRICE PER SHARE
|
||||||||
|
ISI Class A Shares (based on net assets of $101,804,373)
|
$ | — | $ | 10.49 | ||||
|
ISI Class I Shares (based on net assets of $2,814,461)
|
$ | — | $ | 10.50 | ||||
|
ISI Shares (based on net assets of $84,628,557)
|
$ | 9.74 | $ | — | ||||
|
MAXIMUM OFFERING PRICE VALUE PER SHARE (100/97) X NET ASSET VALUE PER SHARE
|
||||||||
|
ISI Class A Shares
|
$ | — | $ | 10.81 | ||||
|
ISI Shares
|
$ | 10.04 | $ | — | ||||
See Notes to Financial Statements.
| 28 |
|
ISI FUNDS
|
|
Statements of Assets and Liabilities
|
April 30, 2011 (Unaudited)
|
|
North American Government Bond Fund
|
ISI
Strategy
Fund
|
|||||||
|
ASSETS
|
||||||||
|
Investments in securities:
|
||||||||
|
At cost
|
$ | 138,507,802 | $ | 53,500,311 | ||||
|
At value (Note 1)
|
$ | 142,277,669 | $ | 68,556,333 | ||||
|
Cash
|
436 | 691 | ||||||
|
Dividends and interest receivable, at value
|
2,007,064 | 91,391 | ||||||
|
Receivable for capital shares sold
|
201,035 | 4,978 | ||||||
|
Other assets
|
72,771 | 28,680 | ||||||
|
TOTAL ASSETS
|
144,558,975 | 68,682,073 | ||||||
|
LIABILITIES
|
||||||||
|
Distributions payable
|
121,944 | — | ||||||
|
Payable for capital shares redeemed
|
306,412 | 60,736 | ||||||
|
Accrued investment advisory fees (Note 2)
|
47,209 | 22,059 | ||||||
|
Accrued distribution fees (Note 2)
|
48,321 | 13,787 | ||||||
|
Accrued shareholder servicing fees (Note 2)
|
3,515 | — | ||||||
|
Accrued transfer agent fees (Note 2)
|
8,977 | 2,888 | ||||||
|
Accrued administration fees (Note 2)
|
15,245 | 20,306 | ||||||
|
Other accrued expenses and liabilities
|
16,090 | 4,780 | ||||||
|
TOTAL LIABILITIES
|
567,713 | 124,556 | ||||||
|
NET ASSETS
|
$ | 143,991,262 | $ | 68,557,517 | ||||
|
NET ASSETS CONSIST OF:
|
||||||||
|
Paid-in capital
|
$ | 140,567,566 | $ | 56,823,847 | ||||
|
Distributions in excess of net investment income
|
(785,357 | ) | (6,508 | ) | ||||
|
Accumulated net realized gains (losses) from security and foreign currency transactions
|
406,302 | (3,315,844 | ) | |||||
|
Net unrealized appreciation on investments and foreign currencies
|
3,802,751 | 15,056,022 | ||||||
|
Net assets
|
$ | 143,991,262 | $ | 68,557,517 | ||||
See Notes to Financial Statements.
| 29 |
|
ISI FUNDS
|
|
Statements of Assets and Liabilities (continued)
|
April 30, 2011 (Unaudited)
|
|
North American
Government
Bond Fund
|
ISI
Strategy
Fund
|
|||||||
|
SHARES OF CAPITAL STOCK OUTSTANDING OF $0.001 PAR VALUE
|
||||||||
|
ISI Class A Shares (50,000,000 shares authorized)
|
14,831,284 | — | ||||||
|
ISI Class C Shares (5,000,000 shares authorized)
|
2,187,654 | — | ||||||
|
ISI Class I Shares (5,000,000 shares authorized)
|
1,556,943 | — | ||||||
|
ISI Shares (25,000,000 shares authorized)
|
— | 4,938,561 | ||||||
|
NET ASSET VALUE AND REDEMPTION PRICE PER SHARE
|
||||||||
|
ISI Class A Shares (based on net assets of $115,017,097)
|
$ | 7.76 | $ | — | ||||
|
ISI Class C Shares (based on net assets of $16,884,367)*
|
$ | 7.72 | $ | — | ||||
|
ISI Class I Shares (based on net assets of $12,089,798)
|
$ | 7.77 | $ | — | ||||
|
ISI Shares (based on net assets of $68,557,517)
|
$ | — | $ | 13.88 | ||||
|
MAXIMUM OFFERING PRICE VALUE PER SHARE (100/97) X NET ASSET VALUE PER SHARE
|
||||||||
|
ISI Class A Shares
|
$ | 8.00 | $ | — | ||||
|
ISI Shares
|
$ | — | $ | 14.31 | ||||
|
*
|
Contingent deferred sales charge of 1.00% is imposed on the sale of shares if redeemed within the first year of purchase.
|
See Notes to Financial Statements.
| 30 |
|
ISI FUNDS
|
|
Statements of Operations
|
Six Months Ended April 30, 2011 (Unaudited)
|
|
Total Return
US Treasury
Fund
|
Managed
Municipal
Fund
|
|||||||
|
INVESTMENT INCOME
|
||||||||
|
Interest
|
$ | 1,037,604 | $ | 1,938,871 | ||||
|
Other income
|
394 | — | ||||||
|
TOTAL INVESTMENT INCOME
|
1,037,998 | 1,938,871 | ||||||
|
EXPENSES
|
||||||||
|
Investment advisory fees (Note 2)
|
112,855 | 208,787 | ||||||
|
Distribution fees (Note 2):
|
||||||||
|
ISI Class A Shares
|
— | 127,428 | ||||||
|
ISI Shares
|
111,224 | — | ||||||
|
Administration fees (Note 2)
|
35,769 | 38,542 | ||||||
|
Professional fees
|
36,153 | 36,489 | ||||||
|
Transfer agent fees (Note 2):
|
||||||||
|
ISI Class A Shares
|
— | 16,975 | ||||||
|
ISI Class I Shares
|
— | 267 | ||||||
|
ISI Shares
|
28,400 | — | ||||||
|
Registration fees
|
14,415 | 24,525 | ||||||
|
Custody fees
|
27,982 | 34,172 | ||||||
|
Compliance consulting fees (Note 2)
|
9,886 | 10,142 | ||||||
|
Directors' fees and expenses
|
9,116 | 9,280 | ||||||
|
Other expenses
|
16,433 | 11,698 | ||||||
|
TOTAL EXPENSES
|
402,233 | 518,305 | ||||||
|
NET INVESTMENT INCOME
|
635,765 | 1,420,566 | ||||||
|
REALIZED AND UNREALIZED GAINS (LOSSES) ON INVESTMENTS
|
||||||||
|
Net realized gains (losses) from security transactions
|
363,440 | (41,364 | ) | |||||
|
Net change in unrealized appreciation/depreciation on investments
|
(3,467,839 | ) | (2,653,578 | ) | ||||
|
NET REALIZED AND UNREALIZED LOSSES ON INVESTMENTS
|
(3,104,399 | ) | (2,694,942 | ) | ||||
|
NET DECREASE IN NET ASSETS FROM OPERATIONS
|
$ | (2,468,634 | ) | $ | (1,274,376 | ) | ||
See Notes to Financial Statements.
| 31 |
|
ISI FUNDS
|
|
Statements of Operations
|
Six Months Ended April 30, 2011 (Unaudited)
|
|
North American
Government Bond Fund
|
ISI
Strategy
Fund
|
|||||||
|
INVESTMENT INCOME
|
||||||||
|
Dividends
|
$ | — | $ | 616,974 | ||||
|
Interest
|
2,214,149 | 97,694 | ||||||
|
TOTAL INVESTMENT INCOME
|
2,214,149 | 714,668 | ||||||
|
EXPENSES
|
||||||||
|
Investment advisory fees (Note 2)
|
293,973 | 129,148 | ||||||
|
Distribution fees (Note 2):
|
||||||||
|
ISI Class A Shares
|
236,855 | — | ||||||
|
ISI Class C Shares
|
71,020 | — | ||||||
|
ISI Shares
|
— | 80,718 | ||||||
|
Administration fees (Note 2)
|
54,193 | 20,059 | ||||||
|
Professional fees
|
48,233 | 25,454 | ||||||
|
Transfer agent fees (Note 2):
|
||||||||
|
ISI Class A Shares
|
39,817 | — | ||||||
|
ISI Class C Shares
|
6,486 | — | ||||||
|
ISI Class I Shares
|
2,197 | — | ||||||
|
ISI Shares
|
— | 15,298 | ||||||
|
Registration fees
|
21,513 | 14,664 | ||||||
|
Shareholder servicing fees (Note 2):
|
||||||||
|
ISI Class C Shares
|
23,673 | — | ||||||
|
Compliance consulting fees (Note 2)
|
15,846 | 5,592 | ||||||
|
Directors' fees and expenses
|
13,262 | 5,396 | ||||||
|
Custody fees
|
52,790 | 23,186 | ||||||
|
Other expenses
|
30,367 | 12,253 | ||||||
|
TOTAL EXPENSES
|
910,225 | 331,768 | ||||||
|
NET INVESTMENT INCOME
|
1,303,924 | 382,900 | ||||||
|
REALIZED AND UNREALIZED GAINS (LOSSES) ON INVESTMENTS AND FOREIGN CURRENCIES (Note 1)
|
||||||||
|
Net realized gains (losses) from:
|
||||||||
|
Security transactions
|
424,483 | 2,352,536 | ||||||
|
Foreign currency transactions
|
(17,983 | ) | — | |||||
|
Net change in unrealized appreciation/depreciation on:
|
||||||||
|
Investments
|
(2,202,774 | ) | 5,698,664 | |||||
|
Foreign currency translation
|
19,430 | — | ||||||
|
NET REALIZED AND UNREALIZED GAINS (LOSSES) ON INVESTMENTS AND FOREIGN CURRENCIES
|
(1,776,844 | ) | 8,051,200 | |||||
|
NET INCREASE (DECREASE) IN NET ASSETS FROM OPERATIONS
|
$ | (472,920 | ) | $ | 8,434,100 | |||
See Notes to Financial Statements.
| 32 |
|
Total Return US Treasury Fund
|
|
Statements of Changes in Net Assets
|
|
|
Six Months
Ended
April 30,
2011
(Unaudited)
|
Year
Ended
October 31,
2010
|
||||||
|
FROM OPERATIONS
|
||||||||
|
Net investment income
|
$ | 635,765 | $ | 1,532,943 | ||||
|
Net realized gains from security transactions
|
363,440 | 994,042 | ||||||
|
Net change in net unrealized appreciation/depreciation on investments
|
(3,467,839 | ) | 4,202,408 | |||||
|
Net increase (decrease) in net assets from operations
|
(2,468,634 | ) | 6,729,393 | |||||
|
DISTRIBUTIONS TO SHAREHOLDERS
|
||||||||
|
From net investment income
|
(635,765 | ) | (1,532,943 | ) | ||||
|
From net realized gains from security transactions
|
(14,107 | ) | (5,616,815 | ) | ||||
|
In excess of net investment income
|
(288,582 | ) | — | |||||
|
Decrease in net assets from distributions to shareholders
|
(938,454 | ) | (7,149,758 | ) | ||||
|
FROM CAPITAL SHARE TRANSACTIONS
|
||||||||
|
Proceeds from shares sold
|
1,600,511 | 5,698,834 | ||||||
|
Net asset value of shares issued in reinvestment of distributions to shareholders
|
629,141 | 5,284,575 | ||||||
|
Payments for shares redeemed
|
(11,986,760 | ) | (25,065,786 | ) | ||||
|
Net decrease in net assets from capital share transactions
|
(9,757,108 | ) | (14,082,377 | ) | ||||
|
TOTAL DECREASE IN NET ASSETS
|
(13,164,196 | ) | (14,502,742 | ) | ||||
|
NET ASSETS
|
||||||||
|
Beginning of period
|
97,792,753 | 112,295,495 | ||||||
|
End of period
|
$ | 84,628,557 | $ | 97,792,753 | ||||
|
DISTRIBUTIONS IN EXCESS OF NET INVESTMENT INCOME
|
$ | (288,582 | ) | $ | — | |||
|
CAPITAL SHARE ACTIVITY
|
||||||||
|
Shares sold
|
163,317 | 577,733 | ||||||
|
Shares reinvested
|
64,383 | 550,435 | ||||||
|
Shares redeemed
|
(1,231,909 | ) | (2,546,872 | ) | ||||
|
Net decrease in shares outstanding
|
(1,004,209 | ) | (1,418,704 | ) | ||||
|
Shares outstanding, beginning of period
|
9,690,372 | 11,109,076 | ||||||
|
Shares outstanding, end of period
|
8,686,163 | 9,690,372 | ||||||
See Notes to Financial Statements.
| 33 |
|
Managed Municipal Fund
|
|
Statements of Changes in Net Assets
|
|
Six Months
Ended
April 30,
2011
(Unaudited)
|
Year
Ended
October 31,
2010
|
|||||||
|
FROM OPERATIONS
|
||||||||
|
Net investment income
|
$ | 1,420,566 | $ | 3,077,914 | ||||
|
Net realized gains (losses) from security transactions
|
(41,364 | ) | 720,306 | |||||
|
Net change in net unrealized appreciation/depreciation on investments
|
(2,653,578 | ) | 985,144 | |||||
|
Net increase (decrease) in net assets from operations
|
(1,274,376 | ) | 4,783,364 | |||||
|
DISTRIBUTIONS TO SHAREHOLDERS
|
||||||||
|
From net investment income
|
||||||||
|
ISI Class A Shares
|
(1,382,866 | ) | (3,078,368 | ) | ||||
|
ISI Class I Shares
|
(37,890 | ) | (182 | ) | ||||
|
From net realized gains from security transactions
|
||||||||
|
ISI Class A Shares
|
(702,786 | ) | (345,235 | ) | ||||
|
ISI Class I Shares
|
(17,284 | ) | — | |||||
|
Decrease in net assets from distributions to shareholders
|
(2,140,826 | ) | (3,423,785 | ) | ||||
|
FROM CAPITAL SHARE TRANSACTIONS
|
||||||||
|
Proceeds from shares sold
|
||||||||
|
ISI Class A Shares
|
5,242,616 | 22,551,334 | ||||||
|
ISI Class I Shares
|
3,070,073 | 76,591 | ||||||
|
Net asset value of shares issued in reinvestment of distributions to shareholders
|
||||||||
|
ISI Class A Shares
|
1,344,835 | 2,006,694 | ||||||
|
ISI Class I Shares
|
26,363 | 182 | ||||||
|
Payments for shares redeemed
|
||||||||
|
ISI Class A Shares
|
(13,637,300 | ) | (14,638,906 | ) | ||||
|
ISI Class I Shares
|
(291,026 | ) | (11 | ) | ||||
|
Net increase (decrease) in net assets from capital share transactions
|
(4,244,439 | ) | 9,995,884 | |||||
|
TOTAL INCREASE (DECREASE) IN NET ASSETS
|
(7,659,641 | ) | 11,355,463 | |||||
|
NET ASSETS
|
||||||||
|
Beginning of period
|
112,278,475 | 100,923,012 | ||||||
|
End of period
|
$ | 104,618,834 | $ | 112,278,475 | ||||
|
UNDISTRIBUTED NET INVESTMENT INCOME
|
$ | 92 | $ | 282 | ||||
See Notes to Financial Statements.
| 34 |
|
Managed Municipal Fund
|
|
Statements of Changes in Net Assets (continued)
|
|
Six Months
Ended
April 30,
2011
(Unaudited)
|
Year
Ended
October 31,
2010
|
|||||||
|
CAPITAL SHARE ACTIVITY
|
||||||||
|
Shares sold
|
||||||||
|
ISI Class A Shares
|
503,890 | 2,089,357 | ||||||
|
ISI Class I Shares
|
286,853 | 7,001 | ||||||
|
Shares reinvested
|
||||||||
|
ISI Class A Shares
|
129,755 | 186,500 | ||||||
|
ISI Class I Shares
|
2,537 | 17 | ||||||
|
Shares redeemed
|
||||||||
|
ISI Class A Shares
|
(1,298,517 | ) | (1,357,843 | ) | ||||
|
ISI Class I Shares
|
(28,303 | ) | (1 | ) | ||||
|
Net increase (decrease) in shares outstanding
|
||||||||
|
ISI Class A Shares
|
(664,872 | ) | 918,014 | |||||
|
ISI Class I Shares
|
261,087 | 7,017 | ||||||
|
Shares outstanding, beginning of period
|
||||||||
|
ISI Class A Shares
|
10,368,126 | 9,450,112 | ||||||
|
ISI Class I Shares
|
7,017 | — | ||||||
|
Shares outstanding, end of period
|
||||||||
|
ISI Class A Shares
|
9,703,254 | 10,368,126 | ||||||
|
ISI Class I Shares
|
268,104 | 7,017 | ||||||
See Notes to Financial Statements.
| 35 |
|
North American Government Bond Fund
|
|
Statements of Changes in Net Assets
|
|
Six Months
Ended
April 30,
2011
(Unaudited)
|
Year
Ended
October 31,
2010
|
|||||||
|
FROM OPERATIONS
|
||||||||
|
Net investment income
|
$ | 1,303,924 | $ | 2,679,004 | ||||
|
Net realized gains from security and foreign currency transactions
|
406,500 | 2,892,343 | ||||||
|
Net change in net unrealized appreciation/depreciation on investments and foreign currency translation
|
(2,183,344 | ) | 8,160,933 | |||||
|
Net increase (decrease) in net assets from operations
|
(472,920 | ) | 13,732,280 | |||||
|
DISTRIBUTIONS TO SHAREHOLDERS
|
||||||||
|
From net investment income
|
||||||||
|
ISI Class A Shares
|
(1,079,765 | ) | (2,397,132 | ) | ||||
|
ISI Class C Shares
|
(115,271 | ) | (281,317 | ) | ||||
|
ISI Class I Shares
|
(108,888 | ) | (555 | ) | ||||
|
From net realized gains from security transactions
|
||||||||
|
ISI Class A Shares
|
(122,468 | ) | (3,838,365 | ) | ||||
|
ISI Class C Shares
|
(19,625 | ) | (740,785 | ) | ||||
|
ISI Class I Shares
|
(9,142 | ) | (586 | ) | ||||
|
In excess of net investment income
|
||||||||
|
ISI Class A Shares
|
(623,112 | ) | — | |||||
|
ISI Class C Shares
|
(112,058 | ) | — | |||||
|
ISI Class I Shares
|
(50,187 | ) | — | |||||
|
Decrease in net assets from distributions to shareholders
|
(2,240,516 | ) | (7,258,740 | ) | ||||
|
FROM CAPITAL SHARE TRANSACTIONS
|
||||||||
|
Proceeds from shares sold
|
||||||||
|
ISI Class A Shares
|
11,881,665 | 31,062,656 | ||||||
|
ISI Class C Shares
|
1,474,702 | 3,451,857 | ||||||
|
ISI Class I Shares
|
12,382,004 | 193,289 | ||||||
|
Net asset value of shares issued in reinvestment of distributions to shareholders
|
||||||||
|
ISI Class A Shares
|
1,168,385 | 4,030,261 | ||||||
|
ISI Class C Shares
|
152,212 | 664,834 | ||||||
|
ISI Class I Shares
|
64,116 | 1,141 | ||||||
|
Payments for shares redeemed
|
||||||||
|
ISI Class A Shares
|
(30,246,200 | ) | (39,092,239 | ) | ||||
|
ISI Class C Shares
|
(7,275,759 | ) | (6,715,972 | ) | ||||
|
ISI Class I Shares
|
(439,144 | ) | (8 | ) | ||||
|
Net decrease in net assets from capital share transactions
|
(10,838,019 | ) | (6,404,181 | ) | ||||
|
TOTAL INCREASE (DECREASE) IN NET ASSETS
|
(13,551,455 | ) | 69,359 | |||||
See Notes to Financial Statements.
| 36 |
|
North American Government Bond Fund
|
|
Statements of Changes in Net Assets (continued)
|
|
Six Months
Ended
April 30,
2011
(Unaudited)
|
Year
Ended
October 31,
2010
|
|||||||
|
NET ASSETS
|
||||||||
|
Beginning of period
|
157,542,717 | 157,473,358 | ||||||
|
End of period
|
$ | 143,991,262 | $ | 157,542,717 | ||||
|
DISTRIBUTIONS IN EXCESS OF NET INVESTMENT INCOME
|
$ | (785,357 | ) | $ | — | |||
|
CAPITAL SHARE ACTIVITY
|
||||||||
|
Shares sold
|
||||||||
|
ISI Class A Shares
|
1,549,789 | 4,064,217 | ||||||
|
ISI Class C Shares
|
192,655 | 452,123 | ||||||
|
ISI Class I Shares
|
1,580,757 | 24,780 | ||||||
|
Shares reinvested
|
||||||||
|
ISI Class A Shares
|
152,028 | 532,705 | ||||||
|
ISI Class C Shares
|
19,898 | 88,248 | ||||||
|
ISI Class I Shares
|
8,310 | 145 | ||||||
|
Shares redeemed
|
||||||||
|
ISI Class A Shares
|
(3,910,377 | ) | (5,136,420 | ) | ||||
|
ISI Class C Shares
|
(948,299 | ) | (885,939 | ) | ||||
|
ISI Class I Shares
|
(57,048 | ) | (1 | ) | ||||
|
Net increase (decrease) in shares outstanding
|
||||||||
|
ISI Class A Shares
|
(2,208,560 | ) | (539,498 | ) | ||||
|
ISI Class C Shares
|
(735,746 | ) | (345,568 | ) | ||||
|
ISI Class I Shares
|
1,532,019 | 24,924 | ||||||
|
Shares outstanding, beginning of period
|
||||||||
|
ISI Class A Shares
|
17,039,844 | 17,579,342 | ||||||
|
ISI Class C Shares
|
2,923,400 | 3,268,968 | ||||||
|
ISI Class I Shares
|
24,924 | — | ||||||
|
Shares outstanding, end of period
|
||||||||
|
ISI Class A Shares
|
14,831,284 | 17,039,844 | ||||||
|
ISI Class C Shares
|
2,187,654 | 2,923,400 | ||||||
|
ISI Class I Shares
|
1,556,943 | 24,924 | ||||||
See Notes to Financial Statements.
| 37 |
|
ISI Strategy Fund
|
|
Statements of Changes in Net Assets
|
|
Six Months
Ended
April 30,
2011
(Unaudited)
|
Year
Ended
October 31,
2010
|
|||||||
|
FROM OPERATIONS
|
||||||||
|
Net investment income
|
$ | 382,900 | $ | 809,776 | ||||
|
Net realized gains (losses) from security transactions
|
2,352,536 | (488,595 | ) | |||||
|
Net change in net unrealized appreciation/depreciation on investments
|
5,698,664 | 8,625,267 | ||||||
|
Net increase in net assets from operations
|
8,434,100 | 8,946,448 | ||||||
|
DISTRIBUTIONS TO SHAREHOLDERS
|
||||||||
|
From net investment income
|
(399,163 | ) | (809,407 | ) | ||||
|
FROM CAPITAL SHARE TRANSACTIONS
|
||||||||
|
Proceeds from shares sold
|
4,808,303 | 5,666,622 | ||||||
|
Net asset value of shares issued in reinvestment of distributions to shareholders
|
346,462 | 705,681 | ||||||
|
Payments for shares redeemed
|
(5,076,910 | ) | (7,795,400 | ) | ||||
|
Net increase (decrease) in net assets from capital share transactions
|
77,855 | (1,423,097 | ) | |||||
|
TOTAL INCREASE IN NET ASSETS
|
8,112,792 | 6,713,944 | ||||||
|
NET ASSETS
|
||||||||
|
Beginning of period
|
60,444,725 | 53,730,781 | ||||||
|
End of period
|
$ | 68,557,517 | $ | 60,444,725 | ||||
|
UNDISTRIBUTED (DISTRIBUTIONS IN EXCESS OF) NET INVESTMENT INCOME
|
$ | (6,508 | ) | $ | 9,755 | |||
|
CAPITAL SHARE ACTIVITY
|
||||||||
|
Shares sold
|
374,043 | 486,397 | ||||||
|
Shares reinvested
|
26,375 | 61,148 | ||||||
|
Shares redeemed
|
(385,795 | ) | (674,109 | ) | ||||
|
Net increase (decrease) in shares outstanding
|
14,623 | (126,564 | ) | |||||
|
Shares outstanding, beginning of period
|
4,923,938 | 5,050,502 | ||||||
|
Shares outstanding, end of period
|
4,938,561 | 4,923,938 | ||||||
See Notes to Financial Statements.
| 38 |
|
Total Return US Treasury Fund
|
Financial Highlights
Selected Per Share Data and Ratios for a Share Outstanding Throughout Each Period
|
|
Six Months Ended
April 30,
2011
|
Years Ended October 31,
|
||||||||||||||||||||||
|
(Unaudited)
|
2010
|
2009
|
2008
|
2007
|
2006
|
|||||||||||||||||||
|
Net asset value at beginning of period
|
$ | 10.09 | $ | 10.11 | $ | 9.59 | $ | 9.50 | $ | 9.42 | $ | 9.33 | ||||||||||||
|
Income (loss) from investment operations:
|
||||||||||||||||||||||||
|
Net investment income(a)
|
0.07 | 0.15 | 0.17 | 0.28 | 0.35 | 0.32 | ||||||||||||||||||
|
Net realized and unrealized gains (losses) on investments
|
(0.32 | ) | 0.50 | 0.70 | 0.16 | 0.08 | 0.12 | |||||||||||||||||
|
Total from investment operations
|
(0.25 | ) | 0.65 | 0.87 | 0.44 | 0.43 | 0.44 | |||||||||||||||||
|
Less distributions:
|
||||||||||||||||||||||||
|
Dividends from net investment income
|
(0.07 | ) | (0.15 | ) | (0.17 | ) | (0.28 | ) | (0.34 | ) | (0.35 | ) | ||||||||||||
|
Distributions from net realized gains
|
(0.00 | )* | (0.52 | ) | (0.18 | ) | (0.07 | ) | (0.00 | )* | — | |||||||||||||
|
Return of capital
|
— | — | — | — | (0.01 | ) | — | |||||||||||||||||
|
In excess of net investment income
|
(0.03 | ) | — | — | — | — | — | |||||||||||||||||
|
Total distributions
|
(0.10 | ) | (0.67 | ) | (0.35 | ) | (0.35 | ) | (0.35 | ) | (0.35 | ) | ||||||||||||
|
Net asset value at end of period
|
$ | 9.74 | $ | 10.09 | $ | 10.11 | $ | 9.59 | $ | 9.50 | $ | 9.42 | ||||||||||||
|
TOTAL RETURN(b)
|
(2.46 | )%(d) | 6.85 | % | 9.05 | % | 4.61 | % | 4.66 | % | 4.83 | % | ||||||||||||
|
Net assets at end of period (000's)
|
$ | 84,629 | $ | 97,793 | $ | 112,295 | $ | 119,973 | $ | 124,768 | $ | 153,784 | ||||||||||||
|
Ratio of expenses to average net assets
|
0.90 | %(e) | 0.82 | % | 0.80 | % | 0.79 | % | 0.79 | % | 0.76 | %(c) | ||||||||||||
|
Ratio of net investment income to average net assets
|
1.43 | %(e) | 1.49 | % | 1.68 | % | 2.86 | % | 3.68 | % | 3.44 | %(c) | ||||||||||||
|
Portfolio turnover rate
|
17 | %(d) | 44 | % | 109 | % | 70 | % | 29 | % | 51 | % | ||||||||||||
|
(a)
|
Calculated using the average shares outstanding for the period.
|
|
(b)
|
Total return is a measure of the change in value of an investment in the Fund over the period covered, which assumes any dividends or capital gains distributions are reinvested in shares of the Fund. Returns shown do not reflect the deduction of taxes a shareholder would pay on Fund distributions or the redemption of Fund shares.
|
|
(c)
|
The October 31, 2006 ratios of expenses and net investment income to average net assets were unaffected by the waiver of distribution fees during the year.
|
|
(d)
|
Not annualized.
|
|
(e)
|
Annualized.
|
|
*
|
Amount less than $0.005 per share.
|
See Notes to Financial Statements.
| 39 |
|
Managed Municipal Fund - Class A
|
Financial Highlights
Selected Per Share Data and Ratios for a Share Outstanding Throughout Each Period
|
|
Six Months
Ended
April 30,
2011
|
Years Ended October 31,
|
||||||||||||||||||||||
|
(Unaudited)
|
2010
|
2009
|
2008
|
2007
|
2006
|
|||||||||||||||||||
|
Net asset value at beginning of period
|
$ | 10.82 | $ | 10.68 | $ | 9.96 | $ | 10.61 | $ | 10.80 | $ | 10.68 | ||||||||||||
|
Income (loss) from investment operations:
|
||||||||||||||||||||||||
|
Net investment income(a)
|
0.14 | 0.31 | 0.32 | 0.36 | 0.38 | 0.39 | ||||||||||||||||||
|
Net realized and unrealized gains (losses) on investments
|
(0.26 | ) | 0.18 | 0.74 | (0.50 | ) | (0.14 | ) | 0.10 | |||||||||||||||
|
Total from investment operations
|
(0.12 | ) | 0.49 | 1.06 | (0.14 | ) | 0.24 | 0.49 | ||||||||||||||||
|
Less distributions:
|
||||||||||||||||||||||||
|
Dividends from net investment income
|
(0.14 | ) | (0.31 | ) | (0.32 | ) | (0.47 | ) | (0.34 | ) | (0.34 | ) | ||||||||||||
|
Distributions from net realized gains
|
(0.07 | ) | (0.04 | ) | (0.02 | ) | (0.04 | ) | (0.09 | ) | (0.03 | ) | ||||||||||||
|
Total distributions
|
(0.21 | ) | (0.35 | ) | (0.34 | ) | (0.51 | ) | (0.43 | ) | (0.37 | ) | ||||||||||||
|
Net asset value at end of period
|
$ | 10.49 | $ | 10.82 | $ | 10.68 | $ | 9.96 | $ | 10.61 | $ | 10.80 | ||||||||||||
|
TOTAL RETURN(b)
|
(1.05 | )%(c) | 4.62 | % | 10.68 | % | (1.44 | )% | 2.29 | % | 4.68 | % | ||||||||||||
|
Net assets at end of period (000's)
|
$ | 101,804 | $ | 112,203 | $ | 100,923 | $ | 75,072 | $ | 73,038 | $ | 82,880 | ||||||||||||
|
Ratio of expenses to average net assets
|
1.00 | %(d) | 0.97 | % | 0.97 | % | 0.96 | % | 0.94 | % | 0.91 | % | ||||||||||||
|
Ratio of net investment income to average net assets
|
2.71 | %(d) | 2.89 | % | 3.02 | % | 3.48 | % | 3.57 | % | 3.63 | % | ||||||||||||
|
Portfolio turnover rate
|
5 | %(c) | 22 | % | 10 | % | 7 | % | 5 | % | 7 | % | ||||||||||||
|
(a)
|
Calculated using the average shares outstanding for the period.
|
|
(b)
|
Total return is a measure of the change in value of an investment in the Fund over the period covered, which assumes any dividends or capital gains distributions are reinvested in shares of the Fund. Returns shown do not reflect the deduction of taxes a shareholder would pay on Fund distributions or the redemption of Fund shares.
|
|
(c)
|
Not annualized.
|
|
(d)
|
Annualized.
|
See Notes to Financial Statements.
| 40 |
|
Managed Municipal Fund - Class I
|
Financial Highlights
Selected Per Share Data and Ratios for a Share Outstanding Throughout Each Period
|
|
Six Months
Ended
April 30,
2011
(Unaudited)
|
Period
Ended
October 31,
2010(a)
|
||||||
|
Net asset value at beginning of period
|
$ | 10.82 | $ | 10.94 | ||||
|
Income (loss) from investment operations:
|
||||||||
|
Net investment income(b)
|
0.15 | 0.02 | ||||||
|
Net realized and unrealized losses on investments
|
(0.25 | ) | (0.11 | ) | ||||
|
Total from investment operations
|
(0.10 | ) | (0.09 | ) | ||||
|
Less distributions:
|
||||||||
|
Dividends from net investment income
|
(0.15 | ) | (0.03 | ) | ||||
|
Distributions from net realized gains
|
(0.07 | ) | — | |||||
|
Total distributions
|
(0.22 | ) | (0.03 | ) | ||||
|
Net asset value at end of period
|
$ | 10.50 | $ | 10.82 | ||||
|
TOTAL RETURN(c)
|
(0.83 | )%(d) | (0.86 | )%(d) | ||||
|
Net assets at end of period (000's)
|
$ | 2,815 | $ | 76 | ||||
|
Ratio of expenses to average net assets
|
0.74 | %(e) | 0.70 | %(e) | ||||
|
Ratio of net investment income to average net assets
|
3.00 | %(e) | 2.83 | %(e) | ||||
|
Portfolio turnover rate
|
5 | %(d) | 22 | %(d) | ||||
|
(a)
|
Class I commenced operations on October 7, 2010.
|
|
(b)
|
Calculated using the average shares outstanding for the period.
|
|
(c)
|
Total return is a measure of the change in value of an investment in the Fund over the period covered, which assumes any dividends or capital gains distributions are reinvested in shares of the Fund. Returns shown do not reflect the deduction of taxes a shareholder would pay on Fund distributions or the redemption of Fund shares.
|
|
(d)
|
Not annualized.
|
|
(e)
|
Annualized.
|
See Notes to Financial Statements.
| 41 |
|
North American Government Bond Fund - Class A
|
Financial Highlights
Selected Per Share Data and Ratios for a Share Outstanding Throughout Each Period
|
|
Six Months
Ended
April 30,
2011
|
Years Ended October 31,
|
||||||||||||||||||||||
|
(Unaudited)
|
2010
|
2009
|
2008
|
2007
|
2006
|
|||||||||||||||||||
|
Net asset value at beginning of period
|
$ | 7.89 | $ | 7.56 | $ | 7.22 | $ | 7.53 | $ | 7.41 | $ | 7.34 | ||||||||||||
|
Income (loss) from investment operations:
|
||||||||||||||||||||||||
|
Net investment income(a)
|
0.07 | 0.14 | 0.14 | 0.23 | 0.26 | 0.25 | ||||||||||||||||||
|
Net realized and unrealized gains (losses) on investments and foreign currencies
|
(0.08 | ) | 0.56 | 0.56 | (0.18 | ) | 0.22 | 0.18 | ||||||||||||||||
|
Total from investment operations
|
(0.01 | ) | 0.70 | 0.70 | 0.05 | 0.48 | 0.43 | |||||||||||||||||
|
Less distributions:
|
||||||||||||||||||||||||
|
Dividends from net investment income
|
(0.07 | ) | (0.14 | ) | (0.08 | ) | (0.19 | ) | (0.35 | ) | (0.30 | ) | ||||||||||||
|
Distributions from net realized gains
|
(0.01 | ) | (0.23 | ) | (0.28 | ) | (0.14 | ) | — | (0.01 | ) | |||||||||||||
|
Return of capital
|
— | — | — | (0.03 | ) | (0.01 | ) | (0.05 | ) | |||||||||||||||
|
In excess of net investment income
|
(0.04 | ) | — | — | — | — | — | |||||||||||||||||
|
Total distributions
|
(0.12 | ) | (0.37 | ) | (0.36 | ) | (0.36 | ) | (0.36 | ) | (0.36 | ) | ||||||||||||
|
Net asset value at end of period
|
$ | 7.76 | $ | 7.89 | $ | 7.56 | $ | 7.22 | $ | 7.53 | $ | 7.41 | ||||||||||||
|
TOTAL RETURN(b)
|
(0.13 | )%(d) | 9.53 | % | 9.80 | % | 0.51 | % | 6.71 | % | 6.04 | % | ||||||||||||
|
Net assets at end of period (000's)
|
$ | 115,017 | $ | 134,383 | $ | 132,814 | $ | 140,326 | $ | 131,748 | $ | 146,854 | ||||||||||||
|
Ratio of expenses to average net assets
|
1.19 | %(e) | 1.15 | % | 1.13 | % | 1.11 | % | 1.11 | % | 1.06 | %(c) | ||||||||||||
|
Ratio of net investment income to average net assets
|
1.82 | %(e) | 1.85 | % | 1.87 | % | 2.97 | % | 3.54 | % | 3.47 | %(c) | ||||||||||||
|
Portfolio turnover rate
|
19 | %(d) | 48 | % | 131 | % | 108 | % | 49 | % | 53 | % | ||||||||||||
|
(a)
|
Calculated using the average shares outstanding for the period.
|
|
(b)
|
Total return is a measure of the change in value of an investment in the Fund over the period covered, which assumes any dividends or capital gains distributions are reinvested in shares of the Fund. Returns shown do not reflect the deduction of taxes a shareholder would pay on Fund distributions or the redemption of Fund shares.
|
|
(c)
|
The October 31, 2006 ratios of expenses and net investment income to average net assets were unaffected by the waiver of distribution fees during the year.
|
|
(d)
|
Not annualized.
|
|
(e)
|
Annualized.
|
See Notes to Financial Statements.
| 42 |
|
North American Government Bond Fund - Class C
|
Financial Highlights
Selected Per Share Data and Ratios for a Share Outstanding Throughout Each Period
|
|
Six Months
Ended
April 30,
2011
|
Years Ended October 31,
|
||||||||||||||||||||||
|
(Unaudited)
|
2010
|
2009
|
2008
|
2007
|
2006
|
|||||||||||||||||||
|
Net asset value at beginning of period
|
$ | 7.85 | $ | 7.54 | $ | 7.21 | $ | 7.52 | $ | 7.40 | $ | 7.33 | ||||||||||||
|
Income (loss) from investment operations:
|
||||||||||||||||||||||||
|
Net investment income(a)
|
0.05 | 0.09 | 0.09 | 0.18 | 0.21 | 0.21 | ||||||||||||||||||
|
Net realized and unrealized gains (losses) on investments and foreign currencies
|
(0.08 | ) | 0.56 | 0.55 | (0.18 | ) | 0.22 | 0.17 | ||||||||||||||||
|
Total from investment operations
|
(0.03 | ) | 0.65 | 0.64 | 0.00 | 0.43 | 0.38 | |||||||||||||||||
|
Less distributions:
|
||||||||||||||||||||||||
|
Dividends from net investment income
|
(0.05 | ) | (0.11 | ) | (0.03 | ) | (0.14 | ) | (0.30 | ) | (0.25 | ) | ||||||||||||
|
Distributions from net realized gains
|
(0.01 | ) | (0.23 | ) | (0.28 | ) | (0.14 | ) | — | (0.01 | ) | |||||||||||||
|
Return of capital
|
— | — | — | (0.03 | ) | (0.01 | ) | (0.05 | ) | |||||||||||||||
|
In excess of net investment income
|
(0.04 | ) | — | — | — | — | — | |||||||||||||||||
|
Total distributions
|
(0.10 | ) | (0.34 | ) | (0.31 | ) | (0.31 | ) | (0.31 | ) | (0.31 | ) | ||||||||||||
|
Net asset value at end of period
|
$ | 7.72 | $ | 7.85 | $ | 7.54 | $ | 7.21 | $ | 7.52 | $ | 7.40 | ||||||||||||
|
TOTAL RETURN(b)
|
(0.37 | )%(c) | 8.85 | % | 8.97 | % | (0.12 | )% | 6.03 | % | 5.35 | % | ||||||||||||
|
Net assets at end of period (000's)
|
$ | 16,884 | $ | 22,963 | $ | 24,659 | $ | 20,636 | $ | 16,848 | $ | 15,579 | ||||||||||||
|
Ratio of expenses to average net assets
|
1.79 | %(d) | 1.78 | % | 1.76 | % | 1.73 | % | 1.74 | % | 1.72 | % | ||||||||||||
|
Ratio of net investment income to average net assets
|
1.22 | %(d) | 1.23 | % | 1.22 | % | 2.34 | % | 2.93 | % | 2.81 | % | ||||||||||||
|
Portfolio turnover rate
|
19 | %(c) | 48 | % | 131 | % | 108 | % | 49 | % | 53 | % | ||||||||||||
|
(a)
|
Calculated using the average shares outstanding for the period.
|
|
(b)
|
Total return is a measure of the change in value of an investment in the Fund over the period covered, which assumes any dividends or capital gains distributions are reinvested in shares of the Fund. Returns shown do not reflect the deduction of taxes a shareholder would pay on Fund distributions or the redemption of Fund shares.
|
|
(c)
|
Not annualized.
|
|
(d)
|
Annualized.
|
See Notes to Financial Statements.
| 43 |
|
North American Government Bond Fund - Class I
|
Financial Highlights
Selected Per Share Data and Ratios for a Share Outstanding Throughout Each Period
|
|
Six Months
Ended
April 30,
2011
(Unaudited)
|
Period
Ended
October 31,
2010(a)
|
||||||
|
Net asset value at beginning of period
|
$ | 7.89 | $ | 7.80 | ||||
|
Income (loss) from investment operations:
|
||||||||
|
Net investment income(b)
|
0.09 | 0.02 | ||||||
|
Net realized and unrealized gains (losses) on investments and foreign currencies
|
(0.08 | ) | 0.12 | |||||
|
Total from investment operations
|
0.01 | 0.14 | ||||||
|
Less distributions:
|
||||||||
|
Dividends from net investment income
|
(0.08 | ) | (0.02 | ) | ||||
|
Distributions from net realized gains
|
(0.01 | ) | (0.03 | ) | ||||
|
In excess of net investment income
|
(0.04 | ) | — | |||||
|
Total distributions
|
(0.13 | ) | (0.05 | ) | ||||
|
Net asset value at end of period
|
$ | 7.77 | $ | 7.89 | ||||
|
TOTAL RETURN(c)
|
0.15 | %(d) | 1.74 | %(d) | ||||
|
Net assets at end of period (000's)
|
$ | 12,090 | $ | 197 | ||||
|
Ratio of expenses to average net assets
|
0.77 | %(e) | 0.69 | %(e) | ||||
|
Ratio of net investment income to average net assets
|
2.26 | %(e) | 2.25 | %(e) | ||||
|
Portfolio turnover rate
|
19 | %(d) | 48 | %(d) | ||||
|
(a)
|
Class I commenced operations on September 16, 2010.
|
|
(b)
|
Calculated using the average shares outstanding for the period.
|
|
(c)
|
Total return is a measure of the change in value of an investment in the Fund over the period covered, which assumes any dividends or capital gains distributions are reinvested in shares of the Fund. Returns shown do not reflect the deduction of taxes a shareholder would pay on Fund distributions or the redemption of Fund shares.
|
|
(d)
|
Not annualized.
|
|
(e)
|
Annualized.
|
See Notes to Financial Statements.
| 44 |
|
ISI Strategy Fund
|
Financial Highlights
Selected Per Share Data and Ratios for a Share Outstanding Throughout Each Period
|
|
Six Months
Ended
April 30,
2011
|
Years Ended October 31,
|
||||||||||||||||||||||
|
(Unaudited)
|
2010
|
2009
|
2008
|
2007
|
2006
|
|||||||||||||||||||
|
Net asset value at beginning of period
|
$ | 12.28 | $ | 10.64 | $ | 9.63 | $ | 14.82 | $ | 13.54 | $ | 12.12 | ||||||||||||
|
Income (loss) from investment operations:
|
||||||||||||||||||||||||
|
Net investment income(a)
|
0.08 | 0.16 | 0.11 | 0.13 | 0.17 | 0.15 | ||||||||||||||||||
|
Net realized and unrealized gains (losses) on investments
|
1.60 | 1.64 | 1.02 | (4.39 | ) | 1.65 | 1.42 | |||||||||||||||||
|
Total from investment operations
|
1.68 | 1.80 | 1.13 | (4.26 | ) | 1.82 | 1.57 | |||||||||||||||||
|
Less distributions:
|
||||||||||||||||||||||||
|
Dividends from net investment income
|
(0.08 | ) | (0.16 | ) | (0.12 | ) | (0.13 | ) | (0.17 | ) | (0.15 | ) | ||||||||||||
|
Distributions from net realized gains
|
— | — | — | (0.80 | ) | (0.37 | ) | — | ||||||||||||||||
|
Total distributions
|
(0.08 | ) | (0.16 | ) | (0.12 | ) | (0.93 | ) | (0.54 | ) | (0.15 | ) | ||||||||||||
|
Net asset value at end of period
|
$ | 13.88 | $ | 12.28 | $ | 10.64 | $ | 9.63 | $ | 14.82 | $ | 13.54 | ||||||||||||
|
TOTAL RETURN(b)
|
13.72 | %(c) | 17.05 | % | 11.84 | % | (30.49 | )% | 13.79 | % | 13.01 | % | ||||||||||||
|
Net assets at end of period (000's)
|
$ | 68,558 | $ | 60,445 | $ | 53,731 | $ | 53,245 | $ | 80,535 | $ | 69,438 | ||||||||||||
|
Ratio of expenses to average net assets
|
1.03 | %(d) | 1.06 | % | 1.10 | % | 0.99 | % | 0.96 | % | 0.95 | % | ||||||||||||
|
Ratio of net investment income to average net assets
|
1.19 | %(d) | 1.40 | % | 1.19 | % | 1.02 | % | 1.21 | % | 1.17 | % | ||||||||||||
|
Portfolio turnover rate
|
23 | %(c) | 38 | % | 55 | % | 42 | % | 62 | % | 41 | % | ||||||||||||
|
(a)
|
Calculated using the average shares outstanding for the period.
|
|
(b)
|
Total return is a measure of the change in value of an investment in the Fund over the period covered, which assumes any dividends or capital gains distributions are reinvested in shares of the Fund. Returns shown do not reflect the deduction of taxes a shareholder would pay on Fund distributions or the redemption of Fund shares.
|
|
(c)
|
Not annualized.
|
|
(d)
|
Annualized.
|
See Notes to Financial Statements.
| 45 |
|
ISI Funds
|
Notes to Financial Statements
April 30, 2011 (Unaudited)
Note 1 – Organization and Significant Accounting Policies
|
A.
|
Organization
|
Total Return US Treasury Fund, Inc. (“Total Return”), Managed Municipal Fund, Inc. (“Managed Municipal”), North American Government Bond Fund, Inc. (“North American”) and ISI Strategy Fund, Inc. (“Strategy”) (each a “Fund” and collectively, the “Funds”) are registered under the Investment Company Act of 1940 as open-end management investment companies. The Funds are organized as corporations under the laws of the State of Maryland.
Total Return’s investment objective is to achieve a high level of total return with relative stability of principal and, secondarily, high current income consistent with an investment in securities issued by the United States Treasury. Managed Municipal’s investment objective is to provide a high level of total return with relative stability of principal and, secondarily, high current income exempt from Federal income tax through investment in a portfolio consisting primarily of tax-free municipal obligations. North American’s investment objective is designed to provide a high level of current income, consistent with prudent investment risk. Strategy’s investment objective is to maximize total return through a combination of long-term growth of capital and current income.
Total Return and Strategy each currently offer a single class of shares (ISI Shares) to investors. Managed Municipal offers two classes of shares – ISI Class A Shares and ISI Class I Shares. North American offers three classes of shares – ISI Class A Shares, ISI Class C Shares and ISI Class I Shares. ISI Shares and ISI Class A Shares are subject to a maximum front-end sales charge equal to 3.00%. A contingent deferred sales charge of 1.00% is imposed on the sale of ISI Class C Shares if redeemed within the first year of purchase.
Total Return and Strategy are authorized to issue 115,000,000 and 25,000,000 shares, respectively, of ISI Shares at $0.001 par value. Managed Municipal is authorized to issue 50,000,000 ISI Class A Shares and 5,000,000 ISI Class I Shares at $0.001 par value. North American is authorized to issue 50,000,000 ISI Class A Shares, 5,000,000 ISI Class C Shares and 5,000,000 ISI Class I Shares at $0.001 par value.
|
B.
|
Valuation of Securities
|
Exchange traded securities and over-the-counter securities listed on the NASDAQ National Market System for which market quotations are readily available are valued each Fund business day using the last reported sales price or the NASDAQ Official Closing Price (“NOCP”) provided by independent pricing services as of the close of trading on the New York Stock Exchange (normally 4:00 p.m. Eastern time). In the absence of a sale price or NOCP, such securities are valued at the mean of the last
| 46 |
|
ISI Funds
|
Notes to Financial Statements (continued)
bid and the last asked prices. Non-exchange traded securities for which quotations are readily available are generally valued at the mean between the last bid and the last asked prices. Debt securities may be valued at prices supplied by a Fund’s pricing agent based on broker or dealer supplied valuations or matrix pricing, a method of valuing securities by reference to the value of other securities with similar characteristics such as rating, interest rate, and maturity. Money market instruments that mature in 60 days or less may be valued at amortized cost unless the Fund’s investment advisor believes another valuation is more appropriate.
When valuing securities for which market quotations are not readily available or for which the market quotations that are readily available are considered unreliable, the Funds determine a fair value in good faith under procedures established by and under the general supervision of the Funds’ Boards of Directors (the “Board”). The Funds may use these procedures to establish the fair value of securities when, for example, a significant event occurs between the time the market closes and the calculation of the net asset value per share, and the event is likely to affect the Fund’s net asset value per share. Fair valuation may also be used for securities that are subject to legal or contractual restrictions on resale, securities for which no or limited trading activity has occurred for a period of time, or securities that are otherwise deemed to be illiquid (i.e., securities that cannot be disposed of within seven days at approximately the price at which the security is currently priced by the Funds).
If a fair value is required, the investment advisor, or the sub-advisor in the case of Strategy, determines the value of the security until the Board meets to establish the fair value of the security.
As of April 30, 2011, there were no fair valued securities.
Accounting principles generally accepted in the United States (“GAAP”) establish a single authoritative definition of fair value, set out a frame work for measuring fair value and require additional disclosures about fair value measurements.
Various inputs are used in determining the value of each Fund’s investments. These inputs are summarized in the three broad levels listed below:
Level 1 – quoted prices in active markets for identical securities
Level 2 – other significant observable inputs
Level 3 – significant unobservable inputs
The inputs or methodology used for valuing securities are not necessarily an indication of the risks associated with investing in those securities.
| 47 |
|
ISI Funds
|
Notes to Financial Statements (continued)
The following is a summary of the inputs used to value each Fund’s investments as of April 30, 2011:
|
Total Return
|
||||||||||||||||
|
|
Level 1
|
Level 2
|
Level 3
|
Total
|
||||||||||||
|
US Treasury Obligations
|
$ | — | $ | 82,509,710 | $ | — | $ | 82,509,710 | ||||||||
|
Repurchase Agreements
|
— | 1,528,000 | — | 1,528,000 | ||||||||||||
|
Total
|
$ | — | $ | 84,037,710 | $ | — | $ | 84,037,710 | ||||||||
|
Managed Municipal
|
||||||||||||||||
|
|
Level 1
|
Level 2
|
Level 3
|
Total
|
||||||||||||
|
Municipal Bonds
|
$ | — | $ | 92,389,125 | $ | — | $ | 92,389,125 | ||||||||
|
US Treasury Obligation
|
— | 5,015,820 | — | 5,015,820 | ||||||||||||
|
Repurchase Agreements
|
— | 6,413,000 | — | 6,413,000 | ||||||||||||
|
Total
|
$ | — | $ | 103,817,945 | $ | — | $ | 103,817,945 | ||||||||
|
North American
|
||||||||||||||||
|
|
Level 1
|
Level 2
|
Level 3
|
Total
|
||||||||||||
|
Canadian Securities
|
$ | — | $ | 25,914,139 | $ | — | $ | 25,914,139 | ||||||||
|
Mexican Securities
|
— | 13,602,188 | — | 13,602,188 | ||||||||||||
|
US Treasury Obligations
|
— | 101,407,342 | — | 101,407,342 | ||||||||||||
|
Repurchase Agreements
|
— | 1,354,000 | — | 1,354,000 | ||||||||||||
|
Total
|
$ | — | $ | 142,277,669 | $ | — | $ | 142,277,669 | ||||||||
|
Strategy
|
||||||||||||||||
|
|
Level 1
|
Level 2
|
Level 3
|
Total
|
||||||||||||
|
Common Stocks
|
$ | 61,005,926 | $ | — | $ | — | $ | 61,005,926 | ||||||||
|
US Treasury Obligations
|
— | 6,448,407 | — | 6,448,407 | ||||||||||||
|
Repurchase Agreements
|
— | 1,102,000 | — | 1,102,000 | ||||||||||||
|
Total
|
$ | 61,005,926 | $ | 7,550,407 | $ | — | $ | 68,556,333 | ||||||||
See Strategy’s Schedule of Investments for a listing of the common stocks valued using Level 1 inputs by industry type.
|
C.
|
Securities Transactions and Investment Income
|
Securities transactions are recorded on trade date. Realized gains and losses are determined by comparing the proceeds of a sale or the cost of a purchase with a specific offsetting transaction. Dividend income is recorded on the ex-dividend date. Interest income, including amortization of premiums and accretion of discounts, is accrued daily. Estimated expenses are also accrued daily. With respect to North American and
| 48 |
|
ISI Funds
|
Notes to Financial Statements (continued)
Managed Municipal, income, gains (losses) and common expenses are allocated to each class based on its respective net assets. Class specific expenses are charged directly to each class.
|
D.
|
Distributions
|
Total Return declares distributions daily, and North American declares monthly distributions at fixed rates approved by the Board. These distributions are paid monthly. To the extent that a Fund’s net investment income is less than an approved fixed rate, some of its distributions may be designated as a return of capital. Managed Municipal declares and pays dividends monthly from its net investment income. Strategy declares and pays dividends quarterly from its net investment income. Net realized capital gains, if any, are distributed at least annually. The Funds record dividends and distributions on the ex-dividend date.
|
E.
|
Federal Income Taxes
|
Each Fund has a policy to qualify as a regulated investment company under subchapter M of the Internal Revenue Code. As provided therein in any fiscal year in which a Fund so qualifies and distributes at least 90% of its net taxable income, the Fund (but not its shareholders) will be relieved of Federal income tax on the income distributed. In addition, by distributing in each calendar year substantially all of its net investment income and net realized capital gains, a Fund will not be subject to Federal excise taxes. Accordingly, no Federal income or excise taxes have been accrued.
|
F.
|
Foreign Currency Translation
|
The Funds maintain their accounting records in U.S. dollars. North American determines the U.S. dollar value of foreign currency-denominated assets, liabilities and transactions by using prevailing exchange rates. In valuing security transactions, the receipt of income and the payment of expenses, North American uses the prevailing exchange rate on the transaction date.
Net realized gains and losses on foreign currency transactions shown on North American’s financial statements result from the sale of foreign currencies, currency gains or losses realized between the trade and settlement dates on securities transactions, and from the difference between the amounts of interest recorded on North American’s books and the U.S. dollar equivalent of the amounts actually received or paid. That portion of realized gains (losses) from security transactions that results from fluctuation in foreign currency exchange rates relating to the sale of foreign securities is not separately disclosed but is included in net realized gains (losses) from security transactions. That portion of unrealized gains and losses on investments that results from fluctuations in foreign currency exchange rates is not separately disclosed but is included in the net change in unrealized appreciation/depreciation on investments.
| 49 |
|
ISI Funds
|
Notes to Financial Statements (continued)
|
G.
|
Forward Foreign Currency Contracts
|
North American may use forward foreign currency contracts to manage foreign exchange rate risk. The Fund may use these contracts to fix the U.S. dollar value of securities transactions for the period between the date of the transaction and the date the security is received or delivered or to hedge the U.S. dollar value of securities that it already owns. The use of forward foreign currency contracts does not eliminate fluctuations in the prices of the underlying securities, but does establish a rate of exchange that can be achieved in the future. North American determines the net U.S. dollar value of the forward foreign currency contracts using prevailing exchange rates.
|
H.
|
Repurchase Agreements
|
Each Fund may make short-term investments in repurchase agreements that are fully collateralized by U.S. government securities. Under the terms of a repurchase agreement, a financial institution sells U.S. government securities to a Fund and agrees to buy them back on a specified day in return for the principal amount of the original sale plus accrued interest. The custodial bank holds the collateral in a separate account until the agreement matures. If the value of the securities falls below the principal amount of the repurchase agreement plus accrued interest, the financial institution deposits additional collateral by the following business day. If the financial institution either fails to deposit the required additional collateral or fails to repurchase the securities as agreed, a Fund has the right to sell the securities and recover any resulting loss from the financial institution. If the financial institution enters into bankruptcy, a Fund’s claim on the collateral may be subject to legal proceedings.
|
I.
|
Estimates
|
In preparing its financial statements in conformity with GAAP, management makes estimates and assumptions that affect the reported amounts of assets and liabilities and disclosure of contingent assets and liabilities at the date of the financial statements and the reported amounts of revenues and expenses during the period. Actual results may be different.
Note 2 – Fees and Transactions with Affiliates
International Strategy & Investment, Inc. (“ISI”) is the Funds’ investment advisor. As compensation for ISI’s advisory services, Total Return pays ISI an annual fee based on the Fund’s average daily net assets, which is calculated daily and paid monthly at the following annual rates: 0.20% of the first $100 million, 0.18% of the next $100 million, 0.16% of the next $100 million, 0.14% of the next $200 million and 0.12% of the amount over $500 million. In addition, Total Return pays ISI 1.50% of the Fund’s gross interest income. As compensation for ISI’s advisory services, Managed Municipal, North American and Strategy each pay ISI a fee, which is calculated daily and paid monthly, at the annual rate of 0.40% of such Fund’s average daily net assets.
| 50 |
|
ISI Funds
|
Notes to Financial Statements (continued)
ISI has contractually agreed to reimburse expenses with respect to Class C Shares of North American through February 29, 2012 to the extent necessary to limit the annual ordinary operating expenses of ISI Class C Shares to 1.85% of the average daily net assets attributable to such shares. During the six months ended April 30, 2011, ISI was not required to waive any advisory fees.
Los Angeles Capital Management and Equity Research, Inc. is Strategy’s Sub-Advisor and is responsible for managing the common stocks in Strategy’s portfolio. The Sub-Advisor is paid by ISI, not Strategy.
International Strategy & Investment Group, Inc. (“ISI Group”), an affiliate of ISI, is the distributor for the Funds. Total Return, Managed Municipal (ISI Class A Shares, only) and Strategy each pay ISI Group a distribution/shareholder service fee, pursuant to Rule 12b-1, that is calculated daily and paid monthly at the annual rate of 0.25% of average daily net assets. North American’s ISI Class A Shares and ISI Class C Shares pay ISI Group a distribution/shareholder service fee, pursuant to Rule 12b-1, that is calculated daily and paid monthly at the annual rates of 0.40% and 1.00% (which may include up to 0.25% for shareholder servicing fees for each class) of their average daily net assets, respectively.
During the six months ended April 30, 2011, ISI Group earned commissions on sales of ISI Shares of Total Return, Managed Municipal and Strategy of $1,657, $3,474 and $3,121, respectively, and earned commissions of $2,451 on sales of ISI Class A Shares of North American. ISI Group retained $1,932 of contingent deferred sales charges on redemptions of ISI Class C Shares of North American during the six months ended April 30, 2011.
State Street Bank and Trust Company (“State Street”) is the administrator of the Funds. State Street is responsible for providing certain administrative services to the Funds, and assists in managing and supervising all aspects of the general day-to-day business activities and operations of the Fund other than investment advisory activities, including maintaining the books and records of the Fund, and preparing certain reports and other documents required by federal and/or state laws and regulations. For the performance of these services, the Funds pay State Street an annual fee of $300,000. This fee is allocated among the Funds based on the relative net assets of each Fund.
State Street is the fund accountant and fund custodian, and State Street is responsible for safeguarding and controlling the Funds’ cash and securities, handling the delivery of securities and collecting interest and dividends on the Fund’s investments. State Street as fund accounting agent is responsible for maintaining the books and records and calculating the daily net asset value of the Fund. For Fund accounting services, the Funds pay State Street an annual base fee of $180,000. For Fund custodian services, the Funds pay State Street an annual base fee of 1 (one) basis point on net assets, plus other asset-based fees that vary according to the number of positions and transactions, plus out-of-pocket fees.
| 51 |
|
ISI Funds
|
Notes to Financial Statements (continued)
State Street also serves as transfer agent for the Funds and is responsible for the issuance, transfer and redemption of shares and the opening, maintenance and servicing of shareholder accounts. For these services State Street receives an annual amount of $65,000, allocated among the Funds based on the relative net assets of each Fund and a monthly fee from each Fund at an annual rate of $20 for each direct account and $15 for certain accounts established through financial intermediaries. In addition, the Funds reimburse State Street for its out-of-pocket expenses including, but not limited to, postage and supplies.
EJV Financial Services, LLC (“EJV”) provides certain compliance services to the Funds. Edward J. Veilleux, Vice President and Chief Compliance Officer of the Funds, is also a principal of EJV. The Funds pay EJV $18,750 quarterly for providing CCO services. This fee is allocated among the Funds based on the relative net assets of each Fund. In addition, the Funds reimburse EJV for any reasonable out-of-pocket expenses relating to these compliance services.
The Funds pay each independent Director an annual fee of $15,000. The Audit Committee Chairman and Chairman of the Board receive an annual fee of $17,000 and $19,000 respectively. In addition each independent Director receives $1,000 for each Board meeting attended. The Funds also reimburse each of the Directors for out-of-pocket expenses incurred in connection with attending the Board of Directors’ meetings. Certain officers of the Funds are also officers or employees of the above named service providers, and during their terms of office, receive no compensation from the Funds.
Note 3 – Federal Income Tax
The Funds may periodically make reclassifications among certain capital accounts as a result of differences in the characterization and allocation of certain income and capital gain distributions determined annually in accordance with Federal tax regulations, which may differ from GAAP. These book/tax differences may be either temporary or permanent in nature. To the extent they are permanent, they are charged or credited to paid-in-capital, undistributed net investment income or accumulated net realized gains, as appropriate, in the period that the differences arose. The reclassifications have no impact on the net assets or net asset value per share of the Funds.
The Funds determine their net investment income and capital gain distributions in accordance with income tax regulations, which may differ from GAAP.
During the periods ended April 30, 2011 and October 31, 2010, the tax character of distributions paid by each of the Funds was as follows:
| 52 |
|
ISI Funds
|
Notes to Financial Statements (continued)
|
Ordinary
Income
|
Tax-Exempt
Income
|
Long-Term
Capital Gains
|
||||||||||||||||||||||
|
|
April 30,
2011
|
October 31,
2010 |
April 30,
2011
|
October 31,
2010 |
April 30,
2011
|
October 31,
2010 |
||||||||||||||||||
|
Total Return
|
$ | 936,505 | * | $ | 3,775,835 | $ | — | $ | — | $ | 1,949 | $ | 3,373,923 | |||||||||||
|
Managed Municipal
|
7,280 | 25,543 | 1,403,286 | 3,053,007 | 594,326 | 345,235 | ||||||||||||||||||
|
North American
|
2,234,775 | * | 5,420,092 | — | — | 5,741 | 1,838,648 | |||||||||||||||||
|
Strategy
|
399,163 | * | 809,407 | — | — | — | — | |||||||||||||||||
|
*
|
A portion of the ordinary income is short-term gains that are taxed as ordinary income for tax purposes. However, these short-term gains may be offset by losses incurred through October 31, 2011 and therefore could be treated as return of capital.
|
The Funds recognize the tax benefits or expenses of uncertain tax positions only when the position is “more likely than not” to be sustained assuming examination by tax authorities. Management has reviewed each Fund’s tax positions taken on Federal and state income tax returns for all open tax years (tax years ended October 31, 2007 through October 31, 2010) and concluded that no provision for unrecognized tax benefits or expenses is required in these financial statements.
As of October 31, 2010, the components of distributable earnings (accumulated deficit) on a tax basis were as follows:
|
Total
Return
|
Managed
Municipal
|
North
American
|
Strategy
|
|||||||||||||
|
Undistributed ordinary income
|
$ | 76,573 | $ | 126,576 | $ | 314,696 | $ | 9,755 | ||||||||
|
Undistributed tax-exempt income
|
— | 102,319 | — | — | ||||||||||||
|
Accumulated undistributed long-term capital gains
|
1,922 | 594,262 | 5,708 | — | ||||||||||||
|
Capital loss carryforwards
|
— | — | — | (5,592,059 | ) | |||||||||||
|
Net unrealized appreciation (depreciation)
|
4,416,794 | 4,457,100 | 5,986,095 | 9,281,037 | ||||||||||||
|
Other gains (losses)
|
— | — | — | — | ||||||||||||
|
Other temporary differences
|
(64,506 | ) | (102,891 | ) | (169,367 | ) | — | |||||||||
|
Total
|
$ | 4,430,783 | $ | 5,177,366 | $ | 6,137,132 | $ | 3,698,733 | ||||||||
As of October 31, 2010, Strategy had capital loss carryforwards of $5,592,059, of which $989,548 expires October 31, 2016, $4,076,771 expires October 31, 2017, and $525,740 expires October 31, 2018. These capital loss carryforwards may be utilized in the current and future years to offset net realized capital gains, if any, prior to distributing such gains to shareholders.
| 53 |
|
ISI Funds
|
Notes to Financial Statements (continued)
The difference between the federal income tax cost of portfolio investments and the financial statement cost for Strategy is due to certain timing differences in the recognition of capital gains or losses under income tax reporting regulations and GAAP. These “book/tax” differences are temporary in nature and are primarily due to the tax deferral of losses on wash sales.
Note 4 – Investment Transactions
The aggregate cost of purchases and proceeds from sales of investments, other than short-term obligations, for the six months ended April 30, 2011 were as follows:
|
|
Non-US Government Obligations
|
US Government Obligations
|
||||||||||||||
|
|
Purchases
|
Sales
|
Purchases
|
Sales
|
||||||||||||
|
Total Return
|
$ | — | $ | — | $ | 11,008,594 | $ | 12,201,484 | ||||||||
|
Managed Municipal
|
4,298,955 | 8,094,380 | — | — | ||||||||||||
|
North American
|
— | 11,817,763 | 23,920,652 | 12,568,281 | ||||||||||||
|
Strategy
|
17,562,765 | 13,678,628 | 800,625 | 890,297 | ||||||||||||
Note 5 – Market and Credit Risk
North American invests in Canadian and Mexican government securities. Investing in Canadian and Mexican government securities may have different risks than investing in U.S. government securities. An investment in Canada or Mexico may be affected by developments unique to those countries. These developments may not affect the U.S. economy or the prices of U.S. government securities in the same manner. In addition, the value of bonds issued by non-U.S. governments may be affected by adverse international political and economic developments that may not impact the value of U.S. government securities.
Note 6 – Contractual Obligations
In the ordinary course of business, the Funds enter into contracts that contain a variety of indemnifications. Each Fund’s maximum exposure under these arrangements is unknown. However, the Funds have not had prior claims or losses pursuant to these indemnification provisions and believe the risk of loss thereunder to be remote.
Note 7 – Recent Accounting Pronouncement
In January 2010, the Financial Accounting Standards Board (“FASB”) issued Accounting Standards Update (“ASU”) No. 2010-06 “Improving Disclosures about Fair Value Measurements.” ASU No. 2010-06 amends FASB Accounting Standards Codification Topic 820, Fair Value Measurements and Disclosures, to require additional disclosures regarding fair value measurements. Certain disclosures required by ASU No.
| 54 |
|
ISI Funds
|
Notes to Financial Statements (continued)
2010-06 are effective for interim and annual reporting periods beginning after December 31, 2009 and others for fiscal years beginning after December 15, 2010 and for interim periods within those fiscal years. Management is currently evaluating the impact ASU No. 2010-06 will have on the Funds’ financial statement disclosures and has determined no disclosure is necessary, other than is noted below.
Note 8 – Subsequent Events
GAAP requires the Funds to recognize in the financial statements the effects of all subsequent events that provide additional evidence about conditions that existed as of the date of the Statements of Assets and Liabilities. For non-recognized subsequent events that must be disclosed to keep the financial statements from being misleading, the Funds are required to disclose the nature of the event as well as an estimate of its financial effect, or a statement that such an estimate cannot be made. Management has evaluated subsequent events through the issuance of these financial statements and has determined no disclosure is necessary other than is noted below.
On May 31, 2011 North American Class A Shares, Class C Shares, and Class I Shares, Managed Municipal Class A Shares and Class I Shares, and Total Return ISI Shares paid a distribution of $0.016, $0.013, $0.018, $0.0226, $0.0248, and $0.015, respectively, per share in net investment income related to the period ended May 31, 2011.
| 55 |
|
Notice to Shareholders (Unaudited)
|
Proxy Voting Policies and Procedures
A description of the policies and procedures that Strategy uses to determine how to vote proxies relating to securities held in Strategy’s portfolio is available, without charge and upon request, by calling (800) 955-7175. Information regarding how Strategy voted proxies relating to portfolio securities during the most recent twelve-month period ended June 30 is available, without charge, upon request, by calling (800) 955-7175 or on the SEC’s website at http://www.sec.gov.
Availability of Quarterly Portfolio Schedule
The Funds file their complete schedule of portfolio holdings with the SEC for the first and third quarters of each fiscal year on Form N-Q. Each Fund’s Form N-Q is available on the SEC’s website at http://www.sec.gov or may be reviewed and copied at the SEC’s Public Reference Room in Washington, DC. Information on the operation of the Public Reference Room may be obtained by calling 800-SEC-0330.
Privacy Notice for ISI Mutual Funds
Privacy Policy
The mutual funds in the ISI Fund Complex believe that your privacy is extremely important. We are firmly committed to protecting any personal or financial information you provide to us as well as information about your transactions with us, such as transaction amounts, account balance and account holdings (“Personal Information”). We use Personal Information only to develop and deliver products and services that you request and to fulfill any applicable legal and regulatory requirements. We do not disclose Personal Information about you or our former customers except to our affiliates and service providers. We require our employees, affiliates and service providers to maintain appropriate safeguards to ensure the security of your non-public information.
Limits of Use of Personal Information
We limit the use, collection and retention of customer information to what is necessary to provide personal financial services and related products. We have security practices and procedures in place to ensure the confidentiality and security of your Personal Information.
Accuracy of Personal Information
We strive to keep your personal and financial information accurate. If our records are incorrect or out-of-date, please notify us immediately by contacting the Service Center listed on your account statement.
Change to Our Policies
If you have any privacy or security questions, please contact us at 800-882-8585. We may, at our discretion, change this Privacy Policy at any time. If we make material changes to the policy, we will provide you with notice of these changes.
| 56 |
THIS PAGE INTENTIONALLY LEFT BLANK.
 |
|
|
Louis E. Levy
Chairman
W. Murray Jacques
Director
Edward A. Kuczmarski
Director
R. Alan Medaugh
President
Director
Nancy Lazar
Vice President
Carrie L. Butler
Vice President
|
Edward J. Veilleux
Vice President
Chief Compliance Officer
Thomas D. Stevens*
Vice President
Stephen V. Killorin
Vice President
Treasurer
Margaret M. Beeler
Vice President
Secretary
Edward S. Hyman
Senior Economic Advisor
* Thomas D. Stevens is an officer for only the ISI Strategy Fund.
|
|
Investment Advisor
|
|
|
ISI, Inc.
40 West 57th Street, 18th Floor
New York, NY 10019
(800) 955-7175
|
|
|
Shareholder Servicing Agent
|
|
|
State Street Bank & Trust Company
One Lincoln Street
Boston, MA 02111
|
|
|
Distributor
|
|
|
ISI Group, Inc.
40 West 57th Street, 18th Floor
New York, NY 10019
(800) 955-7175
|
|
Item 2.
|
Code of Ethics.
|
Not required
|
Item 3.
|
Audit Committee Financial Expert.
|
Not required
|
Item 4.
|
Principal Accountant Fees and Services.
|
Not required
|
Item 5.
|
Audit Committee of Listed Registrants.
|
Not applicable
|
Item 6.
|
Schedule of Investments.
|
|
|
(a)
|
A Schedule of Investments is included as a part of the report to shareholders filed under Item 1 of this Form N-CSR.
|
|
|
(b)
|
Not applicable
|
|
Item 7.
|
Disclosure of Proxy Voting Policies and Procedures for Closed-End Management Investment Companies.
|
|
Not applicable
|
|
Item 8.
|
Portfolio Managers of Closed-End Management Investment Companies.
|
|
Not applicable
|
|
Item 9.
|
Purchases of Equity Securities by Closed-End Management Investment Company and Affiliated Purchasers.
|
|
Not applicable
|
|
Item 10.
|
Submission of Matters to a Vote of Security Holders.
|
The registrant has not adopted procedures by which shareholders may recommend nominees to the registrant’s board of directors.
|
Item 11.
|
Controls and Procedures.
|
|
|
(a)
|
Based on their evaluation of the registrant’s disclosure controls and procedures (as defined in Rule 30a-3(c) under the Investment Company Act of 1940) as of a date within 90 days of the filing date of this report, the registrant’s principal executive officer and principal financial officer have concluded that such disclosure controls and procedures are reasonably designed and are operating effectively to ensure that material information relating to the registrant, including its consolidated subsidiaries, is made known to them by others within those entities, particularly during the period in which this report is being prepared, and that the information required in filings on Form N-CSR is recorded, processed, summarized, and reported on a timely basis.
|
|
|
(b)
|
There were no changes in the registrant’s internal control over financial reporting (as defined in Rule 30a-3(d) under the Investment Company Act of 1940) that occurred during the second fiscal quarter of the period covered by this report that have materially affected, or are reasonably likely to materially affect, the registrant’s internal control over financial reporting.
|
|
Item 12.
|
Exhibits.
|
|
|
(a)
|
(1)
|
Not applicable.
|
|
|
(2)
|
Separate certifications of the Registrant’s Principal Executive Officer and Principal Financial Officer as required by Rule 30a-2(a) under the Investment Company Act of 1940 (17 CFR 270.30a-2(a)) are attached hereto.
|
|
|
(3)
|
Not applicable
|
|
|
(b)
|
Certifications of the Registrant’s Principal Executive Officer and Principal Financial Officer as required by Rule 30a-2(b) under the Investment Company Act of 1940 are attached hereto. These certifications are being furnished to the Securities and Exchange Commission solely pursuant to 18 U.S.C. section 1350 and are not being filed as part of the Form N-CSR with the Commission.
|
SIGNATURES
Pursuant to the requirements of the Securities Exchange Act of 1934 and the Investment Company Act of 1940, the registrant has duly caused this report to be signed on its behalf by the undersigned, thereunto duly authorized.
(Registrant) North American Government Bond Fund, Inc.
|
By (Signature and Title)*
|
/s/ R. Alan Medaugh
|
||
|
R. Alan Medaugh, President
|
|||
|
Date
|
June 30, 2011
|
||
Pursuant to the requirements of the Securities Exchange Act of 1934 and the Investment Company Act of 1940, this report has been signed below by the following persons on behalf of the registrant and in the capacities and on the dates indicated.
|
By (Signature and Title)*
|
/s/ R. Alan Medaugh
|
||
|
R. Alan Medaugh, President
|
|||
|
Date
|
June 30, 2011
|
||
|
By (Signature and Title)*
|
/s/ Stephen V. Killorin
|
||
|
Stephen V. Killorin, Treasurer
|
|||
|
Date
|
June 30, 2011
|
||