Total | ||||||||||||||||||||||||||||||||
|---|---|---|---|---|---|---|---|---|---|---|---|---|---|---|---|---|---|---|---|---|---|---|---|---|---|---|---|---|---|---|---|---|
| Cutler Equity Fund | ||||||||||||||||||||||||||||||||
| RISK/RETURN SUMMARY CUTLER EQUITY FUND | ||||||||||||||||||||||||||||||||
| INVESTMENT OBJECTIVE | ||||||||||||||||||||||||||||||||
The investment objective of the Fund is to seek current income and long-term capital appreciation. | ||||||||||||||||||||||||||||||||
| FEES AND EXPENSES | ||||||||||||||||||||||||||||||||
The following tables describe the fees and expenses that you will pay if you buy and hold Class II Shares of the Equity Fund. | ||||||||||||||||||||||||||||||||
| ||||||||||||||||||||||||||||||||
| Annual Fund Operating Expenses (expenses that you pay each year as a percentage of the value of your investment) | ||||||||||||||||||||||||||||||||
| ||||||||||||||||||||||||||||||||
| Example | ||||||||||||||||||||||||||||||||
This Example is intended to help you compare the cost of investing in the Equity Fund with the cost of investing in other mutual funds. It assumes that you invest $10,000 in the Equity Fund for the time periods indicated and then redeem all of your shares at the end of those periods. The Example also assumes that your investment has a 5% return each year and that the Equity Fund's operating expenses remain the same. Although your actual costs may be higher or lower, based on these assumptions your costs would be: | ||||||||||||||||||||||||||||||||
| ||||||||||||||||||||||||||||||||
| Portfolio Turnover | ||||||||||||||||||||||||||||||||
The Equity Fund pays transaction costs, such as commissions, when it buys and sells securities (or "turns over" its portfolio). A higher portfolio turnover rate may indicate higher transaction costs and may result in higher taxes when Equity Fund shares are held in a taxable account. These costs, which are not reflected in Annual Fund Operating Expenses or in the Example, affect the Equity Fund's performance. During the most recent fiscal year, the Equity Fund's portfolio turnover rate was 6% of the average value of its portfolio. | ||||||||||||||||||||||||||||||||
| PRINCIPAL INVESTMENT STRATEGIES OF THE EQUITY FUND | ||||||||||||||||||||||||||||||||
In seeking to meet its investment objective, under normal conditions, at least 80% of the Equity Fund's assets will be invested in a diversified portfolio of common stocks according to the investment style of the Fund's Adviser. For purposes of this policy, "assets" shall mean net assets plus the amount of any borrowings for investment purposes (although the Equity Fund is not currently authorized by the Board of Trustees to do so). The Adviser invests primarily in companies domiciled in the United States and chooses investments in common stocks based on its judgment of fundamental value, which emphasizes stocks that the Adviser judges to have favorable dividend yields and growth prospects relative to comparable companies. Factors deemed particularly relevant in determining fundamental value include:
Changes in economic and political outlooks, as well as corporate developments affecting individual companies, can influence specific security prices. The Equity Fund typically invests in stocks of companies that have a total market capitalization of at least $10 billion and, in the Adviser's opinion, have institutional ownership that is sufficiently broad to provide adequate liquidity suitable to the Fund's holdings.
The Adviser uses both "top-down" and "bottom-up" approaches, and investment selections are made using a fundamental approach. Top-down research involves the study of economic trends in the domestic and global economy, such as the fluctuation in interest or unemployment rates. These factors help to identify industries and sectors with the potential to outperform as a result of major economic developments. Bottom-up research involves detailed analysis of specific companies. Important factors include industry characteristics, profitability, growth dynamics, industry positioning, strength of management, valuation and expected return for the foreseeable future. Particular attention is paid to a company's ability to pay or increase its current dividend.
The Adviser will sell securities for any one of three possible reasons:
| ||||||||||||||||||||||||||||||||
| PRINCIPAL RISKS OF INVESTING IN THE EQUITY FUND | ||||||||||||||||||||||||||||||||
An investment in the Equity Fund is subject to investment risks; therefore you may lose money by investing in the Fund. There is no assurance that the Equity Fund will achieve its investment objective. The Equity Fund's net asset value and total return will fluctuate based upon changes in the value of its portfolio securities. Upon redemption, an investment in the Equity Fund may be worth less than its original cost. The Equity Fund, by itself, does not provide a complete investment program. The Equity Fund is subject to the following principal risks:
Large-Cap Company Risk
The Equity Fund may invest in large-capitalization ("large-cap") companies. Large-cap companies may be unable to respond quickly to new competitive challenges, such as changes in technology and consumer tastes, and may not be able to attain the high growth rate of successful smaller companies, especially during extended periods of economic expansion.
Management Risk
Because the Equity Fund is actively managed, it is subject to the risk that the investment strategies, techniques and risk analyses employed by the Adviser may not produce the desired results. Poor security selection could cause the Equity Fund's return to be lower than anticipated. Current income may be significant or very little, depending upon the Adviser's portfolio selections for the Equity Fund.
Mid-Cap Company Risk
The Equity Fund may invest in mid-capitalization ("mid-cap") companies. Mid-cap companies often involve higher risks than large-cap companies because these companies may lack the financial resources, product diversification and competitive strengths of larger companies. In addition, the frequency and volume of the trading of securities of mid-cap companies are substantially less than are typical of larger companies. Therefore, the securities of mid-cap companies may be subject to greater price fluctuations. Mid-cap companies also may not be widely followed by investors, which can lower the demand for their stock.
Stock Market Risk
All investments made by the Equity Fund have some risk. Among other things, the market value of any security in which the Equity Fund may invest is based upon the market's perception of value and not necessarily the book value of an issuer or other objective measures of the issuer's worth.
The Equity Fund may be an appropriate investment if you are seeking long-term growth in your investment and are willing to tolerate significant fluctuations in the value of your investment in response to changes in the market value of the stocks the Fund holds. This type of market movement may affect the price of the securities of a single issuer, a segment of the domestic stock market or the entire market. The investment style utilized for the Equity Fund could fall out of favor with the market. In addition, performance of the Equity Fund can be affected by unexpected local, state, regional, national or global events (e.g., significant earnings shortfalls or gains, war, political events, acts of terrorism, the spread of infectious diseases or other public health issues, and natural and environmental disasters) that cause major price changes in individual securities or market sectors.
In summary, but not inclusive of all possible risks, you could lose money on your investment in the Equity Fund, or the Fund could underperform other investments, if any of the following occurs:
For additional information regarding Market Risk, refer to "Market Risk" in the section titled "Investment Objective, Principal Investment Strategies and Principal Risks of the Fund" in the Fund's prospectus.
COVID-19 Risk
An outbreak of infectious respiratory illness caused by a novel coronavirus known as COVID-19 was first detected in China in December 2019 and has now been detected globally. On March 11, 2020, the World Health Organization announced that it had made the assessment that COVID-19 can be characterized as a pandemic. The impact of COVID-19, and other infectious illness outbreaks that may arise in the future, could adversely affect the economies of many nations or the entire global economy, individual issuers and capital markets in ways that cannot necessarily be foreseen. Public health crises caused by the COVID-19 outbreak may exacerbate other pre-existing political, social and economic risks in certain countries or globally. The duration of the COVID-19 outbreak and its effects cannot be determined with certainty. The value of the Fund and the securities in which the Fund invests may be adversely affected by impacts caused by COVID-19 and other epidemics and pandemics that may arise in the future. | ||||||||||||||||||||||||||||||||
| PERFORMANCE SUMMARY | ||||||||||||||||||||||||||||||||
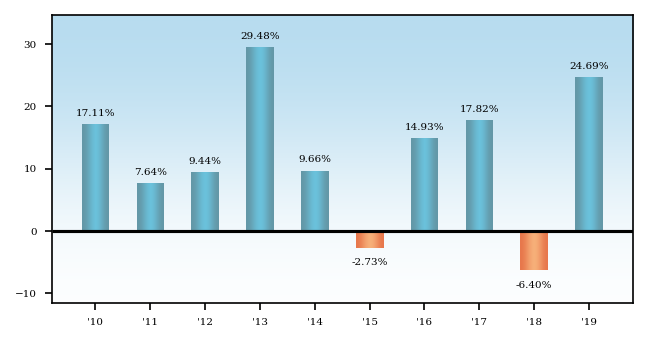
The bar chart and performance table that follow provide some indication of the risks and variability of investing in the Equity Fund by showing the changes in the Fund's performance from year-to-year for the last ten calendar years, and by showing how the Fund's average annual total returns for 1, 5 and 10 years compare with those of a broad measure of market performance. The bar chart and performance table show changes in the year-to-year performance of the Equity Fund's class of shares identified by TICKER: CALEX and offered in a separate prospectus dated October 28, 2019 (referred to herein as "Class I Shares"). Performance information for Class II Shares offered in this prospectus will be included when the share class has been operational for a full calendar year. Class II Shares would have substantially similar returns to the share class presented herein because the shares are invested in the same portfolio of securities and the annual returns would differ only to the extent that the classes do not have the same expenses.
The Equity Fund's performance in the past is not necessarily an indication of how the Fund will perform in the future. Updated performance information, current to the most recent month end, is available by calling 1-888-CUTLER4 (1-888-288-5374). | ||||||||||||||||||||||||||||||||
| EQUITY FUND Class I Shares TICKER: CALEX Year-by-year Annual Total Return as of 12/31 each year (%) | ||||||||||||||||||||||||||||||||
| ||||||||||||||||||||||||||||||||
The Equity Fund's 2020 year-to-date total return through June 30, 2020 is -8.25%.
During the periods shown in the bar chart, the highest quarterly return was 13.43% during the quarter ended September 30, 2010 and the lowest quarterly return was -11.41% during the quarter ended September 30, 2011. | ||||||||||||||||||||||||||||||||
| Average Annual Total Returns For Periods Ended December 31, 2019 | ||||||||||||||||||||||||||||||||
After-tax returns are calculated using the historical highest individual federal marginal income tax rates and do not reflect the impact of state and local taxes. Actual after-tax returns depend on an investor's tax situation and may differ from those shown. After-tax returns shown are not relevant to investors who hold their fund shares through tax-deferred arrangements, such as 401(k) plans or individual retirement accounts (IRAs). Return After Taxes on Distributions and Sale of Fund Shares may be higher than other returns for the same period due to a tax benefit of realizing a capital loss on the sale of Fund shares. | ||||||||||||||||||||||||||||||||
| ||||||||||||||||||||||||||||||||