As filed with the Securities and Exchange Commission on July 8, 2022
UNITED STATES
SECURITIES AND EXCHANGE COMMISSION
Washington, D.C. 20549
SECURITIES AND EXCHANGE COMMISSION
Washington, D.C. 20549
FORM N-CSR
CERTIFIED SHAREHOLDER REPORT OF REGISTERED
MANAGEMENT INVESTMENT COMPANIES
Investment Company Act file number (811-07168)
Hennessy Funds Trust
(Exact name of registrant as specified in charter)
(Exact name of registrant as specified in charter)
7250 Redwood Blvd., Suite 200
Novato, CA 94945
(Address of principal executive offices) (Zip code)
(Address of principal executive offices) (Zip code)
Teresa M. Nilsen
7250 Redwood Blvd., Suite 200
Novato, CA 94945
(Name and address of agent for service)
(Name and address of agent for service)
800-966-4354
Registrant’s telephone number, including area code
Date of fiscal year end: October 31, 2022
Date of reporting period: April 30, 2022
Item 1. Reports to Stockholders.
|
(a)
|
|
SEMI-ANNUAL REPORT
APRIL 30, 2022

HENNESSY CORNERSTONE GROWTH FUND
Investor Class HFCGX
Institutional Class HICGX

www.hennessyfunds.com | 1-800-966-4354
(This Page Intentionally Left Blank.)
Contents
|
Letter to Shareholders
|
2
|
|
Performance Overview
|
4
|
|
Financial Statements
|
|
|
Schedule of Investments
|
5
|
|
Statement of Assets and Liabilities
|
9
|
|
Statement of Operations
|
10
|
|
Statements of Changes in Net Assets
|
11
|
|
Financial Highlights
|
12
|
|
Notes to the Financial Statements
|
16
|
|
Expense Example
|
24
|
|
Proxy Voting Policy and Proxy Voting Records
|
26
|
|
Availability of Quarterly Portfolio Schedule
|
26
|
|
Important Notice Regarding Delivery of Shareholder Documents
|
26
|
|
Electronic Delivery
|
26
|
|
Board Approval of Investment Advisory Agreement
|
27
|
|
HENNESSY FUNDS
|
1-800-966-4354
|
May 2022
Dear Hennessy Funds Shareholder:
We’d like to start our semi-annual letter with a pause. At the end of 2021, we looked forward to a new year – a potentially calmer year – having come through almost two full years
of the coronavirus pandemic. As people, we were aware our lives had changed, but we hoped for a better 2022; as investors, we were aware that the economy was strong and employment was robust, yet challenges loomed, including inflation, supply chain
disruptions, and tightening monetary policy; as employees, students, and family members, we recognized much was different, but we sought a return to what’s familiar. What we didn’t know was that a world leader who controls one of the largest
militaries on the planet was about to start one of the worst atrocities in Europe since World War II. Our thoughts are with the Ukrainian people, and our hope is for this unjustified, senseless human tragedy to end quickly.
The equity market started 2022 on a high note, with the S&P 500® Index hitting an all-time high on the first trading day of the year. This turned out to be the last hurrah for a market that saw a continuous march higher in 2021, having hit 70 new all-time highs, with a new
all-time high being recorded on average every three and a half days. Concerns in the market then coalesced and overpowered bullish sentiment, and the market has spiraled lower throughout 2022. Factors that drove the market lower include: tightening
monetary policy as the Federal Reserve has begun raising rates and has announced plans for shrinking its $8.5 trillion asset portfolio; inflation, higher energy costs, and their effects on the domestic and global economies; continued supply chain
disruptions; investors’ indiscriminate liquidation of broad-based ETFs and index funds and the detrimental effect on equities; and the near-term and long-term global implications of the Russian invasion of Ukraine.
While markets are adjusting, many positive conditions remain intact. Corporate balance sheets and profits remain strong, GDP growth remains positive, the consumer
continues to show resilience in the face of rising prices, cash is abundant both at the corporate and household levels, unemployment is exceptionally low, and our financial system remains healthy. Markets are also experiencing a change in
leadership, as value stocks have been outperforming growth stocks, and traditionally defensive sectors such as Utilities and Consumer Staples have been outperforming the broader market. Finally, the Energy sector has soared in 2022, as companies
reap the benefits of dramatically higher oil and natural gas prices, and shareholders are rewarded with significantly higher dividends, aggressive buybacks, and higher stock prices after many years of underperformance for the sector.
With history as our guide, we are hopeful that eventually the market may bottom and head higher again. Since the financial crisis of 2008, we have experienced
many corrections and many recoveries to new highs. The Dow Jones Industrial Average has dropped over 10% eight times, including the current drop, for a median decline of 14.00%, and on average, it took 45 trading days to drop from peak to trough
and 127 trading days to return to the previous peak. Since the current drop has taken longer to go from peak to its recent trough, it may take some time for a recovery in prices to truly take hold.
On a positive note, valuations have come in, and many stocks have become more attractive, especially for longer-term investors. We note, however, that the concept
of “historically cheap stocks” does not, on its own, move the market higher. Rather, it is
|
WWW.HENNESSYFUNDS.COM
|
2
|
LETTER TO SHAREHOLDERS
|
overall capitulation and improving fundamentals that could bring buyers back into the market and reverse any bearish trends. Investors need to see improving company earnings, retreating inflationary trends, a measured
pace of interest rate increases globally that does not cause significant economic contraction, hope for a more peaceful and orderly world economic system unconstrained by supply bottlenecks and other hindrances to global trade, and, most
importantly, a subsidence of the deleterious effects of the coronavirus pandemic. While that may seem like a “tall order,” we believe that patient investing, focusing on value, quality, and downside risk mitigation, works well over the longer term.
During this tumultuous period, performance of the majority of the Hennessy Funds has been relatively strong when compared to the overall market as well as to our
benchmarks. During the six months ended April 30, 2022, the Dow Jones Industrial Average, the S&P 500® Index, and the NASDAQ Composite Index dropped
7.05%, 9.65%, and 20.15%, respectively, on a total return basis. During this period when these three major indices saw significant declines, we were pleased that seven of our 16 Funds posted positive total returns, 10 of our 14 domestic Funds
outperformed the S&P 500® Index, and over half of our active funds outperformed their primary benchmarks.
We thank you, our shareholders, for your continued interest in our family of Funds. We are grateful for the trust you put in us, and we will continue to strive to
manage our portfolios for long-term performance, ever mindful of downside risk. While volatility and uncertainty may impact the markets in the short-term, we encourage investors to stay the course, maintain a diversified portfolio, and keep a
long-term perspective. If you have any questions or would like to speak with us, please don’t hesitate to call us directly at (800) 966-4354. In closing, we would also like to thank all of the healthcare and frontline workers that have worked – and
still work – tirelessly throughout the coronavirus pandemic.
Best regards,
 |
|
 |
|
|
Ryan C. Kelley, CFA
|
|
|
Chief Investment Officer,
|
|
|
Senior Vice President, and Portfolio Manager
|
Past performance does not guarantee future results.
Mutual fund investing involves risk. Principal loss is possible.
Opinions expressed are those of Ryan C. Kelley and are subject to change, are not guaranteed, and should not be considered investment advice.
The Dow Jones Industrial Average and S&P 500® Index are commonly used to measure the performance of U.S. stocks. The NASDAQ Composite
Index comprises all common stocks listed on The NASDAQ Stock Market and is commonly used to measure the performance of technology-related stocks. The indices are used herein for comparative purposes in accordance with SEC regulations. One cannot
invest directly in an index. All returns are shown on a total return basis.
Please refer to the Performance Overview section for more detailed performance information.
|
HENNESSY FUNDS
|
1-800-966-4354
|
3
Performance Overview (Unaudited)
AVERAGE ANNUAL TOTAL RETURN FOR PERIODS ENDED APRIL 30, 2022
|
Six
|
One
|
Five
|
Ten
|
|
|
Months(1)
|
Year
|
Years
|
Years
|
|
|
Hennessy Cornerstone Growth Fund –
|
||||
|
Investor Class (HFCGX)
|
-1.92%
|
-1.39%
|
9.23%
|
10.52%
|
|
Hennessy Cornerstone Growth Fund –
|
||||
|
Institutional Class (HICGX)
|
-1.78%
|
-1.08%
|
9.59%
|
10.86%
|
|
Russell 2000® Index
|
-18.38%
|
-16.87%
|
7.24%
|
10.06%
|
|
S&P 500® Index
|
-9.65%
|
0.21%
|
13.66%
|
13.67%
|
Expense ratios: 1.34% (Investor Class); 1.01% (Institutional Class)
|
(1)
|
Periods of less than one year are not annualized.
|
_______________
Performance data quoted represents past performance; past performance does not guarantee future results. The investment return and principal value of an investment will fluctuate so that an investor’s
shares, when redeemed, may be worth more or less than their original cost. The performance table does not reflect the deduction of taxes that a shareholder would pay on Fund distributions or the redemption of Fund shares. Current performance of the
Fund may be lower or higher than the performance quoted. Performance data current to the most recent month end may be obtained by visiting www.hennessyfunds.com.
The Russell 2000® Index comprises the smallest 2,000 companies in the Russell 3000® Index based on market capitalization, representing approximately 8% of the Russell 3000® Index in terms of total market capitalization.
The S&P 500® Index is a capitalization-weighted index that is designed to represent the broad domestic economy through changes in the aggregate market value of 500
stocks across all major industries. One cannot invest directly in an index. These indices are used for comparative purposes in accordance with Securities and Exchange Commission regulations.
Frank Russell Company (“Russell”) is the source and owner of the trademarks, service marks, and copyrights related to the Russell Indexes. Russell®
is a trademark of Frank Russell Company. Neither Russell nor its licensors accept any liability for any errors or omissions in the Russell Indexes or Russell ratings or underlying data and no party may rely on any Russell Indexes or Russell ratings
or underlying data contained in this communication. No further distribution of Russell data is permitted without Russell’s express written consent. Russell does not promote, sponsor, or endorse the content of this communication.
Standard & Poor’s Financial Services is the source and owner of the S&P® and S&P 500® trademarks.
The expense ratios presented are from the most recent prospectus. The expense ratios for the current reporting period are available in the Financial Highlights section of this report.
|
WWW.HENNESSYFUNDS.COM
|
4
|
PERFORMANCE OVERVIEW/SCHEDULE OF INVESTMENTS
|
Financial Statements
|
Schedule of Investments as of April
30, 2022 (Unaudited)
|
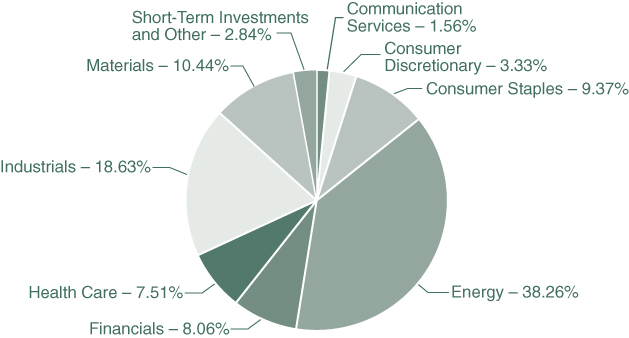
HENNESSY CORNERSTONE GROWTH FUND
(% of Net Assets)
|
TOP TEN HOLDINGS (EXCLUDING MONEY MARKET FUNDS)
|
% NET ASSETS
|
|
Alpha Metallurgical Resources, Inc.
|
3.16%
|
|
Antero Resources Corp.
|
2.96%
|
|
PBF Energy, Inc.
|
2.94%
|
|
Arch Resources, Inc.
|
2.67%
|
|
Alliance Resource Partners LP
|
2.53%
|
|
Peabody Energy Corp.
|
2.46%
|
|
The Andersons, Inc.
|
2.34%
|
|
Cenovus Energy, Inc.
|
2.27%
|
|
Chesapeake Energy Corp.
|
2.27%
|
|
Titan International, Inc.
|
2.26%
|
Note: For presentation purposes, the Fund has grouped some of the industry categories. For purposes of categorizing securities for compliance with Section 8(b)(1) of the Investment Company Act of 1940, as amended, the
Fund uses more specific industry classifications.
The Global Industry Classification Standard (GICS®) was developed by and is the exclusive property and a service mark of MSCI, Inc. and
Standard & Poor’s Financial Services LLC. It has been licensed for use by the Hennessy Funds.
|
HENNESSY FUNDS
|
1-800-966-4354
|
5
|
COMMON STOCKS – 92.62%
|
Number
|
% of
|
||||||||||
|
|
of Shares
|
Value
|
Net Assets
|
|||||||||
|
Communication Services – 1.56%
|
||||||||||||
|
Scholastic Corp.
|
66,000
|
$
|
2,432,100
|
1.56
|
%
|
|||||||
|
Consumer Discretionary – 3.33%
|
||||||||||||
|
Build-A-Bear Workshop, Inc. (a)
|
135,600
|
2,568,264
|
1.65
|
%
|
||||||||
|
Movado Group, Inc.
|
72,600
|
2,611,422
|
1.68
|
%
|
||||||||
|
|
5,179,686
|
3.33
|
%
|
|||||||||
|
Consumer Staples – 9.37%
|
||||||||||||
|
BJ’s Wholesale Club Holdings, Inc. (a)
|
43,100
|
2,773,485
|
1.78
|
%
|
||||||||
|
Coca Cola Consolidated, Inc.
|
4,900
|
2,163,350
|
1.39
|
%
|
||||||||
|
Ingles Markets, Inc.
|
33,600
|
3,128,832
|
2.01
|
%
|
||||||||
|
Tyson Foods, Inc., Class A
|
30,800
|
2,869,328
|
1.85
|
%
|
||||||||
|
The Andersons, Inc.
|
72,500
|
3,641,675
|
2.34
|
%
|
||||||||
|
|
14,576,670
|
9.37
|
%
|
|||||||||
|
Energy – 33.72%
|
||||||||||||
|
Antero Resources Corp. (a)
|
130,900
|
4,607,680
|
2.96
|
%
|
||||||||
|
Arch Resources, Inc.
|
25,000
|
4,159,500
|
2.67
|
%
|
||||||||
|
Cenovus Energy, Inc. (b)
|
191,100
|
3,531,528
|
2.27
|
%
|
||||||||
|
Chesapeake Energy Corp.
|
43,100
|
3,535,062
|
2.27
|
%
|
||||||||
|
EnLink Midstream LLC
|
335,800
|
3,314,346
|
2.13
|
%
|
||||||||
|
Equinor ASA – ADR (b)
|
97,800
|
3,333,024
|
2.14
|
%
|
||||||||
|
Imperial Oil Ltd. (b)
|
65,300
|
3,274,142
|
2.11
|
%
|
||||||||
|
Laredo Petroleum, Inc. (a)
|
41,200
|
2,933,852
|
1.89
|
%
|
||||||||
|
Marathon Petroleum Corp.
|
36,800
|
3,211,168
|
2.07
|
%
|
||||||||
|
Nabors Industries Ltd. (a)(b)
|
22,500
|
3,478,950
|
2.24
|
%
|
||||||||
|
Oceaneering International, Inc. (a)
|
195,300
|
2,212,749
|
1.42
|
%
|
||||||||
|
PBF Energy, Inc. (a)
|
157,500
|
4,576,950
|
2.94
|
%
|
||||||||
|
Peabody Energy Corp. (a)
|
169,100
|
3,828,424
|
2.46
|
%
|
||||||||
|
Ranger Oil Corp. (a)
|
97,300
|
3,099,005
|
1.99
|
%
|
||||||||
|
Targa Resources Corp.
|
45,700
|
3,354,837
|
2.16
|
%
|
||||||||
|
|
52,451,217
|
33.72
|
%
|
|||||||||
|
Financials – 8.06%
|
||||||||||||
|
American International Group, Inc.
|
46,000
|
2,691,460
|
1.73
|
%
|
||||||||
|
Encore Capital Group, Inc. (a)
|
39,600
|
2,289,276
|
1.47
|
%
|
||||||||
|
Mr. Cooper Group, Inc. (a)
|
55,400
|
2,491,338
|
1.60
|
%
|
||||||||
The accompanying notes are an integral part of these financial statements.
|
WWW.HENNESSYFUNDS.COM
|
6
|
SCHEDULE OF INVESTMENTS
|
|
COMMON STOCKS
|
Number
|
% of
|
||||||||||
|
|
of Shares
|
Value
|
Net Assets
|
|||||||||
|
Financials (Continued)
|
||||||||||||
|
Old Republic International Corp.
|
107,800
|
$
|
2,372,678
|
1.52
|
%
|
|||||||
|
Prudential Financial, Inc.
|
24,900
|
2,701,899
|
1.74
|
%
|
||||||||
|
|
12,546,651
|
8.06
|
%
|
|||||||||
|
Health Care – 7.51%
|
||||||||||||
|
Anthem, Inc.
|
6,400
|
3,212,352
|
2.06
|
%
|
||||||||
|
CVS Health Corp.
|
27,800
|
2,672,414
|
1.72
|
%
|
||||||||
|
McKesson Corp.
|
10,500
|
3,250,905
|
2.09
|
%
|
||||||||
|
Tenet Healthcare Corp. (a)
|
35,200
|
2,552,352
|
1.64
|
%
|
||||||||
|
|
11,688,023
|
7.51
|
%
|
|||||||||
|
Industrials – 18.63%
|
||||||||||||
|
BlueLinx Holdings, Inc. (a)
|
33,100
|
2,206,777
|
1.42
|
%
|
||||||||
|
Boise Cascade Co.
|
34,400
|
2,599,952
|
1.67
|
%
|
||||||||
|
Builders FirstSource, Inc. (a)
|
39,600
|
2,438,172
|
1.57
|
%
|
||||||||
|
Daseke, Inc. (a)
|
249,600
|
2,096,640
|
1.35
|
%
|
||||||||
|
Eagle Bulk Shipping, Inc. (b)
|
52,500
|
3,267,600
|
2.10
|
%
|
||||||||
|
Grindrod Shipping Holdings Ltd. (b)
|
126,100
|
3,240,770
|
2.08
|
%
|
||||||||
|
Titan International, Inc. (a)
|
253,600
|
3,514,896
|
2.26
|
%
|
||||||||
|
Triumph Group, Inc. (a)
|
119,000
|
2,682,260
|
1.72
|
%
|
||||||||
|
Univar Solutions, Inc. (a)
|
100,200
|
2,917,824
|
1.88
|
%
|
||||||||
|
USA Truck, Inc. (a)
|
107,000
|
1,755,870
|
1.13
|
%
|
||||||||
|
ZIM Integrated Shipping Services Ltd. (b)
|
40,600
|
2,258,578
|
1.45
|
%
|
||||||||
|
|
28,979,339
|
18.63
|
%
|
|||||||||
|
Materials – 10.44%
|
||||||||||||
|
Alcoa Corp.
|
36,300
|
2,461,140
|
1.58
|
%
|
||||||||
|
Alpha Metallurgical Resources, Inc. (a)
|
31,800
|
4,920,732
|
3.16
|
%
|
||||||||
|
Cabot Corp.
|
38,300
|
2,522,055
|
1.62
|
%
|
||||||||
|
Commercial Metals Co.
|
77,200
|
3,165,200
|
2.04
|
%
|
||||||||
|
Sasol Ltd – ADR (a)(b)
|
130,500
|
3,165,930
|
2.04
|
%
|
||||||||
|
|
16,235,057
|
10.44
|
%
|
|||||||||
|
|
||||||||||||
|
Total Common Stocks
|
||||||||||||
|
(Cost $136,898,574)
|
144,088,743
|
92.62
|
%
|
|||||||||
The accompanying notes are an integral part of these financial statements.
|
HENNESSY FUNDS
|
1-800-966-4354
|
7
|
PARTNERSHIPS & TRUSTS – 4.54%
|
Number
|
% of
|
||||||||||
|
|
of Shares
|
Value
|
Net Assets
|
|||||||||
|
Energy – 4.54%
|
||||||||||||
|
Alliance Resource Partners LP
|
220,000
|
$
|
3,940,200
|
2.53
|
%
|
|||||||
|
Energy Transfer Equity LP
|
282,300
|
3,127,884
|
2.01
|
%
|
||||||||
|
|
||||||||||||
|
Total Partnerships & Trusts
|
||||||||||||
|
(Cost $5,895,832)
|
7,068,084
|
4.54
|
%
|
|||||||||
|
|
||||||||||||
|
SHORT-TERM INVESTMENTS – 2.87%
|
||||||||||||
|
Money Market Funds – 2.87%
|
||||||||||||
|
First American Government Obligations Fund,
|
||||||||||||
|
Institutional Class, 0.22% (c)
|
4,472,378
|
4,472,378
|
2.87
|
%
|
||||||||
|
|
||||||||||||
|
Total Short-Term Investments
|
||||||||||||
|
(Cost $4,472,378)
|
4,472,378
|
2.87
|
%
|
|||||||||
|
|
||||||||||||
|
Total Investments
|
||||||||||||
|
(Cost $147,266,784) – 100.03%
|
155,629,205
|
100.03
|
%
|
|||||||||
|
Liabilities in Excess of Other Assets – (0.03)%
|
(45,034
|
)
|
(0.03
|
)%
|
||||||||
|
|
||||||||||||
|
TOTAL NET ASSETS – 100.00%
|
$
|
155,584,171
|
100.00
|
%
|
||||||||
Percentages are stated as a percent of net assets.
ADR – American Depository Receipt
|
(a)
|
Non-income-producing security.
|
|
(b)
|
U.S.-traded security of a foreign corporation.
|
|
(c)
|
The rate listed is the fund’s seven-day yield as of April 30, 2022.
|
Summary of Fair Value Exposure as of April 30, 2022
The following is a summary of the inputs used to value the Fund’s net assets as of April 30, 2022 (see Note 3 in the accompanying Notes to the Financial Statements):
|
Common Stocks
|
Level 1
|
Level 2
|
Level 3
|
Total
|
||||||||||||
|
Communication Services
|
$
|
2,432,100
|
$
|
—
|
$
|
—
|
$
|
2,432,100
|
||||||||
|
Consumer Discretionary
|
5,179,686
|
—
|
—
|
5,179,686
|
||||||||||||
|
Consumer Staples
|
14,576,670
|
—
|
—
|
14,576,670
|
||||||||||||
|
Energy
|
52,451,217
|
—
|
—
|
52,451,217
|
||||||||||||
|
Financials
|
12,546,651
|
—
|
—
|
12,546,651
|
||||||||||||
|
Health Care
|
11,688,023
|
—
|
—
|
11,688,023
|
||||||||||||
|
Industrials
|
28,979,339
|
—
|
—
|
28,979,339
|
||||||||||||
|
Materials
|
16,235,057
|
—
|
—
|
16,235,057
|
||||||||||||
|
Total Common Stocks
|
$
|
144,088,743
|
$
|
—
|
$
|
—
|
$
|
144,088,743
|
||||||||
|
Partnerships & Trusts
|
||||||||||||||||
|
Energy
|
$
|
7,068,084
|
$
|
—
|
$
|
—
|
$
|
7,068,084
|
||||||||
|
Total Partnerships & Trusts
|
$
|
7,068,084
|
$
|
—
|
$
|
—
|
$
|
7,068,084
|
||||||||
|
Short-Term Investments
|
||||||||||||||||
|
Money Market Funds
|
$
|
4,472,378
|
$
|
—
|
$
|
—
|
$
|
4,472,378
|
||||||||
|
Total Short-Term Investments
|
$
|
4,472,378
|
$
|
—
|
$
|
—
|
$
|
4,472,378
|
||||||||
|
Total Investments
|
$
|
155,629,205
|
$
|
—
|
$
|
—
|
$
|
155,629,205
|
||||||||
The accompanying notes are an integral part of these financial statements.
|
WWW.HENNESSYFUNDS.COM
|
8
|
SCHEDULE OF INVESTMENTS/STATEMENT OF ASSETS AND LIABILITIES
|
Financial Statements
|
Statement of Assets and Liabilities as of April 30, 2022 (Unaudited)
|
|
ASSETS:
|
||||
|
Investments in securities, at value (cost $147,266,784)
|
$
|
155,629,205
|
||
|
Dividends and interest receivable
|
28,141
|
|||
|
Receivable for fund shares sold
|
71,838
|
|||
|
Return of capital receivable
|
53,773
|
|||
|
Prepaid expenses and other assets
|
20,945
|
|||
|
Total assets
|
155,803,902
|
|||
|
LIABILITIES:
|
||||
|
Payable for fund shares redeemed
|
24,416
|
|||
|
Payable to advisor
|
97,409
|
|||
|
Payable to administrator
|
29,644
|
|||
|
Payable to auditor
|
11,228
|
|||
|
Accrued distribution fees
|
19,381
|
|||
|
Accrued service fees
|
11,921
|
|||
|
Accrued trustees fees
|
5,258
|
|||
|
Accrued expenses and other payables
|
20,474
|
|||
|
Total liabilities
|
219,731
|
|||
|
NET ASSETS
|
$
|
155,584,171
|
||
|
NET ASSETS CONSISTS OF:
|
||||
|
Capital stock
|
$
|
142,272,563
|
||
|
Total distributable earnings
|
13,311,608
|
|||
|
Total net assets
|
$
|
155,584,171
|
||
|
NET ASSETS:
|
||||
|
Investor Class
|
||||
|
Shares authorized (no par value)
|
Unlimited
|
|||
|
Net assets applicable to outstanding shares
|
$
|
140,812,096
|
||
|
Shares issued and outstanding
|
6,115,206
|
|||
|
Net asset value, offering price, and redemption price per share
|
$
|
23.03
|
||
|
Institutional Class
|
||||
|
Shares authorized (no par value)
|
Unlimited
|
|||
|
Net assets applicable to outstanding shares
|
$
|
14,772,075
|
||
|
Shares issued and outstanding
|
614,604
|
|||
|
Net asset value, offering price, and redemption price per share
|
$
|
24.04
|
||
The accompanying notes are an integral part of these financial statements.
|
HENNESSY FUNDS
|
1-800-966-4354
|
9
Financial Statements
|
Statement of Operations for the six months ended April 30, 2022 (Unaudited)
|
|
INVESTMENT INCOME:
|
||||
|
Dividend income(1)
|
$
|
1,751,703
|
||
|
Interest income
|
1,287
|
|||
|
Total investment income
|
1,752,990
|
|||
|
EXPENSES:
|
||||
|
Investment advisory fees (See Note 5)
|
600,313
|
|||
|
Distribution fees – Investor Class (See Note 5)
|
110,256
|
|||
|
Sub-transfer agent expenses – Investor Class (See Note 5)
|
99,028
|
|||
|
Sub-transfer agent expenses – Institutional Class (See Note 5)
|
4,560
|
|||
|
Administration, accounting, custody, and transfer agent fees (See Note 5)
|
93,799
|
|||
|
Service fees – Investor Class (See Note 5)
|
73,504
|
|||
|
Federal and state registration fees
|
15,463
|
|||
|
Compliance expense (See Note 5)
|
15,156
|
|||
|
Audit fees
|
11,222
|
|||
|
Trustees’ fees and expenses
|
9,779
|
|||
|
Reports to shareholders
|
6,785
|
|||
|
Legal fees
|
1,169
|
|||
|
Interest expense (See Note 7)
|
678
|
|||
|
Other expenses
|
13,409
|
|||
|
Total expenses
|
1,055,121
|
|||
|
NET INVESTMENT INCOME
|
$
|
697,869
|
||
|
REALIZED AND UNREALIZED GAINS (LOSSES):
|
||||
|
Net realized gain on investments
|
$
|
5,241,966
|
||
|
Net change in unrealized appreciation/depreciation on investments
|
(8,948,928
|
)
|
||
|
Net loss on investments
|
(3,706,962
|
)
|
||
|
NET DECREASE IN NET ASSETS RESULTING FROM OPERATIONS
|
$
|
(3,009,093
|
)
|
|
|
(1)
|
Net of foreign taxes withheld and issuance fees of $177,645.
|
The accompanying notes are an integral part of these financial statements.
|
WWW.HENNESSYFUNDS.COM
|
10
|
STATEMENT OF OPERATIONS/STATEMENTS OF CHANGES IN NET ASSETS
|
Financial Statements
|
Statements of Changes in Net Assets
|
|
Six Months Ended
|
||||||||
|
April 30, 2022
|
Year Ended
|
|||||||
|
(Unaudited)
|
October 31, 2021
|
|||||||
|
OPERATIONS:
|
||||||||
|
Net investment income (loss)
|
$
|
697,869
|
$
|
(785,532
|
)
|
|||
|
Net realized gain on investments
|
5,241,966
|
41,914,519
|
||||||
|
Net change in unrealized
|
||||||||
|
appreciation/depreciation on investments
|
(8,948,928
|
)
|
18,604,616
|
|||||
|
Net increase (decrease) in net
|
||||||||
|
assets resulting from operations
|
(3,009,093
|
)
|
59,733,603
|
|||||
|
DISTRIBUTIONS TO SHAREHOLDERS:
|
||||||||
|
Distributable earnings – Investor Class
|
(33,524,165
|
)
|
—
|
|||||
|
Distributable earnings – Institutional Class
|
(3,505,908
|
)
|
—
|
|||||
|
Total distributions
|
(37,030,073
|
)
|
—
|
|||||
|
CAPITAL SHARE TRANSACTIONS:
|
||||||||
|
Proceeds from shares subscribed – Investor Class
|
5,666,528
|
7,853,848
|
||||||
|
Proceeds from shares subscribed – Institutional Class
|
1,153,176
|
1,438,342
|
||||||
|
Dividends reinvested – Investor Class
|
32,429,645
|
—
|
||||||
|
Dividends reinvested – Institutional Class
|
3,066,399
|
—
|
||||||
|
Cost of shares redeemed – Investor Class
|
(12,958,096
|
)
|
(20,954,269
|
)
|
||||
|
Cost of shares redeemed – Institutional Class
|
(1,475,108
|
)
|
(2,945,640
|
)
|
||||
|
Net increase (decrease) in net assets derived
|
||||||||
|
from capital share transactions
|
27,882,544
|
(14,607,719
|
)
|
|||||
|
TOTAL INCREASE (DECREASE) IN NET ASSETS
|
(12,156,622
|
)
|
45,125,884
|
|||||
|
NET ASSETS:
|
||||||||
|
Beginning of period
|
167,740,793
|
122,614,909
|
||||||
|
End of period
|
$
|
155,584,171
|
$
|
167,740,793
|
||||
|
CHANGES IN SHARES OUTSTANDING:
|
||||||||
|
Shares sold – Investor Class
|
227,406
|
276,838
|
||||||
|
Shares sold – Institutional Class
|
43,548
|
49,401
|
||||||
|
Shares issued to holders as reinvestment
|
||||||||
|
of dividends – Investor Class
|
1,319,351
|
—
|
||||||
|
Shares issued to holders as reinvestment
|
||||||||
|
of dividends – Institutional Class
|
119,641
|
—
|
||||||
|
Shares redeemed – Investor Class
|
(525,284
|
)
|
(755,784
|
)
|
||||
|
Shares redeemed – Institutional Class
|
(56,235
|
)
|
(105,327
|
)
|
||||
|
Net increase (decrease) in shares outstanding
|
1,128,427
|
(534,872
|
)
|
|||||
The accompanying notes are an integral part of these financial statements.
|
HENNESSY FUNDS
|
1-800-966-4354
|
11
Financial Statements
|
Financial Highlights
|
For an Investor Class share outstanding throughout each period
|
Six Months Ended
|
||||
|
April 30, 2022
|
||||
|
(Unaudited)
|
||||
|
PER SHARE DATA:
|
||||
|
Net asset value, beginning of period
|
$
|
29.83
|
||
|
Income from investment operations:
|
||||
|
Net investment income (loss)
|
0.10
|
(1)
|
||
|
Net realized and unrealized gains (losses) on investments
|
(0.26
|
)
|
||
|
Total from investment operations
|
(0.16
|
)
|
||
|
Less distributions:
|
||||
|
Dividends from net realized gains
|
(6.64
|
)
|
||
|
Total distributions
|
(6.64
|
)
|
||
|
Net asset value, end of period
|
$
|
23.03
|
||
|
TOTAL RETURN
|
-1.92
|
%(2)
|
||
|
SUPPLEMENTAL DATA AND RATIOS:
|
||||
|
Net assets, end of period (millions)
|
$
|
140.81
|
||
|
Ratio of expenses to average net assets
|
1.33
|
%(3)
|
||
|
Ratio of net investment income (loss) to average net assets
|
0.83
|
%(3)
|
||
|
Portfolio turnover rate(4)
|
88
|
%(2)
|
||
|
(1)
|
Calculated using the average shares outstanding method.
|
|
(2)
|
Not annualized.
|
|
(3)
|
Annualized.
|
|
(4)
|
Calculated on the basis of the Fund as a whole.
|
The accompanying notes are an integral part of these financial statements.
|
WWW.HENNESSYFUNDS.COM
|
12
|
FINANCIAL HIGHLIGHTS — INVESTOR CLASS
|
|
Year Ended October 31,
|
||||||||||||||||||
|
2021
|
2020
|
2019
|
2018
|
2017
|
||||||||||||||
|
$
|
19.91
|
$
|
19.15
|
$
|
22.17
|
$
|
24.16
|
$
|
18.98
|
|||||||||
|
(0.14
|
)(1)
|
(0.08
|
)(1)
|
(0.01
|
)(1)
|
(0.17
|
)
|
(0.09
|
)
|
|||||||||
|
10.06
|
0.84
|
(1.19
|
)
|
(1.82
|
)
|
5.27
|
||||||||||||
|
9.92
|
0.76
|
(1.20
|
)
|
(1.99
|
)
|
5.18
|
||||||||||||
|
—
|
—
|
(1.82
|
)
|
—
|
—
|
|||||||||||||
|
—
|
—
|
(1.82
|
)
|
—
|
—
|
|||||||||||||
|
$
|
29.83
|
$
|
19.91
|
$
|
19.15
|
$
|
22.17
|
$
|
24.16
|
|||||||||
|
49.82
|
%
|
3.97
|
%
|
-5.19
|
%
|
-8.24
|
%
|
27.29
|
%
|
|||||||||
|
$
|
151.96
|
$
|
110.96
|
$
|
125.10
|
$
|
158.98
|
$
|
197.22
|
|||||||||
|
1.34
|
%
|
1.36
|
%
|
1.34
|
%
|
1.30
|
%
|
1.30
|
%
|
|||||||||
|
(0.51
|
)%
|
(0.45
|
)%
|
(0.07
|
)%
|
(0.56
|
)%
|
(0.33
|
)%
|
|||||||||
|
98
|
%
|
98
|
%
|
95
|
%
|
133
|
%
|
98
|
%
|
|||||||||
The accompanying notes are an integral part of these financial statements.
|
HENNESSY FUNDS
|
1-800-966-4354
|
13
Financial Statements
|
Financial Highlights
|
For an Institutional Class share outstanding throughout each period
|
Six Months Ended
|
||||
|
April 30, 2022
|
||||
|
(Unaudited)
|
||||
|
PER SHARE DATA:
|
||||
|
Net asset value, beginning of period
|
$
|
31.09
|
||
|
Income from investment operations:
|
||||
|
Net investment income (loss)
|
0.15
|
(1)
|
||
|
Net realized and unrealized gains (losses) on investments
|
(0.27
|
)
|
||
|
Total from investment operations
|
(0.12
|
)
|
||
|
Less distributions:
|
||||
|
Dividends from net realized gains
|
(6.93
|
)
|
||
|
Total distributions
|
(6.93
|
)
|
||
|
Net asset value, end of period
|
$
|
24.04
|
||
|
TOTAL RETURN
|
-1.78
|
%(2)
|
||
|
SUPPLEMENTAL DATA AND RATIOS:
|
||||
|
Net assets, end of period (millions)
|
$
|
14.77
|
||
|
Ratio of expenses to average net assets
|
1.01
|
%(3)
|
||
|
Ratio of net investment income (loss) to average net assets
|
1.18
|
%(3)
|
||
|
Portfolio turnover rate(4)
|
88
|
%(2)
|
||
|
(1)
|
Calculated using the average shares outstanding method.
|
|
(2)
|
Not annualized.
|
|
(3)
|
Annualized.
|
|
(4)
|
Calculated on the basis of the Fund as a whole.
|
The accompanying notes are an integral part of these financial statements.
|
WWW.HENNESSYFUNDS.COM
|
14
|
FINANCIAL HIGHLIGHTS — INSTITUTIONAL CLASS
|
|
Year Ended October 31,
|
||||||||||||||||||
|
2021
|
2020
|
2019
|
2018
|
2017
|
||||||||||||||
|
$
|
20.68
|
$
|
19.83
|
$
|
22.88
|
$
|
24.85
|
$
|
19.46
|
|||||||||
|
(0.05
|
)(1)
|
(0.03
|
)(1)
|
0.05
|
(1)
|
0.11
|
0.01
|
|||||||||||
|
10.46
|
0.88
|
(1.22
|
)
|
(2.08
|
)
|
5.38
|
||||||||||||
|
10.41
|
0.85
|
(1.17
|
)
|
(1.97
|
)
|
5.39
|
||||||||||||
|
—
|
—
|
(1.88
|
)
|
—
|
—
|
|||||||||||||
|
—
|
—
|
(1.88
|
)
|
—
|
—
|
|||||||||||||
|
$
|
31.09
|
$
|
20.68
|
$
|
19.83
|
$
|
22.88
|
$
|
24.85
|
|||||||||
|
50.34
|
%
|
4.29
|
%
|
-4.86
|
%
|
-7.93
|
%
|
27.70
|
%
|
|||||||||
|
$
|
15.78
|
$
|
11.65
|
$
|
14.62
|
$
|
20.52
|
$
|
31.65
|
|||||||||
|
1.01
|
%
|
1.05
|
%
|
1.01
|
%
|
0.96
|
%
|
0.97
|
%
|
|||||||||
|
(0.17
|
)%
|
(0.14
|
)%
|
0.27
|
%
|
(0.23
|
)%
|
(0.00
|
)%
|
|||||||||
|
98
|
%
|
98
|
%
|
95
|
%
|
133
|
%
|
98
|
%
|
|||||||||
The accompanying notes are an integral part of these financial statements.
|
HENNESSY FUNDS
|
1-800-966-4354
|
15
Financial Statements
|
Notes to the Financial Statements April 30, 2022 (Unaudited)
|
1). ORGANIZATION
The Hennessy Cornerstone Growth Fund (the “Fund”) is a series of Hennessy Funds Trust (the “Trust”), which was organized as a Delaware statutory trust on September 17, 1992. The Fund is an open-end management investment
company registered under the Investment Company Act of 1940, as amended. The investment objective of the Fund is long-term growth of capital. The Fund is a diversified fund.
The Fund offers Investor Class and Institutional Class shares. Each class of shares differs principally in its respective 12b-1 distribution and service, shareholder servicing, and sub-transfer agent
expenses. There are no sales charges. Each class has identical rights to earnings, assets, and voting privileges, except for class-specific expenses and exclusive rights to vote on matters affecting only one class.
As an investment company, the Fund follows the investment company accounting and reporting guidance of the Financial Accounting Standards Board (“FASB”) Accounting Standard Codification Topic 946
“Financial Services—Investment Companies.”
2). SIGNIFICANT ACCOUNTING POLICIES
The following is a summary of significant accounting policies consistently followed by the Fund in the preparation of the financial statements. These policies conform to U.S. generally accepted accounting principles
(“GAAP”).
|
a).
|
Securities Valuation – All investments in securities are valued in accordance with the Fund’s valuation policies and procedures, as described in Note 3.
|
|
b).
|
Federal Income Taxes – The Fund has elected to be taxed as a regulated investment company and intends to distribute substantially all of its taxable income to its shareholders and otherwise comply with the
provisions of the Internal Revenue Code of 1986, as amended, applicable to regulated investment companies. As a result, the Fund has made no provision for federal income taxes or excise taxes. Net investment income/loss and realized
gains/losses for federal income tax purposes may differ from those reported in the financial statements because of temporary book-basis and tax-basis differences. Temporary differences are primarily the result of the treatment of
partnership income and wash sales for tax reporting purposes. The Fund recognizes interest and penalties related to income tax benefits, if any, in the Statement of Operations as an income tax expense. Distributions from net realized gains
for book purposes may include short-term capital gains, which are included as ordinary income to shareholders for tax purposes. The Fund may utilize equalization accounting for tax purposes and designate earnings and profits, including net
realized gains distributed to shareholders on redemption of shares, as part of the dividends paid deduction for income tax purposes.
|
|
c).
|
Accounting for Uncertainty in Income Taxes – The Fund has accounting policies regarding recognition and measurement of tax positions taken or expected to be taken on a tax return. The tax returns of the Fund for
the prior three fiscal years are open for examination. The Fund has reviewed all open tax years in major tax jurisdictions and concluded that there is no impact on the Fund’s net assets and no tax liability resulting from unrecognized tax
benefits relating to uncertain income tax positions taken or expected to be taken on a tax return. The Fund’s major tax jurisdictions are U.S. federal and Delaware.
|
|
WWW.HENNESSYFUNDS.COM
|
16
|
NOTES TO THE FINANCIAL STATEMENTS
|
|
d).
|
Income and Expenses – Dividend income is recognized on the ex-dividend date or as soon as information is available to the Fund. Interest income, which includes the amortization of premium and accretion of
discount, is recognized on an accrual basis. Market discounts, original issue discounts, and market premiums on debt securities are accreted or amortized to interest income over the life of a security with a corresponding increase or
decrease, as applicable, in the cost basis of such security using the yield-to-maturity method or, where applicable, the first call date of the security. Other non-cash dividends are recognized as investment income at the fair value of the
property received. The Fund is charged for those expenses that are directly attributable to its portfolio, such as advisory, administration, and certain shareholder service fees. Income, expenses (other than expenses attributable to a
specific class), and realized and unrealized gains/losses on investments are allocated to each class of shares based on such class’s net assets. Distributions received from the Fund’s investments in master limited partnerships (“MLPs”)
generally consist of ordinary income, capital gains, and return of capital. The Fund records investment income on the ex-date of the distributions. For financial statement purposes, the Fund uses return of capital and income estimates to
allocate the dividend income received. Such estimates are based on historical information available from the MLPs and other industry sources. These estimates may subsequently be revised based on information received from the MLPs after
their tax reporting periods are concluded, as the actual character of these distributions is not known until after the fiscal year end of the Fund.
|
|
e).
|
Distributions to Shareholders – Dividends from net investment income for the Fund, if any, are declared and paid annually, usually in December. Distributions of net realized capital gains, if any, are declared and
paid annually, usually in December.
|
|
f).
|
Security Transactions – Investment and shareholder transactions are recorded on the trade date. The Fund determines the realized gain/loss from an investment transaction by comparing the original cost of the
security lot sold with the net sale proceeds. Discounts and premiums on securities purchased are accreted or amortized, respectively, over the life of each such security.
|
|
g).
|
Use of Estimates – Preparing financial statements in accordance with GAAP requires management to make estimates and assumptions that affect the reported amounts of assets and liabilities and disclosure of
contingent assets and liabilities at the date of the financial statements, as well as the reported change in net assets during the reporting period. Actual results could differ from those estimates.
|
|
h).
|
Share Valuation – The net asset value (“NAV”) per share of the Fund is calculated by dividing (i) the total value of the securities held by the Fund, plus cash and other assets, minus all liabilities (including
estimated accrued expenses) by (ii) the total number of Fund shares outstanding, rounded to the nearest $0.01. Fund shares are not priced on days the New York Stock Exchange is closed for trading. The offering and redemption price per share
for the Fund is equal to the Fund’s NAV per share.
|
|
i).
|
Recent Accounting Pronouncements and Regulatory Updates – In October 2020, the Securities and Exchange Commission (“SEC”) adopted new regulations governing the use of derivatives by registered investment companies
(“Rule 18f-4”). Rule 18f-4 imposes limits on the amount of derivatives a fund can enter into, eliminates the asset segregation framework currently used by funds to comply with Section 18 of the 1940 Act, and requires funds whose use of
derivatives is greater than a limited specified amount to establish and maintain a comprehensive derivatives risk management program and appoint a derivatives risk manager. Funds are required to
|
|
HENNESSY FUNDS
|
1-800-966-4354
|
17
|
comply with Rule 18f-4 by August 19, 2022. The impact, if any, that Rule 18f-4 will have on the availability, liquidity, and performance of derivatives is unclear. Management is currently evaluating the potential
impact of Rule 18f-4 on the Fund. When fully implemented, Rule 18f-4 may require changes in how the Fund uses derivatives, adversely affect the Fund’s performance, and increase costs related to the Fund’s use of derivatives.
|
|
|
In December 2020, the SEC adopted a new rule providing a framework for fund valuation practices (“Rule 2a-5”). Rule 2a-5 establishes
requirements for determining fair value in good faith for purposes of the 1940 Act. Rule 2a-5 permits fund boards to designate certain parties to perform fair value determinations, subject to board oversight and certain other conditions.
Rule 2a-5 also defines when market quotations are “readily available” for purposes of the 1940 Act and the threshold for determining whether a fund must fair value a security. In connection with Rule 2a-5, the SEC also adopted related
recordkeeping requirements and is rescinding previously issued guidance, including with respect to the role of a board in determining fair value and the accounting and auditing of fund investments. Funds must comply with the rules by
September 8, 2022. Management is currently assessing the potential impact of the new rules on the Fund’s financial statements.
|
3). SECURITIES VALUATION
The Fund follows its valuation policies and procedures in determining its net asset value and, in preparing these financial statements, the fair value accounting standards that establish an authoritative definition of
fair value and set out a hierarchy for measuring fair value. These standards require additional disclosures about the various inputs and valuation techniques used to develop the measurements of fair value and a discussion of changes in valuation
techniques and related inputs during the period. These inputs are summarized in the three broad levels listed below:
|
Level 1 –
|
Unadjusted, quoted prices in active markets for identical instruments that the Fund has the ability to access at the date of measurement.
|
|
|
Level 2 –
|
Other significant observable inputs (including, but not limited to, quoted prices in active markets for similar instruments, quoted prices in markets that are not active for identical or similar instruments, and
model-derived valuations in which all significant inputs and significant value drivers are observable in active markets, such as interest rates, prepayment speeds, credit risk curves, default rates, and similar data).
|
|
|
Level 3 –
|
Significant unobservable inputs (including the Fund’s own assumptions about what market participants would use to price the asset or liability based on the best available information) when observable inputs are
unavailable.
|
The following is a description of the valuation techniques applied to the Fund’s major categories of assets and liabilities on a recurring basis:
|
Equity Securities – Equity securities, including common stocks, preferred stocks, foreign-issued common stocks, exchange-traded funds, closed-end mutual funds,
partnerships, rights, MLPs, and real estate investment trusts, that are traded on a securities exchange for which a last-quoted sales price is readily available generally are valued at the last sales price as reported by the primary
exchange on which the securities are listed. Securities listed on The Nasdaq Stock Market (“Nasdaq”) generally are valued at the Nasdaq Official Closing Price, which may differ from the last sales price reported. Securities traded on a
securities exchange for which a last-quoted sales price is not readily available generally are valued at the mean between
|
|
WWW.HENNESSYFUNDS.COM
|
18
|
NOTES TO THE FINANCIAL STATEMENTS
|
|
the bid and ask prices. To the extent these securities are actively traded and valuation adjustments are not applied, they are classified in Level 1 of the fair value hierarchy. Securities traded on foreign
exchanges generally are not valued at the same time the Fund calculates its NAV because most foreign markets close well before such time. The earlier close of most foreign markets gives rise to the possibility that significant events,
including broad market moves, may have occurred in the interim. In certain circumstances, it may be determined that a foreign security needs to be fair valued because it appears that the value of the security might have been materially
affected by events occurring after the close of the market in which the security is principally traded, but before the time the Fund calculates its NAV, such as by a development that affects an entire market or region (e.g., a
weather-related event) or a potentially global development (e.g., a terrorist attack that may be expected to have an effect on investor expectations worldwide).
|
|
|
Registered Investment Companies – Investments in open-end registered investment companies, commonly referred to as mutual funds, generally are priced at the ending NAV
provided by the applicable mutual fund’s service agent and are classified in Level 1 of the fair value hierarchy.
|
|
|
Debt Securities – Debt securities, including corporate bonds, asset-backed securities, mortgage-backed securities, municipal bonds, U.S. Treasuries, and U.S. government
agency issues, are generally valued at market on the basis of valuations furnished by an independent pricing service that utilizes both dealer-supplied valuations and formula-based techniques. The pricing service may consider recently
executed transactions in securities of the issuer or comparable issuers, market price quotations (where observable), bond spreads, and fundamental data relating to the issuer. In addition, the model may incorporate observable market data,
such as reported sales of similar securities, broker quotes, yields, bids, offers, and reference data. Certain securities are valued primarily using dealer quotations. These securities are generally classified in Level 2 of the fair value
hierarchy.
|
|
|
Short-Term Securities – Short-term equity investments, including money market funds, are valued in the manner specified above for equity securities. Short-term debt
investments with an original term to maturity of 60 days or less are valued at amortized cost, which approximates fair market value. If the original term to maturity of a short-term debt investment exceeds 60 days, then the values as of the
61st day prior to maturity are amortized. Amortized cost is not used if its use would be inappropriate due to credit or other impairments of the issuer, in which case the security’s fair value would be determined as described below.
Short-term securities are generally classified in Level 1 or Level 2 of the fair value hierarchy depending on the inputs used and market activity levels for specific securities.
|
The Board of Trustees of the Fund (the “Board”) has adopted fair value pricing procedures that are followed when a price for a security is not readily available or if a significant event has occurred
that indicates the closing price of a security no longer represents the true value of that security. Fair value pricing determinations are made in good faith in accordance with these procedures. There are numerous criteria considered in determining
a fair value of a security, such as the trading volume of a security and markets, the values of other similar securities, and news events with direct bearing on a security or markets. Fair value pricing results in an estimated price for a security
that reflects the amount the Fund might reasonably expect to receive in a current sale. Depending on the relative significance of the valuation inputs, these securities may be classified in either Level 2 or Level 3 of the fair value hierarchy.
|
HENNESSY FUNDS
|
1-800-966-4354
|
19
The fair value of foreign securities may be determined with the assistance of a pricing service using correlations between the movement of prices of such securities and indices of domestic securities
and other appropriate indicators, such as closing market prices of relevant American Depositary Receipts or futures contracts. Using fair value pricing means that the Fund’s NAV reflects the affected portfolio securities’ values as determined by
the Board or its designee, pursuant to the fair value pricing procedures adopted by the Board, instead of being determined by the market. Using a fair value pricing methodology to price a foreign security may result in a value that is different
from such foreign security’s most recent closing price and from the value used by other investment companies to calculate their NAVs. Such securities are generally classified in Level 2 of the fair value hierarchy. Because the Fund may invest in
foreign securities, the value of the Fund’s portfolio securities may change on days when a shareholder is unable to purchase or redeem Fund shares.
The Board has delegated day-to-day valuation matters to the Valuation and Liquidity Committee comprising representatives from Hennessy Advisors, Inc., the Fund’s investment advisor (the “Advisor”). The
function of the Valuation and Liquidity Committee, among other things, is to value securities where current and reliable market quotations are not readily available. All actions taken by the Valuation and Liquidity Committee are reviewed by the
Board.
The Fund has performed an analysis of all existing investments to determine the significance and character of all inputs to their fair value determinations. Various inputs are used to determine the
value of the Fund’s investments. The inputs or methodology used for valuing securities are not necessarily an indication of the risk associated with investing in those securities. Details related to the fair value hierarchy of the Fund’s securities
as of April 30, 2022, are included in the Schedule of Investments.
4). INVESTMENT TRANSACTIONS
Purchases and sales of investment securities (excluding government and short-term investments) for the Fund during the six months ended April 30, 2022, were $139,671,060 and $150,767,713, respectively.
There were no purchases or sales/maturities of long-term U.S. government securities for the Fund during the six months ended April 30, 2022.
5). INVESTMENT ADVISORY FEE AND OTHER TRANSACTIONS WITH AFFILIATES
The Advisor provides the Fund with investment advisory services under an Investment Advisory Agreement. The Advisor furnishes all investment advice, office space, and facilities and most of the personnel needed by the
Fund. As compensation for its services, the Advisor is entitled to a monthly fee from the Fund. The fee is based on the average daily net assets of the Fund at an annual rate of 0.74%. The net investment advisory fees expensed by the Fund during
the six months ended April 30, 2022, are included in the Statement of Operations.
The Board has approved a Shareholder Servicing Agreement for Investor Class shares of the Fund, which compensates the Advisor for the non-investment advisory services it provides to the Fund. The
Shareholder Servicing Agreement provides for a monthly fee paid to the Advisor at an annual rate of 0.10% of the average daily net assets of the Fund attributable to Investor Class shares. The shareholder service fees expensed by the Fund during
the six months ended April 30, 2022, are included in the Statement of Operations.
The Fund has adopted a plan pursuant to Rule 12b-1 under the Investment Company Act of 1940, as amended, that authorizes payments in connection with the
|
WWW.HENNESSYFUNDS.COM
|
20
|
NOTES TO THE FINANCIAL STATEMENTS
|
distribution of Fund shares at an annual rate of up to 0.25% of the Fund’s average daily net assets attributable to Investor Class shares. Even though the authorized rate is up to 0.25%, the Fund is currently only using
up to 0.15% of its average daily net assets attributable to Investor Class shares for such purpose. Amounts paid under the plan may be spent on any activities or expenses primarily intended to result in the sale of shares, including, but not
limited to, advertising, shareholder account servicing, printing and mailing of prospectuses to other than current shareholders, printing and mailing of sales literature, and compensation for sales and marketing activities or to financial
institutions and others, such as dealers and distributors. The distribution fees expensed by the Fund during the six months ended April 30, 2022, are included in the Statement of Operations.
The Fund has entered into agreements with various brokers, dealers, and financial intermediaries in connection with the sale of Fund shares. The agreements provide for periodic payments of sub-transfer
agent expenses by the Fund to the brokers, dealers, and financial intermediaries for providing certain shareholder maintenance services. These shareholder services include the pre-processing and quality control of new accounts, shareholder
correspondence, answering customer inquiries regarding account status, and facilitating shareholder telephone transactions. The sub-transfer agent fees expensed by the Fund during the six months ended April 30, 2022, are included in the Statement
of Operations.
U.S. Bancorp Fund Services, LLC, d/b/a U.S. Bank Global Fund Services (“Fund Services”) provides the Fund with administrative, accounting, and transfer agent services. As administrator, Fund Services is
responsible for activities such as (i) preparing various federal and state regulatory filings, reports, and returns for the Fund, (ii) preparing reports and materials to be supplied to the Board, (iii) monitoring the activities of the Fund’s
custodian, transfer agent, and accountants, and (iv) coordinating the preparation and payment of the Fund’s expenses and reviewing the Fund’s expense accruals. U.S. Bank N.A., an affiliate of Fund Services, serves as the Fund’s custodian. The
servicing agreements between the Trust, Fund Services, and U.S. Bank N.A. contain a fee schedule that is inclusive of administrative, accounting, custody, and transfer agent fees. The administrative, accounting, custody, and transfer agent fees
expensed by the Fund during the six months ended April 30, 2022, are included in the Statement of Operations.
Quasar Distributors, LLC (“Quasar”), a wholly owned broker-dealer subsidiary of Foreside Financial Group, LLC, acts as the Fund’s principal underwriter in a continuous public offering of Fund shares.
The officers of the Fund are affiliated with the Advisor. With the exception of the Chief Compliance Officer and the Senior Compliance Officer, such officers receive no compensation from the Fund for
serving in their respective roles. The Fund, along with the other funds in the Hennessy Funds family (collectively, the “Hennessy Funds”), makes reimbursement payments on an equal basis to the Advisor for a portion of the salary and benefits
associated with the office of the Chief Compliance Officer and for all of the salary and benefits associated with the office of the Senior Compliance Officer. The compliance fees expensed by the Fund during the six months ended April 30, 2022, are
included in the Statement of Operations.
6). GUARANTEES AND INDEMNIFICATIONS
Under the Hennessy Funds’ organizational documents, their officers and trustees are indemnified by the Hennessy Funds against certain liabilities arising out of the performance of their duties to the Hennessy Funds.
Additionally, in the normal course of business, the Hennessy Funds enter into contracts with service providers that contain
|
HENNESSY FUNDS
|
1-800-966-4354
|
21
general indemnification clauses. The Fund’s maximum exposure under these arrangements is unknown as this would involve future claims that may be made against the Fund that have not yet occurred. Currently, the Fund
expects the risk of loss to be remote.
7). LINE OF CREDIT
The Fund has an uncommitted line of credit with the other Hennessy Funds in the amount of the lesser of (i) $100,000,000 or (ii) 33.33% of each Hennessy Fund’s net assets, or 30% for the Hennessy Gas Utility Fund and 10%
for the Hennessy Balanced Fund. The line of credit is intended to provide any necessary short-term financing in connection with shareholder redemptions, subject to certain restrictions. The credit facility is with the Hennessy Funds’ custodian
bank, U.S. Bank N.A. Borrowings under this arrangement bear interest at the bank’s prime rate and are secured by all of the Fund’s assets (as to its own borrowings only). During the six months ended April 30, 2022, the Fund had an outstanding
average daily balance and a weighted average interest rate of $41,497 and 3.25%, respectively. The interest expensed by the Fund during the six months ended April 30, 2022, is included in the Statement of Operations. The maximum amount outstanding
for the Fund during the period was $3,039,000. As of April 30, 2022, the Fund did not have any borrowings outstanding under the line of credit.
8). FEDERAL TAX INFORMATION
As of October 31, 2021, the Fund’s most recent fiscal year end, the components of accumulated earnings (losses) for income tax purposes were as follows:
|
Investments
|
|||||
|
Cost of investments for tax purposes
|
$
|
150,726,712
|
|||
|
Gross tax unrealized appreciation
|
$
|
36,563,930
|
|||
|
Gross tax unrealized depreciation
|
(19,252,581
|
)
|
|||
|
Net tax unrealized appreciation/(depreciation)
|
$
|
17,311,349
|
|||
|
Undistributed ordinary income
|
$
|
—
|
|||
|
Undistributed long-term capital gains
|
37,030,068
|
||||
|
Total distributable earnings
|
$
|
37,030,068
|
|||
|
Other accumulated gain/(loss)
|
$
|
(990,643
|
)
|
||
|
Total accumulated gain/(loss)
|
$
|
53,350,774
|
|||
As of October 31, 2021, the Fund had no tax-basis capital losses to offset future capital gains. During fiscal year 2021, the capital losses utilized by the Fund were $1,916,363.
Capital losses sustained in or after fiscal year 2012 can be carried forward indefinitely, but any such loss retains the character of the original loss and must be utilized prior to any loss incurred
before fiscal year 2012. As a result of this ordering rule, capital loss carryforwards incurred prior to fiscal year 2012 may be more likely to expire unused. Capital losses sustained prior to fiscal year 2012 can be carried forward for eight years
and can be carried forward as short-term capital losses regardless of the character of the original loss.
As of October 31, 2021, the Fund deferred, on a tax basis, a late-year ordinary loss of $990,643. Late-year ordinary losses are net ordinary losses incurred after December 31, 2020, but within the
taxable year, that are deemed to arise on the first day of the Fund’s next taxable year.
|
WWW.HENNESSYFUNDS.COM
|
22
|
NOTES TO THE FINANCIAL STATEMENTS
|
During fiscal year 2022 (year to date) and fiscal year 2021, the tax character of distributions paid by the Fund was as follows:
|
Six Months Ended
|
Year Ended
|
||||||||
|
April 30, 2022
|
October 31, 2021
|
||||||||
|
Ordinary income(1)
|
$
|
—
|
$
|
—
|
|||||
|
Long-term capital gains
|
37,030,073
|
—
|
|||||||
|
Total distributions
|
$
|
37,030,073
|
$
|
—
|
|||||
|
(1) Ordinary income includes short-term capital gains.
|
9). EVENTS SUBSEQUENT TO PERIOD END
Management has evaluated the Fund’s related events and transactions that occurred subsequent to April 30, 2022, through the date of issuance of the Fund’s financial statements. Management has determined that there were no
subsequent events requiring recognition or disclosure in the financial statements.
|
HENNESSY FUNDS
|
1-800-966-4354
|
23
Expense Example (Unaudited)
April 30, 2022
As a shareholder of the Fund, you incur ongoing costs, including management fees, service fees, and other Fund expenses. This Example is intended to help you understand your ongoing costs (in dollars) of investing in the
Fund and to compare these costs with the ongoing costs of investing in other mutual funds. The Example is based on an investment of $1,000 invested at the beginning of the period and held for the entire period from November 1, 2021, through April
30, 2022.
Actual Expenses
In the table below, the first line under each of the “Investor Class” and “Institutional Class” headings provides information about actual account values and actual expenses for each share class. You may use this
information, together with the amount you invested, to estimate the expenses that you paid over the period. Simply divide your account value by $1,000 (for example, an $8,600 account value divided by $1,000 = 8.6), then multiply the result by the
number in the first line under the heading “Expenses Paid During Period” to estimate the expenses you paid on your account during this period. Although the Fund charges no sales loads or transaction fees, you will be assessed fees for outgoing wire
transfers, returned checks, and stop payment orders at prevailing rates charged by U.S. Bank Global Fund Services, the Fund’s transfer agent. If you request that a redemption be made by wire transfer, the Fund’s transfer agent charges a $15 fee.
IRAs are charged a $15 annual maintenance fee (up to $30 maximum per shareholder for shareholders with multiple IRAs). The examples below include, but are not limited to, management, shareholder servicing, accounting, custody, and transfer agent
fees. However, the examples below do not include portfolio trading commissions and related expenses.
Hypothetical Example for Comparison Purposes
In the table below, the second line under each of the “Investor Class” and “Institutional Class” headings provides information about hypothetical account values and hypothetical expenses based on the Fund’s actual expense
ratio for each share class and an assumed rate of return of 5% per year before expenses, which is not the Fund’s actual return for such share class. The hypothetical account values and expenses may not be used to estimate the actual ending account
balance or expenses you paid for the period. You may use this information to compare the ongoing costs of investing in the Fund and other funds. To do so, compare these 5% hypothetical examples with the 5% hypothetical examples that appear in the
shareholder reports of the other funds. Please note that the expenses shown in the table are meant to highlight your ongoing costs only. Therefore, the second lines under “Investor Class” and “Institutional Class” are useful in comparing ongoing
costs only and will not help you determine the relative total costs of owning different funds.
|
WWW.HENNESSYFUNDS.COM
|
24
|
EXPENSE EXAMPLE
|
|
Beginning
|
Ending
|
||
|
Account Value
|
Account Value
|
Expenses Paid
|
|
|
November 1, 2021
|
April 30, 2022
|
During Period(1)
|
|
|
Investor Class
|
|||
|
Actual
|
$1,000.00
|
$ 980.80
|
$6.53
|
|
Hypothetical (5% return before expenses)
|
$1,000.00
|
$1,018.20
|
$6.66
|
|
Institutional Class
|
|||
|
Actual
|
$1,000.00
|
$ 982.20
|
$4.96
|
|
Hypothetical (5% return before expenses)
|
$1,000.00
|
$1,019.79
|
$5.06
|
|
(1)
|
Expenses are equal to the Fund’s annualized expense ratio of 1.33% for Investor Class shares or 1.01% for Institutional Class shares, as applicable, multiplied by the average account value over the period,
multiplied by 181/365 days (to reflect the half-year period).
|
|
HENNESSY FUNDS
|
1-800-966-4354
|
25
How to Obtain a Copy of the Fund’s Proxy
Voting Policy and Proxy Voting Records
A description of the policies and procedures the Fund uses to determine how to vote proxies relating to portfolio securities is available without charge (1) by calling 800-966-4354, (2) on the Hennessy Funds’ website at
www.hennessyfunds.com/proxy-voting/voting-policy, or (3) on the U.S. Securities and Exchange Commission’s (the “SEC”) website at www.sec.gov. The Fund’s proxy voting record is available without charge on both the Hennessy Funds’ website at
www.hennessyfunds.com/proxy-voting/voting-record and the SEC’s website at www.sec.gov no later than August 31 for the prior 12 months ending June 30.
Availability of Quarterly Portfolio Schedule
The Fund files its complete schedule of portfolio holdings with the SEC for the first and third quarters of each fiscal year as an exhibit to its reports on Form N-PORT. The Fund’s Form N-PORT reports are available on the
SEC’s website at www.sec.gov or on request by calling 800-966-4354.
Important Notice Regarding Delivery
of Shareholder Documents
To help keep the Fund’s costs as low as possible, we generally deliver a single copy of shareholder reports, proxy statements, and prospectuses to shareholders who share an address and have the same last name. This
process does not apply to account statements. You may request an individual copy of a shareholder document at any time. If you would like to receive separate mailings of shareholder documents, please call U.S. Bank Global Fund Services at
800-261-6950 or 414-765-4124, and individual delivery will begin within 30 days of your request. If your account is held through a financial institution or other intermediary, please contact such intermediary directly to request individual
delivery.
Electronic Delivery
As permitted by SEC regulations, the Fund’s shareholder reports are made available on a website, and unless you sign up for eDelivery or elect to receive paper copies as detailed below, you will be notified each time a
report is posted and provided with a website link to access the report.
The Fund also offers shareholders the option to receive all notices, account statements, prospectuses, tax forms, and shareholder reports electronically. To sign up for eDelivery or change your delivery
preference, please visit www.hennessyfunds.com/account.
To elect to receive paper copies of all future reports free of charge, please call U.S. Bank Global Fund Services at 800-261-6950 or 414-765-4124.
Subscribe to receive our team’s unique market and sector insights delivered to your inbox
www.hennessyfunds.com/subscribe
Follow us on social media
| |
|
WWW.HENNESSYFUNDS.COM
|
26
|
PROXY VOTING — BOARD APPROVAL OF INVESTMENT ADVISORY AGREEMENT
|
Board Approval of Investment Advisory
Agreement
At its meeting on March 11, 2022, the Board of Trustees of the Fund (the “Board,” and the members thereof, the “Trustees”) unanimously approved the continuation of the investment advisory agreement of the Fund with
Hennessy Advisors, Inc. (the “Advisor”). As part of the process, the Trustees reviewed their fiduciary duties and the relevant factors for them to consider with respect to approving the advisory agreement. In addition, the Trustees who are not
deemed “interested persons” (as defined by the Investment Company Act of 1940, as amended) of the Fund (the “Independent Trustees”) met in executive session to discuss the approval of the advisory agreement. As part of their discussion, the
Independent Trustees confirmed their understanding of the need to have asked about, and received answers to, any matters that they believed are relevant to determining whether to approve the continuation of the advisory agreement.
In advance of the meeting, the Advisor sent detailed information to the Trustees to assist them in their evaluation of the advisory agreement. This information included, but was not limited to, the
following:
|
(1)
|
A memorandum from outside legal counsel that described the fiduciary duties of the Board with respect to approving the continuation of the advisory agreement and the relevant factors for consideration;
|
|
|
(2)
|
A memorandum from the Advisor that listed the factors relevant to the Board’s approval of the continuation of the advisory agreement and also referenced the documents that had been provided to help the Board
assess each such factor;
|
|
|
(3)
|
The Advisor’s financial statements from its most recent Form 10-K and Form 10-Q;
|
|
|
(4)
|
A summary of the advisory agreement;
|
|
|
(5)
|
A recent Fund fact sheet, which included, among other things, Fund performance over various periods;
|
|
|
(6)
|
A description of the range of services provided by the Advisor;
|
|
|
(7)
|
A peer expense comparison of the net expense ratio and investment advisory fee of the Fund; and
|
|
|
(8)
|
A memorandum from the Advisor regarding economies of scale.
|
The Trustees reviewed and discussed all of the information provided by the Advisor. Following this review, and further discussion with the Advisor, the Trustees concluded that the information provided
before and at the meeting addressed all of the relevant matters that they wanted to consider in assessing the performance of the Funds and the performance of the Advisor under the advisory agreement, and that said information provided them with a
fulsome understanding of the advisory agreement and the services provided by the Advisor.
All of the factors discussed were considered as a whole by the Trustees, as well as by the Independent Trustees meeting in executive session. The Trustees viewed the relevant factors in their totality,
with no single factor being the principal or determinative factor in the Trustees’ determination of whether to approve the continuation of the advisory agreement. The Trustees recognized that the management and fee arrangements for the Fund are the
result of years of review and discussion between the Independent Trustees and the Advisor, that certain aspects of such arrangements may receive greater scrutiny in some years than in others, and that the Trustees’ conclusions may be based, in
part, on
|
HENNESSY FUNDS
|
1-800-966-4354
|
27
their consideration of these same arrangements and information received during the course of the year and in prior years.
Prior to approving the continuation of the advisory agreement, the Trustees, including the Independent Trustees in executive session, considered, among other items:
|
(1)
|
The nature and quality of the advisory services provided by the Advisor;
|
|
|
(2)
|
A comparison of the fees and expenses of the Fund to other similar funds;
|
|
|
(3)
|
Whether economies of scale are recognized by the Fund;
|
|
|
(4)
|
The costs and profitability of the Fund to the Advisor;
|
|
|
(5)
|
The performance of the Fund; and
|
|
|
(6)
|
Any benefits to the Advisor from serving as an investment advisor to the Fund (other than the advisory fee).
|
The material considerations and determinations of the Trustees, including the Independent Trustees, were as follows:
|
(1)
|
The Trustees considered the services identified below that are provided by the Advisor. Based on this review and an assessment of the Advisor’s performance, the Trustees concluded that the Advisor provides
high-quality services to the Fund, and they noted that their overall confidence in the Advisor was high. The Trustees also concluded that they were satisfied with the nature, extent, and quality of the advisory services provided to the Fund
by the Advisor and that the nature and extent of the services provided by the Advisor were appropriate to assure that the Fund’s operations are conducted in compliance with applicable laws, rules, and regulations.
|
|
(a)
|
The Advisor acts as the portfolio manager for the Fund. In this capacity, the Advisor does the following:
|
|
(i)
|
manages the composition of the Fund’s portfolio, including the purchase, retention, and disposition of portfolio securities in accordance with the Fund’s investment objectives, policies, and restrictions;
|
|||
|
(ii)
|
seeks best execution for the Fund’s portfolio;
|
|||
|
(iii)
|
manages the use of soft dollars for the Fund; and
|
|||
|
(iv)
|
manages proxy voting for the Fund.
|
|
(b)
|
The Advisor performs a daily reconciliation of portfolio positions and cash for the Fund.
|
||
|
(c)
|
The Advisor monitors the liquidity of each Fund.
|
||
|
(d)
|
The Advisor monitors the Fund’s compliance with its investment objectives and restrictions and federal securities laws.
|
||
|
(e)
|
The Advisor maintains a compliance program (including a code of ethics), conducts ongoing reviews of the compliance programs of the Fund’s service providers (including their codes of ethics, as appropriate),
conducts on-site visits to the Fund’s service providers, as feasible, monitors incidents of abusive trading practices, reviews Fund expense accruals, payments, and fixed expense ratios, evaluates insurance providers for fidelity bond,
D&O/E&O insurance, and cybersecurity insurance coverage, manages regulatory examination compliance and responses, conducts employee compliance training, reviews reports provided by service providers, and maintains books and records.
|
|
WWW.HENNESSYFUNDS.COM
|
28
|
BOARD APPROVAL OF INVESTMENT ADVISORY AGREEMENT
|
|
(f)
|
The Advisor oversees service providers that provide accounting, administration, distribution, transfer agency, custodial, sales, marketing, public relations, audit, information technology, and legal services to
the Fund.
|
||
|
(g)
|
The Advisor maintains in-house marketing and distribution departments on behalf of the Fund.
|
||
|
(h)
|
The Advisor prepares or directs the preparation of all regulatory filings for the Fund, including writing and annually updating the Fund’s prospectus and related documents.
|
||
|
(i)
|
For each annual report of the Fund, the Advisor prepares a written summary of the Fund’s performance during the most recent 12-month period.
|
||
|
(j)
|
The Advisor oversees distribution of the Fund through third-party broker/dealers and independent financial institutions such as Charles Schwab, Inc., Fidelity, TD Ameritrade, and Pershing. The Advisor participates
in “no transaction fee” (“NTF”) programs with these companies on behalf of the Fund, which allow customers to purchase the Fund through third-party distribution channels without paying a transaction fee. The Advisor compensates, in part, a
number of these third-party providers of NTF programs out of its own revenues.
|
||
|
(k)
|
The Advisor pays the incentive compensation of the Fund’s compliance officers and employs other staff, such as legal, marketing, national accounts, distribution, sales, administrative, and trading oversight
personnel, as well as management executives.
|
||
|
(l)
|
The Advisor provides a quarterly compliance certification to the Board.
|
||
|
(m)
|
The Advisor prepares or reviews all Board materials, presents to and leads discussions with the Board, prepares or reviews all meeting minutes, and arranges for Board training and education.
|
|
(2)
|
The Trustees compared the performance of the Fund to benchmark indices over various periods and noted that the Trustees review and discuss reports comparing the investment performance of the Fund to various
indices at each quarterly Board meeting. Based on such information, the Trustees determined that the Advisor manages the Fund in a manner materially consistent with its stated investment objective and style. The Trustees concluded that the
performance of the Fund over various periods warranted the continuation of the advisory agreement.
|
|
|
(3)
|
The Trustees reviewed the advisory fees and overall expense ratios of the Fund compared to other funds similar in asset size and investment objective to the Fund using data from Morningstar. As part of the
discussion with management, the Trustees ensured that they understood and were comfortable with the criteria used to determine the mutual funds included in the Morningstar categories for purposes of the materials considered at the meeting.
The Trustees determined that the advisory fee and overall expense ratio of the Fund falls within a reasonable range of the advisory fees and overall expense ratios of other comparable funds and concluded that they are reasonable and
warranted continuation of the advisory agreement.
|
|
|
(4)
|
The Trustees also considered whether the Advisor was realizing economies of scale that should be shared with the Fund’s shareholders. The Trustees noted that the majority of expenses incurred to manage the Fund
are variable
|
|
HENNESSY FUNDS
|
1-800-966-4354
|
29
|
asset-based fees, so the Advisor does not realize material economies of scale relating to these expenses as the assets of the Fund increase. For example, third-party platform fees increase as the Fund’s assets
grow.
|
||
|
(5)
|
The Trustees considered the profitability of the Advisor, including the impact of mutual fund platform fees on the Advisor’s profitability, and also considered the resources and revenues that the Advisor has put
into managing and distributing the Fund. The Trustees then concluded that the profits of the Advisor are reasonable and not excessive when compared to profitability guidelines set forth in relevant court cases.
|
|
|
(6)
|
The Trustees considered the high level of professionalism and knowledge of the Advisor’s employees and concluded that this was beneficial to the Fund and its shareholders.
|
|
|
(7)
|
The Trustees considered any benefits to the Advisor from serving as an advisor to the Fund (other than the advisory fee). The Trustees noted that the Advisor may derive ancillary benefits from, by way of example,
its association with the Fund in the form of proprietary and third-party research products and services received from broker-dealers that execute portfolio trades for the Fund. The Trustees determined that any such products and services
have been used for legitimate purposes relating to the Fund by providing assistance in the investment decision-making process. The Trustees concluded that any additional benefits realized by the Advisor from its relationship with the Fund
were reasonable, which was based on, among other things, the Trustees’ finding that the research, analytical, statistical, and other information and services provided by brokers are merely supplemental to the Advisor’s own efforts in the
performance of its duties under the advisory agreement.
|
After reviewing the materials and information provided at the meeting, as well as other information regularly provided at the Board’s quarterly meetings throughout the year regarding the quality of
services provided by the Advisor, the performance of the Fund, expense information, brokerage commissions information, the adequacy and efficacy of the Advisor’s written policies and procedures, other regulatory compliance issues, trading
information and related matters, and other factors that the Trustees deemed relevant, the Trustees, including the Independent Trustees, approved the continuation of the advisory agreement.
|
WWW.HENNESSYFUNDS.COM
|
30
|
BOARD APPROVAL OF INVESTMENT ADVISORY AGREEMENT
|
(This Page Intentionally Left Blank.)
For information, questions, or assistance, please call
The Hennessy Funds
800-966-4354 or 415-899-1555
INVESTMENT ADVISOR
Hennessy Advisors, Inc.
7250 Redwood Boulevard, Suite 200
Novato, California 94945
ADMINISTRATOR,
TRANSFER AGENT,
DIVIDEND PAYING AGENT, &
SHAREHOLDER SERVICING AGENT
U.S. Bancorp Fund Services, LLC
d/b/a U.S. Bank Global Fund Services
P.O. Box 701
Milwaukee, Wisconsin 53201-0701
CUSTODIAN
U.S. Bank N.A.
Custody Operations
1555 North River Center Drive, Suite 302
Milwaukee, Wisconsin 53212
TRUSTEES
Neil J. Hennessy
J. Dennis DeSousa
Robert T. Doyle
Claire Garvie
Gerald P. Richardson
COUNSEL
Foley & Lardner LLP
777 East Wisconsin Avenue
Milwaukee, Wisconsin 53202-5306
INDEPENDENT REGISTERED
PUBLIC ACCOUNTING FIRM
Tait, Weller & Baker LLP
Two Liberty Place
50 South 16th Street, Suite 2900
Philadelphia, Pennsylvania 19102-2529
DISTRIBUTOR
Quasar Distributors, LLC
111 East Kilbourn Avenue, Suite 1250
Milwaukee, Wisconsin 53202
www.hennessyfunds.com | 800-966-4354
This report has been prepared for shareholders and may be distributed to
others only if preceded or accompanied by a current prospectus.
SEMI-ANNUAL REPORT
APRIL 30, 2022

HENNESSY FOCUS FUND
Investor Class HFCSX
Institutional Class HFCIX
www.hennessyfunds.com | 1-800-966-4354
(This Page Intentionally Left Blank.)
Contents
|
Letter to Shareholders
|
2
|
|
Performance Overview
|
4
|
|
Financial Statements
|
|
|
Schedule of Investments
|
5
|
|
Statement of Assets and Liabilities
|
9
|
|
Statement of Operations
|
10
|
|
Statements of Changes in Net Assets
|
11
|
|
Financial Highlights
|
12
|
|
Notes to the Financial Statements
|
16
|
|
Expense Example
|
24
|
|
Proxy Voting Policy and Proxy Voting Records
|
26
|
|
Availability of Quarterly Portfolio Schedule
|
26
|
|
Federal Tax Distribution Information
|
26
|
|
Important Notice Regarding Delivery of Shareholder Documents
|
26
|
|
Electronic Delivery
|
26
|
|
Board Approval of Investment Advisory Agreements
|
27
|
|
HENNESSY FUNDS
|
1-800-966-4354
|
May 2022
Dear Hennessy Funds Shareholder:
We’d like to start our semi-annual letter with a pause. At the end of 2021, we looked forward to a new year – a potentially calmer year – having come through almost two full years
of the coronavirus pandemic. As people, we were aware our lives had changed, but we hoped for a better 2022; as investors, we were aware that the economy was strong and employment was robust, yet challenges loomed, including inflation, supply
chain disruptions, and tightening monetary policy; as employees, students, and family members, we recognized much was different, but we sought a return to what’s familiar. What we didn’t know was that a world leader who controls one of the
largest militaries on the planet was about to start one of the worst atrocities in Europe since World War II. Our thoughts are with the Ukrainian people, and our hope is for this unjustified, senseless human tragedy to end quickly.
The equity market started 2022 on a high note, with the S&P 500® Index hitting an all-time high on the first trading day of the year. This turned out to be the last hurrah for a market that saw a continuous march higher in 2021, having hit 70 new all-time highs, with a new
all-time high being recorded on average every three and a half days. Concerns in the market then coalesced and overpowered bullish sentiment, and the market has spiraled lower throughout 2022. Factors that drove the market lower include:
tightening monetary policy as the Federal Reserve has begun raising rates and has announced plans for shrinking its $8.5 trillion asset portfolio; inflation, higher energy costs, and their effects on the domestic and global economies; continued
supply chain disruptions; investors’ indiscriminate liquidation of broad-based ETFs and index funds and the detrimental effect on equities; and the near-term and long-term global implications of the Russian invasion of Ukraine.
While markets are adjusting, many positive conditions remain intact. Corporate balance sheets and profits remain strong, GDP growth remains positive, the
consumer continues to show resilience in the face of rising prices, cash is abundant both at the corporate and household levels, unemployment is exceptionally low, and our financial system remains healthy. Markets are also experiencing a change
in leadership, as value stocks have been outperforming growth stocks, and traditionally defensive sectors such as Utilities and Consumer Staples have been outperforming the broader market. Finally, the Energy sector has soared in 2022, as
companies reap the benefits of dramatically higher oil and natural gas prices, and shareholders are rewarded with significantly higher dividends, aggressive buybacks, and higher stock prices after many years of underperformance for the sector.
With history as our guide, we are hopeful that eventually the market may bottom and head higher again. Since the financial crisis of 2008, we have experienced
many corrections and many recoveries to new highs. The Dow Jones Industrial Average has dropped over 10% eight times, including the current drop, for a median decline of 14.00%, and on average, it took 45 trading days to drop from peak to trough
and 127 trading days to return to the previous peak. Since the current drop has taken longer to go from peak to its recent trough, it may take some time for a recovery in prices to truly take hold.
On a positive note, valuations have come in, and many stocks have become more attractive, especially for longer-term investors. We note, however, that the
concept of “historically cheap stocks” does not, on its own, move the market higher. Rather, it is
|
WWW.HENNESSYFUNDS.COM
|
2
|
LETTER TO SHAREHOLDERS
|
overall capitulation and improving fundamentals that could bring buyers back into the market and reverse any bearish trends. Investors need to see improving company earnings, retreating inflationary trends, a measured
pace of interest rate increases globally that does not cause significant economic contraction, hope for a more peaceful and orderly world economic system unconstrained by supply bottlenecks and other hindrances to global trade, and, most
importantly, a subsidence of the deleterious effects of the coronavirus pandemic. While that may seem like a “tall order,” we believe that patient investing, focusing on value, quality, and downside risk mitigation, works well over the longer
term.
During this tumultuous period, performance of the majority of the Hennessy Funds has been relatively strong when compared to the overall market as well as to our
benchmarks. During the six months ended April 30, 2022, the Dow Jones Industrial Average, the S&P 500® Index, and the NASDAQ Composite Index dropped
7.05%, 9.65%, and 20.15%, respectively, on a total return basis. During this period when these three major indices saw significant declines, we were pleased that seven of our 16 Funds posted positive total returns, 10 of our 14 domestic Funds
outperformed the S&P 500® Index, and over half of our active funds outperformed their primary benchmarks.
We thank you, our shareholders, for your continued interest in our family of Funds. We are grateful for the trust you put in us, and we will continue to strive
to manage our portfolios for long-term performance, ever mindful of downside risk. While volatility and uncertainty may impact the markets in the short-term, we encourage investors to stay the course, maintain a diversified portfolio, and keep a
long-term perspective. If you have any questions or would like to speak with us, please don’t hesitate to call us directly at (800) 966-4354. In closing, we would also like to thank all of the healthcare and frontline workers that have worked –
and still work – tirelessly throughout the coronavirus pandemic.
Best regards,
|
|
|
|
|
Ryan C. Kelley, CFA
|
|
|
Chief Investment Officer,
|
|
|
Senior Vice President, and Portfolio Manager
|
Past performance does not guarantee future results.
Mutual fund investing involves risk. Principal loss is possible.
Opinions expressed are those of Ryan C. Kelley and are subject to change, are not guaranteed, and should not be considered investment advice.
The Dow Jones Industrial Average and S&P 500® Index are commonly used to measure the performance of U.S. stocks. The NASDAQ Composite
Index comprises all common stocks listed on The NASDAQ Stock Market and is commonly used to measure the performance of technology-related stocks. The indices are used herein for comparative purposes in accordance with SEC regulations. One cannot
invest directly in an index. All returns are shown on a total return basis.
Please refer to the Performance Overview section for more detailed performance information.
|
HENNESSY FUNDS
|
1-800-966-4354
|
3
Performance Overview (Unaudited)
AVERAGE ANNUAL TOTAL RETURN FOR PERIODS ENDED APRIL 30, 2022
|
Six
|
One
|
Five
|
Ten
|
|
|
Months(1)
|
Year
|
Years
|
Years
|
|
|
Hennessy Focus Fund –
|
||||
|
Investor Class (HFCSX)
|
-17.05%
|
-8.89%
|
9.56%
|
11.11%
|
|
Hennessy Focus Fund –
|
||||
|
Institutional Class (HFCIX)
|
-16.88%
|
-8.55%
|
9.96%
|
11.50%
|
|
Russell 3000® Index
|
-11.75%
|
-3.11%
|
13.01%
|
13.29%
|
|
Russell Mid Cap® Growth Index
|
-25.44%
|
-16.73%
|
12.06%
|
12.17%
|
Expense ratios: 1.49% (Investor Class); 1.12% (Institutional Class)
|
(1)
|
Periods of less than one year are not annualized.
|
_______________
Performance data quoted represents past performance; past performance does not guarantee future results. The investment return and principal value of an investment will fluctuate so that an
investor’s shares, when redeemed, may be worth more or less than their original cost. The performance table does not reflect the deduction of taxes that a shareholder would pay on Fund distributions or the redemption of Fund shares. Current
performance of the Fund may be lower or higher than the performance quoted. Performance data current to the most recent month end may be obtained by visiting www.hennessyfunds.com. Performance for periods including or prior to October 26, 2012,
is that of the FBR Focus Fund.
The Russell 3000® Index comprises the 3,000 largest U.S. companies based on market capitalization, representing approximately 98% of the
investable U.S. equities market. The Russell Midcap® Growth Index comprises approximately 65% of the total market value of the Russell Midcap® Index and includes companies with higher price-to-book ratios and higher forecasted growth values. One cannot invest directly in an index. These indices are used for
comparative purposes in accordance with Securities and Exchange Commission regulations.
Frank Russell Company (“Russell”) is the source and owner of the trademarks, service marks, and copyrights related to the Russell Indexes. Russell® is a trademark of Frank Russell Company. Neither Russell nor its licensors accept any liability for any errors or omissions in the Russell Indexes or Russell ratings or underlying data and no party may rely on any Russell
Indexes or Russell ratings or underlying data contained in this communication. No further distribution of Russell data is permitted without Russell’s express written consent. Russell does not promote, sponsor, or endorse the content of this
communication.
The expense ratios presented are from the most recent prospectus. The expense ratios for the current reporting period are available in the Financial Highlights section of this report.
|
WWW.HENNESSYFUNDS.COM
|
4
|
PERFORMANCE OVERVIEW/SCHEDULE OF INVESTMENTS
|
Financial Statements
|
Schedule of Investments as of April 30, 2022 (Unaudited)
|
HENNESSY FOCUS FUND
(% of Net Assets)
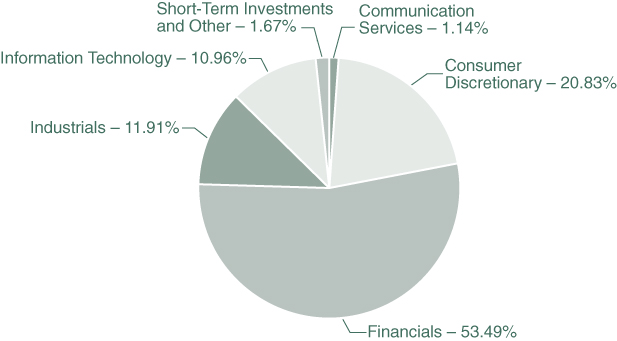
|
TOP TEN HOLDINGS (EXCLUDING MONEY MARKET FUNDS)
|
% NET ASSETS
|
|
Markel Corp.
|
11.81%
|
|
Brookfield Asset Management, Inc., Class A
|
11.38%
|
|
American Tower Corp., Class A
|
10.97%
|
|
Encore Capital Group, Inc.
|
10.61%
|
|
Aon PLC
|
8.63%
|
|
CarMax, Inc.
|
7.32%
|
|
O’Reilly Automotive, Inc.
|
6.58%
|
|
SS&C Technologies Holdings, Inc.
|
5.40%
|
|
Ashtead Group PLC
|
5.03%
|
|
Restoration Hardware Holdings, Inc.
|
3.90%
|
Note: For presentation purposes, the Fund has grouped some of the industry categories. For purposes of categorizing securities for compliance with Section 8(b)(1) of the Investment Company Act of 1940, as amended, the
Fund uses more specific industry classifications.
The Global Industry Classification Standard (GICS®) was developed by and is the exclusive property and a service mark of MSCI, Inc. and
Standard & Poor’s Financial Services LLC. It has been licensed for use by the Hennessy Funds.
|
HENNESSY FUNDS
|
1-800-966-4354
|
5
|
COMMON STOCKS – 87.36%
|
Number
|
% of
|
||||||||||
|
|
of Shares
|
Value
|
Net Assets
|
|||||||||
|
Communication Services – 1.14%
|
||||||||||||
|
AST SpaceMobile, Inc. (a)
|
1,247,902
|
$
|
9,396,702
|
1.05
|
%
|
|||||||
|
Shenandoah Telecommunications Co.
|
42,275
|
853,955
|
0.09
|
%
|
||||||||
|
|
10,250,657
|
1.14
|
%
|
|||||||||
|
Consumer Discretionary – 20.83%
|
||||||||||||
|
CarMax, Inc. (a)
|
766,122
|
65,717,945
|
7.32
|
%
|
||||||||
|
NVR, Inc. (a)
|
6,228
|
27,255,036
|
3.03
|
%
|
||||||||
|
O’Reilly Automotive, Inc. (a)
|
97,409
|
59,083,429
|
6.58
|
%
|
||||||||
|
Restoration Hardware Holdings, Inc. (a)
|
104,116
|
34,995,470
|
3.90
|
%
|
||||||||
|
|
187,051,880
|
20.83
|
%
|
|||||||||
|
Financials – 42.52%
|
||||||||||||
|
Aon PLC (b)
|
269,099
|
77,497,821
|
8.63
|
%
|
||||||||
|
Brookfield Asset Management, Inc., Class A (b)
|
2,050,442
|
102,235,038
|
11.38
|
%
|
||||||||
|
Brookfield Asset Management Reinsurance Partners Ltd. (b)
|
15,721
|
788,565
|
0.09
|
%
|
||||||||
|
Encore Capital Group, Inc. (a)(d)
|
1,648,029
|
95,272,557
|
10.61
|
%
|
||||||||
|
Markel Corp. (a)
|
78,347
|
106,025,428
|
11.81
|
%
|
||||||||
|
|
381,819,409
|
42.52
|
%
|
|||||||||
|
Industrials – 11.91%
|
||||||||||||
|
Allegiant Travel Co. (a)
|
160,303
|
24,877,423
|
2.77
|
%
|
||||||||
|
American Woodmark Corp. (a)
|
691,441
|
32,394,011
|
3.61
|
%
|
||||||||
|
Ashtead Group PLC (b)
|
860,196
|
45,202,312
|
5.03
|
%
|
||||||||
|
Mistras Group, Inc. (a)
|
785,984
|
4,472,249
|
0.50
|
%
|
||||||||
|
|
106,945,995
|
11.91
|
%
|
|||||||||
|
Information Technology – 10.96%
|
||||||||||||
|
Applied Materials, Inc.
|
183,115
|
20,206,740
|
2.25
|
%
|
||||||||
|
CDW Corp.
|
182,239
|
29,737,760
|
3.31
|
%
|
||||||||
|
SS&C Technologies Holdings, Inc.
|
749,303
|
48,449,932
|
5.40
|
%
|
||||||||
|
|
98,394,432
|
10.96
|
%
|
|||||||||
|
|
||||||||||||
|
Total Common Stocks
|
||||||||||||
|
(Cost $332,739,718)
|
784,462,373
|
87.36
|
%
|
|||||||||
|
|
||||||||||||
|
REITS – 10.97%
|
||||||||||||
|
Financials – 10.97%
|
||||||||||||
|
American Tower Corp., Class A
|
408,606
|
98,482,218
|
10.97
|
%
|
||||||||
|
|
||||||||||||
|
Total REITS
|
||||||||||||
|
(Cost $648,119)
|
98,482,218
|
10.97
|
%
|
|||||||||
The accompanying notes are an integral part of these financial statements.
|
WWW.HENNESSYFUNDS.COM
|
6
|
SCHEDULE OF INVESTMENTS
|
|
SHORT-TERM INVESTMENTS – 1.76%
|
Number
|
% of
|
||||||||||
|
|
of Shares
|
Value
|
Net Assets
|
|||||||||
|
Money Market Funds – 1.76%
|
||||||||||||
|
First American Government Obligations Fund,
|
||||||||||||
|
Institutional Class, 0.22% (c)
|
15,819,015
|
$
|
15,819,015
|
1.76
|
%
|
|||||||
|
|
||||||||||||
|
Total Short-Term Investments
|
||||||||||||
|
(Cost $15,819,015)
|
15,819,015
|
1.76
|
%
|
|||||||||
|
|
||||||||||||
|
Total Investments
|
||||||||||||
|
(Cost $349,206,852) – 100.09%
|
898,763,606
|
100.09
|
%
|
|||||||||
|
Liabilities in Excess of Other Assets – (0.09)%
|
(828,411
|
)
|
(0.09
|
)%
|
||||||||
|
|
||||||||||||
|
TOTAL NET ASSETS – 100.00%
|
$
|
897,935,195
|
100.00
|
%
|
||||||||
Percentages are stated as a percent of net assets.
PLC – Public Limited Company
REIT – Real Estate Investment Trust
|
(a)
|
Non-income-producing security.
|
|
(b)
|
U.S.-traded security of a foreign corporation.
|
|
(c)
|
The rate listed is the fund’s seven-day yield as of April 30, 2022.
|
|
(d)
|
Investment in affiliated security. Investment represents five percent or more of the outstanding voting securities of the issuer, making the issuer an affiliate of the Fund, as defined in the Investment Company
Act of 1940, as amended. Details of transactions with affiliated companies for the period ended April 30, 2022, are as follows:
|
|
Value at
|
Sales
|
Realized
|
Corporate
|
||||||||||||||||||
|
Common Stocks
|
November 1, 2021
|
Purchases
|
Proceeds
|
Gain/Loss
|
Actions
|
||||||||||||||||
|
Encore Capital Group, Inc.
|
$
|
113,892,311
|
$
|
—
|
$
|
(27,883,967
|
)
|
$
|
9,777,341
|
$
|
—
|
||||||||||
|
Sub-total for affiliates
|
|||||||||||||||||||||
|
held as of 4/30/2022(1)
|
113,892,311
|
—
|
(27,883,967
|
)
|
9,777,341
|
—
|
|||||||||||||||
|
Marlin Business Services Corp
|
22,009,457
|
—
|
(12,347,191
|
)
|
7,721,670
|
(10,183,161
|
)
|
||||||||||||||
|
Sub-total for securities
|
|||||||||||||||||||||
|
no longer affiliates
|
|||||||||||||||||||||
|
as of 4/30/2022(2)
|
22,009,457
|
—
|
(12,347,191
|
)
|
7,721,670
|
$
|
(10,183,161
|
)
|
|||||||||||||
|
$
|
135,901,768
|
$
|
—
|
$
|
(40,231,158
|
)
|
$
|
17,499,011
|
$
|
(10,183,161
|
)
|
||||||||||
|
Net Change
|
|||||||||||||||||||||
|
in Unrealized
|
|||||||||||||||||||||
|
Appreciation /
|
Value at
|
||||||||||||||||||||
|
Common Stocks
|
Depreciation
|
Dividends
|
April 30, 2022
|
Shares
|
|||||||||||||||||
|
Encore Capital Group, Inc.
|
$
|
(513,128
|
)
|
$
|
—
|
$
|
95,272,557
|
1,648,029
|
|||||||||||||
|
Sub-total for affiliates
|
|||||||||||||||||||||
|
held as of 4/30/2022(1)
|
(513,128
|
)
|
—
|
95,272,557
|
1,648,029
|
||||||||||||||||
|
Marlin Business Services Corp
|
(7,200,775
|
)
|
134,438
|
—
|
—
|
||||||||||||||||
|
Sub-total for securities
|
|||||||||||||||||||||
|
no longer affiliates
|
|||||||||||||||||||||
|
as of 4/30/2022(2)
|
(7,200,775
|
)
|
134,438
|
—
|
—
|
||||||||||||||||
|
$
|
(7,713,903
|
)
|
$
|
134,438
|
$
|
95,272,557
|
1,648,029
|
||||||||||||||
|
(1)
|
At April 30, 2022, this security represented 10.61% of the Fund’s net assets.
|
|
(2)
|
At April 30, 2022, this security was no longer an affiliate of the Fund.
|
The accompanying notes are an integral part of these financial statements.
|
HENNESSY FUNDS
|
1-800-966-4354
|
7
Summary of Fair Value Exposure as of April 30, 2022
The following is a summary of the inputs used to value the Fund’s net assets as of April 30, 2022 (see Note 3 in the accompanying Notes to the Financial Statements):
|
Common Stocks
|
Level 1
|
Level 2
|
Level 3
|
Total
|
||||||||||||
|
Communication Services
|
$
|
10,250,657
|
$
|
—
|
$
|
—
|
$
|
10,250,657
|
||||||||
|
Consumer Discretionary
|
187,051,880
|
—
|
—
|
187,051,880
|
||||||||||||
|
Financials
|
381,819,409
|
—
|
—
|
381,819,409
|
||||||||||||
|
Industrials
|
106,945,995
|
—
|
—
|
106,945,995
|
||||||||||||
|
Information Technology
|
98,394,432
|
—
|
—
|
98,394,432
|
||||||||||||
|
Total Common Stocks
|
$
|
784,462,373
|
$
|
—
|
$
|
—
|
$
|
784,462,373
|
||||||||
|
REITS
|
||||||||||||||||
|
Financials
|
$
|
98,482,218
|
$
|
—
|
$
|
—
|
$
|
98,482,218
|
||||||||
|
Total REITS
|
$
|
98,482,218
|
$
|
—
|
$
|
—
|
$
|
98,482,218
|
||||||||
|
Short-Term Investments
|
||||||||||||||||
|
Money Market Funds
|
$
|
15,819,015
|
$
|
—
|
$
|
—
|
$
|
15,819,015
|
||||||||
|
Total Short-Term Investments
|
$
|
15,819,015
|
$
|
—
|
$
|
—
|
$
|
15,819,015
|
||||||||
|
Total Investments
|
$
|
898,763,606
|
$
|
—
|
$
|
—
|
$
|
898,763,606
|
||||||||
The accompanying notes are an integral part of these financial statements.
|
WWW.HENNESSYFUNDS.COM
|
8
|
SCHEDULE OF INVESTMENTS/STATEMENT OF ASSETS AND LIABILITIES
|
Financial Statements
|
Statement of Assets and Liabilities as of April 30, 2022 (Unaudited)
|
|
ASSETS:
|
||||
|
Investments in unaffiliated securities, at value (cost $305,714,721)
|
$
|
803,491,049
|
||
|
Investments in affiliated securities, at value (cost $43,492,131)
|
95,272,557
|
|||
|
Total investments in securities, at value (cost $349,206,852)
|
898,763,606
|
|||
|
Dividends and interest receivable
|
153,196
|
|||
|
Receivable for fund shares sold
|
125,847
|
|||
|
Receivable for securities sold
|
4,453,507
|
|||
|
Prepaid expenses and other assets
|
41,350
|
|||
|
Total assets
|
903,537,506
|
|||
|
LIABILITIES:
|
||||
|
Payable for securities purchased
|
3,935,202
|
|||
|
Payable for fund shares redeemed
|
446,677
|
|||
|
Payable to advisor
|
724,389
|
|||
|
Payable to administrator
|
176,683
|
|||
|
Payable to auditor
|
11,223
|
|||
|
Accrued distribution fees
|
102,333
|
|||
|
Accrued service fees
|
46,889
|
|||
|
Accrued expenses and other payables
|
158,915
|
|||
|
Total liabilities
|
5,602,311
|
|||
|
NET ASSETS
|
$
|
897,935,195
|
||
|
NET ASSETS CONSISTS OF:
|
||||
|
Capital stock
|
$
|
289,169,314
|
||
|
Total distributable earnings
|
608,765,881
|
|||
|
Total net assets
|
$
|
897,935,195
|
||
|
NET ASSETS:
|
||||
|
Investor Class
|
||||
|
Shares authorized (no par value)
|
Unlimited
|
|||
|
Net assets applicable to outstanding shares
|
$
|
523,062,356
|
||
|
Shares issued and outstanding
|
9,182,537
|
|||
|
Net asset value, offering price, and redemption price per share
|
$
|
56.96
|
||
|
Institutional Class
|
||||
|
Shares authorized (no par value)
|
Unlimited
|
|||
|
Net assets applicable to outstanding shares
|
$
|
374,872,839
|
||
|
Shares issued and outstanding
|
6,318,338
|
|||
|
Net asset value, offering price, and redemption price per share
|
$
|
59.33
|
||
The accompanying notes are an integral part of these financial statements.
|
HENNESSY FUNDS
|
1-800-966-4354
|
9
Financial Statements
|
Statement of Operations for the six months ended April 30, 2022 (Unaudited)
|
|
INVESTMENT INCOME:
|
||||
|
Dividend income from unaffiliated securities(1)
|
$
|
2,507,630
|
||
|
Dividend income from affiliated securities
|
134,438
|
|||
|
Interest income
|
5,409
|
|||
|
Total investment income
|
2,647,477
|
|||
|
EXPENSES:
|
||||
|
Investment advisory fees (See Note 5)
|
4,812,618
|
|||
|
Sub-transfer agent expenses – Investor Class (See Note 5)
|
736,054
|
|||
|
Sub-transfer agent expenses – Institutional Class (See Note 5)
|
177,921
|
|||
|
Administration, accounting, custody, and transfer agent fees (See Note 5)
|
584,555
|
|||
|
Distribution fees – Investor Class (See Note 5)
|
468,502
|
|||
|
Service fees – Investor Class (See Note 5)
|
312,335
|
|||
|
Federal and state registration fees
|
31,580
|
|||
|
Reports to shareholders
|
27,927
|
|||
|
Trustees’ fees and expenses
|
18,906
|
|||
|
Compliance expense (See Note 5)
|
15,156
|
|||
|
Audit fees
|
11,222
|
|||
|
Legal fees
|
7,904
|
|||
|
Other expenses
|
79,014
|
|||
|
Total expenses
|
7,283,694
|
|||
|
NET INVESTMENT LOSS
|
$
|
(4,636,217
|
)
|
|
|
REALIZED AND UNREALIZED GAINS (LOSSES):
|
||||
|
Net realized gain on investments:
|
||||
|
Unaffiliated investments
|
$
|
54,782,504
|
||
|
Affiliated investments
|
17,499,011
|
|||
|
Net change in unrealized appreciation/depreciation on investments
|
||||
|
Unaffiliated investments
|
(249,474,276
|
)
|
||
|
Affiliated investments
|
(7,713,903
|
)
|
||
|
Net loss on investments
|
(184,906,664
|
)
|
||
|
NET DECREASE IN NET ASSETS RESULTING FROM OPERATIONS
|
$
|
(189,542,881
|
)
|
|
|
(1)
|
Net of foreign taxes withheld of $84,018.
|
The accompanying notes are an integral part of these financial statements.
|
WWW.HENNESSYFUNDS.COM
|
10
|
STATEMENT OF OPERATIONS/STATEMENTS OF CHANGES IN NET ASSETS
|
Financial Statements
|
Statements of Changes in Net Assets
|
|
Six Months Ended
|
||||||||
|
April 30, 2022
|
Year Ended
|
|||||||
|
(Unaudited)
|
October 31, 2021
|
|||||||
|
OPERATIONS:
|
||||||||
|
Net investment loss
|
$
|
(4,636,217
|
)
|
$
|
(8,433,350
|
)
|
||
|
Net realized gain on investments
|
72,281,515
|
223,830,997
|
||||||
|
Net change in unrealized
|
||||||||
|
appreciation/depreciation on investments
|
(257,188,179
|
)
|
262,240,110
|
|||||
|
Net increase (decrease) in net
|
||||||||
|
assets resulting from operations
|
(189,542,881
|
)
|
477,637,757
|
|||||
|
DISTRIBUTIONS TO SHAREHOLDERS:
|
||||||||
|
Distributable earnings – Investor Class
|
(102,832,917
|
)
|
(202,897,649
|
)
|
||||
|
Distributable earnings – Institutional Class
|
(74,423,824
|
)
|
(111,878,455
|
)
|
||||
|
Total distributions
|
(177,256,741
|
)
|
(314,776,104
|
)
|
||||
|
CAPITAL SHARE TRANSACTIONS:
|
||||||||
|
Proceeds from shares subscribed – Investor Class
|
9,368,829
|
38,949,266
|
||||||
|
Proceeds from shares subscribed – Institutional Class
|
40,021,143
|
214,555,313
|
||||||
|
Dividends reinvested – Investor Class
|
100,142,197
|
198,099,143
|
||||||
|
Dividends reinvested – Institutional Class
|
68,169,964
|
100,565,261
|
||||||
|
Cost of shares redeemed – Investor Class
|
(81,813,786
|
)
|
(305,916,863
|
)
|
||||
|
Cost of shares redeemed – Institutional Class
|
(79,068,197
|
)
|
(267,470,520
|
)
|
||||
|
Net increase (decrease) in net assets
|
||||||||
|
derived from capital share transactions
|
56,820,150
|
(21,218,400
|
)
|
|||||
|
TOTAL INCREASE (DECREASE) IN NET ASSETS
|
(309,979,472
|
)
|
141,643,253
|
|||||
|
NET ASSETS:
|
||||||||
|
Beginning of period
|
1,207,914,667
|
1,066,271,414
|
||||||
|
End of period
|
$
|
897,935,195
|
$
|
1,207,914,667
|
||||
|
CHANGES IN SHARES OUTSTANDING:
|
||||||||
|
Shares sold – Investor Class
|
137,702
|
541,194
|
||||||
|
Shares sold – Institutional Class
|
561,059
|
2,870,484
|
||||||
|
Shares issued to holders as reinvestment
|
||||||||
|
of dividends – Investor Class
|
1,451,336
|
3,250,724
|
||||||
|
Shares issued to holders as reinvestment
|
||||||||
|
of dividends – Institutional Class
|
950,104
|
1,592,734
|
||||||
|
Shares redeemed – Investor Class
|
(1,221,127
|
)
|
(4,446,090
|
)
|
||||
|
Shares redeemed – Institutional Class
|
(1,151,693
|
)
|
(3,724,618
|
)
|
||||
|
Net increase in shares outstanding
|
727,381
|
84,428
|
||||||
The accompanying notes are an integral part of these financial statements.
|
HENNESSY FUNDS
|
1-800-966-4354
|
11
Financial Statements
|
Financial Highlights
|
For an Investor Class share outstanding throughout each period
|
Six Months Ended
|
||||
|
April 30, 2022
|
||||
|
(Unaudited)
|
||||
|
PER SHARE DATA:
|
||||
|
Net asset value, beginning of period
|
$
|
80.48
|
||
|
Income from investment operations:
|
||||
|
Net investment loss
|
(0.34
|
)(1)
|
||
|
Net realized and unrealized gains (losses) on investments
|
(11.30
|
)
|
||
|
Total from investment operations
|
(11.64
|
)
|
||
|
Less distributions:
|
||||
|
Dividends from net realized gains
|
(11.88
|
)
|
||
|
Total distributions
|
(11.88
|
)
|
||
|
Net asset value, end of period
|
$
|
56.96
|
||
|
TOTAL RETURN
|
-17.05
|
%(2)
|
||
|
SUPPLEMENTAL DATA AND RATIOS:
|
||||
|
Net assets, end of period (millions)
|
$
|
523.06
|
||
|
Ratio of expenses to average net assets
|
1.53
|
%(3)
|
||
|
Ratio of net investment loss to average net assets
|
(1.04
|
)%(3)
|
||
|
Portfolio turnover rate(4)
|
2
|
%(2)
|
||
|
(1)
|
Calculated using the average shares outstanding method.
|
|
(2)
|
Not annualized.
|
|
(3)
|
Annualized.
|
|
(4)
|
Calculated on the basis of the Fund as a whole.
|
The accompanying notes are an integral part of these financial statements.
|
WWW.HENNESSYFUNDS.COM
|
12
|
FINANCIAL HIGHLIGHTS — INVESTOR CLASS
|
|
Year Ended October 31,
|
||||||||||||||||||
|
2021
|
2020
|
2019
|
2018
|
2017
|
||||||||||||||
|
$
|
71.68
|
$
|
85.11
|
$
|
83.20
|
$
|
84.92
|
$
|
70.63
|
|||||||||
|
(0.63
|
)(1)
|
(0.66
|
)(1)
|
(0.52
|
)(1)
|
(0.86
|
)
|
(0.51
|
)
|
|||||||||
|
31.46
|
(4.21
|
)
|
16.90
|
(0.85
|
)
|
14.80
|
||||||||||||
|
30.83
|
(4.87
|
)
|
16.38
|
(1.71
|
)
|
14.29
|
||||||||||||
|
(22.03
|
)
|
(8.56
|
)
|
(14.47
|
)
|
(0.01
|
)
|
—
|
||||||||||
|
(22.03
|
)
|
(8.56
|
)
|
(14.47
|
)
|
(0.01
|
)
|
—
|
||||||||||
|
$
|
80.48
|
$
|
71.68
|
$
|
85.11
|
$
|
83.20
|
$
|
84.92
|
|||||||||
|
52.87
|
%
|
-6.79
|
%
|
24.16
|
%
|
-2.02
|
%
|
20.23
|
%
|
|||||||||
|
$
|
709.40
|
$
|
678.72
|
$
|
1,213.20
|
$
|
1,339.45
|
$
|
1,675.00
|
|||||||||
|
1.49
|
%
|
1.51
|
%
|
1.47
|
%
|
1.47
|
%
|
1.48
|
%
|
|||||||||
|
(0.88
|
)%
|
(0.88
|
)%
|
(0.67
|
)%
|
(0.72
|
)%
|
(0.51
|
)%
|
|||||||||
|
4
|
%
|
5
|
%
|
2
|
%
|
13
|
%
|
5
|
%
|
|||||||||
The accompanying notes are an integral part of these financial statements.
|
HENNESSY FUNDS
|
1-800-966-4354
|
13
Financial Statements
|
Financial Highlights
|
For an Institutional Class share outstanding throughout each period
|
Six Months Ended
|
||||
|
April 30, 2022
|
||||
|
(Unaudited)
|
||||
|
PER SHARE DATA:
|
||||
|
Net asset value, beginning of period
|
$
|
83.66
|
||
|
Income from investment operations:
|
||||
|
Net investment loss
|
(0.22
|
)(1)
|
||
|
Net realized and unrealized gains (losses) on investments
|
(11.76
|
)
|
||
|
Total from investment operations
|
(11.98
|
)
|
||
|
Less distributions:
|
||||
|
Dividends from net realized gains
|
(12.35
|
)
|
||
|
Total distributions
|
(12.35
|
)
|
||
|
Net asset value, end of period
|
$
|
59.33
|
||
|
TOTAL RETURN
|
-16.88
|
%(2)
|
||
|
SUPPLEMENTAL DATA AND RATIOS:
|
||||
|
Net assets, end of period (millions)
|
$
|
374.87
|
||
|
Ratio of expenses to average net assets
|
1.13
|
%(3)
|
||
|
Ratio of net investment loss to average net assets
|
(0.63
|
)%(3)
|
||
|
Portfolio turnover rate(4)
|
2
|
%(2)
|
||
|
(1)
|
Calculated using the average shares outstanding method.
|
|
(2)
|
Not annualized.
|
|
(3)
|
Annualized.
|
|
(4)
|
Calculated on the basis of the Fund as a whole.
|
The accompanying notes are an integral part of these financial statements.
|
WWW.HENNESSYFUNDS.COM
|
14
|
FINANCIAL HIGHLIGHTS — INSTITUTIONAL CLASS
|
|
Year Ended October 31,
|
||||||||||||||||||
|
2021
|
2020
|
2019
|
2018
|
2017
|
||||||||||||||
|
$
|
74.24
|
$
|
87.83
|
$
|
85.66
|
$
|
87.10
|
$
|
72.17
|
|||||||||
|
(0.37
|
)(1)
|
(0.39
|
)(1)
|
(0.25
|
)(1)
|
(0.28
|
)
|
(0.11
|
)
|
|||||||||
|
32.62
|
(4.36
|
)
|
17.41
|
(1.15
|
)
|
15.04
|
||||||||||||
|
32.25
|
(4.75
|
)
|
17.16
|
(1.43
|
)
|
14.93
|
||||||||||||
|
(22.83
|
)
|
(8.84
|
)
|
(14.99
|
)
|
(0.01
|
)
|
—
|
||||||||||
|
(22.83
|
)
|
(8.84
|
)
|
(14.99
|
)
|
(0.01
|
)
|
—
|
||||||||||
|
$
|
83.66
|
$
|
74.24
|
$
|
87.83
|
$
|
85.66
|
$
|
87.10
|
|||||||||
|
53.43
|
%
|
-6.45
|
%
|
24.59
|
%
|
-1.65
|
%
|
20.69
|
%
|
|||||||||
|
$
|
498.51
|
$
|
387.55
|
$
|
586.25
|
$
|
811.96
|
$
|
1,057.32
|
|||||||||
|
1.12
|
%
|
1.14
|
%
|
1.12
|
%
|
1.09
|
%
|
1.10
|
%
|
|||||||||
|
(0.50
|
)%
|
(0.51
|
)%
|
(0.32
|
)%
|
(0.34
|
)%
|
(0.13
|
)%
|
|||||||||
|
4
|
%
|
5
|
%
|
2
|
%
|
13
|
%
|
5
|
%
|
|||||||||
The accompanying notes are an integral part of these financial statements.
|
HENNESSY FUNDS
|
1-800-966-4354
|
15
Financial Statements
|
Notes to the Financial Statements April 30, 2022 (Unaudited)
|
1). ORGANIZATION
The Hennessy Focus Fund (the “Fund”) is a series of Hennessy Funds Trust (the “Trust”), which was organized as a Delaware statutory trust on September 17, 1992. The Fund is an open-end management investment company
registered under the Investment Company Act of 1940, as amended. The investment objective of the Fund is capital appreciation. The Fund is a non-diversified fund.
The Fund offers Investor Class and Institutional Class shares. Each class of shares differs principally in its respective 12b-1 distribution and service, shareholder servicing, and sub-transfer agent
expenses. There are no sales charges. Each class has identical rights to earnings, assets, and voting privileges, except for class-specific expenses and exclusive rights to vote on matters affecting only one class.
As an investment company, the Fund follows the investment company accounting and reporting guidance of the Financial Accounting Standards Board (“FASB”) Accounting Standard Codification Topic 946
“Financial Services—Investment Companies.”
2). SIGNIFICANT ACCOUNTING POLICIES
The following is a summary of significant accounting policies consistently followed by the Fund in the preparation of the financial statements. These policies conform to U.S. generally accepted accounting principles
(“GAAP”).
|
a).
|
Securities Valuation – All investments in securities are valued in accordance with the Fund’s valuation policies and procedures, as described in Note 3.
|
|
b).
|
Federal Income Taxes – The Fund has elected to be taxed as a regulated investment company and intends to distribute substantially all of its taxable income to its shareholders and otherwise comply with the
provisions of the Internal Revenue Code of 1986, as amended, applicable to regulated investment companies. As a result, the Fund has made no provision for federal income taxes or excise taxes. Net investment income/loss and realized
gains/losses for federal income tax purposes may differ from those reported in the financial statements because of temporary book-basis and tax-basis differences. Temporary differences are primarily the result of the treatment of wash
sales for tax reporting purposes. The Fund recognizes interest and penalties related to income tax benefits, if any, in the Statement of Operations as an income tax expense. Distributions from net realized gains for book purposes may
include short-term capital gains, which are included as ordinary income to shareholders for tax purposes. The Fund may utilize equalization accounting for tax purposes and designate earnings and profits, including net realized gains
distributed to shareholders on redemption of shares, as part of the dividends paid deduction for income tax purposes.
|
|
c).
|
Accounting for Uncertainty in Income Taxes – The Fund has accounting policies regarding recognition and measurement of tax positions taken or expected to be taken on a tax return. The tax returns of the Fund for
the prior three fiscal years are open for examination. The Fund has reviewed all open tax years in major tax jurisdictions and concluded that there is no impact on the Fund’s net assets and no tax liability resulting from unrecognized tax
benefits relating to uncertain income tax positions taken or expected to be taken on a tax return. The Fund’s major tax jurisdictions are U.S. federal and Delaware.
|
|
WWW.HENNESSYFUNDS.COM
|
16
|
NOTES TO THE FINANCIAL STATEMENTS
|
|
d).
|
Income and Expenses – Dividend income is recognized on the ex-dividend date or as soon as information is available to the Fund. Interest income, which includes the amortization of premium and accretion of
discount, is recognized on an accrual basis. Market discounts, original issue discounts, and market premiums on debt securities are accreted or amortized to interest income over the life of a security with a corresponding increase or
decrease, as applicable, in the cost basis of such security using the yield-to-maturity method or, where applicable, the first call date of the security. Other non-cash dividends are recognized as investment income at the fair value of
the property received. The Fund is charged for those expenses that are directly attributable to its portfolio, such as advisory, administration, and certain shareholder service fees. Income, expenses (other than expenses attributable to a
specific class), and realized and unrealized gains/losses on investments are allocated to each class of shares based on such class’s net assets. Distributions received from the Fund’s investments in master limited partnerships (“MLPs”)
generally consist of ordinary income, capital gains, and return of capital. The Fund records investment income on the ex-date of the distributions. For financial statement purposes, the Fund uses return of capital and income estimates to
allocate the dividend income received. Such estimates are based on historical information available from the MLPs and other industry sources. These estimates may subsequently be revised based on information received from the MLPs after
their tax reporting periods are concluded, as the actual character of these distributions is not known until after the fiscal year end of the Fund.
|
|
e).
|
Distributions to Shareholders – Dividends from net investment income for the Fund, if any, are declared and paid annually, usually in December. Distributions of net realized capital gains, if any, are declared
and paid annually, usually in December.
|
|
f).
|
Security Transactions – Investment and shareholder transactions are recorded on the trade date. The Fund determines the realized gain/loss from an investment transaction by comparing the original cost of the
security lot sold with the net sale proceeds. Discounts and premiums on securities purchased are accreted or amortized, respectively, over the life of each such security.
|
|
g).
|
Use of Estimates – Preparing financial statements in accordance with GAAP requires management to make estimates and assumptions that affect the reported amounts of assets and liabilities and disclosure of
contingent assets and liabilities at the date of the financial statements, as well as the reported change in net assets during the reporting period. Actual results could differ from those estimates.
|
|
h).
|
Share Valuation – The net asset value (“NAV”) per share of the Fund is calculated by dividing (i) the total value of the securities held by the Fund, plus cash and other assets, minus all liabilities (including
estimated accrued expenses) by (ii) the total number of Fund shares outstanding, rounded to the nearest $0.01. Fund shares are not priced on days the New York Stock Exchange is closed for trading. The offering and redemption price per
share for the Fund is equal to the Fund’s NAV per share.
|
|
i).
|
Foreign Currency – Values of investments denominated in foreign currencies are converted into U.S. dollars using the spot market exchange rate at the time of valuation. Purchases and sales of investments and
income are translated into U.S. dollars using the spot market exchange rate prevailing on the respective dates of such transactions. The Fund does not isolate the portion of the results of operations resulting from fluctuations in foreign
exchange rates on investments from fluctuations resulting from changes in the market prices of securities held. Such fluctuations are included with the net realized and unrealized gain/loss on
|
|
HENNESSY FUNDS
|
1-800-966-4354
|
17
|
investments. Foreign investments present additional risks due to currency fluctuations, economic and political factors, lower liquidity, government regulations, differences in accounting standards, and other
factors.
|
|
|
j).
|
REIT Equity Securities – Distributions received from real estate investment trusts (“REITs”) may be classified as dividends, capital gains, or return of capital. Investments in REITs may require the Fund to
accrue and distribute income not yet received. To generate sufficient cash to make any required distributions, the Fund may be required to sell securities in its portfolio (including when it is not advantageous to do so) that it otherwise
would have continued to hold. At other times, investments in a REIT may result in the Fund’s receipt of cash in excess of the REIT’s earnings. If the Fund distributes these amounts, these distributions could constitute a return of capital
to Fund shareholders for U.S. federal income tax purposes. Dividends received by the Fund from a REIT generally do not constitute qualified dividend income and do not qualify for the dividends-received deduction.
|
|
k).
|
Partnership Accounting Policy – To the extent the Fund receives distributions from underlying partnerships in which it invests, the Fund records its pro rata share of income/loss and capital gains/losses and
accordingly adjusts the cost basis of the underlying partnerships for return of capital.
|
|
l).
|
Recent Accounting Pronouncements and Regulatory Updates – In October 2020, the Securities and Exchange Commission (“SEC”) adopted new regulations governing the use of derivatives by registered investment
companies (“Rule 18f-4”). Rule 18f-4 imposes limits on the amount of derivatives a fund can enter into, eliminates the asset segregation framework currently used by funds to comply with Section 18 of the 1940 Act, and requires funds whose
use of derivatives is greater than a limited specified amount to establish and maintain a comprehensive derivatives risk management program and appoint a derivatives risk manager. Funds are required to comply with Rule 18f-4 by August 19,
2022. The impact, if any, that Rule 18f-4 will have on the availability, liquidity, and performance of derivatives is unclear. Management is currently evaluating the potential impact of Rule 18f-4 on the Fund. When fully implemented, Rule
18f-4 may require changes in how the Fund uses derivatives, adversely affect the Fund’s performance, and increase costs related to the Fund’s use of derivatives.
|
|
In December 2020, the SEC adopted a new rule providing a framework for fund valuation practices (“Rule 2a-5”). Rule 2a-5 establishes
requirements for determining fair value in good faith for purposes of the 1940 Act. Rule 2a-5 permits fund boards to designate certain parties to perform fair value determinations, subject to board oversight and certain other conditions.
Rule 2a-5 also defines when market quotations are “readily available” for purposes of the 1940 Act and the threshold for determining whether a fund must fair value a security. In connection with Rule 2a-5, the SEC also adopted related
recordkeeping requirements and is rescinding previously issued guidance, including with respect to the role of a board in determining fair value and the accounting and auditing of fund investments. Funds must comply with the rules by
September 8, 2022. Management is currently assessing the potential impact of the new rules on the Fund’s financial statements.
|
3). SECURITIES VALUATION
The Fund follows its valuation policies and procedures in determining its net asset value and, in preparing these financial statements, the fair value accounting standards that establish an authoritative definition of
fair value and set out a hierarchy for measuring fair value. These standards require additional disclosures about the various inputs and
|
WWW.HENNESSYFUNDS.COM
|
18
|
NOTES TO THE FINANCIAL STATEMENTS
|
valuation techniques used to develop the measurements of fair value and a discussion of changes in valuation techniques and related inputs during the period. These inputs are summarized in the three broad levels listed
below:
|
Level 1 –
|
Unadjusted, quoted prices in active markets for identical instruments that the Fund has the ability to access at the date of measurement.
|
|
|
Level 2 –
|
Other significant observable inputs (including, but not limited to, quoted prices in active markets for similar instruments, quoted prices in markets that are not active for identical or similar instruments, and
model-derived valuations in which all significant inputs and significant value drivers are observable in active markets, such as interest rates, prepayment speeds, credit risk curves, default rates, and similar data).
|
|
|
Level 3 –
|
Significant unobservable inputs (including the Fund’s own assumptions about what market participants would use to price the asset or liability based on the best available information) when observable inputs are
unavailable.
|
The following is a description of the valuation techniques applied to the Fund’s major categories of assets and liabilities on a recurring basis:
|
Equity Securities – Equity securities, including common stocks, preferred stocks, foreign-issued common stocks, exchange-traded funds, closed-end mutual funds,
partnerships, rights, MLPs, and real estate investment trusts, that are traded on a securities exchange for which a last-quoted sales price is readily available generally are valued at the last sales price as reported by the primary
exchange on which the securities are listed. Securities listed on The Nasdaq Stock Market (“Nasdaq”) generally are valued at the Nasdaq Official Closing Price, which may differ from the last sales price reported. Securities traded on a
securities exchange for which a last-quoted sales price is not readily available generally are valued at the mean between the bid and ask prices. To the extent these securities are actively traded and valuation adjustments are not
applied, they are classified in Level 1 of the fair value hierarchy. Securities traded on foreign exchanges generally are not valued at the same time the Fund calculates its NAV because most foreign markets close well before such time.
The earlier close of most foreign markets gives rise to the possibility that significant events, including broad market moves, may have occurred in the interim. In certain circumstances, it may be determined that a foreign security needs
to be fair valued because it appears that the value of the security might have been materially affected by events occurring after the close of the market in which the security is principally traded, but before the time the Fund calculates
its NAV, such as by a development that affects an entire market or region (e.g., a weather-related event) or a potentially global development (e.g., a terrorist attack that may be expected to have an effect on investor expectations
worldwide).
|
|
|
Registered Investment Companies – Investments in open-end registered investment companies, commonly referred to as mutual funds, generally are priced at the ending NAV
provided by the applicable mutual fund’s service agent and are classified in Level 1 of the fair value hierarchy.
|
|
|
Debt Securities – Debt securities, including corporate bonds, asset-backed securities, mortgage-backed securities, municipal bonds, U.S. Treasuries, and U.S. government
agency issues, are generally valued at market on the basis of valuations furnished by an independent pricing service that utilizes both dealer-supplied valuations and formula-based techniques. The pricing service may consider recently
executed transactions in securities of the issuer or comparable issuers, market price quotations (where observable), bond spreads, and fundamental data relating to the issuer. In
|
|
HENNESSY FUNDS
|
1-800-966-4354
|
19
|
addition, the model may incorporate observable market data, such as reported sales of similar securities, broker quotes, yields, bids, offers, and reference data. Certain securities are valued primarily using
dealer quotations. These securities are generally classified in Level 2 of the fair value hierarchy.
|
|
|
Short-Term Securities – Short-term equity investments, including money market funds, are valued in the manner specified above for equity securities. Short-term debt
investments with an original term to maturity of 60 days or less are valued at amortized cost, which approximates fair market value. If the original term to maturity of a short-term debt investment exceeds 60 days, then the values as of
the 61st day prior to maturity are amortized. Amortized cost is not used if its use would be inappropriate due to credit or other impairments of the issuer, in which case the security’s fair value would be determined as described below.
Short-term securities are generally classified in Level 1 or Level 2 of the fair value hierarchy depending on the inputs used and market activity levels for specific securities.
|
The Board of Trustees of the Fund (the “Board”) has adopted fair value pricing procedures that are followed when a price for a security is not readily available or if a significant event has occurred
that indicates the closing price of a security no longer represents the true value of that security. Fair value pricing determinations are made in good faith in accordance with these procedures. There are numerous criteria considered in
determining a fair value of a security, such as the trading volume of a security and markets, the values of other similar securities, and news events with direct bearing on a security or markets. Fair value pricing results in an estimated price
for a security that reflects the amount the Fund might reasonably expect to receive in a current sale. Depending on the relative significance of the valuation inputs, these securities may be classified in either Level 2 or Level 3 of the fair
value hierarchy.
The fair value of foreign securities may be determined with the assistance of a pricing service using correlations between the movement of prices of such securities and indices of domestic securities
and other appropriate indicators, such as closing market prices of relevant American Depositary Receipts or futures contracts. Using fair value pricing means that the Fund’s NAV reflects the affected portfolio securities’ values as determined by
the Board or its designee, pursuant to the fair value pricing procedures adopted by the Board, instead of being determined by the market. Using a fair value pricing methodology to price a foreign security may result in a value that is different
from such foreign security’s most recent closing price and from the value used by other investment companies to calculate their NAVs. Such securities are generally classified in Level 2 of the fair value hierarchy. Because the Fund may invest in
foreign securities, the value of the Fund’s portfolio securities may change on days when a shareholder is unable to purchase or redeem Fund shares.
The Board has delegated day-to-day valuation matters to the Valuation and Liquidity Committee comprising representatives from Hennessy Advisors, Inc., the Fund’s investment advisor (the “Advisor”).
The function of the Valuation and Liquidity Committee, among other things, is to value securities where current and reliable market quotations are not readily available. All actions taken by the Valuation and Liquidity Committee are reviewed by
the Board.
The Fund has performed an analysis of all existing investments to determine the significance and character of all inputs to their fair value determinations. Various inputs are used to determine the
value of the Fund’s investments. The inputs or methodology used for valuing securities are not necessarily an indication of the risk associated with investing in those securities. Details related to the fair value hierarchy of the Fund’s
securities as of April 30, 2022, are included in the Schedule of Investments.
|
WWW.HENNESSYFUNDS.COM
|
20
|
NOTES TO THE FINANCIAL STATEMENTS
|
4). INVESTMENT TRANSACTIONS
Purchases and sales of investment securities (excluding government and short-term investments) for the Fund during the six months ended April 30, 2022, were $17,703,841 and $124,544,457, respectively.
There were no purchases or sales/maturities of long-term U.S. government securities for the Fund during the six months ended April 30, 2022.
5). INVESTMENT ADVISORY FEE AND OTHER TRANSACTIONS WITH AFFILIATES
The Advisor provides the Fund with investment advisory services under an Investment Advisory Agreement. The Advisor oversees the provision of investment advice and furnishes office space, facilities, and most of the
personnel needed by the Fund. As compensation for its services, the Advisor is entitled to a monthly fee from the Fund. The fee is based on the average daily net assets of the Fund at an annual rate of 0.90%. The net investment advisory fees
expensed by the Fund during the six months ended April 30, 2022, are included in the Statement of Operations.
The Advisor has delegated the day-to-day management of the Fund to a sub-advisor, Broad Run Investment Management, LLC. The Advisor pays the sub-advisory fees from its own assets, and these fees are
not an additional expense of the Fund. During the six months ended April 30, 2022, the Advisor (not the Fund) paid a sub-advisory fee at the rate of 0.29% of the daily net assets of the Fund.
The Board has approved a Shareholder Servicing Agreement for Investor Class shares of the Fund, which compensates the Advisor for the non-investment advisory services it provides to the Fund. The
Shareholder Servicing Agreement provides for a monthly fee paid to the Advisor at an annual rate of 0.10% of the average daily net assets of the Fund attributable to Investor Class shares. The shareholder service fees expensed by the Fund during
the six months ended April 30, 2022, are included in the Statement of Operations.
The Fund has adopted a plan pursuant to Rule 12b-1 under the Investment Company Act of 1940, as amended, that authorizes payments in connection with the distribution of Fund shares at an annual rate
of up to 0.25% of the Fund’s average daily net assets attributable to Investor Class shares. Even though the authorized rate is up to 0.25%, the Fund is currently only using up to 0.15% of its average daily net assets attributable to Investor
Class shares for such purpose. Amounts paid under the plan may be spent on any activities or expenses primarily intended to result in the sale of shares, including, but not limited to, advertising, shareholder account servicing, printing and
mailing of prospectuses to other than current shareholders, printing and mailing of sales literature, and compensation for sales and marketing activities or to financial institutions and others, such as dealers and distributors. The distribution
fees expensed by the Fund during the six months ended April 30, 2022, are included in the Statement of Operations.
The Fund has entered into agreements with various brokers, dealers, and financial intermediaries in connection with the sale of Fund shares. The agreements provide for periodic payments of
sub-transfer agent expenses by the Fund to the brokers, dealers, and financial intermediaries for providing certain shareholder maintenance services. These shareholder services include the pre-processing and quality control of new accounts,
shareholder correspondence, answering customer inquiries regarding account status, and facilitating shareholder telephone transactions. The sub-transfer agent fees expensed by the Fund during the six months ended April 30, 2022, are included in
the Statement of Operations.
|
HENNESSY FUNDS
|
1-800-966-4354
|
21
U.S. Bancorp Fund Services, LLC, d/b/a U.S. Bank Global Fund Services (“Fund Services”) provides the Fund with administrative, accounting, and transfer agent services. As administrator, Fund Services
is responsible for activities such as (i) preparing various federal and state regulatory filings, reports, and returns for the Fund, (ii) preparing reports and materials to be supplied to the Board, (iii) monitoring the activities of the Fund’s
custodian, transfer agent, and accountants, and (iv) coordinating the preparation and payment of the Fund’s expenses and reviewing the Fund’s expense accruals. U.S. Bank N.A., an affiliate of Fund Services, serves as the Fund’s custodian. The
servicing agreements between the Trust, Fund Services, and U.S. Bank N.A. contain a fee schedule that is inclusive of administrative, accounting, custody, and transfer agent fees. The administrative, accounting, custody, and transfer agent fees
expensed by the Fund during the six months ended April 30, 2022, are included in the Statement of Operations.
Quasar Distributors, LLC (“Quasar”), a wholly owned broker-dealer subsidiary of Foreside Financial Group, LLC, acts as the Fund’s principal underwriter in a continuous public offering of Fund shares.
The officers of the Fund are affiliated with the Advisor. With the exception of the Chief Compliance Officer and the Senior Compliance Officer, such officers receive no compensation from the Fund for
serving in their respective roles. The Fund, along with the other funds in the Hennessy Funds family (collectively, the “Hennessy Funds”), makes reimbursement payments on an equal basis to the Advisor for a portion of the salary and benefits
associated with the office of the Chief Compliance Officer and for all of the salary and benefits associated with the office of the Senior Compliance Officer. The compliance fees expensed by the Fund during the six months ended April 30, 2022,
are included in the Statement of Operations.
6). GUARANTEES AND INDEMNIFICATIONS
Under the Hennessy Funds’ organizational documents, their officers and trustees are indemnified by the Hennessy Funds against certain liabilities arising out of the performance of their duties to the Hennessy Funds.
Additionally, in the normal course of business, the Hennessy Funds enter into contracts with service providers that contain general indemnification clauses. The Fund’s maximum exposure under these arrangements is unknown as this would involve
future claims that may be made against the Fund that have not yet occurred. Currently, the Fund expects the risk of loss to be remote.
7). LINE OF CREDIT
The Fund has an uncommitted line of credit with the other Hennessy Funds in the amount of the lesser of (i) $100,000,000 or (ii) 33.33% of each Hennessy Fund’s net assets, or 30% for the Hennessy Gas Utility Fund and
10% for the Hennessy Balanced Fund. The line of credit is intended to provide any necessary short-term financing in connection with shareholder redemptions, subject to certain restrictions. The credit facility is with the Hennessy Funds’
custodian bank, U.S. Bank N.A. Borrowings under this arrangement bear interest at the bank’s prime rate and are secured by all of the Fund’s assets (as to its own borrowings only). During the six months ended April 30, 2022, the Fund did not have
any borrowings outstanding under the line of credit.
|
WWW.HENNESSYFUNDS.COM
|
22
|
NOTES TO THE FINANCIAL STATEMENTS
|
8). FEDERAL TAX INFORMATION
As of October 31, 2021, the Fund’s most recent fiscal year end, the components of accumulated earnings (losses) for income tax purposes were as follows:
|
Investments
|
||||
|
Cost of investments for tax purposes
|
$
|
402,434,173
|
||
|
Gross tax unrealized appreciation
|
$
|
818,221,412
|
||
|
Gross tax unrealized depreciation
|
(11,476,479
|
)
|
||
|
Net tax unrealized appreciation/(depreciation)
|
$
|
806,744,933
|
||
|
Undistributed ordinary income
|
$
|
—
|
||
|
Undistributed long-term capital gains
|
177,256,695
|
|||
|
Total distributable earnings
|
$
|
177,256,695
|
||
|
Other accumulated gain/(loss)
|
$
|
(8,436,125
|
)
|
|
|
Total accumulated gain/(loss)
|
$
|
975,565,503
|
||
As of October 31, 2021, the Fund had no tax-basis capital losses to offset future capital gains.
As of October 31, 2021, the Fund deferred, on a tax basis, a late-year ordinary loss of $8,436,125. Late-year ordinary losses are net ordinary losses incurred after December 31, 2020, but within the
taxable year, that are deemed to arise on the first day of the Fund’s next taxable year.
During fiscal year 2022 (year to date) and fiscal year 2021, the tax character of distributions paid by the Fund was as follows:
|
Six Months Ended
|
Year Ended
|
||||||||
|
April 30, 2022
|
October 31, 2021
|
||||||||
|
Ordinary income(1)
|
$
|
—
|
$
|
—
|
|||||
|
Long-term capital gains
|
177,256,741
|
314,776,104
|
|||||||
|
Total distributions
|
$
|
177,256,741
|
$
|
314,776,104
|
|||||
|
(1) Ordinary income includes short-term capital gains.
|
9). EVENTS SUBSEQUENT TO PERIOD END
Management has evaluated the Fund’s related events and transactions that occurred subsequent to April 30, 2022, through the date of issuance of the Fund’s financial statements. Management has determined that there were
no subsequent events requiring recognition or disclosure in the financial statements.
|
HENNESSY FUNDS
|
1-800-966-4354
|
23
Expense Example (Unaudited)
April 30, 2022
As a shareholder of the Fund, you incur ongoing costs, including management fees, service fees, and other Fund expenses. This Example is intended to help you understand your ongoing costs (in dollars) of investing in
the Fund and to compare these costs with the ongoing costs of investing in other mutual funds. The Example is based on an investment of $1,000 invested at the beginning of the period and held for the entire period from November 1, 2021, through
April 30, 2022.
Actual Expenses
In the table below, the first line under each of the “Investor Class” and “Institutional Class” headings provides information about actual account values and actual expenses for each share class. You may use this
information, together with the amount you invested, to estimate the expenses that you paid over the period. Simply divide your account value by $1,000 (for example, an $8,600 account value divided by $1,000 = 8.6), then multiply the result by the
number in the first line under the heading “Expenses Paid During Period” to estimate the expenses you paid on your account during this period. Although the Fund charges no sales loads or transaction fees, you will be assessed fees for outgoing
wire transfers, returned checks, and stop payment orders at prevailing rates charged by U.S. Bank Global Fund Services, the Fund’s transfer agent. If you request that a redemption be made by wire transfer, the Fund’s transfer agent charges a $15
fee. IRAs are charged a $15 annual maintenance fee (up to $30 maximum per shareholder for shareholders with multiple IRAs). The examples below include, but are not limited to, management, shareholder servicing, accounting, custody, and transfer
agent fees. However, the examples below do not include portfolio trading commissions and related expenses.
Hypothetical Example for Comparison Purposes
In the table below, the second line under each of the “Investor Class” and “Institutional Class” headings provides information about hypothetical account values and hypothetical expenses based on the Fund’s actual
expense ratio for each share class and an assumed rate of return of 5% per year before expenses, which is not the Fund’s actual return for such share class. The hypothetical account values and expenses may not be used to estimate the actual
ending account balance or expenses you paid for the period. You may use this information to compare the ongoing costs of investing in the Fund and other funds. To do so, compare these 5% hypothetical examples with the 5% hypothetical examples
that appear in the shareholder reports of the other funds. Please note that the expenses shown in the table are meant to highlight your ongoing costs only. Therefore, the second lines under “Investor Class” and “Institutional Class” are useful in
comparing ongoing costs only and will not help you determine the relative total costs of owning different funds.
|
WWW.HENNESSYFUNDS.COM
|
24
|
EXPENSE EXAMPLE
|
|
Beginning
|
Ending
|
||
|
Account Value
|
Account Value
|
Expenses Paid
|
|
|
November 1, 2021
|
April 30, 2022
|
During Period(1)
|
|
|
Investor Class
|
|||
|
Actual
|
$1,000.00
|
$ 829.50
|
$6.94
|
|
Hypothetical (5% return before expenses)
|
$1,000.00
|
$1,017.21
|
$7.65
|
|
Institutional Class
|
|||
|
Actual
|
$1,000.00
|
$ 831.20
|
$5.13
|
|
Hypothetical (5% return before expenses)
|
$1,000.00
|
$1,019.19
|
$5.66
|
|
(1)
|
Expenses are equal to the Fund’s annualized expense ratio of 1.53% for Investor Class shares or 1.13% for Institutional Class shares, as applicable, multiplied by the average account value over the period,
multiplied by 181/365 days (to reflect the half-year period).
|
|
HENNESSY FUNDS
|
1-800-966-4354
|
25
How to Obtain a Copy of the Fund’s Proxy
Voting Policy and Proxy Voting Records
A description of the policies and procedures the Fund uses to determine how to vote proxies relating to portfolio securities is available without charge (1) by calling 800-966-4354, (2) on the Hennessy Funds’ website at
www.hennessyfunds.com/proxy-voting/voting-policy, or (3) on the U.S. Securities and Exchange Commission’s (the “SEC”) website at www.sec.gov. The Fund’s proxy voting record is available without charge on both the Hennessy Funds’ website at
www.hennessyfunds.com/proxy-voting/voting-record and the SEC’s website at www.sec.gov no later than August 31 for the prior 12 months ending June 30.
Availability of Quarterly Portfolio Schedule
The Fund files its complete schedule of portfolio holdings with the SEC for the first and third quarters of each fiscal year as an exhibit to its reports on Form N-PORT. The Fund’s Form N-PORT reports are available on
the SEC’s website at www.sec.gov or on request by calling 800-966-4354.
Federal Tax Distribution Information (Unaudited)
For fiscal year 2021, certain dividends paid by the Fund may be subject to a maximum tax rate of 23.8%, as provided for by the Jobs and Growth Tax Relief Reconciliation Act of 2003. The percentage of dividends declared
from ordinary income designated as qualified dividend income was 0.00%.
For corporate shareholders, the percent of ordinary income distributions that qualified for the corporate dividends received deduction for fiscal year 2021 was 0.00%.
The percentage of taxable ordinary income distributions that were designated as short-term capital gain distributions under Section 871(k)(2)(C) of the Internal Revenue Code of 1986, as amended, for
the Fund was 0.00%.
Important Notice Regarding Delivery
of Shareholder Documents
To help keep the Fund’s costs as low as possible, we generally deliver a single copy of shareholder reports, proxy statements, and prospectuses to shareholders who share an address and have the same last name. This
process does not apply to account statements. You may request an individual copy of a shareholder document at any time. If you would like to receive separate mailings of shareholder documents, please call U.S. Bank Global Fund Services at
800-261-6950 or 414-765-4124, and individual delivery will begin within 30 days of your request. If your account is held through a financial institution or other intermediary, please contact such intermediary directly to request individual
delivery.
Electronic Delivery
As permitted by SEC regulations, the Fund’s shareholder reports are made available on a website, and unless you sign up for eDelivery or elect to receive paper copies as detailed below, you will be notified each time a
report is posted and provided with a website link to access the report.
The Fund also offers shareholders the option to receive all notices, account statements, prospectuses, tax forms, and shareholder reports electronically. To sign up for eDelivery or change your
delivery preference, please visit www.hennessyfunds.com/account.
To elect to receive paper copies of all future reports free of charge, please call U.S. Bank Global Fund Services at 800-261-6950 or 414-765-4124.
Subscribe to receive our team’s unique market and sector insights delivered to your inbox
www.hennessyfunds.com/subscribe
Follow us on social media
| |
|
|
WWW.HENNESSYFUNDS.COM
|
26
|
PROXY VOTING — BOARD APPROVAL OF INVESTMENT ADVISORY AGREEMENTS
|
Board Approval of Investment Advisory
Agreements
At its meeting on March 11, 2022, the Board of Trustees of the Fund (the “Board,” and the members thereof, the “Trustees”) unanimously approved the continuation of the investment advisory agreement of the Fund with
Hennessy Advisors, Inc. (the “Advisor”) and the sub-advisory agreement for the Fund between the Advisor and Broad Run Investment Management, LLC (the “Sub-Advisor”). As part of the process, the Trustees reviewed their fiduciary duties and the
relevant factors for them to consider with respect to approving the advisory and sub-advisory agreements. In addition, the Trustees who are not deemed “interested persons” (as defined by the Investment Company Act of 1940, as amended) of the Fund
(the “Independent Trustees”) met in executive session to discuss the approval of the advisory and sub-advisory agreements. As part of their discussion, the Independent Trustees confirmed their understanding of the need to have asked about, and
received answers to, any matters that they believed are relevant to determining whether to approve the continuation of the advisory and sub-advisory agreements.
In advance of the meeting, the Advisor sent detailed information to the Trustees to assist them in their evaluation of the advisory and sub-advisory agreements. This information included, but was not
limited to, the following:
|
(1)
|
A memorandum from outside legal counsel that described the fiduciary duties of the Board with respect to approving the continuation of the advisory and sub-advisory agreements and the relevant factors for
consideration;
|
|
|
(2)
|
A memorandum from the Advisor that listed the factors relevant to the Board’s approval of the continuation of the advisory and sub-advisory agreements and also referenced the documents that had been provided to
help the Board assess each such factor;
|
|
|
(3)
|
The Advisor’s financial statements from its most recent Form 10-K and Form 10-Q;
|
|
|
(4)
|
Summaries of the advisory and sub-advisory agreements;
|
|
|
(5)
|
A recent Fund fact sheet, which included, among other things, Fund performance over various periods;
|
|
|
(6)
|
A description of the range of services provided by the Advisor and the Sub-Advisor and the distinction between the Advisor-provided services and the Sub-Advisor-provided services;
|
|
|
(7)
|
A peer expense comparison of the net expense ratio and investment advisory fee of the Fund;
|
|
|
(8)
|
A memorandum from the Advisor regarding economies of scale;
|
|
|
(9)
|
A completed questionnaire from the Sub-Advisor;
|
|
|
(10)
|
A summary of the Sub-Advisor’s responses to the questionnaire, as well as relevant information from the Sub-Advisor’s Form ADVs Parts 1 and 2 and the certifications submitted by the Sub-Advisor each quarter;
|
|
|
(11)
|
Financial information of the Sub-Advisor; and
|
|
|
(12)
|
The Sub-Advisor’s Code of Ethics.
|
The Trustees reviewed and discussed all of the information provided by the Advisor and the Sub-Advisor. Following this review, and further discussion with the Advisor, the Trustees concluded that the
information provided before and at the meeting addressed all
|
HENNESSY FUNDS
|
1-800-966-4354
|
27
of the relevant matters that they wanted to consider in assessing the performance of the Funds and the performance of the Advisor and the Sub-Advisor under the advisory and sub-advisory agreements, and that said
information provided them with a fulsome understanding of the advisory and sub-advisory agreements and the services provided by the Advisor and the Sub-Advisor.
All of the factors discussed were considered as a whole by the Trustees, as well as by the Independent Trustees meeting in executive session. The Trustees viewed the relevant factors in their
totality, with no single factor being the principal or determinative factor in the Trustees’ determination of whether to approve the continuation of the advisory and sub-advisory agreements. The Trustees recognized that the management and fee
arrangements for the Fund are the result of years of review and discussion between the Independent Trustees and the Advisor, that certain aspects of such arrangements may receive greater scrutiny in some years than in others, and that the
Trustees’ conclusions may be based, in part, on their consideration of these same arrangements and information received during the course of the year and in prior years.
Prior to approving the continuation of the advisory and sub-advisory agreements, the Trustees, including the Independent Trustees in executive session, considered, among other items:
|
(1)
|
The nature and quality of the advisory services provided by the Advisor and the Sub-Advisor;
|
|
|
(2)
|
A comparison of the fees and expenses of the Fund to other similar funds;
|
|
|
(3)
|
Whether economies of scale are recognized by the Fund;
|
|
|
(4)
|
The costs and profitability of the Fund to the Advisor and the Sub-Advisor;
|
|
|
(5)
|
The performance of the Fund; and
|
|
|
(6)
|
Any benefits to the Advisor and the Sub-Advisor from serving as an investment advisor to the Fund (other than the advisory and sub-advisory fees).
|
The material considerations and determinations of the Trustees, including the Independent Trustees, were as follows:
|
(1)
|
The Trustees considered the services identified below that are provided by the Advisor. Based on this review and an assessment of the Advisor’s performance, the Trustees concluded that the Advisor provides
high-quality services to the Fund, and they noted that their overall confidence in the Advisor was high. The Trustees also concluded that they were satisfied with the nature, extent, and quality of the advisory services provided to the
Fund by the Advisor and that the nature and extent of the services provided by the Advisor were appropriate to assure that the Fund’s operations are conducted in compliance with applicable laws, rules, and regulations.
|
|
(a)
|
The Advisor oversees the Sub-Advisor for the Fund, and the Sub-Advisor acts as the portfolio manager for the Fund by providing portfolio management services.
|
||
|
(b)
|
The Advisor performs a daily reconciliation of portfolio positions and cash for the Fund.
|
||
|
(c)
|
The Advisor monitors the liquidity of each Fund.
|
||
|
(d)
|
The Advisor monitors the Fund’s compliance with its investment objectives and restrictions and federal securities laws.
|
|
WWW.HENNESSYFUNDS.COM
|
28
|
BOARD APPROVAL OF INVESTMENT ADVISORY AGREEMENTS
|
|
(e)
|
The Advisor maintains a compliance program (including a code of ethics), conducts ongoing reviews of the compliance programs of the Sub-Advisor and the Fund’s other service providers (including their codes of
ethics, as appropriate), conducts on-site visits to the Sub-Advisor and the Fund’s other service providers, as feasible, monitors incidents of abusive trading practices, reviews Fund expense accruals, payments, and fixed expense ratios,
evaluates insurance providers for fidelity bond, D&O/E&O insurance, and cybersecurity insurance coverage, manages regulatory examination compliance and responses, conducts employee compliance training, reviews reports provided by
service providers, and maintains books and records.
|
||
|
(f)
|
The Advisor oversees the selection and continued employment of the Sub-Advisor, reviews the Fund’s investment performance, and monitors the Sub-Advisor’s adherence to the Fund’s investment objectives, policies,
and restrictions.
|
||
|
(g)
|
The Advisor oversees service providers that provide accounting, administration, distribution, transfer agency, custodial, sales, marketing, public relations, audit, information technology, and legal services to
the Fund.
|
||
|
(h)
|
The Advisor maintains in-house marketing and distribution departments on behalf of the Fund.
|
||
|
(i)
|
The Advisor prepares or directs the preparation of all regulatory filings for the Fund, including writing and annually updating the Fund’s prospectus and related documents.
|
||
|
(j)
|
For each annual report of the Fund, the Advisor reviews the written summary prepared by the Sub-Advisor of the Fund’s performance during the most recent 12-month period.
|
||
|
(k)
|
The Advisor oversees distribution of the Fund through third-party broker/dealers and independent financial institutions such as Charles Schwab, Inc., Fidelity, TD Ameritrade, and Pershing. The Advisor
participates in “no transaction fee” (“NTF”) programs with these companies on behalf of the Fund, which allow customers to purchase the Fund through third-party distribution channels without paying a transaction fee. The Advisor
compensates, in part, a number of these third-party providers of NTF programs out of its own revenues.
|
||
|
(l)
|
The Advisor pays the incentive compensation of the Fund’s compliance officers and employs other staff, such as legal, marketing, national accounts, distribution, sales, administrative, and trading oversight
personnel, as well as management executives.
|
||
|
(m)
|
The Advisor provides a quarterly compliance certification to the Board.
|
||
|
(n)
|
The Advisor prepares or reviews all Board materials, presents to and leads discussions with the Board, prepares or reviews all meeting minutes, and arranges for Board training and education.
|
|
(2)
|
The Trustees considered the services identified below that are provided by the Sub-Advisor. Based on this review and an assessment of the Sub-Advisor’s performance, the Trustees concluded that the Sub-Advisor
provides high-quality services to the Fund. The Trustees also concluded that they were satisfied with the nature, extent, and quality of the advisory services provided to the Fund by
|
|
HENNESSY FUNDS
|
1-800-966-4354
|
29
|
the Sub-Advisor and that the nature and extent of the services provided by the Sub-Advisor were appropriate to assure that the Fund’s portfolio aligns properly with its investment objective and principal
investment strategies.
|
|
(a)
|
The Sub-Advisor acts as the portfolio manager for the Fund. In this capacity, the Sub-Advisor does the following:
|
|
(i)
|
manages the composition of the Fund’s portfolio, including the purchase, retention, and disposition of portfolio securities in accordance with the Fund’s investment objectives, policies, and restrictions;
|
|||
|
(ii)
|
seeks best execution for the Fund’s portfolio; and
|
|||
|
(iii)
|
manages proxy voting for the Fund.
|
|
(b)
|
The Sub-Advisor ensures that its compliance program includes policies and procedures relevant to the Fund and the Sub-Advisor’s duties as a portfolio manager to the Fund.
|
||
|
(c)
|
For each annual report of the Fund, the Sub-Advisor prepares a written summary of the Fund’s performance during the most recent 12-month period.
|
||
|
(d)
|
The Sub-Advisor provides a quarterly compliance certification to the Board regarding trading and allocation practices, supervisory matters, the Sub-Advisor’s compliance program (including its code of ethics),
compliance with the Fund’s policies, and general firm updates.
|
|
(3)
|
Trustees considered the distinction between the services performed by the Advisor and the Sub-Advisor. The Trustees noted that the management of the Fund, including the oversight of the Sub-Advisor, involves
more comprehensive and substantive duties than the duties of the Sub-Advisor. Specifically, the Trustees considered the lists of Advisor services previously identified and concluded that the services performed by the Advisor for the Fund
require a higher level of service and oversight than the services performed by the Sub-Advisor. Based on this determination, the Trustees concluded that the differential in advisory fees between the Advisor and the Sub-Advisor is
reasonable.
|
|
|
(4)
|
The Trustees compared the performance of the Fund to benchmark indices over various periods and noted that the Trustees review and discuss reports comparing the investment performance of the Fund to various
indices at each quarterly Board meeting. Based on such information, the Trustees determined that the Advisor and the Sub-Advisor manage the Fund in a manner materially consistent with its stated investment objective and style. The
Trustees concluded that the performance of the Fund over various periods warranted the continuation of the advisory and sub-advisory agreements.
|
|
|
(5)
|
The Trustees reviewed the advisory fees and overall expense ratios of the Fund compared to other funds similar in asset size and investment objective to the Fund using data from Morningstar. As part of the
discussion with management, the Trustees ensured that they understood and were comfortable with the criteria used to determine the mutual funds included in the Morningstar categories for purposes of the materials considered at the
meeting. The Trustees determined that the advisory fee and overall expense ratio of the Fund falls within a reasonable range of the advisory fees and overall expense ratios of other comparable funds and concluded that they are reasonable
and warranted continuation of the advisory and sub-advisory agreements.
|
|
|
(6)
|
The Trustees also considered whether the Advisor was realizing economies of scale that should be shared with the Fund’s shareholders. The Trustees noted that
|
|
WWW.HENNESSYFUNDS.COM
|
30
|
BOARD APPROVAL OF INVESTMENT ADVISORY AGREEMENTS
|
|
the majority of expenses incurred to manage the Fund are variable asset-based fees, so the Advisor does not realize material economies of scale relating to these expenses as the assets of the Fund increase. For
example, third-party platform fees and sub-advisory fees increase as the Fund’s assets grow.
|
||
|
(7)
|
The Trustees considered the profitability of the Advisor and the Sub-Advisor, including the impact of mutual fund platform fees on the Advisor’s profitability, and also considered the resources and revenues that
the Advisor has put into managing and distributing the Fund. The Trustees then concluded that the profits of the Advisor and the Sub-Advisor are reasonable and not excessive when compared to profitability guidelines set forth in relevant
court cases.
|
|
|
(8)
|
The Trustees considered the high level of professionalism and knowledge of the Advisor’s employees and concluded that this was beneficial to the Fund and its shareholders.
|
|
|
(9)
|
The Trustees considered any benefits to the Advisor and the Sub-Advisor from serving as an advisor to the Fund (other than the advisory and sub-advisory fees). The Trustees noted that the Advisor and the
Sub-Advisor may derive ancillary benefits from, by way of example, their association with the Fund in the form of proprietary and third-party research products and services received from broker-dealers that execute portfolio trades for
the Fund. The Trustees determined that any such products and services have been used for legitimate purposes relating to the Fund by providing assistance in the investment decision-making process. The Trustees concluded that any
additional benefits realized by the Advisor and the Sub-Advisor from their relationship with the Fund were reasonable, which was based on, among other things, the Trustees’ findings that (i) the research, analytical, statistical, and
other information and services provided by brokers are merely supplemental to the Advisor’s and the Sub-Advisor’s own efforts in the performance of their duties under the advisory and sub-advisory agreements and (ii) although the
Sub-Advisor could derive benefits from the conversion of Fund shareholders into separate account clients, the Fund also could benefit from potential institutional shareholders who might choose to invest in the Fund.
|
After reviewing the materials and information provided at the meeting, as well as other information regularly provided at the Board’s quarterly meetings throughout the year regarding the quality of
services provided by the Advisor and the Sub-Advisor, the performance of the Fund, expense information, brokerage commissions information, the adequacy and efficacy of the Advisor’s and the Sub-Advisor’s written policies and procedures, other
regulatory compliance issues, trading information and related matters, and other factors that the Trustees deemed relevant, the Trustees, including the Independent Trustees, approved the continuation of the advisory and sub-advisory agreements.
|
HENNESSY FUNDS
|
1-800-966-4354
|
31
(This Page Intentionally Left Blank.)
For information, questions, or assistance, please call
The Hennessy Funds
800-966-4354 or 415-899-1555
INVESTMENT ADVISOR
Hennessy Advisors, Inc.
7250 Redwood Boulevard, Suite 200
Novato, California 94945
ADMINISTRATOR,
TRANSFER AGENT,
DIVIDEND PAYING AGENT, &
SHAREHOLDER SERVICING AGENT
U.S. Bancorp Fund Services, LLC
d/b/a U.S. Bank Global Fund Services
P.O. Box 701
Milwaukee, Wisconsin 53201-0701
CUSTODIAN
U.S. Bank N.A.
Custody Operations
1555 North River Center Drive, Suite 302
Milwaukee, Wisconsin 53212
TRUSTEES
Neil J. Hennessy
J. Dennis DeSousa
Robert T. Doyle
Claire Garvie
Gerald P. Richardson
COUNSEL
Foley & Lardner LLP
777 East Wisconsin Avenue
Milwaukee, Wisconsin 53202-5306
INDEPENDENT REGISTERED
PUBLIC ACCOUNTING FIRM
Tait, Weller & Baker LLP
Two Liberty Place
50 South 16th Street, Suite 2900
Philadelphia, Pennsylvania 19102-2529
DISTRIBUTOR
Quasar Distributors, LLC
111 East Kilbourn Avenue, Suite 1250
Milwaukee, Wisconsin 53202
www.hennessyfunds.com | 800-966-4354
This report has been prepared for shareholders and may be distributed to
others only if preceded or accompanied by a current prospectus.
SEMI-ANNUAL REPORT
APRIL 30, 2022
HENNESSY CORNERSTONE MID CAP 30 FUND
Investor Class HFMDX
Institutional Class HIMDX
www.hennessyfunds.com | 1-800-966-4354
(This Page Intentionally Left Blank.)
Contents
|
Letter to Shareholders
|
2
|
|
Performance Overview
|
4
|
|
Financial Statements
|
|
|
Schedule of Investments
|
5
|
|
Statement of Assets and Liabilities
|
9
|
|
Statement of Operations
|
10
|
|
Statements of Changes in Net Assets
|
11
|
|
Financial Highlights
|
12
|
|
Notes to the Financial Statements
|
16
|
|
Expense Example
|
23
|
|
Proxy Voting Policy and Proxy Voting Records
|
25
|
|
Availability of Quarterly Portfolio Schedule
|
25
|
|
Important Notice Regarding Delivery of Shareholder Documents
|
25
|
|
Electronic Delivery
|
25
|
|
Board Approval of Investment Advisory Agreement
|
26
|
|
HENNESSY FUNDS
|
1-800-966-4354
|
May 2022
Dear Hennessy Funds Shareholder:
We’d like to start our semi-annual letter with a pause. At the end of 2021, we looked forward to a new year – a potentially calmer year – having come through almost two full
years of the coronavirus pandemic. As people, we were aware our lives had changed, but we hoped for a better 2022; as investors, we were aware that the economy was strong and employment was robust, yet challenges loomed, including inflation,
supply chain disruptions, and tightening monetary policy; as employees, students, and family members, we recognized much was different, but we sought a return to what’s familiar. What we didn’t know was that a world leader who controls one of
the largest militaries on the planet was about to start one of the worst atrocities in Europe since World War II. Our thoughts are with the Ukrainian people, and our hope is for this unjustified, senseless human tragedy to end quickly.
The equity market started 2022 on a high note, with the S&P 500® Index hitting an all-time high on the first trading day of the year. This turned out to be the last hurrah for a market that saw a continuous march higher in 2021, having hit 70 new
all-time highs, with a new all-time high being recorded on average every three and a half days. Concerns in the market then coalesced and overpowered bullish sentiment, and the market has spiraled lower throughout 2022. Factors that drove the
market lower include: tightening monetary policy as the Federal Reserve has begun raising rates and has announced plans for shrinking its $8.5 trillion asset portfolio; inflation, higher energy costs, and their effects on the domestic and
global economies; continued supply chain disruptions; investors’ indiscriminate liquidation of broad-based ETFs and index funds and the detrimental effect on equities; and the near-term and long-term global implications of the Russian invasion
of Ukraine.
While markets are adjusting, many positive conditions remain intact. Corporate balance sheets and profits remain strong, GDP growth remains positive, the
consumer continues to show resilience in the face of rising prices, cash is abundant both at the corporate and household levels, unemployment is exceptionally low, and our financial system remains healthy. Markets are also experiencing a change
in leadership, as value stocks have been outperforming growth stocks, and traditionally defensive sectors such as Utilities and Consumer Staples have been outperforming the broader market. Finally, the Energy sector has soared in 2022, as
companies reap the benefits of dramatically higher oil and natural gas prices, and shareholders are rewarded with significantly higher dividends, aggressive buybacks, and higher stock prices after many years of underperformance for the sector.
With history as our guide, we are hopeful that eventually the market may bottom and head higher again. Since the financial crisis of 2008, we have experienced
many corrections and many recoveries to new highs. The Dow Jones Industrial Average has dropped over 10% eight times, including the current drop, for a median decline of 14.00%, and on average, it took 45 trading days to drop from peak to
trough and 127 trading days to return to the previous peak. Since the current drop has taken longer to go from peak to its recent trough, it may take some time for a recovery in prices to truly take hold.
On a positive note, valuations have come in, and many stocks have become more attractive, especially for longer-term investors. We note, however, that the
concept of “historically cheap stocks” does not, on its own, move the market higher. Rather, it is
|
WWW.HENNESSYFUNDS.COM
|
2
|
LETTER TO SHAREHOLDERS
|
overall capitulation and improving fundamentals that could bring buyers back into the market and reverse any bearish trends. Investors need to see improving company earnings, retreating inflationary trends, a measured
pace of interest rate increases globally that does not cause significant economic contraction, hope for a more peaceful and orderly world economic system unconstrained by supply bottlenecks and other hindrances to global trade, and, most
importantly, a subsidence of the deleterious effects of the coronavirus pandemic. While that may seem like a “tall order,” we believe that patient investing, focusing on value, quality, and downside risk mitigation, works well over the longer
term.
During this tumultuous period, performance of the majority of the Hennessy Funds has been relatively strong when compared to the overall market as well as to our
benchmarks. During the six months ended April 30, 2022, the Dow Jones Industrial Average, the S&P 500® Index, and the NASDAQ Composite Index dropped
7.05%, 9.65%, and 20.15%, respectively, on a total return basis. During this period when these three major indices saw significant declines, we were pleased that seven of our 16 Funds posted positive total returns, 10 of our 14 domestic Funds
outperformed the S&P 500® Index, and over half of our active funds outperformed their primary benchmarks.
We thank you, our shareholders, for your continued interest in our family of Funds. We are grateful for the trust you put in us, and we will continue to
strive to manage our portfolios for long-term performance, ever mindful of downside risk. While volatility and uncertainty may impact the markets in the short-term, we encourage investors to stay the course, maintain a diversified portfolio,
and keep a long-term perspective. If you have any questions or would like to speak with us, please don’t hesitate to call us directly at (800) 966-4354. In closing, we would also like to thank all of the healthcare and frontline workers that
have worked – and still work – tirelessly throughout the coronavirus pandemic.
Best regards,
|
|
|
|
|
Ryan C. Kelley, CFA
|
|
|
Chief Investment Officer,
|
|
|
Senior Vice President, and Portfolio Manager
|
Past performance does not guarantee future results.
Mutual fund investing involves risk. Principal loss is possible.
Opinions expressed are those of Ryan C. Kelley and are subject to change, are not guaranteed, and should not be considered investment advice.
The Dow Jones Industrial Average and S&P 500® Index are commonly used to measure the performance of U.S. stocks. The NASDAQ
Composite Index comprises all common stocks listed on The NASDAQ Stock Market and is commonly used to measure the performance of technology-related stocks. The indices are used herein for comparative purposes in accordance with SEC regulations.
One cannot invest directly in an index. All returns are shown on a total return basis.
Please refer to the Performance Overview section for more detailed performance information.
|
HENNESSY FUNDS
|
1-800-966-4354
|
3
Performance Overview (Unaudited)
AVERAGE ANNUAL TOTAL RETURN FOR PERIODS ENDED APRIL 30, 2022
|
Six
|
One
|
Five
|
Ten
|
|
|
Months(1)
|
Year
|
Years
|
Years
|
|
|
Hennessy Cornerstone
|
||||
|
Mid Cap 30 Fund –
|
||||
|
Investor Class (HFMDX)
|
1.67%
|
1.36%
|
10.17%
|
11.08%
|
|
Hennessy Cornerstone
|
||||
|
Mid Cap 30 Fund –
|
||||
|
Institutional Class (HIMDX)
|
1.85%
|
1.71%
|
10.57%
|
11.45%
|
|
Russell Midcap® Index
|
-12.54%
|
-6.10%
|
10.66%
|
11.99%
|
|
S&P 500® Index
|
-9.65%
|
0.21%
|
13.66%
|
13.67%
|
Expense ratios: 1.36% (Investor Class); 0.99% (Institutional Class)
|
(1)
|
Periods of less than one year are not annualized.
|
_______________
Performance data quoted represents past performance; past performance does not guarantee future results. The investment return and principal value of an investment will fluctuate so that an
investor’s shares, when redeemed, may be worth more or less than their original cost. The performance table does not reflect the deduction of taxes that a shareholder would pay on Fund distributions or the redemption of Fund shares. Current
performance of the Fund may be lower or higher than the performance quoted. Performance data current to the most recent month end may be obtained by visiting www.hennessyfunds.com.
The Russell Midcap® Index comprises approximately 800 of the smallest securities of the Russell 1000® Index based on a combination of market capitalization and current index membership. The S&P 500® Index
is a capitalization-weighted index that is designed to represent the broad domestic economy through changes in the aggregate market value of 500 stocks across all major industries. One cannot invest directly in an index. These indices are used
for comparative purposes in accordance with Securities and Exchange Commission regulations.
Frank Russell Company (“Russell”) is the source and owner of the trademarks, service marks, and copyrights related to the Russell Indexes. Russell® is a trademark of Frank Russell Company. Neither Russell nor its licensors accept any liability for any errors or omissions in the Russell Indexes or Russell ratings or underlying data and no party may rely on any Russell
Indexes or Russell ratings or underlying data contained in this communication. No further distribution of Russell data is permitted without Russell’s express written consent. Russell does not promote, sponsor, or endorse the content of this
communication.
Standard & Poor’s Financial Services is the source and owner of the S&P® and S&P 500® trademarks.
The expense ratios presented are from the most recent prospectus. The expense ratios for the current reporting period are available in the Financial Highlights section of this report.
|
WWW.HENNESSYFUNDS.COM
|
4
|
PERFORMANCE OVERVIEW/SCHEDULE OF INVESTMENTS
|
Financial Statements
|
Schedule of Investments as of April
30, 2022 (Unaudited)
|
HENNESSY CORNERSTONE MID CAP 30 FUND
(% of Net Assets)
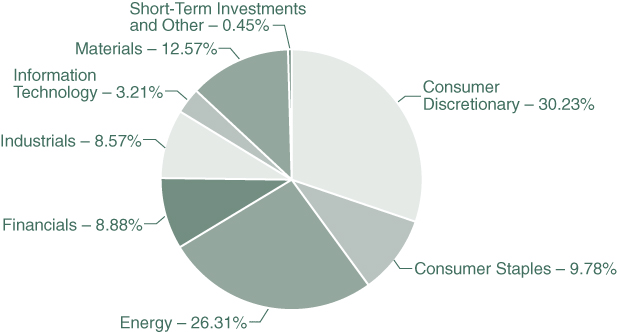
|
TOP TEN HOLDINGS (EXCLUDING MONEY MARKET FUNDS)
|
% NET ASSETS
|
|
Peabody Energy Corp.
|
6.40%
|
|
Antero Resources Corp.
|
5.96%
|
|
Alcoa Corp.
|
4.95%
|
|
NOV, Inc.
|
4.28%
|
|
Commercial Metals Co.
|
4.23%
|
|
Dillard’s, Inc.
|
3.92%
|
|
HF Sinclair Corp.
|
3.74%
|
|
BJ’s Wholesale Club Holdings, Inc.
|
3.67%
|
|
Plains All American Pipeline LP
|
3.44%
|
|
Mr. Cooper Group, Inc.
|
3.42%
|
Note: For presentation purposes, the Fund has grouped some of the industry categories. For purposes of categorizing securities for compliance with Section 8(b)(1) of the Investment Company Act of 1940, as amended, the
Fund uses more specific industry classifications.
The Global Industry Classification Standard (GICS®) was developed by and is the exclusive property and a service mark of MSCI, Inc. and
Standard & Poor’s Financial Services LLC. It has been licensed for use by the Hennessy Funds.
|
HENNESSY FUNDS
|
1-800-966-4354
|
5
|
COMMON STOCKS – 96.11%
|
Number
|
% of
|
||||||||||
|
|
of Shares
|
Value
|
Net Assets
|
|||||||||
|
Consumer Discretionary – 30.23%
|
||||||||||||
|
Abercrombie & Fitch Co., Class A (a)
|
322,600
|
$
|
11,155,508
|
2.95
|
%
|
|||||||
|
Academy Sports & Outdoors, Inc.
|
292,600
|
10,931,536
|
2.89
|
%
|
||||||||
|
Asbury Automotive Group, Inc. (a)
|
64,500
|
11,849,295
|
3.13
|
%
|
||||||||
|
AutoNation, Inc. (a)
|
104,100
|
12,066,231
|
3.19
|
%
|
||||||||
|
Dillard’s, Inc.
|
48,800
|
14,825,928
|
3.92
|
%
|
||||||||
|
Group 1 Automotive, Inc.
|
70,000
|
12,189,800
|
3.22
|
%
|
||||||||
|
Macy’s, Inc.
|
484,200
|
11,703,114
|
3.10
|
%
|
||||||||
|
Penske Automotive Group, Inc.
|
118,300
|
12,400,206
|
3.28
|
%
|
||||||||
|
PVH Corp.
|
115,800
|
8,427,924
|
2.23
|
%
|
||||||||
|
The Goodyear Tire & Rubber Co. (a)
|
659,700
|
8,787,204
|
2.32
|
%
|
||||||||
|
|
114,336,746
|
30.23
|
%
|
|||||||||
|
Consumer Staples – 9.78%
|
||||||||||||
|
BJ’s Wholesale Club Holdings, Inc. (a)
|
215,600
|
13,873,860
|
3.67
|
%
|
||||||||
|
Spectrum Brands Holdings, Inc.
|
134,800
|
11,467,436
|
3.03
|
%
|
||||||||
|
United Natural Foods, Inc. (a)
|
271,700
|
11,664,081
|
3.08
|
%
|
||||||||
|
|
37,005,377
|
9.78
|
%
|
|||||||||
|
Energy – 22.87%
|
||||||||||||
|
Antero Resources Corp. (a)
|
640,400
|
22,542,080
|
5.96
|
%
|
||||||||
|
Green Plains, Inc. (a)
|
336,000
|
9,431,520
|
2.49
|
%
|
||||||||
|
HF Sinclair Corp. (a)
|
372,400
|
14,158,648
|
3.74
|
%
|
||||||||
|
NOV, Inc.
|
891,900
|
16,170,147
|
4.28
|
%
|
||||||||
|
Peabody Energy Corp. (a)
|
1,068,300
|
24,186,312
|
6.40
|
%
|
||||||||
|
|
86,488,707
|
22.87
|
%
|
|||||||||
|
Financials – 8.88%
|
||||||||||||
|
First American Financial Corp.
|
172,623
|
10,065,647
|
2.66
|
%
|
||||||||
|
Mr. Cooper Group, Inc. (a)
|
287,400
|
12,924,378
|
3.42
|
%
|
||||||||
|
Old Republic International Corp.
|
481,900
|
10,606,619
|
2.80
|
%
|
||||||||
|
|
33,596,644
|
8.88
|
%
|
|||||||||
|
Industrials – 8.57%
|
||||||||||||
|
ArcBest Corp.
|
141,400
|
10,203,424
|
2.70
|
%
|
||||||||
|
Ryder System, Inc.
|
148,000
|
10,345,200
|
2.73
|
%
|
||||||||
|
WESCO International, Inc. (a)
|
96,300
|
11,869,938
|
3.14
|
%
|
||||||||
|
|
32,418,562
|
8.57
|
%
|
|||||||||
The accompanying notes are an integral part of these financial statements.
|
WWW.HENNESSYFUNDS.COM
|
6
|
SCHEDULE OF INVESTMENTS
|
|
COMMON STOCKS
|
Number
|
% of
|
||||||||||
|
|
of Shares
|
Value
|
Net Assets
|
|||||||||
|
Information Technology – 3.21%
|
||||||||||||
|
Jabil, Inc.
|
210,500
|
$
|
12,152,165
|
3.21
|
%
|
|||||||
|
Materials – 12.57%
|
||||||||||||
|
Alcoa Corp.
|
276,300
|
18,733,140
|
4.95
|
%
|
||||||||
|
Commercial Metals Co.
|
389,800
|
15,981,800
|
4.23
|
%
|
||||||||
|
Olin Corp.
|
223,600
|
12,834,640
|
3.39
|
%
|
||||||||
|
|
47,549,580
|
12.57
|
%
|
|||||||||
|
|
||||||||||||
|
Total Common Stocks
|
||||||||||||
|
(Cost $363,884,108)
|
363,547,781
|
96.11
|
%
|
|||||||||
|
|
||||||||||||
|
PARTNERSHIPS & TRUSTS – 3.44%
|
||||||||||||
|
Energy – 3.44%
|
||||||||||||
|
Plains All American Pipeline LP
|
1,254,600
|
12,997,656
|
3.44
|
%
|
||||||||
|
|
||||||||||||
|
Total Partnerships & Trusts
|
||||||||||||
|
(Cost $12,875,016)
|
12,997,656
|
3.44
|
%
|
|||||||||
|
|
||||||||||||
|
SHORT-TERM INVESTMENTS – 0.47%
|
||||||||||||
|
Money Market Funds – 0.47%
|
||||||||||||
|
First American Government Obligations Fund,
|
||||||||||||
|
Institutional Class, 0.22% (b)
|
1,793,531
|
1,793,531
|
0.47
|
%
|
||||||||
|
|
||||||||||||
|
Total Short-Term Investments
|
||||||||||||
|
(Cost $1,793,531)
|
1,793,531
|
0.47
|
%
|
|||||||||
|
|
||||||||||||
|
Total Investments
|
||||||||||||
|
(Cost $378,552,655) – 100.02%
|
378,338,968
|
100.02
|
%
|
|||||||||
|
Liabilities in Excess of Other Assets – (0.02)%
|
(69,655
|
)
|
(0.02
|
)%
|
||||||||
|
|
||||||||||||
|
TOTAL NET ASSETS – 100.00%
|
$
|
378,269,313
|
100.00
|
%
|
||||||||
Percentages are stated as a percent of net assets.
|
(a)
|
Non-income-producing security.
|
|
(b)
|
The rate listed is the fund’s seven-day yield as of April 30, 2022.
|
The accompanying notes are an integral part of these financial statements.
|
HENNESSY FUNDS
|
1-800-966-4354
|
7
Summary of Fair Value Exposure as of April 30, 2022
The following is a summary of the inputs used to value the Fund’s net assets as of April 30, 2022 (see Note 3 in the accompanying Notes to the Financial Statements):
|
Common Stocks
|
Level 1
|
Level 2
|
Level 3
|
Total
|
||||||||||||
|
Consumer Discretionary
|
$
|
114,336,746
|
$
|
—
|
$
|
—
|
$
|
114,336,746
|
||||||||
|
Consumer Staples
|
37,005,377
|
—
|
—
|
37,005,377
|
||||||||||||
|
Energy
|
86,488,707
|
—
|
—
|
86,488,707
|
||||||||||||
|
Financials
|
33,596,644
|
—
|
—
|
33,596,644
|
||||||||||||
|
Industrials
|
32,418,562
|
—
|
—
|
32,418,562
|
||||||||||||
|
Information Technology
|
12,152,165
|
—
|
—
|
12,152,165
|
||||||||||||
|
Materials
|
47,549,580
|
—
|
—
|
47,549,580
|
||||||||||||
|
Total Common Stocks
|
$
|
363,547,781
|
$
|
—
|
$
|
—
|
$
|
363,547,781
|
||||||||
|
Partnerships & Trusts
|
||||||||||||||||
|
Energy
|
$
|
12,997,656
|
$
|
—
|
$
|
—
|
$
|
12,997,656
|
||||||||
|
Total Partnerships & Trusts
|
$
|
12,997,656
|
$
|
—
|
$
|
—
|
$
|
12,997,656
|
||||||||
|
Short-Term Investments
|
||||||||||||||||
|
Money Market Funds
|
$
|
1,793,531
|
$
|
—
|
$
|
—
|
$
|
1,793,531
|
||||||||
|
Total Short-Term Investments
|
$
|
1,793,531
|
$
|
—
|
$
|
—
|
$
|
1,793,531
|
||||||||
|
Total Investments
|
$
|
378,338,968
|
$
|
—
|
$
|
—
|
$
|
378,338,968
|
||||||||
The accompanying notes are an integral part of these financial statements.
|
WWW.HENNESSYFUNDS.COM
|
8
|
SCHEDULE OF INVESTMENTS/STATEMENT OF ASSETS AND LIABILITIES
|
Financial Statements
|
Statement of Assets and Liabilities as of April 30, 2022 (Unaudited)
|
|
ASSETS:
|
||||
|
Investments in securities, at value (cost $378,552,655)
|
$
|
378,338,968
|
||
|
Dividends and interest receivable
|
10,531
|
|||
|
Receivable for fund shares sold
|
69,638
|
|||
|
Return of capital receivable
|
272,875
|
|||
|
Prepaid expenses and other assets
|
25,696
|
|||
|
Total assets
|
378,717,708
|
|||
|
LIABILITIES:
|
||||
|
Payable for fund shares redeemed
|
16,885
|
|||
|
Payable to advisor
|
237,347
|
|||
|
Payable to sub-transfer agents
|
46,817
|
|||
|
Payable to administrator
|
69,762
|
|||
|
Payable to auditor
|
11,228
|
|||
|
Accrued distribution fees
|
38,635
|
|||
|
Accrued service fees
|
17,757
|
|||
|
Accrued trustees fees
|
3,911
|
|||
|
Accrued expenses and other payables
|
6,053
|
|||
|
Total liabilities
|
448,395
|
|||
|
NET ASSETS
|
$
|
378,269,313
|
||
|
NET ASSETS CONSISTS OF:
|
||||
|
Capital stock
|
$
|
282,213,739
|
||
|
Total distributable earnings
|
96,055,574
|
|||
|
Total net assets
|
$
|
378,269,313
|
||
|
NET ASSETS:
|
||||
|
Investor Class
|
||||
|
Shares authorized (no par value)
|
Unlimited
|
|||
|
Net assets applicable to outstanding shares
|
$
|
210,523,590
|
||
|
Shares issued and outstanding
|
10,647,765
|
|||
|
Net asset value, offering price, and redemption price per share
|
$
|
19.77
|
||
|
Institutional Class
|
||||
|
Shares authorized (no par value)
|
Unlimited
|
|||
|
Net assets applicable to outstanding shares
|
$
|
167,745,723
|
||
|
Shares issued and outstanding
|
8,107,618
|
|||
|
Net asset value, offering price, and redemption price per share
|
$
|
20.69
|
||
The accompanying notes are an integral part of these financial statements.
|
HENNESSY FUNDS
|
1-800-966-4354
|
9
Financial Statements
|
Statement of Operations for the six months ended April 30, 2022 (Unaudited)
|
|
INVESTMENT INCOME:
|
||||
|
Distributions received from master limited partnerships
|
$
|
498,703
|
||
|
Return of capital on distributions received
|
(498,703
|
)
|
||
|
Dividend income from common stock
|
5,646,968
|
|||
|
Interest income
|
1,884
|
|||
|
Total investment income
|
5,648,852
|
|||
|
EXPENSES:
|
||||
|
Investment advisory fees (See Note 5)
|
1,406,910
|
|||
|
Sub-transfer agent expenses – Investor Class (See Note 5)
|
211,254
|
|||
|
Sub-transfer agent expenses – Institutional Class (See Note 5)
|
75,064
|
|||
|
Administration, accounting, custody, and transfer agent fees (See Note 5)
|
212,187
|
|||
|
Distribution fees – Investor Class (See Note 5)
|
160,078
|
|||
|
Service fees – Investor Class (See Note 5)
|
106,718
|
|||
|
Federal and state registration fees
|
18,598
|
|||
|
Compliance expense (See Note 5)
|
15,156
|
|||
|
Reports to shareholders
|
14,470
|
|||
|
Trustees’ fees and expenses
|
11,805
|
|||
|
Audit fees
|
11,222
|
|||
|
Legal fees
|
2,783
|
|||
|
Other expenses
|
27,444
|
|||
|
Total expenses
|
2,273,689
|
|||
|
NET INVESTMENT INCOME
|
$
|
3,375,163
|
||
|
REALIZED AND UNREALIZED GAINS (LOSSES):
|
||||
|
Net realized gain on investments
|
$
|
132,724,377
|
||
|
Net change in unrealized appreciation/depreciation on investments
|
(129,618,363
|
)
|
||
|
Net gain on investments
|
3,106,014
|
|||
|
NET INCREASE IN NET ASSETS RESULTING FROM OPERATIONS
|
$
|
6,481,177
|
||
The accompanying notes are an integral part of these financial statements.
|
WWW.HENNESSYFUNDS.COM
|
10
|
STATEMENT OF OPERATIONS/STATEMENTS OF CHANGES IN NET ASSETS
|
Financial Statements
|
Statements of Changes in Net Assets
|
|
Six Months Ended
|
||||||||
|
April 30, 2022
|
Year Ended
|
|||||||
|
(Unaudited)
|
October 31, 2021
|
|||||||
|
OPERATIONS:
|
||||||||
|
Net investment income (loss)
|
$
|
3,375,163
|
$
|
(2,309,361
|
)
|
|||
|
Net realized gain on investments
|
132,724,377
|
20,131,190
|
||||||
|
Net change in unrealized
|
||||||||
|
appreciation/depreciation on investments
|
(129,618,363
|
)
|
130,334,890
|
|||||
|
Net increase in net assets resulting from operations
|
6,481,177
|
148,156,719
|
||||||
|
DISTRIBUTIONS TO SHAREHOLDERS:
|
||||||||
|
Distributable earnings – Investor Class
|
(3,694,691
|
)
|
—
|
|||||
|
Distributable earnings – Institutional Class
|
(2,816,027
|
)
|
—
|
|||||
|
Total distributions
|
(6,510,718
|
)
|
—
|
|||||
|
CAPITAL SHARE TRANSACTIONS:
|
||||||||
|
Proceeds from shares subscribed – Investor Class
|
6,259,632
|
27,799,744
|
||||||
|
Proceeds from shares subscribed – Institutional Class
|
13,249,245
|
11,595,887
|
||||||
|
Dividends reinvested – Investor Class
|
3,639,868
|
—
|
||||||
|
Dividends reinvested – Institutional Class
|
2,742,901
|
—
|
||||||
|
Cost of shares redeemed – Investor Class
|
(18,842,236
|
)
|
(81,876,744
|
)
|
||||
|
Cost of shares redeemed – Institutional Class
|
(17,517,807
|
)
|
(41,705,014
|
)
|
||||
|
Net decrease in net assets derived
|
||||||||
|
from capital share transactions
|
(10,468,397
|
)
|
(84,186,127
|
)
|
||||
|
TOTAL INCREASE (DECREASE) IN NET ASSETS
|
(10,497,938
|
)
|
63,970,592
|
|||||
|
NET ASSETS:
|
||||||||
|
Beginning of period
|
388,767,251
|
324,796,659
|
||||||
|
End of period
|
$
|
378,269,313
|
$
|
388,767,251
|
||||
|
CHANGES IN SHARES OUTSTANDING:
|
||||||||
|
Shares sold – Investor Class
|
319,917
|
1,537,236
|
||||||
|
Shares sold – Institutional Class
|
634,372
|
580,302
|
||||||
|
Shares issued to holders as reinvestment
|
||||||||
|
of dividends – Investor Class
|
184,671
|
—
|
||||||
|
Shares issued to holders as reinvestment
|
||||||||
|
of dividends – Institutional Class
|
133,150
|
—
|
||||||
|
Shares redeemed – Investor Class
|
(956,499
|
)
|
(4,659,617
|
)
|
||||
|
Shares redeemed – Institutional Class
|
(848,889
|
)
|
(2,247,525
|
)
|
||||
|
Net decrease in shares outstanding
|
(533,278
|
)
|
(4,789,604
|
)
|
||||
The accompanying notes are an integral part of these financial statements.
|
HENNESSY FUNDS
|
1-800-966-4354
|
11
Financial Statements
|
Financial Highlights
|
For an Investor Class share outstanding throughout each period
|
Six Months Ended
|
||||
|
April 30, 2022
|
||||
|
(Unaudited)
|
||||
|
PER SHARE DATA:
|
||||
|
Net asset value, beginning of period
|
$
|
19.78
|
||
|
Income from investment operations:
|
||||
|
Net investment income (loss)
|
0.16
|
(1)
|
||
|
Net realized and unrealized gains (losses) on investments
|
0.17
|
|||
|
Total from investment operations
|
0.33
|
|||
|
Less distributions:
|
||||
|
Dividends from net investment income
|
(0.34
|
)
|
||
|
Dividends from net realized gains
|
—
|
|||
|
Total distributions
|
(0.34
|
)
|
||
|
Net asset value, end of period
|
$
|
19.77
|
||
|
TOTAL RETURN
|
1.67
|
%(2)
|
||
|
SUPPLEMENTAL DATA AND RATIOS:
|
||||
|
Net assets, end of period (millions)
|
$
|
210.52
|
||
|
Ratio of expenses to average net assets
|
1.35
|
%(3)
|
||
|
Ratio of net investment income (loss) to average net assets
|
1.63
|
%(3)
|
||
|
Portfolio turnover rate(4)
|
103
|
%(2)
|
||
|
(1)
|
Calculated using the average shares outstanding method.
|
|
(2)
|
Not annualized.
|
|
(3)
|
Annualized.
|
|
(4)
|
Calculated on the basis of the Fund as a whole.
|
The accompanying notes are an integral part of these financial statements.
|
WWW.HENNESSYFUNDS.COM
|
12
|
FINANCIAL HIGHLIGHTS — INVESTOR CLASS
|
|
Year Ended October 31,
|
||||||||||||||||||
|
2021
|
2020
|
2019
|
2018
|
2017
|
||||||||||||||
|
$
|
13.27
|
$
|
12.01
|
$
|
16.87
|
$
|
22.46
|
$
|
18.37
|
|||||||||
|
(0.14
|
)(1)
|
(0.03
|
)(1)
|
(0.02
|
)(1)
|
(0.06
|
)
|
(0.15
|
)
|
|||||||||
|
6.65
|
1.29
|
(0.34
|
)
|
(1.87
|
)
|
4.36
|
||||||||||||
|
6.51
|
1.26
|
(0.36
|
)
|
(1.93
|
)
|
4.21
|
||||||||||||
|
—
|
—
|
—
|
—
|
—
|
||||||||||||||
|
—
|
—
|
(4.50
|
)
|
(3.66
|
)
|
(0.12
|
)
|
|||||||||||
|
—
|
—
|
(4.50
|
)
|
(3.66
|
)
|
(0.12
|
)
|
|||||||||||
|
$
|
19.78
|
$
|
13.27
|
$
|
12.01
|
$
|
16.87
|
$
|
22.46
|
|||||||||
|
49.06
|
%
|
10.49
|
%
|
-1.22
|
%
|
-10.54
|
%
|
23.02
|
%
|
|||||||||
|
$
|
219.58
|
$
|
188.71
|
$
|
206.11
|
$
|
338.39
|
$
|
351.16
|
|||||||||
|
1.36
|
%
|
1.37
|
%
|
1.36
|
%
|
1.31
|
%
|
1.34
|
%
|
|||||||||
|
(0.74
|
)%
|
(0.27
|
)%
|
(0.15
|
)%
|
(0.47
|
)%
|
(0.33
|
)%
|
|||||||||
|
0
|
%
|
94
|
%
|
70
|
%
|
181
|
%
|
106
|
%
|
|||||||||
The accompanying notes are an integral part of these financial statements.
|
HENNESSY FUNDS
|
1-800-966-4354
|
13
Financial Statements
|
Financial Highlights
|
For an Institutional Class share outstanding throughout each period
|
Six Months Ended
|
||||
|
April 30, 2022
|
||||
|
(Unaudited)
|
||||
|
PER SHARE DATA:
|
||||
|
Net asset value, beginning of period
|
$
|
20.66
|
||
|
Income from investment operations:
|
||||
|
Net investment income (loss)
|
0.20
|
(1)
|
||
|
Net realized and unrealized gains (losses) on investments
|
0.18
|
|||
|
Total from investment operations
|
0.38
|
|||
|
Less distributions:
|
||||
|
Dividends from net investment income
|
(0.35
|
)
|
||
|
Dividends from net realized gains
|
—
|
|||
|
Total distributions
|
(0.35
|
)
|
||
|
Net asset value, end of period
|
$
|
20.69
|
||
|
TOTAL RETURN
|
1.85
|
%(3)
|
||
|
SUPPLEMENTAL DATA AND RATIOS:
|
||||
|
Net assets, end of period (millions)
|
$
|
167.75
|
||
|
Ratio of expenses to average net assets
|
1.00
|
%(4)
|
||
|
Ratio of net investment income (loss) to average net assets
|
1.96
|
%(4)
|
||
|
Portfolio turnover rate(5)
|
103
|
%(3)
|
||
|
(1)
|
Calculated using the average shares outstanding method.
|
|
(2)
|
Amount is between $(0.005) and 0.005.
|
|
(3)
|
Not annualized.
|
|
(4)
|
Annualized.
|
|
(5)
|
Calculated on the basis of the Fund as a whole.
|
The accompanying notes are an integral part of these financial statements.
|
WWW.HENNESSYFUNDS.COM
|
14
|
FINANCIAL HIGHLIGHTS — INSTITUTIONAL CLASS
|
|
Year Ended October 31,
|
||||||||||||||||||
|
2021
|
2020
|
2019
|
2018
|
2017
|
||||||||||||||
|
$
|
13.81
|
$
|
12.46
|
$
|
17.38
|
$
|
23.07
|
$
|
18.80
|
|||||||||
|
(0.07
|
)(1)
|
0.01
|
(1)
|
0.03
|
(1)
|
(0.00
|
)(2)
|
0.02
|
||||||||||
|
6.92
|
1.34
|
(0.36
|
)
|
(1.92
|
)
|
4.38
|
||||||||||||
|
6.85
|
1.35
|
(0.33
|
)
|
(1.92
|
)
|
4.40
|
||||||||||||
|
—
|
—
|
—
|
—
|
—
|
||||||||||||||
|
—
|
—
|
(4.59
|
)
|
(3.77
|
)
|
(0.13
|
)
|
|||||||||||
|
—
|
—
|
(4.59
|
)
|
(3.77
|
)
|
(0.13
|
)
|
|||||||||||
|
$
|
20.66
|
$
|
13.81
|
$
|
12.46
|
$
|
17.38
|
$
|
23.07
|
|||||||||
|
49.60
|
%
|
10.83
|
%
|
-0.84
|
%
|
-10.22
|
%
|
23.47
|
%
|
|||||||||
|
$
|
169.19
|
$
|
136.09
|
$
|
168.79
|
$
|
329.30
|
$
|
620.38
|
|||||||||
|
0.99
|
%
|
1.01
|
%
|
1.00
|
%
|
0.95
|
%
|
0.97
|
%
|
|||||||||
|
(0.38
|
)%
|
0.09
|
%
|
0.20
|
%
|
(0.12
|
)%
|
0.04
|
%
|
|||||||||
|
0
|
%
|
94
|
%
|
70
|
%
|
181
|
%
|
106
|
%
|
|||||||||
The accompanying notes are an integral part of these financial statements.
|
HENNESSY FUNDS
|
1-800-966-4354
|
15
Financial Statements
|
Notes to the Financial Statements April 30, 2022 (Unaudited)
|
1). ORGANIZATION
The Hennessy Cornerstone Mid Cap 30 Fund (the “Fund”) is a series of Hennessy Funds Trust (the “Trust”), which was organized as a Delaware statutory trust on September 17, 1992. The Fund is an open-end management
investment company registered under the Investment Company Act of 1940, as amended. The investment objective of the Fund is long-term growth of capital. The Fund is a diversified fund.
The Fund offers Investor Class and Institutional Class shares. Each class of shares differs principally in its respective 12b-1 distribution and service, shareholder servicing, and sub-transfer
agent expenses. There are no sales charges. Each class has identical rights to earnings, assets, and voting privileges, except for class-specific expenses and exclusive rights to vote on matters affecting only one class.
As an investment company, the Fund follows the investment company accounting and reporting guidance of the Financial Accounting Standards Board (“FASB”) Accounting Standard Codification Topic 946
“Financial Services—Investment Companies.”
2). SIGNIFICANT ACCOUNTING POLICIES
The following is a summary of significant accounting policies consistently followed by the Fund in the preparation of the financial statements. These policies conform to U.S. generally accepted accounting principles
(“GAAP”).
|
a).
|
Securities Valuation – All investments in securities are valued in accordance with the Fund’s valuation policies and procedures, as described in Note 3.
|
|
b).
|
Federal Income Taxes – The Fund has elected to be taxed as a regulated investment company and intends to distribute substantially all of its taxable income to its shareholders and otherwise comply with the
provisions of the Internal Revenue Code of 1986, as amended, applicable to regulated investment companies. As a result, the Fund has made no provision for federal income taxes or excise taxes. Net investment income/loss and realized
gains/losses for federal income tax purposes may differ from those reported in the financial statements because of temporary book-basis and tax-basis differences. Temporary differences are primarily the result of the treatment of wash
sales for tax reporting purposes. The Fund recognizes interest and penalties related to income tax benefits, if any, in the Statement of Operations as an income tax expense. Distributions from net realized gains for book purposes may
include short-term capital gains, which are included as ordinary income to shareholders for tax purposes. The Fund may utilize equalization accounting for tax purposes and designate earnings and profits, including net realized gains
distributed to shareholders on redemption of shares, as part of the dividends paid deduction for income tax purposes.
|
|
c).
|
Accounting for Uncertainty in Income Taxes – The Fund has accounting policies regarding recognition and measurement of tax positions taken or expected to be taken on a tax return. The tax returns of the Fund
for the prior three fiscal years are open for examination. The Fund has reviewed all open tax years in major tax jurisdictions and concluded that there is no impact on the Fund’s net assets and no tax liability resulting from
unrecognized tax benefits relating to uncertain income tax positions taken or expected to be taken on a tax return. The Fund’s major tax jurisdictions are U.S. federal and Delaware.
|
|
WWW.HENNESSYFUNDS.COM
|
16
|
NOTES TO THE FINANCIAL STATEMENTS
|
|
d).
|
Income and Expenses – Dividend income is recognized on the ex-dividend date or as soon as information is available to the Fund. Interest income, which includes the amortization of premium and accretion of
discount, is recognized on an accrual basis. Market discounts, original issue discounts, and market premiums on debt securities are accreted or amortized to interest income over the life of a security with a corresponding increase or
decrease, as applicable, in the cost basis of such security using the yield-to-maturity method or, where applicable, the first call date of the security. Other non-cash dividends are recognized as investment income at the fair value of
the property received. The Fund is charged for those expenses that are directly attributable to its portfolio, such as advisory, administration, and certain shareholder service fees. Income, expenses (other than expenses attributable to
a specific class), and realized and unrealized gains/losses on investments are allocated to each class of shares based on such class’s net assets. Distributions received from the Fund’s investments in master limited partnerships
(“MLPs”) generally consist of ordinary income, capital gains, and return of capital. The Fund records investment income on the ex-date of the distributions. For financial statement purposes, the Fund uses return of capital and income
estimates to allocate the dividend income received. Such estimates are based on historical information available from the MLPs and other industry sources. These estimates may subsequently be revised based on information received from
the MLPs after their tax reporting periods are concluded, as the actual character of these distributions is not known until after the fiscal year end of the Fund.
|
|
e).
|
Distributions to Shareholders – Dividends from net investment income for the Fund, if any, are declared and paid annually, usually in December. Distributions of net realized capital gains, if any, are declared
and paid annually, usually in December.
|
|
f).
|
Security Transactions – Investment and shareholder transactions are recorded on the trade date. The Fund determines the realized gain/loss from an investment transaction by comparing the original cost of the
security lot sold with the net sale proceeds. Discounts and premiums on securities purchased are accreted or amortized, respectively, over the life of each such security.
|
|
g).
|
Use of Estimates – Preparing financial statements in accordance with GAAP requires management to make estimates and assumptions that affect the reported amounts of assets and liabilities and disclosure of
contingent assets and liabilities at the date of the financial statements, as well as the reported change in net assets during the reporting period. Actual results could differ from those estimates.
|
|
h).
|
Share Valuation – The net asset value (“NAV”) per share of the Fund is calculated by dividing (i) the total value of the securities held by the Fund, plus cash and other assets, minus all liabilities
(including estimated accrued expenses) by (ii) the total number of Fund shares outstanding, rounded to the nearest $0.01. Fund shares are not priced on days the New York Stock Exchange is closed for trading. The offering and redemption
price per share for the Fund is equal to the Fund’s NAV per share.
|
|
i).
|
Recent Accounting Pronouncements and Regulatory Updates – In October 2020, the Securities and Exchange Commission (“SEC”) adopted new regulations governing the use of derivatives by registered investment
companies (“Rule 18f-4”). Rule 18f-4 imposes limits on the amount of derivatives a fund can enter into, eliminates the asset segregation framework currently used by funds to comply with Section 18 of the 1940 Act, and requires funds
whose use of derivatives is greater than a limited specified amount to establish and maintain a comprehensive derivatives risk management program and appoint a derivatives risk manager. Funds are required to
|
|
HENNESSY FUNDS
|
1-800-966-4354
|
17
|
comply with Rule 18f-4 by August 19, 2022. The impact, if any, that Rule 18f-4 will have on the availability, liquidity, and performance of derivatives is unclear. Management is currently evaluating the
potential impact of Rule 18f-4 on the Fund. When fully implemented, Rule 18f-4 may require changes in how the Fund uses derivatives, adversely affect the Fund’s performance, and increase costs related to the Fund’s use of derivatives.
|
|
|
In December 2020, the SEC adopted a new rule providing a framework for fund valuation practices (“Rule 2a-5”). Rule 2a-5 establishes
requirements for determining fair value in good faith for purposes of the 1940 Act. Rule 2a-5 permits fund boards to designate certain parties to perform fair value determinations, subject to board oversight and certain other
conditions. Rule 2a-5 also defines when market quotations are “readily available” for purposes of the 1940 Act and the threshold for determining whether a fund must fair value a security. In connection with Rule 2a-5, the SEC also
adopted related recordkeeping requirements and is rescinding previously issued guidance, including with respect to the role of a board in determining fair value and the accounting and auditing of fund investments. Funds must comply with
the rules by September 8, 2022. Management is currently assessing the potential impact of the new rules on the Fund’s financial statements.
|
3). SECURITIES VALUATION
The Fund follows its valuation policies and procedures in determining its net asset value and, in preparing these financial statements, the fair value accounting standards that establish an authoritative definition of
fair value and set out a hierarchy for measuring fair value. These standards require additional disclosures about the various inputs and valuation techniques used to develop the measurements of fair value and a discussion of changes in
valuation techniques and related inputs during the period. These inputs are summarized in the three broad levels listed below:
|
Level 1 –
|
Unadjusted, quoted prices in active markets for identical instruments that the Fund has the ability to access at the date of measurement.
|
|
|
Level 2 –
|
Other significant observable inputs (including, but not limited to, quoted prices in active markets for similar instruments, quoted prices in markets that are not active for identical or similar instruments,
and model-derived valuations in which all significant inputs and significant value drivers are observable in active markets, such as interest rates, prepayment speeds, credit risk curves, default rates, and similar data).
|
|
|
Level 3 –
|
Significant unobservable inputs (including the Fund’s own assumptions about what market participants would use to price the asset or liability based on the best available information) when observable inputs
are unavailable.
|
The following is a description of the valuation techniques applied to the Fund’s major categories of assets and liabilities on a recurring basis:
|
Equity Securities – Equity securities, including common stocks, preferred stocks, exchange-traded funds, closed-end mutual funds, partnerships, rights, MLPs, and real
estate investment trusts, that are traded on a securities exchange for which a last-quoted sales price is readily available generally are valued at the last sales price as reported by the primary exchange on which the securities are
listed. Securities listed on The Nasdaq Stock Market (“Nasdaq”) generally are valued at the Nasdaq Official Closing Price, which may differ from the last sales price reported. Securities traded on a securities exchange for which a
last-quoted sales price is not readily available generally are valued at the mean between the bid and ask prices. To the extent these
|
|
WWW.HENNESSYFUNDS.COM
|
18
|
NOTES TO THE FINANCIAL STATEMENTS
|
|
securities are actively traded and valuation adjustments are not applied, they are classified in Level 1 of the fair value hierarchy.
|
|
|
Registered Investment Companies – Investments in open-end registered investment companies, commonly referred to as mutual funds, generally are priced at the ending NAV
provided by the applicable mutual fund’s service agent and are classified in Level 1 of the fair value hierarchy.
|
|
|
Debt Securities – Debt securities, including corporate bonds, asset-backed securities, mortgage-backed securities, municipal bonds, U.S. Treasuries, and U.S. government
agency issues, are generally valued at market on the basis of valuations furnished by an independent pricing service that utilizes both dealer-supplied valuations and formula-based techniques. The pricing service may consider recently
executed transactions in securities of the issuer or comparable issuers, market price quotations (where observable), bond spreads, and fundamental data relating to the issuer. In addition, the model may incorporate observable market
data, such as reported sales of similar securities, broker quotes, yields, bids, offers, and reference data. Certain securities are valued primarily using dealer quotations. These securities are generally classified in Level 2 of the
fair value hierarchy.
|
|
|
Short-Term Securities – Short-term equity investments, including money market funds, are valued in the manner specified above for equity securities. Short-term debt
investments with an original term to maturity of 60 days or less are valued at amortized cost, which approximates fair market value. If the original term to maturity of a short-term debt investment exceeds 60 days, then the values as of
the 61st day prior to maturity are amortized. Amortized cost is not used if its use would be inappropriate due to credit or other impairments of the issuer, in which case the security’s fair value would be determined as described below.
Short-term securities are generally classified in Level 1 or Level 2 of the fair value hierarchy depending on the inputs used and market activity levels for specific securities.
|
The Board of Trustees of the Fund (the “Board”) has adopted fair value pricing procedures that are followed when a price for a security is not readily available or if a significant event has
occurred that indicates the closing price of a security no longer represents the true value of that security. Fair value pricing determinations are made in good faith in accordance with these procedures. There are numerous criteria considered
in determining a fair value of a security, such as the trading volume of a security and markets, the values of other similar securities, and news events with direct bearing on a security or markets. Fair value pricing results in an estimated
price for a security that reflects the amount the Fund might reasonably expect to receive in a current sale. Depending on the relative significance of the valuation inputs, these securities may be classified in either Level 2 or Level 3 of the
fair value hierarchy.
The Board has delegated day-to-day valuation matters to the Valuation and Liquidity Committee comprising representatives from Hennessy Advisors, Inc., the Fund’s investment advisor (the “Advisor”).
The function of the Valuation and Liquidity Committee, among other things, is to value securities where current and reliable market quotations are not readily available. All actions taken by the Valuation and Liquidity Committee are reviewed by
the Board.
The Fund has performed an analysis of all existing investments to determine the significance and character of all inputs to their fair value determinations. Various inputs are used to determine the
value of the Fund’s investments. The inputs or methodology used for valuing securities are not necessarily an indication of the risk associated with investing in those securities. Details related to the fair value hierarchy of the Fund’s
securities as of April 30, 2022, are included in the Schedule of Investments.
|
HENNESSY FUNDS
|
1-800-966-4354
|
19
4). INVESTMENT TRANSACTIONS
Purchases and sales of investment securities (excluding government and short-term investments) for the Fund during the six months ended April 30, 2022, were $386,614,474 and $390,498,574, respectively.
There were no purchases or sales/maturities of long-term U.S. government securities for the Fund during the six months ended April 30, 2022.
5). INVESTMENT ADVISORY FEE AND OTHER TRANSACTIONS WITH AFFILIATES
The Advisor provides the Fund with investment advisory services under an Investment Advisory Agreement. The Advisor furnishes all investment advice, office space, and facilities and most of the personnel needed by the
Fund. As compensation for its services, the Advisor is entitled to a monthly fee from the Fund. The fee is based on the average daily net assets of the Fund at an annual rate of 0.74%. The net investment advisory fees expensed by the Fund
during the six months ended April 30, 2022, are included in the Statement of Operations.
The Board has approved a Shareholder Servicing Agreement for Investor Class shares of the Fund, which compensates the Advisor for the non-investment advisory services it provides to the Fund. The
Shareholder Servicing Agreement provides for a monthly fee paid to the Advisor at an annual rate of 0.10% of the average daily net assets of the Fund attributable to Investor Class shares. The shareholder service fees expensed by the Fund
during the six months ended April 30, 2022, are included in the Statement of Operations.
The Fund has adopted a plan pursuant to Rule 12b-1 under the Investment Company Act of 1940, as amended, that authorizes payments in connection with the distribution of Fund shares at an annual rate
of up to 0.25% of the Fund’s average daily net assets attributable to Investor Class shares. Even though the authorized rate is up to 0.25%, the Fund is currently only using up to 0.15% of its average daily net assets attributable to Investor
Class shares for such purpose. Amounts paid under the plan may be spent on any activities or expenses primarily intended to result in the sale of shares, including, but not limited to, advertising, shareholder account servicing, printing and
mailing of prospectuses to other than current shareholders, printing and mailing of sales literature, and compensation for sales and marketing activities or to financial institutions and others, such as dealers and distributors. The
distribution fees expensed by the Fund during the six months ended April 30, 2022, are included in the Statement of Operations.
The Fund has entered into agreements with various brokers, dealers, and financial intermediaries in connection with the sale of Fund shares. The agreements provide for periodic payments of
sub-transfer agent expenses by the Fund to the brokers, dealers, and financial intermediaries for providing certain shareholder maintenance services. These shareholder services include the pre-processing and quality control of new accounts,
shareholder correspondence, answering customer inquiries regarding account status, and facilitating shareholder telephone transactions. The sub-transfer agent fees expensed by the Fund during the six months ended April 30, 2022, are included in
the Statement of Operations.
U.S. Bancorp Fund Services, LLC, d/b/a U.S. Bank Global Fund Services (“Fund Services”) provides the Fund with administrative, accounting, and transfer agent services. As administrator, Fund
Services is responsible for activities such as (i) preparing various federal and state regulatory filings, reports, and returns for the Fund, (ii) preparing reports and materials to be supplied to the Board, (iii) monitoring the activities of
the Fund’s custodian, transfer agent, and accountants, and (iv) coordinating the preparation and payment of the Fund’s expenses and reviewing the Fund’s expense accruals. U.S. Bank N.A., an affiliate of Fund Services, serves as the Fund’s
custodian. The servicing
|
WWW.HENNESSYFUNDS.COM
|
20
|
NOTES TO THE FINANCIAL STATEMENTS
|
agreements between the Trust, Fund Services, and U.S. Bank N.A. contain a fee schedule that is inclusive of administrative, accounting, custody, and transfer agent fees. The administrative, accounting, custody, and
transfer agent fees expensed by the Fund during the six months ended April 30, 2022, are included in the Statement of Operations.
Quasar Distributors, LLC (“Quasar”), a wholly owned broker-dealer subsidiary of Foreside Financial Group, LLC, acts as the Fund’s principal underwriter in a continuous public offering of Fund
shares.
The officers of the Fund are affiliated with the Advisor. With the exception of the Chief Compliance Officer and the Senior Compliance Officer, such officers receive no compensation from the Fund
for serving in their respective roles. The Fund, along with the other funds in the Hennessy Funds family (collectively, the “Hennessy Funds”), makes reimbursement payments on an equal basis to the Advisor for a portion of the salary and
benefits associated with the office of the Chief Compliance Officer and for all of the salary and benefits associated with the office of the Senior Compliance Officer. The compliance fees expensed by the Fund during the six months ended April
30, 2022, are included in the Statement of Operations.
6). GUARANTEES AND INDEMNIFICATIONS
Under the Hennessy Funds’ organizational documents, their officers and trustees are indemnified by the Hennessy Funds against certain liabilities arising out of the performance of their duties to the Hennessy Funds.
Additionally, in the normal course of business, the Hennessy Funds enter into contracts with service providers that contain general indemnification clauses. The Fund’s maximum exposure under these arrangements is unknown as this would involve
future claims that may be made against the Fund that have not yet occurred. Currently, the Fund expects the risk of loss to be remote.
7). LINE OF CREDIT
The Fund has an uncommitted line of credit with the other Hennessy Funds in the amount of the lesser of (i) $100,000,000 or (ii) 33.33% of each Hennessy Fund’s net assets, or 30% for the Hennessy Gas Utility Fund and
10% for the Hennessy Balanced Fund. The line of credit is intended to provide any necessary short-term financing in connection with shareholder redemptions, subject to certain restrictions. The credit facility is with the Hennessy Funds’
custodian bank, U.S. Bank N.A. Borrowings under this arrangement bear interest at the bank’s prime rate and are secured by all of the Fund’s assets (as to its own borrowings only). During the six months ended April 30, 2022, the Fund did not
have any borrowings outstanding under the line of credit.
8). FEDERAL TAX INFORMATION
As of October 31, 2021, the Fund’s most recent fiscal year end, the components of accumulated earnings (losses) for income tax purposes were as follows:
|
Investments
|
|||||
|
Cost of investments for tax purposes
|
$
|
259,999,096
|
|||
|
Gross tax unrealized appreciation
|
$
|
139,260,695
|
|||
|
Gross tax unrealized depreciation
|
(9,906,846
|
)
|
|||
|
Net tax unrealized appreciation/(depreciation)
|
$
|
129,353,849
|
|||
|
Undistributed ordinary income
|
$
|
—
|
|||
|
Undistributed long-term capital gains
|
—
|
||||
|
Total distributable earnings
|
$
|
—
|
|||
|
Other accumulated gain/(loss)
|
$
|
(33,268,734
|
)
|
||
|
Total accumulated gain/(loss)
|
$
|
96,085,115
|
|||
|
HENNESSY FUNDS
|
1-800-966-4354
|
21
The difference between book-basis unrealized appreciation/depreciation and tax-basis unrealized appreciation/depreciation (as shown above) is attributable primarily to wash sales.
As of October 31, 2021, the Fund had $1,788,004 in unlimited long-term and $29,422,950 in unlimited short-term capital loss carryforwards. During fiscal year 2021, the capital losses utilized by the
Fund were $20,127,731.
Capital losses sustained in or after fiscal year 2012 can be carried forward indefinitely, but any such loss retains the character of the original loss and must be utilized prior to any loss
incurred before fiscal year 2012. As a result of this ordering rule, capital loss carryforwards incurred prior to fiscal year 2012 may be more likely to expire unused. Capital losses sustained prior to fiscal year 2012 can be carried forward
for eight years and can be carried forward as short-term capital losses regardless of the character of the original loss.
As of October 31, 2021, the Fund deferred, on a tax basis, a late-year ordinary loss of $2,057,780. Late-year ordinary losses are net ordinary losses incurred after December 31, 2020, but within the
taxable year, that are deemed to arise on the first day of the Fund’s next taxable year.
During fiscal year 2022 (year to date) and fiscal year 2021, the tax character of distributions paid by the Fund was as follows:
|
Six Months Ended
|
Year Ended
|
||||||||
|
April 30, 2022
|
October 31, 2021
|
||||||||
|
Ordinary income(1)
|
$
|
6,510,718
|
$
|
—
|
|||||
|
Long-term capital gains
|
—
|
—
|
|||||||
|
Total distributions
|
$
|
6,510,718
|
$
|
—
|
|||||
|
(1) Ordinary income includes short-term capital gains.
|
9). EVENTS SUBSEQUENT TO PERIOD END
Management has evaluated the Fund’s related events and transactions that occurred subsequent to April 30, 2022, through the date of issuance of the Fund’s financial statements. Management has determined that there
were no subsequent events requiring recognition or disclosure in the financial statements.
|
WWW.HENNESSYFUNDS.COM
|
22
|
NOTES TO THE FINANCIAL STATEMENTS/EXPENSE EXAMPLE
|
Expense Example (Unaudited)
April 30, 2022
As a shareholder of the Fund, you incur ongoing costs, including management fees, service fees, and other Fund expenses. This Example is intended to help you understand your ongoing costs (in dollars) of investing in
the Fund and to compare these costs with the ongoing costs of investing in other mutual funds. The Example is based on an investment of $1,000 invested at the beginning of the period and held for the entire period from November 1, 2021, through
April 30, 2022.
Actual Expenses
In the table below, the first line under each of the “Investor Class” and “Institutional Class” headings provides information about actual account values and actual expenses for each share class. You may use this
information, together with the amount you invested, to estimate the expenses that you paid over the period. Simply divide your account value by $1,000 (for example, an $8,600 account value divided by $1,000 = 8.6), then multiply the result by
the number in the first line under the heading “Expenses Paid During Period” to estimate the expenses you paid on your account during this period. Although the Fund charges no sales loads or transaction fees, you will be assessed fees for
outgoing wire transfers, returned checks, and stop payment orders at prevailing rates charged by U.S. Bank Global Fund Services, the Fund’s transfer agent. If you request that a redemption be made by wire transfer, the Fund’s transfer agent
charges a $15 fee. IRAs are charged a $15 annual maintenance fee (up to $30 maximum per shareholder for shareholders with multiple IRAs). The examples below include, but are not limited to, management, shareholder servicing, accounting,
custody, and transfer agent fees. However, the examples below do not include portfolio trading commissions and related expenses.
Hypothetical Example for Comparison Purposes
In the table below, the second line under each of the “Investor Class” and “Institutional Class” headings provides information about hypothetical account values and hypothetical expenses based on the Fund’s actual
expense ratio for each share class and an assumed rate of return of 5% per year before expenses, which is not the Fund’s actual return for such share class. The hypothetical account values and expenses may not be used to estimate the actual
ending account balance or expenses you paid for the period. You may use this information to compare the ongoing costs of investing in the Fund and other funds. To do so, compare these 5% hypothetical examples with the 5% hypothetical examples
that appear in the shareholder reports of the other funds. Please note that the expenses shown in the table are meant to highlight your ongoing costs only. Therefore, the second lines under “Investor Class” and “Institutional Class” are useful
in comparing ongoing costs only and will not help you determine the relative total costs of owning different funds.
|
HENNESSY FUNDS
|
1-800-966-4354
|
23
|
Beginning
|
Ending
|
||
|
Account Value
|
Account Value
|
Expenses Paid
|
|
|
November 1, 2021
|
April 30, 2022
|
During Period(1)
|
|
|
Investor Class
|
|||
|
Actual
|
$1,000.00
|
$1,016.70
|
$6.75
|
|
Hypothetical (5% return before expenses)
|
$1,000.00
|
$1,018.10
|
$6.76
|
|
Institutional Class
|
|||
|
Actual
|
$1,000.00
|
$1,018.50
|
$5.00
|
|
Hypothetical (5% return before expenses)
|
$1,000.00
|
$1,019.84
|
$5.01
|
|
(1)
|
Expenses are equal to the Fund’s annualized expense ratio of 1.35% for Investor Class shares or 1.00% for Institutional Class shares, as applicable, multiplied by the average account value over the period,
multiplied by 181/365 days (to reflect the half-year period).
|
|
WWW.HENNESSYFUNDS.COM
|
24
|
EXPENSE EXAMPLE — ELECTRONIC DELIVERY
|
How to Obtain a Copy of the Fund’s Proxy
Voting Policy and Proxy Voting Records
A description of the policies and procedures the Fund uses to determine how to vote proxies relating to portfolio securities is available without charge (1) by calling 800-966-4354, (2) on the Hennessy Funds’ website
at www.hennessyfunds.com/proxy-voting/voting-policy, or (3) on the U.S. Securities and Exchange Commission’s (the “SEC”) website at www.sec.gov. The Fund’s proxy voting record is available without charge on both the Hennessy Funds’ website at
www.hennessyfunds.com/proxy-voting/voting-record and the SEC’s website at www.sec.gov no later than August 31 for the prior 12 months ending June 30.
Availability of Quarterly Portfolio Schedule
The Fund files its complete schedule of portfolio holdings with the SEC for the first and third quarters of each fiscal year as an exhibit to its reports on Form N-PORT. The Fund’s Form N-PORT reports are available on
the SEC’s website at www.sec.gov or on request by calling 800-966-4354.
Important Notice Regarding Delivery
of Shareholder Documents
To help keep the Fund’s costs as low as possible, we generally deliver a single copy of shareholder reports, proxy statements, and prospectuses to shareholders who share an address and have the same last name. This
process does not apply to account statements. You may request an individual copy of a shareholder document at any time. If you would like to receive separate mailings of shareholder documents, please call U.S. Bank Global Fund Services at
800-261-6950 or 414-765-4124, and individual delivery will begin within 30 days of your request. If your account is held through a financial institution or other intermediary, please contact such intermediary directly to request individual
delivery.
Electronic Delivery
As permitted by SEC regulations, the Fund’s shareholder reports are made available on a website, and unless you sign up for eDelivery or elect to receive paper copies as detailed below, you will be notified each time
a report is posted and provided with a website link to access the report.
The Fund also offers shareholders the option to receive all notices, account statements, prospectuses, tax forms, and shareholder reports electronically. To sign up for eDelivery or change your
delivery preference, please visit www.hennessyfunds.com/account.
To elect to receive paper copies of all future reports free of charge, please call U.S. Bank Global Fund Services at 800-261-6950 or 414-765-4124.
Subscribe to receive our team’s unique market and sector insights delivered to your inbox
www.hennessyfunds.com/subscribe
Follow us on social media
| |
|
|
HENNESSY FUNDS
|
1-800-966-4354
|
25
Board Approval of Investment Advisory
Agreement
At its meeting on March 11, 2022, the Board of Trustees of the Fund (the “Board,” and the members thereof, the “Trustees”) unanimously approved the continuation of the investment advisory agreement of the Fund with
Hennessy Advisors, Inc. (the “Advisor”). As part of the process, the Trustees reviewed their fiduciary duties and the relevant factors for them to consider with respect to approving the advisory agreement. In addition, the Trustees who are not
deemed “interested persons” (as defined by the Investment Company Act of 1940, as amended) of the Fund (the “Independent Trustees”) met in executive session to discuss the approval of the advisory agreement. As part of their discussion, the
Independent Trustees confirmed their understanding of the need to have asked about, and received answers to, any matters that they believed are relevant to determining whether to approve the continuation of the advisory agreement.
In advance of the meeting, the Advisor sent detailed information to the Trustees to assist them in their evaluation of the advisory agreement. This information included, but was not limited to, the
following:
|
(1)
|
A memorandum from outside legal counsel that described the fiduciary duties of the Board with respect to approving the continuation of the advisory agreement and the relevant factors for consideration;
|
|
|
(2)
|
A memorandum from the Advisor that listed the factors relevant to the Board’s approval of the continuation of the advisory agreement and also referenced the documents that had been provided to help the Board
assess each such factor;
|
|
|
(3)
|
The Advisor’s financial statements from its most recent Form 10-K and Form 10-Q;
|
|
|
(4)
|
A summary of the advisory agreement;
|
|
|
(5)
|
A recent Fund fact sheet, which included, among other things, Fund performance over various periods;
|
|
|
(6)
|
A description of the range of services provided by the Advisor;
|
|
|
(7)
|
A peer expense comparison of the net expense ratio and investment advisory fee of the Fund; and
|
|
|
(8)
|
A memorandum from the Advisor regarding economies of scale.
|
The Trustees reviewed and discussed all of the information provided by the Advisor. Following this review, and further discussion with the Advisor, the Trustees concluded that the information
provided before and at the meeting addressed all of the relevant matters that they wanted to consider in assessing the performance of the Funds and the performance of the Advisor under the advisory agreement, and that said information provided
them with a fulsome understanding of the advisory agreement and the services provided by the Advisor.
All of the factors discussed were considered as a whole by the Trustees, as well as by the Independent Trustees meeting in executive session. The Trustees viewed the relevant factors in their
totality, with no single factor being the principal or determinative factor in the Trustees’ determination of whether to approve the continuation of the advisory agreement. The Trustees recognized that the management and fee arrangements for
the Fund are the result of years of review and discussion between the Independent Trustees and the Advisor, that certain aspects of such arrangements may receive greater scrutiny in some years than in others, and that the Trustees’ conclusions
may be based, in part, on
|
WWW.HENNESSYFUNDS.COM
|
26
|
BOARD APPROVAL OF INVESTMENT ADVISORY AGREEMENT
|
their consideration of these same arrangements and information received during the course of the year and in prior years.
Prior to approving the continuation of the advisory agreement, the Trustees, including the Independent Trustees in executive session, considered, among other items:
|
(1)
|
The nature and quality of the advisory services provided by the Advisor;
|
|
|
(2)
|
A comparison of the fees and expenses of the Fund to other similar funds;
|
|
|
(3)
|
Whether economies of scale are recognized by the Fund;
|
|
|
(4)
|
The costs and profitability of the Fund to the Advisor;
|
|
|
(5)
|
The performance of the Fund; and
|
|
|
(6)
|
Any benefits to the Advisor from serving as an investment advisor to the Fund (other than the advisory fee).
|
The material considerations and determinations of the Trustees, including the Independent Trustees, were as follows:
|
(1)
|
The Trustees considered the services identified below that are provided by the Advisor. Based on this review and an assessment of the Advisor’s performance, the Trustees concluded that the Advisor provides
high-quality services to the Fund, and they noted that their overall confidence in the Advisor was high. The Trustees also concluded that they were satisfied with the nature, extent, and quality of the advisory services provided to the
Fund by the Advisor and that the nature and extent of the services provided by the Advisor were appropriate to assure that the Fund’s operations are conducted in compliance with applicable laws, rules, and regulations.
|
|
(a)
|
The Advisor acts as the portfolio manager for the Fund. In this capacity, the Advisor does the following:
|
|
(i)
|
manages the composition of the Fund’s portfolio, including the purchase, retention, and disposition of portfolio securities in accordance with the Fund’s investment objectives, policies, and restrictions;
|
|||
|
(ii)
|
seeks best execution for the Fund’s portfolio;
|
|||
|
(iii)
|
manages the use of soft dollars for the Fund; and
|
|||
|
(iv)
|
manages proxy voting for the Fund.
|
|
(b)
|
The Advisor performs a daily reconciliation of portfolio positions and cash for the Fund.
|
||
|
(c)
|
The Advisor monitors the liquidity of each Fund.
|
||
|
(d)
|
The Advisor monitors the Fund’s compliance with its investment objectives and restrictions and federal securities laws.
|
||
|
(e)
|
The Advisor maintains a compliance program (including a code of ethics), conducts ongoing reviews of the compliance programs of the Fund’s service providers (including their codes of ethics, as appropriate),
conducts on-site visits to the Fund’s service providers, as feasible, monitors incidents of abusive trading practices, reviews Fund expense accruals, payments, and fixed expense ratios, evaluates insurance providers for fidelity bond,
D&O/E&O insurance, and cybersecurity insurance coverage, manages regulatory examination compliance and responses, conducts employee compliance training, reviews reports provided by service providers, and maintains books and
records.
|
|
HENNESSY FUNDS
|
1-800-966-4354
|
27
|
(f)
|
The Advisor oversees service providers that provide accounting, administration, distribution, transfer agency, custodial, sales, marketing, public relations, audit, information technology, and legal services
to the Fund.
|
||
|
(g)
|
The Advisor maintains in-house marketing and distribution departments on behalf of the Fund.
|
||
|
(h)
|
The Advisor prepares or directs the preparation of all regulatory filings for the Fund, including writing and annually updating the Fund’s prospectus and related documents.
|
||
|
(i)
|
For each annual report of the Fund, the Advisor prepares a written summary of the Fund’s performance during the most recent 12-month period.
|
||
|
(j)
|
The Advisor oversees distribution of the Fund through third-party broker/dealers and independent financial institutions such as Charles Schwab, Inc., Fidelity, TD Ameritrade, and Pershing. The Advisor
participates in “no transaction fee” (“NTF”) programs with these companies on behalf of the Fund, which allow customers to purchase the Fund through third-party distribution channels without paying a transaction fee. The Advisor
compensates, in part, a number of these third-party providers of NTF programs out of its own revenues.
|
||
|
(k)
|
The Advisor pays the incentive compensation of the Fund’s compliance officers and employs other staff, such as legal, marketing, national accounts, distribution, sales, administrative, and trading oversight
personnel, as well as management executives.
|
||
|
(l)
|
The Advisor provides a quarterly compliance certification to the Board.
|
||
|
(m)
|
The Advisor prepares or reviews all Board materials, presents to and leads discussions with the Board, prepares or reviews all meeting minutes, and arranges for Board training and education.
|
|
(2)
|
The Trustees compared the performance of the Fund to benchmark indices over various periods and noted that the Trustees review and discuss reports comparing the investment performance of the Fund to various
indices at each quarterly Board meeting. Based on such information, the Trustees determined that the Advisor manages the Fund in a manner materially consistent with its stated investment objective and style. The Trustees concluded that
the performance of the Fund over various periods warranted the continuation of the advisory agreement.
|
|
|
(3)
|
The Trustees reviewed the advisory fees and overall expense ratios of the Fund compared to other funds similar in asset size and investment objective to the Fund using data from Morningstar. As part of the
discussion with management, the Trustees ensured that they understood and were comfortable with the criteria used to determine the mutual funds included in the Morningstar categories for purposes of the materials considered at the
meeting. The Trustees determined that the advisory fee and overall expense ratio of the Fund falls within a reasonable range of the advisory fees and overall expense ratios of other comparable funds and concluded that they are
reasonable and warranted continuation of the advisory agreement.
|
|
|
(4)
|
The Trustees also considered whether the Advisor was realizing economies of scale that should be shared with the Fund’s shareholders. The Trustees noted that the majority of expenses incurred to manage the
Fund are variable
|
|
WWW.HENNESSYFUNDS.COM
|
28
|
BOARD APPROVAL OF INVESTMENT ADVISORY AGREEMENT
|
|
asset-based fees, so the Advisor does not realize material economies of scale relating to these expenses as the assets of the Fund increase. For example, third-party platform fees increase as the Fund’s assets
grow.
|
||
|
(5)
|
The Trustees considered the profitability of the Advisor, including the impact of mutual fund platform fees on the Advisor’s profitability, and also considered the resources and revenues that the Advisor has
put into managing and distributing the Fund. The Trustees then concluded that the profits of the Advisor are reasonable and not excessive when compared to profitability guidelines set forth in relevant court cases.
|
|
|
(6)
|
The Trustees considered the high level of professionalism and knowledge of the Advisor’s employees and concluded that this was beneficial to the Fund and its shareholders.
|
|
|
(7)
|
The Trustees considered any benefits to the Advisor from serving as an advisor to the Fund (other than the advisory fee). The Trustees noted that the Advisor may derive ancillary benefits from, by way of
example, its association with the Fund in the form of proprietary and third-party research products and services received from broker-dealers that execute portfolio trades for the Fund. The Trustees determined that any such products and
services have been used for legitimate purposes relating to the Fund by providing assistance in the investment decision-making process. The Trustees concluded that any additional benefits realized by the Advisor from its relationship
with the Fund were reasonable, which was based on, among other things, the Trustees’ finding that the research, analytical, statistical, and other information and services provided by brokers are merely supplemental to the Advisor’s own
efforts in the performance of its duties under the advisory agreement.
|
After reviewing the materials and information provided at the meeting, as well as other information regularly provided at the Board’s quarterly meetings throughout the year regarding the quality
of services provided by the Advisor, the performance of the Fund, expense information, brokerage commissions information, the adequacy and efficacy of the Advisor’s written policies and procedures, other regulatory compliance issues, trading
information and related matters, and other factors that the Trustees deemed relevant, the Trustees, including the Independent Trustees, approved the continuation of the advisory agreement.
|
HENNESSY FUNDS
|
1-800-966-4354
|
29
For information, questions, or assistance, please call
The Hennessy Funds
800-966-4354 or 415-899-1555
INVESTMENT ADVISOR
Hennessy Advisors, Inc.
7250 Redwood Boulevard, Suite 200
Novato, California 94945
ADMINISTRATOR,
TRANSFER AGENT,
DIVIDEND PAYING AGENT, &
SHAREHOLDER SERVICING AGENT
U.S. Bancorp Fund Services, LLC
d/b/a U.S. Bank Global Fund Services
P.O. Box 701
Milwaukee, Wisconsin 53201-0701
CUSTODIAN
U.S. Bank N.A.
Custody Operations
1555 North River Center Drive, Suite 302
Milwaukee, Wisconsin 53212
TRUSTEES
Neil J. Hennessy
J. Dennis DeSousa
Robert T. Doyle
Claire Garvie
Gerald P. Richardson
COUNSEL
Foley & Lardner LLP
777 East Wisconsin Avenue
Milwaukee, Wisconsin 53202-5306
INDEPENDENT REGISTERED
PUBLIC ACCOUNTING FIRM
Tait, Weller & Baker LLP
Two Liberty Place
50 South 16th Street, Suite 2900
Philadelphia, Pennsylvania 19102-2529
DISTRIBUTOR
Quasar Distributors, LLC
111 East Kilbourn Avenue, Suite 1250
Milwaukee, Wisconsin 53202
www.hennessyfunds.com | 800-966-4354
This report has been prepared for shareholders and may be distributed to
others only if preceded or accompanied by a current prospectus.
SEMI-ANNUAL REPORT
APRIL 30, 2022
HENNESSY CORNERSTONE LARGE GROWTH FUND
Investor Class HFLGX
Institutional Class HILGX
www.hennessyfunds.com | 1-800-966-4354
(This Page Intentionally Left Blank.)
Contents
|
Letter to Shareholders
|
2
|
|
Performance Overview
|
4
|
|
Financial Statements
|
|
|
Schedule of Investments
|
5
|
|
Statement of Assets and Liabilities
|
9
|
|
Statement of Operations
|
10
|
|
Statements of Changes in Net Assets
|
11
|
|
Financial Highlights
|
12
|
|
Notes to the Financial Statements
|
16
|
|
Expense Example
|
23
|
|
Proxy Voting Policy and Proxy Voting Records
|
25
|
|
Availability of Quarterly Portfolio Schedule
|
25
|
|
Federal Tax Distribution Information
|
25
|
|
Important Notice Regarding Delivery of Shareholder Documents
|
25
|
|
Electronic Delivery
|
25
|
|
Board Approval of Investment Advisory Agreement
|
26
|
|
HENNESSY FUNDS
|
1-800-966-4354
|
May 2022
Dear Hennessy Funds Shareholder:
We’d like to start our semi-annual letter with a pause. At the end of 2021, we looked forward to a new year – a potentially calmer year – having come through almost two full
years of the coronavirus pandemic. As people, we were aware our lives had changed, but we hoped for a better 2022; as investors, we were aware that the economy was strong and employment was robust, yet challenges loomed, including inflation,
supply chain disruptions, and tightening monetary policy; as employees, students, and family members, we recognized much was different, but we sought a return to what’s familiar. What we didn’t know was that a world leader who controls one of
the largest militaries on the planet was about to start one of the worst atrocities in Europe since World War II. Our thoughts are with the Ukrainian people, and our hope is for this unjustified, senseless human tragedy to end quickly.
The equity market started 2022 on a high note, with the S&P 500® Index hitting an all-time high on the first trading day of the year. This turned out to be the last hurrah for a market that saw a continuous march higher in 2021, having hit 70 new
all-time highs, with a new all-time high being recorded on average every three and a half days. Concerns in the market then coalesced and overpowered bullish sentiment, and the market has spiraled lower throughout 2022. Factors that drove the
market lower include: tightening monetary policy as the Federal Reserve has begun raising rates and has announced plans for shrinking its $8.5 trillion asset portfolio; inflation, higher energy costs, and their effects on the domestic and
global economies; continued supply chain disruptions; investors’ indiscriminate liquidation of broad-based ETFs and index funds and the detrimental effect on equities; and the near-term and long-term global implications of the Russian
invasion of Ukraine.
While markets are adjusting, many positive conditions remain intact. Corporate balance sheets and profits remain strong, GDP growth remains positive, the
consumer continues to show resilience in the face of rising prices, cash is abundant both at the corporate and household levels, unemployment is exceptionally low, and our financial system remains healthy. Markets are also experiencing a
change in leadership, as value stocks have been outperforming growth stocks, and traditionally defensive sectors such as Utilities and Consumer Staples have been outperforming the broader market. Finally, the Energy sector has soared in 2022,
as companies reap the benefits of dramatically higher oil and natural gas prices, and shareholders are rewarded with significantly higher dividends, aggressive buybacks, and higher stock prices after many years of underperformance for the
sector.
With history as our guide, we are hopeful that eventually the market may bottom and head higher again. Since the financial crisis of 2008, we have
experienced many corrections and many recoveries to new highs. The Dow Jones Industrial Average has dropped over 10% eight times, including the current drop, for a median decline of 14.00%, and on average, it took 45 trading days to drop from
peak to trough and 127 trading days to return to the previous peak. Since the current drop has taken longer to go from peak to its recent trough, it may take some time for a recovery in prices to truly take hold.
On a positive note, valuations have come in, and many stocks have become more attractive, especially for longer-term investors. We note, however, that the
concept of “historically cheap stocks” does not, on its own, move the market higher. Rather, it is
|
WWW.HENNESSYFUNDS.COM
|
2
|
LETTER TO SHAREHOLDERS
|
overall capitulation and improving fundamentals that could bring buyers back into the market and reverse any bearish trends. Investors need to see improving company earnings, retreating inflationary trends, a
measured pace of interest rate increases globally that does not cause significant economic contraction, hope for a more peaceful and orderly world economic system unconstrained by supply bottlenecks and other hindrances to global trade, and,
most importantly, a subsidence of the deleterious effects of the coronavirus pandemic. While that may seem like a “tall order,” we believe that patient investing, focusing on value, quality, and downside risk mitigation, works well over the
longer term.
During this tumultuous period, performance of the majority of the Hennessy Funds has been relatively strong when compared to the overall market as well as to our
benchmarks. During the six months ended April 30, 2022, the Dow Jones Industrial Average, the S&P 500® Index, and the NASDAQ Composite Index dropped
7.05%, 9.65%, and 20.15%, respectively, on a total return basis. During this period when these three major indices saw significant declines, we were pleased that seven of our 16 Funds posted positive total returns, 10 of our 14 domestic Funds
outperformed the S&P 500® Index, and over half of our active funds outperformed their primary benchmarks.
We thank you, our shareholders, for your continued interest in our family of Funds. We are grateful for the trust you put in us, and we will continue to
strive to manage our portfolios for long-term performance, ever mindful of downside risk. While volatility and uncertainty may impact the markets in the short-term, we encourage investors to stay the course, maintain a diversified portfolio,
and keep a long-term perspective. If you have any questions or would like to speak with us, please don’t hesitate to call us directly at (800) 966-4354. In closing, we would also like to thank all of the healthcare and frontline workers that
have worked – and still work – tirelessly throughout the coronavirus pandemic.
Best regards,
| |
|
|
|
|
Ryan C. Kelley, CFA
|
|
|
Chief Investment Officer,
|
|
|
Senior Vice President, and Portfolio Manager
|
Past performance does not guarantee future results.
Mutual fund investing involves risk. Principal loss is possible.
Opinions expressed are those of Ryan C. Kelley and are subject to change, are not guaranteed, and should not be considered investment advice.
The Dow Jones Industrial Average and S&P 500® Index are commonly used to measure the performance of U.S. stocks. The NASDAQ
Composite Index comprises all common stocks listed on The NASDAQ Stock Market and is commonly used to measure the performance of technology-related stocks. The indices are used herein for comparative purposes in accordance with SEC
regulations. One cannot invest directly in an index. All returns are shown on a total return basis.
Please refer to the Performance Overview section for more detailed performance information.
|
HENNESSY FUNDS
|
1-800-966-4354
|
3
Performance Overview (Unaudited)
AVERAGE ANNUAL TOTAL RETURN FOR PERIODS ENDED APRIL 30, 2022
|
Six
|
One
|
Five
|
Ten
|
|
|
Months(1)
|
Year
|
Years
|
Years
|
|
|
Hennessy Cornerstone
|
||||
|
Large Growth Fund –
|
||||
|
Investor Class (HFLGX)
|
-6.21%
|
-1.33%
|
10.79%
|
11.18%
|
|
Hennessy Cornerstone
|
||||
|
Large Growth Fund –
|
||||
|
Institutional Class (HILGX)
|
-6.03%
|
-1.05%
|
11.11%
|
11.45%
|
|
Russell 1000® Index
|
-11.29%
|
-2.10%
|
13.44%
|
13.53%
|
|
S&P 500® Index
|
-9.65%
|
0.21%
|
13.66%
|
13.67%
|
Expense ratios: 1.29% (Investor Class); 1.04% (Institutional Class)
|
(1)
|
Periods of less than one year are not annualized.
|
_______________
Performance data quoted represents past performance; past performance does not guarantee future results. The investment return and principal value of an investment will fluctuate so that an
investor’s shares, when redeemed, may be worth more or less than their original cost. The performance table does not reflect the deduction of taxes that a shareholder would pay on Fund distributions or the redemption of Fund shares. Current
performance of the Fund may be lower or higher than the performance quoted. Performance data current to the most recent month end may be obtained by visiting www.hennessyfunds.com.
The Russell 1000® Index comprises the 1,000 largest companies in the Russell 3000® Index based on market capitalization. The S&P 500® Index is a capitalization-weighted index that is designed to represent the
broad domestic economy through changes in the aggregate market value of 500 stocks across all major industries. One cannot invest directly in an index. These indices are used for comparative purposes in accordance with Securities and Exchange
Commission regulations.
Frank Russell Company (“Russell”) is the source and owner of the trademarks, service marks, and copyrights related to the Russell Indexes. Russell® is a trademark of Frank Russell Company. Neither Russell nor its licensors accept any liability for any errors or omissions in the Russell Indexes or Russell ratings or underlying data and no party may rely on any Russell
Indexes or Russell ratings or underlying data contained in this communication. No further distribution of Russell data is permitted without Russell’s express written consent. Russell does not promote, sponsor, or endorse the content of this
communication.
Standard & Poor’s Financial Services is the source and owner of the S&P® and S&P 500® trademarks.
The expense ratios presented are from the most recent prospectus. The expense ratios for the current reporting period are available in the Financial Highlights section of this report.
|
WWW.HENNESSYFUNDS.COM
|
4
|
PERFORMANCE OVERVIEW/SCHEDULE OF INVESTMENTS
|
Financial Statements
|
Schedule of Investments as of April 30, 2022 (Unaudited)
|
HENNESSY CORNERSTONE LARGE GROWTH FUND
(% of Net Assets)
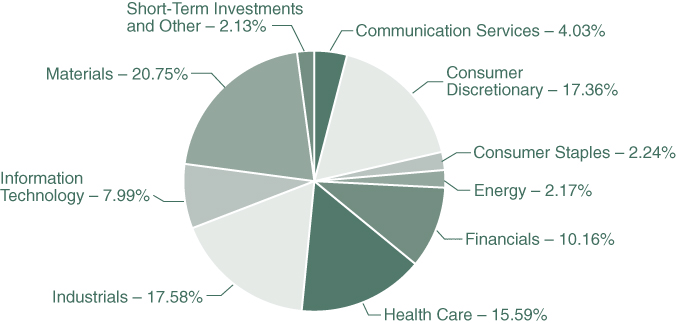
|
TOP TEN HOLDINGS (EXCLUDING MONEY MARKET FUNDS)
|
% NET ASSETS
|
|
Nucor Corp.
|
2.40%
|
|
Bath & Body Works, Inc.
|
2.27%
|
|
Philip Morris International, Inc.
|
2.24%
|
|
HP, Inc.
|
2.22%
|
|
Dow, Inc.
|
2.21%
|
|
Steel Dynamics, Inc.
|
2.21%
|
|
CF Industries Holdings, Inc.
|
2.20%
|
|
APA Corp.
|
2.17%
|
|
Reliance Steel & Aluminum Co.
|
2.17%
|
|
Target Corp.
|
2.16%
|
Note: For presentation purposes, the Fund has grouped some of the industry categories. For purposes of categorizing securities for compliance with Section 8(b)(1) of the Investment Company Act of 1940, as amended,
the Fund uses more specific industry classifications.
The Global Industry Classification Standard (GICS®) was developed by and is the exclusive property and a service mark of MSCI, Inc.
and Standard & Poor’s Financial Services LLC. It has been licensed for use by the Hennessy Funds.
|
HENNESSY FUNDS
|
1-800-966-4354
|
5
|
COMMON STOCKS – 97.87%
|
Number
|
% of
|
||||||||||
|
|
of Shares
|
Value
|
Net Assets
|
|||||||||
|
Communication Services – 4.03%
|
||||||||||||
|
Meta Platforms, Inc. (a)
|
14,700
|
$
|
2,946,909
|
2.02
|
%
|
|||||||
|
Sirius XM Holdings, Inc.
|
487,700
|
2,926,200
|
2.01
|
%
|
||||||||
|
|
5,873,109
|
4.03
|
%
|
|||||||||
|
Consumer Discretionary – 17.36%
|
||||||||||||
|
Bath & Body Works, Inc. (a)
|
62,500
|
3,305,625
|
2.27
|
%
|
||||||||
|
Best Buy Co., Inc.
|
30,700
|
2,760,851
|
1.89
|
%
|
||||||||
|
Darden Restaurants, Inc.
|
23,400
|
3,082,482
|
2.11
|
%
|
||||||||
|
DR Horton, Inc.
|
36,600
|
2,546,994
|
1.75
|
%
|
||||||||
|
NVR, Inc. (a)
|
600
|
2,625,726
|
1.80
|
%
|
||||||||
|
PulteGroup, Inc.
|
64,400
|
2,689,344
|
1.84
|
%
|
||||||||
|
Tapestry, Inc.
|
81,400
|
2,679,688
|
1.84
|
%
|
||||||||
|
Target Corp.
|
13,800
|
3,155,370
|
2.16
|
%
|
||||||||
|
Williams-Sonoma, Inc.
|
19,000
|
2,479,120
|
1.70
|
%
|
||||||||
|
|
25,325,200
|
17.36
|
%
|
|||||||||
|
Consumer Staples – 2.24%
|
||||||||||||
|
Philip Morris International, Inc.
|
32,700
|
3,270,000
|
2.24
|
%
|
||||||||
|
Energy – 2.17%
|
||||||||||||
|
APA Corp.
|
77,300
|
3,163,889
|
2.17
|
%
|
||||||||
|
Financials – 10.16%
|
||||||||||||
|
Ameriprise Financial, Inc.
|
10,200
|
2,707,998
|
1.86
|
%
|
||||||||
|
Cincinnati Financial Corp.
|
23,000
|
2,821,180
|
1.93
|
%
|
||||||||
|
Coinbase Global, Inc. (a)
|
17,200
|
1,938,612
|
1.33
|
%
|
||||||||
|
Fidelity National Financial, Inc.
|
61,900
|
2,464,858
|
1.69
|
%
|
||||||||
|
T. Rowe Price Group, Inc.
|
20,700
|
2,546,928
|
1.74
|
%
|
||||||||
|
The Carlyle Group, Inc.
|
64,600
|
2,344,334
|
1.61
|
%
|
||||||||
|
|
14,823,910
|
10.16
|
%
|
|||||||||
|
Health Care – 15.59%
|
||||||||||||
|
AbbVie, Inc.
|
19,200
|
2,820,096
|
1.93
|
%
|
||||||||
|
AmerisourceBergen Corp.
|
20,000
|
3,025,800
|
2.07
|
%
|
||||||||
|
Cardinal Health, Inc.
|
53,300
|
3,094,065
|
2.12
|
%
|
||||||||
|
Gilead Sciences, Inc.
|
51,500
|
3,056,010
|
2.10
|
%
|
||||||||
|
HCA Healthcare, Inc.
|
11,400
|
2,445,870
|
1.68
|
%
|
||||||||
|
Hologic, Inc. (a)
|
41,200
|
2,965,988
|
2.03
|
%
|
||||||||
The accompanying notes are an integral part of these financial statements.
|
WWW.HENNESSYFUNDS.COM
|
6
|
SCHEDULE OF INVESTMENTS
|
|
COMMON STOCKS
|
Number
|
% of
|
||||||||||
|
|
of Shares
|
Value
|
Net Assets
|
|||||||||
|
Health Care (Continued)
|
||||||||||||
|
Moderna, Inc. (a)
|
18,100
|
$
|
2,432,821
|
1.67
|
%
|
|||||||
|
Regeneron Pharmaceuticals, Inc. (a)
|
4,400
|
2,900,084
|
1.99
|
%
|
||||||||
|
|
22,740,734
|
15.59
|
%
|
|||||||||
|
Industrials – 17.58%
|
||||||||||||
|
3M Co.
|
20,600
|
2,970,932
|
2.04
|
%
|
||||||||
|
Avis Budget Group, Inc. (a)
|
10,200
|
2,730,234
|
1.87
|
%
|
||||||||
|
Builders FirstSource, Inc. (a)
|
39,600
|
2,438,172
|
1.67
|
%
|
||||||||
|
C.H. Robinson Worldwide, Inc.
|
29,300
|
3,110,195
|
2.13
|
%
|
||||||||
|
Caterpillar, Inc.
|
13,700
|
2,884,398
|
1.98
|
%
|
||||||||
|
Expeditors International of Washington, Inc.
|
28,800
|
2,853,216
|
1.95
|
%
|
||||||||
|
Northrop Grumman Corp.
|
7,100
|
3,119,740
|
2.14
|
%
|
||||||||
|
Snap-on, Inc.
|
14,500
|
3,081,105
|
2.11
|
%
|
||||||||
|
United Parcel Service, Inc., Class B
|
13,700
|
2,465,726
|
1.69
|
%
|
||||||||
|
|
25,653,718
|
17.58
|
%
|
|||||||||
|
Information Technology – 7.99%
|
||||||||||||
|
HP, Inc.
|
88,400
|
3,238,092
|
2.22
|
%
|
||||||||
|
Lam Research Corp.
|
5,800
|
2,701,408
|
1.85
|
%
|
||||||||
|
NortonLifeLock, Inc.
|
117,500
|
2,942,200
|
2.02
|
%
|
||||||||
|
QUALCOMM, Inc.
|
19,900
|
2,779,831
|
1.90
|
%
|
||||||||
|
|
11,661,531
|
7.99
|
%
|
|||||||||
|
Materials – 20.75%
|
||||||||||||
|
Alcoa Corp.
|
37,800
|
2,562,840
|
1.76
|
%
|
||||||||
|
Celanese Corp.
|
21,400
|
3,144,516
|
2.16
|
%
|
||||||||
|
CF Industries Holdings, Inc.
|
33,100
|
3,205,073
|
2.20
|
%
|
||||||||
|
Cleveland-Cliffs, Inc. (a)
|
111,000
|
2,829,390
|
1.94
|
%
|
||||||||
|
Dow, Inc.
|
48,500
|
3,225,250
|
2.21
|
%
|
||||||||
|
Freeport-McMoRan, Inc.
|
62,700
|
2,542,485
|
1.74
|
%
|
||||||||
|
Nucor Corp.
|
22,600
|
3,498,028
|
2.40
|
%
|
||||||||
|
Reliance Steel & Aluminum Co.
|
16,000
|
3,172,000
|
2.17
|
%
|
||||||||
|
Sealed Air Corp.
|
44,600
|
2,863,766
|
1.96
|
%
|
||||||||
|
Steel Dynamics, Inc.
|
37,600
|
3,224,200
|
2.21
|
%
|
||||||||
|
|
30,267,548
|
20.75
|
%
|
|||||||||
|
|
||||||||||||
|
Total Common Stocks
|
||||||||||||
|
(Cost $141,038,878)
|
142,779,639
|
97.87
|
%
|
|||||||||
The accompanying notes are an integral part of these financial statements.
|
HENNESSY FUNDS
|
1-800-966-4354
|
7
|
SHORT-TERM INVESTMENTS –2.19%
|
Number
|
% of
|
||||||||||
|
|
of Shares
|
Value
|
Net Assets
|
|||||||||
|
Money Market Funds – 2.19%
|
||||||||||||
|
First American Government Obligations Fund,
|
||||||||||||
|
Institutional Class, 0.22% (b)
|
3,188,890
|
$
|
3,188,890
|
2.19
|
%
|
|||||||
|
|
||||||||||||
|
Total Short-Term Investments
|
||||||||||||
|
(Cost $3,188,890)
|
3,188,890
|
2.19
|
%
|
|||||||||
|
|
||||||||||||
|
Total Investments
|
||||||||||||
|
(Cost $144,227,768) – 100.06%
|
145,968,529
|
100.06
|
%
|
|||||||||
|
Liabilities in Excess of Other Assets – (0.06)%
|
(81,158
|
)
|
(0.06
|
)%
|
||||||||
|
TOTAL NET ASSETS – 100.00%
|
$
|
145,887,371
|
100.00
|
%
|
||||||||
Percentages are stated as a percent of net assets.
|
(a)
|
Non-income-producing security.
|
|
(b)
|
The rate listed is the fund’s seven-day yield as of April 30, 2022.
|
Summary of Fair Value Exposure as of April 30, 2022
The following is a summary of the inputs used to value the Fund’s net assets as of April 30, 2022 (see Note 3 in the accompanying Notes to the Financial Statements):
|
Common Stocks
|
Level 1
|
Level 2
|
Level 3
|
Total
|
||||||||||||
|
Communication Services
|
$
|
5,873,109
|
$
|
—
|
$
|
—
|
$
|
5,873,109
|
||||||||
|
Consumer Discretionary
|
25,325,200
|
—
|
—
|
25,325,200
|
||||||||||||
|
Consumer Staples
|
3,270,000
|
—
|
—
|
3,270,000
|
||||||||||||
|
Energy
|
3,163,889
|
—
|
—
|
3,163,889
|
||||||||||||
|
Financials
|
14,823,910
|
—
|
—
|
14,823,910
|
||||||||||||
|
Health Care
|
22,740,734
|
—
|
—
|
22,740,734
|
||||||||||||
|
Industrials
|
25,653,718
|
—
|
—
|
25,653,718
|
||||||||||||
|
Information Technology
|
11,661,531
|
—
|
—
|
11,661,531
|
||||||||||||
|
Materials
|
30,267,548
|
—
|
—
|
30,267,548
|
||||||||||||
|
Total Common Stocks
|
$
|
142,779,639
|
$
|
—
|
$
|
—
|
$
|
142,779,639
|
||||||||
|
Short-Term Investments
|
||||||||||||||||
|
Money Market Funds
|
$
|
3,188,890
|
$
|
—
|
$
|
—
|
$
|
3,188,890
|
||||||||
|
Total Short-Term Investments
|
$
|
3,188,890
|
$
|
—
|
$
|
—
|
$
|
3,188,890
|
||||||||
|
Total Investments
|
$
|
145,968,529
|
$
|
—
|
$
|
—
|
$
|
145,968,529
|
||||||||
The accompanying notes are an integral part of these financial statements.
|
WWW.HENNESSYFUNDS.COM
|
8
|
SCHEDULE OF INVESTMENTS/STATEMENT OF ASSETS AND LIABILITIES
|
Financial Statements
|
Statement of Assets and Liabilities as of April 30, 2022 (Unaudited)
|
|
ASSETS:
|
||||
|
Investments in securities, at value (cost $144,227,768)
|
$
|
145,968,529
|
||
|
Dividends and interest receivable
|
130,376
|
|||
|
Receivable for fund shares sold
|
2,990
|
|||
|
Prepaid expenses and other assets
|
22,164
|
|||
|
Total assets
|
146,124,059
|
|||
|
LIABILITIES:
|
||||
|
Payable for fund shares redeemed
|
13,708
|
|||
|
Payable to advisor
|
94,375
|
|||
|
Payable to administrator
|
29,422
|
|||
|
Payable to auditor
|
11,228
|
|||
|
Accrued distribution fees
|
58,123
|
|||
|
Accrued service fees
|
11,239
|
|||
|
Accrued trustees fees
|
5,225
|
|||
|
Accrued expenses and other payables
|
13,368
|
|||
|
Total liabilities
|
236,688
|
|||
|
NET ASSETS
|
$
|
145,887,371
|
||
|
NET ASSETS CONSISTS OF:
|
||||
|
Capital stock
|
$
|
120,284,233
|
||
|
Total distributable earnings
|
25,603,138
|
|||
|
Total net assets
|
$
|
145,887,371
|
||
|
NET ASSETS:
|
||||
|
Investor Class
|
||||
|
Shares authorized (no par value)
|
Unlimited
|
|||
|
Net assets applicable to outstanding shares
|
$
|
129,167,544
|
||
|
Shares issued and outstanding
|
11,002,149
|
|||
|
Net asset value, offering price, and redemption price per share
|
$
|
11.74
|
||
|
Institutional Class
|
||||
|
Shares authorized (no par value)
|
Unlimited
|
|||
|
Net assets applicable to outstanding shares
|
$
|
16,719,827
|
||
|
Shares issued and outstanding
|
1,409,051
|
|||
|
Net asset value, offering price, and redemption price per share
|
$
|
11.87
|
||
The accompanying notes are an integral part of these financial statements.
|
HENNESSY FUNDS
|
1-800-966-4354
|
9
Financial Statements
|
Statement of Operations for the six months ended April 30, 2022 (Unaudited)
|
|
INVESTMENT INCOME:
|
||||
|
Dividend income
|
$
|
1,555,894
|
||
|
Interest income
|
745
|
|||
|
Total investment income
|
1,556,639
|
|||
|
EXPENSES:
|
||||
|
Investment advisory fees (See Note 5)
|
584,417
|
|||
|
Distribution fees – Investor Class (See Note 5)
|
104,820
|
|||
|
Administration, accounting, custody, and transfer agent fees (See Note 5)
|
91,386
|
|||
|
Service fees – Investor Class (See Note 5)
|
69,880
|
|||
|
Sub-transfer agent expenses – Investor Class (See Note 5)
|
59,359
|
|||
|
Sub-transfer agent expenses – Institutional Class (See Note 5)
|
2,274
|
|||
|
Federal and state registration fees
|
20,106
|
|||
|
Compliance expense (See Note 5)
|
15,156
|
|||
|
Audit fees
|
11,222
|
|||
|
Trustees’ fees and expenses
|
9,686
|
|||
|
Reports to shareholders
|
4,975
|
|||
|
Legal fees
|
1,081
|
|||
|
Other expenses
|
12,494
|
|||
|
Total expenses before recoupment by advisor
|
986,856
|
|||
|
Expense recoupment by advisor – Investor Class (See Note 5)
|
3,336
|
|||
|
Expense recoupment by advisor – Institutional Class (See Note 5)
|
611
|
|||
|
Net expenses
|
990,803
|
|||
|
NET INVESTMENT INCOME
|
$
|
565,836
|
||
|
REALIZED AND UNREALIZED GAINS (LOSSES):
|
||||
|
Net realized gain on investments
|
$
|
23,328,392
|
||
|
Net change in unrealized appreciation/depreciation on investments
|
(33,456,663
|
)
|
||
|
Net loss on investments
|
(10,128,271
|
)
|
||
|
NET DECREASE IN NET ASSETS RESULTING FROM OPERATIONS
|
$
|
(9,562,435
|
)
|
|
The accompanying notes are an integral part of these financial statements.
|
WWW.HENNESSYFUNDS.COM
|
10
|
STATEMENT OF OPERATIONS/STATEMENTS OF CHANGES IN NET ASSETS
|
Financial Statements
|
Statements of Changes in Net Assets
|
|
Six Months Ended
|
||||||||
|
April 30, 2022
|
Year Ended
|
|||||||
|
(Unaudited)
|
October 31, 2021
|
|||||||
|
OPERATIONS:
|
||||||||
|
Net investment income
|
$
|
565,836
|
$
|
1,077,347
|
||||
|
Net realized gain on investments
|
23,328,392
|
23,137,704
|
||||||
|
Net change in unrealized
|
||||||||
|
appreciation/depreciation on investments
|
(33,456,663
|
)
|
30,012,110
|
|||||
|
Net increase (decrease) in net
|
||||||||
|
assets resulting from operations
|
(9,562,435
|
)
|
54,227,161
|
|||||
|
DISTRIBUTIONS TO SHAREHOLDERS:
|
||||||||
|
Distributable earnings – Investor Class
|
(18,524,443
|
)
|
(5,878,284
|
)
|
||||
|
Distributable earnings – Institutional Class
|
(2,507,385
|
)
|
(758,549
|
)
|
||||
|
Total distributions
|
(21,031,828
|
)
|
(6,636,833
|
)
|
||||
|
CAPITAL SHARE TRANSACTIONS:
|
||||||||
|
Proceeds from shares subscribed – Investor Class
|
3,230,696
|
8,018,607
|
||||||
|
Proceeds from shares subscribed – Institutional Class
|
1,231,390
|
16,491,311
|
||||||
|
Dividends reinvested – Investor Class
|
17,953,867
|
5,574,991
|
||||||
|
Dividends reinvested – Institutional Class
|
2,397,570
|
740,220
|
||||||
|
Cost of shares redeemed – Investor Class
|
(8,151,378
|
)
|
(15,731,261
|
)
|
||||
|
Cost of shares redeemed – Institutional Class
|
(1,688,824
|
)
|
(16,883,651
|
)
|
||||
|
Net increase (decrease) in net assets
|
||||||||
|
derived from capital share transactions
|
14,973,321
|
(1,789,783
|
)
|
|||||
|
TOTAL INCREASE (DECREASE) IN NET ASSETS
|
(15,620,942
|
)
|
45,800,545
|
|||||
|
NET ASSETS:
|
||||||||
|
Beginning of period
|
161,508,313
|
115,707,768
|
||||||
|
End of period
|
$
|
145,887,371
|
$
|
161,508,313
|
||||
|
CHANGES IN SHARES OUTSTANDING:
|
||||||||
|
Shares sold – Investor Class
|
256,710
|
592,099
|
||||||
|
Shares sold – Institutional Class
|
90,289
|
1,203,797
|
||||||
|
Shares issued to holders as reinvestment
|
||||||||
|
of dividends – Investor Class
|
1,400,177
|
501,827
|
||||||
|
Shares issued to holders as reinvestment
|
||||||||
|
of dividends – Institutional Class
|
184,777
|
65,913
|
||||||
|
Shares redeemed – Investor Class
|
(628,849
|
)
|
(1,214,696
|
)
|
||||
|
Shares redeemed – Institutional Class
|
(133,662
|
)
|
(1,221,754
|
)
|
||||
|
Net increase (decrease) in shares outstanding
|
1,169,442
|
(72,814
|
)
|
|||||
The accompanying notes are an integral part of these financial statements.
|
HENNESSY FUNDS
|
1-800-966-4354
|
11
Financial Statements
|
Financial Highlights
|
For an Investor Class share outstanding throughout each period
|
Six Months Ended
|
||||
|
April 30, 2022
|
||||
|
(Unaudited)
|
||||
|
PER SHARE DATA:
|
||||
|
Net asset value, beginning of period
|
$
|
14.35
|
||
|
Income from investment operations:
|
||||
|
Net investment income
|
0.04
|
(1)
|
||
|
Net realized and unrealized gains (losses) on investments
|
(0.79
|
)
|
||
|
Total from investment operations
|
(0.75
|
)
|
||
|
Less distributions:
|
||||
|
Dividends from net investment income
|
(0.08
|
)
|
||
|
Dividends from net realized gains
|
(1.78
|
)
|
||
|
Total distributions
|
(1.86
|
)
|
||
|
Net asset value, end of period
|
$
|
11.74
|
||
|
TOTAL RETURN
|
-6.21
|
%(2)
|
||
|
SUPPLEMENTAL DATA AND RATIOS:
|
||||
|
Net assets, end of period (millions)
|
$
|
129.17
|
||
|
Ratio of expenses to average net assets:
|
||||
|
Before expense reimbursement/recoupment
|
1.29
|
%(3)
|
||
|
After expense reimbursement/recoupment
|
1.29
|
%(3)
|
||
|
Ratio of net investment income to average net assets:
|
||||
|
Before expense reimbursement/recoupment
|
0.69
|
%(3)
|
||
|
After expense reimbursement/recoupment
|
0.69
|
%(3)
|
||
|
Portfolio turnover rate(5)
|
71
|
%(2)
|
||
|
(1)
|
Calculated using the average shares outstanding method.
|
|
(2)
|
Not annualized.
|
|
(3)
|
Annualized.
|
|
(4)
|
The Fund had an expense limitation agreement in place through November 30, 2019.
|
|
(5)
|
Calculated on the basis of the Fund as a whole.
|
The accompanying notes are an integral part of these financial statements.
|
WWW.HENNESSYFUNDS.COM
|
12
|
FINANCIAL HIGHLIGHTS — INVESTOR CLASS
|
|
Year Ended October 31,
|
||||||||||||||||||
|
2021
|
2020
|
2019
|
2018
|
2017
|
||||||||||||||
|
$
|
10.21
|
$
|
10.54
|
$
|
12.24
|
$
|
11.75
|
$
|
10.27
|
|||||||||
|
0.09
|
(1)
|
0.09
|
(1)
|
0.13
|
(1)
|
0.06
|
0.11
|
|||||||||||
|
4.64
|
(0.15
|
)
|
0.56
|
0.94
|
1.49
|
|||||||||||||
|
4.73
|
(0.06
|
)
|
0.69
|
1.00
|
1.60
|
|||||||||||||
|
(0.10
|
)
|
(0.14
|
)
|
(0.09
|
)
|
(0.08
|
)
|
(0.12
|
)
|
|||||||||
|
(0.49
|
)
|
(0.13
|
)
|
(2.30
|
)
|
(0.43
|
)
|
—
|
||||||||||
|
(0.59
|
)
|
(0.27
|
)
|
(2.39
|
)
|
(0.51
|
)
|
(0.12
|
)
|
|||||||||
|
$
|
14.35
|
$
|
10.21
|
$
|
10.54
|
$
|
12.24
|
$
|
11.75
|
|||||||||
|
48.00
|
%
|
-0.75
|
%
|
7.84
|
%
|
8.53
|
%
|
15.70
|
%
|
|||||||||
|
$
|
143.11
|
$
|
103.11
|
$
|
117.62
|
$
|
125.91
|
$
|
91.74
|
|||||||||
|
1.29
|
%
|
1.31
|
%
|
1.31
|
%
|
1.24
|
%
|
1.25
|
%
|
|||||||||
|
1.29
|
%
|
1.31
|
%(4)
|
1.29
|
%
|
1.24
|
%
|
1.25
|
%
|
|||||||||
|
0.69
|
%
|
0.93
|
%
|
1.24
|
%
|
0.81
|
%
|
0.95
|
%
|
|||||||||
|
0.69
|
%
|
0.93
|
%
|
1.26
|
%
|
0.81
|
%
|
0.95
|
%
|
|||||||||
|
68
|
%
|
62
|
%
|
57
|
%
|
70
|
%
|
65
|
%
|
|||||||||
The accompanying notes are an integral part of these financial statements.
|
HENNESSY FUNDS
|
1-800-966-4354
|
13
Financial Statements
|
Financial Highlights
|
For an Institutional Class share outstanding throughout each period
|
Six Months Ended
|
||||
|
April 30, 2022
|
||||
|
(Unaudited)
|
||||
|
PER SHARE DATA:
|
||||
|
Net asset value, beginning of period
|
$
|
14.51
|
||
|
Income from investment operations:
|
||||
|
Net investment income
|
0.06
|
(1)
|
||
|
Net realized and unrealized gains (losses) on investments
|
(0.79
|
)
|
||
|
Total from investment operations
|
(0.73
|
)
|
||
|
Less distributions:
|
||||
|
Dividends from net investment income
|
(0.11
|
)
|
||
|
Dividends from net realized gains
|
(1.80
|
)
|
||
|
Total distributions
|
(1.91
|
)
|
||
|
Net asset value, end of period
|
$
|
11.87
|
||
|
TOTAL RETURN
|
-6.03
|
%(2)
|
||
|
SUPPLEMENTAL DATA AND RATIOS:
|
||||
|
Net assets, end of period (millions)
|
$
|
16.72
|
||
|
Ratio of expenses to average net assets:
|
||||
|
Before expense reimbursement/recoupment
|
0.98
|
%(3)
|
||
|
After expense reimbursement/recoupment
|
0.98
|
%(3)
|
||
|
Ratio of net investment income to average net assets:
|
||||
|
Before expense reimbursement/recoupment
|
0.99
|
%(3)
|
||
|
After expense reimbursement/recoupment
|
0.99
|
%(3)
|
||
|
Portfolio turnover rate(5)
|
71
|
%(2)
|
||
|
(1)
|
Calculated using the average shares outstanding method.
|
|
(2)
|
Not annualized.
|
|
(3)
|
Annualized.
|
|
(4)
|
The Fund had an expense limitation agreement in place through November 30, 2019.
|
|
(5)
|
Calculated on the basis of the Fund as a whole.
|
The accompanying notes are an integral part of these financial statements.
|
WWW.HENNESSYFUNDS.COM
|
14
|
FINANCIAL HIGHLIGHTS — INSTITUTIONAL CLASS
|
|
Year Ended October 31,
|
||||||||||||||||||
|
2021
|
2020
|
2019
|
2018
|
2017
|
||||||||||||||
|
$
|
10.33
|
$
|
10.65
|
$
|
12.38
|
$
|
11.87
|
$
|
10.37
|
|||||||||
|
0.12
|
(1)
|
0.13
|
(1)
|
0.16
|
(1)
|
0.14
|
0.13
|
|||||||||||
|
4.68
|
(0.15
|
)
|
0.56
|
0.90
|
1.52
|
|||||||||||||
|
4.80
|
(0.02
|
)
|
0.72
|
1.04
|
1.65
|
|||||||||||||
|
(0.13
|
)
|
(0.17
|
)
|
(0.12
|
)
|
(0.10
|
)
|
(0.15
|
)
|
|||||||||
|
(0.49
|
)
|
(0.13
|
)
|
(2.33
|
)
|
(0.43
|
)
|
—
|
||||||||||
|
(0.62
|
)
|
(0.30
|
)
|
(2.45
|
)
|
(0.53
|
)
|
(0.15
|
)
|
|||||||||
|
$
|
14.51
|
$
|
10.33
|
$
|
10.65
|
$
|
12.38
|
$
|
11.87
|
|||||||||
|
48.30
|
%
|
-0.40
|
%
|
8.12
|
%
|
8.82
|
%
|
16.00
|
%
|
|||||||||
|
$
|
18.39
|
$
|
12.60
|
$
|
18.42
|
$
|
19.25
|
$
|
12.17
|
|||||||||
|
1.04
|
%
|
1.01
|
%
|
1.00
|
%
|
0.96
|
%
|
1.00
|
%
|
|||||||||
|
1.04
|
%
|
1.01
|
%(4)
|
0.98
|
%
|
0.96
|
%
|
1.00
|
%
|
|||||||||
|
0.91
|
%
|
1.23
|
%
|
1.56
|
%
|
1.08
|
%
|
1.20
|
%
|
|||||||||
|
0.91
|
%
|
1.23
|
%
|
1.58
|
%
|
1.08
|
%
|
1.20
|
%
|
|||||||||
|
68
|
%
|
62
|
%
|
57
|
%
|
70
|
%
|
65
|
%
|
|||||||||
The accompanying notes are an integral part of these financial statements.
|
HENNESSY FUNDS
|
1-800-966-4354
|
15
Financial Statements
|
Notes to the Financial Statements April 30, 2022 (Unaudited)
|
1). ORGANIZATION
The Hennessy Cornerstone Large Growth Fund (the “Fund”) is a series of Hennessy Funds Trust (the “Trust”), which was organized as a Delaware statutory trust on September 17, 1992. The Fund is an open-end management
investment company registered under the Investment Company Act of 1940, as amended. The investment objective of the Fund is long-term growth of capital. The Fund is a diversified fund.
The Fund offers Investor Class and Institutional Class shares. Each class of shares differs principally in its respective 12b-1 distribution and service, shareholder servicing, and sub-transfer
agent expenses. There are no sales charges. Each class has identical rights to earnings, assets, and voting privileges, except for class-specific expenses and exclusive rights to vote on matters affecting only one class.
As an investment company, the Fund follows the investment company accounting and reporting guidance of the Financial Accounting Standards Board (“FASB”) Accounting Standard Codification Topic 946
“Financial Services—Investment Companies.”
2). SIGNIFICANT ACCOUNTING POLICIES
The following is a summary of significant accounting policies consistently followed by the Fund in the preparation of the financial statements. These policies conform to U.S. generally accepted accounting principles
(“GAAP”).
|
a).
|
Securities Valuation – All investments in securities are valued in accordance with the Fund’s valuation policies and procedures, as described in Note 3.
|
|
b).
|
Federal Income Taxes – The Fund has elected to be taxed as a regulated investment company and intends to distribute substantially all of its taxable income to its shareholders and otherwise comply with the
provisions of the Internal Revenue Code of 1986, as amended, applicable to regulated investment companies. As a result, the Fund has made no provision for federal income taxes or excise taxes. Net investment income/loss and realized
gains/losses for federal income tax purposes may differ from those reported in the financial statements because of temporary book-basis and tax-basis differences. Temporary differences are primarily the result of the treatment of wash
sales for tax reporting purposes. The Fund recognizes interest and penalties related to income tax benefits, if any, in the Statement of Operations as an income tax expense. Distributions from net realized gains for book purposes may
include short-term capital gains, which are included as ordinary income to shareholders for tax purposes. The Fund may utilize equalization accounting for tax purposes and designate earnings and profits, including net realized gains
distributed to shareholders on redemption of shares, as part of the dividends paid deduction for income tax purposes.
|
|
c).
|
Accounting for Uncertainty in Income Taxes – The Fund has accounting policies regarding recognition and measurement of tax positions taken or expected to be taken on a tax return. The tax returns of the Fund
for the prior three fiscal years are open for examination. The Fund has reviewed all open tax years in major tax jurisdictions and concluded that there is no impact on the Fund’s net assets and no tax liability resulting from
unrecognized tax benefits relating to uncertain income tax positions taken or expected to be taken on a tax return. The Fund’s major tax jurisdictions are U.S. federal and Delaware.
|
|
WWW.HENNESSYFUNDS.COM
|
16
|
NOTES TO THE FINANCIAL STATEMENTS
|
|
d).
|
Income and Expenses – Dividend income is recognized on the ex-dividend date or as soon as information is available to the Fund. Interest income, which includes the amortization of premium and accretion of
discount, is recognized on an accrual basis. Market discounts, original issue discounts, and market premiums on debt securities are accreted or amortized to interest income over the life of a security with a corresponding increase or
decrease, as applicable, in the cost basis of such security using the yield-to-maturity method or, where applicable, the first call date of the security. Other non-cash dividends are recognized as investment income at the fair value
of the property received. The Fund is charged for those expenses that are directly attributable to its portfolio, such as advisory, administration, and certain shareholder service fees. Income, expenses (other than expenses
attributable to a specific class), and realized and unrealized gains/losses on investments are allocated to each class of shares based on such class’s net assets.
|
|
e).
|
Distributions to Shareholders – Dividends from net investment income for the Fund, if any, are declared and paid annually, usually in December. Distributions of net realized capital gains, if any, are
declared and paid annually, usually in December.
|
|
f).
|
Security Transactions – Investment and shareholder transactions are recorded on the trade date. The Fund determines the realized gain/loss from an investment transaction by comparing the original cost of the
security lot sold with the net sale proceeds. Discounts and premiums on securities purchased are accreted or amortized, respectively, over the life of each such security.
|
|
g).
|
Use of Estimates – Preparing financial statements in accordance with GAAP requires management to make estimates and assumptions that affect the reported amounts of assets and liabilities and disclosure of
contingent assets and liabilities at the date of the financial statements, as well as the reported change in net assets during the reporting period. Actual results could differ from those estimates.
|
|
h).
|
Share Valuation – The net asset value (“NAV”) per share of the Fund is calculated by dividing (i) the total value of the securities held by the Fund, plus cash and other assets, minus all liabilities
(including estimated accrued expenses) by (ii) the total number of Fund shares outstanding, rounded to the nearest $0.01. Fund shares are not priced on days the New York Stock Exchange is closed for trading. The offering and
redemption price per share for the Fund is equal to the Fund’s NAV per share.
|
|
i).
|
Recent Accounting Pronouncements and Regulatory Updates – In October 2020, the Securities and Exchange Commission (“SEC”) adopted new regulations governing the use of derivatives by registered investment
companies (“Rule 18f-4”). Rule 18f-4 imposes limits on the amount of derivatives a fund can enter into, eliminates the asset segregation framework currently used by funds to comply with Section 18 of the 1940 Act, and requires funds
whose use of derivatives is greater than a limited specified amount to establish and maintain a comprehensive derivatives risk management program and appoint a derivatives risk manager. Funds are required to comply with Rule 18f-4 by
August 19, 2022. The impact, if any, that Rule 18f-4 will have on the availability, liquidity, and performance of derivatives is unclear. Management is currently evaluating the potential impact of Rule 18f-4 on the Fund. When fully
implemented, Rule 18f-4 may require changes in how the Fund uses derivatives, adversely affect the Fund’s performance, and increase costs related to the Fund’s use of derivatives.
|
|
In December 2020, the SEC adopted a new rule providing a framework for fund valuation practices (“Rule 2a-5”). Rule 2a-5 establishes
requirements for determining fair value in good faith for purposes of the 1940 Act. Rule 2a-5 permits fund boards
|
|
HENNESSY FUNDS
|
1-800-966-4354
|
17
|
to designate certain parties to perform fair value determinations, subject to board oversight and certain other conditions. Rule 2a-5 also defines when market quotations are “readily available” for purposes
of the 1940 Act and the threshold for determining whether a fund must fair value a security. In connection with Rule 2a-5, the SEC also adopted related recordkeeping requirements and is rescinding previously issued guidance, including
with respect to the role of a board in determining fair value and the accounting and auditing of fund investments. Funds must comply with the rules by September 8, 2022. Management is currently assessing the potential impact of the
new rules on the Fund’s financial statements.
|
3). SECURITIES VALUATION
The Fund follows its valuation policies and procedures in determining its net asset value and, in preparing these financial statements, the fair value accounting standards that establish an authoritative definition
of fair value and set out a hierarchy for measuring fair value. These standards require additional disclosures about the various inputs and valuation techniques used to develop the measurements of fair value and a discussion of changes in
valuation techniques and related inputs during the period. These inputs are summarized in the three broad levels listed below:
|
Level 1 –
|
Unadjusted, quoted prices in active markets for identical instruments that the Fund has the ability to access at the date of measurement.
|
|
|
Level 2 –
|
Other significant observable inputs (including, but not limited to, quoted prices in active markets for similar instruments, quoted prices in markets that are not active for identical or similar instruments,
and model-derived valuations in which all significant inputs and significant value drivers are observable in active markets, such as interest rates, prepayment speeds, credit risk curves, default rates, and similar data).
|
|
|
Level 3 –
|
Significant unobservable inputs (including the Fund’s own assumptions about what market participants would use to price the asset or liability based on the best available information) when observable inputs
are unavailable.
|
The following is a description of the valuation techniques applied to the Fund’s major categories of assets and liabilities on a recurring basis:
|
Equity Securities – Equity securities, including common stocks, preferred stocks, exchange-traded funds, closed-end mutual funds, partnerships, rights, and real
estate investment trusts, that are traded on a securities exchange for which a last-quoted sales price is readily available generally are valued at the last sales price as reported by the primary exchange on which the securities are
listed. Securities listed on The Nasdaq Stock Market (“Nasdaq”) generally are valued at the Nasdaq Official Closing Price, which may differ from the last sales price reported. Securities traded on a securities exchange for which a
last-quoted sales price is not readily available generally are valued at the mean between the bid and ask prices. To the extent these securities are actively traded and valuation adjustments are not applied, they are classified in
Level 1 of the fair value hierarchy.
|
|
|
Registered Investment Companies – Investments in open-end registered investment companies, commonly referred to as mutual funds, generally are priced at the ending
NAV provided by the applicable mutual fund’s service agent and are classified in Level 1 of the fair value hierarchy.
|
|
|
Debt Securities – Debt securities, including corporate bonds, asset-backed securities, mortgage-backed securities, municipal bonds, U.S. Treasuries, and U.S.
government agency issues, are generally valued at market on the basis of valuations furnished by
|
|
WWW.HENNESSYFUNDS.COM
|
18
|
NOTES TO THE FINANCIAL STATEMENTS
|
|
an independent pricing service that utilizes both dealer-supplied valuations and formula-based techniques. The pricing service may consider recently executed transactions in securities of the issuer or
comparable issuers, market price quotations (where observable), bond spreads, and fundamental data relating to the issuer. In addition, the model may incorporate observable market data, such as reported sales of similar securities,
broker quotes, yields, bids, offers, and reference data. Certain securities are valued primarily using dealer quotations. These securities are generally classified in Level 2 of the fair value hierarchy.
|
|
|
Short-Term Securities – Short-term equity investments, including money market funds, are valued in the manner specified above for equity securities. Short-term debt
investments with an original term to maturity of 60 days or less are valued at amortized cost, which approximates fair market value. If the original term to maturity of a short-term debt investment exceeds 60 days, then the values as
of the 61st day prior to maturity are amortized. Amortized cost is not used if its use would be inappropriate due to credit or other impairments of the issuer, in which case the security’s fair value would be determined as described
below. Short-term securities are generally classified in Level 1 or Level 2 of the fair value hierarchy depending on the inputs used and market activity levels for specific securities.
|
The Board of Trustees of the Fund (the “Board”) has adopted fair value pricing procedures that are followed when a price for a security is not readily available or if a significant event has
occurred that indicates the closing price of a security no longer represents the true value of that security. Fair value pricing determinations are made in good faith in accordance with these procedures. There are numerous criteria considered
in determining a fair value of a security, such as the trading volume of a security and markets, the values of other similar securities, and news events with direct bearing on a security or markets. Fair value pricing results in an estimated
price for a security that reflects the amount the Fund might reasonably expect to receive in a current sale. Depending on the relative significance of the valuation inputs, these securities may be classified in either Level 2 or Level 3 of
the fair value hierarchy.
The Board has delegated day-to-day valuation matters to the Valuation and Liquidity Committee comprising representatives from Hennessy Advisors, Inc., the Fund’s investment advisor (the
“Advisor”). The function of the Valuation and Liquidity Committee, among other things, is to value securities where current and reliable market quotations are not readily available. All actions taken by the Valuation and Liquidity Committee
are reviewed by the Board.
The Fund has performed an analysis of all existing investments to determine the significance and character of all inputs to their fair value determinations. Various inputs are used to determine
the value of the Fund’s investments. The inputs or methodology used for valuing securities are not necessarily an indication of the risk associated with investing in those securities. Details related to the fair value hierarchy of the Fund’s
securities as of April 30, 2022, are included in the Schedule of Investments.
4). INVESTMENT TRANSACTIONS
Purchases and sales of investment securities (excluding government and short-term investments) for the Fund during the six months ended April 30, 2022, were $108,694,171 and $116,628,835, respectively.
There were no purchases or sales/maturities of long-term U.S. government securities for the Fund during the six months ended April 30, 2022.
|
HENNESSY FUNDS
|
1-800-966-4354
|
19
5). INVESTMENT ADVISORY FEE AND OTHER TRANSACTIONS WITH AFFILIATES
The Advisor provides the Fund with investment advisory services under an Investment Advisory Agreement. The Advisor furnishes all investment advice, office space, and facilities and most of the personnel needed by
the Fund. As compensation for its services, the Advisor is entitled to a monthly fee from the Fund. The fee is based on the average daily net assets of the Fund at an annual rate of 0.74%. The net investment advisory fees expensed by the Fund
during the six months ended April 30, 2022, are included in the Statement of Operations.
From December 1, 2017, through November 30, 2019, the Advisor contractually agreed to limit total annual operating expenses to 1.29% of the Fund’s net assets for Investor Class shares and 0.98% of
the Fund’s net assets for Institutional Class shares (in each case, excluding all federal, state, and local taxes, interest, brokerage commissions, extraordinary items, and acquired fund fees and expenses and other costs incurred in
connection with the purchase and sale of securities).
For three years following the date on which expenses were waived or incurred, the Advisor may recoup waived or reimbursed expenses from the Fund if total operating expenses, including such
recoupment, does not exceed the expense limitation in effect (i) at the time the Advisor waived or reimbursed such expenses and (ii) at the time the Advisor recoups such expenses. As of April 30, 2022, expenses subject to potential recovery
for Investor Class and Institutional Class shares and the fiscal years in which they expire were as follows:
|
Fiscal Year
|
Fiscal Year
|
|||||||||||
|
2022
|
2023
|
Total
|
||||||||||
|
Investor Class
|
$
|
12,258
|
$
|
—
|
$
|
12,258
|
||||||
|
Institutional Class
|
$
|
2,261
|
$
|
162
|
$
|
2,423
|
||||||
During the six months ended April 30, 2022, the Advisor recouped previously waived expenses from the Fund as set forth in the Statement of Operations.
The Board has approved a Shareholder Servicing Agreement for Investor Class shares of the Fund, which compensates the Advisor for the non-investment advisory services it provides to the Fund. The
Shareholder Servicing Agreement provides for a monthly fee paid to the Advisor at an annual rate of 0.10% of the average daily net assets of the Fund attributable to Investor Class shares. The shareholder service fees expensed by the Fund
during the six months ended April 30, 2022, are included in the Statement of Operations.
The Fund has adopted a plan pursuant to Rule 12b-1 under the Investment Company Act of 1940, as amended, that authorizes payments in connection with the distribution of Fund shares at an annual
rate of up to 0.25% of the Fund’s average daily net assets attributable to Investor Class shares. Even though the authorized rate is up to 0.25%, the Fund is currently only using up to 0.15% of its average daily net assets attributable to
Investor Class shares for such purpose. Amounts paid under the plan may be spent on any activities or expenses primarily intended to result in the sale of shares, including, but not limited to, advertising, shareholder account servicing,
printing and mailing of prospectuses to other than current shareholders, printing and mailing of sales literature, and compensation for sales and marketing activities or to financial institutions and others, such as dealers and distributors.
The distribution fees expensed by the Fund during the six months ended April 30, 2022, are included in the Statement of Operations.
The Fund has entered into agreements with various brokers, dealers, and financial intermediaries in connection with the sale of Fund shares. The agreements provide for periodic payments of
sub-transfer agent expenses by the Fund to the brokers, dealers, and
|
WWW.HENNESSYFUNDS.COM
|
20
|
NOTES TO THE FINANCIAL STATEMENTS
|
financial intermediaries for providing certain shareholder maintenance services. These shareholder services include the pre-processing and quality control of new accounts, shareholder correspondence, answering
customer inquiries regarding account status, and facilitating shareholder telephone transactions. The sub-transfer agent fees expensed by the Fund during the six months ended April 30, 2022, are included in the Statement of Operations.
U.S. Bancorp Fund Services, LLC, d/b/a U.S. Bank Global Fund Services (“Fund Services”) provides the Fund with administrative, accounting, and transfer agent services. As administrator, Fund
Services is responsible for activities such as (i) preparing various federal and state regulatory filings, reports, and returns for the Fund, (ii) preparing reports and materials to be supplied to the Board, (iii) monitoring the activities of
the Fund’s custodian, transfer agent, and accountants, and (iv) coordinating the preparation and payment of the Fund’s expenses and reviewing the Fund’s expense accruals. U.S. Bank N.A., an affiliate of Fund Services, serves as the Fund’s
custodian. The servicing agreements between the Trust, Fund Services, and U.S. Bank N.A. contain a fee schedule that is inclusive of administrative, accounting, custody, and transfer agent fees. The administrative, accounting, custody, and
transfer agent fees expensed by the Fund during the six months ended April 30, 2022, are included in the Statement of Operations.
Quasar Distributors, LLC (“Quasar”), a wholly owned broker-dealer subsidiary of Foreside Financial Group, LLC, acts as the Fund’s principal underwriter in a continuous public offering of Fund
shares.
The officers of the Fund are affiliated with the Advisor. With the exception of the Chief Compliance Officer and the Senior Compliance Officer, such officers receive no compensation from the Fund
for serving in their respective roles. The Fund, along with the other funds in the Hennessy Funds family (collectively, the “Hennessy Funds”), makes reimbursement payments on an equal basis to the Advisor for a portion of the salary and
benefits associated with the office of the Chief Compliance Officer and for all of the salary and benefits associated with the office of the Senior Compliance Officer. The compliance fees expensed by the Fund during the six months ended April
30, 2022, are included in the Statement of Operations.
6). GUARANTEES AND INDEMNIFICATIONS
Under the Hennessy Funds’ organizational documents, their officers and trustees are indemnified by the Hennessy Funds against certain liabilities arising out of the performance of their duties to the Hennessy Funds.
Additionally, in the normal course of business, the Hennessy Funds enter into contracts with service providers that contain general indemnification clauses. The Fund’s maximum exposure under these arrangements is unknown as this would involve
future claims that may be made against the Fund that have not yet occurred. Currently, the Fund expects the risk of loss to be remote.
7). LINE OF CREDIT
The Fund has an uncommitted line of credit with the other Hennessy Funds in the amount of the lesser of (i) $100,000,000 or (ii) 33.33% of each Hennessy Fund’s net assets, or 30% for the Hennessy Gas Utility Fund
and 10% for the Hennessy Balanced Fund. The line of credit is intended to provide any necessary short-term financing in connection with shareholder redemptions, subject to certain restrictions. The credit facility is with the Hennessy Funds’
custodian bank, U.S. Bank N.A. Borrowings under this arrangement bear interest at the bank’s prime rate and are secured by all of the Fund’s assets (as to its own borrowings only). During the six months ended April 30, 2022, the Fund did not
have any borrowings outstanding under the line of credit.
|
HENNESSY FUNDS
|
1-800-966-4354
|
21
8). FEDERAL TAX INFORMATION
As of October 31, 2021, the Fund’s most recent fiscal year end, the components of accumulated earnings (losses) for income tax purposes were as follows:
|
Investments
|
||||
|
Cost of investments for tax purposes
|
$
|
126,550,944
|
||
|
Gross tax unrealized appreciation
|
$
|
37,333,974
|
||
|
Gross tax unrealized depreciation
|
(2,168,152
|
)
|
||
|
Net tax unrealized appreciation/(depreciation)
|
$
|
35,165,822
|
||
|
Undistributed ordinary income
|
$
|
1,496,191
|
||
|
Undistributed long-term capital gains
|
19,535,388
|
|||
|
Total distributable earnings
|
$
|
21,031,579
|
||
|
Other accumulated gain/(loss)
|
$
|
—
|
||
|
Total accumulated gain/(loss)
|
$
|
56,197,401
|
||
The difference between book-basis unrealized appreciation/depreciation and tax-basis unrealized appreciation/depreciation (as shown above) is attributable primarily to wash sales.
As of October 31, 2021, the Fund had no tax- basis capital losses to offset future capital gains.
As of October 31, 2021, the Fund did not defer, on a tax basis, any late-year ordinary losses. Late-year ordinary losses are net ordinary losses incurred after December 31, 2020, but within the
taxable year, that are deemed to arise on the first day of the Fund’s next taxable year.
During fiscal year 2022 (year to date) and fiscal year 2021, the tax character of distributions paid by the Fund was as follows:
|
Six Months Ended
|
Year Ended
|
||||||||
|
April 30, 2022
|
October 31, 2021
|
||||||||
|
Ordinary income(1)
|
$
|
1,496,384
|
$
|
1,164,101
|
|||||
|
Long-term capital gains
|
19,535,444
|
5,472,732
|
|||||||
|
Total distributions
|
$
|
21,031,828
|
$
|
6,636,833
|
|||||
|
(1) Ordinary income includes short-term capital gains.
|
9). EVENTS SUBSEQUENT TO PERIOD END
Management has evaluated the Fund’s related events and transactions that occurred subsequent to April 30, 2022, through the date of issuance of the Fund’s financial statements. Management has determined that there
were no subsequent events requiring recognition or disclosure in the financial statements.
|
WWW.HENNESSYFUNDS.COM
|
22
|
NOTES TO THE FINANCIAL STATEMENTS/EXPENSE EXAMPLE
|
Expense Example (Unaudited)
April 30, 2022
As a shareholder of the Fund, you incur ongoing costs, including management fees, service fees, and other Fund expenses. This Example is intended to help you understand your ongoing costs (in dollars) of investing
in the Fund and to compare these costs with the ongoing costs of investing in other mutual funds. The Example is based on an investment of $1,000 invested at the beginning of the period and held for the entire period from November 1, 2021,
through April 30, 2022.
Actual Expenses
In the table below, the first line under each of the “Investor Class” and “Institutional Class” headings provides information about actual account values and actual expenses for each share class. You may use this
information, together with the amount you invested, to estimate the expenses that you paid over the period. Simply divide your account value by $1,000 (for example, an $8,600 account value divided by $1,000 = 8.6), then multiply the result by
the number in the first line under the heading “Expenses Paid During Period” to estimate the expenses you paid on your account during this period. Although the Fund charges no sales loads or transaction fees, you will be assessed fees for
outgoing wire transfers, returned checks, and stop payment orders at prevailing rates charged by U.S. Bank Global Fund Services, the Fund’s transfer agent. If you request that a redemption be made by wire transfer, the Fund’s transfer agent
charges a $15 fee. IRAs are charged a $15 annual maintenance fee (up to $30 maximum per shareholder for shareholders with multiple IRAs). The examples below include, but are not limited to, management, shareholder servicing, accounting,
custody, and transfer agent fees. However, the examples below do not include portfolio trading commissions and related expenses.
Hypothetical Example for Comparison Purposes
In the table below, the second line under each of the “Investor Class” and “Institutional Class” headings provides information about hypothetical account values and hypothetical expenses based on the Fund’s actual
expense ratio for each share class and an assumed rate of return of 5% per year before expenses, which is not the Fund’s actual return for such share class. The hypothetical account values and expenses may not be used to estimate the actual
ending account balance or expenses you paid for the period. You may use this information to compare the ongoing costs of investing in the Fund and other funds. To do so, compare these 5% hypothetical examples with the 5% hypothetical examples
that appear in the shareholder reports of the other funds. Please note that the expenses shown in the table are meant to highlight your ongoing costs only. Therefore, the second lines under “Investor Class” and “Institutional Class” are
useful in comparing ongoing costs only and will not help you determine the relative total costs of owning different funds.
|
HENNESSY FUNDS
|
1-800-966-4354
|
23
|
Beginning
|
Ending
|
||
|
Account Value
|
Account Value
|
Expenses Paid
|
|
|
November 1, 2021
|
April 30, 2022
|
During Period(1)
|
|
|
Investor Class
|
|||
|
Actual
|
$1,000.00
|
$ 937.90
|
$6.20
|
|
Hypothetical (5% return before expenses)
|
$1,000.00
|
$1,018.40
|
$6.46
|
|
Institutional Class
|
|||
|
Actual
|
$1,000.00
|
$ 939.70
|
$4.71
|
|
Hypothetical (5% return before expenses)
|
$1,000.00
|
$1,019.93
|
$4.91
|
|
(1)
|
Expenses are equal to the Fund’s annualized expense ratio of 1.29% for Investor Class shares or 0.98% for Institutional Class shares, as applicable, multiplied by the average account value over the period,
multiplied by 181/365 days (to reflect the half-year period).
|
|
WWW.HENNESSYFUNDS.COM
|
24
|
EXPENSE EXAMPLE — ELECTRONIC DELIVERY
|
How to Obtain a Copy of the Fund’s Proxy
Voting Policy and Proxy Voting Records
A description of the policies and procedures the Fund uses to determine how to vote proxies relating to portfolio securities is available without charge (1) by calling 800-966-4354, (2) on the Hennessy Funds’
website at www.hennessyfunds.com/proxy-voting/voting-policy, or (3) on the U.S. Securities and Exchange Commission’s (the “SEC”) website at www.sec.gov. The Fund’s proxy voting record is available without charge on both the Hennessy Funds’
website at www.hennessyfunds.com/proxy-voting/voting-record and the SEC’s website at www.sec.gov no later than August 31 for the prior 12 months ending June 30.
Availability of Quarterly Portfolio Schedule
The Fund files its complete schedule of portfolio holdings with the SEC for the first and third quarters of each fiscal year as an exhibit to its reports on Form N-PORT. The Fund’s Form N-PORT reports are available
on the SEC’s website at www.sec.gov or on request by calling 800-966-4354.
Federal Tax Distribution Information (Unaudited)
For fiscal year 2021, certain dividends paid by the Fund may be subject to a maximum tax rate of 23.8%, as provided for by the Jobs and Growth Tax Relief Reconciliation Act of 2003. The percentage of dividends
declared from ordinary income designated as qualified dividend income was 100.00%.
For corporate shareholders, the percent of ordinary income distributions that qualified for the corporate dividends received deduction for fiscal year 2021 was 100.00%.
The percentage of taxable ordinary income distributions that were designated as short-term capital gain distributions under Section 871(k)(2)(C) of the Internal Revenue Code of 1986, as amended,
for the Fund was 0.00%.
Important Notice Regarding Delivery
of Shareholder Documents
To help keep the Fund’s costs as low as possible, we generally deliver a single copy of shareholder reports, proxy statements, and prospectuses to shareholders who share an address and have the same last name. This
process does not apply to account statements. You may request an individual copy of a shareholder document at any time. If you would like to receive separate mailings of shareholder documents, please call U.S. Bank Global Fund Services at
800-261-6950 or 414-765-4124, and individual delivery will begin within 30 days of your request. If your account is held through a financial institution or other intermediary, please contact such intermediary directly to request individual
delivery.
Electronic Delivery
As permitted by SEC regulations, the Fund’s shareholder reports are made available on a website, and unless you sign up for eDelivery or elect to receive paper copies as detailed below, you will be notified each
time a report is posted and provided with a website link to access the report.
The Fund also offers shareholders the option to receive all notices, account statements, prospectuses, tax forms, and shareholder reports electronically. To sign up for eDelivery or change your
delivery preference, please visit www.hennessyfunds.com/account.
To elect to receive paper copies of all future reports free of charge, please call U.S. Bank Global Fund Services at 800-261-6950 or 414-765-4124.
Subscribe to receive our team’s unique market and sector insights delivered to your inbox
www.hennessyfunds.com/subscribe
Follow us on social media
| |
|
|
HENNESSY FUNDS
|
1-800-966-4354
|
25
Board Approval of Investment Advisory
Agreement
At its meeting on March 11, 2022, the Board of Trustees of the Fund (the “Board,” and the members thereof, the “Trustees”) unanimously approved the continuation of the investment advisory agreement of the Fund with
Hennessy Advisors, Inc. (the “Advisor”). As part of the process, the Trustees reviewed their fiduciary duties and the relevant factors for them to consider with respect to approving the advisory agreement. In addition, the Trustees who are
not deemed “interested persons” (as defined by the Investment Company Act of 1940, as amended) of the Fund (the “Independent Trustees”) met in executive session to discuss the approval of the advisory agreement. As part of their discussion,
the Independent Trustees confirmed their understanding of the need to have asked about, and received answers to, any matters that they believed are relevant to determining whether to approve the continuation of the advisory agreement.
In advance of the meeting, the Advisor sent detailed information to the Trustees to assist them in their evaluation of the advisory agreement. This information included, but was not limited to,
the following:
|
(1)
|
A memorandum from outside legal counsel that described the fiduciary duties of the Board with respect to approving the continuation of the advisory agreement and the relevant factors for consideration;
|
|
|
(2)
|
A memorandum from the Advisor that listed the factors relevant to the Board’s approval of the continuation of the advisory agreement and also referenced the documents that had been provided to help the Board
assess each such factor;
|
|
|
(3)
|
The Advisor’s financial statements from its most recent Form 10-K and Form 10-Q;
|
|
|
(4)
|
A summary of the advisory agreement;
|
|
|
(5)
|
A recent Fund fact sheet, which included, among other things, Fund performance over various periods;
|
|
|
(6)
|
A description of the range of services provided by the Advisor;
|
|
|
(7)
|
A peer expense comparison of the net expense ratio and investment advisory fee of the Fund; and
|
|
|
(8)
|
A memorandum from the Advisor regarding economies of scale.
|
The Trustees reviewed and discussed all of the information provided by the Advisor. Following this review, and further discussion with the Advisor, the Trustees concluded that the information
provided before and at the meeting addressed all of the relevant matters that they wanted to consider in assessing the performance of the Funds and the performance of the Advisor under the advisory agreement, and that said information
provided them with a fulsome understanding of the advisory agreement and the services provided by the Advisor.
All of the factors discussed were considered as a whole by the Trustees, as well as by the Independent Trustees meeting in executive session. The Trustees viewed the relevant factors in their
totality, with no single factor being the principal or determinative factor in the Trustees’ determination of whether to approve the continuation of the advisory agreement. The Trustees recognized that the management and fee arrangements for
the Fund are the result of years of review and discussion between the Independent Trustees and the Advisor, that certain aspects of such arrangements may receive greater scrutiny in some years than in others, and that the Trustees’
conclusions may be based, in part, on
|
WWW.HENNESSYFUNDS.COM
|
26
|
BOARD APPROVAL OF INVESTMENT ADVISORY AGREEMENT
|
their consideration of these same arrangements and information received during the course of the year and in prior years.
Prior to approving the continuation of the advisory agreement, the Trustees, including the Independent Trustees in executive session, considered, among other items:
|
(1)
|
The nature and quality of the advisory services provided by the Advisor;
|
|
|
(2)
|
A comparison of the fees and expenses of the Fund to other similar funds;
|
|
|
(3)
|
Whether economies of scale are recognized by the Fund;
|
|
|
(4)
|
The costs and profitability of the Fund to the Advisor;
|
|
|
(5)
|
The performance of the Fund; and
|
|
|
(6)
|
Any benefits to the Advisor from serving as an investment advisor to the Fund (other than the advisory fee).
|
The material considerations and determinations of the Trustees, including the Independent Trustees, were as follows:
|
(1)
|
The Trustees considered the services identified below that are provided by the Advisor. Based on this review and an assessment of the Advisor’s performance, the Trustees concluded that the Advisor provides
high-quality services to the Fund, and they noted that their overall confidence in the Advisor was high. The Trustees also concluded that they were satisfied with the nature, extent, and quality of the advisory services provided to
the Fund by the Advisor and that the nature and extent of the services provided by the Advisor were appropriate to assure that the Fund’s operations are conducted in compliance with applicable laws, rules, and regulations.
|
|
(a)
|
The Advisor acts as the portfolio manager for the Fund. In this capacity, the Advisor does the following:
|
|
(i)
|
manages the composition of the Fund’s portfolio, including the purchase, retention, and disposition of portfolio securities in accordance with the Fund’s investment objectives, policies, and restrictions;
|
|||
|
(ii)
|
seeks best execution for the Fund’s portfolio;
|
|||
|
(iii)
|
manages the use of soft dollars for the Fund; and
|
|||
|
(iv)
|
manages proxy voting for the Fund.
|
|
(b)
|
The Advisor performs a daily reconciliation of portfolio positions and cash for the Fund.
|
||
|
(c)
|
The Advisor monitors the liquidity of each Fund.
|
||
|
(d)
|
The Advisor monitors the Fund’s compliance with its investment objectives and restrictions and federal securities laws.
|
||
|
(e)
|
The Advisor maintains a compliance program (including a code of ethics), conducts ongoing reviews of the compliance programs of the Fund’s service providers (including their codes of ethics, as appropriate),
conducts on-site visits to the Fund’s service providers, as feasible, monitors incidents of abusive trading practices, reviews Fund expense accruals, payments, and fixed expense ratios, evaluates insurance providers for fidelity bond,
D&O/E&O insurance, and cybersecurity insurance coverage, manages regulatory examination compliance and responses, conducts employee compliance training, reviews reports provided by service providers, and maintains books and
records.
|
|
HENNESSY FUNDS
|
1-800-966-4354
|
27
|
(f)
|
The Advisor oversees service providers that provide accounting, administration, distribution, transfer agency, custodial, sales, marketing, public relations, audit, information technology, and legal services
to the Fund.
|
||
|
(g)
|
The Advisor maintains in-house marketing and distribution departments on behalf of the Fund.
|
||
|
(h)
|
The Advisor prepares or directs the preparation of all regulatory filings for the Fund, including writing and annually updating the Fund’s prospectus and related documents.
|
||
|
(i)
|
For each annual report of the Fund, the Advisor prepares a written summary of the Fund’s performance during the most recent 12-month period.
|
||
|
(j)
|
The Advisor oversees distribution of the Fund through third-party broker/dealers and independent financial institutions such as Charles Schwab, Inc., Fidelity, TD Ameritrade, and Pershing. The Advisor
participates in “no transaction fee” (“NTF”) programs with these companies on behalf of the Fund, which allow customers to purchase the Fund through third-party distribution channels without paying a transaction fee. The Advisor
compensates, in part, a number of these third-party providers of NTF programs out of its own revenues.
|
||
|
(k)
|
The Advisor pays the incentive compensation of the Fund’s compliance officers and employs other staff, such as legal, marketing, national accounts, distribution, sales, administrative, and trading oversight
personnel, as well as management executives.
|
||
|
(l)
|
The Advisor provides a quarterly compliance certification to the Board.
|
||
|
(m)
|
The Advisor prepares or reviews all Board materials, presents to and leads discussions with the Board, prepares or reviews all meeting minutes, and arranges for Board training and education.
|
|
(2)
|
The Trustees compared the performance of the Fund to benchmark indices over various periods and noted that the Trustees review and discuss reports comparing the investment performance of the Fund to various
indices at each quarterly Board meeting. Based on such information, the Trustees determined that the Advisor manages the Fund in a manner materially consistent with its stated investment objective and style. The Trustees concluded
that the performance of the Fund over various periods warranted the continuation of the advisory agreement.
|
|
|
(3)
|
The Trustees reviewed the advisory fees and overall expense ratios of the Fund compared to other funds similar in asset size and investment objective to the Fund using data from Morningstar. As part of the
discussion with management, the Trustees ensured that they understood and were comfortable with the criteria used to determine the mutual funds included in the Morningstar categories for purposes of the materials considered at the
meeting. The Trustees determined that the advisory fee and overall expense ratio of the Fund falls within a reasonable range of the advisory fees and overall expense ratios of other comparable funds and concluded that they are
reasonable and warranted continuation of the advisory agreement.
|
|
|
(4)
|
The Trustees also considered whether the Advisor was realizing economies of scale that should be shared with the Fund’s shareholders. The Trustees noted that the majority of expenses incurred to manage the
Fund are variable
|
|
WWW.HENNESSYFUNDS.COM
|
28
|
BOARD APPROVAL OF INVESTMENT ADVISORY AGREEMENT
|
|
asset-based fees, so the Advisor does not realize material economies of scale relating to these expenses as the assets of the Fund increase. For example, third-party platform fees increase as the Fund’s
assets grow.
|
||
|
(5)
|
The Trustees considered the profitability of the Advisor, including the impact of mutual fund platform fees on the Advisor’s profitability, and also considered the resources and revenues that the Advisor has
put into managing and distributing the Fund. The Trustees then concluded that the profits of the Advisor are reasonable and not excessive when compared to profitability guidelines set forth in relevant court cases.
|
|
|
(6)
|
The Trustees considered the high level of professionalism and knowledge of the Advisor’s employees and concluded that this was beneficial to the Fund and its shareholders.
|
|
|
(7)
|
The Trustees considered any benefits to the Advisor from serving as an advisor to the Fund (other than the advisory fee). The Trustees noted that the Advisor may derive ancillary benefits from, by way of
example, its association with the Fund in the form of proprietary and third-party research products and services received from broker-dealers that execute portfolio trades for the Fund. The Trustees determined that any such products
and services have been used for legitimate purposes relating to the Fund by providing assistance in the investment decision-making process. The Trustees concluded that any additional benefits realized by the Advisor from its
relationship with the Fund were reasonable, which was based on, among other things, the Trustees’ finding that the research, analytical, statistical, and other information and services provided by brokers are merely supplemental to
the Advisor’s own efforts in the performance of its duties under the advisory agreement.
|
After reviewing the materials and information provided at the meeting, as well as other information regularly provided at the Board’s quarterly meetings throughout the year regarding the quality
of services provided by the Advisor, the performance of the Fund, expense information, brokerage commissions information, the adequacy and efficacy of the Advisor’s written policies and procedures, other regulatory compliance issues, trading
information and related matters, and other factors that the Trustees deemed relevant, the Trustees, including the Independent Trustees, approved the continuation of the advisory agreement.
|
HENNESSY FUNDS
|
1-800-966-4354
|
29
For information, questions, or assistance, please call
The Hennessy Funds
800-966-4354 or 415-899-1555
INVESTMENT ADVISOR
Hennessy Advisors, Inc.
7250 Redwood Boulevard, Suite 200
Novato, California 94945
ADMINISTRATOR,
TRANSFER AGENT,
DIVIDEND PAYING AGENT, &
SHAREHOLDER SERVICING AGENT
U.S. Bancorp Fund Services, LLC
d/b/a U.S. Bank Global Fund Services
P.O. Box 701
Milwaukee, Wisconsin 53201-0701
CUSTODIAN
U.S. Bank N.A.
Custody Operations
1555 North River Center Drive, Suite 302
Milwaukee, Wisconsin 53212
TRUSTEES
Neil J. Hennessy
J. Dennis DeSousa
Robert T. Doyle
Claire Garvie
Gerald P. Richardson
COUNSEL
Foley & Lardner LLP
777 East Wisconsin Avenue
Milwaukee, Wisconsin 53202-5306
INDEPENDENT REGISTERED
PUBLIC ACCOUNTING FIRM
Tait, Weller & Baker LLP
Two Liberty Place
50 South 16th Street, Suite 2900
Philadelphia, Pennsylvania 19102-2529
DISTRIBUTOR
Quasar Distributors, LLC
111 East Kilbourn Avenue, Suite 1250
Milwaukee, Wisconsin 53202
www.hennessyfunds.com | 800-966-4354
This report has been prepared for shareholders and may be distributed to
others only if preceded or accompanied by a current prospectus.
SEMI-ANNUAL REPORT
APRIL 30, 2022

HENNESSY CORNERSTONE VALUE FUND
Investor Class HFCVX
Institutional Class HICVX
www.hennessyfunds.com | 1-800-966-4354
(This Page Intentionally Left Blank.)
Contents
|
Letter to Shareholders
|
2
|
|
Performance Overview
|
4
|
|
Financial Statements
|
|
|
Schedule of Investments
|
5
|
|
Statement of Assets and Liabilities
|
9
|
|
Statement of Operations
|
10
|
|
Statements of Changes in Net Assets
|
11
|
|
Financial Highlights
|
12
|
|
Notes to the Financial Statements
|
16
|
|
Expense Example
|
24
|
|
Proxy Voting Policy and Proxy Voting Records
|
26
|
|
Availability of Quarterly Portfolio Schedule
|
26
|
|
Federal Tax Distribution Information
|
26
|
|
Important Notice Regarding Delivery of Shareholder Documents
|
26
|
|
Electronic Delivery
|
26
|
|
Board Approval of Investment Advisory Agreement
|
27
|
|
HENNESSY FUNDS
|
1-800-966-4354
|
May 2022
Dear Hennessy Funds Shareholder:
We’d like to start our semi-annual letter with a pause. At the end of 2021, we looked forward to a new year – a potentially calmer year – having come through almost two full
years of the coronavirus pandemic. As people, we were aware our lives had changed, but we hoped for a better 2022; as investors, we were aware that the economy was strong and employment was robust, yet challenges loomed, including
inflation, supply chain disruptions, and tightening monetary policy; as employees, students, and family members, we recognized much was different, but we sought a return to what’s familiar. What we didn’t know was that a world leader who
controls one of the largest militaries on the planet was about to start one of the worst atrocities in Europe since World War II. Our thoughts are with the Ukrainian people, and our hope is for this unjustified, senseless human tragedy to
end quickly.
The equity market started 2022 on a high note, with the S&P 500® Index hitting an all-time high on the first trading day of the year. This turned out to be the last hurrah for a market that saw a continuous march higher in 2021, having hit 70
new all-time highs, with a new all-time high being recorded on average every three and a half days. Concerns in the market then coalesced and overpowered bullish sentiment, and the market has spiraled lower throughout 2022. Factors that
drove the market lower include: tightening monetary policy as the Federal Reserve has begun raising rates and has announced plans for shrinking its $8.5 trillion asset portfolio; inflation, higher energy costs, and their effects on the
domestic and global economies; continued supply chain disruptions; investors’ indiscriminate liquidation of broad-based ETFs and index funds and the detrimental effect on equities; and the near-term and long-term global implications of the
Russian invasion of Ukraine.
While markets are adjusting, many positive conditions remain intact. Corporate balance sheets and profits remain strong, GDP growth remains positive, the
consumer continues to show resilience in the face of rising prices, cash is abundant both at the corporate and household levels, unemployment is exceptionally low, and our financial system remains healthy. Markets are also experiencing a
change in leadership, as value stocks have been outperforming growth stocks, and traditionally defensive sectors such as Utilities and Consumer Staples have been outperforming the broader market. Finally, the Energy sector has soared in
2022, as companies reap the benefits of dramatically higher oil and natural gas prices, and shareholders are rewarded with significantly higher dividends, aggressive buybacks, and higher stock prices after many years of underperformance for
the sector.
With history as our guide, we are hopeful that eventually the market may bottom and head higher again. Since the financial crisis of 2008, we have
experienced many corrections and many recoveries to new highs. The Dow Jones Industrial Average has dropped over 10% eight times, including the current drop, for a median decline of 14.00%, and on average, it took 45 trading days to drop
from peak to trough and 127 trading days to return to the previous peak. Since the current drop has taken longer to go from peak to its recent trough, it may take some time for a recovery in prices to truly take hold.
On a positive note, valuations have come in, and many stocks have become more attractive, especially for longer-term investors. We note, however, that the
concept of “historically cheap stocks” does not, on its own, move the market higher. Rather, it is
|
WWW.HENNESSYFUNDS.COM
|
2
|
LETTER TO SHAREHOLDERS
|
overall capitulation and improving fundamentals that could bring buyers back into the market and reverse any bearish trends. Investors need to see improving company earnings, retreating inflationary trends, a
measured pace of interest rate increases globally that does not cause significant economic contraction, hope for a more peaceful and orderly world economic system unconstrained by supply bottlenecks and other hindrances to global trade,
and, most importantly, a subsidence of the deleterious effects of the coronavirus pandemic. While that may seem like a “tall order,” we believe that patient investing, focusing on value, quality, and downside risk mitigation, works well
over the longer term.
During this tumultuous period, performance of the majority of the Hennessy Funds has been relatively strong when compared to the overall market as well as to our
benchmarks. During the six months ended April 30, 2022, the Dow Jones Industrial Average, the S&P 500® Index, and the NASDAQ Composite Index
dropped 7.05%, 9.65%, and 20.15%, respectively, on a total return basis. During this period when these three major indices saw significant declines, we were pleased that seven of our 16 Funds posted positive total returns, 10 of our 14
domestic Funds outperformed the S&P 500® Index, and over half of our active funds outperformed their primary benchmarks.
We thank you, our shareholders, for your continued interest in our family of Funds. We are grateful for the trust you put in us, and we will continue to
strive to manage our portfolios for long-term performance, ever mindful of downside risk. While volatility and uncertainty may impact the markets in the short-term, we encourage investors to stay the course, maintain a diversified
portfolio, and keep a long-term perspective. If you have any questions or would like to speak with us, please don’t hesitate to call us directly at (800) 966-4354. In closing, we would also like to thank all of the healthcare and frontline
workers that have worked – and still work – tirelessly throughout the coronavirus pandemic.
Best regards,
|
|
|
|
|
Ryan C. Kelley, CFA
|
|
|
Chief Investment Officer,
|
|
|
Senior Vice President, and Portfolio Manager
|
Past performance does not guarantee future results.
Mutual fund investing involves risk. Principal loss is possible.
Opinions expressed are those of Ryan C. Kelley and are subject to change, are not guaranteed, and should not be considered investment advice.
The Dow Jones Industrial Average and S&P 500® Index are commonly used to measure the performance of U.S. stocks. The NASDAQ
Composite Index comprises all common stocks listed on The NASDAQ Stock Market and is commonly used to measure the performance of technology-related stocks. The indices are used herein for comparative purposes in accordance with SEC
regulations. One cannot invest directly in an index. All returns are shown on a total return basis.
Please refer to the Performance Overview section for more detailed performance information.
|
HENNESSY FUNDS
|
1-800-966-4354
|
3
Performance Overview (Unaudited)
AVERAGE ANNUAL TOTAL RETURN FOR PERIODS ENDED APRIL 30, 2022
|
Six
|
One
|
Five
|
Ten
|
|
|
Months(1)
|
Year
|
Years
|
Years
|
|
|
Hennessy Cornerstone Value Fund –
|
||||
|
Investor Class (HFCVX)
|
7.88%
|
13.99%
|
9.50%
|
10.00%
|
|
Hennessy Cornerstone Value Fund –
|
||||
|
Institutional Class (HICVX)
|
8.01%
|
14.24%
|
9.74%
|
10.22%
|
|
Russell 1000® Value Index
|
-3.94%
|
1.32%
|
9.06%
|
11.17%
|
|
S&P 500® Index
|
-9.65%
|
0.21%
|
13.66%
|
13.67%
|
Expense ratios: 1.23% (Investor Class); 0.99% (Institutional Class)
|
(1)
|
Periods of less than one year are not annualized.
|
_______________
Performance data quoted represents past performance; past performance does not guarantee future results. The investment return and principal value of an investment will fluctuate so that an
investor’s shares, when redeemed, may be worth more or less than their original cost. The performance table does not reflect the deduction of taxes that a shareholder would pay on Fund distributions or the redemption of Fund shares. Current
performance of the Fund may be lower or higher than the performance quoted. Performance data current to the most recent month end may be obtained by visiting www.hennessyfunds.com.
The Russell 1000® Value Index comprises those Russell 1000®
companies with lower price-to-book ratios and lower forecasted growth value. The S&P 500® Index is a capitalization-weighted index that is designed to
represent the broad domestic economy through changes in the aggregate market value of 500 stocks across all major industries. One cannot invest directly in an index. These indices are used for comparative purposes in accordance with
Securities and Exchange Commission regulations.
Frank Russell Company (“Russell”) is the source and owner of the trademarks, service marks, and copyrights related to the Russell Indexes. Russell® is a trademark of Frank Russell Company. Neither Russell nor its licensors accept any liability for any errors or omissions in the Russell Indexes or Russell ratings or underlying data and no party may rely on any
Russell Indexes or Russell ratings or underlying data contained in this communication. No further distribution of Russell data is permitted without Russell’s express written consent. Russell does not promote, sponsor, or endorse the content
of this communication.
Standard & Poor’s Financial Services is the source and owner of the S&P® and S&P 500® trademarks.
The expense ratios presented are from the most recent prospectus. The expense ratios for the current reporting period are available in the Financial Highlights section of this report.
|
WWW.HENNESSYFUNDS.COM
|
4
|
PERFORMANCE OVERVIEW/SCHEDULE OF INVESTMENTS
|
Financial Statements
|
Schedule of Investments as of April 30, 2022 (Unaudited)
|
HENNESSY CORNERSTONE VALUE FUND
(% of Net Assets)
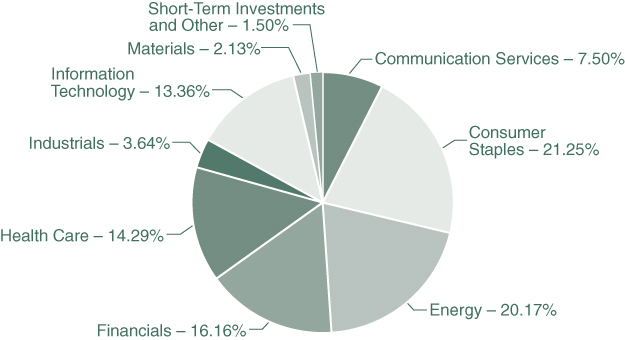
|
TOP TEN HOLDINGS (EXCLUDING MONEY MARKET FUNDS)
|
% NET ASSETS
|
|
The Kraft Heinz Co.
|
2.30%
|
|
General Mills, Inc.
|
2.29%
|
|
Merck & Co., Inc.
|
2.27%
|
|
Suncor Energy, Inc.
|
2.25%
|
|
Marathon Petroleum Corp.
|
2.21%
|
|
Altria Group, Inc.
|
2.16%
|
|
Philip Morris International, Inc.
|
2.16%
|
|
The Coca-Cola Co.
|
2.16%
|
|
Bristol-Myers Squibb Co.
|
2.15%
|
|
GlaxoSmithKline PLC – ADR
|
2.15%
|
Note: For presentation purposes, the Fund has grouped some of the industry categories. For purposes of categorizing securities for compliance with Section 8(b)(1) of the Investment Company Act of 1940, as amended,
the Fund uses more specific industry classifications.
The Global Industry Classification Standard (GICS®) was developed by and is the exclusive property and a service mark of MSCI, Inc.
and Standard & Poor’s Financial Services LLC. It has been licensed for use by the Hennessy Funds.
|
HENNESSY FUNDS
|
1-800-966-4354
|
5
|
COMMON STOCKS – 98.50%
|
Number
|
% of
|
||||||||||
|
|
of Shares
|
Value
|
Net Assets
|
|||||||||
|
Communication Services – 7.50%
|
||||||||||||
|
AT&T, Inc.
|
256,460
|
$
|
4,836,836
|
1.65
|
%
|
|||||||
|
BCE, Inc. – ADR (b)
|
109,900
|
5,843,383
|
2.00
|
%
|
||||||||
|
Paramount Global
|
163,200
|
4,752,384
|
1.62
|
%
|
||||||||
|
Verizon Communications, Inc.
|
116,200
|
5,380,060
|
1.84
|
%
|
||||||||
|
Warner Bros. Discovery, Inc. (a)
|
62,042
|
1,126,062
|
0.39
|
%
|
||||||||
|
|
21,938,725
|
7.50
|
%
|
|||||||||
|
Consumer Staples – 21.25%
|
||||||||||||
|
Altria Group, Inc.
|
113,700
|
6,318,309
|
2.16
|
%
|
||||||||
|
British American Tobacco PLC – ADR (b)
|
141,900
|
5,928,582
|
2.03
|
%
|
||||||||
|
Colgate-Palmolive Co.
|
80,100
|
6,171,705
|
2.11
|
%
|
||||||||
|
General Mills, Inc.
|
94,600
|
6,691,058
|
2.29
|
%
|
||||||||
|
PepsiCo, Inc.
|
36,500
|
6,267,415
|
2.14
|
%
|
||||||||
|
Philip Morris International, Inc.
|
63,100
|
6,310,000
|
2.16
|
%
|
||||||||
|
The Coca-Cola Co.
|
98,100
|
6,338,241
|
2.16
|
%
|
||||||||
|
The Kraft Heinz Co.
|
157,900
|
6,731,277
|
2.30
|
%
|
||||||||
|
Unilever PLC – ADR (b)
|
131,800
|
6,097,068
|
2.08
|
%
|
||||||||
|
Walgreens Boots Alliance, Inc.
|
125,400
|
5,316,960
|
1.82
|
%
|
||||||||
|
|
62,170,615
|
21.25
|
%
|
|||||||||
|
Energy – 20.17%
|
||||||||||||
|
BP PLC – ADR (b)
|
199,300
|
5,723,896
|
1.96
|
%
|
||||||||
|
Canadian Natural Resources Ltd. (b)
|
94,900
|
5,871,463
|
2.01
|
%
|
||||||||
|
Chevron Corp.
|
36,075
|
5,651,870
|
1.93
|
%
|
||||||||
|
ConocoPhillips
|
57,800
|
5,521,056
|
1.89
|
%
|
||||||||
|
Devon Energy Corp.
|
96,700
|
5,625,039
|
1.92
|
%
|
||||||||
|
EOG Resources, Inc.
|
48,500
|
5,662,860
|
1.93
|
%
|
||||||||
|
Exxon Mobil Corp.
|
72,310
|
6,164,428
|
2.11
|
%
|
||||||||
|
Marathon Petroleum Corp.
|
74,300
|
6,483,418
|
2.21
|
%
|
||||||||
|
Suncor Energy, Inc. (b)
|
183,000
|
6,577,020
|
2.25
|
%
|
||||||||
|
TotalEnergies SE – ADR (b)
|
118,100
|
5,752,651
|
1.96
|
%
|
||||||||
|
|
59,033,701
|
20.17
|
%
|
|||||||||
|
Financials – 16.16%
|
||||||||||||
|
Aflac, Inc.
|
93,700
|
5,367,136
|
1.83
|
%
|
||||||||
|
Citigroup, Inc.
|
104,300
|
5,028,303
|
1.72
|
%
|
||||||||
|
JPMorgan Chase & Co.
|
42,500
|
5,072,800
|
1.73
|
%
|
||||||||
|
Manulife Financial Corp. (b)
|
288,900
|
5,650,884
|
1.93
|
%
|
||||||||
The accompanying notes are an integral part of these financial statements.
|
WWW.HENNESSYFUNDS.COM
|
6
|
SCHEDULE OF INVESTMENTS
|
|
COMMON STOCKS
|
Number
|
% of
|
||||||||||
|
|
of Shares
|
Value
|
Net Assets
|
|||||||||
|
Financials (Continued)
|
||||||||||||
|
MetLife, Inc.
|
86,400
|
$
|
5,674,752
|
1.94
|
%
|
|||||||
|
Morgan Stanley
|
64,100
|
5,165,819
|
1.77
|
%
|
||||||||
|
Royal Bank of Canada (b)
|
52,400
|
5,293,972
|
1.81
|
%
|
||||||||
|
The Bank of New York Mellon Corp.
|
113,800
|
4,786,428
|
1.64
|
%
|
||||||||
|
The Toronto-Dominion Bank (b)
|
72,700
|
5,251,848
|
1.79
|
%
|
||||||||
|
|
47,291,942
|
16.16
|
%
|
|||||||||
|
Health Care – 14.29%
|
||||||||||||
|
AbbVie, Inc.
|
37,100
|
5,449,248
|
1.86
|
%
|
||||||||
|
Amgen, Inc.
|
25,100
|
5,853,069
|
2.00
|
%
|
||||||||
|
Bristol-Myers Squibb Co.
|
83,600
|
6,292,572
|
2.15
|
%
|
||||||||
|
Gilead Sciences, Inc.
|
99,600
|
5,910,264
|
2.02
|
%
|
||||||||
|
GlaxoSmithKline PLC – ADR (b)
|
138,700
|
6,280,336
|
2.15
|
%
|
||||||||
|
Merck & Co., Inc.
|
75,100
|
6,660,619
|
2.27
|
%
|
||||||||
|
Pfizer, Inc.
|
109,600
|
5,378,072
|
1.84
|
%
|
||||||||
|
|
41,824,180
|
14.29
|
%
|
|||||||||
|
Industrials – 3.64%
|
||||||||||||
|
3M Co.
|
40,000
|
5,768,800
|
1.97
|
%
|
||||||||
|
United Parcel Service, Inc., Class B
|
27,200
|
4,895,456
|
1.67
|
%
|
||||||||
|
|
10,664,256
|
3.64
|
%
|
|||||||||
|
Information Technology – 13.36%
|
||||||||||||
|
Cisco Systems, Inc.
|
106,100
|
5,196,778
|
1.78
|
%
|
||||||||
|
Corning, Inc.
|
157,200
|
5,531,868
|
1.89
|
%
|
||||||||
|
Hewlett Packard Enterprise Co.
|
348,400
|
5,368,844
|
1.83
|
%
|
||||||||
|
HP, Inc.
|
158,200
|
5,794,866
|
1.98
|
%
|
||||||||
|
Intel Corp.
|
125,300
|
5,461,827
|
1.87
|
%
|
||||||||
|
International Business Machines Corp.
|
46,400
|
6,134,544
|
2.10
|
%
|
||||||||
|
Texas Instruments, Inc.
|
32,900
|
5,601,225
|
1.91
|
%
|
||||||||
|
|
39,089,952
|
13.36
|
%
|
|||||||||
|
Materials – 2.13%
|
||||||||||||
|
Dow, Inc.
|
93,800
|
6,237,700
|
2.13
|
%
|
||||||||
|
|
||||||||||||
|
Total Common Stocks
|
||||||||||||
|
(Cost $261,165,666)
|
288,251,071
|
98.50
|
%
|
|||||||||
The accompanying notes are an integral part of these financial statements.
|
HENNESSY FUNDS
|
1-800-966-4354
|
7
|
SHORT-TERM INVESTMENTS – 1.36%
|
Number
|
% of
|
||||||||||
|
|
of Shares
|
Value
|
Net Assets
|
|||||||||
|
Money Market Funds – 1.36%
|
||||||||||||
|
First American Government Obligations Fund,
|
||||||||||||
|
Institutional Class, 0.22% (c)
|
3,975,097
|
$
|
3,975,097
|
1.36
|
%
|
|||||||
|
|
||||||||||||
|
Total Short-Term Investments
|
||||||||||||
|
(Cost $3,975,097)
|
3,975,097
|
1.36
|
%
|
|||||||||
|
|
||||||||||||
|
Total Investments
|
||||||||||||
|
(Cost $265,140,763) – 99.86%
|
292,226,168
|
99.86
|
%
|
|||||||||
|
Other Assets in Excess of Liabilities – 0.14%
|
405,405
|
0.14
|
%
|
|||||||||
|
|
||||||||||||
|
TOTAL NET ASSETS – 100.00%
|
$
|
292,631,573
|
100.00
|
%
|
||||||||
Percentages are stated as a percent of net assets.
ADR – American Depository Receipt
PLC – Public Limited Company
|
(a)
|
Non-income-producing security.
|
|
(b)
|
U.S.-traded security of a foreign corporation.
|
|
(c)
|
The rate listed is the fund’s seven-day yield as of April 30, 2022.
|
Summary of Fair Value Exposure as of April 30, 2022
The following is a summary of the inputs used to value the Fund’s net assets as of April 30, 2022 (see Note 3 in the accompanying Notes to the Financial Statements):
|
Common Stocks
|
Level 1
|
Level 2
|
Level 3
|
Total
|
||||||||||||
|
Communication Services
|
$
|
21,938,725
|
$
|
—
|
$
|
—
|
$
|
21,938,725
|
||||||||
|
Consumer Staples
|
62,170,615
|
—
|
—
|
62,170,615
|
||||||||||||
|
Energy
|
59,033,701
|
—
|
—
|
59,033,701
|
||||||||||||
|
Financials
|
47,291,942
|
—
|
—
|
47,291,942
|
||||||||||||
|
Health Care
|
41,824,180
|
—
|
—
|
41,824,180
|
||||||||||||
|
Industrials
|
10,664,256
|
—
|
—
|
10,664,256
|
||||||||||||
|
Information Technology
|
39,089,952
|
—
|
—
|
39,089,952
|
||||||||||||
|
Materials
|
6,237,700
|
—
|
—
|
6,237,700
|
||||||||||||
|
Total Common Stocks
|
$
|
288,251,071
|
$
|
—
|
$
|
—
|
$
|
288,251,071
|
||||||||
|
Short-Term Investments
|
||||||||||||||||
|
Money Market Funds
|
$
|
3,975,097
|
$
|
—
|
$
|
—
|
$
|
3,975,097
|
||||||||
|
Total Short-Term Investments
|
$
|
3,975,097
|
$
|
—
|
$
|
—
|
$
|
3,975,097
|
||||||||
|
Total Investments
|
$
|
292,226,168
|
$
|
—
|
$
|
—
|
$
|
292,226,168
|
||||||||
The accompanying notes are an integral part of these financial statements.
|
WWW.HENNESSYFUNDS.COM
|
8
|
SCHEDULE OF INVESTMENTS/STATEMENT OF ASSETS AND LIABILITIES
|
Financial Statements
|
Statement of Assets and Liabilities as of April 30, 2022 (Unaudited)
|
|
ASSETS:
|
||||
|
Investments in securities, at value (cost $265,140,763)
|
$
|
292,226,168
|
||
|
Dividends and interest receivable
|
693,483
|
|||
|
Dividend tax reclaim receivable
|
48,220
|
|||
|
Receivable for fund shares sold
|
57,981
|
|||
|
Prepaid expenses and other assets
|
22,459
|
|||
|
Total assets
|
293,048,311
|
|||
|
LIABILITIES:
|
||||
|
Payable for fund shares redeemed
|
20,660
|
|||
|
Payable to advisor
|
184,653
|
|||
|
Payable to administrator
|
54,320
|
|||
|
Payable to auditor
|
11,228
|
|||
|
Accrued distribution fees
|
105,719
|
|||
|
Accrued service fees
|
22,989
|
|||
|
Accrued trustees fees
|
4,488
|
|||
|
Accrued expenses and other payables
|
12,681
|
|||
|
Total liabilities
|
416,738
|
|||
|
NET ASSETS
|
$
|
292,631,573
|
||
|
NET ASSETS CONSIST OF:
|
||||
|
Capital stock
|
$
|
241,529,381
|
||
|
Total distributable earnings
|
51,102,192
|
|||
|
Total net assets
|
$
|
292,631,573
|
||
|
NET ASSETS:
|
||||
|
Investor Class
|
||||
|
Shares authorized (no par value)
|
Unlimited
|
|||
|
Net assets applicable to outstanding shares
|
$
|
270,087,979
|
||
|
Shares issued and outstanding
|
13,401,127
|
|||
|
Net asset value, offering price, and redemption price per share
|
$
|
20.15
|
||
|
Institutional Class
|
||||
|
Shares authorized (no par value)
|
Unlimited
|
|||
|
Net assets applicable to outstanding shares
|
$
|
22,543,594
|
||
|
Shares issued and outstanding
|
1,117,501
|
|||
|
Net asset value, offering price, and redemption price per share
|
$
|
20.17
|
||
The accompanying notes are an integral part of these financial statements.
|
HENNESSY FUNDS
|
1-800-966-4354
|
9
Financial Statements
|
Statement of Operations for the six months ended April 30, 2022 (Unaudited)
|
|
INVESTMENT INCOME:
|
||||
|
Dividend income(1)
|
$
|
5,413,088
|
||
|
Interest income
|
1,511
|
|||
|
Total investment income
|
5,414,599
|
|||
|
EXPENSES:
|
||||
|
Investment advisory fees (See Note 5)
|
1,037,676
|
|||
|
Distribution fees – Investor Class (See Note 5)
|
200,094
|
|||
|
Administration, accounting, custody, and transfer agent fees (See Note 5)
|
158,085
|
|||
|
Service fees – Investor Class (See Note 5)
|
133,396
|
|||
|
Sub-transfer agent expenses – Investor Class (See Note 5)
|
85,552
|
|||
|
Sub-transfer agent expenses – Institutional Class (See Note 5)
|
4,098
|
|||
|
Federal and state registration fees
|
15,463
|
|||
|
Compliance expense (See Note 5)
|
15,156
|
|||
|
Audit fees
|
11,222
|
|||
|
Trustees’ fees and expenses
|
10,611
|
|||
|
Reports to shareholders
|
6,604
|
|||
|
Legal fees
|
1,707
|
|||
|
Other expenses
|
18,922
|
|||
|
Total expenses
|
1,698,586
|
|||
|
NET INVESTMENT INCOME
|
$
|
3,716,013
|
||
|
REALIZED AND UNREALIZED GAINS (LOSSES):
|
||||
|
Net realized gain on investments
|
$
|
22,745,803
|
||
|
Net change in unrealized appreciation/depreciation on investments
|
(6,415,658
|
)
|
||
|
Net gain on investments
|
16,330,145
|
|||
|
NET INCREASE IN NET ASSETS RESULTING FROM OPERATIONS
|
$
|
20,046,158
|
||
|
(1)
|
Net of foreign taxes withheld and issuance fees of $193,532.
|
The accompanying notes are an integral part of these financial statements.
|
WWW.HENNESSYFUNDS.COM
|
10
|
STATEMENT OF OPERATIONS/STATEMENTS OF CHANGES IN NET ASSETS
|
Financial Statements
|
Statements of Changes in Net Assets
|
|
Six Months Ended
|
||||||||
|
April 30, 2022
|
Year Ended
|
|||||||
|
(Unaudited)
|
October 31, 2021
|
|||||||
|
OPERATIONS:
|
||||||||
|
Net investment income
|
$
|
3,716,013
|
$
|
5,989,743
|
||||
|
Net realized gain on investments
|
22,745,803
|
5,839,377
|
||||||
|
Net change in unrealized
|
||||||||
|
appreciation/depreciation on investments
|
(6,415,658
|
)
|
75,931,568
|
|||||
|
Net increase in net assets resulting from operations
|
20,046,158
|
87,760,688
|
||||||
|
DISTRIBUTIONS TO SHAREHOLDERS:
|
||||||||
|
Distributable earnings – Investor Class
|
(12,280,194
|
)
|
(5,556,028
|
)
|
||||
|
Distributable earnings – Institutional Class
|
(284,427
|
)
|
(127,258
|
)
|
||||
|
Total distributions
|
(12,564,621
|
)
|
(5,683,286
|
)
|
||||
|
CAPITAL SHARE TRANSACTIONS:
|
||||||||
|
Proceeds from shares subscribed – Investor Class
|
5,460,363
|
1,114,552
|
||||||
|
Proceeds from shares subscribed – Institutional Class
|
19,824,898
|
578,755
|
||||||
|
Dividends reinvested – Investor Class
|
11,605,966
|
5,201,166
|
||||||
|
Dividends reinvested – Institutional Class
|
250,047
|
108,613
|
||||||
|
Cost of shares redeemed – Investor Class
|
(8,831,654
|
)
|
(21,989,301
|
)
|
||||
|
Cost of shares redeemed – Institutional Class
|
(2,880,770
|
)
|
(1,257,956
|
)
|
||||
|
Net increase (decrease) in net assets derived
|
||||||||
|
from capital share transactions
|
25,428,850
|
(16,244,171
|
)
|
|||||
|
TOTAL INCREASE IN NET ASSETS
|
32,910,387
|
65,833,231
|
||||||
|
NET ASSETS:
|
||||||||
|
Beginning of period
|
259,721,186
|
193,887,955
|
||||||
|
End of period
|
$
|
292,631,573
|
$
|
259,721,186
|
||||
|
CHANGES IN SHARES OUTSTANDING:
|
||||||||
|
Shares sold – Investor Class
|
266,780
|
62,162
|
||||||
|
Shares sold – Institutional Class
|
963,080
|
32,026
|
||||||
|
Shares issued to holders as reinvestment
|
||||||||
|
of dividends – Investor Class
|
593,351
|
331,073
|
||||||
|
Shares issued to holders as reinvestment
|
||||||||
|
of dividends – Institutional Class
|
12,767
|
6,909
|
||||||
|
Shares redeemed – Investor Class
|
(438,892
|
)
|
(1,262,841
|
)
|
||||
|
Shares redeemed – Institutional Class
|
(138,363
|
)
|
(71,863
|
)
|
||||
|
Net increase (decrease) in shares outstanding
|
1,258,723
|
(902,534
|
)
|
|||||
The accompanying notes are an integral part of these financial statements.
|
HENNESSY FUNDS
|
1-800-966-4354
|
11
Financial Statements
|
Financial Highlights
|
For an Investor Class share outstanding throughout each period
|
Six Months Ended
|
||||
|
April 30, 2022
|
||||
|
(Unaudited)
|
||||
|
PER SHARE DATA:
|
||||
|
Net asset value, beginning of period
|
$
|
19.59
|
||
|
Income from investment operations:
|
||||
|
Net investment income
|
0.26
|
(1)
|
||
|
Net realized and unrealized gains (losses) on investments
|
1.24
|
|||
|
Total from investment operations
|
1.50
|
|||
|
Less distributions:
|
||||
|
Dividends from net investment income
|
(0.51
|
)
|
||
|
Dividends from net realized gains
|
(0.43
|
)
|
||
|
Total distributions
|
(0.94
|
)
|
||
|
Net asset value, end of period
|
$
|
20.15
|
||
|
TOTAL RETURN
|
7.88
|
%(2)
|
||
|
SUPPLEMENTAL DATA AND RATIOS:
|
||||
|
Net assets, end of period (millions)
|
$
|
270.09
|
||
|
Ratio of expenses to average net assets
|
1.22
|
%(3)
|
||
|
Ratio of net investment income to average net assets
|
2.65
|
%(3)
|
||
|
Portfolio turnover rate(4)
|
35
|
%(2)
|
||
|
(1)
|
Calculated using the average shares outstanding method.
|
|
(2)
|
Not annualized.
|
|
(3)
|
Annualized.
|
|
(4)
|
Calculated on the basis of the Fund as a whole.
|
The accompanying notes are an integral part of these financial statements.
|
WWW.HENNESSYFUNDS.COM
|
12
|
FINANCIAL HIGHLIGHTS — INVESTOR CLASS
|
|
Year Ended October 31,
|
||||||||||||||||||
|
2021
|
2020
|
2019
|
2018
|
2017
|
||||||||||||||
|
$
|
13.69
|
$
|
17.43
|
$
|
19.29
|
$
|
21.48
|
$
|
18.36
|
|||||||||
|
0.44
|
(1)
|
0.41
|
(1)
|
0.47
|
(1)
|
0.41
|
0.45
|
|||||||||||
|
5.87
|
(3.01
|
)
|
0.30
|
0.35
|
3.10
|
|||||||||||||
|
6.31
|
(2.60
|
)
|
0.77
|
0.76
|
3.55
|
|||||||||||||
|
(0.41
|
)
|
(0.47
|
)
|
(0.41
|
)
|
(0.42
|
)
|
(0.43
|
)
|
|||||||||
|
—
|
(0.67
|
)
|
(2.22
|
)
|
(2.53
|
)
|
—
|
|||||||||||
|
(0.41
|
)
|
(1.14
|
)
|
(2.63
|
)
|
(2.95
|
)
|
(0.43
|
)
|
|||||||||
|
$
|
19.59
|
$
|
13.69
|
$
|
17.43
|
$
|
19.29
|
$
|
21.48
|
|||||||||
|
46.82
|
%
|
-16.22
|
%
|
5.22
|
%
|
3.64
|
%
|
19.63
|
%
|
|||||||||
|
$
|
254.23
|
$
|
189.60
|
$
|
253.95
|
$
|
266.76
|
$
|
281.07
|
|||||||||
|
1.23
|
%
|
1.30
|
%
|
1.23
|
%
|
1.21
|
%
|
1.22
|
%
|
|||||||||
|
2.43
|
%
|
2.71
|
%
|
2.75
|
%
|
2.21
|
%
|
2.36
|
%
|
|||||||||
|
41
|
%
|
32
|
%
|
27
|
%
|
41
|
%
|
72
|
%
|
|||||||||
The accompanying notes are an integral part of these financial statements.
|
HENNESSY FUNDS
|
1-800-966-4354
|
13
Financial Statements
|
Financial Highlights
|
For an Institutional Class share outstanding throughout each period
|
Six Months Ended
|
||||
|
April 30, 2022
|
||||
|
(Unaudited)
|
||||
|
PER SHARE DATA:
|
||||
|
Net asset value, beginning of period
|
$
|
19.63
|
||
|
Income from investment operations:
|
||||
|
Net investment income
|
0.28
|
(1)
|
||
|
Net realized and unrealized gains (losses) on investments
|
1.25
|
|||
|
Total from investment operations
|
1.53
|
|||
|
Less distributions:
|
||||
|
Dividends from net investment income
|
(0.56
|
)
|
||
|
Dividends from net realized gains
|
(0.43
|
)
|
||
|
Total distributions
|
(0.99
|
)
|
||
|
Net asset value, end of period
|
$
|
20.17
|
||
|
TOTAL RETURN
|
8.01
|
%(2)
|
||
|
SUPPLEMENTAL DATA AND RATIOS:
|
||||
|
Net assets, end of period (millions)
|
$
|
22.54
|
||
|
Ratio of expenses to average net assets
|
0.98
|
%(3)
|
||
|
Ratio of net investment income to average net assets
|
2.72
|
%(3)
|
||
|
Portfolio turnover rate(4)
|
35
|
%(2)
|
||
|
(1)
|
Calculated using the average shares outstanding method.
|
|
(2)
|
Not annualized.
|
|
(3)
|
Annualized.
|
|
(4)
|
Calculated on the basis of the Fund as a whole.
|
The accompanying notes are an integral part of these financial statements.
|
WWW.HENNESSYFUNDS.COM
|
14
|
FINANCIAL HIGHLIGHTS — INSTITUTIONAL CLASS
|
|
Year Ended October 31,
|
||||||||||||||||||
|
2021
|
2020
|
2019
|
2018
|
2017
|
||||||||||||||
|
$
|
13.71
|
$
|
17.45
|
$
|
19.33
|
$
|
21.52
|
$
|
18.40
|
|||||||||
|
0.48
|
(1)
|
0.44
|
(1)
|
0.50
|
(1)
|
0.45
|
0.43
|
|||||||||||
|
5.88
|
(3.01
|
)
|
0.29
|
0.35
|
3.18
|
|||||||||||||
|
6.36
|
(2.57
|
)
|
0.79
|
0.80
|
3.61
|
|||||||||||||
|
(0.44
|
)
|
(0.49
|
)
|
(0.45
|
)
|
(0.46
|
)
|
(0.49
|
)
|
|||||||||
|
—
|
(0.68
|
)
|
(2.22
|
)
|
(2.53
|
)
|
—
|
|||||||||||
|
(0.44
|
)
|
(1.17
|
)
|
(2.67
|
)
|
(2.99
|
)
|
(0.49
|
)
|
|||||||||
|
$
|
19.63
|
$
|
13.71
|
$
|
17.45
|
$
|
19.33
|
$
|
21.52
|
|||||||||
|
47.19
|
%
|
-16.06
|
%
|
5.37
|
%
|
3.88
|
%
|
19.95
|
%
|
|||||||||
|
$
|
5.50
|
$
|
4.29
|
$
|
6.44
|
$
|
7.22
|
$
|
7.40
|
|||||||||
|
0.99
|
%
|
1.08
|
%
|
1.08
|
%
|
0.98
|
%
|
0.97
|
%
|
|||||||||
|
2.67
|
%
|
2.94
|
%
|
2.92
|
%
|
2.43
|
%
|
2.60
|
%
|
|||||||||
|
41
|
%
|
32
|
%
|
27
|
%
|
41
|
%
|
72
|
%
|
|||||||||
The accompanying notes are an integral part of these financial statements.
|
HENNESSY FUNDS
|
1-800-966-4354
|
15
Financial Statements
|
Notes to the Financial Statements April 30, 2022 (Unaudited)
|
1). ORGANIZATION
The Hennessy Cornerstone Value Fund (the “Fund”) is a series of Hennessy Funds Trust (the “Trust”), which was organized as a Delaware statutory trust on September 17, 1992. The Fund is an open-end management
investment company registered under the Investment Company Act of 1940, as amended. The investment objective of the Fund is total return, consisting of capital appreciation and current income. The Fund is a diversified fund.
The Fund offers Investor Class and Institutional Class shares. Each class of shares differs principally in its respective 12b-1 distribution and service, shareholder servicing, and
sub-transfer agent expenses. There are no sales charges. Each class has identical rights to earnings, assets, and voting privileges, except for class-specific expenses and exclusive rights to vote on matters affecting only one class.
As an investment company, the Fund follows the investment company accounting and reporting guidance of the Financial Accounting Standards Board (“FASB”) Accounting Standard Codification Topic
946 “Financial Services—Investment Companies.”
2). SIGNIFICANT ACCOUNTING POLICIES
The following is a summary of significant accounting policies consistently followed by the Fund in the preparation of the financial statements. These policies conform to U.S. generally accepted accounting
principles (“GAAP”).
|
a).
|
Securities Valuation – All investments in securities are valued in accordance with the Fund’s valuation policies and procedures, as described in Note 3.
|
|
b).
|
Federal Income Taxes – The Fund has elected to be taxed as a regulated investment company and intends to distribute substantially all of its taxable income to its shareholders and otherwise comply with
the provisions of the Internal Revenue Code of 1986, as amended, applicable to regulated investment companies. As a result, the Fund has made no provision for federal income taxes or excise taxes. Net investment income/loss and
realized gains/losses for federal income tax purposes may differ from those reported in the financial statements because of temporary book-basis and tax-basis differences. Temporary differences are primarily the result of the
treatment of wash sales for tax reporting purposes. The Fund recognizes interest and penalties related to income tax benefits, if any, in the Statement of Operations as an income tax expense. Distributions from net realized gains
for book purposes may include short-term capital gains, which are included as ordinary income to shareholders for tax purposes. The Fund may utilize equalization accounting for tax purposes and designate earnings and profits,
including net realized gains distributed to shareholders on redemption of shares, as part of the dividends paid deduction for income tax purposes.
|
|
c).
|
Accounting for Uncertainty in Income Taxes – The Fund has accounting policies regarding recognition and measurement of tax positions taken or expected to be taken on a tax return. The tax returns of the
Fund for the prior three fiscal years are open for examination. The Fund has reviewed all open tax years in major tax jurisdictions and concluded that there is no impact on the Fund’s net assets and no
|
|
WWW.HENNESSYFUNDS.COM
|
16
|
NOTES TO THE FINANCIAL STATEMENTS
|
|
tax liability resulting from unrecognized tax benefits relating to uncertain income tax positions taken or expected to be taken on a tax return. The Fund’s major tax jurisdictions are U.S. federal and
Delaware.
|
|
|
d).
|
Income and Expenses – Dividend income is recognized on the ex-dividend date or as soon as information is available to the Fund. Interest income, which includes the amortization of premium and accretion
of discount, is recognized on an accrual basis. Market discounts, original issue discounts, and market premiums on debt securities are accreted or amortized to interest income over the life of a security with a corresponding
increase or decrease, as applicable, in the cost basis of such security using the yield-to-maturity method or, where applicable, the first call date of the security. Other non-cash dividends are recognized as investment income at
the fair value of the property received. The Fund is charged for those expenses that are directly attributable to its portfolio, such as advisory, administration, and certain shareholder service fees. Income, expenses (other than
expenses attributable to a specific class), and realized and unrealized gains/losses on investments are allocated to each class of shares based on such class’s net assets.
|
|
e).
|
Distributions to Shareholders – Dividends from net investment income for the Fund, if any, are declared and paid annually, usually in December. Distributions of net realized capital gains, if any, are
declared and paid annually, usually in December.
|
|
f).
|
Security Transactions – Investment and shareholder transactions are recorded on the trade date. The Fund determines the realized gain/loss from an investment transaction by comparing the original cost of
the security lot sold with the net sale proceeds. Discounts and premiums on securities purchased are accreted or amortized, respectively, over the life of each such security.
|
|
g).
|
Use of Estimates – Preparing financial statements in accordance with GAAP requires management to make estimates and assumptions that affect the reported amounts of assets and liabilities and disclosure
of contingent assets and liabilities at the date of the financial statements, as well as the reported change in net assets during the reporting period. Actual results could differ from those estimates.
|
|
h).
|
Share Valuation – The net asset value (“NAV”) per share of the Fund is calculated by dividing (i) the total value of the securities held by the Fund, plus cash and other assets, minus all liabilities
(including estimated accrued expenses) by (ii) the total number of Fund shares outstanding, rounded to the nearest $0.01. Fund shares are not priced on days the New York Stock Exchange is closed for trading. The offering and
redemption price per share for the Fund is equal to the Fund’s NAV per share.
|
|
i).
|
Recent Accounting Pronouncements and Regulatory Updates – In October 2020, the Securities and Exchange Commission (“SEC”) adopted new regulations governing the use of derivatives by registered investment
companies (“Rule 18f-4”). Rule 18f-4 imposes limits on the amount of derivatives a fund can enter into, eliminates the asset segregation framework currently used by funds to comply with Section 18 of the 1940 Act, and requires
funds whose use of derivatives is greater than a limited specified amount to establish and maintain a comprehensive derivatives risk management program and appoint a derivatives risk manager. Funds are required to comply with Rule
18f-4 by August 19, 2022. The impact, if any, that Rule 18f-4 will have on the availability, liquidity, and performance of derivatives is unclear. Management is currently evaluating the potential impact of Rule 18f-4 on the Fund.
When fully implemented, Rule 18f-4 may require changes in how the Fund uses derivatives, adversely affect the Fund’s performance, and increase costs related to the Fund’s use of derivatives.
|
|
HENNESSY FUNDS
|
1-800-966-4354
|
17
|
In December 2020, the SEC adopted a new rule providing a framework for fund valuation practices (“Rule 2a-5”). Rule 2a-5 establishes requirements for determining fair value in
good faith for purposes of the 1940 Act. Rule 2a-5 permits fund boards to designate certain parties to perform fair value determinations, subject to board oversight and certain other conditions. Rule 2a-5 also defines when market
quotations are “readily available” for purposes of the 1940 Act and the threshold for determining whether a fund must fair value a security. In connection with Rule 2a-5, the SEC also adopted related recordkeeping requirements and
is rescinding previously issued guidance, including with respect to the role of a board in determining fair value and the accounting and auditing of fund investments. Funds must comply with the rules by September 8, 2022.
Management is currently assessing the potential impact of the new rules on the Fund’s financial statements.
|
3). SECURITIES VALUATION
The Fund follows its valuation policies and procedures in determining its net asset value and, in preparing these financial statements, the fair value accounting standards that establish an authoritative
definition of fair value and set out a hierarchy for measuring fair value. These standards require additional disclosures about the various inputs and valuation techniques used to develop the measurements of fair value and a discussion of
changes in valuation techniques and related inputs during the period. These inputs are summarized in the three broad levels listed below:
|
Level 1 –
|
Unadjusted, quoted prices in active markets for identical instruments that the Fund has the ability to access at the date of measurement.
|
|
|
Level 2 –
|
Other significant observable inputs (including, but not limited to, quoted prices in active markets for similar instruments, quoted prices in markets that are not active for identical or similar
instruments, and model-derived valuations in which all significant inputs and significant value drivers are observable in active markets, such as interest rates, prepayment speeds, credit risk curves, default rates, and similar
data).
|
|
|
Level 3 –
|
Significant unobservable inputs (including the Fund’s own assumptions about what market participants would use to price the asset or liability based on the best available information) when observable
inputs are unavailable.
|
The following is a description of the valuation techniques applied to the Fund’s major categories of assets and liabilities on a recurring basis:
|
Equity Securities – Equity securities, including common stocks, preferred stocks, foreign-issued common stocks, exchange-traded funds, closed-end mutual funds,
partnerships, rights, and real estate investment trusts, that are traded on a securities exchange for which a last-quoted sales price is readily available generally are valued at the last sales price as reported by the primary
exchange on which the securities are listed. Securities listed on The Nasdaq Stock Market (“Nasdaq”) generally are valued at the Nasdaq Official Closing Price, which may differ from the last sales price reported. Securities traded
on a securities exchange for which a last-quoted sales price is not readily available generally are valued at the mean between the bid and ask prices. To the extent these securities are actively traded and valuation adjustments
are not applied, they are classified in Level 1 of the fair value hierarchy. Securities traded on foreign exchanges generally are not valued at the same time the Fund calculates its NAV because most foreign markets close well
before such time. The earlier close of most foreign markets gives rise to the possibility that significant events, including broad market moves, may have occurred in the interim. In certain
|
|
WWW.HENNESSYFUNDS.COM
|
18
|
NOTES TO THE FINANCIAL STATEMENTS
|
|
circumstances, it may be determined that a foreign security needs to be fair valued because it appears that the value of the security might have been materially affected by events occurring after the
close of the market in which the security is principally traded, but before the time the Fund calculates its NAV, such as by a development that affects an entire market or region (e.g., a weather-related event) or a potentially
global development (e.g., a terrorist attack that may be expected to have an effect on investor expectations worldwide).
|
|
|
Registered Investment Companies – Investments in open-end registered investment companies, commonly referred to as mutual funds, generally are priced at the
ending NAV provided by the applicable mutual fund’s service agent and are classified in Level 1 of the fair value hierarchy.
|
|
|
Debt Securities – Debt securities, including corporate bonds, asset-backed securities, mortgage-backed securities, municipal bonds, U.S. Treasuries, and U.S.
government agency issues, are generally valued at market on the basis of valuations furnished by an independent pricing service that utilizes both dealer-supplied valuations and formula-based techniques. The pricing service may
consider recently executed transactions in securities of the issuer or comparable issuers, market price quotations (where observable), bond spreads, and fundamental data relating to the issuer. In addition, the model may
incorporate observable market data, such as reported sales of similar securities, broker quotes, yields, bids, offers, and reference data. Certain securities are valued primarily using dealer quotations. These securities are
generally classified in Level 2 of the fair value hierarchy.
|
|
|
Short-Term Securities – Short-term equity investments, including money market funds, are valued in the manner specified above for equity securities. Short-term
debt investments with an original term to maturity of 60 days or less are valued at amortized cost, which approximates fair market value. If the original term to maturity of a short-term debt investment exceeds 60 days, then the
values as of the 61st day prior to maturity are amortized. Amortized cost is not used if its use would be inappropriate due to credit or other impairments of the issuer, in which case the security’s fair value would be determined
as described below. Short-term securities are generally classified in Level 1 or Level 2 of the fair value hierarchy depending on the inputs used and market activity levels for specific securities.
|
The Board of Trustees of the Fund (the “Board”) has adopted fair value pricing procedures that are followed when a price for a security is not readily available or if a significant event has
occurred that indicates the closing price of a security no longer represents the true value of that security. Fair value pricing determinations are made in good faith in accordance with these procedures. There are numerous criteria
considered in determining a fair value of a security, such as the trading volume of a security and markets, the values of other similar securities, and news events with direct bearing on a security or markets. Fair value pricing results
in an estimated price for a security that reflects the amount the Fund might reasonably expect to receive in a current sale. Depending on the relative significance of the valuation inputs, these securities may be classified in either
Level 2 or Level 3 of the fair value hierarchy.
The fair value of foreign securities may be determined with the assistance of a pricing service using correlations between the movement of prices of such securities and indices of domestic
securities and other appropriate indicators, such as closing market prices of relevant American Depositary Receipts or futures contracts. Using fair value pricing means that the Fund’s NAV reflects the affected portfolio securities’
values as determined by the Board or its designee, pursuant to the fair value pricing procedures adopted by the
|
HENNESSY FUNDS
|
1-800-966-4354
|
19
Board, instead of being determined by the market. Using a fair value pricing methodology to price a foreign security may result in a value that is different from such foreign security’s most recent closing price
and from the value used by other investment companies to calculate their NAVs. Such securities are generally classified in Level 2 of the fair value hierarchy. Because the Fund may invest in foreign securities, the value of the Fund’s
portfolio securities may change on days when a shareholder is unable to purchase or redeem Fund shares.
The Board has delegated day-to-day valuation matters to the Valuation and Liquidity Committee comprising representatives from Hennessy Advisors, Inc., the Fund’s investment advisor (the
“Advisor”). The function of the Valuation and Liquidity Committee, among other things, is to value securities where current and reliable market quotations are not readily available. All actions taken by the Valuation and Liquidity
Committee are reviewed by the Board.
The Fund has performed an analysis of all existing investments to determine the significance and character of all inputs to their fair value determinations. Various inputs are used to
determine the value of the Fund’s investments. The inputs or methodology used for valuing securities are not necessarily an indication of the risk associated with investing in those securities. Details related to the fair value hierarchy
of the Fund’s securities as of April 30, 2022, are included in the Schedule of Investments.
4). INVESTMENT TRANSACTIONS
Purchases and sales of investment securities (excluding government and short-term investments) for the Fund during the six months ended April 30, 2022, were $110,168,526 and $95,408,218, respectively.
There were no purchases or sales/maturities of long-term U.S. government securities for the Fund during the six months ended April 30, 2022.
5). INVESTMENT ADVISORY FEE AND OTHER TRANSACTIONS WITH AFFILIATES
The Advisor provides the Fund with investment advisory services under an Investment Advisory Agreement. The Advisor furnishes all investment advice, office space, and facilities and most of the personnel needed
by the Fund. As compensation for its services, the Advisor is entitled to a monthly fee from the Fund. The fee is based on the average daily net assets of the Fund at an annual rate of 0.74%. The net investment advisory fees expensed by
the Fund during the six months ended April 30, 2022, are included in the Statement of Operations.
The Board has approved a Shareholder Servicing Agreement for Investor Class shares of the Fund, which compensates the Advisor for the non-investment advisory services it provides to the Fund.
The Shareholder Servicing Agreement provides for a monthly fee paid to the Advisor at an annual rate of 0.10% of the average daily net assets of the Fund attributable to Investor Class shares. The shareholder service fees expensed by the
Fund during the six months ended April 30, 2022, are included in the Statement of Operations.
The Fund has adopted a plan pursuant to Rule 12b-1 under the Investment Company Act of 1940, as amended, that authorizes payments in connection with the distribution of Fund shares at an
annual rate of up to 0.25% of the Fund’s average daily net assets attributable to Investor Class shares. Even though the authorized rate is up to 0.25%, the Fund is currently only using up to 0.15% of its average daily net assets
attributable to Investor Class shares for such purpose. Amounts paid under the plan may be spent on any activities or expenses primarily intended to result in the sale of shares, including, but not limited to, advertising, shareholder
account servicing, printing and mailing of prospectuses to other than current shareholders, printing and mailing of sales
|
WWW.HENNESSYFUNDS.COM
|
20
|
NOTES TO THE FINANCIAL STATEMENTS
|
literature, and compensation for sales and marketing activities or to financial institutions and others, such as dealers and distributors. The distribution fees expensed by the Fund during the six months ended
April 30, 2022, are included in the Statement of Operations.
The Fund has entered into agreements with various brokers, dealers, and financial intermediaries in connection with the sale of Fund shares. The agreements provide for periodic payments of
sub-transfer agent expenses by the Fund to the brokers, dealers, and financial intermediaries for providing certain shareholder maintenance services. These shareholder services include the pre-processing and quality control of new
accounts, shareholder correspondence, answering customer inquiries regarding account status, and facilitating shareholder telephone transactions. The sub-transfer agent fees expensed by the Fund during the six months ended April 30, 2022,
are included in the Statement of Operations.
U.S. Bancorp Fund Services, LLC, d/b/a U.S. Bank Global Fund Services (“Fund Services”) provides the Fund with administrative, accounting, and transfer agent services. As administrator, Fund
Services is responsible for activities such as (i) preparing various federal and state regulatory filings, reports, and returns for the Fund, (ii) preparing reports and materials to be supplied to the Board, (iii) monitoring the
activities of the Fund’s custodian, transfer agent, and accountants, and (iv) coordinating the preparation and payment of the Fund’s expenses and reviewing the Fund’s expense accruals. U.S. Bank N.A., an affiliate of Fund Services, serves
as the Fund’s custodian. The servicing agreements between the Trust, Fund Services, and U.S. Bank N.A. contain a fee schedule that is inclusive of administrative, accounting, custody, and transfer agent fees. The administrative,
accounting, custody, and transfer agent fees expensed by the Fund during the six months ended April 30, 2022, are included in the Statement of Operations.
Quasar Distributors, LLC (“Quasar”), a wholly owned broker-dealer subsidiary of Foreside Financial Group, LLC, acts as the Fund’s principal underwriter in a continuous public offering of Fund
shares.
The officers of the Fund are affiliated with the Advisor. With the exception of the Chief Compliance Officer and the Senior Compliance Officer, such officers receive no compensation from the
Fund for serving in their respective roles. The Fund, along with the other funds in the Hennessy Funds family (collectively, the “Hennessy Funds”), makes reimbursement payments on an equal basis to the Advisor for a portion of the salary
and benefits associated with the office of the Chief Compliance Officer and for all of the salary and benefits associated with the office of the Senior Compliance Officer. The compliance fees expensed by the Fund during the six months
ended April 30, 2022, are included in the Statement of Operations.
6). GUARANTEES AND INDEMNIFICATIONS
Under the Hennessy Funds’ organizational documents, their officers and trustees are indemnified by the Hennessy Funds against certain liabilities arising out of the performance of their duties to the Hennessy
Funds. Additionally, in the normal course of business, the Hennessy Funds enter into contracts with service providers that contain general indemnification clauses. The Fund’s maximum exposure under these arrangements is unknown as this
would involve future claims that may be made against the Fund that have not yet occurred. Currently, the Fund expects the risk of loss to be remote.
7). LINE OF CREDIT
The Fund has an uncommitted line of credit with the other Hennessy Funds in the amount of the lesser of (i) $100,000,000 or (ii) 33.33% of each Hennessy Fund’s net assets, or 30% for the Hennessy Gas Utility
Fund and 10% for the Hennessy Balanced
|
HENNESSY FUNDS
|
1-800-966-4354
|
21
Fund. The line of credit is intended to provide any necessary short-term financing in connection with shareholder redemptions, subject to certain restrictions. The credit facility is with the Hennessy Funds’
custodian bank, U.S. Bank N.A. Borrowings under this arrangement bear interest at the bank’s prime rate and are secured by all of the Fund’s assets (as to its own borrowings only). During the six months ended April 30, 2022, the Fund did
not have any borrowings outstanding under the line of credit.
8). FEDERAL TAX INFORMATION
As of October 31, 2021, the Fund’s most recent fiscal year end, the components of accumulated earnings (losses) for income tax purposes were as follows:
|
Investments
|
|||||
|
Cost of investments for tax purposes
|
$
|
226,781,886
|
|||
|
Gross tax unrealized appreciation
|
$
|
43,586,393
|
|||
|
Gross tax unrealized depreciation
|
(10,784,596
|
)
|
|||
|
Net tax unrealized appreciation/(depreciation)
|
$
|
32,801,797
|
|||
|
Undistributed ordinary income
|
$
|
5,163,173
|
|||
|
Undistributed long-term capital gains
|
5,655,685
|
||||
|
Total distributable earnings
|
$
|
10,818,858
|
|||
|
Other accumulated gain/(loss)
|
$
|
—
|
|||
|
Total accumulated gain/(loss)
|
$
|
43,620,655
|
|||
The difference between book-basis unrealized appreciation/depreciation and tax-basis unrealized appreciation/depreciation (as shown above) is attributable primarily to wash sales.
As of October 31, 2021, the Fund had no tax-basis capital losses to offset future capital gains. During fiscal year 2021, the capital losses utilized by the Fund were $115,751.
Capital losses sustained in or after fiscal year 2012 can be carried forward indefinitely, but any such loss retains the character of the original loss and must be utilized prior to any loss
incurred before fiscal year 2012. As a result of this ordering rule, capital loss carryforwards incurred prior to fiscal year 2012 may be more likely to expire unused. Capital losses sustained prior to fiscal year 2012 can be carried
forward for eight years and can be carried forward as short-term capital losses regardless of the character of the original loss.
As of October 31, 2021, the Fund did not defer, on a tax basis, any late-year ordinary losses. Late-year ordinary losses are net ordinary losses incurred after December 31, 2020, but within
the taxable year, that are deemed to arise on the first day of the Fund’s next taxable year.
During fiscal year 2022 (year to date) and fiscal year 2021, the tax character of distributions paid by the Fund was as follows:
|
Six Months Ended
|
Year Ended
|
||||||||
|
April 30, 2022
|
October 31, 2021
|
||||||||
|
Ordinary income(1)
|
$
|
6,908,914
|
$
|
5,683,286
|
|||||
|
Long-term capital gains
|
5,655,707
|
—
|
|||||||
|
Total distributions
|
$
|
12,564,621
|
$
|
5,683,286
|
|||||
|
(1) Ordinary income includes short-term capital gains.
|
|
WWW.HENNESSYFUNDS.COM
|
22
|
NOTES TO THE FINANCIAL STATEMENTS
|
9). EVENTS SUBSEQUENT TO PERIOD END
Management has evaluated the Fund’s related events and transactions that occurred subsequent to April 30, 2022, through the date of issuance of the Fund’s financial statements. Management has determined that
there were no subsequent events requiring recognition or disclosure in the financial statements.
|
HENNESSY FUNDS
|
1-800-966-4354
|
23
Expense Example (Unaudited)
April 30, 2022
As a shareholder of the Fund, you incur ongoing costs, including management fees, service fees, and other Fund expenses. This Example is intended to help you understand your ongoing costs (in dollars) of
investing in the Fund and to compare these costs with the ongoing costs of investing in other mutual funds. The Example is based on an investment of $1,000 invested at the beginning of the period and held for the entire period from
November 1, 2021, through April 30, 2022.
Actual Expenses
In the table below, the first line under each of the “Investor Class” and “Institutional Class” headings provides information about actual account values and actual expenses for each share class. You may use
this information, together with the amount you invested, to estimate the expenses that you paid over the period. Simply divide your account value by $1,000 (for example, an $8,600 account value divided by $1,000 = 8.6), then multiply the
result by the number in the first line under the heading “Expenses Paid During Period” to estimate the expenses you paid on your account during this period. Although the Fund charges no sales loads or transaction fees, you will be
assessed fees for outgoing wire transfers, returned checks, and stop payment orders at prevailing rates charged by U.S. Bank Global Fund Services, the Fund’s transfer agent. If you request that a redemption be made by wire transfer, the
Fund’s transfer agent charges a $15 fee. IRAs are charged a $15 annual maintenance fee (up to $30 maximum per shareholder for shareholders with multiple IRAs). The examples below include, but are not limited to, management, shareholder
servicing, accounting, custody, and transfer agent fees. However, the examples below do not include portfolio trading commissions and related expenses.
Hypothetical Example for Comparison Purposes
In the table below, the second line under each of the “Investor Class” and “Institutional Class” headings provides information about hypothetical account values and hypothetical expenses based on the Fund’s
actual expense ratio for each share class and an assumed rate of return of 5% per year before expenses, which is not the Fund’s actual return for such share class. The hypothetical account values and expenses may not be used to estimate
the actual ending account balance or expenses you paid for the period. You may use this information to compare the ongoing costs of investing in the Fund and other funds. To do so, compare these 5% hypothetical examples with the 5%
hypothetical examples that appear in the shareholder reports of the other funds. Please note that the expenses shown in the table are meant to highlight your ongoing costs only. Therefore, the second lines under “Investor Class” and
“Institutional Class” are useful in comparing ongoing costs only and will not help you determine the relative total costs of owning different funds.
|
WWW.HENNESSYFUNDS.COM
|
24
|
EXPENSE EXAMPLE
|
|
Beginning
|
Ending
|
||
|
Account Value
|
Account Value
|
Expenses Paid
|
|
|
November 1, 2021
|
April 30, 2022
|
During Period(1)
|
|
|
Investor Class
|
|||
|
Actual
|
$1,000.00
|
$1,078.80
|
$6.29
|
|
Hypothetical (5% return before expenses)
|
$1,000.00
|
$1,018.74
|
$6.11
|
|
Institutional Class
|
|||
|
Actual
|
$1,000.00
|
$1,080.10
|
$5.05
|
|
Hypothetical (5% return before expenses)
|
$1,000.00
|
$1,019.93
|
$4.91
|
|
(1)
|
Expenses are equal to the Fund’s annualized expense ratio of 1.22% for Investor Class shares or 0.98% for Institutional Class shares, as applicable, multiplied by the average account value over the
period, multiplied by 181/365 days (to reflect the half-year period).
|
|
HENNESSY FUNDS
|
1-800-966-4354
|
25
How to Obtain a Copy of the Fund’s Proxy
Voting Policy and Proxy Voting Records
A description of the policies and procedures the Fund uses to determine how to vote proxies relating to portfolio securities is available without charge (1) by calling 800-966-4354, (2) on the Hennessy Funds’
website at www.hennessyfunds.com/proxy-voting/voting-policy, or (3) on the U.S. Securities and Exchange Commission’s (the “SEC”) website at www.sec.gov. The Fund’s proxy voting record is available without charge on both the Hennessy
Funds’ website at www.hennessyfunds.com/proxy-voting/voting-record and the SEC’s website at www.sec.gov no later than August 31 for the prior 12 months ending June 30.
Availability of Quarterly Portfolio Schedule
The Fund files its complete schedule of portfolio holdings with the SEC for the first and third quarters of each fiscal year as an exhibit to its reports on Form N-PORT. The Fund’s Form N-PORT reports are
available on the SEC’s website at www.sec.gov or on request by calling 800-966-4354.
Federal Tax Distribution Information (Unaudited)
For fiscal year 2021, certain dividends paid by the Fund may be subject to a maximum tax rate of 23.8%, as provided for by the Jobs and Growth Tax Relief Reconciliation Act of 2003. The percentage of dividends
declared from ordinary income designated as qualified dividend income was 100.00%.
For corporate shareholders, the percent of ordinary income distributions that qualified for the corporate dividends received deduction for fiscal year 2021 was 99.50%.
The percentage of taxable ordinary income distributions that were designated as short-term capital gain distributions under Section 871(k)(2)(C) of the Internal Revenue Code of 1986, as
amended, for the Fund was 0.00%.
Important Notice Regarding Delivery
of Shareholder Documents
To help keep the Fund’s costs as low as possible, we generally deliver a single copy of shareholder reports, proxy statements, and prospectuses to shareholders who share an address and have the same last name.
This process does not apply to account statements. You may request an individual copy of a shareholder document at any time. If you would like to receive separate mailings of shareholder documents, please call U.S. Bank Global Fund
Services at 800-261-6950 or 414-765-4124, and individual delivery will begin within 30 days of your request. If your account is held through a financial institution or other intermediary, please contact such intermediary directly to
request individual delivery.
Electronic Delivery
As permitted by SEC regulations, the Fund’s shareholder reports are made available on a website, and unless you sign up for eDelivery or elect to receive paper copies as detailed below, you will be notified each
time a report is posted and provided with a website link to access the report.
The Fund also offers shareholders the option to receive all notices, account statements, prospectuses, tax forms, and shareholder reports electronically. To sign up for eDelivery or change
your delivery preference, please visit www.hennessyfunds.com/account.
To elect to receive paper copies of all future reports free of charge, please call U.S. Bank Global Fund Services at 800-261-6950 or 414-765-4124.
Subscribe to receive our team’s unique market and sector insights delivered to your inbox
www.hennessyfunds.com/subscribe
Follow us on social media
|
|
|
|
|
|
WWW.HENNESSYFUNDS.COM
|
26
|
PROXY VOTING — BOARD APPROVAL OF INVESTMENT ADVISORY AGREEMENT
|
Board Approval of Investment Advisory
Agreement
At its meeting on March 11, 2022, the Board of Trustees of the Fund (the “Board,” and the members thereof, the “Trustees”) unanimously approved the continuation of the investment advisory agreement of the Fund
with Hennessy Advisors, Inc. (the “Advisor”). As part of the process, the Trustees reviewed their fiduciary duties and the relevant factors for them to consider with respect to approving the advisory agreement. In addition, the Trustees
who are not deemed “interested persons” (as defined by the Investment Company Act of 1940, as amended) of the Fund (the “Independent Trustees”) met in executive session to discuss the approval of the advisory agreement. As part of their
discussion, the Independent Trustees confirmed their understanding of the need to have asked about, and received answers to, any matters that they believed are relevant to determining whether to approve the continuation of the advisory
agreement.
In advance of the meeting, the Advisor sent detailed information to the Trustees to assist them in their evaluation of the advisory agreement. This information included, but was not limited
to, the following:
|
(1)
|
A memorandum from outside legal counsel that described the fiduciary duties of the Board with respect to approving the continuation of the advisory agreement and the relevant factors for consideration;
|
|
|
(2)
|
A memorandum from the Advisor that listed the factors relevant to the Board’s approval of the continuation of the advisory agreement and also referenced the documents that had been provided to help the
Board assess each such factor;
|
|
|
(3)
|
The Advisor’s financial statements from its most recent Form 10-K and Form 10-Q;
|
|
|
(4)
|
A summary of the advisory agreement;
|
|
|
(5)
|
A recent Fund fact sheet, which included, among other things, Fund performance over various periods;
|
|
|
(6)
|
A description of the range of services provided by the Advisor;
|
|
|
(7)
|
A peer expense comparison of the net expense ratio and investment advisory fee of the Fund; and
|
|
|
(8)
|
A memorandum from the Advisor regarding economies of scale.
|
The Trustees reviewed and discussed all of the information provided by the Advisor. Following this review, and further discussion with the Advisor, the Trustees concluded that the information
provided before and at the meeting addressed all of the relevant matters that they wanted to consider in assessing the performance of the Funds and the performance of the Advisor under the advisory agreement, and that said information
provided them with a fulsome understanding of the advisory agreement and the services provided by the Advisor.
All of the factors discussed were considered as a whole by the Trustees, as well as by the Independent Trustees meeting in executive session. The Trustees viewed the relevant factors in their
totality, with no single factor being the principal or determinative factor in the Trustees’ determination of whether to approve the continuation of the advisory agreement. The Trustees recognized that the management and fee arrangements
for the Fund are the result of years of review and discussion between the Independent Trustees and the Advisor, that certain aspects of such arrangements may receive greater scrutiny in some years than in others, and that the Trustees’
conclusions may be based, in part, on
|
HENNESSY FUNDS
|
1-800-966-4354
|
27
their consideration of these same arrangements and information received during the course of the year and in prior years.
Prior to approving the continuation of the advisory agreement, the Trustees, including the Independent Trustees in executive session, considered, among other items:
|
(1)
|
The nature and quality of the advisory services provided by the Advisor;
|
|
|
(2)
|
A comparison of the fees and expenses of the Fund to other similar funds;
|
|
|
(3)
|
Whether economies of scale are recognized by the Fund;
|
|
|
(4)
|
The costs and profitability of the Fund to the Advisor;
|
|
|
(5)
|
The performance of the Fund; and
|
|
|
(6)
|
Any benefits to the Advisor from serving as an investment advisor to the Fund (other than the advisory fee).
|
The material considerations and determinations of the Trustees, including the Independent Trustees, were as follows:
|
(1)
|
The Trustees considered the services identified below that are provided by the Advisor. Based on this review and an assessment of the Advisor’s performance, the Trustees concluded that the Advisor
provides high-quality services to the Fund, and they noted that their overall confidence in the Advisor was high. The Trustees also concluded that they were satisfied with the nature, extent, and quality of the advisory services
provided to the Fund by the Advisor and that the nature and extent of the services provided by the Advisor were appropriate to assure that the Fund’s operations are conducted in compliance with applicable laws, rules, and
regulations.
|
|
(a)
|
The Advisor acts as the portfolio manager for the Fund. In this capacity, the Advisor does the following:
|
|
(i)
|
manages the composition of the Fund’s portfolio, including the purchase, retention, and disposition of portfolio securities in accordance with the Fund’s investment objectives, policies, and
restrictions;
|
|||
|
(ii)
|
seeks best execution for the Fund’s portfolio;
|
|||
|
(iii)
|
manages the use of soft dollars for the Fund; and
|
|||
|
(iv)
|
manages proxy voting for the Fund.
|
|
(b)
|
The Advisor performs a daily reconciliation of portfolio positions and cash for the Fund.
|
||
|
(c)
|
The Advisor monitors the liquidity of each Fund.
|
||
|
(d)
|
The Advisor monitors the Fund’s compliance with its investment objectives and restrictions and federal securities laws.
|
||
|
(e)
|
The Advisor maintains a compliance program (including a code of ethics), conducts ongoing reviews of the compliance programs of the Fund’s service providers (including their codes of ethics, as
appropriate), conducts on-site visits to the Fund’s service providers, as feasible, monitors incidents of abusive trading practices, reviews Fund expense accruals, payments, and fixed expense ratios, evaluates insurance providers
for fidelity bond, D&O/E&O insurance, and cybersecurity insurance coverage, manages regulatory examination compliance and responses, conducts employee compliance training, reviews reports provided by service providers, and
maintains books and records.
|
|
WWW.HENNESSYFUNDS.COM
|
28
|
BOARD APPROVAL OF INVESTMENT ADVISORY AGREEMENT
|
|
(f)
|
The Advisor oversees service providers that provide accounting, administration, distribution, transfer agency, custodial, sales, marketing, public relations, audit, information technology, and legal
services to the Fund.
|
||
|
(g)
|
The Advisor maintains in-house marketing and distribution departments on behalf of the Fund.
|
||
|
(h)
|
The Advisor prepares or directs the preparation of all regulatory filings for the Fund, including writing and annually updating the Fund’s prospectus and related documents.
|
||
|
(i)
|
For each annual report of the Fund, the Advisor prepares a written summary of the Fund’s performance during the most recent 12-month period.
|
||
|
(j)
|
The Advisor oversees distribution of the Fund through third-party broker/dealers and independent financial institutions such as Charles Schwab, Inc., Fidelity, TD Ameritrade, and Pershing. The Advisor
participates in “no transaction fee” (“NTF”) programs with these companies on behalf of the Fund, which allow customers to purchase the Fund through third-party distribution channels without paying a transaction fee. The Advisor
compensates, in part, a number of these third-party providers of NTF programs out of its own revenues.
|
||
|
(k)
|
The Advisor pays the incentive compensation of the Fund’s compliance officers and employs other staff, such as legal, marketing, national accounts, distribution, sales, administrative, and trading
oversight personnel, as well as management executives.
|
||
|
(l)
|
The Advisor provides a quarterly compliance certification to the Board.
|
||
|
(m)
|
The Advisor prepares or reviews all Board materials, presents to and leads discussions with the Board, prepares or reviews all meeting minutes, and arranges for Board training and education.
|
|
(2)
|
The Trustees compared the performance of the Fund to benchmark indices over various periods and noted that the Trustees review and discuss reports comparing the investment performance of the Fund to
various indices at each quarterly Board meeting. Based on such information, the Trustees determined that the Advisor manages the Fund in a manner materially consistent with its stated investment objective and style. The Trustees
concluded that the performance of the Fund over various periods warranted the continuation of the advisory agreement.
|
|
|
(3)
|
The Trustees reviewed the advisory fees and overall expense ratios of the Fund compared to other funds similar in asset size and investment objective to the Fund using data from Morningstar. As part of
the discussion with management, the Trustees ensured that they understood and were comfortable with the criteria used to determine the mutual funds included in the Morningstar categories for purposes of the materials considered at
the meeting. The Trustees determined that the advisory fee and overall expense ratio of the Fund falls within a reasonable range of the advisory fees and overall expense ratios of other comparable funds and concluded that they are
reasonable and warranted continuation of the advisory agreement.
|
|
|
(4)
|
The Trustees also considered whether the Advisor was realizing economies of scale that should be shared with the Fund’s shareholders. The Trustees noted that the majority of expenses incurred to manage
the Fund are variable
|
|
HENNESSY FUNDS
|
1-800-966-4354
|
29
|
asset-based fees, so the Advisor does not realize material economies of scale relating to these expenses as the assets of the Fund increase. For example, third-party platform fees increase as the Fund’s
assets grow.
|
||
|
(5)
|
The Trustees considered the profitability of the Advisor, including the impact of mutual fund platform fees on the Advisor’s profitability, and also considered the resources and revenues that the Advisor
has put into managing and distributing the Fund. The Trustees then concluded that the profits of the Advisor are reasonable and not excessive when compared to profitability guidelines set forth in relevant court cases.
|
|
|
(6)
|
The Trustees considered the high level of professionalism and knowledge of the Advisor’s employees and concluded that this was beneficial to the Fund and its shareholders.
|
|
|
(7)
|
The Trustees considered any benefits to the Advisor from serving as an advisor to the Fund (other than the advisory fee). The Trustees noted that the Advisor may derive ancillary benefits from, by way of
example, its association with the Fund in the form of proprietary and third-party research products and services received from broker-dealers that execute portfolio trades for the Fund. The Trustees determined that any such
products and services have been used for legitimate purposes relating to the Fund by providing assistance in the investment decision-making process. The Trustees concluded that any additional benefits realized by the Advisor from
its relationship with the Fund were reasonable, which was based on, among other things, the Trustees’ finding that the research, analytical, statistical, and other information and services provided by brokers are merely
supplemental to the Advisor’s own efforts in the performance of its duties under the advisory agreement.
|
After reviewing the materials and information provided at the meeting, as well as other information regularly provided at the Board’s quarterly meetings throughout the year regarding the
quality of services provided by the Advisor, the performance of the Fund, expense information, brokerage commissions information, the adequacy and efficacy of the Advisor’s written policies and procedures, other regulatory compliance
issues, trading information and related matters, and other factors that the Trustees deemed relevant, the Trustees, including the Independent Trustees, approved the continuation of the advisory agreement.
|
WWW.HENNESSYFUNDS.COM
|
30
|
BOARD APPROVAL OF INVESTMENT ADVISORY AGREEMENT
|
(This Page Intentionally Left Blank.)
For information, questions, or assistance, please call
The Hennessy Funds
800-966-4354 or 415-899-1555
INVESTMENT ADVISOR
Hennessy Advisors, Inc.
7250 Redwood Boulevard, Suite 200
Novato, California 94945
ADMINISTRATOR,
TRANSFER AGENT,
DIVIDEND PAYING AGENT, &
SHAREHOLDER SERVICING AGENT
U.S. Bancorp Fund Services, LLC
d/b/a U.S. Bank Global Fund Services
P.O. Box 701
Milwaukee, Wisconsin 53201-0701
CUSTODIAN
U.S. Bank N.A.
Custody Operations
1555 North River Center Drive, Suite 302
Milwaukee, Wisconsin 53212
TRUSTEES
Neil J. Hennessy
J. Dennis DeSousa
Robert T. Doyle
Claire Garvie
Gerald P. Richardson
COUNSEL
Foley & Lardner LLP
777 East Wisconsin Avenue
Milwaukee, Wisconsin 53202-5306
INDEPENDENT REGISTERED
PUBLIC ACCOUNTING FIRM
Tait, Weller & Baker LLP
Two Liberty Place
50 South 16th Street, Suite 2900
Philadelphia, Pennsylvania 19102-2529
DISTRIBUTOR
Quasar Distributors, LLC
111 East Kilbourn Avenue, Suite 1250
Milwaukee, Wisconsin 53202
www.hennessyfunds.com | 800-966-4354
This report has been prepared for shareholders and may be distributed to
others only if preceded or accompanied by a current prospectus.
SEMI-ANNUAL REPORT
APRIL 30, 2022
HENNESSY TOTAL RETURN FUND
Investor Class HDOGX
www.hennessyfunds.com | 1-800-966-4354
(This Page Intentionally Left Blank.)
Contents
|
Letter to Shareholders
|
2
|
|
Performance Overview
|
4
|
|
Financial Statements
|
|
|
Schedule of Investments
|
5
|
|
Statement of Assets and Liabilities
|
9
|
|
Statement of Operations
|
10
|
|
Statements of Changes in Net Assets
|
11
|
|
Statement of Cash Flows
|
12
|
|
Financial Highlights
|
14
|
|
Notes to the Financial Statements
|
16
|
|
Expense Example
|
24
|
|
Proxy Voting Policy and Proxy Voting Records
|
25
|
|
Availability of Quarterly Portfolio Schedule
|
25
|
|
Federal Tax Distribution Information
|
25
|
|
Important Notice Regarding Delivery of Shareholder Documents
|
25
|
|
Electronic Delivery
|
25
|
|
Board Approval of Investment Advisory Agreement
|
26
|
|
HENNESSY FUNDS
|
1-800-966-4354
|
May 2022
Dear Hennessy Funds Shareholder:
We’d like to start our semi-annual letter with a pause. At the end of 2021, we looked forward to a new year – a potentially calmer year – having come through almost two
full years of the coronavirus pandemic. As people, we were aware our lives had changed, but we hoped for a better 2022; as investors, we were aware that the economy was strong and employment was robust, yet challenges loomed, including
inflation, supply chain disruptions, and tightening monetary policy; as employees, students, and family members, we recognized much was different, but we sought a return to what’s familiar. What we didn’t know was that a world leader
who controls one of the largest militaries on the planet was about to start one of the worst atrocities in Europe since World War II. Our thoughts are with the Ukrainian people, and our hope is for this unjustified, senseless human
tragedy to end quickly.
The equity market started 2022 on a high note, with the S&P 500® Index hitting an all-time high on the first trading day of the year. This turned out to be the last hurrah for a market that saw a continuous march higher in 2021, having hit
70 new all-time highs, with a new all-time high being recorded on average every three and a half days. Concerns in the market then coalesced and overpowered bullish sentiment, and the market has spiraled lower throughout 2022. Factors
that drove the market lower include: tightening monetary policy as the Federal Reserve has begun raising rates and has announced plans for shrinking its $8.5 trillion asset portfolio; inflation, higher energy costs, and their effects on
the domestic and global economies; continued supply chain disruptions; investors’ indiscriminate liquidation of broad-based ETFs and index funds and the detrimental effect on equities; and the near-term and long-term global implications
of the Russian invasion of Ukraine.
While markets are adjusting, many positive conditions remain intact. Corporate balance sheets and profits remain strong, GDP growth remains positive,
the consumer continues to show resilience in the face of rising prices, cash is abundant both at the corporate and household levels, unemployment is exceptionally low, and our financial system remains healthy. Markets are also
experiencing a change in leadership, as value stocks have been outperforming growth stocks, and traditionally defensive sectors such as Utilities and Consumer Staples have been outperforming the broader market. Finally, the Energy
sector has soared in 2022, as companies reap the benefits of dramatically higher oil and natural gas prices, and shareholders are rewarded with significantly higher dividends, aggressive buybacks, and higher stock prices after many
years of underperformance for the sector.
With history as our guide, we are hopeful that eventually the market may bottom and head higher again. Since the financial crisis of 2008, we have
experienced many corrections and many recoveries to new highs. The Dow Jones Industrial Average has dropped over 10% eight times, including the current drop, for a median decline of 14.00%, and on average, it took 45 trading days to
drop from peak to trough and 127 trading days to return to the previous peak. Since the current drop has taken longer to go from peak to its recent trough, it may take some time for a recovery in prices to truly take hold.
On a positive note, valuations have come in, and many stocks have become more attractive, especially for longer-term investors. We note, however, that
the concept of “historically cheap stocks” does not, on its own, move the market higher. Rather, it is
|
WWW.HENNESSYFUNDS.COM
|
2
|
LETTER TO SHAREHOLDERS
|
overall capitulation and improving fundamentals that could bring buyers back into the market and reverse any bearish trends. Investors need to see improving company earnings, retreating inflationary trends, a
measured pace of interest rate increases globally that does not cause significant economic contraction, hope for a more peaceful and orderly world economic system unconstrained by supply bottlenecks and other hindrances to global trade,
and, most importantly, a subsidence of the deleterious effects of the coronavirus pandemic. While that may seem like a “tall order,” we believe that patient investing, focusing on value, quality, and downside risk mitigation, works well
over the longer term.
During this tumultuous period, performance of the majority of the Hennessy Funds has been relatively strong when compared to the overall market as well as to
our benchmarks. During the six months ended April 30, 2022, the Dow Jones Industrial Average, the S&P 500® Index, and the NASDAQ Composite
Index dropped 7.05%, 9.65%, and 20.15%, respectively, on a total return basis. During this period when these three major indices saw significant declines, we were pleased that seven of our 16 Funds posted positive total returns, 10 of
our 14 domestic Funds outperformed the S&P 500® Index, and over half of our active funds outperformed their primary benchmarks.
We thank you, our shareholders, for your continued interest in our family of Funds. We are grateful for the trust you put in us, and we will continue
to strive to manage our portfolios for long-term performance, ever mindful of downside risk. While volatility and uncertainty may impact the markets in the short-term, we encourage investors to stay the course, maintain a diversified
portfolio, and keep a long-term perspective. If you have any questions or would like to speak with us, please don’t hesitate to call us directly at (800) 966-4354. In closing, we would also like to thank all of the healthcare and
frontline workers that have worked – and still work – tirelessly throughout the coronavirus pandemic.
Best regards,
|
|
|
|
|
Ryan C. Kelley, CFA
|
|
|
Chief Investment Officer,
|
|
|
Senior Vice President, and Portfolio Manager
|
Past performance does not guarantee future results.
Mutual fund investing involves risk. Principal loss is possible.
Opinions expressed are those of Ryan C. Kelley and are subject to change, are not guaranteed, and should not be considered investment advice.
The Dow Jones Industrial Average and S&P 500® Index are commonly used to measure the performance of U.S. stocks. The NASDAQ
Composite Index comprises all common stocks listed on The NASDAQ Stock Market and is commonly used to measure the performance of technology-related stocks. The indices are used herein for comparative purposes in accordance with SEC
regulations. One cannot invest directly in an index. All returns are shown on a total return basis.
Please refer to the Performance Overview section for more detailed performance information.
|
HENNESSY FUNDS
|
1-800-966-4354
|
3
Performance Overview (Unaudited)
AVERAGE ANNUAL TOTAL RETURN FOR PERIODS ENDED APRIL 30, 2022
|
Six
|
One
|
Five
|
Ten
|
|
|
Months(1)
|
Year
|
Years
|
Years
|
|
|
Hennessy Total Return
|
||||
|
Fund (HDOGX)
|
3.17%
|
3.40%
|
5.74%
|
6.94%
|
|
75/25 Blended DJIA/Treasury Index
|
-5.24%
|
-0.45%
|
9.43%
|
9.39%
|
|
Dow Jones Industrial Average
|
-7.05%
|
-0.82%
|
11.96%
|
12.20%
|
Expense ratio: 1.35%
|
(1)
|
Periods of less than one year are not annualized.
|
_______________
Performance data quoted represents past performance; past performance does not guarantee future results. The investment return and principal value of an investment will fluctuate so that an
investor’s shares, when redeemed, may be worth more or less than their original cost. The performance table does not reflect the deduction of taxes that a shareholder would pay on Fund distributions or the redemption of Fund shares.
Current performance of the Fund may be lower or higher than the performance quoted. Performance data current to the most recent month end may be obtained by visiting www.hennessyfunds.com.
The 75/25 Blended DJIA/Treasury Index consists of 75% common stocks represented by the Dow Jones Industrial Average and 25% short-duration Treasury securities represented by the ICE BofAML U.S. 3-Month
Treasury Bill Index, which comprises U.S. Treasury securities maturing in three months. The Dow Jones Industrial Average is a price-weighted average of 30 significant stocks traded on the New York Stock Exchange or The Nasdaq Stock
Market LLC. One cannot invest directly in an index. These indices are used for comparative purposes in accordance with Securities and Exchange Commission regulations.
The expense ratio presented is from the most recent prospectus. The expense ratio for the current reporting period is available in the Financial Highlights section of this report.
|
WWW.HENNESSYFUNDS.COM
|
4
|
PERFORMANCE OVERVIEW/SCHEDULE OF INVESTMENTS
|
Financial Statements
|
Schedule of Investments as of April 30, 2022 (Unaudited)
|
HENNESSY TOTAL RETURN FUND
(% of Net Assets)
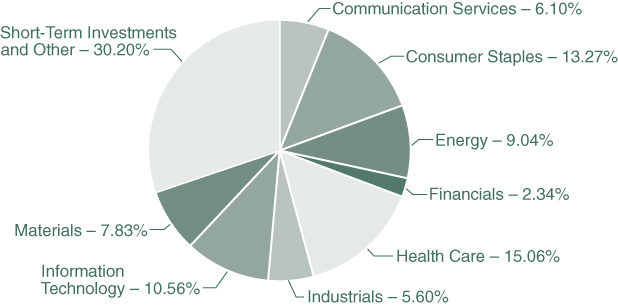
|
TOP TEN HOLDINGS (EXCLUDING MONEY MARKET FUNDS)
|
% NET ASSETS
|
|
U.S. Treasury Bill, 0.785%, 07/14/2022
|
27.96%
|
|
U.S. Treasury Bill, 0.290%, 05/12/2022
|
22.40%
|
|
U.S. Treasury Bill, 0.450%, 06/16/2022
|
22.40%
|
|
Chevron Corp.
|
9.04%
|
|
Dow, Inc.
|
7.83%
|
|
Merck & Co., Inc.
|
7.70%
|
|
The Coca-Cola Co.
|
7.51%
|
|
Amgen, Inc.
|
7.36%
|
|
International Business Machines Corp.
|
7.18%
|
|
Verizon Communications, Inc.
|
6.10%
|
Note: For presentation purposes, the Fund has grouped some of the industry categories. For purposes of categorizing securities for compliance with Section 8(b)(1) of the Investment Company Act of 1940, as
amended, the Fund uses more specific industry classifications.
The Global Industry Classification Standard (GICS®) was developed by and is the exclusive property and a service mark of MSCI,
Inc. and Standard & Poor’s Financial Services LLC. It has been licensed for use by the Hennessy Funds.
|
HENNESSY FUNDS
|
1-800-966-4354
|
5
|
COMMON STOCKS – 69.80%
|
Number
|
% of
|
||||||||||
|
|
of Shares
|
Value
|
Net Assets
|
|||||||||
|
Communication Services – 6.10%
|
||||||||||||
|
Verizon Communications, Inc.
|
70,600
|
$
|
3,268,780
|
6.10
|
%
|
|||||||
|
Consumer Staples – 13.27%
|
||||||||||||
|
The Coca-Cola Co.
|
62,200
|
4,018,742
|
7.51
|
%
|
||||||||
|
Walgreens Boots Alliance, Inc.
|
72,800
|
3,086,720
|
5.76
|
%
|
||||||||
|
|
7,105,462
|
13.27
|
%
|
|||||||||
|
Energy – 9.04%
|
||||||||||||
|
Chevron Corp.
|
30,900
|
4,841,103
|
9.04
|
%
|
||||||||
|
Financials – 2.34%
|
||||||||||||
|
JPMorgan Chase & Co.
|
10,500
|
1,253,280
|
2.34
|
%
|
||||||||
|
Health Care – 15.06%
|
||||||||||||
|
Amgen, Inc.
|
16,900
|
3,940,911
|
7.36
|
%
|
||||||||
|
Merck & Co., Inc.
|
46,500
|
4,124,085
|
7.70
|
%
|
||||||||
|
|
8,064,996
|
15.06
|
%
|
|||||||||
|
Industrials – 5.60%
|
||||||||||||
|
3M Co.
|
20,800
|
2,999,776
|
5.60
|
%
|
||||||||
|
Information Technology – 10.56%
|
||||||||||||
|
Cisco Systems, Inc.
|
1,900
|
93,062
|
0.18
|
%
|
||||||||
|
Intel Corp.
|
39,300
|
1,713,087
|
3.20
|
%
|
||||||||
|
International Business Machines Corp.
|
29,100
|
3,847,311
|
7.18
|
%
|
||||||||
|
|
5,653,460
|
10.56
|
%
|
|||||||||
|
Materials – 7.83%
|
||||||||||||
|
Dow, Inc.
|
63,100
|
4,196,150
|
7.83
|
%
|
||||||||
|
|
||||||||||||
|
Total Common Stocks
|
||||||||||||
|
(Cost $33,461,395)
|
37,383,007
|
69.80
|
%
|
|||||||||
The accompanying notes are an integral part of these financial statements.
|
WWW.HENNESSYFUNDS.COM
|
6
|
SCHEDULE OF INVESTMENTS
|
|
SHORT-TERM INVESTMENTS – 73.95%
|
Number of Shares/
|
% of
|
||||||||||
|
|
Par Amount
|
Value
|
Net Assets
|
|||||||||
|
Money Market Funds – 1.19%
|
||||||||||||
|
First American Government Obligations Fund,
|
||||||||||||
|
Institutional Class, 0.22% (a)
|
635,946
|
$
|
635,946
|
1.19
|
%
|
|||||||
|
U.S. Treasury Bills – 72.76%
|
||||||||||||
|
0.290%, 05/12/2022 (b)(c)
|
12,000,000
|
11,998,937
|
22.40
|
%
|
||||||||
|
0.450%, 06/16/2022 (b)(c)
|
12,000,000
|
11,994,480
|
22.40
|
%
|
||||||||
|
0.785%, 07/14/2022 (b)(c)
|
15,000,000
|
14,976,457
|
27.96
|
%
|
||||||||
|
|
38,969,874
|
72.76
|
%
|
|||||||||
|
|
||||||||||||
|
Total Short-Term Investments
|
||||||||||||
|
(Cost $39,607,009)
|
39,605,820
|
73.95
|
%
|
|||||||||
|
|
||||||||||||
|
Total Investments
|
||||||||||||
|
(Cost $73,068,404) – 143.75%
|
76,988,827
|
143.75
|
%
|
|||||||||
|
Liabilities in Excess of Other Assets – (43.75)%
|
(23,432,104
|
)
|
(43.75
|
)%
|
||||||||
|
|
||||||||||||
|
TOTAL NET ASSETS – 100.00%
|
$
|
53,556,723
|
100.00
|
%
|
||||||||
Percentages are stated as a percent of net assets.
|
(a)
|
The rate listed is the fund’s seven-day yield as of April 30, 2022.
|
|
(b)
|
The rate listed is the discount rate at issue.
|
|
(c)
|
All or a portion of this security is pledged as collateral for securities sold subject to repurchase. The aggregate fair value of the collateral is $25,979,918.
|
Summary of Fair Value Exposure as of April 30, 2022
The following is a summary of the inputs used to value the Fund’s net assets as of April 30, 2022 (see Note 3 in the accompanying Notes to the Financial Statements):
|
Common Stocks
|
Level 1
|
Level 2
|
Level 3
|
Total
|
||||||||||||
|
Communication Services
|
$
|
3,268,780
|
$
|
—
|
$
|
—
|
$
|
3,268,780
|
||||||||
|
Consumer Staples
|
7,105,462
|
—
|
—
|
7,105,462
|
||||||||||||
|
Energy
|
4,841,103
|
—
|
—
|
4,841,103
|
||||||||||||
|
Financials
|
1,253,280
|
—
|
—
|
1,253,280
|
||||||||||||
|
Health Care
|
8,064,996
|
—
|
—
|
8,064,996
|
||||||||||||
|
Industrials
|
2,999,776
|
—
|
—
|
2,999,776
|
||||||||||||
|
Information Technology
|
5,653,460
|
—
|
—
|
5,653,460
|
||||||||||||
|
Materials
|
4,196,150
|
—
|
—
|
4,196,150
|
||||||||||||
|
Total Common Stocks
|
$
|
37,383,007
|
$
|
—
|
$
|
—
|
$
|
37,383,007
|
||||||||
|
Short-Term Investments
|
||||||||||||||||
|
Money Market Funds
|
$
|
635,946
|
$
|
—
|
$
|
—
|
$
|
635,946
|
||||||||
|
U.S. Treasury Bills
|
—
|
38,969,874
|
—
|
38,969,874
|
||||||||||||
|
Total Short-Term Investments
|
$
|
635,946
|
$
|
38,969,874
|
$
|
—
|
$
|
39,605,820
|
||||||||
|
Total Investments
|
$
|
38,018,953
|
$
|
38,969,874
|
$
|
—
|
$
|
76,988,827
|
||||||||
The accompanying notes are an integral part of these financial statements.
|
HENNESSY FUNDS
|
1-800-966-4354
|
7
Schedule of Reverse Repurchase Agreements
|
Principal
|
Maturity
|
|||||||||||||
|
Face Value
|
Counterparty
|
Rate
|
Trade Date
|
Maturity Date
|
Amount
|
|||||||||
|
$
|
7,196,000
|
Jefferies LLC
|
0.45%
|
|
02/10/22
|
05/12/22
|
$
|
7,204,096
|
||||||
|
7,196,000
|
Jefferies LLC
|
0.70%
|
|
03/17/22
|
06/16/22
|
7,208,593
|
||||||||
|
8,995,000
|
Jefferies LLC
|
0.95%
|
|
04/14/22
|
07/14/22
|
9,016,363
|
||||||||
|
$
|
23,387,000
|
$
|
23,429,052
|
|||||||||||
As of April 30, 2022, the fair value of securities held as collateral for reverse repurchase agreements was $25,979,918, as noted on the Schedule of Investments.
Reverse repurchase agreements are not included in the fair value hierarchy because they are carried at face value. Due to the short-term nature of the reverse repurchase agreements, face
value approximates fair value. The face value of the reverse repurchase agreements as of April 30, 2022, was $23,387,000. The face value plus interest due at maturity is equal to $23,429,052.
The accompanying notes are an integral part of these financial statements.
|
WWW.HENNESSYFUNDS.COM
|
8
|
SCHEDULE OF INVESTMENTS/STATEMENT OF ASSETS AND LIABILITIES
|
Financial Statements
|
Statement of Assets and Liabilities as of April 30, 2022 (Unaudited)
|
|
ASSETS:
|
||||
|
Investments in securities, at value (cost $73,068,404)
|
$
|
76,988,827
|
||
|
Dividends and interest receivable
|
55,792
|
|||
|
Receivable for fund shares sold
|
420
|
|||
|
Prepaid expenses and other assets
|
9,440
|
|||
|
Total assets
|
77,054,479
|
|||
|
LIABILITIES:
|
||||
|
Payable to advisor
|
27,031
|
|||
|
Payable to administrator
|
11,221
|
|||
|
Payable to auditor
|
11,228
|
|||
|
Accrued distribution fees
|
28,983
|
|||
|
Accrued service fees
|
4,505
|
|||
|
Reverse repurchase agreements
|
23,387,000
|
|||
|
Accrued interest payable
|
17,061
|
|||
|
Accrued trustees fees
|
5,948
|
|||
|
Accrued expenses and other payables
|
4,779
|
|||
|
Total liabilities
|
23,497,756
|
|||
|
NET ASSETS
|
$
|
53,556,723
|
||
|
NET ASSETS CONSISTS OF:
|
||||
|
Capital stock
|
$
|
46,802,079
|
||
|
Total distributable earnings
|
6,754,644
|
|||
|
Total net assets
|
$
|
53,556,723
|
||
|
NET ASSETS:
|
||||
|
Investor Class
|
||||
|
Shares authorized (no par value)
|
Unlimited
|
|||
|
Net assets applicable to outstanding shares
|
$
|
53,556,723
|
||
|
Shares issued and outstanding
|
3,859,948
|
|||
|
Net asset value, offering price, and redemption price per share
|
$
|
13.87
|
||
The accompanying notes are an integral part of these financial statements.
|
HENNESSY FUNDS
|
1-800-966-4354
|
9
Financial Statements
|
Statement of Operations for the six months ended April 30, 2022 (Unaudited)
|
|
INVESTMENT INCOME:
|
||||
|
Dividend income
|
$
|
712,102
|
||
|
Interest income
|
26,174
|
|||
|
Total investment income
|
738,276
|
|||
|
EXPENSES:
|
||||
|
Investment advisory fees (See Note 5)
|
161,623
|
|||
|
Distribution fees – Investor Class (See Note 5)
|
40,406
|
|||
|
Interest expense (See Notes 7 and 9)
|
38,429
|
|||
|
Administration, accounting, custody, and transfer agent fees (See Note 5)
|
35,110
|
|||
|
Service fees – Investor Class (See Note 5)
|
26,937
|
|||
|
Sub-transfer agent expenses – Investor Class (See Note 5)
|
16,162
|
|||
|
Compliance expense (See Note 5)
|
15,156
|
|||
|
Audit fees
|
11,222
|
|||
|
Federal and state registration fees
|
10,126
|
|||
|
Trustees’ fees and expenses
|
8,766
|
|||
|
Reports to shareholders
|
4,070
|
|||
|
Legal fees
|
357
|
|||
|
Other expenses
|
4,598
|
|||
|
Total expenses
|
372,962
|
|||
|
NET INVESTMENT INCOME
|
$
|
365,314
|
||
|
REALIZED AND UNREALIZED GAINS (LOSSES):
|
||||
|
Net realized gain on investments
|
$
|
3,139,523
|
||
|
Net change in unrealized appreciation/depreciation on investments
|
(1,778,144
|
)
|
||
|
Net gain on investments
|
1,361,379
|
|||
|
NET INCREASE IN NET ASSETS RESULTING FROM OPERATIONS
|
$
|
1,726,693
|
||
The accompanying notes are an integral part of these financial statements.
|
WWW.HENNESSYFUNDS.COM
|
10
|
STATEMENT OF OPERATIONS/STATEMENTS OF CHANGES IN NET ASSETS
|
Financial Statements
|
Statements of Changes in Net Assets
|
|
Six Months Ended
|
||||||||
|
April 30, 2022
|
Year Ended
|
|||||||
|
(Unaudited)
|
October 31, 2021
|
|||||||
|
OPERATIONS:
|
||||||||
|
Net investment income
|
$
|
365,314
|
$
|
843,922
|
||||
|
Net realized gain (loss) on investments
|
3,139,523
|
(185,169
|
)
|
|||||
|
Net change in unrealized
|
||||||||
|
appreciation/depreciation on investments
|
(1,778,144
|
)
|
9,981,646
|
|||||
|
Net increase in net assets resulting from operations
|
1,726,693
|
10,640,399
|
||||||
|
DISTRIBUTIONS TO SHAREHOLDERS:
|
||||||||
|
Distributable earnings – Investor Class
|
(387,098
|
)
|
(3,994,715
|
)
|
||||
|
Total distributions
|
(387,098
|
)
|
(3,994,715
|
)
|
||||
|
CAPITAL SHARE TRANSACTIONS:
|
||||||||
|
Proceeds from shares subscribed – Investor Class
|
381,648
|
575,745
|
||||||
|
Dividends reinvested – Investor Class
|
367,698
|
3,786,662
|
||||||
|
Cost of shares redeemed – Investor Class
|
(2,984,784
|
)
|
(7,221,451
|
)
|
||||
|
Net decrease in net assets derived
|
||||||||
|
from capital share transactions
|
(2,235,438
|
)
|
(2,859,044
|
)
|
||||
|
TOTAL INCREASE (DECREASE) IN NET ASSETS
|
(895,843
|
)
|
3,786,640
|
|||||
|
NET ASSETS:
|
||||||||
|
Beginning of period
|
54,452,566
|
50,665,926
|
||||||
|
End of period
|
$
|
53,556,723
|
$
|
54,452,566
|
||||
|
CHANGES IN SHARES OUTSTANDING:
|
||||||||
|
Shares sold – Investor Class
|
27,122
|
43,131
|
||||||
|
Shares issued to holders as reinvestment
|
||||||||
|
of dividends – Investor Class
|
26,243
|
294,662
|
||||||
|
Shares redeemed – Investor Class
|
(215,853
|
)
|
(548,584
|
)
|
||||
|
Net decrease in shares outstanding
|
(162,488
|
)
|
(210,791
|
)
|
||||
The accompanying notes are an integral part of these financial statements.
|
HENNESSY FUNDS
|
1-800-966-4354
|
11
Financial Statements
|
Statement of Cash Flows for the six months ended April 30, 2022 (Unaudited)
|
|
Cash flows from operating activities:
|
||||
|
Net increase in net assets from operations
|
$
|
1,726,693
|
||
|
Adjustments to reconcile net increase in net assets resulting from
|
||||
|
operations to net cash used in operating activities:
|
||||
|
Payments to purchase securities
|
(7,131,584
|
)
|
||
|
Proceeds from sale of securities
|
9,183,542
|
|||
|
Net sale of short term investments
|
(1,550,046
|
)
|
||
|
Realized gain on investments in securities
|
(3,139,523
|
)
|
||
|
Net accretion of discount on securities
|
(25,862
|
)
|
||
|
Change in unrealized appreciation/depreciation
|
||||
|
on investments in securities
|
1,778,144
|
|||
|
(Increases) decreases in operating assets:
|
||||
|
Increase in dividends and interest receivable
|
(2,446
|
)
|
||
|
Decrease in prepaid expenses and other assets
|
1,675
|
|||
|
Increases (decreases) in operating liabilities:
|
||||
|
Decrease in payable to advisor
|
(813
|
)
|
||
|
Decrease in payable to administrator
|
(6,949
|
)
|
||
|
Decrease in payable for distribution fees
|
(3,652
|
)
|
||
|
Decrease in payable for service fees
|
(135
|
)
|
||
|
Increase in accrued interest payable
|
12,014
|
|||
|
Decrease in accrued audit fees
|
(11,328
|
)
|
||
|
Decrease in accrued trustee fees
|
(655
|
)
|
||
|
Decrease in other accrued expenses and payables
|
(5,105
|
)
|
||
|
Net cash used in operating securities
|
823,970
|
|||
|
Cash flows from financing activities:
|
||||
|
Increase in reverse repurchase agreements
|
1,799,000
|
|||
|
Proceeds on shares sold
|
381,264
|
|||
|
Payment on shares redeemed
|
(2,984,834
|
)
|
||
|
Distributions paid in cash, net of reinvestments
|
(19,400
|
)
|
||
|
Net cash provided by financing activities
|
(823,970
|
)
|
||
|
Net increase in cash
|
—
|
|||
|
Cash:
|
||||
|
Beginning balance
|
—
|
|||
|
Ending balance
|
$
|
—
|
||
|
Supplemental information:
|
||||
|
Non-cash financing activities not included herein, consisting
|
||||
|
of dividend reinvestment of dividends and distributions
|
$
|
367,698
|
||
|
Cash paid for interest
|
$
|
26,415
|
||
The accompanying notes are an integral part of these financial statements.
|
WWW.HENNESSYFUNDS.COM
|
12
|
STATEMENT OF CASH FLOWS
|
(This Page Intentionally Left Blank.)
|
HENNESSY FUNDS
|
1-800-966-4354
|
13
Financial Statements
|
Financial Highlights
|
For an Investor Class share outstanding throughout each period
|
Six Months Ended
|
||||
|
April 30, 2022
|
||||
|
(Unaudited)
|
||||
|
PER SHARE DATA:
|
||||
|
Net asset value, beginning of period
|
$
|
13.54
|
||
|
Income from investment operations:
|
||||
|
Net investment income
|
0.09
|
(1)
|
||
|
Net realized and unrealized gains (losses) on investments
|
0.34
|
|||
|
Total from investment operations
|
0.43
|
|||
|
Less distributions:
|
||||
|
Dividends from net investment income
|
(0.10
|
)
|
||
|
Dividends from net realized gains
|
—
|
|||
|
Total distributions
|
(0.10
|
)
|
||
|
Net asset value, end of period
|
$
|
13.87
|
||
|
TOTAL RETURN
|
3.17
|
%(2)
|
||
|
SUPPLEMENTAL DATA AND RATIOS:
|
||||
|
Net assets, end of period (millions)
|
$
|
53.56
|
||
|
Ratio of expenses, including interest expense, to average net assets
|
1.38
|
%(3)
|
||
|
Ratio of net investment income to average net assets
|
1.36
|
%(3)
|
||
|
Portfolio turnover rate
|
19
|
%(2)
|
||
|
(1)
|
Calculated using the average shares outstanding method.
|
|
(2)
|
Not annualized.
|
|
(3)
|
Annualized.
|
The accompanying notes are an integral part of these financial statements.
|
WWW.HENNESSYFUNDS.COM
|
14
|
FINANCIAL HIGHLIGHTS — INVESTOR CLASS
|
|
Year Ended October 31,
|
||||||||||||||||||
|
2021
|
2020
|
2019
|
2018
|
2017
|
||||||||||||||
|
$
|
11.97
|
$
|
13.98
|
$
|
13.57
|
$
|
14.66
|
$
|
13.84
|
|||||||||
|
0.20
|
(1)
|
0.27
|
(1)
|
0.24
|
(1)
|
0.23
|
0.20
|
|||||||||||
|
2.33
|
(1.99
|
)
|
0.81
|
0.43
|
1.48
|
|||||||||||||
|
2.53
|
(1.72
|
)
|
1.05
|
0.66
|
1.68
|
|||||||||||||
|
(0.20
|
)
|
(0.29
|
)
|
(0.24
|
)
|
(0.23
|
)
|
(0.20
|
)
|
|||||||||
|
(0.76
|
)
|
—
|
(0.40
|
)
|
(1.52
|
)
|
(0.66
|
)
|
||||||||||
|
(0.96
|
)
|
(0.29
|
)
|
(0.64
|
)
|
(1.75
|
)
|
(0.86
|
)
|
|||||||||
|
$
|
13.54
|
$
|
11.97
|
$
|
13.98
|
$
|
13.57
|
$
|
14.66
|
|||||||||
|
21.72
|
%
|
-12.36
|
%
|
7.93
|
%
|
4.92
|
%
|
12.56
|
%
|
|||||||||
|
$
|
54.45
|
$
|
50.67
|
$
|
72.94
|
$
|
71.60
|
$
|
77.75
|
|||||||||
|
1.35
|
%
|
1.73
|
%
|
2.31
|
%
|
1.95
|
%
|
1.57
|
%
|
|||||||||
|
1.52
|
%
|
2.05
|
%
|
1.74
|
%
|
1.67
|
%
|
1.38
|
%
|
|||||||||
|
19
|
%
|
39
|
%
|
30
|
%
|
10
|
%
|
36
|
%
|
|||||||||
The accompanying notes are an integral part of these financial statements.
|
HENNESSY FUNDS
|
1-800-966-4354
|
15
Financial Statements
|
Notes to the Financial Statements April 30, 2022 (Unaudited)
|
1). ORGANIZATION
The Hennessy Total Return Fund (the “Fund”) is a series of Hennessy Funds Trust (the “Trust”), which was organized as a Delaware statutory trust on September 17, 1992. The Fund is an open-end management
investment company registered under the Investment Company Act of 1940, as amended. The investment objective of the Fund is total return, consisting of capital appreciation and current income. The Fund is a non-diversified fund and
offers Investor Class shares.
As an investment company, the Fund follows the investment company accounting and reporting guidance of the Financial Accounting Standards Board (“FASB”) Accounting Standard Codification
Topic 946 “Financial Services—Investment Companies.”
2). SIGNIFICANT ACCOUNTING POLICIES
The following is a summary of significant accounting policies consistently followed by the Fund in the preparation of the financial statements. These policies conform to U.S. generally accepted accounting
principles (“GAAP”).
|
a).
|
Securities Valuation – All investments in securities are valued in accordance with the Fund’s valuation policies and procedures, as described in Note 3.
|
|
b).
|
Federal Income Taxes – The Fund has elected to be taxed as a regulated investment company and intends to distribute substantially all of its taxable income to its shareholders and otherwise comply with
the provisions of the Internal Revenue Code of 1986, as amended, applicable to regulated investment companies. As a result, the Fund has made no provision for federal income taxes or excise taxes. Net investment income/loss and
realized gains/losses for federal income tax purposes may differ from those reported in the financial statements because of temporary book-basis and tax-basis differences. Temporary differences are primarily the result of the
treatment of wash sales for tax reporting purposes. The Fund recognizes interest and penalties related to income tax benefits, if any, in the Statement of Operations as an income tax expense. Distributions from net realized
gains for book purposes may include short-term capital gains, which are included as ordinary income to shareholders for tax purposes. The Fund may utilize equalization accounting for tax purposes and designate earnings and
profits, including net realized gains distributed to shareholders on redemption of shares, as part of the dividends paid deduction for income tax purposes.
|
|
c).
|
Accounting for Uncertainty in Income Taxes – The Fund has accounting policies regarding recognition and measurement of tax positions taken or expected to be taken on a tax return. The tax returns of
the Fund for the prior three fiscal years are open for examination. The Fund has reviewed all open tax years in major tax jurisdictions and concluded that there is no impact on the Fund’s net assets and no tax liability
resulting from unrecognized tax benefits relating to uncertain income tax positions taken or expected to be taken on a tax return. The Fund’s major tax jurisdictions are U.S. federal and Delaware.
|
|
d).
|
Income and Expenses – Dividend income is recognized on the ex-dividend date or as soon as information is available to the Fund. Interest income, which includes the amortization of premium and accretion
of discount, is recognized on an accrual basis.
|
|
WWW.HENNESSYFUNDS.COM
|
16
|
NOTES TO THE FINANCIAL STATEMENTS
|
|
Market discounts, original issue discounts, and market premiums on debt securities are accreted or amortized to interest income over the life of a security with a corresponding increase or decrease, as
applicable, in the cost basis of such security using the yield-to-maturity method or, where applicable, the first call date of the security. Other non-cash dividends are recognized as investment income at the fair value of the
property received. The Fund is charged for those expenses that are directly attributable to its portfolio, such as advisory, administration, and certain shareholder service fees.
|
|
|
e).
|
Distributions to Shareholders – Dividends from net investment income for the Fund, if any, are declared and paid at the end of each calendar quarter. Distributions of net realized capital gains, if
any, are declared and paid annually, usually in December.
|
|
f).
|
Security Transactions – Investment and shareholder transactions are recorded on the trade date. The Fund determines the realized gain/loss from an investment transaction by comparing the original cost
of the security lot sold with the net sale proceeds. Discounts and premiums on securities purchased are accreted or amortized, respectively, over the life of each such security.
|
|
g).
|
Use of Estimates – Preparing financial statements in accordance with GAAP requires management to make estimates and assumptions that affect the reported amounts of assets and liabilities and disclosure
of contingent assets and liabilities at the date of the financial statements, as well as the reported change in net assets during the reporting period. Actual results could differ from those estimates.
|
|
h).
|
Share Valuation – The net asset value (“NAV”) per share of the Fund is calculated by dividing (i) the total value of the securities held by the Fund, plus cash and other assets, minus all liabilities
(including estimated accrued expenses) by (ii) the total number of Fund shares outstanding, rounded to the nearest $0.01. Fund shares are not priced on days the New York Stock Exchange is closed for trading. The offering and
redemption price per share for the Fund is equal to the Fund’s NAV per share.
|
|
i).
|
Reverse Repurchase Agreements – Transactions involving reverse repurchase agreements are treated as collateralized financing transactions and are recorded at their contracted resell or repurchase
amounts, which approximates fair value. Upon entering into a reverse repurchase agreement transaction, the Fund establishes a segregated account in which it maintains liquid assets in an amount at least equal to the repurchase
price marked to market daily (including accrued interest), and the Fund subsequently monitors the account to ensure that it maintains such equivalent value. Interest on reverse repurchase agreements is included in interest
payable.
|
|
As of April 30, 2022, securities with a fair value of $25,979,918, which are included in investments in securities in the
Statement of Assets and Liabilities, were pledged to collateralize reverse repurchase agreements.
|
|
|
j).
|
Offsetting Assets and Liabilities – The Fund follows the financial reporting rules regarding offsetting assets and liabilities and related netting arrangements to enable users of its financial
statements to understand the effect of those arrangements on its financial position. Reverse repurchase transactions are entered into by the Fund under Master Repurchase Agreements (“MRAs”) that permit the Fund, under certain
circumstances, including an event of default (such as bankruptcy or insolvency), to offset payables under the MRA with collateral held with the counterparty and create one single net payment from the Fund. Upon a bankruptcy or
insolvency of the MRA counterparty, the Fund is considered an unsecured creditor with respect to excess collateral and, as such, the return of excess collateral may be delayed. In the event the buyer of securities under an MRA
files for bankruptcy or becomes insolvent, the
|
|
HENNESSY FUNDS
|
1-800-966-4354
|
17
|
Fund’s use of the proceeds of the MRA may be restricted while the other party, or its trustee or receiver, determines whether or not to enforce the Fund’s obligation to repurchase the securities. For
additional information regarding the offsetting of assets and liabilities as of April 30, 2022, please refer to the table in Note 9.
|
|
|
k).
|
Recent Accounting Pronouncements and Regulatory Updates – In October 2020, the Securities and Exchange Commission (“SEC”) adopted new regulations governing the use of derivatives by registered
investment companies (“Rule 18f-4”). Rule 18f-4 imposes limits on the amount of derivatives a fund can enter into, eliminates the asset segregation framework currently used by funds to comply with Section 18 of the 1940 Act, and
requires funds whose use of derivatives is greater than a limited specified amount to establish and maintain a comprehensive derivatives risk management program and appoint a derivatives risk manager. Funds are required to
comply with Rule 18f-4 by August 19, 2022. The impact, if any, that Rule 18f-4 will have on the availability, liquidity, and performance of derivatives is unclear. Management is currently evaluating the potential impact of Rule
18f-4 on the Fund. When fully implemented, Rule 18f-4 may require changes in how the Fund uses derivatives, adversely affect the Fund’s performance, and increase costs related to the Fund’s use of derivatives.
|
|
In December 2020, the SEC adopted a new rule providing a framework for fund valuation practices (“Rule 2a-5”). Rule 2a-5
establishes requirements for determining fair value in good faith for purposes of the 1940 Act. Rule 2a-5 permits fund boards to designate certain parties to perform fair value determinations, subject to board oversight and
certain other conditions. Rule 2a-5 also defines when market quotations are “readily available” for purposes of the 1940 Act and the threshold for determining whether a fund must fair value a security. In connection with Rule
2a-5, the SEC also adopted related recordkeeping requirements and is rescinding previously issued guidance, including with respect to the role of a board in determining fair value and the accounting and auditing of fund
investments. Funds must comply with the rules by September 8, 2022. Management is currently assessing the potential impact of the new rules on the Fund’s financial statements.
|
3). SECURITIES VALUATION
The Fund follows its valuation policies and procedures in determining its net asset value and, in preparing these financial statements, the fair value accounting standards that establish an authoritative
definition of fair value and set out a hierarchy for measuring fair value. These standards require additional disclosures about the various inputs and valuation techniques used to develop the measurements of fair value and a discussion
of changes in valuation techniques and related inputs during the period. These inputs are summarized in the three broad levels listed below:
|
Level 1 –
|
Unadjusted, quoted prices in active markets for identical instruments that the Fund has the ability to access at the date of measurement.
|
|
|
Level 2 –
|
Other significant observable inputs (including, but not limited to, quoted prices in active markets for similar instruments, quoted prices in markets that are not active for identical or similar
instruments, and model-derived valuations in which all significant inputs and significant value drivers are observable in active markets, such as interest rates, prepayment speeds, credit risk curves, default rates, and similar
data).
|
|
|
Level 3 –
|
Significant unobservable inputs (including the Fund’s own assumptions about what market participants would use to price the asset or liability based on the best available information) when observable
inputs are unavailable.
|
|
WWW.HENNESSYFUNDS.COM
|
18
|
NOTES TO THE FINANCIAL STATEMENTS
|
The following is a description of the valuation techniques applied to the Fund’s major categories of assets and liabilities on a recurring basis:
|
Equity Securities – Equity securities, including common stocks, preferred stocks, exchange-traded funds, closed-end mutual funds, partnerships, rights, and real
estate investment trusts, that are traded on a securities exchange for which a last-quoted sales price is readily available generally are valued at the last sales price as reported by the primary exchange on which the securities
are listed. Securities listed on The Nasdaq Stock Market (“Nasdaq”) generally are valued at the Nasdaq Official Closing Price, which may differ from the last sales price reported. Securities traded on a securities exchange for
which a last-quoted sales price is not readily available generally are valued at the mean between the bid and ask prices. To the extent these securities are actively traded and valuation adjustments are not applied, they are
classified in Level 1 of the fair value hierarchy.
|
|
|
Registered Investment Companies – Investments in open-end registered investment companies, commonly referred to as mutual funds, generally are priced at the
ending NAV provided by the applicable mutual fund’s service agent and are classified in Level 1 of the fair value hierarchy.
|
|
|
Debt Securities – Debt securities, including corporate bonds, asset-backed securities, mortgage-backed securities, municipal bonds, U.S. Treasuries, and U.S.
government agency issues, are generally valued at market on the basis of valuations furnished by an independent pricing service that utilizes both dealer-supplied valuations and formula-based techniques. The pricing service may
consider recently executed transactions in securities of the issuer or comparable issuers, market price quotations (where observable), bond spreads, and fundamental data relating to the issuer. In addition, the model may
incorporate observable market data, such as reported sales of similar securities, broker quotes, yields, bids, offers, and reference data. Certain securities are valued primarily using dealer quotations. These securities are
generally classified in Level 2 of the fair value hierarchy.
|
|
|
Short-Term Securities – Short-term equity investments, including money market funds, are valued in the manner specified above for equity securities. Short-term
debt investments with an original term to maturity of 60 days or less are valued at amortized cost, which approximates fair market value. If the original term to maturity of a short-term debt investment exceeds 60 days, then the
values as of the 61st day prior to maturity are amortized. Amortized cost is not used if its use would be inappropriate due to credit or other impairments of the issuer, in which case the security’s fair value would be
determined as described below. Short-term securities are generally classified in Level 1 or Level 2 of the fair value hierarchy depending on the inputs used and market activity levels for specific securities.
|
The Board of Trustees of the Fund (the “Board”) has adopted fair value pricing procedures that are followed when a price for a security is not readily available or if a significant event has
occurred that indicates the closing price of a security no longer represents the true value of that security. Fair value pricing determinations are made in good faith in accordance with these procedures. There are numerous criteria
considered in determining a fair value of a security, such as the trading volume of a security and markets, the values of other similar securities, and news events with direct bearing on a security or markets. Fair value pricing results
in an estimated price for a security that reflects the amount the Fund might reasonably expect to receive in a current sale. Depending on the relative significance of the valuation inputs, these securities may be classified in either
Level 2 or Level 3 of the fair value hierarchy.
|
HENNESSY FUNDS
|
1-800-966-4354
|
19
The Board has delegated day-to-day valuation matters to the Valuation and Liquidity Committee comprising representatives from Hennessy Advisors, Inc., the Fund’s investment advisor (the
“Advisor”). The function of the Valuation and Liquidity Committee, among other things, is to value securities where current and reliable market quotations are not readily available. All actions taken by the Valuation and Liquidity
Committee are reviewed by the Board.
The Fund has performed an analysis of all existing investments to determine the significance and character of all inputs to their fair value determinations. Various inputs are used to
determine the value of the Fund’s investments. The inputs or methodology used for valuing securities are not necessarily an indication of the risk associated with investing in those securities. Details related to the fair value
hierarchy of the Fund’s securities as of April 30, 2022, are included in the Schedule of Investments.
4). INVESTMENT TRANSACTIONS
Purchases and sales of investment securities (excluding government and short-term investments) for the Fund during the six months ended April 30, 2022, were $7,131,584 and $9,183,542, respectively.
There were no purchases or sales/maturities of long-term U.S. government securities for the Fund during the six months ended April 30, 2022.
5). INVESTMENT ADVISORY FEE AND OTHER TRANSACTIONS WITH AFFILIATES
The Advisor provides the Fund with investment advisory services under an Investment Advisory Agreement. The Advisor furnishes all investment advice, office space, and facilities and most of the personnel
needed by the Fund. As compensation for its services, the Advisor is entitled to a monthly fee from the Fund. The fee is based on the average daily net assets of the Fund at an annual rate of 0.60%. The net investment advisory fees
expensed by the Fund during the six months ended April 30, 2022, are included in the Statement of Operations.
The Board has approved a Shareholder Servicing Agreement for the Fund, which compensates the Advisor for the non-investment advisory services it provides to the Fund. The Shareholder
Servicing Agreement provides for a monthly fee paid to the Advisor at an annual rate of 0.10% of the average daily net assets of the Fund. The shareholder service fees expensed by the Fund during the six months ended April 30, 2022, are
included in the Statement of Operations.
The Fund has adopted a plan pursuant to Rule 12b-1 under the Investment Company Act of 1940, as amended, that authorizes payments in connection with the distribution of Fund shares at an
annual rate of up to 0.25% of the Fund’s average daily net assets. Even though the authorized rate is up to 0.25%, the Fund is currently only using up to 0.15% of its average daily net assets for such purpose. Amounts paid under the
plan may be spent on any activities or expenses primarily intended to result in the sale of shares, including, but not limited to, advertising, shareholder account servicing, printing and mailing of prospectuses to other than current
shareholders, printing and mailing of sales literature, and compensation for sales and marketing activities or to financial institutions and others, such as dealers and distributors. The distribution fees expensed by the Fund during the
six months ended April 30, 2022, are included in the Statement of Operations.
The Fund has entered into agreements with various brokers, dealers, and financial intermediaries in connection with the sale of Fund shares. The agreements provide for periodic payments of
sub-transfer agent expenses by the Fund to the brokers, dealers, and financial intermediaries for providing certain shareholder maintenance services. These
|
WWW.HENNESSYFUNDS.COM
|
20
|
NOTES TO THE FINANCIAL STATEMENTS
|
shareholder services include the pre-processing and quality control of new accounts, shareholder correspondence, answering customer inquiries regarding account status, and facilitating shareholder telephone
transactions. The sub-transfer agent fees expensed by the Fund during the six months ended April 30, 2022, are included in the Statement of Operations.
U.S. Bancorp Fund Services, LLC, d/b/a U.S. Bank Global Fund Services (“Fund Services”) provides the Fund with administrative, accounting, and transfer agent services. As administrator, Fund
Services is responsible for activities such as (i) preparing various federal and state regulatory filings, reports, and returns for the Fund, (ii) preparing reports and materials to be supplied to the Board, (iii) monitoring the
activities of the Fund’s custodian, transfer agent, and accountants, and (iv) coordinating the preparation and payment of the Fund’s expenses and reviewing the Fund’s expense accruals. U.S. Bank N.A., an affiliate of Fund Services,
serves as the Fund’s custodian. The servicing agreements between the Trust, Fund Services, and U.S. Bank N.A. contain a fee schedule that is inclusive of administrative, accounting, custody, and transfer agent fees. The administrative,
accounting, custody, and transfer agent fees expensed by the Fund during the six months ended April 30, 2022, are included in the Statement of Operations.
Quasar Distributors, LLC (“Quasar”), a wholly owned broker-dealer subsidiary of Foreside Financial Group, LLC, acts as the Fund’s principal underwriter in a continuous public offering of
Fund shares.
The officers of the Fund are affiliated with the Advisor. With the exception of the Chief Compliance Officer and the Senior Compliance Officer, such officers receive no compensation from the
Fund for serving in their respective roles. The Fund, along with the other funds in the Hennessy Funds family (collectively, the “Hennessy Funds”), makes reimbursement payments on an equal basis to the Advisor for a portion of the
salary and benefits associated with the office of the Chief Compliance Officer and for all of the salary and benefits associated with the office of the Senior Compliance Officer. The compliance fees expensed by the Fund during the six
months ended April 30, 2022, are included in the Statement of Operations.
6). GUARANTEES AND INDEMNIFICATIONS
Under the Hennessy Funds’ organizational documents, their officers and trustees are indemnified by the Hennessy Funds against certain liabilities arising out of the performance of their duties to the Hennessy
Funds. Additionally, in the normal course of business, the Hennessy Funds enter into contracts with service providers that contain general indemnification clauses. The Fund’s maximum exposure under these arrangements is unknown as this
would involve future claims that may be made against the Fund that have not yet occurred. Currently, the Fund expects the risk of loss to be remote.
7). LINE OF CREDIT
The Fund has an uncommitted line of credit with the other Hennessy Funds in the amount of the lesser of (i) $100,000,000 or (ii) 33.33% of each Hennessy Fund’s net assets, or 30% for the Hennessy Gas Utility
Fund and 10% for the Hennessy Balanced Fund. The line of credit is intended to provide any necessary short-term financing in connection with shareholder redemptions, subject to certain restrictions. The credit facility is with the
Hennessy Funds’ custodian bank, U.S. Bank N.A. Borrowings under this arrangement bear interest at the bank’s prime rate and are secured by all of the Fund’s assets (as to its own borrowings only). During the six months ended April 30,
2022, the Fund did not have any borrowings outstanding under the line of credit.
|
HENNESSY FUNDS
|
1-800-966-4354
|
21
8). FEDERAL TAX INFORMATION
As of October 31, 2021, the Fund’s most recent fiscal year end, the components of accumulated earnings (losses) for income tax purposes were as follows:
|
Investments
|
|||||
|
Cost of investments for tax purposes
|
$
|
70,431,450
|
|||
|
Gross tax unrealized appreciation
|
$
|
6,894,601
|
|||
|
Gross tax unrealized depreciation
|
(1,222,553
|
)
|
|||
|
Net tax unrealized appreciation/(depreciation)
|
$
|
5,672,048
|
|||
|
Undistributed ordinary income
|
$
|
20,834
|
|||
|
Undistributed long-term capital gains
|
—
|
||||
|
Total distributable earnings
|
$
|
20,834
|
|||
|
Other accumulated gain/(loss)
|
$
|
(277,833
|
)
|
||
|
Total accumulated gain/(loss)
|
$
|
5,415,049
|
|||
The difference between book-basis unrealized appreciation/depreciation and tax-basis unrealized appreciation/depreciation (as shown above) is attributable primarily to wash sales.
As of October 31, 2021, the Fund had $277,833 in unlimited long-term capital loss carryforwards.
Capital losses sustained in or after fiscal year 2012 can be carried forward indefinitely, but any such loss retains the character of the original loss and must be utilized prior to any loss
incurred before fiscal year 2012. As a result of this ordering rule, capital loss carryforwards incurred prior to fiscal year 2012 may be more likely to expire unused. Capital losses sustained prior to fiscal year 2012 can be carried
forward for eight years and can be carried forward as short-term capital losses regardless of the character of the original loss.
As of October 31, 2021, the Fund did not defer, on a tax basis, any late-year ordinary losses. Late-year ordinary losses are net ordinary losses incurred after December 31, 2020, but within
the taxable year, that are deemed to arise on the first day of the Fund’s next taxable year.
During fiscal year 2022 (year to date) and fiscal year 2021, the tax character of distributions paid by the Fund was as follows:
|
Six Months Ended
|
Year Ended
|
||||||||
|
April 30, 2022
|
October 31, 2021
|
||||||||
|
Ordinary income(1)
|
$
|
387,098
|
$
|
844,427
|
|||||
|
Long-term capital gains
|
—
|
3,150,288
|
|||||||
|
Total distributions
|
$
|
387,098
|
$
|
3,994,715
|
|||||
|
(1) Ordinary income includes short-term capital gains.
|
9). REVERSE REPURCHASE AGREEMENTS
Under a reverse repurchase agreement, the Fund sells securities and agrees to repurchase them at a mutually agreed date and price. Reverse repurchase agreements are regarded as a form of secured borrowing by
the Fund. Securities sold under reverse repurchase agreements are reflected as a liability in the Statement of Assets and Liabilities. Interest payments made under reverse repurchase agreements during the six months ended April 30,
2022, totaled $38,429 and are recorded as a component of interest expense in the Statement of Operations.
|
WWW.HENNESSYFUNDS.COM
|
22
|
NOTES TO THE FINANCIAL STATEMENTS
|
During the six months ended April 30, 2022, the average daily balance and average interest rate in effect for reverse repurchase agreements were $22,939,735 and 0.33%, respectively. Below is
information about the scheduled maturity date, amount, and interest rate for outstanding reverse repurchase agreements as of April 30, 2022:
|
Maturity Date
|
Amount
|
Interest Rate
|
||
|
May 12, 2022
|
$7,196,000
|
0.45%
|
||
|
June 16, 2022
|
$7,196,000
|
0.70%
|
||
|
July 14, 2022
|
$8,995,000
|
0.95%
|
Outstanding reverse repurchase agreements as of April 30, 2022, comprised 43.67% of the Fund’s net assets.
Below is information about reverse repurchase agreements eligible for offset in the Statement of Assets and Liabilities, on both a gross and net basis:
|
Gross
|
Net
|
Gross Amounts Not
Offset in the Statement
of Assets and Liabilities
|
||||||||||||||||||||
|
Amounts
|
Amounts
|
|||||||||||||||||||||
|
Offset
|
Presented
|
|||||||||||||||||||||
|
Gross
|
in the
|
in the
|
||||||||||||||||||||
|
Amounts of
|
Statement of
|
Statement of
|
Collateral
|
|||||||||||||||||||
|
Recognized
|
Assets and
|
Assets and
|
Financial
|
Pledged
|
Net
|
|||||||||||||||||
|
Liabilities
|
Liabilities
|
Liabilities
|
Instruments
|
(Received)
|
Amount
|
|||||||||||||||||
|
$
|
23,387,000
|
$
|
—
|
$
|
23,387,000
|
$
|
23,387,000
|
$
|
—
|
$
|
—
|
|||||||||||
|
$
|
23,387,000
|
$
|
—
|
$
|
23,387,000
|
$
|
23,387,000
|
$
|
—
|
$
|
—
|
|||||||||||
For additional information, please refer to the “Offsetting Assets and Liabilities” section in Note 2.
10). EVENTS SUBSEQUENT TO PERIOD END
Management has evaluated the Fund’s related events and transactions that occurred subsequent to April 30, 2022, through the date of issuance of the Fund’s financial statements. Management has determined that
there were no subsequent events requiring recognition or disclosure in the financial statements.
|
HENNESSY FUNDS
|
1-800-966-4354
|
23
Expense Example (Unaudited)
April 30, 2022
As a shareholder of the Fund, you incur ongoing costs, including management fees, service fees, and other Fund expenses. This Example is intended to help you understand your ongoing costs (in dollars) of
investing in the Fund and to compare these costs with the ongoing costs of investing in other mutual funds. The Example is based on an investment of $1,000 invested at the beginning of the period and held for the entire period from
November 1, 2021, through April 30, 2022.
Actual Expenses
The first line of the table below provides information about actual account values and actual expenses. You may use this information, together with the amount you invested, to estimate the expenses that you
paid over the period. Simply divide your account value by $1,000 (for example, an $8,600 account value divided by $1,000 = 8.6), then multiply the result by the number in the first line under the heading “Expenses Paid During Period” to
estimate the expenses you paid on your account during this period. Although the Fund charges no sales loads or transaction fees, you will be assessed fees for outgoing wire transfers, returned checks, and stop payment orders at
prevailing rates charged by U.S. Bank Global Fund Services, the Fund’s transfer agent. If you request that a redemption be made by wire transfer, the Fund’s transfer agent charges a $15 fee. IRAs are charged a $15 annual maintenance fee
(up to $30 maximum per shareholder for shareholders with multiple IRAs). The example below includes, but is not limited to, management, shareholder servicing, accounting, custody, and transfer agent fees. However, the example below does
not include portfolio trading commissions and related expenses.
Hypothetical Example for Comparison Purposes
The second line of the table below provides information about hypothetical account values and hypothetical expenses based on the Fund’s actual expense ratio and an assumed rate of return of 5% per year before
expenses, which is not the Fund’s actual return. The hypothetical account values and expenses may not be used to estimate the actual ending account balance or expenses you paid for the period. You may use this information to compare the
ongoing costs of investing in the Fund and other funds. To do so, compare this 5% hypothetical example with the 5% hypothetical examples that appear in the shareholder reports of the other funds. Please note that the expenses shown in
the table are meant to highlight your ongoing costs only. Therefore, the second line is useful in comparing ongoing costs only and will not help you determine the relative total costs of owning different funds.
|
Beginning
|
Ending
|
||
|
Account Value
|
Account Value
|
Expenses Paid
|
|
|
November 1, 2021
|
April 30, 2022
|
During Period(1)
|
|
|
Investor Class
|
|||
|
Actual
|
$1,000.00
|
$1,031.70
|
$6.95
|
|
Hypothetical (5% return before expenses)
|
$1,000.00
|
$1,017.95
|
$6.90
|
|
(1)
|
Expenses are equal to the Fund’s annualized expense ratio of 1.38%, multiplied by the average account value over the period, multiplied by 181/365 days (to reflect the half-year period).
|
|
WWW.HENNESSYFUNDS.COM
|
24
|
EXPENSE EXAMPLE — ELECTRONIC DELIVERY
|
How to Obtain a Copy of the Fund’s Proxy
Voting Policy and Proxy Voting Records
A description of the policies and procedures the Fund uses to determine how to vote proxies relating to portfolio securities is available without charge (1) by calling 800-966-4354, (2) on the Hennessy Funds’
website at www.hennessyfunds.com/proxy-voting/voting-policy, or (3) on the U.S. Securities and Exchange Commission’s (the “SEC”) website at www.sec.gov. The Fund’s proxy voting record is available without charge on both the Hennessy
Funds’ website at www.hennessyfunds.com/proxy-voting/voting-record and the SEC’s website at www.sec.gov no later than August 31 for the prior 12 months ending June 30.
Availability of Quarterly Portfolio Schedule
The Fund files its complete schedule of portfolio holdings with the SEC for the first and third quarters of each fiscal year as an exhibit to its reports on Form N-PORT. The Fund’s Form N-PORT reports are
available on the SEC’s website at www.sec.gov or on request by calling 800-966-4354.
Federal Tax Distribution Information (Unaudited)
For fiscal year 2021, certain dividends paid by the Fund may be subject to a maximum tax rate of 23.8%, as provided for by the Jobs and Growth Tax Relief Reconciliation Act of 2003. The percentage of dividends
declared from ordinary income designated as qualified dividend income was 100.00%.
For corporate shareholders, the percent of ordinary income distributions that qualified for the corporate dividends received deduction for fiscal year 2021 was 100.00%.
The percentage of taxable ordinary income distributions that were designated as short-term capital gain distributions under Section 871(k)(2)(C) of the Internal Revenue Code of 1986, as
amended, for the Fund was 0.00%.
Important Notice Regarding Delivery
of Shareholder Documents
To help keep the Fund’s costs as low as possible, we generally deliver a single copy of shareholder reports, proxy statements, and prospectuses to shareholders who share an address and have the same last name.
This process does not apply to account statements. You may request an individual copy of a shareholder document at any time. If you would like to receive separate mailings of shareholder documents, please call U.S. Bank Global Fund
Services at 800-261-6950 or 414-765-4124, and individual delivery will begin within 30 days of your request. If your account is held through a financial institution or other intermediary, please contact such intermediary directly to
request individual delivery.
Electronic Delivery
As permitted by SEC regulations, the Fund’s shareholder reports are made available on a website, and unless you sign up for eDelivery or elect to receive paper copies as detailed below, you will be notified
each time a report is posted and provided with a website link to access the report.
The Fund also offers shareholders the option to receive all notices, account statements, prospectuses, tax forms, and shareholder reports electronically. To sign up for eDelivery or change
your delivery preference, please visit www.hennessyfunds.com/account.
To elect to receive paper copies of all future reports free of charge, please call U.S. Bank Global Fund Services at 800-261-6950 or 414-765-4124.
Subscribe to receive our team’s unique market and sector insights delivered to your inbox
www.hennessyfunds.com/subscribe
Follow us on social media
| |
|
|
HENNESSY FUNDS
|
1-800-966-4354
|
25
Board Approval of Investment Advisory
Agreement
At its meeting on March 11, 2022, the Board of Trustees of the Fund (the “Board,” and the members thereof, the “Trustees”) unanimously approved the continuation of the investment advisory agreement of the Fund
with Hennessy Advisors, Inc. (the “Advisor”). As part of the process, the Trustees reviewed their fiduciary duties and the relevant factors for them to consider with respect to approving the advisory agreement. In addition, the Trustees
who are not deemed “interested persons” (as defined by the Investment Company Act of 1940, as amended) of the Fund (the “Independent Trustees”) met in executive session to discuss the approval of the advisory agreement. As part of their
discussion, the Independent Trustees confirmed their understanding of the need to have asked about, and received answers to, any matters that they believed are relevant to determining whether to approve the continuation of the advisory
agreement.
In advance of the meeting, the Advisor sent detailed information to the Trustees to assist them in their evaluation of the advisory agreement. This information included, but was not limited
to, the following:
|
(1)
|
A memorandum from outside legal counsel that described the fiduciary duties of the Board with respect to approving the continuation of the advisory agreement and the relevant factors for consideration;
|
|
|
(2)
|
A memorandum from the Advisor that listed the factors relevant to the Board’s approval of the continuation of the advisory agreement and also referenced the documents that had been provided to help the
Board assess each such factor;
|
|
|
(3)
|
The Advisor’s financial statements from its most recent Form 10-K and Form 10-Q;
|
|
|
(4)
|
A summary of the advisory agreement;
|
|
|
(5)
|
A recent Fund fact sheet, which included, among other things, Fund performance over various periods;
|
|
|
(6)
|
A description of the range of services provided by the Advisor;
|
|
|
(7)
|
A peer expense comparison of the net expense ratio and investment advisory fee of the Fund; and
|
|
|
(8)
|
A memorandum from the Advisor regarding economies of scale.
|
The Trustees reviewed and discussed all of the information provided by the Advisor. Following this review, and further discussion with the Advisor, the Trustees concluded that the
information provided before and at the meeting addressed all of the relevant matters that they wanted to consider in assessing the performance of the Funds and the performance of the Advisor under the advisory agreement, and that said
information provided them with a fulsome understanding of the advisory agreement and the services provided by the Advisor.
All of the factors discussed were considered as a whole by the Trustees, as well as by the Independent Trustees meeting in executive session. The Trustees viewed the relevant factors in
their totality, with no single factor being the principal or determinative factor in the Trustees’ determination of whether to approve the continuation of the advisory agreement. The Trustees recognized that the management and fee
arrangements for the Fund are the result of years of review and discussion between the Independent Trustees and the Advisor, that certain aspects of such arrangements may receive greater scrutiny in
|
WWW.HENNESSYFUNDS.COM
|
26
|
BOARD APPROVAL OF INVESTMENT ADVISORY AGREEMENT
|
some years than in others, and that the Trustees’ conclusions may be based, in part, on their consideration of these same arrangements and information received during the course of the year and in prior years.
Prior to approving the continuation of the advisory agreement, the Trustees, including the Independent Trustees in executive session, considered, among other items:
|
(1)
|
The nature and quality of the advisory services provided by the Advisor;
|
|
|
(2)
|
A comparison of the fees and expenses of the Fund to other similar funds;
|
|
|
(3)
|
Whether economies of scale are recognized by the Fund;
|
|
|
(4)
|
The costs and profitability of the Fund to the Advisor;
|
|
|
(5)
|
The performance of the Fund; and
|
|
|
(6)
|
Any benefits to the Advisor from serving as an investment advisor to the Fund (other than the advisory fee).
|
The material considerations and determinations of the Trustees, including the Independent Trustees, were as follows:
|
(1)
|
The Trustees considered the services identified below that are provided by the Advisor. Based on this review and an assessment of the Advisor’s performance, the Trustees concluded that the Advisor
provides high-quality services to the Fund, and they noted that their overall confidence in the Advisor was high. The Trustees also concluded that they were satisfied with the nature, extent, and quality of the advisory services
provided to the Fund by the Advisor and that the nature and extent of the services provided by the Advisor were appropriate to assure that the Fund’s operations are conducted in compliance with applicable laws, rules, and
regulations.
|
|
(a)
|
The Advisor acts as the portfolio manager for the Fund. In this capacity, the Advisor does the following:
|
|
(i)
|
manages the composition of the Fund’s portfolio, including the purchase, retention, and disposition of portfolio securities in accordance with the Fund’s investment objectives, policies, and
restrictions;
|
|||
|
(ii)
|
seeks best execution for the Fund’s portfolio;
|
|||
|
(iii)
|
manages the use of soft dollars for the Fund; and
|
|||
|
(iv)
|
manages proxy voting for the Fund.
|
|
(b)
|
The Advisor performs a daily reconciliation of portfolio positions and cash for the Fund.
|
||
|
(c)
|
The Advisor monitors the liquidity of each Fund.
|
||
|
(d)
|
The Advisor monitors the Fund’s compliance with its investment objectives and restrictions and federal securities laws.
|
||
|
(e)
|
The Advisor maintains a compliance program (including a code of ethics), conducts ongoing reviews of the compliance programs of the Fund’s service providers (including their codes of ethics, as
appropriate), conducts on-site visits to the Fund’s service providers, as feasible, monitors incidents of abusive trading practices, reviews Fund expense accruals, payments, and fixed expense ratios, evaluates insurance
providers for fidelity bond, D&O/E&O insurance, and cybersecurity insurance coverage, manages regulatory examination compliance and responses, conducts employee compliance training, reviews reports provided by service
providers, and maintains books and records.
|
|
HENNESSY FUNDS
|
1-800-966-4354
|
27
|
(f)
|
The Advisor oversees service providers that provide accounting, administration, distribution, transfer agency, custodial, sales, marketing, public relations, audit, information technology, and legal
services to the Fund.
|
||
|
(g)
|
The Advisor maintains in-house marketing and distribution departments on behalf of the Fund.
|
||
|
(h)
|
The Advisor prepares or directs the preparation of all regulatory filings for the Fund, including writing and annually updating the Fund’s prospectus and related documents.
|
||
|
(i)
|
For each annual report of the Fund, the Advisor prepares a written summary of the Fund’s performance during the most recent 12-month period.
|
||
|
(j)
|
The Advisor oversees distribution of the Fund through third-party broker/dealers and independent financial institutions such as Charles Schwab, Inc., Fidelity, TD Ameritrade, and Pershing. The Advisor
participates in “no transaction fee” (“NTF”) programs with these companies on behalf of the Fund, which allow customers to purchase the Fund through third-party distribution channels without paying a transaction fee. The Advisor
compensates, in part, a number of these third-party providers of NTF programs out of its own revenues.
|
||
|
(k)
|
The Advisor pays the incentive compensation of the Fund’s compliance officers and employs other staff, such as legal, marketing, national accounts, distribution, sales, administrative, and trading
oversight personnel, as well as management executives.
|
||
|
(l)
|
The Advisor provides a quarterly compliance certification to the Board.
|
||
|
(m)
|
The Advisor prepares or reviews all Board materials, presents to and leads discussions with the Board, prepares or reviews all meeting minutes, and arranges for Board training and education.
|
|
(2)
|
The Trustees compared the performance of the Fund to benchmark indices over various periods and noted that the Trustees review and discuss reports comparing the investment performance of the Fund to
various indices at each quarterly Board meeting. Based on such information, the Trustees determined that the Advisor manages the Fund in a manner materially consistent with its stated investment objective and style. The Trustees
concluded that the performance of the Fund over various periods warranted the continuation of the advisory agreement.
|
|
|
(3)
|
The Trustees reviewed the advisory fees and overall expense ratios of the Fund compared to other funds similar in asset size and investment objective to the Fund using data from Morningstar. As part of
the discussion with management, the Trustees ensured that they understood and were comfortable with the criteria used to determine the mutual funds included in the Morningstar categories for purposes of the materials considered
at the meeting. The Trustees determined that the advisory fee and overall expense ratio of the Fund falls within a reasonable range of the advisory fees and overall expense ratios of other comparable funds and concluded that
they are reasonable and warranted continuation of the advisory agreement.
|
|
|
(4)
|
The Trustees also considered whether the Advisor was realizing economies of scale that should be shared with the Fund’s shareholders. The Trustees noted that the majority of expenses incurred to manage
the Fund are variable
|
|
WWW.HENNESSYFUNDS.COM
|
28
|
BOARD APPROVAL OF INVESTMENT ADVISORY AGREEMENT
|
|
asset-based fees, so the Advisor does not realize material economies of scale relating to these expenses as the assets of the Fund increase. For example, third-party platform fees increase as the
Fund’s assets grow.
|
||
|
(5)
|
The Trustees considered the profitability of the Advisor, including the impact of mutual fund platform fees on the Advisor’s profitability, and also considered the resources and revenues that the
Advisor has put into managing and distributing the Fund. The Trustees then concluded that the profits of the Advisor are reasonable and not excessive when compared to profitability guidelines set forth in relevant court cases.
|
|
|
(6)
|
The Trustees considered the high level of professionalism and knowledge of the Advisor’s employees and concluded that this was beneficial to the Fund and its shareholders.
|
|
|
(7)
|
The Trustees considered any benefits to the Advisor from serving as an advisor to the Fund (other than the advisory fee). The Trustees noted that the Advisor may derive ancillary benefits from, by way
of example, its association with the Fund in the form of proprietary and third-party research products and services received from broker-dealers that execute portfolio trades for the Fund. The Trustees determined that any such
products and services have been used for legitimate purposes relating to the Fund by providing assistance in the investment decision-making process. The Trustees concluded that any additional benefits realized by the Advisor
from its relationship with the Fund were reasonable, which was based on, among other things, the Trustees’ finding that the research, analytical, statistical, and other information and services provided by brokers are merely
supplemental to the Advisor’s own efforts in the performance of its duties under the advisory agreement.
|
After reviewing the materials and information provided at the meeting, as well as other information regularly provided at the Board’s quarterly meetings throughout the year regarding the
quality of services provided by the Advisor, the performance of the Fund, expense information, brokerage commissions information, the adequacy and efficacy of the Advisor’s written policies and procedures, other regulatory compliance
issues, trading information and related matters, and other factors that the Trustees deemed relevant, the Trustees, including the Independent Trustees, approved the continuation of the advisory agreement.
|
HENNESSY FUNDS
|
1-800-966-4354
|
29
For information, questions, or assistance, please call
The Hennessy Funds
800-966-4354 or 415-899-1555
INVESTMENT ADVISOR
Hennessy Advisors, Inc.
7250 Redwood Boulevard, Suite 200
Novato, California 94945
ADMINISTRATOR,
TRANSFER AGENT,
DIVIDEND PAYING AGENT, &
SHAREHOLDER SERVICING AGENT
U.S. Bancorp Fund Services, LLC
d/b/a U.S. Bank Global Fund Services
P.O. Box 701
Milwaukee, Wisconsin 53201-0701
CUSTODIAN
U.S. Bank N.A.
Custody Operations
1555 North River Center Drive, Suite 302
Milwaukee, Wisconsin 53212
TRUSTEES
Neil J. Hennessy
J. Dennis DeSousa
Robert T. Doyle
Claire Garvie
Gerald P. Richardson
COUNSEL
Foley & Lardner LLP
777 East Wisconsin Avenue
Milwaukee, Wisconsin 53202-5306
INDEPENDENT REGISTERED
PUBLIC ACCOUNTING FIRM
Tait, Weller & Baker LLP
Two Liberty Place
50 South 16th Street, Suite 2900
Philadelphia, Pennsylvania 19102-2529
DISTRIBUTOR
Quasar Distributors, LLC
111 East Kilbourn Avenue, Suite 1250
Milwaukee, Wisconsin 53202
www.hennessyfunds.com | 800-966-4354
This report has been prepared for shareholders and may be distributed to
others only if preceded or accompanied by a current prospectus.
SEMI-ANNUAL REPORT
APRIL 30, 2022

HENNESSY EQUITY AND INCOME FUND
Investor Class HEIFX
Institutional Class HEIIX
www.hennessyfunds.com | 1-800-966-4354
(This Page Intentionally Left Blank.)
Contents
|
Letter to Shareholders
|
2
|
|
Performance Overview
|
4
|
|
Financial Statements
|
|
|
Schedule of Investments
|
5
|
|
Statement of Assets and Liabilities
|
15
|
|
Statement of Operations
|
16
|
|
Statements of Changes in Net Assets
|
17
|
|
Financial Highlights
|
18
|
|
Notes to the Financial Statements
|
22
|
|
Expense Example
|
30
|
|
Proxy Voting Policy and Proxy Voting Records
|
32
|
|
Availability of Quarterly Portfolio Schedule
|
32
|
|
Federal Tax Distribution Information
|
32
|
|
Important Notice Regarding Delivery of Shareholder Documents
|
32
|
|
Electronic Delivery
|
32
|
|
Board Approval of Investment Advisory Agreements
|
33
|
|
HENNESSY FUNDS
|
1-800-966-4354
|
May 2022
Dear Hennessy Funds Shareholder:
We’d like to start our semi-annual letter with a pause. At the end of 2021, we looked forward to a new year – a potentially calmer year – having come through almost
two full years of the coronavirus pandemic. As people, we were aware our lives had changed, but we hoped for a better 2022; as investors, we were aware that the economy was strong and employment was robust, yet challenges loomed,
including inflation, supply chain disruptions, and tightening monetary policy; as employees, students, and family members, we recognized much was different, but we sought a return to what’s familiar. What we didn’t know was that a
world leader who controls one of the largest militaries on the planet was about to start one of the worst atrocities in Europe since World War II. Our thoughts are with the Ukrainian people, and our hope is for this unjustified,
senseless human tragedy to end quickly.
The equity market started 2022 on a high note, with the S&P 500® Index hitting an all-time high on the first trading day of the year. This turned out to be the last hurrah for a market that saw a continuous march higher in 2021,
having hit 70 new all-time highs, with a new all-time high being recorded on average every three and a half days. Concerns in the market then coalesced and overpowered bullish sentiment, and the market has spiraled lower throughout
2022. Factors that drove the market lower include: tightening monetary policy as the Federal Reserve has begun raising rates and has announced plans for shrinking its $8.5 trillion asset portfolio; inflation, higher energy costs, and
their effects on the domestic and global economies; continued supply chain disruptions; investors’ indiscriminate liquidation of broad-based ETFs and index funds and the detrimental effect on equities; and the near-term and long-term
global implications of the Russian invasion of Ukraine.
While markets are adjusting, many positive conditions remain intact. Corporate balance sheets and profits remain strong, GDP growth remains
positive, the consumer continues to show resilience in the face of rising prices, cash is abundant both at the corporate and household levels, unemployment is exceptionally low, and our financial system remains healthy. Markets are
also experiencing a change in leadership, as value stocks have been outperforming growth stocks, and traditionally defensive sectors such as Utilities and Consumer Staples have been outperforming the broader market. Finally, the
Energy sector has soared in 2022, as companies reap the benefits of dramatically higher oil and natural gas prices, and shareholders are rewarded with significantly higher dividends, aggressive buybacks, and higher stock prices after
many years of underperformance for the sector.
With history as our guide, we are hopeful that eventually the market may bottom and head higher again. Since the financial crisis of 2008, we have
experienced many corrections and many recoveries to new highs. The Dow Jones Industrial Average has dropped over 10% eight times, including the current drop, for a median decline of 14.00%, and on average, it took 45 trading days to
drop from peak to trough and 127 trading days to return to the previous peak. Since the current drop has taken longer to go from peak to its recent trough, it may take some time for a recovery in prices to truly take hold.
On a positive note, valuations have come in, and many stocks have become more attractive, especially for longer-term investors. We note, however,
that the concept of “historically cheap stocks” does not, on its own, move the market higher. Rather, it is
|
WWW.HENNESSYFUNDS.COM
|
2
|
LETTER TO SHAREHOLDERS
|
overall capitulation and improving fundamentals that could bring buyers back into the market and reverse any bearish trends. Investors need to see improving company earnings, retreating inflationary trends,
a measured pace of interest rate increases globally that does not cause significant economic contraction, hope for a more peaceful and orderly world economic system unconstrained by supply bottlenecks and other hindrances to global
trade, and, most importantly, a subsidence of the deleterious effects of the coronavirus pandemic. While that may seem like a “tall order,” we believe that patient investing, focusing on value, quality, and downside risk mitigation,
works well over the longer term.
During this tumultuous period, performance of the majority of the Hennessy Funds has been relatively strong when compared to the overall market as well as
to our benchmarks. During the six months ended April 30, 2022, the Dow Jones Industrial Average, the S&P 500® Index, and the NASDAQ
Composite Index dropped 7.05%, 9.65%, and 20.15%, respectively, on a total return basis. During this period when these three major indices saw significant declines, we were pleased that seven of our 16 Funds posted positive total
returns, 10 of our 14 domestic Funds outperformed the S&P 500® Index, and over half of our active funds outperformed their primary benchmarks.
We thank you, our shareholders, for your continued interest in our family of Funds. We are grateful for the trust you put in us, and we will
continue to strive to manage our portfolios for long-term performance, ever mindful of downside risk. While volatility and uncertainty may impact the markets in the short-term, we encourage investors to stay the course, maintain a
diversified portfolio, and keep a long-term perspective. If you have any questions or would like to speak with us, please don’t hesitate to call us directly at (800) 966-4354. In closing, we would also like to thank all of the
healthcare and frontline workers that have worked – and still work – tirelessly throughout the coronavirus pandemic.
Best regards,
|
|
|
|
|
Ryan C. Kelley, CFA
|
|
|
Chief Investment Officer,
|
|
|
Senior Vice President, and Portfolio Manager
|
Past performance does not guarantee future results.
Mutual fund investing involves risk. Principal loss is possible.
Opinions expressed are those of Ryan C. Kelley and are subject to change, are not guaranteed, and should not be considered investment advice.
The Dow Jones Industrial Average and S&P 500® Index are commonly used to measure the performance of U.S. stocks. The
NASDAQ Composite Index comprises all common stocks listed on The NASDAQ Stock Market and is commonly used to measure the performance of technology-related stocks. The indices are used herein for comparative purposes in accordance with
SEC regulations. One cannot invest directly in an index. All returns are shown on a total return basis.
Please refer to the Performance Overview section for more detailed performance information.
|
HENNESSY FUNDS
|
1-800-966-4354
|
3
Performance Overview (Unaudited)
AVERAGE ANNUAL TOTAL RETURN FOR PERIODS ENDED APRIL 30, 2022
|
Six
|
One
|
Five
|
Ten
|
|
|
Months(1)
|
Year
|
Years
|
Years
|
|
|
Hennessy Equity and Income Fund –
|
||||
|
Investor Class (HEIFX)
|
-8.20%
|
-5.37%
|
6.31%
|
6.68%
|
|
Hennessy Equity and Income Fund –
|
||||
|
Institutional Class (HEIIX)
|
-8.00%
|
-4.98%
|
6.72%
|
7.06%
|
|
S&P 500® Index
|
-9.65%
|
0.21%
|
13.66%
|
13.67%
|
Expense ratios: 1.56% (Investor Class); 1.19% (Institutional Class)
|
(1)
|
Periods of less than one year are not annualized.
|
_______________
Performance data quoted represents past performance; past performance does not guarantee future results. The investment return and principal value of an investment will fluctuate so that
an investor’s shares, when redeemed, may be worth more or less than their original cost. The performance table does not reflect the deduction of taxes that a shareholder would pay on Fund distributions or the redemption of Fund
shares. Current performance of the Fund may be lower or higher than the performance quoted. Performance data current to the most recent month end may be obtained by visiting www.hennessyfunds.com. Performance for periods including or
prior to October 26, 2012, is that of the FBR Balanced Fund.
The S&P 500® Index is a capitalization-weighted index that is designed to represent the broad domestic economy through
changes in the aggregate market value of 500 stocks across all major industries. One cannot invest directly in an index. This index is used for comparative purposes in accordance with Securities and Exchange Commission regulations.
Standard & Poor’s Financial Services is the source and owner of the S&P® and S&P 500® trademarks.
The expense ratios presented are from the most recent prospectus. The expense ratios for the current reporting period are available in the Financial Highlights section of this report.
|
WWW.HENNESSYFUNDS.COM
|
4
|
PERFORMANCE OVERVIEW/SCHEDULE OF INVESTMENTS
|
Financial Statements
|
Schedule of Investments as of April 30, 2022 (Unaudited)
|
HENNESSY EQUITY AND INCOME FUND
(% of Net Assets)
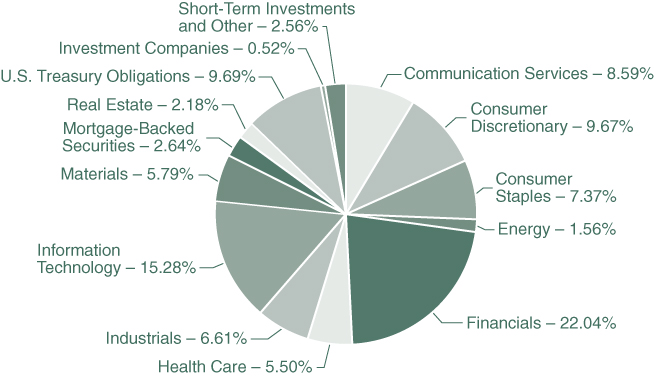
|
TOP TEN HOLDINGS (EXCLUDING MONEY MARKET FUNDS)
|
% NET ASSETS
|
|
Berkshire Hathaway, Inc., Class B
|
4.86%
|
|
Apple, Inc.
|
4.53%
|
|
Alphabet, Inc., Class C
|
3.82%
|
|
BlackRock, Inc.
|
2.84%
|
|
Altria Group, Inc.
|
2.74%
|
|
The Charles Schwab Corp.
|
2.67%
|
|
O’Reilly Automotive, Inc.
|
2.65%
|
|
Visa, Inc., Class A
|
2.59%
|
|
Martin Marietta Materials, Inc.
|
2.52%
|
|
Texas Instruments, Inc.
|
2.52%
|
Note: For presentation purposes, the Fund has grouped some of the industry categories. For purposes of categorizing securities for compliance with Section 8(b)(1) of the Investment Company Act of 1940, as
amended, the Fund uses more specific industry classifications.
The Global Industry Classification Standard (GICS®) was developed by and is the exclusive property and a service mark of MSCI,
Inc. and Standard & Poor’s Financial Services LLC. It has been licensed for use by the Hennessy Funds.
|
HENNESSY FUNDS
|
1-800-966-4354
|
5
|
COMMON STOCKS – 64.03%
|
Number
|
% of
|
||||||||||
|
|
of Shares
|
Value
|
Net Assets
|
|||||||||
|
Communication Services – 7.40%
|
||||||||||||
|
Alphabet, Inc., Class C (a)
|
1,676
|
$
|
3,853,677
|
3.82
|
%
|
|||||||
|
Meta Platforms, Inc. (a)
|
10,758
|
2,156,656
|
2.14
|
%
|
||||||||
|
Verizon Communications, Inc.
|
31,248
|
1,446,782
|
1.44
|
%
|
||||||||
|
|
7,457,115
|
7.40
|
%
|
|||||||||
|
Consumer Discretionary – 7.98%
|
||||||||||||
|
CarMax, Inc. (a)
|
17,360
|
1,489,141
|
1.48
|
%
|
||||||||
|
Lowe’s Companies, Inc.
|
7,081
|
1,400,126
|
1.39
|
%
|
||||||||
|
O’Reilly Automotive, Inc. (a)
|
4,406
|
2,672,459
|
2.65
|
%
|
||||||||
|
The Home Depot, Inc.
|
8,264
|
2,482,506
|
2.46
|
%
|
||||||||
|
|
8,044,232
|
7.98
|
%
|
|||||||||
|
Consumer Staples – 7.34%
|
||||||||||||
|
Altria Group, Inc.
|
49,702
|
2,761,940
|
2.74
|
%
|
||||||||
|
Church & Dwight Co., Inc.
|
23,052
|
2,248,953
|
2.23
|
%
|
||||||||
|
Nestlé S.A. – ADR (b)
|
18,526
|
2,383,185
|
2.37
|
%
|
||||||||
|
|
7,394,078
|
7.34
|
%
|
|||||||||
|
Energy – 0.16%
|
||||||||||||
|
Enbridge, Inc. (b)
|
925
|
40,367
|
0.04
|
%
|
||||||||
|
Kinder Morgan, Inc.
|
2,200
|
39,930
|
0.04
|
%
|
||||||||
|
Targa Resources Corp.
|
550
|
40,376
|
0.04
|
%
|
||||||||
|
The Williams Companies, Inc.
|
1,225
|
42,005
|
0.04
|
%
|
||||||||
|
|
162,678
|
0.16
|
%
|
|||||||||
|
Financials – 12.37%
|
||||||||||||
|
Berkshire Hathaway, Inc., Class B (a)
|
15,157
|
4,893,134
|
4.86
|
%
|
||||||||
|
BlackRock, Inc.
|
4,580
|
2,861,034
|
2.84
|
%
|
||||||||
|
The Charles Schwab Corp.
|
40,641
|
2,695,718
|
2.67
|
%
|
||||||||
|
The Progressive Corp.
|
18,769
|
2,015,040
|
2.00
|
%
|
||||||||
|
|
12,464,926
|
12.37
|
%
|
|||||||||
|
Health Care – 3.76%
|
||||||||||||
|
Johnson & Johnson
|
11,442
|
2,064,823
|
2.05
|
%
|
||||||||
|
Pfizer, Inc.
|
35,151
|
1,724,860
|
1.71
|
%
|
||||||||
|
|
3,789,683
|
3.76
|
%
|
|||||||||
|
Industrials – 6.06%
|
||||||||||||
|
FedEx Corp.
|
9,814
|
1,950,434
|
1.94
|
%
|
||||||||
|
Norfolk Southern Corp.
|
9,810
|
2,529,803
|
2.51
|
%
|
||||||||
|
Old Dominion Freight Line, Inc.
|
5,798
|
1,624,136
|
1.61
|
%
|
||||||||
|
|
6,104,373
|
6.06
|
%
|
|||||||||
The accompanying notes are an integral part of these financial statements.
|
WWW.HENNESSYFUNDS.COM
|
6
|
SCHEDULE OF INVESTMENTS
|
|
COMMON STOCKS
|
Number
|
% of
|
||||||||||
|
|
of Shares
|
Value
|
Net Assets
|
|||||||||
|
Information Technology – 13.17%
|
||||||||||||
|
Apple, Inc.
|
28,983
|
$
|
4,569,170
|
4.53
|
%
|
|||||||
|
Cisco Systems, Inc.
|
32,441
|
1,588,960
|
1.58
|
%
|
||||||||
|
Fiserv, Inc. (a)
|
20,076
|
1,965,842
|
1.95
|
%
|
||||||||
|
Texas Instruments, Inc.
|
14,890
|
2,535,023
|
2.52
|
%
|
||||||||
|
Visa, Inc., Class A
|
12,263
|
2,613,613
|
2.59
|
%
|
||||||||
|
|
13,272,608
|
13.17
|
%
|
|||||||||
|
Materials – 5.79%
|
||||||||||||
|
Air Products and Chemicals, Inc.
|
7,153
|
1,674,303
|
1.66
|
%
|
||||||||
|
Martin Marietta Materials, Inc.
|
7,187
|
2,545,779
|
2.52
|
%
|
||||||||
|
NewMarket Corp.
|
4,987
|
1,618,830
|
1.61
|
%
|
||||||||
|
|
5,838,912
|
5.79
|
%
|
|||||||||
|
|
||||||||||||
|
Total Common Stocks
|
||||||||||||
|
(Cost $40,251,680)
|
64,528,605
|
64.03
|
%
|
|||||||||
|
|
||||||||||||
|
PREFERRED STOCKS – 1.64%
|
||||||||||||
|
Communication Services – 0.05%
|
||||||||||||
|
AT&T, Inc.
|
||||||||||||
|
Series A, 5.000%, Perpetual
|
860
|
17,647
|
0.02
|
%
|
||||||||
|
Series C, 4.750%, Perpetual
|
1,935
|
37,558
|
0.03
|
%
|
||||||||
|
|
55,205
|
0.05
|
%
|
|||||||||
|
Consumer Discretionary – 0.03%
|
||||||||||||
|
Ford Motor Co.
|
||||||||||||
|
6.000%, 12/01/2059
|
515
|
12,947
|
0.01
|
%
|
||||||||
|
6.200%, 06/01/2059
|
513
|
13,261
|
0.02
|
%
|
||||||||
|
|
26,208
|
0.03
|
%
|
|||||||||
|
Consumer Staples – 0.03%
|
||||||||||||
|
CHS, Inc., Series 3, 6.750% to 09/30/2024 then
|
||||||||||||
|
3 Month LIBOR USD + 4.155%, Perpetual (c)
|
355
|
9,400
|
0.01
|
%
|
||||||||
|
CHS, Inc., Series 4, 7.500%, Perpetual
|
840
|
23,201
|
0.02
|
%
|
||||||||
|
|
32,601
|
0.03
|
%
|
|||||||||
|
Financials – 1.53%
|
||||||||||||
|
AEGON Funding Co. LLC, 5.100%, 12/15/2049
|
1,175
|
24,851
|
0.02
|
%
|
||||||||
|
American International Group, Inc., Series A, 5.850%, Perpetual
|
1,435
|
35,516
|
0.04
|
%
|
||||||||
|
Arch Capital Group Ltd.
|
||||||||||||
|
Series G, 4.550%, Perpetual (b)
|
1,010
|
19,483
|
0.02
|
%
|
||||||||
|
Series F, 5.450%, Perpetual (b)
|
401
|
9,083
|
0.01
|
%
|
||||||||
|
Axis Capital Holdings Ltd., Series E, 5.500%, Perpetual (b)
|
905
|
20,227
|
0.02
|
%
|
||||||||
The accompanying notes are an integral part of these financial statements.
|
HENNESSY FUNDS
|
1-800-966-4354
|
7
|
PREFERRED STOCKS
|
Number
|
% of
|
||||||||||
|
|
of Shares
|
Value
|
Net Assets
|
|||||||||
|
Financials (Continued)
|
||||||||||||
|
Bank of America Corp.
|
||||||||||||
|
Series QQ, 4.250%, Perpetual
|
1,575
|
$
|
28,082
|
0.03
|
%
|
|||||||
|
Series LL, 5.000%, Perpetual
|
1,420
|
30,019
|
0.03
|
%
|
||||||||
|
Series KK, 5.375%, Perpetual
|
815
|
18,321
|
0.02
|
%
|
||||||||
|
Bank of Hawaii Corp., Series A, 4.375%, Perpetual
|
1,060
|
21,073
|
0.02
|
%
|
||||||||
|
Bank OZK, Series A, 4.625%, Perpetual
|
1,395
|
25,110
|
0.02
|
%
|
||||||||
|
Cadence Bank, Series A, 5.500%, Perpetual
|
565
|
13,696
|
0.01
|
%
|
||||||||
|
Capital One Financial Corp.
|
||||||||||||
|
Series J, 4.800%, Perpetual
|
2,060
|
40,850
|
0.04
|
%
|
||||||||
|
Series I, 5.000%, Perpetual
|
1,900
|
39,482
|
0.04
|
%
|
||||||||
|
Carlyle Finance LLC, 4.625%, 05/15/2061
|
995
|
18,666
|
0.02
|
%
|
||||||||
|
Citigroup, Inc., Series K, 6.875% to 11/15/2023 then
|
||||||||||||
|
3 Month LIBOR USD + 4.130%, Perpetual (c)
|
780
|
20,686
|
0.02
|
%
|
||||||||
|
Citizens Financial Group, Inc., Series D, 6.350% to 04/06/2024 then
|
||||||||||||
|
3 Month LIBOR USD + 3.642%, Perpetual (c)
|
980
|
25,353
|
0.03
|
%
|
||||||||
|
ConnectOne Bancorp, Inc., Series A, 5.250% to 09/01/2026 then
|
||||||||||||
|
5 Year CMT Rate + 4.420%, Perpetual (c)
|
625
|
14,756
|
0.01
|
%
|
||||||||
|
Cullen/Frost Bankers, Inc., Series B, 4.450%, Perpetual
|
860
|
17,243
|
0.02
|
%
|
||||||||
|
Equitable Holdings, Inc., Series A, 5.250%, Perpetual
|
1,270
|
27,635
|
0.03
|
%
|
||||||||
|
Federal Agricultural Mortgage Corp, Series F, 5.250%, Perpetual
|
585
|
12,232
|
0.01
|
%
|
||||||||
|
Fifth Third Bancorp, Series K, 4.950%, Perpetual
|
1,580
|
33,417
|
0.03
|
%
|
||||||||
|
First Citizens BancShares, Inc., Series A, 5.375%, Perpetual
|
1,495
|
35,073
|
0.03
|
%
|
||||||||
|
First Horizon Corp.
|
||||||||||||
|
Series D, 6.100% to 05/01/2024 then
|
||||||||||||
|
3 Month LIBOR USD + 3.859%, Perpetual (c)
|
530
|
13,223
|
0.01
|
%
|
||||||||
|
Series B, 6.625% to 08/01/2025 then
|
||||||||||||
|
3 Month LIBOR USD + 4.262%, Perpetual (c)
|
700
|
18,102
|
0.02
|
%
|
||||||||
|
First Republic Bank, Series N, 4.500%, Perpetual
|
1,625
|
30,534
|
0.03
|
%
|
||||||||
|
Hartford Financial Services Group, Inc., Series G, 6.000%, Perpetual
|
1,505
|
38,949
|
0.04
|
%
|
||||||||
|
Huntington Bancshares, Inc., Series H, 4.500%, Perpetual
|
2,275
|
42,633
|
0.04
|
%
|
||||||||
|
JPMorgan Chase & Co.
|
||||||||||||
|
Series JJ, 4.550%, Perpetual
|
1,900
|
36,081
|
0.03
|
%
|
||||||||
|
Series LL, 4.625%, Perpetual
|
1,875
|
36,338
|
0.04
|
%
|
||||||||
|
KeyCorp
|
||||||||||||
|
Series G, 5.625%, Perpetual
|
535
|
12,733
|
0.01
|
%
|
||||||||
|
Series F, 5.650%, Perpetual
|
755
|
17,833
|
0.02
|
%
|
||||||||
|
Series E, 6.125% to 12/15/2026 then
|
||||||||||||
|
3 Month LIBOR USD + 3.892%, Perpetual (c)
|
412
|
11,005
|
0.01
|
%
|
||||||||
|
MetLife, Inc., Series F, 4.750%, Perpetual
|
1,725
|
38,864
|
0.04
|
%
|
||||||||
|
Morgan Stanley
|
||||||||||||
|
4.250%, Perpetual
|
2,365
|
42,239
|
0.04
|
%
|
||||||||
The accompanying notes are an integral part of these financial statements.
|
WWW.HENNESSYFUNDS.COM
|
8
|
SCHEDULE OF INVESTMENTS
|
|
PREFERRED STOCKS
|
Number
|
% of
|
||||||||||
|
|
of Shares
|
Value
|
Net Assets
|
|||||||||
|
Financials (Continued)
|
||||||||||||
|
Morgan Stanley (Continued)
|
||||||||||||
|
Series K, 5.850% to 04/15/2027 then
|
||||||||||||
|
3 Month LIBOR USD + 3.491%, Perpetual (c)
|
735
|
$
|
18,544
|
0.02
|
%
|
|||||||
|
Series I, 6.375% to 10/15/2024 then
|
||||||||||||
|
3 Month LIBOR USD + 3.708%, Perpetual (c)
|
790
|
20,564
|
0.02
|
%
|
||||||||
|
Regions Financial Corp.
|
||||||||||||
|
Series E, 4.450%, Perpetual
|
1,960
|
36,652
|
0.04
|
%
|
||||||||
|
Series C, 5.700% to 05/15/2029 then
|
||||||||||||
|
3 Month LIBOR USD + 3.148%, Perpetual (c)
|
1,035
|
25,099
|
0.02
|
%
|
||||||||
|
Signature Bank, Series A, 5.000%, Perpetual
|
1,460
|
27,930
|
0.03
|
%
|
||||||||
|
State Street Corp., Series D, 5.900% to 03/15/2024 then
|
||||||||||||
|
3 Month LIBOR USD + 3.108%, Perpetual (c)
|
1,975
|
49,770
|
0.05
|
%
|
||||||||
|
SVB Financial Group, Series A, 5.250%, Perpetual
|
1,185
|
25,679
|
0.03
|
%
|
||||||||
|
Synchrony Financial, Series A, 5.625%, Perpetual
|
1,815
|
37,534
|
0.04
|
%
|
||||||||
|
Synovus Financial Corp.
|
||||||||||||
|
Series E, 5.875% to 07/01/2024 then
|
||||||||||||
|
5 Year CMT Rate + 4.127%, Perpetual (c)
|
710
|
18,155
|
0.02
|
%
|
||||||||
|
Series D, 6.300% to 06/21/2023 then
|
||||||||||||
|
3 Month LIBOR USD + 3.352%, Perpetual (c)
|
740
|
18,352
|
0.02
|
%
|
||||||||
|
Texas Capital Bancshares, Inc., Series B, 5.750%, Perpetual
|
595
|
13,191
|
0.01
|
%
|
||||||||
|
The Allstate Corp., Series H, 5.100%, Perpetual
|
1,120
|
25,010
|
0.02
|
%
|
||||||||
|
The Charles Schwab Corp., Series J, 4.450%, Perpetual
|
1,495
|
30,109
|
0.03
|
%
|
||||||||
|
The Goldman Sachs Group, Inc.
|
||||||||||||
|
Series K, 6.375% to 05/10/2024 then
|
||||||||||||
|
3 Month LIBOR USD + 3.550%, Perpetual (c)
|
895
|
22,912
|
0.02
|
%
|
||||||||
|
Series J, 5.500% to 05/10/2023 then
|
||||||||||||
|
3 Month LIBOR USD + 3.640%, Perpetual (c)
|
955
|
24,295
|
0.02
|
%
|
||||||||
|
Truist Financial Corp.
|
||||||||||||
|
Series R, 4.750%, Perpetual
|
2,190
|
44,479
|
0.04
|
%
|
||||||||
|
Series O, 5.250%, Perpetual
|
1,625
|
37,456
|
0.04
|
%
|
||||||||
|
US Bancorp
|
||||||||||||
|
Series O, 4.500%, Perpetual
|
1,295
|
25,680
|
0.03
|
%
|
||||||||
|
Series B, 3.500% to 05/31/2022 then
|
||||||||||||
|
3 Month LIBOR USD + 0.600%, Perpetual (c)
|
1,970
|
40,483
|
0.04
|
%
|
||||||||
|
Voya Financial, Inc., Series B, 5.350% to 09/15/2029 then
|
||||||||||||
|
5 Year CMT Rate + 3.210%, Perpetual (c)
|
1,105
|
27,238
|
0.03
|
%
|
||||||||
|
Washington Federal, Inc., Series A, 4.875%, Perpetual
|
1,395
|
26,714
|
0.03
|
%
|
||||||||
|
Wells Fargo & Co.
|
||||||||||||
|
Series Z, 4.750%, Perpetual
|
1,930
|
37,539
|
0.04
|
%
|
||||||||
|
Series R, 6.625% to 03/15/2024 then
|
||||||||||||
|
3 Month LIBOR USD + 3.690%, Perpetual (c)
|
1,505
|
39,506
|
0.04
|
%
|
||||||||
|
|
1,542,279
|
1.53
|
%
|
|||||||||
|
|
||||||||||||
|
Total Preferred Stocks
|
||||||||||||
|
(Cost $1,875,673)
|
1,656,293
|
1.64
|
%
|
|||||||||
The accompanying notes are an integral part of these financial statements.
|
HENNESSY FUNDS
|
1-800-966-4354
|
9
|
REITS – 2.36%
|
Number of Shares/
|
% of
|
||||||||||
|
|
Par Amount
|
Value
|
Net Assets
|
|||||||||
|
Financials – 0.18%
|
||||||||||||
|
Annaly Capital Management, Inc., Series I, 6.750% to 06/30/2024
|
||||||||||||
|
then 3 Month LIBOR USD + 4.989%, Perpetual (c)
|
1,115
|
$
|
27,585
|
0.03
|
%
|
|||||||
|
Apollo Commercial Real Estate Finance, Inc.
|
3,130
|
37,685
|
0.04
|
%
|
||||||||
|
Chimera Investment Corp.
|
2,930
|
29,359
|
0.03
|
%
|
||||||||
|
Chimera Investment Corp.
|
||||||||||||
|
Series C, 7.750% to 09/30/2025 then
|
||||||||||||
|
3 Month LIBOR USD + 4.743%, Perpetual (c)
|
1,265
|
29,791
|
0.03
|
%
|
||||||||
|
Series B, 8.000% to 03/30/2024 then
|
||||||||||||
|
3 Month LIBOR USD + 5.791%, Perpetual (c)
|
575
|
14,053
|
0.01
|
%
|
||||||||
|
Starwood Property Trust, Inc.
|
1,805
|
41,298
|
0.04
|
%
|
||||||||
|
|
179,771
|
0.18
|
%
|
|||||||||
|
Real Estate – 2.18%
|
||||||||||||
|
Kimco Realty Corp., Series M, 5.250%, Perpetual
|
955
|
23,149
|
0.02
|
%
|
||||||||
|
Public Storage, Series P, 4.000%, Perpetual
|
1,185
|
22,408
|
0.02
|
%
|
||||||||
|
STORE Capital Corp.
|
75,771
|
2,154,170
|
2.14
|
%
|
||||||||
|
|
2,199,727
|
2.18
|
%
|
|||||||||
|
|
||||||||||||
|
Total REITS
|
||||||||||||
|
(Cost $2,101,972)
|
2,379,498
|
2.36
|
%
|
|||||||||
|
|
||||||||||||
|
CORPORATE BONDS – 16.56%
|
||||||||||||
|
Communication Services – 1.14%
|
||||||||||||
|
AT&T, Inc., 4.250%, 03/01/2027
|
980,000
|
1,001,548
|
1.00
|
%
|
||||||||
|
T-Mobile USA, Inc., 3.875%, 04/15/2030
|
150,000
|
142,488
|
0.14
|
%
|
||||||||
|
|
1,144,036
|
1.14
|
%
|
|||||||||
|
Consumer Discretionary – 1.66%
|
||||||||||||
|
Alibaba Group Holding Ltd., 3.600%, 11/28/2024 (b)
|
1,000,000
|
998,283
|
0.99
|
%
|
||||||||
|
Lowe’s Companies, Inc., 2.625%, 04/01/2031
|
325,000
|
285,524
|
0.28
|
%
|
||||||||
|
Starbucks Corp., 3.500%, 03/01/2028
|
400,000
|
390,312
|
0.39
|
%
|
||||||||
|
|
1,674,119
|
1.66
|
%
|
|||||||||
|
Energy – 1.40%
|
||||||||||||
|
Canadian Natural Resources Ltd., 3.900%, 02/01/2025 (b)
|
1,000,000
|
1,002,773
|
0.99
|
%
|
||||||||
|
The Williams Companies, Inc., 2.600%, 03/15/2031
|
475,000
|
411,900
|
0.41
|
%
|
||||||||
|
|
1,414,673
|
1.40
|
%
|
|||||||||
|
Financials – 7.96%
|
||||||||||||
|
Aflac, Inc., 3.600%, 04/01/2030
|
300,000
|
292,883
|
0.29
|
%
|
||||||||
|
Bank of America Corp., 2.299% to 07/21/2031 then
|
||||||||||||
|
SOFR + 1.220%, 07/21/2032 (c)
|
575,000
|
476,168
|
0.47
|
%
|
||||||||
|
Dell International LLC / EMC Corp., 5.450%, 06/15/2023
|
322,000
|
329,170
|
0.33
|
%
|
||||||||
The accompanying notes are an integral part of these financial statements.
|
WWW.HENNESSYFUNDS.COM
|
10
|
SCHEDULE OF INVESTMENTS
|
|
CORPORATE BONDS
|
% of
|
|||||||||||
|
|
Par Amount
|
Value
|
Net Assets
|
|||||||||
|
Financials (Continued)
|
||||||||||||
|
Fifth Third Bancorp, 3.650%, 01/25/2024
|
225,000
|
$
|
225,838
|
0.23
|
%
|
|||||||
|
General Motors Financial Co., Inc., 3.700%, 05/09/2023
|
1,075,000
|
1,081,474
|
1.07
|
%
|
||||||||
|
Huntington Bancshares, Inc.
|
||||||||||||
|
2.550%, 02/04/2030
|
525,000
|
470,459
|
0.47
|
%
|
||||||||
|
4.000%, 05/15/2025
|
365,000
|
368,362
|
0.36
|
%
|
||||||||
|
Intercontinental Exchange, Inc., 0.700%, 06/15/2023
|
165,000
|
161,355
|
0.16
|
%
|
||||||||
|
JPMorgan Chase & Co., 2.069% to 06/01/2028 then
|
||||||||||||
|
SOFR + 1.015%, 06/01/2029 (c)
|
325,000
|
285,272
|
0.28
|
%
|
||||||||
|
Marsh & McLennan Cos., Inc., 4.375%, 03/15/2029
|
275,000
|
278,362
|
0.28
|
%
|
||||||||
|
Morgan Stanley
|
||||||||||||
|
1.593% to 05/04/2026 then SOFR + 0.879%, 05/04/2027 (c)
|
295,000
|
265,771
|
0.27
|
%
|
||||||||
|
2.239% to 07/21/2031 then SOFR + 1.178%, 07/21/2032 (c)
|
330,000
|
273,030
|
0.27
|
%
|
||||||||
|
Prudential Financial Inc., 3.878%, 03/27/2028
|
260,000
|
261,038
|
0.26
|
%
|
||||||||
|
Regions Financial Corp., 1.800%, 08/12/2028
|
325,000
|
283,087
|
0.28
|
%
|
||||||||
|
Synchrony Financial, 3.950%, 12/01/2027
|
650,000
|
623,403
|
0.62
|
%
|
||||||||
|
Synovus Financial Corp., 3.125%, 11/01/2022
|
1,300,000
|
1,302,248
|
1.29
|
%
|
||||||||
|
The Goldman Sachs Group, Inc., 4.223% to 05/01/2028 then
|
||||||||||||
|
3 Month LIBOR USD + 1.301%, 05/01/2029 (c)
|
300,000
|
293,922
|
0.29
|
%
|
||||||||
|
Willis North America, Inc., 3.600%, 05/15/2024
|
750,000
|
747,961
|
0.74
|
%
|
||||||||
|
|
8,019,803
|
7.96
|
%
|
|||||||||
|
Health Care – 1.74%
|
||||||||||||
|
Edwards Lifesciences Corp., 4.300%, 06/15/2028
|
700,000
|
707,594
|
0.70
|
%
|
||||||||
|
Evernorth Health, Inc., 3.500%, 06/15/2024
|
700,000
|
701,742
|
0.70
|
%
|
||||||||
|
Regeneron Pharmaceuticals, Inc., 1.750%, 09/15/2030
|
425,000
|
346,523
|
0.34
|
%
|
||||||||
|
|
1,755,859
|
1.74
|
%
|
|||||||||
|
Industrials – 0.55%
|
||||||||||||
|
General Electric Co., 3.625%, 05/01/2030
|
380,000
|
352,176
|
0.35
|
%
|
||||||||
|
The Boeing Co., 2.196%, 02/04/2026
|
225,000
|
205,495
|
0.20
|
%
|
||||||||
|
|
557,671
|
0.55
|
%
|
|||||||||
|
Information Technology – 2.11%
|
||||||||||||
|
Autodesk, Inc., 2.850%, 01/15/2030
|
675,000
|
613,705
|
0.61
|
%
|
||||||||
|
Broadcom, Inc., 4.110%, 09/15/2028
|
425,000
|
412,559
|
0.41
|
%
|
||||||||
|
International Business Machines Corp.
|
||||||||||||
|
2.200%, 02/09/2027
|
125,000
|
117,239
|
0.11
|
%
|
||||||||
|
2.720%, 02/09/2032
|
325,000
|
288,689
|
0.29
|
%
|
||||||||
|
PayPal Holdings, Inc., 2.850%, 10/01/2029
|
750,000
|
689,683
|
0.69
|
%
|
||||||||
|
|
2,121,875
|
2.11
|
%
|
|||||||||
|
|
||||||||||||
|
Total Corporate Bonds
|
||||||||||||
|
(Cost $17,626,841)
|
16,688,036
|
16.56
|
%
|
|||||||||
The accompanying notes are an integral part of these financial statements.
|
HENNESSY FUNDS
|
1-800-966-4354
|
11
|
MORTGAGE-BACKED SECURITIES – 2.64%
|
% of
|
|||||||||||
|
|
Par Amount
|
Value
|
Net Assets
|
|||||||||
|
Federal Agency Mortgage-Backed Obligations - 2.64%
|
||||||||||||
|
Fannie Mae Pool
|
||||||||||||
|
3.000%, 10/01/2043
|
967,273
|
$
|
932,944
|
0.93
|
%
|
|||||||
|
3.500%, 01/01/2042
|
168,926
|
167,235
|
0.17
|
%
|
||||||||
|
6.000%, 10/01/2037
|
77,916
|
83,472
|
0.08
|
%
|
||||||||
|
Fannie Mae REMICS
|
||||||||||||
|
Series 2013-52, 1.250%, 06/25/2043
|
47,183
|
42,407
|
0.04
|
%
|
||||||||
|
Series 2012-16, 2.000%, 11/25/2041
|
44,603
|
41,473
|
0.04
|
%
|
||||||||
|
Series 2010-134, 2.250%, 03/25/2039
|
9,934
|
9,930
|
0.01
|
%
|
||||||||
|
Freddie Mac Gold Pool
|
||||||||||||
|
3.000%, 05/01/2042
|
491,028
|
474,529
|
0.47
|
%
|
||||||||
|
3.000%, 09/01/2042
|
666,595
|
644,168
|
0.64
|
%
|
||||||||
|
5.500%, 04/01/2037
|
37,222
|
39,824
|
0.04
|
%
|
||||||||
|
Freddie Mac REMICS
|
||||||||||||
|
Series 4146, 1.500%, 10/15/2042
|
15,804
|
15,526
|
0.02
|
%
|
||||||||
|
Series 4309, 2.000%, 10/15/2043
|
41,098
|
39,359
|
0.04
|
%
|
||||||||
|
Series 3870, 2.750%, 01/15/2041
|
15,744
|
15,501
|
0.01
|
%
|
||||||||
|
Series 4322, 3.000%, 05/15/2043
|
65,861
|
64,700
|
0.06
|
%
|
||||||||
|
Government National Mortgage Association,
|
||||||||||||
|
Series 2013-24, 1.750%, 02/16/2043
|
97,551
|
90,781
|
0.09
|
%
|
||||||||
|
|
||||||||||||
|
Total Mortgage-Backed Securities
|
||||||||||||
|
(Cost $2,754,269)
|
2,661,849
|
2.64
|
%
|
|||||||||
|
|
||||||||||||
|
U.S. TREASURY OBLIGATIONS – 9.69%
|
||||||||||||
|
U.S. Treasury Notes – 9.69%
|
||||||||||||
|
0.250%, 08/31/2025
|
1,250,000
|
1,145,068
|
1.14
|
%
|
||||||||
|
0.500%, 11/30/2023
|
750,000
|
726,094
|
0.72
|
%
|
||||||||
|
0.625%, 03/31/2027
|
450,000
|
403,049
|
0.40
|
%
|
||||||||
|
0.750%, 04/30/2026
|
1,500,000
|
1,377,275
|
1.37
|
%
|
||||||||
|
1.000%, 07/31/2028
|
1,000,000
|
888,945
|
0.88
|
%
|
||||||||
|
1.250%, 12/31/2026
|
625,000
|
579,468
|
0.58
|
%
|
||||||||
|
1.250%, 04/30/2028
|
425,000
|
385,439
|
0.38
|
%
|
||||||||
|
1.500%, 02/15/2025
|
200,000
|
192,656
|
0.19
|
%
|
||||||||
|
1.500%, 11/30/2028
|
75,000
|
68,520
|
0.07
|
%
|
||||||||
|
1.875%, 07/31/2026
|
1,550,000
|
1,485,820
|
1.47
|
%
|
||||||||
|
1.875%, 02/15/2032
|
575,000
|
525,855
|
0.52
|
%
|
||||||||
|
2.250%, 03/31/2024
|
350,000
|
347,197
|
0.34
|
%
|
||||||||
|
2.375%, 03/31/2029
|
125,000
|
120,645
|
0.12
|
%
|
||||||||
|
2.500%, 03/31/2027
|
200,000
|
196,203
|
0.19
|
%
|
||||||||
|
2.625%, 04/15/2025
|
300,000
|
298,031
|
0.30
|
%
|
||||||||
|
2.750%, 02/15/2024
|
575,000
|
576,168
|
0.57
|
%
|
||||||||
|
3.000%, 10/31/2025
|
450,000
|
451,512
|
0.45
|
%
|
||||||||
|
|
||||||||||||
|
Total U.S. Treasury Obligations
|
||||||||||||
|
(Cost $10,346,094)
|
9,767,945
|
9.69
|
%
|
|||||||||
The accompanying notes are an integral part of these financial statements.
|
WWW.HENNESSYFUNDS.COM
|
12
|
SCHEDULE OF INVESTMENTS
|
|
INVESTMENT COMPANIES (EXCLUDING
|
Number
|
% of
|
||||||||||
|
MONEY MARKET FUNDS) – 0.52%
|
of Shares
|
Value
|
Net Assets
|
|||||||||
|
Financials – 0.52%
|
||||||||||||
|
Apollo Investment Corp.
|
3,225
|
$
|
40,925
|
0.04
|
%
|
|||||||
|
Ares Capital Corp.
|
1,995
|
40,439
|
0.04
|
%
|
||||||||
|
Bain Capital Specialty Finance, Inc.
|
2,655
|
40,834
|
0.04
|
%
|
||||||||
|
BlackRock TCP Capital Corp.
|
3,015
|
41,305
|
0.04
|
%
|
||||||||
|
FS KKR Capital Corp.
|
1,865
|
39,072
|
0.04
|
%
|
||||||||
|
Golub Capital BDC, Inc.
|
2,775
|
41,403
|
0.04
|
%
|
||||||||
|
Hercules Capital, Inc.
|
2,325
|
39,060
|
0.04
|
%
|
||||||||
|
Monroe Capital Corp.
|
4,000
|
40,520
|
0.04
|
%
|
||||||||
|
New Mountain Finance Corp.
|
3,130
|
41,629
|
0.04
|
%
|
||||||||
|
Oaktree Specialty Lending Corp.
|
5,730
|
41,027
|
0.04
|
%
|
||||||||
|
Sixth Street Specialty Lending, Inc.
|
1,825
|
40,771
|
0.04
|
%
|
||||||||
|
Carlyle Secured Lending, Inc.
|
2,935
|
41,119
|
0.04
|
%
|
||||||||
|
TriplePoint Venture Growth BDC Corp.
|
2,500
|
39,375
|
0.04
|
%
|
||||||||
|
|
||||||||||||
|
Total Investment Companies
|
||||||||||||
|
(Excluding Money Market Funds)
|
||||||||||||
|
(Cost $550,539)
|
527,479
|
0.52
|
%
|
|||||||||
|
|
||||||||||||
|
SHORT-TERM INVESTMENTS – 2.14%
|
||||||||||||
|
Money Market Funds – 2.14%
|
||||||||||||
|
First American Government Obligations Fund,
|
||||||||||||
|
Institutional Class, 0.22% (d)
|
2,158,475
|
2,158,475
|
2.14
|
%
|
||||||||
|
|
||||||||||||
|
Total Short-Term Investments
|
||||||||||||
|
(Cost $2,158,475)
|
2,158,475
|
2.14
|
%
|
|||||||||
|
|
||||||||||||
|
Total Investments
|
||||||||||||
|
(Cost $77,665,543) – 99.58%
|
100,368,180
|
99.58
|
%
|
|||||||||
|
Other Assets in Excess of Liabilities – 0.42%
|
420,748
|
0.42
|
%
|
|||||||||
|
|
||||||||||||
|
TOTAL NET ASSETS – 100.00%
|
$
|
100,788,928
|
100.00
|
%
|
||||||||
Percentages are stated as a percent of net assets.
ADR – American Depositary Receipt
LIBOR – London Interbank Offered Rate
PLC – Public Limited Company
REIT – Real Estate Investment Trust
SOFR – Secured Overnight Financing Rate
|
(a)
|
Non-income-producing security.
|
|
(b)
|
U.S.-traded security of a foreign corporation.
|
|
(c)
|
Variable rate security; rate disclosed is the rate as of April 30, 2022.
|
|
(d)
|
The rate listed is the fund’s seven-day yield as of April 30, 2022.
|
The accompanying notes are an integral part of these financial statements.
|
HENNESSY FUNDS
|
1-800-966-4354
|
13
Summary of Fair Value Exposure as of April 30, 2022
The following is a summary of the inputs used to value the Fund’s net assets as of April 30, 2022 (see Note 3 in the accompanying Notes to the Financial Statements):
|
Common Stocks
|
Level 1
|
Level 2
|
Level 3
|
Total
|
||||||||||||
|
Communication Services
|
$
|
7,457,115
|
$
|
—
|
$
|
—
|
$
|
7,457,115
|
||||||||
|
Consumer Discretionary
|
8,044,232
|
—
|
—
|
8,044,232
|
||||||||||||
|
Consumer Staples
|
7,394,078
|
—
|
—
|
7,394,078
|
||||||||||||
|
Energy
|
162,678
|
—
|
—
|
162,678
|
||||||||||||
|
Financials
|
12,464,926
|
—
|
—
|
12,464,926
|
||||||||||||
|
Health Care
|
3,789,683
|
—
|
—
|
3,789,683
|
||||||||||||
|
Industrials
|
6,104,373
|
—
|
—
|
6,104,373
|
||||||||||||
|
Information Technology
|
13,272,608
|
—
|
—
|
13,272,608
|
||||||||||||
|
Materials
|
5,838,912
|
—
|
—
|
5,838,912
|
||||||||||||
|
Total Common Stocks
|
$
|
64,528,605
|
$
|
—
|
$
|
—
|
$
|
64,528,605
|
||||||||
|
Preferred Stocks
|
||||||||||||||||
|
Communication Services
|
$
|
55,205
|
$
|
—
|
$
|
—
|
$
|
55,205
|
||||||||
|
Consumer Discretionary
|
26,208
|
—
|
—
|
26,208
|
||||||||||||
|
Consumer Staples
|
32,601
|
—
|
—
|
32,601
|
||||||||||||
|
Financials
|
1,542,279
|
—
|
—
|
1,542,279
|
||||||||||||
|
Total Preferred Stocks
|
$
|
1,656,293
|
$
|
—
|
$
|
—
|
$
|
1,656,293
|
||||||||
|
REITS
|
||||||||||||||||
|
Financials
|
$
|
179,771
|
$
|
—
|
$
|
—
|
$
|
179,771
|
||||||||
|
Real Estate
|
2,199,727
|
—
|
—
|
2,199,727
|
||||||||||||
|
Total REITS
|
$
|
2,379,498
|
$
|
—
|
$
|
—
|
$
|
2,379,498
|
||||||||
|
Corporate Bonds
|
||||||||||||||||
|
Communication Services
|
$
|
—
|
$
|
1,144,036
|
$
|
—
|
$
|
1,144,036
|
||||||||
|
Consumer Discretionary
|
—
|
1,674,119
|
—
|
1,674,119
|
||||||||||||
|
Energy
|
—
|
1,414,673
|
—
|
1,414,673
|
||||||||||||
|
Financials
|
—
|
8,019,803
|
—
|
8,019,803
|
||||||||||||
|
Health Care
|
—
|
1,755,859
|
—
|
1,755,859
|
||||||||||||
|
Industrials
|
—
|
557,671
|
—
|
557,671
|
||||||||||||
|
Information Technology
|
—
|
2,121,875
|
—
|
2,121,875
|
||||||||||||
|
Total Corporate Bonds
|
$
|
—
|
$
|
16,688,036
|
$
|
—
|
$
|
16,688,036
|
||||||||
|
Mortgage-Backed Securities
|
||||||||||||||||
|
Federal Agency Mortgage-Backed Obligations
|
$
|
—
|
$
|
2,661,849
|
$
|
—
|
$
|
2,661,849
|
||||||||
|
Total Mortgage-Backed Securities
|
$
|
—
|
$
|
2,661,849
|
$
|
—
|
$
|
2,661,849
|
||||||||
|
U.S. Treasury Obligations
|
||||||||||||||||
|
U.S. Treasury Notes
|
$
|
—
|
$
|
9,767,945
|
$
|
—
|
$
|
9,767,945
|
||||||||
|
Total U.S. Treasury Obligations
|
$
|
—
|
$
|
9,767,945
|
$
|
—
|
$
|
9,767,945
|
||||||||
|
Investment Companies (Excluding
|
||||||||||||||||
|
Money Market Funds)
|
||||||||||||||||
|
Financials
|
$
|
527,479
|
$
|
—
|
$
|
—
|
$
|
527,479
|
||||||||
|
Total Investment Companies
|
||||||||||||||||
|
(Excluding Money Market Funds)
|
$
|
527,479
|
$
|
—
|
$
|
—
|
$
|
527,479
|
||||||||
|
Short-Term Investments
|
||||||||||||||||
|
Money Market Funds
|
$
|
2,158,475
|
$
|
—
|
$
|
—
|
$
|
2,158,475
|
||||||||
|
Total Short-Term Investments
|
$
|
2,158,475
|
$
|
—
|
$
|
—
|
$
|
2,158,475
|
||||||||
|
Total Investments
|
$
|
71,250,350
|
$
|
29,117,830
|
$
|
—
|
$
|
100,368,180
|
||||||||
The accompanying notes are an integral part of these financial statements.
|
WWW.HENNESSYFUNDS.COM
|
14
|
SCHEDULE OF INVESTMENTS/STATEMENT OF ASSETS AND LIABILITIES
|
Financial Statements
|
Statement of Assets and Liabilities as of April 30, 2022 (Unaudited)
|
|
ASSETS:
|
||||
|
Investments in securities, at value (cost $77,665,543)
|
$
|
100,368,180
|
||
|
Dividends and interest receivable
|
342,517
|
|||
|
Receivable for fund shares sold
|
71,990
|
|||
|
Receivable for securities sold
|
618,300
|
|||
|
Return of capital receivable
|
498
|
|||
|
Prepaid expenses and other assets
|
21,489
|
|||
|
Total assets
|
101,422,974
|
|||
|
LIABILITIES:
|
||||
|
Payable for fund shares redeemed
|
494,939
|
|||
|
Payable to advisor
|
70,042
|
|||
|
Payable to administrator
|
20,051
|
|||
|
Payable to auditor
|
11,216
|
|||
|
Accrued distribution fees
|
7,984
|
|||
|
Accrued service fees
|
3,933
|
|||
|
Accrued trustees fees
|
5,579
|
|||
|
Accrued expenses and other payables
|
20,302
|
|||
|
Total liabilities
|
634,046
|
|||
|
NET ASSETS
|
$
|
100,788,928
|
||
|
NET ASSETS CONSISTS OF:
|
||||
|
Capital stock
|
$
|
75,593,004
|
||
|
Total distributable earnings
|
25,195,924
|
|||
|
Total net assets
|
$
|
100,788,928
|
||
|
NET ASSETS:
|
||||
|
Investor Class
|
||||
|
Shares authorized (no par value)
|
Unlimited
|
|||
|
Net assets applicable to outstanding shares
|
$
|
45,690,570
|
||
|
Shares issued and outstanding
|
3,082,400
|
|||
|
Net asset value, offering price, and redemption price per share
|
$
|
14.82
|
||
|
Institutional Class
|
||||
|
Shares authorized (no par value)
|
Unlimited
|
|||
|
Net assets applicable to outstanding shares
|
$
|
55,098,358
|
||
|
Shares issued and outstanding
|
3,956,237
|
|||
|
Net asset value, offering price, and redemption price per share
|
$
|
13.93
|
||
The accompanying notes are an integral part of these financial statements.
|
HENNESSY FUNDS
|
1-800-966-4354
|
15
Financial Statements
|
Statement of Operations for the six months ended April 30, 2022 (Unaudited)
|
|
INVESTMENT INCOME:
|
||||
|
Dividend income(1)
|
$
|
735,599
|
||
|
Interest income
|
372,606
|
|||
|
Total investment income
|
1,108,205
|
|||
|
EXPENSES:
|
||||
|
Investment advisory fees (See Note 5)
|
454,839
|
|||
|
Sub-transfer agent expenses – Investor Class (See Note 5)
|
55,004
|
|||
|
Sub-transfer agent expenses – Institutional Class (See Note 5)
|
23,484
|
|||
|
Administration, accounting, custody, and transfer agent fees (See Note 5)
|
67,749
|
|||
|
Distribution fees – Investor Class (See Note 5)
|
38,270
|
|||
|
Service fees – Investor Class (See Note 5)
|
25,513
|
|||
|
Federal and state registration fees
|
15,923
|
|||
|
Compliance expense (See Note 5)
|
15,156
|
|||
|
Audit fees
|
11,222
|
|||
|
Trustees’ fees and expenses
|
9,407
|
|||
|
Reports to shareholders
|
6,413
|
|||
|
Legal fees
|
3,492
|
|||
|
Other expenses
|
7,783
|
|||
|
Total expenses
|
734,255
|
|||
|
NET INVESTMENT INCOME
|
$
|
373,950
|
||
|
REALIZED AND UNREALIZED GAINS (LOSSES):
|
||||
|
Net realized gain on investments:
|
$
|
2,726,439
|
||
|
Net change in unrealized appreciation/depreciation on investments:
|
(12,140,396
|
)
|
||
|
Net loss on investments
|
(9,413,957
|
)
|
||
|
NET DECREASE IN NET ASSETS RESULTING FROM OPERATIONS
|
$
|
(9,040,007
|
)
|
|
|
(1)
|
Net of foreign taxes withheld of $8,953.
|
The accompanying notes are an integral part of these financial statements.
|
WWW.HENNESSYFUNDS.COM
|
16
|
STATEMENT OF OPERATIONS/STATEMENTS OF CHANGES IN NET ASSETS
|
Financial Statements
|
Statements of Changes in Net Assets
|
|
Six Months Ended
|
||||||||
|
April 30, 2022
|
Year Ended
|
|||||||
|
(Unaudited)
|
October 31, 2021
|
|||||||
|
OPERATIONS:
|
||||||||
|
Net investment income
|
$
|
373,950
|
$
|
890,714
|
||||
|
Net realized gain on investments
|
2,726,439
|
8,268,323
|
||||||
|
Net change in unrealized
|
||||||||
|
appreciation/depreciation on investments
|
(12,140,396
|
)
|
13,894,367
|
|||||
|
Net increase (decrease) in net
|
||||||||
|
assets resulting from operations
|
(9,040,007
|
)
|
23,053,404
|
|||||
|
DISTRIBUTIONS TO SHAREHOLDERS:
|
||||||||
|
Distributable earnings – Investor Class
|
(3,514,334
|
)
|
(3,200,223
|
)
|
||||
|
Distributable earnings – Institutional Class
|
(4,442,947
|
)
|
(4,139,573
|
)
|
||||
|
Total distributions
|
(7,957,281
|
)
|
(7,339,796
|
)
|
||||
|
CAPITAL SHARE TRANSACTIONS:
|
||||||||
|
Proceeds from shares subscribed – Investor Class
|
1,627,526
|
1,376,547
|
||||||
|
Proceeds from shares subscribed – Institutional Class
|
1,763,872
|
3,724,722
|
||||||
|
Dividends reinvested – Investor Class
|
3,420,686
|
3,106,285
|
||||||
|
Dividends reinvested – Institutional Class
|
3,396,892
|
3,180,592
|
||||||
|
Cost of shares redeemed – Investor Class
|
(5,685,457
|
)
|
(8,925,766
|
)
|
||||
|
Cost of shares redeemed – Institutional Class
|
(6,769,307
|
)
|
(11,189,372
|
)
|
||||
|
Net decrease in net assets derived
|
||||||||
|
from capital share transactions
|
(2,245,788
|
)
|
(8,726,992
|
)
|
||||
|
TOTAL INCREASE (DECREASE) IN NET ASSETS
|
(19,243,076
|
)
|
6,986,616
|
|||||
|
NET ASSETS:
|
||||||||
|
Beginning of period
|
120,032,004
|
113,045,388
|
||||||
|
End of period
|
$
|
100,788,928
|
$
|
120,032,004
|
||||
|
CHANGES IN SHARES OUTSTANDING:
|
||||||||
|
Shares sold – Investor Class
|
98,169
|
83,494
|
||||||
|
Shares sold – Institutional Class
|
114,951
|
245,309
|
||||||
|
Shares issued to holders as reinvestment
|
||||||||
|
of dividends – Investor Class
|
207,242
|
200,751
|
||||||
|
Shares issued to holders as reinvestment
|
||||||||
|
of dividends – Institutional Class
|
219,021
|
217,790
|
||||||
|
Shares redeemed – Investor Class
|
(349,409
|
)
|
(549,400
|
)
|
||||
|
Shares redeemed – Institutional Class
|
(451,347
|
)
|
(732,371
|
)
|
||||
|
Net decrease in shares outstanding
|
(161,373
|
)
|
(534,427
|
)
|
||||
The accompanying notes are an integral part of these financial statements.
|
HENNESSY FUNDS
|
1-800-966-4354
|
17
Financial Statements
|
Financial Highlights
|
For an Investor Class share outstanding throughout each period
|
Six Months Ended
|
||||
|
April 30, 2022
|
||||
|
(Unaudited)
|
||||
|
PER SHARE DATA:
|
||||
|
Net asset value, beginning of period
|
$
|
17.26
|
||
|
Income from investment operations:
|
||||
|
Net investment income
|
0.04
|
(1)
|
||
|
Net realized and unrealized gains (losses) on investments
|
(1.34
|
)
|
||
|
Total from investment operations
|
(1.30
|
)
|
||
|
Less distributions:
|
||||
|
Dividends from net investment income
|
(0.03
|
)
|
||
|
Dividends from net realized gains
|
(1.11
|
)
|
||
|
Total distributions
|
(1.14
|
)
|
||
|
Net asset value, end of period
|
$
|
14.82
|
||
|
TOTAL RETURN
|
-8.20
|
%(2)
|
||
|
SUPPLEMENTAL DATA AND RATIOS:
|
||||
|
Net assets, end of period (millions)
|
$
|
45.69
|
||
|
Ratio of expenses to average net assets
|
1.51
|
%(3)
|
||
|
Ratio of net investment income to average net assets
|
0.44
|
%(3)
|
||
|
Portfolio turnover rate(4)
|
11
|
%(2)
|
||
|
(1)
|
Calculated using the average shares outstanding method.
|
|
(2)
|
Not annualized.
|
|
(3)
|
Annualized.
|
|
(4)
|
Calculated on the basis of the Fund as a whole.
|
The accompanying notes are an integral part of these financial statements.
|
WWW.HENNESSYFUNDS.COM
|
18
|
FINANCIAL HIGHLIGHTS — INVESTOR CLASS
|
|
Year Ended October 31,
|
||||||||||||||||||
|
2021
|
2020
|
2019
|
2018
|
2017
|
||||||||||||||
|
$
|
15.12
|
$
|
15.72
|
$
|
15.82
|
$
|
16.24
|
$
|
15.61
|
|||||||||
|
0.09
|
(1)
|
0.16
|
(1)
|
0.18
|
(1)
|
0.16
|
0.14
|
|||||||||||
|
3.01
|
0.40
|
1.02
|
0.40
|
1.95
|
||||||||||||||
|
3.10
|
0.56
|
1.20
|
0.56
|
2.09
|
||||||||||||||
|
(0.10
|
)
|
(0.16
|
)
|
(0.17
|
)
|
(0.14
|
)
|
(0.12
|
)
|
|||||||||
|
(0.86
|
)
|
(1.00
|
)
|
(1.13
|
)
|
(0.84
|
)
|
(1.34
|
)
|
|||||||||
|
(0.96
|
)
|
(1.16
|
)
|
(1.30
|
)
|
(0.98
|
)
|
(1.46
|
)
|
|||||||||
|
$
|
17.26
|
$
|
15.12
|
$
|
15.72
|
$
|
15.82
|
$
|
16.24
|
|||||||||
|
21.24
|
%
|
3.74
|
%
|
8.39
|
%
|
3.44
|
%
|
14.16
|
%
|
|||||||||
|
$
|
53.97
|
$
|
51.29
|
$
|
93.51
|
$
|
121.32
|
$
|
155.33
|
|||||||||
|
1.49
|
%
|
1.49
|
%
|
1.46
|
%
|
1.42
|
%
|
1.43
|
%
|
|||||||||
|
0.54
|
%
|
1.08
|
%
|
1.16
|
%
|
0.89
|
%
|
0.78
|
%
|
|||||||||
|
26
|
%
|
22
|
%
|
16
|
%
|
18
|
%
|
15
|
%
|
|||||||||
The accompanying notes are an integral part of these financial statements.
|
HENNESSY FUNDS
|
1-800-966-4354
|
19
Financial Statements
|
Financial Highlights
|
For an Institutional Class share outstanding throughout each period
|
Six Months Ended
|
||||
|
April 30, 2022
|
||||
|
(Unaudited)
|
||||
|
PER SHARE DATA:
|
||||
|
Net asset value, beginning of period
|
$
|
16.22
|
||
|
Income from investment operations:
|
||||
|
Net investment income
|
0.06
|
(1)
|
||
|
Net realized and unrealized gains (losses) on investments
|
(1.25
|
)
|
||
|
Total from investment operations
|
(1.19
|
)
|
||
|
Less distributions:
|
||||
|
Dividends from net investment income
|
(0.06
|
)
|
||
|
Dividends from net realized gains
|
(1.04
|
)
|
||
|
Total distributions
|
(1.10
|
)
|
||
|
Net asset value, end of period
|
$
|
13.93
|
||
|
TOTAL RETURN
|
-8.00
|
%(2)
|
||
|
SUPPLEMENTAL DATA AND RATIOS:
|
||||
|
Net assets, end of period (millions)
|
$
|
55.10
|
||
|
Ratio of expenses to average net assets
|
1.12
|
%(3)
|
||
|
Ratio of net investment income to average net assets
|
0.83
|
%(3)
|
||
|
Portfolio turnover rate(4)
|
11
|
%(2)
|
||
|
(1)
|
Calculated using the average shares outstanding method.
|
|
(2)
|
Not annualized.
|
|
(3)
|
Annualized.
|
|
(4)
|
Calculated on the basis of the Fund as a whole.
|
The accompanying notes are an integral part of these financial statements.
|
WWW.HENNESSYFUNDS.COM
|
20
|
FINANCIAL HIGHLIGHTS — INSTITUTIONAL CLASS
|
|
Year Ended October 31,
|
||||||||||||||||||
|
2021
|
2020
|
2019
|
2018
|
2017
|
||||||||||||||
|
$
|
14.22
|
$
|
14.80
|
$
|
14.93
|
$
|
15.34
|
$
|
14.76
|
|||||||||
|
0.14
|
(1)
|
0.20
|
(1)
|
0.22
|
(1)
|
0.19
|
0.16
|
|||||||||||
|
2.83
|
0.38
|
0.96
|
0.39
|
1.87
|
||||||||||||||
|
2.97
|
0.58
|
1.18
|
0.58
|
2.03
|
||||||||||||||
|
(0.16
|
)
|
(0.22
|
)
|
(0.24
|
)
|
(0.20
|
)
|
(0.18
|
)
|
|||||||||
|
(0.81
|
)
|
(0.94
|
)
|
(1.07
|
)
|
(0.79
|
)
|
(1.27
|
)
|
|||||||||
|
(0.97
|
)
|
(1.16
|
)
|
(1.31
|
)
|
(0.99
|
)
|
(1.45
|
)
|
|||||||||
|
$
|
16.22
|
$
|
14.22
|
$
|
14.80
|
$
|
14.93
|
$
|
15.34
|
|||||||||
|
21.68
|
%
|
4.16
|
%
|
8.76
|
%
|
3.86
|
%
|
14.60
|
%
|
|||||||||
|
$
|
66.06
|
$
|
61.75
|
$
|
80.40
|
$
|
97.86
|
$
|
110.74
|
|||||||||
|
1.12
|
%
|
1.12
|
%
|
1.09
|
%
|
1.02
|
%
|
1.05
|
%
|
|||||||||
|
0.91
|
%
|
1.44
|
%
|
1.53
|
%
|
1.28
|
%
|
1.16
|
%
|
|||||||||
|
26
|
%
|
22
|
%
|
16
|
%
|
18
|
%
|
15
|
%
|
|||||||||
The accompanying notes are an integral part of these financial statements.
|
HENNESSY FUNDS
|
1-800-966-4354
|
21
Financial Statements
|
Notes to the Financial Statements April 30, 2022 (Unaudited)
|
1). ORGANIZATION
The Hennessy Equity and Income Fund (the “Fund”) is a series of Hennessy Funds Trust (the “Trust”), which was organized as a Delaware statutory trust on September 17, 1992. The Fund is an open-end management
investment company registered under the Investment Company Act of 1940, as amended. The investment objective of the Fund is long-term capital growth and current income. The Fund is a diversified fund.
The Fund offers Investor Class and Institutional Class shares. Each class of shares differs principally in its respective 12b-1 distribution and service, shareholder servicing, and
sub-transfer agent expenses. There are no sales charges. Each class has identical rights to earnings, assets, and voting privileges, except for class-specific expenses and exclusive rights to vote on matters affecting only one class.
As an investment company, the Fund follows the investment company accounting and reporting guidance of the Financial Accounting Standards Board (“FASB”) Accounting Standard Codification
Topic 946 “Financial Services—Investment Companies.”
2). SIGNIFICANT ACCOUNTING POLICIES
The following is a summary of significant accounting policies consistently followed by the Fund in the preparation of the financial statements. These policies conform to U.S. generally accepted accounting
principles (“GAAP”).
|
a).
|
Securities Valuation – All investments in securities are valued in accordance with the Fund’s valuation policies and procedures, as described in Note 3.
|
|
b).
|
Federal Income Taxes – The Fund has elected to be taxed as a regulated investment company and intends to distribute substantially all of its taxable income to its shareholders and otherwise comply
with the provisions of the Internal Revenue Code of 1986, as amended, applicable to regulated investment companies. As a result, the Fund has made no provision for federal income taxes or excise taxes. Net investment
income/loss and realized gains/losses for federal income tax purposes may differ from those reported in the financial statements because of temporary book-basis and tax-basis differences. Temporary differences are primarily
the result of the treatment of wash sales for tax reporting purposes. The Fund recognizes interest and penalties related to income tax benefits, if any, in the Statement of Operations as an income tax expense. Distributions
from net realized gains for book purposes may include short-term capital gains, which are included as ordinary income to shareholders for tax purposes. The Fund may utilize equalization accounting for tax purposes and
designate earnings and profits, including net realized gains distributed to shareholders on redemption of shares, as part of the dividends paid deduction for income tax purposes.
|
|
c).
|
Accounting for Uncertainty in Income Taxes – The Fund has accounting policies regarding recognition and measurement of tax positions taken or expected to be taken on a tax return. The tax returns of
the Fund for the prior three fiscal years are open for examination. The Fund has reviewed all open tax years in major tax jurisdictions and concluded that there is no impact on the Fund’s net assets and no tax liability
resulting from unrecognized tax benefits relating to uncertain income tax positions taken or expected to be taken on a tax return. The Fund’s major tax jurisdictions are U.S. federal and Delaware.
|
|
WWW.HENNESSYFUNDS.COM
|
22
|
NOTES TO THE FINANCIAL STATEMENTS
|
|
d).
|
Income and Expenses – Dividend income is recognized on the ex-dividend date or as soon as information is available to the Fund. Interest income, which includes the amortization of premium and
accretion of discount, is recognized on an accrual basis. Market discounts, original issue discounts, and market premiums on debt securities are accreted or amortized to interest income over the life of a security with a
corresponding increase or decrease, as applicable, in the cost basis of such security using the yield-to-maturity method or, where applicable, the first call date of the security. Other non-cash dividends are recognized as
investment income at the fair value of the property received. The Fund is charged for those expenses that are directly attributable to its portfolio, such as advisory, administration, and certain shareholder service fees.
Income, expenses (other than expenses attributable to a specific class), and realized and unrealized gains/losses on investments are allocated to each class of shares based on such class’s net assets.
|
|
e).
|
Distributions to Shareholders – Dividends from net investment income for the Fund, if any, are declared and paid at the end of each calendar quarter. Distributions of net realized capital gains, if
any, are declared and paid annually, usually in December.
|
|
f).
|
Security Transactions – Investment and shareholder transactions are recorded on the trade date. The Fund determines the realized gain/loss from an investment transaction by comparing the original
cost of the security lot sold with the net sale proceeds. Discounts and premiums on securities purchased are accreted or amortized, respectively, over the life of each such security.
|
|
g).
|
Use of Estimates – Preparing financial statements in accordance with GAAP requires management to make estimates and assumptions that affect the reported amounts of assets and liabilities and
disclosure of contingent assets and liabilities at the date of the financial statements, as well as the reported change in net assets during the reporting period. Actual results could differ from those estimates.
|
|
h).
|
Share Valuation – The net asset value (“NAV”) per share of the Fund is calculated by dividing (i) the total value of the securities held by the Fund, plus cash and other assets, minus all liabilities
(including estimated accrued expenses) by (ii) the total number of Fund shares outstanding, rounded to the nearest $0.01. Fund shares are not priced on days the New York Stock Exchange is closed for trading. The offering and
redemption price per share for the Fund is equal to the Fund’s NAV per share.
|
|
i).
|
REIT Equity Securities – Distributions received from real estate investment trusts (“REITs”) may be classified as dividends, capital gains, or return of capital. Investments in REITs may require the
Fund to accrue and distribute income not yet received. To generate sufficient cash to make any required distributions, the Fund may be required to sell securities in its portfolio (including when it is not advantageous to do
so) that it otherwise would have continued to hold. At other times, investments in a REIT may result in the Fund’s receipt of cash in excess of the REIT’s earnings. If the Fund distributes these amounts, these distributions
could constitute a return of capital to Fund shareholders for U.S. federal income tax purposes. Dividends received by the Fund from a REIT generally do not constitute qualified dividend income and do not qualify for the
dividends-received deduction.
|
|
j).
|
Recent Accounting Pronouncements and Regulatory Updates – In October 2020, the Securities and Exchange Commission (“SEC”) adopted new regulations governing the use of derivatives by registered
investment companies (“Rule 18f-4”). Rule 18f-4 imposes limits on the amount of derivatives a fund can enter into, eliminates the asset segregation framework currently used by funds to comply with Section 18 of the 1940 Act,
and requires funds whose use of derivatives is greater than a limited
|
|
HENNESSY FUNDS
|
1-800-966-4354
|
23
|
specified amount to establish and maintain a comprehensive derivatives risk management program and appoint a derivatives risk manager. Funds are required to comply with Rule 18f-4 by August 19, 2022.
The impact, if any, that Rule 18f-4 will have on the availability, liquidity, and performance of derivatives is unclear. Management is currently evaluating the potential impact of Rule 18f-4 on the Fund. When fully
implemented, Rule 18f-4 may require changes in how the Fund uses derivatives, adversely affect the Fund’s performance, and increase costs related to the Fund’s use of derivatives.
|
|
|
In December 2020, the SEC adopted a new rule providing a framework for fund valuation practices (“Rule 2a-5”). Rule 2a-5
establishes requirements for determining fair value in good faith for purposes of the 1940 Act. Rule 2a-5 permits fund boards to designate certain parties to perform fair value determinations, subject to board oversight and
certain other conditions. Rule 2a-5 also defines when market quotations are “readily available” for purposes of the 1940 Act and the threshold for determining whether a fund must fair value a security. In connection with Rule
2a-5, the SEC also adopted related recordkeeping requirements and is rescinding previously issued guidance, including with respect to the role of a board in determining fair value and the accounting and auditing of fund
investments. Funds must comply with the rules by September 8, 2022. Management is currently assessing the potential impact of the new rules on the Fund’s financial statements.
|
3). SECURITIES VALUATION
The Fund follows its valuation policies and procedures in determining its net asset value and, in preparing these financial statements, the fair value accounting standards that establish an authoritative
definition of fair value and set out a hierarchy for measuring fair value. These standards require additional disclosures about the various inputs and valuation techniques used to develop the measurements of fair value and a
discussion of changes in valuation techniques and related inputs during the period. These inputs are summarized in the three broad levels listed below:
|
Level 1 –
|
Unadjusted, quoted prices in active markets for identical instruments that the Fund has the ability to access at the date of measurement.
|
|
|
Level 2 –
|
Other significant observable inputs (including, but not limited to, quoted prices in active markets for similar instruments, quoted prices in markets that are not active for identical or similar
instruments, and model-derived valuations in which all significant inputs and significant value drivers are observable in active markets, such as interest rates, prepayment speeds, credit risk curves, default rates, and
similar data).
|
|
|
Level 3 –
|
Significant unobservable inputs (including the Fund’s own assumptions about what market participants would use to price the asset or liability based on the best available information) when observable
inputs are unavailable.
|
The following is a description of the valuation techniques applied to the Fund’s major categories of assets and liabilities on a recurring basis:
|
Equity Securities – Equity securities, including common stocks, preferred stocks, foreign-issued common stocks, exchange-traded funds, closed-end mutual
funds, partnerships, rights, and real estate investment trusts, that are traded on a securities exchange for which a last-quoted sales price is readily available generally are valued at the last sales price as reported by the
primary exchange on which the securities are listed. Securities listed on The Nasdaq Stock Market (“Nasdaq”) generally are valued at the Nasdaq Official Closing Price, which may differ from the last sales price reported.
|
|
WWW.HENNESSYFUNDS.COM
|
24
|
NOTES TO THE FINANCIAL STATEMENTS
|
|
Securities traded on a securities exchange for which a last-quoted sales price is not readily available generally are valued at the mean between the bid and ask prices. To the extent these securities
are actively traded and valuation adjustments are not applied, they are classified in Level 1 of the fair value hierarchy. Securities traded on foreign exchanges generally are not valued at the same time the Fund calculates
its NAV because most foreign markets close well before such time. The earlier close of most foreign markets gives rise to the possibility that significant events, including broad market moves, may have occurred in the interim.
In certain circumstances, it may be determined that a foreign security needs to be fair valued because it appears that the value of the security might have been materially affected by events occurring after the close of the
market in which the security is principally traded, but before the time the Fund calculates its NAV, such as by a development that affects an entire market or region (e.g., a weather-related event) or a potentially global
development (e.g., a terrorist attack that may be expected to have an effect on investor expectations worldwide).
|
|
|
Registered Investment Companies – Investments in open-end registered investment companies, commonly referred to as mutual funds, generally are priced at the
ending NAV provided by the applicable mutual fund’s service agent and are classified in Level 1 of the fair value hierarchy.
|
|
|
Debt Securities – Debt securities, including corporate bonds, asset-backed securities, mortgage-backed securities, municipal bonds, U.S. Treasuries, and U.S.
government agency issues, are generally valued at market on the basis of valuations furnished by an independent pricing service that utilizes both dealer-supplied valuations and formula-based techniques. The pricing service
may consider recently executed transactions in securities of the issuer or comparable issuers, market price quotations (where observable), bond spreads, and fundamental data relating to the issuer. In addition, the model may
incorporate observable market data, such as reported sales of similar securities, broker quotes, yields, bids, offers, and reference data. Certain securities are valued primarily using dealer quotations. These securities are
generally classified in Level 2 of the fair value hierarchy.
|
|
|
Short-Term Securities – Short-term equity investments, including money market funds, are valued in the manner specified above for equity securities.
Short-term debt investments with an original term to maturity of 60 days or less are valued at amortized cost, which approximates fair market value. If the original term to maturity of a short-term debt investment exceeds 60
days, then the values as of the 61st day prior to maturity are amortized. Amortized cost is not used if its use would be inappropriate due to credit or other impairments of the issuer, in which case the security’s fair value
would be determined as described below. Short-term securities are generally classified in Level 1 or Level 2 of the fair value hierarchy depending on the inputs used and market activity levels for specific securities.
|
The Board of Trustees of the Fund (the “Board”) has adopted fair value pricing procedures that are followed when a price for a security is not readily available or if a significant event
has occurred that indicates the closing price of a security no longer represents the true value of that security. Fair value pricing determinations are made in good faith in accordance with these procedures. There are numerous
criteria considered in determining a fair value of a security, such as the trading volume of a security and markets, the values of other similar securities, and news events with direct bearing on a security or markets. Fair value
pricing results in an estimated price for a security that reflects the amount the Fund might reasonably expect to receive in a current sale. Depending on the relative significance of the valuation inputs, these securities may be
classified in either Level 2 or Level 3 of the fair value hierarchy.
|
HENNESSY FUNDS
|
1-800-966-4354
|
25
The fair value of foreign securities may be determined with the assistance of a pricing service using correlations between the movement of prices of such securities and indices of domestic
securities and other appropriate indicators, such as closing market prices of relevant American Depositary Receipts or futures contracts. Using fair value pricing means that the Fund’s NAV reflects the affected portfolio securities’
values as determined by the Board or its designee, pursuant to the fair value pricing procedures adopted by the Board, instead of being determined by the market. Using a fair value pricing methodology to price a foreign security may
result in a value that is different from such foreign security’s most recent closing price and from the value used by other investment companies to calculate their NAVs. Such securities are generally classified in Level 2 of the fair
value hierarchy. Because the Fund may invest in foreign securities, the value of the Fund’s portfolio securities may change on days when a shareholder is unable to purchase or redeem Fund shares.
The Board has delegated day-to-day valuation matters to the Valuation and Liquidity Committee comprising representatives from Hennessy Advisors, Inc., the Fund’s investment advisor (the
“Advisor”). The function of the Valuation and Liquidity Committee, among other things, is to value securities where current and reliable market quotations are not readily available. All actions taken by the Valuation and Liquidity
Committee are reviewed by the Board.
The Fund has performed an analysis of all existing investments to determine the significance and character of all inputs to their fair value determinations. Various inputs are used to
determine the value of the Fund’s investments. The inputs or methodology used for valuing securities are not necessarily an indication of the risk associated with investing in those securities. Details related to the fair value
hierarchy of the Fund’s securities as of April 30, 2022, are included in the Schedule of Investments.
4). INVESTMENT TRANSACTIONS
Purchases and sales of investment securities (excluding government and short-term investments) for the Fund during the six months ended April 30, 2022, were $6,479,423 and $16,505,825, respectively.
Purchases and sales/maturities of long-term U.S. government securities for the Fund during the six months ended April 30, 2022, were $6,119,178 and $6,452,183, respectively.
5). INVESTMENT ADVISORY FEE AND OTHER TRANSACTIONS WITH AFFILIATES
The Advisor provides the Fund with investment advisory services under an Investment Advisory Agreement. The Advisor oversees the provision of investment advice and furnishes office space, facilities, and
most of the personnel needed by the Fund. As compensation for its services, the Advisor is entitled to a monthly fee from the Fund. The fee is based on the average daily net assets of the Fund at an annual rate of 0.80%. The
net investment advisory fees expensed by the Fund during the six months ended April 30, 2022, are included in the Statement of Operations.
The Advisor has delegated the day-to-day management of the equity allocation of the Fund to a sub-advisor, The London Company of Virginia, LLC, and has delegated the day-to-day management
of the fixed income allocation of the Fund to a sub-advisor, FCI Advisors. The Advisor pays the sub-advisory fees from its own assets, and these fees are not an additional expense of the Fund. During the six months ended April 30,
2022, the Advisor (not the Fund) paid a sub-advisory fee at the rate of 0.33% of the daily net assets of the equity allocation of the Fund and 0.27% of the daily net assets of the fixed income allocation of the Fund.
|
WWW.HENNESSYFUNDS.COM
|
26
|
NOTES TO THE FINANCIAL STATEMENTS
|
The Board has approved a Shareholder Servicing Agreement for Investor Class shares of the Fund, which compensates the Advisor for the non-investment advisory services it provides to the
Fund. The Shareholder Servicing Agreement provides for a monthly fee paid to the Advisor at an annual rate of 0.10% of the average daily net assets of the Fund attributable to Investor Class shares. The shareholder service fees
expensed by the Fund during the six months ended April 30, 2022, are included in the Statement of Operations.
The Fund has adopted a plan pursuant to Rule 12b-1 under the Investment Company Act of 1940, as amended, that authorizes payments in connection with the distribution of Fund shares at an
annual rate of up to 0.25% of the Fund’s average daily net assets attributable to Investor Class shares. Even though the authorized rate is up to 0.25%, the Fund is currently only using up to 0.15% of its average daily net assets
attributable to Investor Class shares for such purpose. Amounts paid under the plan may be spent on any activities or expenses primarily intended to result in the sale of shares, including, but not limited to, advertising, shareholder
account servicing, printing and mailing of prospectuses to other than current shareholders, printing and mailing of sales literature, and compensation for sales and marketing activities or to financial institutions and others, such as
dealers and distributors. The distribution fees expensed by the Fund during the six months ended April 30, 2022, are included in the Statement of Operations.
The Fund has entered into agreements with various brokers, dealers, and financial intermediaries in connection with the sale of Fund shares. The agreements provide for periodic payments of
sub-transfer agent expenses by the Fund to the brokers, dealers, and financial intermediaries for providing certain shareholder maintenance services. These shareholder services include the pre-processing and quality control of new
accounts, shareholder correspondence, answering customer inquiries regarding account status, and facilitating shareholder telephone transactions. The sub-transfer agent fees expensed by the Fund during the six months ended April 30,
2022, are included in the Statement of Operations.
U.S. Bancorp Fund Services, LLC, d/b/a U.S. Bank Global Fund Services (“Fund Services”) provides the Fund with administrative, accounting, and transfer agent services. As administrator,
Fund Services is responsible for activities such as (i) preparing various federal and state regulatory filings, reports, and returns for the Fund, (ii) preparing reports and materials to be supplied to the Board, (iii) monitoring the
activities of the Fund’s custodian, transfer agent, and accountants, and (iv) coordinating the preparation and payment of the Fund’s expenses and reviewing the Fund’s expense accruals. U.S. Bank N.A., an affiliate of Fund Services,
serves as the Fund’s custodian. The servicing agreements between the Trust, Fund Services, and U.S. Bank N.A. contain a fee schedule that is inclusive of administrative, accounting, custody, and transfer agent fees. The
administrative, accounting, custody, and transfer agent fees expensed by the Fund during the six months ended April 30, 2022, are included in the Statement of Operations.
Quasar Distributors, LLC (“Quasar”), a wholly owned broker-dealer subsidiary of Foreside Financial Group, LLC, acts as the Fund’s principal underwriter in a continuous public offering of
Fund shares.
The officers of the Fund are affiliated with the Advisor. With the exception of the Chief Compliance Officer and the Senior Compliance Officer, such officers receive no compensation from
the Fund for serving in their respective roles. The Fund, along with the other funds in the Hennessy Funds family (collectively, the “Hennessy Funds”), makes reimbursement payments on an equal basis to the Advisor for a portion of the
salary and benefits associated with the office of the Chief Compliance Officer and for all of
|
HENNESSY FUNDS
|
1-800-966-4354
|
27
the salary and benefits associated with the office of the Senior Compliance Officer. The compliance fees expensed by the Fund during the six months ended April 30, 2022, are included in the Statement of
Operations.
6). GUARANTEES AND INDEMNIFICATIONS
Under the Hennessy Funds’ organizational documents, their officers and trustees are indemnified by the Hennessy Funds against certain liabilities arising out of the performance of their duties to the
Hennessy Funds. Additionally, in the normal course of business, the Hennessy Funds enter into contracts with service providers that contain general indemnification clauses. The Fund’s maximum exposure under these arrangements is
unknown as this would involve future claims that may be made against the Fund that have not yet occurred. Currently, the Fund expects the risk of loss to be remote.
7). LINE OF CREDIT
The Fund has an uncommitted line of credit with the other Hennessy Funds in the amount of the lesser of (i) $100,000,000 or (ii) 33.33% of each Hennessy Fund’s net assets, or 30% for the Hennessy Gas Utility
Fund and 10% for the Hennessy Balanced Fund. The line of credit is intended to provide any necessary short-term financing in connection with shareholder redemptions, subject to certain restrictions. The credit facility is with the
Hennessy Funds’ custodian bank, U.S. Bank N.A. Borrowings under this arrangement bear interest at the bank’s prime rate and are secured by all of the Fund’s assets (as to its own borrowings only). During the six months ended April 30,
2022, the Fund did not have any borrowings outstanding under the line of credit.
8). FEDERAL TAX INFORMATION
As of October 31, 2021, the Fund’s most recent fiscal year end, the components of accumulated earnings (losses) for income tax purposes were as follows:
|
Investments
|
||||
|
Cost of investments for tax purposes
|
$
|
85,235,039
|
||
|
Gross tax unrealized appreciation
|
$
|
36,289,007
|
||
|
Gross tax unrealized depreciation
|
(1,722,007
|
)
|
||
|
Net tax unrealized appreciation/(depreciation)
|
$
|
34,567,000
|
||
|
Undistributed ordinary income
|
$
|
35,920
|
||
|
Undistributed long-term capital gains
|
7,590,292
|
|||
|
Total distributable earnings
|
$
|
7,626,212
|
||
|
Other accumulated gain/(loss)
|
$
|
—
|
||
|
Total accumulated gain/(loss)
|
$
|
42,193,212
|
||
The difference between book-basis unrealized appreciation/depreciation and tax-basis unrealized appreciation/depreciation (as shown above) is attributable primarily to wash sales.
As of October 31, 2021, the Fund had no tax-basis capital losses to offset future capital gains.
As of October 31, 2021, the Fund did not defer, on a tax basis, any late-year ordinary losses. Late-year ordinary losses are net ordinary losses incurred after December 31, 2020, but
within the taxable year, that are deemed to arise on the first day of the Fund’s next taxable year.
|
WWW.HENNESSYFUNDS.COM
|
28
|
NOTES TO THE FINANCIAL STATEMENTS
|
During fiscal year 2022 (year to date) and fiscal year 2021, the tax character of distributions paid by the Fund was as follows:
|
Six Months Ended
|
Year Ended
|
||||||||
|
April 30, 2022
|
October 31, 2021
|
||||||||
|
Ordinary income(1)
|
$
|
366,988
|
$
|
990,650
|
|||||
|
Long-term capital gains
|
7,590,293
|
6,349,146
|
|||||||
|
Total distributions
|
$
|
7,957,281
|
$
|
7,339,796
|
|||||
|
(1) Ordinary income includes short-term capital gains.
|
9). LIBOR TRANSITION
The Fund invests in financial instruments with payment obligations, financing terms, hedging strategies, or investment values based on, among other floating rates, the London Interbank Offered Rate
(“LIBOR”). Determined by the ICE Benchmark Administration, LIBOR is an average interest rate that banks charge one another for the use of short-term money. In 2017, the United Kingdom’s Financial Conduct Authority (the “FCA”), which
regulates LIBOR, announced plans to phase out the use of LIBOR by the end of 2021. Most LIBOR settings are no longer being published as of December 31, 2021, and the FCA and ICE Benchmark Administrator have announced that a majority
of U.S. dollar LIBOR settings will cease publication after June 30, 2023. The U.S. Federal Reserve has begun publishing the Secured Overnight Financing Rate (SOFR), which is intended to replace the U.S. dollar LIBOR. Other regulators
and industry groups around the world have announced or begun publishing proposed alternative reference rates for other currencies, but global consensus is lacking, and the process for amending many existing contracts or instruments to
transition away from LIBOR remains unclear. Uncertainty related to the liquidity impact of the change in reference rates and how to appropriately adjust these rates at the time of transition may lead to increased volatility and
illiquidity in markets tied to LIBOR, reduce the value of LIBOR-related instruments, and reduce the effectiveness of hedging strategies, which could adversely affect the Fund’s performance. Moreover, the risks associated with this
discontinuation and transition could be exacerbated if the work necessary to effect an orderly transition to an alternative reference rate is not completed in a timely manner. Accordingly, it is difficult to predict the full impact of
the transition away from LIBOR on the Fund until new reference rates and fallbacks for both legacy and new instruments and contracts are commercially accepted and market practices become settled.
10). EVENTS SUBSEQUENT TO PERIOD END
Management has evaluated the Fund’s related events and transactions that occurred subsequent to April 30, 2022, through the date of issuance of the Fund’s financial statements. Management has determined that
there were no subsequent events requiring recognition or disclosure in the financial statements.
|
HENNESSY FUNDS
|
1-800-966-4354
|
29
Expense Example (Unaudited)
April 30, 2022
As a shareholder of the Fund, you incur ongoing costs, including management fees, service fees, and other Fund expenses. This Example is intended to help you understand your ongoing costs (in dollars) of
investing in the Fund and to compare these costs with the ongoing costs of investing in other mutual funds. The Example is based on an investment of $1,000 invested at the beginning of the period and held for the entire period from
November 1, 2021, through April 30, 2022.
Actual Expenses
In the table below, the first line under each of the “Investor Class” and “Institutional Class” headings provides information about actual account values and actual expenses for each share class. You may use
this information, together with the amount you invested, to estimate the expenses that you paid over the period. Simply divide your account value by $1,000 (for example, an $8,600 account value divided by $1,000 = 8.6), then multiply
the result by the number in the first line under the heading “Expenses Paid During Period” to estimate the expenses you paid on your account during this period. Although the Fund charges no sales loads or transaction fees, you will be
assessed fees for outgoing wire transfers, returned checks, and stop payment orders at prevailing rates charged by U.S. Bank Global Fund Services, the Fund’s transfer agent. If you request that a redemption be made by wire transfer,
the Fund’s transfer agent charges a $15 fee. IRAs are charged a $15 annual maintenance fee (up to $30 maximum per shareholder for shareholders with multiple IRAs). The examples below include, but are not limited to, management,
shareholder servicing, accounting, custody, and transfer agent fees. However, the examples below do not include portfolio trading commissions and related expenses.
Hypothetical Example for Comparison Purposes
In the table below, the second line under each of the “Investor Class” and “Institutional Class” headings provides information about hypothetical account values and hypothetical expenses based on the Fund’s
actual expense ratio for each share class and an assumed rate of return of 5% per year before expenses, which is not the Fund’s actual return for such share class. The hypothetical account values and expenses may not be used to
estimate the actual ending account balance or expenses you paid for the period. You may use this information to compare the ongoing costs of investing in the Fund and other funds. To do so, compare these 5% hypothetical examples with
the 5% hypothetical examples that appear in the shareholder reports of the other funds. Please note that the expenses shown in the table are meant to highlight your ongoing costs only. Therefore, the second lines under “Investor
Class” and “Institutional Class” are useful in comparing ongoing costs only and will not help you determine the relative total costs of owning different funds.
|
WWW.HENNESSYFUNDS.COM
|
30
|
EXPENSE EXAMPLE
|
|
Beginning
|
Ending
|
||
|
Account Value
|
Account Value
|
Expenses Paid
|
|
|
November 1, 2021
|
April 30, 2022
|
During Period(1)
|
|
|
Investor Class
|
|||
|
Actual
|
$1,000.00
|
$ 918.00
|
$7.18
|
|
Hypothetical (5% return before expenses)
|
$1,000.00
|
$1,017.31
|
$7.55
|
|
Institutional Class
|
|||
|
Actual
|
$1,000.00
|
$ 920.00
|
$5.33
|
|
Hypothetical (5% return before expenses)
|
$1,000.00
|
$1,019.24
|
$5.61
|
|
1)
|
Expenses are equal to the Fund’s annualized expense ratio of 1.51% for Investor Class shares or 1.12% for Institutional Class shares, as applicable, multiplied by the average account value over the
period, multiplied by 181/365 days (to reflect the half-year period).
|
|
HENNESSY FUNDS
|
1-800-966-4354
|
31
How to Obtain a Copy of the Fund’s Proxy
Voting Policy and Proxy Voting Records
A description of the policies and procedures the Fund uses to determine how to vote proxies relating to portfolio securities is available without charge (1) by calling 800-966-4354, (2) on the Hennessy
Funds’ website at www.hennessyfunds.com/proxy-voting/voting-policy, or (3) on the U.S. Securities and Exchange Commission’s (the “SEC”) website at www.sec.gov. The Fund’s proxy voting record is available without charge on both the
Hennessy Funds’ website at www.hennessyfunds.com/proxy-voting/voting-record and the SEC’s website at www.sec.gov no later than August 31 for the prior 12 months ending June 30.
Availability of Quarterly Portfolio Schedule
The Fund files its complete schedule of portfolio holdings with the SEC for the first and third quarters of each fiscal year as an exhibit to its reports on Form N-PORT. The Fund’s Form N-PORT reports are
available on the SEC’s website at www.sec.gov or on request by calling 800-966-4354.
Federal Tax Distribution Information (Unaudited)
For fiscal year 2021, certain dividends paid by the Fund may be subject to a maximum tax rate of 23.8%, as provided for by the Jobs and Growth Tax Relief Reconciliation Act of 2003. The percentage of
dividends declared from ordinary income designated as qualified dividend income was 100.00%.
For corporate shareholders, the percent of ordinary income distributions that qualified for the corporate dividends received deduction for fiscal year 2021 was 100.00%.
The percentage of taxable ordinary income distributions that were designated as short-term capital gain distributions under Section 871(k)(2)(C) of the Internal Revenue Code of 1986, as
amended, for the Fund was 0.00%.
Important Notice Regarding Delivery
of Shareholder Documents
To help keep the Fund’s costs as low as possible, we generally deliver a single copy of shareholder reports, proxy statements, and prospectuses to shareholders who share an address and have the same last
name. This process does not apply to account statements. You may request an individual copy of a shareholder document at any time. If you would like to receive separate mailings of shareholder documents, please call U.S. Bank Global
Fund Services at 800-261-6950 or 414-765-4124, and individual delivery will begin within 30 days of your request. If your account is held through a financial institution or other intermediary, please contact such intermediary directly
to request individual delivery.
Electronic Delivery
As permitted by SEC regulations, the Fund’s shareholder reports are made available on a website, and unless you sign up for eDelivery or elect to receive paper copies as detailed below, you will be notified
each time a report is posted and provided with a website link to access the report.
The Fund also offers shareholders the option to receive all notices, account statements, prospectuses, tax forms, and shareholder reports electronically. To sign up for eDelivery or change
your delivery preference, please visit www.hennessyfunds.com/account.
To elect to receive paper copies of all future reports free of charge, please call U.S. Bank Global Fund Services at 800-261-6950 or 414-765-4124.
Subscribe to receive our team’s unique market and sector insights delivered to your inbox
www.hennessyfunds.com/subscribe
Follow us on social media
| |
|
|
WWW.HENNESSYFUNDS.COM
|
32
|
PROXY VOTING — BOARD APPROVAL OF INVESTMENT ADVISORY AGREEMENTS
|
Board Approval of Investment Advisory
Agreements
At its meeting on March 11, 2022, the Board of Trustees of the Fund (the “Board,” and the members thereof, the “Trustees”) unanimously approved the continuation of the investment advisory agreement of the
Fund with Hennessy Advisors, Inc. (the “Advisor”), the sub-advisory agreement for the equity allocation of the Fund between the Advisor and The London Company, LLC, and the sub-advisory agreement for the fixed income allocation of the
Fund between the Advisor and FCI Advisors (with The London Company, LLC and FCI Advisors each herein referred to individually as a “Sub-Advisor” and together as the “Sub-Advisors”). As part of the process, the Trustees reviewed their
fiduciary duties and the relevant factors for them to consider with respect to approving the advisory and sub-advisory agreements. In addition, the Trustees who are not deemed “interested persons” (as defined by the Investment Company
Act of 1940, as amended) of the Fund (the “Independent Trustees”) met in executive session to discuss the approval of the advisory and sub-advisory agreements. As part of their discussion, the Independent Trustees confirmed their
understanding of the need to have asked about, and received answers to, any matters that they believed are relevant to determining whether to approve the continuation of the advisory and sub-advisory agreements.
In advance of the meeting, the Advisor sent detailed information to the Trustees to assist them in their evaluation of the advisory and sub-advisory agreements. This information included,
but was not limited to, the following:
|
(1)
|
A memorandum from outside legal counsel that described the fiduciary duties of the Board with respect to approving the continuation of the advisory and sub-advisory agreements and the relevant
factors for consideration;
|
|
|
(2)
|
A memorandum from the Advisor that listed the factors relevant to the Board’s approval of the continuation of the advisory and sub-advisory agreements and also referenced the documents that had been
provided to help the Board assess each such factor;
|
|
|
(3)
|
The Advisor’s financial statements from its most recent Form 10-K and Form 10-Q;
|
|
|
(4)
|
Summaries of the advisory and sub-advisory agreements;
|
|
|
(5)
|
A recent Fund fact sheet, which included, among other things, Fund performance over various periods;
|
|
|
(6)
|
A description of the range of services provided by the Advisor and the Sub-Advisors and the distinction between the Advisor-provided services and the Sub-Advisor-provided services;
|
|
|
(7)
|
A peer expense comparison of the net expense ratio and investment advisory fee of the Fund;
|
|
|
(8)
|
A memorandum from the Advisor regarding economies of scale;
|
|
|
(9)
|
A completed questionnaire from each Sub-Advisor;
|
|
|
(10)
|
Summaries of each Sub-Advisor’s questionnaire and relevant information from such Sub-Advisor’s Form ADV Parts I and II;
|
|
|
(11)
|
Financial information for the holding company of each Sub-Advisor; and
|
|
|
(12)
|
Each Sub-Advisor’s Code of Ethics.
|
The Trustees reviewed and discussed all of the information provided by the Advisor and the Sub-Advisors. Following this review, and further discussion with the Advisor, the
|
HENNESSY FUNDS
|
1-800-966-4354
|
33
Trustees concluded that the information provided before and at the meeting addressed all of the relevant matters that they wanted to consider in assessing the performance of the Funds and the performance of
the Advisor and the Sub-Advisors under the advisory and sub-advisory agreements, and that said information provided them with a fulsome understanding of the advisory and sub-advisory agreements and the services provided by the Advisor
and the Sub-Advisors.
All of the factors discussed were considered as a whole by the Trustees, as well as by the Independent Trustees meeting in executive session. The Trustees viewed the relevant factors in
their totality, with no single factor being the principal or determinative factor in the Trustees’ determination of whether to approve the continuation of the advisory and sub-advisory agreements. The Trustees recognized that the
management and fee arrangements for the Fund are the result of years of review and discussion between the Independent Trustees and the Advisor, that certain aspects of such arrangements may receive greater scrutiny in some years than
in others, and that the Trustees’ conclusions may be based, in part, on their consideration of these same arrangements and information received during the course of the year and in prior years.
Prior to approving the continuation of the advisory and sub-advisory agreements, the Trustees, including the Independent Trustees in executive session, considered, among other items:
|
(1)
|
The nature and quality of the advisory services provided by the Advisor and the Sub-Advisors;
|
|
|
(2)
|
A comparison of the fees and expenses of the Fund to other similar funds;
|
|
|
(3)
|
Whether economies of scale are recognized by the Fund;
|
|
|
(4)
|
The costs and profitability of the Fund to the Advisor and the Sub-Advisors;
|
|
|
(5)
|
The performance of the Fund; and
|
|
|
(6)
|
Any benefits to the Advisor and the Sub-Advisors from serving as an investment advisor to the Fund (other than the advisory and sub-advisory fees).
|
The material considerations and determinations of the Trustees, including the Independent Trustees, were as follows:
|
(1)
|
The Trustees considered the services identified below that are provided by the Advisor. Based on this review and an assessment of the Advisor’s performance, the Trustees concluded that the Advisor
provides high-quality services to the Fund, and they noted that their overall confidence in the Advisor was high. The Trustees also concluded that they were satisfied with the nature, extent, and quality of the advisory
services provided to the Fund by the Advisor and that the nature and extent of the services provided by the Advisor were appropriate to assure that the Fund’s operations are conducted in compliance with applicable laws, rules,
and regulations.
|
|
(a)
|
The Advisor oversees the Sub-Advisors for the Fund, and the Sub-Advisors act as the portfolio managers for the Fund by providing portfolio management services.
|
||
|
(b)
|
The Advisor performs a daily reconciliation of portfolio positions and cash for the Fund.
|
||
|
(c)
|
The Advisor monitors the liquidity of each Fund.
|
||
|
(d)
|
The Advisor monitors the Fund’s compliance with its investment objectives and restrictions and federal securities laws.
|
|
WWW.HENNESSYFUNDS.COM
|
34
|
BOARD APPROVAL OF INVESTMENT ADVISORY AGREEMENTS
|
|
(e)
|
The Advisor maintains a compliance program (including a code of ethics), conducts ongoing reviews of the compliance programs of the Sub-Advisors and the Fund’s other service providers (including
their codes of ethics, as appropriate), conducts on-site visits to the Sub-Advisors and the Fund’s other service providers, as feasible, monitors incidents of abusive trading practices, reviews Fund expense accruals, payments,
and fixed expense ratios, evaluates insurance providers for fidelity bond, D&O/E&O insurance, and cybersecurity insurance coverage, manages regulatory examination compliance and responses, conducts employee compliance
training, reviews reports provided by service providers, and maintains books and records.
|
||
|
(f)
|
The Advisor oversees the selection and continued employment of each Sub-Advisor, reviews the Fund’s investment performance, and monitors each Sub-Advisor’s adherence to the Fund’s investment
objectives, policies, and restrictions.
|
||
|
(g)
|
The Advisor oversees service providers that provide accounting, administration, distribution, transfer agency, custodial, sales, marketing, public relations, audit, information technology, and legal
services to the Fund.
|
||
|
(h)
|
The Advisor maintains in-house marketing and distribution departments on behalf of the Fund.
|
||
|
(i)
|
The Advisor prepares or directs the preparation of all regulatory filings for the Fund, including writing and annually updating the Fund’s prospectus and related documents.
|
||
|
(j)
|
For each annual report of the Fund, the Advisor reviews the written summaries prepared by the Sub-Advisors of the Fund’s performance during the most recent 12-month period.
|
||
|
(k)
|
The Advisor oversees distribution of the Fund through third-party broker/dealers and independent financial institutions such as Charles Schwab, Inc., Fidelity, TD Ameritrade, and Pershing. The
Advisor participates in “no transaction fee” (“NTF”) programs with these companies on behalf of the Fund, which allow customers to purchase the Fund through third-party distribution channels without paying a transaction fee.
The Advisor compensates, in part, a number of these third-party providers of NTF programs out of its own revenues.
|
||
|
(l)
|
The Advisor pays the incentive compensation of the Fund’s compliance officers and employs other staff, such as legal, marketing, national accounts, distribution, sales, administrative, and trading
oversight personnel, as well as management executives.
|
||
|
(m)
|
The Advisor provides a quarterly compliance certification to the Board.
|
||
|
(n)
|
The Advisor prepares or reviews all Board materials, presents to and leads discussions with the Board, prepares or reviews all meeting minutes, and arranges for Board training and education.
|
|
(2)
|
The Trustees considered the services identified below that are provided by each Sub-Advisor. Based on this review and an assessment of each Sub-Advisor’s performance, the Trustees concluded that each
Sub-Advisor provides high-quality services to the Fund. The Trustees also concluded that they were satisfied with
|
|
HENNESSY FUNDS
|
1-800-966-4354
|
35
|
the nature, extent, and quality of the advisory services provided to the Fund by each Sub-Advisor and that the nature and extent of the services provided by each Sub-Advisor were appropriate to
assure that the Fund’s portfolio aligns properly with its investment objective and principal investment strategies.
|
|
(a)
|
Each Sub-Advisor acts as the portfolio manager for the Fund. In this capacity, each Sub-Advisor does the following:
|
|
(i)
|
manages the composition of the Fund’s portfolio, including the purchase, retention, and disposition of portfolio securities in accordance with the Fund’s investment objectives, policies, and
restrictions;
|
|||
|
(ii)
|
seeks best execution for the Fund’s portfolio; and
|
|||
|
(iii)
|
manages proxy voting for the Fund.
|
|
(b)
|
Each Sub-Advisor ensures that its compliance program includes policies and procedures relevant to the Fund and the Sub-Advisor’s duties as a portfolio manager to the Fund.
|
||
|
(c)
|
For each annual report of the Fund, each Sub-Advisor prepares a written summary of the Fund’s performance (with respect to the equity allocation or the fixed income allocation, as applicable) during
the most recent 12-month period.
|
||
|
(d)
|
Each Sub-Advisor provides a quarterly compliance certification to the Board regarding trading and allocation practices, supervisory matters, the Sub-Advisor’s compliance program (including its code
of ethics), compliance with the Fund’s policies, and general firm updates.
|
|
(3)
|
Trustees considered the distinction between the services performed by the Advisor and the Sub-Advisors. The Trustees noted that the management of the Fund, including the oversight of the
Sub-Advisors, involves more comprehensive and substantive duties than the duties of the Sub-Advisors. Specifically, the Trustees considered the lists of Advisor services previously identified and concluded that the services
performed by the Advisor for the Fund require a higher level of service and oversight than the services performed by the Sub-Advisors. Based on this determination, the Trustees concluded that the differential in advisory fees
between the Advisor and the Sub-Advisors is reasonable.
|
|
|
(4)
|
The Trustees compared the performance of the Fund to benchmark indices over various periods and noted that the Trustees review and discuss reports comparing the investment performance of the Fund to
various indices at each quarterly Board meeting. Based on such information, the Trustees determined that the Advisor and the Sub-Advisors manage the Fund in a manner materially consistent with its stated investment objective
and style. The Trustees concluded that the performance of the Fund over various periods warranted the continuation of the advisory and sub-advisory agreements.
|
|
|
(5)
|
The Trustees reviewed the advisory fees and overall expense ratios of the Fund compared to other funds similar in asset size and investment objective to the Fund using data from Morningstar. As part
of the discussion with management, the Trustees ensured that they understood and were comfortable with the criteria used to determine the mutual funds included in the Morningstar categories for purposes of the materials
considered at the meeting. The Trustees determined that the advisory fee and overall expense ratio of the Fund falls
|
|
WWW.HENNESSYFUNDS.COM
|
36
|
BOARD APPROVAL OF INVESTMENT ADVISORY AGREEMENTS
|
|
within a reasonable range of the advisory fees and overall expense ratios of other comparable funds and concluded that they are reasonable and warranted continuation of the advisory and sub-advisory
agreements.
|
||
|
(6)
|
The Trustees also considered whether the Advisor was realizing economies of scale that should be shared with the Fund’s shareholders. The Trustees noted that the majority of expenses incurred to
manage the Fund are variable asset-based fees, so the Advisor does not realize material economies of scale relating to these expenses as the assets of the Fund increase. For example, third-party platform fees and sub-advisory
fees increase as the Fund’s assets grow.
|
|
|
(7)
|
The Trustees considered the profitability of the Advisor and the Sub-Advisors, including the impact of mutual fund platform fees on the Advisor’s profitability, and also considered the resources and
revenues that the Advisor has put into managing and distributing the Fund. The Trustees then concluded that the profits of the Advisor and the Sub-Advisors are reasonable and not excessive when compared to profitability
guidelines set forth in relevant court cases.
|
|
|
(8)
|
The Trustees considered the high level of professionalism and knowledge of the Advisor’s employees and concluded that this was beneficial to the Fund and its shareholders.
|
|
|
(9)
|
The Trustees considered any benefits to the Advisor and the Sub-Advisors from serving as an advisor to the Fund (other than the advisory and sub-advisory fees). The Trustees noted that the Advisor
and the Sub-Advisors may derive ancillary benefits from, by way of example, their association with the Fund in the form of proprietary and third-party research products and services received from broker-dealers that execute
portfolio trades for the Fund. The Trustees determined that any such products and services have been used for legitimate purposes relating to the Fund by providing assistance in the investment decision-making process. The
Trustees concluded that any additional benefits realized by the Advisor and the Sub-Advisors from their relationship with the Fund were reasonable, which was based on, among other things, the Trustees’ findings that (i) the
research, analytical, statistical, and other information and services provided by brokers are merely supplemental to the Advisor’s and the Sub-Advisors’ own efforts in the performance of their duties under the advisory and
sub-advisory agreements and (ii) although the Sub-Advisors could derive benefits from the conversion of Fund shareholders into separate account clients, the Fund also could benefit from potential institutional shareholders who
might choose to invest in the Fund.
|
After reviewing the materials and information provided at the meeting, as well as other information regularly provided at the Board’s quarterly meetings throughout the year regarding the
quality of services provided by the Advisor and the Sub-Advisors, the performance of the Fund, expense information, brokerage commissions information, the adequacy and efficacy of the Advisor’s and the Sub-Advisors’ written policies
and procedures, other regulatory compliance issues, trading information and related matters, and other factors that the Trustees deemed relevant, the Trustees, including the Independent Trustees, approved the continuation of the
advisory and sub-advisory agreements.
|
HENNESSY FUNDS
|
1-800-966-4354
|
37
For information, questions, or assistance, please call
The Hennessy Funds
800-966-4354 or 415-899-1555
INVESTMENT ADVISOR
Hennessy Advisors, Inc.
7250 Redwood Boulevard, Suite 200
Novato, California 94945
ADMINISTRATOR,
TRANSFER AGENT,
DIVIDEND PAYING AGENT, &
SHAREHOLDER SERVICING AGENT
U.S. Bancorp Fund Services, LLC
d/b/a U.S. Bank Global Fund Services
P.O. Box 701
Milwaukee, Wisconsin 53201-0701
CUSTODIAN
U.S. Bank N.A.
Custody Operations
1555 North River Center Drive, Suite 302
Milwaukee, Wisconsin 53212
TRUSTEES
Neil J. Hennessy
J. Dennis DeSousa
Robert T. Doyle
Claire Garvie
Gerald P. Richardson
COUNSEL
Foley & Lardner LLP
777 East Wisconsin Avenue
Milwaukee, Wisconsin 53202-5306
INDEPENDENT REGISTERED
PUBLIC ACCOUNTING FIRM
Tait, Weller & Baker LLP
Two Liberty Place
50 South 16th Street, Suite 2900
Philadelphia, Pennsylvania 19102-2529
DISTRIBUTOR
Quasar Distributors, LLC
111 East Kilbourn Avenue, Suite 1250
Milwaukee, Wisconsin 53202
www.hennessyfunds.com | 800-966-4354
This report has been prepared for shareholders and may be distributed to
others only if preceded or accompanied by a current prospectus.
SEMI-ANNUAL REPORT
APRIL 30, 2022
HENNESSY BALANCED FUND
Investor Class HBFBX
www.hennessyfunds.com | 1-800-966-4354
(This Page Intentionally Left Blank.)
Contents
|
Letter to Shareholders
|
2
|
|
Performance Overview
|
4
|
|
Financial Statements
|
|
|
Schedule of Investments
|
5
|
|
Statement of Assets and Liabilities
|
8
|
|
Statement of Operations
|
9
|
|
Statements of Changes in Net Assets
|
11
|
|
Financial Highlights
|
12
|
|
Notes to the Financial Statements
|
14
|
|
Expense Example
|
21
|
|
Proxy Voting Policy and Proxy Voting Records
|
22
|
|
Availability of Quarterly Portfolio Schedule
|
22
|
|
Federal Tax Distribution Information
|
22
|
|
Important Notice Regarding Delivery of Shareholder Documents
|
22
|
|
Electronic Delivery
|
22
|
|
Board Approval of Investment Advisory Agreement
|
23
|
|
HENNESSY FUNDS
|
1-800-966-4354
|
May 2022
Dear Hennessy Funds Shareholder:
We’d like to start our semi-annual letter with a pause. At the end of 2021, we looked forward to a new year – a potentially calmer year – having come through almost
two full years of the coronavirus pandemic. As people, we were aware our lives had changed, but we hoped for a better 2022; as investors, we were aware that the economy was strong and employment was robust, yet challenges loomed,
including inflation, supply chain disruptions, and tightening monetary policy; as employees, students, and family members, we recognized much was different, but we sought a return to what’s familiar. What we didn’t know was that a
world leader who controls one of the largest militaries on the planet was about to start one of the worst atrocities in Europe since World War II. Our thoughts are with the Ukrainian people, and our hope is for this unjustified,
senseless human tragedy to end quickly.
The equity market started 2022 on a high note, with the S&P 500® Index hitting an all-time high on the first trading day of the year. This turned out to be the last hurrah for a market that saw a continuous march higher in
2021, having hit 70 new all-time highs, with a new all-time high being recorded on average every three and a half days. Concerns in the market then coalesced and overpowered bullish sentiment, and the market has spiraled lower
throughout 2022. Factors that drove the market lower include: tightening monetary policy as the Federal Reserve has begun raising rates and has announced plans for shrinking its $8.5 trillion asset portfolio; inflation, higher
energy costs, and their effects on the domestic and global economies; continued supply chain disruptions; investors’ indiscriminate liquidation of broad-based ETFs and index funds and the detrimental effect on equities; and the
near-term and long-term global implications of the Russian invasion of Ukraine.
While markets are adjusting, many positive conditions remain intact. Corporate balance sheets and profits remain strong, GDP growth remains
positive, the consumer continues to show resilience in the face of rising prices, cash is abundant both at the corporate and household levels, unemployment is exceptionally low, and our financial system remains healthy. Markets are
also experiencing a change in leadership, as value stocks have been outperforming growth stocks, and traditionally defensive sectors such as Utilities and Consumer Staples have been outperforming the broader market. Finally, the
Energy sector has soared in 2022, as companies reap the benefits of dramatically higher oil and natural gas prices, and shareholders are rewarded with significantly higher dividends, aggressive buybacks, and higher stock prices
after many years of underperformance for the sector.
With history as our guide, we are hopeful that eventually the market may bottom and head higher again. Since the financial crisis of 2008, we have
experienced many corrections and many recoveries to new highs. The Dow Jones Industrial Average has dropped over 10% eight times, including the current drop, for a median decline of 14.00%, and on average, it took 45 trading days to
drop from peak to trough and 127 trading days to return to the previous peak. Since the current drop has taken longer to go from peak to its recent trough, it may take some time for a recovery in prices to truly take hold.
On a positive note, valuations have come in, and many stocks have become more attractive, especially for longer-term investors. We note, however,
that the concept of “historically cheap stocks” does not, on its own, move the market higher. Rather, it is
|
WWW.HENNESSYFUNDS.COM
|
2
|
LETTER TO SHAREHOLDERS
|
overall capitulation and improving fundamentals that could bring buyers back into the market and reverse any bearish trends. Investors need to see improving company earnings, retreating inflationary
trends, a measured pace of interest rate increases globally that does not cause significant economic contraction, hope for a more peaceful and orderly world economic system unconstrained by supply bottlenecks and other hindrances to
global trade, and, most importantly, a subsidence of the deleterious effects of the coronavirus pandemic. While that may seem like a “tall order,” we believe that patient investing, focusing on value, quality, and downside risk
mitigation, works well over the longer term.
During this tumultuous period, performance of the majority of the Hennessy Funds has been relatively strong when compared to the overall market as well
as to our benchmarks. During the six months ended April 30, 2022, the Dow Jones Industrial Average, the S&P 500® Index, and the NASDAQ
Composite Index dropped 7.05%, 9.65%, and 20.15%, respectively, on a total return basis. During this period when these three major indices saw significant declines, we were pleased that seven of our 16 Funds posted positive total
returns, 10 of our 14 domestic Funds outperformed the S&P 500® Index, and over half of our active funds outperformed their primary benchmarks.
We thank you, our shareholders, for your continued interest in our family of Funds. We are grateful for the trust you put in us, and we will
continue to strive to manage our portfolios for long-term performance, ever mindful of downside risk. While volatility and uncertainty may impact the markets in the short-term, we encourage investors to stay the course, maintain a
diversified portfolio, and keep a long-term perspective. If you have any questions or would like to speak with us, please don’t hesitate to call us directly at (800) 966-4354. In closing, we would also like to thank all of the
healthcare and frontline workers that have worked – and still work – tirelessly throughout the coronavirus pandemic.
Best regards,
|
|
|
|
|
Ryan C. Kelley, CFA
|
|
|
Chief Investment Officer,
|
|
|
Senior Vice President, and Portfolio Manager
|
Past performance does not guarantee future results.
Mutual fund investing involves risk. Principal loss is possible.
Opinions expressed are those of Ryan C. Kelley and are subject to change, are not guaranteed, and should not be considered investment advice.
The Dow Jones Industrial Average and S&P 500® Index are commonly used to measure the performance of U.S. stocks. The
NASDAQ Composite Index comprises all common stocks listed on The NASDAQ Stock Market and is commonly used to measure the performance of technology-related stocks. The indices are used herein for comparative purposes in accordance
with SEC regulations. One cannot invest directly in an index. All returns are shown on a total return basis.
Please refer to the Performance Overview section for more detailed performance information.
|
HENNESSY FUNDS
|
1-800-966-4354
|
3
Performance Overview (Unaudited)
AVERAGE ANNUAL TOTAL RETURN FOR PERIODS ENDED APRIL 30, 2022
|
Six
|
One
|
Five
|
Ten
|
|
|
Months(1)
|
Year
|
Years
|
Years
|
|
|
Hennessy Balanced Fund (HBFBX)
|
1.42%
|
0.95%
|
4.15%
|
4.57%
|
|
50/50 Blended DJIA/Treasury Index
|
-4.03%
|
-0.80%
|
6.80%
|
6.59%
|
|
Dow Jones Industrial Average
|
-7.05%
|
-0.82%
|
11.96%
|
12.20%
|
Expense ratio: 1.85%
|
(1)
|
Periods of less than one year are not annualized.
|
_______________
Performance data quoted represents past performance; past performance does not guarantee future results. The investment return and principal value of an investment will fluctuate so
that an investor’s shares, when redeemed, may be worth more or less than their original cost. The performance table does not reflect the deduction of taxes that a shareholder would pay on Fund distributions or the redemption of Fund
shares. Current performance of the Fund may be lower or higher than the performance quoted. Performance data current to the most recent month end may be obtained by visiting www.hennessyfunds.com.
The 50/50 Blended DJIA/Treasury Index consists of 50% common stocks represented by the Dow Jones Industrial Average and 50% short-duration Treasury securities represented by the ICE BofAML 1-Year U.S.
Treasury Note Index, which comprises U.S. Treasury securities maturing in approximately one year. The Dow Jones Industrial Average is a price-weighted average of 30 significant stocks traded on the New York Stock Exchange or The
Nasdaq Stock Market LLC. One cannot invest directly in an index. These indices are used for comparative purposes in accordance with Securities and Exchange Commission regulations.
The expense ratio presented is from the most recent prospectus. The expense ratio for the current reporting period is available in the Financial Highlights section of this report.
|
WWW.HENNESSYFUNDS.COM
|
4
|
PERFORMANCE OVERVIEW/SCHEDULE OF INVESTMENTS
|
Financial Statements
|
Schedule of Investments as of April 30, 2022 (Unaudited)
|
HENNESSY BALANCED FUND
(% of Net Assets)
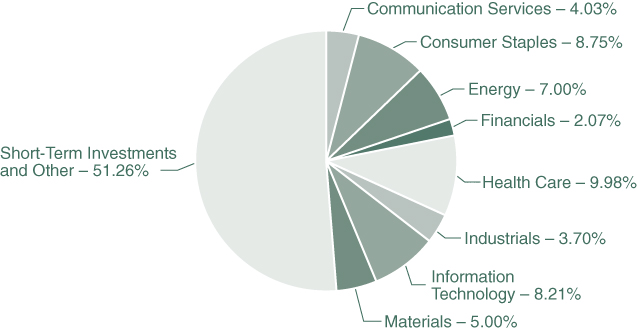
|
TOP TEN HOLDINGS (EXCLUDING MONEY MARKET FUNDS)
|
% NET ASSETS
|
|
U.S. Treasury Bill, 0.630%, 01/26/2023
|
17.12%
|
|
U.S. Treasury Bill, 0.450%, 06/16/2022
|
9.01%
|
|
Chevron Corp.
|
7.00%
|
|
U.S. Treasury Bill, 0.240%, 12/01/2022
|
6.87%
|
|
Merck & Co., Inc.
|
5.38%
|
|
Dow, Inc.
|
5.00%
|
|
The Coca-Cola Co.
|
4.97%
|
|
U.S. Treasury Bill, 0.440%, 05/19/2022
|
4.85%
|
|
U.S. Treasury Bill, 1.420%, 11/03/2022
|
4.82%
|
|
International Business Machines Corp.
|
4.72%
|
Note: For presentation purposes, the Fund has grouped some of the industry categories. For purposes of categorizing securities for compliance with Section 8(b)(1) of the Investment Company Act of 1940, as
amended, the Fund uses more specific industry classifications.
The Global Industry Classification Standard (GICS®) was developed by and is the exclusive property and a service mark of
MSCI, Inc. and Standard & Poor’s Financial Services LLC. It has been licensed for use by the Hennessy Funds.
|
HENNESSY FUNDS
|
1-800-966-4354
|
5
|
COMMON STOCKS – 48.74%
|
Number
|
% of
|
||||||||||
|
|
of Shares
|
Value
|
Net Assets
|
|||||||||
|
Communication Services – 4.03%
|
||||||||||||
|
Verizon Communications, Inc.
|
12,550
|
$
|
581,065
|
4.03
|
%
|
|||||||
|
|
||||||||||||
|
Consumer Staples – 8.75%
|
||||||||||||
|
The Coca-Cola Co.
|
11,100
|
717,171
|
4.97
|
%
|
||||||||
|
Walgreens Boots Alliance, Inc.
|
12,850
|
544,840
|
3.78
|
%
|
||||||||
|
|
1,262,011
|
8.75
|
%
|
|||||||||
|
Energy – 7.00%
|
||||||||||||
|
Chevron Corp.
|
6,450
|
1,010,521
|
7.00
|
%
|
||||||||
|
|
||||||||||||
|
Financials – 2.07%
|
||||||||||||
|
JPMorgan Chase & Co.
|
2,500
|
298,400
|
2.07
|
%
|
||||||||
|
|
||||||||||||
|
Health Care – 9.98%
|
||||||||||||
|
Amgen, Inc.
|
2,850
|
664,591
|
4.60
|
%
|
||||||||
|
Merck & Co., Inc.
|
8,750
|
776,038
|
5.38
|
%
|
||||||||
|
|
1,440,629
|
9.98
|
%
|
|||||||||
|
Industrials – 3.70%
|
||||||||||||
|
3M Co.
|
3,700
|
533,614
|
3.70
|
%
|
||||||||
|
Information Technology – 8.21%
|
||||||||||||
|
Cisco Systems, Inc.
|
10,300
|
504,494
|
3.49
|
%
|
||||||||
|
International Business Machines Corp.
|
5,150
|
680,882
|
4.72
|
%
|
||||||||
|
|
1,185,376
|
8.21
|
%
|
|||||||||
|
Materials – 5.00%
|
||||||||||||
|
Dow, Inc.
|
10,850
|
721,525
|
5.00
|
%
|
||||||||
|
|
||||||||||||
|
Total Common Stocks
|
||||||||||||
|
(Cost $6,136,350)
|
7,033,141
|
48.74
|
%
|
|||||||||
The accompanying notes are an integral part of these financial statements.
|
WWW.HENNESSYFUNDS.COM
|
6
|
SCHEDULE OF INVESTMENTS
|
|
SHORT-TERM INVESTMENTS – 51.34%
|
Number of Shares/
|
% of
|
||||||||||
|
|
Par Amount
|
Value
|
Net Assets
|
|||||||||
|
Money Market Funds – 3.18%
|
||||||||||||
|
First American Government Obligations
|
||||||||||||
|
Fund, Institutional Class, 0.22% (a)
|
459,561
|
$
|
459,561
|
3.18
|
%
|
|||||||
|
U.S. Treasury Bills – 48.16%
|
||||||||||||
|
0.440%, 05/19/2022 (b)
|
700,000
|
699,988
|
4.85
|
%
|
||||||||
|
0.450%, 06/16/2022 (b)
|
1,300,000
|
1,299,892
|
9.01
|
%
|
||||||||
|
0.785%, 07/14/2022 (b)
|
300,000
|
299,529
|
2.08
|
%
|
||||||||
|
1.420%, 11/03/2022 (b)
|
700,000
|
695,007
|
4.82
|
%
|
||||||||
|
0.240%, 12/01/2022 (b)
|
1,000,000
|
991,761
|
6.87
|
%
|
||||||||
|
0.630%, 01/26/2023 (b)
|
2,500,000
|
2,469,756
|
17.12
|
%
|
||||||||
|
1.590%, 03/23/2023 (b)
|
500,000
|
491,973
|
3.41
|
%
|
||||||||
|
|
6,947,906
|
48.16
|
%
|
|||||||||
|
|
||||||||||||
|
Total Short-Term Investments
|
||||||||||||
|
(Cost $7,436,818)
|
7,407,467
|
51.34
|
%
|
|||||||||
|
|
||||||||||||
|
Total Investments
|
||||||||||||
|
(Cost $13,573,168) – 100.08%
|
14,440,608
|
100.08
|
%
|
|||||||||
|
Liabilities in Excess of Other Assets – (0.08)%
|
(11,219
|
)
|
(0.08
|
)%
|
||||||||
|
|
||||||||||||
|
TOTAL NET ASSETS – 100.00%
|
$
|
14,429,389
|
100.00
|
%
|
||||||||
Percentages are stated as a percent of net assets.
|
(a)
|
The rate listed is the fund’s seven-day yield as of April 30, 2022.
|
|
(b)
|
The rate listed is the discount rate at issue.
|
Summary of Fair Value Exposure as of April 30, 2022
The following is a summary of the inputs used to value the Fund’s net assets as of April 30, 2022 (see Note 3 in the accompanying Notes to the Financial Statements):
|
Common Stocks
|
Level 1
|
Level 2
|
Level 3
|
Total
|
||||||||||||
|
Communication Services
|
$
|
581,065
|
$
|
—
|
$
|
—
|
$
|
581,065
|
||||||||
|
Consumer Staples
|
1,262,011
|
—
|
—
|
1,262,011
|
||||||||||||
|
Energy
|
1,010,521
|
—
|
—
|
1,010,521
|
||||||||||||
|
Financials
|
298,400
|
—
|
—
|
298,400
|
||||||||||||
|
Health Care
|
1,440,629
|
—
|
—
|
1,440,629
|
||||||||||||
|
Industrials
|
533,614
|
—
|
—
|
533,614
|
||||||||||||
|
Information Technology
|
1,185,376
|
—
|
—
|
1,185,376
|
||||||||||||
|
Materials
|
721,525
|
—
|
—
|
721,525
|
||||||||||||
|
Total Common Stocks
|
$
|
7,033,141
|
$
|
—
|
$
|
—
|
$
|
7,033,141
|
||||||||
|
Short-Term Investments
|
||||||||||||||||
|
Money Market Funds
|
$
|
459,561
|
$
|
—
|
$
|
—
|
$
|
459,561
|
||||||||
|
U.S. Treasury Bills
|
—
|
6,947,906
|
—
|
6,947,906
|
||||||||||||
|
Total Short-Term Investments
|
$
|
459,561
|
$
|
6,947,906
|
$
|
—
|
$
|
7,407,467
|
||||||||
|
Total Investments
|
$
|
7,492,702
|
$
|
6,947,906
|
$
|
—
|
$
|
14,440,608
|
||||||||
The accompanying notes are an integral part of these financial statements.
|
HENNESSY FUNDS
|
1-800-966-4354
|
7
Financial Statements
|
Statement of Assets and Liabilities as of April 30, 2022 (Unaudited)
|
|
ASSETS:
|
||||
|
Investments in securities, at value (cost $13,573,168)
|
$
|
14,440,608
|
||
|
Dividends and interest receivable
|
10,618
|
|||
|
Receivable for fund shares sold
|
200
|
|||
|
Prepaid expenses and other assets
|
13,875
|
|||
|
Total assets
|
14,465,301
|
|||
|
LIABILITIES:
|
||||
|
Payable to advisor
|
7,262
|
|||
|
Payable to administrator
|
4,273
|
|||
|
Payable to auditor
|
11,228
|
|||
|
Accrued distribution fees
|
1,966
|
|||
|
Accrued service fees
|
1,210
|
|||
|
Accrued trustees fees
|
6,218
|
|||
|
Accrued expenses and other payables
|
3,755
|
|||
|
Total liabilities
|
35,912
|
|||
|
NET ASSETS
|
$
|
14,429,389
|
||
|
NET ASSETS CONSIST OF:
|
||||
|
Capital stock
|
$
|
13,557,813
|
||
|
Total distributable earnings
|
871,576
|
|||
|
Total net assets
|
$
|
14,429,389
|
||
|
NET ASSETS:
|
||||
|
Investor Class
|
||||
|
Shares authorized (no par value)
|
Unlimited
|
|||
|
Net assets applicable to outstanding shares
|
$
|
14,429,389
|
||
|
Shares issued and outstanding
|
1,191,149
|
|||
|
Net asset value, offering price, and redemption price per share
|
$
|
12.11
|
||
The accompanying notes are an integral part of these financial statements.
|
WWW.HENNESSYFUNDS.COM
|
8
|
STATEMENT OF ASSETS AND LIABILITIES/STATEMENT OF OPERATIONS
|
Financial Statements
|
Statement of Operations for the six months ended April 30, 2022 (Unaudited)
|
|
INVESTMENT INCOME:
|
||||
|
Dividend income
|
$
|
132,883
|
||
|
Interest income
|
8,235
|
|||
|
Total investment income
|
141,118
|
|||
|
EXPENSES:
|
||||
|
Investment advisory fees (See Note 5)
|
41,433
|
|||
|
Compliance expense (See Note 5)
|
15,156
|
|||
|
Administration, accounting, custody, and transfer agent fees (See Note 5)
|
13,467
|
|||
|
Audit fees
|
11,222
|
|||
|
Distribution fees – Investor Class (See Note 5)
|
10,358
|
|||
|
Federal and state registration fees
|
9,867
|
|||
|
Trustees’ fees and expenses
|
8,394
|
|||
|
Service fees – Investor Class (See Note 5)
|
6,905
|
|||
|
Sub-transfer agent expenses – Investor Class (See Note 5)
|
3,414
|
|||
|
Reports to shareholders
|
2,896
|
|||
|
Legal fees
|
88
|
|||
|
Interest expense (See Note 7)
|
40
|
|||
|
Other expenses
|
2,265
|
|||
|
Total expenses
|
125,505
|
|||
|
NET INVESTMENT INCOME
|
$
|
15,613
|
||
|
REALIZED AND UNREALIZED GAINS (LOSSES):
|
||||
|
Net realized gain on investments
|
$
|
14,815
|
||
|
Net change in unrealized appreciation/depreciation on investments
|
146,245
|
|||
|
Net gain on investments
|
161,060
|
|||
|
NET INCREASE IN NET ASSETS RESULTING FROM OPERATIONS
|
$
|
176,673
|
||
The accompanying notes are an integral part of these financial statements.
|
HENNESSY FUNDS
|
1-800-966-4354
|
9
(This Page Intentionally Left Blank.)
|
WWW.HENNESSYFUNDS.COM
|
10
|
STATEMENTS OF CHANGES IN NET ASSETS
|
Financial Statements
|
Statements of Changes in Net Assets
|
|
Six Months Ended
|
||||||||
|
April 30, 2022
|
Year Ended
|
|||||||
|
(Unaudited)
|
October 31, 2021
|
|||||||
|
OPERATIONS:
|
||||||||
|
Net investment income
|
$
|
15,613
|
$
|
22,631
|
||||
|
Net realized gain on investments
|
14,815
|
528,693
|
||||||
|
Net change in unrealized
|
||||||||
|
appreciation/depreciation on investments
|
146,245
|
1,167,646
|
||||||
|
Net increase in net assets resulting from operations
|
176,673
|
1,718,970
|
||||||
|
DISTRIBUTIONS TO SHAREHOLDERS:
|
||||||||
|
Distributable earnings – Investor Class
|
(485,416
|
)
|
(35,846
|
)
|
||||
|
Total distributions
|
(485,416
|
)
|
(35,846
|
)
|
||||
|
CAPITAL SHARE TRANSACTIONS:
|
||||||||
|
Proceeds from shares subscribed – Investor Class
|
1,323,647
|
1,324,997
|
||||||
|
Dividends reinvested – Investor Class
|
481,808
|
35,297
|
||||||
|
Cost of shares redeemed – Investor Class
|
(598,519
|
)
|
(1,500,429
|
)
|
||||
|
Net increase (decrease) in net assets derived
|
||||||||
|
from capital share transactions
|
1,206,936
|
(140,135
|
)
|
|||||
|
TOTAL INCREASE IN NET ASSETS
|
898,193
|
1,542,989
|
||||||
|
NET ASSETS:
|
||||||||
|
Beginning of period
|
13,531,196
|
11,988,207
|
||||||
|
End of period
|
$
|
14,429,389
|
$
|
13,531,196
|
||||
|
CHANGES IN SHARES OUTSTANDING:
|
||||||||
|
Shares sold – Investor Class
|
107,959
|
107,079
|
||||||
|
Shares issued to holders as reinvestment
|
||||||||
|
of dividends – Investor Class
|
40,546
|
2,986
|
||||||
|
Shares redeemed – Investor Class
|
(49,361
|
)
|
(124,203
|
)
|
||||
|
Net increase (decrease) in shares outstanding
|
99,144
|
(14,138
|
)
|
|||||
The accompanying notes are an integral part of these financial statements.
|
HENNESSY FUNDS
|
1-800-966-4354
|
11
Financial Statements
|
Financial Highlights
|
For an Investor Class share outstanding throughout each period
|
Six Months Ended
|
||||
|
April 30, 2022
|
||||
|
(Unaudited)
|
||||
|
PER SHARE DATA:
|
||||
|
Net asset value, beginning of period
|
$
|
12.39
|
||
|
Income from investment operations:
|
||||
|
Net investment income
|
0.02
|
(1)
|
||
|
Net realized and unrealized gains (losses) on investments
|
0.15
|
|||
|
Total from investment operations
|
0.17
|
|||
|
Less distributions:
|
||||
|
Dividends from net investment income
|
(0.02
|
)
|
||
|
Dividends from net realized gains
|
(0.43
|
)
|
||
|
Total distributions
|
(0.45
|
)
|
||
|
Net asset value, end of period
|
$
|
12.11
|
||
|
TOTAL RETURN
|
1.42
|
%(2)
|
||
|
SUPPLEMENTAL DATA AND RATIOS:
|
||||
|
Net assets, end of period (millions)
|
$
|
14.43
|
||
|
Ratio of expenses to average net assets
|
1.82
|
%(3)
|
||
|
Ratio of net investment income to average net assets
|
0.23
|
%(3)
|
||
|
Portfolio turnover rate
|
7
|
%(2)
|
||
|
(1)
|
Calculated using the average shares outstanding method.
|
|
(2)
|
Not annualized.
|
|
(3)
|
Annualized.
|
The accompanying notes are an integral part of these financial statements.
|
WWW.HENNESSYFUNDS.COM
|
12
|
FINANCIAL HIGHLIGHTS — INVESTOR CLASS
|
|
Year Ended October 31,
|
||||||||||||||||||
|
2021
|
2020
|
2019
|
2018
|
2017
|
||||||||||||||
|
$
|
10.84
|
$
|
12.38
|
$
|
12.34
|
$
|
12.88
|
$
|
12.68
|
|||||||||
|
0.02
|
(1)
|
0.12
|
(1)
|
0.13
|
(1)
|
0.09
|
0.06
|
|||||||||||
|
1.56
|
(1.04
|
)
|
0.59
|
0.33
|
1.09
|
|||||||||||||
|
1.58
|
(0.92
|
)
|
0.72
|
0.42
|
1.15
|
|||||||||||||
|
(0.03
|
)
|
(0.12
|
)
|
(0.13
|
)
|
(0.08
|
)
|
(0.05
|
)
|
|||||||||
|
—
|
(0.50
|
)
|
(0.55
|
)
|
(0.88
|
)
|
(0.90
|
)
|
||||||||||
|
(0.03
|
)
|
(0.62
|
)
|
(0.68
|
)
|
(0.96
|
)
|
(0.95
|
)
|
|||||||||
|
$
|
12.39
|
$
|
10.84
|
$
|
12.38
|
$
|
12.34
|
$
|
12.88
|
|||||||||
|
14.62
|
%
|
-7.84
|
%
|
6.05
|
%
|
3.46
|
%
|
9.56
|
%
|
|||||||||
|
$
|
13.53
|
$
|
11.99
|
$
|
12.30
|
$
|
11.62
|
$
|
12.24
|
|||||||||
|
1.85
|
%
|
1.89
|
%
|
1.88
|
%
|
1.84
|
%
|
1.82
|
%
|
|||||||||
|
0.17
|
%
|
1.05
|
%
|
1.04
|
%
|
0.70
|
%
|
0.45
|
%
|
|||||||||
|
31
|
%
|
42
|
%
|
52
|
%
|
21
|
%
|
31
|
%
|
|||||||||
The accompanying notes are an integral part of these financial statements.
|
HENNESSY FUNDS
|
1-800-966-4354
|
13
Financial Statements
|
Notes to the Financial Statements April 30, 2022 (Unaudited)
|
1). ORGANIZATION
The Hennessy Balanced Fund (the “Fund”) is a series of Hennessy Funds Trust (the “Trust”), which was organized as a Delaware statutory trust on September 17, 1992. The Fund is an open-end management
investment company registered under the Investment Company Act of 1940, as amended. The investment objective of the Fund is a combination of capital appreciation and current income. The Fund is a non-diversified fund and offers
Investor Class shares.
As an investment company, the Fund follows the investment company accounting and reporting guidance of the Financial Accounting Standards Board (“FASB”) Accounting Standard Codification
Topic 946 “Financial Services—Investment Companies.”
2). SIGNIFICANT ACCOUNTING POLICIES
The following is a summary of significant accounting policies consistently followed by the Fund in the preparation of the financial statements. These policies conform to U.S. generally accepted accounting
principles (“GAAP”).
|
a).
|
Securities Valuation – All investments in securities are valued in accordance with the Fund’s valuation policies and procedures, as described in Note 3.
|
|
b).
|
Federal Income Taxes – The Fund has elected to be taxed as a regulated investment company and intends to distribute substantially all of its taxable income to its shareholders and otherwise comply
with the provisions of the Internal Revenue Code of 1986, as amended, applicable to regulated investment companies. As a result, the Fund has made no provision for federal income taxes or excise taxes. Net investment
income/loss and realized gains/losses for federal income tax purposes may differ from those reported in the financial statements because of temporary book-basis and tax-basis differences. Temporary differences are primarily
the result of the treatment of wash sales for tax reporting purposes. The Fund recognizes interest and penalties related to income tax benefits, if any, in the Statement of Operations as an income tax expense. Distributions
from net realized gains for book purposes may include short-term capital gains, which are included as ordinary income to shareholders for tax purposes. The Fund may utilize equalization accounting for tax purposes and
designate earnings and profits, including net realized gains distributed to shareholders on redemption of shares, as part of the dividends paid deduction for income tax purposes.
|
|
c).
|
Accounting for Uncertainty in Income Taxes – The Fund has accounting policies regarding recognition and measurement of tax positions taken or expected to be taken on a tax return. The tax returns
of the Fund for the prior three fiscal years are open for examination. The Fund has reviewed all open tax years in major tax jurisdictions and concluded that there is no impact on the Fund’s net assets and no tax liability
resulting from unrecognized tax benefits relating to uncertain income tax positions taken or expected to be taken on a tax return. The Fund’s major tax jurisdictions are U.S. federal and Delaware.
|
|
d).
|
Income and Expenses – Dividend income is recognized on the ex-dividend date or as soon as information is available to the Fund. Interest income, which includes the amortization of premium and
accretion of discount, is recognized on an accrual basis. Market discounts, original issue discounts, and market premiums on debt securities
|
|
WWW.HENNESSYFUNDS.COM
|
14
|
NOTES TO THE FINANCIAL STATEMENTS
|
|
are accreted or amortized to interest income over the life of a security with a corresponding increase or decrease, as applicable, in the cost basis of such security using the yield-to-maturity
method or, where applicable, the first call date of the security. Other non-cash dividends are recognized as investment income at the fair value of the property received. The Fund is charged for those expenses that are
directly attributable to its portfolio, such as advisory, administration, and certain shareholder service fees.
|
|
|
e).
|
Distributions to Shareholders – Dividends from net investment income for the Fund, if any, are declared and paid at the end of each calendar quarter. Distributions of net realized capital gains, if
any, are declared and paid annually, usually in December.
|
|
f).
|
Security Transactions – Investment and shareholder transactions are recorded on the trade date. The Fund determines the realized gain/loss from an investment transaction by comparing the original
cost of the security lot sold with the net sale proceeds. Discounts and premiums on securities purchased are accreted or amortized, respectively, over the life of each such security.
|
|
g).
|
Use of Estimates – Preparing financial statements in accordance with GAAP requires management to make estimates and assumptions that affect the reported amounts of assets and liabilities and
disclosure of contingent assets and liabilities at the date of the financial statements, as well as the reported change in net assets during the reporting period. Actual results could differ from those estimates.
|
|
h).
|
Share Valuation – The net asset value (“NAV”) per share of the Fund is calculated by dividing (i) the total value of the securities held by the Fund, plus cash and other assets, minus all
liabilities (including estimated accrued expenses) by (ii) the total number of Fund shares outstanding, rounded to the nearest $0.01. Fund shares are not priced on days the New York Stock Exchange is closed for trading. The
offering and redemption price per share for the Fund is equal to the Fund’s NAV per share.
|
|
i).
|
Recent Accounting Pronouncements and Regulatory Updates – In October 2020, the Securities and Exchange Commission (“SEC”) adopted new regulations governing the use of derivatives by registered
investment companies (“Rule 18f-4”). Rule 18f-4 imposes limits on the amount of derivatives a fund can enter into, eliminates the asset segregation framework currently used by funds to comply with Section 18 of the 1940 Act,
and requires funds whose use of derivatives is greater than a limited specified amount to establish and maintain a comprehensive derivatives risk management program and appoint a derivatives risk manager. Funds are required
to comply with Rule 18f-4 by August 19, 2022. The impact, if any, that Rule 18f-4 will have on the availability, liquidity, and performance of derivatives is unclear. Management is currently evaluating the potential impact
of Rule 18f-4 on the Fund. When fully implemented, Rule 18f-4 may require changes in how the Fund uses derivatives, adversely affect the Fund’s performance, and increase costs related to the Fund’s use of derivatives.
|
|
In December 2020, the SEC adopted a new rule providing a framework for fund valuation practices (“Rule 2a-5”). Rule 2a-5
establishes requirements for determining fair value in good faith for purposes of the 1940 Act. Rule 2a-5 permits fund boards to designate certain parties to perform fair value determinations, subject to board oversight and
certain other conditions. Rule 2a-5 also defines when market quotations are “readily available” for purposes of the 1940 Act and the threshold for determining whether a fund must fair value a security. In connection with
Rule 2a-5, the SEC also adopted related recordkeeping requirements and is rescinding previously issued guidance, including with respect to the role of a board in
|
|
HENNESSY FUNDS
|
1-800-966-4354
|
15
|
determining fair value and the accounting and auditing of fund investments. Funds must comply with the rules by September 8, 2022. Management is currently assessing the potential impact of the new
rules on the Fund’s financial statements.
|
3). SECURITIES VALUATION
The Fund follows its valuation policies and procedures in determining its net asset value and, in preparing these financial statements, the fair value accounting standards that establish an authoritative
definition of fair value and set out a hierarchy for measuring fair value. These standards require additional disclosures about the various inputs and valuation techniques used to develop the measurements of fair value and a
discussion of changes in valuation techniques and related inputs during the period. These inputs are summarized in the three broad levels listed below:
|
Level 1 –
|
Unadjusted, quoted prices in active markets for identical instruments that the Fund has the ability to access at the date of measurement.
|
|
|
Level 2 –
|
Other significant observable inputs (including, but not limited to, quoted prices in active markets for similar instruments, quoted prices in markets that are not active for identical or similar
instruments, and model-derived valuations in which all significant inputs and significant value drivers are observable in active markets, such as interest rates, prepayment speeds, credit risk curves, default rates, and
similar data).
|
|
|
Level 3 –
|
Significant unobservable inputs (including the Fund’s own assumptions about what market participants would use to price the asset or liability based on the best available information) when
observable inputs are unavailable.
|
The following is a description of the valuation techniques applied to the Fund’s major categories of assets and liabilities on a recurring basis:
|
Equity Securities – Equity securities, including common stocks, preferred stocks, exchange-traded funds, closed-end mutual funds, partnerships, rights, and
real estate investment trusts, that are traded on a securities exchange for which a last-quoted sales price is readily available generally are valued at the last sales price as reported by the primary exchange on which the
securities are listed. Securities listed on The Nasdaq Stock Market (“Nasdaq”) generally are valued at the Nasdaq Official Closing Price, which may differ from the last sales price reported. Securities traded on a securities
exchange for which a last-quoted sales price is not readily available generally are valued at the mean between the bid and ask prices. To the extent these securities are actively traded and valuation adjustments are not
applied, they are classified in Level 1 of the fair value hierarchy.
|
|
|
Registered Investment Companies – Investments in open-end registered investment companies, commonly referred to as mutual funds, generally are priced at the
ending NAV provided by the applicable mutual fund’s service agent and are classified in Level 1 of the fair value hierarchy.
|
|
|
Debt Securities – Debt securities, including corporate bonds, asset-backed securities, mortgage-backed securities, municipal bonds, U.S. Treasuries, and
U.S. government agency issues, are generally valued at market on the basis of valuations furnished by an independent pricing service that utilizes both dealer-supplied valuations and formula-based techniques. The pricing
service may consider recently executed transactions in securities of the issuer or comparable issuers, market price quotations (where observable), bond spreads, and fundamental data relating to the issuer. In addition, the
model may incorporate observable market data, such as reported sales of similar securities, broker quotes, yields, bids, offers, and reference data. Certain
|
|
WWW.HENNESSYFUNDS.COM
|
16
|
NOTES TO THE FINANCIAL STATEMENTS
|
|
securities are valued primarily using dealer quotations. These securities are generally classified in Level 2 of the fair value hierarchy.
|
|
|
Short-Term Securities – Short-term equity investments, including money market funds, are valued in the manner specified above for equity securities.
Short-term debt investments with an original term to maturity of 60 days or less are valued at amortized cost, which approximates fair market value. If the original term to maturity of a short-term debt investment exceeds 60
days, then the values as of the 61st day prior to maturity are amortized. Amortized cost is not used if its use would be inappropriate due to credit or other impairments of the issuer, in which case the security’s fair value
would be determined as described below. Short-term securities are generally classified in Level 1 or Level 2 of the fair value hierarchy depending on the inputs used and market activity levels for specific securities.
|
The Board of Trustees of the Fund (the “Board”) has adopted fair value pricing procedures that are followed when a price for a security is not readily available or if a significant event
has occurred that indicates the closing price of a security no longer represents the true value of that security. Fair value pricing determinations are made in good faith in accordance with these procedures. There are numerous
criteria considered in determining a fair value of a security, such as the trading volume of a security and markets, the values of other similar securities, and news events with direct bearing on a security or markets. Fair value
pricing results in an estimated price for a security that reflects the amount the Fund might reasonably expect to receive in a current sale. Depending on the relative significance of the valuation inputs, these securities may be
classified in either Level 2 or Level 3 of the fair value hierarchy.
The Board has delegated day-to-day valuation matters to the Valuation and Liquidity Committee comprising representatives from Hennessy Advisors, Inc., the Fund’s investment advisor (the
“Advisor”). The function of the Valuation and Liquidity Committee, among other things, is to value securities where current and reliable market quotations are not readily available. All actions taken by the Valuation and Liquidity
Committee are reviewed by the Board.
The Fund has performed an analysis of all existing investments to determine the significance and character of all inputs to their fair value determinations. Various inputs are used to
determine the value of the Fund’s investments. The inputs or methodology used for valuing securities are not necessarily an indication of the risk associated with investing in those securities. Details related to the fair value
hierarchy of the Fund’s securities as of April 30, 2022, are included in the Schedule of Investments.
4). INVESTMENT TRANSACTIONS
Purchases and sales of investment securities (excluding government and short-term investments) for the Fund during the six months ended April 30, 2022, were $557,129 and $467,163, respectively.
There were no purchases or sales/maturities of long-term U.S. government securities for the Fund during the six months ended April 30, 2022.
5). INVESTMENT ADVISORY FEE AND OTHER TRANSACTIONS WITH AFFILIATES
The Advisor provides the Fund with investment advisory services under an Investment Advisory Agreement. The Advisor furnishes all investment advice, office space, and facilities and most of the personnel
needed by the Fund. As compensation for its services, the Advisor is entitled to a monthly fee from the Fund. The fee is based on the average daily net assets of the Fund at an annual rate of 0.60%. The net investment advisory fees
expensed by the Fund during the six months ended April 30, 2022, are included in the Statement of Operations.
|
HENNESSY FUNDS
|
1-800-966-4354
|
17
The Board has approved a Shareholder Servicing Agreement for the Fund, which compensates the Advisor for the non-investment advisory services it provides to the Fund. The Shareholder
Servicing Agreement provides for a monthly fee paid to the Advisor at an annual rate of 0.10% of the average daily net assets of the Fund. The shareholder service fees expensed by the Fund during the six months ended April 30, 2022,
are included in the Statement of Operations.
The Fund has adopted a plan pursuant to Rule 12b-1 under the Investment Company Act of 1940, as amended, that authorizes payments in connection with the distribution of Fund shares at an
annual rate of up to 0.25% of the Fund’s average daily net assets. Even though the authorized rate is up to 0.25%, the Fund is currently only using up to 0.15% of its average daily net assets for such purpose. Amounts paid under the
plan may be spent on any activities or expenses primarily intended to result in the sale of shares, including, but not limited to, advertising, shareholder account servicing, printing and mailing of prospectuses to other than
current shareholders, printing and mailing of sales literature, and compensation for sales and marketing activities or to financial institutions and others, such as dealers and distributors. The distribution fees expensed by the
Fund during the six months ended April 30, 2022, are included in the Statement of Operations.
The Fund has entered into agreements with various brokers, dealers, and financial intermediaries in connection with the sale of Fund shares. The agreements provide for periodic payments
of sub-transfer agent expenses by the Fund to the brokers, dealers, and financial intermediaries for providing certain shareholder maintenance services. These shareholder services include the pre-processing and quality control of
new accounts, shareholder correspondence, answering customer inquiries regarding account status, and facilitating shareholder telephone transactions. The sub-transfer agent fees expensed by the Fund during the six months ended April
30, 2022, are included in the Statement of Operations.
U.S. Bancorp Fund Services, LLC, d/b/a U.S. Bank Global Fund Services (“Fund Services”) provides the Fund with administrative, accounting, and transfer agent services. As administrator,
Fund Services is responsible for activities such as (i) preparing various federal and state regulatory filings, reports, and returns for the Fund, (ii) preparing reports and materials to be supplied to the Board, (iii) monitoring
the activities of the Fund’s custodian, transfer agent, and accountants, and (iv) coordinating the preparation and payment of the Fund’s expenses and reviewing the Fund’s expense accruals. U.S. Bank N.A., an affiliate of Fund
Services, serves as the Fund’s custodian. The servicing agreements between the Trust, Fund Services, and U.S. Bank N.A. contain a fee schedule that is inclusive of administrative, accounting, custody, and transfer agent fees. The
administrative, accounting, custody, and transfer agent fees expensed by the Fund during the six months ended April 30, 2022, are included in the Statement of Operations.
Quasar Distributors, LLC (“Quasar”), a wholly owned broker-dealer subsidiary of Foreside Financial Group, LLC, acts as the Fund’s principal underwriter in a continuous public offering of
Fund shares.
The officers of the Fund are affiliated with the Advisor. With the exception of the Chief Compliance Officer and the Senior Compliance Officer, such officers receive no compensation from
the Fund for serving in their respective roles. The Fund, along with the other funds in the Hennessy Funds family (collectively, the “Hennessy Funds”), makes reimbursement payments on an equal basis to the Advisor for a portion of
the salary and benefits associated with the office of the Chief Compliance Officer and for all of the salary and benefits associated with the office of the Senior Compliance Officer. The
|
WWW.HENNESSYFUNDS.COM
|
18
|
NOTES TO THE FINANCIAL STATEMENTS
|
compliance fees expensed by the Fund during the six months ended April 30, 2022, are included in the Statement of Operations.
6). GUARANTEES AND INDEMNIFICATIONS
Under the Hennessy Funds’ organizational documents, their officers and trustees are indemnified by the Hennessy Funds against certain liabilities arising out of the performance of their duties to the
Hennessy Funds. Additionally, in the normal course of business, the Hennessy Funds enter into contracts with service providers that contain general indemnification clauses. The Fund’s maximum exposure under these arrangements is
unknown as this would involve future claims that may be made against the Fund that have not yet occurred. Currently, the Fund expects the risk of loss to be remote.
7). LINE OF CREDIT
The Fund has an uncommitted line of credit with the other Hennessy Funds in the amount of the lesser of (i) $100,000,000 or (ii) 33.33% of each Hennessy Fund’s net assets, or 30% for the Hennessy Gas
Utility Fund and 10% for the Fund. The line of credit is intended to provide any necessary short-term financing in connection with shareholder redemptions, subject to certain restrictions. The credit facility is with the Hennessy
Funds’ custodian bank, U.S. Bank N.A. Borrowings under this arrangement bear interest at the bank’s prime rate and are secured by all of the Fund’s assets (as to its own borrowings only). During the six months ended April 30, 2022,
the Fund had an outstanding average daily balance and a weighted average interest rate of $2,436 and 3.25%, respectively. The interest expensed by the Fund during the six months ended April 30, 2022, is included in the Statement of
Operations. The maximum amount outstanding for the Fund during the period was $147,000. As of April 30, 2022, the Fund did not have any borrowings outstanding under the line of credit.
8). FEDERAL TAX INFORMATION
As of October 31, 2021, the Fund’s most recent fiscal year end, the components of accumulated earnings (losses) for income tax purposes were as follows:
|
Investments
|
||||
|
Cost of investments for tax purposes
|
$
|
12,851,955
|
||
|
Gross tax unrealized appreciation
|
$
|
873,298
|
||
|
Gross tax unrealized depreciation
|
(157,698
|
)
|
||
|
Net tax unrealized appreciation/(depreciation)
|
$
|
715,600
|
||
|
Undistributed ordinary income
|
$
|
10,636
|
||
|
Undistributed long-term capital gains
|
454,083
|
|||
|
Total distributable earnings
|
$
|
464,719
|
||
|
Other accumulated gain/(loss)
|
$
|
—
|
||
|
Total accumulated gain/(loss)
|
$
|
1,180,319
|
||
The difference between book-basis unrealized appreciation/depreciation and tax-basis unrealized appreciation/depreciation (as shown above) is attributable primarily to wash sales.
As of October 31, 2021, the Fund had no tax-basis capital losses to offset future capital gains. During fiscal year 2021, the capital losses utilized by the Fund were $27,785.
Capital losses sustained in or after fiscal year 2012 can be carried forward indefinitely, but any such loss retains the character of the original loss and must be utilized prior to any
loss incurred before fiscal year 2012. As a result of this ordering rule, capital loss carryforwards incurred prior to fiscal year 2012 may be more likely to expire
|
HENNESSY FUNDS
|
1-800-966-4354
|
19
unused. Capital losses sustained prior to fiscal year 2012 can be carried forward for eight years and can be carried forward as short-term capital losses regardless of the character of the original loss.
As of October 31, 2021, the Fund did not defer, on a tax basis, any late-year ordinary losses. Late-year ordinary losses are net ordinary losses incurred after December 31, 2020, but
within the taxable year, that are deemed to arise on the first day of the Fund’s next taxable year.
During fiscal year 2022 (year to date) and fiscal year 2021, the tax character of distributions paid by the Fund was as follows:
|
Six Months Ended
|
Year Ended
|
||||||||
|
April 30, 2022
|
October 31, 2021
|
||||||||
|
Ordinary income(1)
|
$
|
31,330
|
$
|
35,846
|
|||||
|
Long-term capital gains
|
454,086
|
—
|
|||||||
|
Total distributions
|
$
|
485,416
|
$
|
35,846
|
|||||
|
(1) Ordinary income includes short-term capital gains.
|
9). EVENTS SUBSEQUENT TO PERIOD END
Management has evaluated the Fund’s related events and transactions that occurred subsequent to April 30, 2022, through the date of issuance of the Fund’s financial statements. Management has determined
that there were no subsequent events requiring recognition or disclosure in the financial statements.
|
WWW.HENNESSYFUNDS.COM
|
20
|
NOTES TO THE FINANCIAL STATEMENTS /EXPENSE EXAMPLE
|
Expense Example (Unaudited)
April 30, 2022
As a shareholder of the Fund, you incur ongoing costs, including management fees, service fees, and other Fund expenses. This Example is intended to help you understand your ongoing costs (in dollars) of
investing in the Fund and to compare these costs with the ongoing costs of investing in other mutual funds. The Example is based on an investment of $1,000 invested at the beginning of the period and held for the entire period from
November 1, 2021, through April 30, 2022.
Actual Expenses
The first line of the table below provides information about actual account values and actual expenses. You may use this information, together with the amount you invested, to estimate the expenses that
you paid over the period. Simply divide your account value by $1,000 (for example, an $8,600 account value divided by $1,000 = 8.6), then multiply the result by the number in the first line under the heading “Expenses Paid During
Period” to estimate the expenses you paid on your account during this period. Although the Fund charges no sales loads or transaction fees, you will be assessed fees for outgoing wire transfers, returned checks, and stop payment
orders at prevailing rates charged by U.S. Bank Global Fund Services, the Fund’s transfer agent. If you request that a redemption be made by wire transfer, the Fund’s transfer agent charges a $15 fee. IRAs are charged a $15 annual
maintenance fee (up to $30 maximum per shareholder for shareholders with multiple IRAs). The example below includes, but is not limited to, management, shareholder servicing, accounting, custody, and transfer agent fees. However,
the example below does not include portfolio trading commissions and related expenses.
Hypothetical Example for Comparison Purposes
The second line of the table below provides information about hypothetical account values and hypothetical expenses based on the Fund’s actual expense ratio and an assumed rate of return of 5% per year
before expenses, which is not the Fund’s actual return. The hypothetical account values and expenses may not be used to estimate the actual ending account balance or expenses you paid for the period. You may use this information to
compare the ongoing costs of investing in the Fund and other funds. To do so, compare this 5% hypothetical example with the 5% hypothetical examples that appear in the shareholder reports of the other funds. Please note that the
expenses shown in the table are meant to highlight your ongoing costs only. Therefore, the second line is useful in comparing ongoing costs only and will not help you determine the relative total costs of owning different funds.
|
Beginning
|
Ending
|
||
|
Account Value
|
Account Value
|
Expenses Paid
|
|
|
November 1, 2021
|
April 30, 2022
|
During Period(1)
|
|
|
Investor Class
|
|||
|
Actual
|
$1,000.00
|
$1,014.20
|
$9.09
|
|
Hypothetical (5% return before expenses)
|
$1,000.00
|
$1,015.77
|
$9.10
|
|
(1)
|
Expenses are equal to the Fund’s annualized expense ratio of 1.82%, multiplied by the average account value over the period, multiplied by 181/365 days (to reflect the half-year period).
|
|
HENNESSY FUNDS
|
1-800-966-4354
|
21
How to Obtain a Copy of the Fund’s Proxy
Voting Policy and Proxy Voting Records
A description of the policies and procedures the Fund uses to determine how to vote proxies relating to portfolio securities is available without charge (1) by calling 800-966-4354, (2) on the Hennessy
Funds’ website at www.hennessyfunds.com/proxy-voting/voting-policy, or (3) on the U.S. Securities and Exchange Commission’s (the “SEC”) website at www.sec.gov. The Fund’s proxy voting record is available without charge on both the
Hennessy Funds’ website at www.hennessyfunds.com/proxy-voting/voting-record and the SEC’s website at www.sec.gov no later than August 31 for the prior 12 months ending June 30.
Availability of Quarterly Portfolio Schedule
The Fund files its complete schedule of portfolio holdings with the SEC for the first and third quarters of each fiscal year as an exhibit to its reports on Form N-PORT. The Fund’s Form N-PORT reports are
available on the SEC’s website at www.sec.gov or on request by calling 800-966-4354.
Federal Tax Distribution Information (Unaudited)
For fiscal year 2021, certain dividends paid by the Fund may be subject to a maximum tax rate of 23.8%, as provided for by the Jobs and Growth Tax Relief Reconciliation Act of 2003. The percentage of
dividends declared from ordinary income designated as qualified dividend income was 100.00%.
For corporate shareholders, the percent of ordinary income distributions that qualified for the corporate dividends received deduction for fiscal year 2021 was 100.00%.
The percentage of taxable ordinary income distributions that were designated as short-term capital gain distributions under Section 871(k)(2)(C) of the Internal Revenue Code of 1986, as
amended, for the Fund was 28.96%.
Important Notice Regarding Delivery
of Shareholder Documents
To help keep the Fund’s costs as low as possible, we generally deliver a single copy of shareholder reports, proxy statements, and prospectuses to shareholders who share an address and have the same last
name. This process does not apply to account statements. You may request an individual copy of a shareholder document at any time. If you would like to receive separate mailings of shareholder documents, please call U.S. Bank Global
Fund Services at 800-261-6950 or 414-765-4124, and individual delivery will begin within 30 days of your request. If your account is held through a financial institution or other intermediary, please contact such intermediary
directly to request individual delivery.
Electronic Delivery
As permitted by SEC regulations, the Fund’s shareholder reports are made available on a website, and unless you sign up for eDelivery or elect to receive paper copies as detailed below, you will be
notified each time a report is posted and provided with a website link to access the report.
The Fund also offers shareholders the option to receive all notices, account statements, prospectuses, tax forms, and shareholder reports electronically. To sign up for eDelivery or
change your delivery preference, please visit www.hennessyfunds.com/account.
To elect to receive paper copies of all future reports free of charge, please call U.S. Bank Global Fund Services at 800-261-6950 or 414-765-4124.
Subscribe to receive our team’s unique market and sector insights delivered to your inbox
www.hennessyfunds.com/subscribe
Follow us on social media
| |
|
|
WWW.HENNESSYFUNDS.COM
|
22
|
PROXY VOTING — BOARD APPROVAL OF INVESTMENT ADVISORY AGREEMENT
|
Board Approval of Investment Advisory
Agreement
At its meeting on March 11, 2022, the Board of Trustees of the Fund (the “Board,” and the members thereof, the “Trustees”) unanimously approved the continuation of the investment advisory agreement of the
Fund with Hennessy Advisors, Inc. (the “Advisor”). As part of the process, the Trustees reviewed their fiduciary duties and the relevant factors for them to consider with respect to approving the advisory agreement. In addition, the
Trustees who are not deemed “interested persons” (as defined by the Investment Company Act of 1940, as amended) of the Fund (the “Independent Trustees”) met in executive session to discuss the approval of the advisory agreement. As
part of their discussion, the Independent Trustees confirmed their understanding of the need to have asked about, and received answers to, any matters that they believed are relevant to determining whether to approve the
continuation of the advisory agreement.
In advance of the meeting, the Advisor sent detailed information to the Trustees to assist them in their evaluation of the advisory agreement. This information included, but was not
limited to, the following:
|
(1)
|
A memorandum from outside legal counsel that described the fiduciary duties of the Board with respect to approving the continuation of the advisory agreement and the relevant factors for
consideration;
|
|
|
(2)
|
A memorandum from the Advisor that listed the factors relevant to the Board’s approval of the continuation of the advisory agreement and also referenced the documents that had been provided to help
the Board assess each such factor;
|
|
|
(3)
|
The Advisor’s financial statements from its most recent Form 10-K and Form 10-Q;
|
|
|
(4)
|
A summary of the advisory agreement;
|
|
|
(5)
|
A recent Fund fact sheet, which included, among other things, Fund performance over various periods;
|
|
|
(6)
|
A description of the range of services provided by the Advisor;
|
|
|
(7)
|
A peer expense comparison of the net expense ratio and investment advisory fee of the Fund; and
|
|
|
(8)
|
A memorandum from the Advisor regarding economies of scale.
|
The Trustees reviewed and discussed all of the information provided by the Advisor. Following this review, and further discussion with the Advisor, the Trustees concluded that the
information provided before and at the meeting addressed all of the relevant matters that they wanted to consider in assessing the performance of the Funds and the performance of the Advisor under the advisory agreement, and that
said information provided them with a fulsome understanding of the advisory agreement and the services provided by the Advisor.
All of the factors discussed were considered as a whole by the Trustees, as well as by the Independent Trustees meeting in executive session. The Trustees viewed the relevant factors in
their totality, with no single factor being the principal or determinative factor in the Trustees’ determination of whether to approve the continuation of the advisory agreement. The Trustees recognized that the management and fee
arrangements for the Fund are the result of years of review and discussion between the Independent Trustees and the Advisor, that certain aspects of such arrangements may receive greater scrutiny in some years than in others, and
that the Trustees’ conclusions may be based, in part, on
|
HENNESSY FUNDS
|
1-800-966-4354
|
23
their consideration of these same arrangements and information received during the course of the year and in prior years.
Prior to approving the continuation of the advisory agreement, the Trustees, including the Independent Trustees in executive session, considered, among other items:
|
(1)
|
The nature and quality of the advisory services provided by the Advisor;
|
|
|
(2)
|
A comparison of the fees and expenses of the Fund to other similar funds;
|
|
|
(3)
|
Whether economies of scale are recognized by the Fund;
|
|
|
(4)
|
The costs and profitability of the Fund to the Advisor;
|
|
|
(5)
|
The performance of the Fund; and
|
|
|
(6)
|
Any benefits to the Advisor from serving as an investment advisor to the Fund (other than the advisory fee).
|
The material considerations and determinations of the Trustees, including the Independent Trustees, were as follows:
|
(1)
|
The Trustees considered the services identified below that are provided by the Advisor. Based on this review and an assessment of the Advisor’s performance, the Trustees concluded that the Advisor
provides high-quality services to the Fund, and they noted that their overall confidence in the Advisor was high. The Trustees also concluded that they were satisfied with the nature, extent, and quality of the advisory
services provided to the Fund by the Advisor and that the nature and extent of the services provided by the Advisor were appropriate to assure that the Fund’s operations are conducted in compliance with applicable laws,
rules, and regulations.
|
|
(a)
|
The Advisor acts as the portfolio manager for the Fund. In this capacity, the Advisor does the following:
|
|
(i)
|
manages the composition of the Fund’s portfolio, including the purchase, retention, and disposition of portfolio securities in accordance with the Fund’s investment objectives, policies, and
restrictions;
|
|||
|
(ii)
|
seeks best execution for the Fund’s portfolio;
|
|||
|
(iii)
|
manages the use of soft dollars for the Fund; and
|
|||
|
(iv)
|
manages proxy voting for the Fund.
|
|
(b)
|
The Advisor performs a daily reconciliation of portfolio positions and cash for the Fund.
|
||
|
(c)
|
The Advisor monitors the liquidity of each Fund.
|
||
|
(d)
|
The Advisor monitors the Fund’s compliance with its investment objectives and restrictions and federal securities laws.
|
||
|
(e)
|
The Advisor maintains a compliance program (including a code of ethics), conducts ongoing reviews of the compliance programs of the Fund’s service providers (including their codes of ethics, as
appropriate), conducts on-site visits to the Fund’s service providers, as feasible, monitors incidents of abusive trading practices, reviews Fund expense accruals, payments, and fixed expense ratios, evaluates insurance
providers for fidelity bond, D&O/E&O insurance, and cybersecurity insurance coverage, manages regulatory examination compliance and responses, conducts employee compliance training, reviews reports provided by
service providers, and maintains books and records.
|
|
WWW.HENNESSYFUNDS.COM
|
24
|
BOARD APPROVAL OF INVESTMENT ADVISORY AGREEMENT
|
|
(f)
|
The Advisor oversees service providers that provide accounting, administration, distribution, transfer agency, custodial, sales, marketing, public relations, audit, information technology, and
legal services to the Fund.
|
||
|
(g)
|
The Advisor maintains in-house marketing and distribution departments on behalf of the Fund.
|
||
|
(h)
|
The Advisor prepares or directs the preparation of all regulatory filings for the Fund, including writing and annually updating the Fund’s prospectus and related documents.
|
||
|
(i)
|
For each annual report of the Fund, the Advisor prepares a written summary of the Fund’s performance during the most recent 12-month period.
|
||
|
(j)
|
The Advisor oversees distribution of the Fund through third-party broker/dealers and independent financial institutions such as Charles Schwab, Inc., Fidelity, TD Ameritrade, and Pershing. The
Advisor participates in “no transaction fee” (“NTF”) programs with these companies on behalf of the Fund, which allow customers to purchase the Fund through third-party distribution channels without paying a transaction fee.
The Advisor compensates, in part, a number of these third-party providers of NTF programs out of its own revenues.
|
||
|
(k)
|
The Advisor pays the incentive compensation of the Fund’s compliance officers and employs other staff, such as legal, marketing, national accounts, distribution, sales, administrative, and trading
oversight personnel, as well as management executives.
|
||
|
(l)
|
The Advisor provides a quarterly compliance certification to the Board.
|
||
|
(m)
|
The Advisor prepares or reviews all Board materials, presents to and leads discussions with the Board, prepares or reviews all meeting minutes, and arranges for Board training and education.
|
|
(2)
|
The Trustees compared the performance of the Fund to benchmark indices over various periods and noted that the Trustees review and discuss reports comparing the investment performance of the Fund
to various indices at each quarterly Board meeting. Based on such information, the Trustees determined that the Advisor manages the Fund in a manner materially consistent with its stated investment objective and style. The
Trustees concluded that the performance of the Fund over various periods warranted the continuation of the advisory agreement.
|
|
|
(3)
|
The Trustees reviewed the advisory fees and overall expense ratios of the Fund compared to other funds similar in asset size and investment objective to the Fund using data from Morningstar. As
part of the discussion with management, the Trustees ensured that they understood and were comfortable with the criteria used to determine the mutual funds included in the Morningstar categories for purposes of the materials
considered at the meeting. The Trustees determined that the advisory fee and overall expense ratio of the Fund falls within a reasonable range of the advisory fees and overall expense ratios of other comparable funds and
concluded that they are reasonable and warranted continuation of the advisory agreement.
|
|
|
(4)
|
The Trustees also considered whether the Advisor was realizing economies of scale that should be shared with the Fund’s shareholders. The Trustees noted that the majority of expenses incurred to
manage the Fund are variable
|
|
HENNESSY FUNDS
|
1-800-966-4354
|
25
|
asset-based fees, so the Advisor does not realize material economies of scale relating to these expenses as the assets of the Fund increase. For example, third-party platform fees increase as the
Fund’s assets grow.
|
||
|
(5)
|
The Trustees considered the profitability of the Advisor, including the impact of mutual fund platform fees on the Advisor’s profitability, and also considered the resources and revenues that the
Advisor has put into managing and distributing the Fund. The Trustees then concluded that the profits of the Advisor are reasonable and not excessive when compared to profitability guidelines set forth in relevant court
cases.
|
|
|
(6)
|
The Trustees considered the high level of professionalism and knowledge of the Advisor’s employees and concluded that this was beneficial to the Fund and its shareholders.
|
|
|
(7)
|
The Trustees considered any benefits to the Advisor from serving as an advisor to the Fund (other than the advisory fee). The Trustees noted that the Advisor may derive ancillary benefits from, by
way of example, its association with the Fund in the form of proprietary and third-party research products and services received from broker-dealers that execute portfolio trades for the Fund. The Trustees determined that
any such products and services have been used for legitimate purposes relating to the Fund by providing assistance in the investment decision-making process. The Trustees concluded that any additional benefits realized by
the Advisor from its relationship with the Fund were reasonable, which was based on, among other things, the Trustees’ finding that the research, analytical, statistical, and other information and services provided by
brokers are merely supplemental to the Advisor’s own efforts in the performance of its duties under the advisory agreement.
|
After reviewing the materials and information provided at the meeting, as well as other information regularly provided at the Board’s quarterly meetings throughout the year regarding the
quality of services provided by the Advisor, the performance of the Fund, expense information, brokerage commissions information, the adequacy and efficacy of the Advisor’s written policies and procedures, other regulatory
compliance issues, trading information and related matters, and other factors that the Trustees deemed relevant, the Trustees, including the Independent Trustees, approved the continuation of the advisory agreement.
|
WWW.HENNESSYFUNDS.COM
|
26
|
BOARD APPROVAL OF INVESTMENT ADVISORY AGREEMENT
|
(This Page Intentionally Left Blank.)
For information, questions, or assistance, please call
The Hennessy Funds
800-966-4354 or 415-899-1555
INVESTMENT ADVISOR
Hennessy Advisors, Inc.
7250 Redwood Boulevard, Suite 200
Novato, California 94945
ADMINISTRATOR,
TRANSFER AGENT,
DIVIDEND PAYING AGENT, &
SHAREHOLDER SERVICING AGENT
U.S. Bancorp Fund Services, LLC
d/b/a U.S. Bank Global Fund Services
P.O. Box 701
Milwaukee, Wisconsin 53201-0701
CUSTODIAN
U.S. Bank N.A.
Custody Operations
1555 North River Center Drive, Suite 302
Milwaukee, Wisconsin 53212
TRUSTEES
Neil J. Hennessy
J. Dennis DeSousa
Robert T. Doyle
Claire Garvie
Gerald P. Richardson
COUNSEL
Foley & Lardner LLP
777 East Wisconsin Avenue
Milwaukee, Wisconsin 53202-5306
INDEPENDENT REGISTERED
PUBLIC ACCOUNTING FIRM
Tait, Weller & Baker LLP
Two Liberty Place
50 South 16th Street, Suite 2900
Philadelphia, Pennsylvania 19102-2529
DISTRIBUTOR
Quasar Distributors, LLC
111 East Kilbourn Avenue, Suite 1250
Milwaukee, Wisconsin 53202
www.hennessyfunds.com | 800-966-4354
This report has been prepared for shareholders and may be distributed to
others only if preceded or accompanied by a current prospectus.
SEMI-ANNUAL REPORT
APRIL 30, 2022

HENNESSY ENERGY TRANSITION FUND
Investor Class HNRGX
Institutional Class HNRIX
www.hennessyfunds.com | 1-800-966-4354
(This Page Intentionally Left Blank.)
Contents
|
Letter to Shareholders
|
2
|
|
Performance Overview
|
4
|
|
Financial Statements
|
|
|
Schedule of Investments
|
5
|
|
Statement of Assets and Liabilities
|
9
|
|
Statement of Operations
|
10
|
|
Statements of Changes in Net Assets
|
11
|
|
Financial Highlights
|
12
|
|
Notes to the Financial Statements
|
16
|
|
Expense Example
|
24
|
|
Proxy Voting Policy and Proxy Voting Records
|
26
|
|
Availability of Quarterly Portfolio Schedule
|
26
|
|
Important Notice Regarding Delivery of Shareholder Documents
|
26
|
|
Electronic Delivery
|
26
|
|
Board Approval of Investment Advisory Agreement
|
27
|
|
HENNESSY FUNDS
|
1-800-966-4354
|
May 2022
Dear Hennessy Funds Shareholder:
We’d like to start our semi-annual letter with a pause. At the end of 2021, we looked forward to a new year – a potentially calmer year – having come through
almost two full years of the coronavirus pandemic. As people, we were aware our lives had changed, but we hoped for a better 2022; as investors, we were aware that the economy was strong and employment was robust, yet challenges
loomed, including inflation, supply chain disruptions, and tightening monetary policy; as employees, students, and family members, we recognized much was different, but we sought a return to what’s familiar. What we didn’t know
was that a world leader who controls one of the largest militaries on the planet was about to start one of the worst atrocities in Europe since World War II. Our thoughts are with the Ukrainian people, and our hope is for this
unjustified, senseless human tragedy to end quickly.
The equity market started 2022 on a high note, with the S&P 500® Index hitting an all-time high on the first trading day of the year. This turned out to be the last hurrah for a market that saw a continuous march higher in
2021, having hit 70 new all-time highs, with a new all-time high being recorded on average every three and a half days. Concerns in the market then coalesced and overpowered bullish sentiment, and the market has spiraled lower
throughout 2022. Factors that drove the market lower include: tightening monetary policy as the Federal Reserve has begun raising rates and has announced plans for shrinking its $8.5 trillion asset portfolio; inflation, higher
energy costs, and their effects on the domestic and global economies; continued supply chain disruptions; investors’ indiscriminate liquidation of broad-based ETFs and index funds and the detrimental effect on equities; and the
near-term and long-term global implications of the Russian invasion of Ukraine.
While markets are adjusting, many positive conditions remain intact. Corporate balance sheets and profits remain strong, GDP growth remains
positive, the consumer continues to show resilience in the face of rising prices, cash is abundant both at the corporate and household levels, unemployment is exceptionally low, and our financial system remains healthy. Markets
are also experiencing a change in leadership, as value stocks have been outperforming growth stocks, and traditionally defensive sectors such as Utilities and Consumer Staples have been outperforming the broader market. Finally,
the Energy sector has soared in 2022, as companies reap the benefits of dramatically higher oil and natural gas prices, and shareholders are rewarded with significantly higher dividends, aggressive buybacks, and higher stock
prices after many years of underperformance for the sector.
With history as our guide, we are hopeful that eventually the market may bottom and head higher again. Since the financial crisis of 2008, we
have experienced many corrections and many recoveries to new highs. The Dow Jones Industrial Average has dropped over 10% eight times, including the current drop, for a median decline of 14.00%, and on average, it took 45 trading
days to drop from peak to trough and 127 trading days to return to the previous peak. Since the current drop has taken longer to go from peak to its recent trough, it may take some time for a recovery in prices to truly take hold.
On a positive note, valuations have come in, and many stocks have become more attractive, especially for longer-term investors. We note,
however, that the concept of “historically cheap stocks” does not, on its own, move the market higher. Rather, it is
|
WWW.HENNESSYFUNDS.COM
|
2
|
LETTER TO SHAREHOLDERS
|
overall capitulation and improving fundamentals that could bring buyers back into the market and reverse any bearish trends. Investors need to see improving company earnings, retreating inflationary
trends, a measured pace of interest rate increases globally that does not cause significant economic contraction, hope for a more peaceful and orderly world economic system unconstrained by supply bottlenecks and other hindrances
to global trade, and, most importantly, a subsidence of the deleterious effects of the coronavirus pandemic. While that may seem like a “tall order,” we believe that patient investing, focusing on value, quality, and downside risk
mitigation, works well over the longer term.
During this tumultuous period, performance of the majority of the Hennessy Funds has been relatively strong when compared to the overall market as well
as to our benchmarks. During the six months ended April 30, 2022, the Dow Jones Industrial Average, the S&P 500® Index, and the NASDAQ
Composite Index dropped 7.05%, 9.65%, and 20.15%, respectively, on a total return basis. During this period when these three major indices saw significant declines, we were pleased that seven of our 16 Funds posted positive total
returns, 10 of our 14 domestic Funds outperformed the S&P 500® Index, and over half of our active funds outperformed their primary benchmarks.
We thank you, our shareholders, for your continued interest in our family of Funds. We are grateful for the trust you put in us, and we will
continue to strive to manage our portfolios for long-term performance, ever mindful of downside risk. While volatility and uncertainty may impact the markets in the short-term, we encourage investors to stay the course, maintain a
diversified portfolio, and keep a long-term perspective. If you have any questions or would like to speak with us, please don’t hesitate to call us directly at (800) 966-4354. In closing, we would also like to thank all of the
healthcare and frontline workers that have worked – and still work – tirelessly throughout the coronavirus pandemic.
Best regards,
|
|
|
|
|
Ryan C. Kelley, CFA
|
|
|
Chief Investment Officer,
|
|
|
Senior Vice President, and Portfolio Manager
|
Past performance does not guarantee future results.
Mutual fund investing involves risk. Principal loss is possible.
Opinions expressed are those of Ryan C. Kelley and are subject to change, are not guaranteed, and should not be considered investment advice.
The Dow Jones Industrial Average and S&P 500® Index are commonly used to measure the performance of U.S. stocks. The
NASDAQ Composite Index comprises all common stocks listed on The NASDAQ Stock Market and is commonly used to measure the performance of technology-related stocks. The indices are used herein for comparative purposes in accordance
with SEC regulations. One cannot invest directly in an index. All returns are shown on a total return basis.
Please refer to the Performance Overview section for more detailed performance information.
|
HENNESSY FUNDS
|
1-800-966-4354
|
3
Performance Overview (Unaudited)
AVERAGE ANNUAL TOTAL RETURN FOR PERIODS ENDED APRIL 30, 2022
|
Six
|
One
|
Five
|
Since Inception
|
|
|
Months(1)
|
Year
|
Years
|
(12/31/13)
|
|
|
Hennessy Energy Transition Fund –
|
||||
|
Investor Class (HNRGX)
|
28.78%
|
58.26%
|
4.06%
|
2.33%
|
|
Hennessy Energy Transition Fund –
|
||||
|
Institutional Class (HNRIX)
|
28.95%
|
58.84%
|
4.34%
|
2.58%
|
|
S&P 500® Energy Index
|
33.92%
|
60.82%
|
7.03%
|
2.00%
|
|
S&P 500® Index
|
-9.65%
|
0.21%
|
13.66%
|
12.27%
|
Expense ratios: 2.96% (Investor Class); 2.61% (Institutional Class)
|
(1)
|
Periods of less than one year are not annualized.
|
_______________
Performance data quoted represents past performance; past performance does not guarantee future results. The investment return and principal value of an investment will fluctuate so
that an investor’s shares, when redeemed, may be worth more or less than their original cost. The performance table does not reflect the deduction of taxes that a shareholder would pay on Fund distributions or the redemption of
Fund shares. Current performance of the Fund may be lower or higher than the performance quoted. Performance data current to the most recent month end may be obtained by visiting www.hennessyfunds.com. Performance for periods
including or prior to October 26, 2018, is that of the BP Capital TwinLine Energy Fund.
The S&P 500® Energy Index comprises those companies included in the S&P 500® that are classified in the Energy sector. The S&P 500® Index is a capitalization-weighted index
that is designed to represent the broad domestic economy through changes in the aggregate market value of 500 stocks across all major industries. One cannot invest directly in an index. These indices are used for comparative
purposes in accordance with Securities and Exchange Commission regulations.
Standard & Poor’s Financial Services is the source and owner of the S&P® and S&P 500® trademarks.
The expense ratios presented are from the most recent prospectus. The expense ratios for the current reporting period are available in the Financial Highlights section of this report.
|
WWW.HENNESSYFUNDS.COM
|
4
|
PERFORMANCE OVERVIEW/SCHEDULE OF INVESTMENTS
|
Financial Statements
|
Schedule of Investments as of April 30, 2022 (Unaudited)
|
HENNESSY ENERGY TRANSITION FUND
(% of Total Assets)
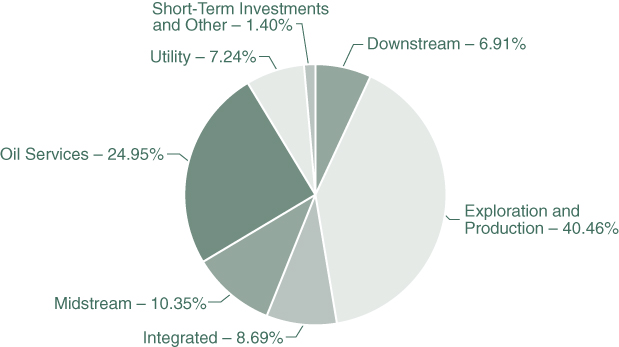
|
TOP TEN HOLDINGS (EXCLUDING MONEY MARKET FUNDS)
|
% TOTAL ASSETS
|
|
EOG Resources, Inc.
|
4.71%
|
|
Solaris Oilfield Infrastructure, Inc.
|
4.51%
|
|
EQT Corp.
|
4.44%
|
|
Halliburton Co.
|
4.41%
|
|
Pioneer Natural Resources Co.
|
4.40%
|
|
Cheniere Energy, Inc.
|
4.40%
|
|
Exxon Mobil Corp.
|
4.40%
|
|
Antero Resources Corp.
|
4.34%
|
|
Chevron Corp.
|
4.29%
|
|
Phillips 66
|
4.16%
|
Note: The Fund concentrates its investments in the Energy industry. For presentation purposes, the Fund uses custom categories.
|
HENNESSY FUNDS
|
1-800-966-4354
|
5
|
COMMON STOCKS – 93.59%
|
Number
|
% of
|
||||||||||
|
|
of Shares
|
Value
|
Net Assets
|
|||||||||
|
Downstream – 6.98%
|
||||||||||||
|
Marathon Petroleum Corp.
|
6,900
|
$
|
602,094
|
2.78
|
%
|
|||||||
|
Phillips 66
|
10,500
|
910,980
|
4.20
|
%
|
||||||||
|
|
1,513,074
|
6.98
|
%
|
|||||||||
|
Exploration & Production – 40.88%
|
||||||||||||
|
Antero Resources Corp. (a)
|
27,000
|
950,400
|
4.38
|
%
|
||||||||
|
Comstock Resources, Inc. (a)
|
19,640
|
334,469
|
1.54
|
%
|
||||||||
|
ConocoPhillips
|
9,145
|
873,530
|
4.03
|
%
|
||||||||
|
Coterra Energy, Inc.
|
26,510
|
763,223
|
3.52
|
%
|
||||||||
|
Diamondback Energy, Inc.
|
6,120
|
772,528
|
3.56
|
%
|
||||||||
|
EOG Resources, Inc.
|
8,830
|
1,030,991
|
4.75
|
%
|
||||||||
|
EQT Corp.
|
24,500
|
973,875
|
4.49
|
%
|
||||||||
|
Magnolia Oil & Gas Corp.
|
21,600
|
501,984
|
2.32
|
%
|
||||||||
|
PDC Energy, Inc.
|
12,090
|
843,157
|
3.89
|
%
|
||||||||
|
Pioneer Natural Resources Co.
|
4,150
|
964,751
|
4.45
|
%
|
||||||||
|
Suncor Energy, Inc. (b)
|
23,860
|
857,528
|
3.95
|
%
|
||||||||
|
|
8,866,436
|
40.88
|
%
|
|||||||||
|
Integrated – 8.77%
|
||||||||||||
|
Chevron Corp.
|
6,000
|
940,020
|
4.33
|
%
|
||||||||
|
Exxon Mobil Corp.
|
11,300
|
963,325
|
4.44
|
%
|
||||||||
|
|
1,903,345
|
8.77
|
%
|
|||||||||
|
Midstream – 4.44%
|
||||||||||||
|
Cheniere Energy, Inc.
|
7,100
|
964,251
|
4.44
|
%
|
||||||||
|
Oil Services – 25.21%
|
||||||||||||
|
Halliburton Co.
|
27,150
|
967,083
|
4.46
|
%
|
||||||||
|
Helmerich & Payne, Inc.
|
12,000
|
552,360
|
2.55
|
%
|
||||||||
|
Newpark Resources, Inc. (a)
|
125,950
|
439,565
|
2.03
|
%
|
||||||||
|
Schlumberger Ltd. (b)
|
23,210
|
905,422
|
4.17
|
%
|
||||||||
|
Select Energy Services, Inc. (a)
|
52,660
|
408,642
|
1.88
|
%
|
||||||||
|
Solaris Oilfield Infrastructure, Inc.
|
87,920
|
989,100
|
4.56
|
%
|
||||||||
|
TechnipFMC PLC (a)(b)
|
65,240
|
451,461
|
2.08
|
%
|
||||||||
|
Tenaris SA – ADR (b)
|
25,000
|
754,500
|
3.48
|
%
|
||||||||
|
|
5,468,133
|
25.21
|
%
|
|||||||||
The accompanying notes are an integral part of these financial statements.
|
WWW.HENNESSYFUNDS.COM
|
6
|
SCHEDULE OF INVESTMENTS
|
|
COMMON STOCKS
|
Number
|
% of
|
||||||||||
|
|
of Shares
|
Value
|
Net Assets
|
|||||||||
|
Utility – 7.31%
|
||||||||||||
|
Freeport-McMoRan, Inc.
|
19,220
|
$
|
779,371
|
3.59
|
%
|
|||||||
|
NextEra Energy, Inc.
|
4,770
|
338,765
|
1.56
|
%
|
||||||||
|
OGE Energy Corp.
|
12,100
|
468,028
|
2.16
|
%
|
||||||||
|
|
1,586,164
|
7.31
|
%
|
|||||||||
|
|
||||||||||||
|
Total Common Stocks
|
||||||||||||
|
(Cost $13,517,516)
|
20,301,403
|
93.59
|
%
|
|||||||||
|
|
||||||||||||
|
PARTNERSHIPS & TRUSTS – 6.01%
|
||||||||||||
|
Midstream – 6.01%
|
||||||||||||
|
MPLX LP
|
15,104
|
488,765
|
2.25
|
%
|
||||||||
|
Plains All American Pipeline LP
|
78,710
|
815,436
|
3.76
|
%
|
||||||||
|
|
||||||||||||
|
Total Partnerships & Trusts
|
||||||||||||
|
(Cost $1,458,831)
|
1,304,201
|
6.01
|
%
|
|||||||||
|
|
||||||||||||
|
SHORT-TERM INVESTMENTS – 0.00%
|
||||||||||||
|
Money Market Funds – 0.00%
|
||||||||||||
|
First American Government Obligations Fund,
|
||||||||||||
|
Institutional Class, 0.22% (c)
|
47
|
47
|
0.00
|
%
|
||||||||
|
|
||||||||||||
|
Total Short-Term Investments
|
||||||||||||
|
(Cost $47)
|
47
|
0.00
|
%
|
|||||||||
|
|
||||||||||||
|
Total Investments
|
||||||||||||
|
(Cost $14,976,394) – 99.60%
|
21,605,651
|
99.60
|
%
|
|||||||||
|
Other Assets in Excess of Liabilities – 0.40%
|
85,760
|
0.40
|
%
|
|||||||||
|
|
||||||||||||
|
TOTAL NET ASSETS – 100.00%
|
$
|
21,691,411
|
100.00
|
%
|
||||||||
Percentages are stated as a percent of net assets.
ADR – American Depositary Receipt
|
(a)
|
Non-income-producing security.
|
|
(b)
|
U.S.-traded security of a foreign corporation.
|
|
(c)
|
The rate listed is the fund’s seven-day yield as of April 30, 2022.
|
The accompanying notes are an integral part of these financial statements.
|
HENNESSY FUNDS
|
1-800-966-4354
|
7
Summary of Fair Value Exposure as of April 30, 2022
The following is a summary of the inputs used to value the Fund’s net assets as of April 30, 2022 (see Note 3 in the accompanying Notes to the Financial Statements):
|
Common Stocks
|
Level 1
|
Level 2
|
Level 3
|
Total
|
||||||||||||
|
Downstream
|
$
|
1,513,074
|
$
|
—
|
$
|
—
|
$
|
1,513,074
|
||||||||
|
Exploration & Production
|
8,866,436
|
—
|
—
|
8,866,436
|
||||||||||||
|
Integrated
|
1,903,345
|
—
|
—
|
1,903,345
|
||||||||||||
|
Midstream
|
964,251
|
—
|
—
|
964,251
|
||||||||||||
|
Oil Services
|
5,468,133
|
—
|
—
|
5,468,133
|
||||||||||||
|
Utility
|
1,586,164
|
—
|
—
|
1,586,164
|
||||||||||||
|
Total Common Stocks
|
$
|
20,301,403
|
$
|
—
|
$
|
—
|
$
|
20,301,403
|
||||||||
|
Partnerships & Trusts
|
||||||||||||||||
|
Midstream
|
$
|
1,304,201
|
$
|
—
|
$
|
—
|
$
|
1,304,201
|
||||||||
|
Total Partnerships & Trusts
|
$
|
1,304,201
|
$
|
—
|
$
|
—
|
$
|
1,304,201
|
||||||||
|
Short-Term Investments
|
||||||||||||||||
|
Money Market Funds
|
$
|
47
|
$
|
—
|
$
|
—
|
$
|
47
|
||||||||
|
Total Short-Term Investments
|
$
|
47
|
$
|
—
|
$
|
—
|
$
|
47
|
||||||||
|
Total Investments
|
$
|
21,605,651
|
$
|
—
|
$
|
—
|
$
|
21,605,651
|
||||||||
The accompanying notes are an integral part of these financial statements.
|
WWW.HENNESSYFUNDS.COM
|
8
|
SCHEDULE OF INVESTMENTS/STATEMENT OF ASSETS AND LIABILITIES
|
Financial Statements
|
Statement of Assets and Liabilities as of April 30, 2022 (Unaudited)
|
|
ASSETS:
|
||||
|
Investments in securities, at value (cost $14,976,394)
|
$
|
21,605,651
|
||
|
Dividends and interest receivable
|
2,943
|
|||
|
Receivable for fund shares sold
|
18,307
|
|||
|
Receivable for securities sold
|
247,191
|
|||
|
Return of capital receivable
|
17,119
|
|||
|
Prepaid expenses and other assets
|
20,842
|
|||
|
Total assets
|
21,912,053
|
|||
|
LIABILITIES:
|
||||
|
Loans payable
|
168,000
|
|||
|
Payable for fund shares redeemed
|
8,069
|
|||
|
Payable to advisor
|
23,530
|
|||
|
Payable to auditor
|
11,504
|
|||
|
Accrued distribution fees
|
1,909
|
|||
|
Accrued service fees
|
739
|
|||
|
Accrued trustees fees
|
6,165
|
|||
|
Accrued expenses and other payables
|
726
|
|||
|
Total liabilities
|
220,642
|
|||
|
NET ASSETS
|
$
|
21,691,411
|
||
|
NET ASSETS CONSISTS OF:
|
||||
|
Capital stock
|
$
|
56,934,742
|
||
|
Accumulated deficit
|
(35,243,331
|
)
|
||
|
Total net assets
|
$
|
21,691,411
|
||
|
NET ASSETS:
|
||||
|
Investor Class
|
||||
|
Shares authorized (no par value)
|
Unlimited
|
|||
|
Net assets applicable to outstanding shares
|
$
|
9,102,899
|
||
|
Shares issued and outstanding
|
436,824
|
|||
|
Net asset value, offering price, and redemption price per share
|
$
|
20.84
|
||
|
Institutional Class
|
||||
|
Shares authorized (no par value)
|
Unlimited
|
|||
|
Net assets applicable to outstanding shares
|
$
|
12,588,512
|
||
|
Shares issued and outstanding
|
594,264
|
|||
|
Net asset value, offering price, and redemption price per share
|
$
|
21.18
|
||
The accompanying notes are an integral part of these financial statements.
|
HENNESSY FUNDS
|
1-800-966-4354
|
9
Financial Statements
|
Statement of Operations for the six months ended April 30, 2022 (Unaudited)
|
|
INVESTMENT INCOME:
|
||||
|
Distributions received from master limited partnerships
|
$
|
67,157
|
||
|
Return of capital on distributions received
|
(67,157
|
)
|
||
|
Dividend income from common stock(1)
|
255,017
|
|||
|
Interest income
|
108
|
|||
|
Total investment income
|
255,125
|
|||
|
EXPENSES:
|
||||
|
Investment advisory fees (See Note 5)
|
119,604
|
|||
|
Administration, accounting, custody, and transfer agent fees (See Note 5)
|
16,877
|
|||
|
Federal and state registration fees
|
16,290
|
|||
|
Compliance expense (See Note 5)
|
15,156
|
|||
|
Audit fees
|
11,496
|
|||
|
Sub-transfer agent expenses – Investor Class (See Note 5)
|
5,490
|
|||
|
Sub-transfer agent expenses – Institutional Class (See Note 5)
|
3,947
|
|||
|
Trustees’ fees and expenses
|
8,394
|
|||
|
Distribution fees – Investor Class (See Note 5)
|
5,587
|
|||
|
Reports to shareholders
|
4,251
|
|||
|
Service fees – Investor Class (See Note 5)
|
3,724
|
|||
|
Interest expense (See Note 7)
|
261
|
|||
|
Other expenses
|
2,593
|
|||
|
Total expenses before waiver
|
213,670
|
|||
|
Service provider expense waiver (See Note 5)
|
(16,877
|
)
|
||
|
Net expenses
|
196,793
|
|||
|
NET INVESTMENT INCOME
|
$
|
58,332
|
||
|
REALIZED AND UNREALIZED GAINS (LOSSES):
|
||||
|
Net realized gain on investments
|
$
|
815,269
|
||
|
Net change in unrealized appreciation/depreciation on investments
|
4,169,030
|
|||
|
Net gain on investments
|
4,984,299
|
|||
|
NET INCREASE IN NET ASSETS RESULTING FROM OPERATIONS
|
$
|
5,042,631
|
||
|
(1)
|
Net of foreign taxes withheld of $2,515.
|
The accompanying notes are an integral part of these financial statements.
|
WWW.HENNESSYFUNDS.COM
|
10
|
STATEMENT OF OPERATIONS/STATEMENTS OF CHANGES IN NET ASSETS
|
Financial Statements
|
Statements of Changes in Net Assets
|
|
Six Months Ended
|
||||||||
|
April 30, 2022
|
Year Ended
|
|||||||
|
(Unaudited)
|
October 31, 2021
|
|||||||
|
OPERATIONS:
|
||||||||
|
Net investment income
|
$
|
58,332
|
$
|
45,083
|
||||
|
Net realized gain on investments
|
815,269
|
1,234,155
|
||||||
|
Net change in unrealized
|
||||||||
|
appreciation/depreciation on investments
|
4,169,030
|
5,107,361
|
||||||
|
Net increase in net assets resulting from operations
|
5,042,631
|
6,386,599
|
||||||
|
DISTRIBUTIONS TO SHAREHOLDERS:
|
||||||||
|
Distributable earnings – Investor Class
|
(751,147
|
)
|
—
|
|||||
|
Distributable earnings – Institutional Class
|
(1,188,176
|
)
|
—
|
|||||
|
Total distributions
|
(1,939,323
|
)
|
—
|
|||||
|
CAPITAL SHARE TRANSACTIONS:
|
||||||||
|
Proceeds from shares subscribed – Investor Class
|
3,732,351
|
7,710,426
|
||||||
|
Proceeds from shares subscribed – Institutional Class
|
3,075,803
|
5,598,042
|
||||||
|
Dividends reinvested – Investor Class
|
698,292
|
—
|
||||||
|
Dividends reinvested – Institutional Class
|
1,181,355
|
—
|
||||||
|
Cost of shares redeemed – Investor Class
|
(3,162,354
|
)
|
(6,158,757
|
)
|
||||
|
Cost of shares redeemed – Institutional Class
|
(3,188,118
|
)
|
(3,599,017
|
)
|
||||
|
Net increase in net assets derived
|
||||||||
|
from capital share transactions
|
2,337,329
|
3,550,694
|
||||||
|
TOTAL INCREASE IN NET ASSETS
|
5,440,637
|
9,937,293
|
||||||
|
NET ASSETS:
|
||||||||
|
Beginning of period
|
16,250,774
|
6,313,481
|
||||||
|
End of period
|
$
|
21,691,411
|
$
|
16,250,774
|
||||
|
CHANGES IN SHARES OUTSTANDING:
|
||||||||
|
Shares sold – Investor Class
|
190,543
|
521,054
|
||||||
|
Shares sold – Institutional Class
|
171,535
|
329,240
|
||||||
|
Shares issued to holders as reinvestment
|
||||||||
|
of dividends – Investor Class
|
44,449
|
—
|
||||||
|
Shares issued to holders as reinvestment
|
||||||||
|
of dividends – Institutional Class
|
74,066
|
—
|
||||||
|
Shares redeemed – Investor Class
|
(169,704
|
)
|
(435,171
|
)
|
||||
|
Shares redeemed – Institutional Class
|
(159,430
|
)
|
(252,362
|
)
|
||||
|
Net increase in shares outstanding
|
151,459
|
162,761
|
||||||
The accompanying notes are an integral part of these financial statements.
|
HENNESSY FUNDS
|
1-800-966-4354
|
11
Financial Statements
|
Financial Highlights
|
For an Investor Class share outstanding throughout each period
|
Six Months Ended
|
||||
|
April 30, 2022
|
||||
|
(Unaudited)
|
||||
|
PER SHARE DATA:
|
||||
|
Net asset value, beginning of period
|
$
|
18.31
|
||
|
Income from investment operations:
|
||||
|
Net investment income (loss)(2)
|
0.04
|
|||
|
Net realized and unrealized gains (losses) on investments
|
4.56
|
|||
|
Total from investment operations
|
4.60
|
|||
|
Less distributions:
|
||||
|
Dividends from net investment income
|
(2.07
|
)
|
||
|
Total distributions
|
(2.07
|
)
|
||
|
Net asset value, end of period
|
$
|
20.84
|
||
|
TOTAL RETURN
|
28.78
|
%(3)
|
||
|
SUPPLEMENTAL DATA AND RATIOS:
|
||||
|
Net assets, end of period (millions)
|
$
|
9.10
|
||
|
Ratio of expenses to average net assets:
|
||||
|
Before expense reimbursement
|
2.44
|
%(4)
|
||
|
After expense reimbursement
|
2.26
|
%(4)(6)
|
||
|
Ratio of net investment income (loss) to average net assets:
|
||||
|
Before expense reimbursement
|
0.25
|
%(4)
|
||
|
After expense reimbursement
|
0.43
|
%(4)
|
||
|
Portfolio turnover rate(7)
|
16
|
%(3)
|
||
|
(1)
|
The period ended October 31, 2018, consists of 11 months due to the Fund’s fiscal year end change from November 30 to October 31, effective October 26, 2018.
|
|
(2)
|
Calculated using the average shares outstanding method.
|
|
(3)
|
Not annualized.
|
|
(4)
|
Annualized.
|
|
(5)
|
The Fund had an expense limitation agreement in place through October 25, 2020.
|
|
(6)
|
Certain service provider expenses were voluntarily waived during the period.
|
|
(7)
|
Calculated on the basis of the Fund as a whole.
|
The accompanying notes are an integral part of these financial statements.
|
WWW.HENNESSYFUNDS.COM
|
12
|
FINANCIAL HIGHLIGHTS — INVESTOR CLASS
|
|
Year Ended October 31,
|
Period Ended
October 31,
|
Year Ended
November 30,
|
||||||||||||||||||||
|
2021
|
2020
|
2019
|
2018(1)
|
2017
|
2016
|
|||||||||||||||||
|
$
|
8.74
|
$
|
14.08
|
$
|
18.32
|
$
|
19.47
|
$
|
20.54
|
$
|
16.41
|
|||||||||||
|
0.06
|
0.04
|
(0.07
|
)
|
(0.20
|
)
|
(0.23
|
)
|
(0.15
|
)
|
|||||||||||||
|
9.51
|
(5.38
|
)
|
(4.17
|
)
|
(0.95
|
)
|
(0.84
|
)
|
4.28
|
|||||||||||||
|
9.57
|
(5.34
|
)
|
(4.24
|
)
|
(1.15
|
)
|
(1.07
|
)
|
4.13
|
|||||||||||||
|
—
|
—
|
—
|
—
|
—
|
—
|
|||||||||||||||||
|
—
|
—
|
—
|
—
|
—
|
—
|
|||||||||||||||||
|
$
|
18.31
|
$
|
8.74
|
$
|
14.08
|
$
|
18.32
|
$
|
19.47
|
$
|
20.54
|
|||||||||||
|
109.50
|
%
|
-37.93
|
%
|
-23.14
|
%
|
-5.91
|
%(3)
|
-5.21
|
%
|
25.17
|
%
|
|||||||||||
|
$
|
6.80
|
$
|
2.50
|
$
|
6.83
|
$
|
18.16
|
$
|
22.66
|
$
|
19.64
|
|||||||||||
|
2.96
|
%
|
2.59
|
%
|
1.97
|
%
|
1.82
|
%(4)
|
1.87
|
%
|
1.89
|
%
|
|||||||||||
|
2.74
|
%(6)
|
2.03
|
%(5)(6)
|
1.97
|
%
|
1.82
|
%(4)
|
1.87
|
%
|
1.89
|
%
|
|||||||||||
|
0.16
|
%
|
(0.18
|
)%
|
(0.46
|
)%
|
(1.05
|
)%(4)
|
(1.21
|
)%
|
(0.92
|
)%
|
|||||||||||
|
0.38
|
%
|
0.38
|
%
|
(0.46
|
)%
|
(1.05
|
)%(4)
|
(1.21
|
)%
|
(0.92
|
)%
|
|||||||||||
|
74
|
%
|
73
|
%
|
87
|
%
|
72
|
%(3)
|
84
|
%
|
83
|
%
|
|||||||||||
The accompanying notes are an integral part of these financial statements.
|
HENNESSY FUNDS
|
1-800-966-4354
|
13
Financial Statements
|
Financial Highlights
|
For an Institutional Class share outstanding throughout each period
|
Six Months Ended
|
||||
|
April 30, 2022
|
||||
|
(Unaudited)
|
||||
|
PER SHARE DATA:
|
||||
|
Net asset value, beginning of period
|
$
|
18.60
|
||
|
Income from investment operations:
|
||||
|
Net investment income (loss)(2)
|
0.07
|
|||
|
Net realized and unrealized gains (losses) on investments
|
4.62
|
|||
|
Total from investment operations
|
4.69
|
|||
|
Less distributions:
|
||||
|
Dividends from net investment income
|
(2.11
|
)
|
||
|
Total distributions
|
(2.11
|
)
|
||
|
Net asset value, end of period
|
$
|
21.18
|
||
|
TOTAL RETURN
|
28.95
|
%(3)
|
||
|
SUPPLEMENTAL DATA AND RATIOS:
|
||||
|
Net assets, end of period (millions)
|
$
|
12.59
|
||
|
Ratio of expenses to average net assets:
|
||||
|
Before expense reimbursement
|
2.11
|
%(4)
|
||
|
After expense reimbursement
|
1.93
|
%(4)(6)
|
||
|
Ratio of net investment income (loss) to average net assets:
|
||||
|
Before expense reimbursement
|
0.55
|
%(4)
|
||
|
After expense reimbursement
|
0.73
|
%(4)
|
||
|
Portfolio turnover rate(7)
|
16
|
%(3)
|
||
|
(1)
|
The period ended October 31, 2018, consists of 11 months due to the Fund’s fiscal year end change from November 30 to October 31, effective October 26, 2018.
|
|
(2)
|
Calculated using the average shares outstanding method.
|
|
(3)
|
Not annualized.
|
|
(4)
|
Annualized.
|
|
(5)
|
The Fund had an expense limitation agreement in place through October 25, 2020.
|
|
(6)
|
Certain service provider expenses were voluntarily waived during the period.
|
|
(7)
|
Calculated on the basis of the Fund as a whole.
|
The accompanying notes are an integral part of these financial statements.
|
WWW.HENNESSYFUNDS.COM
|
14
|
FINANCIAL HIGHLIGHTS — INSTITUTIONAL CLASS
|
|
Year Ended October 31,
|
Period Ended
October 31,
|
Year Ended
November 30,
|
||||||||||||||||||||
|
2021
|
2020
|
2019
|
2018(1)
|
2017
|
2016
|
|||||||||||||||||
|
$
|
8.85
|
$
|
14.26
|
$
|
18.50
|
$
|
19.61
|
$
|
20.64
|
$
|
16.46
|
|||||||||||
|
0.07
|
0.12
|
(0.02
|
)
|
(0.15
|
)
|
(0.19
|
)
|
(0.11
|
)
|
|||||||||||||
|
9.68
|
(5.50
|
)
|
(4.22
|
)
|
(0.96
|
)
|
(0.84
|
)
|
4.32
|
|||||||||||||
|
9.75
|
(5.38
|
)
|
(4.24
|
)
|
(1.11
|
)
|
(1.03
|
)
|
4.21
|
|||||||||||||
|
—
|
(0.03
|
)
|
—
|
—
|
—
|
(0.03
|
)
|
|||||||||||||||
|
—
|
(0.03
|
)
|
—
|
—
|
—
|
(0.03
|
)
|
|||||||||||||||
|
$
|
18.60
|
$
|
8.85
|
$
|
14.26
|
$
|
18.50
|
$
|
19.61
|
$
|
20.64
|
|||||||||||
|
110.17
|
%
|
-37.80
|
%
|
-22.92
|
%
|
-5.66
|
%(3)
|
-4.99
|
%
|
25.61
|
%
|
|||||||||||
|
$
|
9.45
|
$
|
3.82
|
$
|
44.37
|
$
|
78.81
|
$
|
122.45
|
$
|
126.92
|
|||||||||||
|
2.61
|
%
|
2.01
|
%
|
1.66
|
%
|
1.57
|
%(4)
|
1.62
|
%
|
1.60
|
%
|
|||||||||||
|
2.39
|
%(6)
|
1.77
|
%(5)(6)
|
1.66
|
%
|
1.57
|
%(4)
|
1.62
|
%
|
1.60
|
%
|
|||||||||||
|
0.22
|
%
|
0.79
|
%
|
(0.12
|
)%
|
(0.79
|
)%(4)
|
(0.98
|
)%
|
(0.65
|
)%
|
|||||||||||
|
0.44
|
%
|
1.03
|
%
|
(0.12
|
)%
|
(0.79
|
)%(4)
|
(0.98
|
)%
|
(0.65
|
)%
|
|||||||||||
|
74
|
%
|
73
|
%
|
87
|
%
|
72
|
%(3)
|
84
|
%
|
83
|
%
|
|||||||||||
The accompanying notes are an integral part of these financial statements.
|
HENNESSY FUNDS
|
1-800-966-4354
|
15
Financial Statements
|
Notes to the Financial Statements April 30, 2022 (Unaudited)
|
1). ORGANIZATION
The Hennessy Energy Transition Fund (the “Fund”) is a series of Hennessy Funds Trust (the “Trust”), which was organized as a Delaware statutory trust on September 17, 1992. The Fund is an open-end
management investment company registered under the Investment Company Act of 1940, as amended. The investment objective of the Fund is to seek total return. The Fund is a diversified fund.
The Fund offers Investor Class and Institutional Class shares. Each class of shares differs principally in its respective 12b-1 distribution and service, shareholder servicing, and
sub-transfer agent expenses. There are no sales charges. Each class has identical rights to earnings, assets, and voting privileges, except for class-specific expenses and exclusive rights to vote on matters affecting only one
class.
As an investment company, the Fund follows the investment company accounting and reporting guidance of the Financial Accounting Standards Board (“FASB”) Accounting Standard
Codification Topic 946 “Financial Services—Investment Companies.”
2). SIGNIFICANT ACCOUNTING POLICIES
The following is a summary of significant accounting policies consistently followed by the Fund in the preparation of the financial statements. These policies conform to U.S. generally accepted
accounting principles (“GAAP”).
|
a).
|
Securities Valuation – All investments in securities are valued in accordance with the Fund’s valuation policies and procedures, as described in Note 3.
|
|
b).
|
Federal Income Taxes – The Fund has elected to be taxed as a regulated investment company and intends to distribute substantially all of its taxable income to its shareholders and otherwise
comply with the provisions of the Internal Revenue Code of 1986, as amended, applicable to regulated investment companies. As a result, the Fund has made no provision for federal income taxes or excise taxes. Net
investment income/loss and realized gains/losses for federal income tax purposes may differ from those reported in the financial statements because of temporary book-basis and tax-basis differences. Temporary differences
are primarily the result of the treatment of wash sales for tax reporting purposes and investments in companies organized as partnerships for tax purposes. The Fund recognizes interest and penalties related to income tax
benefits, if any, in the Statement of Operations as an income tax expense. Distributions from net realized gains for book purposes may include short-term capital gains, which are included as ordinary income to shareholders
for tax purposes. The Fund may utilize equalization accounting for tax purposes and designate earnings and profits, including net realized gains distributed to shareholders on redemption of shares, as part of the dividends
paid deduction for income tax purposes.
|
|
c).
|
Accounting for Uncertainty in Income Taxes – The Fund has accounting policies regarding recognition and measurement of tax positions taken or expected to be taken on a tax return. The tax returns
of the Fund for the prior three fiscal years are open for examination. The Fund has reviewed all open tax years in major tax jurisdictions and concluded that there is no impact on the Fund’s net assets and no tax liability
resulting from unrecognized tax benefits relating to uncertain income tax positions taken or expected to be taken on a tax return. The Fund’s major tax jurisdictions are U.S. federal and Delaware.
|
|
WWW.HENNESSYFUNDS.COM
|
16
|
NOTES TO THE FINANCIAL STATEMENTS
|
|
d).
|
Income and Expenses – Dividend income is recognized on the ex-dividend date or as soon as information is available to the Fund. Interest income, which includes the amortization of premium and
accretion of discount, is recognized on an accrual basis. Market discounts, original issue discounts, and market premiums on debt securities are accreted or amortized to interest income over the life of a security with a
corresponding increase or decrease, as applicable, in the cost basis of such security using the yield-to-maturity method or, where applicable, the first call date of the security. Other non-cash dividends are recognized as
investment income at the fair value of the property received. The Fund is charged for those expenses that are directly attributable to its portfolio, such as advisory, administration, and certain shareholder service fees.
Income, expenses (other than expenses attributable to a specific class), and realized and unrealized gains/losses on investments are allocated to each class of shares based on such class’s net assets. Distributions
received from the Fund’s investments in master limited partnerships (“MLPs”) generally consist of ordinary income, capital gains, and return of capital. The Fund records investment income on the ex-date of the
distributions. For financial statement purposes, the Fund uses return of capital and income estimates to allocate the dividend income received. Such estimates are based on historical information available from the MLPs and
other industry sources. These estimates may subsequently be revised based on information received from the MLPs after their tax reporting periods are concluded, as the actual character of these distributions is not known
until after the fiscal year end of the Fund.
|
|
e).
|
Distributions to Shareholders – Dividends from net investment income for the Fund, if any, are declared and paid annually, usually in December. Distributions of net realized capital gains, if
any, are declared and paid annually, usually in December.
|
|
f).
|
Security Transactions – Investment and shareholder transactions are recorded on the trade date. The Fund determines the realized gain/loss from an investment transaction by comparing the original
cost of the security lot sold with the net sale proceeds. Discounts and premiums on securities purchased are accreted or amortized, respectively, over the life of each such security.
|
|
g).
|
Use of Estimates – Preparing financial statements in accordance with GAAP requires management to make estimates and assumptions that affect the reported amounts of assets and liabilities and
disclosure of contingent assets and liabilities at the date of the financial statements, as well as the reported change in net assets during the reporting period. Actual results could differ from those estimates.
|
|
h).
|
Share Valuation – The net asset value (“NAV”) per share of the Fund is calculated by dividing (i) the total value of the securities held by the Fund, plus cash and other assets, minus all
liabilities (including estimated accrued expenses) by (ii) the total number of Fund shares outstanding, rounded to the nearest $0.01. Fund shares are not priced on days the New York Stock Exchange is closed for trading.
The offering and redemption price per share for the Fund is equal to the Fund’s NAV per share.
|
|
i).
|
Partnership Accounting Policy – To the extent the Fund receives distributions from underlying partnerships in which it invests, the Fund records its pro rata share of income/loss and capital
gains/losses and accordingly adjusts the cost basis of the underlying partnerships for return of capital.
|
|
j).
|
Recent Accounting Pronouncements and Regulatory Updates – In October 2020, the Securities and Exchange Commission (“SEC”) adopted new regulations governing the use of derivatives by registered
investment companies (“Rule 18f-4”). Rule 18f-4 imposes limits on the amount of derivatives a fund can enter into, eliminates the asset segregation framework currently used by funds to comply with Section 18 of
|
|
HENNESSY FUNDS
|
1-800-966-4354
|
17
|
the 1940 Act, and requires funds whose use of derivatives is greater than a limited specified amount to establish and maintain a comprehensive derivatives risk management program and appoint a
derivatives risk manager. Funds are required to comply with Rule 18f-4 by August 19, 2022. The impact, if any, that Rule 18f-4 will have on the availability, liquidity, and performance of derivatives is unclear. Management
is currently evaluating the potential impact of Rule 18f-4 on the Fund. When fully implemented, Rule 18f-4 may require changes in how the Fund uses derivatives, adversely affect the Fund’s performance, and increase costs
related to the Fund’s use of derivatives.
|
|
|
In December 2020, the SEC adopted a new rule providing a framework for fund valuation practices (“Rule 2a-5”). Rule 2a-5
establishes requirements for determining fair value in good faith for purposes of the 1940 Act. Rule 2a-5 permits fund boards to designate certain parties to perform fair value determinations, subject to board oversight
and certain other conditions. Rule 2a-5 also defines when market quotations are “readily available” for purposes of the 1940 Act and the threshold for determining whether a fund must fair value a security. In connection
with Rule 2a-5, the SEC also adopted related recordkeeping requirements and is rescinding previously issued guidance, including with respect to the role of a board in determining fair value and the accounting and auditing
of fund investments. Funds must comply with the rules by September 8, 2022. Management is currently assessing the potential impact of the new rules on the Fund’s financial statements.
|
3). SECURITIES VALUATION
The Fund follows its valuation policies and procedures in determining its net asset value and, in preparing these financial statements, the fair value accounting standards that establish an authoritative
definition of fair value and set out a hierarchy for measuring fair value. These standards require additional disclosures about the various inputs and valuation techniques used to develop the measurements of fair value and a
discussion of changes in valuation techniques and related inputs during the period. These inputs are summarized in the three broad levels listed below:
|
Level 1 –
|
Unadjusted, quoted prices in active markets for identical instruments that the Fund has the ability to access at the date of measurement.
|
|
|
Level 2 –
|
Other significant observable inputs (including, but not limited to, quoted prices in active markets for similar instruments, quoted prices in markets that are not active for identical or similar
instruments, and model-derived valuations in which all significant inputs and significant value drivers are observable in active markets, such as interest rates, prepayment speeds, credit risk curves, default rates, and
similar data).
|
|
|
Level 3 –
|
Significant unobservable inputs (including the Fund’s own assumptions about what market participants would use to price the asset or liability based on the best available information) when
observable inputs are unavailable.
|
The following is a description of the valuation techniques applied to the Fund’s major categories of assets and liabilities on a recurring basis:
|
Equity Securities – Equity securities, including common stocks, preferred stocks, foreign-issued common stocks, exchange-traded funds, closed-end mutual
funds, partnerships, rights, MLPs, and real estate investment trusts, that are traded on a securities exchange for which a last-quoted sales price is readily available generally are valued at the last sales price as
reported by the primary exchange on which the securities are listed. Securities listed on The Nasdaq Stock Market (“Nasdaq”)
|
|
WWW.HENNESSYFUNDS.COM
|
18
|
NOTES TO THE FINANCIAL STATEMENTS
|
|
generally are valued at the Nasdaq Official Closing Price, which may differ from the last sales price reported. Securities traded on a securities exchange for which a last-quoted sales price is
not readily available generally are valued at the mean between the bid and ask prices. To the extent these securities are actively traded and valuation adjustments are not applied, they are classified in Level 1 of the
fair value hierarchy. Securities traded on foreign exchanges generally are not valued at the same time the Fund calculates its NAV because most foreign markets close well before such time. The earlier close of most foreign
markets gives rise to the possibility that significant events, including broad market moves, may have occurred in the interim. In certain circumstances, it may be determined that a foreign security needs to be fair valued
because it appears that the value of the security might have been materially affected by events occurring after the close of the market in which the security is principally traded, but before the time the Fund calculates
its NAV, such as by a development that affects an entire market or region (e.g., a weather-related event) or a potentially global development (e.g., a terrorist attack that may be expected to have an effect on investor
expectations worldwide).
|
|
|
Registered Investment Companies – Investments in open-end registered investment companies, commonly referred to as mutual funds, generally are priced at
the ending NAV provided by the applicable mutual fund’s service agent and are classified in Level 1 of the fair value hierarchy.
|
|
|
Debt Securities – Debt securities, including corporate bonds, asset-backed securities, mortgage-backed securities, municipal bonds, U.S. Treasuries, and
U.S. government agency issues, are generally valued at market on the basis of valuations furnished by an independent pricing service that utilizes both dealer-supplied valuations and formula-based techniques. The pricing
service may consider recently executed transactions in securities of the issuer or comparable issuers, market price quotations (where observable), bond spreads, and fundamental data relating to the issuer. In addition, the
model may incorporate observable market data, such as reported sales of similar securities, broker quotes, yields, bids, offers, and reference data. Certain securities are valued primarily using dealer quotations. These
securities are generally classified in Level 2 of the fair value hierarchy.
|
|
|
Short-Term Securities – Short-term equity investments, including money market funds, are valued in the manner specified above for equity securities.
Short-term debt investments with an original term to maturity of 60 days or less are valued at amortized cost, which approximates fair market value. If the original term to maturity of a short-term debt investment exceeds
60 days, then the values as of the 61st day prior to maturity are amortized. Amortized cost is not used if its use would be inappropriate due to credit or other impairments of the issuer, in which case the security’s fair
value would be determined as described below. Short-term securities are generally classified in Level 1 or Level 2 of the fair value hierarchy depending on the inputs used and market activity levels for specific
securities.
|
The Board of Trustees of the Fund (the “Board”) has adopted fair value pricing procedures that are followed when a price for a security is not readily available or if a significant
event has occurred that indicates the closing price of a security no longer represents the true value of that security. Fair value pricing determinations are made in good faith in accordance with these procedures. There are
numerous criteria considered in determining a fair value of a security, such as the trading volume of a security and markets, the values of other similar securities, and news events with direct bearing on a security or markets.
Fair value pricing results in an estimated price for a security that
|
HENNESSY FUNDS
|
1-800-966-4354
|
19
reflects the amount the Fund might reasonably expect to receive in a current sale. Depending on the relative significance of the valuation inputs, these securities may be classified in either Level 2 or
Level 3 of the fair value hierarchy.
The fair value of foreign securities may be determined with the assistance of a pricing service using correlations between the movement of prices of such securities and indices of
domestic securities and other appropriate indicators, such as closing market prices of relevant American Depositary Receipts or futures contracts. Using fair value pricing means that the Fund’s NAV reflects the affected portfolio
securities’ values as determined by the Board or its designee, pursuant to the fair value pricing procedures adopted by the Board, instead of being determined by the market. Using a fair value pricing methodology to price a
foreign security may result in a value that is different from such foreign security’s most recent closing price and from the value used by other investment companies to calculate their NAVs. Such securities are generally
classified in Level 2 of the fair value hierarchy. Because the Fund may invest in foreign securities, the value of the Fund’s portfolio securities may change on days when a shareholder is unable to purchase or redeem Fund shares.
The Board has delegated day-to-day valuation matters to the Valuation and Liquidity Committee comprising representatives from Hennessy Advisors, Inc., the Fund’s investment advisor
(the “Advisor”). The function of the Valuation and Liquidity Committee, among other things, is to value securities where current and reliable market quotations are not readily available. All actions taken by the Valuation and
Liquidity Committee are reviewed by the Board.
The Fund has performed an analysis of all existing investments to determine the significance and character of all inputs to their fair value determinations. Various inputs are used to
determine the value of the Fund’s investments. The inputs or methodology used for valuing securities are not necessarily an indication of the risk associated with investing in those securities. Details related to the fair value
hierarchy of the Fund’s securities as of April 30, 2022, are included in the Schedule of Investments.
4). INVESTMENT TRANSACTIONS
Purchases and sales of investment securities (excluding government and short-term investments) for the Fund during the six months ended April 30, 2022, were 3,949,026 and $3,031,834, respectively.
There were no purchases or sales/maturities of long-term U.S. government securities for the Fund during the six months ended April 30, 2022.
5). INVESTMENT ADVISORY FEE AND OTHER TRANSACTIONS WITH AFFILIATES
The Advisor provides the Fund with investment advisory services under an Investment Advisory Agreement. The Advisor furnishes all investment advice, office space, and facilities and most of the personnel
needed by the Fund. As compensation for its services, the Advisor is entitled to a monthly fee from the Fund. The fee is based on the average daily net assets of the Fund at an annual rate of 1.25 %. The net investment advisory
fees expensed by the Fund during the six months ended April 30, 2022, are included in the Statement of Operations.
Prior to January 31, 2022, the Advisor delegated the day-to-day management of the Fund to a sub-advisor. Effective January 31, 2022, the sub-advisory agreement between BP Capital Fund
Advisors, LLC and the Advisor was terminated. The Advisor paid the sub-advisory fees from its own assets, and these fees were not an additional expense of the Fund. From November 1, 2021, through January 31, 2022, the Advisor (not
the Fund) paid a sub-advisory fee at the rate of 0.40% of the daily net assets of the Fund.
|
WWW.HENNESSYFUNDS.COM
|
20
|
NOTES TO THE FINANCIAL STATEMENTS
|
From October 26, 2018, through October 25, 2020, the Advisor contractually agreed to limit total annual operating expenses to 2.00% of the Fund’s net assets for Investor Class shares
and 1.75% of the Fund’s net assets for Institutional Class shares (in each case, excluding all federal, state, and local taxes, interest, brokerage commissions, dividend and interest expenses on short sales, extraordinary items,
and acquired fund fees and expenses and other costs incurred in connection with the purchase and sale of securities).
For three years following the date on which expenses were waived or incurred, the Advisor may recoup waived or reimbursed expenses from the Fund if total operating expenses, including
such recoupment, does not exceed the expense limitation in effect (i) at the time the Advisor waived or reimbursed such expenses and (ii) at the time the Advisor recoups such expenses. As of April 30, 2022, expenses subject to
potential recovery were $22,749 for Investor Class shares and $38,580 for Institutional Class shares, both of which expire in fiscal year 2023. The Advisor did not recoup expenses from the Fund during the six months ended April
30, 2022.
The Board has approved a Shareholder Servicing Agreement for Investor Class shares of the Fund, which compensates the Advisor for the non-investment advisory services it provides to
the Fund. The Shareholder Servicing Agreement provides for a monthly fee paid to the Advisor at an annual rate of 0.10% of the average daily net assets of the Fund attributable to Investor Class shares. The shareholder service
fees expensed by the Fund during the six months ended April 30, 2022, are included in the Statement of Operations.
The Fund has adopted a plan pursuant to Rule 12b-1 under the Investment Company Act of 1940, as amended, that authorizes payments in connection with the distribution of Fund shares at
an annual rate of up to 0.25% of the Fund’s average daily net assets attributable to Investor Class shares. Even though the authorized rate is up to 0.25%, the Fund is currently only using up to 0.15% of its average daily net
assets attributable to Investor Class shares for such purpose. Amounts paid under the plan may be spent on any activities or expenses primarily intended to result in the sale of shares, including, but not limited to, advertising,
shareholder account servicing, printing and mailing of prospectuses to other than current shareholders, printing and mailing of sales literature, and compensation for sales and marketing activities or to financial institutions and
others, such as dealers and distributors. The distribution fees expensed by the Fund during the six months ended April 30, 2022, are included in the Statement of Operations.
The Fund has entered into agreements with various brokers, dealers, and financial intermediaries in connection with the sale of Fund shares. The agreements provide for periodic
payments of sub-transfer agent expenses by the Fund to the brokers, dealers, and financial intermediaries for providing certain shareholder maintenance services. These shareholder services include the pre-processing and quality
control of new accounts, shareholder correspondence, answering customer inquiries regarding account status, and facilitating shareholder telephone transactions. The sub-transfer agent fees expensed by the Fund during the six
months ended April 30, 2022, are included in the Statement of Operations.
U.S. Bancorp Fund Services, LLC, d/b/a U.S. Bank Global Fund Services (“Fund Services”) provides the Fund with administrative, accounting, and transfer agent services. As
administrator, Fund Services is responsible for activities such as (i) preparing various federal and state regulatory filings, reports, and returns for the Fund, (ii) preparing reports and materials to be supplied to the Board,
(iii) monitoring the activities of the Fund’s custodian, transfer agent, and accountants, and (iv) coordinating the preparation and payment of the Fund’s expenses and reviewing the Fund’s expense accruals. U.S. Bank N.A., an
affiliate of Fund Services, serves as the Fund’s custodian. The servicing
|
HENNESSY FUNDS
|
1-800-966-4354
|
21
agreements between the Trust, Fund Services, and U.S. Bank N.A. contain a fee schedule that is inclusive of administrative, accounting, custody, and transfer agent fees. The administrative, accounting,
custody, and transfer agent fees expensed by the Fund during the six months ended April 30, 2022, are included in the Statement of Operations. Fund Services has voluntarily waived all or a portion of its fees for the Fund. The
fees voluntarily waived by Fund Services during the six months ended April 30, 2022, are included in the Statement of Operations.
Quasar Distributors, LLC (“Quasar”), a wholly owned broker-dealer subsidiary of Foreside Financial Group, LLC, acts as the Fund’s principal underwriter in a continuous public offering
of Fund shares.
The officers of the Fund are affiliated with the Advisor. With the exception of the Chief Compliance Officer and the Senior Compliance Officer, such officers receive no compensation
from the Fund for serving in their respective roles. The Fund, along with the other funds in the Hennessy Funds family (collectively, the “Hennessy Funds”), makes reimbursement payments on an equal basis to the Advisor for a
portion of the salary and benefits associated with the office of the Chief Compliance Officer and for all of the salary and benefits associated with the office of the Senior Compliance Officer. The compliance fees expensed by the
Fund during the six months ended April 30, 2022, are included in the Statement of Operations.
6). GUARANTEES AND INDEMNIFICATIONS
Under the Hennessy Funds’ organizational documents, their officers and trustees are indemnified by the Hennessy Funds against certain liabilities arising out of the performance of their duties to the
Hennessy Funds. Additionally, in the normal course of business, the Hennessy Funds enter into contracts with service providers that contain general indemnification clauses. The Fund’s maximum exposure under these arrangements is
unknown as this would involve future claims that may be made against the Fund that have not yet occurred. Currently, the Fund expects the risk of loss to be remote.
7). LINE OF CREDIT
The Fund has an uncommitted line of credit with the other Hennessy Funds in the amount of the lesser of (i) $100,000,000 or (ii) 33.33% of each Hennessy Fund’s net assets, or 30% for the Hennessy Gas
Utility Fund and 10% for the Hennessy Balanced Fund. The line of credit is intended to provide any necessary short-term financing in connection with shareholder redemptions, subject to certain restrictions. The credit facility is
with the Hennessy Funds’ custodian bank, U.S. Bank N.A. Borrowings under this arrangement bear interest at the bank’s prime rate and are secured by all of the Fund’s assets (as to its own borrowings only). During the six months
ended April 30, 2022, the Fund had an outstanding average daily balance and a weighted average interest rate of $14,812 and 3.50%, respectively. The interest expensed by the Fund during the six months ended April 30, 2022, is
included in the Statement of Operations. The maximum amount outstanding for the Fund during the period was $529,000. As of April 30, 2022, the Fund had a loan payable of $168,000.
|
WWW.HENNESSYFUNDS.COM
|
22
|
NOTES TO THE FINANCIAL STATEMENTS
|
8). FEDERAL TAX INFORMATION
As of October 31, 2021, the Fund’s most recent fiscal year end, the components of accumulated earnings (losses) for income tax purposes were as follows:
|
Investments
|
||||
|
Cost of investments for tax purposes
|
$
|
14,993,677
|
||
|
Gross tax unrealized appreciation
|
$
|
3,082,255
|
||
|
Gross tax unrealized depreciation
|
(1,734,192
|
)
|
||
|
Net tax unrealized appreciation/(depreciation)
|
$
|
1,348,063
|
||
|
Undistributed ordinary income
|
$
|
1,939,323
|
||
|
Undistributed long-term capital gains
|
—
|
|||
|
Total distributable earnings
|
$
|
1,939,323
|
||
|
Other accumulated gain/(loss)
|
$
|
(41,634,025
|
)
|
|
|
Total accumulated gain/(loss)
|
$
|
(38,346,639
|
)
|
|
The difference between book-basis unrealized appreciation/depreciation and tax-basis unrealized appreciation/depreciation (as shown above) is attributable primarily to wash sales and
partnership adjustments.
As of October 31, 2021, the Fund had $22,971,925 in unlimited long-term and $18,662,100 in unlimited short-term capital loss carryforwards.
Capital losses sustained in or after fiscal year 2012 can be carried forward indefinitely, but any such loss retains the character of the original loss and must be utilized prior to
any loss incurred before fiscal year 2012. As a result of this ordering rule, capital loss carryforwards incurred prior to fiscal year 2012 may be more likely to expire unused. Capital losses sustained prior to fiscal year 2012
can be carried forward for eight years and can be carried forward as short-term capital losses regardless of the character of the original loss.
As of October 31, 2021, the Fund did not defer, on a tax basis, any late-year ordinary losses. Late-year ordinary losses are net ordinary losses incurred after December 31, 2020, but
within the taxable year, that are deemed to arise on the first day of the Fund’s next taxable year.
During fiscal year 2022 (year to date) and fiscal year 2021, the tax character of distributions paid by the Fund was as follows:
|
Six Months Ended
|
Year Ended
|
||||||||
|
April 30, 2022
|
October 31, 2021
|
||||||||
|
Ordinary income(1)
|
$
|
1,939,323
|
$
|
—
|
|||||
|
Long-term capital gains
|
—
|
—
|
|||||||
|
Total distributions
|
$
|
1,939,323
|
$
|
—
|
|||||
|
(1) Ordinary income includes short-term capital gains.
|
9). EVENTS SUBSEQUENT TO PERIOD END
Management has evaluated the Fund’s related events and transactions that occurred subsequent to April 30, 2022, through the date of issuance of the Fund’s financial statements. Management has determined
that there were no subsequent events requiring recognition or disclosure in the financial statements.
|
HENNESSY FUNDS
|
1-800-966-4354
|
23
Expense Example (Unaudited)
April 30, 2022
As a shareholder of the Fund, you incur ongoing costs, including management fees, service fees, and other Fund expenses. This Example is intended to help you understand your ongoing costs (in dollars) of
investing in the Fund and to compare these costs with the ongoing costs of investing in other mutual funds. The Example is based on an investment of $1,000 invested at the beginning of the period and held for the entire period
from November 1, 2021, through April 30, 2022.
Actual Expenses
In the table below, the first line under each of the “Investor Class” and “Institutional Class” headings provides information about actual account values and actual expenses for each share class. You may
use this information, together with the amount you invested, to estimate the expenses that you paid over the period. Simply divide your account value by $1,000 (for example, an $8,600 account value divided by $1,000 = 8.6), then
multiply the result by the number in the first line under the heading “Expenses Paid During Period” to estimate the expenses you paid on your account during this period. Although the Fund charges no sales loads or transaction
fees, you will be assessed fees for outgoing wire transfers, returned checks, and stop payment orders at prevailing rates charged by U.S. Bank Global Fund Services, the Fund’s transfer agent. If you request that a redemption be
made by wire transfer, the Fund’s transfer agent charges a $15 fee. IRAs are charged a $15 annual maintenance fee (up to $30 maximum per shareholder for shareholders with multiple IRAs). The examples below include, but are not
limited to, management, shareholder servicing, accounting, custody, and transfer agent fees. However, the examples below do not include portfolio trading commissions and related expenses.
Hypothetical Example for Comparison Purposes
In the table below, the second line under each of the “Investor Class” and “Institutional Class” headings provides information about hypothetical account values and hypothetical expenses based on the
Fund’s actual expense ratio for each share class and an assumed rate of return of 5% per year before expenses, which is not the Fund’s actual return for such share class. The hypothetical account values and expenses may not be
used to estimate the actual ending account balance or expenses you paid for the period. You may use this information to compare the ongoing costs of investing in the Fund and other funds. To do so, compare these 5% hypothetical
examples with the 5% hypothetical examples that appear in the shareholder reports of the other funds. Please note that the expenses shown in the table are meant to highlight your ongoing costs only. Therefore, the second lines
under “Investor Class” and “Institutional Class” are useful in comparing ongoing costs only and will not help you determine the relative total costs of owning different funds.
|
WWW.HENNESSYFUNDS.COM
|
24
|
EXPENSE EXAMPLE
|
|
Beginning
|
Ending
|
||
|
Account Value
|
Account Value
|
Expenses Paid
|
|
|
November 1, 2021
|
April 30, 2022
|
During Period(1)
|
|
|
Investor Class
|
|||
|
Actual
|
$1,000.00
|
$1,287.80
|
$12.82
|
|
Hypothetical (5% return before expenses)
|
$1,000.00
|
$1,013.59
|
$11.28
|
|
Institutional Class
|
|||
|
Actual
|
$1,000.00
|
$1,289.50
|
$10.96
|
|
Hypothetical (5% return before expenses)
|
$1,000.00
|
$1,015.22
|
$ 9.64
|
|
(1)
|
Expenses are equal to the Fund’s annualized expense ratio of 2.26% for Investor Class shares or 1.93% for Institutional Class shares, as applicable, multiplied by the average account value over
the period, multiplied by 181/365 days (to reflect the half-year period).
|
|
HENNESSY FUNDS
|
1-800-966-4354
|
25
How to Obtain a Copy of the Fund’s Proxy
Voting Policy and Proxy Voting Records
A description of the policies and procedures the Fund uses to determine how to vote proxies relating to portfolio securities is available without charge (1) by calling 800-966-4354, (2) on the Hennessy
Funds’ website at www.hennessyfunds.com/proxy-voting/voting-policy, or (3) on the U.S. Securities and Exchange Commission’s (the “SEC”) website at www.sec.gov. The Fund’s proxy voting record is available without charge on both the
Hennessy Funds’ website at www.hennessyfunds.com/proxy-voting/voting-record and the SEC’s website at www.sec.gov no later than August 31 for the prior 12 months ending June 30.
Availability of Quarterly Portfolio Schedule
The Fund files its complete schedule of portfolio holdings with the SEC for the first and third quarters of each fiscal year as an exhibit to its reports on Form N-PORT. The Fund’s Form N-PORT reports
are available on the SEC’s website at www.sec.gov or on request by calling 800-966-4354.
Important Notice Regarding Delivery
of Shareholder Documents
To help keep the Fund’s costs as low as possible, we generally deliver a single copy of shareholder reports, proxy statements, and prospectuses to shareholders who share an address and have the same last
name. This process does not apply to account statements. You may request an individual copy of a shareholder document at any time. If you would like to receive separate mailings of shareholder documents, please call U.S. Bank
Global Fund Services at 800-261-6950 or 414-765-4124, and individual delivery will begin within 30 days of your request. If your account is held through a financial institution or other intermediary, please contact such
intermediary directly to request individual delivery.
Electronic Delivery
As permitted by SEC regulations, the Fund’s shareholder reports are made available on a website, and unless you sign up for eDelivery or elect to receive paper copies as detailed below, you will be
notified each time a report is posted and provided with a website link to access the report.
The Fund also offers shareholders the option to receive all notices, account statements, prospectuses, tax forms, and shareholder reports electronically. To sign up for eDelivery or
change your delivery preference, please visit www.hennessyfunds.com/account.
To elect to receive paper copies of all future reports free of charge, please call U.S. Bank Global Fund Services at 800-261-6950 or 414-765-4124.
Subscribe to receive our team’s unique market and sector insights delivered to your inbox
www.hennessyfunds.com/subscribe
Follow us on social media
| |
|
|
WWW.HENNESSYFUNDS.COM
|
26
|
PROXY VOTING — BOARD APPROVAL OF INVESTMENT ADVISORY AGREEMENT
|
Board Approval of Investment Advisory
Agreement
At its meeting on March 11, 2022, the Board of Trustees of the Fund (the “Board,” and the members thereof, the “Trustees”) unanimously approved the continuation of the investment advisory agreement of
the Fund with Hennessy Advisors, Inc. (the “Advisor”). As part of the process, the Trustees reviewed their fiduciary duties and the relevant factors for them to consider with respect to approving the advisory agreement. In
addition, the Trustees who are not deemed “interested persons” (as defined by the Investment Company Act of 1940, as amended) of the Fund (the “Independent Trustees”) met in executive session to discuss the approval of the
advisory agreement. As part of their discussion, the Independent Trustees confirmed their understanding of the need to have asked about, and received answers to, any matters that they believed are relevant to determining whether
to approve the continuation of the advisory agreement.
In advance of the meeting, the Advisor sent detailed information to the Trustees to assist them in their evaluation of the advisory agreement. This information included, but was not
limited to, the following:
|
(1)
|
A memorandum from outside legal counsel that described the fiduciary duties of the Board with respect to approving the continuation of the advisory agreement and the relevant factors for
consideration;
|
|
|
(2)
|
A memorandum from the Advisor that listed the factors relevant to the Board’s approval of the continuation of the advisory agreement and also referenced the documents that had been provided to
help the Board assess each such factor;
|
|
|
(3)
|
The Advisor’s financial statements from its most recent Form 10-K and Form 10-Q;
|
|
|
(4)
|
A summary of the advisory agreement;
|
|
|
(5)
|
A recent Fund fact sheet, which included, among other things, Fund performance over various periods;
|
|
|
(6)
|
A description of the range of services provided by the Advisor;
|
|
|
(7)
|
A peer expense comparison of the net expense ratio and investment advisory fee of the Fund; and
|
|
|
(8)
|
A memorandum from the Advisor regarding economies of scale.
|
The Trustees reviewed and discussed all of the information provided by the Advisor. Following this review, and further discussion with the Advisor, the Trustees concluded that the
information provided before and at the meeting addressed all of the relevant matters that they wanted to consider in assessing the performance of the Funds and the performance of the Advisor under the advisory agreement, and that
said information provided them with a fulsome understanding of the advisory agreement and the services provided by the Advisor.
All of the factors discussed were considered as a whole by the Trustees, as well as by the Independent Trustees meeting in executive session. The Trustees viewed the relevant factors
in their totality, with no single factor being the principal or determinative factor in the Trustees’ determination of whether to approve the continuation of the advisory agreement. The Trustees recognized that the management and
fee arrangements for the Fund are the result of years of review and discussion between the Independent Trustees and the Advisor, that certain aspects of such arrangements may receive greater scrutiny in some years than in others,
and that the Trustees’ conclusions may be based, in part, on
|
HENNESSY FUNDS
|
1-800-966-4354
|
27
their consideration of these same arrangements and information received during the course of the year and in prior years.
Prior to approving the continuation of the advisory agreement, the Trustees, including the Independent Trustees in executive session, considered, among other items:
|
(1)
|
The nature and quality of the advisory services provided by the Advisor;
|
|
|
(2)
|
A comparison of the fees and expenses of the Fund to other similar funds;
|
|
|
(3)
|
Whether economies of scale are recognized by the Fund;
|
|
|
(4)
|
The costs and profitability of the Fund to the Advisor;
|
|
|
(5)
|
The performance of the Fund; and
|
|
|
(6)
|
Any benefits to the Advisor from serving as an investment advisor to the Fund (other than the advisory fee).
|
The material considerations and determinations of the Trustees, including the Independent Trustees, were as follows:
|
(1)
|
The Trustees considered the services identified below that are provided by the Advisor. Based on this review and an assessment of the Advisor’s performance, the Trustees concluded that the
Advisor provides high-quality services to the Fund, and they noted that their overall confidence in the Advisor was high. The Trustees also concluded that they were satisfied with the nature, extent, and quality of the
advisory services provided to the Fund by the Advisor and that the nature and extent of the services provided by the Advisor were appropriate to assure that the Fund’s operations are conducted in compliance with applicable
laws, rules, and regulations.
|
|
(a)
|
The Advisor acts as the portfolio manager for the Fund. In this capacity, the Advisor does the following:
|
|
(i)
|
manages the composition of the Fund’s portfolio, including the purchase, retention, and disposition of portfolio securities in accordance with the Fund’s investment objectives, policies, and
restrictions;
|
|||
|
(ii)
|
seeks best execution for the Fund’s portfolio;
|
|||
|
(iii)
|
manages the use of soft dollars for the Fund; and
|
|||
|
(iv)
|
manages proxy voting for the Fund.
|
|
(b)
|
The Advisor performs a daily reconciliation of portfolio positions and cash for the Fund.
|
||
|
(c)
|
The Advisor monitors the liquidity of each Fund.
|
||
|
(d)
|
The Advisor monitors the Fund’s compliance with its investment objectives and restrictions and federal securities laws.
|
||
|
(e)
|
The Advisor maintains a compliance program (including a code of ethics), conducts ongoing reviews of the compliance programs of the Fund’s service providers (including their codes of ethics, as
appropriate), conducts on-site visits to the Fund’s service providers, as feasible, monitors incidents of abusive trading practices, reviews Fund expense accruals, payments, and fixed expense ratios, evaluates insurance
providers for fidelity bond, D&O/E&O insurance, and cybersecurity insurance coverage, manages regulatory examination compliance and responses, conducts employee compliance training, reviews reports provided by
service providers, and maintains books and records.
|
|
WWW.HENNESSYFUNDS.COM
|
28
|
BOARD APPROVAL OF INVESTMENT ADVISORY AGREEMENT
|
|
(f)
|
The Advisor oversees service providers that provide accounting, administration, distribution, transfer agency, custodial, sales, marketing, public relations, audit, information technology, and
legal services to the Fund.
|
||
|
(g)
|
The Advisor maintains in-house marketing and distribution departments on behalf of the Fund.
|
||
|
(h)
|
The Advisor prepares or directs the preparation of all regulatory filings for the Fund, including writing and annually updating the Fund’s prospectus and related documents.
|
||
|
(i)
|
For each annual report of the Fund, the Advisor prepares a written summary of the Fund’s performance during the most recent 12-month period.
|
||
|
(j)
|
The Advisor oversees distribution of the Fund through third-party broker/dealers and independent financial institutions such as Charles Schwab, Inc., Fidelity, TD Ameritrade, and Pershing. The
Advisor participates in “no transaction fee” (“NTF”) programs with these companies on behalf of the Fund, which allow customers to purchase the Fund through third-party distribution channels without paying a transaction
fee. The Advisor compensates, in part, a number of these third-party providers of NTF programs out of its own revenues.
|
||
|
(k)
|
The Advisor pays the incentive compensation of the Fund’s compliance officers and employs other staff, such as legal, marketing, national accounts, distribution, sales, administrative, and
trading oversight personnel, as well as management executives.
|
||
|
(l)
|
The Advisor provides a quarterly compliance certification to the Board.
|
||
|
(m)
|
The Advisor prepares or reviews all Board materials, presents to and leads discussions with the Board, prepares or reviews all meeting minutes, and arranges for Board training and education.
|
|
(2)
|
The Trustees compared the performance of the Fund to benchmark indices over various periods and noted that the Trustees review and discuss reports comparing the investment performance of the Fund
to various indices at each quarterly Board meeting. Based on such information, the Trustees determined that the Advisor manages the Fund in a manner materially consistent with its stated investment objective and style. The
Trustees concluded that the performance of the Fund over various periods warranted the continuation of the advisory agreement.
|
|
|
(3)
|
The Trustees reviewed the advisory fees and overall expense ratios of the Fund compared to other funds similar in asset size and investment objective to the Fund using data from Morningstar. As
part of the discussion with management, the Trustees ensured that they understood and were comfortable with the criteria used to determine the mutual funds included in the Morningstar categories for purposes of the
materials considered at the meeting. The Trustees determined that the advisory fee and overall expense ratio of the Fund falls within a reasonable range of the advisory fees and overall expense ratios of other comparable
funds and concluded that they are reasonable and warranted continuation of the advisory agreement.
|
|
|
(4)
|
The Trustees also considered whether the Advisor was realizing economies of scale that should be shared with the Fund’s shareholders. The Trustees noted that the majority of expenses incurred to
manage the Fund are variable
|
|
HENNESSY FUNDS
|
1-800-966-4354
|
29
|
asset-based fees, so the Advisor does not realize material economies of scale relating to these expenses as the assets of the Fund increase. For example, third-party platform fees increase as the
Fund’s assets grow.
|
||
|
(5)
|
The Trustees considered the profitability of the Advisor, including the impact of mutual fund platform fees on the Advisor’s profitability, and also considered the resources and revenues that the
Advisor has put into managing and distributing the Fund. The Trustees then concluded that the profits of the Advisor are reasonable and not excessive when compared to profitability guidelines set forth in relevant court
cases.
|
|
|
(6)
|
The Trustees considered the high level of professionalism and knowledge of the Advisor’s employees and concluded that this was beneficial to the Fund and its shareholders.
|
|
|
(7)
|
The Trustees considered any benefits to the Advisor from serving as an advisor to the Fund (other than the advisory fee). The Trustees noted that the Advisor may derive ancillary benefits from,
by way of example, its association with the Fund in the form of proprietary and third-party research products and services received from broker-dealers that execute portfolio trades for the Fund. The Trustees determined
that any such products and services have been used for legitimate purposes relating to the Fund by providing assistance in the investment decision-making process. The Trustees concluded that any additional benefits
realized by the Advisor from its relationship with the Fund were reasonable, which was based on, among other things, the Trustees’ finding that the research, analytical, statistical, and other information and services
provided by brokers are merely supplemental to the Advisor’s own efforts in the performance of its duties under the advisory agreement.
|
After reviewing the materials and information provided at the meeting, as well as other information regularly provided at the Board’s quarterly meetings throughout the year regarding
the quality of services provided by the Advisor, the performance of the Fund, expense information, brokerage commissions information, the adequacy and efficacy of the Advisor’s written policies and procedures, other regulatory
compliance issues, trading information and related matters, and other factors that the Trustees deemed relevant, the Trustees, including the Independent Trustees, approved the continuation of the advisory agreement.
|
WWW.HENNESSYFUNDS.COM
|
30
|
BOARD APPROVAL OF INVESTMENT ADVISORY AGREEMENT
|
(This Page Intentionally Left Blank.)
For information, questions, or assistance, please call
The Hennessy Funds
800-966-4354 or 415-899-1555
INVESTMENT ADVISOR
Hennessy Advisors, Inc.
7250 Redwood Boulevard, Suite 200
Novato, California 94945
ADMINISTRATOR,
TRANSFER AGENT,
DIVIDEND PAYING AGENT, &
SHAREHOLDER SERVICING AGENT
U.S. Bancorp Fund Services, LLC
d/b/a U.S. Bank Global Fund Services
P.O. Box 701
Milwaukee, Wisconsin 53201-0701
CUSTODIAN
U.S. Bank N.A.
Custody Operations
1555 North River Center Drive, Suite 302
Milwaukee, Wisconsin 53212
TRUSTEES
Neil J. Hennessy
J. Dennis DeSousa
Robert T. Doyle
Claire Garvie
Gerald P. Richardson
COUNSEL
Foley & Lardner LLP
777 East Wisconsin Avenue
Milwaukee, Wisconsin 53202-5306
INDEPENDENT REGISTERED
PUBLIC ACCOUNTING FIRM
Tait, Weller & Baker LLP
Two Liberty Place
50 South 16th Street, Suite 2900
Philadelphia, Pennsylvania 19102-2529
DISTRIBUTOR
Quasar Distributors, LLC
111 East Kilbourn Avenue, Suite 1250
Milwaukee, Wisconsin 53202
www.hennessyfunds.com | 800-966-4354
This report has been prepared for shareholders and may be distributed to
others only if preceded or accompanied by a current prospectus.
SEMI-ANNUAL REPORT
APRIL 30, 2022

HENNESSY MIDSTREAM FUND
Investor Class HMSFX
Institutional Class HMSIX
www.hennessyfunds.com | 1-800-966-4354
(This Page Intentionally Left Blank.)
Contents
|
Letter to Shareholders
|
2
|
|
Performance Overview
|
4
|
|
Financial Statements
|
|
|
Schedule of Investments
|
5
|
|
Statement of Assets and Liabilities
|
8
|
|
Statement of Operations
|
9
|
|
Statements of Changes in Net Assets
|
11
|
|
Financial Highlights
|
12
|
|
Notes to the Financial Statements
|
16
|
|
Expense Example
|
26
|
|
Proxy Voting Policy and Proxy Voting Records
|
28
|
|
Availability of Quarterly Portfolio Schedule
|
28
|
|
Federal Tax Distribution Information
|
28
|
|
Important Notice Regarding Delivery of Shareholder Documents
|
28
|
|
Electronic Delivery
|
28
|
|
Board Approval of Investment Advisory Agreement
|
29
|
|
HENNESSY FUNDS
|
1-800-966-4354
|
May 2022
Dear Hennessy Funds Shareholder:
We’d like to start our semi-annual letter with a pause. At the end of 2021, we looked forward to a new year – a potentially calmer year – having come through
almost two full years of the coronavirus pandemic. As people, we were aware our lives had changed, but we hoped for a better 2022; as investors, we were aware that the economy was strong and employment was robust, yet challenges
loomed, including inflation, supply chain disruptions, and tightening monetary policy; as employees, students, and family members, we recognized much was different, but we sought a return to what’s familiar. What we didn’t know
was that a world leader who controls one of the largest militaries on the planet was about to start one of the worst atrocities in Europe since World War II. Our thoughts are with the Ukrainian people, and our hope is for this
unjustified, senseless human tragedy to end quickly.
The equity market started 2022 on a high note, with the S&P 500® Index hitting an all-time high on the first trading day of the year. This turned out to be the last hurrah for a market that saw a continuous march higher in
2021, having hit 70 new all-time highs, with a new all-time high being recorded on average every three and a half days. Concerns in the market then coalesced and overpowered bullish sentiment, and the market has spiraled lower
throughout 2022. Factors that drove the market lower include: tightening monetary policy as the Federal Reserve has begun raising rates and has announced plans for shrinking its $8.5 trillion asset portfolio; inflation, higher
energy costs, and their effects on the domestic and global economies; continued supply chain disruptions; investors’ indiscriminate liquidation of broad-based ETFs and index funds and the detrimental effect on equities; and the
near-term and long-term global implications of the Russian invasion of Ukraine.
While markets are adjusting, many positive conditions remain intact. Corporate balance sheets and profits remain strong, GDP growth remains
positive, the consumer continues to show resilience in the face of rising prices, cash is abundant both at the corporate and household levels, unemployment is exceptionally low, and our financial system remains healthy. Markets
are also experiencing a change in leadership, as value stocks have been outperforming growth stocks, and traditionally defensive sectors such as Utilities and Consumer Staples have been outperforming the broader market. Finally,
the Energy sector has soared in 2022, as companies reap the benefits of dramatically higher oil and natural gas prices, and shareholders are rewarded with significantly higher dividends, aggressive buybacks, and higher stock
prices after many years of underperformance for the sector.
With history as our guide, we are hopeful that eventually the market may bottom and head higher again. Since the financial crisis of 2008, we
have experienced many corrections and many recoveries to new highs. The Dow Jones Industrial Average has dropped over 10% eight times, including the current drop, for a median decline of 14.00%, and on average, it took 45
trading days to drop from peak to trough and 127 trading days to return to the previous peak. Since the current drop has taken longer to go from peak to its recent trough, it may take some time for a recovery in prices to truly
take hold.
On a positive note, valuations have come in, and many stocks have become more attractive, especially for longer-term investors. We note,
however, that the concept of “historically cheap stocks” does not, on its own, move the market higher. Rather, it is
|
WWW.HENNESSYFUNDS.COM
|
2
|
LETTER TO SHAREHOLDERS
|
overall capitulation and improving fundamentals that could bring buyers back into the market and reverse any bearish trends. Investors need to see improving company earnings, retreating inflationary
trends, a measured pace of interest rate increases globally that does not cause significant economic contraction, hope for a more peaceful and orderly world economic system unconstrained by supply bottlenecks and other
hindrances to global trade, and, most importantly, a subsidence of the deleterious effects of the coronavirus pandemic. While that may seem like a “tall order,” we believe that patient investing, focusing on value, quality, and
downside risk mitigation, works well over the longer term.
During this tumultuous period, performance of the majority of the Hennessy Funds has been relatively strong when compared to the overall market as
well as to our benchmarks. During the six months ended April 30, 2022, the Dow Jones Industrial Average, the S&P 500® Index, and the
NASDAQ Composite Index dropped 7.05%, 9.65%, and 20.15%, respectively, on a total return basis. During this period when these three major indices saw significant declines, we were pleased that seven of our 16 Funds posted
positive total returns, 10 of our 14 domestic Funds outperformed the S&P 500® Index, and over half of our active funds outperformed their
primary benchmarks.
We thank you, our shareholders, for your continued interest in our family of Funds. We are grateful for the trust you put in us, and we will
continue to strive to manage our portfolios for long-term performance, ever mindful of downside risk. While volatility and uncertainty may impact the markets in the short-term, we encourage investors to stay the course, maintain
a diversified portfolio, and keep a long-term perspective. If you have any questions or would like to speak with us, please don’t hesitate to call us directly at (800) 966-4354. In closing, we would also like to thank all of the
healthcare and frontline workers that have worked – and still work – tirelessly throughout the coronavirus pandemic.
Best regards,
|
|
|
|
|
Ryan C. Kelley, CFA
|
|
|
Chief Investment Officer,
|
|
|
Senior Vice President, and Portfolio Manager
|
Past performance does not guarantee future results.
Mutual fund investing involves risk. Principal loss is possible.
Opinions expressed are those of Ryan C. Kelley and are subject to change, are not guaranteed, and should not be considered investment advice.
The Dow Jones Industrial Average and S&P 500® Index are commonly used to measure the performance of U.S. stocks. The
NASDAQ Composite Index comprises all common stocks listed on The NASDAQ Stock Market and is commonly used to measure the performance of technology-related stocks. The indices are used herein for comparative purposes in
accordance with SEC regulations. One cannot invest directly in an index. All returns are shown on a total return basis.
Please refer to the Performance Overview section for more detailed performance information.
|
HENNESSY FUNDS
|
1-800-966-4354
|
3
Performance Overview (Unaudited)
AVERAGE ANNUAL TOTAL RETURN FOR PERIODS ENDED APRIL 30, 2022
|
Six
|
One
|
Five
|
Since Inception
|
|
|
Months(1)
|
Year
|
Years
|
(12/31/13)
|
|
|
Hennessy Midstream Fund –
|
||||
|
Investor Class (HMSFX)
|
14.52%
|
31.65%
|
-1.45%
|
-0.98%
|
|
Hennessy Midstream Fund –
|
||||
|
Institutional Class (HMSIX)
|
14.69%
|
31.99%
|
-1.22%
|
-0.73%
|
|
Alerian US Midstream Energy Index
|
16.51%
|
37.51%
|
5.06%
|
2.72%
|
|
S&P 500® Index
|
-9.65%
|
0.21%
|
13.66%
|
12.27%
|
| Expense ratios: | Gross 2.11%, Net 1.76%(2) (Investor Class); |
|
|
Gross 1.74%, Net 1.51%(2) (Institutional Class)
|
|
(1)
|
Periods of less than one year are not annualized.
|
|
(2)
|
The Fund’s investment advisor has contractually agreed to limit expenses until February 28, 2023.
|
_______________
Performance data quoted represents past performance; past performance does not guarantee future results. The investment return and principal value of an investment will fluctuate so
that an investor’s shares, when redeemed, may be worth more or less than their original cost. The performance table does not reflect the deduction of taxes that a shareholder would pay on Fund distributions or the redemption of
Fund shares. Current performance of the Fund may be lower or higher than the performance quoted. Performance data current to the most recent month end may be obtained by visiting www.hennessyfunds.com. Performance for periods
including or prior to October 26, 2018, is that of the BP Capital TwinLine MLP Fund.
The Alerian US Midstream Energy Index comprises companies that earn a majority of their cash flows from midstream activities involving energy commodities. The S&P 500® Index is a capitalization-weighted index that is designed to represent the broad domestic economy through changes in the aggregate market value of 500 stocks across all
major industries. One cannot invest directly in an index. These indices are used for comparative purposes in accordance with Securities and Exchange Commission regulations.
Standard & Poor’s Financial Services is the source and owner of the S&P® and S&P 500® trademarks.
The Alerian US Midstream Energy Index is a servicemark of GKD Index Partners, LLC d/b/a Alerian (“Alerian”), and its use is granted under a license from Alerian. Alerian makes no express or implied
warranties, representations, or promises regarding the originality, merchantability, suitability, or fitness for a particular purpose or use with respect to the Alerian indices. No party may rely on, and Alerian does not accept
any liability for any errors, omissions, interruptions, or defects in, the Alerian indices or underlying data. In no event shall Alerian have any liability for any direct, indirect, special, incidental, punitive, consequential,
or other damages (including lost profits), even if notified of the possibility of such damages.
The expense ratios presented are from the most recent prospectus. The expense ratios for the current reporting period are available in the Financial Highlights section of this report.
|
WWW.HENNESSYFUNDS.COM
|
4
|
PERFORMANCE OVERVIEW/SCHEDULE OF INVESTMENTS
|
Financial Statements
|
Schedule of Investments as of April 30, 2022 (Unaudited)
|
HENNESSY MIDSTREAM FUND
(% of Total Assets)
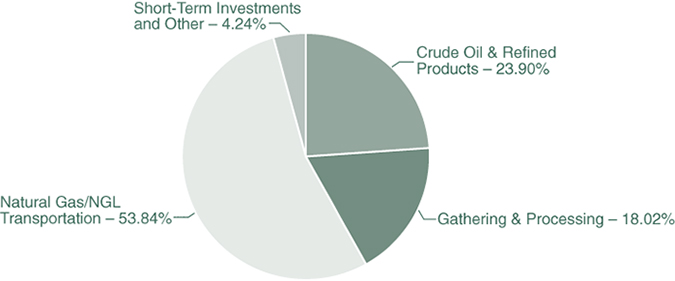
|
TOP TEN HOLDINGS (EXCLUDING MONEY MARKET FUNDS)
|
% TOTAL ASSETS
|
|
Energy Transfer LP
|
14.05%
|
|
Enterprise Products Partners LP
|
10.85%
|
|
MPLX LP
|
10.23%
|
|
Targa Resources Corp.
|
8.86%
|
|
The Williams Companies, Inc.
|
8.04%
|
|
Plains All American Pipeline LP
|
7.72%
|
|
ONEOK, Inc.
|
7.18%
|
|
Kinder Morgan, Inc.
|
6.54%
|
|
DCP Midstream LP
|
5.07%
|
|
Western Midstream Partners LP
|
4.46%
|
Note: The Fund concentrates its investments in the Energy industry. For presentation purposes, the Fund uses custom categories.
|
HENNESSY FUNDS
|
1-800-966-4354
|
5
|
COMMON STOCKS – 39.48%
|
Number
|
% of
|
||||||||||
|
|
of Shares
|
Value
|
Net Assets
|
|||||||||
|
Crude Oil & Refined Products – 1.99%
|
||||||||||||
|
Enbridge, Inc. (a)
|
21,500
|
$
|
938,260
|
1.99
|
%
|
|||||||
|
Gathering & Processing – 13.58%
|
||||||||||||
|
Antero Midstream Corp.
|
89,000
|
914,030
|
1.94
|
%
|
||||||||
|
EnLink Midstream LLC
|
132,000
|
1,302,840
|
2.76
|
%
|
||||||||
|
Targa Resources Corp.
|
57,000
|
4,184,370
|
8.88
|
%
|
||||||||
|
|
6,401,240
|
13.58
|
%
|
|||||||||
|
Natural Gas/NGL Transportation – 23.91%
|
||||||||||||
|
DT Midstream, Inc.
|
18,500
|
994,375
|
2.11
|
%
|
||||||||
|
Kinder Morgan, Inc.
|
170,090
|
3,087,133
|
6.55
|
%
|
||||||||
|
ONEOK, Inc.
|
53,526
|
3,389,802
|
7.20
|
%
|
||||||||
|
The Williams Companies, Inc.
|
110,652
|
3,794,257
|
8.05
|
%
|
||||||||
|
|
11,265,567
|
23.91
|
%
|
|||||||||
|
|
||||||||||||
|
Total Common Stocks
|
||||||||||||
|
(Cost $10,727,032)
|
18,605,067
|
39.48
|
%
|
|||||||||
|
|
||||||||||||
|
PARTNERSHIPS & TRUSTS – 56.43%
|
||||||||||||
|
Crude Oil & Refined Products – 21.95%
|
||||||||||||
|
Genesis Energy LP
|
65,000
|
713,700
|
1.51
|
%
|
||||||||
|
Magellan Midstream Partners LP
|
23,900
|
1,157,955
|
2.46
|
%
|
||||||||
|
MPLX LP
|
149,249
|
4,829,698
|
10.25
|
%
|
||||||||
|
Plains All American Pipeline LP
|
351,526
|
3,641,809
|
7.73
|
%
|
||||||||
|
|
10,343,162
|
21.95
|
%
|
|||||||||
|
Gathering & Processing – 4.46%
|
||||||||||||
|
Western Midstream Partners LP
|
87,000
|
2,104,530
|
4.46
|
%
|
||||||||
|
Natural Gas/NGL Transportation – 30.02%
|
||||||||||||
|
DCP Midstream LP
|
70,000
|
2,394,000
|
5.08
|
%
|
||||||||
|
Energy Transfer LP
|
598,700
|
6,633,596
|
14.08
|
%
|
||||||||
|
Enterprise Products Partners LP
|
197,600
|
5,119,816
|
10.86
|
%
|
||||||||
|
|
14,147,412
|
30.02
|
%
|
|||||||||
|
|
||||||||||||
|
Total Partnerships & Trusts
|
||||||||||||
|
(Cost $18,223,291)
|
26,595,104
|
56.43
|
%
|
|||||||||
The accompanying notes are an integral part of these financial statements.
|
WWW.HENNESSYFUNDS.COM
|
6
|
SCHEDULE OF INVESTMENTS
|
|
SHORT-TERM INVESTMENTS – 3.24%
|
Number
|
% of
|
||||||||||
|
|
of Shares
|
Value
|
Net Assets
|
|||||||||
|
Money Market Funds – 3.24%
|
||||||||||||
|
First American Government Obligations Fund,
|
||||||||||||
|
Institutional Class, 0.22% (b)
|
1,526,087
|
$
|
1,526,087
|
3.24
|
%
|
|||||||
|
|
||||||||||||
|
Total Short-Term Investments
|
||||||||||||
|
(Cost $1,526,087)
|
1,526,087
|
3.24
|
%
|
|||||||||
|
|
||||||||||||
|
Total Investments
|
||||||||||||
|
(Cost $30,476,410) – 99.15%
|
46,726,258
|
99.15
|
%
|
|||||||||
|
Other Assets in Excess of Liabilities – 0.85%
|
401,845
|
0.85
|
%
|
|||||||||
|
|
||||||||||||
|
TOTAL NET ASSETS – 100.00%
|
$
|
47,128,103
|
100.00
|
%
|
||||||||
Percentages are stated as a percent of net assets.
|
(a)
|
U.S.-traded security of a foreign corporation.
|
|
(b)
|
The rate listed is the fund’s seven-day yield as of April 30, 2022.
|
Summary of Fair Value Exposure as of April 30, 2022
The following is a summary of the inputs used to value the Fund’s net assets as of April 30, 2022 (see Note 3 in the accompanying Notes to the Financial Statements):
|
Common Stocks
|
Level 1
|
Level 2
|
Level 3
|
Total
|
||||||||||||
|
Crude Oil & Refined Products
|
$
|
938,260
|
$
|
—
|
$
|
—
|
$
|
938,260
|
||||||||
|
Gathering & Processing
|
6,401,240
|
—
|
—
|
6,401,240
|
||||||||||||
|
Natural Gas/NGL Transportation
|
11,265,567
|
—
|
—
|
11,265,567
|
||||||||||||
|
Total Common Stocks
|
$
|
18,605,067
|
$
|
—
|
$
|
—
|
$
|
18,605,067
|
||||||||
|
Partnerships & Trusts
|
||||||||||||||||
|
Crude Oil & Refined Products
|
$
|
10,343,162
|
$
|
—
|
$
|
—
|
$
|
10,343,162
|
||||||||
|
Gathering & Processing
|
2,104,530
|
—
|
—
|
2,104,530
|
||||||||||||
|
Natural Gas/NGL Transportation
|
14,147,412
|
—
|
—
|
14,147,412
|
||||||||||||
|
Total Partnerships & Trusts
|
$
|
26,595,104
|
$
|
—
|
$
|
—
|
$
|
26,595,104
|
||||||||
|
Short-Term Investments
|
||||||||||||||||
|
Money Market Funds
|
$
|
1,526,087
|
$
|
—
|
$
|
—
|
$
|
1,526,087
|
||||||||
|
Total Short-Term Investments
|
$
|
1,526,087
|
$
|
—
|
$
|
—
|
$
|
1,526,087
|
||||||||
|
Total Investments
|
$
|
46,726,258
|
$
|
—
|
$
|
—
|
$
|
46,726,258
|
||||||||
The accompanying notes are an integral part of these financial statements.
|
HENNESSY FUNDS
|
1-800-966-4354
|
7
Financial Statements
|
Statement of Assets and Liabilities as of April 30, 2022 (Unaudited)
|
|
ASSETS:
|
||||
|
Investments in securities, at value (cost $30,476,410)
|
$
|
46,726,258
|
||
|
Dividends and interest receivable
|
48,412
|
|||
|
Receivable for fund shares sold
|
28,000
|
|||
|
Return of capital receivable
|
377,635
|
|||
|
Deferred income tax
|
—
|
|||
|
Prepaid expenses and other assets
|
22,885
|
|||
|
Total assets
|
47,203,190
|
|||
|
LIABILITIES:
|
||||
|
Payable to advisor
|
43,797
|
|||
|
Payable to auditor
|
20,372
|
|||
|
Accrued distribution fees
|
1,542
|
|||
|
Accrued service fees
|
795
|
|||
|
Accrued trustees fees
|
6,320
|
|||
|
Accrued expenses and other payables
|
2,261
|
|||
|
Total liabilities
|
75,087
|
|||
|
NET ASSETS
|
$
|
47,128,103
|
||
|
NET ASSETS CONSISTS OF:
|
||||
|
Capital stock
|
$
|
56,502,426
|
||
|
Accumulated deficit
|
(9,374,323
|
)
|
||
|
Total net assets
|
$
|
47,128,103
|
||
|
NET ASSETS:
|
||||
|
Investor Class
|
||||
|
Shares authorized (no par value)
|
Unlimited
|
|||
|
Net assets applicable to outstanding shares
|
$
|
9,455,568
|
||
|
Shares issued and outstanding
|
1,013,464
|
|||
|
Net asset value, offering price, and redemption price per share
|
$
|
9.33
|
||
|
Institutional Class
|
||||
|
Shares authorized (no par value)
|
Unlimited
|
|||
|
Net assets applicable to outstanding shares
|
$
|
37,672,535
|
||
|
Shares issued and outstanding
|
3,915,955
|
|||
|
Net asset value, offering price, and redemption price per share
|
$
|
9.62
|
||
The accompanying notes are an integral part of these financial statements.
|
WWW.HENNESSYFUNDS.COM
|
8
|
STATEMENT OF ASSETS AND LIABILITIES/STATEMENT OF OPERATIONS
|
Financial Statements
|
Statement of Operations for the six months ended April 30, 2022 (Unaudited)
|
|
INVESTMENT INCOME:
|
||||
|
Distributions received from master limited partnerships
|
$
|
988,833
|
||
|
Return of capital on distributions received
|
(988,833
|
)
|
||
|
Dividend income(1)
|
254,462
|
|||
|
Interest income
|
470
|
|||
|
Total investment income
|
254,932
|
|||
|
EXPENSES:
|
||||
|
Investment advisory fees (See Note 5)
|
224,775
|
|||
|
Administration, accounting, custody, and transfer agent fees (See Note 5)
|
28,940
|
|||
|
Audit fees
|
20,365
|
|||
|
Sub-transfer agent expenses – Investor Class (See Note 5)
|
6,617
|
|||
|
Sub-transfer agent expenses – Institutional Class (See Note 5)
|
10,313
|
|||
|
Federal and state registration fees
|
15,654
|
|||
|
Compliance expense (See Note 5)
|
15,156
|
|||
|
Trustees’ fees and expenses
|
8,487
|
|||
|
Distribution fees – Investor Class (See Note 5)
|
5,809
|
|||
|
Reports to shareholders
|
5,714
|
|||
|
Service fees – Investor Class (See Note 5)
|
3,872
|
|||
|
Income tax expense
|
900
|
|||
|
Legal fees
|
548
|
|||
|
Other expenses
|
5,797
|
|||
|
Total expenses before waivers and reimbursements
|
352,947
|
|||
|
Service provider expense waiver (See Note 5)
|
(28,940
|
)
|
||
|
Expense reimbursement by advisor – Investor Class (See Note 5)
|
(4,805
|
)
|
||
|
Expense reimbursement by advisor – Institutional Class (See Note 5)
|
(2,111
|
)
|
||
|
Net expenses
|
317,091
|
|||
|
NET INVESTMENT LOSS
|
$
|
(62,159
|
)
|
|
|
REALIZED AND UNREALIZED GAINS (LOSSES):
|
||||
|
Net realized gain on investments
|
$
|
104,009
|
||
|
Net change in unrealized appreciation/depreciation on investments
|
5,765,419
|
|||
|
Income tax expense
|
—
|
|||
|
Net gain on investments
|
5,869,428
|
|||
|
NET INCREASE IN NET ASSETS RESULTING FROM OPERATIONS
|
$
|
5,807,269
|
||
|
(1)
|
Net of foreign taxes withheld of $4,913.
|
The accompanying notes are an integral part of these financial statements.
|
HENNESSY FUNDS
|
1-800-966-4354
|
9
(This Page Intentionally Left Blank.)
|
WWW.HENNESSYFUNDS.COM
|
10
|
STATEMENTS OF CHANGES IN NET ASSETS
|
Financial Statements
|
Statements of Changes in Net Assets
|
|
Six Months Ended
|
||||||||
|
April 30, 2022
|
Year Ended
|
|||||||
|
(Unaudited)
|
October 31, 2021
|
|||||||
|
OPERATIONS:
|
||||||||
|
Net investment loss
|
$
|
(62,159
|
)
|
$
|
(230,996
|
)
|
||
|
Net realized gain on investments
|
104,009
|
357,263
|
||||||
|
Net change in unrealized
|
||||||||
|
appreciation/deprecation on investments
|
5,765,419
|
17,111,950
|
||||||
|
Net increase in net assets resulting from operations
|
5,807,269
|
17,238,217
|
||||||
|
DISTRIBUTIONS TO SHAREHOLDERS FROM:
|
||||||||
|
Return of capital – Investor Class
|
(442,182
|
)
|
(756,323
|
)
|
||||
|
Return of capital – Institutional Class
|
(1,841,310
|
)
|
(3,420,217
|
)
|
||||
|
Total distributions
|
(2,283,492
|
)
|
(4,176,540
|
)
|
||||
|
CAPITAL SHARE TRANSACTIONS:
|
||||||||
|
Proceeds from shares subscribed – Investor Class
|
2,454,841
|
2,502,132
|
||||||
|
Proceeds from shares subscribed – Institutional Class
|
5,069,747
|
3,761,293
|
||||||
|
Dividends reinvested – Investor Class
|
372,557
|
677,429
|
||||||
|
Dividends reinvested – Institutional Class
|
1,721,319
|
3,185,818
|
||||||
|
Cost of shares redeemed – Investor Class
|
(724,800
|
)
|
(2,532,516
|
)
|
||||
|
Cost of shares redeemed – Institutional Class
|
(2,456,451
|
)
|
(5,635,003
|
)
|
||||
|
Net increase in net assets derived
|
||||||||
|
from capital share transactions
|
6,437,213
|
1,959,153
|
||||||
|
TOTAL INCREASE IN NET ASSETS
|
9,960,990
|
15,020,830
|
||||||
|
NET ASSETS:
|
||||||||
|
Beginning of period
|
37,167,113
|
22,146,283
|
||||||
|
End of period
|
$
|
47,128,103
|
$
|
37,167,113
|
||||
|
CHANGES IN SHARES OUTSTANDING:
|
||||||||
|
Shares sold – Investor Class
|
274,006
|
321,069
|
||||||
|
Shares sold – Institutional Class
|
570,412
|
490,595
|
||||||
|
Shares issued to holders as reinvestment
|
||||||||
|
of dividends – Investor Class
|
44,513
|
89,396
|
||||||
|
Shares issued to holders as reinvestment
|
||||||||
|
of dividends – Institutional Class
|
200,654
|
410,703
|
||||||
|
Shares redeemed – Investor Class
|
(80,972
|
)
|
(320,846
|
)
|
||||
|
Shares redeemed – Institutional Class
|
(274,716
|
)
|
(711,400
|
)
|
||||
|
Net increase in shares outstanding
|
733,897
|
279,517
|
||||||
The accompanying notes are an integral part of these financial statements.
|
HENNESSY FUNDS
|
1-800-966-4354
|
11
Financial Statements
|
Financial Highlights
|
For an Investor Class share outstanding throughout each period
|
Six Months Ended
|
||||
|
April 30, 2022
|
||||
|
(Unaudited)
|
||||
|
PER SHARE DATA:
|
||||
|
Net asset value, beginning of period
|
$
|
8.66
|
||
|
Income from investment operations:
|
||||
|
Net investment loss(2)(3)
|
(0.02
|
)
|
||
|
Net realized and unrealized gains (losses) on investments
|
1.21
|
|||
|
Total from investment operations
|
1.19
|
|||
|
Less distributions:
|
||||
|
Dividends from return of capital
|
(0.52
|
)
|
||
|
Total distributions
|
(0.52
|
)
|
||
|
Net asset value, end of period
|
$
|
9.33
|
||
|
TOTAL RETURN
|
14.52
|
%(4)
|
||
|
SUPPLEMENTAL DATA AND RATIOS:
|
||||
|
Net assets, end of period (millions)
|
$
|
9.46
|
||
|
Ratio of expenses to average net assets:
|
||||
|
Before expense reimbursement
|
2.02
|
%(5)
|
||
|
After expense reimbursement
|
1.75
|
%(5)(6)
|
||
|
Ratio of net investment loss to average net assets:
|
||||
|
Before expense reimbursement(3)
|
(0.74
|
)%(5)
|
||
|
After expense reimbursement(3)
|
(0.47
|
)%(5)
|
||
|
Portfolio turnover rate(7)
|
6
|
%(4)
|
||
|
(1)
|
The period ended October 31, 2018, consists of 11 months due to the Fund’s fiscal year end change from November 30 to October 31, effective October 26, 2018.
|
|
(2)
|
Calculated using the average shares outstanding method.
|
|
(3)
|
Includes current and deferred tax benefit/expense from net investment income/loss only.
|
|
(4)
|
Not annualized.
|
|
(5)
|
Annualized.
|
|
(6)
|
Certain service provider expenses were voluntarily waived during the period.
|
|
(7)
|
Calculated on the basis of the Fund as a whole.
|
The accompanying notes are an integral part of these financial statements.
|
WWW.HENNESSYFUNDS.COM
|
12
|
FINANCIAL HIGHLIGHTS — INVESTOR CLASS
|
|
Year Ended October 31,
|
Period Ended
|
Year Ended
November 30,
|
||||||||||||||||||||
|
October 31,
|
||||||||||||||||||||||
|
2021
|
2020
|
2019
|
2018(1)
|
2017
|
2016
|
|||||||||||||||||
|
$
|
5.55
|
$
|
10.90
|
$
|
12.66
|
$
|
14.51
|
$
|
16.54
|
$
|
15.45
|
|||||||||||
|
(0.07
|
)
|
(0.10
|
)
|
(0.10
|
)
|
(0.16
|
)
|
(0.22
|
)
|
(0.17
|
)
|
|||||||||||
|
4.21
|
(4.22
|
)
|
(0.63
|
)
|
(0.66
|
)
|
(0.78
|
)
|
2.29
|
|||||||||||||
|
4.14
|
(4.32
|
)
|
(0.73
|
)
|
(0.82
|
)
|
(1.00
|
)
|
2.12
|
|||||||||||||
|
(1.03
|
)
|
(1.03
|
)
|
(1.03
|
)
|
(1.03
|
)
|
(1.03
|
)
|
(1.03
|
)
|
|||||||||||
|
(1.03
|
)
|
(1.03
|
)
|
(1.03
|
)
|
(1.03
|
)
|
(1.03
|
)
|
(1.03
|
)
|
|||||||||||
|
$
|
8.66
|
$
|
5.55
|
$
|
10.90
|
$
|
12.66
|
$
|
14.51
|
$
|
16.54
|
|||||||||||
|
78.41
|
%
|
-42.13
|
%
|
-6.28
|
%
|
-6.15
|
%(4)
|
-6.49
|
%
|
14.78
|
%
|
|||||||||||
|
$
|
6.72
|
$
|
3.81
|
$
|
9.20
|
$
|
20.07
|
$
|
16.86
|
$
|
13.43
|
|||||||||||
|
2.11
|
%
|
2.12
|
%
|
1.89
|
%
|
1.86
|
%(5)
|
1.91
|
%
|
2.21
|
%
|
|||||||||||
|
1.76
|
%(6)
|
1.76
|
%(6)
|
1.76
|
%
|
1.78
|
%(5)
|
1.77
|
%
|
1.74
|
%
|
|||||||||||
|
(1.26
|
)%
|
(1.63
|
)%
|
(0.92
|
)%
|
(1.34
|
)%(5)
|
(1.50
|
)%
|
(1.60
|
)%
|
|||||||||||
|
(0.91
|
)%
|
(1.27
|
)%
|
(0.79
|
)%
|
(1.26
|
)%(5)
|
(1.36
|
)%
|
(1.13
|
)%
|
|||||||||||
|
40
|
%
|
53
|
%
|
41
|
%
|
64
|
%(4)
|
63
|
%
|
139
|
%
|
|||||||||||
The accompanying notes are an integral part of these financial statements.
|
HENNESSY FUNDS
|
1-800-966-4354
|
13
Financial Statements
|
Financial Highlights
|
For an Institutional Class share outstanding throughout each period
|
Six Months Ended
|
||||
|
April 30, 2022
|
||||
|
(Unaudited)
|
||||
|
PER SHARE DATA:
|
||||
|
Net asset value, beginning of period
|
$
|
8.90
|
||
|
Income from investment operations:
|
||||
|
Net investment loss(2)(3)
|
(0.01
|
)
|
||
|
Net realized and unrealized gains (losses) on investments
|
1.25
|
|||
|
Total from investment operations
|
1.24
|
|||
|
Less distributions:
|
||||
|
Dividends from return of capital
|
(0.52
|
)
|
||
|
Total distributions
|
(0.52
|
)
|
||
|
Net asset value, end of period
|
$
|
9.62
|
||
|
TOTAL RETURN
|
14.69
|
%(4)
|
||
|
SUPPLEMENTAL DATA AND RATIOS:
|
||||
|
Net assets, end of period (millions)
|
$
|
37.67
|
||
|
Ratio of expenses to average net assets:
|
||||
|
Before expense reimbursement
|
1.66
|
%(5)
|
||
|
After expense reimbursement
|
1.50
|
%(5)(6)
|
||
|
Ratio of net investment loss to average net assets:
|
||||
|
Before expense reimbursement(3)
|
(0.42
|
)%(5)
|
||
|
After expense reimbursement(3)
|
(0.26
|
)%(5)
|
||
|
Portfolio turnover rate(7)
|
6
|
%(4)
|
||
|
(1)
|
The period ended October 31, 2018, consists of 11 months due to the Fund’s fiscal year end change from November 30 to October 31, effective October 26, 2018.
|
|
(2)
|
Calculated using the average shares outstanding method.
|
|
(3)
|
Includes current and deferred tax benefit/expense from net investment income/loss only.
|
|
(4)
|
Not annualized.
|
|
(5)
|
Annualized.
|
|
(6)
|
Certain service provider expenses were voluntarily waived during the period.
|
|
(7)
|
Calculated on the basis of the Fund as a whole.
|
The accompanying notes are an integral part of these financial statements.
|
WWW.HENNESSYFUNDS.COM
|
14
|
FINANCIAL HIGHLIGHTS — INSTITUTIONAL CLASS
|
|
Year Ended October 31,
|
Period Ended
|
Year Ended
November 30,
|
||||||||||||||||||||
|
October 31,
|
||||||||||||||||||||||
|
2021
|
2020
|
2019
|
2018(1)
|
2017
|
2016
|
|||||||||||||||||
|
$
|
5.68
|
$
|
11.09
|
$
|
12.83
|
$
|
14.66
|
$
|
16.66
|
$
|
15.53
|
|||||||||||
|
(0.05
|
)
|
(0.10
|
)
|
(0.09
|
)
|
(0.14
|
)
|
(0.18
|
)
|
(0.12
|
)
|
|||||||||||
|
4.30
|
(4.28
|
)
|
(0.62
|
)
|
(0.66
|
)
|
(0.79
|
)
|
2.28
|
|||||||||||||
|
4.25
|
(4.38
|
)
|
(0.71
|
)
|
(0.80
|
)
|
(0.97
|
)
|
2.16
|
|||||||||||||
|
(1.03
|
)
|
(1.03
|
)
|
(1.03
|
)
|
(1.03
|
)
|
(1.03
|
)
|
(1.03
|
)
|
|||||||||||
|
(1.03
|
)
|
(1.03
|
)
|
(1.03
|
)
|
(1.03
|
)
|
(1.03
|
)
|
(1.03
|
)
|
|||||||||||
|
$
|
8.90
|
$
|
5.68
|
$
|
11.09
|
$
|
12.83
|
$
|
14.66
|
$
|
16.66
|
|||||||||||
|
78.57
|
%
|
-41.93
|
%
|
-6.10
|
%
|
-5.94
|
%(4)
|
-6.25
|
%
|
14.97
|
%
|
|||||||||||
|
$
|
30.45
|
$
|
18.33
|
$
|
31.78
|
$
|
61.92
|
$
|
82.59
|
$
|
33.22
|
|||||||||||
|
1.74
|
%
|
1.79
|
%
|
1.56
|
%
|
1.58
|
%(5)
|
1.66
|
%
|
1.95
|
%
|
|||||||||||
|
1.51
|
%(6)
|
1.51
|
%(6)
|
1.51
|
%
|
1.52
|
%(5)
|
1.52
|
%
|
1.48
|
%
|
|||||||||||
|
(0.89
|
)%
|
(1.55
|
)%
|
(0.76
|
)%
|
(1.15
|
)%(5)
|
(1.28
|
)%
|
(1.28
|
)%
|
|||||||||||
|
(0.66
|
)%
|
(1.27
|
)%
|
(0.71
|
)%
|
(1.09
|
)%(5)
|
(1.14
|
)%
|
(0.81
|
)%
|
|||||||||||
|
40
|
%
|
53
|
%
|
41
|
%
|
64
|
%(4)
|
63
|
%
|
139
|
%
|
|||||||||||
The accompanying notes are an integral part of these financial statements.
|
HENNESSY FUNDS
|
1-800-966-4354
|
15
Financial Statements
|
Notes to the Financial Statements April 30, 2022 (Unaudited)
|
1). ORGANIZATION
The Hennessy Midstream Fund (the “Fund”) is a series of Hennessy Funds Trust (the “Trust”), which was organized as a Delaware statutory trust on September 17, 1992. The Fund is an open-end management
investment company registered under the Investment Company Act of 1940, as amended. The investment objective of the Fund is to seek capital appreciation through distribution growth along with current income. The Fund is treated
as a regular corporation, or “C” corporation, for U.S. federal income tax purposes. Because the Fund is treated as a “C” corporation, it is not taxed as a regulated investment company under Subchapter M of the Code and is not
required to comply with the diversification requirements applicable to regulated investment companies. The Fund is a non-diversified fund.
The Fund offers Investor Class and Institutional Class shares. Each class of shares differs principally in its respective 12b-1 distribution and service, shareholder servicing, and
sub-transfer agent expenses. There are no sales charges. Each class has identical rights to earnings, assets, and voting privileges, except for class-specific expenses and exclusive rights to vote on matters affecting only one
class.
As an investment company, the Fund follows the investment company accounting and reporting guidance of the Financial Accounting Standards Board (“FASB”) Accounting Standard
Codification Topic 946 “Financial Services—Investment Companies.”
2). SIGNIFICANT ACCOUNTING POLICIES
The following is a summary of significant accounting policies consistently followed by the Fund in the preparation of the financial statements. These policies conform to U.S. generally accepted
accounting principles (“GAAP”).
|
a).
|
Securities Valuation – All investments in securities are valued in accordance with the Fund’s valuation policies and procedures, as described in Note 3.
|
|
b).
|
Federal Income Taxes – The Fund is taxed as a corporation and is obligated to pay U.S. federal and state income tax on its taxable income. Currently, the maximum marginal regular federal income
tax rate for a corporation is 21%. The Fund invests a substantial portion of its assets in master limited partnerships (“MLPs”), which are treated as partnerships for federal income tax purposes. As a limited partner in
MLPs, the Fund reports its allocable share of each MLP’s taxable income in computing its own taxable income.
|
|
The Fund includes any tax expense or benefit in the Statement of Operations based on the component of income or
gains/losses to which such expense or benefit relates. Deferred income taxes reflect the net tax effects of temporary differences between the carrying amount of assets and liabilities for financial reporting purposes and
the carrying amount of assets and liabilities for income tax purposes. The Fund recognizes a valuation allowance if, based on the weight of available evidence, it is more likely than not that the Fund will not realize
some portion or all of the deferred income tax assets. As of April 30, 2022, the Fund has placed a full valuation allowance on its deferred tax assets.
|
|
|
c).
|
Accounting for Uncertainty in Income Taxes – The Fund has accounting policies regarding recognition and measurement of tax positions taken or expected to be taken on a tax return. The tax
returns of the Fund for the prior three fiscal years are
|
|
WWW.HENNESSYFUNDS.COM
|
16
|
NOTES TO THE FINANCIAL STATEMENTS
|
|
open for examination. The Fund has reviewed all open tax years in major tax jurisdictions and concluded that there is no impact on the Fund’s net assets and no tax liability resulting from
unrecognized tax benefits relating to uncertain income tax positions taken or expected to be taken on a tax return. The Fund files U.S. federal income tax returns and various state income tax returns.
|
|
|
d).
|
Income and Expenses – Dividend income is recognized on the ex-dividend date or as soon as information is available to the Fund. Interest income, which includes the amortization of premium and
accretion of discount, is recognized on an accrual basis. Market discounts, original issue discounts, and market premiums on debt securities are accreted or amortized to interest income over the life of a security with a
corresponding increase or decrease, as applicable, in the cost basis of such security using the yield-to-maturity method or, where applicable, the first call date of the security. Other non-cash dividends are recognized
as investment income at the fair value of the property received. The Fund is charged for those expenses that are directly attributable to its portfolio, such as advisory, administration, and certain shareholder service
fees. Income, expenses (other than expenses attributable to a specific class), and realized and unrealized gains/losses on investments are allocated to each class of shares based on such class’s net assets. Distributions
received from the Fund’s investments in MLPs generally consist of ordinary income, capital gains, and return of capital. The Fund records investment income on the ex-date of the distributions. For financial statement
purposes, the Fund uses return of capital and income estimates to allocate the dividend income received. Such estimates are based on historical information available from the MLPs and other industry sources. These
estimates may subsequently be revised based on information received from the MLPs after their tax reporting periods are concluded, as the actual character of these distributions is not known until after the fiscal year
end of the Fund.
|
|
e).
|
Distributions to Shareholders – The Fund typically makes cash distributions to its shareholders quarterly at the beginning of the months of March, June, September, and December. Due to the tax
treatment of the Fund’s allocations and distributions from MLPs, a significant portion of the Fund’s distributions to shareholders typically is treated as return of capital to shareholders for U.S. federal income tax
purposes (i.e., as distributions in excess of the Fund’s current and accumulated earnings and profits as described below). However, no assurance can be given in this regard; just as the Fund’s corporate income tax
liability can fluctuate materially from year to year, the extent to which the Fund is able to make return-of-capital distributions also can vary materially from year to year depending on a number of different factors,
including the composition of the Fund’s portfolio, the level of allocations of net income and other tax items for the Fund from its underlying MLP investments, the length of time the Fund has owned the MLP equity
securities in its portfolio, and the extent to which the Fund disposes of MLP equity securities during a particular year, including to meet Fund shareholder redemption requests as necessary.
|
|
In general, a distribution constitutes a return of capital to a shareholder rather than a dividend to the extent such
distribution exceeds the Fund’s current and accumulated earnings and profits. The portion of any distribution treated as a return of capital constitutes a tax-free return of capital to the extent of a shareholder’s cost
basis in Fund shares and thereafter generally is taxable to the shareholder as a capital gain. A return-of-capital distribution also reduces the shareholder’s cost basis in Fund shares (but not below zero). A lower cost
basis means that a shareholder recognizes more gain or less loss when the shareholder eventually sells Fund shares, which increases the shareholder’s tax liability.
|
|
HENNESSY FUNDS
|
1-800-966-4354
|
17
|
The Fund attempts to maintain a stable distribution rate and therefore may distribute more or less than the actual amount
of cash it receives from its investments in a particular period. Any undistributed cash would be available to supplement future distributions, and until distributed would increase the Fund’s net asset value (“NAV”).
Correspondingly, such amounts, once distributed, decrease the Fund’s NAV. In addition, the Fund may opt not to make distributions in quarters in which the Fund believes that a distribution could cause adverse tax
consequences to shareholders, including when the Fund believes that a distribution may not constitute a tax-free return of capital as described above.
|
|
|
f).
|
Security Transactions – Investment and shareholder transactions are recorded on the trade date. The Fund determines the realized gain/loss from an investment transaction by comparing the
original cost of the security lot sold with the net sale proceeds. Discounts and premiums on securities purchased are accreted or amortized, respectively, over the life of each such security.
|
|
g).
|
Use of Estimates – Preparing financial statements in accordance with GAAP requires management to make estimates and assumptions that affect the reported amounts of assets and liabilities and
disclosure of contingent assets and liabilities at the date of the financial statements, as well as the reported change in net assets during the reporting period. Actual results could differ from those estimates.
|
|
h).
|
Share Valuation – The NAV per share of the Fund is calculated by dividing (i) the total value of the securities held by the Fund, plus cash and other assets, minus all liabilities (including
estimated accrued expenses) by (ii) the total number of Fund shares outstanding, rounded to the nearest $0.01. Fund shares are not priced on days the New York Stock Exchange is closed for trading. The offering and
redemption price per share for the Fund is equal to the Fund’s NAV per share.
|
|
i).
|
Partnership Accounting Policy – To the extent the Fund receives distributions from underlying partnerships in which it invests, the Fund records its pro rata share of income/loss and capital
gains/losses and accordingly adjusts the cost basis of the underlying partnerships for return of capital.
|
|
j).
|
Recent Accounting Pronouncements and Regulatory Updates – In October 2020, the Securities and Exchange Commission (“SEC”) adopted new regulations governing the use of derivatives by registered
investment companies (“Rule 18f-4”). Rule 18f-4 imposes limits on the amount of derivatives a fund can enter into, eliminates the asset segregation framework currently used by funds to comply with Section 18 of the 1940
Act, and requires funds whose use of derivatives is greater than a limited specified amount to establish and maintain a comprehensive derivatives risk management program and appoint a derivatives risk manager. Funds are
required to comply with Rule 18f-4 by August 19, 2022. The impact, if any, that Rule 18f-4 will have on the availability, liquidity, and performance of derivatives is unclear. Management is currently evaluating the
potential impact of Rule 18f-4 on the Fund. When fully implemented, Rule 18f-4 may require changes in how the Fund uses derivatives, adversely affect the Fund’s performance, and increase costs related to the Fund’s use
of derivatives.
|
|
In December 2020, the SEC adopted a new rule providing a framework for fund valuation practices (“Rule 2a-5”). Rule 2a-5
establishes requirements for determining fair value in good faith for purposes of the 1940 Act. Rule 2a-5 permits fund boards to designate certain parties to perform fair value determinations, subject to board oversight
and certain other conditions. Rule 2a-5 also defines when market quotations are “readily available” for purposes of the 1940 Act and the threshold for
|
|
WWW.HENNESSYFUNDS.COM
|
18
|
NOTES TO THE FINANCIAL STATEMENTS
|
|
determining whether a fund must fair value a security. In connection with Rule 2a-5, the SEC also adopted related recordkeeping requirements and is rescinding previously issued guidance,
including with respect to the role of a board in determining fair value and the accounting and auditing of fund investments. Funds must comply with the rules by September 8, 2022. Management is currently assessing the
potential impact of the new rules on the Fund’s financial statements.
|
3). SECURITIES VALUATION
The Fund follows its valuation policies and procedures in determining its net asset value and, in preparing these financial statements, the fair value accounting standards that establish an
authoritative definition of fair value and set out a hierarchy for measuring fair value. These standards require additional disclosures about the various inputs and valuation techniques used to develop the measurements of fair
value and a discussion of changes in valuation techniques and related inputs during the period. These inputs are summarized in the three broad levels listed below:
|
Level 1 –
|
Unadjusted, quoted prices in active markets for identical instruments that the Fund has the ability to access at the date of measurement.
|
|
|
Level 2 –
|
Other significant observable inputs (including, but not limited to, quoted prices in active markets for similar instruments, quoted prices in markets that are not active for identical or
similar instruments, and model-derived valuations in which all significant inputs and significant value drivers are observable in active markets, such as interest rates, prepayment speeds, credit risk curves, default
rates, and similar data).
|
|
|
Level 3 –
|
Significant unobservable inputs (including the Fund’s own assumptions about what market participants would use to price the asset or liability based on the best available information) when
observable inputs are unavailable.
|
The following is a description of the valuation techniques applied to the Fund’s major categories of assets and liabilities on a recurring basis:
|
Equity Securities – Equity securities, including common stocks, preferred stocks, foreign-issued common stocks, exchange-traded funds, closed-end mutual
funds, partnerships, rights, MLPs, and real estate investment trusts, that are traded on a securities exchange for which a last-quoted sales price is readily available generally are valued at the last sales price as
reported by the primary exchange on which the securities are listed. Securities listed on The Nasdaq Stock Market (“Nasdaq”) generally are valued at the Nasdaq Official Closing Price, which may differ from the last sales
price reported. Securities traded on a securities exchange for which a last-quoted sales price is not readily available generally are valued at the mean between the bid and ask prices. To the extent these securities are
actively traded and valuation adjustments are not applied, they are classified in Level 1 of the fair value hierarchy. Securities traded on foreign exchanges generally are not valued at the same time the Fund calculates
its NAV because most foreign markets close well before such time. The earlier close of most foreign markets gives rise to the possibility that significant events, including broad market moves, may have occurred in the
interim. In certain circumstances, it may be determined that a foreign security needs to be fair valued because it appears that the value of the security might have been materially affected by events occurring after the
close of the market in which the security is principally traded, but before the time the Fund calculates its NAV, such as by a development that affects an entire market or region (e.g., a weather-related event) or a
potentially global development (e.g., a terrorist attack that may be expected to have an effect on investor expectations worldwide).
|
|
HENNESSY FUNDS
|
1-800-966-4354
|
19
|
Registered Investment Companies – Investments in open-end registered investment companies, commonly referred to as mutual funds, generally are priced at
the ending NAV provided by the applicable mutual fund’s service agent and are classified in Level 1 of the fair value hierarchy.
|
|
|
Debt Securities – Debt securities, including corporate bonds, asset-backed securities, mortgage-backed securities, municipal bonds, U.S. Treasuries, and
U.S. government agency issues, are generally valued at market on the basis of valuations furnished by an independent pricing service that utilizes both dealer-supplied valuations and formula-based techniques. The pricing
service may consider recently executed transactions in securities of the issuer or comparable issuers, market price quotations (where observable), bond spreads, and fundamental data relating to the issuer. In addition,
the model may incorporate observable market data, such as reported sales of similar securities, broker quotes, yields, bids, offers, and reference data. Certain securities are valued primarily using dealer quotations.
These securities are generally classified in Level 2 of the fair value hierarchy.
|
|
|
Short-Term Securities – Short-term equity investments, including money market funds, are valued in the manner specified above for equity securities.
Short-term debt investments with an original term to maturity of 60 days or less are valued at amortized cost, which approximates fair market value. If the original term to maturity of a short-term debt investment
exceeds 60 days, then the values as of the 61st day prior to maturity are amortized. Amortized cost is not used if its use would be inappropriate due to credit or other impairments of the issuer, in which case the
security’s fair value would be determined as described below. Short-term securities are generally classified in Level 1 or Level 2 of the fair value hierarchy depending on the inputs used and market activity levels for
specific securities.
|
The Board of Trustees of the Fund (the “Board”) has adopted fair value pricing procedures that are followed when a price for a security is not readily available or if a significant
event has occurred that indicates the closing price of a security no longer represents the true value of that security. Fair value pricing determinations are made in good faith in accordance with these procedures. There are
numerous criteria considered in determining a fair value of a security, such as the trading volume of a security and markets, the values of other similar securities, and news events with direct bearing on a security or markets.
Fair value pricing results in an estimated price for a security that reflects the amount the Fund might reasonably expect to receive in a current sale. Depending on the relative significance of the valuation inputs, these
securities may be classified in either Level 2 or Level 3 of the fair value hierarchy.
The fair value of foreign securities may be determined with the assistance of a pricing service using correlations between the movement of prices of such securities and indices of
domestic securities and other appropriate indicators, such as closing market prices of relevant American Depositary Receipts or futures contracts. Using fair value pricing means that the Fund’s NAV reflects the affected
portfolio securities’ values as determined by the Board or its designee, pursuant to the fair value pricing procedures adopted by the Board, instead of being determined by the market. Using a fair value pricing methodology to
price a foreign security may result in a value that is different from such foreign security’s most recent closing price and from the value used by other investment companies to calculate their NAVs. Such securities are generally
classified in Level 2 of the fair value hierarchy. Because the Fund may invest in foreign securities, the value of the Fund’s portfolio securities may change on days when a shareholder is unable to purchase or redeem Fund
shares.
|
WWW.HENNESSYFUNDS.COM
|
20
|
NOTES TO THE FINANCIAL STATEMENTS
|
The Board has delegated day-to-day valuation matters to the Valuation and Liquidity Committee comprising representatives from Hennessy Advisors, Inc., the Fund’s investment advisor
(the “Advisor”). The function of the Valuation and Liquidity Committee, among other things, is to value securities where current and reliable market quotations are not readily available. All actions taken by the Valuation and
Liquidity Committee are reviewed by the Board.
The Fund has performed an analysis of all existing investments to determine the significance and character of all inputs to their fair value determinations. Various inputs are used
to determine the value of the Fund’s investments. The inputs or methodology used for valuing securities are not necessarily an indication of the risk associated with investing in those securities. Details related to the fair
value hierarchy of the Fund’s securities as of April 30, 2022, are included in the Schedule of Investments.
4). INVESTMENT TRANSACTIONS
Purchases and sales of investment securities (excluding government and short-term investments) for the Fund during the six months ended April 30, 2022, were $6,431,254 and $2,246,822, respectively.
There were no purchases or sales/maturities of long-term U.S. government securities for the Fund during the six months ended April 30, 2022.
5). INVESTMENT ADVISORY FEE AND OTHER TRANSACTIONS WITH AFFILIATES
The Advisor provides the Fund with investment advisory services under an Investment Advisory Agreement. The Advisor furnishes all investment advice, office space, and facilities and most of the
personnel needed by the Fund. As compensation for its services, the Advisor is entitled to a monthly fee from the Fund. The fee is based on the average daily net assets of the Fund at an annual rate of 1.10%. The net investment
advisory fees expensed by the Fund during the six months ended April 30, 2022, are included in the Statement of Operations.
Prior to January 31, 2022, the Advisor delegated the day-to-day management of the Fund to a sub-advisor. Effective January 31, 2022, the sub-advisory agreement between BP Capital
Fund Advisors, LLC and the Advisor was terminated. The Advisor paid the sub-advisory fees from its own assets, and these fees were not an additional expense of the Fund. From November 1, 2021, through January 31, 2022, the
Advisor (not the Fund) paid a sub-advisory fee at the rate of 0.40% of the daily net assets of the Fund.
The Advisor has contractually agreed to limit total annual operating expenses to 1.75% of the Fund’s net assets for Investor Class shares and 1.50% of the Fund’s net assets for
Institutional Class shares (in each case, excluding all federal, state, and local taxes, interest, brokerage commissions, dividend and interest expenses on short sales, extraordinary items, and acquired fund fees and expenses
and other costs incurred in connection with the purchase and sale of securities) through February 28, 2023.
For three years following the date on which expenses were waived or incurred, the Advisor may recoup waived or reimbursed expenses from the Fund if total operating expenses,
including such recoupment, does not exceed the expense limitation in effect (i) at the time the Advisor waived or reimbursed such expenses and (ii) at the time the Advisor recoups such expenses. As of April 30, 2022, expenses
subject to potential recovery for Investor Class and Institutional Class shares and the fiscal years in which they expire were as follows:
|
Fiscal Year
|
Fiscal Year
|
Fiscal Year
|
Fiscal Year
|
|||
|
2022
|
2023
|
2024
|
2025
|
Total
|
||
|
Investor Class
|
$10,704
|
$22,658
|
$12,376
|
$4,805
|
$ 50,543
|
|
|
Institutional Class
|
$15,321
|
$60,422
|
$26,693
|
$2,654
|
$105,090
|
|
HENNESSY FUNDS
|
1-800-966-4354
|
21
The amount of the expense reimbursement by the Advisor for Institutional Class shares set forth in the statement of Operations is net of $543 that the Advisor recouped from the Fund during the six
months ended April 30, 2022.
The Board has approved a Shareholder Servicing Agreement for Investor Class shares of the Fund, which compensates the Advisor for the non-investment advisory services it provides to
the Fund. The Shareholder Servicing Agreement provides for a monthly fee paid to the Advisor at an annual rate of 0.10% of the average daily net assets of the Fund attributable to Investor Class shares. The shareholder service
fees expensed by the Fund during the six months ended April 30, 2022, are included in the Statement of Operations.
The Fund has adopted a plan pursuant to Rule 12b-1 under the Investment Company Act of 1940, as amended, that authorizes payments in connection with the distribution of Fund shares
at an annual rate of up to 0.25% of the Fund’s average daily net assets attributable to Investor Class shares. Even though the authorized rate is up to 0.25%, the Fund is currently only using up to 0.15% of its average daily net
assets attributable to Investor Class shares for such purpose. Amounts paid under the plan may be spent on any activities or expenses primarily intended to result in the sale of shares, including, but not limited to,
advertising, shareholder account servicing, printing and mailing of prospectuses to other than current shareholders, printing and mailing of sales literature, and compensation for sales and marketing activities or to financial
institutions and others, such as dealers and distributors. The distribution fees expensed by the Fund during the six months ended April 30, 2022, are included in the Statement of Operations.
The Fund has entered into agreements with various brokers, dealers, and financial intermediaries in connection with the sale of Fund shares. The agreements provide for periodic
payments of sub-transfer agent expenses by the Fund to the brokers, dealers, and financial intermediaries for providing certain shareholder maintenance services. These shareholder services include the pre-processing and quality
control of new accounts, shareholder correspondence, answering customer inquiries regarding account status, and facilitating shareholder telephone transactions. The sub-transfer agent fees expensed by the Fund during the six
months ended April 30, 2022, are included in the Statement of Operations.
U.S. Bancorp Fund Services, LLC, d/b/a U.S. Bank Global Fund Services (“Fund Services”) provides the Fund with administrative, accounting, and transfer agent services. As
administrator, Fund Services is responsible for activities such as (i) preparing various federal and state regulatory filings, reports, and returns for the Fund, (ii) preparing reports and materials to be supplied to the Board,
(iii) monitoring the activities of the Fund’s custodian, transfer agent, and accountants, and (iv) coordinating the preparation and payment of the Fund’s expenses and reviewing the Fund’s expense accruals. U.S. Bank N.A., an
affiliate of Fund Services, serves as the Fund’s custodian. The servicing agreements between the Trust, Fund Services, and U.S. Bank N.A. contain a fee schedule that is inclusive of administrative, accounting, custody, and
transfer agent fees. The administrative, accounting, custody, and transfer agent fees expensed by the Fund during the six months ended April 30, 2022, are included in the Statement of Operations. Fund Services has voluntarily
waived all or a portion of its fees for the Fund. The fees voluntarily waived by Fund Services during the six months ended April 30, 2022, are included in the Statement of Operations.
Quasar Distributors, LLC (“Quasar”), a wholly owned broker-dealer subsidiary of Foreside Financial Group, LLC, acts as the Fund’s principal underwriter in a continuous public
offering of Fund shares.
|
WWW.HENNESSYFUNDS.COM
|
22
|
NOTES TO THE FINANCIAL STATEMENTS
|
The officers of the Fund are affiliated with the Advisor. With the exception of the Chief Compliance Officer and the Senior Compliance Officer, such officers receive no compensation
from the Fund for serving in their respective roles. The Fund, along with the other funds in the Hennessy Funds family (collectively, the “Hennessy Funds”), makes reimbursement payments on an equal basis to the Advisor for a
portion of the salary and benefits associated with the office of the Chief Compliance Officer and for all of the salary and benefits associated with the office of the Senior Compliance Officer. The compliance fees expensed by
the Fund during the six months ended April 30, 2022, are included in the Statement of Operations.
6). GUARANTEES AND INDEMNIFICATIONS
Under the Hennessy Funds’ organizational documents, their officers and trustees are indemnified by the Hennessy Funds against certain liabilities arising out of the performance of their duties to the
Hennessy Funds. Additionally, in the normal course of business, the Hennessy Funds enter into contracts with service providers that contain general indemnification clauses. The Fund’s maximum exposure under these arrangements is
unknown as this would involve future claims that may be made against the Fund that have not yet occurred. Currently, the Fund expects the risk of loss to be remote.
7). LINE OF CREDIT
The Fund has an uncommitted line of credit with the other Hennessy Funds in the amount of the lesser of (i) $100,000,000 or (ii) 33.33% of each Hennessy Fund’s net assets, or 30% for the Hennessy Gas
Utility Fund and 10% for the Hennessy Balanced Fund. The line of credit is intended to provide any necessary short-term financing in connection with shareholder redemptions, subject to certain restrictions. The credit facility
is with the Hennessy Funds’ custodian bank, U.S. Bank N.A. Borrowings under this arrangement bear interest at the bank’s prime rate and are secured by all of the Fund’s assets (as to its own borrowings only). During the six
months ended April 30, 2022, the Fund did not have any borrowings outstanding under the line of credit.
8). FEDERAL TAX INFORMATION
As of April 30, 2022, the components of accumulated earnings (losses) for income tax purposes were as follows:
|
Investments
|
||||
|
Cost of investments for tax purposes
|
$
|
25,744,103
|
||
|
Gross tax unrealized appreciation
|
$
|
20,982,155
|
||
|
Gross tax unrealized depreciation
|
—
|
|||
|
Net tax unrealized appreciation/(depreciation)
|
$
|
20,982,155
|
||
As of April 30, 2022, deferred tax assets consisted of the following:
|
Deferred tax assets (liabilities):
|
||||
|
Net operating losses
|
$
|
905,000
|
||
|
Capital loss
|
5,027,828
|
|||
|
Unrealized (gain) loss on investments
|
(3,490,998
|
)
|
||
|
Total deferred tax assets, net
|
2,441,830
|
|||
|
Valuation allowance
|
(2,441,830
|
)
|
||
|
Net
|
$
|
—
|
||
For the six months ended April 30, 2022, the Fund had an effective tax rate of 0% and a federal statutory rate of 21%, with the difference resulting from a change in the valuation
allowance of the deferred tax assets.
|
HENNESSY FUNDS
|
1-800-966-4354
|
23
Deferred income tax assets and liabilities are recorded for differences between the financial statement and tax basis of the assets and liabilities that will result in taxable or
deductible amounts in the future based on enacted laws and rates applicable to the periods in which the differences are expected to affect taxable income. Valuation allowances are established when necessary to reduce deferred
tax assets to the amount expected to be realized. The Fund has evaluated the available evidence supporting the realization of its gross deferred tax assets, including the amount and timing of future taxable income, and has
determined that, based on net losses to date, it may not utilize all of its deferred tax assets in the future. As of April 30, 2022, the Fund established a valuation allowance in the amount of $2,441,830 against its deferred tax
assets.
The Fund may carry forward any net capital loss five years to offset any future realized capital gains. The Fund may carry forward indefinitely any net operating loss arising in a
tax year ending after December 31, 2018. As of April 30, 2022, the Fund had $22,232,587 in capital loss carryforwards that expire as follows:
|
Amount
|
Expiration
|
||||
|
$
|
6,082,301
|
10/31/2023
|
|||
|
8,971,423
|
10/31/2024
|
||||
|
7,178,863
|
10/31/2025
|
||||
As of April 30, 2022, the Fund had $4,098,530 in net operating loss carryforwards that expire as follows:
|
Amount
|
Expiration
|
||||
|
$
|
360,753
|
11/30/2037
|
|||
|
3,737,777
|
Indefinite
|
||||
Total income taxes have been computed by applying the federal statutory income tax rate of 21% plus a blended state income tax rate. The Fund applied this effective rate to net
investment income and realized and unrealized gains on investments before taxes in computing its total income taxes.
|
Tax expense (benefit) at statutory rates
|
$
|
1,219,526
|
|||
|
State income tax expense, net of federal benefit
|
85,501
|
||||
|
Tax expense (benefit) on permanent items(1)
|
(13,179
|
)
|
|||
|
Tax expense (benefit) on expired carryforwards
|
—
|
||||
|
Tax expense (benefit) due to change in effective state rates
|
—
|
||||
|
Total current tax expense (benefit)
|
—
|
||||
|
Change in valuation allowance
|
(1,291,848
|
)
|
|||
|
Total tax expense
|
$
|
—
|
|
(1) Permanent items consist of dividends-received deductions.
|
The Fund recognizes the tax benefits of uncertain tax positions only where the position is “more likely than not” to be sustained assuming examination by tax authorities. Management
has analyzed the Fund’s tax positions in all open tax years and has concluded that no liability for unrecognized tax benefits should be recorded related to uncertain tax positions taken on U.S. federal tax returns and state tax
returns filed or expected to be filed. No income tax returns are currently under examination. Generally, the tax returns of the Fund for the prior three fiscal years are open for examination. Due to the nature of the Fund’s
investments, the Fund may be required to file income tax returns in several states. The Fund is not aware of any tax positions for which it is reasonably possible that the total amounts of unrecognized tax benefits will change
materially.
|
WWW.HENNESSYFUNDS.COM
|
24
|
NOTES TO THE FINANCIAL STATEMENTS
|
During fiscal year 2022 (year to date) and fiscal year 2021, the tax character of distributions paid by the Fund was as follows:
|
Six Months Ended
|
Year Ended
|
||||||||
|
April 30, 2022
|
October 31, 2021
|
||||||||
|
Ordinary income(1)
|
$
|
—
|
$
|
—
|
|||||
|
Long-term capital gains
|
—
|
—
|
|||||||
|
Return of capital
|
2,283,492
|
4,176,540
|
|||||||
|
Total distributions
|
$
|
2,283,492
|
$
|
4,176,540
|
|||||
|
(1) Ordinary income includes short-term capital gains.
|
9). EVENTS SUBSEQUENT TO PERIOD END
Management has evaluated the Fund’s related events and transactions that occurred subsequent to April 30, 2022, through the date of issuance of the Fund’s financial statements. Other than as disclosed
below, management has determined that there were no subsequent events requiring recognition or disclosure in the financial statements.
On June 1, 2022, distributions were declared and paid to shareholders of record on May 31, 2022, as follows:
|
Return of Capital
|
||
|
Investor Class
|
$0.2575
|
|
|
Institutional Class
|
$0.2575
|
|
HENNESSY FUNDS
|
1-800-966-4354
|
25
Expense Example (Unaudited)
April 30, 2022
As a shareholder of the Fund, you incur ongoing costs, including management fees, service fees, and other Fund expenses. This Example is intended to help you understand your ongoing costs (in dollars)
of investing in the Fund and to compare these costs with the ongoing costs of investing in other mutual funds. The Example is based on an investment of $1,000 invested at the beginning of the period and held for the entire
period from November 1, 2021, through April 30, 2022.
Actual Expenses
In the table below, the first line under each of the “Investor Class” and “Institutional Class” headings provides information about actual account values and actual expenses for each share class. You
may use this information, together with the amount you invested, to estimate the expenses that you paid over the period. Simply divide your account value by $1,000 (for example, an $8,600 account value divided by $1,000 = 8.6),
then multiply the result by the number in the first line under the heading “Expenses Paid During Period” to estimate the expenses you paid on your account during this period. Although the Fund charges no sales loads or
transaction fees, you will be assessed fees for outgoing wire transfers, returned checks, and stop payment orders at prevailing rates charged by U.S. Bank Global Fund Services, the Fund’s transfer agent. If you request that a
redemption be made by wire transfer, the Fund’s transfer agent charges a $15 fee. IRAs are charged a $15 annual maintenance fee (up to $30 maximum per shareholder for shareholders with multiple IRAs). The examples below include,
but are not limited to, management, shareholder servicing, accounting, custody, and transfer agent fees. However, the examples below do not include portfolio trading commissions and related expenses.
Hypothetical Example for Comparison Purposes
In the table below, the second line under each of the “Investor Class” and “Institutional Class” headings provides information about hypothetical account values and hypothetical expenses based on the
Fund’s actual expense ratio for each share class and an assumed rate of return of 5% per year before expenses, which is not the Fund’s actual return for such share class. The hypothetical account values and expenses may not be
used to estimate the actual ending account balance or expenses you paid for the period. You may use this information to compare the ongoing costs of investing in the Fund and other funds. To do so, compare these 5% hypothetical
examples with the 5% hypothetical examples that appear in the shareholder reports of the other funds. Please note that the expenses shown in the table are meant to highlight your ongoing costs only. Therefore, the second lines
under “Investor Class” and “Institutional Class” are useful in comparing ongoing costs only and will not help you determine the relative total costs of owning different funds.
|
WWW.HENNESSYFUNDS.COM
|
26
|
EXPENSE EXAMPLE
|
|
Beginning
|
Ending
|
||
|
Account Value
|
Account Value
|
Expenses Paid
|
|
|
November 1, 2021
|
April 30, 2022
|
During Period(1)
|
|
|
Investor Class
|
|||
|
Actual
|
$1,000.00
|
$1,145.20
|
$9.31
|
|
Hypothetical (5% return before expenses)
|
$1,000.00
|
$1,016.12
|
$8.75
|
|
Institutional Class
|
|||
|
Actual
|
$1,000.00
|
$1,146.90
|
$7.98
|
|
Hypothetical (5% return before expenses)
|
$1,000.00
|
$1,017.36
|
$7.50
|
|
(1)
|
Expenses are equal to the Fund’s annualized expense ratio of 1.75% for Investor Class shares or 1.50% for Institutional Class shares, as applicable, multiplied by the average account value over
the period, multiplied by 181/365 days (to reflect the half-year period).
|
|
HENNESSY FUNDS
|
1-800-966-4354
|
27
How to Obtain a Copy of the Fund’s Proxy
Voting Policy and Proxy Voting Records
A description of the policies and procedures the Fund uses to determine how to vote proxies relating to portfolio securities is available without charge (1) by calling 800-966-4354, (2) on the Hennessy
Funds’ website at www.hennessyfunds.com/proxy-voting/voting-policy, or (3) on the U.S. Securities and Exchange Commission’s (the “SEC”) website at www.sec.gov. The Fund’s proxy voting record is available without charge on both
the Hennessy Funds’ website at www.hennessyfunds.com/proxy-voting/voting-record and the SEC’s website at www.sec.gov no later than August 31 for the prior 12 months ending June 30.
Availability of Quarterly Portfolio Schedule
The Fund files its complete schedule of portfolio holdings with the SEC for the first and third quarters of each fiscal year as an exhibit to its reports on Form N-PORT. The Fund’s Form N-PORT reports
are available on the SEC’s website at www.sec.gov or on request by calling 800-966-4354.
Federal Tax Distribution Information (Unaudited)
For fiscal year 2021, certain dividends paid by the Fund may be subject to a maximum tax rate of 23.8%, as provided for by the Jobs and Growth Tax Relief Reconciliation Act of 2003. The percentage of
dividends declared from ordinary income designated as qualified dividend income was 0.00%.
For corporate shareholders, the percent of ordinary income distributions that qualified for the corporate dividends received deduction for fiscal year 2021 was 0.00%.
The percentage of taxable ordinary income distributions that were designated as short-term capital gain distributions under Section 871(k)(2)(C) of the Internal Revenue Code of 1986,
as amended, for the Fund was 0.00%.
Important Notice Regarding Delivery
of Shareholder Documents
To help keep the Fund’s costs as low as possible, we generally deliver a single copy of shareholder reports, proxy statements, and prospectuses to shareholders who share an address and have the same
last name. This process does not apply to account statements. You may request an individual copy of a shareholder document at any time. If you would like to receive separate mailings of shareholder documents, please call U.S.
Bank Global Fund Services at 800-261-6950 or 414-765-4124, and individual delivery will begin within 30 days of your request. If your account is held through a financial institution or other intermediary, please contact such
intermediary directly to request individual delivery.
Electronic Delivery
As permitted by SEC regulations, the Fund’s shareholder reports are made available on a website, and unless you sign up for eDelivery or elect to receive paper copies as detailed below, you will be
notified each time a report is posted and provided with a website link to access the report.
The Fund also offers shareholders the option to receive all notices, account statements, prospectuses, tax forms, and shareholder reports electronically. To sign up for eDelivery or
change your delivery preference, please visit www.hennessyfunds.com/account.
To elect to receive paper copies of all future reports free of charge, please call U.S. Bank Global Fund Services at 800-261-6950 or 414-765-4124.
Subscribe to receive our team’s unique market and sector insights delivered to your inbox
www.hennessyfunds.com/subscribe
Follow us on social media
| |
|
|
WWW.HENNESSYFUNDS.COM
|
28
|
PROXY VOTING — BOARD APPROVAL OF INVESTMENT ADVISORY AGREEMENT
|
Board Approval of Investment Advisory
Agreement
At its meeting on March 11, 2022, the Board of Trustees of the Fund (the “Board,” and the members thereof, the “Trustees”) unanimously approved the continuation of the investment advisory agreement of
the Fund with Hennessy Advisors, Inc. (the “Advisor”). As part of the process, the Trustees reviewed their fiduciary duties and the relevant factors for them to consider with respect to approving the advisory agreement. In
addition, the Trustees who are not deemed “interested persons” (as defined by the Investment Company Act of 1940, as amended) of the Fund (the “Independent Trustees”) met in executive session to discuss the approval of the
advisory agreement. As part of their discussion, the Independent Trustees confirmed their understanding of the need to have asked about, and received answers to, any matters that they believed are relevant to determining whether
to approve the continuation of the advisory agreement.
In advance of the meeting, the Advisor sent detailed information to the Trustees to assist them in their evaluation of the advisory agreement. This information included, but was not
limited to, the following:
|
(1)
|
A memorandum from outside legal counsel that described the fiduciary duties of the Board with respect to approving the continuation of the advisory agreement and the relevant factors for
consideration;
|
|
|
(2)
|
A memorandum from the Advisor that listed the factors relevant to the Board’s approval of the continuation of the advisory agreement and also referenced the documents that had been provided to
help the Board assess each such factor;
|
|
|
(3)
|
The Advisor’s financial statements from its most recent Form 10-K and Form 10-Q;
|
|
|
(4)
|
A summary of the advisory agreement;
|
|
|
(5)
|
A recent Fund fact sheet, which included, among other things, Fund performance over various periods;
|
|
|
(6)
|
A description of the range of services provided by the Advisor;
|
|
|
(7)
|
A peer expense comparison of the net expense ratio and investment advisory fee of the Fund; and
|
|
|
(8)
|
A memorandum from the Advisor regarding economies of scale.
|
The Trustees reviewed and discussed all of the information provided by the Advisor. Following this review, and further discussion with the Advisor, the Trustees concluded that the
information provided before and at the meeting addressed all of the relevant matters that they wanted to consider in assessing the performance of the Funds and the performance of the Advisor under the advisory agreement, and
that said information provided them with a fulsome understanding of the advisory agreement and the services provided by the Advisor.
All of the factors discussed were considered as a whole by the Trustees, as well as by the Independent Trustees meeting in executive session. The Trustees viewed the relevant factors
in their totality, with no single factor being the principal or determinative factor in the Trustees’ determination of whether to approve the continuation of the advisory agreement. The Trustees recognized that the management
and fee arrangements for the Fund are the result of years of review and discussion between the Independent Trustees and the Advisor, that certain aspects of such arrangements may receive greater scrutiny in some years than in
others, and that the Trustees’ conclusions may be based, in part, on
|
HENNESSY FUNDS
|
1-800-966-4354
|
29
their consideration of these same arrangements and information received during the course of the year and in prior years.
Prior to approving the continuation of the advisory agreement, the Trustees, including the Independent Trustees in executive session, considered, among other items:
|
(1)
|
The nature and quality of the advisory services provided by the Advisor;
|
|
|
(2)
|
A comparison of the fees and expenses of the Fund to other similar funds;
|
|
|
(3)
|
Whether economies of scale are recognized by the Fund;
|
|
|
(4)
|
The costs and profitability of the Fund to the Advisor;
|
|
|
(5)
|
The performance of the Fund; and
|
|
|
(6)
|
Any benefits to the Advisor from serving as an investment advisor to the Fund (other than the advisory fee).
|
The material considerations and determinations of the Trustees, including the Independent Trustees, were as follows:
|
(1)
|
The Trustees considered the services identified below that are provided by the Advisor. Based on this review and an assessment of the Advisor’s performance, the Trustees concluded that the
Advisor provides high-quality services to the Fund, and they noted that their overall confidence in the Advisor was high. The Trustees also concluded that they were satisfied with the nature, extent, and quality of the
advisory services provided to the Fund by the Advisor and that the nature and extent of the services provided by the Advisor were appropriate to assure that the Fund’s operations are conducted in compliance with
applicable laws, rules, and regulations.
|
|
(a)
|
The Advisor acts as the portfolio manager for the Fund. In this capacity, the Advisor does the following:
|
|
(i)
|
manages the composition of the Fund’s portfolio, including the purchase, retention, and disposition of portfolio securities in accordance with the Fund’s investment objectives, policies, and
restrictions;
|
|||
|
(ii)
|
seeks best execution for the Fund’s portfolio;
|
|||
|
(iii)
|
manages the use of soft dollars for the Fund; and
|
|||
|
(iv)
|
manages proxy voting for the Fund.
|
|
(b)
|
The Advisor performs a daily reconciliation of portfolio positions and cash for the Fund.
|
||
|
(c)
|
The Advisor monitors the liquidity of each Fund.
|
||
|
(d)
|
The Advisor monitors the Fund’s compliance with its investment objectives and restrictions and federal securities laws.
|
||
|
(e)
|
The Advisor maintains a compliance program (including a code of ethics), conducts ongoing reviews of the compliance programs of the Fund’s service providers (including their codes of ethics, as
appropriate), conducts on-site visits to the Fund’s service providers, as feasible, monitors incidents of abusive trading practices, reviews Fund expense accruals, payments, and fixed expense ratios, evaluates insurance
providers for fidelity bond, D&O/E&O insurance, and cybersecurity insurance coverage, manages regulatory examination compliance and responses, conducts employee compliance training, reviews reports provided by
service providers, and maintains books and records.
|
|
WWW.HENNESSYFUNDS.COM
|
30
|
BOARD APPROVAL OF INVESTMENT ADVISORY AGREEMENT
|
|
(f)
|
The Advisor oversees service providers that provide accounting, administration, distribution, transfer agency, custodial, sales, marketing, public relations, audit, information technology, and
legal services to the Fund.
|
||
|
(g)
|
The Advisor maintains in-house marketing and distribution departments on behalf of the Fund.
|
||
|
(h)
|
The Advisor prepares or directs the preparation of all regulatory filings for the Fund, including writing and annually updating the Fund’s prospectus and related documents.
|
||
|
(i)
|
For each annual report of the Fund, the Advisor prepares a written summary of the Fund’s performance during the most recent 12-month period.
|
||
|
(j)
|
The Advisor oversees distribution of the Fund through third-party broker/dealers and independent financial institutions such as Charles Schwab, Inc., Fidelity, TD Ameritrade, and Pershing. The
Advisor participates in “no transaction fee” (“NTF”) programs with these companies on behalf of the Fund, which allow customers to purchase the Fund through third-party distribution channels without paying a transaction
fee. The Advisor compensates, in part, a number of these third-party providers of NTF programs out of its own revenues.
|
||
|
(k)
|
The Advisor pays the incentive compensation of the Fund’s compliance officers and employs other staff, such as legal, marketing, national accounts, distribution, sales, administrative, and
trading oversight personnel, as well as management executives.
|
||
|
(l)
|
The Advisor provides a quarterly compliance certification to the Board.
|
||
|
(m)
|
The Advisor prepares or reviews all Board materials, presents to and leads discussions with the Board, prepares or reviews all meeting minutes, and arranges for Board training and education.
|
|
(2)
|
The Trustees compared the performance of the Fund to benchmark indices over various periods and noted that the Trustees review and discuss reports comparing the investment performance of the
Fund to various indices at each quarterly Board meeting. Based on such information, the Trustees determined that the Advisor manages the Fund in a manner materially consistent with its stated investment objective and
style. The Trustees concluded that the performance of the Fund over various periods warranted the continuation of the advisory agreement.
|
|
|
(3)
|
The Trustees reviewed the advisory fees and overall expense ratios of the Fund compared to other funds similar in asset size and investment objective to the Fund using data from Morningstar. As
part of the discussion with management, the Trustees ensured that they understood and were comfortable with the criteria used to determine the mutual funds included in the Morningstar categories for purposes of the
materials considered at the meeting. The Trustees determined that the advisory fee and overall expense ratio of the Fund falls within a reasonable range of the advisory fees and overall expense ratios of other comparable
funds and concluded that they are reasonable and warranted continuation of the advisory agreement.
|
|
|
(4)
|
The Trustees also considered whether the Advisor was realizing economies of scale that should be shared with the Fund’s shareholders. The Trustees noted that the majority of expenses incurred
to manage the Fund are variable
|
|
HENNESSY FUNDS
|
1-800-966-4354
|
31
|
asset-based fees, so the Advisor does not realize material economies of scale relating to these expenses as the assets of the Fund increase. For example, third-party platform fees increase as
the Fund’s assets grow.
|
||
|
(5)
|
The Trustees considered the profitability of the Advisor, including the impact of mutual fund platform fees on the Advisor’s profitability, and also considered the resources and revenues that
the Advisor has put into managing and distributing the Fund. The Trustees then concluded that the profits of the Advisor are reasonable and not excessive when compared to profitability guidelines set forth in relevant
court cases.
|
|
|
(6)
|
The Trustees considered the high level of professionalism and knowledge of the Advisor’s employees and concluded that this was beneficial to the Fund and its shareholders.
|
|
|
(7)
|
The Trustees considered any benefits to the Advisor from serving as an advisor to the Fund (other than the advisory fee). The Trustees noted that the Advisor may derive ancillary benefits from,
by way of example, its association with the Fund in the form of proprietary and third-party research products and services received from broker-dealers that execute portfolio trades for the Fund. The Trustees determined
that any such products and services have been used for legitimate purposes relating to the Fund by providing assistance in the investment decision-making process. The Trustees concluded that any additional benefits
realized by the Advisor from its relationship with the Fund were reasonable, which was based on, among other things, the Trustees’ finding that the research, analytical, statistical, and other information and services
provided by brokers are merely supplemental to the Advisor’s own efforts in the performance of its duties under the advisory agreement.
|
After reviewing the materials and information provided at the meeting, as well as other information regularly provided at the Board’s quarterly meetings throughout the year regarding
the quality of services provided by the Advisor, the performance of the Fund, expense information, brokerage commissions information, the adequacy and efficacy of the Advisor’s written policies and procedures, other regulatory
compliance issues, trading information and related matters, and other factors that the Trustees deemed relevant, the Trustees, including the Independent Trustees, approved the continuation of the advisory agreement.
|
WWW.HENNESSYFUNDS.COM
|
32
|
BOARD APPROVAL OF INVESTMENT ADVISORY AGREEMENT
|
(This Page Intentionally Left Blank.)
For information, questions, or assistance, please call
The Hennessy Funds
800-966-4354 or 415-899-1555
INVESTMENT ADVISOR
Hennessy Advisors, Inc.
7250 Redwood Boulevard, Suite 200
Novato, California 94945
ADMINISTRATOR,
TRANSFER AGENT,
DIVIDEND PAYING AGENT, &
SHAREHOLDER SERVICING AGENT
U.S. Bancorp Fund Services, LLC
d/b/a U.S. Bank Global Fund Services
P.O. Box 701
Milwaukee, Wisconsin 53201-0701
CUSTODIAN
U.S. Bank N.A.
Custody Operations
1555 North River Center Drive, Suite 302
Milwaukee, Wisconsin 53212
TRUSTEES
Neil J. Hennessy
J. Dennis DeSousa
Robert T. Doyle
Claire Garvie
Gerald P. Richardson
COUNSEL
Foley & Lardner LLP
777 East Wisconsin Avenue
Milwaukee, Wisconsin 53202-5306
INDEPENDENT REGISTERED
PUBLIC ACCOUNTING FIRM
Tait, Weller & Baker LLP
Two Liberty Place
50 South 16th Street, Suite 2900
Philadelphia, Pennsylvania 19102-2529
DISTRIBUTOR
Quasar Distributors, LLC
111 East Kilbourn Avenue, Suite 1250
Milwaukee, Wisconsin 53202
www.hennessyfunds.com | 800-966-4354
This report has been prepared for shareholders and may be distributed to
others only if preceded or accompanied by a current prospectus.
SEMI-ANNUAL REPORT
APRIL 30, 2022

HENNESSY GAS UTILITY FUND
Investor Class GASFX
Institutional Class HGASX
www.hennessyfunds.com | 1-800-966-4354
(This Page Intentionally Left Blank.)
Contents
|
Letter to Shareholders
|
2
|
|
Performance Overview
|
4
|
|
Financial Statements
|
|
|
Schedule of Investments
|
5
|
|
Statement of Assets and Liabilities
|
9
|
|
Statement of Operations
|
10
|
|
Statements of Changes in Net Assets
|
11
|
|
Financial Highlights
|
12
|
|
Notes to the Financial Statements
|
16
|
|
Expense Example
|
24
|
|
Proxy Voting Policy and Proxy Voting Records
|
26
|
|
Availability of Quarterly Portfolio Schedule
|
26
|
|
Federal Tax Distribution Information
|
26
|
|
Important Notice Regarding Delivery of Shareholder Documents
|
26
|
|
Electronic Delivery
|
26
|
|
Board Approval of Investment Advisory Agreement
|
27
|
|
HENNESSY FUNDS
|
1-800-966-4354
|
May 2022
Dear Hennessy Funds Shareholder:
We’d like to start our semi-annual letter with a pause. At the end of 2021, we looked forward to a new year – a potentially calmer year – having come through
almost two full years of the coronavirus pandemic. As people, we were aware our lives had changed, but we hoped for a better 2022; as investors, we were aware that the economy was strong and employment was robust, yet
challenges loomed, including inflation, supply chain disruptions, and tightening monetary policy; as employees, students, and family members, we recognized much was different, but we sought a return to what’s familiar. What we
didn’t know was that a world leader who controls one of the largest militaries on the planet was about to start one of the worst atrocities in Europe since World War II. Our thoughts are with the Ukrainian people, and our hope
is for this unjustified, senseless human tragedy to end quickly.
The equity market started 2022 on a high note, with the S&P 500® Index hitting an all-time high on the first trading day of the year. This turned out to be the last hurrah for a market that saw a continuous march higher
in 2021, having hit 70 new all-time highs, with a new all-time high being recorded on average every three and a half days. Concerns in the market then coalesced and overpowered bullish sentiment, and the market has spiraled
lower throughout 2022. Factors that drove the market lower include: tightening monetary policy as the Federal Reserve has begun raising rates and has announced plans for shrinking its $8.5 trillion asset portfolio; inflation,
higher energy costs, and their effects on the domestic and global economies; continued supply chain disruptions; investors’ indiscriminate liquidation of broad-based ETFs and index funds and the detrimental effect on equities;
and the near-term and long-term global implications of the Russian invasion of Ukraine.
While markets are adjusting, many positive conditions remain intact. Corporate balance sheets and profits remain strong, GDP growth remains
positive, the consumer continues to show resilience in the face of rising prices, cash is abundant both at the corporate and household levels, unemployment is exceptionally low, and our financial system remains healthy.
Markets are also experiencing a change in leadership, as value stocks have been outperforming growth stocks, and traditionally defensive sectors such as Utilities and Consumer Staples have been outperforming the broader
market. Finally, the Energy sector has soared in 2022, as companies reap the benefits of dramatically higher oil and natural gas prices, and shareholders are rewarded with significantly higher dividends, aggressive buybacks,
and higher stock prices after many years of underperformance for the sector.
With history as our guide, we are hopeful that eventually the market may bottom and head higher again. Since the financial crisis of 2008,
we have experienced many corrections and many recoveries to new highs. The Dow Jones Industrial Average has dropped over 10% eight times, including the current drop, for a median decline of 14.00%, and on average, it took 45
trading days to drop from peak to trough and 127 trading days to return to the previous peak. Since the current drop has taken longer to go from peak to its recent trough, it may take some time for a recovery in prices to
truly take hold.
On a positive note, valuations have come in, and many stocks have become more attractive, especially for longer-term investors. We note,
however, that the concept of “historically cheap stocks” does not, on its own, move the market higher. Rather, it is
|
WWW.HENNESSYFUNDS.COM
|
2
|
LETTER TO SHAREHOLDERS
|
overall capitulation and improving fundamentals that could bring buyers back into the market and reverse any bearish trends. Investors need to see improving company earnings, retreating inflationary
trends, a measured pace of interest rate increases globally that does not cause significant economic contraction, hope for a more peaceful and orderly world economic system unconstrained by supply bottlenecks and other
hindrances to global trade, and, most importantly, a subsidence of the deleterious effects of the coronavirus pandemic. While that may seem like a “tall order,” we believe that patient investing, focusing on value, quality,
and downside risk mitigation, works well over the longer term.
During this tumultuous period, performance of the majority of the Hennessy Funds has been relatively strong when compared to the overall market as
well as to our benchmarks. During the six months ended April 30, 2022, the Dow Jones Industrial Average, the S&P 500® Index, and the
NASDAQ Composite Index dropped 7.05%, 9.65%, and 20.15%, respectively, on a total return basis. During this period when these three major indices saw significant declines, we were pleased that seven of our 16 Funds posted
positive total returns, 10 of our 14 domestic Funds outperformed the S&P 500® Index, and over half of our active funds outperformed their
primary benchmarks.
We thank you, our shareholders, for your continued interest in our family of Funds. We are grateful for the trust you put in us, and we will
continue to strive to manage our portfolios for long-term performance, ever mindful of downside risk. While volatility and uncertainty may impact the markets in the short-term, we encourage investors to stay the course,
maintain a diversified portfolio, and keep a long-term perspective. If you have any questions or would like to speak with us, please don’t hesitate to call us directly at (800) 966-4354. In closing, we would also like to thank
all of the healthcare and frontline workers that have worked – and still work – tirelessly throughout the coronavirus pandemic.
Best regards,
|
|
|
|
|
Ryan C. Kelley, CFA
|
|
|
Chief Investment Officer,
|
|
|
Senior Vice President, and Portfolio Manager
|
Past performance does not guarantee future results.
Mutual fund investing involves risk. Principal loss is possible.
Opinions expressed are those of Ryan C. Kelley and are subject to change, are not guaranteed, and should not be considered investment advice.
The Dow Jones Industrial Average and S&P 500® Index are commonly used to measure the performance of U.S. stocks.
The NASDAQ Composite Index comprises all common stocks listed on The NASDAQ Stock Market and is commonly used to measure the performance of technology-related stocks. The indices are used herein for comparative purposes in
accordance with SEC regulations. One cannot invest directly in an index. All returns are shown on a total return basis.
Please refer to the Performance Overview section for more detailed performance information.
|
HENNESSY FUNDS
|
1-800-966-4354
|
3
Performance Overview (Unaudited)
AVERAGE ANNUAL TOTAL RETURN FOR PERIODS ENDED APRIL 30, 2022
|
Six
|
One
|
Five
|
Ten
|
|
|
Months(1)
|
Year
|
Years
|
Years
|
|
|
Hennessy Gas Utility Fund –
|
||||
|
Investor Class (GASFX)
|
16.61%
|
17.57%
|
7.21%
|
9.12%
|
|
Hennessy Gas Utility Fund –
|
||||
|
Institutional Class (HGASX)(2)
|
16.78%
|
17.89%
|
7.56%
|
9.30%
|
|
AGA Stock Index
|
17.25%
|
18.57%
|
8.48%
|
10.25%
|
|
S&P 500® Index
|
-9.65%
|
0.21%
|
13.66%
|
13.67%
|
Expense ratios: 1.00% (Investor Class); 0.69% (Institutional Class)
|
(1)
|
Periods of less than one year are not annualized.
|
|
(2)
|
The inception date of Institutional Class shares is March 1, 2017. Performance shown prior to the inception of Institutional Class shares reflects the performance of Investor Class shares and
includes expenses that are not applicable to, and are higher than, those of Institutional Class shares.
|
_______________
Performance data quoted represents past performance; past performance does not guarantee future results. The investment return and principal value of an investment will fluctuate
so that an investor’s shares, when redeemed, may be worth more or less than their original cost. The performance table does not reflect the deduction of taxes that a shareholder would pay on Fund distributions or the
redemption of Fund shares. Current performance of the Fund may be lower or higher than the performance quoted. Performance data current to the most recent month end may be obtained by visiting www.hennessyfunds.com.
Performance for periods including or prior to October 26, 2012, is that of the FBR Gas Utility Index Fund.
The AGA Stock Index is a capitalization-weighted index that consists of members of the American Gas Association whose securities are traded on a U.S. Stock Exchange. The S&P 500® Index is a capitalization-weighted index that is designed to represent the broad domestic economy through changes in the aggregate market value of
500 stocks across all major industries. One cannot invest directly in an index. These indices are used for comparative purposes in accordance with Securities and Exchange Commission regulations.
Standard & Poor’s Financial Services is the source and owner of the S&P® and S&P 500® trademarks.
The expense ratios presented are from the most recent prospectus. The expense ratios for the current reporting period are available in the Financial Highlights section of this report.
|
WWW.HENNESSYFUNDS.COM
|
4
|
PERFORMANCE OVERVIEW/SCHEDULE OF INVESTMENTS
|
Financial Statements
|
Schedule of Investments as of April 30, 2022 (Unaudited)
|
HENNESSY GAS UTILITY FUND
(% of Net Assets)
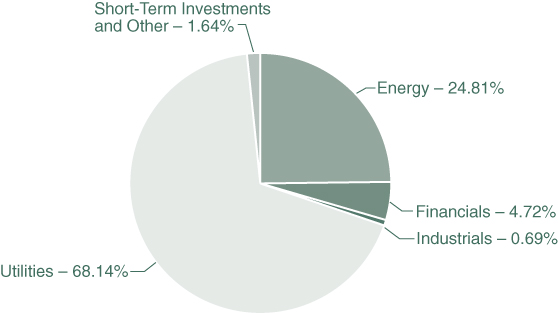
|
TOP TEN HOLDINGS (EXCLUDING MONEY MARKET FUNDS)
|
% NET ASSETS
|
|
EQT Corp.
|
5.21%
|
|
The Southern Co.
|
4.97%
|
|
Sempra Energy
|
4.91%
|
|
Cheniere Energy, Inc.
|
4.90%
|
|
Kinder Morgan, Inc.
|
4.83%
|
|
Enbridge, Inc.
|
4.82%
|
|
Atmos Energy Corp.
|
4.78%
|
|
Dominion Resources, Inc.
|
4.78%
|
|
Berkshire Hathaway, Inc., Class A
|
4.72%
|
|
ONEOK, Inc.
|
4.34%
|
Note: For presentation purposes, the Fund has grouped some of the industry categories. For purposes of categorizing securities for compliance with Section 8(b)(1) of the Investment Company Act of
1940, as amended, the Fund uses more specific industry classifications.
The Global Industry Classification Standard (GICS®) was developed by and is the exclusive property and a service mark
of MSCI, Inc. and Standard & Poor’s Financial Services LLC. It has been licensed for use by the Hennessy Funds.
|
HENNESSY FUNDS
|
1-800-966-4354
|
5
|
COMMON STOCKS – 98.36%
|
Number
|
% of
|
||||||||||
|
|
of Shares
|
Value
|
Net Assets
|
|||||||||
|
Energy – 24.81%
|
||||||||||||
|
Cheniere Energy, Inc.
|
214,617
|
$
|
29,147,135
|
4.90
|
%
|
|||||||
|
Enbridge, Inc. (b)
|
656,765
|
28,661,225
|
4.82
|
%
|
||||||||
|
EQT Corp.
|
780,600
|
31,028,850
|
5.21
|
%
|
||||||||
|
Kinder Morgan, Inc.
|
1,585,101
|
28,769,583
|
4.83
|
%
|
||||||||
|
ONEOK, Inc.
|
407,300
|
25,794,309
|
4.34
|
%
|
||||||||
|
Tellurian, Inc. (a)
|
846,690
|
4,216,516
|
0.71
|
%
|
||||||||
|
|
147,617,618
|
24.81
|
%
|
|||||||||
|
Financials – 4.72%
|
||||||||||||
|
Berkshire Hathaway, Inc., Class A (a)
|
58
|
28,091,720
|
4.72
|
%
|
||||||||
|
Industrials – 0.69%
|
||||||||||||
|
MDU Resources Group, Inc.
|
159,407
|
4,106,324
|
0.69
|
%
|
||||||||
|
Utilities – 68.14%
|
||||||||||||
|
Algonquin Power & Utilities Corp. (b)
|
156,864
|
2,266,685
|
0.38
|
%
|
||||||||
|
ALLETE, Inc.
|
425
|
25,220
|
0.00
|
%
|
||||||||
|
Alliant Energy Corp.
|
41,800
|
2,458,258
|
0.41
|
%
|
||||||||
|
Ameren Corp.
|
52,040
|
4,834,516
|
0.81
|
%
|
||||||||
|
Atmos Energy Corp.
|
250,986
|
28,461,812
|
4.78
|
%
|
||||||||
|
Avangrid, Inc.
|
110,100
|
4,882,935
|
0.82
|
%
|
||||||||
|
Avista Corp.
|
30,972
|
1,256,534
|
0.21
|
%
|
||||||||
|
Black Hills Corp.
|
71,847
|
5,262,074
|
0.88
|
%
|
||||||||
|
Centerpoint Energy, Inc.
|
590,728
|
18,082,184
|
3.04
|
%
|
||||||||
|
Chesapeake Utilities Corp.
|
25,758
|
3,224,129
|
0.54
|
%
|
||||||||
|
CMS Energy Corp.
|
193,398
|
13,284,509
|
2.23
|
%
|
||||||||
|
Consolidated Edison, Inc.
|
163,436
|
15,157,055
|
2.55
|
%
|
||||||||
|
Corning Natural Gas Holding Corp.
|
4,699
|
113,716
|
0.02
|
%
|
||||||||
|
Dominion Resources, Inc.
|
348,477
|
28,449,662
|
4.78
|
%
|
||||||||
|
DTE Energy Co.
|
65,204
|
8,544,332
|
1.44
|
%
|
||||||||
|
Duke Energy Corp.
|
137,587
|
15,156,584
|
2.55
|
%
|
||||||||
|
Entergy Corp.
|
4,260
|
506,301
|
0.09
|
%
|
||||||||
|
Essential Utilities, Inc.
|
205,400
|
9,193,704
|
1.55
|
%
|
||||||||
|
Eversource Energy
|
68,875
|
6,019,675
|
1.01
|
%
|
||||||||
|
Exelon Corp.
|
187,531
|
8,772,700
|
1.47
|
%
|
||||||||
|
Fortis, Inc. (b)
|
159,776
|
7,773,102
|
1.31
|
%
|
||||||||
The accompanying notes are an integral part of these financial statements.
|
WWW.HENNESSYFUNDS.COM
|
6
|
SCHEDULE OF INVESTMENTS
|
|
COMMON STOCKS
|
Number
|
% of
|
||||||||||
|
|
of Shares
|
Value
|
Net Assets
|
|||||||||
|
Utilities (Continued)
|
||||||||||||
|
MGE Energy, Inc.
|
13,129
|
$
|
1,022,355
|
0.17
|
%
|
|||||||
|
National Fuel Gas Co.
|
112,224
|
7,870,269
|
1.32
|
%
|
||||||||
|
National Grid PLC – ADR (b)
|
294,544
|
21,843,383
|
3.67
|
%
|
||||||||
|
New Jersey Resources Corp.
|
152,834
|
6,596,315
|
1.11
|
%
|
||||||||
|
NiSource, Inc.
|
519,081
|
15,115,639
|
2.54
|
%
|
||||||||
|
Northwest Natural Holding Co.
|
67,203
|
3,214,320
|
0.54
|
%
|
||||||||
|
NorthWestern Corp.
|
30,898
|
1,751,608
|
0.29
|
%
|
||||||||
|
ONE Gas, Inc.
|
112,575
|
9,497,953
|
1.60
|
%
|
||||||||
|
PG&E Corp. (a)
|
1,332,649
|
16,858,010
|
2.83
|
%
|
||||||||
|
PPL Corp.
|
69,919
|
1,979,407
|
0.33
|
%
|
||||||||
|
Public Service Enterprise Group, Inc.
|
197,190
|
13,736,255
|
2.31
|
%
|
||||||||
|
RGC Resources, Inc.
|
20,254
|
421,283
|
0.07
|
%
|
||||||||
|
Sempra Energy
|
180,940
|
29,196,478
|
4.91
|
%
|
||||||||
|
South Jersey Industries, Inc.
|
218,071
|
7,455,847
|
1.25
|
%
|
||||||||
|
Southwest Gas Holdings, Inc.
|
115,117
|
10,142,959
|
1.70
|
%
|
||||||||
|
Spire, Inc.
|
78,091
|
5,681,120
|
0.96
|
%
|
||||||||
|
The Southern Co.
|
402,700
|
29,554,153
|
4.97
|
%
|
||||||||
|
UGI Corp.
|
117,652
|
4,035,464
|
0.68
|
%
|
||||||||
|
Unitil Corp.
|
19,998
|
1,019,898
|
0.17
|
%
|
||||||||
|
WEC Energy Group, Inc.
|
247,240
|
24,736,362
|
4.16
|
%
|
||||||||
|
Xcel Energy, Inc.
|
137,499
|
10,073,177
|
1.69
|
%
|
||||||||
|
|
405,527,942
|
68.14
|
%
|
|||||||||
|
|
||||||||||||
|
Total Common Stocks
|
||||||||||||
|
(Cost $284,700,570)
|
585,343,604
|
98.36
|
%
|
|||||||||
The accompanying notes are an integral part of these financial statements.
|
HENNESSY FUNDS
|
1-800-966-4354
|
7
|
SHORT-TERM INVESTMENTS – 1.51%
|
Number
|
% of
|
||||||||||
|
|
of Shares
|
Value
|
Net Assets
|
|||||||||
|
Money Market Funds – 1.51%
|
||||||||||||
|
First American Government Obligations Fund,
|
||||||||||||
|
Institutional Class, 0.22% (c)
|
8,958,358
|
$
|
8,958,358
|
1.51
|
%
|
|||||||
|
|
||||||||||||
|
Total Short-Term Investments
|
||||||||||||
|
(Cost $8,958,358)
|
8,958,358
|
1.51
|
%
|
|||||||||
|
|
||||||||||||
|
Total Investments
|
||||||||||||
|
(Cost $293,658,928) – 99.87%
|
594,301,962
|
99.87
|
%
|
|||||||||
|
Other Assets in Excess of Liabilities – 0.13%
|
757,853
|
0.13
|
%
|
|||||||||
|
|
||||||||||||
|
TOTAL NET ASSETS – 100.00%
|
$
|
595,059,815
|
100.00
|
%
|
||||||||
Percentages are stated as a percent of net assets.
ADR – American Depository Receipt
PLC – Public Limited Company
|
(a)
|
Non-income-producing security.
|
|
(b)
|
U.S.-traded security of a foreign corporation.
|
|
(c)
|
The rate listed is the fund’s seven-day yield as of April 30, 2022.
|
Summary of Fair Value Exposure as of April 30, 2022
The following is a summary of the inputs used to value the Fund’s net assets as of April 30, 2022 (see Note 3 in the accompanying Notes to the Financial Statements):
|
Common Stocks
|
Level 1
|
Level 2
|
Level 3
|
Total
|
||||||||||||
|
Energy
|
$
|
147,617,618
|
$
|
—
|
$
|
—
|
$
|
147,617,618
|
||||||||
|
Financials
|
28,091,720
|
—
|
—
|
28,091,720
|
||||||||||||
|
Industrials
|
4,106,324
|
—
|
—
|
4,106,324
|
||||||||||||
|
Utilities
|
405,527,942
|
—
|
—
|
405,527,942
|
||||||||||||
|
Total Common Stocks
|
$
|
585,343,604
|
$
|
—
|
$
|
—
|
$
|
585,343,604
|
||||||||
|
Short-Term Investments
|
||||||||||||||||
|
Money Market Funds
|
$
|
8,958,358
|
$
|
—
|
$
|
—
|
$
|
8,958,358
|
||||||||
|
Total Short-Term Investments
|
$
|
8,958,358
|
$
|
—
|
$
|
—
|
$
|
8,958,358
|
||||||||
|
Total Investments
|
$
|
594,301,962
|
$
|
—
|
$
|
—
|
$
|
594,301,962
|
||||||||
The accompanying notes are an integral part of these financial statements.
|
WWW.HENNESSYFUNDS.COM
|
8
|
SCHEDULE OF INVESTMENTS/STATEMENT OF ASSETS AND LIABILITIES
|
Financial Statements
|
Statement of Assets and Liabilities as of April 30, 2022 (Unaudited)
|
|
ASSETS:
|
||||
|
Investments in securities, at value (cost $293,658,928)
|
$
|
594,301,962
|
||
|
Dividends and interest receivable
|
568,916
|
|||
|
Receivable for fund shares sold
|
487,754
|
|||
|
Return of capital receivable
|
429,387
|
|||
|
Prepaid expenses and other assets
|
34,954
|
|||
|
Total assets
|
595,822,973
|
|||
|
LIABILITIES:
|
||||
|
Payable for fund shares redeemed
|
215,547
|
|||
|
Payable to advisor
|
203,062
|
|||
|
Payable to administrator
|
105,635
|
|||
|
Payable to auditor
|
11,228
|
|||
|
Accrued distribution fees
|
94,784
|
|||
|
Accrued service fees
|
43,189
|
|||
|
Accrued trustees fees
|
3,052
|
|||
|
Accrued expenses and other payables
|
86,661
|
|||
|
Total liabilities
|
763,158
|
|||
|
NET ASSETS
|
$
|
595,059,815
|
||
|
NET ASSETS CONSISTS OF:
|
||||
|
Capital stock
|
$
|
302,125,417
|
||
|
Total distributable earnings
|
292,934,398
|
|||
|
Total net assets
|
$
|
595,059,815
|
||
|
NET ASSETS:
|
||||
|
Investor Class
|
||||
|
Shares authorized (no par value)
|
Unlimited
|
|||
|
Net assets applicable to outstanding shares
|
$
|
504,732,758
|
||
|
Shares issued and outstanding
|
18,216,532
|
|||
|
Net asset value, offering price, and redemption price per share
|
$
|
27.71
|
||
|
Institutional Class
|
||||
|
Shares authorized (no par value)
|
Unlimited
|
|||
|
Net assets applicable to outstanding shares
|
$
|
90,327,057
|
||
|
Shares issued and outstanding
|
3,268,637
|
|||
|
Net asset value, offering price, and redemption price per share
|
$
|
27.63
|
||
The accompanying notes are an integral part of these financial statements.
|
HENNESSY FUNDS
|
1-800-966-4354
|
9
Financial Statements
|
Statement of Operations for the six months ended April 30, 2022 (Unaudited)
|
|
INVESTMENT INCOME:
|
||||
|
Dividend income(1)
|
$
|
7,864,995
|
||
|
Interest income
|
2,226
|
|||
|
Total investment income
|
7,867,221
|
|||
|
EXPENSES:
|
||||
|
Investment advisory fees (See Note 5)
|
1,079,601
|
|||
|
Sub-transfer agent expenses – Investor Class (See Note 5)
|
372,368
|
|||
|
Sub-transfer agent expenses – Institutional Class (See Note 5)
|
31,443
|
|||
|
Distribution fees – Investor Class (See Note 5)
|
353,211
|
|||
|
Administration, accounting, custody, and transfer agent fees (See Note 5)
|
298,539
|
|||
|
Service fees – Investor Class (See Note 5)
|
235,474
|
|||
|
Federal and state registration fees
|
20,247
|
|||
|
Reports to shareholders
|
19,171
|
|||
|
Compliance expense (See Note 5)
|
15,156
|
|||
|
Trustees’ fees and expenses
|
13,185
|
|||
|
Audit fees
|
11,222
|
|||
|
Legal fees
|
3,678
|
|||
|
Interest expense (See Note 7)
|
2,214
|
|||
|
Other expenses
|
135,766
|
|||
|
Total expenses
|
2,591,275
|
|||
|
NET INVESTMENT INCOME
|
$
|
5,275,946
|
||
|
REALIZED AND UNREALIZED GAINS (LOSSES):
|
||||
|
Net realized gain on investments
|
$
|
27,026,120
|
||
|
Net change in unrealized appreciation/depreciation on investments
|
50,367,953
|
|||
|
Net gain on investments
|
77,394,073
|
|||
|
NET INCREASE IN NET ASSETS RESULTING FROM OPERATIONS
|
$
|
82,670,019
|
||
|
(1)
|
Net of foreign taxes withheld and issuance fees of $156,813.
|
The accompanying notes are an integral part of these financial statements.
|
WWW.HENNESSYFUNDS.COM
|
10
|
STATEMENT OF OPERATIONS/STATEMENTS OF CHANGES IN NET ASSETS
|
Financial Statements
|
Statements of Changes in Net Assets
|
|
Six Months Ended
|
||||||||
|
April 30, 2022
|
Year Ended
|
|||||||
|
(Unaudited)
|
October 31, 2021
|
|||||||
|
OPERATIONS:
|
||||||||
|
Net investment income
|
$
|
5,275,946
|
$
|
11,225,332
|
||||
|
Net realized gain on investments
|
27,026,120
|
69,474,485
|
||||||
|
Net change in unrealized
|
||||||||
|
appreciation/depreciation on investments
|
50,367,953
|
17,334,029
|
||||||
|
Net increase in net assets resulting from operations
|
82,670,019
|
98,033,846
|
||||||
|
DISTRIBUTIONS TO SHAREHOLDERS:
|
||||||||
|
Distributable earnings – Investor Class
|
(41,660,325
|
)
|
(48,578,658
|
)
|
||||
|
Distributable earnings – Institutional Class
|
(5,897,554
|
)
|
(6,556,181
|
)
|
||||
|
Total distributions
|
(47,557,879
|
)
|
(55,134,839
|
)
|
||||
|
CAPITAL SHARE TRANSACTIONS:
|
||||||||
|
Proceeds from shares subscribed – Investor Class
|
17,025,816
|
10,282,767
|
||||||
|
Proceeds from shares subscribed – Institutional Class
|
31,976,016
|
16,158,873
|
||||||
|
Dividends reinvested – Investor Class
|
39,351,915
|
46,063,257
|
||||||
|
Dividends reinvested – Institutional Class
|
5,560,226
|
5,933,451
|
||||||
|
Cost of shares redeemed – Investor Class
|
(39,524,706
|
)
|
(121,059,136
|
)
|
||||
|
Cost of shares redeemed – Institutional Class
|
(14,816,714
|
)
|
(29,927,336
|
)
|
||||
|
Net increase (decrease) in net assets derived
|
||||||||
|
from capital share transactions
|
39,572,553
|
(72,548,124
|
)
|
|||||
|
TOTAL INCREASE (DECREASE) IN NET ASSETS
|
74,684,693
|
(29,649,117
|
)
|
|||||
|
NET ASSETS:
|
||||||||
|
Beginning of period
|
520,375,122
|
550,024,239
|
||||||
|
End of period
|
$
|
595,059,815
|
$
|
520,375,122
|
||||
|
CHANGES IN SHARES OUTSTANDING:
|
||||||||
|
Shares sold – Investor Class
|
613,798
|
412,697
|
||||||
|
Shares sold – Institutional Class
|
1,186,943
|
624,642
|
||||||
|
Shares issued to holders as reinvestment
|
||||||||
|
of dividends – Investor Class
|
1,592,198
|
1,920,697
|
||||||
|
Shares issued to holders as reinvestment
|
||||||||
|
of dividends – Institutional Class
|
224,694
|
247,846
|
||||||
|
Shares redeemed – Investor Class
|
(1,520,299
|
)
|
(4,884,070
|
)
|
||||
|
Shares redeemed – Institutional Class
|
(567,377
|
)
|
(1,215,733
|
)
|
||||
|
Net increase (decrease) in shares outstanding
|
1,529,957
|
(2,893,921
|
)
|
|||||
The accompanying notes are an integral part of these financial statements.
|
HENNESSY FUNDS
|
1-800-966-4354
|
11
Financial Statements
|
Financial Highlights
|
For an Investor Class share outstanding throughout each period
|
Six Months Ended
|
||||
|
April 30, 2022
|
||||
|
(Unaudited)
|
||||
|
PER SHARE DATA:
|
||||
|
Net asset value, beginning of period
|
$
|
26.09
|
||
|
Income from investment operations:
|
||||
|
Net investment income
|
0.25
|
(1)
|
||
|
Net realized and unrealized gains (losses) on investments
|
3.76
|
|||
|
Total from investment operations
|
4.01
|
|||
|
Less distributions:
|
||||
|
Dividends from net investment income
|
(0.24
|
)
|
||
|
Dividends from net realized gains
|
(2.15
|
)
|
||
|
Total distributions
|
(2.39
|
)
|
||
|
Net asset value, end of period
|
$
|
27.71
|
||
|
TOTAL RETURN
|
16.61
|
%(2)
|
||
|
SUPPLEMENTAL DATA AND RATIOS:
|
||||
|
Net assets, end of period (millions)
|
$
|
504.73
|
||
|
Ratio of expenses to average net assets
|
1.00
|
%(3)
|
||
|
Ratio of net investment income to average net assets
|
1.93
|
%(3)
|
||
|
Portfolio turnover rate(4)
|
16
|
%(2)
|
||
|
(1)
|
Calculated using the average shares outstanding method.
|
|
(2)
|
Not annualized.
|
|
(3)
|
Annualized.
|
|
(4)
|
Calculated on the basis of the Fund as a whole.
|
The accompanying notes are an integral part of these financial statements.
|
WWW.HENNESSYFUNDS.COM
|
12
|
FINANCIAL HIGHLIGHTS — INVESTOR CLASS
|
|
Year Ended October 31,
|
||||||||||||||||||
|
2021
|
2020
|
2019
|
2018
|
2017
|
||||||||||||||
|
$
|
24.08
|
$
|
29.64
|
$
|
28.68
|
$
|
30.35
|
$
|
28.57
|
|||||||||
|
0.52
|
(1)
|
0.58
|
(1)
|
0.56
|
(1)
|
0.65
|
0.70
|
|||||||||||
|
4.00
|
(4.14
|
)
|
3.50
|
(1.52
|
)
|
2.20
|
||||||||||||
|
4.52
|
(3.56
|
)
|
4.06
|
(0.87
|
)
|
2.90
|
||||||||||||
|
(0.57
|
)
|
(0.56
|
)
|
(0.62
|
)
|
(0.64
|
)
|
(0.72
|
)
|
|||||||||
|
(1.94
|
)
|
(1.44
|
)
|
(2.48
|
)
|
(0.16
|
)
|
(0.40
|
)
|
|||||||||
|
(2.51
|
)
|
(2.00
|
)
|
(3.10
|
)
|
(0.80
|
)
|
(1.12
|
)
|
|||||||||
|
$
|
26.09
|
$
|
24.08
|
$
|
29.64
|
$
|
28.68
|
$
|
30.35
|
|||||||||
|
19.91
|
%
|
-12.49
|
%
|
15.28
|
%
|
-2.86
|
%
|
10.39
|
%
|
|||||||||
|
$
|
457.31
|
$
|
483.56
|
$
|
764.10
|
$
|
825.18
|
$
|
1,306.70
|
|||||||||
|
1.00
|
%
|
1.02
|
%
|
1.00
|
%
|
1.01
|
%
|
1.01
|
%
|
|||||||||
|
2.06
|
%
|
2.24
|
%
|
1.98
|
%
|
2.18
|
%
|
2.34
|
%
|
|||||||||
|
15
|
%
|
16
|
%
|
12
|
%
|
14
|
%
|
18
|
%
|
|||||||||
The accompanying notes are an integral part of these financial statements.
|
HENNESSY FUNDS
|
1-800-966-4354
|
13
Financial Statements
|
Financial Highlights
|
For an Institutional Class share outstanding throughout each period
|
Six Months Ended
|
||||
|
April 30, 2022
|
||||
|
(Unaudited)
|
||||
|
PER SHARE DATA:
|
||||
|
Net asset value, beginning of period
|
$
|
26.01
|
||
|
Income from investment operations:
|
||||
|
Net investment income
|
0.28
|
(2)
|
||
|
Net realized and unrealized gains (losses) on investments
|
3.77
|
|||
|
Total from investment operations
|
4.05
|
|||
|
Less distributions:
|
||||
|
Dividends from net investment income
|
(0.28
|
)
|
||
|
Dividends from net realized gains
|
(2.15
|
)
|
||
|
Total distributions
|
(2.43
|
)
|
||
|
Net asset value, end of period
|
$
|
27.63
|
||
|
TOTAL RETURN
|
16.78
|
%(4)
|
||
|
SUPPLEMENTAL DATA AND RATIOS:
|
||||
|
Net assets, end of period (millions)
|
$
|
90.33
|
||
|
Ratio of expenses to average net assets
|
0.68
|
%(5)
|
||
|
Ratio of net investment income to average net assets
|
2.13
|
%(5)
|
||
|
Portfolio turnover rate(6)
|
16
|
%(4)
|
||
|
(1)
|
Institutional Class shares commenced operations on March 1, 2017.
|
|
(2)
|
Calculated using the average shares outstanding method.
|
|
(3)
|
Actual return from inception date of March 1, 2017, to the year end of October 31, 2017.
|
|
(4)
|
Not annualized.
|
|
(5)
|
Annualized.
|
|
(6)
|
Calculated on the basis of the Fund as a whole.
|
The accompanying notes are an integral part of these financial statements.
|
WWW.HENNESSYFUNDS.COM
|
14
|
FINANCIAL HIGHLIGHTS — INSTITUTIONAL CLASS
|
|
Period Ended
|
||||||||||||||||||
|
Year Ended October 31,
|
October 31,
|
|||||||||||||||||
|
2021
|
2020
|
2019
|
2018
|
2017(1)
|
||||||||||||||
|
$
|
24.01
|
$
|
29.56
|
$
|
28.65
|
$
|
30.32
|
$
|
29.68
|
|||||||||
|
0.59
|
(2)
|
0.66
|
(2)
|
0.64
|
(2)
|
0.71
|
0.62
|
|||||||||||
|
3.99
|
(4.13
|
)
|
3.50
|
(1.47
|
)
|
0.72
|
||||||||||||
|
4.58
|
(3.47
|
)
|
4.14
|
(0.76
|
)
|
1.34
|
||||||||||||
|
(0.65
|
)
|
(0.64
|
)
|
(0.73
|
)
|
(0.75
|
)
|
(0.70
|
)
|
|||||||||
|
(1.93
|
)
|
(1.44
|
)
|
(2.50
|
)
|
(0.16
|
)
|
—
|
||||||||||
|
(2.58
|
)
|
(2.08
|
)
|
(3.23
|
)
|
(0.91
|
)
|
(0.70
|
)
|
|||||||||
|
$
|
26.01
|
$
|
24.01
|
$
|
29.56
|
$
|
28.65
|
$
|
30.32
|
|||||||||
|
20.29
|
%
|
-12.22
|
%
|
15.63
|
%
|
-2.51
|
%
|
4.56
|
%(3)(4)
|
|||||||||
|
$
|
63.06
|
$
|
66.46
|
$
|
107.18
|
$
|
107.75
|
$
|
84.62
|
|||||||||
|
0.69
|
%
|
0.70
|
%
|
0.69
|
%
|
0.65
|
%
|
0.64
|
%(5)
|
|||||||||
|
2.35
|
%
|
2.57
|
%
|
2.25
|
%
|
2.47
|
%
|
1.23
|
%(5)
|
|||||||||
|
15
|
%
|
16
|
%
|
12
|
%
|
14
|
%
|
18
|
%(4)
|
|||||||||
The accompanying notes are an integral part of these financial statements.
|
HENNESSY FUNDS
|
1-800-966-4354
|
15
Financial Statements
|
Notes to the Financial Statements April 30, 2022 (Unaudited)
|
1). ORGANIZATION
The Hennessy Gas Utility Fund (the “Fund”) is a series of Hennessy Funds Trust (the “Trust”), which was organized as a Delaware statutory trust on September 17, 1992. The Fund is an open-end
management investment company registered under the Investment Company Act of 1940, as amended. The investment objective of the Fund is income and capital appreciation. The Fund is a diversified fund.
The Fund offers Investor Class and Institutional Class shares. Each class of shares differs principally in its respective 12b-1 distribution and service, shareholder servicing, and
sub-transfer agent expenses. There are no sales charges. Each class has identical rights to earnings, assets, and voting privileges, except for class-specific expenses and exclusive rights to vote on matters affecting only one
class.
As an investment company, the Fund follows the investment company accounting and reporting guidance of the Financial Accounting Standards Board (“FASB”) Accounting Standard
Codification Topic 946 “Financial Services—Investment Companies.”
2). SIGNIFICANT ACCOUNTING POLICIES
The following is a summary of significant accounting policies consistently followed by the Fund in the preparation of the financial statements. These policies conform to U.S. generally accepted
accounting principles (“GAAP”).
|
a).
|
Securities Valuation – All investments in securities are valued in accordance with the Fund’s valuation policies and procedures, as described in Note 3.
|
|
b).
|
Federal Income Taxes – The Fund has elected to be taxed as a regulated investment company and intends to distribute substantially all of its taxable income to its shareholders and otherwise
comply with the provisions of the Internal Revenue Code of 1986, as amended, applicable to regulated investment companies. As a result, the Fund has made no provision for federal income taxes or excise taxes. Net
investment income/loss and realized gains/losses for federal income tax purposes may differ from those reported in the financial statements because of temporary book-basis and tax-basis differences. Temporary
differences are primarily the result of the treatment of wash sales for tax reporting purposes. The Fund recognizes interest and penalties related to income tax benefits, if any, in the Statement of Operations as an
income tax expense. Distributions from net realized gains for book purposes may include short-term capital gains, which are included as ordinary income to shareholders for tax purposes. The Fund may utilize
equalization accounting for tax purposes and designate earnings and profits, including net realized gains distributed to shareholders on redemption of shares, as part of the dividends paid deduction for income tax
purposes.
|
|
c).
|
Accounting for Uncertainty in Income Taxes – The Fund has accounting policies regarding recognition and measurement of tax positions taken or expected to be taken on a tax return. The tax
returns of the Fund for the prior three fiscal years are open for examination. The Fund has reviewed all open tax years in major tax jurisdictions and concluded that there is no impact on the Fund’s net assets and no
tax liability resulting from unrecognized tax benefits relating to uncertain income tax positions taken or expected to be taken on a tax return. The Fund’s major tax jurisdictions are U.S. federal and Delaware.
|
|
WWW.HENNESSYFUNDS.COM
|
16
|
NOTES TO THE FINANCIAL STATEMENTS
|
|
d).
|
Income and Expenses – Dividend income is recognized on the ex-dividend date or as soon as information is available to the Fund. Interest income, which includes the amortization of premium and
accretion of discount, is recognized on an accrual basis. Market discounts, original issue discounts, and market premiums on debt securities are accreted or amortized to interest income over the life of a security with
a corresponding increase or decrease, as applicable, in the cost basis of such security using the yield-to-maturity method or, where applicable, the first call date of the security. Other non-cash dividends are
recognized as investment income at the fair value of the property received. The Fund is charged for those expenses that are directly attributable to its portfolio, such as advisory, administration, and certain
shareholder service fees. Income, expenses (other than expenses attributable to a specific class), and realized and unrealized gains/losses on investments are allocated to each class of shares based on such class’s net
assets. Distributions received from the Fund’s investments in master limited partnerships (“MLPs”) generally consist of ordinary income, capital gains, and return of capital. The Fund records investment income on the
ex-date of the distributions. For financial statement purposes, the Fund uses return of capital and income estimates to allocate the dividend income received. Such estimates are based on historical information
available from the MLPs and other industry sources. These estimates may subsequently be revised based on information received from the MLPs after their tax reporting periods are concluded, as the actual character of
these distributions is not known until after the fiscal year end of the Fund.
|
|
e).
|
Distributions to Shareholders – Dividends from net investment income for the Fund, if any, are declared and paid at the end of each calendar quarter. Distributions of net realized capital
gains, if any, are declared and paid annually, usually in December.
|
|
f).
|
Security Transactions – Investment and shareholder transactions are recorded on the trade date. The Fund determines the realized gain/loss from an investment transaction by comparing the
original cost of the security lot sold with the net sale proceeds. Discounts and premiums on securities purchased are accreted or amortized, respectively, over the life of each such security.
|
|
g).
|
Use of Estimates – Preparing financial statements in accordance with GAAP requires management to make estimates and assumptions that affect the reported amounts of assets and liabilities and
disclosure of contingent assets and liabilities at the date of the financial statements, as well as the reported change in net assets during the reporting period. Actual results could differ from those estimates.
|
|
h).
|
Share Valuation – The net asset value (“NAV”) per share of the Fund is calculated by dividing (i) the total value of the securities held by the Fund, plus cash and other assets, minus all
liabilities (including estimated accrued expenses) by (ii) the total number of Fund shares outstanding, rounded to the nearest $0.01. Fund shares are not priced on days the New York Stock Exchange is closed for
trading. The offering and redemption price per share for the Fund is equal to the Fund’s NAV per share.
|
|
i).
|
Partnership Accounting Policy – To the extent the Fund receives distributions from underlying partnerships in which it invests, the Fund records its pro rata share of income/loss and capital
gains/losses and accordingly adjusts the cost basis of the underlying partnerships for return of capital.
|
|
j).
|
Recent Accounting Pronouncements and Regulatory Updates – In October 2020, the Securities and Exchange Commission (“SEC”) adopted new regulations governing the use of derivatives by
registered investment companies (“Rule 18f-4”). Rule 18f-4 imposes limits on the amount of derivatives a fund can enter into, eliminates the asset segregation framework currently used by funds to comply with Section 18
of
|
|
HENNESSY FUNDS
|
1-800-966-4354
|
17
|
the 1940 Act, and requires funds whose use of derivatives is greater than a limited specified amount to establish and maintain a comprehensive derivatives risk management program and appoint
a derivatives risk manager. Funds are required to comply with Rule 18f-4 by August 19, 2022. The impact, if any, that Rule 18f-4 will have on the availability, liquidity, and performance of derivatives is unclear.
Management is currently evaluating the potential impact of Rule 18f-4 on the Fund. When fully implemented, Rule 18f-4 may require changes in how the Fund uses derivatives, adversely affect the Fund’s performance, and
increase costs related to the Fund’s use of derivatives.
|
|
|
In December 2020, the SEC adopted a new rule providing a framework for fund valuation practices (“Rule 2a-5”). Rule 2a-5
establishes requirements for determining fair value in good faith for purposes of the 1940 Act. Rule 2a-5 permits fund boards to designate certain parties to perform fair value determinations, subject to board
oversight and certain other conditions. Rule 2a-5 also defines when market quotations are “readily available” for purposes of the 1940 Act and the threshold for determining whether a fund must fair value a security. In
connection with Rule 2a-5, the SEC also adopted related recordkeeping requirements and is rescinding previously issued guidance, including with respect to the role of a board in determining fair value and the
accounting and auditing of fund investments. Funds must comply with the rules by September 8, 2022. Management is currently assessing the potential impact of the new rules on the Fund’s financial statements.
|
3). SECURITIES VALUATION
The Fund follows its valuation policies and procedures in determining its net asset value and, in preparing these financial statements, the fair value accounting standards that establish an
authoritative definition of fair value and set out a hierarchy for measuring fair value. These standards require additional disclosures about the various inputs and valuation techniques used to develop the measurements of fair
value and a discussion of changes in valuation techniques and related inputs during the period. These inputs are summarized in the three broad levels listed below:
|
Level 1 –
|
Unadjusted, quoted prices in active markets for identical instruments that the Fund has the ability to access at the date of measurement.
|
|
|
Level 2 –
|
Other significant observable inputs (including, but not limited to, quoted prices in active markets for similar instruments, quoted prices in markets that are not active for identical or
similar instruments, and model-derived valuations in which all significant inputs and significant value drivers are observable in active markets, such as interest rates, prepayment speeds, credit risk curves, default
rates, and similar data).
|
|
|
Level 3 –
|
Significant unobservable inputs (including the Fund’s own assumptions about what market participants would use to price the asset or liability based on the best available information) when
observable inputs are unavailable.
|
The following is a description of the valuation techniques applied to the Fund’s major categories of assets and liabilities on a recurring basis:
|
Equity Securities – Equity securities, including common stocks, preferred stocks, foreign-issued common stocks, exchange-traded funds, closed-end
mutual funds, partnerships, rights, MLPs, and real estate investment trusts, that are traded on a securities exchange for which a last-quoted sales price is readily available generally are valued at the last sales
price as reported by the primary exchange on which the securities are listed. Securities listed on The Nasdaq Stock Market (“Nasdaq”)
|
|
WWW.HENNESSYFUNDS.COM
|
18
|
NOTES TO THE FINANCIAL STATEMENTS
|
|
generally are valued at the Nasdaq Official Closing Price, which may differ from the last sales price reported. Securities traded on a securities exchange for which a last-quoted sales price
is not readily available generally are valued at the mean between the bid and ask prices. To the extent these securities are actively traded and valuation adjustments are not applied, they are classified in Level 1 of
the fair value hierarchy. Securities traded on foreign exchanges generally are not valued at the same time the Fund calculates its NAV because most foreign markets close well before such time. The earlier close of most
foreign markets gives rise to the possibility that significant events, including broad market moves, may have occurred in the interim. In certain circumstances, it may be determined that a foreign security needs to be
fair valued because it appears that the value of the security might have been materially affected by events occurring after the close of the market in which the security is principally traded, but before the time the
Fund calculates its NAV, such as by a development that affects an entire market or region (e.g., a weather-related event) or a potentially global development (e.g., a terrorist attack that may be expected to have an
effect on investor expectations worldwide).
|
|
|
Registered Investment Companies – Investments in open-end registered investment companies, commonly referred to as mutual funds, generally are priced
at the ending NAV provided by the applicable mutual fund’s service agent and are classified in Level 1 of the fair value hierarchy.
|
|
|
Debt Securities – Debt securities, including corporate bonds, asset-backed securities, mortgage-backed securities, municipal bonds, U.S. Treasuries,
and U.S. government agency issues, are generally valued at market on the basis of valuations furnished by an independent pricing service that utilizes both dealer-supplied valuations and formula-based techniques. The
pricing service may consider recently executed transactions in securities of the issuer or comparable issuers, market price quotations (where observable), bond spreads, and fundamental data relating to the issuer. In
addition, the model may incorporate observable market data, such as reported sales of similar securities, broker quotes, yields, bids, offers, and reference data. Certain securities are valued primarily using dealer
quotations. These securities are generally classified in Level 2 of the fair value hierarchy.
|
|
|
Short-Term Securities – Short-term equity investments, including money market funds, are valued in the manner specified above for equity securities.
Short-term debt investments with an original term to maturity of 60 days or less are valued at amortized cost, which approximates fair market value. If the original term to maturity of a short-term debt investment
exceeds 60 days, then the values as of the 61st day prior to maturity are amortized. Amortized cost is not used if its use would be inappropriate due to credit or other impairments of the issuer, in which case the
security’s fair value would be determined as described below. Short-term securities are generally classified in Level 1 or Level 2 of the fair value hierarchy depending on the inputs used and market activity levels for
specific securities.
|
The Board of Trustees of the Fund (the “Board”) has adopted fair value pricing procedures that are followed when a price for a security is not readily available or if a significant
event has occurred that indicates the closing price of a security no longer represents the true value of that security. Fair value pricing determinations are made in good faith in accordance with these procedures. There are
numerous criteria considered in determining a fair value of a security, such as the trading volume of a security and markets, the values of other similar securities, and news events with direct bearing on a security or
markets. Fair value pricing results in an estimated price for a security that
|
HENNESSY FUNDS
|
1-800-966-4354
|
19
reflects the amount the Fund might reasonably expect to receive in a current sale. Depending on the relative significance of the valuation inputs, these securities may be classified in either Level 2
or Level 3 of the fair value hierarchy.
The fair value of foreign securities may be determined with the assistance of a pricing service using correlations between the movement of prices of such securities and indices of
domestic securities and other appropriate indicators, such as closing market prices of relevant American Depositary Receipts or futures contracts. Using fair value pricing means that the Fund’s NAV reflects the affected
portfolio securities’ values as determined by the Board or its designee, pursuant to the fair value pricing procedures adopted by the Board, instead of being determined by the market. Using a fair value pricing methodology to
price a foreign security may result in a value that is different from such foreign security’s most recent closing price and from the value used by other investment companies to calculate their NAVs. Such securities are
generally classified in Level 2 of the fair value hierarchy. Because the Fund may invest in foreign securities, the value of the Fund’s portfolio securities may change on days when a shareholder is unable to purchase or redeem
Fund shares.
The Board has delegated day-to-day valuation matters to the Valuation and Liquidity Committee comprising representatives from Hennessy Advisors, Inc., the Fund’s investment advisor
(the “Advisor”). The function of the Valuation and Liquidity Committee, among other things, is to value securities where current and reliable market quotations are not readily available. All actions taken by the Valuation and
Liquidity Committee are reviewed by the Board.
The Fund has performed an analysis of all existing investments to determine the significance and character of all inputs to their fair value determinations. Various inputs are used
to determine the value of the Fund’s investments. The inputs or methodology used for valuing securities are not necessarily an indication of the risk associated with investing in those securities. Details related to the fair
value hierarchy of the Fund’s securities as of April 30, 2022, are included in the Schedule of Investments.
4). INVESTMENT TRANSACTIONS
Purchases and sales of investment securities (excluding government and short-term investments) for the Fund during the six months ended April 30, 2022, were $88,093,500 and $97,570,846, respectively.
There were no purchases or sales/maturities of long-term U.S. government securities for the Fund during the six months ended April 30, 2022.
5). INVESTMENT ADVISORY FEE AND OTHER TRANSACTIONS WITH AFFILIATES
The Advisor provides the Fund with investment advisory services under an Investment Advisory Agreement. The Advisor furnishes all investment advice, office space, and facilities and most of the
personnel needed by the Fund. As compensation for its services, the Advisor is entitled to a monthly fee from the Fund. The fee is based on the average daily net assets of the Fund at an annual rate of 0.40%. The net
investment advisory fees expensed by the Fund during the six months ended April 30, 2022, are included in the Statement of Operations.
The Board has approved a Shareholder Servicing Agreement for Investor Class shares of the Fund, which compensates the Advisor for the non-investment advisory services it provides
to the Fund. The Shareholder Servicing Agreement provides for a monthly fee paid to the Advisor at an annual rate of 0.10% of the average daily net assets of the Fund attributable to Investor Class shares. The shareholder
service fees expensed by the Fund during the six months ended April 30, 2022, are included in the Statement of Operations.
|
WWW.HENNESSYFUNDS.COM
|
20
|
NOTES TO THE FINANCIAL STATEMENTS
|
The Fund has adopted a plan pursuant to Rule 12b-1 under the Investment Company Act of 1940, as amended, that authorizes payments in connection with the distribution of Fund shares
at an annual rate of up to 0.25% of the Fund’s average daily net assets attributable to Investor Class shares. Even though the authorized rate is up to 0.25%, the Fund is currently only using up to 0.15% of its average daily
net assets attributable to Investor Class shares for such purpose. Amounts paid under the plan may be spent on any activities or expenses primarily intended to result in the sale of shares, including, but not limited to,
advertising, shareholder account servicing, printing and mailing of prospectuses to other than current shareholders, printing and mailing of sales literature, and compensation for sales and marketing activities or to financial
institutions and others, such as dealers and distributors. The distribution fees expensed by the Fund during the six months ended April 30, 2022, are included in the Statement of Operations.
The Fund has entered into agreements with various brokers, dealers, and financial intermediaries in connection with the sale of Fund shares. The agreements provide for periodic
payments of sub-transfer agent expenses by the Fund to the brokers, dealers, and financial intermediaries for providing certain shareholder maintenance services. These shareholder services include the pre-processing and
quality control of new accounts, shareholder correspondence, answering customer inquiries regarding account status, and facilitating shareholder telephone transactions. The sub-transfer agent fees expensed by the Fund during
the six months ended April 30, 2022, are included in the Statement of Operations.
The Fund has entered into an Administrative Services Agreement among the Fund, the Advisor, and the American Gas Association (“AGA”), pursuant to which the AGA provides
administrative services to the Fund, including overseeing the calculation of the AGA Stock Index. ScottMadden, Inc. performs the actual computations required to produce the AGA Stock Index and receives a fee for such
calculations pursuant to a contractual arrangement with AGA. AGA does not furnish other securities advice to the Fund or the Advisor or make recommendations regarding the purchase or sale of securities by the Fund. Under the
terms of the Administrative Services Agreement, which has been approved by the Board, AGA provides the Fund with current information regarding the common stock composition of the AGA Stock Index at least monthly. In addition,
on request, AGA provides the Fund and the Advisor with information on the natural gas industry. The Fund pays AGA a fee at an annual rate of 0.04% of the average daily net assets of the Fund.
U.S. Bancorp Fund Services, LLC, d/b/a U.S. Bank Global Fund Services (“Fund Services”) provides the Fund with administrative, accounting, and transfer agent services. As
administrator, Fund Services is responsible for activities such as (i) preparing various federal and state regulatory filings, reports, and returns for the Fund, (ii) preparing reports and materials to be supplied to the
Board, (iii) monitoring the activities of the Fund’s custodian, transfer agent, and accountants, and (iv) coordinating the preparation and payment of the Fund’s expenses and reviewing the Fund’s expense accruals. U.S. Bank
N.A., an affiliate of Fund Services, serves as the Fund’s custodian. The servicing agreements between the Trust, Fund Services, and U.S. Bank N.A. contain a fee schedule that is inclusive of administrative, accounting,
custody, and transfer agent fees. The administrative, accounting, custody, and transfer agent fees expensed by the Fund during the six months ended April 30, 2022, are included in the Statement of Operations.
Quasar Distributors, LLC (“Quasar”), a wholly owned broker-dealer subsidiary of Foreside Financial Group, LLC, acts as the Fund’s principal underwriter in a continuous public
offering of Fund shares.
|
HENNESSY FUNDS
|
1-800-966-4354
|
21
The officers of the Fund are affiliated with the Advisor. With the exception of the Chief Compliance Officer and the Senior Compliance Officer, such officers receive no
compensation from the Fund for serving in their respective roles. The Fund, along with the other funds in the Hennessy Funds family (collectively, the “Hennessy Funds”), makes reimbursement payments on an equal basis to the
Advisor for a portion of the salary and benefits associated with the office of the Chief Compliance Officer and for all of the salary and benefits associated with the office of the Senior Compliance Officer. The compliance
fees expensed by the Fund during the six months ended April 30, 2022, are included in the Statement of Operations.
6). GUARANTEES AND INDEMNIFICATIONS
Under the Hennessy Funds’ organizational documents, their officers and trustees are indemnified by the Hennessy Funds against certain liabilities arising out of the performance of their duties to the
Hennessy Funds. Additionally, in the normal course of business, the Hennessy Funds enter into contracts with service providers that contain general indemnification clauses. The Fund’s maximum exposure under these arrangements
is unknown as this would involve future claims that may be made against the Fund that have not yet occurred. Currently, the Fund expects the risk of loss to be remote.
7). LINE OF CREDIT
The Fund has an uncommitted line of credit with the other Hennessy Funds in the amount of the lesser of (i) $100,000,000 or (ii) 33.33% of each Hennessy Fund’s net assets, or 30% for the Fund and 10%
for the Hennessy Balanced Fund. The line of credit is intended to provide any necessary short-term financing in connection with shareholder redemptions, subject to certain restrictions. The credit facility is with the Hennessy
Funds’ custodian bank, U.S. Bank N.A. Borrowings under this arrangement bear interest at the bank’s prime rate and are secured by all of the Fund’s assets (as to its own borrowings only). During the six months ended April 30,
2022, the Fund had an outstanding average daily balance and a weighted average interest rate of $135,508 and 3.25%, respectively. The interest expensed by the Fund during the six months ended April 30, 2022, is included in the
Statement of Operations. The maximum amount outstanding for the Fund during the period was $1,953,000. As of April 30, 2022, the Fund did not have any borrowings outstanding under the line of credit.
8). FEDERAL TAX INFORMATION
As of October 31, 2021, the Fund’s most recent fiscal year end, the components of accumulated earnings (losses) for income tax purposes were as follows:
|
Investments
|
||||
|
Cost of investments for tax purposes
|
$
|
304,865,782
|
||
|
Gross tax unrealized appreciation
|
$
|
256,658,348
|
||
|
Gross tax unrealized depreciation
|
(41,200,626
|
)
|
||
|
Net tax unrealized appreciation/(depreciation)
|
$
|
215,457,722
|
||
|
Undistributed ordinary income
|
$
|
—
|
||
|
Undistributed long-term capital gains
|
42,364,536
|
|||
|
Total distributable earnings
|
$
|
42,364,536
|
||
|
Other accumulated gain/(loss)
|
$
|
—
|
||
|
Total accumulated gain/(loss)
|
$
|
257,822,258
|
||
The difference between book-basis unrealized appreciation/depreciation and tax-basis unrealized appreciation/depreciation (as shown above) is attributable primarily to wash sales.
|
WWW.HENNESSYFUNDS.COM
|
22
|
NOTES TO THE FINANCIAL STATEMENTS
|
As of October 31, 2021, the Fund had no tax-basis capital losses to offset future capital gains.
As of October 31, 2021, the Fund did not defer, on a tax basis, any late-year ordinary losses. Late-year ordinary losses are net ordinary losses incurred after December 31, 2020,
but within the taxable year, that are deemed to arise on the first day of the Fund’s next taxable year.
During fiscal year 2022 (year to date) and fiscal year 2021, the tax character of distributions paid by the Fund was as follows:
|
Six Months Ended
|
Year Ended
|
||||||||
|
April 30, 2022
|
October 31, 2021
|
||||||||
|
Ordinary income(1)
|
$
|
5,193,201
|
$
|
12,094,090
|
|||||
|
Long-term capital gains
|
42,364,678
|
43,040,749
|
|||||||
|
Total distributions
|
$
|
47,557,879
|
$
|
55,134,839
|
|||||
|
(1) Ordinary income includes short-term capital gains.
|
9). EVENTS SUBSEQUENT TO PERIOD END
Management has evaluated the Fund’s related events and transactions that occurred subsequent to April 30, 2022, through the date of issuance of the Fund’s financial statements. Management has
determined that there were no subsequent events requiring recognition or disclosure in the financial statements.
|
HENNESSY FUNDS
|
1-800-966-4354
|
23
Expense Example (Unaudited)
April 30, 2022
As a shareholder of the Fund, you incur ongoing costs, including management fees, service fees, and other Fund expenses. This Example is intended to help you understand your ongoing costs (in
dollars) of investing in the Fund and to compare these costs with the ongoing costs of investing in other mutual funds. The Example is based on an investment of $1,000 invested at the beginning of the period and held for the
entire period from November 1, 2021, through April 30, 2022.
Actual Expenses
In the table below, the first line under each of the “Investor Class” and “Institutional Class” headings provides information about actual account values and actual expenses for each share class. You
may use this information, together with the amount you invested, to estimate the expenses that you paid over the period. Simply divide your account value by $1,000 (for example, an $8,600 account value divided by $1,000 =
8.6), then multiply the result by the number in the first line under the heading “Expenses Paid During Period” to estimate the expenses you paid on your account during this period. Although the Fund charges no sales loads or
transaction fees, you will be assessed fees for outgoing wire transfers, returned checks, and stop payment orders at prevailing rates charged by U.S. Bank Global Fund Services, the Fund’s transfer agent. If you request that a
redemption be made by wire transfer, the Fund’s transfer agent charges a $15 fee. IRAs are charged a $15 annual maintenance fee (up to $30 maximum per shareholder for shareholders with multiple IRAs). The examples below
include, but are not limited to, management, shareholder servicing, accounting, custody, and transfer agent fees. However, the examples below do not include portfolio trading commissions and related expenses.
Hypothetical Example for Comparison Purposes
In the table below, the second line under each of the “Investor Class” and “Institutional Class” headings provides information about hypothetical account values and hypothetical expenses based on the
Fund’s actual expense ratio for each share class and an assumed rate of return of 5% per year before expenses, which is not the Fund’s actual return for such share class. The hypothetical account values and expenses may not be
used to estimate the actual ending account balance or expenses you paid for the period. You may use this information to compare the ongoing costs of investing in the Fund and other funds. To do so, compare these 5%
hypothetical examples with the 5% hypothetical examples that appear in the shareholder reports of the other funds. Please note that the expenses shown in the table are meant to highlight your ongoing costs only. Therefore, the
second lines under “Investor Class” and “Institutional Class” are useful in comparing ongoing costs only and will not help you determine the relative total costs of owning different funds.
|
WWW.HENNESSYFUNDS.COM
|
24
|
EXPENSE EXAMPLE
|
|
Beginning
|
Ending
|
||
|
Account Value
|
Account Value
|
Expenses Paid
|
|
|
November 1, 2021
|
April 30, 2022
|
During Period(1)
|
|
|
Investor Class
|
|||
|
Actual
|
$1,000.00
|
$1,166.10
|
$5.37
|
|
Hypothetical (5% return before expenses)
|
$1,000.00
|
$1,019.84
|
$5.01
|
|
Institutional Class
|
|||
|
Actual
|
$1,000.00
|
$1,167.80
|
$3.65
|
|
Hypothetical (5% return before expenses)
|
$1,000.00
|
$1,021.42
|
$3.41
|
|
(1)
|
Expenses are equal to the Fund’s annualized expense ratio of 1.00% for Investor Class shares or 0.68% for Institutional Class shares, as applicable, multiplied by the average account value
over the period, multiplied by 181/365 days (to reflect the half-year period).
|
|
HENNESSY FUNDS
|
1-800-966-4354
|
25
How to Obtain a Copy of the Fund’s Proxy
Voting Policy and Proxy Voting Records
A description of the policies and procedures the Fund uses to determine how to vote proxies relating to portfolio securities is available without charge (1) by calling 800-966-4354, (2) on the
Hennessy Funds’ website at www.hennessyfunds.com/proxy-voting/voting-policy, or (3) on the U.S. Securities and Exchange Commission’s (the “SEC”) website at www.sec.gov. The Fund’s proxy voting record is available without
charge on both the Hennessy Funds’ website at www.hennessyfunds.com/proxy-voting/voting-record and the SEC’s website at www.sec.gov no later than August 31 for the prior 12 months ending June 30.
Availability of Quarterly Portfolio Schedule
The Fund files its complete schedule of portfolio holdings with the SEC for the first and third quarters of each fiscal year as an exhibit to its reports on Form N-PORT. The Fund’s Form N-PORT
reports are available on the SEC’s website at www.sec.gov or on request by calling 800-966-4354.
Federal Tax Distribution Information (Unaudited)
For fiscal year 2021, certain dividends paid by the Fund may be subject to a maximum tax rate of 23.8%, as provided for by the Jobs and Growth Tax Relief Reconciliation Act of 2003. The percentage of
dividends declared from ordinary income designated as qualified dividend income was 100.00%.
For corporate shareholders, the percent of ordinary income distributions that qualified for the corporate dividends received deduction for fiscal year 2021 was 100.00%.
The percentage of taxable ordinary income distributions that were designated as short-term capital gain distributions under Section 871(k)(2)(C) of the Internal Revenue Code of
1986, as amended, for the Fund was 0.00%.
Important Notice Regarding Delivery
of Shareholder Documents
To help keep the Fund’s costs as low as possible, we generally deliver a single copy of shareholder reports, proxy statements, and prospectuses to shareholders who share an address and have the same
last name. This process does not apply to account statements. You may request an individual copy of a shareholder document at any time. If you would like to receive separate mailings of shareholder documents, please call U.S.
Bank Global Fund Services at 800-261-6950 or 414-765-4124, and individual delivery will begin within 30 days of your request. If your account is held through a financial institution or other intermediary, please contact such
intermediary directly to request individual delivery.
Electronic Delivery
As permitted by SEC regulations, the Fund’s shareholder reports are made available on a website, and unless you sign up for eDelivery or elect to receive paper copies as detailed below, you will be
notified each time a report is posted and provided with a website link to access the report.
The Fund also offers shareholders the option to receive all notices, account statements, prospectuses, tax forms, and shareholder reports electronically. To sign up for eDelivery
or change your delivery preference, please visit www.hennessyfunds.com/account.
To elect to receive paper copies of all future reports free of charge, please call U.S. Bank Global Fund Services at 800-261-6950 or 414-765-4124.
Subscribe to receive our team’s unique market and sector insights delivered to your inbox
www.hennessyfunds.com/subscribe
Follow us on social media
| |
|
|
WWW.HENNESSYFUNDS.COM
|
26
|
PROXY VOTING — BOARD APPROVAL OF INVESTMENT ADVISORY AGREEMENT
|
Board Approval of Investment Advisory
Agreement
At its meeting on March 11, 2022, the Board of Trustees of the Fund (the “Board,” and the members thereof, the “Trustees”) unanimously approved the continuation of the investment advisory agreement
of the Fund with Hennessy Advisors, Inc. (the “Advisor”). As part of the process, the Trustees reviewed their fiduciary duties and the relevant factors for them to consider with respect to approving the advisory agreement. In
addition, the Trustees who are not deemed “interested persons” (as defined by the Investment Company Act of 1940, as amended) of the Fund (the “Independent Trustees”) met in executive session to discuss the approval of the
advisory agreement. As part of their discussion, the Independent Trustees confirmed their understanding of the need to have asked about, and received answers to, any matters that they believed are relevant to determining
whether to approve the continuation of the advisory agreement.
In advance of the meeting, the Advisor sent detailed information to the Trustees to assist them in their evaluation of the advisory agreement. This information included, but was
not limited to, the following:
|
(1)
|
A memorandum from outside legal counsel that described the fiduciary duties of the Board with respect to approving the continuation of the advisory agreement and the relevant factors for
consideration;
|
|
|
(2)
|
A memorandum from the Advisor that listed the factors relevant to the Board’s approval of the continuation of the advisory agreement and also referenced the documents that had been provided
to help the Board assess each such factor;
|
|
|
(3)
|
The Advisor’s financial statements from its most recent Form 10-K and Form 10-Q;
|
|
|
(4)
|
A summary of the advisory agreement;
|
|
|
(5)
|
A recent Fund fact sheet, which included, among other things, Fund performance over various periods;
|
|
|
(6)
|
A description of the range of services provided by the Advisor;
|
|
|
(7)
|
A peer expense comparison of the net expense ratio and investment advisory fee of the Fund; and
|
|
|
(8)
|
A memorandum from the Advisor regarding economies of scale.
|
The Trustees reviewed and discussed all of the information provided by the Advisor. Following this review, and further discussion with the Advisor, the Trustees concluded that the
information provided before and at the meeting addressed all of the relevant matters that they wanted to consider in assessing the performance of the Funds and the performance of the Advisor under the advisory agreement, and
that said information provided them with a fulsome understanding of the advisory agreement and the services provided by the Advisor.
All of the factors discussed were considered as a whole by the Trustees, as well as by the Independent Trustees meeting in executive session. The Trustees viewed the relevant
factors in their totality, with no single factor being the principal or determinative factor in the Trustees’ determination of whether to approve the continuation of the advisory agreement. The Trustees recognized that the
management and fee arrangements for the Fund are the result of years of review and discussion between the Independent Trustees and the Advisor, that certain aspects of such arrangements may receive greater scrutiny in some
years than in others, and that the Trustees’ conclusions may be based, in part, on
|
HENNESSY FUNDS
|
1-800-966-4354
|
27
their consideration of these same arrangements and information received during the course of the year and in prior years.
Prior to approving the continuation of the advisory agreement, the Trustees, including the Independent Trustees in executive session, considered, among other items:
|
(1)
|
The nature and quality of the advisory services provided by the Advisor;
|
|
|
(2)
|
A comparison of the fees and expenses of the Fund to other similar funds;
|
|
|
(3)
|
Whether economies of scale are recognized by the Fund;
|
|
|
(4)
|
The costs and profitability of the Fund to the Advisor;
|
|
|
(5)
|
The performance of the Fund; and
|
|
|
(6)
|
Any benefits to the Advisor from serving as an investment advisor to the Fund (other than the advisory fee).
|
The material considerations and determinations of the Trustees, including the Independent Trustees, were as follows:
|
(1)
|
The Trustees considered the services identified below that are provided by the Advisor. Based on this review and an assessment of the Advisor’s performance, the Trustees concluded that the
Advisor provides high-quality services to the Fund, and they noted that their overall confidence in the Advisor was high. The Trustees also concluded that they were satisfied with the nature, extent, and quality of the
advisory services provided to the Fund by the Advisor and that the nature and extent of the services provided by the Advisor were appropriate to assure that the Fund’s operations are conducted in compliance with
applicable laws, rules, and regulations.
|
|
(a)
|
The Advisor acts as the portfolio manager for the Fund. In this capacity, the Advisor does the following:
|
|
(i)
|
manages the composition of the Fund’s portfolio, including the purchase, retention, and disposition of portfolio securities in accordance with the Fund’s investment objectives, policies, and
restrictions;
|
|||
|
(ii)
|
seeks best execution for the Fund’s portfolio;
|
|||
|
(iii)
|
manages the use of soft dollars for the Fund; and
|
|||
|
(iv)
|
manages proxy voting for the Fund.
|
|
(b)
|
The Advisor performs a daily reconciliation of portfolio positions and cash for the Fund.
|
||
|
(c)
|
The Advisor monitors the liquidity of each Fund.
|
||
|
(d)
|
The Advisor monitors the Fund’s compliance with its investment objectives and restrictions and federal securities laws.
|
||
|
(e)
|
The Advisor maintains a compliance program (including a code of ethics), conducts ongoing reviews of the compliance programs of the Fund’s service providers (including their codes of ethics,
as appropriate), conducts on-site visits to the Fund’s service providers, as feasible, monitors incidents of abusive trading practices, reviews Fund expense accruals, payments, and fixed expense ratios, evaluates
insurance providers for fidelity bond, D&O/E&O insurance, and cybersecurity insurance coverage, manages regulatory examination compliance and responses, conducts employee compliance training, reviews reports
provided by service providers, and maintains books and records.
|
|
WWW.HENNESSYFUNDS.COM
|
28
|
BOARD APPROVAL OF INVESTMENT ADVISORY AGREEMENT
|
|
(f)
|
The Advisor oversees service providers that provide accounting, administration, distribution, transfer agency, custodial, sales, marketing, public relations, audit, information technology,
and legal services to the Fund.
|
||
|
(g)
|
The Advisor maintains in-house marketing and distribution departments on behalf of the Fund.
|
||
|
(h)
|
The Advisor prepares or directs the preparation of all regulatory filings for the Fund, including writing and annually updating the Fund’s prospectus and related documents.
|
||
|
(i)
|
For each annual report of the Fund, the Advisor prepares a written summary of the Fund’s performance during the most recent 12-month period.
|
||
|
(j)
|
The Advisor oversees distribution of the Fund through third-party broker/dealers and independent financial institutions such as Charles Schwab, Inc., Fidelity, TD Ameritrade, and Pershing.
The Advisor participates in “no transaction fee” (“NTF”) programs with these companies on behalf of the Fund, which allow customers to purchase the Fund through third-party distribution channels without paying a
transaction fee. The Advisor compensates, in part, a number of these third-party providers of NTF programs out of its own revenues.
|
||
|
(k)
|
The Advisor pays the incentive compensation of the Fund’s compliance officers and employs other staff, such as legal, marketing, national accounts, distribution, sales, administrative, and
trading oversight personnel, as well as management executives.
|
||
|
(l)
|
The Advisor provides a quarterly compliance certification to the Board.
|
||
|
(m)
|
The Advisor prepares or reviews all Board materials, presents to and leads discussions with the Board, prepares or reviews all meeting minutes, and arranges for Board training and education.
|
|
(2)
|
The Trustees compared the performance of the Fund to benchmark indices over various periods and noted that the Trustees review and discuss reports comparing the investment performance of the
Fund to various indices at each quarterly Board meeting. Based on such information, the Trustees determined that the Advisor manages the Fund in a manner materially consistent with its stated investment objective and
style. The Trustees concluded that the performance of the Fund over various periods warranted the continuation of the advisory agreement.
|
|
|
(3)
|
The Trustees reviewed the advisory fees and overall expense ratios of the Fund compared to other funds similar in asset size and investment objective to the Fund using data from Morningstar.
As part of the discussion with management, the Trustees ensured that they understood and were comfortable with the criteria used to determine the mutual funds included in the Morningstar categories for purposes of the
materials considered at the meeting. The Trustees determined that the advisory fee and overall expense ratio of the Fund falls within a reasonable range of the advisory fees and overall expense ratios of other
comparable funds and concluded that they are reasonable and warranted continuation of the advisory agreement.
|
|
|
(4)
|
The Trustees also considered whether the Advisor was realizing economies of scale that should be shared with the Fund’s shareholders. The Trustees noted that the majority of expenses incurred
to manage the Fund are variable
|
|
HENNESSY FUNDS
|
1-800-966-4354
|
29
|
asset-based fees, so the Advisor does not realize material economies of scale relating to these expenses as the assets of the Fund increase. For example, third-party platform fees increase as
the Fund’s assets grow.
|
||
|
(5)
|
The Trustees considered the profitability of the Advisor, including the impact of mutual fund platform fees on the Advisor’s profitability, and also considered the resources and revenues that
the Advisor has put into managing and distributing the Fund. The Trustees then concluded that the profits of the Advisor are reasonable and not excessive when compared to profitability guidelines set forth in relevant
court cases.
|
|
|
(6)
|
The Trustees considered the high level of professionalism and knowledge of the Advisor’s employees and concluded that this was beneficial to the Fund and its shareholders.
|
|
|
(7)
|
The Trustees considered any benefits to the Advisor from serving as an advisor to the Fund (other than the advisory fee). The Trustees noted that the Advisor may derive ancillary benefits
from, by way of example, its association with the Fund in the form of proprietary and third-party research products and services received from broker-dealers that execute portfolio trades for the Fund. The Trustees
determined that any such products and services have been used for legitimate purposes relating to the Fund by providing assistance in the investment decision-making process. The Trustees concluded that any additional
benefits realized by the Advisor from its relationship with the Fund were reasonable, which was based on, among other things, the Trustees’ finding that the research, analytical, statistical, and other information and
services provided by brokers are merely supplemental to the Advisor’s own efforts in the performance of its duties under the advisory agreement.
|
After reviewing the materials and information provided at the meeting, as well as other information regularly provided at the Board’s quarterly meetings throughout the year
regarding the quality of services provided by the Advisor, the performance of the Fund, expense information, brokerage commissions information, the adequacy and efficacy of the Advisor’s written policies and procedures, other
regulatory compliance issues, trading information and related matters, and other factors that the Trustees deemed relevant, the Trustees, including the Independent Trustees, approved the continuation of the advisory agreement.
|
WWW.HENNESSYFUNDS.COM
|
30
|
BOARD APPROVAL OF INVESTMENT ADVISORY AGREEMENT
|
(This Page Intentionally Left Blank.)
For information, questions, or assistance, please call
The Hennessy Funds
800-966-4354 or 415-899-1555
INVESTMENT ADVISOR
Hennessy Advisors, Inc.
7250 Redwood Boulevard, Suite 200
Novato, California 94945
ADMINISTRATOR,
TRANSFER AGENT,
DIVIDEND PAYING AGENT, &
SHAREHOLDER SERVICING AGENT
U.S. Bancorp Fund Services, LLC
d/b/a U.S. Bank Global Fund Services
P.O. Box 701
Milwaukee, Wisconsin 53201-0701
CUSTODIAN
U.S. Bank N.A.
Custody Operations
1555 North River Center Drive, Suite 302
Milwaukee, Wisconsin 53212
TRUSTEES
Neil J. Hennessy
J. Dennis DeSousa
Robert T. Doyle
Claire Garvie
Gerald P. Richardson
COUNSEL
Foley & Lardner LLP
777 East Wisconsin Avenue
Milwaukee, Wisconsin 53202-5306
INDEPENDENT REGISTERED
PUBLIC ACCOUNTING FIRM
Tait, Weller & Baker LLP
Two Liberty Place
50 South 16th Street, Suite 2900
Philadelphia, Pennsylvania 19102-2529
DISTRIBUTOR
Quasar Distributors, LLC
111 East Kilbourn Avenue, Suite 1250
Milwaukee, Wisconsin 53202
www.hennessyfunds.com | 800-966-4354
This report has been prepared for shareholders and may be distributed to
others only if preceded or accompanied by a current prospectus.
SEMI-ANNUAL REPORT
APRIL 30, 2022

HENNESSY JAPAN FUND
Investor Class HJPNX
Institutional Class HJPIX
www.hennessyfunds.com | 1-800-966-4354
(This Page Intentionally Left Blank.)
Contents
|
Letter to Shareholders
|
2
|
|
Performance Overview
|
4
|
|
Financial Statements
|
|
|
Schedule of Investments
|
5
|
|
Statement of Assets and Liabilities
|
9
|
|
Statement of Operations
|
10
|
|
Statements of Changes in Net Assets
|
11
|
|
Financial Highlights
|
12
|
|
Notes to the Financial Statements
|
16
|
|
Expense Example
|
24
|
|
Proxy Voting Policy and Proxy Voting Records
|
26
|
|
Availability of Quarterly Portfolio Schedule
|
26
|
|
Federal Tax Distribution Information
|
26
|
|
Important Notice Regarding Delivery of Shareholder Documents
|
26
|
|
Electronic Delivery
|
27
|
|
Board Approval of Investment Advisory Agreements
|
28
|
|
HENNESSY FUNDS
|
1-800-966-4354
|
May 2022
Dear Hennessy Funds Shareholder:
The Japanese stock market lost -16.29% in U.S. dollar terms as measured by the Tokyo Stock Price Index (TOPIX) over the six months ended April 30, 2022.
The Japanese stock market declined mainly within the manufacturing sector, including high-tech stocks with high-growth expectations. This decline was due to uncertainty over the
armed conflict in Ukraine and a sharp rise in long-term U.S. interest rates as the Federal Reserve’s aggressive monetary tightening stance became clear. Since mid-March, the Japanese yen weakened against the U.S. dollar,
fueling a phase of solid performance mainly in export-related stocks. However, the prolonged lockdown in Chinese cities and other factors caused concern, limiting the upward momentum.
We are again witnessing a growth-to-value rotation on the back of rising bond yields around the world. Value stocks marched higher despite their lack of growth appeal. In theory,
higher interest rates should result in price corrections of all equities regardless of whether they are long-duration stocks (growth names) or short-duration stocks (value names). But in reality, it is completely reasonable
that some stocks get re-rated, perhaps driven by mean-reversion effects. After many years of anemic growth, the P/E ratios of these companies were depressed, so for their valuation levels to moderately recover is not
surprising. So far, we have seen this take place with Japanese banks’ P/B ratios rising to 0.5x from 0.3x recently. For Toyota Motor Corporation, the largest index constituent, its P/E ratio has climbed to 11x from 9x.
The depreciation of the Japanese yen should be a major plus for companies with global operations. One thing to note here is that many of these companies are not marginal
exporters who can only thrive under a weak domestic currency; to the contrary, they are market leaders in their respective fields with competitive profit margins and strong pricing power so the currency tailwind is purely an
added bonus for their fundamentals.
Thank you for your continued confidence and investment in the Hennessy Funds.
Sincerely,

 |
 |
|
Tadahiro Fujimura
|
Masakazu Takeda
|
|
Portfolio Manager,
|
Portfolio Manager,
|
|
Hennessy Japan Small Cap Fund;
|
Hennessy Japan Fund;
|
|
Chief Investment Officer
|
Fund Manager
|
|
SPARX Asset Management Co., Ltd.
|
SPARX Asset Management Co., Ltd.
|
SPARX Asset Management Co., Ltd., located in Tokyo, Japan, is the sub-advisor to the Hennessy Japan Fund and the Hennessy Japan Small Cap Fund.
|
WWW.HENNESSYFUNDS.COM
|
2
|
LETTER TO SHAREHOLDERS
|
Past performance does not guarantee future results.
Mutual fund investing involves risk. Principal loss is possible.
Opinions expressed are those of Tadahiro Fujimura and Masakazu Takeda and are subject to change, are not guaranteed, and should not be considered investment advice.
Fund holdings and sector allocations are subject to change. A non-diversified fund, which may concentrate its assets in fewer individual holdings than a diversified fund, is more exposed to
individual stock volatility than a diversified fund. A fund that concentrates its investments within one country, one sector, or a small group of industries, such as Japan, may be subject to a higher degree of market risk.
P/E, or price-to-earnings ratio, is a valuation measure calculated by dividing a company’s market price per share by its earnings per share. P/B, or price-to-book ration, is a valuation measure
calculated by dividing a company’s market price per share by its book value per share.
The Tokyo Stock Price Index (TOPIX) is a capitalization-weighted index of all of the companies listed on the First Section of the Tokyo Stock Exchange. The index is used herein for comparative
purposes in accordance with SEC regulations. One cannot invest directly in an index.
Please refer to the Schedule of Investments included in this report for additional portfolio information.
|
HENNESSY FUNDS
|
1-800-966-4354
|
3
Performance Overview (Unaudited)
AVERAGE ANNUAL TOTAL RETURN FOR PERIODS ENDED APRIL 30, 2022
|
Six
|
One
|
Five
|
Ten
|
|
|
Months(1)
|
Year
|
Years
|
Years
|
|
|
Hennessy Japan Fund –
|
||||
|
Investor Class (HJPNX)
|
-30.55%
|
-26.29%
|
3.19%
|
8.27%
|
|
Hennessy Japan Fund –
|
||||
|
Institutional Class (HJPIX)
|
-30.39%
|
-25.97%
|
3.61%
|
8.63%
|
|
Russell/Nomura Total MarketTM Index
|
-16.61%
|
-15.06%
|
3.58%
|
6.22%
|
|
Tokyo Stock Price Index (TOPIX)
|
-16.29%
|
-14.60%
|
3.42%
|
6.07%
|
Expense ratios: 1.43% (Investor Class); 1.04% (Institutional Class)
|
(1)
|
Periods of less than one year are not annualized.
|
_______________
Performance data quoted represents past performance; past performance does not guarantee future results. The investment return and principal value of an investment will
fluctuate so that an investor’s shares, when redeemed, may be worth more or less than their original cost. The performance table does not reflect the deduction of taxes that a shareholder would pay on Fund distributions or
the redemption of Fund shares. Current performance of the Fund may be lower or higher than the performance quoted. Performance data current to the most recent month end may be obtained by visiting www.hennessyfunds.com.
The Russell/Nomura Total Market™ Index contains the top 98% of all stocks listed on Japan’s stock exchanges and
registered on Japan’s over-the-counter market based on market capitalization. The Tokyo Stock Price Index (TOPIX) is a capitalization-weighted index of all of the companies listed on the First Section of the Tokyo Stock
Exchange. One cannot invest directly in an index. These indices are used for comparative purposes in accordance with Securities and Exchange Commission regulations.
Frank Russell Company (“Russell”) is the source and owner of the trademarks, service marks, and copyrights related to the Russell Indexes. Russell® is a trademark of Frank Russell Company. Neither Russell nor its licensors accept any liability for any errors or omissions in the Russell Indexes or Russell ratings or underlying data and
no party may rely on any Russell Indexes or Russell ratings or underlying data contained in this communication. No further distribution of Russell data is permitted without Russell’s express written consent. Russell does not
promote, sponsor, or endorse the content of this communication.
The expense ratios presented are from the most recent prospectus. The expense ratios for the current reporting period are available in the Financial Highlights section of this report.
|
WWW.HENNESSYFUNDS.COM
|
4
|
PERFORMANCE OVERVIEW/SCHEDULE OF INVESTMENTS
|
Financial Statements
|
Schedule of Investments as of April 30, 2022 (Unaudited)
|
HENNESSY JAPAN FUND
(% of Net Assets)
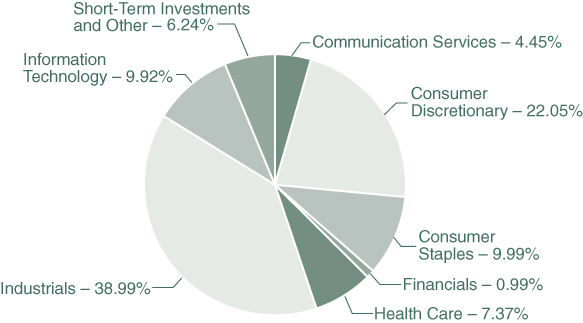
|
TOP TEN HOLDINGS (EXCLUDING MONEY MARKET FUNDS)
|
% NET ASSETS
|
|
Sony Group Corp.
|
9.01%
|
|
Mitsubishi Corp.
|
8.37%
|
|
Recruit Holdings Co., Ltd.
|
6.81%
|
|
Hitachi Ltd.
|
6.71%
|
|
Keyence Corp.
|
6.10%
|
|
Terumo Corp.
|
4.73%
|
|
Daikin Industries, Ltd.
|
4.66%
|
|
Nidec Corp.
|
4.60%
|
|
MISUMI Group, Inc.
|
4.11%
|
|
Shimano, Inc.
|
3.85%
|
Note: For presentation purposes, the Fund has grouped some of the industry categories. For purposes of categorizing securities for compliance with Section 8(b)(1) of the Investment Company Act of
1940, as amended, the Fund uses more specific industry classifications.
The Global Industry Classification Standard (GICS®) was developed by and is the exclusive property and a service
mark of MSCI, Inc. and Standard & Poor’s Financial Services LLC. It has been licensed for use by the Hennessy Funds.
|
HENNESSY FUNDS
|
1-800-966-4354
|
5
|
COMMON STOCKS – 93.76%
|
Number
|
% of
|
||||||||||
|
|
of Shares
|
Value
|
Net Assets
|
|||||||||
|
Communication Services – 4.45%
|
||||||||||||
|
SoftBank Group Corp.
|
243,400
|
$
|
10,011,101
|
2.15
|
%
|
|||||||
|
Z Holdings Corp.
|
2,725,300
|
10,699,088
|
2.30
|
%
|
||||||||
|
|
20,710,189
|
4.45
|
%
|
|||||||||
|
Consumer Discretionary – 22.05%
|
||||||||||||
|
Asics Corp.
|
306,000
|
4,827,688
|
1.04
|
%
|
||||||||
|
Fast Retailing Co., Ltd.
|
30,500
|
14,042,389
|
3.02
|
%
|
||||||||
|
Mercari, Inc. (a)
|
880,900
|
14,435,652
|
3.10
|
%
|
||||||||
|
Nitori Holdings Co., Ltd.
|
91,800
|
9,444,325
|
2.03
|
%
|
||||||||
|
Shimano, Inc.
|
101,300
|
17,948,785
|
3.85
|
%
|
||||||||
|
Sony Group Corp.
|
486,000
|
41,942,327
|
9.01
|
%
|
||||||||
|
|
102,641,166
|
22.05
|
%
|
|||||||||
|
Consumer Staples – 9.99%
|
||||||||||||
|
Ariake Japan Co., Ltd.
|
119,900
|
4,810,549
|
1.03
|
%
|
||||||||
|
Kao Corp.
|
243,200
|
9,747,085
|
2.09
|
%
|
||||||||
|
Rohto Pharmaceutical Co., Ltd.
|
640,800
|
17,112,288
|
3.68
|
%
|
||||||||
|
Unicharm Corp.
|
426,000
|
14,821,393
|
3.19
|
%
|
||||||||
|
|
46,491,315
|
9.99
|
%
|
|||||||||
|
Financials – 0.99%
|
||||||||||||
|
Anicom Holdings, Inc.
|
981,200
|
4,628,431
|
0.99
|
%
|
||||||||
|
Health Care – 7.37%
|
||||||||||||
|
Asahi Intecc Co., Ltd.
|
100,600
|
1,943,988
|
0.42
|
%
|
||||||||
|
Olympus Corp.
|
513,200
|
9,032,898
|
1.94
|
%
|
||||||||
|
PeptiDream, Inc. (a)
|
79,700
|
1,285,471
|
0.28
|
%
|
||||||||
|
Terumo Corp.
|
739,700
|
22,017,280
|
4.73
|
%
|
||||||||
|
|
34,279,637
|
7.37
|
%
|
|||||||||
|
Industrials – 38.99%
|
||||||||||||
|
Daikin Industries, Ltd.
|
141,900
|
21,684,832
|
4.66
|
%
|
||||||||
|
Hitachi Ltd.
|
659,100
|
31,258,785
|
6.71
|
%
|
||||||||
|
Kubota Corp.
|
1,023,100
|
17,381,109
|
3.73
|
%
|
||||||||
|
MISUMI Group, Inc.
|
762,700
|
19,124,187
|
4.11
|
%
|
||||||||
|
Mitsubishi Corp.
|
1,160,900
|
38,977,824
|
8.37
|
%
|
||||||||
|
Nidec Corp.
|
330,900
|
21,392,391
|
4.60
|
%
|
||||||||
|
Recruit Holdings Co., Ltd.
|
873,200
|
31,681,105
|
6.81
|
%
|
||||||||
|
|
181,500,233
|
38.99
|
%
|
|||||||||
The accompanying notes are an integral part of these financial statements.
|
WWW.HENNESSYFUNDS.COM
|
6
|
SCHEDULE OF INVESTMENTS
|
|
COMMON STOCKS
|
Number
|
% of
|
||||||||||
|
|
of Shares
|
Value
|
Net Assets
|
|||||||||
|
Information Technology – 9.92%
|
||||||||||||
|
Keyence Corp.
|
70,600
|
$
|
28,381,500
|
6.10
|
%
|
|||||||
|
Murata Manufacturing Co., Ltd.
|
298,400
|
17,786,877
|
3.82
|
%
|
||||||||
|
|
46,168,377
|
9.92
|
%
|
|||||||||
|
|
||||||||||||
|
Total Common Stocks
|
||||||||||||
|
(Cost $369,345,202)
|
436,419,348
|
93.76
|
%
|
|||||||||
|
|
||||||||||||
|
SHORT-TERM INVESTMENTS – 5.72%
|
||||||||||||
|
Money Market Funds – 5.72%
|
||||||||||||
|
First American Government Obligations Fund,
|
||||||||||||
|
Institutional Class, 0.22% (b)
|
23,263,000
|
23,263,000
|
5.00
|
%
|
||||||||
|
First American Treasury Obligations Fund,
|
||||||||||||
|
Institutional Class, 0.29% (b)
|
3,375,819
|
3,375,819
|
0.72
|
%
|
||||||||
|
|
||||||||||||
|
Total Short-Term Investments
|
||||||||||||
|
(Cost $26,638,819)
|
26,638,819
|
5.72
|
%
|
|||||||||
|
|
||||||||||||
|
Total Investments
|
||||||||||||
|
(Cost $395,984,021) – 99.48%
|
463,058,167
|
99.48
|
%
|
|||||||||
|
Other Assets in Excess of Liabilities – 0.52%
|
2,421,760
|
0.52
|
%
|
|||||||||
|
|
||||||||||||
|
TOTAL NET ASSETS – 100.00%
|
$
|
465,479,927
|
100.00
|
%
|
||||||||
Percentages are stated as a percent of net assets.
|
(a)
|
Non-income-producing security.
|
|
(b)
|
The rate listed is the fund’s seven-day yield as of April 30, 2022.
|
The accompanying notes are an integral part of these financial statements.
|
HENNESSY FUNDS
|
1-800-966-4354
|
7
Summary of Fair Value Exposure as of April 30, 2022
The following is a summary of the inputs used to value the Fund’s net assets as of April 30, 2022 (see Note 3 in the accompanying Notes to the Financial Statements):
|
Common Stocks
|
Level 1
|
Level 2
|
Level 3
|
Total
|
||||||||||||
|
Communication Services
|
$
|
—
|
$
|
20,710,189
|
$
|
—
|
$
|
20,710,189
|
||||||||
|
Consumer Discretionary
|
—
|
102,641,166
|
—
|
102,641,166
|
||||||||||||
|
Consumer Staples
|
—
|
46,491,315
|
—
|
46,491,315
|
||||||||||||
|
Financials
|
—
|
4,628,431
|
—
|
4,628,431
|
||||||||||||
|
Health Care
|
—
|
34,279,637
|
—
|
34,279,637
|
||||||||||||
|
Industrials
|
—
|
181,500,233
|
—
|
181,500,233
|
||||||||||||
|
Information Technology
|
—
|
46,168,377
|
—
|
46,168,377
|
||||||||||||
|
Total Common Stocks
|
$
|
—
|
$
|
436,419,348
|
$
|
—
|
$
|
436,419,348
|
||||||||
|
Short-Term Investments
|
||||||||||||||||
|
Money Market Funds
|
$
|
26,638,819
|
$
|
—
|
$
|
—
|
$
|
26,638,819
|
||||||||
|
Total Short-Term Investments
|
$
|
26,638,819
|
$
|
—
|
$
|
—
|
$
|
26,638,819
|
||||||||
|
Total Investments
|
$
|
26,638,819
|
$
|
436,419,348
|
$
|
—
|
$
|
463,058,167
|
||||||||
The accompanying notes are an integral part of these financial statements.
|
WWW.HENNESSYFUNDS.COM
|
8
|
SCHEDULE OF INVESTMENTS/STATEMENT OF ASSETS AND LIABILITIES
|
Financial Statements
|
Statement of Assets and Liabilities as of April 30, 2022 (Unaudited)
|
|
ASSETS:
|
||||
|
Investments in securities, at value (cost $395,984,021)
|
$
|
463,058,167
|
||
|
Dividends and interest receivable
|
2,230,673
|
|||
|
Receivable for fund shares sold
|
1,571,228
|
|||
|
Receivable for securities sold
|
1,306,501
|
|||
|
Prepaid expenses and other assets
|
27,954
|
|||
|
Total assets
|
468,194,523
|
|||
|
LIABILITIES:
|
||||
|
Payable for fund shares redeemed
|
2,223,454
|
|||
|
Payable to advisor
|
338,787
|
|||
|
Payable to administrator
|
100,870
|
|||
|
Payable to auditor
|
10,710
|
|||
|
Accrued distribution fees
|
10,758
|
|||
|
Accrued service fees
|
5,395
|
|||
|
Accrued trustees fees
|
1,876
|
|||
|
Accrued expenses and other payables
|
22,746
|
|||
|
Total liabilities
|
2,714,596
|
|||
|
NET ASSETS
|
$
|
465,479,927
|
||
|
NET ASSETS CONSISTS OF:
|
||||
|
Capital stock
|
$
|
414,881,161
|
||
|
Total distributable earnings
|
50,598,766
|
|||
|
Total net assets
|
$
|
465,479,927
|
||
|
NET ASSETS:
|
||||
|
Investor Class
|
||||
|
Shares authorized (no par value)
|
Unlimited
|
|||
|
Net assets applicable to outstanding shares
|
$
|
60,622,970
|
||
|
Shares issued and outstanding
|
1,842,996
|
|||
|
Net asset value, offering price, and redemption price per share
|
$
|
32.89
|
||
|
Institutional Class
|
||||
|
Shares authorized (no par value)
|
Unlimited
|
|||
|
Net assets applicable to outstanding shares
|
$
|
404,856,957
|
||
|
Shares issued and outstanding
|
11,921,561
|
|||
|
Net asset value, offering price, and redemption price per share
|
$
|
33.96
|
||
The accompanying notes are an integral part of these financial statements.
|
HENNESSY FUNDS
|
1-800-966-4354
|
9
Financial Statements
|
Statement of Operations for the six months ended April 30, 2022 (Unaudited)
|
|
INVESTMENT INCOME:
|
||||
|
Dividend income(1)
|
$
|
3,084,696
|
||
|
Interest income
|
5,758
|
|||
|
Total investment income
|
3,090,454
|
|||
|
EXPENSES:
|
||||
|
Investment advisory fees (See Note 5)
|
2,809,492
|
|||
|
Administration, accounting, custody, and transfer agent fees (See Note 5)
|
386,262
|
|||
|
Sub-transfer agent expenses – Investor Class (See Note 5)
|
88,920
|
|||
|
Sub-transfer agent expenses – Institutional Class (See Note 5)
|
212,526
|
|||
|
Distribution fees – Investor Class (See Note 5)
|
56,444
|
|||
|
Service fees – Investor Class (See Note 5)
|
37,629
|
|||
|
Federal and state registration fees
|
35,191
|
|||
|
Reports to shareholders
|
18,804
|
|||
|
Trustees’ fees and expenses
|
16,224
|
|||
|
Compliance expense (See Note 5)
|
15,156
|
|||
|
Interest expense (See Note 7)
|
12,555
|
|||
|
Audit fees
|
10,709
|
|||
|
Legal fees
|
6,104
|
|||
|
Other expenses
|
46,519
|
|||
|
Total expenses
|
3,752,535
|
|||
|
NET INVESTMENT LOSS
|
$
|
(662,081
|
)
|
|
|
REALIZED AND UNREALIZED GAINS (LOSSES):
|
||||
|
Net realized gain on investments
|
$
|
4,923,376
|
||
|
Net change in unrealized appreciation/depreciation on investments
|
(242,294,611
|
)
|
||
|
Net loss on investments
|
(237,371,235
|
)
|
||
|
NET DECREASE IN NET ASSETS RESULTING FROM OPERATIONS
|
$
|
(238,033,316
|
)
|
|
|
(1)
|
Net of foreign taxes withheld of $342,728.
|
The accompanying notes are an integral part of these financial statements.
|
WWW.HENNESSYFUNDS.COM
|
10
|
STATEMENT OF OPERATIONS/STATEMENTS OF CHANGES IN NET ASSETS
|
Financial Statements
|
Statements of Changes in Net Assets
|
|
Six Months Ended
|
||||||||
|
April 30, 2022
|
Year Ended
|
|||||||
|
(Unaudited)
|
October 31, 2021
|
|||||||
|
OPERATIONS:
|
||||||||
|
Net investment loss
|
$
|
(662,081
|
)
|
$
|
(1,149,197
|
)
|
||
|
Net realized gain on investments
|
4,923,376
|
19,086,546
|
||||||
|
Net change in unrealized
|
||||||||
|
appreciation/depreciation on investments
|
(242,294,611
|
)
|
68,905,761
|
|||||
|
Net increase (decrease) in net
|
||||||||
|
assets resulting from operations
|
(238,033,316
|
)
|
86,843,110
|
|||||
|
DISTRIBUTIONS TO SHAREHOLDERS:
|
||||||||
|
Distributable earnings – Investor Class
|
(747,296
|
)
|
—
|
|||||
|
Distributable earnings – Institutional Class
|
(11,015,400
|
)
|
(48,044
|
)
|
||||
|
Total distributions
|
(11,762,696
|
)
|
(48,044
|
)
|
||||
|
CAPITAL SHARE TRANSACTIONS:
|
||||||||
|
Proceeds from shares subscribed – Investor Class
|
13,339,003
|
61,092,843
|
||||||
|
Proceeds from shares subscribed – Institutional Class
|
117,831,572
|
227,381,324
|
||||||
|
Dividends reinvested – Investor Class
|
703,285
|
—
|
||||||
|
Dividends reinvested – Institutional Class
|
10,598,718
|
47,024
|
||||||
|
Cost of shares redeemed – Investor Class
|
(12,390,794
|
)
|
(129,927,285
|
)
|
||||
|
Cost of shares redeemed – Institutional Class
|
(228,390,357
|
)
|
(182,214,241
|
)
|
||||
|
Net decrease in net assets derived
|
||||||||
|
from capital share transactions
|
(98,308,573
|
)
|
(23,620,335
|
)
|
||||
|
TOTAL INCREASE (DECREASE) IN NET ASSETS
|
(348,104,585
|
)
|
63,174,731
|
|||||
|
NET ASSETS:
|
||||||||
|
Beginning of period
|
813,584,512
|
750,409,781
|
||||||
|
End of period
|
$
|
465,479,927
|
$
|
813,584,512
|
||||
|
CHANGES IN SHARES OUTSTANDING:
|
||||||||
|
Shares sold – Investor Class
|
333,180
|
1,302,489
|
||||||
|
Shares sold – Institutional Class
|
2,744,578
|
4,688,665
|
||||||
|
Shares issued to holders as reinvestment
|
||||||||
|
of dividends – Investor Class
|
15,157
|
—
|
||||||
|
Shares issued to holders as reinvestment
|
||||||||
|
of dividends – Institutional Class
|
221,545
|
944
|
||||||
|
Shares redeemed – Investor Class
|
(307,742
|
)
|
(2,825,915
|
)
|
||||
|
Shares redeemed – Institutional Class
|
(5,728,249
|
)
|
(3,765,795
|
)
|
||||
|
Net decrease in shares outstanding
|
(2,721,531
|
)
|
(599,612
|
)
|
||||
The accompanying notes are an integral part of these financial statements.
|
HENNESSY FUNDS
|
1-800-966-4354
|
11
Financial Statements
|
Financial Highlights
|
For an Investor Class share outstanding throughout each period
|
Six Months Ended
|
||||
|
April 30, 2022
|
||||
|
(Unaudited)
|
||||
|
PER SHARE DATA:
|
||||
|
Net asset value, beginning of period
|
$
|
47.78
|
||
|
Income from investment operations:
|
||||
|
Net investment income (loss)
|
(0.11
|
)(1)
|
||
|
Net realized and unrealized gains (losses) on investments
|
(14.37
|
)
|
||
|
Total from investment operations
|
(14.48
|
)
|
||
|
Less distributions:
|
||||
|
Dividends from net investment income
|
(0.41
|
)
|
||
|
Dividends from net realized gains
|
—
|
|||
|
Total distributions
|
(0.41
|
)
|
||
|
Net asset value, end of period
|
$
|
32.89
|
||
|
TOTAL RETURN
|
-30.55
|
%(3)
|
||
|
SUPPLEMENTAL DATA AND RATIOS:
|
||||
|
Net assets, end of period (millions)
|
$
|
60.62
|
||
|
Ratio of expenses to average net assets
|
1.44
|
%(4)
|
||
|
Ratio of net investment income (loss) to average net assets
|
(0.52
|
)%(4)
|
||
|
Portfolio turnover rate(5)
|
2
|
%(3)
|
||
|
(1)
|
Calculated using the average shares outstanding method.
|
|
(2)
|
Amount is between $(0.005) and $0.005.
|
|
(3)
|
Not annualized.
|
|
(4)
|
Annualized.
|
|
(5)
|
Calculated on the basis of the Fund as a whole.
|
The accompanying notes are an integral part of these financial statements.
|
WWW.HENNESSYFUNDS.COM
|
12
|
FINANCIAL HIGHLIGHTS — INVESTOR CLASS
|
|
Year Ended October 31,
|
||||||||||||||||||
|
2021
|
2020
|
2019
|
2018
|
2017
|
||||||||||||||
|
$
|
42.79
|
$
|
37.17
|
$
|
33.63
|
$
|
32.75
|
$
|
27.81
|
|||||||||
|
(0.23
|
)(1)
|
(0.14
|
)(1)
|
0.05
|
(1)
|
(0.00
|
)(2)
|
(0.03
|
)
|
|||||||||
|
5.22
|
5.81
|
3.50
|
0.89
|
4.97
|
||||||||||||||
|
4.99
|
5.67
|
3.55
|
0.89
|
4.94
|
||||||||||||||
|
—
|
(0.02
|
)
|
(0.01
|
)
|
(0.01
|
)
|
—
|
|||||||||||
|
—
|
(0.03
|
)
|
—
|
—
|
—
|
|||||||||||||
|
—
|
(0.05
|
)
|
(0.01
|
)
|
(0.01
|
)
|
—
|
|||||||||||
|
$
|
47.78
|
$
|
42.79
|
$
|
37.17
|
$
|
33.63
|
$
|
32.75
|
|||||||||
|
11.66
|
%
|
15.27
|
%
|
10.60
|
%
|
2.70
|
%
|
17.76
|
%
|
|||||||||
|
$
|
86.11
|
$
|
142.30
|
$
|
87.22
|
$
|
103.33
|
$
|
84.44
|
|||||||||
|
1.43
|
%
|
1.43
|
%
|
1.43
|
%
|
1.43
|
%
|
1.46
|
%
|
|||||||||
|
(0.49
|
)%
|
(0.37
|
)%
|
0.14
|
%
|
(0.02
|
)%
|
(0.15
|
)%
|
|||||||||
|
16
|
%
|
23
|
%
|
9
|
%
|
1
|
%
|
0
|
%
|
|||||||||
The accompanying notes are an integral part of these financial statements.
|
HENNESSY FUNDS
|
1-800-966-4354
|
13
Financial Statements
|
Financial Highlights
|
For an Institutional Class share outstanding throughout each period
|
Six Months Ended
|
||||
|
April 30, 2022
|
||||
|
(Unaudited)
|
||||
|
PER SHARE DATA:
|
||||
|
Net asset value, beginning of period
|
$
|
49.54
|
||
|
Income from investment operations:
|
||||
|
Net investment income (loss)
|
(0.03
|
)(1)
|
||
|
Net realized and unrealized gains (losses) on investments
|
(14.81
|
)
|
||
|
Total from investment operations
|
(14.84
|
)
|
||
|
Less distributions:
|
||||
|
Dividends from net investment income
|
(0.74
|
)
|
||
|
Dividends from net realized gains
|
—
|
|||
|
Total distributions
|
(0.74
|
)
|
||
|
Net asset value, end of period
|
$
|
33.96
|
||
|
TOTAL RETURN
|
-30.39
|
%(3)
|
||
|
SUPPLEMENTAL DATA AND RATIOS:
|
||||
|
Net assets, end of period (millions)
|
$
|
404.86
|
||
|
Ratio of expenses to average net assets
|
1.02
|
%(4)
|
||
|
Ratio of net investment income (loss) to average net assets
|
(0.15
|
)%(4)
|
||
|
Portfolio turnover rate(5)
|
2
|
%(3)
|
||
|
(1)
|
Calculated using the average shares outstanding method.
|
|
(2)
|
Amount is between $(0.005) and $0.005.
|
|
(3)
|
Not annualized.
|
|
(4)
|
Annualized.
|
|
(5)
|
Calculated on the basis of the Fund as a whole.
|
The accompanying notes are an integral part of these financial statements.
|
WWW.HENNESSYFUNDS.COM
|
14
|
FINANCIAL HIGHLIGHTS — INSTITUTIONAL CLASS
|
|
Year Ended October 31,
|
||||||||||||||||||
|
2021
|
2020
|
2019
|
2018
|
2017
|
||||||||||||||
|
$
|
44.19
|
$
|
38.37
|
$
|
34.67
|
$
|
33.64
|
$
|
28.45
|
|||||||||
|
(0.03
|
)(1)
|
0.02
|
(1)
|
0.21
|
(1)
|
0.15
|
0.03
|
|||||||||||
|
5.38
|
5.99
|
3.60
|
0.91
|
5.16
|
||||||||||||||
|
5.35
|
6.01
|
3.81
|
1.06
|
5.19
|
||||||||||||||
|
(0.00
|
)(2)
|
(0.16
|
)
|
(0.11
|
)
|
(0.03
|
)
|
—
|
||||||||||
|
—
|
(0.03
|
)
|
—
|
—
|
—
|
|||||||||||||
|
(0.00
|
)(2)
|
(0.19
|
)
|
(0.11
|
)
|
(0.03
|
)
|
—
|
||||||||||
|
$
|
49.54
|
$
|
44.19
|
$
|
38.37
|
$
|
34.67
|
$
|
33.64
|
|||||||||
|
12.11
|
%
|
15.72
|
%
|
11.02
|
%
|
3.14
|
%
|
18.24
|
%
|
|||||||||
|
$
|
727.47
|
$
|
608.11
|
$
|
611.41
|
$
|
399.76
|
$
|
177.42
|
|||||||||
|
1.04
|
%
|
1.04
|
%
|
1.03
|
%
|
1.01
|
%
|
1.05
|
%
|
|||||||||
|
(0.07
|
)%
|
0.04
|
%
|
0.59
|
%
|
0.49
|
%
|
0.30
|
%
|
|||||||||
|
16
|
%
|
23
|
%
|
9
|
%
|
1
|
%
|
0
|
%
|
|||||||||
The accompanying notes are an integral part of these financial statements.
|
HENNESSY FUNDS
|
1-800-966-4354
|
15
Financial Statements
|
Notes to the Financial Statements April 30, 2022 (Unaudited)
|
1). ORGANIZATION
The Hennessy Japan Fund (the “Fund”) is a series of Hennessy Funds Trust (the “Trust”), which was organized as a Delaware statutory trust on September 17, 1992. The Fund is an open-end management
investment company registered under the Investment Company Act of 1940, as amended. The investment objective of the Fund is long-term capital appreciation. The Fund is a diversified fund, but employs a relatively
concentrated investment strategy and may hold securities of fewer issuers than other diversified funds.
The Fund offers Investor Class and Institutional Class shares. Each class of shares differs principally in its respective 12b-1 distribution and service, shareholder servicing,
and sub-transfer agent expenses. There are no sales charges. Each class has identical rights to earnings, assets, and voting privileges, except for class-specific expenses and exclusive rights to vote on matters affecting
only one class.
As an investment company, the Fund follows the investment company accounting and reporting guidance of the Financial Accounting Standards Board (“FASB”) Accounting Standard
Codification Topic 946 “Financial Services—Investment Companies.”
2). SIGNIFICANT ACCOUNTING POLICIES
The following is a summary of significant accounting policies consistently followed by the Fund in the preparation of the financial statements. These policies conform to U.S. generally accepted
accounting principles (“GAAP”).
|
a).
|
Securities Valuation – All investments in securities are valued in accordance with the Fund’s valuation policies and procedures, as described in Note 3.
|
|
b).
|
Federal Income Taxes – The Fund has elected to be taxed as a regulated investment company and intends to distribute substantially all of its taxable income to its shareholders and otherwise
comply with the provisions of the Internal Revenue Code of 1986, as amended, applicable to regulated investment companies. As a result, the Fund has made no provision for federal income taxes or excise taxes. Net
investment income/loss and realized gains/losses for federal income tax purposes may differ from those reported in the financial statements because of temporary book-basis and tax-basis differences. Temporary
differences are primarily the result of the treatment of wash sales for tax reporting purposes. The Fund recognizes interest and penalties related to income tax benefits, if any, in the Statement of Operations as an
income tax expense. Distributions from net realized gains for book purposes may include short-term capital gains, which are included as ordinary income to shareholders for tax purposes. The Fund may utilize
equalization accounting for tax purposes and designate earnings and profits, including net realized gains distributed to shareholders on redemption of shares, as part of the dividends paid deduction for income tax
purposes.
|
|
c).
|
Accounting for Uncertainty in Income Taxes – The Fund has accounting policies regarding recognition and measurement of tax positions taken or expected to be taken on a tax return. The tax
returns of the Fund for the prior three fiscal years are open for examination. The Fund has reviewed all open tax years in major tax jurisdictions and concluded that there is no impact on the Fund’s net assets and no
tax liability resulting from unrecognized tax benefits relating to uncertain income tax
|
|
WWW.HENNESSYFUNDS.COM
|
16
|
NOTES TO THE FINANCIAL STATEMENTS
|
|
positions taken or expected to be taken on a tax return. The Fund’s major tax jurisdictions are U.S. federal and Delaware.
|
|
|
d).
|
Income and Expenses – Dividend income is recognized on the ex-dividend date or as soon as information is available to the Fund. Interest income, which includes the amortization of premium
and accretion of discount, is recognized on an accrual basis. Market discounts, original issue discounts, and market premiums on debt securities are accreted or amortized to interest income over the life of a
security with a corresponding increase or decrease, as applicable, in the cost basis of such security using the yield-to-maturity method or, where applicable, the first call date of the security. Other non-cash
dividends are recognized as investment income at the fair value of the property received. The Fund is charged for those expenses that are directly attributable to its portfolio, such as advisory, administration, and
certain shareholder service fees. Income, expenses (other than expenses attributable to a specific class), and realized and unrealized gains/losses on investments are allocated to each class of shares based on such
class’s net assets.
|
|
e).
|
Distributions to Shareholders – Dividends from net investment income for the Fund, if any, are declared and paid annually, usually in December. Distributions of net realized capital gains,
if any, are declared and paid annually, usually in December.
|
|
f).
|
Security Transactions – Investment and shareholder transactions are recorded on the trade date. The Fund determines the realized gain/loss from an investment transaction by comparing the
original cost of the security lot sold with the net sale proceeds. Discounts and premiums on securities purchased are accreted or amortized, respectively, over the life of each such security.
|
|
g).
|
Use of Estimates – Preparing financial statements in accordance with GAAP requires management to make estimates and assumptions that affect the reported amounts of assets and liabilities
and disclosure of contingent assets and liabilities at the date of the financial statements, as well as the reported change in net assets during the reporting period. Actual results could differ from those estimates.
|
|
h).
|
Share Valuation – The net asset value (“NAV”) per share of the Fund is calculated by dividing (i) the total value of the securities held by the Fund, plus cash and other assets, minus all
liabilities (including estimated accrued expenses) by (ii) the total number of Fund shares outstanding, rounded to the nearest $0.01. Fund shares are not priced on days the New York Stock Exchange is closed for
trading. The offering and redemption price per share for the Fund is equal to the Fund’s NAV per share.
|
|
i).
|
Foreign Currency – Values of investments denominated in foreign currencies are converted into U.S. dollars using the spot market exchange rate at the time of valuation. Purchases and sales
of investments and income are translated into U.S. dollars using the spot market exchange rate prevailing on the respective dates of such transactions. The Fund does not isolate the portion of the results of
operations resulting from fluctuations in foreign exchange rates on investments from fluctuations resulting from changes in the market prices of securities held. Such fluctuations are included with the net realized
and unrealized gain/loss on investments. Foreign investments present additional risks due to currency fluctuations, economic and political factors, lower liquidity, government regulations, differences in accounting
standards, and other factors.
|
|
j).
|
Recent Accounting Pronouncements and Regulatory Updates – In October 2020, the Securities and Exchange Commission (“SEC”) adopted new regulations governing the use of derivatives by
registered investment companies (“Rule 18f-4”). Rule 18f-4 imposes limits on the amount of derivatives a fund can enter into, eliminates the
|
|
HENNESSY FUNDS
|
1-800-966-4354
|
17
|
asset segregation framework currently used by funds to comply with Section 18 of the 1940 Act, and requires funds whose use of derivatives is greater than a limited specified amount to
establish and maintain a comprehensive derivatives risk management program and appoint a derivatives risk manager. Funds are required to comply with Rule 18f-4 by August 19, 2022. The impact, if any, that Rule 18f-4
will have on the availability, liquidity, and performance of derivatives is unclear. Management is currently evaluating the potential impact of Rule 18f-4 on the Fund. When fully implemented, Rule 18f-4 may require
changes in how the Fund uses derivatives, adversely affect the Fund’s performance, and increase costs related to the Fund’s use of derivatives.
|
|
|
In December 2020, the SEC adopted a new rule providing a framework for fund valuation practices (“Rule 2a-5”). Rule
2a-5 establishes requirements for determining fair value in good faith for purposes of the 1940 Act. Rule 2a-5 permits fund boards to designate certain parties to perform fair value determinations, subject to board
oversight and certain other conditions. Rule 2a-5 also defines when market quotations are “readily available” for purposes of the 1940 Act and the threshold for determining whether a fund must fair value a security.
In connection with Rule 2a-5, the SEC also adopted related recordkeeping requirements and is rescinding previously issued guidance, including with respect to the role of a board in determining fair value and the
accounting and auditing of fund investments. Funds must comply with the rules by September 8, 2022. Management is currently assessing the potential impact of the new rules on the Fund’s financial statements.
|
3). SECURITIES VALUATION
The Fund follows its valuation policies and procedures in determining its net asset value and, in preparing these financial statements, the fair value accounting standards that establish an
authoritative definition of fair value and set out a hierarchy for measuring fair value. These standards require additional disclosures about the various inputs and valuation techniques used to develop the measurements of
fair value and a discussion of changes in valuation techniques and related inputs during the period. These inputs are summarized in the three broad levels listed below:
|
Level 1 –
|
Unadjusted, quoted prices in active markets for identical instruments that the Fund has the ability to access at the date of measurement.
|
|
|
Level 2 –
|
Other significant observable inputs (including, but not limited to, quoted prices in active markets for similar instruments, quoted prices in markets that are not active for identical or
similar instruments, and model-derived valuations in which all significant inputs and significant value drivers are observable in active markets, such as interest rates, prepayment speeds, credit risk curves, default
rates, and similar data).
|
|
|
Level 3 –
|
Significant unobservable inputs (including the Fund’s own assumptions about what market participants would use to price the asset or liability based on the best available information) when
observable inputs are unavailable.
|
The following is a description of the valuation techniques applied to the Fund’s major categories of assets and liabilities on a recurring basis:
|
Equity Securities – Equity securities, including common stocks, preferred stocks, foreign-issued common stocks, exchange-traded funds, closed-end
mutual funds, partnerships, rights, and real estate investment trusts, that are traded on a securities exchange for which a last-quoted sales price is readily available generally are valued at the last sales price as
reported by the primary exchange on which the securities are
|
|
WWW.HENNESSYFUNDS.COM
|
18
|
NOTES TO THE FINANCIAL STATEMENTS
|
|
listed. Securities listed on The Nasdaq Stock Market (“Nasdaq”) generally are valued at the Nasdaq Official Closing Price, which may differ from the last sales price reported. Securities
traded on a securities exchange for which a last-quoted sales price is not readily available generally are valued at the mean between the bid and ask prices. To the extent these securities are actively traded and
valuation adjustments are not applied, they are classified in Level 1 of the fair value hierarchy. Securities traded on foreign exchanges generally are not valued at the same time the Fund calculates its NAV because
most foreign markets close well before such time. The earlier close of most foreign markets gives rise to the possibility that significant events, including broad market moves, may have occurred in the interim. In
certain circumstances, it may be determined that a foreign security needs to be fair valued because it appears that the value of the security might have been materially affected by events occurring after the close of
the market in which the security is principally traded, but before the time the Fund calculates its NAV, such as by a development that affects an entire market or region (e.g., a weather-related event) or a
potentially global development (e.g., a terrorist attack that may be expected to have an effect on investor expectations worldwide).
|
|
|
Registered Investment Companies – Investments in open-end registered investment companies, commonly referred to as mutual funds, generally are
priced at the ending NAV provided by the applicable mutual fund’s service agent and are classified in Level 1 of the fair value hierarchy.
|
|
|
Debt Securities – Debt securities, including corporate bonds, asset-backed securities, mortgage-backed securities, municipal bonds, U.S. Treasuries,
and U.S. government agency issues, are generally valued at market on the basis of valuations furnished by an independent pricing service that utilizes both dealer-supplied valuations and formula-based techniques. The
pricing service may consider recently executed transactions in securities of the issuer or comparable issuers, market price quotations (where observable), bond spreads, and fundamental data relating to the issuer. In
addition, the model may incorporate observable market data, such as reported sales of similar securities, broker quotes, yields, bids, offers, and reference data. Certain securities are valued primarily using dealer
quotations. These securities are generally classified in Level 2 of the fair value hierarchy.
|
|
|
Short-Term Securities – Short-term equity investments, including money market funds, are valued in the manner specified above for equity securities.
Short-term debt investments with an original term to maturity of 60 days or less are valued at amortized cost, which approximates fair market value. If the original term to maturity of a short-term debt investment
exceeds 60 days, then the values as of the 61st day prior to maturity are amortized. Amortized cost is not used if its use would be inappropriate due to credit or other impairments of the issuer, in which case the
security’s fair value would be determined as described below. Short-term securities are generally classified in Level 1 or Level 2 of the fair value hierarchy depending on the inputs used and market activity levels
for specific securities.
|
The Board of Trustees of the Fund (the “Board”) has adopted fair value pricing procedures that are followed when a price for a security is not readily available or if a
significant event has occurred that indicates the closing price of a security no longer represents the true value of that security. Fair value pricing determinations are made in good faith in accordance with these
procedures. There are numerous criteria considered in determining a fair value of a security, such as the trading volume of a security and markets, the values of other similar securities, and news events with direct bearing
on a
|
HENNESSY FUNDS
|
1-800-966-4354
|
19
security or markets. Fair value pricing results in an estimated price for a security that reflects the amount the Fund might reasonably expect to receive in a current sale. Depending on the
relative significance of the valuation inputs, these securities may be classified in either Level 2 or Level 3 of the fair value hierarchy.
The fair value of foreign securities may be determined with the assistance of a pricing service using correlations between the movement of prices of such securities and indices
of domestic securities and other appropriate indicators, such as closing market prices of relevant American Depositary Receipts or futures contracts. Using fair value pricing means that the Fund’s NAV reflects the affected
portfolio securities’ values as determined by the Board or its designee, pursuant to the fair value pricing procedures adopted by the Board, instead of being determined by the market. Using a fair value pricing methodology
to price a foreign security may result in a value that is different from such foreign security’s most recent closing price and from the value used by other investment companies to calculate their NAVs. Such securities are
generally classified in Level 2 of the fair value hierarchy. Because the Fund invests in foreign securities, the value of the Fund’s portfolio securities may change on days when a shareholder is unable to purchase or redeem
Fund shares.
The Board has delegated day-to-day valuation matters to the Valuation and Liquidity Committee comprising representatives from Hennessy Advisors, Inc., the Fund’s investment
advisor (the “Advisor”). The function of the Valuation and Liquidity Committee, among other things, is to value securities where current and reliable market quotations are not readily available. All actions taken by the
Valuation and Liquidity Committee are reviewed by the Board.
The Fund has performed an analysis of all existing investments to determine the significance and character of all inputs to their fair value determinations. Various inputs are
used to determine the value of the Fund’s investments. The inputs or methodology used for valuing securities are not necessarily an indication of the risk associated with investing in those securities. Details related to the
fair value hierarchy of the Fund’s securities as of April 30, 2022, are included in the Schedule of Investments.
4). INVESTMENT TRANSACTIONS
Purchases and sales of investment securities (excluding government and short-term investments) for the Fund during the six months ended April 30, 2022, were $13,678,526 and $126,166,231,
respectively.
There were no purchases or sales/maturities of long-term U.S. government securities for the Fund during the six months ended April 30, 2022.
5). INVESTMENT ADVISORY FEE AND OTHER TRANSACTIONS WITH AFFILIATES
The Advisor provides the Fund with investment advisory services under an Investment Advisory Agreement. The Advisor oversees the provision of investment advice and furnishes office space,
facilities, and most of the personnel needed by the Fund. As compensation for its services, the Advisor is entitled to a monthly fee from the Fund. The fee is based on the average daily net assets of the Fund at an annual
rate of 0.80%. The net investment advisory fees expensed by the Fund during the six months ended April 30, 2022, are included in the Statement of Operations.
The Advisor has delegated the day-to-day management of the Fund to a sub-advisor, SPARX Asset Management Co., Ltd. The Advisor pays the sub-advisory fees from its own assets, and
these fees are not an additional expense of the Fund. During the six months ended April 30, 2022, the Advisor (not the Fund) paid a sub-advisory fee at the average rate of 0.36% of the daily net assets of the Fund. Pursuant
to the sub-advisory agreement,
|
WWW.HENNESSYFUNDS.COM
|
20
|
NOTES TO THE FINANCIAL STATEMENTS
|
the Advisor pays sub-advisory fees at the rate of 0.35% of the first $500 million of daily net assets, 0.40% of daily net assets between $500 million and $1 billion, and 0.42% of daily net assets
over $1 billion.
The Board has approved a Shareholder Servicing Agreement for Investor Class shares of the Fund, which compensates the Advisor for the non-investment advisory services it provides
to the Fund. The Shareholder Servicing Agreement provides for a monthly fee paid to the Advisor at an annual rate of 0.10% of the average daily net assets of the Fund attributable to Investor Class shares. The shareholder
service fees expensed by the Fund during the six months ended April 30, 2022, are included in the Statement of Operations.
The Fund has adopted a plan pursuant to Rule 12b-1 under the Investment Company Act of 1940, as amended, that authorizes payments in connection with the distribution of Fund
shares at an annual rate of up to 0.25% of the Fund’s average daily net assets attributable to Investor Class shares. Even though the authorized rate is up to 0.25%, the Fund is currently only using up to 0.15% of its
average daily net assets attributable to Investor Class shares for such purpose. Amounts paid under the plan may be spent on any activities or expenses primarily intended to result in the sale of shares, including, but not
limited to, advertising, shareholder account servicing, printing and mailing of prospectuses to other than current shareholders, printing and mailing of sales literature, and compensation for sales and marketing activities
or to financial institutions and others, such as dealers and distributors. The distribution fees expensed by the Fund during the six months ended April 30, 2022, are included in the Statement of Operations.
The Fund has entered into agreements with various brokers, dealers, and financial intermediaries in connection with the sale of Fund shares. The agreements provide for periodic
payments of sub-transfer agent expenses by the Fund to the brokers, dealers, and financial intermediaries for providing certain shareholder maintenance services. These shareholder services include the pre-processing and
quality control of new accounts, shareholder correspondence, answering customer inquiries regarding account status, and facilitating shareholder telephone transactions. The sub-transfer agent fees expensed by the Fund during
the six months ended April 30, 2022, are included in the Statement of Operations.
U.S. Bancorp Fund Services, LLC, d/b/a U.S. Bank Global Fund Services (“Fund Services”) provides the Fund with administrative, accounting, and transfer agent services. As
administrator, Fund Services is responsible for activities such as (i) preparing various federal and state regulatory filings, reports, and returns for the Fund, (ii) preparing reports and materials to be supplied to the
Board, (iii) monitoring the activities of the Fund’s custodian, transfer agent, and accountants, and (iv) coordinating the preparation and payment of the Fund’s expenses and reviewing the Fund’s expense accruals. U.S. Bank
N.A., an affiliate of Fund Services, serves as the Fund’s custodian. The servicing agreements between the Trust, Fund Services, and U.S. Bank N.A. contain a fee schedule that is inclusive of administrative, accounting,
custody, and transfer agent fees. The administrative, accounting, custody, and transfer agent fees expensed by the Fund during the six months ended April 30, 2022, are included in the Statement of Operations.
Quasar Distributors, LLC (“Quasar”), a wholly owned broker-dealer subsidiary of Foreside Financial Group, LLC, acts as the Fund’s principal underwriter in a continuous public
offering of Fund shares.
The officers of the Fund are affiliated with the Advisor. With the exception of the Chief Compliance Officer and the Senior Compliance Officer, such officers receive no
compensation from the Fund for serving in their respective roles. The Fund, along with the other funds in the Hennessy Funds family (collectively, the “Hennessy Funds”),
|
HENNESSY FUNDS
|
1-800-966-4354
|
21
makes reimbursement payments on an equal basis to the Advisor for a portion of the salary and benefits associated with the office of the Chief Compliance Officer and for all of the salary and
benefits associated with the office of the Senior Compliance Officer. The compliance fees expensed by the Fund during the six months ended April 30, 2022, are included in the Statement of Operations.
6). GUARANTEES AND INDEMNIFICATIONS
Under the Hennessy Funds’ organizational documents, their officers and trustees are indemnified by the Hennessy Funds against certain liabilities arising out of the performance of their duties to
the Hennessy Funds. Additionally, in the normal course of business, the Hennessy Funds enter into contracts with service providers that contain general indemnification clauses. The Fund’s maximum exposure under these
arrangements is unknown as this would involve future claims that may be made against the Fund that have not yet occurred. Currently, the Fund expects the risk of loss to be remote.
7). LINE OF CREDIT
The Fund has an uncommitted line of credit with the other Hennessy Funds in the amount of the lesser of (i) $100,000,000 or (ii) 33.33% of each Hennessy Fund’s net assets, or 30% for the Hennessy
Gas Utility Fund and 10% for the Hennessy Balanced Fund. The line of credit is intended to provide any necessary short-term financing in connection with shareholder redemptions, subject to certain restrictions. The credit
facility is with the Hennessy Funds’ custodian bank, U.S. Bank N.A. Borrowings under this arrangement bear interest at the bank’s prime rate and are secured by all of the Fund’s assets (as to its own borrowings only). During
the six months ended April 30, 2022, the Fund had an outstanding average daily balance and a weighted average interest rate of $719,696 and 3.47%, respectively. The interest expensed by the Fund during the six months ended
April 30, 2022, is included in the Statement of Operations. The maximum amount outstanding for the Fund during the period was $23,879,000. As of April 30, 2022, the Fund did not have any borrowings outstanding under the line
of credit.
8). FEDERAL TAX INFORMATION
As of October 31, 2021, the Fund’s most recent fiscal year end, the components of accumulated earnings (losses) for income tax purposes were as follows:
|
Investments
|
||||
|
Cost of investments for tax purposes
|
$
|
514,098,328
|
||
|
Gross tax unrealized appreciation
|
$
|
319,634,787
|
||
|
Gross tax unrealized depreciation
|
(23,480,253
|
)
|
||
|
Net tax unrealized appreciation/(depreciation)
|
$
|
296,154,534
|
||
|
Undistributed ordinary income
|
$
|
11,762,697
|
||
|
Undistributed long-term capital gains
|
—
|
|||
|
Total distributable earnings
|
$
|
11,762,697
|
||
|
Other accumulated gain/(loss)
|
$
|
(7,522,453
|
)
|
|
|
Total accumulated gain/(loss)
|
$
|
300,394,778
|
||
The difference between book-basis unrealized appreciation/depreciation and tax-basis unrealized appreciation/depreciation (as shown above) is attributable primarily to wash sales
and investments in passive foreign investment companies.
As of October 31, 2021, the Fund had $7,522,453 in unlimited short-term capital loss carryforwards. During fiscal year 2021, the capital losses utilized by the Fund were
$18,252,798.
|
WWW.HENNESSYFUNDS.COM
|
22
|
NOTES TO THE FINANCIAL STATEMENTS
|
Capital losses sustained in or after fiscal year 2012 can be carried forward indefinitely, but any such loss retains the character of the original loss and must be utilized prior
to any loss incurred before fiscal year 2012. As a result of this ordering rule, capital loss carryforwards incurred prior to fiscal year 2012 may be more likely to expire unused. Capital losses sustained prior to fiscal
year 2012 can be carried forward for eight years and can be carried forward as short-term capital losses regardless of the character of the original loss.
As of October 31, 2021, the Fund did not defer, on a tax basis, any late-year ordinary losses. Late-year ordinary losses are net ordinary losses incurred after December 31, 2020,
but within the taxable year, that are deemed to arise on the first day of the Fund’s next taxable year.
During fiscal year 2022 (year to date) and fiscal year 2021, the tax character of distributions paid by the Fund was as follows:
|
Six Months Ended
|
Year Ended
|
||||||||
|
April 30, 2022
|
October 31, 2021
|
||||||||
|
Ordinary income(1)
|
$
|
11,762,696
|
$
|
48,044
|
|||||
|
Long-term capital gains
|
—
|
—
|
|||||||
|
Total distributions
|
$
|
11,762,696
|
$
|
48,044
|
|||||
|
(1) Ordinary income includes short-term capital gains.
|
9). EVENTS SUBSEQUENT TO PERIOD END
Management has evaluated the Fund’s related events and transactions that occurred subsequent to April 30, 2022, through the date of issuance of the Fund’s financial statements. Management has
determined that there were no subsequent events requiring recognition or disclosure in the financial statements.
|
HENNESSY FUNDS
|
1-800-966-4354
|
23
Expense Example (Unaudited)
April 30, 2022
As a shareholder of the Fund, you incur ongoing costs, including management fees, service fees, and other Fund expenses. This Example is intended to help you understand your ongoing costs (in
dollars) of investing in the Fund and to compare these costs with the ongoing costs of investing in other mutual funds. The Example is based on an investment of $1,000 invested at the beginning of the period and held for the
entire period from November 1, 2021, through April 30, 2022.
Actual Expenses
In the table below, the first line under each of the “Investor Class” and “Institutional Class” headings provides information about actual account values and actual expenses for each share class.
You may use this information, together with the amount you invested, to estimate the expenses that you paid over the period. Simply divide your account value by $1,000 (for example, an $8,600 account value divided by $1,000
= 8.6), then multiply the result by the number in the first line under the heading “Expenses Paid During Period” to estimate the expenses you paid on your account during this period. Although the Fund charges no sales loads
or transaction fees, you will be assessed fees for outgoing wire transfers, returned checks, and stop payment orders at prevailing rates charged by U.S. Bank Global Fund Services, the Fund’s transfer agent. If you request
that a redemption be made by wire transfer, the Fund’s transfer agent charges a $15 fee. IRAs are charged a $15 annual maintenance fee (up to $30 maximum per shareholder for shareholders with multiple IRAs). The examples
below include, but are not limited to, management, shareholder servicing, accounting, custody, and transfer agent fees. However, the examples below do not include portfolio trading commissions and related expenses.
Hypothetical Example for Comparison Purposes
In the table below, the second line under each of the “Investor Class” and “Institutional Class” headings provides information about hypothetical account values and hypothetical expenses based on
the Fund’s actual expense ratio for each share class and an assumed rate of return of 5% per year before expenses, which is not the Fund’s actual return for such share class. The hypothetical account values and expenses may
not be used to estimate the actual ending account balance or expenses you paid for the period. You may use this information to compare the ongoing costs of investing in the Fund and other funds. To do so, compare these 5%
hypothetical examples with the 5% hypothetical examples that appear in the shareholder reports of the other funds. Please note that the expenses shown in the table are meant to highlight your ongoing costs only. Therefore,
the second lines under “Investor Class” and “Institutional Class” are useful in comparing ongoing costs only and will not help you determine the relative total costs of owning different funds.
|
WWW.HENNESSYFUNDS.COM
|
24
|
EXPENSE EXAMPLE
|
|
Beginning
|
Ending
|
||
|
Account Value
|
Account Value
|
Expenses Paid
|
|
|
November 1, 2021
|
April 30, 2022
|
During Period(1)
|
|
|
Investor Class
|
|||
|
Actual
|
$1,000.00
|
$ 694.50
|
$6.05
|
|
Hypothetical (5% return before expenses)
|
$1,000.00
|
$1,017.65
|
$7.20
|
|
Institutional Class
|
|||
|
Actual
|
$1,000.00
|
$ 696.10
|
$4.29
|
|
Hypothetical (5% return before expenses)
|
$1,000.00
|
$1,019.74
|
$5.11
|
|
(1)
|
Expenses are equal to the Fund’s annualized expense ratio of 1.44% for Investor Class shares or 1.02% for Institutional Class shares, as applicable, multiplied by the average account value
over the period, multiplied by 181/365 days (to reflect the half-year period).
|
|
HENNESSY FUNDS
|
1-800-966-4354
|
25
How to Obtain a Copy of the Fund’s Proxy
Voting Policy and Proxy Voting Records
A description of the policies and procedures the Fund uses to determine how to vote proxies relating to portfolio securities is available without charge (1) by calling 800-966-4354, (2) on the
Hennessy Funds’ website at www.hennessyfunds.com/proxy-voting/voting-policy, or (3) on the U.S. Securities and Exchange Commission’s (the “SEC”) website at www.sec.gov. The Fund’s proxy voting record is available without
charge on both the Hennessy Funds’ website at www.hennessyfunds.com/proxy-voting/voting-record and the SEC’s website at www.sec.gov no later than August 31 for the prior 12 months ending June 30.
Availability of Quarterly Portfolio Schedule
The Fund files its complete schedule of portfolio holdings with the SEC for the first and third quarters of each fiscal year as an exhibit to its reports on Form N-PORT. The Fund’s Form N-PORT
reports are available on the SEC’s website at www.sec.gov or on request by calling 800-966-4354.
Federal Tax Distribution Information (Unaudited)
For fiscal year 2021, certain dividends paid by the Fund may be subject to a maximum tax rate of 23.8%, as provided for by the Jobs and Growth Tax Relief Reconciliation Act of 2003. The percentage
of dividends declared from ordinary income designated as qualified dividend income was 69.62%.
For corporate shareholders, the percent of ordinary income distributions that qualified for the corporate dividends received deduction for fiscal year 2021 was 0.00%.
The percentage of taxable ordinary income distributions that were designated as short-term capital gain distributions under Section 871(k)(2)(C) of the Internal Revenue Code of
1986, as amended, for the Fund was 0.00%.
For the year ended October 31, 2021, the Fund earned foreign-source income and paid foreign taxes as noted below, which it intends to pass through to its shareholders pursuant to
Section 853 of the Internal Revenue Code.
|
Country
|
Gross Foreign Income
|
Foreign Tax Paid
|
||
|
Japan
|
$9,097,931
|
$909,789
|
Important Notice Regarding Delivery of
Shareholder Documents
To help keep the Fund’s costs as low as possible, we generally deliver a single copy of shareholder reports, proxy statements, and prospectuses to shareholders who share an address and have the
same last name. This process does not apply to account statements. You may request an individual copy of a shareholder document at any time. If you would like to receive separate mailings of shareholder documents, please
call U.S. Bank Global Fund Services at 800-261-6950 or 414-765-4124, and individual delivery will begin within 30 days of your request. If your account is held through a financial institution or other intermediary, please
contact such intermediary directly to request individual delivery.
|
WWW.HENNESSYFUNDS.COM
|
26
|
PROXY VOTING — ELECTRONIC DELIVERY
|
Electronic Delivery
As permitted by SEC regulations, the Fund’s shareholder reports are made available on a website, and unless you sign up for eDelivery or elect to receive paper copies as detailed below, you will be
notified each time a report is posted and provided with a website link to access the report.
The Fund also offers shareholders the option to receive all notices, account statements, prospectuses, tax forms, and shareholder reports electronically. To sign up for eDelivery
or change your delivery preference, please visit www.hennessyfunds.com/account.
To elect to receive paper copies of all future reports free of charge, please call U.S. Bank Global Fund Services at 800-261-6950 or 414-765-4124.
Subscribe to receive our team’s unique market and sector insights delivered to your inbox
www.hennessyfunds.com/subscribe
Follow us on social media
| |
|
|
HENNESSY FUNDS
|
1-800-966-4354
|
27
Board Approval of Investment Advisory
Agreements
At its meeting on March 11, 2022, the Board of Trustees of the Fund (the “Board,” and the members thereof, the “Trustees”) unanimously approved the continuation of the investment advisory agreement
of the Fund with Hennessy Advisors, Inc. (the “Advisor”) and the sub-advisory agreement for the Fund between the Advisor and SPARX Asset Management Co., Ltd. (the “Sub-Advisor”). As part of the process, the Trustees reviewed
their fiduciary duties and the relevant factors for them to consider with respect to approving the advisory and sub-advisory agreements. In addition, the Trustees who are not deemed “interested persons” (as defined by the
Investment Company Act of 1940, as amended) of the Fund (the “Independent Trustees”) met in executive session to discuss the approval of the advisory and sub-advisory agreements. As part of their discussion, the Independent
Trustees confirmed their understanding of the need to have asked about, and received answers to, any matters that they believed are relevant to determining whether to approve the continuation of the advisory and sub-advisory
agreements.
In advance of the meeting, the Advisor sent detailed information to the Trustees to assist them in their evaluation of the advisory and sub-advisory agreements. This information
included, but was not limited to, the following:
|
(1)
|
A memorandum from outside legal counsel that described the fiduciary duties of the Board with respect to approving the continuation of the advisory and sub-advisory agreements and the
relevant factors for consideration;
|
|
|
(2)
|
A memorandum from the Advisor that listed the factors relevant to the Board’s approval of the continuation of the advisory and sub-advisory agreements and also referenced the documents that
had been provided to help the Board assess each such factor;
|
|
|
(3)
|
The Advisor’s financial statements from its most recent Form 10-K and Form 10-Q;
|
|
|
(4)
|
Summaries of the advisory and sub-advisory agreements;
|
|
|
(5)
|
A recent Fund fact sheet, which included, among other things, Fund performance over various periods;
|
|
|
(6)
|
A description of the range of services provided by the Advisor and the Sub-Advisor and the distinction between the Advisor-provided services and the Sub-Advisor-provided services;
|
|
|
(7)
|
A peer expense comparison of the net expense ratio and investment advisory fee of the Fund;
|
|
|
(8)
|
A memorandum from the Advisor regarding economies of scale;
|
|
|
(9)
|
A completed questionnaire from the Sub-Advisor;
|
|
|
(10)
|
A summary of the Sub-Advisor’s responses to the questionnaire, as well as relevant information from the Sub-Advisor’s Form ADVs Parts 1 and 2 and the certifications submitted by the
Sub-Advisor each quarter;
|
|
|
(11)
|
Financial information of the Sub-Advisor and its parent company; and
|
|
|
(12)
|
The Sub-Advisor’s Code of Ethics.
|
The Trustees reviewed and discussed all of the information provided by the Advisor and the Sub-Advisor. Following this review, and further discussion with the Advisor, the
Trustees concluded that the information provided before and at the meeting addressed all
|
WWW.HENNESSYFUNDS.COM
|
28
|
BOARD APPROVAL OF INVESTMENT ADVISORY AGREEMENTS
|
of the relevant matters that they wanted to consider in assessing the performance of the Funds and the performance of the Advisor and the Sub-Advisor under the advisory and sub-advisory agreements,
and that said information provided them with a fulsome understanding of the advisory and sub-advisory agreements and the services provided by the Advisor and the Sub-Advisor.
All of the factors discussed were considered as a whole by the Trustees, as well as by the Independent Trustees meeting in executive session. The Trustees viewed the relevant
factors in their totality, with no single factor being the principal or determinative factor in the Trustees’ determination of whether to approve the continuation of the advisory and sub-advisory agreements. The Trustees
recognized that the management and fee arrangements for the Fund are the result of years of review and discussion between the Independent Trustees and the Advisor, that certain aspects of such arrangements may receive
greater scrutiny in some years than in others, and that the Trustees’ conclusions may be based, in part, on their consideration of these same arrangements and information received during the course of the year and in prior
years.
Prior to approving the continuation of the advisory and sub-advisory agreements, the Trustees, including the Independent Trustees in executive session, considered, among other
items:
|
(1)
|
The nature and quality of the advisory services provided by the Advisor and the Sub-Advisor;
|
|
|
(2)
|
A comparison of the fees and expenses of the Fund to other similar funds;
|
|
|
(3)
|
Whether economies of scale are recognized by the Fund;
|
|
|
(4)
|
The costs and profitability of the Fund to the Advisor and the Sub-Advisor;
|
|
|
(5)
|
The performance of the Fund; and
|
|
|
(6)
|
Any benefits to the Advisor and the Sub-Advisor from serving as an investment advisor to the Fund (other than the advisory and sub-advisory fees).
|
The material considerations and determinations of the Trustees, including the Independent Trustees, were as follows:
|
(1)
|
The Trustees considered the services identified below that are provided by the Advisor. Based on this review and an assessment of the Advisor’s performance, the Trustees concluded that the
Advisor provides high-quality services to the Fund, and they noted that their overall confidence in the Advisor was high. The Trustees also concluded that they were satisfied with the nature, extent, and quality of
the advisory services provided to the Fund by the Advisor and that the nature and extent of the services provided by the Advisor were appropriate to assure that the Fund’s operations are conducted in compliance with
applicable laws, rules, and regulations.
|
|
(a)
|
The Advisor oversees the Sub-Advisor for the Fund, and the Sub-Advisor acts as the portfolio manager for the Fund by providing portfolio management services.
|
||
|
(b)
|
The Advisor performs a daily reconciliation of portfolio positions and cash for the Fund.
|
||
|
(c)
|
The Advisor monitors the liquidity of each Fund.
|
||
|
(d)
|
The Advisor monitors the Fund’s compliance with its investment objectives and restrictions and federal securities laws.
|
|
HENNESSY FUNDS
|
1-800-966-4354
|
29
|
(e)
|
The Advisor maintains a compliance program (including a code of ethics), conducts ongoing reviews of the compliance programs of the Sub-Advisor and the Fund’s other service providers
(including their codes of ethics, as appropriate), conducts on-site visits to the Sub-Advisor and the Fund’s other service providers, as feasible, monitors incidents of abusive trading practices, reviews Fund expense
accruals, payments, and fixed expense ratios, evaluates insurance providers for fidelity bond, D&O/E&O insurance, and cybersecurity insurance coverage, manages regulatory examination compliance and responses,
conducts employee compliance training, reviews reports provided by service providers, and maintains books and records.
|
||
|
(f)
|
The Advisor oversees the selection and continued employment of the Sub-Advisor, reviews the Fund’s investment performance, and monitors the Sub-Advisor’s adherence to the Fund’s investment
objectives, policies, and restrictions.
|
||
|
(g)
|
The Advisor oversees service providers that provide accounting, administration, distribution, transfer agency, custodial, sales, marketing, public relations, audit, information technology,
and legal services to the Fund.
|
||
|
(h)
|
The Advisor maintains in-house marketing and distribution departments on behalf of the Fund.
|
||
|
(i)
|
The Advisor prepares or directs the preparation of all regulatory filings for the Fund, including writing and annually updating the Fund’s prospectus and related documents.
|
||
|
(j)
|
For each annual report of the Fund, the Advisor reviews the written summary prepared by the Sub-Advisor of the Fund’s performance during the most recent 12-month period.
|
||
|
(k)
|
The Advisor oversees distribution of the Fund through third-party broker/dealers and independent financial institutions such as Charles Schwab, Inc., Fidelity, TD Ameritrade, and Pershing.
The Advisor participates in “no transaction fee” (“NTF”) programs with these companies on behalf of the Fund, which allow customers to purchase the Fund through third-party distribution channels without paying a
transaction fee. The Advisor compensates, in part, a number of these third-party providers of NTF programs out of its own revenues.
|
||
|
(l)
|
The Advisor pays the incentive compensation of the Fund’s compliance officers and employs other staff, such as legal, marketing, national accounts, distribution, sales, administrative, and
trading oversight personnel, as well as management executives.
|
||
|
(m)
|
The Advisor provides a quarterly compliance certification to the Board.
|
||
|
(n)
|
The Advisor prepares or reviews all Board materials, presents to and leads discussions with the Board, prepares or reviews all meeting minutes, and arranges for Board training and
education.
|
|
(2)
|
The Trustees considered the services identified below that are provided by the Sub-Advisor. Based on this review and an assessment of the Sub-Advisor’s performance, the Trustees concluded
that the Sub-Advisor provides high-quality services to the Fund. The Trustees also concluded that they were satisfied with
|
|
WWW.HENNESSYFUNDS.COM
|
30
|
BOARD APPROVAL OF INVESTMENT ADVISORY AGREEMENTS
|
|
the nature, extent, and quality of the advisory services provided to the Fund by the Sub-Advisor and that the nature and extent of the services provided by the Sub-Advisor were appropriate
to assure that the Fund’s portfolio aligns properly with its investment objective and principal investment strategies.
|
|
(a)
|
The Sub-Advisor acts as the portfolio manager for the Fund. In this capacity, the Sub-Advisor does the following:
|
|
(i)
|
manages the composition of the Fund’s portfolio, including the purchase, retention, and disposition of portfolio securities in accordance with the Fund’s investment objectives, policies,
and restrictions;
|
|||
|
(ii)
|
seeks best execution for the Fund’s portfolio; and
|
|||
|
(iii)
|
manages proxy voting for the Fund.
|
|
(b)
|
The Sub-Advisor ensures that its compliance program includes policies and procedures relevant to the Fund and the Sub-Advisor’s duties as a portfolio manager to the Fund.
|
||
|
(c)
|
For each annual report of the Fund, the Sub-Advisor prepares a written summary of the Fund’s performance during the most recent 12-month period.
|
||
|
(d)
|
The Sub-Advisor provides a quarterly compliance certification to the Board regarding trading and allocation practices, supervisory matters, the Sub-Advisor’s compliance program (including
its code of ethics), compliance with the Fund’s policies, and general firm updates.
|
|
(3)
|
Trustees considered the distinction between the services performed by the Advisor and the Sub-Advisor. The Trustees noted that the management of the Fund, including the oversight of the
Sub-Advisor, involves more comprehensive and substantive duties than the duties of the Sub-Advisor. Specifically, the Trustees considered the lists of Advisor services previously identified and concluded that the
services performed by the Advisor for the Fund require a higher level of service and oversight than the services performed by the Sub-Advisor. Based on this determination, the Trustees concluded that the differential
in advisory fees between the Advisor and the Sub-Advisor is reasonable.
|
|
|
(4)
|
The Trustees compared the performance of the Fund to benchmark indices over various periods and noted that the Trustees review and discuss reports comparing the investment performance of
the Fund to various indices at each quarterly Board meeting. Based on such information, the Trustees determined that the Advisor and the Sub-Advisor manage the Fund in a manner materially consistent with its stated
investment objective and style. The Trustees concluded that the performance of the Fund over various periods warranted the continuation of the advisory and sub-advisory agreements.
|
|
|
(5)
|
The Trustees reviewed the advisory fees and overall expense ratios of the Fund compared to other funds similar in asset size and investment objective to the Fund using data from
Morningstar. As part of the discussion with management, the Trustees ensured that they understood and were comfortable with the criteria used to determine the mutual funds included in the Morningstar categories for
purposes of the materials considered at the meeting. The Trustees determined that the advisory fee and overall expense ratio of the Fund falls within a reasonable range of the advisory fees and overall expense ratios
of other comparable funds and concluded that they are reasonable and warranted continuation of the advisory and sub-advisory agreements.
|
|
HENNESSY FUNDS
|
1-800-966-4354
|
31
|
(6)
|
The Trustees also considered whether the Advisor was realizing economies of scale that should be shared with the Fund’s shareholders. The Trustees noted that the majority of expenses
incurred to manage the Fund are variable asset-based fees, so the Advisor does not realize material economies of scale relating to these expenses as the assets of the Fund increase. For example, third-party platform
fees and sub-advisory fees increase as the Fund’s assets grow.
|
|
|
(7)
|
The Trustees considered the profitability of the Advisor and the Sub-Advisor, including the impact of mutual fund platform fees on the Advisor’s profitability, and also considered the
resources and revenues that the Advisor has put into managing and distributing the Fund. The Trustees then concluded that the profits of the Advisor and the Sub-Advisor are reasonable and not excessive when compared
to profitability guidelines set forth in relevant court cases.
|
|
|
(8)
|
The Trustees considered the high level of professionalism and knowledge of the Advisor’s employees and concluded that this was beneficial to the Fund and its shareholders.
|
|
|
(9)
|
The Trustees considered any benefits to the Advisor and the Sub-Advisor from serving as an advisor to the Fund (other than the advisory and sub-advisory fees). The Trustees noted that the
Advisor and the Sub-Advisor may derive ancillary benefits from, by way of example, their association with the Fund in the form of proprietary and third-party research products and services received from
broker-dealers that execute portfolio trades for the Fund. The Trustees determined that any such products and services have been used for legitimate purposes relating to the Fund by providing assistance in the
investment decision-making process. The Trustees concluded that any additional benefits realized by the Advisor and the Sub-Advisor from their relationship with the Fund were reasonable, which was based on, among
other things, the Trustees’ findings that (i) the research, analytical, statistical, and other information and services provided by brokers are merely supplemental to the Advisor’s and the Sub-Advisor’s own efforts
in the performance of their duties under the advisory and sub-advisory agreements and (ii) although the Sub-Advisor could derive benefits from the conversion of Fund shareholders into separate account clients, the
Fund also could benefit from potential institutional shareholders who might choose to invest in the Fund.
|
After reviewing the materials and information provided at the meeting, as well as other information regularly provided at the Board’s quarterly meetings throughout the year
regarding the quality of services provided by the Advisor and the Sub-Advisor, the performance of the Fund, expense information, brokerage commissions information, the adequacy and efficacy of the Advisor’s and the
Sub-Advisor’s written policies and procedures, other regulatory compliance issues, trading information and related matters, and other factors that the Trustees deemed relevant, the Trustees, including the Independent
Trustees, approved the continuation of the advisory and sub-advisory agreements.
|
WWW.HENNESSYFUNDS.COM
|
32
|
BOARD APPROVAL OF INVESTMENT ADVISORY AGREEMENTS
|
(This Page Intentionally Left Blank.)
For information, questions, or assistance, please call
The Hennessy Funds
800-966-4354 or 415-899-1555
INVESTMENT ADVISOR
Hennessy Advisors, Inc.
7250 Redwood Boulevard, Suite 200
Novato, California 94945
ADMINISTRATOR,
TRANSFER AGENT,
DIVIDEND PAYING AGENT, &
SHAREHOLDER SERVICING AGENT
U.S. Bancorp Fund Services, LLC
d/b/a U.S. Bank Global Fund Services
P.O. Box 701
Milwaukee, Wisconsin 53201-0701
CUSTODIAN
U.S. Bank N.A.
Custody Operations
1555 North River Center Drive, Suite 302
Milwaukee, Wisconsin 53212
TRUSTEES
Neil J. Hennessy
J. Dennis DeSousa
Robert T. Doyle
Claire Garvie
Gerald P. Richardson
COUNSEL
Foley & Lardner LLP
777 East Wisconsin Avenue
Milwaukee, Wisconsin 53202-5306
INDEPENDENT REGISTERED
PUBLIC ACCOUNTING FIRM
Tait, Weller & Baker LLP
Two Liberty Place
50 South 16th Street, Suite 2900
Philadelphia, Pennsylvania 19102-2529
DISTRIBUTOR
Quasar Distributors, LLC
111 East Kilbourn Avenue, Suite 1250
Milwaukee, Wisconsin 53202
www.hennessyfunds.com | 800-966-4354
This report has been prepared for shareholders and may be distributed to
others only if preceded or accompanied by a current prospectus.
SEMI-ANNUAL REPORT
APRIL 30, 2022

HENNESSY JAPAN SMALL CAP FUND
Investor Class HJPSX
Institutional Class HJSIX
www.hennessyfunds.com | 1-800-966-4354
(This Page Intentionally Left Blank.)
Contents
|
Letter to Shareholders
|
2
|
|
Performance Overview
|
4
|
|
Financial Statements
|
|
|
Schedule of Investments
|
5
|
|
Statement of Assets and Liabilities
|
10
|
|
Statement of Operations
|
11
|
|
Statements of Changes in Net Assets
|
13
|
|
Financial Highlights
|
14
|
|
Notes to the Financial Statements
|
18
|
|
Expense Example
|
26
|
|
Proxy Voting Policy and Proxy Voting Records
|
28
|
|
Availability of Quarterly Portfolio Schedule
|
28
|
|
Federal Tax Distribution Information
|
28
|
|
Important Notice Regarding Delivery of Shareholder Documents
|
28
|
|
Electronic Delivery
|
29
|
|
Board Approval of Investment Advisory Agreements
|
29
|
|
HENNESSY FUNDS
|
1-800-966-4354
|
May 2022
Dear Hennessy Funds Shareholder:
The Japanese stock market lost -16.29% in U.S. dollar terms as measured by the Tokyo Stock Price Index (TOPIX) over the six months ended April 30, 2022.
The Japanese stock market declined mainly within the manufacturing sector, including high-tech stocks with high-growth expectations. This decline was due to uncertainty over
the armed conflict in Ukraine and a sharp rise in long-term U.S. interest rates as the Federal Reserve’s aggressive monetary tightening stance became clear. Since mid-March, the Japanese yen weakened against the U.S.
dollar, fueling a phase of solid performance mainly in export-related stocks. However, the prolonged lockdown in Chinese cities and other factors caused concern, limiting the upward momentum.
We are again witnessing a growth-to-value rotation on the back of rising bond yields around the world. Value stocks marched higher despite their lack of growth appeal. In
theory, higher interest rates should result in price corrections of all equities regardless of whether they are long-duration stocks (growth names) or short-duration stocks (value names). But in reality, it is completely
reasonable that some stocks get re-rated, perhaps driven by mean-reversion effects. After many years of anemic growth, the P/E ratios of these companies were depressed, so for their valuation levels to moderately recover
is not surprising. So far, we have seen this take place with Japanese banks’ P/B ratios rising to 0.5x from 0.3x recently. For Toyota Motor Corporation, the largest index constituent, its P/E ratio has climbed to 11x from
9x.
The depreciation of the Japanese yen should be a major plus for companies with global operations. One thing to note here is that many of these companies are not marginal
exporters who can only thrive under a weak domestic currency; to the contrary, they are market leaders in their respective fields with competitive profit margins and strong pricing power so the currency tailwind is purely
an added bonus for their fundamentals.
Thank you for your continued confidence and investment in the Hennessy Funds.
Sincerely,
|
|
|
Tadahiro Fujimura
|
Masakazu Takeda
|
|
Portfolio Manager,
|
Portfolio Manager,
|
|
Hennessy Japan Small Cap Fund;
|
Hennessy Japan Fund;
|
|
Chief Investment Officer
|
Fund Manager
|
|
SPARX Asset Management Co., Ltd.
|
SPARX Asset Management Co., Ltd.
|
SPARX Asset Management Co., Ltd., located in Tokyo, Japan, is the sub-advisor to the Hennessy Japan Fund and the Hennessy Japan Small Cap Fund.
|
WWW.HENNESSYFUNDS.COM
|
2
|
LETTER TO SHAREHOLDERS
|
Past performance does not guarantee future results.
Mutual fund investing involves risk. Principal loss is possible.
Opinions expressed are those of Tadahiro Fujimura and Masakazu Takeda and are subject to change, are not guaranteed, and should not be considered investment advice.
Fund holdings and sector allocations are subject to change. A non-diversified fund, which may concentrate its assets in fewer individual holdings than a diversified fund, is more exposed to
individual stock volatility than a diversified fund. A fund that concentrates its investments within one country, one sector, or a small group of industries, such as Japan, may be subject to a higher degree of market risk.
P/E, or price-to-earnings ratio, is a valuation measure calculated by dividing a company’s market price per share by its earnings per share. P/B, or price-to-book ration, is a valuation measure
calculated by dividing a company’s market price per share by its book value per share.
The Tokyo Stock Price Index (TOPIX) is a capitalization-weighted index of all of the companies listed on the First Section of the Tokyo Stock Exchange. The index is used herein for comparative
purposes in accordance with SEC regulations. One cannot invest directly in an index.
Please refer to the Schedule of Investments included in this report for additional portfolio information.
|
HENNESSY FUNDS
|
1-800-966-4354
|
3
Performance Overview (Unaudited)
AVERAGE ANNUAL TOTAL RETURN FOR PERIODS ENDED APRIL 30, 2022
|
Six
|
One
|
Five
|
Ten
|
|
|
Months(1)
|
Year
|
Years
|
Years
|
|
|
Hennessy Japan Small Cap Fund –
|
||||
|
Investor Class (HJPSX)
|
-22.97%
|
-21.14%
|
3.60%
|
9.45%
|
|
Hennessy Japan Small Cap Fund –
|
||||
|
Institutional Class (HJSIX)(2)
|
-22.83%
|
-20.84%
|
4.01%
|
9.72%
|
|
Russell/Nomura Small CapTM Index
|
-19.49%
|
-19.13%
|
0.64%
|
5.76%
|
|
Tokyo Stock Price Index (TOPIX)
|
-16.29%
|
-14.60%
|
3.42%
|
6.07%
|
Expense ratios: 1.53% (Investor Class); 1.13% (Institutional Class)
|
(1)
|
Periods of less than one year are not annualized.
|
|
(2)
|
The inception date of Institutional Class shares is June 15, 2015. Performance shown prior to the inception of Institutional Class shares reflects the performance of Investor Class shares
and includes expenses that are not applicable to, and are higher than, those of Institutional Class shares.
|
_______________
Performance data quoted represents past performance; past performance does not guarantee future results. The investment return and principal value of an investment will
fluctuate so that an investor’s shares, when redeemed, may be worth more or less than their original cost. The performance table does not reflect the deduction of taxes that a shareholder would pay on Fund distributions or
the redemption of Fund shares. Current performance of the Fund may be lower or higher than the performance quoted. Performance data current to the most recent month end may be obtained by visiting www.hennessyfunds.com.
The Russell/Nomura Small Cap™ Index contains the bottom 15% of the Russell/Nomura Total Market™ Index based on market capitalization. The Tokyo Stock Price Index (TOPIX) is a capitalization-weighted index of all of the companies listed on
the First Section of the Tokyo Stock Exchange. One cannot invest directly in an index. These indices are used for comparative purposes in accordance with Securities and Exchange Commission regulations.
Frank Russell Company (“Russell”) is the source and owner of the trademarks, service marks, and copyrights related to the Russell Indexes. Russell® is a trademark of Frank Russell Company. Neither Russell nor its licensors accept any liability for any errors or omissions in the Russell Indexes or Russell ratings or
underlying data and no party may rely on any Russell Indexes or Russell ratings or underlying data contained in this communication. No further distribution of Russell data is permitted without Russell’s express written
consent. Russell does not promote, sponsor, or endorse the content of this communication.
The expense ratios presented are from the most recent prospectus. The expense ratios for the current reporting period are available in the Financial Highlights section of this report.
|
WWW.HENNESSYFUNDS.COM
|
4
|
PERFORMANCE OVERVIEW/SCHEDULE OF INVESTMENTS
|
Financial Statements
|
Schedule of Investments as of April 30, 2022 (Unaudited)
|
HENNESSY JAPAN SMALL CAP FUND
(% of Net Assets)
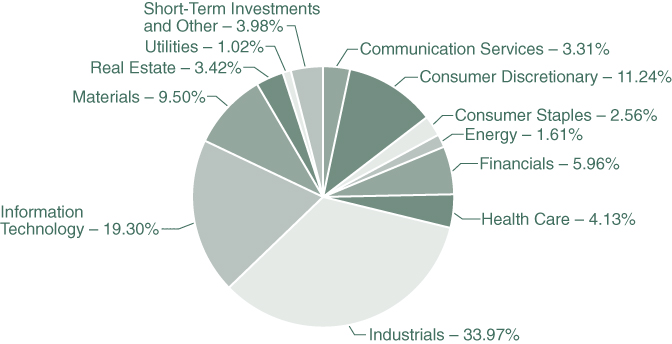
|
TOP TEN HOLDINGS (EXCLUDING MONEY MARKET FUNDS)
|
% NET ASSETS
|
|
TRE Holdings Corp.
|
2.12%
|
|
Creek & River Co., Ltd.
|
2.11%
|
|
BIPROGY, Inc.
|
2.08%
|
|
Ship Healthcare Holdings, Inc.
|
2.07%
|
|
MIRAIT Holdings Corp.
|
2.06%
|
|
Nihon Kohden Corp.
|
2.06%
|
|
SBS Holdings, Inc.
|
2.05%
|
|
Elecom Co., Ltd.
|
1.99%
|
|
Kito Corp.
|
1.99%
|
|
Transcosmos, Inc.
|
1.99%
|
Note: For presentation purposes, the Fund has grouped some of the industry categories. For purposes of categorizing securities for compliance with Section 8(b)(1) of the Investment Company Act of
1940, as amended, the Fund uses more specific industry classifications.
The Global Industry Classification Standard (GICS®) was developed by and is the exclusive property and a service
mark of MSCI, Inc. and Standard & Poor’s Financial Services LLC. It has been licensed for use by the Hennessy Funds.
|
HENNESSY FUNDS
|
1-800-966-4354
|
5
|
COMMON STOCKS – 96.02%
|
Number
|
% of
|
||||||||||
|
|
of Shares
|
Value
|
Net Assets
|
|||||||||
|
Communication Services – 3.31%
|
||||||||||||
|
Macromill, Inc.
|
122,600
|
$
|
1,127,573
|
1.52
|
%
|
|||||||
|
Septeni Holdings Co., Ltd.
|
261,200
|
1,322,203
|
1.79
|
%
|
||||||||
|
|
2,449,776
|
3.31
|
%
|
|||||||||
|
Consumer Discretionary – 11.24%
|
||||||||||||
|
Benesse Holdings, Inc.
|
75,000
|
1,312,267
|
1.77
|
%
|
||||||||
|
Matsuoka Corp.
|
57,900
|
488,154
|
0.66
|
%
|
||||||||
|
Musashi Seimitsu Industry Co., Ltd.
|
112,700
|
1,145,320
|
1.55
|
%
|
||||||||
|
NGK Spark Plug Co., Ltd.
|
88,100
|
1,351,914
|
1.83
|
%
|
||||||||
|
Nojima Corp.
|
60,500
|
1,216,803
|
1.64
|
%
|
||||||||
|
Sac’s Bar Holdings, Inc.
|
234,100
|
909,108
|
1.23
|
%
|
||||||||
|
Saizeriya Co., Ltd.
|
40,400
|
740,927
|
1.00
|
%
|
||||||||
|
Seiren Co., Ltd.
|
72,700
|
1,152,251
|
1.56
|
%
|
||||||||
|
|
8,316,744
|
11.24
|
%
|
|||||||||
|
Consumer Staples – 2.56%
|
||||||||||||
|
Nishimoto Co., Ltd.
|
65,600
|
1,408,943
|
1.90
|
%
|
||||||||
|
Yoshimura Food Holdings KK (a)
|
118,900
|
489,908
|
0.66
|
%
|
||||||||
|
|
1,898,851
|
2.56
|
%
|
|||||||||
|
Energy – 1.61%
|
||||||||||||
|
Iwatani Corp.
|
29,900
|
1,189,626
|
1.61
|
%
|
||||||||
|
Financials – 5.96%
|
||||||||||||
|
AEON Financial Service Co., Ltd.
|
110,500
|
1,015,871
|
1.37
|
%
|
||||||||
|
Aruhi Corp.
|
130,900
|
1,007,466
|
1.36
|
%
|
||||||||
|
Lifenet Insurance Co. (a)
|
228,200
|
923,792
|
1.25
|
%
|
||||||||
|
Musashino Bank Ltd.
|
107,000
|
1,463,574
|
1.98
|
%
|
||||||||
|
|
4,410,703
|
5.96
|
%
|
|||||||||
|
Health Care – 4.13%
|
||||||||||||
|
Nihon Kohden Corp.
|
63,400
|
1,521,988
|
2.06
|
%
|
||||||||
|
Ship Healthcare Holdings, Inc.
|
91,800
|
1,533,421
|
2.07
|
%
|
||||||||
|
|
3,055,409
|
4.13
|
%
|
|||||||||
|
Industrials – 33.97%
|
||||||||||||
|
Benefit One, Inc.
|
47,700
|
723,248
|
0.98
|
%
|
||||||||
|
Creek & River Co., Ltd.
|
96,800
|
1,562,598
|
2.11
|
%
|
||||||||
|
Daihen Corp.
|
28,100
|
803,868
|
1.08
|
%
|
||||||||
|
Fugi Corp.
|
58,800
|
981,051
|
1.32
|
%
|
||||||||
The accompanying notes are an integral part of these financial statements.
|
WWW.HENNESSYFUNDS.COM
|
6
|
SCHEDULE OF INVESTMENTS
|
|
COMMON STOCKS
|
Number
|
% of
|
||||||||||
|
|
of Shares
|
Value
|
Net Assets
|
|||||||||
|
Industrials (Continued)
|
||||||||||||
|
Glory Ltd.
|
52,400
|
$
|
842,852
|
1.14
|
%
|
|||||||
|
Hanwa Co., Ltd.
|
54,100
|
1,322,398
|
1.79
|
%
|
||||||||
|
Hito Communications Holdings, Inc.
|
116,000
|
1,383,144
|
1.87
|
%
|
||||||||
|
Kawada Technologies, Inc.
|
17,500
|
480,010
|
0.65
|
%
|
||||||||
|
Kito Corp.
|
113,400
|
1,472,891
|
1.99
|
%
|
||||||||
|
MIRAIT Holdings Corp.
|
108,600
|
1,521,881
|
2.06
|
%
|
||||||||
|
Mitsubishi Logisnext Co., Ltd.
|
112,400
|
659,516
|
0.89
|
%
|
||||||||
|
Nichiha Corp.
|
60,700
|
1,097,434
|
1.48
|
%
|
||||||||
|
Nihon Flush Co., Ltd.
|
13,700
|
101,282
|
0.14
|
%
|
||||||||
|
Nippon Koei Co., Ltd.
|
64,900
|
1,448,654
|
1.96
|
%
|
||||||||
|
Sato Holdings Corp.
|
96,600
|
1,328,263
|
1.79
|
%
|
||||||||
|
SBS Holdings, Inc.
|
65,400
|
1,517,583
|
2.05
|
%
|
||||||||
|
Senko Group Holdings Co., Ltd.
|
55,100
|
372,635
|
0.50
|
%
|
||||||||
|
Tadano Ltd.
|
130,000
|
923,492
|
1.25
|
%
|
||||||||
|
Tanseisha Co., Ltd.
|
204,900
|
1,248,978
|
1.69
|
%
|
||||||||
|
Tocalo Co., Ltd.
|
111,700
|
1,115,297
|
1.51
|
%
|
||||||||
|
TRE Holdings Corp.
|
98,300
|
1,572,690
|
2.12
|
%
|
||||||||
|
Tsubakimoto Chain Co.
|
63,900
|
1,459,129
|
1.97
|
%
|
||||||||
|
Ushio, Inc.
|
93,000
|
1,205,799
|
1.63
|
%
|
||||||||
|
|
25,144,693
|
33.97
|
%
|
|||||||||
|
Information Technology – 19.30%
|
||||||||||||
|
Anritsu Corp.
|
50,000
|
628,726
|
0.85
|
%
|
||||||||
|
Bell System24 Holdings, Inc.
|
70,300
|
812,989
|
1.10
|
%
|
||||||||
|
BIPROGY, Inc.
|
60,900
|
1,538,638
|
2.08
|
%
|
||||||||
|
Digital Garage, Inc.
|
33,100
|
1,095,433
|
1.48
|
%
|
||||||||
|
Elecom Co., Ltd.
|
122,900
|
1,473,731
|
1.99
|
%
|
||||||||
|
Macnica Fuji Electronics Holdings, Inc.
|
36,200
|
750,530
|
1.01
|
%
|
||||||||
|
Mimaki Engineering Co., Ltd.
|
271,500
|
1,424,121
|
1.93
|
%
|
||||||||
|
Nippon Signal Company, Ltd.
|
155,000
|
1,076,019
|
1.45
|
%
|
||||||||
|
Pole To Win Holdings, Inc.
|
28,400
|
216,730
|
0.29
|
%
|
||||||||
|
SIIX Corp.
|
137,900
|
1,053,391
|
1.42
|
%
|
||||||||
|
Towa Corp.
|
82,800
|
1,284,869
|
1.74
|
%
|
||||||||
|
Transcosmos, Inc.
|
62,400
|
1,471,163
|
1.99
|
%
|
||||||||
|
Yamaichi Electronics Co., Ltd.
|
115,100
|
1,458,204
|
1.97
|
%
|
||||||||
|
|
14,284,544
|
19.30
|
%
|
|||||||||
The accompanying notes are an integral part of these financial statements.
|
HENNESSY FUNDS
|
1-800-966-4354
|
7
|
COMMON STOCKS
|
Number
|
% of
|
||||||||||
|
|
of Shares
|
Value
|
Net Assets
|
|||||||||
|
Materials – 9.50%
|
||||||||||||
|
Asia Pile Holdings Corp.
|
423,300
|
$
|
1,390,665
|
1.88
|
%
|
|||||||
|
Kyoei Steel Ltd.
|
141,200
|
1,448,707
|
1.96
|
%
|
||||||||
|
Rengo Co., Ltd.
|
226,100
|
1,338,638
|
1.81
|
%
|
||||||||
|
Sanyo Chemical Industries Ltd.
|
36,600
|
1,399,607
|
1.89
|
%
|
||||||||
|
Tokyo Ohka Kogyo Co., Ltd.
|
26,700
|
1,450,779
|
1.96
|
%
|
||||||||
|
|
7,028,396
|
9.50
|
%
|
|||||||||
|
Real Estate – 3.42%
|
||||||||||||
|
Star Mica Holdings Co., Ltd.
|
120,400
|
1,424,615
|
1.92
|
%
|
||||||||
|
Tosei Corp.
|
131,900
|
1,109,858
|
1.50
|
%
|
||||||||
|
|
2,534,473
|
3.42
|
%
|
|||||||||
|
Utilities – 1.02%
|
||||||||||||
|
EF-ON, Inc.
|
179,900
|
756,150
|
1.02
|
%
|
||||||||
|
|
||||||||||||
|
Total Common Stocks
|
||||||||||||
|
(Cost $80,236,110)
|
71,069,365
|
96.02
|
%
|
|||||||||
|
|
||||||||||||
|
SHORT-TERM INVESTMENTS – 1.89%
|
||||||||||||
|
Money Market Funds – 1.89%
|
||||||||||||
|
First American Government Obligations Fund,
|
||||||||||||
|
Institutional Class, 0.22% (b)
|
1,402,127
|
1,402,127
|
1.89
|
%
|
||||||||
|
|
||||||||||||
|
Total Short-Term Investments
|
||||||||||||
|
(Cost $1,402,127)
|
1,402,127
|
1.89
|
%
|
|||||||||
|
|
||||||||||||
|
Total Investments
|
||||||||||||
|
(Cost $81,638,237) – 97.91%
|
72,471,492
|
97.91
|
%
|
|||||||||
|
Other Assets in Excess of Liabilities – 2.09%
|
1,545,277
|
2.09
|
%
|
|||||||||
|
|
||||||||||||
|
TOTAL NET ASSETS – 100.00%
|
$
|
74,016,769
|
100.00
|
%
|
||||||||
Percentages are stated as a percent of net assets.
|
(a)
|
Non-income-producing security.
|
|
(b)
|
The rate listed is the fund’s seven-day yield as of April 30, 2022.
|
The accompanying notes are an integral part of these financial statements.
|
WWW.HENNESSYFUNDS.COM
|
8
|
SCHEDULE OF INVESTMENTS
|
Summary of Fair Value Exposure as of April 30, 2022
The following is a summary of the inputs used to value the Fund’s net assets as of April 30, 2022 (see Note 3 in the accompanying Notes to the Financial Statements):
|
Common Stocks
|
Level 1
|
Level 2
|
Level 3
|
Total
|
||||||||||||
|
Communication Services
|
$
|
—
|
$
|
2,449,776
|
$
|
—
|
$
|
2,449,776
|
||||||||
|
Consumer Discretionary
|
—
|
8,316,744
|
—
|
8,316,744
|
||||||||||||
|
Consumer Staples
|
—
|
1,898,851
|
—
|
1,898,851
|
||||||||||||
|
Energy
|
—
|
1,189,626
|
—
|
1,189,626
|
||||||||||||
|
Financials
|
—
|
4,410,703
|
—
|
4,410,703
|
||||||||||||
|
Health Care
|
—
|
3,055,409
|
—
|
3,055,409
|
||||||||||||
|
Industrials
|
—
|
25,144,693
|
—
|
25,144,693
|
||||||||||||
|
Information Technology
|
—
|
14,284,544
|
—
|
14,284,544
|
||||||||||||
|
Materials
|
—
|
7,028,396
|
—
|
7,028,396
|
||||||||||||
|
Real Estate
|
—
|
2,534,473
|
—
|
2,534,473
|
||||||||||||
|
Utilities
|
—
|
756,150
|
—
|
756,150
|
||||||||||||
|
Total Common Stocks
|
$
|
—
|
$
|
71,069,365
|
$
|
—
|
$
|
71,069,365
|
||||||||
|
Short-Term Investments
|
||||||||||||||||
|
Money Market Funds
|
$
|
1,402,127
|
$
|
—
|
$
|
—
|
$
|
1,402,127
|
||||||||
|
Total Short-Term Investments
|
$
|
1,402,127
|
$
|
—
|
$
|
—
|
$
|
1,402,127
|
||||||||
|
Total Investments
|
$
|
1,402,127
|
$
|
71,069,365
|
$
|
—
|
$
|
72,471,492
|
||||||||
The accompanying notes are an integral part of these financial statements.
|
HENNESSY FUNDS
|
1-800-966-4354
|
9
Financial Statements
|
Statement of Assets and Liabilities
as of April 30, 2022 (Unaudited)
|
|
ASSETS:
|
||||
|
Investments in securities, at value (cost $81,638,237)
|
$
|
72,471,492
|
||
|
Dividends and interest receivable
|
1,003,022
|
|||
|
Receivable for fund shares sold
|
171,686
|
|||
|
Receivable for securities sold
|
490,641
|
|||
|
Prepaid expenses and other assets
|
20,029
|
|||
|
Total assets
|
74,156,870
|
|||
|
LIABILITIES:
|
||||
|
Payable for securities purchased
|
1,219
|
|||
|
Payable for fund shares redeemed
|
27,563
|
|||
|
Payable to advisor
|
53,869
|
|||
|
Payable to administrator
|
16,609
|
|||
|
Payable to auditor
|
11,228
|
|||
|
Accrued distribution fees
|
6,026
|
|||
|
Accrued service fees
|
3,017
|
|||
|
Accrued trustees fees
|
5,591
|
|||
|
Accrued expenses and other payables
|
14,979
|
|||
|
Total liabilities
|
140,101
|
|||
|
NET ASSETS
|
$
|
74,016,769
|
||
|
NET ASSETS CONSISTS OF:
|
||||
|
Capital stock
|
$
|
81,562,959
|
||
|
Accumulated deficit
|
(7,546,190
|
)
|
||
|
Total net assets
|
$
|
74,016,769
|
||
|
NET ASSETS:
|
||||
|
Investor Class
|
||||
|
Shares authorized (no par value)
|
Unlimited
|
|||
|
Net assets applicable to outstanding shares
|
$
|
35,348,233
|
||
|
Shares issued and outstanding
|
2,543,697
|
|||
|
Net asset value, offering price, and redemption price per share
|
$
|
13.90
|
||
|
Institutional Class
|
||||
|
Shares authorized (no par value)
|
Unlimited
|
|||
|
Net assets applicable to outstanding shares
|
$
|
38,668,536
|
||
|
Shares issued and outstanding
|
2,817,999
|
|||
|
Net asset value, offering price, and redemption price per share
|
$
|
13.72
|
||
The accompanying notes are an integral part of these financial statements.
|
WWW.HENNESSYFUNDS.COM
|
10
|
STATEMENT OF ASSETS AND LIABILITIES/STATEMENT OF OPERATIONS
|
Financial Statements
|
Statement of Operations for the six months ended April 30, 2022 (Unaudited)
|
|
INVESTMENT INCOME:
|
||||
|
Dividend income(1)
|
$
|
1,260,940
|
||
|
Interest income
|
1,142
|
|||
|
Total investment income
|
1,262,082
|
|||
|
EXPENSES:
|
||||
|
Investment advisory fees (See Note 5)
|
394,710
|
|||
|
Sub-transfer agent expenses – Investor Class (See Note 5)
|
48,489
|
|||
|
Sub-transfer agent expenses – Institutional Class (See Note 5)
|
26,373
|
|||
|
Administration, accounting, custody, and transfer agent fees (See Note 5)
|
59,583
|
|||
|
Distribution fees – Investor Class (See Note 5)
|
30,889
|
|||
|
Service fees – Investor Class (See Note 5)
|
20,593
|
|||
|
Federal and state registration fees
|
17,112
|
|||
|
Compliance expense (See Note 5)
|
15,156
|
|||
|
Audit fees
|
11,222
|
|||
|
Trustees’ fees and expenses
|
9,226
|
|||
|
Reports to shareholders
|
7,152
|
|||
|
Interest expense (See Note 7)
|
1,702
|
|||
|
Legal fees
|
719
|
|||
|
Other expenses
|
7,684
|
|||
|
Total expenses
|
650,610
|
|||
|
NET INVESTMENT INCOME
|
$
|
611,472
|
||
|
REALIZED AND UNREALIZED GAINS (LOSSES):
|
||||
|
Net realized gain on investments
|
$
|
1,158,512
|
||
|
Net change in unrealized appreciation/depreciation on investments
|
(26,930,310
|
)
|
||
|
Net loss on investments
|
(25,771,798
|
)
|
||
|
NET DECREASE IN NET ASSETS RESULTING FROM OPERATIONS
|
$
|
(25,160,326
|
)
|
|
|
(1)
|
Net of foreign taxes withheld of $140,102.
|
The accompanying notes are an integral part of these financial statements.
|
HENNESSY FUNDS
|
1-800-966-4354
|
11
(This Page Intentionally Left Blank.)
|
WWW.HENNESSYFUNDS.COM
|
12
|
STATEMENTS OF CHANGES IN NET ASSETS
|
Financial Statements
|
Statements of Changes in Net Assets
|
|
Six Months Ended
|
||||||||
|
April 30, 2022
|
Year Ended
|
|||||||
|
(Unaudited)
|
October 31, 2021
|
|||||||
|
OPERATIONS:
|
||||||||
|
Net investment income
|
$
|
611,472
|
$
|
392,688
|
||||
|
Net realized gain on investments
|
1,158,512
|
1,288,362
|
||||||
|
Net change in unrealized
|
||||||||
|
appreciation/depreciation on investments
|
(26,930,310
|
)
|
10,917,876
|
|||||
|
Net increase (decrease) in net
|
||||||||
|
assets resulting from operations
|
(25,160,326
|
)
|
12,598,926
|
|||||
|
DISTRIBUTIONS TO SHAREHOLDERS:
|
||||||||
|
Distributable earnings – Investor Class
|
(186,236
|
)
|
(121,856
|
)
|
||||
|
Distributable earnings – Institutional Class
|
(589,255
|
)
|
(260,753
|
)
|
||||
|
Total distributions
|
(775,491
|
)
|
(382,609
|
)
|
||||
|
CAPITAL SHARE TRANSACTIONS:
|
||||||||
|
Proceeds from shares subscribed – Investor Class
|
4,287,995
|
10,823,523
|
||||||
|
Proceeds from shares subscribed – Institutional Class
|
14,174,002
|
45,926,109
|
||||||
|
Dividends reinvested – Investor Class
|
180,037
|
116,988
|
||||||
|
Dividends reinvested – Institutional Class
|
571,970
|
246,865
|
||||||
|
Cost of shares redeemed – Investor Class
|
(4,482,096
|
)
|
(18,166,242
|
)
|
||||
|
Cost of shares redeemed – Institutional Class
|
(27,506,462
|
)
|
(19,434,438
|
)
|
||||
|
Net increase (decrease) in net assets
|
||||||||
|
derived from capital share transactions
|
(12,774,554
|
)
|
19,512,805
|
|||||
|
TOTAL INCREASE (DECREASE) IN NET ASSETS
|
(38,710,371
|
)
|
31,729,122
|
|||||
|
NET ASSETS:
|
||||||||
|
Beginning of period
|
112,727,140
|
80,998,018
|
||||||
|
End of period
|
$
|
74,016,769
|
$
|
112,727,140
|
||||
|
CHANGES IN SHARES OUTSTANDING:
|
||||||||
|
Shares sold – Investor Class
|
268,767
|
607,997
|
||||||
|
Shares sold – Institutional Class
|
878,090
|
2,575,700
|
||||||
|
Shares issued to holders as reinvestment
|
||||||||
|
of dividends – Investor Class
|
10,154
|
6,496
|
||||||
|
Shares issued to holders as reinvestment
|
||||||||
|
of dividends – Institutional Class
|
33,206
|
13,885
|
||||||
|
Shares redeemed – Investor Class
|
(282,420
|
)
|
(1,018,588
|
)
|
||||
|
Shares redeemed – Institutional Class
|
(1,804,192
|
)
|
(1,098,633
|
)
|
||||
|
Net increase (decrease) in shares outstanding
|
(896,395
|
)
|
1,086,857
|
|||||
The accompanying notes are an integral part of these financial statements.
|
HENNESSY FUNDS
|
1-800-966-4354
|
13
Financial Statements
|
Financial Highlights
|
For an Investor Class share outstanding throughout each period
|
Six Months Ended
|
||||
|
April 30, 2022
|
||||
|
(Unaudited)
|
||||
|
PER SHARE DATA:
|
||||
|
Net asset value, beginning of period
|
$
|
18.12
|
||
|
Income from investment operations:
|
||||
|
Net investment income
|
0.08
|
(1)
|
||
|
Net realized and unrealized gains (losses) on investments
|
(4.23
|
)
|
||
|
Total from investment operations
|
(4.15
|
)
|
||
|
Less distributions:
|
||||
|
Dividends from net investment income
|
(0.00
|
)(2)
|
||
|
Dividends from net realized gains
|
(0.07
|
)
|
||
|
Total distributions
|
(0.07
|
)
|
||
|
Net asset value, end of period
|
$
|
13.90
|
||
|
TOTAL RETURN
|
-22.97
|
%(3)
|
||
|
SUPPLEMENTAL DATA AND RATIOS:
|
||||
|
Net assets, end of period (millions)
|
$
|
35.35
|
||
|
Ratio of expenses to average net assets
|
1.55
|
%(4)
|
||
|
Ratio of net investment income to average net assets
|
1.07
|
%(4)
|
||
|
Portfolio turnover rate(5)
|
8
|
%(3)
|
||
|
(1)
|
Calculated using the average shares outstanding method.
|
|
(2)
|
Amount is between $(0.005) and $0.005.
|
|
(3)
|
Not annualized.
|
|
(4)
|
Annualized.
|
|
(5)
|
Calculated on the basis of the Fund as a whole.
|
The accompanying notes are an integral part of these financial statements.
|
WWW.HENNESSYFUNDS.COM
|
14
|
FINANCIAL HIGHLIGHTS — INVESTOR CLASS
|
|
Year Ended October 31,
|
||||||||||||||||||
|
2021
|
2020
|
2019
|
2018
|
2017
|
||||||||||||||
|
$
|
15.73
|
$
|
15.43
|
$
|
14.99
|
$
|
14.92
|
$
|
11.29
|
|||||||||
|
0.03
|
(1)
|
0.01
|
(1)
|
0.03
|
(1)
|
0.05
|
0.08
|
|||||||||||
|
2.40
|
0.50
|
0.88
|
0.35
|
3.77
|
||||||||||||||
|
2.43
|
0.51
|
0.91
|
0.40
|
3.85
|
||||||||||||||
|
(0.04
|
)
|
(0.21
|
)
|
—
|
(0.05
|
)
|
(0.12
|
)
|
||||||||||
|
—
|
—
|
(0.47
|
)
|
(0.28
|
)
|
(0.10
|
)
|
|||||||||||
|
(0.04
|
)
|
(0.21
|
)
|
(0.47
|
)
|
(0.33
|
)
|
(0.22
|
)
|
|||||||||
|
$
|
18.12
|
$
|
15.73
|
$
|
15.43
|
$
|
14.99
|
$
|
14.92
|
|||||||||
|
15.46
|
%
|
3.27
|
%
|
6.30
|
%
|
2.64
|
%
|
34.82
|
%
|
|||||||||
|
$
|
46.15
|
$
|
46.41
|
$
|
66.30
|
$
|
100.93
|
$
|
69.86
|
|||||||||
|
1.53
|
%
|
1.55
|
%
|
1.52
|
%
|
1.46
|
%
|
1.60
|
%
|
|||||||||
|
0.16
|
%
|
0.09
|
%
|
0.23
|
%
|
0.21
|
%
|
0.26
|
%
|
|||||||||
|
24
|
%
|
17
|
%
|
21
|
%
|
35
|
%
|
41
|
%
|
|||||||||
The accompanying notes are an integral part of these financial statements.
|
HENNESSY FUNDS
|
1-800-966-4354
|
15
Financial Statements
|
Financial Highlights
|
For an Institutional Class share outstanding throughout each period
|
Six Months Ended
|
||||
|
April 30, 2022
|
||||
|
(Unaudited)
|
||||
|
PER SHARE DATA:
|
||||
|
Net asset value, beginning of period
|
$
|
17.94
|
||
|
Income from investment operations:
|
||||
|
Net investment income
|
0.11
|
(1)
|
||
|
Net realized and unrealized gains (losses) on investments
|
(4.17
|
)
|
||
|
Total from investment operations
|
(4.06
|
)
|
||
|
Less distributions:
|
||||
|
Dividends from net investment income
|
(0.09
|
)
|
||
|
Dividends from net realized gains
|
(0.07
|
)
|
||
|
Total distributions
|
(0.16
|
)
|
||
|
Net asset value, end of period
|
$
|
13.72
|
||
|
TOTAL RETURN
|
-22.83
|
%(2)
|
||
|
SUPPLEMENTAL DATA AND RATIOS:
|
||||
|
Net assets, end of period (millions)
|
$
|
38.67
|
||
|
Ratio of expenses to average net assets
|
1.15
|
%(3)
|
||
|
Ratio of net investment income to average net assets
|
1.36
|
%(3)
|
||
|
Portfolio turnover rate(4)
|
8
|
%(2)
|
||
|
(1)
|
Calculated using the average shares outstanding method.
|
|
(2)
|
Not annualized.
|
|
(3)
|
Annualized.
|
|
(4)
|
Calculated on the basis of the Fund as a whole.
|
The accompanying notes are an integral part of these financial statements.
|
WWW.HENNESSYFUNDS.COM
|
16
|
FINANCIAL HIGHLIGHTS — INSTITUTIONAL CLASS
|
|
Year Ended October 31,
|
||||||||||||||||||
|
2021
|
2020
|
2019
|
2018
|
2017
|
||||||||||||||
|
$
|
15.58
|
$
|
15.28
|
$
|
14.83
|
$
|
14.72
|
$
|
11.33
|
|||||||||
|
0.11
|
(1)
|
0.07
|
(1)
|
0.09
|
(1)
|
0.11
|
0.05
|
|||||||||||
|
2.37
|
0.50
|
0.86
|
0.36
|
3.78
|
||||||||||||||
|
2.48
|
0.57
|
0.95
|
0.47
|
3.83
|
||||||||||||||
|
(0.12
|
)
|
(0.27
|
)
|
(0.04
|
)
|
(0.08
|
)
|
(0.10
|
)
|
|||||||||
|
—
|
—
|
(0.46
|
)
|
(0.28
|
)
|
(0.34
|
)
|
|||||||||||
|
(0.12
|
)
|
(0.27
|
)
|
(0.50
|
)
|
(0.36
|
)
|
(0.44
|
)
|
|||||||||
|
$
|
17.94
|
$
|
15.58
|
$
|
15.28
|
$
|
14.83
|
$
|
14.72
|
|||||||||
|
15.90
|
%
|
3.69
|
%
|
6.73
|
%
|
3.12
|
%
|
35.17
|
%
|
|||||||||
|
$
|
66.58
|
$
|
34.58
|
$
|
63.78
|
$
|
98.42
|
$
|
28.71
|
|||||||||
|
1.13
|
%
|
1.13
|
%
|
1.12
|
%
|
1.04
|
%
|
1.19
|
%
|
|||||||||
|
0.63
|
%
|
0.45
|
%
|
0.61
|
%
|
0.77
|
%
|
0.80
|
%
|
|||||||||
|
24
|
%
|
17
|
%
|
21
|
%
|
35
|
%
|
41
|
%
|
|||||||||
The accompanying notes are an integral part of these financial statements.
|
HENNESSY FUNDS
|
1-800-966-4354
|
17
Financial Statements
|
Notes to the Financial Statements April 30, 2022 (Unaudited)
|
1). ORGANIZATION
The Hennessy Japan Small Cap Fund (the “Fund”) is a series of Hennessy Funds Trust (the “Trust”), which was organized as a Delaware statutory trust on September 17, 1992. The Fund is an open-end
management investment company registered under the Investment Company Act of 1940, as amended. The investment objective of the Fund is long-term capital appreciation. The Fund is a diversified fund.
The Fund offers Investor Class and Institutional Class shares. Each class of shares differs principally in its respective 12b-1 distribution and service, shareholder servicing,
and sub-transfer agent expenses. There are no sales charges. Each class has identical rights to earnings, assets, and voting privileges, except for class-specific expenses and exclusive rights to vote on matters affecting
only one class.
As an investment company, the Fund follows the investment company accounting and reporting guidance of the Financial Accounting Standards Board (“FASB”) Accounting Standard
Codification Topic 946 “Financial Services—Investment Companies.”
2). SIGNIFICANT ACCOUNTING POLICIES
The following is a summary of significant accounting policies consistently followed by the Fund in the preparation of the financial statements. These policies conform to U.S. generally accepted
accounting principles (“GAAP”).
|
a).
|
Securities Valuation – All investments in securities are valued in accordance with the Fund’s valuation policies and procedures, as described in Note 3.
|
|
b).
|
Federal Income Taxes – The Fund has elected to be taxed as a regulated investment company and intends to distribute substantially all of its taxable income to its shareholders and
otherwise comply with the provisions of the Internal Revenue Code of 1986, as amended, applicable to regulated investment companies. As a result, the Fund has made no provision for federal income taxes or excise
taxes. Net investment income/loss and realized gains/losses for federal income tax purposes may differ from those reported in the financial statements because of temporary book-basis and tax-basis differences.
Temporary differences are primarily the result of the treatment of wash sales for tax reporting purposes. The Fund recognizes interest and penalties related to income tax benefits, if any, in the Statement of
Operations as an income tax expense. Distributions from net realized gains for book purposes may include short-term capital gains, which are included as ordinary income to shareholders for tax purposes. The Fund
may utilize equalization accounting for tax purposes and designate earnings and profits, including net realized gains distributed to shareholders on redemption of shares, as part of the dividends paid deduction for
income tax purposes.
|
|
c).
|
Accounting for Uncertainty in Income Taxes – The Fund has accounting policies regarding recognition and measurement of tax positions taken or expected to be taken on a tax return. The tax
returns of the Fund for the prior three fiscal years are open for examination. The Fund has reviewed all open tax years in major tax jurisdictions and concluded that there is no impact on the Fund’s net assets and
no tax liability resulting from unrecognized tax benefits relating to uncertain income tax positions taken or expected to be taken on a tax return. The Fund’s major tax jurisdictions are U.S. federal and Delaware.
|
|
WWW.HENNESSYFUNDS.COM
|
18
|
NOTES TO THE FINANCIAL STATEMENTS
|
|
d).
|
Income and Expenses – Dividend income is recognized on the ex-dividend date or as soon as information is available to the Fund. Interest income, which includes the amortization of premium
and accretion of discount, is recognized on an accrual basis. Market discounts, original issue discounts, and market premiums on debt securities are accreted or amortized to interest income over the life of a
security with a corresponding increase or decrease, as applicable, in the cost basis of such security using the yield-to-maturity method or, where applicable, the first call date of the security. Other non-cash
dividends are recognized as investment income at the fair value of the property received. The Fund is charged for those expenses that are directly attributable to its portfolio, such as advisory, administration,
and certain shareholder service fees. Income, expenses (other than expenses attributable to a specific class), and realized and unrealized gains/losses on investments are allocated to each class of shares based on
such class’s net assets.
|
|
e).
|
Distributions to Shareholders – Dividends from net investment income for the Fund, if any, are declared and paid annually, usually in December. Distributions of net realized capital
gains, if any, are declared and paid annually, usually in December.
|
|
f).
|
Security Transactions – Investment and shareholder transactions are recorded on the trade date. The Fund determines the realized gain/loss from an investment transaction by comparing the
original cost of the security lot sold with the net sale proceeds. Discounts and premiums on securities purchased are accreted or amortized, respectively, over the life of each such security.
|
|
g).
|
Use of Estimates – Preparing financial statements in accordance with GAAP requires management to make estimates and assumptions that affect the reported amounts of assets and liabilities
and disclosure of contingent assets and liabilities at the date of the financial statements, as well as the reported change in net assets during the reporting period. Actual results could differ from those
estimates.
|
|
h).
|
Share Valuation – The net asset value (“NAV”) per share of the Fund is calculated by dividing (i) the total value of the securities held by the Fund, plus cash and other assets, minus all
liabilities (including estimated accrued expenses) by (ii) the total number of Fund shares outstanding, rounded to the nearest $0.01. Fund shares are not priced on days the New York Stock Exchange is closed for
trading. The offering and redemption price per share for the Fund is equal to the Fund’s NAV per share.
|
|
i).
|
Foreign Currency – Values of investments denominated in foreign currencies are converted into U.S. dollars using the spot market exchange rate at the time of valuation. Purchases and
sales of investments and income are translated into U.S. dollars using the spot market exchange rate prevailing on the respective dates of such transactions. The Fund does not isolate the portion of the results of
operations resulting from fluctuations in foreign exchange rates on investments from fluctuations resulting from changes in the market prices of securities held. Such fluctuations are included with the net realized
and unrealized gain/loss on investments. Foreign investments present additional risks due to currency fluctuations, economic and political factors, lower liquidity, government regulations, differences in accounting
standards, and other factors.
|
|
j).
|
Recent Accounting Pronouncements and Regulatory Updates – In October 2020, the Securities and Exchange Commission (“SEC”) adopted new regulations governing the use of derivatives by
registered investment companies (“Rule 18f-4”). Rule 18f-4 imposes limits on the amount of derivatives a fund can enter into, eliminates the asset segregation framework currently used by funds to comply with
Section 18 of the 1940 Act, and requires funds whose use of derivatives is greater than a limited specified amount to establish and maintain a comprehensive derivatives risk
|
|
HENNESSY FUNDS
|
1-800-966-4354
|
19
|
management program and appoint a derivatives risk manager. Funds are required to comply with Rule 18f-4 by August 19, 2022. The impact, if any, that Rule 18f-4 will have on the
availability, liquidity, and performance of derivatives is unclear. Management is currently evaluating the potential impact of Rule 18f-4 on the Fund. When fully implemented, Rule 18f-4 may require changes in how
the Fund uses derivatives, adversely affect the Fund’s performance, and increase costs related to the Fund’s use of derivatives.
|
|
|
In December 2020, the SEC adopted a new rule providing a framework for fund valuation practices (“Rule 2a-5”). Rule
2a-5 establishes requirements for determining fair value in good faith for purposes of the 1940 Act. Rule 2a-5 permits fund boards to designate certain parties to perform fair value determinations, subject to board
oversight and certain other conditions. Rule 2a-5 also defines when market quotations are “readily available” for purposes of the 1940 Act and the threshold for determining whether a fund must fair value a
security. In connection with Rule 2a-5, the SEC also adopted related recordkeeping requirements and is rescinding previously issued guidance, including with respect to the role of a board in determining fair value
and the accounting and auditing of fund investments. Funds must comply with the rules by September 8, 2022. Management is currently assessing the potential impact of the new rules on the Fund’s financial
statements.
|
3). SECURITIES VALUATION
The Fund follows its valuation policies and procedures in determining its net asset value and, in preparing these financial statements, the fair value accounting standards that establish an
authoritative definition of fair value and set out a hierarchy for measuring fair value. These standards require additional disclosures about the various inputs and valuation techniques used to develop the measurements of
fair value and a discussion of changes in valuation techniques and related inputs during the period. These inputs are summarized in the three broad levels listed below:
|
Level 1 –
|
Unadjusted, quoted prices in active markets for identical instruments that the Fund has the ability to access at the date of measurement.
|
|
|
Level 2 –
|
Other significant observable inputs (including, but not limited to, quoted prices in active markets for similar instruments, quoted prices in markets that are not active for identical or
similar instruments, and model-derived valuations in which all significant inputs and significant value drivers are observable in active markets, such as interest rates, prepayment speeds, credit risk curves,
default rates, and similar data).
|
|
|
Level 3 –
|
Significant unobservable inputs (including the Fund’s own assumptions about what market participants would use to price the asset or liability based on the best available information)
when observable inputs are unavailable.
|
The following is a description of the valuation techniques applied to the Fund’s major categories of assets and liabilities on a recurring basis:
|
Equity Securities – Equity securities, including common stocks, preferred stocks, foreign-issued common stocks, exchange-traded funds, closed-end
mutual funds, partnerships, rights, and real estate investment trusts, that are traded on a securities exchange for which a last-quoted sales price is readily available generally are valued at the last sales price
as reported by the primary exchange on which the securities are listed. Securities listed on The Nasdaq Stock Market (“Nasdaq”) generally are valued at the Nasdaq Official Closing Price, which may differ from the
last sales price reported. Securities traded on a securities exchange for which a last-quoted sales price is not readily available generally are valued at the mean between the bid and
|
|
WWW.HENNESSYFUNDS.COM
|
20
|
NOTES TO THE FINANCIAL STATEMENTS
|
|
ask prices. To the extent these securities are actively traded and valuation adjustments are not applied, they are classified in Level 1 of the fair value hierarchy. Securities traded on
foreign exchanges generally are not valued at the same time the Fund calculates its NAV because most foreign markets close well before such time. The earlier close of most foreign markets gives rise to the
possibility that significant events, including broad market moves, may have occurred in the interim. In certain circumstances, it may be determined that a foreign security needs to be fair valued because it appears
that the value of the security might have been materially affected by events occurring after the close of the market in which the security is principally traded, but before the time the Fund calculates its NAV,
such as by a development that affects an entire market or region (e.g., a weather-related event) or a potentially global development (e.g., a terrorist attack that may be expected to have an effect on investor
expectations worldwide).
|
|
|
Registered Investment Companies – Investments in open-end registered investment companies, commonly referred to as mutual funds, generally are
priced at the ending NAV provided by the applicable mutual fund’s service agent and are classified in Level 1 of the fair value hierarchy.
|
|
|
Debt Securities – Debt securities, including corporate bonds, asset-backed securities, mortgage-backed securities, municipal bonds, U.S.
Treasuries, and U.S. government agency issues, are generally valued at market on the basis of valuations furnished by an independent pricing service that utilizes both dealer-supplied valuations and formula-based
techniques. The pricing service may consider recently executed transactions in securities of the issuer or comparable issuers, market price quotations (where observable), bond spreads, and fundamental data relating
to the issuer. In addition, the model may incorporate observable market data, such as reported sales of similar securities, broker quotes, yields, bids, offers, and reference data. Certain securities are valued
primarily using dealer quotations. These securities are generally classified in Level 2 of the fair value hierarchy.
|
|
|
Short-Term Securities – Short-term equity investments, including money market funds, are valued in the manner specified above for equity
securities. Short-term debt investments with an original term to maturity of 60 days or less are valued at amortized cost, which approximates fair market value. If the original term to maturity of a short-term debt
investment exceeds 60 days, then the values as of the 61st day prior to maturity are amortized. Amortized cost is not used if its use would be inappropriate due to credit or other impairments of the issuer, in
which case the security’s fair value would be determined as described below. Short-term securities are generally classified in Level 1 or Level 2 of the fair value hierarchy depending on the inputs used and market
activity levels for specific securities.
|
The Board of Trustees of the Fund (the “Board”) has adopted fair value pricing procedures that are followed when a price for a security is not readily available or if a
significant event has occurred that indicates the closing price of a security no longer represents the true value of that security. Fair value pricing determinations are made in good faith in accordance with these
procedures. There are numerous criteria considered in determining a fair value of a security, such as the trading volume of a security and markets, the values of other similar securities, and news events with direct
bearing on a security or markets. Fair value pricing results in an estimated price for a security that reflects the amount the Fund might reasonably expect to receive in a current sale. Depending on the relative
significance of the valuation inputs, these securities may be classified in either Level 2 or Level 3 of the fair value hierarchy.
|
HENNESSY FUNDS
|
1-800-966-4354
|
21
The fair value of foreign securities may be determined with the assistance of a pricing service using correlations between the movement of prices of such securities and indices
of domestic securities and other appropriate indicators, such as closing market prices of relevant American Depositary Receipts or futures contracts. Using fair value pricing means that the Fund’s NAV reflects the affected
portfolio securities’ values as determined by the Board or its designee, pursuant to the fair value pricing procedures adopted by the Board, instead of being determined by the market. Using a fair value pricing methodology
to price a foreign security may result in a value that is different from such foreign security’s most recent closing price and from the value used by other investment companies to calculate their NAVs. Such securities are
generally classified in Level 2 of the fair value hierarchy. Because the Fund invests in foreign securities, the value of the Fund’s portfolio securities may change on days when a shareholder is unable to purchase or
redeem Fund shares.
The Board has delegated day-to-day valuation matters to the Valuation and Liquidity Committee comprising representatives from Hennessy Advisors, Inc., the Fund’s investment
advisor (the “Advisor”). The function of the Valuation and Liquidity Committee, among other things, is to value securities where current and reliable market quotations are not readily available. All actions taken by the
Valuation and Liquidity Committee are reviewed by the Board.
The Fund has performed an analysis of all existing investments to determine the significance and character of all inputs to their fair value determinations. Various inputs are
used to determine the value of the Fund’s investments. The inputs or methodology used for valuing securities are not necessarily an indication of the risk associated with investing in those securities. Details related to
the fair value hierarchy of the Fund’s securities as of April 30, 2022, are included in the Schedule of Investments.
4). INVESTMENT TRANSACTIONS
Purchases and sales of investment securities (excluding government and short-term investments) for the Fund during the six months ended April 30, 2022, were $7,366,842 and $15,955,143,
respectively.
There were no purchases or sales/maturities of long-term U.S. government securities for the Fund during the six months ended April 30, 2022.
5). INVESTMENT ADVISORY FEE AND OTHER TRANSACTIONS WITH AFFILIATES
The Advisor provides the Fund with investment advisory services under an Investment Advisory Agreement. The Advisor oversees the provision of investment advice and furnishes office space,
facilities, and most of the personnel needed by the Fund. As compensation for its services, the Advisor is entitled to a monthly fee from the Fund. The fee is based on the average daily net assets of the Fund at an annual
rate of 0.80%. The net investment advisory fees expensed by the Fund during the six months ended April 30, 2022, are included in the Statement of Operations.
The Advisor has delegated the day-to-day management of the Fund to a sub-advisor, SPARX Asset Management Co., Ltd. The Advisor pays the sub-advisory fees from its own assets,
and these fees are not an additional expense of the Fund. During the six months ended April 30, 2022, the Advisor (not the Fund) paid a sub-advisory fee at the average rate of 0.35% of the daily net assets of the Fund.
Pursuant to the sub-advisory agreement, the Advisor pays sub-advisory fees at the rate of 0.35% of the first $500 million of daily net assets, 0.40% of daily net assets between $500 million and $1 billion, and 0.42% of
daily net assets over $1 billion.
The Board has approved a Shareholder Servicing Agreement for Investor Class shares of the Fund, which compensates the Advisor for the non-investment advisory services it
|
WWW.HENNESSYFUNDS.COM
|
22
|
NOTES TO THE FINANCIAL STATEMENTS
|
provides to the Fund. The Shareholder Servicing Agreement provides for a monthly fee paid to the Advisor at an annual rate of 0.10% of the average daily net assets of the Fund attributable to
Investor Class shares. The shareholder service fees expensed by the Fund during the six months ended April 30, 2022, are included in the Statement of Operations.
The Fund has adopted a plan pursuant to Rule 12b-1 under the Investment Company Act of 1940, as amended, that authorizes payments in connection with the distribution of Fund
shares at an annual rate of up to 0.25% of the Fund’s average daily net assets attributable to Investor Class shares. Even though the authorized rate is up to 0.25%, the Fund is currently only using up to 0.15% of its
average daily net assets attributable to Investor Class shares for such purpose. Amounts paid under the plan may be spent on any activities or expenses primarily intended to result in the sale of shares, including, but not
limited to, advertising, shareholder account servicing, printing and mailing of prospectuses to other than current shareholders, printing and mailing of sales literature, and compensation for sales and marketing activities
or to financial institutions and others, such as dealers and distributors. The distribution fees expensed by the Fund during the six months ended April 30, 2022, are included in the Statement of Operations.
The Fund has entered into agreements with various brokers, dealers, and financial intermediaries in connection with the sale of Fund shares. The agreements provide for periodic
payments of sub-transfer agent expenses by the Fund to the brokers, dealers, and financial intermediaries for providing certain shareholder maintenance services. These shareholder services include the pre-processing and
quality control of new accounts, shareholder correspondence, answering customer inquiries regarding account status, and facilitating shareholder telephone transactions. The sub-transfer agent fees expensed by the Fund
during the six months ended April 30, 2022, are included in the Statement of Operations.
U.S. Bancorp Fund Services, LLC, d/b/a U.S. Bank Global Fund Services (“Fund Services”) provides the Fund with administrative, accounting, and transfer agent services. As
administrator, Fund Services is responsible for activities such as (i) preparing various federal and state regulatory filings, reports, and returns for the Fund, (ii) preparing reports and materials to be supplied to the
Board, (iii) monitoring the activities of the Fund’s custodian, transfer agent, and accountants, and (iv) coordinating the preparation and payment of the Fund’s expenses and reviewing the Fund’s expense accruals. U.S. Bank
N.A., an affiliate of Fund Services, serves as the Fund’s custodian. The servicing agreements between the Trust, Fund Services, and U.S. Bank N.A. contain a fee schedule that is inclusive of administrative, accounting,
custody, and transfer agent fees. The administrative, accounting, custody, and transfer agent fees expensed by the Fund during the six months ended April 30, 2022, are included in the Statement of Operations.
Quasar Distributors, LLC (“Quasar”), a wholly owned broker-dealer subsidiary of Foreside Financial Group, LLC, acts as the Fund’s principal underwriter in a continuous public
offering of Fund shares.
The officers of the Fund are affiliated with the Advisor. With the exception of the Chief Compliance Officer and the Senior Compliance Officer, such officers receive no
compensation from the Fund for serving in their respective roles. The Fund, along with the other funds in the Hennessy Funds family (collectively, the “Hennessy Funds”), makes reimbursement payments on an equal basis to
the Advisor for a portion of the salary and benefits associated with the office of the Chief Compliance Officer and for all of the salary and benefits associated with the office of the Senior Compliance Officer. The
compliance fees expensed by the Fund during the six months ended April 30, 2022, are included in the Statement of Operations.
|
HENNESSY FUNDS
|
1-800-966-4354
|
23
6). GUARANTEES AND INDEMNIFICATIONS
Under the Hennessy Funds’ organizational documents, their officers and trustees are indemnified by the Hennessy Funds against certain liabilities arising out of the performance of their duties to
the Hennessy Funds. Additionally, in the normal course of business, the Hennessy Funds enter into contracts with service providers that contain general indemnification clauses. The Fund’s maximum exposure under these
arrangements is unknown as this would involve future claims that may be made against the Fund that have not yet occurred. Currently, the Fund expects the risk of loss to be remote.
7). LINE OF CREDIT
The Fund has an uncommitted line of credit with the other Hennessy Funds in the amount of the lesser of (i) $100,000,000 or (ii) 33.33% of each Hennessy Fund’s net assets, or 30% for the Hennessy
Gas Utility Fund and 10% for the Hennessy Balanced Fund. The line of credit is intended to provide any necessary short-term financing in connection with shareholder redemptions, subject to certain restrictions. The credit
facility is with the Hennessy Funds’ custodian bank, U.S. Bank N.A. Borrowings under this arrangement bear interest at the bank’s prime rate and are secured by all of the Fund’s assets (as to its own borrowings only).
During the six months ended April 30, 2022, the Fund had an outstanding average daily balance and a weighted average interest rate of $96,735 and 3.50%, respectively. The interest expensed by the Fund during the six months
ended April 30, 2022, is included in the Statement of Operations. The maximum amount outstanding for the Fund during the period was $3,666,000. As of April 30, 2022, the Fund did not have any borrowings outstanding under
the line of credit.
8). FEDERAL TAX INFORMATION
As of October 31, 2021, the Fund’s most recent fiscal year end, the components of accumulated earnings (losses) for income tax purposes were as follows:
|
Investments
|
||||
|
Cost of investments for tax purposes
|
$
|
98,174,058
|
||
|
Gross tax unrealized appreciation
|
$
|
23,765,642
|
||
|
Gross tax unrealized depreciation
|
(6,151,489
|
)
|
||
|
Net tax unrealized appreciation/(depreciation)
|
$
|
17,614,153
|
||
|
Undistributed ordinary income
|
$
|
327,681
|
||
|
Undistributed long-term capital gains
|
447,793
|
|||
|
Total distributable earnings
|
$
|
775,474
|
||
|
Other accumulated gain/(loss)
|
$
|
—
|
||
|
Total accumulated gain/(loss)
|
$
|
18,389,627
|
||
The difference between book-basis unrealized appreciation/depreciation and tax-basis unrealized appreciation/depreciation (as shown above) is attributable primarily to wash
sales.
As of October 31, 2021, the Fund had no tax-basis capital losses to offset future capital gains. During fiscal year 2021, the capital losses utilized by the Fund were $871,567.
Capital losses sustained in or after fiscal year 2012 can be carried forward indefinitely, but any such loss retains the character of the original loss and must be utilized
prior to any loss incurred before fiscal year 2012. As a result of this ordering rule, capital loss carryforwards incurred prior to fiscal year 2012 may be more likely to expire unused. Capital losses sustained prior to
fiscal year 2012 can be carried forward for eight years and can be carried forward as short-term capital losses regardless of the character of the original loss.
|
WWW.HENNESSYFUNDS.COM
|
24
|
NOTES TO THE FINANCIAL STATEMENTS
|
As of October 31, 2021, the Fund did not defer, on a tax basis, any late-year ordinary losses. Late-year ordinary losses are net ordinary losses incurred after December 31,
2020, but within the taxable year, that are deemed to arise on the first day of the Fund’s next taxable year.
During fiscal year 2022 (year to date) and fiscal year 2021, the tax character of distributions paid by the Fund was as follows:
|
Six Months Ended
|
Year Ended
|
||||||||
|
April 30, 2022
|
October 31, 2021
|
||||||||
|
Ordinary income(1)
|
$
|
327,681
|
$
|
382,609
|
|||||
|
Long-term capital gains
|
447,810
|
—
|
|||||||
|
Total distributions
|
$
|
775,491
|
$
|
382,609
|
|||||
|
(1) Ordinary income includes short-term capital gains.
|
9). EVENTS SUBSEQUENT TO PERIOD END
Management has evaluated the Fund’s related events and transactions that occurred subsequent to April 30, 2022, through the date of issuance of the Fund’s financial statements. Management has
determined that there were no subsequent events requiring recognition or disclosure in the financial statements.
|
HENNESSY FUNDS
|
1-800-966-4354
|
25
Expense Example (Unaudited)
April 30, 2022
As a shareholder of the Fund, you incur ongoing costs, including management fees, service fees, and other Fund expenses. This Example is intended to help you understand your ongoing costs (in
dollars) of investing in the Fund and to compare these costs with the ongoing costs of investing in other mutual funds. The Example is based on an investment of $1,000 invested at the beginning of the period and held for
the entire period from November 1, 2021, through April 30, 2022.
Actual Expenses
In the table below, the first line under each of the “Investor Class” and “Institutional Class” headings provides information about actual account values and actual expenses for each share class.
You may use this information, together with the amount you invested, to estimate the expenses that you paid over the period. Simply divide your account value by $1,000 (for example, an $8,600 account value divided by
$1,000 = 8.6), then multiply the result by the number in the first line under the heading “Expenses Paid During Period” to estimate the expenses you paid on your account during this period. Although the Fund charges no
sales loads or transaction fees, you will be assessed fees for outgoing wire transfers, returned checks, and stop payment orders at prevailing rates charged by U.S. Bank Global Fund Services, the Fund’s transfer agent. If
you request that a redemption be made by wire transfer, the Fund’s transfer agent charges a $15 fee. IRAs are charged a $15 annual maintenance fee (up to $30 maximum per shareholder for shareholders with multiple IRAs).
The examples below include, but are not limited to, management, shareholder servicing, accounting, custody, and transfer agent fees. However, the examples below do not include portfolio trading commissions and related
expenses.
Hypothetical Example for Comparison Purposes
In the table below, the second line under each of the “Investor Class” and “Institutional Class” headings provides information about hypothetical account values and hypothetical expenses based on
the Fund’s actual expense ratio for each share class and an assumed rate of return of 5% per year before expenses, which is not the Fund’s actual return for such share class. The hypothetical account values and expenses
may not be used to estimate the actual ending account balance or expenses you paid for the period. You may use this information to compare the ongoing costs of investing in the Fund and other funds. To do so, compare these
5% hypothetical examples with the 5% hypothetical examples that appear in the shareholder reports of the other funds. Please note that the expenses shown in the table are meant to highlight your ongoing costs only.
Therefore, the second lines under “Investor Class” and “Institutional Class” are useful in comparing ongoing costs only and will not help you determine the relative total costs of owning different funds.
|
WWW.HENNESSYFUNDS.COM
|
26
|
EXPENSE EXAMPLE
|
|
Beginning
|
Ending
|
||
|
Account Value
|
Account Value
|
Expenses Paid
|
|
|
November 1, 2021
|
April 30, 2022
|
During Period(1)
|
|
|
Investor Class
|
|||
|
Actual
|
$1,000.00
|
$ 770.30
|
$6.80
|
|
Hypothetical (5% return before expenses)
|
$1,000.00
|
$1,017.11
|
$7.75
|
|
Institutional Class
|
|||
|
Actual
|
$1,000.00
|
$ 771.70
|
$5.05
|
|
Hypothetical (5% return before expenses)
|
$1,000.00
|
$1,019.09
|
$5.76
|
|
(1)
|
Expenses are equal to the Fund’s annualized expense ratio of 1.55% for Investor Class shares or 1.15% for Institutional Class shares, as applicable, multiplied by the average account
value over the period, multiplied by 181/365 days (to reflect the half-year period).
|
|
HENNESSY FUNDS
|
1-800-966-4354
|
27
How to Obtain a Copy of the Fund’s Proxy
Voting Policy and Proxy Voting Records
A description of the policies and procedures the Fund uses to determine how to vote proxies relating to portfolio securities is available without charge (1) by calling 800-966-4354, (2) on the
Hennessy Funds’ website at www.hennessyfunds.com/proxy-voting/voting-policy, or (3) on the U.S. Securities and Exchange Commission’s (the “SEC”) website at www.sec.gov. The Fund’s proxy voting record is available without
charge on both the Hennessy Funds’ website at www.hennessyfunds.com/proxy-voting/voting-record and the SEC’s website at www.sec.gov no later than August 31 for the prior 12 months ending June 30.
Availability of Quarterly Portfolio Schedule
The Fund files its complete schedule of portfolio holdings with the SEC for the first and third quarters of each fiscal year as an exhibit to its reports on Form N-PORT. The Fund’s Form N-PORT
reports are available on the SEC’s website at www.sec.gov or on request by calling 800-966-4354.
Federal Tax Distribution Information (Unaudited)
For fiscal year 2021, certain dividends paid by the Fund may be subject to a maximum tax rate of 23.8%, as provided for by the Jobs and Growth Tax Relief Reconciliation Act of 2003. The
percentage of dividends declared from ordinary income designated as qualified dividend income was 100.00%.
For corporate shareholders, the percent of ordinary income distributions that qualified for the corporate dividends received deduction for fiscal year 2021 was 0.00%.
The percentage of taxable ordinary income distributions that were designated as short-term capital gain distributions under Section 871(k)(2)(C) of the Internal Revenue Code of
1986, as amended, for the Fund was 0.00%.
For the year ended October 31, 2021, the Fund earned foreign-source income and paid foreign taxes as noted below, which it intends to pass through to its shareholders pursuant
to Section 853 of the Internal Revenue Code.
|
Country
|
Gross Foreign Income
|
Foreign Tax Paid
|
||
|
Japan
|
$1,896,845
|
$189,684
|
Important Notice Regarding Delivery of
Shareholder Documents
To help keep the Fund’s costs as low as possible, we generally deliver a single copy of shareholder reports, proxy statements, and prospectuses to shareholders who share an address and have the
same last name. This process does not apply to account statements. You may request an individual copy of a shareholder document at any time. If you would like to receive separate mailings of shareholder documents, please
call U.S. Bank Global Fund Services at 800-261-6950 or 414-765-4124, and individual delivery will begin within 30 days of your request. If your account is held through a financial institution or other intermediary, please
contact such intermediary directly to request individual delivery.
|
WWW.HENNESSYFUNDS.COM
|
28
|
PROXY VOTING — BOARD APPROVAL OF INVESTMENT ADVISORY AGREEMENTS
|
Electronic Delivery
As permitted by SEC regulations, the Fund’s shareholder reports are made available on a website, and unless you sign up for eDelivery or elect to receive paper copies as detailed below, you will
be notified each time a report is posted and provided with a website link to access the report.
The Fund also offers shareholders the option to receive all notices, account statements, prospectuses, tax forms, and shareholder reports electronically. To sign up for
eDelivery or change your delivery preference, please visit www.hennessyfunds.com/account.
To elect to receive paper copies of all future reports free of charge, please call U.S. Bank Global Fund Services at 800-261-6950 or 414-765-4124.
Subscribe to receive our team’s unique market and sector insights delivered to your inbox
www.hennessyfunds.com/subscribe
Follow us on social media
| |
|
Board Approval of Investment Advisory
Agreements
At its meeting on March 11, 2022, the Board of Trustees of the Fund (the “Board,” and the members thereof, the “Trustees”) unanimously approved the continuation of the investment advisory
agreement of the Fund with Hennessy Advisors, Inc. (the “Advisor”) and the sub-advisory agreement for the Fund between the Advisor and SPARX Asset Management Co., Ltd. (the “Sub-Advisor”). As part of the process, the
Trustees reviewed their fiduciary duties and the relevant factors for them to consider with respect to approving the advisory and sub-advisory agreements. In addition, the Trustees who are not deemed “interested persons”
(as defined by the Investment Company Act of 1940, as amended) of the Fund (the “Independent Trustees”) met in executive session to discuss the approval of the advisory and sub-advisory agreements. As part of their
discussion, the Independent Trustees confirmed their understanding of the need to have asked about, and received answers to, any matters that they believed are relevant to determining whether to approve the continuation of
the advisory and sub-advisory agreements.
In advance of the meeting, the Advisor sent detailed information to the Trustees to assist them in their evaluation of the advisory and sub-advisory agreements. This
information included, but was not limited to, the following:
|
(1)
|
A memorandum from outside legal counsel that described the fiduciary duties of the Board with respect to approving the continuation of the advisory and sub-advisory agreements and the
relevant factors for consideration;
|
|
|
(2)
|
A memorandum from the Advisor that listed the factors relevant to the Board’s approval of the continuation of the advisory and sub-advisory agreements and also referenced the documents
that had been provided to help the Board assess each such factor;
|
|
|
(3)
|
The Advisor’s financial statements from its most recent Form 10-K and Form 10-Q;
|
|
|
(4)
|
Summaries of the advisory and sub-advisory agreements;
|
|
|
(5)
|
A recent Fund fact sheet, which included, among other things, Fund performance over various periods;
|
|
HENNESSY FUNDS
|
1-800-966-4354
|
29
|
(6)
|
A description of the range of services provided by the Advisor and the Sub-Advisor and the distinction between the Advisor-provided services and the Sub-Advisor-provided services;
|
|
|
(7)
|
A peer expense comparison of the net expense ratio and investment advisory fee of the Fund;
|
|
|
(8)
|
A memorandum from the Advisor regarding economies of scale;
|
|
|
(9)
|
A completed questionnaire from the Sub-Advisor;
|
|
|
(10)
|
A summary of the Sub-Advisor’s responses to the questionnaire, as well as relevant information from the Sub-Advisor’s Form ADVs Parts 1 and 2 and the certifications submitted by the
Sub-Advisor each quarter;
|
|
|
(11)
|
Financial information of the Sub-Advisor and its parent company; and
|
|
|
(12)
|
The Sub-Advisor’s Code of Ethics.
|
The Trustees reviewed and discussed all of the information provided by the Advisor and the Sub-Advisor. Following this review, and further discussion with the Advisor, the
Trustees concluded that the information provided before and at the meeting addressed all of the relevant matters that they wanted to consider in assessing the performance of the Funds and the performance of the Advisor and
the Sub-Advisor under the advisory and sub-advisory agreements, and that said information provided them with a fulsome understanding of the advisory and sub-advisory agreements and the services provided by the Advisor and
the Sub-Advisor.
All of the factors discussed were considered as a whole by the Trustees, as well as by the Independent Trustees meeting in executive session. The Trustees viewed the relevant
factors in their totality, with no single factor being the principal or determinative factor in the Trustees’ determination of whether to approve the continuation of the advisory and sub-advisory agreements. The Trustees
recognized that the management and fee arrangements for the Fund are the result of years of review and discussion between the Independent Trustees and the Advisor, that certain aspects of such arrangements may receive
greater scrutiny in some years than in others, and that the Trustees’ conclusions may be based, in part, on their consideration of these same arrangements and information received during the course of the year and in prior
years.
Prior to approving the continuation of the advisory and sub-advisory agreements, the Trustees, including the Independent Trustees in executive session, considered, among other
items:
|
(1)
|
The nature and quality of the advisory services provided by the Advisor and the Sub-Advisor;
|
|
|
(2)
|
A comparison of the fees and expenses of the Fund to other similar funds;
|
|
|
(3)
|
Whether economies of scale are recognized by the Fund;
|
|
|
(4)
|
The costs and profitability of the Fund to the Advisor and the Sub-Advisor;
|
|
|
(5)
|
The performance of the Fund; and
|
|
|
(6)
|
Any benefits to the Advisor and the Sub-Advisor from serving as an investment advisor to the Fund (other than the advisory and sub-advisory fees).
|
The material considerations and determinations of the Trustees, including the Independent Trustees, were as follows:
|
(1)
|
The Trustees considered the services identified below that are provided by the Advisor. Based on this review and an assessment of the Advisor’s performance, the Trustees concluded that
the Advisor provides high-quality services to the Fund, and they noted that their overall confidence in the Advisor was high. The
|
|
WWW.HENNESSYFUNDS.COM
|
30
|
BOARD APPROVAL OF INVESTMENT ADVISORY AGREEMENTS
|
|
Trustees also concluded that they were satisfied with the nature, extent, and quality of the advisory services provided to the Fund by the Advisor and that the nature and extent of the
services provided by the Advisor were appropriate to assure that the Fund’s operations are conducted in compliance with applicable laws, rules, and regulations.
|
|
(a)
|
The Advisor oversees the Sub-Advisor for the Fund, and the Sub-Advisor acts as the portfolio manager for the Fund by providing portfolio management services.
|
||
|
(b)
|
The Advisor performs a daily reconciliation of portfolio positions and cash for the Fund.
|
||
|
(c)
|
The Advisor monitors the liquidity of each Fund.
|
||
|
(d)
|
The Advisor monitors the Fund’s compliance with its investment objectives and restrictions and federal securities laws.
|
||
|
(e)
|
The Advisor maintains a compliance program (including a code of ethics), conducts ongoing reviews of the compliance programs of the Sub-Advisor and the Fund’s other service providers
(including their codes of ethics, as appropriate), conducts on-site visits to the Sub-Advisor and the Fund’s other service providers, as feasible, monitors incidents of abusive trading practices, reviews Fund
expense accruals, payments, and fixed expense ratios, evaluates insurance providers for fidelity bond, D&O/E&O insurance, and cybersecurity insurance coverage, manages regulatory examination compliance and
responses, conducts employee compliance training, reviews reports provided by service providers, and maintains books and records.
|
||
|
(f)
|
The Advisor oversees the selection and continued employment of the Sub-Advisor, reviews the Fund’s investment performance, and monitors the Sub-Advisor’s adherence to the Fund’s
investment objectives, policies, and restrictions.
|
||
|
(g)
|
The Advisor oversees service providers that provide accounting, administration, distribution, transfer agency, custodial, sales, marketing, public relations, audit, information
technology, and legal services to the Fund.
|
||
|
(h)
|
The Advisor maintains in-house marketing and distribution departments on behalf of the Fund.
|
||
|
(i)
|
The Advisor prepares or directs the preparation of all regulatory filings for the Fund, including writing and annually updating the Fund’s prospectus and related documents.
|
||
|
(j)
|
For each annual report of the Fund, the Advisor reviews the written summary prepared by the Sub-Advisor of the Fund’s performance during the most recent 12-month period.
|
||
|
(k)
|
The Advisor oversees distribution of the Fund through third-party broker/dealers and independent financial institutions such as Charles Schwab, Inc., Fidelity, TD Ameritrade, and
Pershing. The Advisor participates in “no transaction fee” (“NTF”) programs with these companies on behalf of the Fund, which allow customers to purchase the Fund through third-party distribution channels without
paying a transaction fee. The Advisor compensates, in part, a number of these third-party providers of NTF programs out of its own revenues.
|
||
|
(l)
|
The Advisor pays the incentive compensation of the Fund’s compliance officers and employs other staff, such as legal, marketing, national accounts, distribution, sales, administrative,
and trading oversight personnel, as well as management executives.
|
|
HENNESSY FUNDS
|
1-800-966-4354
|
31
|
(m)
|
The Advisor provides a quarterly compliance certification to the Board.
|
||
|
(n)
|
The Advisor prepares or reviews all Board materials, presents to and leads discussions with the Board, prepares or reviews all meeting minutes, and arranges for Board training and
education.
|
|
(2)
|
The Trustees considered the services identified below that are provided by the Sub-Advisor. Based on this review and an assessment of the Sub-Advisor’s performance, the Trustees concluded
that the Sub-Advisor provides high-quality services to the Fund. The Trustees also concluded that they were satisfied with the nature, extent, and quality of the advisory services provided to the Fund by the
Sub-Advisor and that the nature and extent of the services provided by the Sub-Advisor were appropriate to assure that the Fund’s portfolio aligns properly with its investment objective and principal investment
strategies.
|
|
(a)
|
The Sub-Advisor acts as the portfolio manager for the Fund. In this capacity, the Sub-Advisor does the following:
|
|
(i)
|
manages the composition of the Fund’s portfolio, including the purchase, retention, and disposition of portfolio securities in accordance with the Fund’s investment objectives, policies,
and restrictions;
|
|||
|
(ii)
|
seeks best execution for the Fund’s portfolio; and
|
|||
|
(iii)
|
manages proxy voting for the Fund.
|
|
(b)
|
The Sub-Advisor ensures that its compliance program includes policies and procedures relevant to the Fund and the Sub-Advisor’s duties as a portfolio manager to the Fund.
|
||
|
(c)
|
For each annual report of the Fund, the Sub-Advisor prepares a written summary of the Fund’s performance during the most recent 12-month period.
|
||
|
(d)
|
The Sub-Advisor provides a quarterly compliance certification to the Board regarding trading and allocation practices, supervisory matters, the Sub-Advisor’s compliance program (including
its code of ethics), compliance with the Fund’s policies, and general firm updates.
|
|
(3)
|
Trustees considered the distinction between the services performed by the Advisor and the Sub-Advisor. The Trustees noted that the management of the Fund, including the oversight of the
Sub-Advisor, involves more comprehensive and substantive duties than the duties of the Sub-Advisor. Specifically, the Trustees considered the lists of Advisor services previously identified and concluded that the
services performed by the Advisor for the Fund require a higher level of service and oversight than the services performed by the Sub-Advisor. Based on this determination, the Trustees concluded that the
differential in advisory fees between the Advisor and the Sub-Advisor is reasonable.
|
|
|
(4)
|
The Trustees compared the performance of the Fund to benchmark indices over various periods and noted that the Trustees review and discuss reports comparing the investment performance of
the Fund to various indices at each quarterly Board meeting. Based on such information, the Trustees determined that the Advisor and the Sub-Advisor manage the Fund in a manner materially consistent with its stated
investment objective and style. The Trustees concluded that the performance of the Fund over various periods warranted the continuation of the advisory and sub-advisory agreements.
|
|
|
(5)
|
The Trustees reviewed the advisory fees and overall expense ratios of the Fund compared to other funds similar in asset size and investment objective to the Fund using data from
Morningstar. As part of the discussion with management,
|
|
WWW.HENNESSYFUNDS.COM
|
32
|
BOARD APPROVAL OF INVESTMENT ADVISORY AGREEMENTS
|
|
the Trustees ensured that they understood and were comfortable with the criteria used to determine the mutual funds included in the Morningstar categories for purposes of the materials
considered at the meeting. The Trustees determined that the advisory fee and overall expense ratio of the Fund falls within a reasonable range of the advisory fees and overall expense ratios of other comparable
funds and concluded that they are reasonable and warranted continuation of the advisory and sub-advisory agreements.
|
||
|
(6)
|
The Trustees also considered whether the Advisor was realizing economies of scale that should be shared with the Fund’s shareholders. The Trustees noted that the majority of expenses
incurred to manage the Fund are variable asset-based fees, so the Advisor does not realize material economies of scale relating to these expenses as the assets of the Fund increase. For example, third-party
platform fees and sub-advisory fees increase as the Fund’s assets grow.
|
|
|
(7)
|
The Trustees considered the profitability of the Advisor and the Sub-Advisor, including the impact of mutual fund platform fees on the Advisor’s profitability, and also considered the
resources and revenues that the Advisor has put into managing and distributing the Fund. The Trustees then concluded that the profits of the Advisor and the Sub-Advisor are reasonable and not excessive when
compared to profitability guidelines set forth in relevant court cases.
|
|
|
(8)
|
The Trustees considered the high level of professionalism and knowledge of the Advisor’s employees and concluded that this was beneficial to the Fund and its shareholders.
|
|
|
(9)
|
The Trustees considered any benefits to the Advisor and the Sub-Advisor from serving as an advisor to the Fund (other than the advisory and sub-advisory fees). The Trustees noted that the
Advisor and the Sub-Advisor may derive ancillary benefits from, by way of example, their association with the Fund in the form of proprietary and third-party research products and services received from
broker-dealers that execute portfolio trades for the Fund. The Trustees determined that any such products and services have been used for legitimate purposes relating to the Fund by providing assistance in the
investment decision-making process. The Trustees concluded that any additional benefits realized by the Advisor and the Sub-Advisor from their relationship with the Fund were reasonable, which was based on, among
other things, the Trustees’ findings that (i) the research, analytical, statistical, and other information and services provided by brokers are merely supplemental to the Advisor’s and the Sub-Advisor’s own efforts
in the performance of their duties under the advisory and sub-advisory agreements and (ii) although the Sub-Advisor could derive benefits from the conversion of Fund shareholders into separate account clients, the
Fund also could benefit from potential institutional shareholders who might choose to invest in the Fund.
|
After reviewing the materials and information provided at the meeting, as well as other information regularly provided at the Board’s quarterly meetings throughout the year
regarding the quality of services provided by the Advisor and the Sub-Advisor, the performance of the Fund, expense information, brokerage commissions information, the adequacy and efficacy of the Advisor’s and the
Sub-Advisor’s written policies and procedures, other regulatory compliance issues, trading information and related matters, and other factors that the Trustees deemed relevant, the Trustees, including the Independent
Trustees, approved the continuation of the advisory and sub-advisory agreements.
|
HENNESSY FUNDS
|
1-800-966-4354
|
33
For information, questions, or assistance, please call
The Hennessy Funds
800-966-4354 or 415-899-1555
INVESTMENT ADVISOR
Hennessy Advisors, Inc.
7250 Redwood Boulevard, Suite 200
Novato, California 94945
ADMINISTRATOR,
TRANSFER AGENT,
DIVIDEND PAYING AGENT, &
SHAREHOLDER SERVICING AGENT
U.S. Bancorp Fund Services, LLC
d/b/a U.S. Bank Global Fund Services
P.O. Box 701
Milwaukee, Wisconsin 53201-0701
CUSTODIAN
U.S. Bank N.A.
Custody Operations
1555 North River Center Drive, Suite 302
Milwaukee, Wisconsin 53212
TRUSTEES
Neil J. Hennessy
J. Dennis DeSousa
Robert T. Doyle
Claire Garvie
Gerald P. Richardson
COUNSEL
Foley & Lardner LLP
777 East Wisconsin Avenue
Milwaukee, Wisconsin 53202-5306
INDEPENDENT REGISTERED
PUBLIC ACCOUNTING FIRM
Tait, Weller & Baker LLP
Two Liberty Place
50 South 16th Street, Suite 2900
Philadelphia, Pennsylvania 19102-2529
DISTRIBUTOR
Quasar Distributors, LLC
111 East Kilbourn Avenue, Suite 1250
Milwaukee, Wisconsin 53202
www.hennessyfunds.com | 800-966-4354
This report has been prepared for shareholders and may be distributed to
others only if preceded or accompanied by a current prospectus.
SEMI-ANNUAL REPORT
APRIL 30, 2022

HENNESSY LARGE CAP FINANCIAL FUND
Investor Class HLFNX
Institutional Class HILFX
www.hennessyfunds.com | 1-800-966-4354
(This Page Intentionally Left Blank.)
Contents
|
Letter to Shareholders
|
2
|
|
Performance Overview
|
4
|
|
Financial Statements
|
|
|
Schedule of Investments
|
5
|
|
Statement of Assets and Liabilities
|
8
|
|
Statement of Operations
|
9
|
|
Statements of Changes in Net Assets
|
11
|
|
Financial Highlights
|
12
|
|
Notes to the Financial Statements
|
16
|
|
Expense Example
|
24
|
|
Proxy Voting Policy and Proxy Voting Records
|
26
|
|
Availability of Quarterly Portfolio Schedule
|
26
|
|
Important Notice Regarding Delivery of Shareholder Documents
|
26
|
|
Electronic Delivery
|
26
|
|
Board Approval of Investment Advisory Agreement
|
27
|
|
HENNESSY FUNDS
|
1-800-966-4354
|
May 2022
Dear Hennessy Funds Shareholder:
We’d like to start our semi-annual letter with a pause. At the end of 2021, we looked forward to a new year – a potentially calmer year – having come
through almost two full years of the coronavirus pandemic. As people, we were aware our lives had changed, but we hoped for a better 2022; as investors, we were aware that the economy was strong and employment was
robust, yet challenges loomed, including inflation, supply chain disruptions, and tightening monetary policy; as employees, students, and family members, we recognized much was different, but we sought a return to what’s
familiar. What we didn’t know was that a world leader who controls one of the largest militaries on the planet was about to start one of the worst atrocities in Europe since World War II. Our thoughts are with the
Ukrainian people, and our hope is for this unjustified, senseless human tragedy to end quickly.
The equity market started 2022 on a high note, with the S&P 500® Index hitting an all-time high on the first trading day of the year. This turned out to be the last hurrah for a market that saw a
continuous march higher in 2021, having hit 70 new all-time highs, with a new all-time high being recorded on average every three and a half days. Concerns in the market then coalesced and overpowered bullish sentiment,
and the market has spiraled lower throughout 2022. Factors that drove the market lower include: tightening monetary policy as the Federal Reserve has begun raising rates and has announced plans for shrinking its $8.5
trillion asset portfolio; inflation, higher energy costs, and their effects on the domestic and global economies; continued supply chain disruptions; investors’ indiscriminate liquidation of broad-based ETFs and index
funds and the detrimental effect on equities; and the near-term and long-term global implications of the Russian invasion of Ukraine.
While markets are adjusting, many positive conditions remain intact. Corporate balance sheets and profits remain strong, GDP growth
remains positive, the consumer continues to show resilience in the face of rising prices, cash is abundant both at the corporate and household levels, unemployment is exceptionally low, and our financial system remains
healthy. Markets are also experiencing a change in leadership, as value stocks have been outperforming growth stocks, and traditionally defensive sectors such as Utilities and Consumer Staples have been outperforming the
broader market. Finally, the Energy sector has soared in 2022, as companies reap the benefits of dramatically higher oil and natural gas prices, and shareholders are rewarded with significantly higher dividends,
aggressive buybacks, and higher stock prices after many years of underperformance for the sector.
With history as our guide, we are hopeful that eventually the market may bottom and head higher again. Since the financial crisis of
2008, we have experienced many corrections and many recoveries to new highs. The Dow Jones Industrial Average has dropped over 10% eight times, including the current drop, for a median decline of 14.00%, and on average,
it took 45 trading days to drop from peak to trough and 127 trading days to return to the previous peak. Since the current drop has taken longer to go from peak to its recent trough, it may take some time for a recovery
in prices to truly take hold.
On a positive note, valuations have come in, and many stocks have become more attractive, especially for longer-term investors. We
note, however, that the concept of “historically cheap stocks” does not, on its own, move the market higher. Rather, it is
|
WWW.HENNESSYFUNDS.COM
|
2
|
LETTER TO SHAREHOLDERS
|
overall capitulation and improving fundamentals that could bring buyers back into the market and reverse any bearish trends. Investors need to see improving company earnings, retreating
inflationary trends, a measured pace of interest rate increases globally that does not cause significant economic contraction, hope for a more peaceful and orderly world economic system unconstrained by supply
bottlenecks and other hindrances to global trade, and, most importantly, a subsidence of the deleterious effects of the coronavirus pandemic. While that may seem like a “tall order,” we believe that patient investing,
focusing on value, quality, and downside risk mitigation, works well over the longer term.
During this tumultuous period, performance of the majority of the Hennessy Funds has been relatively strong when compared to the overall
market as well as to our benchmarks. During the six months ended April 30, 2022, the Dow Jones Industrial Average, the S&P 500®
Index, and the NASDAQ Composite Index dropped 7.05%, 9.65%, and 20.15%, respectively, on a total return basis. During this period when these three major indices saw significant declines, we were pleased that seven of our
16 Funds posted positive total returns, 10 of our 14 domestic Funds outperformed the S&P 500® Index, and over half of our active funds
outperformed their primary benchmarks.
We thank you, our shareholders, for your continued interest in our family of Funds. We are grateful for the trust you put in us, and
we will continue to strive to manage our portfolios for long-term performance, ever mindful of downside risk. While volatility and uncertainty may impact the markets in the short-term, we encourage investors to stay the
course, maintain a diversified portfolio, and keep a long-term perspective. If you have any questions or would like to speak with us, please don’t hesitate to call us directly at (800) 966-4354. In closing, we would also
like to thank all of the healthcare and frontline workers that have worked – and still work – tirelessly throughout the coronavirus pandemic.
Best regards,
|
|
|
|
|
Ryan C. Kelley, CFA
|
|
|
Chief Investment Officer,
|
|
|
Senior Vice President, and Portfolio Manager
|
Past performance does not guarantee future results.
Mutual fund investing involves risk. Principal loss is possible.
Opinions expressed are those of Ryan C. Kelley and are subject to change, are not guaranteed, and should not be considered investment advice.
The Dow Jones Industrial Average and S&P 500® Index are commonly used to measure the performance of U.S.
stocks. The NASDAQ Composite Index comprises all common stocks listed on The NASDAQ Stock Market and is commonly used to measure the performance of technology-related stocks. The indices are used herein for comparative
purposes in accordance with SEC regulations. One cannot invest directly in an index. All returns are shown on a total return basis.
Please refer to the Performance Overview section for more detailed performance information.
|
HENNESSY FUNDS
|
1-800-966-4354
|
3
Performance Overview (Unaudited)
AVERAGE ANNUAL TOTAL RETURN FOR PERIODS ENDED APRIL 30, 2022
|
Six
|
One
|
Five
|
Ten
|
|
|
Months(1)
|
Year
|
Years
|
Years
|
|
|
Hennessy Large Cap Financial Fund –
|
||||
|
Investor Class (HLFNX)
|
-24.53%
|
-18.71%
|
8.41%
|
10.07%
|
|
Hennessy Large Cap Financial Fund –
|
||||
|
Institutional Class (HILFX)(2)
|
-24.39%
|
-18.41%
|
8.78%
|
10.35%
|
|
Russell 1000® Index Financials
|
-13.99%
|
-3.31%
|
13.03%
|
14.04%
|
|
Russell 1000® Index
|
-11.29%
|
-2.10%
|
13.44%
|
13.53%
|
Expense ratios: 1.68% (Investor Class); 1.32% (Institutional Class)
|
(1)
|
Periods of less than one year are not annualized.
|
|
(2)
|
The inception date of Institutional Class shares is June 15, 2015. Performance shown prior to the inception of Institutional Class shares reflects the performance of Investor Class
shares and includes expenses that are not applicable to, and are higher than, those of Institutional Class shares.
|
_______________
Performance data quoted represents past performance; past performance does not guarantee future results. The investment return and principal value of an investment will
fluctuate so that an investor’s shares, when redeemed, may be worth more or less than their original cost. The performance table does not reflect the deduction of taxes that a shareholder would pay on Fund distributions
or the redemption of Fund shares. Current performance of the Fund may be lower or higher than the performance quoted. Performance data current to the most recent month end may be obtained by visiting
www.hennessyfunds.com. Performance for periods including or prior to October 26, 2012, is that of the FBR Large Cap Financial Fund.
The Russell 1000® Index Financials is a subset of the Russell 1000® Index that measures the performance of the securities classified in the Financials sector of the large-cap U.S. equity market. The Russell 1000® Index comprises the 1,000 largest companies in the Russell 3000® Index based on
market capitalization. One cannot invest directly in an index. These indices are used for comparative purposes in accordance with Securities and Exchange Commission regulations.
Frank Russell Company (“Russell”) is the source and owner of the trademarks, service marks, and copyrights related to the Russell Indexes. Russell® is a trademark of Frank Russell Company. Neither Russell nor its licensors accept any liability for any errors or omissions in the Russell Indexes or Russell ratings or
underlying data and no party may rely on any Russell Indexes or Russell ratings or underlying data contained in this communication. No further distribution of Russell data is permitted without Russell’s express written
consent. Russell does not promote, sponsor, or endorse the content of this communication.
The expense ratios presented are from the most recent prospectus. The expense ratios for the current reporting period are available in the Financial Highlights section of this report.
|
WWW.HENNESSYFUNDS.COM
|
4
|
PERFORMANCE OVERVIEW/SCHEDULE OF INVESTMENTS
|
Financial Statements
|
Schedule of Investments as of April 30, 2022 (Unaudited)
|
HENNESSY LARGE CAP FINANCIAL FUND
(% of Net Assets)
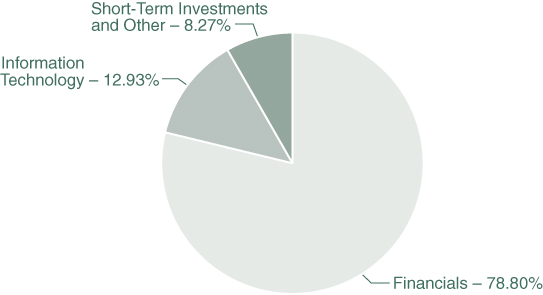
|
TOP TEN HOLDINGS (EXCLUDING MONEY MARKET FUNDS)
|
% NET ASSETS
|
|
Berkshire Hathaway Inc., Class B
|
6.11%
|
|
Bank of America Corp.
|
5.30%
|
|
Wells Fargo & Co.
|
5.20%
|
|
JPMorgan Chase & Co.
|
4.97%
|
|
Capital One Financial Corp.
|
4.95%
|
|
Citizens Financial Group, Inc.
|
4.92%
|
|
KeyCorp
|
4.75%
|
|
State Street Corp.
|
4.69%
|
|
Morgan Stanley
|
4.50%
|
|
Huntington Bancshares, Inc.
|
4.30%
|
Note: For presentation purposes, the Fund has grouped some of the industry categories. For purposes of categorizing securities for compliance with Section 8(b)(1) of the Investment Company Act
of 1940, as amended, the Fund uses more specific industry classifications.
The Global Industry Classification Standard (GICS®) was developed by and is the exclusive property and a service
mark of MSCI, Inc. and Standard & Poor’s Financial Services LLC. It has been licensed for use by the Hennessy Funds.
|
HENNESSY FUNDS
|
1-800-966-4354
|
5
|
COMMON STOCKS – 91.73%
|
Number
|
% of
|
||||||||||
|
|
of Shares
|
Value
|
Net Assets
|
|||||||||
|
Financials – 78.80%
|
||||||||||||
|
Ally Financial, Inc.
|
33,000
|
$
|
1,318,680
|
2.49
|
%
|
|||||||
|
Bank of America Corp.
|
78,500
|
2,800,880
|
5.30
|
%
|
||||||||
|
Berkshire Hathaway, Inc., Class B (a)
|
10,000
|
3,228,300
|
6.11
|
%
|
||||||||
|
BlackRock, Inc.
|
1,300
|
812,084
|
1.54
|
%
|
||||||||
|
Blackstone, Inc.
|
3,500
|
355,495
|
0.67
|
%
|
||||||||
|
Capital One Financial Corp.
|
21,000
|
2,617,020
|
4.95
|
%
|
||||||||
|
Citigroup, Inc.
|
44,000
|
2,121,240
|
4.01
|
%
|
||||||||
|
Citizens Financial Group, Inc.
|
66,000
|
2,600,400
|
4.92
|
%
|
||||||||
|
Fifth Third Bancorp
|
50,000
|
1,876,500
|
3.55
|
%
|
||||||||
|
Huntington Bancshares, Inc.
|
173,000
|
2,274,950
|
4.30
|
%
|
||||||||
|
JPMorgan Chase & Co.
|
22,000
|
2,625,920
|
4.97
|
%
|
||||||||
|
KeyCorp
|
130,000
|
2,510,300
|
4.75
|
%
|
||||||||
|
Moody’s Corp.
|
5,800
|
1,835,584
|
3.47
|
%
|
||||||||
|
Morgan Stanley
|
29,500
|
2,377,405
|
4.50
|
%
|
||||||||
|
Signature Bank
|
7,000
|
1,695,750
|
3.21
|
%
|
||||||||
|
State Street Corp.
|
37,000
|
2,477,890
|
4.69
|
%
|
||||||||
|
The Goldman Sachs Group, Inc.
|
7,000
|
2,138,430
|
4.04
|
%
|
||||||||
|
Tradeweb Markets, Inc.
|
8,000
|
569,520
|
1.08
|
%
|
||||||||
|
Truist Financial Corp.
|
26,000
|
1,257,100
|
2.38
|
%
|
||||||||
|
Wells Fargo & Co.
|
63,000
|
2,748,690
|
5.20
|
%
|
||||||||
|
Zions Bancorp NA
|
25,000
|
1,412,750
|
2.67
|
%
|
||||||||
|
|
41,654,888
|
78.80
|
%
|
|||||||||
|
Information Technology – 12.93%
|
||||||||||||
|
Apple, Inc.
|
14,000
|
2,207,100
|
4.17
|
%
|
||||||||
|
Block, Inc. (a)
|
900
|
89,586
|
0.17
|
%
|
||||||||
|
Mastercard, Inc., Class A
|
5,000
|
1,816,900
|
3.44
|
%
|
||||||||
|
PayPal Holdings, Inc. (a)
|
7,000
|
615,510
|
1.16
|
%
|
||||||||
|
SoFi Technologies, Inc. (a)
|
24,000
|
146,880
|
0.28
|
%
|
||||||||
|
Visa, Inc., Class A
|
9,200
|
1,960,796
|
3.71
|
%
|
||||||||
|
|
6,836,772
|
12.93
|
%
|
|||||||||
|
|
||||||||||||
|
Total Common Stocks
|
||||||||||||
|
(Cost $41,725,206)
|
48,491,660
|
91.73
|
%
|
|||||||||
The accompanying notes are an integral part of these financial statements.
|
WWW.HENNESSYFUNDS.COM
|
6
|
SCHEDULE OF INVESTMENTS
|
|
SHORT-TERM INVESTMENTS – 9.43%
|
Number
|
% of
|
||||||||||
|
|
of Shares
|
Value
|
Net Assets
|
|||||||||
|
Money Market Funds – 9.43%
|
||||||||||||
|
First American Government Obligations Fund,
|
||||||||||||
|
Institutional Class, 0.22% (b)
|
2,728,000
|
$
|
2,728,000
|
5.16
|
%
|
|||||||
|
First American Treasury Obligations Fund,
|
||||||||||||
|
Institutional Class, 0.29% (b)
|
2,258,894
|
2,258,894
|
4.27
|
%
|
||||||||
|
|
||||||||||||
|
Total Short-Term Investments
|
||||||||||||
|
(Cost $4,986,894)
|
4,986,894
|
9.43
|
%
|
|||||||||
|
|
||||||||||||
|
Total Investments
|
||||||||||||
|
(Cost $46,712,100) – 101.16%
|
53,478,554
|
101.16
|
%
|
|||||||||
|
Liabilities in Excess of Other Assets – (1.16)%
|
(614,271
|
)
|
(1.16
|
)%
|
||||||||
|
|
||||||||||||
|
TOTAL NET ASSETS – 100.00%
|
$
|
52,864,283
|
100.00
|
%
|
||||||||
Percentages are stated as a percent of net assets.
|
(a)
|
Non-income-producing security.
|
|
(b)
|
The rate listed is the fund’s seven-day yield as of April 30, 2022.
|
Summary of Fair Value Exposure as of April 30, 2022
The following is a summary of the inputs used to value the Fund’s net assets as of April 30, 2022 (see Note 3 in the accompanying Notes to the Financial Statements):
|
Common Stocks
|
Level 1
|
Level 2
|
Level 3
|
Total
|
||||||||||||
|
Financials
|
$
|
41,654,888
|
$
|
—
|
$
|
—
|
$
|
41,654,888
|
||||||||
|
Information Technology
|
6,836,772
|
—
|
—
|
6,836,772
|
||||||||||||
|
Total Common Stocks
|
$
|
48,491,660
|
$
|
—
|
$
|
—
|
$
|
48,491,660
|
||||||||
|
Short-Term Investments
|
||||||||||||||||
|
Money Market Funds
|
$
|
4,986,894
|
$
|
—
|
$
|
—
|
$
|
4,986,894
|
||||||||
|
Total Short-Term Investments
|
$
|
4,986,894
|
$
|
—
|
$
|
—
|
$
|
4,986,894
|
||||||||
|
Total Investments
|
$
|
53,478,554
|
$
|
—
|
$
|
—
|
$
|
53,478,554
|
||||||||
The accompanying notes are an integral part of these financial statements.
|
HENNESSY FUNDS
|
1-800-966-4354
|
7
Financial Statements
|
Statement of Assets and
Liabilities as of April 30, 2022 (Unaudited)
|
|
ASSETS:
|
||||
|
Investments in securities, at value (cost $46,712,100)
|
$
|
53,478,554
|
||
|
Dividends and interest receivable
|
86,480
|
|||
|
Receivable for fund shares sold
|
63,348
|
|||
|
Return of capital receivable
|
1,663
|
|||
|
Prepaid expenses and other assets
|
21,838
|
|||
|
Total assets
|
53,651,883
|
|||
|
LIABILITIES:
|
||||
|
Payable for securities purchased
|
588,020
|
|||
|
Payable for fund shares redeemed
|
111,405
|
|||
|
Payable to advisor
|
42,130
|
|||
|
Payable to administrator
|
11,795
|
|||
|
Payable to auditor
|
11,228
|
|||
|
Accrued distribution fees
|
3,920
|
|||
|
Accrued service fees
|
2,280
|
|||
|
Accrued trustees fees
|
5,876
|
|||
|
Accrued expenses and other payables
|
10,946
|
|||
|
Total liabilities
|
787,600
|
|||
|
NET ASSETS
|
$
|
52,864,283
|
||
|
NET ASSETS CONSISTS OF:
|
||||
|
Capital stock
|
$
|
43,213,393
|
||
|
Total distributable earnings
|
9,650,890
|
|||
|
Total net assets
|
$
|
52,864,283
|
||
|
NET ASSETS:
|
||||
|
Investor Class
|
||||
|
Shares authorized (no par value)
|
Unlimited
|
|||
|
Net assets applicable to outstanding shares
|
$
|
25,824,886
|
||
|
Shares issued and outstanding
|
1,018,123
|
|||
|
Net asset value, offering price, and redemption price per share
|
$
|
25.37
|
||
|
Institutional Class
|
||||
|
Shares authorized (no par value)
|
Unlimited
|
|||
|
Net assets applicable to outstanding shares
|
$
|
27,039,397
|
||
|
Shares issued and outstanding
|
1,054,738
|
|||
|
Net asset value, offering price, and redemption price per share
|
$
|
25.64
|
||
The accompanying notes are an integral part of these financial statements.
|
WWW.HENNESSYFUNDS.COM
|
8
|
STATEMENT OF ASSETS AND LIABILITIES/STATEMENT OF OPERATIONS
|
Financial Statements
|
Statement of Operations for the six months ended April 30, 2022 (Unaudited)
|
|
INVESTMENT INCOME:
|
||||
|
Dividend income
|
$
|
609,730
|
||
|
Interest income
|
878
|
|||
|
Total investment income
|
610,608
|
|||
|
EXPENSES:
|
||||
|
Investment advisory fees (See Note 5)
|
299,700
|
|||
|
Administration, accounting, custody, and transfer agent fees (See Note 5)
|
42,190
|
|||
|
Sub-transfer agent expenses – Investor Class (See Note 5)
|
31,960
|
|||
|
Sub-transfer agent expenses – Institutional Class (See Note 5)
|
9,523
|
|||
|
Distribution fees – Investor Class (See Note 5)
|
23,915
|
|||
|
Federal and state registration fees
|
17,728
|
|||
|
Service fees – Investor Class (See Note 5)
|
15,943
|
|||
|
Compliance expense (See Note 5)
|
15,156
|
|||
|
Audit fees
|
11,222
|
|||
|
Trustees’ fees and expenses
|
8,947
|
|||
|
Reports to shareholders
|
5,161
|
|||
|
Interest expense (See Note 7)
|
716
|
|||
|
Legal fees
|
450
|
|||
|
Other expenses
|
6,252
|
|||
|
Total expenses
|
488,863
|
|||
|
NET INVESTMENT INCOME
|
$
|
121,745
|
||
|
REALIZED AND UNREALIZED GAINS (LOSSES):
|
||||
|
Net realized gain on investments
|
$
|
4,016,220
|
||
|
Net change in unrealized appreciation/deprecation on investments
|
(22,161,550
|
)
|
||
|
Net loss on investments
|
(18,145,330
|
)
|
||
|
NET DECREASE IN NET ASSETS RESULTING FROM OPERATIONS
|
$
|
(18,023,585
|
)
|
|
The accompanying notes are an integral part of these financial statements.
|
HENNESSY FUNDS
|
1-800-966-4354
|
9
(This Page Intentionally Left Blank.)
|
WWW.HENNESSYFUNDS.COM
|
10
|
STATEMENTS OF CHANGES IN NET ASSETS
|
Financial Statements
|
Statements of Changes in Net Assets
|
|
Six Months Ended
|
||||||||
|
April 30, 2022
|
Year Ended
|
|||||||
|
(Unaudited)
|
October 31, 2021
|
|||||||
|
OPERATIONS:
|
||||||||
|
Net investment income (loss)
|
$
|
121,745
|
$
|
(190,967
|
)
|
|||
|
Net realized gain on investments
|
4,016,220
|
4,934,331
|
||||||
|
Net change in unrealized
|
||||||||
|
appreciation/depreciation on investments
|
(22,161,550
|
)
|
21,198,437
|
|||||
|
Net increase (decrease) in net
|
||||||||
|
assets resulting from operations
|
(18,023,585
|
)
|
25,941,801
|
|||||
|
DISTRIBUTIONS TO SHAREHOLDERS:
|
||||||||
|
Distributable earnings – Investor Class
|
(1,687,916
|
)
|
—
|
|||||
|
Distributable earnings – Institutional Class
|
(1,797,726
|
)
|
—
|
|||||
|
Total distributions
|
(3,485,642
|
)
|
—
|
|||||
|
CAPITAL SHARE TRANSACTIONS:
|
||||||||
|
Proceeds from shares subscribed – Investor Class
|
1,797,839
|
10,760,638
|
||||||
|
Proceeds from shares subscribed – Institutional Class
|
10,093,477
|
24,725,649
|
||||||
|
Dividends reinvested – Investor Class
|
1,636,788
|
—
|
||||||
|
Dividends reinvested – Institutional Class
|
1,782,399
|
—
|
||||||
|
Cost of shares redeemed – Investor Class
|
(3,731,016
|
)
|
(10,552,763
|
)
|
||||
|
Cost of shares redeemed – Institutional Class
|
(8,689,907
|
)
|
(23,051,103
|
)
|
||||
|
Net increase in net assets derived
|
||||||||
|
from capital share transactions
|
2,889,580
|
1,882,421
|
||||||
|
TOTAL INCREASE (DECREASE) IN NET ASSETS
|
(18,619,647
|
)
|
27,824,222
|
|||||
|
NET ASSETS:
|
||||||||
|
Beginning of period
|
71,483,930
|
43,659,708
|
||||||
|
End of period
|
$
|
52,864,283
|
$
|
71,483,930
|
||||
|
CHANGES IN SHARES OUTSTANDING:
|
||||||||
|
Shares sold – Investor Class
|
56,620
|
356,674
|
||||||
|
Shares sold – Institutional Class
|
309,167
|
786,529
|
||||||
|
Shares issued to holders as reinvestment
|
||||||||
|
of dividends – Investor Class
|
50,270
|
—
|
||||||
|
Shares issued to holders as reinvestment
|
||||||||
|
of dividends – Institutional Class
|
54,242
|
—
|
||||||
|
Shares redeemed – Investor Class
|
(119,939
|
)
|
(333,681
|
)
|
||||
|
Shares redeemed – Institutional Class
|
(292,694
|
)
|
(744,960
|
)
|
||||
|
Net increase in shares outstanding
|
57,666
|
64,562
|
||||||
The accompanying notes are an integral part of these financial statements.
|
HENNESSY FUNDS
|
1-800-966-4354
|
11
Financial Statements
|
Financial Highlights
|
For an Investor Class share outstanding throughout each period
|
Six Months Ended
|
||||
|
April 30, 2022
|
||||
|
(Unaudited)
|
||||
|
PER SHARE DATA:
|
||||
|
Net asset value, beginning of period
|
$
|
35.32
|
||
|
Income from investment operations:
|
||||
|
Net investment income (loss)
|
0.02
|
(1)
|
||
|
Net realized and unrealized gains (losses) on investments
|
(8.32
|
)
|
||
|
Total from investment operations
|
(8.30
|
)
|
||
|
Less distributions:
|
||||
|
Dividends from net investment income
|
—
|
|||
|
Dividends from net realized gains
|
(1.65
|
)
|
||
|
Total distributions
|
(1.65
|
)
|
||
|
Net asset value, end of period
|
$
|
25.37
|
||
|
TOTAL RETURN
|
-24.53
|
%(2)
|
||
|
SUPPLEMENTAL DATA AND RATIOS:
|
||||
|
Net assets, end of period (millions)
|
$
|
25.82
|
||
|
Ratio of expenses to average net assets
|
1.67
|
%(3)
|
||
|
Ratio of net investment income (loss) to average net assets
|
0.15
|
%(3)
|
||
|
Portfolio turnover rate(4)
|
40
|
%(2)
|
||
|
(1)
|
Calculated using the average shares outstanding method.
|
|
(2)
|
Not annualized.
|
|
(3)
|
Annualized.
|
|
(4)
|
Calculated on the basis of the Fund as a whole.
|
The accompanying notes are an integral part of these financial statements.
|
WWW.HENNESSYFUNDS.COM
|
12
|
FINANCIAL HIGHLIGHTS — INVESTOR CLASS
|
|
Year Ended October 31,
|
||||||||||||||||||
|
2021
|
2020
|
2019
|
2018
|
2017
|
||||||||||||||
|
$
|
22.33
|
$
|
22.63
|
$
|
21.43
|
$
|
22.02
|
$
|
16.23
|
|||||||||
|
(0.15
|
)(1)
|
(0.05
|
)(1)
|
(0.05
|
)(1)
|
(0.07
|
)
|
(0.08
|
)
|
|||||||||
|
13.14
|
(0.25
|
)
|
1.84
|
0.48
|
5.97
|
|||||||||||||
|
12.99
|
(0.30
|
)
|
1.79
|
0.41
|
5.89
|
|||||||||||||
|
—
|
—
|
—
|
—
|
(0.10
|
)
|
|||||||||||||
|
—
|
—
|
(0.59
|
)
|
(1.00
|
)
|
—
|
||||||||||||
|
—
|
—
|
(0.59
|
)
|
(1.00
|
)
|
(0.10
|
)
|
|||||||||||
|
$
|
35.32
|
$
|
22.33
|
$
|
22.63
|
$
|
21.43
|
$
|
22.02
|
|||||||||
|
58.17
|
%
|
-1.33
|
%
|
8.75
|
%
|
1.82
|
%
|
36.41
|
%
|
|||||||||
|
$
|
36.42
|
$
|
22.51
|
$
|
23.63
|
$
|
40.99
|
$
|
26.33
|
|||||||||
|
1.68
|
%
|
1.75
|
%
|
1.82
|
%
|
1.69
|
%
|
1.81
|
%
|
|||||||||
|
(0.47
|
)%
|
(0.21
|
)%
|
(0.23
|
)%
|
(0.44
|
)%
|
(0.41
|
)%
|
|||||||||
|
62
|
%
|
88
|
%
|
83
|
%
|
64
|
%
|
76
|
%
|
|||||||||
The accompanying notes are an integral part of these financial statements.
|
HENNESSY FUNDS
|
1-800-966-4354
|
13
Financial Statements
|
Financial Highlights
|
For an Institutional Class share outstanding throughout each period
|
Six Months Ended
|
||||
|
April 30, 2022
|
||||
|
(Unaudited)
|
||||
|
PER SHARE DATA:
|
||||
|
Net asset value, beginning of period
|
$
|
35.63
|
||
|
Income from investment operations:
|
||||
|
Net investment income (loss)
|
0.09
|
(1)
|
||
|
Net realized and unrealized gains (losses) on investments
|
(8.41
|
)
|
||
|
Total from investment operations
|
(8.32
|
)
|
||
|
Less distributions:
|
||||
|
Dividends from net investment income
|
—
|
|||
|
Dividends from net realized gains
|
(1.67
|
)
|
||
|
Total distributions
|
(1.67
|
)
|
||
|
Net asset value, end of period
|
$
|
25.64
|
||
|
TOTAL RETURN
|
-24.39
|
%(2)
|
||
|
SUPPLEMENTAL DATA AND RATIOS:
|
||||
|
Net assets, end of period (millions)
|
$
|
27.04
|
||
|
Ratio of expenses to average net assets
|
1.28
|
%(3)
|
||
|
Ratio of net investment income (loss) to average net assets
|
0.57
|
%(3)
|
||
|
Portfolio turnover rate(4)
|
40
|
%(2)
|
||
|
(1)
|
Calculated using the average shares outstanding method.
|
|
(2)
|
Not annualized.
|
|
(3)
|
Annualized.
|
|
(4)
|
Calculated on the basis of the Fund as a whole.
|
The accompanying notes are an integral part of these financial statements.
|
WWW.HENNESSYFUNDS.COM
|
14
|
FINANCIAL HIGHLIGHTS — INSTITUTIONAL CLASS
|
|
Year Ended October 31,
|
||||||||||||||||||
|
2021
|
2020
|
2019
|
2018
|
2017
|
||||||||||||||
|
$
|
22.44
|
$
|
22.68
|
$
|
21.39
|
$
|
21.91
|
$
|
16.26
|
|||||||||
|
(0.03
|
)(1)
|
0.02
|
(1)
|
0.01
|
(1)
|
0.03
|
0.18
|
|||||||||||
|
13.22
|
(0.26
|
)
|
1.87
|
0.45
|
5.78
|
|||||||||||||
|
13.19
|
(0.24
|
)
|
1.88
|
0.48
|
5.96
|
|||||||||||||
|
—
|
—
|
—
|
—
|
(0.31
|
)
|
|||||||||||||
|
—
|
—
|
(0.59
|
)
|
(1.00
|
)
|
—
|
||||||||||||
|
—
|
—
|
(0.59
|
)
|
(1.00
|
)
|
(0.31
|
)
|
|||||||||||
|
$
|
35.63
|
$
|
22.44
|
$
|
22.68
|
$
|
21.39
|
$
|
21.91
|
|||||||||
|
58.78
|
%
|
-1.06
|
%
|
9.16
|
%
|
2.16
|
%
|
36.92
|
%
|
|||||||||
|
$
|
35.06
|
$
|
21.15
|
$
|
21.97
|
$
|
8.85
|
$
|
5.83
|
|||||||||
|
1.32
|
%
|
1.45
|
%
|
1.43
|
%
|
1.34
|
%
|
1.50
|
%
|
|||||||||
|
(0.11
|
)%
|
0.08
|
%
|
0.05
|
%
|
(0.07
|
)%
|
(0.17
|
)%
|
|||||||||
|
62
|
%
|
88
|
%
|
83
|
%
|
64
|
%
|
76
|
%
|
|||||||||
The accompanying notes are an integral part of these financial statements.
|
HENNESSY FUNDS
|
1-800-966-4354
|
15
Financial Statements
|
Notes to the Financial Statements
April 30, 2022 (Unaudited)
|
1). ORGANIZATION
The Hennessy Large Cap Financial Fund (the “Fund”) is a series of Hennessy Funds Trust (the “Trust”), which was organized as a Delaware statutory trust on September 17, 1992. The Fund is an
open-end management investment company registered under the Investment Company Act of 1940, as amended. The investment objective of the Fund is capital appreciation. The Fund is a non-diversified fund.
The Fund offers Investor Class and Institutional Class shares. Each class of shares differs principally in its respective 12b-1 distribution and service, shareholder
servicing, and sub-transfer agent expenses. There are no sales charges. Each class has identical rights to earnings, assets, and voting privileges, except for class-specific expenses and exclusive rights to vote on
matters affecting only one class.
As an investment company, the Fund follows the investment company accounting and reporting guidance of the Financial Accounting Standards Board (“FASB”) Accounting Standard
Codification Topic 946 “Financial Services—Investment Companies.”
2). SIGNIFICANT ACCOUNTING POLICIES
The following is a summary of significant accounting policies consistently followed by the Fund in the preparation of the financial statements. These policies conform to U.S. generally accepted
accounting principles (“GAAP”).
|
a).
|
Securities Valuation – All investments in securities are valued in accordance with the Fund’s valuation policies and procedures, as described in Note 3.
|
|
b).
|
Federal Income Taxes – The Fund has elected to be taxed as a regulated investment company and intends to distribute substantially all of its taxable income to its shareholders and
otherwise comply with the provisions of the Internal Revenue Code of 1986, as amended, applicable to regulated investment companies. As a result, the Fund has made no provision for federal income taxes or excise
taxes. Net investment income/loss and realized gains/losses for federal income tax purposes may differ from those reported in the financial statements because of temporary book-basis and tax-basis differences.
Temporary differences are primarily the result of the treatment of wash sales for tax reporting purposes. The Fund recognizes interest and penalties related to income tax benefits, if any, in the Statement of
Operations as an income tax expense. Distributions from net realized gains for book purposes may include short-term capital gains, which are included as ordinary income to shareholders for tax purposes. The Fund
may utilize equalization accounting for tax purposes and designate earnings and profits, including net realized gains distributed to shareholders on redemption of shares, as part of the dividends paid deduction
for income tax purposes.
|
|
c).
|
Accounting for Uncertainty in Income Taxes – The Fund has accounting policies regarding recognition and measurement of tax positions taken or expected to be taken on a tax return. The
tax returns of the Fund for the prior three fiscal years are open for examination. The Fund has reviewed all open tax years in major tax jurisdictions and concluded that there is no impact on the Fund’s net
assets and no tax liability resulting from unrecognized tax benefits relating to uncertain income tax positions taken or expected to be taken on a tax return. The Fund’s major tax jurisdictions are U.S. federal
and Delaware.
|
|
WWW.HENNESSYFUNDS.COM
|
16
|
NOTES TO THE FINANCIAL STATEMENTS
|
|
d).
|
Income and Expenses – Dividend income is recognized on the ex-dividend date or as soon as information is available to the Fund. Interest income, which includes the amortization of
premium and accretion of discount, is recognized on an accrual basis. Market discounts, original issue discounts, and market premiums on debt securities are accreted or amortized to interest income over the life
of a security with a corresponding increase or decrease, as applicable, in the cost basis of such security using the yield-to-maturity method or, where applicable, the first call date of the security. Other
non-cash dividends are recognized as investment income at the fair value of the property received. The Fund is charged for those expenses that are directly attributable to its portfolio, such as advisory,
administration, and certain shareholder service fees. Income, expenses (other than expenses attributable to a specific class), and realized and unrealized gains/losses on investments are allocated to each class
of shares based on such class’s net assets.
|
|
e).
|
Distributions to Shareholders – Dividends from net investment income for the Fund, if any, are declared and paid annually, usually in December. Distributions of net realized capital
gains, if any, are declared and paid annually, usually in December.
|
|
f).
|
Security Transactions – Investment and shareholder transactions are recorded on the trade date. The Fund determines the realized gain/loss from an investment transaction by comparing
the original cost of the security lot sold with the net sale proceeds. Discounts and premiums on securities purchased are accreted or amortized, respectively, over the life of each such security.
|
|
g).
|
Use of Estimates – Preparing financial statements in accordance with GAAP requires management to make estimates and assumptions that affect the reported amounts of assets and
liabilities and disclosure of contingent assets and liabilities at the date of the financial statements, as well as the reported change in net assets during the reporting period. Actual results could differ from
those estimates.
|
|
h).
|
Share Valuation – The net asset value (“NAV”) per share of the Fund is calculated by dividing (i) the total value of the securities held by the Fund, plus cash and other assets, minus
all liabilities (including estimated accrued expenses) by (ii) the total number of Fund shares outstanding, rounded to the nearest $0.01. Fund shares are not priced on days the New York Stock Exchange is closed
for trading. The offering and redemption price per share for the Fund is equal to the Fund’s NAV per share.
|
|
i).
|
Recent Accounting Pronouncements and Regulatory Updates – In October 2020, the Securities and Exchange Commission (“SEC”) adopted new regulations governing the use of derivatives by
registered investment companies (“Rule 18f-4”). Rule 18f-4 imposes limits on the amount of derivatives a fund can enter into, eliminates the asset segregation framework currently used by funds to comply with
Section 18 of the 1940 Act, and requires funds whose use of derivatives is greater than a limited specified amount to establish and maintain a comprehensive derivatives risk management program and appoint a
derivatives risk manager. Funds are required to comply with Rule 18f-4 by August 19, 2022. The impact, if any, that Rule 18f-4 will have on the availability, liquidity, and performance of derivatives is unclear.
Management is currently evaluating the potential impact of Rule 18f-4 on the Fund. When fully implemented, Rule 18f-4 may require changes in how the Fund uses derivatives, adversely affect the Fund’s performance,
and increase costs related to the Fund’s use of derivatives.
|
|
In December 2020, the SEC adopted a new rule providing a framework for fund valuation practices (“Rule 2a-5”).
Rule 2a-5 establishes requirements for determining fair value in good faith for purposes of the 1940 Act. Rule 2a-5 permits fund boards
|
|
HENNESSY FUNDS
|
1-800-966-4354
|
17
|
to designate certain parties to perform fair value determinations, subject to board oversight and certain other conditions. Rule 2a-5 also defines when market quotations are “readily
available” for purposes of the 1940 Act and the threshold for determining whether a fund must fair value a security. In connection with Rule 2a-5, the SEC also adopted related recordkeeping requirements and is
rescinding previously issued guidance, including with respect to the role of a board in determining fair value and the accounting and auditing of fund investments. Funds must comply with the rules by September 8,
2022. Management is currently assessing the potential impact of the new rules on the Fund’s financial statements.
|
3). SECURITIES VALUATION
The Fund follows its valuation policies and procedures in determining its net asset value and, in preparing these financial statements, the fair value accounting standards that establish an
authoritative definition of fair value and set out a hierarchy for measuring fair value. These standards require additional disclosures about the various inputs and valuation techniques used to develop the measurements
of fair value and a discussion of changes in valuation techniques and related inputs during the period. These inputs are summarized in the three broad levels listed below:
|
Level 1 –
|
Unadjusted, quoted prices in active markets for identical instruments that the Fund has the ability to access at the date of measurement.
|
|
|
Level 2 –
|
Other significant observable inputs (including, but not limited to, quoted prices in active markets for similar instruments, quoted prices in markets that are not active for identical
or similar instruments, and model-derived valuations in which all significant inputs and significant value drivers are observable in active markets, such as interest rates, prepayment speeds, credit risk curves,
default rates, and similar data).
|
|
|
Level 3 –
|
Significant unobservable inputs (including the Fund’s own assumptions about what market participants would use to price the asset or liability based on the best available information)
when observable inputs are unavailable.
|
The following is a description of the valuation techniques applied to the Fund’s major categories of assets and liabilities on a recurring basis:
|
Equity Securities – Equity securities, including common stocks, preferred stocks, foreign-issued common stocks, exchange-traded funds,
closed-end mutual funds, partnerships, rights, and real estate investment trusts, that are traded on a securities exchange for which a last-quoted sales price is readily available generally are valued at the last
sales price as reported by the primary exchange on which the securities are listed. Securities listed on The Nasdaq Stock Market (“Nasdaq”) generally are valued at the Nasdaq Official Closing Price, which may
differ from the last sales price reported. Securities traded on a securities exchange for which a last-quoted sales price is not readily available generally are valued at the mean between the bid and ask prices.
To the extent these securities are actively traded and valuation adjustments are not applied, they are classified in Level 1 of the fair value hierarchy. Securities traded on foreign exchanges generally are not
valued at the same time the Fund calculates its NAV because most foreign markets close well before such time. The earlier close of most foreign markets gives rise to the possibility that significant events,
including broad market moves, may have occurred in the interim. In certain circumstances, it may be determined that a foreign security needs to be fair valued because it appears that the value of the security
might have been materially affected by events occurring after the close of the market in which the security is principally traded, but before the time the Fund calculates its NAV, such as by a development
|
|
WWW.HENNESSYFUNDS.COM
|
18
|
NOTES TO THE FINANCIAL STATEMENTS
|
|
that affects an entire market or region (e.g., a weather-related event) or a potentially global development (e.g., a terrorist attack that may be expected to have an effect on investor
expectations worldwide).
|
|
|
Registered Investment Companies – Investments in open-end registered investment companies, commonly referred to as mutual funds, generally are
priced at the ending NAV provided by the applicable mutual fund’s service agent and are classified in Level 1 of the fair value hierarchy.
|
|
|
Debt Securities – Debt securities, including corporate bonds, asset-backed securities, mortgage-backed securities, municipal bonds, U.S.
Treasuries, and U.S. government agency issues, are generally valued at market on the basis of valuations furnished by an independent pricing service that utilizes both dealer-supplied valuations and formula-based
techniques. The pricing service may consider recently executed transactions in securities of the issuer or comparable issuers, market price quotations (where observable), bond spreads, and fundamental data
relating to the issuer. In addition, the model may incorporate observable market data, such as reported sales of similar securities, broker quotes, yields, bids, offers, and reference data. Certain securities are
valued primarily using dealer quotations. These securities are generally classified in Level 2 of the fair value hierarchy.
|
|
|
Short-Term Securities – Short-term equity investments, including money market funds, are valued in the manner specified above for equity
securities. Short-term debt investments with an original term to maturity of 60 days or less are valued at amortized cost, which approximates fair market value. If the original term to maturity of a short-term
debt investment exceeds 60 days, then the values as of the 61st day prior to maturity are amortized. Amortized cost is not used if its use would be inappropriate due to credit or other impairments of the issuer,
in which case the security’s fair value would be determined as described below. Short-term securities are generally classified in Level 1 or Level 2 of the fair value hierarchy depending on the inputs used and
market activity levels for specific securities.
|
The Board of Trustees of the Fund (the “Board”) has adopted fair value pricing procedures that are followed when a price for a security is not readily available or if a
significant event has occurred that indicates the closing price of a security no longer represents the true value of that security. Fair value pricing determinations are made in good faith in accordance with these
procedures. There are numerous criteria considered in determining a fair value of a security, such as the trading volume of a security and markets, the values of other similar securities, and news events with direct
bearing on a security or markets. Fair value pricing results in an estimated price for a security that reflects the amount the Fund might reasonably expect to receive in a current sale. Depending on the relative
significance of the valuation inputs, these securities may be classified in either Level 2 or Level 3 of the fair value hierarchy.
The fair value of foreign securities may be determined with the assistance of a pricing service using correlations between the movement of prices of such securities and
indices of domestic securities and other appropriate indicators, such as closing market prices of relevant American Depositary Receipts or futures contracts. Using fair value pricing means that the Fund’s NAV reflects
the affected portfolio securities’ values as determined by the Board or its designee, pursuant to the fair value pricing procedures adopted by the Board, instead of being determined by the market. Using a fair value
pricing methodology to price a foreign security may result in a value that is different from such foreign security’s most recent closing price and from the value used by other investment companies to calculate their
NAVs. Such securities are generally classified in Level 2 of the
|
HENNESSY FUNDS
|
1-800-966-4354
|
19
fair value hierarchy. Because the Fund may invest in foreign securities, the value of the Fund’s portfolio securities may change on days when a shareholder is unable to purchase or redeem Fund
shares.
The Board has delegated day-to-day valuation matters to the Valuation and Liquidity Committee comprising representatives from Hennessy Advisors, Inc., the Fund’s investment
advisor (the “Advisor”). The function of the Valuation and Liquidity Committee, among other things, is to value securities where current and reliable market quotations are not readily available. All actions taken by the
Valuation and Liquidity Committee are reviewed by the Board.
The Fund has performed an analysis of all existing investments to determine the significance and character of all inputs to their fair value determinations. Various inputs
are used to determine the value of the Fund’s investments. The inputs or methodology used for valuing securities are not necessarily an indication of the risk associated with investing in those securities. Details
related to the fair value hierarchy of the Fund’s securities as of April 30, 2022, are included in the Schedule of Investments.
4). INVESTMENT TRANSACTIONS
Purchases and sales of investment securities (excluding government and short-term investments) for the Fund during the six months ended April 30, 2022, were $25,717,079 and $29,512,320,
respectively.
There were no purchases or sales/maturities of long-term U.S. government securities for the Fund during the six months ended April 30, 2022.
5). INVESTMENT ADVISORY FEE AND OTHER TRANSACTIONS WITH AFFILIATES
The Advisor provides the Fund with investment advisory services under an Investment Advisory Agreement. The Advisor furnishes all investment advice, office space, and facilities and most of the
personnel needed by the Fund. As compensation for its services, the Advisor is entitled to a monthly fee from the Fund. The fee is based on the average daily net assets of the Fund at an annual rate of 0.90%. The net
investment advisory fees expensed by the Fund during the six months ended April 30, 2022, are included in the Statement of Operations.
The Board has approved a Shareholder Servicing Agreement for Investor Class shares of the Fund, which compensates the Advisor for the non-investment advisory services it
provides to the Fund. The Shareholder Servicing Agreement provides for a monthly fee paid to the Advisor at an annual rate of 0.10% of the average daily net assets of the Fund attributable to Investor Class shares. The
shareholder service fees expensed by the Fund during the six months ended April 30, 2022, are included in the Statement of Operations.
The Fund has adopted a plan pursuant to Rule 12b-1 under the Investment Company Act of 1940, as amended, that authorizes payments in connection with the distribution of Fund
shares at an annual rate of up to 0.25% of the Fund’s average daily net assets attributable to Investor Class shares. Even though the authorized rate is up to 0.25%, the Fund is currently only using up to 0.15% of its
average daily net assets attributable to Investor Class shares for such purpose. Amounts paid under the plan may be spent on any activities or expenses primarily intended to result in the sale of shares, including, but
not limited to, advertising, shareholder account servicing, printing and mailing of prospectuses to other than current shareholders, printing and mailing of sales literature, and compensation for sales and marketing
activities or to financial institutions and others, such as dealers and distributors. The distribution fees expensed by the Fund during the six months ended April 30, 2022, are included in the Statement of Operations.
|
WWW.HENNESSYFUNDS.COM
|
20
|
NOTES TO THE FINANCIAL STATEMENTS
|
The Fund has entered into agreements with various brokers, dealers, and financial intermediaries in connection with the sale of Fund shares. The agreements provide for
periodic payments of sub-transfer agent expenses by the Fund to the brokers, dealers, and financial intermediaries for providing certain shareholder maintenance services. These shareholder services include the
pre-processing and quality control of new accounts, shareholder correspondence, answering customer inquiries regarding account status, and facilitating shareholder telephone transactions. The sub-transfer agent fees
expensed by the Fund during the six months ended April 30, 2022, are included in the Statement of Operations.
U.S. Bancorp Fund Services, LLC, d/b/a U.S. Bank Global Fund Services (“Fund Services”) provides the Fund with administrative, accounting, and transfer agent services. As
administrator, Fund Services is responsible for activities such as (i) preparing various federal and state regulatory filings, reports, and returns for the Fund, (ii) preparing reports and materials to be supplied to the
Board, (iii) monitoring the activities of the Fund’s custodian, transfer agent, and accountants, and (iv) coordinating the preparation and payment of the Fund’s expenses and reviewing the Fund’s expense accruals. U.S.
Bank N.A., an affiliate of Fund Services, serves as the Fund’s custodian. The servicing agreements between the Trust, Fund Services, and U.S. Bank N.A. contain a fee schedule that is inclusive of administrative,
accounting, custody, and transfer agent fees. The administrative, accounting, custody, and transfer agent fees expensed by the Fund during the six months ended April 30, 2022, are included in the Statement of Operations.
Quasar Distributors, LLC (“Quasar”), a wholly owned broker-dealer subsidiary of Foreside Financial Group, LLC, acts as the Fund’s principal underwriter in a continuous public
offering of Fund shares.
The officers of the Fund are affiliated with the Advisor. With the exception of the Chief Compliance Officer and the Senior Compliance Officer, such officers receive no
compensation from the Fund for serving in their respective roles. The Fund, along with the other funds in the Hennessy Funds family (collectively, the “Hennessy Funds”), makes reimbursement payments on an equal basis to
the Advisor for a portion of the salary and benefits associated with the office of the Chief Compliance Officer and for all of the salary and benefits associated with the office of the Senior Compliance Officer. The
compliance fees expensed by the Fund during the six months ended April 30, 2022, are included in the Statement of Operations.
6). GUARANTEES AND INDEMNIFICATIONS
Under the Hennessy Funds’ organizational documents, their officers and trustees are indemnified by the Hennessy Funds against certain liabilities arising out of the performance of their duties
to the Hennessy Funds. Additionally, in the normal course of business, the Hennessy Funds enter into contracts with service providers that contain general indemnification clauses. The Fund’s maximum exposure under these
arrangements is unknown as this would involve future claims that may be made against the Fund that have not yet occurred. Currently, the Fund expects the risk of loss to be remote.
7). LINE OF CREDIT
The Fund has an uncommitted line of credit with the other Hennessy Funds in the amount of the lesser of (i) $100,000,000 or (ii) 33.33% of each Hennessy Fund’s net assets, or 30% for the
Hennessy Gas Utility Fund and 10% for the Hennessy Balanced Fund. The line of credit is intended to provide any necessary short-term financing in connection with shareholder redemptions, subject to certain restrictions.
The credit facility is with the Hennessy Funds’ custodian bank, U.S. Bank N.A. Borrowings under
|
HENNESSY FUNDS
|
1-800-966-4354
|
21
this arrangement bear interest at the bank’s prime rate and are secured by all of the Fund’s assets (as to its own borrowings only). During the six months ended April 30, 2022, the Fund had an
outstanding average daily balance and a weighted average interest rate of $40,696 and 3.50%, respectively. The interest expensed by the Fund during the six months ended April 30, 2022, is included in the Statement of
Operations. The maximum amount outstanding for the Fund during the period was $1,896,000. As of April 30, 2022, the Fund did not have any borrowings outstanding under the line of credit.
8). FEDERAL TAX INFORMATION
As of October 31, 2021, the Fund’s most fiscal year end, the components of accumulated earnings (losses) for income tax purposes were as follows:
|
Investments
|
||||
|
Cost of investments for tax purposes
|
$
|
43,654,396
|
||
|
Gross tax unrealized appreciation
|
$
|
29,210,202
|
||
|
Gross tax unrealized depreciation
|
(1,247,644
|
)
|
||
|
Net tax unrealized appreciation/(depreciation)
|
$
|
27,962,558
|
||
|
Undistributed ordinary income
|
$
|
—
|
||
|
Undistributed long-term capital gains
|
3,485,637
|
|||
|
Total distributable earnings
|
$
|
3,485,637
|
||
|
Other accumulated gain/(loss)
|
$
|
(288,078
|
)
|
|
|
Total accumulated gain/(loss)
|
$
|
31,160,117
|
||
The difference between book-basis unrealized appreciation/depreciation and tax-basis unrealized appreciation/depreciation (as shown above) is attributable primarily to wash
sales.
As of October 31, 2021, the Fund had no tax-basis capital losses to offset future capital gains. During fiscal year 2021, the capital losses utilized by the Fund were
$914,697.
Capital losses sustained in or after fiscal year 2012 can be carried forward indefinitely, but any such loss retains the character of the original loss and must be utilized
prior to any loss incurred before fiscal year 2012. As a result of this ordering rule, capital loss carryforwards incurred prior to fiscal year 2012 may be more likely to expire unused. Capital losses sustained prior to
fiscal year 2012 can be carried forward for eight years and can be carried forward as short-term capital losses regardless of the character of the original loss.
As of October 31, 2021, the Fund deferred, on a tax basis, a late-year ordinary loss of $288,078. Late-year ordinary losses are net ordinary losses incurred after December
31, 2020, but within the taxable year, that are deemed to arise on the first day of the Fund’s next taxable year.
During fiscal year 2022 (year to date) and fiscal year 2021, the tax character of distributions paid by the Fund was as follows:
|
Six Months Ended
|
Year Ended
|
||||||||
|
April 30, 2022
|
October 31, 2021
|
||||||||
|
Ordinary income(1)
|
$
|
—
|
$
|
—
|
|||||
|
Long-term capital gains
|
3,485,642
|
—
|
|||||||
|
Total distributions
|
$
|
3,485,642
|
$
|
—
|
|||||
|
(1) Ordinary income includes short-term capital gains.
|
|
WWW.HENNESSYFUNDS.COM
|
22
|
NOTES TO THE FINANCIAL STATEMENTS
|
9). LIBOR TRANSITION
The Fund invests in financial instruments with payment obligations, financing terms, hedging strategies, or investment values based on, among other floating rates, the London Interbank Offered
Rate (“LIBOR”). Determined by the ICE Benchmark Administration, LIBOR is an average interest rate that banks charge one another for the use of short-term money. In 2017, the United Kingdom’s Financial Conduct Authority
(the “FCA”), which regulates LIBOR, announced plans to phase out the use of LIBOR by the end of 2021. Most LIBOR settings are no longer being published as of December 31, 2021, and the FCA and ICE Benchmark Administrator
have announced that a majority of U.S. dollar LIBOR settings will cease publication after June 30, 2023. The U.S. Federal Reserve has begun publishing the Secured Overnight Financing Rate (SOFR), which is intended to
replace the U.S. dollar LIBOR. Other regulators and industry groups around the world have announced or begun publishing proposed alternative reference rates for other currencies, but global consensus is lacking, and the
process for amending many existing contracts or instruments to transition away from LIBOR remains unclear. Uncertainty related to the liquidity impact of the change in reference rates and how to appropriately adjust
these rates at the time of transition may lead to increased volatility and illiquidity in markets tied to LIBOR, reduce the value of LIBOR-related instruments, and reduce the effectiveness of hedging strategies, which
could adversely affect the Fund’s performance. Moreover, the risks associated with this discontinuation and transition could be exacerbated if the work necessary to effect an orderly transition to an alternative
reference rate is not completed in a timely manner. Accordingly, it is difficult to predict the full impact of the transition away from LIBOR on the Fund until new reference rates and fallbacks for both legacy and new
instruments and contracts are commercially accepted and market practices become settled.
10). EVENTS SUBSEQUENT TO PERIOD END
Management has evaluated the Fund’s related events and transactions that occurred subsequent to April 30, 2022, through the date of issuance of the Fund’s financial statements. Management has
determined that there were no subsequent events requiring recognition or disclosure in the financial statements.
|
HENNESSY FUNDS
|
1-800-966-4354
|
23
Expense Example (Unaudited)
April 30, 2022
As a shareholder of the Fund, you incur ongoing costs, including management fees, service fees, and other Fund expenses. This Example is intended to help you understand your ongoing costs (in
dollars) of investing in the Fund and to compare these costs with the ongoing costs of investing in other mutual funds. The Example is based on an investment of $1,000 invested at the beginning of the period and held for
the entire period from November 1, 2021, through April 30, 2022.
Actual Expenses
In the table below, the first line under each of the “Investor Class” and “Institutional Class” headings provides information about actual account values and actual expenses for each share
class. You may use this information, together with the amount you invested, to estimate the expenses that you paid over the period. Simply divide your account value by $1,000 (for example, an $8,600 account value divided
by $1,000 = 8.6), then multiply the result by the number in the first line under the heading “Expenses Paid During Period” to estimate the expenses you paid on your account during this period. Although the Fund charges
no sales loads or transaction fees, you will be assessed fees for outgoing wire transfers, returned checks, and stop payment orders at prevailing rates charged by U.S. Bank Global Fund Services, the Fund’s transfer
agent. If you request that a redemption be made by wire transfer, the Fund’s transfer agent charges a $15 fee. IRAs are charged a $15 annual maintenance fee (up to $30 maximum per shareholder for shareholders with
multiple IRAs). The examples below include, but are not limited to, management, shareholder servicing, accounting, custody, and transfer agent fees. However, the examples below do not include portfolio trading
commissions and related expenses.
Hypothetical Example for Comparison Purposes
In the table below, the second line under each of the “Investor Class” and “Institutional Class” headings provides information about hypothetical account values and hypothetical expenses based
on the Fund’s actual expense ratio for each share class and an assumed rate of return of 5% per year before expenses, which is not the Fund’s actual return for such share class. The hypothetical account values and
expenses may not be used to estimate the actual ending account balance or expenses you paid for the period. You may use this information to compare the ongoing costs of investing in the Fund and other funds. To do so,
compare these 5% hypothetical examples with the 5% hypothetical examples that appear in the shareholder reports of the other funds. Please note that the expenses shown in the table are meant to highlight your ongoing
costs only. Therefore, the second lines under “Investor Class” and “Institutional Class” are useful in comparing ongoing costs only and will not help you determine the relative total costs of owning different funds.
|
WWW.HENNESSYFUNDS.COM
|
24
|
EXPENSE EXAMPLE
|
|
Beginning
|
Ending
|
||
|
Account Value
|
Account Value
|
Expenses Paid
|
|
|
November 1, 2021
|
April 30, 2022
|
During Period(1)
|
|
|
Investor Class
|
|||
|
Actual
|
$1,000.00
|
$ 754.70
|
$7.27
|
|
Hypothetical (5% return before expenses)
|
$1,000.00
|
$1,016.51
|
$8.35
|
|
Institutional Class
|
|||
|
Actual
|
$1,000.00
|
$ 756.10
|
$5.57
|
|
Hypothetical (5% return before expenses)
|
$1,000.00
|
$1,018.45
|
$6.41
|
|
(1)
|
Expenses are equal to the Fund’s annualized expense ratio of 1.67% for Investor Class shares or 1.28% for Institutional Class shares, as applicable, multiplied by the average account
value over the period, multiplied by 181/365 days (to reflect the half-year period).
|
|
HENNESSY FUNDS
|
1-800-966-4354
|
25
How to Obtain a Copy of the Fund’s Proxy
Voting Policy and Proxy Voting Records
A description of the policies and procedures the Fund uses to determine how to vote proxies relating to portfolio securities is available without charge (1) by calling 800-966-4354, (2) on the
Hennessy Funds’ website at www.hennessyfunds.com/proxy-voting/voting-policy, or (3) on the U.S. Securities and Exchange Commission’s (the “SEC”) website at www.sec.gov. The Fund’s proxy voting record is available without
charge on both the Hennessy Funds’ website at www.hennessyfunds.com/proxy-voting/voting-record and the SEC’s website at www.sec.gov no later than August 31 for the prior 12 months ending June 30.
Availability of Quarterly Portfolio Schedule
The Fund files its complete schedule of portfolio holdings with the SEC for the first and third quarters of each fiscal year as an exhibit to its reports on Form N-PORT. The Fund’s Form N-PORT
reports are available on the SEC’s website at www.sec.gov or on request by calling 800-966-4354.
Important Notice Regarding Delivery
of Shareholder Documents
To help keep the Fund’s costs as low as possible, we generally deliver a single copy of shareholder reports, proxy statements, and prospectuses to shareholders who share an address and have the
same last name. This process does not apply to account statements. You may request an individual copy of a shareholder document at any time. If you would like to receive separate mailings of shareholder documents, please
call U.S. Bank Global Fund Services at 800-261-6950 or 414-765-4124, and individual delivery will begin within 30 days of your request. If your account is held through a financial institution or other intermediary,
please contact such intermediary directly to request individual delivery.
Electronic Delivery
As permitted by SEC regulations, the Fund’s shareholder reports are made available on a website, and unless you sign up for eDelivery or elect to receive paper copies as detailed below, you
will be notified each time a report is posted and provided with a website link to access the report.
The Fund also offers shareholders the option to receive all notices, account statements, prospectuses, tax forms, and shareholder reports electronically. To sign up for
eDelivery or change your delivery preference, please visit www.hennessyfunds.com/account.
To elect to receive paper copies of all future reports free of charge, please call U.S. Bank Global Fund Services at 800-261-6950 or 414-765-4124.
Subscribe to receive our team’s unique market and sector insights delivered to your inbox
www.hennessyfunds.com/subscribe
Follow us on social media
| |
|
|
WWW.HENNESSYFUNDS.COM
|
26
|
PROXY VOTING — BOARD APPROVAL OF INVESTMENT ADVISORY AGREEMENT
|
Board Approval of Investment Advisory
Agreement
At its meeting on March 11, 2022, the Board of Trustees of the Fund (the “Board,” and the members thereof, the “Trustees”) unanimously approved the continuation of the investment advisory
agreement of the Fund with Hennessy Advisors, Inc. (the “Advisor”). As part of the process, the Trustees reviewed their fiduciary duties and the relevant factors for them to consider with respect to approving the
advisory agreement. In addition, the Trustees who are not deemed “interested persons” (as defined by the Investment Company Act of 1940, as amended) of the Fund (the “Independent Trustees”) met in executive session to
discuss the approval of the advisory agreement. As part of their discussion, the Independent Trustees confirmed their understanding of the need to have asked about, and received answers to, any matters that they believed
are relevant to determining whether to approve the continuation of the advisory agreement.
In advance of the meeting, the Advisor sent detailed information to the Trustees to assist them in their evaluation of the advisory agreement. This information included, but
was not limited to, the following:
|
(1)
|
A memorandum from outside legal counsel that described the fiduciary duties of the Board with respect to approving the continuation of the advisory agreement and the relevant factors
for consideration;
|
|
|
(2)
|
A memorandum from the Advisor that listed the factors relevant to the Board’s approval of the continuation of the advisory agreement and also referenced the documents that had been
provided to help the Board assess each such factor;
|
|
|
(3)
|
The Advisor’s financial statements from its most recent Form 10-K and Form 10-Q;
|
|
|
(4)
|
A summary of the advisory agreement;
|
|
|
(5)
|
A recent Fund fact sheet, which included, among other things, Fund performance over various periods;
|
|
|
(6)
|
A description of the range of services provided by the Advisor;
|
|
|
(7)
|
A peer expense comparison of the net expense ratio and investment advisory fee of the Fund; and
|
|
|
(8)
|
A memorandum from the Advisor regarding economies of scale.
|
The Trustees reviewed and discussed all of the information provided by the Advisor. Following this review, and further discussion with the Advisor, the Trustees concluded
that the information provided before and at the meeting addressed all of the relevant matters that they wanted to consider in assessing the performance of the Funds and the performance of the Advisor under the advisory
agreement, and that said information provided them with a fulsome understanding of the advisory agreement and the services provided by the Advisor.
All of the factors discussed were considered as a whole by the Trustees, as well as by the Independent Trustees meeting in executive session. The Trustees viewed the relevant
factors in their totality, with no single factor being the principal or determinative factor in the Trustees’ determination of whether to approve the continuation of the advisory agreement. The Trustees recognized that
the management and fee arrangements for the Fund are the result of years of review and discussion between the Independent Trustees and the Advisor, that certain aspects of such arrangements may receive greater scrutiny
in
|
HENNESSY FUNDS
|
1-800-966-4354
|
27
some years than in others, and that the Trustees’ conclusions may be based, in part, on their consideration of these same arrangements and information received during the course of the year and
in prior years.
Prior to approving the continuation of the advisory agreement, the Trustees, including the Independent Trustees in executive session, considered, among other items:
|
(1)
|
The nature and quality of the advisory services provided by the Advisor;
|
|
|
(2)
|
A comparison of the fees and expenses of the Fund to other similar funds;
|
|
|
(3)
|
Whether economies of scale are recognized by the Fund;
|
|
|
(4)
|
The costs and profitability of the Fund to the Advisor;
|
|
|
(5)
|
The performance of the Fund; and
|
|
|
(6)
|
Any benefits to the Advisor from serving as an investment advisor to the Fund (other than the advisory fee).
|
The material considerations and determinations of the Trustees, including the Independent Trustees, were as follows:
|
(1)
|
The Trustees considered the services identified below that are provided by the Advisor. Based on this review and an assessment of the Advisor’s performance, the Trustees concluded that
the Advisor provides high-quality services to the Fund, and they noted that their overall confidence in the Advisor was high. The Trustees also concluded that they were satisfied with the nature, extent, and
quality of the advisory services provided to the Fund by the Advisor and that the nature and extent of the services provided by the Advisor were appropriate to assure that the Fund’s operations are conducted in
compliance with applicable laws, rules, and regulations.
|
|
(a)
|
The Advisor acts as the portfolio manager for the Fund. In this capacity, the Advisor does the following:
|
|
(i)
|
manages the composition of the Fund’s portfolio, including the purchase, retention, and disposition of portfolio securities in accordance with the Fund’s investment objectives,
policies, and restrictions;
|
|||
|
(ii)
|
seeks best execution for the Fund’s portfolio;
|
|||
|
(iii)
|
manages the use of soft dollars for the Fund; and
|
|||
|
(iv)
|
manages proxy voting for the Fund.
|
|
(b)
|
The Advisor performs a daily reconciliation of portfolio positions and cash for the Fund.
|
||
|
(c)
|
The Advisor monitors the liquidity of each Fund.
|
||
|
(d)
|
The Advisor monitors the Fund’s compliance with its investment objectives and restrictions and federal securities laws.
|
||
|
(e)
|
The Advisor maintains a compliance program (including a code of ethics), conducts ongoing reviews of the compliance programs of the Fund’s service providers (including their codes of
ethics, as appropriate), conducts on-site visits to the Fund’s service providers, as feasible, monitors incidents of abusive trading practices, reviews Fund expense accruals, payments, and fixed expense ratios,
evaluates insurance providers for fidelity bond, D&O/E&O insurance, and cybersecurity insurance coverage, manages regulatory examination compliance and responses, conducts employee compliance training,
reviews reports provided by service providers, and maintains books and records.
|
|
WWW.HENNESSYFUNDS.COM
|
28
|
BOARD APPROVAL OF INVESTMENT ADVISORY AGREEMENT
|
|
(f)
|
The Advisor oversees service providers that provide accounting, administration, distribution, transfer agency, custodial, sales, marketing, public relations, audit, information
technology, and legal services to the Fund.
|
||
|
(g)
|
The Advisor maintains in-house marketing and distribution departments on behalf of the Fund.
|
||
|
(h)
|
The Advisor prepares or directs the preparation of all regulatory filings for the Fund, including writing and annually updating the Fund’s prospectus and related documents.
|
||
|
(i)
|
For each annual report of the Fund, the Advisor prepares a written summary of the Fund’s performance during the most recent 12-month period.
|
||
|
(j)
|
The Advisor oversees distribution of the Fund through third-party broker/dealers and independent financial institutions such as Charles Schwab, Inc., Fidelity, TD Ameritrade, and
Pershing. The Advisor participates in “no transaction fee” (“NTF”) programs with these companies on behalf of the Fund, which allow customers to purchase the Fund through third-party distribution channels without
paying a transaction fee. The Advisor compensates, in part, a number of these third-party providers of NTF programs out of its own revenues.
|
||
|
(k)
|
The Advisor pays the incentive compensation of the Fund’s compliance officers and employs other staff, such as legal, marketing, national accounts, distribution, sales, administrative,
and trading oversight personnel, as well as management executives.
|
||
|
(l)
|
The Advisor provides a quarterly compliance certification to the Board.
|
||
|
(m)
|
The Advisor prepares or reviews all Board materials, presents to and leads discussions with the Board, prepares or reviews all meeting minutes, and arranges for Board training and
education.
|
|
(2)
|
The Trustees compared the performance of the Fund to benchmark indices over various periods and noted that the Trustees review and discuss reports comparing the investment performance
of the Fund to various indices at each quarterly Board meeting. Based on such information, the Trustees determined that the Advisor manages the Fund in a manner materially consistent with its stated investment
objective and style. The Trustees concluded that the performance of the Fund over various periods warranted the continuation of the advisory agreement.
|
|
|
(3)
|
The Trustees reviewed the advisory fees and overall expense ratios of the Fund compared to other funds similar in asset size and investment objective to the Fund using data from
Morningstar. As part of the discussion with management, the Trustees ensured that they understood and were comfortable with the criteria used to determine the mutual funds included in the Morningstar categories
for purposes of the materials considered at the meeting. The Trustees determined that the advisory fee and overall expense ratio of the Fund falls within a reasonable range of the advisory fees and overall
expense ratios of other comparable funds and concluded that they are reasonable and warranted continuation of the advisory agreement.
|
|
|
(4)
|
The Trustees also considered whether the Advisor was realizing economies of scale that should be shared with the Fund’s shareholders. The Trustees noted that the majority of expenses
incurred to manage the Fund are variable
|
|
HENNESSY FUNDS
|
1-800-966-4354
|
29
|
asset-based fees, so the Advisor does not realize material economies of scale relating to these expenses as the assets of the Fund increase. For example, third-party platform fees
increase as the Fund’s assets grow.
|
||
|
(5)
|
The Trustees considered the profitability of the Advisor, including the impact of mutual fund platform fees on the Advisor’s profitability, and also considered the resources and
revenues that the Advisor has put into managing and distributing the Fund. The Trustees then concluded that the profits of the Advisor are reasonable and not excessive when compared to profitability guidelines
set forth in relevant court cases.
|
|
|
(6)
|
The Trustees considered the high level of professionalism and knowledge of the Advisor’s employees and concluded that this was beneficial to the Fund and its shareholders.
|
|
|
(7)
|
The Trustees considered any benefits to the Advisor from serving as an advisor to the Fund (other than the advisory fee). The Trustees noted that the Advisor may derive ancillary
benefits from, by way of example, its association with the Fund in the form of proprietary and third-party research products and services received from broker-dealers that execute portfolio trades for the Fund.
The Trustees determined that any such products and services have been used for legitimate purposes relating to the Fund by providing assistance in the investment decision-making process. The Trustees concluded
that any additional benefits realized by the Advisor from its relationship with the Fund were reasonable, which was based on, among other things, the Trustees’ finding that the research, analytical, statistical,
and other information and services provided by brokers are merely supplemental to the Advisor’s own efforts in the performance of its duties under the advisory agreement.
|
After reviewing the materials and information provided at the meeting, as well as other information regularly provided at the Board’s quarterly meetings throughout the year
regarding the quality of services provided by the Advisor, the performance of the Fund, expense information, brokerage commissions information, the adequacy and efficacy of the Advisor’s written policies and procedures,
other regulatory compliance issues, trading information and related matters, and other factors that the Trustees deemed relevant, the Trustees, including the Independent Trustees, approved the continuation of the
advisory agreement.
|
WWW.HENNESSYFUNDS.COM
|
30
|
BOARD APPROVAL OF INVESTMENT ADVISORY AGREEMENT
|
(This Page Intentionally Left Blank.)
For information, questions, or assistance, please call
The Hennessy Funds
800-966-4354 or 415-899-1555
INVESTMENT ADVISOR
Hennessy Advisors, Inc.
7250 Redwood Boulevard, Suite 200
Novato, California 94945
ADMINISTRATOR,
TRANSFER AGENT,
DIVIDEND PAYING AGENT, &
SHAREHOLDER SERVICING AGENT
U.S. Bancorp Fund Services, LLC
d/b/a U.S. Bank Global Fund Services
P.O. Box 701
Milwaukee, Wisconsin 53201-0701
CUSTODIAN
U.S. Bank N.A.
Custody Operations
1555 North River Center Drive, Suite 302
Milwaukee, Wisconsin 53212
TRUSTEES
Neil J. Hennessy
J. Dennis DeSousa
Robert T. Doyle
Claire Garvie
Gerald P. Richardson
COUNSEL
Foley & Lardner LLP
777 East Wisconsin Avenue
Milwaukee, Wisconsin 53202-5306
INDEPENDENT REGISTERED
PUBLIC ACCOUNTING FIRM
Tait, Weller & Baker LLP
Two Liberty Place
50 South 16th Street, Suite 2900
Philadelphia, Pennsylvania 19102-2529
DISTRIBUTOR
Quasar Distributors, LLC
111 East Kilbourn Avenue, Suite 1250
Milwaukee, Wisconsin 53202
www.hennessyfunds.com | 800-966-4354
This report has been prepared for shareholders and may be distributed to
others only if preceded or accompanied by a current prospectus.
SEMI-ANNUAL REPORT
APRIL 30, 2022
HENNESSY SMALL CAP FINANCIAL FUND
Investor Class HSFNX
Institutional Class HISFX
www.hennessyfunds.com | 1-800-966-4354
(This Page Intentionally Left Blank.)
Contents
|
Letter to Shareholders
|
2
|
|
Performance Overview
|
4
|
|
Financial Statements
|
|
|
Schedule of Investments
|
5
|
|
Statement of Assets and Liabilities
|
8
|
|
Statement of Operations
|
9
|
|
Statements of Changes in Net Assets
|
11
|
|
Financial Highlights
|
12
|
|
Notes to the Financial Statements
|
16
|
|
Expense Example
|
24
|
|
Proxy Voting Policy and Proxy Voting Records
|
26
|
|
Availability of Quarterly Portfolio Schedule
|
26
|
|
Federal Tax Distribution Information
|
26
|
|
Important Notice Regarding Delivery of Shareholder Documents
|
26
|
|
Electronic Delivery
|
26
|
|
Board Approval of Investment Advisory Agreement
|
27
|
|
HENNESSY FUNDS
|
1-800-966-4354
|
May 2022
Dear Hennessy Funds Shareholder:
We’d like to start our semi-annual letter with a pause. At the end of 2021, we looked forward to a new year – a potentially calmer year – having come
through almost two full years of the coronavirus pandemic. As people, we were aware our lives had changed, but we hoped for a better 2022; as investors, we were aware that the economy was strong and employment was
robust, yet challenges loomed, including inflation, supply chain disruptions, and tightening monetary policy; as employees, students, and family members, we recognized much was different, but we sought a return to
what’s familiar. What we didn’t know was that a world leader who controls one of the largest militaries on the planet was about to start one of the worst atrocities in Europe since World War II. Our thoughts are with
the Ukrainian people, and our hope is for this unjustified, senseless human tragedy to end quickly.
The equity market started 2022 on a high note, with the S&P 500® Index hitting an all-time high on the first trading day of the year. This turned out to be the last hurrah for a market that saw a
continuous march higher in 2021, having hit 70 new all-time highs, with a new all-time high being recorded on average every three and a half days. Concerns in the market then coalesced and overpowered bullish
sentiment, and the market has spiraled lower throughout 2022. Factors that drove the market lower include: tightening monetary policy as the Federal Reserve has begun raising rates and has announced plans for shrinking
its $8.5 trillion asset portfolio; inflation, higher energy costs, and their effects on the domestic and global economies; continued supply chain disruptions; investors’ indiscriminate liquidation of broad-based ETFs
and index funds and the detrimental effect on equities; and the near-term and long-term global implications of the Russian invasion of Ukraine.
While markets are adjusting, many positive conditions remain intact. Corporate balance sheets and profits remain strong, GDP growth
remains positive, the consumer continues to show resilience in the face of rising prices, cash is abundant both at the corporate and household levels, unemployment is exceptionally low, and our financial system remains
healthy. Markets are also experiencing a change in leadership, as value stocks have been outperforming growth stocks, and traditionally defensive sectors such as Utilities and Consumer Staples have been outperforming
the broader market. Finally, the Energy sector has soared in 2022, as companies reap the benefits of dramatically higher oil and natural gas prices, and shareholders are rewarded with significantly higher dividends,
aggressive buybacks, and higher stock prices after many years of underperformance for the sector.
With history as our guide, we are hopeful that eventually the market may bottom and head higher again. Since the financial crisis of
2008, we have experienced many corrections and many recoveries to new highs. The Dow Jones Industrial Average has dropped over 10% eight times, including the current drop, for a median decline of 14.00%, and on
average, it took 45 trading days to drop from peak to trough and 127 trading days to return to the previous peak. Since the current drop has taken longer to go from peak to its recent trough, it may take some time for
a recovery in prices to truly take hold.
On a positive note, valuations have come in, and many stocks have become more attractive, especially for longer-term investors. We
note, however, that the concept of “historically cheap stocks” does not, on its own, move the market higher. Rather, it is
|
WWW.HENNESSYFUNDS.COM
|
2
|
LETTER TO SHAREHOLDERS
|
overall capitulation and improving fundamentals that could bring buyers back into the market and reverse any bearish trends. Investors need to see improving company earnings, retreating
inflationary trends, a measured pace of interest rate increases globally that does not cause significant economic contraction, hope for a more peaceful and orderly world economic system unconstrained by supply
bottlenecks and other hindrances to global trade, and, most importantly, a subsidence of the deleterious effects of the coronavirus pandemic. While that may seem like a “tall order,” we believe that patient investing,
focusing on value, quality, and downside risk mitigation, works well over the longer term.
During this tumultuous period, performance of the majority of the Hennessy Funds has been relatively strong when compared to the overall
market as well as to our benchmarks. During the six months ended April 30, 2022, the Dow Jones Industrial Average, the S&P 500®
Index, and the NASDAQ Composite Index dropped 7.05%, 9.65%, and 20.15%, respectively, on a total return basis. During this period when these three major indices saw significant declines, we were pleased that seven of
our 16 Funds posted positive total returns, 10 of our 14 domestic Funds outperformed the S&P 500® Index, and over half of our active
funds outperformed their primary benchmarks.
We thank you, our shareholders, for your continued interest in our family of Funds. We are grateful for the trust you put in us, and
we will continue to strive to manage our portfolios for long-term performance, ever mindful of downside risk. While volatility and uncertainty may impact the markets in the short-term, we encourage investors to stay
the course, maintain a diversified portfolio, and keep a long-term perspective. If you have any questions or would like to speak with us, please don’t hesitate to call us directly at (800) 966-4354. In closing, we
would also like to thank all of the healthcare and frontline workers that have worked – and still work – tirelessly throughout the coronavirus pandemic.
Best regards,
|
|
|
|
|
Ryan C. Kelley, CFA
|
|
|
Chief Investment Officer,
|
|
|
Senior Vice President, and Portfolio Manager
|
Past performance does not guarantee future results.
Mutual fund investing involves risk. Principal loss is possible.
Opinions expressed are those of Ryan C. Kelley and are subject to change, are not guaranteed, and should not be considered investment advice.
The Dow Jones Industrial Average and S&P 500® Index are commonly used to measure the performance of U.S.
stocks. The NASDAQ Composite Index comprises all common stocks listed on The NASDAQ Stock Market and is commonly used to measure the performance of technology-related stocks. The indices are used herein for comparative
purposes in accordance with SEC regulations. One cannot invest directly in an index. All returns are shown on a total return basis.
Please refer to the Performance Overview section for more detailed performance information.
|
HENNESSY FUNDS
|
1-800-966-4354
|
3
Performance Overview (Unaudited)
AVERAGE ANNUAL TOTAL RETURN FOR PERIODS ENDED APRIL 30, 2022
|
Six
|
One
|
Five
|
Ten
|
|
|
Months(1)
|
Year
|
Years
|
Years
|
|
|
Hennessy Small Cap Financial Fund –
|
||||
|
Investor Class (HSFNX)
|
-12.23%
|
-8.84%
|
6.31%
|
10.71%
|
|
Hennessy Small Cap Financial Fund –
|
||||
|
Institutional Class (HISFX)
|
-12.09%
|
-8.54%
|
6.69%
|
11.10%
|
|
Russell 2000® Index Financials
|
-15.16%
|
-9.93%
|
4.92%
|
9.99%
|
|
Russell 2000® Index
|
-18.38%
|
-16.87%
|
7.24%
|
10.06%
|
Expense ratios: 1.58% (Investor Class); 1.20% (Institutional Class)
|
(1)
|
Periods of less than one year are not annualized.
|
_______________
Performance data quoted represents past performance; past performance does not guarantee future results. The investment return and principal value of an investment will
fluctuate so that an investor’s shares, when redeemed, may be worth more or less than their original cost. The performance table does not reflect the deduction of taxes that a shareholder would pay on Fund
distributions or the redemption of Fund shares. Current performance of the Fund may be lower or higher than the performance quoted. Performance data current to the most recent month end may be obtained by visiting
www.hennessyfunds.com. Performance for periods including or prior to October 26, 2012, is that of the FBR Small Cap Financial Fund.
The Russell 2000® Index Financials is a subset of the Russell 2000® Index that measures the performance of the securities classified in the Financials sector of the small-cap U.S. equity market. The Russell 2000® Index comprises the smallest 2,000 companies in the Russell 3000® Index based on
market capitalization, representing approximately 8% of the Russell 3000® Index in terms of total market capitalization. One cannot
invest directly in an index. These indices are used for comparative purposes in accordance with Securities and Exchange Commission regulations.
Frank Russell Company (“Russell”) is the source and owner of the trademarks, service marks, and copyrights related to the Russell Indexes. Russell® is a trademark of Frank Russell Company. Neither Russell nor its licensors accept any liability for any errors or omissions in the Russell Indexes or Russell ratings or
underlying data and no party may rely on any Russell Indexes or Russell ratings or underlying data contained in this communication. No further distribution of Russell data is permitted without Russell’s express written
consent. Russell does not promote, sponsor, or endorse the content of this communication.
The expense ratios presented are from the most recent prospectus. The expense ratios for the current reporting period are available in the Financial Highlights section of this report.
|
WWW.HENNESSYFUNDS.COM
|
4
|
PERFORMANCE OVERVIEW/SCHEDULE OF INVESTMENTS
|
Financial Statements
|
Schedule of Investments as of April 30, 2022 (Unaudited)
|
HENNESSY SMALL CAP FINANCIAL FUND
(% of Net Assets)
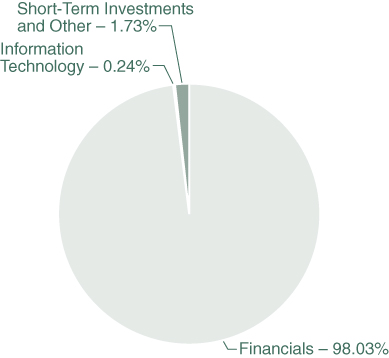
|
TOP TEN HOLDINGS (EXCLUDING MONEY MARKET FUNDS)
|
% NET ASSETS
|
|
First BanCorp.
|
6.05%
|
|
Independent Bank Corp.
|
5.81%
|
|
Hingham Institution for Savings
|
5.72%
|
|
Hancock Whitney Corp.
|
5.65%
|
|
Old National Bancorp
|
5.37%
|
|
First Citizens BancShares, Inc.
|
4.93%
|
|
Texas Capital Bancshares, Inc.
|
4.90%
|
|
Lakeland Bancorp, Inc.
|
4.89%
|
|
Banner Corp.
|
4.88%
|
|
WSFS Financial Corp.
|
4.73%
|
Note: For presentation purposes, the Fund has grouped some of the industry categories. For purposes of categorizing securities for compliance with Section 8(b)(1) of the Investment Company
Act of 1940, as amended, the Fund uses more specific industry classifications.
The Global Industry Classification Standard (GICS®) was developed by and is the exclusive property and a
service mark of MSCI, Inc. and Standard & Poor’s Financial Services LLC. It has been licensed for use by the Hennessy Funds.
|
HENNESSY FUNDS
|
1-800-966-4354
|
5
|
COMMON STOCKS – 98.27%
|
Number
|
% of
|
||||||||||
|
|
of Shares
|
Value
|
Net Assets
|
|||||||||
|
Financials – 98.03%
|
||||||||||||
|
Associated Banc-Corp.
|
160,000
|
$
|
3,192,000
|
2.90
|
%
|
|||||||
|
Banner Corp.
|
100,000
|
5,370,000
|
4.88
|
%
|
||||||||
|
Berkshire Hills Bancorp, Inc.
|
10,000
|
247,400
|
0.22
|
%
|
||||||||
|
Cadence Bank
|
90,000
|
2,253,600
|
2.05
|
%
|
||||||||
|
Coastal Financial Corp. (a)
|
18,000
|
738,720
|
0.67
|
%
|
||||||||
|
ConnectOne Bancorp, Inc.
|
185,000
|
5,154,100
|
4.68
|
%
|
||||||||
|
Eastern Bankshares, Inc.
|
170,000
|
3,257,200
|
2.96
|
%
|
||||||||
|
First BanCorp. (b)
|
490,000
|
6,668,900
|
6.05
|
%
|
||||||||
|
First Citizens BancShares, Inc.
|
8,500
|
5,434,730
|
4.93
|
%
|
||||||||
|
Flushing Financial Corp.
|
220,000
|
4,730,000
|
4.29
|
%
|
||||||||
|
Hancock Whitney Corp.
|
133,000
|
6,220,410
|
5.65
|
%
|
||||||||
|
HarborOne Bancorp, Inc.
|
40,000
|
535,600
|
0.49
|
%
|
||||||||
|
Hingham Institution for Savings
|
19,500
|
6,299,865
|
5.72
|
%
|
||||||||
|
HomeTrust Bancshares, Inc.
|
185,000
|
5,000,550
|
4.54
|
%
|
||||||||
|
Independent Bank Corp.
|
83,000
|
6,404,280
|
5.81
|
%
|
||||||||
|
Kearny Financial Corp. of Maryland
|
308,000
|
3,652,880
|
3.32
|
%
|
||||||||
|
Lakeland Bancorp, Inc.
|
358,000
|
5,380,740
|
4.89
|
%
|
||||||||
|
Luther Burbank Corp.
|
20,000
|
265,400
|
0.24
|
%
|
||||||||
|
New York Community Bancorp, Inc.
|
410,000
|
3,788,400
|
3.44
|
%
|
||||||||
|
Northeast Community Bancorp, Inc.
|
228,331
|
2,561,874
|
2.33
|
%
|
||||||||
|
Old National Bancorp
|
390,000
|
5,912,400
|
5.37
|
%
|
||||||||
|
PacWest Bancorp
|
97,000
|
3,190,330
|
2.90
|
%
|
||||||||
|
Shore Bancshares, Inc.
|
82,000
|
1,650,660
|
1.50
|
%
|
||||||||
|
Silvergate Capital Corp. (a)
|
19,500
|
2,280,720
|
2.07
|
%
|
||||||||
|
Synovus Financial Corp.
|
25,000
|
1,038,500
|
0.94
|
%
|
||||||||
|
Texas Capital Bancshares, Inc. (a)
|
105,000
|
5,392,800
|
4.90
|
%
|
||||||||
|
Western New England Bancorp, Inc.
|
337,000
|
2,894,830
|
2.63
|
%
|
||||||||
|
Wintrust Financial Corp.
|
37,000
|
3,230,840
|
2.93
|
%
|
||||||||
|
WSFS Financial Corp.
|
130,000
|
5,209,100
|
4.73
|
%
|
||||||||
|
|
107,956,829
|
98.03
|
%
|
|||||||||
|
Information Technology – 0.24%
|
||||||||||||
|
Bread Financial Holdings, Inc.
|
5,000
|
274,000
|
0.24
|
%
|
||||||||
|
|
||||||||||||
|
Total Common Stocks
|
||||||||||||
|
(Cost $87,627,986)
|
108,230,829
|
98.27
|
%
|
|||||||||
The accompanying notes are an integral part of these financial statements.
|
WWW.HENNESSYFUNDS.COM
|
6
|
SCHEDULE OF INVESTMENTS
|
|
SHORT-TERM INVESTMENTS – 1.86%
|
Number
|
% of
|
||||||||||
|
|
of Shares
|
Value
|
Net Assets
|
|||||||||
|
Money Market Funds – 1.86%
|
||||||||||||
|
First American Government Obligations Fund,
|
||||||||||||
|
Institutional Class, 0.22% (c)
|
2,043,774
|
$
|
2,043,774
|
1.86
|
%
|
|||||||
|
|
||||||||||||
|
Total Short-Term Investments
|
||||||||||||
|
(Cost $2,043,774)
|
2,043,774
|
1.86
|
%
|
|||||||||
|
|
||||||||||||
|
Total Investments
|
||||||||||||
|
(Cost $89,671,760) – 100.13%
|
110,274,603
|
100.13
|
%
|
|||||||||
|
Liabilities in Excess of Other Assets – (0.13)%
|
(148,361
|
)
|
(0.13
|
)%
|
||||||||
|
|
||||||||||||
|
TOTAL NET ASSETS – 100.00%
|
$
|
110,126,242
|
100.00
|
%
|
||||||||
Percentages are stated as a percent of net assets.
|
(a)
|
Non-income-producing security.
|
|
(b)
|
U.S.-traded security of a foreign corporation.
|
|
(c)
|
The rate listed is the fund’s seven-day yield as of April 30, 2022.
|
Summary of Fair Value Exposure as of April 30, 2022
The following is a summary of the inputs used to value the Fund’s net assets as of April 30, 2022 (see Note 3 in the accompanying Notes to the Financial Statements):
|
Common Stocks
|
Level 1
|
Level 2
|
Level 3
|
Total
|
||||||||||||
|
Financials
|
$
|
107,956,829
|
$
|
—
|
$
|
—
|
$
|
107,956,829
|
||||||||
|
Information Technology
|
274,000
|
—
|
—
|
274,000
|
||||||||||||
|
Total Common Stocks
|
$
|
108,230,829
|
$
|
—
|
$
|
—
|
$
|
108,230,829
|
||||||||
|
Short-Term Investments
|
||||||||||||||||
|
Money Market Funds
|
$
|
2,043,774
|
$
|
—
|
$
|
—
|
$
|
2,043,774
|
||||||||
|
Total Short-Term Investments
|
$
|
2,043,774
|
$
|
—
|
$
|
—
|
$
|
2,043,774
|
||||||||
|
Total Investments
|
$
|
110,274,603
|
$
|
—
|
$
|
—
|
$
|
110,274,603
|
||||||||
The accompanying notes are an integral part of these financial statements.
|
HENNESSY FUNDS
|
1-800-966-4354
|
7
Financial Statements
|
Statement of Assets and
Liabilities as of April 30, 2022 (Unaudited)
|
|
ASSETS:
|
||||
|
Investments in securities, at value (cost $89,671,760)
|
$
|
110,274,603
|
||
|
Dividends and interest receivable
|
25,073
|
|||
|
Receivable for fund shares sold
|
4,466
|
|||
|
Prepaid expenses and other assets
|
30,645
|
|||
|
Total assets
|
110,334,787
|
|||
|
LIABILITIES:
|
||||
|
Payable for fund shares redeemed
|
43,102
|
|||
|
Payable to advisor
|
91,412
|
|||
|
Payable to administrator
|
25,781
|
|||
|
Payable to auditor
|
11,228
|
|||
|
Accrued distribution fees
|
15,873
|
|||
|
Accrued service fees
|
8,082
|
|||
|
Accrued trustees fees
|
5,079
|
|||
|
Accrued expenses and other payables
|
7,988
|
|||
|
Total liabilities
|
208,545
|
|||
|
NET ASSETS
|
$
|
110,126,242
|
||
|
NET ASSETS CONSISTS OF:
|
||||
|
Capital stock
|
$
|
79,797,895
|
||
|
Total distributable earnings
|
30,328,347
|
|||
|
Total net assets
|
$
|
110,126,242
|
||
|
NET ASSETS:
|
||||
|
Investor Class
|
||||
|
Shares authorized (no par value)
|
Unlimited
|
|||
|
Net assets applicable to outstanding shares
|
$
|
86,076,734
|
||
|
Shares issued and outstanding
|
3,141,868
|
|||
|
Net asset value, offering price, and redemption price per share
|
$
|
27.40
|
||
|
Institutional Class
|
||||
|
Shares authorized (no par value)
|
Unlimited
|
|||
|
Net assets applicable to outstanding shares
|
$
|
24,049,508
|
||
|
Shares issued and outstanding
|
1,503,730
|
|||
|
Net asset value, offering price, and redemption price per share
|
$
|
15.99
|
||
The accompanying notes are an integral part of these financial statements.
|
WWW.HENNESSYFUNDS.COM
|
8
|
STATEMENT OF ASSETS AND LIABILITIES/STATEMENT OF OPERATIONS
|
Financial Statements
|
Statement of Operations for the six months ended April 30, 2022 (Unaudited)
|
|
INVESTMENT INCOME:
|
||||
|
Dividend income(1)
|
$
|
1,627,528
|
||
|
Interest income
|
978
|
|||
|
Total investment income
|
1,628,506
|
|||
|
EXPENSES:
|
||||
|
Investment advisory fees (See Note 5)
|
697,529
|
|||
|
Sub-transfer agent expenses – Investor Class (See Note 5)
|
107,310
|
|||
|
Sub-transfer agent expenses – Institutional Class (See Note 5)
|
8,782
|
|||
|
Distribution fees – Investor Class (See Note 5)
|
95,275
|
|||
|
Administration, accounting, custody, and transfer agent fees (See Note 5)
|
90,052
|
|||
|
Service fees – Investor Class (See Note 5)
|
63,516
|
|||
|
Federal and state registration fees
|
22,509
|
|||
|
Compliance expense (See Note 5)
|
15,156
|
|||
|
Audit fees
|
11,222
|
|||
|
Trustees’ fees and expenses
|
9,598
|
|||
|
Interest expense (See Note 7)
|
7,476
|
|||
|
Reports to shareholders
|
6,971
|
|||
|
Legal fees
|
900
|
|||
|
Other expenses
|
11,805
|
|||
|
Total expenses
|
1,148,101
|
|||
|
NET INVESTMENT INCOME
|
$
|
480,405
|
||
|
REALIZED AND UNREALIZED GAINS (LOSSES):
|
||||
|
Net realized gain on investments
|
$
|
12,219,980
|
||
|
Net change in unrealized appreciation/depreciation on investments
|
(29,977,548
|
)
|
||
|
Net loss on investments
|
(17,757,568
|
)
|
||
|
NET DECREASE IN NET ASSETS RESULTING FROM OPERATIONS
|
$
|
(17,277,163
|
)
|
|
|
(1)
|
Net of foreign taxes withheld of $10,250.
|
The accompanying notes are an integral part of these financial statements.
|
HENNESSY FUNDS
|
1-800-966-4354
|
9
(This Page Intentionally Left Blank.)
|
WWW.HENNESSYFUNDS.COM
|
10
|
STATEMENTS OF CHANGES IN NET ASSETS
|
Financial Statements
|
Statements of Changes in Net Assets
|
|
Six Months Ended
|
||||||||
|
April 30, 2022
|
Year Ended
|
|||||||
|
(Unaudited)
|
October 31, 2021
|
|||||||
|
OPERATIONS:
|
||||||||
|
Net investment income
|
$
|
480,405
|
$
|
1,237,630
|
||||
|
Net realized gain on investments
|
12,219,980
|
7,181,600
|
||||||
|
Net change in unrealized
|
||||||||
|
appreciation/depreciation on investments
|
(29,977,548
|
)
|
46,273,638
|
|||||
|
Net increase (decrease) in net
|
||||||||
|
assets resulting from operations
|
(17,277,163
|
)
|
54,692,868
|
|||||
|
DISTRIBUTIONS TO SHAREHOLDERS:
|
||||||||
|
Distributable earnings – Investor Class
|
(1,276,583
|
)
|
(640,077
|
)
|
||||
|
Distributable earnings – Institutional Class
|
(587,596
|
)
|
(266,480
|
)
|
||||
|
Total distributions
|
(1,864,179
|
)
|
(906,557
|
)
|
||||
|
CAPITAL SHARE TRANSACTIONS:
|
||||||||
|
Proceeds from shares subscribed – Investor Class
|
13,698,920
|
89,150,331
|
||||||
|
Proceeds from shares subscribed – Institutional Class
|
10,472,749
|
23,725,263
|
||||||
|
Dividends reinvested – Investor Class
|
1,243,912
|
621,958
|
||||||
|
Dividends reinvested – Institutional Class
|
549,827
|
237,659
|
||||||
|
Cost of shares redeemed – Investor Class
|
(53,557,247
|
)
|
(49,466,414
|
)
|
||||
|
Cost of shares redeemed – Institutional Class
|
(15,247,960
|
)
|
(11,517,594
|
)
|
||||
|
Net increase (decrease) in net assets
|
||||||||
|
derived from capital share transactions
|
(42,839,799
|
)
|
52,751,203
|
|||||
|
TOTAL INCREASE (DECREASE) IN NET ASSETS
|
(61,981,141
|
)
|
106,537,514
|
|||||
|
NET ASSETS:
|
||||||||
|
Beginning of period
|
172,107,383
|
65,569,869
|
||||||
|
End of period
|
$
|
110,126,242
|
$
|
172,107,383
|
||||
|
CHANGES IN SHARES OUTSTANDING:
|
||||||||
|
Shares sold – Investor Class
|
422,231
|
3,020,767
|
||||||
|
Shares sold – Institutional Class
|
566,377
|
1,373,793
|
||||||
|
Shares issued to holders as reinvestment
|
||||||||
|
of dividends – Investor Class
|
39,265
|
28,361
|
||||||
|
Shares issued to holders as reinvestment
|
||||||||
|
of dividends – Institutional Class
|
29,680
|
18,452
|
||||||
|
Shares redeemed – Investor Class
|
(1,762,262
|
)
|
(1,754,093
|
)
|
||||
|
Shares redeemed – Institutional Class
|
(819,660
|
)
|
(688,529
|
)
|
||||
|
Net increase (decrease) in shares outstanding
|
(1,524,369
|
)
|
1,998,751
|
|||||
The accompanying notes are an integral part of these financial statements.
|
HENNESSY FUNDS
|
1-800-966-4354
|
11
Financial Statements
|
Financial Highlights
|
For an Investor Class share outstanding throughout each period
|
Six Months Ended
|
||||
|
April 30, 2022
|
||||
|
(Unaudited)
|
||||
|
PER SHARE DATA:
|
||||
|
Net asset value, beginning of period
|
$
|
31.52
|
||
|
Income from investment operations:
|
||||
|
Net investment income (loss)
|
0.09
|
(1)
|
||
|
Net realized and unrealized gains (losses) on investments
|
(3.90
|
)
|
||
|
Total from investment operations
|
(3.81
|
)
|
||
|
Less distributions:
|
||||
|
Dividends from net investment income
|
(0.22
|
)
|
||
|
Dividends from net realized gains
|
(0.09
|
)
|
||
|
Total distributions
|
(0.31
|
)
|
||
|
Net asset value, end of period
|
$
|
27.40
|
||
|
TOTAL RETURN
|
-12.23
|
%(3)
|
||
|
SUPPLEMENTAL DATA AND RATIOS:
|
||||
|
Net assets, end of period (millions)
|
$
|
86.08
|
||
|
Ratio of expenses to average net assets
|
1.55
|
%(4)
|
||
|
Ratio of net investment income (loss) to average net assets
|
0.56
|
%(4)
|
||
|
Portfolio turnover rate(5)
|
12
|
%(3)
|
||
|
(1)
|
Calculated using the average shares outstanding method.
|
|
(2)
|
Amount is between $(0.005) and $0.005.
|
|
(3)
|
Not annualized.
|
|
(4)
|
Annualized.
|
|
(5)
|
Calculated on the basis of the Fund as a whole.
|
The accompanying notes are an integral part of these financial statements.
|
WWW.HENNESSYFUNDS.COM
|
12
|
FINANCIAL HIGHLIGHTS — INVESTOR CLASS
|
|
Year Ended October 31,
|
||||||||||||||||||
|
2021
|
2020
|
2019
|
2018
|
2017
|
||||||||||||||
|
$
|
17.46
|
$
|
21.60
|
$
|
21.96
|
$
|
26.02
|
$
|
23.48
|
|||||||||
|
0.25
|
(1)
|
0.16
|
(1)
|
0.10
|
(1)
|
0.03
|
(0.04
|
)
|
||||||||||
|
14.01
|
(3.55
|
)
|
0.93
|
(2.12
|
)
|
5.83
|
||||||||||||
|
14.26
|
(3.39
|
)
|
1.03
|
(2.09
|
)
|
5.79
|
||||||||||||
|
(0.20
|
)
|
(0.09
|
)
|
(0.07
|
)
|
0.00
|
(2)
|
(0.06
|
)
|
|||||||||
|
—
|
(0.66
|
)
|
(1.32
|
)
|
(1.97
|
)
|
(3.19
|
)
|
||||||||||
|
(0.20
|
)
|
(0.75
|
)
|
(1.39
|
)
|
(1.97
|
)
|
(3.25
|
)
|
|||||||||
|
$
|
31.52
|
$
|
17.46
|
$
|
21.60
|
$
|
21.96
|
$
|
26.02
|
|||||||||
|
82.20
|
%
|
-16.37
|
%
|
5.27
|
%
|
-8.79
|
%
|
25.03
|
%
|
|||||||||
|
$
|
140.03
|
$
|
54.96
|
$
|
89.36
|
$
|
122.00
|
$
|
174.01
|
|||||||||
|
1.58
|
%
|
1.65
|
%
|
1.58
|
%
|
1.54
|
%
|
1.52
|
%
|
|||||||||
|
0.90
|
%
|
0.96
|
%
|
0.47
|
%
|
0.11
|
%
|
(0.06
|
)%
|
|||||||||
|
28
|
%
|
75
|
%
|
46
|
%
|
28
|
%
|
46
|
%
|
|||||||||
The accompanying notes are an integral part of these financial statements.
|
HENNESSY FUNDS
|
1-800-966-4354
|
13
Financial Statements
|
Financial Highlights
|
For an Institutional Class share outstanding throughout each period
|
Six Months Ended
|
||||
|
April 30, 2022
|
||||
|
(Unaudited)
|
||||
|
PER SHARE DATA:
|
||||
|
Net asset value, beginning of period
|
$
|
18.57
|
||
|
Income from investment operations:
|
||||
|
Net investment income
|
0.08
|
(1)
|
||
|
Net realized and unrealized gains (losses) on investments
|
(2.28
|
)
|
||
|
Total from investment operations
|
(2.20
|
)
|
||
|
Less distributions:
|
||||
|
Dividends from net investment income
|
(0.33
|
)
|
||
|
Dividends from net realized gains
|
(0.05
|
)
|
||
|
Total distributions
|
(0.38
|
)
|
||
|
Net asset value, end of period
|
$
|
15.99
|
||
|
TOTAL RETURN
|
-12.09
|
%(2)
|
||
|
SUPPLEMENTAL DATA AND RATIOS:
|
||||
|
Net assets, end of period (millions)
|
$
|
24.05
|
||
|
Ratio of expenses to average net assets
|
1.19
|
%(3)
|
||
|
Ratio of net investment income to average net assets
|
0.91
|
%(3)
|
||
|
Portfolio turnover rate(4)
|
12
|
%(2)
|
||
|
(1)
|
Calculated using the average shares outstanding method.
|
|
(2)
|
Not annualized.
|
|
(3)
|
Annualized.
|
|
(4)
|
Calculated on the basis of the Fund as a whole.
|
The accompanying notes are an integral part of these financial statements.
|
WWW.HENNESSYFUNDS.COM
|
14
|
FINANCIAL HIGHLIGHTS — INSTITUTIONAL CLASS
|
|
Year Ended October 31,
|
||||||||||||||||||
|
2021
|
2020
|
2019
|
2018
|
2017
|
||||||||||||||
|
$
|
10.37
|
$
|
12.92
|
$
|
13.28
|
$
|
15.69
|
$
|
14.23
|
|||||||||
|
0.21
|
(1)
|
0.13
|
(1)
|
0.10
|
(1)
|
0.07
|
0.02
|
|||||||||||
|
8.26
|
(2.10
|
)
|
0.54
|
(1.27
|
)
|
3.56
|
||||||||||||
|
8.47
|
(1.97
|
)
|
0.64
|
(1.20
|
)
|
3.58
|
||||||||||||
|
(0.27
|
)
|
(0.19
|
)
|
(0.18
|
)
|
(0.02
|
)
|
(0.17
|
)
|
|||||||||
|
—
|
(0.39
|
)
|
(0.82
|
)
|
(1.19
|
)
|
(1.95
|
)
|
||||||||||
|
(0.27
|
)
|
(0.58
|
)
|
(1.00
|
)
|
(1.21
|
)
|
(2.12
|
)
|
|||||||||
|
$
|
18.57
|
$
|
10.37
|
$
|
12.92
|
$
|
13.28
|
$
|
15.69
|
|||||||||
|
82.88
|
%
|
-16.05
|
%
|
5.57
|
%
|
-8.42
|
%
|
25.56
|
%
|
|||||||||
|
$
|
32.08
|
$
|
10.61
|
$
|
20.74
|
$
|
35.66
|
$
|
37.92
|
|||||||||
|
1.20
|
%
|
1.29
|
%
|
1.23
|
%
|
1.15
|
%
|
1.15
|
%
|
|||||||||
|
1.31
|
%
|
1.27
|
%
|
0.84
|
%
|
0.51
|
%
|
0.30
|
%
|
|||||||||
|
28
|
%
|
75
|
%
|
46
|
%
|
28
|
%
|
46
|
%
|
|||||||||
The accompanying notes are an integral part of these financial statements.
|
HENNESSY FUNDS
|
1-800-966-4354
|
15
Financial Statements
|
Notes to the Financial
Statements April 30, 2022 (Unaudited)
|
1). ORGANIZATION
The Hennessy Small Cap Financial Fund (the “Fund”) is a series of Hennessy Funds Trust (the “Trust”), which was organized as a Delaware statutory trust on September 17, 1992. The Fund is an
open-end management investment company registered under the Investment Company Act of 1940, as amended. The investment objective of the Fund is capital appreciation. The Fund is a non-diversified fund.
The Fund offers Investor Class and Institutional Class shares. Each class of shares differs principally in its respective 12b-1 distribution and service, shareholder
servicing, and sub-transfer agent expenses. There are no sales charges. Each class has identical rights to earnings, assets, and voting privileges, except for class-specific expenses and exclusive rights to vote on
matters affecting only one class.
As an investment company, the Fund follows the investment company accounting and reporting guidance of the Financial Accounting Standards Board (“FASB”) Accounting Standard
Codification Topic 946 “Financial Services—Investment Companies.”
2). SIGNIFICANT ACCOUNTING POLICIES
The following is a summary of significant accounting policies consistently followed by the Fund in the preparation of the financial statements. These policies conform to U.S. generally
accepted accounting principles (“GAAP”).
|
a).
|
Securities Valuation – All investments in securities are valued in accordance with the Fund’s valuation policies and procedures, as described in Note 3.
|
|
b).
|
Federal Income Taxes – The Fund has elected to be taxed as a regulated investment company and intends to distribute substantially all of its taxable income to its shareholders and
otherwise comply with the provisions of the Internal Revenue Code of 1986, as amended, applicable to regulated investment companies. As a result, the Fund has made no provision for federal income taxes or
excise taxes. Net investment income/loss and realized gains/losses for federal income tax purposes may differ from those reported in the financial statements because of temporary book-basis and tax-basis
differences. Temporary differences are primarily the result of the treatment of wash sales for tax reporting purposes. The Fund recognizes interest and penalties related to income tax benefits, if any, in the
Statement of Operations as an income tax expense. Distributions from net realized gains for book purposes may include short-term capital gains, which are included as ordinary income to shareholders for tax
purposes. The Fund may utilize equalization accounting for tax purposes and designate earnings and profits, including net realized gains distributed to shareholders on redemption of shares, as part of the
dividends paid deduction for income tax purposes.
|
|
c).
|
Accounting for Uncertainty in Income Taxes – The Fund has accounting policies regarding recognition and measurement of tax positions taken or expected to be taken on a tax return. The
tax returns of the Fund for the prior three fiscal years are open for examination. The Fund has reviewed all open tax years in major tax jurisdictions and concluded that there is no impact on the Fund’s net
assets and no tax liability resulting from unrecognized tax benefits relating to uncertain income tax positions taken or expected to be taken on a tax return. The Fund’s major tax jurisdictions are U.S. federal
and Delaware.
|
|
WWW.HENNESSYFUNDS.COM
|
16
|
NOTES TO THE FINANCIAL STATEMENTS
|
|
d).
|
Income and Expenses – Dividend income is recognized on the ex-dividend date or as soon as information is available to the Fund. Interest income, which includes the amortization of
premium and accretion of discount, is recognized on an accrual basis. Market discounts, original issue discounts, and market premiums on debt securities are accreted or amortized to interest income over the
life of a security with a corresponding increase or decrease, as applicable, in the cost basis of such security using the yield-to-maturity method or, where applicable, the first call date of the security.
Other non-cash dividends are recognized as investment income at the fair value of the property received. The Fund is charged for those expenses that are directly attributable to its portfolio, such as advisory,
administration, and certain shareholder service fees. Income, expenses (other than expenses attributable to a specific class), and realized and unrealized gains/losses on investments are allocated to each class
of shares based on such class’s net assets.
|
|
e).
|
Distributions to Shareholders – Dividends from net investment income for the Fund, if any, are declared and paid annually, usually in December. Distributions of net realized capital
gains, if any, are declared and paid annually, usually in December.
|
|
f).
|
Security Transactions – Investment and shareholder transactions are recorded on the trade date. The Fund determines the realized gain/loss from an investment transaction by comparing
the original cost of the security lot sold with the net sale proceeds. Discounts and premiums on securities purchased are accreted or amortized, respectively, over the life of each such security.
|
|
g).
|
Use of Estimates – Preparing financial statements in accordance with GAAP requires management to make estimates and assumptions that affect the reported amounts of assets and
liabilities and disclosure of contingent assets and liabilities at the date of the financial statements, as well as the reported change in net assets during the reporting period. Actual results could differ
from those estimates.
|
|
h).
|
Share Valuation – The net asset value (“NAV”) per share of the Fund is calculated by dividing (i) the total value of the securities held by the Fund, plus cash and other assets, minus
all liabilities (including estimated accrued expenses) by (ii) the total number of Fund shares outstanding, rounded to the nearest $0.01. Fund shares are not priced on days the New York Stock Exchange is closed
for trading. The offering and redemption price per share for the Fund is equal to the Fund’s NAV per share.
|
|
i).
|
Recent Accounting Pronouncements and Regulatory Updates – In October 2020, the Securities and Exchange Commission (“SEC”) adopted new regulations governing the use of derivatives by
registered investment companies (“Rule 18f-4”). Rule 18f-4 imposes limits on the amount of derivatives a fund can enter into, eliminates the asset segregation framework currently used by funds to comply with
Section 18 of the 1940 Act, and requires funds whose use of derivatives is greater than a limited specified amount to establish and maintain a comprehensive derivatives risk management program and appoint a
derivatives risk manager. Funds are required to comply with Rule 18f-4 by August 19, 2022. The impact, if any, that Rule 18f-4 will have on the availability, liquidity, and performance of derivatives is
unclear. Management is currently evaluating the potential impact of Rule 18f-4 on the Fund. When fully implemented, Rule 18f-4 may require changes in how the Fund uses derivatives, adversely affect the Fund’s
performance, and increase costs related to the Fund’s use of derivatives.
|
|
In December 2020, the SEC adopted a new rule providing a framework for fund valuation practices (“Rule 2a-5”).
Rule 2a-5 establishes requirements for determining fair value in good faith for purposes of the 1940 Act. Rule 2a-5 permits fund boards
|
|
HENNESSY FUNDS
|
1-800-966-4354
|
17
|
to designate certain parties to perform fair value determinations, subject to board oversight and certain other conditions. Rule 2a-5 also defines when market quotations are “readily
available” for purposes of the 1940 Act and the threshold for determining whether a fund must fair value a security. In connection with Rule 2a-5, the SEC also adopted related recordkeeping requirements and is
rescinding previously issued guidance, including with respect to the role of a board in determining fair value and the accounting and auditing of fund investments. Funds must comply with the rules by September
8, 2022. Management is currently assessing the potential impact of the new rules on the Fund’s financial statements.
|
3). SECURITIES VALUATION
The Fund follows its valuation policies and procedures in determining its net asset value and, in preparing these financial statements, the fair value accounting standards that establish an
authoritative definition of fair value and set out a hierarchy for measuring fair value. These standards require additional disclosures about the various inputs and valuation techniques used to develop the measurements
of fair value and a discussion of changes in valuation techniques and related inputs during the period. These inputs are summarized in the three broad levels listed below:
|
Level 1 –
|
Unadjusted, quoted prices in active markets for identical instruments that the Fund has the ability to access at the date of measurement.
|
|
|
Level 2 –
|
Other significant observable inputs (including, but not limited to, quoted prices in active markets for similar instruments, quoted prices in markets that are not active for identical
or similar instruments, and model-derived valuations in which all significant inputs and significant value drivers are observable in active markets, such as interest rates, prepayment speeds, credit risk
curves, default rates, and similar data).
|
|
|
Level 3 –
|
Significant unobservable inputs (including the Fund’s own assumptions about what market participants would use to price the asset or liability based on the best available information)
when observable inputs are unavailable.
|
The following is a description of the valuation techniques applied to the Fund’s major categories of assets and liabilities on a recurring basis:
|
Equity Securities – Equity securities, including common stocks, preferred stocks, foreign-issued common stocks, exchange-traded funds,
closed-end mutual funds, partnerships, rights, and real estate investment trusts, that are traded on a securities exchange for which a last-quoted sales price is readily available generally are valued at the
last sales price as reported by the primary exchange on which the securities are listed. Securities listed on The Nasdaq Stock Market (“Nasdaq”) generally are valued at the Nasdaq Official Closing Price, which
may differ from the last sales price reported. Securities traded on a securities exchange for which a last-quoted sales price is not readily available generally are valued at the mean between the bid and ask
prices. To the extent these securities are actively traded and valuation adjustments are not applied, they are classified in Level 1 of the fair value hierarchy. Securities traded on foreign exchanges generally
are not valued at the same time the Fund calculates its NAV because most foreign markets close well before such time. The earlier close of most foreign markets gives rise to the possibility that significant
events, including broad market moves, may have occurred in the interim. In certain circumstances, it may be determined that a foreign security needs to be fair valued because it appears that the value of the
security might have been materially affected by events occurring after the close of the market in which the security is principally
|
|
WWW.HENNESSYFUNDS.COM
|
18
|
NOTES TO THE FINANCIAL STATEMENTS
|
|
traded, but before the time the Fund calculates its NAV, such as by a development that affects an entire market or region (e.g., a weather-related event) or a potentially global
development (e.g., a terrorist attack that may be expected to have an effect on investor expectations worldwide).
|
|
|
Registered Investment Companies – Investments in open-end registered investment companies, commonly referred to as mutual funds, generally are
priced at the ending NAV provided by the applicable mutual fund’s service agent and are classified in Level 1 of the fair value hierarchy.
|
|
|
Debt Securities – Debt securities, including corporate bonds, asset-backed securities, mortgage-backed securities, municipal bonds, U.S.
Treasuries, and U.S. government agency issues, are generally valued at market on the basis of valuations furnished by an independent pricing service that utilizes both dealer-supplied valuations and
formula-based techniques. The pricing service may consider recently executed transactions in securities of the issuer or comparable issuers, market price quotations (where observable), bond spreads, and
fundamental data relating to the issuer. In addition, the model may incorporate observable market data, such as reported sales of similar securities, broker quotes, yields, bids, offers, and reference data.
Certain securities are valued primarily using dealer quotations. These securities are generally classified in Level 2 of the fair value hierarchy.
|
|
|
Short-Term Securities – Short-term equity investments, including money market funds, are valued in the manner specified above for equity
securities. Short-term debt investments with an original term to maturity of 60 days or less are valued at amortized cost, which approximates fair market value. If the original term to maturity of a short-term
debt investment exceeds 60 days, then the values as of the 61st day prior to maturity are amortized. Amortized cost is not used if its use would be inappropriate due to credit or other impairments of the
issuer, in which case the security’s fair value would be determined as described below. Short-term securities are generally classified in Level 1 or Level 2 of the fair value hierarchy depending on the inputs
used and market activity levels for specific securities.
|
The Board of Trustees of the Fund (the “Board”) has adopted fair value pricing procedures that are followed when a price for a security is not readily available or if a
significant event has occurred that indicates the closing price of a security no longer represents the true value of that security. Fair value pricing determinations are made in good faith in accordance with these
procedures. There are numerous criteria considered in determining a fair value of a security, such as the trading volume of a security and markets, the values of other similar securities, and news events with direct
bearing on a security or markets. Fair value pricing results in an estimated price for a security that reflects the amount the Fund might reasonably expect to receive in a current sale. Depending on the relative
significance of the valuation inputs, these securities may be classified in either Level 2 or Level 3 of the fair value hierarchy.
The fair value of foreign securities may be determined with the assistance of a pricing service using correlations between the movement of prices of such securities and
indices of domestic securities and other appropriate indicators, such as closing market prices of relevant American Depositary Receipts or futures contracts. Using fair value pricing means that the Fund’s NAV reflects
the affected portfolio securities’ values as determined by the Board or its designee, pursuant to the fair value pricing procedures adopted by the Board, instead of being determined by the market. Using a fair value
pricing methodology to price a foreign security may result in a value that is different from such foreign security’s most recent closing price and from the value used by other investment
|
HENNESSY FUNDS
|
1-800-966-4354
|
19
companies to calculate their NAVs. Such securities are generally classified in Level 2 of the fair value hierarchy. Because the Fund may invest in foreign securities, the value of the Fund’s
portfolio securities may change on days when a shareholder is unable to purchase or redeem Fund shares.
The Board has delegated day-to-day valuation matters to the Valuation and Liquidity Committee comprising representatives from Hennessy Advisors, Inc., the Fund’s investment
advisor (the “Advisor”). The function of the Valuation and Liquidity Committee, among other things, is to value securities where current and reliable market quotations are not readily available. All actions taken by
the Valuation and Liquidity Committee are reviewed by the Board.
The Fund has performed an analysis of all existing investments to determine the significance and character of all inputs to their fair value determinations. Various inputs
are used to determine the value of the Fund’s investments. The inputs or methodology used for valuing securities are not necessarily an indication of the risk associated with investing in those securities. Details
related to the fair value hierarchy of the Fund’s securities as of April 30, 2022, are included in the Schedule of Investments.
4). INVESTMENT TRANSACTIONS
Purchases and sales of investment securities (excluding government and short-term investments) for the Fund during the six months ended April 30, 2022, were $18,071,556 and $59,136,586,
respectively.
There were no purchases or sales/maturities of long-term U.S. government securities for the Fund during the six months ended April 30, 2022.
5). INVESTMENT ADVISORY FEE AND OTHER TRANSACTIONS WITH AFFILIATES
The Advisor provides the Fund with investment advisory services under an Investment Advisory Agreement. The Advisor furnishes all investment advice, office space, and facilities and most of
the personnel needed by the Fund. As compensation for its services, the Advisor is entitled to a monthly fee from the Fund. The fee is based on the average daily net assets of the Fund at an annual rate of 0.90%. The
net investment advisory fees expensed by the Fund during the six months ended April 30, 2022, are included in the Statement of Operations.
The Board has approved a Shareholder Servicing Agreement for Investor Class shares of the Fund, which compensates the Advisor for the non-investment advisory services it
provides to the Fund. The Shareholder Servicing Agreement provides for a monthly fee paid to the Advisor at an annual rate of 0.10% of the average daily net assets of the Fund attributable to Investor Class shares. The
shareholder service fees expensed by the Fund during the six months ended April 30, 2022, are included in the Statement of Operations.
The Fund has adopted a plan pursuant to Rule 12b-1 under the Investment Company Act of 1940, as amended, that authorizes payments in connection with the distribution of
Fund shares at an annual rate of up to 0.25% of the Fund’s average daily net assets attributable to Investor Class shares. Even though the authorized rate is up to 0.25%, the Fund is currently only using up to 0.15% of
its average daily net assets attributable to Investor Class shares for such purpose. Amounts paid under the plan may be spent on any activities or expenses primarily intended to result in the sale of shares, including,
but not limited to, advertising, shareholder account servicing, printing and mailing of prospectuses to other than current shareholders, printing and mailing of sales literature, and compensation for sales and
marketing activities or to financial institutions and others, such as dealers and distributors. The distribution fees expensed by the Fund during the six months ended April 30, 2022, are included in the Statement of
Operations.
|
WWW.HENNESSYFUNDS.COM
|
20
|
NOTES TO THE FINANCIAL STATEMENTS
|
The Fund has entered into agreements with various brokers, dealers, and financial intermediaries in connection with the sale of Fund shares. The agreements provide for
periodic payments of sub-transfer agent expenses by the Fund to the brokers, dealers, and financial intermediaries for providing certain shareholder maintenance services. These shareholder services include the
pre-processing and quality control of new accounts, shareholder correspondence, answering customer inquiries regarding account status, and facilitating shareholder telephone transactions. The sub-transfer agent fees
expensed by the Fund during the six months ended April 30, 2022, are included in the Statement of Operations.
U.S. Bancorp Fund Services, LLC, d/b/a U.S. Bank Global Fund Services (“Fund Services”) provides the Fund with administrative, accounting, and transfer agent services. As
administrator, Fund Services is responsible for activities such as (i) preparing various federal and state regulatory filings, reports, and returns for the Fund, (ii) preparing reports and materials to be supplied to
the Board, (iii) monitoring the activities of the Fund’s custodian, transfer agent, and accountants, and (iv) coordinating the preparation and payment of the Fund’s expenses and reviewing the Fund’s expense accruals.
U.S. Bank N.A., an affiliate of Fund Services, serves as the Fund’s custodian. The servicing agreements between the Trust, Fund Services, and U.S. Bank N.A. contain a fee schedule that is inclusive of administrative,
accounting, custody, and transfer agent fees. The administrative, accounting, custody, and transfer agent fees expensed by the Fund during the six months ended April 30, 2022, are included in the Statement of
Operations.
Quasar Distributors, LLC (“Quasar”), a wholly owned broker-dealer subsidiary of Foreside Financial Group, LLC, acts as the Fund’s principal underwriter in a continuous
public offering of Fund shares.
The officers of the Fund are affiliated with the Advisor. With the exception of the Chief Compliance Officer and the Senior Compliance Officer, such officers receive no
compensation from the Fund for serving in their respective roles. The Fund, along with the other funds in the Hennessy Funds family (collectively, the “Hennessy Funds”), makes reimbursement payments on an equal basis
to the Advisor for a portion of the salary and benefits associated with the office of the Chief Compliance Officer and for all of the salary and benefits associated with the office of the Senior Compliance Officer. The
compliance fees expensed by the Fund during the six months ended April 30, 2022, are included in the Statement of Operations.
6). GUARANTEES AND INDEMNIFICATIONS
Under the Hennessy Funds’ organizational documents, their officers and trustees are indemnified by the Hennessy Funds against certain liabilities arising out of the performance of their
duties to the Hennessy Funds. Additionally, in the normal course of business, the Hennessy Funds enter into contracts with service providers that contain general indemnification clauses. The Fund’s maximum exposure
under these arrangements is unknown as this would involve future claims that may be made against the Fund that have not yet occurred. Currently, the Fund expects the risk of loss to be remote.
7). LINE OF CREDIT
The Fund has an uncommitted line of credit with the other Hennessy Funds in the amount of the lesser of (i) $100,000,000 or (ii) 33.33% of each Hennessy Fund’s net assets, or 30% for the
Hennessy Gas Utility Fund and 10% for the Hennessy Balanced Fund. The line of credit is intended to provide any necessary short-term financing in connection with shareholder redemptions, subject to certain
restrictions. The credit facility is with the Hennessy Funds’ custodian bank, U.S. Bank N.A. Borrowings under
|
HENNESSY FUNDS
|
1-800-966-4354
|
21
this arrangement bear interest at the bank’s prime rate and are secured by all of the Fund’s assets (as to its own borrowings only). During the six months ended April 30, 2022, the Fund had
an outstanding average daily balance and a weighted average interest rate of $440,254 and 3.38%, respectively. The interest expensed by the Fund during the six months ended April 30, 2022, is included in the Statement
of Operations. The maximum amount outstanding for the Fund during the period was $15,682,000. As of April 30, 2022, the Fund did not have any borrowings outstanding under the line of credit.
8). FEDERAL TAX INFORMATION
As of October 31, 2021, the Fund’s most recent fiscal year end, the components of accumulated earnings (losses) for income tax purposes were as follows:
|
Investments
|
||||
|
Cost of investments for tax purposes
|
$
|
126,270,823
|
||
|
Gross tax unrealized appreciation
|
$
|
51,915,639
|
||
|
Gross tax unrealized depreciation
|
(3,505,271
|
)
|
||
|
Net tax unrealized appreciation/(depreciation)
|
$
|
48,410,368
|
||
|
Undistributed ordinary income
|
$
|
573,969
|
||
|
Undistributed long-term capital gains
|
485,352
|
|||
|
Total distributable earnings
|
$
|
1,059,321
|
||
|
Other accumulated gain/(loss)
|
$
|
—
|
||
|
Total accumulated gain/(loss)
|
$
|
49,469,689
|
||
The difference between book-basis unrealized appreciation/depreciation and tax-basis unrealized appreciation/depreciation (as shown above) is attributable primarily to wash
sales.
As of October 31, 2021, the Fund had no tax-basis capital losses to offset future capital gains. During fiscal year 2021, the capital losses utilized by the fund were
$6,639,295.
Capital losses sustained in or after fiscal year 2012 can be carried forward indefinitely, but any such loss retains the character of the original loss and must be utilized
prior to any loss incurred before fiscal year 2012. As a result of this ordering rule, capital loss carryforwards incurred prior to fiscal year 2012 may be more likely to expire unused. Capital losses sustained prior
to fiscal year 2012 can be carried forward for eight years and can be carried forward as short-term capital losses regardless of the character of the original loss.
As of October 31, 2021, the Fund did not defer, on a tax basis, any late-year ordinary losses. Late-year ordinary losses are net ordinary losses incurred after December 31,
2020, but within the taxable year, that are deemed to arise on the first day of the Fund’s next taxable year.
During fiscal year 2022 (year to date) and fiscal year 2021, the tax character of distributions paid by the Fund was as follows:
|
Six Months Ended
|
Year Ended
|
||||||||
|
April 30, 2022
|
October 31, 2021
|
||||||||
|
Ordinary income(1)
|
$
|
1,378,796
|
$
|
906,557
|
|||||
|
Long-term capital gains
|
485,383
|
—
|
|||||||
|
Total distributions
|
$
|
1,864,179
|
$
|
906,557
|
|||||
|
(1) Ordinary income includes short-term capital gains.
|
|
WWW.HENNESSYFUNDS.COM
|
22
|
NOTES TO THE FINANCIAL STATEMENTS
|
9). LIBOR TRANSITION
The Fund invests in financial instruments with payment obligations, financing terms, hedging strategies, or investment values based on, among other floating rates, the London Interbank
Offered Rate (“LIBOR”). Determined by the ICE Benchmark Administration, LIBOR is an average interest rate that banks charge one another for the use of short-term money. In 2017, the United Kingdom’s Financial Conduct
Authority (the “FCA”), which regulates LIBOR, announced plans to phase out the use of LIBOR by the end of 2021. Most LIBOR settings are no longer being published as of December 31, 2021, and the FCA and ICE Benchmark
Administrator have announced that a majority of U.S. dollar LIBOR settings will cease publication after June 30, 2023. The U.S. Federal Reserve has begun publishing the Secured Overnight Financing Rate (SOFR), which is
intended to replace the U.S. dollar LIBOR. Other regulators and industry groups around the world have announced or begun publishing proposed alternative reference rates for other currencies, but global consensus is
lacking, and the process for amending many existing contracts or instruments to transition away from LIBOR remains unclear. Uncertainty related to the liquidity impact of the change in reference rates and how to
appropriately adjust these rates at the time of transition may lead to increased volatility and illiquidity in markets tied to LIBOR, reduce the value of LIBOR-related instruments, and reduce the effectiveness of
hedging strategies, which could adversely affect the Fund’s performance. Moreover, the risks associated with this discontinuation and transition could be exacerbated if the work necessary to effect an orderly
transition to an alternative reference rate is not completed in a timely manner. Accordingly, it is difficult to predict the full impact of the transition away from LIBOR on the Fund until new reference rates and
fallbacks for both legacy and new instruments and contracts are commercially accepted and market practices become settled.
10). EVENTS SUBSEQUENT TO PERIOD END
Management has evaluated the Fund’s related events and transactions that occurred subsequent to April 30, 2022, through the date of issuance of the Fund’s financial statements. Management has
determined that there were no subsequent events requiring recognition or disclosure in the financial statements.
|
HENNESSY FUNDS
|
1-800-966-4354
|
23
Expense Example (Unaudited)
April 30, 2022
As a shareholder of the Fund, you incur ongoing costs, including management fees, service fees, and other Fund expenses. This Example is intended to help you understand your ongoing costs (in
dollars) of investing in the Fund and to compare these costs with the ongoing costs of investing in other mutual funds. The Example is based on an investment of $1,000 invested at the beginning of the period and held
for the entire period from November 1, 2021, through April 30, 2022.
Actual Expenses
In the table below, the first line under each of the “Investor Class” and “Institutional Class” headings provides information about actual account values and actual expenses for each share
class. You may use this information, together with the amount you invested, to estimate the expenses that you paid over the period. Simply divide your account value by $1,000 (for example, an $8,600 account value
divided by $1,000 = 8.6), then multiply the result by the number in the first line under the heading “Expenses Paid During Period” to estimate the expenses you paid on your account during this period. Although the Fund
charges no sales loads or transaction fees, you will be assessed fees for outgoing wire transfers, returned checks, and stop payment orders at prevailing rates charged by U.S. Bank Global Fund Services, the Fund’s
transfer agent. If you request that a redemption be made by wire transfer, the Fund’s transfer agent charges a $15 fee. IRAs are charged a $15 annual maintenance fee (up to $30 maximum per shareholder for shareholders
with multiple IRAs). The examples below include, but are not limited to, management, shareholder servicing, accounting, custody, and transfer agent fees. However, the examples below do not include portfolio trading
commissions and related expenses.
Hypothetical Example for Comparison Purposes
In the table below, the second line under each of the “Investor Class” and “Institutional Class” headings provides information about hypothetical account values and hypothetical expenses
based on the Fund’s actual expense ratio for each share class and an assumed rate of return of 5% per year before expenses, which is not the Fund’s actual return for such share class. The hypothetical account values
and expenses may not be used to estimate the actual ending account balance or expenses you paid for the period. You may use this information to compare the ongoing costs of investing in the Fund and other funds. To do
so, compare these 5% hypothetical examples with the 5% hypothetical examples that appear in the shareholder reports of the other funds. Please note that the expenses shown in the table are meant to highlight your
ongoing costs only. Therefore, the second lines under “Investor Class” and “Institutional Class” are useful in comparing ongoing costs only and will not help you determine the relative total costs of owning different
funds.
|
WWW.HENNESSYFUNDS.COM
|
24
|
EXPENSE EXAMPLE
|
|
Beginning
|
Ending
|
||
|
Account Value
|
Account Value
|
Expenses Paid
|
|
|
November 1, 2021
|
April 30, 2022
|
During Period(1)
|
|
|
Investor Class
|
|||
|
Actual
|
$1,000.00
|
$ 877.70
|
$7.22
|
|
Hypothetical (5% return before expenses)
|
$1,000.00
|
$1,017.11
|
$7.75
|
|
Institutional Class
|
|||
|
Actual
|
$1,000.00
|
$ 879.10
|
$5.54
|
|
Hypothetical (5% return before expenses)
|
$1,000.00
|
$1,018.89
|
$5.96
|
|
(1)
|
Expenses are equal to the Fund’s annualized expense ratio of 1.55% for Investor Class shares or 1.19% for Institutional Class shares, as applicable, multiplied by the average account
value over the period, multiplied by 181/365 days (to reflect the half-year period).
|
|
HENNESSY FUNDS
|
1-800-966-4354
|
25
How to Obtain a Copy of the Fund’s Proxy
Voting Policy and Proxy Voting Records
A description of the policies and procedures the Fund uses to determine how to vote proxies relating to portfolio securities is available without charge (1) by calling 800-966-4354, (2) on
the Hennessy Funds’ website at www.hennessyfunds.com/proxy-voting/voting-policy, or (3) on the U.S. Securities and Exchange Commission’s (the “SEC”) website at www.sec.gov. The Fund’s proxy voting record is available
without charge on both the Hennessy Funds’ website at www.hennessyfunds.com/proxy-voting/voting-record and the SEC’s website at www.sec.gov no later than August 31 for the prior 12 months ending June 30.
Availability of Quarterly Portfolio Schedule
The Fund files its complete schedule of portfolio holdings with the SEC for the first and third quarters of each fiscal year as an exhibit to its reports on Form N-PORT. The Fund’s Form
N-PORT reports are available on the SEC’s website at www.sec.gov or on request by calling 800-966-4354.
Federal Tax Distribution Information (Unaudited)
For fiscal year 2021, certain dividends paid by the Fund may be subject to a maximum tax rate of 23.8%, as provided for by the Jobs and Growth Tax Relief Reconciliation Act of 2003. The
percentage of dividends declared from ordinary income designated as qualified dividend income was 100.00%.
For corporate shareholders, the percent of ordinary income distributions that qualified for the corporate dividends received deduction for fiscal year 2021 was 100.00%.
The percentage of taxable ordinary income distributions that were designated as short-term capital gain distributions under Section 871(k)(2)(C) of the Internal Revenue
Code of 1986, as amended, for the Fund was 0.00%.
Important Notice Regarding Delivery
of Shareholder Documents
To help keep the Fund’s costs as low as possible, we generally deliver a single copy of shareholder reports, proxy statements, and prospectuses to shareholders who share an address and have
the same last name. This process does not apply to account statements. You may request an individual copy of a shareholder document at any time. If you would like to receive separate mailings of shareholder documents,
please call U.S. Bank Global Fund Services at 800-261-6950 or 414-765-4124, and individual delivery will begin within 30 days of your request. If your account is held through a financial institution or other
intermediary, please contact such intermediary directly to request individual delivery.
Electronic Delivery
As permitted by SEC regulations, the Fund’s shareholder reports are made available on a website, and unless you sign up for eDelivery or elect to receive paper copies as detailed below, you
will be notified each time a report is posted and provided with a website link to access the report.
The Fund also offers shareholders the option to receive all notices, account statements, prospectuses, tax forms, and shareholder reports electronically. To sign up for
eDelivery or change your delivery preference, please visit www.hennessyfunds.com/account.
To elect to receive paper copies of all future reports free of charge, please call U.S. Bank Global Fund Services at 800-261-6950 or 414-765-4124.
Subscribe to receive our team’s unique market and sector insights delivered to your inbox
www.hennessyfunds.com/subscribe
Follow us on social media
| |
|
|
WWW.HENNESSYFUNDS.COM
|
26
|
PROXY VOTING — BOARD APPROVAL OF INVESTMENT ADVISORY AGREEMENT
|
Board Approval of Investment Advisory
Agreement
At its meeting on March 11, 2022, the Board of Trustees of the Fund (the “Board,” and the members thereof, the “Trustees”) unanimously approved the continuation of the investment advisory
agreement of the Fund with Hennessy Advisors, Inc. (the “Advisor”). As part of the process, the Trustees reviewed their fiduciary duties and the relevant factors for them to consider with respect to approving the
advisory agreement. In addition, the Trustees who are not deemed “interested persons” (as defined by the Investment Company Act of 1940, as amended) of the Fund (the “Independent Trustees”) met in executive session to
discuss the approval of the advisory agreement. As part of their discussion, the Independent Trustees confirmed their understanding of the need to have asked about, and received answers to, any matters that they
believed are relevant to determining whether to approve the continuation of the advisory agreement.
In advance of the meeting, the Advisor sent detailed information to the Trustees to assist them in their evaluation of the advisory agreement. This information included,
but was not limited to, the following:
|
(1)
|
A memorandum from outside legal counsel that described the fiduciary duties of the Board with respect to approving the continuation of the advisory agreement and the relevant factors
for consideration;
|
|
|
(2)
|
A memorandum from the Advisor that listed the factors relevant to the Board’s approval of the continuation of the advisory agreement and also referenced the documents that had been
provided to help the Board assess each such factor;
|
|
|
(3)
|
The Advisor’s financial statements from its most recent Form 10-K and Form 10-Q;
|
|
|
(4)
|
A summary of the advisory agreement;
|
|
|
(5)
|
A recent Fund fact sheet, which included, among other things, Fund performance over various periods;
|
|
|
(6)
|
A description of the range of services provided by the Advisor;
|
|
|
(7)
|
A peer expense comparison of the net expense ratio and investment advisory fee of the Fund; and
|
|
|
(8)
|
A memorandum from the Advisor regarding economies of scale.
|
The Trustees reviewed and discussed all of the information provided by the Advisor. Following this review, and further discussion with the Advisor, the Trustees concluded
that the information provided before and at the meeting addressed all of the relevant matters that they wanted to consider in assessing the performance of the Funds and the performance of the Advisor under the advisory
agreement, and that said information provided them with a fulsome understanding of the advisory agreement and the services provided by the Advisor.
All of the factors discussed were considered as a whole by the Trustees, as well as by the Independent Trustees meeting in executive session. The Trustees viewed the
relevant factors in their totality, with no single factor being the principal or determinative factor in the Trustees’ determination of whether to approve the continuation of the advisory agreement. The Trustees
recognized that the management and fee arrangements for the Fund are the result of years of review and discussion between the Independent Trustees and the Advisor, that certain aspects of such arrangements may receive
greater scrutiny in
|
HENNESSY FUNDS
|
1-800-966-4354
|
27
some years than in others, and that the Trustees’ conclusions may be based, in part, on their consideration of these same arrangements and information received during the course of the year
and in prior years.
Prior to approving the continuation of the advisory agreement, the Trustees, including the Independent Trustees in executive session, considered, among other items:
|
(1)
|
The nature and quality of the advisory services provided by the Advisor;
|
|
|
(2)
|
A comparison of the fees and expenses of the Fund to other similar funds;
|
|
|
(3)
|
Whether economies of scale are recognized by the Fund;
|
|
|
(4)
|
The costs and profitability of the Fund to the Advisor;
|
|
|
(5)
|
The performance of the Fund; and
|
|
|
(6)
|
Any benefits to the Advisor from serving as an investment advisor to the Fund (other than the advisory fee).
|
The material considerations and determinations of the Trustees, including the Independent Trustees, were as follows:
|
(1)
|
The Trustees considered the services identified below that are provided by the Advisor. Based on this review and an assessment of the Advisor’s performance, the Trustees concluded
that the Advisor provides high-quality services to the Fund, and they noted that their overall confidence in the Advisor was high. The Trustees also concluded that they were satisfied with the nature, extent,
and quality of the advisory services provided to the Fund by the Advisor and that the nature and extent of the services provided by the Advisor were appropriate to assure that the Fund’s operations are
conducted in compliance with applicable laws, rules, and regulations.
|
|
(a)
|
The Advisor acts as the portfolio manager for the Fund. In this capacity, the Advisor does the following:
|
|
(i)
|
manages the composition of the Fund’s portfolio, including the purchase, retention, and disposition of portfolio securities in accordance with the Fund’s investment objectives,
policies, and restrictions;
|
|||
|
(ii)
|
seeks best execution for the Fund’s portfolio;
|
|||
|
(iii)
|
manages the use of soft dollars for the Fund; and
|
|||
|
(iv)
|
manages proxy voting for the Fund.
|
|
(b)
|
The Advisor performs a daily reconciliation of portfolio positions and cash for the Fund.
|
||
|
(c)
|
The Advisor monitors the liquidity of each Fund.
|
||
|
(d)
|
The Advisor monitors the Fund’s compliance with its investment objectives and restrictions and federal securities laws.
|
||
|
(e)
|
The Advisor maintains a compliance program (including a code of ethics), conducts ongoing reviews of the compliance programs of the Fund’s service providers (including their codes of
ethics, as appropriate), conducts on-site visits to the Fund’s service providers, as feasible, monitors incidents of abusive trading practices, reviews Fund expense accruals, payments, and fixed expense ratios,
evaluates insurance providers for fidelity bond, D&O/E&O insurance, and cybersecurity insurance coverage, manages regulatory examination compliance and responses, conducts employee compliance training,
reviews reports provided by service providers, and maintains books and records.
|
|
WWW.HENNESSYFUNDS.COM
|
28
|
BOARD APPROVAL OF INVESTMENT ADVISORY AGREEMENT
|
|
(f)
|
The Advisor oversees service providers that provide accounting, administration, distribution, transfer agency, custodial, sales, marketing, public relations, audit, information
technology, and legal services to the Fund.
|
||
|
(g)
|
The Advisor maintains in-house marketing and distribution departments on behalf of the Fund.
|
||
|
(h)
|
The Advisor prepares or directs the preparation of all regulatory filings for the Fund, including writing and annually updating the Fund’s prospectus and related documents.
|
||
|
(i)
|
For each annual report of the Fund, the Advisor prepares a written summary of the Fund’s performance during the most recent 12-month period.
|
||
|
(j)
|
The Advisor oversees distribution of the Fund through third-party broker/dealers and independent financial institutions such as Charles Schwab, Inc., Fidelity, TD Ameritrade, and
Pershing. The Advisor participates in “no transaction fee” (“NTF”) programs with these companies on behalf of the Fund, which allow customers to purchase the Fund through third-party distribution channels
without paying a transaction fee. The Advisor compensates, in part, a number of these third-party providers of NTF programs out of its own revenues.
|
||
|
(k)
|
The Advisor pays the incentive compensation of the Fund’s compliance officers and employs other staff, such as legal, marketing, national accounts, distribution, sales,
administrative, and trading oversight personnel, as well as management executives.
|
||
|
(l)
|
The Advisor provides a quarterly compliance certification to the Board.
|
||
|
(m)
|
The Advisor prepares or reviews all Board materials, presents to and leads discussions with the Board, prepares or reviews all meeting minutes, and arranges for Board training and
education.
|
|
(2)
|
The Trustees compared the performance of the Fund to benchmark indices over various periods and noted that the Trustees review and discuss reports comparing the investment performance
of the Fund to various indices at each quarterly Board meeting. Based on such information, the Trustees determined that the Advisor manages the Fund in a manner materially consistent with its stated investment
objective and style. The Trustees concluded that the performance of the Fund over various periods warranted the continuation of the advisory agreement.
|
|
|
(3)
|
The Trustees reviewed the advisory fees and overall expense ratios of the Fund compared to other funds similar in asset size and investment objective to the Fund using data from
Morningstar. As part of the discussion with management, the Trustees ensured that they understood and were comfortable with the criteria used to determine the mutual funds included in the Morningstar categories
for purposes of the materials considered at the meeting. The Trustees determined that the advisory fee and overall expense ratio of the Fund falls within a reasonable range of the advisory fees and overall
expense ratios of other comparable funds and concluded that they are reasonable and warranted continuation of the advisory agreement.
|
|
|
(4)
|
The Trustees also considered whether the Advisor was realizing economies of scale that should be shared with the Fund’s shareholders. The Trustees noted that the majority of expenses
incurred to manage the Fund are variable
|
|
HENNESSY FUNDS
|
1-800-966-4354
|
29
|
asset-based fees, so the Advisor does not realize material economies of scale relating to these expenses as the assets of the Fund increase. For example, third-party platform fees
increase as the Fund’s assets grow.
|
||
|
(5)
|
The Trustees considered the profitability of the Advisor, including the impact of mutual fund platform fees on the Advisor’s profitability, and also considered the resources and
revenues that the Advisor has put into managing and distributing the Fund. The Trustees then concluded that the profits of the Advisor are reasonable and not excessive when compared to profitability guidelines
set forth in relevant court cases.
|
|
|
(6)
|
The Trustees considered the high level of professionalism and knowledge of the Advisor’s employees and concluded that this was beneficial to the Fund and its shareholders.
|
|
|
(7)
|
The Trustees considered any benefits to the Advisor from serving as an advisor to the Fund (other than the advisory fee). The Trustees noted that the Advisor may derive ancillary
benefits from, by way of example, its association with the Fund in the form of proprietary and third-party research products and services received from broker-dealers that execute portfolio trades for the Fund.
The Trustees determined that any such products and services have been used for legitimate purposes relating to the Fund by providing assistance in the investment decision-making process. The Trustees concluded
that any additional benefits realized by the Advisor from its relationship with the Fund were reasonable, which was based on, among other things, the Trustees’ finding that the research, analytical,
statistical, and other information and services provided by brokers are merely supplemental to the Advisor’s own efforts in the performance of its duties under the advisory agreement.
|
After reviewing the materials and information provided at the meeting, as well as other information regularly provided at the Board’s quarterly meetings throughout the year
regarding the quality of services provided by the Advisor, the performance of the Fund, expense information, brokerage commissions information, the adequacy and efficacy of the Advisor’s written policies and
procedures, other regulatory compliance issues, trading information and related matters, and other factors that the Trustees deemed relevant, the Trustees, including the Independent Trustees, approved the continuation
of the advisory agreement.
|
WWW.HENNESSYFUNDS.COM
|
30
|
BOARD APPROVAL OF INVESTMENT ADVISORY AGREEMENT
|
(This Page Intentionally Left Blank.)
For information, questions, or assistance, please call
The Hennessy Funds
800-966-4354 or 415-899-1555
INVESTMENT ADVISOR
Hennessy Advisors, Inc.
7250 Redwood Boulevard, Suite 200
Novato, California 94945
ADMINISTRATOR,
TRANSFER AGENT,
DIVIDEND PAYING AGENT, &
SHAREHOLDER SERVICING AGENT
U.S. Bancorp Fund Services, LLC
d/b/a U.S. Bank Global Fund Services
P.O. Box 701
Milwaukee, Wisconsin 53201-0701
CUSTODIAN
U.S. Bank N.A.
Custody Operations
1555 North River Center Drive, Suite 302
Milwaukee, Wisconsin 53212
TRUSTEES
Neil J. Hennessy
J. Dennis DeSousa
Robert T. Doyle
Claire Garvie
Gerald P. Richardson
COUNSEL
Foley & Lardner LLP
777 East Wisconsin Avenue
Milwaukee, Wisconsin 53202-5306
INDEPENDENT REGISTERED
PUBLIC ACCOUNTING FIRM
Tait, Weller & Baker LLP
Two Liberty Place
50 South 16th Street, Suite 2900
Philadelphia, Pennsylvania 19102-2529
DISTRIBUTOR
Quasar Distributors, LLC
111 East Kilbourn Avenue, Suite 1250
Milwaukee, Wisconsin 53202
www.hennessyfunds.com | 800-966-4354
This report has been prepared for shareholders and may be distributed to
others only if preceded or accompanied by a current prospectus.
SEMI-ANNUAL REPORT
APRIL 30, 2022

HENNESSY TECHNOLOGY FUND
Investor Class HTECX
Institutional Class HTCIX
www.hennessyfunds.com | 1-800-966-4354
(This Page Intentionally Left Blank.)
Contents
|
Letter to Shareholders
|
2
|
|
Performance Overview
|
4
|
|
Financial Statements
|
|
|
Schedule of Investments
|
5
|
|
Statement of Assets and Liabilities
|
10
|
|
Statement of Operations
|
11
|
|
Statements of Changes in Net Assets
|
13
|
|
Financial Highlights
|
14
|
|
Notes to the Financial Statements
|
18
|
|
Expense Example
|
26
|
|
Proxy Voting Policy and Proxy Voting Records
|
28
|
|
Availability of Quarterly Portfolio Schedule
|
28
|
|
Federal Tax Distribution Information
|
28
|
|
Important Notice Regarding Delivery of Shareholder Documents
|
28
|
|
Electronic Delivery
|
28
|
|
Board Approval of Investment Advisory Agreement
|
29
|
|
HENNESSY FUNDS
|
1-800-966-4354
|
May 2022
Dear Hennessy Funds Shareholder:
We’d like to start our semi-annual letter with a pause. At the end of 2021, we looked forward to a new year – a potentially calmer year – having come
through almost two full years of the coronavirus pandemic. As people, we were aware our lives had changed, but we hoped for a better 2022; as investors, we were aware that the economy was strong and employment was
robust, yet challenges loomed, including inflation, supply chain disruptions, and tightening monetary policy; as employees, students, and family members, we recognized much was different, but we sought a return to
what’s familiar. What we didn’t know was that a world leader who controls one of the largest militaries on the planet was about to start one of the worst atrocities in Europe since World War II. Our thoughts are with
the Ukrainian people, and our hope is for this unjustified, senseless human tragedy to end quickly.
The equity market started 2022 on a high note, with the S&P 500® Index hitting an all-time high on the first trading day of the year. This turned out to be the last hurrah for a market that saw
a continuous march higher in 2021, having hit 70 new all-time highs, with a new all-time high being recorded on average every three and a half days. Concerns in the market then coalesced and overpowered bullish
sentiment, and the market has spiraled lower throughout 2022. Factors that drove the market lower include: tightening monetary policy as the Federal Reserve has begun raising rates and has announced plans for
shrinking its $8.5 trillion asset portfolio; inflation, higher energy costs, and their effects on the domestic and global economies; continued supply chain disruptions; investors’ indiscriminate liquidation of
broad-based ETFs and index funds and the detrimental effect on equities; and the near-term and long-term global implications of the Russian invasion of Ukraine.
While markets are adjusting, many positive conditions remain intact. Corporate balance sheets and profits remain strong, GDP
growth remains positive, the consumer continues to show resilience in the face of rising prices, cash is abundant both at the corporate and household levels, unemployment is exceptionally low, and our financial
system remains healthy. Markets are also experiencing a change in leadership, as value stocks have been outperforming growth stocks, and traditionally defensive sectors such as Utilities and Consumer Staples have
been outperforming the broader market. Finally, the Energy sector has soared in 2022, as companies reap the benefits of dramatically higher oil and natural gas prices, and shareholders are rewarded with significantly
higher dividends, aggressive buybacks, and higher stock prices after many years of underperformance for the sector.
With history as our guide, we are hopeful that eventually the market may bottom and head higher again. Since the financial crisis
of 2008, we have experienced many corrections and many recoveries to new highs. The Dow Jones Industrial Average has dropped over 10% eight times, including the current drop, for a median decline of 14.00%, and on
average, it took 45 trading days to drop from peak to trough and 127 trading days to return to the previous peak. Since the current drop has taken longer to go from peak to its recent trough, it may take some time
for a recovery in prices to truly take hold.
On a positive note, valuations have come in, and many stocks have become more attractive, especially for longer-term investors. We
note, however, that the concept of “historically cheap stocks” does not, on its own, move the market higher. Rather, it is
|
WWW.HENNESSYFUNDS.COM
|
2
|
LETTER TO SHAREHOLDERS
|
overall capitulation and improving fundamentals that could bring buyers back into the market and reverse any bearish trends. Investors need to see improving company earnings, retreating
inflationary trends, a measured pace of interest rate increases globally that does not cause significant economic contraction, hope for a more peaceful and orderly world economic system unconstrained by supply
bottlenecks and other hindrances to global trade, and, most importantly, a subsidence of the deleterious effects of the coronavirus pandemic. While that may seem like a “tall order,” we believe that patient
investing, focusing on value, quality, and downside risk mitigation, works well over the longer term.
During this tumultuous period, performance of the majority of the Hennessy Funds has been relatively strong when compared to the overall
market as well as to our benchmarks. During the six months ended April 30, 2022, the Dow Jones Industrial Average, the S&P 500®
Index, and the NASDAQ Composite Index dropped 7.05%, 9.65%, and 20.15%, respectively, on a total return basis. During this period when these three major indices saw significant declines, we were pleased that seven of
our 16 Funds posted positive total returns, 10 of our 14 domestic Funds outperformed the S&P 500® Index, and over half of our
active funds outperformed their primary benchmarks.
We thank you, our shareholders, for your continued interest in our family of Funds. We are grateful for the trust you put in us,
and we will continue to strive to manage our portfolios for long-term performance, ever mindful of downside risk. While volatility and uncertainty may impact the markets in the short-term, we encourage investors to
stay the course, maintain a diversified portfolio, and keep a long-term perspective. If you have any questions or would like to speak with us, please don’t hesitate to call us directly at (800) 966-4354. In closing,
we would also like to thank all of the healthcare and frontline workers that have worked – and still work – tirelessly throughout the coronavirus pandemic.
Best regards,
|
|
|
|
|
Ryan C. Kelley, CFA
|
|
|
Chief Investment Officer,
|
|
|
Senior Vice President, and Portfolio Manager
|
Past performance does not guarantee future results.
Mutual fund investing involves risk. Principal loss is possible.
Opinions expressed are those of Ryan C. Kelley and are subject to change, are not guaranteed, and should not be considered investment advice.
The Dow Jones Industrial Average and S&P 500® Index are commonly used to measure the performance of U.S.
stocks. The NASDAQ Composite Index comprises all common stocks listed on The NASDAQ Stock Market and is commonly used to measure the performance of technology-related stocks. The indices are used herein for
comparative purposes in accordance with SEC regulations. One cannot invest directly in an index. All returns are shown on a total return basis.
Please refer to the Performance Overview section for more detailed performance information.
|
HENNESSY FUNDS
|
1-800-966-4354
|
3
Performance Overview (Unaudited)
AVERAGE ANNUAL TOTAL RETURN FOR PERIODS ENDED APRIL 30, 2022
|
Six
|
One
|
Five
|
Ten
|
|
|
Months(1)
|
Year
|
Years
|
Years
|
|
|
Hennessy Technology Fund –
|
||||
|
Investor Class (HTECX)
|
-20.53%
|
-18.77%
|
12.86%
|
9.93%
|
|
Hennessy Technology Fund –
|
||||
|
Institutional Class (HTCIX)
|
-20.43%
|
-18.55%
|
13.14%
|
10.22%
|
|
Nasdaq Composite Index
|
-20.15%
|
-11.08%
|
16.40%
|
16.30%
|
|
S&P 500® Index
|
-9.65%
|
0.21%
|
13.66%
|
13.67%
|
|
Expense ratios:
|
Gross 2.79%, Net 1.23%(2) (Investor Class);
|
|
Gross 2.44%, Net 0.98%(2) (Institutional Class)
|
|
(1)
|
Periods of less than one year are not annualized.
|
|
(2)
|
The Fund’s investment advisor has contractually agreed to limit expenses until February 28, 2023.
|
_______________
Performance data quoted represents past performance; past performance does not guarantee future results. The investment return and principal value of an investment will
fluctuate so that an investor’s shares, when redeemed, may be worth more or less than their original cost. The performance table does not reflect the deduction of taxes that a shareholder would pay on Fund
distributions or the redemption of Fund shares. Current performance of the Fund may be lower or higher than the performance quoted. Performance data current to the most recent month end may be obtained by visiting
www.hennessyfunds.com. Performance for periods including or prior to October 26, 2012, is that of the FBR Technology Fund.
The Nasdaq Composite Index is a broad-based capitalization-weighted index of all common stocks listed on The Nasdaq Stock Market LLC. The S&P 500® Index is a capitalization-weighted index that is designed to represent the broad domestic economy through changes in the aggregate market value of 500 stocks across all
major industries. One cannot invest directly in an index. These indices are used for comparative purposes in accordance with Securities and Exchange Commission regulations.
Standard & Poor’s Financial Services is the source and owner of the S&P® and S&P 500® trademarks.
The expense ratios presented are from the most recent prospectus. The expense ratios for the current reporting period are available in the Financial Highlights section of this report.
|
WWW.HENNESSYFUNDS.COM
|
4
|
PERFORMANCE OVERVIEW/SCHEDULE OF INVESTMENTS
|
Financial Statements
|
Schedule of Investments as of April 30, 2022 (Unaudited)
|
HENNESSY TECHNOLOGY FUND
(% of Net Assets)
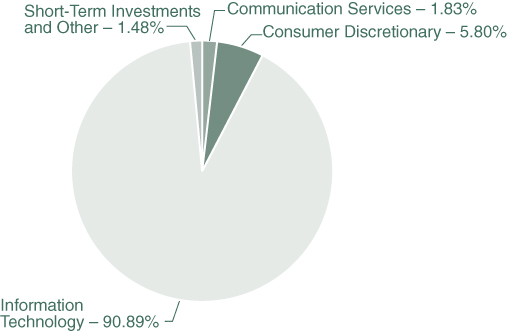
|
TOP TEN HOLDINGS (EXCLUDING MONEY MARKET FUNDS)
|
% NET ASSETS
|
|
Box, Inc.
|
1.93%
|
|
Vontier Corp.
|
1.92%
|
|
Sanmina Corp.
|
1.85%
|
|
Sciplay Corp.
|
1.83%
|
|
Arrow Electronics, Inc.
|
1.81%
|
|
Mastercard, Inc., Class A
|
1.81%
|
|
A10 Networks, Inc.
|
1.79%
|
|
Gartner, Inc.
|
1.78%
|
|
KnowBe4, Inc.
|
1.78%
|
|
Vishay Intertechnology, Inc.
|
1.78%
|
Note: For presentation purposes, the Fund has grouped some of the industry categories. For purposes of categorizing securities for compliance with Section 8(b)(1) of the Investment Company
Act of 1940, as amended, the Fund uses more specific industry classifications.
The Global Industry Classification Standard (GICS®) was developed by and is the exclusive property and a
service mark of MSCI, Inc. and Standard & Poor’s Financial Services LLC. It has been licensed for use by the Hennessy Funds.
|
HENNESSY FUNDS
|
1-800-966-4354
|
5
|
COMMON STOCKS – 98.52%
|
Number
|
% of
|
||||||||||
|
|
of Shares
|
Value
|
Net Assets
|
|||||||||
|
Communication Services – 1.83%
|
||||||||||||
|
Sciplay Corp. (a)
|
8,170
|
$
|
109,151
|
1.83
|
%
|
|||||||
|
|
||||||||||||
|
Consumer Discretionary – 5.80%
|
||||||||||||
|
1-800-Flowers.com, Inc. (a)
|
8,379
|
85,466
|
1.43
|
%
|
||||||||
|
Etsy, Inc. (a)
|
835
|
77,814
|
1.30
|
%
|
||||||||
|
Lands’ End, Inc. (a)
|
6,581
|
92,265
|
1.54
|
%
|
||||||||
|
Shutterstock, Inc.
|
1,204
|
91,167
|
1.53
|
%
|
||||||||
|
|
346,712
|
5.80
|
%
|
|||||||||
|
Information Technology – 90.89%
|
||||||||||||
|
3D Systems Corp. (a)
|
6,442
|
73,052
|
1.22
|
%
|
||||||||
|
A10 Networks, Inc.
|
7,480
|
106,814
|
1.79
|
%
|
||||||||
|
Adobe, Inc. (a)
|
234
|
92,652
|
1.55
|
%
|
||||||||
|
Advanced Micro Devices, Inc. (a)
|
1,009
|
86,290
|
1.44
|
%
|
||||||||
|
Apple, Inc.
|
618
|
97,428
|
1.63
|
%
|
||||||||
|
Applied Materials, Inc.
|
861
|
95,011
|
1.59
|
%
|
||||||||
|
Arrow Electronics, Inc. (a)
|
919
|
108,313
|
1.81
|
%
|
||||||||
|
ASE Technology Holding Co. Ltd. – ADR (b)
|
15,257
|
98,255
|
1.65
|
%
|
||||||||
|
ASML Holding NV – ADR (b)
|
162
|
91,331
|
1.53
|
%
|
||||||||
|
Atlassian Corp. PLC (a)(b)
|
347
|
78,016
|
1.31
|
%
|
||||||||
|
Automatic Data Processing, Inc.
|
467
|
101,890
|
1.71
|
%
|
||||||||
|
Box, Inc. (a)
|
3,759
|
115,101
|
1.93
|
%
|
||||||||
|
Cadence Design Systems, Inc. (a)
|
656
|
98,958
|
1.66
|
%
|
||||||||
|
CDW Corp.
|
607
|
99,050
|
1.66
|
%
|
||||||||
|
Cohu, Inc. (a)
|
3,797
|
100,848
|
1.69
|
%
|
||||||||
|
CommVault Systems, Inc. (a)
|
1,647
|
100,467
|
1.68
|
%
|
||||||||
|
Dell Technologies, Inc.
|
2,239
|
105,255
|
1.76
|
%
|
||||||||
|
DocuSign, Inc. (a)
|
978
|
79,218
|
1.33
|
%
|
||||||||
|
DXC Technology Co. (a)
|
3,467
|
99,503
|
1.67
|
%
|
||||||||
|
Extreme Networks, Inc. (a)
|
8,763
|
84,125
|
1.41
|
%
|
||||||||
|
Flex Ltd. (a)(b)
|
5,943
|
98,000
|
1.64
|
%
|
||||||||
|
Fortinet, Inc. (a)
|
319
|
92,194
|
1.54
|
%
|
||||||||
|
Gartner, Inc. (a)
|
366
|
106,341
|
1.78
|
%
|
||||||||
|
Hewlett Packard Enterprise Co.
|
6,855
|
105,636
|
1.77
|
%
|
||||||||
|
Intel Corp.
|
2,229
|
97,162
|
1.63
|
%
|
||||||||
|
Jabil, Inc.
|
1,771
|
102,240
|
1.71
|
%
|
||||||||
The accompanying notes are an integral part of these financial statements.
|
WWW.HENNESSYFUNDS.COM
|
6
|
SCHEDULE OF INVESTMENTS
|
|
COMMON STOCKS
|
Number
|
% of
|
||||||||||
|
|
of Shares
|
Value
|
Net Assets
|
|||||||||
|
Information Technology (Continued)
|
||||||||||||
|
Kimball Electronics, Inc. (a)
|
5,465
|
$
|
97,496
|
1.63
|
%
|
|||||||
|
KLA Corp.
|
301
|
96,097
|
1.61
|
%
|
||||||||
|
KnowBe4, Inc. (a)
|
4,457
|
106,077
|
1.78
|
%
|
||||||||
|
Kulicke & Soffa Industries, Inc. (b)
|
1,969
|
91,381
|
1.53
|
%
|
||||||||
|
Lam Research Corp.
|
206
|
95,947
|
1.61
|
%
|
||||||||
|
LG Display Co. Ltd. – ADR (a)(b)
|
13,412
|
86,239
|
1.44
|
%
|
||||||||
|
Mastercard, Inc., Class A
|
298
|
108,287
|
1.81
|
%
|
||||||||
|
Microsoft Corp.
|
351
|
97,410
|
1.63
|
%
|
||||||||
|
NetApp, Inc.
|
1,369
|
100,279
|
1.68
|
%
|
||||||||
|
Palo Alto Networks, Inc. (a)
|
177
|
99,347
|
1.66
|
%
|
||||||||
|
Paychex, Inc.
|
796
|
100,877
|
1.69
|
%
|
||||||||
|
Paycom Software, Inc. (a)
|
303
|
85,285
|
1.43
|
%
|
||||||||
|
QIWI PLC – ADR (b)(d)
|
15,383
|
87,222
|
1.46
|
%
|
||||||||
|
QUALCOMM, Inc.
|
724
|
101,136
|
1.69
|
%
|
||||||||
|
Sanmina Corp. (a)
|
2,701
|
110,444
|
1.85
|
%
|
||||||||
|
Seagate Technology Holdings PLC (b)
|
1,214
|
99,597
|
1.67
|
%
|
||||||||
|
ServiceNow, Inc. (a)
|
188
|
89,883
|
1.51
|
%
|
||||||||
|
SMART Global Holdings, Inc. (a)(b)
|
4,435
|
100,497
|
1.68
|
%
|
||||||||
|
Taiwan Semiconductor Manufacturing Co. Ltd. – ADR (b)
|
1,043
|
96,926
|
1.62
|
%
|
||||||||
|
Telefonaktiebolaget LM Ericsson – ADR (b)
|
11,569
|
92,089
|
1.54
|
%
|
||||||||
|
Teradata Corp. (a)
|
2,200
|
90,970
|
1.52
|
%
|
||||||||
|
Teradyne, Inc.
|
920
|
97,023
|
1.62
|
%
|
||||||||
|
Texas Instruments, Inc.
|
604
|
102,831
|
1.72
|
%
|
||||||||
|
The Western Union Co.
|
5,800
|
97,208
|
1.63
|
%
|
||||||||
|
United Microelectronics Corp. – ADR (b)
|
12,091
|
96,244
|
1.61
|
%
|
||||||||
|
UserTesting, Inc. (a)
|
9,724
|
75,945
|
1.27
|
%
|
||||||||
|
Vertex, Inc. (a)
|
6,817
|
97,006
|
1.62
|
%
|
||||||||
|
Vishay Intertechnology, Inc.
|
5,695
|
106,098
|
1.78
|
%
|
||||||||
|
Vontier Corp.
|
4,470
|
114,521
|
1.92
|
%
|
||||||||
|
Zeta Global Holdings Corp. (a)
|
8,774
|
95,022
|
1.59
|
%
|
||||||||
|
|
5,428,534
|
90.89
|
%
|
|||||||||
|
|
||||||||||||
|
Total Common Stocks
|
||||||||||||
|
(Cost $6,148,011)
|
5,884,397
|
98.52
|
%
|
|||||||||
The accompanying notes are an integral part of these financial statements.
|
HENNESSY FUNDS
|
1-800-966-4354
|
7
|
SHORT-TERM INVESTMENTS – 1.47%
|
Number
|
% of
|
||||||||||
|
|
of Shares
|
Value
|
Net Assets
|
|||||||||
|
Money Market Funds – 1.47%
|
||||||||||||
|
First American Government Obligations Fund,
|
||||||||||||
|
Institutional Class, 0.22% (c)
|
87,564
|
$
|
87,564
|
1.47
|
%
|
|||||||
|
|
||||||||||||
|
Total Short-Term Investments
|
||||||||||||
|
(Cost $87,564)
|
87,564
|
1.47
|
%
|
|||||||||
|
|
||||||||||||
|
Total Investments
|
||||||||||||
|
(Cost $6,235,575) – 99.99%
|
5,971,961
|
99.99
|
%
|
|||||||||
|
Other Assets in Excess of Liabilities – 0.01%
|
511
|
0.01
|
%
|
|||||||||
|
|
||||||||||||
|
TOTAL NET ASSETS –
100.00%
|
$
|
5,972,472
|
100.00
|
%
|
||||||||
Percentages are stated as a percent of net assets.
ADR – American Depository Receipt
NV – Naamloze Vennootschap is a Dutch term for publicly traded companies.
PLC – Public Limited Company
|
(a)
|
Non-income-producing security.
|
|
(b)
|
U.S.-traded security of a foreign corporation.
|
|
(c)
|
The rate listed is the fund’s seven-day yield as of April 30, 2022.
|
|
(d)
|
Value determined using significant unobservable inputs. As of April 30, 2022, this security amounted to $87,222 or 1.46% of net assets.
|
Summary of Fair Value Exposure as of April 30, 2022
The following is a summary of the inputs used to value the Fund’s net assets as of April 30, 2022 (see Note 3 in the accompanying Notes to the Financial Statements):
|
Common Stocks
|
Level 1
|
Level 2
|
Level 3
|
Total
|
||||||||||||
|
Communication Services
|
$
|
109,151
|
$
|
—
|
$
|
—
|
$
|
109,151
|
||||||||
|
Consumer Discretionary
|
346,712
|
—
|
—
|
346,712
|
||||||||||||
|
Information Technology
|
5,341,312
|
—
|
87,222
|
5,428,534
|
||||||||||||
|
Total Common Stocks
|
$
|
5,797,175
|
$
|
—
|
$
|
87,222
|
$
|
5,884,397
|
||||||||
|
Short-Term Investments
|
||||||||||||||||
|
Money Market Funds
|
$
|
87,564
|
$
|
—
|
$
|
—
|
$
|
87,564
|
||||||||
|
Total Short-Term Investments
|
$
|
87,564
|
$
|
—
|
$
|
—
|
$
|
87,564
|
||||||||
|
Total Investments
|
$
|
5,884,739
|
$
|
—
|
$
|
87,222
|
$
|
5,971,961
|
||||||||
The accompanying notes are an integral part of these financial statements.
|
WWW.HENNESSYFUNDS.COM
|
8
|
SCHEDULE OF INVESTMENTS
|
Level 3 Reconciliation Disclosure
The following is a reconciliation of Level 3 holdings for which significant unobservable inputs were used in determining fair value as of April 30, 2022:
|
Fair Value as of
|
Transfers into
|
Fair Value as of
|
|||||||||||
|
November 1, 2021
|
Level 3(1)
|
April 30, 2022
|
|||||||||||
|
Investments in Securities
|
|||||||||||||
|
Common Stocks
|
$
|
—
|
$
|
87,222
|
$
|
87,222
|
|||||||
|
Total
|
$
|
—
|
$
|
87,222
|
$
|
87,222
|
|||||||
|
(1)
|
Transfers into Level 3 can be attributed to changes in the availability of pricing sources or in the observability of significant inputs used to measure the fair value of those
instruments.
|
The following is a summary of quantitative information about Level 3 Fair Value Measurements:
|
Impact to
|
|||||||||||
|
Fair Value
|
Valuation
|
Unobservable
|
Unobservable
|
Valuation from an
|
|||||||
|
Type of Security
|
at 4/30/2022
|
Techniques
|
Input
|
Input Values
|
Increase in Input
|
||||||
|
Common Stocks
|
$87,222
|
Last Traded
|
Market
|
$5.67
|
Significant changes
|
||||||
|
Price
|
Assessments
|
in market conditions
|
|||||||||
|
could result in direct
|
|||||||||||
|
and proportional
|
|||||||||||
|
changes in the fair
|
|||||||||||
|
value of the security
|
The accompanying notes are an integral part of these financial statements.
|
HENNESSY FUNDS
|
1-800-966-4354
|
9
Financial Statements
|
Statement of Assets and
Liabilities as of April 30, 2022 (Unaudited)
|
|
ASSETS:
|
||||
|
Investments in securities, at value (cost $6,235,575)
|
$
|
5,971,961
|
||
|
Dividends and interest receivable
|
639
|
|||
|
Prepaid expenses and other assets
|
17,383
|
|||
|
Due from advisor
|
4,858
|
|||
|
Total assets
|
5,994,841
|
|||
|
LIABILITIES:
|
||||
|
Payable to auditor
|
11,226
|
|||
|
Accrued distribution fees
|
747
|
|||
|
Accrued service fees
|
398
|
|||
|
Accrued trustees fees
|
6,311
|
|||
|
Accrued printing & mailing fees
|
3,042
|
|||
|
Accrued expenses and other payables
|
645
|
|||
|
Total liabilities
|
22,369
|
|||
|
NET ASSETS
|
$
|
5,972,472
|
||
|
NET ASSETS CONSISTS OF:
|
||||
|
Capital stock
|
$
|
6,531,817
|
||
|
Accumulated deficit
|
(559,345
|
)
|
||
|
Total net assets
|
$
|
5,972,472
|
||
|
NET ASSETS:
|
||||
|
Investor Class
|
||||
|
Shares authorized (no par value)
|
Unlimited
|
|||
|
Net assets applicable to outstanding shares
|
$
|
4,538,709
|
||
|
Shares issued and outstanding
|
283,704
|
|||
|
Net asset value, offering price, and redemption price per share
|
$
|
16.00
|
||
|
Institutional Class
|
||||
|
Shares authorized (no par value)
|
Unlimited
|
|||
|
Net assets applicable to outstanding shares
|
$
|
1,433,763
|
||
|
Shares issued and outstanding
|
87,074
|
|||
|
Net asset value, offering price, and redemption price per share
|
$
|
16.47
|
||
The accompanying notes are an integral part of these financial statements.
|
WWW.HENNESSYFUNDS.COM
|
10
|
STATEMENT OF ASSETS AND LIABILITIES/STATEMENT OF OPERATIONS
|
Financial Statements
|
Statement of Operations for the six months ended April 30, 2022 (Unaudited)
|
|
INVESTMENT INCOME:
|
||||
|
Dividend income(1)
|
$
|
42,493
|
||
|
Interest income
|
53
|
|||
|
Total investment income
|
42,546
|
|||
|
EXPENSES:
|
||||
|
Investment advisory fees (See Note 5)
|
26,470
|
|||
|
Federal and state registration fees
|
15,385
|
|||
|
Compliance expense (See Note 5)
|
15,156
|
|||
|
Audit fees
|
11,222
|
|||
|
Administration, accounting, custody, and transfer agent fees (See Note 5)
|
10,210
|
|||
|
Trustees’ fees and expenses
|
8,394
|
|||
|
Distribution fees – Investor Class (See Note 5)
|
3,998
|
|||
|
Sub-transfer agent expenses – Investor Class (See Note 5)
|
3,162
|
|||
|
Sub-transfer agent expenses – Institutional Class (See Note 5)
|
306
|
|||
|
Reports to shareholders
|
3,258
|
|||
|
Service fees – Investor Class (See Note 5)
|
2,665
|
|||
|
Other expenses
|
2,446
|
|||
|
Total expenses before waivers and reimbursements
|
102,672
|
|||
|
Service provider expense waiver (See Note 5)
|
(10,210
|
)
|
||
|
Expense reimbursement from advisor – Investor Class
|
(38,397
|
)
|
||
|
Expense reimbursement from advisor – Institutional Class
|
(12,347
|
)
|
||
|
Net expenses
|
41,718
|
|||
|
NET INVESTMENT INCOME
|
$
|
828
|
||
|
REALIZED AND UNREALIZED GAINS (LOSSES):
|
||||
|
Net realized loss on investments
|
$
|
(264,921
|
)
|
|
|
Net change in unrealized appreciation/depreciation on investments
|
(1,314,801
|
)
|
||
|
Net loss on investments
|
(1,579,722
|
)
|
||
|
NET DECREASE IN NET ASSETS RESULTING FROM OPERATIONS
|
$
|
(1,578,894
|
)
|
|
|
(1)
|
Net of foreign taxes withheld and issuance fees of $1,716
|
The accompanying notes are an integral part of these financial statements.
|
HENNESSY FUNDS
|
1-800-966-4354
|
11
(This Page Intentionally Left Blank.)
|
WWW.HENNESSYFUNDS.COM
|
12
|
STATEMENTS OF CHANGES IN NET ASSETS
|
Financial Statements
|
Statements of Changes in Net Assets
|
|
Six Months Ended
|
||||||||
|
April 30, 2022
|
Year Ended
|
|||||||
|
(Unaudited)
|
October 31, 2021
|
|||||||
|
OPERATIONS:
|
||||||||
|
Net investment income (loss)
|
$
|
828
|
$
|
(1,224
|
)
|
|||
|
Net realized gain (loss) on investments
|
(264,921
|
)
|
2,211,486
|
|||||
|
Net change in unrealized
|
||||||||
|
appreciation/depreciation on investments
|
(1,314,801
|
)
|
358,442
|
|||||
|
Net increase (decrease) in net assets
|
||||||||
|
resulting from operations
|
(1,578,894
|
)
|
2,568,704
|
|||||
|
DISTRIBUTIONS TO SHAREHOLDERS:
|
||||||||
|
Distributable earnings – Investor Class
|
(1,498,176
|
)
|
(493,580
|
)
|
||||
|
Distributable earnings – Institutional Class
|
(513,645
|
)
|
(175,930
|
)
|
||||
|
Total distributions
|
(2,011,821
|
)
|
(669,510
|
)
|
||||
|
CAPITAL SHARE TRANSACTIONS:
|
||||||||
|
Proceeds from shares subscribed – Investor Class
|
132,457
|
917,272
|
||||||
|
Proceeds from shares subscribed – Institutional Class
|
30,683
|
57,969
|
||||||
|
Dividends reinvested – Investor Class
|
1,465,100
|
482,162
|
||||||
|
Dividends reinvested – Institutional Class
|
513,645
|
175,930
|
||||||
|
Cost of shares redeemed – Investor Class
|
(444,363
|
)
|
(1,006,346
|
)
|
||||
|
Cost of shares redeemed – Institutional Class
|
(261,393
|
)
|
(125,590
|
)
|
||||
|
Net increase in net assets derived
|
||||||||
|
from capital share transactions
|
1,436,129
|
501,397
|
||||||
|
TOTAL INCREASE (DECREASE) IN NET ASSETS
|
(2,154,586
|
)
|
2,400,591
|
|||||
|
NET ASSETS:
|
||||||||
|
Beginning of period
|
8,127,058
|
5,726,467
|
||||||
|
End of period
|
$
|
5,972,472
|
$
|
8,127,058
|
||||
|
CHANGES IN SHARES OUTSTANDING:
|
||||||||
|
Shares sold – Investor Class
|
7,308
|
35,433
|
||||||
|
Shares sold – Institutional Class
|
1,554
|
2,256
|
||||||
|
Shares issued to holders as reinvestment
|
||||||||
|
of dividends – Investor Class
|
73,365
|
21,237
|
||||||
|
Shares issued to holders as reinvestment
|
||||||||
|
of dividends – Institutional Class
|
25,019
|
7,528
|
||||||
|
Shares redeemed – Investor Class
|
(22,443
|
)
|
(38,822
|
)
|
||||
|
Shares redeemed – Institutional Class
|
(14,145
|
)
|
(4,863
|
)
|
||||
|
Net increase in shares outstanding
|
70,658
|
22,769
|
||||||
The accompanying notes are an integral part of these financial statements.
|
HENNESSY FUNDS
|
1-800-966-4354
|
13
Financial Statements
|
Financial Highlights
|
For an Investor Class share outstanding throughout each period
|
Six Months Ended
|
||||
|
April 30, 2022
|
||||
|
(Unaudited)
|
||||
|
PER SHARE DATA:
|
||||
|
Net asset value, beginning of period
|
$
|
26.89
|
||
|
Income from investment operations:
|
||||
|
Net investment income (loss)
|
0.00
|
(1)(2)
|
||
|
Net realized and unrealized gains (losses) on investments
|
(4.18
|
)
|
||
|
Total from investment operations
|
(4.18
|
)
|
||
|
Less distributions:
|
||||
|
Dividends from net investment income
|
—
|
|||
|
Dividends from net realized gains
|
(6.71
|
)
|
||
|
Total distributions
|
(6.71
|
)
|
||
|
Net asset value, end of period
|
$
|
16.00
|
||
|
TOTAL RETURN
|
-20.53
|
%(3)
|
||
|
SUPPLEMENTAL DATA AND RATIOS:
|
||||
|
Net assets, end of period (millions)
|
$
|
4.54
|
||
|
Ratio of expenses to average net assets:
|
||||
|
Before expense reimbursement
|
2.96
|
%(4)
|
||
|
After expense reimbursement
|
1.23
|
%(4)(5)
|
||
|
Ratio of net investment income (loss) to average net assets:
|
||||
|
Before expense reimbursement
|
(1.77
|
)%(4)
|
||
|
After expense reimbursement
|
(0.04
|
)%(4)
|
||
|
Portfolio turnover rate(7)
|
99
|
%(3)
|
||
|
(1)
|
Calculated using the average shares outstanding method.
|
|
(2)
|
Amount is between $(0.005) and $0.005.
|
|
(3)
|
Not annualized.
|
|
(4)
|
Annualized.
|
|
(5)
|
Certain service provider expenses were voluntarily waived during the period.
|
|
(6)
|
The Fund’s current expense limitation agreement, which became effective on February 28, 2017, was in effect for eight months of the year ended October 31, 2017.
|
|
(7)
|
Calculated on the basis of the Fund as a whole.
|
The accompanying notes are an integral part of these financial statements.
|
WWW.HENNESSYFUNDS.COM
|
14
|
FINANCIAL HIGHLIGHTS — INVESTOR CLASS
|
|
Year Ended October 31,
|
||||||||||||||||||
|
2021
|
2020
|
2019
|
2018
|
2017
|
||||||||||||||
|
$
|
20.50
|
$
|
18.90
|
$
|
18.04
|
$
|
18.46
|
$
|
15.82
|
|||||||||
|
(0.02
|
)(1)
|
0.02
|
(1)
|
(0.03
|
)(1)
|
(0.05
|
)
|
(0.23
|
)
|
|||||||||
|
8.82
|
2.10
|
3.15
|
1.26
|
2.87
|
||||||||||||||
|
8.80
|
2.12
|
3.12
|
1.21
|
2.64
|
||||||||||||||
|
(0.04
|
)
|
—
|
—
|
—
|
—
|
|||||||||||||
|
(2.37
|
)
|
(0.52
|
)
|
(2.26
|
)
|
(1.63
|
)
|
—
|
||||||||||
|
(2.41
|
)
|
(0.52
|
)
|
(2.26
|
)
|
(1.63
|
)
|
—
|
||||||||||
|
$
|
26.89
|
$
|
20.50
|
$
|
18.90
|
$
|
18.04
|
$
|
18.46
|
|||||||||
|
45.11
|
%
|
11.42
|
%
|
20.47
|
%
|
7.25
|
%
|
16.69
|
%
|
|||||||||
|
$
|
6.06
|
$
|
4.26
|
$
|
3.89
|
$
|
3.31
|
$
|
3.20
|
|||||||||
|
2.79
|
%
|
3.45
|
%
|
3.84
|
%
|
3.70
|
%
|
4.16
|
%
|
|||||||||
|
1.23
|
%(5)
|
1.23
|
%(5)
|
1.23
|
%
|
1.23
|
%
|
2.15
|
%(6)
|
|||||||||
|
(1.64
|
)%
|
(2.12
|
)%
|
(2.80
|
)%
|
(2.83
|
)%
|
(3.16
|
)%
|
|||||||||
|
(0.08
|
)%
|
0.10
|
%
|
(0.19
|
)%
|
(0.36
|
)%
|
(1.15
|
)%(6)
|
|||||||||
|
200
|
%
|
192
|
%
|
185
|
%
|
225
|
%
|
267
|
%
|
|||||||||
The accompanying notes are an integral part of these financial statements.
|
HENNESSY FUNDS
|
1-800-966-4354
|
15
Financial Statements
|
Financial Highlights
|
For an Institutional Class share outstanding throughout each period
|
Six Months Ended
|
||||
|
April 30, 2022
|
||||
|
(Unaudited)
|
||||
|
PER SHARE DATA:
|
||||
|
Net asset value, beginning of period
|
$
|
27.65
|
||
|
Income from investment operations:
|
||||
|
Net investment income (loss)
|
0.02
|
(1)
|
||
|
Net realized and unrealized gains (losses) on investments
|
(4.31
|
)
|
||
|
Total from investment operations
|
(4.29
|
)
|
||
|
Less distributions:
|
||||
|
Dividends from net investment income
|
—
|
|||
|
Dividends from net realized gains
|
(6.89
|
)
|
||
|
Total distributions
|
(6.89
|
)
|
||
|
Net asset value, end of period
|
$
|
16.47
|
||
|
TOTAL RETURN
|
-20.43
|
%(2)
|
||
|
SUPPLEMENTAL DATA AND RATIOS:
|
||||
|
Net assets, end of period (millions)
|
$
|
1.43
|
||
|
Ratio of expenses to average net assets:
|
||||
|
Before expense reimbursement
|
2.62
|
%(3)
|
||
|
After expense reimbursement
|
0.98
|
%(3)(4)
|
||
|
Ratio of net investment income (loss) to average net assets:
|
||||
|
Before expense reimbursement
|
(1.43
|
)%(3)
|
||
|
After expense reimbursement
|
0.21
|
%(3)
|
||
|
Portfolio turnover rate(6)
|
99
|
%(2)
|
||
|
(1)
|
Calculated using the average shares outstanding method.
|
|
(2)
|
Not annualized.
|
|
(3)
|
Annualized.
|
|
(4)
|
Certain service provider expenses were voluntarily waived during the period.
|
|
(5)
|
The Fund’s current expense limitation agreement, which became effective on February 28, 2017, was in effect for eight months of the year ended October 31, 2017.
|
|
(6)
|
Calculated on the basis of the Fund as a whole.
|
The accompanying notes are an integral part of these financial statements.
|
WWW.HENNESSYFUNDS.COM
|
16
|
FINANCIAL HIGHLIGHTS — INSTITUTIONAL CLASS
|
|
Year Ended October 31,
|
||||||||||||||||||
|
2021
|
2020
|
2019
|
2018
|
2017
|
||||||||||||||
|
$
|
21.08
|
$
|
19.40
|
$
|
18.47
|
$
|
18.85
|
$
|
16.11
|
|||||||||
|
0.05
|
(1)
|
0.07
|
(1)
|
0.01
|
(1)
|
0.01
|
(0.12
|
)
|
||||||||||
|
9.06
|
2.15
|
3.23
|
1.28
|
2.86
|
||||||||||||||
|
9.11
|
2.22
|
3.24
|
1.29
|
2.74
|
||||||||||||||
|
(0.11
|
)
|
(0.01
|
)
|
—
|
—
|
—
|
||||||||||||
|
(2.43
|
)
|
(0.53
|
)
|
(2.31
|
)
|
(1.67
|
)
|
—
|
||||||||||
|
(2.54
|
)
|
(0.54
|
)
|
(2.31
|
)
|
(1.67
|
)
|
—
|
||||||||||
|
$
|
27.65
|
$
|
21.08
|
$
|
19.40
|
$
|
18.47
|
$
|
18.85
|
|||||||||
|
45.49
|
%
|
11.67
|
%
|
20.77
|
%
|
7.54
|
%
|
17.01
|
%
|
|||||||||
|
$
|
2.06
|
$
|
1.47
|
$
|
1.34
|
$
|
1.09
|
$
|
1.22
|
|||||||||
|
2.44
|
%
|
3.08
|
%
|
3.47
|
%
|
3.27
|
%
|
3.74
|
%
|
|||||||||
|
0.98
|
%(4)
|
0.98
|
%(4)
|
0.98
|
%
|
0.98
|
%
|
1.77
|
%(5)
|
|||||||||
|
(1.29
|
)%
|
(1.74
|
)%
|
(2.43
|
)%
|
(2.41
|
)%
|
(2.74
|
)%
|
|||||||||
|
0.17
|
%
|
0.36
|
%
|
0.06
|
%
|
(0.12
|
)%
|
(0.77
|
)%(5)
|
|||||||||
|
200
|
%
|
192
|
%
|
185
|
%
|
225
|
%
|
267
|
%
|
|||||||||
The accompanying notes are an integral part of these financial statements.
|
HENNESSY FUNDS
|
1-800-966-4354
|
17
Financial Statements
|
Notes to the Financial Statements April 30, 2022 (Unaudited)
|
1). ORGANIZATION
The Hennessy Technology Fund (the “Fund”) is a series of Hennessy Funds Trust (the “Trust”), which was organized as a Delaware statutory trust on September 17, 1992. The Fund is an open-end
management investment company registered under the Investment Company Act of 1940, as amended. The investment objective of the Fund is long-term capital appreciation. The Fund is a diversified fund.
The Fund offers Investor Class and Institutional Class shares. Each class of shares differs principally in its respective 12b-1 distribution and service, shareholder
servicing, and sub-transfer agent expenses. There are no sales charges. Each class has identical rights to earnings, assets, and voting privileges, except for class-specific expenses and exclusive rights to vote on
matters affecting only one class.
As an investment company, the Fund follows the investment company accounting and reporting guidance of the Financial Accounting Standards Board (“FASB”) Accounting
Standard Codification Topic 946 “Financial Services—Investment Companies.”
2). SIGNIFICANT ACCOUNTING POLICIES
The following is a summary of significant accounting policies consistently followed by the Fund in the preparation of the financial statements. These policies conform to U.S. generally
accepted accounting principles (“GAAP”).
|
a).
|
Securities Valuation – All investments in securities are valued in accordance with the Fund’s valuation policies and procedures, as described in Note 3.
|
|
b).
|
Federal Income Taxes – The Fund has elected to be taxed as a regulated investment company and intends to distribute substantially all of its taxable income to its shareholders and
otherwise comply with the provisions of the Internal Revenue Code of 1986, as amended, applicable to regulated investment companies. As a result, the Fund has made no provision for federal income taxes or
excise taxes. Net investment income/loss and realized gains/losses for federal income tax purposes may differ from those reported in the financial statements because of temporary book-basis and tax-basis
differences. Temporary differences are primarily the result of the treatment of wash sales for tax reporting purposes. The Fund recognizes interest and penalties related to income tax benefits, if any, in the
Statement of Operations as an income tax expense. Distributions from net realized gains for book purposes may include short-term capital gains, which are included as ordinary income to shareholders for tax
purposes. The Fund may utilize equalization accounting for tax purposes and designate earnings and profits, including net realized gains distributed to shareholders on redemption of shares, as part of the
dividends paid deduction for income tax purposes.
|
|
c).
|
Accounting for Uncertainty in Income Taxes – The Fund has accounting policies regarding recognition and measurement of tax positions taken or expected to be taken on a tax return.
The tax returns of the Fund for the prior three fiscal years are open for examination. The Fund has reviewed all open tax years in major tax jurisdictions and concluded that there is no impact on the Fund’s
net assets and no tax liability resulting from unrecognized tax benefits relating to uncertain income tax positions taken or expected to be taken on a tax return. The Fund’s major tax jurisdictions are U.S.
federal and Delaware.
|
|
WWW.HENNESSYFUNDS.COM
|
18
|
NOTES TO THE FINANCIAL STATEMENTS
|
|
d).
|
Income and Expenses – Dividend income is recognized on the ex-dividend date or as soon as information is available to the Fund. Interest income, which includes the amortization of
premium and accretion of discount, is recognized on an accrual basis. Market discounts, original issue discounts, and market premiums on debt securities are accreted or amortized to interest income over the
life of a security with a corresponding increase or decrease, as applicable, in the cost basis of such security using the yield-to-maturity method or, where applicable, the first call date of the security.
Other non-cash dividends are recognized as investment income at the fair value of the property received. The Fund is charged for those expenses that are directly attributable to its portfolio, such as
advisory, administration, and certain shareholder service fees. Income, expenses (other than expenses attributable to a specific class), and realized and unrealized gains/losses on investments are allocated
to each class of shares based on such class’s net assets.
|
|
e).
|
Distributions to Shareholders – Dividends from net investment income for the Fund, if any, are declared and paid annually, usually in December. Distributions of net realized capital
gains, if any, are declared and paid annually, usually in December.
|
|
f).
|
Security Transactions – Investment and shareholder transactions are recorded on the trade date. The Fund determines the realized gain/loss from an investment transaction by
comparing the original cost of the security lot sold with the net sale proceeds. Discounts and premiums on securities purchased are accreted or amortized, respectively, over the life of each such security.
|
|
g).
|
Use of Estimates – Preparing financial statements in accordance with GAAP requires management to make estimates and assumptions that affect the reported amounts of assets and
liabilities and disclosure of contingent assets and liabilities at the date of the financial statements, as well as the reported change in net assets during the reporting period. Actual results could differ
from those estimates.
|
|
h).
|
Share Valuation – The net asset value (“NAV”) per share of the Fund is calculated by dividing (i) the total value of the securities held by the Fund, plus cash and other assets,
minus all liabilities (including estimated accrued expenses) by (ii) the total number of Fund shares outstanding, rounded to the nearest $0.01. Fund shares are not priced on days the New York Stock Exchange
is closed for trading. The offering and redemption price per share for the Fund is equal to the Fund’s NAV per share.
|
|
i).
|
Recent Accounting Pronouncements and Regulatory Updates – In October 2020, the Securities and Exchange Commission (“SEC”) adopted new regulations governing the use of derivatives by
registered investment companies (“Rule 18f-4”). Rule 18f-4 imposes limits on the amount of derivatives a fund can enter into, eliminates the asset segregation framework currently used by funds to comply with
Section 18 of the 1940 Act, and requires funds whose use of derivatives is greater than a limited specified amount to establish and maintain a comprehensive derivatives risk management program and appoint a
derivatives risk manager. Funds are required to comply with Rule 18f-4 by August 19, 2022. The impact, if any, that Rule 18f-4 will have on the availability, liquidity, and performance of derivatives is
unclear. Management is currently evaluating the potential impact of Rule 18f-4 on the Fund. When fully implemented, Rule 18f-4 may require changes in how the Fund uses derivatives, adversely affect the Fund’s
performance, and increase costs related to the Fund’s use of derivatives.
|
|
In December 2020, the SEC adopted a new rule providing a framework for fund valuation practices (“Rule 2a-5”).
Rule 2a-5 establishes requirements for determining fair value in good faith for purposes of the 1940 Act. Rule 2a-5 permits fund boards
|
|
HENNESSY FUNDS
|
1-800-966-4354
|
19
|
to designate certain parties to perform fair value determinations, subject to board oversight and certain other conditions. Rule 2a-5 also defines when market quotations are
“readily available” for purposes of the 1940 Act and the threshold for determining whether a fund must fair value a security. In connection with Rule 2a-5, the SEC also adopted related recordkeeping
requirements and is rescinding previously issued guidance, including with respect to the role of a board in determining fair value and the accounting and auditing of fund investments. Funds must comply with
the rules by September 8, 2022. Management is currently assessing the potential impact of the new rules on the Fund’s financial statements.
|
3). SECURITIES VALUATION
The Fund follows its valuation policies and procedures in determining its net asset value and, in preparing these financial statements, the fair value accounting standards that establish an
authoritative definition of fair value and set out a hierarchy for measuring fair value. These standards require additional disclosures about the various inputs and valuation techniques used to develop the
measurements of fair value and a discussion of changes in valuation techniques and related inputs during the period. These inputs are summarized in the three broad levels listed below:
|
Level 1 –
|
Unadjusted, quoted prices in active markets for identical instruments that the Fund has the ability to access at the date of measurement.
|
|
|
Level 2 –
|
Other significant observable inputs (including, but not limited to, quoted prices in active markets for similar instruments, quoted prices in markets that are not active for
identical or similar instruments, and model-derived valuations in which all significant inputs and significant value drivers are observable in active markets, such as interest rates, prepayment speeds, credit
risk curves, default rates, and similar data).
|
|
|
Level 3 –
|
Significant unobservable inputs (including the Fund’s own assumptions about what market participants would use to price the asset or liability based on the best available
information) when observable inputs are unavailable.
|
The following is a description of the valuation techniques applied to the Fund’s major categories of assets and liabilities on a recurring basis:
|
Equity Securities – Equity securities, including common stocks, preferred stocks, foreign-issued common stocks, exchange-traded funds,
closed-end mutual funds, partnerships, rights, and real estate investment trusts, that are traded on a securities exchange for which a last-quoted sales price is readily available generally are valued at the
last sales price as reported by the primary exchange on which the securities are listed. Securities listed on The Nasdaq Stock Market (“Nasdaq”) generally are valued at the Nasdaq Official Closing Price,
which may differ from the last sales price reported. Securities traded on a securities exchange for which a last-quoted sales price is not readily available generally are valued at the mean between the bid
and ask prices. To the extent these securities are actively traded and valuation adjustments are not applied, they are classified in Level 1 of the fair value hierarchy. Securities traded on foreign exchanges
generally are not valued at the same time the Fund calculates its NAV because most foreign markets close well before such time. The earlier close of most foreign markets gives rise to the possibility that
significant events, including broad market moves, may have occurred in the interim. In certain circumstances, it may be determined that a foreign security needs to be fair valued because it appears that the
value of the security might have been materially affected by events occurring after the close of the market in which the security is principally
|
|
WWW.HENNESSYFUNDS.COM
|
20
|
NOTES TO THE FINANCIAL STATEMENTS
|
|
traded, but before the time the Fund calculates its NAV, such as by a development that affects an entire market or region (e.g., a weather-related event) or a potentially global
development (e.g., a terrorist attack that may be expected to have an effect on investor expectations worldwide).
|
|
|
Registered Investment Companies – Investments in open-end registered investment companies, commonly referred to as mutual funds, generally
are priced at the ending NAV provided by the applicable mutual fund’s service agent and are classified in Level 1 of the fair value hierarchy.
|
|
|
Debt Securities – Debt securities, including corporate bonds, asset-backed securities, mortgage-backed securities, municipal bonds, U.S.
Treasuries, and U.S. government agency issues, are generally valued at market on the basis of valuations furnished by an independent pricing service that utilizes both dealer-supplied valuations and
formula-based techniques. The pricing service may consider recently executed transactions in securities of the issuer or comparable issuers, market price quotations (where observable), bond spreads, and
fundamental data relating to the issuer. In addition, the model may incorporate observable market data, such as reported sales of similar securities, broker quotes, yields, bids, offers, and reference data.
Certain securities are valued primarily using dealer quotations. These securities are generally classified in Level 2 of the fair value hierarchy.
|
|
|
Short-Term Securities – Short-term equity investments, including money market funds, are valued in the manner specified above for equity
securities. Short-term debt investments with an original term to maturity of 60 days or less are valued at amortized cost, which approximates fair market value. If the original term to maturity of a
short-term debt investment exceeds 60 days, then the values as of the 61st day prior to maturity are amortized. Amortized cost is not used if its use would be inappropriate due to credit or other impairments
of the issuer, in which case the security’s fair value would be determined as described below. Short-term securities are generally classified in Level 1 or Level 2 of the fair value hierarchy depending on the
inputs used and market activity levels for specific securities.
|
The Board of Trustees of the Fund (the “Board”) has adopted fair value pricing procedures that are followed when a price for a security is not readily available or if a
significant event has occurred that indicates the closing price of a security no longer represents the true value of that security. Fair value pricing determinations are made in good faith in accordance with these
procedures. There are numerous criteria considered in determining a fair value of a security, such as the trading volume of a security and markets, the values of other similar securities, and news events with direct
bearing on a security or markets. Fair value pricing results in an estimated price for a security that reflects the amount the Fund might reasonably expect to receive in a current sale. Depending on the relative
significance of the valuation inputs, these securities may be classified in either Level 2 or Level 3 of the fair value hierarchy.
The fair value of foreign securities may be determined with the assistance of a pricing service using correlations between the movement of prices of such securities and
indices of domestic securities and other appropriate indicators, such as closing market prices of relevant American Depositary Receipts or futures contracts. Using fair value pricing means that the Fund’s NAV
reflects the affected portfolio securities’ values as determined by the Board or its designee, pursuant to the fair value pricing procedures adopted by the Board, instead of being determined by the market. Using a
fair value pricing methodology to price a foreign security may result in a value that is different from such foreign security’s most recent closing price and from the value used by other investment
|
HENNESSY FUNDS
|
1-800-966-4354
|
21
companies to calculate their NAVs. Such securities are generally classified in Level 2 of the fair value hierarchy. Because the Fund may invest in foreign securities, the value of the
Fund’s portfolio securities may change on days when a shareholder is unable to purchase or redeem Fund shares.
The Board has delegated day-to-day valuation matters to the Valuation and Liquidity Committee comprising representatives from Hennessy Advisors, Inc., the Fund’s
investment advisor (the “Advisor”). The function of the Valuation and Liquidity Committee, among other things, is to value securities where current and reliable market quotations are not readily available. All
actions taken by the Valuation and Liquidity Committee are reviewed by the Board.
The Fund has performed an analysis of all existing investments to determine the significance and character of all inputs to their fair value determinations. Various
inputs are used to determine the value of the Fund’s investments. The inputs or methodology used for valuing securities are not necessarily an indication of the risk associated with investing in those securities.
Details related to the fair value hierarchy of the Fund’s securities as of April 30, 2022, are included in the Schedule of Investments.
4). INVESTMENT TRANSACTIONS
Purchases and sales of investment securities (excluding government and short-term investments) for the Fund during the six months ended April 30, 2022, were $6,986,597 and $7,395,271,
respectively.
There were no purchases or sales/maturities of long-term U.S. government securities for the Fund during the six months ended April 30, 2022.
5). INVESTMENT ADVISORY FEE AND OTHER TRANSACTIONS WITH AFFILIATES
The Advisor provides the Fund with investment advisory services under an Investment Advisory Agreement. The Advisor furnishes all investment advice, office space, and facilities and most of
the personnel needed by the Fund. As compensation for its services, the Advisor is entitled to a monthly fee from the Fund. The fee is based on the average daily net assets of the Fund at an annual rate of 0.74%. The
net investment advisory fees expensed by the Fund during the six months ended April 30, 2022, are included in the Statement of Operations.
The Advisor has contractually agreed to limit total annual operating expenses to 0.98% of the Fund’s net assets for both Investor Class shares and Institutional Class
shares (excluding all federal, state and local taxes, interest, brokerage commissions, 12b-1 fees, shareholder servicing fees payable to the Advisor, extraordinary items, and acquired fund fees and expenses and other
costs incurred in connection with the purchase and sale of securities) through February 28, 2023.
For three years following the date on which expenses were waived or incurred, the Advisor may recoup waived or reimbursed expenses from the Fund if total operating
expenses, including such recoupment, does not exceed the expense limitation in effect (i) at the time the Advisor waived or reimbursed such expenses and (ii) at the time the Advisor recoups such expenses. As of April
30, 2022, expenses subject to potential recovery for Investor Class and Institutional Class shares and the fiscal years in which they expire were as follows:
|
Fiscal Year
|
Fiscal Year
|
Fiscal Year
|
Fiscal Year
|
|||
|
2022
|
2023
|
2024
|
2025
|
Total
|
||
|
Investor Class
|
$51,219
|
$86,892
|
$75,956
|
$38,397
|
$252,464
|
|
|
Institutional Class
|
$16,327
|
$27,643
|
$23,799
|
$12,347
|
$ 80,116
|
|
WWW.HENNESSYFUNDS.COM
|
22
|
NOTES TO THE FINANCIAL STATEMENTS
|
The Advisor did not recoup expenses from the Fund during the six months ended April 30, 2022.
The Board has approved a Shareholder Servicing Agreement for Investor Class shares of the Fund, which compensates the Advisor for the non-investment advisory services it
provides to the Fund. The Shareholder Servicing Agreement provides for a monthly fee paid to the Advisor at an annual rate of 0.10% of the average daily net assets of the Fund attributable to Investor Class shares.
The shareholder service fees expensed by the Fund during the six months ended April 30, 2022, are included in the Statement of Operations.
The Fund has adopted a plan pursuant to Rule 12b-1 under the Investment Company Act of 1940, as amended, that authorizes payments in connection with the distribution of
Fund shares at an annual rate of up to 0.25% of the Fund’s average daily net assets attributable to Investor Class shares. Even though the authorized rate is up to 0.25%, the Fund is currently only using up to 0.15%
of its average daily net assets attributable to Investor Class shares for such purpose. Amounts paid under the plan may be spent on any activities or expenses primarily intended to result in the sale of shares,
including, but not limited to, advertising, shareholder account servicing, printing and mailing of prospectuses to other than current shareholders, printing and mailing of sales literature, and compensation for sales
and marketing activities or to financial institutions and others, such as dealers and distributors. The distribution fees expensed by the Fund during the six months ended April 30, 2022, are included in the Statement
of Operations.
The Fund has entered into agreements with various brokers, dealers, and financial intermediaries in connection with the sale of Fund shares. The agreements provide for
periodic payments of sub-transfer agent expenses by the Fund to the brokers, dealers, and financial intermediaries for providing certain shareholder maintenance services. These shareholder services include the
pre-processing and quality control of new accounts, shareholder correspondence, answering customer inquiries regarding account status, and facilitating shareholder telephone transactions. The sub-transfer agent fees
expensed by the Fund during the six months ended April 30, 2022, are included in the Statement of Operations.
U.S. Bancorp Fund Services, LLC, d/b/a U.S. Bank Global Fund Services (“Fund Services”) provides the Fund with administrative, accounting, and transfer agent services. As
administrator, Fund Services is responsible for activities such as (i) preparing various federal and state regulatory filings, reports, and returns for the Fund, (ii) preparing reports and materials to be supplied to
the Board, (iii) monitoring the activities of the Fund’s custodian, transfer agent, and accountants, and (iv) coordinating the preparation and payment of the Fund’s expenses and reviewing the Fund’s expense accruals.
U.S. Bank N.A., an affiliate of Fund Services, serves as the Fund’s custodian. The servicing agreements between the Trust, Fund Services, and U.S. Bank N.A. contain a fee schedule that is inclusive of administrative,
accounting, custody, and transfer agent fees. The administrative, accounting, custody, and transfer agent fees expensed by the Fund during the six months ended April 30, 2022, are included in the Statement of
Operations. Fund Services has voluntarily waived all or a portion of its fees for the Fund. The fees voluntarily waived by Fund Services during the six months ended April 30, 2022, are included in the Statement of
Operations.
Quasar Distributors, LLC (“Quasar”), a wholly owned broker-dealer subsidiary of Foreside Financial Group, LLC, acts as the Fund’s principal underwriter in a continuous
public offering of Fund shares.
The officers of the Fund are affiliated with the Advisor. With the exception of the Chief Compliance Officer and the Senior Compliance Officer, such officers receive no
|
HENNESSY FUNDS
|
1-800-966-4354
|
23
compensation from the Fund for serving in their respective roles. The Fund, along with the other funds in the Hennessy Funds family (collectively, the “Hennessy Funds”), makes reimbursement
payments on an equal basis to the Advisor for a portion of the salary and benefits associated with the office of the Chief Compliance Officer and for all of the salary and benefits associated with the office of the
Senior Compliance Officer. The compliance fees expensed by the Fund during the six months ended April 30, 2022, are included in the Statement of Operations.
6). GUARANTEES AND INDEMNIFICATIONS
Under the Hennessy Funds’ organizational documents, their officers and trustees are indemnified by the Hennessy Funds against certain liabilities arising out of the performance of their
duties to the Hennessy Funds. Additionally, in the normal course of business, the Hennessy Funds enter into contracts with service providers that contain general indemnification clauses. The Fund’s maximum exposure
under these arrangements is unknown as this would involve future claims that may be made against the Fund that have not yet occurred. Currently, the Fund expects the risk of loss to be remote.
7). LINE OF CREDIT
The Fund has an uncommitted line of credit with the other Hennessy Funds in the amount of the lesser of (i) $100,000,000 or (ii) 33.33% of each Hennessy Fund’s net assets, or 30% for the
Hennessy Gas Utility Fund and 10% for the Hennessy Balanced Fund. The line of credit is intended to provide any necessary short-term financing in connection with shareholder redemptions, subject to certain
restrictions. The credit facility is with the Hennessy Funds’ custodian bank, U.S. Bank N.A. Borrowings under this arrangement bear interest at the bank’s prime rate and are secured by all of the Fund’s assets (as to
its own borrowings only). During the six months ended April 30, 2022, the Fund did not have any borrowings outstanding under the line of credit.
8). FEDERAL TAX INFORMATION
As of October 31, 2021, the Fund’s most recent fiscal year end, the components of accumulated earnings (losses) for income tax purposes were as follows:
|
Investments
|
|||||
|
Cost of investments for tax purposes
|
$
|
7,125,370
|
|||
|
Gross tax unrealized appreciation
|
$
|
1,538,881
|
|||
|
Gross tax unrealized depreciation
|
(514,095
|
)
|
|||
|
Net tax unrealized appreciation/(depreciation)
|
$
|
1,024,786
|
|||
|
Undistributed ordinary income
|
$
|
1,178,003
|
|||
|
Undistributed long-term capital gains
|
828,581
|
||||
|
Total distributable earnings
|
$
|
2,006,584
|
|||
|
Other accumulated gain/(loss)
|
$
|
—
|
|||
|
Total accumulated gain/(loss)
|
$
|
3,031,370
|
|||
The difference between book-basis unrealized appreciation/depreciation and tax-basis unrealized appreciation/depreciation (as shown above) is attributable primarily to
wash sales.
As of October 31, 2021, the Fund had no tax-basis capital losses to offset future capital gains.
As of October 31, 2021, the Fund did not defer, on a tax basis, any late-year ordinary losses. Late-year ordinary losses are net ordinary losses incurred after December
31, 2020, but within the taxable year, that are deemed to arise on the first day of the Fund’s next taxable year.
|
WWW.HENNESSYFUNDS.COM
|
24
|
NOTES TO THE FINANCIAL STATEMENTS
|
During fiscal year 2022 (year to date) and fiscal year 2021, the tax character of distributions paid by the Fund was as follows:
|
Six Months Ended
|
Year Ended
|
||||||||
|
April 30, 2022
|
October 31, 2021
|
||||||||
|
Ordinary income(1)
|
$
|
1,183,100
|
$
|
239,745
|
|||||
|
Long-term capital gains
|
828,721
|
429,765
|
|||||||
|
Total distributions
|
$
|
2,011,821
|
$
|
669,510
|
|||||
|
(1) Ordinary income includes short-term capital gains.
|
9). EVENTS SUBSEQUENT TO PERIOD END
Management has evaluated the Fund’s related events and transactions that occurred subsequent to April 30, 2022, through the date of issuance of the Fund’s financial statements. Management
has determined that there were no subsequent events requiring recognition or disclosure in the financial statements.
|
HENNESSY FUNDS
|
1-800-966-4354
|
25
Expense Example (Unaudited)
April 30, 2022
As a shareholder of the Fund, you incur ongoing costs, including management fees, service fees, and other Fund expenses. This Example is intended to help you understand your ongoing costs
(in dollars) of investing in the Fund and to compare these costs with the ongoing costs of investing in other mutual funds. The Example is based on an investment of $1,000 invested at the beginning of the period and
held for the entire period from November 1, 2021, through April 30, 2022.
Actual Expenses
In the table below, the first line under each of the “Investor Class” and “Institutional Class” headings provides information about actual account values and actual expenses for each share
class. You may use this information, together with the amount you invested, to estimate the expenses that you paid over the period. Simply divide your account value by $1,000 (for example, an $8,600 account value
divided by $1,000 = 8.6), then multiply the result by the number in the first line under the heading “Expenses Paid During Period” to estimate the expenses you paid on your account during this period. Although the
Fund charges no sales loads or transaction fees, you will be assessed fees for outgoing wire transfers, returned checks, and stop payment orders at prevailing rates charged by U.S. Bank Global Fund Services, the
Fund’s transfer agent. If you request that a redemption be made by wire transfer, the Fund’s transfer agent charges a $15 fee. IRAs are charged a $15 annual maintenance fee (up to $30 maximum per shareholder for
shareholders with multiple IRAs). The examples below include, but are not limited to, management, shareholder servicing, accounting, custody, and transfer agent fees. However, the examples below do not include
portfolio trading commissions and related expenses.
Hypothetical Example for Comparison Purposes
In the table below, the second line under each of the “Investor Class” and “Institutional Class” headings provides information about hypothetical account values and hypothetical expenses
based on the Fund’s actual expense ratio for each share class and an assumed rate of return of 5% per year before expenses, which is not the Fund’s actual return for such share class. The hypothetical account values
and expenses may not be used to estimate the actual ending account balance or expenses you paid for the period. You may use this information to compare the ongoing costs of investing in the Fund and other funds. To
do so, compare these 5% hypothetical examples with the 5% hypothetical examples that appear in the shareholder reports of the other funds. Please note that the expenses shown in the table are meant to highlight your
ongoing costs only. Therefore, the second lines under “Investor Class” and “Institutional Class” are useful in comparing ongoing costs only and will not help you determine the relative total costs of owning different
funds.
|
WWW.HENNESSYFUNDS.COM
|
26
|
EXPENSE EXAMPLE
|
|
Beginning
|
Ending
|
||
|
Account Value
|
Account Value
|
Expenses Paid
|
|
|
November 1, 2021
|
April 30, 2022
|
During Period(1)
|
|
|
Investor Class
|
|||
|
Actual
|
$1,000.00
|
$ 794.70
|
$5.47
|
|
Hypothetical (5% return before expenses)
|
$1,000.00
|
$1,018.70
|
$6.16
|
|
Institutional Class
|
|||
|
Actual
|
$1,000.00
|
$ 795.70
|
$4.36
|
|
Hypothetical (5% return before expenses)
|
$1,000.00
|
$1,019.93
|
$4.91
|
|
(1)
|
Expenses are equal to the Fund’s annualized expense ratio of 1.23% for Investor Class shares or 0.98% for Institutional Class shares, as applicable, multiplied by the average
account value over the period, multiplied by 181/365 days (to reflect the half-year period).
|
|
HENNESSY FUNDS
|
1-800-966-4354
|
27
How to Obtain a Copy of the Fund’s Proxy
Voting Policy and Proxy Voting Records
A description of the policies and procedures the Fund uses to determine how to vote proxies relating to portfolio securities is available without charge (1) by calling 800-966-4354, (2) on
the Hennessy Funds’ website at www.hennessyfunds.com/proxy-voting/voting-policy, or (3) on the U.S. Securities and Exchange Commission’s (the “SEC”) website at www.sec.gov. The Fund’s proxy voting record is available
without charge on both the Hennessy Funds’ website at www.hennessyfunds.com/proxy-voting/voting-record and the SEC’s website at www.sec.gov no later than August 31 for the prior 12 months ending June 30.
Availability of Quarterly Portfolio Schedule
The Fund files its complete schedule of portfolio holdings with the SEC for the first and third quarters of each fiscal year as an exhibit to its reports on Form N-PORT. The Fund’s Form
N-PORT reports are available on the SEC’s website at www.sec.gov or on request by calling 800-966-4354.
Federal Tax Distribution Information (Unaudited)
For fiscal year 2021, certain dividends paid by the Fund may be subject to a maximum tax rate of 23.8%, as provided for by the Jobs and Growth Tax Relief Reconciliation Act of 2003. The
percentage of dividends declared from ordinary income designated as qualified dividend income was 28.32%.
For corporate shareholders, the percent of ordinary income distributions that qualified for the corporate dividends received deduction for fiscal year 2021 was 25.39%.
The percentage of taxable ordinary income distributions that were designated as short-term capital gain distributions under Section 871(k)(2)(C) of the Internal Revenue
Code of 1986, as amended, for the Fund was 92.49%.
Important Notice Regarding Delivery
of Shareholder Documents
To help keep the Fund’s costs as low as possible, we generally deliver a single copy of shareholder reports, proxy statements, and prospectuses to shareholders who share an address and have
the same last name. This process does not apply to account statements. You may request an individual copy of a shareholder document at any time. If you would like to receive separate mailings of shareholder
documents, please call U.S. Bank Global Fund Services at 800-261-6950 or 414-765-4124, and individual delivery will begin within 30 days of your request. If your account is held through a financial institution or
other intermediary, please contact such intermediary directly to request individual delivery.
Electronic Delivery
As permitted by SEC regulations, the Fund’s shareholder reports are made available on a website, and unless you sign up for eDelivery or elect to receive paper copies as detailed below, you
will be notified each time a report is posted and provided with a website link to access the report.
The Fund also offers shareholders the option to receive all notices, account statements, prospectuses, tax forms, and shareholder reports electronically. To sign up for
eDelivery or change your delivery preference, please visit www.hennessyfunds.com/account.
To elect to receive paper copies of all future reports free of charge, please call U.S. Bank Global Fund Services at 800-261-6950 or 414-765-4124.
Subscribe to receive our team’s unique market and sector insights delivered to your inbox
www.hennessyfunds.com/subscribe
Follow us on social media
| |
|
|
WWW.HENNESSYFUNDS.COM
|
28
|
PROXY VOTING — BOARD APPROVAL OF INVESTMENT ADVISORY AGREEMENT
|
Board Approval of Investment Advisory
Agreement
At its meeting on March 11, 2022, the Board of Trustees of the Fund (the “Board,” and the members thereof, the “Trustees”) unanimously approved the continuation of the investment advisory
agreement of the Fund with Hennessy Advisors, Inc. (the “Advisor”). As part of the process, the Trustees reviewed their fiduciary duties and the relevant factors for them to consider with respect to approving the
advisory agreement. In addition, the Trustees who are not deemed “interested persons” (as defined by the Investment Company Act of 1940, as amended) of the Fund (the “Independent Trustees”) met in executive session
to discuss the approval of the advisory agreement. As part of their discussion, the Independent Trustees confirmed their understanding of the need to have asked about, and received answers to, any matters that they
believed are relevant to determining whether to approve the continuation of the advisory agreement.
In advance of the meeting, the Advisor sent detailed information to the Trustees to assist them in their evaluation of the advisory agreement. This information included,
but was not limited to, the following:
|
(1)
|
A memorandum from outside legal counsel that described the fiduciary duties of the Board with respect to approving the continuation of the advisory agreement and the relevant
factors for consideration;
|
|
|
(2)
|
A memorandum from the Advisor that listed the factors relevant to the Board’s approval of the continuation of the advisory agreement and also referenced the documents that had been
provided to help the Board assess each such factor;
|
|
|
(3)
|
The Advisor’s financial statements from its most recent Form 10-K and Form 10-Q;
|
|
|
(4)
|
A summary of the advisory agreement;
|
|
|
(5)
|
A recent Fund fact sheet, which included, among other things, Fund performance over various periods;
|
|
|
(6)
|
A description of the range of services provided by the Advisor;
|
|
|
(7)
|
A peer expense comparison of the net expense ratio and investment advisory fee of the Fund; and
|
|
|
(8)
|
A memorandum from the Advisor regarding economies of scale.
|
The Trustees reviewed and discussed all of the information provided by the Advisor. Following this review, and further discussion with the Advisor, the Trustees concluded
that the information provided before and at the meeting addressed all of the relevant matters that they wanted to consider in assessing the performance of the Funds and the performance of the Advisor under the
advisory agreement, and that said information provided them with a fulsome understanding of the advisory agreement and the services provided by the Advisor.
All of the factors discussed were considered as a whole by the Trustees, as well as by the Independent Trustees meeting in executive session. The Trustees viewed the
relevant factors in their totality, with no single factor being the principal or determinative factor in the Trustees’ determination of whether to approve the continuation of the advisory agreement. The Trustees
recognized that the management and fee arrangements for the Fund are the result of years of review and discussion between the Independent Trustees and the Advisor, that certain aspects of such arrangements may
receive greater scrutiny in
|
HENNESSY FUNDS
|
1-800-966-4354
|
29
some years than in others, and that the Trustees’ conclusions may be based, in part, on their consideration of these same arrangements and information received during the course of the year
and in prior years.
Prior to approving the continuation of the advisory agreement, the Trustees, including the Independent Trustees in executive session, considered, among other items:
|
(1)
|
The nature and quality of the advisory services provided by the Advisor;
|
|
|
(2)
|
A comparison of the fees and expenses of the Fund to other similar funds;
|
|
|
(3)
|
Whether economies of scale are recognized by the Fund;
|
|
|
(4)
|
The costs and profitability of the Fund to the Advisor;
|
|
|
(5)
|
The performance of the Fund; and
|
|
|
(6)
|
Any benefits to the Advisor from serving as an investment advisor to the Fund (other than the advisory fee).
|
The material considerations and determinations of the Trustees, including the Independent Trustees, were as follows:
|
(1)
|
The Trustees considered the services identified below that are provided by the Advisor. Based on this review and an assessment of the Advisor’s performance, the Trustees concluded
that the Advisor provides high-quality services to the Fund, and they noted that their overall confidence in the Advisor was high. The Trustees also concluded that they were satisfied with the nature, extent,
and quality of the advisory services provided to the Fund by the Advisor and that the nature and extent of the services provided by the Advisor were appropriate to assure that the Fund’s operations are
conducted in compliance with applicable laws, rules, and regulations.
|
|
(a)
|
The Advisor acts as the portfolio manager for the Fund. In this capacity, the Advisor does the following:
|
|
(i)
|
manages the composition of the Fund’s portfolio, including the purchase, retention, and disposition of portfolio securities in accordance with the Fund’s investment objectives,
policies, and restrictions;
|
|||
|
(ii)
|
seeks best execution for the Fund’s portfolio;
|
|||
|
(iii)
|
manages the use of soft dollars for the Fund; and
|
|||
|
(iv)
|
manages proxy voting for the Fund.
|
|
(b)
|
The Advisor performs a daily reconciliation of portfolio positions and cash for the Fund.
|
||
|
(c)
|
The Advisor monitors the liquidity of each Fund.
|
||
|
(d)
|
The Advisor monitors the Fund’s compliance with its investment objectives and restrictions and federal securities laws.
|
||
|
(e)
|
The Advisor maintains a compliance program (including a code of ethics), conducts ongoing reviews of the compliance programs of the Fund’s service providers (including their codes
of ethics, as appropriate), conducts on-site visits to the Fund’s service providers, as feasible, monitors incidents of abusive trading practices, reviews Fund expense accruals, payments, and fixed expense
ratios, evaluates insurance providers for fidelity bond, D&O/E&O insurance, and cybersecurity insurance coverage, manages regulatory examination compliance and responses, conducts employee compliance
training, reviews reports provided by service providers, and maintains books and records.
|
|
WWW.HENNESSYFUNDS.COM
|
30
|
BOARD APPROVAL OF INVESTMENT ADVISORY AGREEMENT
|
|
(f)
|
The Advisor oversees service providers that provide accounting, administration, distribution, transfer agency, custodial, sales, marketing, public relations, audit, information
technology, and legal services to the Fund.
|
||
|
(g)
|
The Advisor maintains in-house marketing and distribution departments on behalf of the Fund.
|
||
|
(h)
|
The Advisor prepares or directs the preparation of all regulatory filings for the Fund, including writing and annually updating the Fund’s prospectus and related documents.
|
||
|
(i)
|
For each annual report of the Fund, the Advisor prepares a written summary of the Fund’s performance during the most recent 12-month period.
|
||
|
(j)
|
The Advisor oversees distribution of the Fund through third-party broker/dealers and independent financial institutions such as Charles Schwab, Inc., Fidelity, TD Ameritrade, and
Pershing. The Advisor participates in “no transaction fee” (“NTF”) programs with these companies on behalf of the Fund, which allow customers to purchase the Fund through third-party distribution channels
without paying a transaction fee. The Advisor compensates, in part, a number of these third-party providers of NTF programs out of its own revenues.
|
||
|
(k)
|
The Advisor pays the incentive compensation of the Fund’s compliance officers and employs other staff, such as legal, marketing, national accounts, distribution, sales,
administrative, and trading oversight personnel, as well as management executives.
|
||
|
(l)
|
The Advisor provides a quarterly compliance certification to the Board.
|
||
|
(m)
|
The Advisor prepares or reviews all Board materials, presents to and leads discussions with the Board, prepares or reviews all meeting minutes, and arranges for Board training and
education.
|
|
(2)
|
The Trustees compared the performance of the Fund to benchmark indices over various periods and noted that the Trustees review and discuss reports comparing the investment
performance of the Fund to various indices at each quarterly Board meeting. Based on such information, the Trustees determined that the Advisor manages the Fund in a manner materially consistent with its
stated investment objective and style. The Trustees concluded that the performance of the Fund over various periods warranted the continuation of the advisory agreement.
|
|
|
(3)
|
The Trustees reviewed the advisory fees and overall expense ratios of the Fund compared to other funds similar in asset size and investment objective to the Fund using data from
Morningstar. As part of the discussion with management, the Trustees ensured that they understood and were comfortable with the criteria used to determine the mutual funds included in the Morningstar
categories for purposes of the materials considered at the meeting. The Trustees determined that the advisory fee and overall expense ratio of the Fund falls within a reasonable range of the advisory fees and
overall expense ratios of other comparable funds and concluded that they are reasonable and warranted continuation of the advisory agreement.
|
|
|
(4)
|
The Trustees also considered whether the Advisor was realizing economies of scale that should be shared with the Fund’s shareholders. The Trustees noted that the majority of
expenses incurred to manage the Fund are variable
|
|
HENNESSY FUNDS
|
1-800-966-4354
|
31
|
asset-based fees, so the Advisor does not realize material economies of scale relating to these expenses as the assets of the Fund increase. For example, third-party platform fees
increase as the Fund’s assets grow.
|
||
|
(5)
|
The Trustees considered the profitability of the Advisor, including the impact of mutual fund platform fees on the Advisor’s profitability, and also considered the resources and
revenues that the Advisor has put into managing and distributing the Fund. The Trustees then concluded that the profits of the Advisor are reasonable and not excessive when compared to profitability
guidelines set forth in relevant court cases.
|
|
|
(6)
|
The Trustees considered the high level of professionalism and knowledge of the Advisor’s employees and concluded that this was beneficial to the Fund and its shareholders.
|
|
|
(7)
|
The Trustees considered any benefits to the Advisor from serving as an advisor to the Fund (other than the advisory fee). The Trustees noted that the Advisor may derive ancillary
benefits from, by way of example, its association with the Fund in the form of proprietary and third-party research products and services received from broker-dealers that execute portfolio trades for the
Fund. The Trustees determined that any such products and services have been used for legitimate purposes relating to the Fund by providing assistance in the investment decision-making process. The Trustees
concluded that any additional benefits realized by the Advisor from its relationship with the Fund were reasonable, which was based on, among other things, the Trustees’ finding that the research, analytical,
statistical, and other information and services provided by brokers are merely supplemental to the Advisor’s own efforts in the performance of its duties under the advisory agreement.
|
After reviewing the materials and information provided at the meeting, as well as other information regularly provided at the Board’s quarterly meetings throughout the
year regarding the quality of services provided by the Advisor, the performance of the Fund, expense information, brokerage commissions information, the adequacy and efficacy of the Advisor’s written policies and
procedures, other regulatory compliance issues, trading information and related matters, and other factors that the Trustees deemed relevant, the Trustees, including the Independent Trustees, approved the
continuation of the advisory agreement.
|
WWW.HENNESSYFUNDS.COM
|
32
|
BOARD APPROVAL OF INVESTMENT ADVISORY AGREEMENT
|
(This Page Intentionally Left Blank.)
For information, questions, or assistance, please call
The Hennessy Funds
800-966-4354 or 415-899-1555
INVESTMENT ADVISOR
Hennessy Advisors, Inc.
7250 Redwood Boulevard, Suite 200
Novato, California 94945
ADMINISTRATOR,
TRANSFER AGENT,
DIVIDEND PAYING AGENT, &
SHAREHOLDER SERVICING AGENT
U.S. Bancorp Fund Services, LLC
d/b/a U.S. Bank Global Fund Services
P.O. Box 701
Milwaukee, Wisconsin 53201-0701
CUSTODIAN
U.S. Bank N.A.
Custody Operations
1555 North River Center Drive, Suite 302
Milwaukee, Wisconsin 53212
TRUSTEES
Neil J. Hennessy
J. Dennis DeSousa
Robert T. Doyle
Claire Garvie
Gerald P. Richardson
COUNSEL
Foley & Lardner LLP
777 East Wisconsin Avenue
Milwaukee, Wisconsin 53202-5306
INDEPENDENT REGISTERED
PUBLIC ACCOUNTING FIRM
Tait, Weller & Baker LLP
Two Liberty Place
50 South 16th Street, Suite 2900
Philadelphia, Pennsylvania 19102-2529
DISTRIBUTOR
Quasar Distributors, LLC
111 East Kilbourn Avenue, Suite 1250
Milwaukee, Wisconsin 53202
www.hennessyfunds.com | 800-966-4354
This report has been prepared for shareholders and may be distributed to
others only if preceded or accompanied by a current prospectus.
|
(b)
|
|
NOTICE:
Important Shareholder Report(s) Available Online and in Print by Request
Shareholder reports contain important information about your investments, including portfolio holdings and financial statements. We encourage you to review the shareholder report(s) and other information by
visiting: www.hennessyfunds.com/funds/fund-documents
You may request printed copies or change your delivery preferences at any time by calling:
U.S. Bank Global Fund Services
1-800-261-6950 or 1-414-765-4124
Please contact U.S. Bank Global Fund Services if you would like to:
|
✔
|
Request a paper copy of a specific shareholder report, free of charge. Unless you contact U.S. Bank Global Fund Services, you will NOT receive a paper copy.
|
|
✔
|
Elect to receive paper copies of ALL future shareholder reports, free of charge.
|
|
✔
|
Elect to receive shareholder reports and other communications (including quarterly statements, annual tax statements, and prospectuses) electronically delivered to your email.
|
Note: You may also elect eDelivery by accessing your account online at www.hennessyfunds.com/account
Subscribe to receive our team’s unique market and sector insights delivered to your inbox
www.hennessyfunds.com/subscribe
Follow us on social media
|
|
|
|
|
Item 2. Code of Ethics.
Not applicable for semi-annual reports.
Item 3. Audit Committee Financial Expert.
Not applicable for semi-annual reports.
Item 4. Principal Accountant Fees and Services.
Not applicable for semi-annual reports.
Item 5. Audit Committee of Listed Registrants.
Not applicable to registrants who are not listed issuers (as defined in Rule 10A-3 under the Securities Exchange Act of 1934 (the “Exchange Act”)).
Item 6. Investments.
|
(a)
|
The Schedules of Investments are included as part of the reports to shareholders filed under Item 1 of this Form.
|
|
(b)
|
Not applicable.
|
Item 7. Disclosure of Proxy Voting Policies and Procedures for Closed-End Management Investment Companies.
Not applicable to open-end investment companies.
Item 8. Portfolio Managers of Closed-End Management Investment Companies.
Not applicable to open-end investment companies.
Item 9. Purchases of Equity Securities by Closed‑End Management Investment Company and Affiliated Purchasers.
Not applicable to open-end investment companies.
Item 10. Submission of Matters to a Vote of Security Holders.
Not applicable.
Item 11. Controls and Procedures.
|
(a)
|
The registrant’s principal executive officer and principal financial officer have reviewed the registrant's disclosure controls and procedures (as defined in Rule 30a-3(c) under the Investment Company
Act of 1940 (the “Act”)) as of a date within 90 days of the filing date of this report, as required by Rule 30a‑3(b) under the Act and Rules 13a-15(b) or 15d‑15(b) under the Exchange Act. Based on their
review, such officers have concluded that the disclosure controls and procedures are effective in ensuring that information required to be disclosed in this report is appropriately recorded, processed,
summarized, and reported and made known to them by others within the registrant and by the registrant’s service providers.
|
|
(b)
|
There were no changes in the registrant's internal control over financial reporting (as defined in Rule 30a-3(d) under the Act) that occurred during the period covered by this report that has
materially affected, or is reasonably likely to materially affect, the registrant's internal control over financial reporting.
|
Item 12. Disclosure of Securities Lending Activities for Closed-End Management Investment Companies.
Not applicable to open-end investment companies.
Item 13. Exhibits.
|
(a)
|
(1) Code of ethics, or amendments thereto, that is the subject of the disclosure required by Item 2, to the extent that the registrant intends to satisfy Item 2
requirements through filing of an exhibit. Not applicable.
|
(3) Any written solicitation to purchase securities under Rule 23c‑1 under the Act sent or given during the period covered by the report by or on
behalf of the registrant to 10 or more persons. Not applicable to open-end investment companies.
(4) Change in the registrant’s independent public accountant. Provide the information called for by Item 4 of Form 8-K under the Exchange Act. Unless
otherwise specified by Item 4, or related to and necessary for a complete understanding of information not previously disclosed, the information should relate to events occurring during the reporting period.
There was no change in the registrant’s independent public accountant for the period covered by this report.
SIGNATURES
Pursuant to the requirements of the Securities Exchange Act of 1934 and the Investment Company Act of 1940, the registrant has duly caused this report to be signed on its behalf by the
undersigned, thereunto duly authorized.
HENNESSY FUNDS TRUST
(Registrant)
By: /s/Neil J. Hennessy
Neil J. Hennessy
President
Date: July 8, 2022
Pursuant to the requirements of the Securities Exchange Act of 1934 and the Investment Company Act of 1940, this report has been signed below by the following persons on behalf of the
registrant and in the capacities and on the dates indicated.
|
By: /s/Neil J. Hennessy
Neil J. Hennessy, President and Principal Executive Officer |
|
Date: July 8, 2022
|
|
By: /s/Teresa M. Nilsen
Teresa M. Nilsen, Treasurer and Principal Financial Officer
|
|
Date: July 8, 2022
|