As filed with the Securities and Exchange Commission on July 9, 2020
UNITED STATES
SECURITIES AND EXCHANGE COMMISSION
Washington, D.C. 20549
SECURITIES AND EXCHANGE COMMISSION
Washington, D.C. 20549
FORM N-CSR
CERTIFIED SHAREHOLDER REPORT OF REGISTERED
MANAGEMENT INVESTMENT COMPANIES
Investment Company Act file number (811-07168)
Hennessy Funds Trust
(Exact name of registrant as specified in charter)
(Exact name of registrant as specified in charter)
7250 Redwood Blvd., Suite 200
Novato, CA 94945
(Address of principal executive offices) (Zip code)
(Address of principal executive offices) (Zip code)
Teresa M. Nilsen
7250 Redwood Blvd., Suite 200
Novato, CA 94945
(Name and address of agent for service)
(Name and address of agent for service)
800-966-4354
Registrant’s telephone number, including area code
Date of fiscal year end: October 31, 2020
Date of reporting period: April 30, 2020
Item 1. Reports to Stockholders.
SEMI-ANNUAL REPORT
APRIL 30, 2020

HENNESSY CORNERSTONE GROWTH FUND
Investor Class HFCGX
Institutional Class HICGX
IMPORTANT NOTICE REGARDING ELECTRONIC DELIVERY OF SHAREHOLDER REPORTS
Beginning on January 1, 2021, as permitted by regulations adopted by the Securities and Exchange Commission, paper copies of the annual and semi-annual reports will no
longer be sent by mail unless you specifically request paper copies from the Hennessy Funds or from your financial intermediary. Instead, the reports will be made available on a website, and you will be notified by mail each time a report is
posted and provided with a website link to access the report.
If you have already elected to receive shareholder reports electronically, you will not be affected by this change and you need not take any action. You may elect to
receive shareholder reports and other communications from the Hennessy Funds electronically by visiting www.hennessyfunds.com/account or by calling U.S. Bank Global Fund Services at 1-800-261-6950. If you own shares in a Fund through a
financial intermediary, please contact your financial intermediary to make this election.
You may elect to receive paper copies of all future reports free of charge by calling U.S. Bank Global Fund Services at 1-800-261-6950 or, if you own your shares through
a financial intermediary, by contacting your financial intermediary. Your election to receive paper copies of reports will apply to all Funds in the Hennessy Funds family.

hennessyfunds.com | 1-800-966-4354
(This Page Intentionally Left Blank.)
Contents
|
Letter to Shareholders
|
2
|
|
Performance Overview
|
4
|
|
Financial Statements
|
|
|
Schedule of Investments
|
5
|
|
Statement of Assets and Liabilities
|
9
|
|
Statement of Operations
|
10
|
|
Statements of Changes in Net Assets
|
11
|
|
Financial Highlights
|
12
|
|
Notes to the Financial Statements
|
16
|
|
Expense Example
|
23
|
|
Proxy Voting Policy and Proxy Voting Records
|
25
|
|
Availability of Quarterly Portfolio Schedule
|
25
|
|
Federal Tax Distribution Information
|
25
|
|
Important Notice Regarding Delivery of Shareholder Documents
|
25
|
|
Electronic Delivery
|
25
|
|
Board Approval of Investment Advisory Agreement
|
26
|
|
HENNESSY FUNDS
|
1-800-966-4354
|
June 2020
Dear Hennessy Funds Shareholder:
First and foremost, I hope this communication finds you and your loved ones safe and healthy. In many ways, the COVID-19 pandemic has turned the world upside down in recent months, and we at Hennessy have joined the rest of
the world in witnessing and experiencing its profound effect on public health, the global economy, and the everyday lives of people around the world. In response to the crisis, we invoked our business continuity plan in mid-March to ensure a smooth
transition to remote work for all of our employees, who have been working safely and productively from home. We want to assure our Hennessy Funds shareholders that our operations are uninterrupted and functioning normally.
The past six months have been marked by extremes. During the first half of the period from November 2019 through January 2020, the bull market, supported by strong corporate fundamentals, continued to
move higher, and investors appeared focused on record-low unemployment and strong economic growth. In mid-February, the major U.S. market indices hit all-time highs, but then, within just a matter of weeks, lost over one-third of their values as the
COVID-19 pandemic unfolded. Shelter-in-place and business closure orders rippled through the nation, causing initial unemployment claims to skyrocket to their highest number in history. The market then rallied back and posted double-digit positive
returns in April.
For the six months ended April 30, 2020, on a total return basis, the Dow Jones Industrial Average was down 8.9% and the S&P 500® Index was down 3.2%. Small-cap and mid-cap stocks generally fared worse than large-cap stocks during the period, and the Financial sector was particularly hard hit as the Federal Reserve aggressively cut the federal funds rate in
an effort to stabilize the economy. The Energy sector was crushed by both the sudden loss of demand due to COVID-19 and the oversupply caused by the surprise market-share battle between Russia and Saudi Arabia, and the S&P 500® Energy Sector Index ended the six-month period down over 30%.
The COVID-19 pandemic is an unprecedented event, and the duration and full extent of the economic impact is unknown. In the moment, there is always the concern that ‘this time is different.’ But, when you
are able to look at past financial, political, and health crises with the benefit of 20/20 hindsight, history has demonstrated that our economy and financial markets have always rebounded and recovered eventually. If you look back to the last market
downturn in 2008, economic fundamentals were weak compared to the market in 2020, where the overall underpinnings were – and are still – quite strong. Publicly listed companies today have plenty of cash, with over $5 trillion on balance sheets of
the S&P 500® companies alone, and I believe that most will survive and that many may emerge from the current crisis even stronger.
|
HENNESSYFUNDS.COM
|
2
|
LETTER TO SHAREHOLDERS
|
We understand that this market volatility and economic uncertainty is jarring to many investors, and we continue to monitor events and the markets. We remain focused on managing our high-conviction
portfolios for the long-term benefit of our shareholders, and we are confident in the time-tested strategies and rigorous research that led to their formation. We encourage shareholders to maintain a long-term investment horizon and to remain focused
on long-term goals. As always, but especially in these trying times, we are here to support our shareholders, and we thank you for your continued investment and trust. Should you have any questions or would like to speak with us directly, please
don’t hesitate to call (800) 966-4354 or email us at fundsinfo@hennessyfunds.com.
Best regards,

Neil J. Hennessy
President and Chief Investment Officer
Past performance does not guarantee future results.
Mutual fund investing involves risk. Principal loss is possible.
The Dow Jones Industrial Average and S&P 500® Index are commonly used to measure the performance of U.S. stocks. The S&P 500® Energy Sector Index is an index that comprises those companies included in the S&P 500 that are classified as members of the GICS energy sector. One cannot invest
directly in an index.
|
HENNESSY FUNDS
|
1-800-966-4354
|
3
Performance Overview (Unaudited)
AVERAGE ANNUAL TOTAL RETURN FOR PERIODS ENDED APRIL 30, 2020
|
Six
|
One
|
Five
|
Ten
|
|
|
Months(1)
|
Year
|
Years
|
Years
|
|
|
Hennessy Cornerstone Growth Fund –
|
||||
|
Investor Class (HFCGX)
|
-22.30%
|
-22.05%
|
-3.32%
|
4.43%
|
|
Hennessy Cornerstone Growth Fund –
|
||||
|
Institutional Class (HICGX)
|
-22.19%
|
-21.79%
|
-3.02%
|
4.76%
|
|
Russell 2000® Index
|
-15.47%
|
-16.39%
|
2.88%
|
7.69%
|
|
S&P 500® Index
|
-3.16%
|
0.86%
|
9.12%
|
11.69%
|
Expense ratios: 1.34% (Investor Class); 1.01% (Institutional Class)
|
(1)
|
Periods of less than one year are not annualized.
|
_______________
Performance data quoted represents past performance; past performance does not guarantee future results. The investment return and principal value of an investment will fluctuate so that an investor’s
shares, when redeemed, may be worth more or less than their original cost. The performance table does not reflect the deduction of taxes that a shareholder would pay on Fund distributions or the redemption of Fund shares. Current performance of the
Fund may be lower or higher than the performance quoted. Performance data current to the most recent month end may be obtained by visiting www.hennessyfunds.com.
The Russell 2000® Index comprises the smallest 2,000 companies in the Russell 3000® Index based on market capitalization, representing approximately 8% of the Russell 3000® total market capitalization. The S&P 500® Index is a capitalization-weighted index that is designed to represent the broad domestic economy through changes in the aggregate market value of 500 stocks across all
major industries. One cannot invest directly in an index. These indices are used herein for comparative purposes in accordance with SEC regulations.
Frank Russell Company (“Russell”) is the source and owner of the trademarks, service marks, and copyrights related to the Russell Indexes. Russell®
is a trademark of Russell. Neither Russell nor its licensors accept any liability for any errors or omissions in the Russell Indexes or Russell ratings or underlying data and no party may rely on any Russell Indexes or Russell ratings or underlying
data contained in this communication. No further distribution of Russell data is permitted without Russell’s express written consent. Russell does not promote, sponsor, or endorse the content of this communication.
Standard & Poor’s Financial Services LLC is the source and owner of the S&P® and S&P 500® trademarks.
The expense ratios presented are from the most recent prospectus. The expense ratios for the current reporting period are available in the Financial Highlights section of this report.
|
HENNESSYFUNDS.COM
|
4
|
PERFORMANCE OVERVIEW/SCHEDULE OF INVESTMENTS
|
Financial Statements
|
Schedule of Investments as of April 30, 2020 (Unaudited)
|
HENNESSY CORNERSTONE GROWTH FUND
(% of Net Assets)

|
TOP TEN HOLDINGS (EXCLUDING MONEY MARKET FUNDS)
|
% NET ASSETS
|
|
Sportsman’s Warehouse Holdings, Inc.
|
3.16%
|
|
Leidos Holdings, Inc.
|
2.74%
|
|
Sony Corp. – ADR
|
2.51%
|
|
Crown Holdings, Inc.
|
2.49%
|
|
Target Corp.
|
2.48%
|
|
Carvana Co.
|
2.42%
|
|
Teekay Tankers Ltd.
|
2.41%
|
|
Brookfield Asset Management, Inc., Class A
|
2.38%
|
|
Best Buy Co., Inc.
|
2.36%
|
|
Universal Forest Products, Inc.
|
2.34%
|
Note: For presentation purposes, the Fund has grouped some of the industry categories. For purposes of categorizing securities for compliance with Section 8(b)(1) of the Investment Company Act of 1940, as amended, the Fund
uses more specific industry classifications.
The Global Industry Classification Standard (GICS®) was developed by and is the exclusive property and a service mark of MSCI, Inc. and
Standard & Poor’s Financial Services LLC. It has been licensed for use by the Hennessy Funds.
|
HENNESSY FUNDS
|
1-800-966-4354
|
5
|
COMMON STOCKS – 97.88%
|
Number
|
% of
|
||||||||||
|
|
of Shares
|
Value
|
Net Assets
|
|||||||||
|
Consumer Discretionary – 33.02%
|
||||||||||||
|
America’s Car-Mart, Inc. (a)
|
25,196
|
$
|
1,661,676
|
1.69
|
%
|
|||||||
|
Best Buy Co., Inc.
|
30,300
|
2,324,919
|
2.36
|
%
|
||||||||
|
Carvana Co. (a)
|
29,800
|
2,387,278
|
2.42
|
%
|
||||||||
|
Dick’s Sporting Goods, Inc.
|
56,100
|
1,648,779
|
1.67
|
%
|
||||||||
|
Installed Building Products, Inc. (a)
|
38,700
|
1,908,297
|
1.94
|
%
|
||||||||
|
KB Home
|
78,300
|
2,054,592
|
2.08
|
%
|
||||||||
|
M/I Homes, Inc. (a)
|
63,400
|
1,614,164
|
1.64
|
%
|
||||||||
|
Rent-A-Center, Inc.
|
92,800
|
1,847,184
|
1.87
|
%
|
||||||||
|
Skechers U.S.A., Inc. (a)
|
65,300
|
1,840,154
|
1.87
|
%
|
||||||||
|
Skyline Champion Corp. (a)
|
79,400
|
1,564,974
|
1.59
|
%
|
||||||||
|
Sony Corp. – ADR (a)(b)
|
38,500
|
2,473,625
|
2.51
|
%
|
||||||||
|
Sportsman’s Warehouse Holdings, Inc. (a)
|
434,800
|
3,113,168
|
3.16
|
%
|
||||||||
|
Target Corp.
|
22,300
|
2,447,202
|
2.48
|
%
|
||||||||
|
The Buckle, Inc.
|
106,300
|
1,627,453
|
1.65
|
%
|
||||||||
|
Williams-Sonoma, Inc.
|
36,600
|
2,263,344
|
2.30
|
%
|
||||||||
|
Zumiez, Inc. (a)
|
83,600
|
1,767,304
|
1.79
|
%
|
||||||||
|
|
32,544,113
|
33.02
|
%
|
|||||||||
|
Energy – 5.69%
|
||||||||||||
|
Cosan Ltd. – Class A (a)(b)
|
120,600
|
1,608,804
|
1.63
|
%
|
||||||||
|
Teekay Tankers Ltd. (a)(b)
|
117,100
|
2,378,301
|
2.41
|
%
|
||||||||
|
World Fuel Services Corp.
|
64,800
|
1,620,000
|
1.65
|
%
|
||||||||
|
|
5,607,105
|
5.69
|
%
|
|||||||||
|
Financials – 10.16%
|
||||||||||||
|
Brookfield Asset Management, Inc., Class A (b)
|
69,400
|
2,347,108
|
2.38
|
%
|
||||||||
|
Equitable Holdings, Inc.
|
105,700
|
1,936,424
|
1.96
|
%
|
||||||||
|
LPL Financial Holdings, Inc.
|
28,000
|
1,686,160
|
1.71
|
%
|
||||||||
|
The Carlyle Group, Inc.
|
87,300
|
2,046,312
|
2.08
|
%
|
||||||||
|
Voya Financial, Inc.
|
44,300
|
2,001,031
|
2.03
|
%
|
||||||||
|
|
10,017,035
|
10.16
|
%
|
|||||||||
|
Health Care – 4.03%
|
||||||||||||
|
R1 RCM, Inc. (a)
|
199,500
|
2,058,840
|
2.09
|
%
|
||||||||
|
RadNet, Inc. (a)
|
135,400
|
1,911,848
|
1.94
|
%
|
||||||||
|
|
3,970,688
|
4.03
|
%
|
|||||||||
The accompanying notes are an integral part of these financial statements.
|
HENNESSYFUNDS.COM
|
6
|
SCHEDULE OF INVESTMENTS
|
|
COMMON STOCKS
|
Number
|
% of
|
||||||||||
|
|
of Shares
|
Value
|
Net Assets
|
|||||||||
|
Industrials – 19.12%
|
||||||||||||
|
Alamo Group, Inc.
|
22,100
|
$
|
2,175,524
|
2.21
|
%
|
|||||||
|
American Woodmark Corp. (a)
|
25,400
|
1,305,814
|
1.32
|
%
|
||||||||
|
Arcosa, Inc.
|
60,200
|
2,243,654
|
2.28
|
%
|
||||||||
|
Atkore International Group, Inc. (a)
|
66,100
|
1,608,874
|
1.63
|
%
|
||||||||
|
BMC Stock Holdings, Inc. (a)
|
91,700
|
1,948,625
|
1.98
|
%
|
||||||||
|
Builders FirstSource, Inc. (a)
|
103,100
|
1,891,885
|
1.92
|
%
|
||||||||
|
Colfax Corp. (a)
|
73,200
|
1,887,828
|
1.91
|
%
|
||||||||
|
Howmet Aerospace, Inc.
|
94,100
|
1,229,887
|
1.25
|
%
|
||||||||
|
JELD-WEN Holding, Inc. (a)
|
111,000
|
1,409,700
|
1.43
|
%
|
||||||||
|
Triumph Group, Inc.
|
119,400
|
840,576
|
0.85
|
%
|
||||||||
|
Universal Forest Products, Inc.
|
56,000
|
2,302,720
|
2.34
|
%
|
||||||||
|
|
18,845,087
|
19.12
|
%
|
|||||||||
|
Information Technology – 19.89%
|
||||||||||||
|
Benchmark Electronics, Inc.
|
77,400
|
1,599,084
|
1.62
|
%
|
||||||||
|
CDW Corp.
|
19,300
|
2,138,440
|
2.17
|
%
|
||||||||
|
Insight Enterprises, Inc. (a)
|
38,500
|
2,090,165
|
2.12
|
%
|
||||||||
|
Itron, Inc. (a)
|
32,400
|
2,262,168
|
2.30
|
%
|
||||||||
|
Jabil, Inc.
|
64,400
|
1,831,536
|
1.86
|
%
|
||||||||
|
JinkoSolar Holding Company Ltd. – ADR (a)(b)
|
119,600
|
1,892,072
|
1.92
|
%
|
||||||||
|
Leidos Holdings, Inc.
|
27,300
|
2,697,513
|
2.74
|
%
|
||||||||
|
Methode Electronics, Inc.
|
70,600
|
2,119,412
|
2.15
|
%
|
||||||||
|
Synnex Corp.
|
18,400
|
1,611,104
|
1.63
|
%
|
||||||||
|
Xerox Holdings Corp.
|
74,500
|
1,362,605
|
1.38
|
%
|
||||||||
|
|
19,604,099
|
19.89
|
%
|
|||||||||
|
Materials – 3.99%
|
||||||||||||
|
Arconic Corp. (a)
|
22,800
|
198,816
|
0.20
|
%
|
||||||||
|
Crown Holdings, Inc. (a)
|
38,100
|
2,454,021
|
2.49
|
%
|
||||||||
|
Koppers Holdings, Inc. (a)
|
81,400
|
1,282,864
|
1.30
|
%
|
||||||||
|
|
3,935,701
|
3.99
|
%
|
|||||||||
|
Real Estate – 1.98%
|
||||||||||||
|
CBRE Group, Inc. (a)
|
45,500
|
1,953,315
|
1.98
|
%
|
||||||||
|
|
||||||||||||
|
Total Common Stocks
|
||||||||||||
|
(Cost $131,272,201)
|
96,477,143
|
97.88
|
%
|
|||||||||
The accompanying notes are an integral part of these financial statements.
|
HENNESSY FUNDS
|
1-800-966-4354
|
7
|
SHORT-TERM INVESTMENTS – 2.31%
|
Number
|
% of
|
||||||||||
|
|
of Shares
|
Value
|
Net Assets
|
|||||||||
|
Money Market Funds – 2.31%
|
||||||||||||
|
First American Government Obligations Fund,
|
||||||||||||
|
Institutional Class, 0.25% (c)
|
2,274,895
|
$
|
2,274,895
|
2.31
|
%
|
|||||||
|
|
||||||||||||
|
Total Short-Term Investments
|
||||||||||||
|
(Cost $2,274,895)
|
2,274,895
|
2.31
|
%
|
|||||||||
|
|
||||||||||||
|
Total Investments
|
||||||||||||
|
(Cost $133,547,096) – 100.19%
|
98,752,038
|
100.19
|
%
|
|||||||||
|
Liabilities in Excess of Other Assets – (0.19)%
|
(185,257
|
)
|
(0.19
|
)%
|
||||||||
|
|
||||||||||||
|
TOTAL NET ASSETS – 100.00%
|
$
|
98,566,781
|
100.00
|
%
|
||||||||
Percentages are stated as a percent of net assets.
ADR – American Depositary Receipt
|
(a)
|
Non-income-producing security.
|
|
(b)
|
U.S.-traded security of a foreign corporation.
|
|
(c)
|
The rate listed is the fund’s seven-day yield as of April 30, 2020.
|
Summary of Fair Value Exposure as of April 30, 2020
The following is a summary of the inputs used to value the Fund’s net assets as of April 30, 2020 (see Note 3 in the accompanying Notes to the Financial Statements):
|
Common Stocks
|
Level 1
|
Level 2
|
Level 3
|
Total
|
||||||||||||
|
Consumer Discretionary
|
$
|
32,544,113
|
$
|
—
|
$
|
—
|
$
|
32,544,113
|
||||||||
|
Energy
|
5,607,105
|
—
|
—
|
5,607,105
|
||||||||||||
|
Financials
|
10,017,035
|
—
|
—
|
10,017,035
|
||||||||||||
|
Health Care
|
3,970,688
|
—
|
—
|
3,970,688
|
||||||||||||
|
Industrials
|
18,845,087
|
—
|
—
|
18,845,087
|
||||||||||||
|
Information Technology
|
19,604,099
|
—
|
—
|
19,604,099
|
||||||||||||
|
Materials
|
3,935,701
|
—
|
—
|
3,935,701
|
||||||||||||
|
Real Estate
|
1,953,315
|
—
|
—
|
1,953,315
|
||||||||||||
|
Total Common Stocks
|
$
|
96,477,143
|
$
|
—
|
$
|
—
|
$
|
96,477,143
|
||||||||
|
Short-Term Investments
|
||||||||||||||||
|
Money Market Funds
|
$
|
2,274,895
|
$
|
—
|
$
|
—
|
$
|
2,274,895
|
||||||||
|
Total Short-Term Investments
|
$
|
2,274,895
|
$
|
—
|
$
|
—
|
$
|
2,274,895
|
||||||||
|
Total Investments
|
$
|
98,752,038
|
$
|
—
|
$
|
—
|
$
|
98,752,038
|
||||||||
The accompanying notes are an integral part of these financial statements.
|
HENNESSYFUNDS.COM
|
8
|
SCHEDULE OF INVESTMENTS/STATEMENT OF ASSETS AND LIABILITIES
|
Financial Statements
|
Statement of Assets and Liabilities as of April 30, 2020 (Unaudited)
|
|
ASSETS:
|
||||
|
Investments in securities, at value (cost $133,547,096)
|
$
|
98,752,038
|
||
|
Dividends and interest receivable
|
26,083
|
|||
|
Receivable for fund shares sold
|
4,440
|
|||
|
Prepaid expenses and other assets
|
18,823
|
|||
|
Total assets
|
98,801,384
|
|||
|
LIABILITIES:
|
||||
|
Payable for fund shares redeemed
|
27,722
|
|||
|
Payable to advisor
|
54,047
|
|||
|
Payable to administrator
|
16,944
|
|||
|
Payable to auditor
|
11,372
|
|||
|
Accrued distribution fees
|
84,893
|
|||
|
Accrued service fees
|
6,584
|
|||
|
Accrued trustees fees
|
5,581
|
|||
|
Accrued expenses and other payables
|
27,460
|
|||
|
Total liabilities
|
234,603
|
|||
|
NET ASSETS
|
$
|
98,566,781
|
||
|
NET ASSETS CONSISTS OF:
|
||||
|
Capital stock
|
$
|
134,817,851
|
||
|
Accumulated deficit
|
(36,251,070
|
)
|
||
|
Total net assets
|
$
|
98,566,781
|
||
|
NET ASSETS:
|
||||
|
Investor Class
|
||||
|
Shares authorized (no par value)
|
Unlimited
|
|||
|
Net assets applicable to outstanding shares
|
$
|
88,878,741
|
||
|
Shares issued and outstanding
|
5,972,420
|
|||
|
Net asset value, offering price, and redemption price per share
|
$
|
14.88
|
||
|
Institutional Class
|
||||
|
Shares authorized (no par value)
|
Unlimited
|
|||
|
Net assets applicable to outstanding shares
|
$
|
9,688,040
|
||
|
Shares issued and outstanding
|
627,805
|
|||
|
Net asset value, offering price, and redemption price per share
|
$
|
15.43
|
||
The accompanying notes are an integral part of these financial statements.
|
HENNESSY FUNDS
|
1-800-966-4354
|
9
Financial Statements
|
Statement of Operations for the six months ended April 30, 2020 (Unaudited)
|
|
INVESTMENT INCOME:
|
||||
|
Dividend income(1)
|
$
|
589,963
|
||
|
Interest income
|
16,198
|
|||
|
Total investment income
|
606,161
|
|||
|
EXPENSES:
|
||||
|
Investment advisory fees (See Note 5)
|
468,599
|
|||
|
Sub-transfer agent expenses – Investor Class (See Note 5)
|
91,203
|
|||
|
Sub-transfer agent expenses – Institutional Class (See Note 5)
|
6,358
|
|||
|
Distribution fees – Investor Class (See Note 5)
|
85,388
|
|||
|
Administration, accounting, custody, and transfer agent fees (See Note 5)
|
69,537
|
|||
|
Service fees – Investor Class (See Note 5)
|
56,925
|
|||
|
Federal and state registration fees
|
18,485
|
|||
|
Compliance expense (See Note 5)
|
13,462
|
|||
|
Audit fees
|
11,375
|
|||
|
Reports to shareholders
|
9,197
|
|||
|
Trustees’ fees and expenses
|
8,921
|
|||
|
Legal fees
|
731
|
|||
|
Other expenses
|
9,380
|
|||
|
Total expenses
|
849,561
|
|||
|
NET INVESTMENT LOSS
|
$
|
(243,400
|
)
|
|
|
REALIZED AND UNREALIZED GAINS (LOSSES):
|
||||
|
Net realized gain on investments
|
$
|
11,594,725
|
||
|
Net change in unrealized appreciation/depreciation on investments
|
(40,617,711
|
)
|
||
|
Net loss on investments
|
(29,022,986
|
)
|
||
|
NET DECREASE IN NET ASSETS RESULTING FROM OPERATIONS
|
$
|
(29,266,386
|
)
|
|
|
(1)
|
Net of foreign taxes withheld of $2,691.
|
The accompanying notes are an integral part of these financial statements.
|
HENNESSYFUNDS.COM
|
10
|
STATEMENT OF OPERATIONS/STATEMENTS OF CHANGES IN NET ASSETS
|
Financial Statements
|
Statements of Changes in Net Assets
|
|
Six Months Ended
|
||||||||
|
April 30, 2020
|
Year Ended
|
|||||||
|
(Unaudited)
|
October 31, 2019
|
|||||||
|
OPERATIONS:
|
||||||||
|
Net investment loss
|
$
|
(243,400
|
)
|
$
|
(45,248
|
)
|
||
|
Net realized gain (loss) on investments
|
11,594,725
|
(12,686,776
|
)
|
|||||
|
Net change in unrealized
|
||||||||
|
appreciation/depreciation on investments
|
(40,617,711
|
)
|
3,138,849
|
|||||
|
Net decrease in net assets resulting from operations
|
(29,266,386
|
)
|
(9,593,175
|
)
|
||||
|
DISTRIBUTIONS TO SHAREHOLDERS:
|
||||||||
|
Distributable earnings – Investor Class
|
—
|
(12,717,829
|
)
|
|||||
|
Distributable earnings – Institutional Class
|
—
|
(1,655,292
|
)
|
|||||
|
Total distributions
|
—
|
(14,373,121
|
)
|
|||||
|
CAPITAL SHARE TRANSACTIONS:
|
||||||||
|
Proceeds from shares subscribed – Investor Class
|
601,667
|
2,338,416
|
||||||
|
Proceeds from shares subscribed – Institutional Class
|
259,737
|
643,045
|
||||||
|
Dividends reinvested – Investor Class
|
—
|
12,312,126
|
||||||
|
Dividends reinvested – Institutional Class
|
—
|
1,582,859
|
||||||
|
Cost of shares redeemed – Investor Class
|
(10,405,549
|
)
|
(27,329,933
|
)
|
||||
|
Cost of shares redeemed – Institutional Class
|
(2,346,814
|
)
|
(5,351,383
|
)
|
||||
|
Net decrease in net assets derived
|
||||||||
|
from capital share transactions
|
(11,890,959
|
)
|
(15,804,870
|
)
|
||||
|
TOTAL DECREASE IN NET ASSETS
|
(41,157,345
|
)
|
(39,771,166
|
)
|
||||
|
NET ASSETS:
|
||||||||
|
Beginning of period
|
139,724,126
|
179,495,292
|
||||||
|
End of period
|
$
|
98,566,781
|
$
|
139,724,126
|
||||
|
CHANGES IN SHARES OUTSTANDING:
|
||||||||
|
Shares sold – Investor Class
|
36,651
|
125,244
|
||||||
|
Shares sold – Institutional Class
|
14,738
|
32,446
|
||||||
|
Shares issued to holders as reinvestment
|
||||||||
|
of dividends – Investor Class
|
—
|
661,942
|
||||||
|
Shares issued to holders as reinvestment
|
||||||||
|
of dividends – Institutional Class
|
—
|
82,441
|
||||||
|
Shares redeemed – Investor Class
|
(597,965
|
)
|
(1,423,630
|
)
|
||||
|
Shares redeemed – Institutional Class
|
(124,359
|
)
|
(274,093
|
)
|
||||
|
Net decrease in shares outstanding
|
(670,935
|
)
|
(795,650
|
)
|
||||
The accompanying notes are an integral part of these financial statements.
|
HENNESSY FUNDS
|
1-800-966-4354
|
11
Financial Statements
|
Financial Highlights
|
For an Investor Class share outstanding throughout each period
|
Six Months Ended
|
||||
|
April 30, 2020
|
||||
|
(Unaudited)
|
||||
|
PER SHARE DATA:
|
||||
|
Net asset value, beginning of period
|
$
|
19.15
|
||
|
Income from investment operations:
|
||||
|
Net investment income (loss)
|
(0.04
|
)(1)
|
||
|
Net realized and unrealized gains (losses) on investments
|
(4.23
|
)
|
||
|
Total from investment operations
|
(4.27
|
)
|
||
|
Less distributions:
|
||||
|
Dividends from net investment income
|
—
|
|||
|
Dividends from net realized gains
|
—
|
|||
|
Total distributions
|
—
|
|||
|
Net asset value, end of period
|
$
|
14.88
|
||
|
TOTAL RETURN
|
-22.30
|
%(2)
|
||
|
SUPPLEMENTAL DATA AND RATIOS:
|
||||
|
Net assets, end of period (millions)
|
$
|
88.88
|
||
|
Ratio of expenses to average net assets
|
1.37
|
%(3)
|
||
|
Ratio of net investment income (loss) to average net assets
|
(0.42
|
)%(3)
|
||
|
Portfolio turnover rate(4)
|
96
|
%(2)
|
||
|
(1)
|
Calculated using the average shares outstanding method.
|
|
(2)
|
Not annualized.
|
|
(3)
|
Annualized.
|
|
(4)
|
Calculated on the basis of the Fund as a whole.
|
The accompanying notes are an integral part of these financial statements.
|
HENNESSYFUNDS.COM
|
12
|
FINANCIAL HIGHLIGHTS — INVESTOR CLASS
|
|
Year Ended October 31,
|
||||||||||||||||||
|
2019
|
2018
|
2017
|
2016
|
2015
|
||||||||||||||
|
$
|
22.17
|
$
|
24.16
|
$
|
18.98
|
$
|
20.00
|
$
|
18.68
|
|||||||||
|
(0.01
|
)(1)
|
(0.17
|
)
|
(0.09
|
)
|
(0.02
|
)
|
0.06
|
||||||||||
|
(1.19
|
)
|
(1.82
|
)
|
5.27
|
(0.98
|
)
|
1.26
|
|||||||||||
|
(1.20
|
)
|
(1.99
|
)
|
5.18
|
(1.00
|
)
|
1.32
|
|||||||||||
|
—
|
—
|
—
|
(0.02
|
)
|
—
|
|||||||||||||
|
(1.82
|
)
|
—
|
—
|
—
|
—
|
|||||||||||||
|
(1.82
|
)
|
—
|
—
|
(0.02
|
)
|
—
|
||||||||||||
|
$
|
19.15
|
$
|
22.17
|
$
|
24.16
|
$
|
18.98
|
$
|
20.00
|
|||||||||
|
-5.19
|
%
|
-8.24
|
%
|
27.29
|
%
|
-5.00
|
%
|
7.07
|
%
|
|||||||||
|
$
|
125.10
|
$
|
158.98
|
$
|
197.22
|
$
|
184.61
|
$
|
248.74
|
|||||||||
|
1.34
|
%
|
1.30
|
%
|
1.30
|
%
|
1.32
|
%
|
1.15
|
%
|
|||||||||
|
(0.07
|
)%
|
(0.56
|
)%
|
(0.33
|
)%
|
(0.18
|
)%
|
0.30
|
%
|
|||||||||
|
95
|
%
|
133
|
%
|
98
|
%
|
97
|
%
|
102
|
%
|
|||||||||
The accompanying notes are an integral part of these financial statements.
|
HENNESSY FUNDS
|
1-800-966-4354
|
13
Financial Statements
|
Financial Highlights
|
For an Institutional Class share outstanding throughout each period
|
Six Months Ended
|
||||
|
April 30, 2020
|
||||
|
(Unaudited)
|
||||
|
PER SHARE DATA:
|
||||
|
Net asset value, beginning of period
|
$
|
19.83
|
||
|
Income from investment operations:
|
||||
|
Net investment income (loss)
|
(0.01
|
)(1)
|
||
|
Net realized and unrealized gains (losses) on investments
|
(4.39
|
)
|
||
|
Total from investment operations
|
(4.40
|
)
|
||
|
Less distributions:
|
||||
|
Dividends from net investment income
|
—
|
|||
|
Dividends from net realized gains
|
—
|
|||
|
Total distributions
|
—
|
|||
|
Net asset value, end of period
|
$
|
15.43
|
||
|
TOTAL RETURN
|
-22.19
|
%(2)
|
||
|
SUPPLEMENTAL DATA AND RATIOS:
|
||||
|
Net assets, end of period (millions)
|
$
|
9.69
|
||
|
Ratio of expenses to average net assets
|
1.06
|
%(3)
|
||
|
Ratio of net investment income (loss) to average net assets
|
(0.10
|
)%(3)
|
||
|
Portfolio turnover rate(4)
|
96
|
%(2)
|
||
|
(1)
|
Calculated using the average shares outstanding method.
|
|
(2)
|
Not annualized.
|
|
(3)
|
Annualized.
|
|
(4)
|
Calculated on the basis of the Fund as a whole.
|
The accompanying notes are an integral part of these financial statements.
|
HENNESSYFUNDS.COM
|
14
|
FINANCIAL HIGHLIGHTS — INSTITUTIONAL CLASS
|
|
Year Ended October 31,
|
||||||||||||||||||
|
2019
|
2018
|
2017
|
2016
|
2015
|
||||||||||||||
|
$
|
22.88
|
$
|
24.85
|
$
|
19.46
|
$
|
20.47
|
$
|
19.08
|
|||||||||
|
0.05
|
(1)
|
0.11
|
0.01
|
0.17
|
0.03
|
|||||||||||||
|
(1.22
|
)
|
(2.08
|
)
|
5.38
|
(1.13
|
)
|
1.36
|
|||||||||||
|
(1.17
|
)
|
(1.97
|
)
|
5.39
|
(0.96
|
)
|
1.39
|
|||||||||||
|
—
|
—
|
—
|
(0.05
|
)
|
—
|
|||||||||||||
|
(1.88
|
)
|
—
|
—
|
—
|
—
|
|||||||||||||
|
(1.88
|
)
|
—
|
—
|
(0.05
|
)
|
—
|
||||||||||||
|
$
|
19.83
|
$
|
22.88
|
$
|
24.85
|
$
|
19.46
|
$
|
20.47
|
|||||||||
|
-4.86
|
%
|
-7.93
|
%
|
27.70
|
%
|
-4.69
|
%
|
7.29
|
%
|
|||||||||
|
$
|
14.62
|
$
|
20.52
|
$
|
31.65
|
$
|
25.74
|
$
|
38.96
|
|||||||||
|
1.01
|
%
|
0.96
|
%
|
0.97
|
%
|
0.98
|
%
|
0.99
|
%
|
|||||||||
|
0.27
|
%
|
(0.23
|
)%
|
(0.00
|
)%
|
0.14
|
%
|
0.51
|
%
|
|||||||||
|
95
|
%
|
133
|
%
|
98
|
%
|
97
|
%
|
102
|
%
|
|||||||||
The accompanying notes are an integral part of these financial statements.
|
HENNESSY FUNDS
|
1-800-966-4354
|
15
Financial Statements
|
Notes to the Financial Statements April 30, 2020 (Unaudited)
|
1). ORGANIZATION
The Hennessy Cornerstone Growth Fund (the “Fund”) is a series of Hennessy Funds Trust (the “Trust”), which was organized as a Delaware statutory trust on September 17, 1992. The Fund is an open-end management investment
company registered under the Investment Company Act of 1940, as amended. The investment objective of the Fund is long-term growth of capital. The Fund is a diversified fund.
The Fund offers Investor Class and Institutional Class shares. Each class of shares differs principally in its respective 12b-1 distribution and service, shareholder servicing, and sub-transfer agent
expenses. There are no sales charges. Each class has identical rights to earnings, assets, and voting privileges, except for class-specific expenses and exclusive rights to vote on matters affecting only one class.
As an investment company, the Fund follows the investment company accounting and reporting guidance of the Financial Accounting Standards Board (“FASB”) Accounting Standard Codification Topic 946
“Financial Services—Investment Companies.”
2). SIGNIFICANT ACCOUNTING POLICIES
The following is a summary of significant accounting policies consistently followed by the Fund in the preparation of the financial statements. These policies conform to U.S. generally accepted accounting principles
(“GAAP”).
|
a).
|
Securities Valuation – All investments in securities are recorded at their estimated fair value, as described in Note 3.
|
|
b).
|
Federal Income Taxes – No provision for federal income taxes or excise taxes has been made because the Fund has elected to be taxed as a regulated investment company and intends to distribute substantially all of
its taxable income to its shareholders and otherwise comply with the provisions of the Internal Revenue Code of 1986, as amended, applicable to regulated investment companies. Net investment income/loss and realized gains/losses for federal
income tax purposes may differ from those reported in the financial statements because of temporary book and tax basis differences. Temporary differences are primarily the result of the treatment of partnership income and wash sales for tax
reporting purposes. The Fund recognizes interest and penalties related to income tax benefits, if any, in the Statement of Operations as an income tax expense. Distributions from net realized gains for book purposes may include short-term
capital gains, which are included as ordinary income to shareholders for tax purposes. The Fund may utilize equalization accounting for tax purposes and designate earnings and profits, including net realized gains distributed to shareholders
on redemption of shares, as part of the dividends paid deduction for income tax purposes.
|
|
c).
|
Accounting for Uncertainty in Income Taxes – The Fund has accounting policies regarding recognition and measurement of tax positions taken or expected to be taken on a tax return. The tax returns of the Fund for the
prior three fiscal years are open for examination. The Fund has reviewed all open tax years in major jurisdictions and concluded that there is no impact on the Fund’s net assets and no tax liability resulting from unrecognized tax benefits
relating to uncertain income tax positions taken or expected to be taken on a tax return. The Fund’s major tax jurisdictions are U.S. federal and Delaware.
|
|
HENNESSYFUNDS.COM
|
16
|
NOTES TO THE FINANCIAL STATEMENTS
|
|
d).
|
Income and Expenses – Dividend income is recognized on the ex-dividend date or as soon as information is available to the Fund. Interest income, which includes the amortization of premium and accretion of discount,
is recognized on an accrual basis. Other non-cash dividends are recognized as investment income at the fair value of the property received. The Fund is charged for those expenses that are directly attributable to its portfolio, such as
advisory, administration, and certain shareholder service fees. Income, expenses (other than expenses attributable to a specific class), and realized and unrealized gains/losses on investments are allocated to each class of shares based on
such class’s net assets.
|
|
e).
|
Distributions to Shareholders – Dividends from net investment income for the Fund, if any, are declared and paid annually, usually in December. Distributions of net realized capital gains, if any, are declared and
paid annually, usually in December.
|
|
f).
|
Security Transactions – Investment and shareholder transactions are recorded on the trade date. The Fund determines the realized gain/loss from an investment transaction by comparing the original cost of the
security lot sold with the net sale proceeds. Discounts and premiums on securities purchased are accreted or amortized, respectively, over the life of each such security.
|
|
g).
|
Use of Estimates – The preparation of financial statements in conformity with GAAP requires management to make estimates and assumptions that affect the reported amounts of assets and liabilities and disclosure of
contingent assets and liabilities at the date of the financial statements and the reported change in net assets during the reporting period. Actual results could differ from those estimates.
|
|
h).
|
Share Valuation – The net asset value (“NAV”) per share of the Fund is calculated by dividing (i) the total value of the securities held by the Fund, plus cash and other assets, minus all liabilities (including
estimated accrued expenses) by (ii) the total number of shares outstanding for the Fund, rounded to the nearest $0.01. The Fund’s shares will not be priced on days the New York Stock Exchange is closed for trading. The offering and redemption
price per share for the Fund is equal to the Fund’s NAV per share.
|
3). SECURITIES VALUATION
The Fund follows fair value accounting standards that establish an authoritative definition of fair value and set out a hierarchy for measuring fair value. These standards require additional disclosures about the various
inputs and valuation techniques used to develop the measurements of fair value and a discussion of changes in valuation techniques and related inputs during the period. These inputs are summarized in the three broad levels listed below:
|
Level 1 –
|
Unadjusted, quoted prices in active markets for identical instruments that the Fund has the ability to access at the date of measurement.
|
|
|
Level 2 –
|
Other significant observable inputs (including, but not limited to, quoted prices in active markets for similar instruments, quoted prices in markets that are not active for identical or similar instruments, and
model-derived valuations in which all significant inputs and significant value drivers are observable in active markets, such as interest rates, prepayment speeds, credit risk curves, default rates, and similar data).
|
|
|
Level 3 –
|
Significant unobservable inputs (including the Fund’s own assumptions about what market participants would use to price the asset or liability based on the best available information) when observable inputs are
unavailable.
|
|
HENNESSY FUNDS
|
1-800-966-4354
|
17
The following is a description of the valuation techniques applied to the Fund’s major categories of assets and liabilities measured at fair value on a recurring basis:
|
Equity Securities – Equity securities, including common stocks, preferred stocks, foreign-issued common stocks, exchange-traded funds, closed-end mutual funds, partnerships,
rights, and real estate investment trusts, that are traded on a securities exchange for which a last-quoted sales price is readily available will generally be valued at the last sales price as reported by the primary exchange on which the
securities are listed. Securities listed on The NASDAQ Stock Market (“NASDAQ”) will generally be valued at the NASDAQ Official Closing Price, which may differ from the last sales price reported. Securities traded on a securities exchange for
which a last-quoted sales price is not readily available will generally be valued at the mean between the bid and ask prices. To the extent these securities are actively traded and valuation adjustments are not applied, they are classified in
Level 1 of the fair value hierarchy. Securities traded on foreign exchanges generally are not valued at the same time the Fund calculates its NAV because most foreign markets close well before such time. The earlier close of most foreign
markets gives rise to the possibility that significant events, including broad market moves, may have occurred in the interim. In certain circumstances, it may be determined that a foreign security needs to be fair valued because it appears
that the value of the security might have been materially affected by events occurring after the close of the market in which the security is principally traded, but before the time the Fund calculates its NAV, such as by a development that
affects an entire market or region (e.g., a weather-related event) or a potentially global development (e.g., a terrorist attack that may be expected to have an effect on investor expectations worldwide).
|
|
|
Registered Investment Companies – Investments in open-end registered investment companies, commonly referred to as mutual funds, generally are priced at the ending NAV
provided by the applicable mutual fund’s service agent and will be classified in Level 1 of the fair value hierarchy.
|
|
|
Debt Securities – Debt securities, including corporate bonds, asset-backed securities, mortgage-backed securities, municipal bonds, U.S. Treasuries, and U.S. government
agency issues, are generally valued at market on the basis of valuations furnished by an independent pricing service that utilizes both dealer-supplied valuations and formula-based techniques. The pricing service may consider recently
executed transactions in securities of the issuer or comparable issuers, market price quotations (where observable), bond spreads, and fundamental data relating to the issuer. In addition, the model may incorporate observable market data,
such as reported sales of similar securities, broker quotes, yields, bids, offers, and reference data. Certain securities are valued primarily using dealer quotations. These securities are generally classified in Level 2 of the fair value
hierarchy.
|
|
|
Short-Term Securities – Short-term equity investments, including money market funds, are valued in the manner specified above. Short-term debt investments with an original
term to maturity of 60 days or less are valued at amortized cost, which approximates fair market value. If the original term to maturity of a short-term debt investment exceeded 60 days, then the values as of the 61st day prior to maturity
are amortized. Amortized cost is not used if its use would be inappropriate due to credit or other impairments of the issuer, in which case the security’s fair value would be determined, as described below. Short-term securities are generally
classified in Level 1 or Level 2 of the fair value hierarchy depending on the inputs used and market activity levels for specific securities.
|
|
HENNESSYFUNDS.COM
|
18
|
NOTES TO THE FINANCIAL STATEMENTS
|
The Board of Trustees of the Fund (the “Board”) has adopted fair value pricing procedures that are followed when a price for a security is not readily available or if a significant event has occurred that
indicates the closing price of a security no longer represents the true value of that security. Fair value pricing determinations are made in good faith in accordance with these procedures. There are numerous criteria that will be given consideration
in determining a fair value of a security, such as the trading volume of a security and markets, the values of other similar securities, and news events with direct bearing on a security or markets. Fair value pricing results in an estimated price
for a security that reflects the amount the Fund might reasonably expect to receive in a current sale. Depending on the relative significance of the valuation inputs, these securities may be classified in either Level 2 or Level 3 of the fair value
hierarchy.
The fair value of foreign securities may be determined with the assistance of a pricing service using correlations between the movement of prices of such securities and indices of domestic securities and
other appropriate indicators, such as closing market prices of relevant American Depositary Receipts or futures contracts. Using fair value pricing means that the Fund’s NAV reflects the affected portfolio securities’ values as determined by the
Board or its designee, pursuant to the fair value pricing procedures adopted by the Board, instead of being determined by the market. Using a fair value pricing methodology to price a foreign security may result in a value that is different from such
foreign security’s most recent closing price and from the value used by other investment companies to calculate their NAVs. Such securities are generally classified in Level 2 of the fair value hierarchy. Because the Fund may invest in foreign
securities, the value of the Fund’s portfolio securities may change on days when you will not be able to purchase or redeem your shares.
The Board has delegated day-to-day valuation matters to the Valuation and Liquidity Committee comprising representatives from Hennessy Advisors, Inc., the Fund’s investment advisor (the “Advisor”). The
function of the Valuation and Liquidity Committee is to value securities where current and reliable market quotations are not readily available. All actions taken by the Valuation and Liquidity Committee are reviewed by the Board.
The Fund has performed an analysis of all existing investments to determine the significance and character of all inputs to their fair value determinations. Various inputs are used to determine the value
of the Fund’s investments. The inputs or methodology used for valuing securities are not necessarily an indication of the risk associated with investing in those securities. Details related to the fair value hierarchy of the Fund’s securities as of
April 30, 2020, are included in the Schedule of Investments.
4). INVESTMENT TRANSACTIONS
Purchases and sales of investment securities (excluding government and short-term investments) for the Fund during the six months ended April 30, 2020, were $117,978,311 and $128,501,795, respectively.
There were no purchases or sales/maturities of long-term U.S. government securities for the Fund during the six months ended April 30, 2020.
The Fund is permitted to purchase or sell securities from or to another fund in the Hennessy Funds family of funds (collectively, the “Hennessy Funds”) under specified conditions outlined in procedures
adopted by the Board. The procedures have been designed to ensure that any purchase or sale of securities by the Fund from or to another Hennessy Fund complies with Rule 17a-7 of the Investment Company Act of 1940, as amended. During the six months
ended April 30, 2020, the Fund did not engage in purchases or sales of securities pursuant to Rule 17a-7 of the Investment Company Act of 1940, as amended.
|
HENNESSY FUNDS
|
1-800-966-4354
|
19
5). INVESTMENT ADVISORY FEE AND OTHER TRANSACTIONS WITH AFFILIATES
The Advisor provides the Fund with investment advisory services under an Investment Advisory Agreement. The Advisor furnishes all investment advice, office space, and facilities and most of the personnel needed by the Fund.
As compensation for its services, the Advisor is entitled to a monthly fee from the Fund. The fee is based on the average daily net assets of the Fund at an annual rate of 0.74%. The net investment advisory fees expensed by the Fund during the six
months ended April 30, 2020, are included in the Statement of Operations.
The Board has approved a Shareholder Servicing Agreement for Investor Class shares of the Fund, which was instituted to compensate the Advisor for the non-investment advisory services it provides to the
Fund. The Shareholder Servicing Agreement provides for a monthly fee paid to the Advisor at an annual rate of 0.10% of the average daily net assets of the Fund attributable to Investor Class shares. The shareholder service fees expensed by the Fund
during the six months ended April 30, 2020, are included in the Statement of Operations.
The Fund has adopted a plan pursuant to Rule 12b-1 under the Investment Company Act of 1940, as amended, that authorizes payments in connection with the distribution of the Fund’s shares at an annual rate
of up to 0.25% of the Fund’s average daily net assets attributable to Investor Class shares. Even though the authorized rate is up to 0.25%, the Fund is currently only using up to 0.15% of its average daily net assets attributable to Investor Class
shares for such purpose. Amounts paid under the plan may be spent on any activities or expenses primarily intended to result in the sale of shares, including, but not limited to, advertising, shareholder account servicing, printing and mailing of
prospectuses to other than current shareholders, printing and mailing of sales literature, and compensation for sales and marketing activities or to financial institutions and others, such as dealers and distributors. The distribution fees expensed
by the Fund during the six months ended April 30, 2020, are included in the Statement of Operations.
The Fund has entered into agreements with various brokers, dealers, and financial intermediaries in connection with the sale of shares of the Fund. The agreements provide for periodic payments of
sub-transfer agent expenses by the Fund to the brokers, dealers, and financial intermediaries for providing certain shareholder maintenance services. These shareholder services include the pre-processing and quality control of new accounts,
shareholder correspondence, answering customer inquiries regarding account status, and facilitating shareholder telephone transactions. The sub-transfer agent fees expensed by the Fund during the six months ended April 30, 2020, are included in the
Statement of Operations.
U.S. Bancorp Fund Services, LLC, d/b/a U.S. Bank Global Fund Services (“Fund Services”) provides the Fund with administrative, accounting, and transfer agent services. As administrator, Fund Services is
responsible for activities such as (i) preparing various federal and state regulatory filings, reports, and returns for the Fund, (ii) preparing reports and materials to be supplied to the Board, (iii) monitoring the activities of the Fund’s
custodian, transfer agent, and accountants, and (iv) coordinating the preparation and payment of the Fund’s expenses and reviewing the Fund’s expense accruals. U.S. Bank N.A., an affiliate of Fund Services, serves as the Fund’s custodian. The
servicing agreements between the Trust and Fund Services and U.S. Bank N.A. contain a fee schedule that is inclusive of administrative, accounting, custody, and transfer agent fees. The administrative, accounting, custody, and transfer agent fees
expensed by the Fund during the six months ended April 30, 2020, are included in the Statement of Operations.
|
HENNESSYFUNDS.COM
|
20
|
NOTES TO THE FINANCIAL STATEMENTS
|
Quasar Distributors, LLC (“Quasar”) acts as the Fund’s principal underwriter in a continuous public offering of the Fund’s shares. Quasar was an affiliate of Fund Services and U.S. Bank N.A. through March
30, 2020. Effective March 31, 2020, Foreside Financial Group, LLC (“Foreside”) acquired Quasar from Fund Services. As a result of the acquisition, Quasar became a wholly owned broker-dealer subsidiary of Foreside and is no longer affiliated with Fund
Services or U.S. Bank N.A. The Board approved a new Distribution Agreement to enable Quasar to continue serving as the Fund’s distributor.
The officers of the Fund are affiliated with the Advisor. With the exception of the Chief Compliance Officer and the Senior Compliance Officer, such officers receive no compensation from the Fund for
serving in their respective roles. The Fund, along with the other Hennessy Funds, makes reimbursement payments on an equal basis to the Advisor for a portion of the salary and benefits associated with the office of the Chief Compliance Officer and
for all of the salary and benefits associated with the office of the Senior Compliance Officer. The compliance fees expensed by the Fund during the six months ended April 30, 2020, are included in the Statement of Operations.
6). GUARANTEES AND INDEMNIFICATIONS
Under the Hennessy Funds’ organizational documents, their officers and trustees are indemnified by the Hennessy Funds against certain liabilities arising out of the performance of their duties to the Hennessy Funds.
Additionally, in the normal course of business, the Hennessy Funds enter into contracts with service providers that contain general indemnification clauses. The Fund’s maximum exposure under these arrangements is unknown as this would involve future
claims that may be made against the Fund that have not yet occurred. Currently, the Fund expects the risk of loss to be remote.
7). LINE OF CREDIT
The Fund has an uncommitted line of credit with the other Hennessy Funds in the amount of the lesser of (i) $100,000,000 or (ii) 33.33% of each Hennessy Fund’s net assets, or 30% for the Hennessy Gas Utility Fund and 10%
for the Hennessy Balanced Fund, intended to provide short-term financing, if necessary, subject to certain restrictions, in connection with shareholder redemptions. The credit facility is with the Hennessy Funds’ custodian bank, U.S. Bank N.A.
Borrowings under this arrangement bear interest at the bank’s prime rate and are secured by all of the Fund’s assets (as to its own borrowings only). During the six months ended April 30, 2020, the Fund did not have any borrowings outstanding under
the line of credit.
8). FEDERAL TAX INFORMATION
As of October 31, 2019, the Fund’s most recent fiscal year end, the components of accumulated earnings (losses) for income tax purposes were as follows:
|
Investments
|
||||
|
Cost of investments for tax purposes
|
$
|
134,392,059
|
||
|
Gross tax unrealized appreciation
|
$
|
15,584,822
|
||
|
Gross tax unrealized depreciation
|
(10,055,455
|
)
|
||
|
Net tax unrealized appreciation/(depreciation)
|
$
|
5,529,367
|
||
|
Undistributed ordinary income
|
$
|
—
|
||
|
Undistributed long-term capital gains
|
—
|
|||
|
Total distributable earnings
|
$
|
—
|
||
|
Other accumulated gain/(loss)
|
$
|
(12,514,051
|
)
|
|
|
Total accumulated gain/(loss)
|
$
|
(6,984,684
|
)
|
|
|
HENNESSY FUNDS
|
1-800-966-4354
|
21
The difference between book-basis unrealized appreciation/depreciation and tax-basis unrealized appreciation/depreciation (as shown above) is attributable primarily to wash sales.
As of October 31, 2019, the Fund had capital loss carryforwards as follows:
|
$12,514,051
|
Unlimited Short-Term
|
As of October 31, 2019, the Fund did not defer, on a tax basis, any late-year ordinary losses. Late-year ordinary losses are net ordinary losses incurred after December 31, 2018, but within the taxable
year, that are deemed to arise on the first day of the Fund’s next taxable year.
During fiscal year 2020 (year to date) and fiscal year 2019, the tax character of distributions paid by the Fund was as follows:
|
Six Months Ended
|
Year Ended
|
||||||||
|
April 30, 2020
|
October 31, 2019
|
||||||||
|
Ordinary income(1)
|
$
|
—
|
$
|
—
|
|||||
|
Long-term capital gain
|
—
|
14,373,121
|
|||||||
|
$
|
—
|
$
|
14,373,121
|
||||||
|
(1) Ordinary income includes short-term capital gain.
|
9). EVENTS SUBSEQUENT TO PERIOD END
Management has evaluated the Fund’s related events and transactions that occurred subsequent to April 30, 2020, through the date of issuance of the Fund’s financial statements. Management has determined that there were no
subsequent events requiring recognition or disclosure in the financial statements.
|
HENNESSYFUNDS.COM
|
22
|
NOTES TO THE FINANCIAL STATEMENTS/EXPENSE EXAMPLE
|
Expense Example (Unaudited)
April 30, 2020
As a shareholder of the Fund, you incur ongoing costs, including management fees, service fees, and other Fund expenses. This Example is intended to help you understand your ongoing costs (in dollars) of investing in the
Fund and to compare these costs with the ongoing costs of investing in other mutual funds. The Example is based on an investment of $1,000 invested at the beginning of the period and held for the entire period from November 1, 2019, through April 30,
2020.
Actual Expenses
The first line of the table below under the “Investor Class” and “Institutional Class” headings provides information about actual account values and actual expenses. Although the Fund charges no sales loads or transaction
fees, you will be assessed fees for outgoing wire transfers, returned checks and stop payment orders at prevailing rates charged by U.S. Bank Global Fund Services, the Fund’s transfer agent. If you request that a redemption be made by wire transfer,
currently a $15 fee is charged by the Fund’s transfer agent. IRA accounts will be charged a $15 annual maintenance fee. The example below includes, but is not limited to, management fees, shareholder servicing fees, accounting, custody, and transfer
agent fees. However, the example below does not include portfolio trading commissions and related expenses. You may use the information in this line, together with the amount you invested, to estimate the expenses that you paid over the period.
Simply divide your account value by $1,000 (for example, an $8,600 account value divided by $1,000 = 8.6), then multiply the result by the number in the first line of the table under the “Investor Class” or “Institutional Class” headings in the
column entitled “Expenses Paid During Period” to estimate the expenses you paid on your account during this period.
Hypothetical Example for Comparison Purposes
The second line of the table below under the “Investor Class” and “Institutional Class” headings provides information about hypothetical account values and hypothetical expenses based on the Fund’s actual expense ratios and
an assumed rate of return of 5% per year before expenses, which is not the Fund’s actual return. The hypothetical account values and expenses may not be used to estimate the actual ending account balance or expenses you paid for the period. You may
use this information to compare the ongoing costs of investing in the Fund and other funds. To do so, compare this 5% hypothetical example with the 5% hypothetical examples that appear in the shareholder reports of the other funds. Please note that
the expenses shown in the table are meant to highlight your ongoing costs only. Therefore, the second line of the table under the “Investor Class” and “Institutional Class” headings is useful in comparing ongoing costs only and will not help you
determine the relative total costs of owning different funds.
|
HENNESSY FUNDS
|
1-800-966-4354
|
23
|
Beginning
|
Ending
|
||
|
Account Value
|
Account Value
|
Expenses Paid
|
|
|
November 1, 2019
|
April 30, 2020
|
During Period(1)
|
|
|
Investor Class
|
|||
|
Actual
|
$1,000.00
|
$ 777.00
|
$6.05
|
|
Hypothetical (5% return before expenses)
|
$1,000.00
|
$1,018.05
|
$6.87
|
|
Institutional Class
|
|||
|
Actual
|
$1,000.00
|
$ 778.10
|
$4.69
|
|
Hypothetical (5% return before expenses)
|
$1,000.00
|
$1,019.59
|
$5.32
|
|
(1)
|
Expenses are equal to the Fund’s annualized expense ratio of 1.37% for Investor Class shares or 1.06% for Institutional Class shares, as applicable, multiplied by the average account value over the period,
multiplied by 182/366 days (to reflect the half-year period).
|
|
HENNESSYFUNDS.COM
|
24
|
EXPENSE EXAMPLE — ELECTRONIC DELIVERY
|
How to Obtain a Copy of the Fund’s Proxy
Voting Policy and Proxy Voting Records
A description of the policies and procedures the Fund uses to determine how to vote proxies relating to portfolio securities is available without charge (1) by calling 1-800-966-4354, (2) on the Hennessy Funds’ website at
www.hennessyfunds.com/proxy-voting/voting-policy, or (3) on the U.S. Securities and Exchange Commission’s (the “SEC”) website at www.sec.gov. The Fund’s proxy voting record is available without charge on both the Hennessy Funds’ website at
www.hennessyfunds.com/proxy-voting/voting-record and the SEC’s website at www.sec.gov no later than August 31 for the prior 12 months ending June 30.
Availability of Quarterly Portfolio Schedule
The Fund files a complete schedule of portfolio holdings with the SEC for the first and third quarters of each fiscal year as an exhibit to its reports on Form N-PORT. The Fund’s Forms N-PORT are available on the SEC’s
website at www.sec.gov or on request by calling 1-800-966-4354.
Federal Tax Distribution Information
(Unaudited)
For fiscal year 2019, certain dividends paid by the Fund may be subject to a maximum tax rate of 23.8%, as provided for by the Jobs and Growth Tax Relief Reconciliation Act of 2003. The percentage of dividends declared from
ordinary income designated as qualified dividend income was 0.00%.
For corporate shareholders, the percent of ordinary income distributions that qualified for the corporate dividends received deduction for fiscal year 2019 was 0.00%.
The percentage of taxable ordinary income distributions that were designated as short-term capital gain distributions under Section 871(k)(2)(C) of the Internal Revenue Code of 1986, as amended, for the
Fund was 0.00%.
Important Notice Regarding Delivery
of Shareholder Documents
To help keep the Fund’s costs as low as possible, we generally deliver a single copy of shareholder reports, proxy statements, and prospectuses to shareholders who share an address and have the same last name. This process
does not apply to account statements. You may request an individual copy of a shareholder document at any time. If you would like to receive separate mailings of shareholder documents, please call U.S. Bank Global Fund Services at 1-800-261-6950 or
1-414-765-4124, and individual delivery will begin within 30 days of your request. If your account is held through a financial institution or other intermediary, please contact such intermediary directly to request individual delivery.
Electronic Delivery
The Funds offer shareholders the option to receive account statements, prospectuses, tax forms, and shareholder reports online. To sign up for eDelivery, please visit www.hennessyfunds.com/account. You may change your
delivery preference at any time by visiting our website or calling U.S. Bank Global Fund Services at 1-800-261-6950 or 1-414-765-4124.
|
HENNESSY FUNDS
|
1-800-966-4354
|
25
Board Approval of Investment Advisory
Agreement
At its meeting on March 12, 2020, the Board of Trustees of the Fund (the “Board,” and the members thereof, the “Trustees”) unanimously approved the continuation of the investment advisory agreement of the Fund with Hennessy
Advisors, Inc. (the “Advisor”). As part of the process of approving the continuation of the advisory agreement, the Trustees reviewed their fiduciary duties and the relevant factors for them to consider with respect to approving the advisory
agreement. In addition, the Trustees who are not deemed “interested persons” (as defined by the Investment Company Act of 1940, as amended) of the Fund (the “Independent Trustees”) met in executive session to discuss the approval of the advisory
agreement.
In advance of the meeting, the Advisor sent detailed information to the Trustees to assist them in their evaluation of the advisory agreement. This information included, but was not limited to, the
following:
|
(1)
|
A memorandum from outside legal counsel that described the fiduciary duties of the Board with respect to approving the continuation of the advisory agreement and the relevant factors for consideration;
|
|
|
(2)
|
A memorandum from the Advisor that listed the factors relevant to the Board’s approval of the continuation of the advisory agreement and also referenced the documents that had been provided to help the Board assess
each such factor;
|
|
|
(3)
|
An inventory of the services provided by the Advisor;
|
|
|
(4)
|
A written discussion of economies of scale;
|
|
|
(5)
|
A summary of the key terms of the advisory agreement;
|
|
|
(6)
|
A recent Fund fact sheet, which included performance information over various periods;
|
|
|
(7)
|
A peer expense comparison of the net expense ratio and investment advisory fee of the Fund; and
|
|
|
(8)
|
The Advisor’s financial statements from its most recent Form 10-K and Form 10-Q.
|
All of the factors discussed were considered as a whole by the Trustees and by the Independent Trustees meeting in executive session. The factors were viewed in their totality by the Trustees, with no
single factor being the principal or determinative factor in the Trustees’ determination of whether to approve the continuation of the advisory agreement. The Trustees recognized that the management and fee arrangements for the Fund are the result of
years of review and discussion between the Independent Trustees and the Advisor, that certain aspects of such arrangements may receive greater scrutiny in some years than in others, and that the Trustees’ conclusions may be based, in part, on their
consideration of these same arrangements and information received during the course of the year and in prior years.
Prior to approving the continuation of the advisory agreement, the Trustees, including the Independent Trustees in executive session, considered, among other items:
|
(1)
|
The nature and quality of the advisory services provided by the Advisor;
|
|
|
(2)
|
A comparison of the fees and expenses of the Fund to other similar funds;
|
|
|
(3)
|
Whether economies of scale are recognized by the Fund;
|
|
HENNESSYFUNDS.COM
|
26
|
BOARD APPROVAL OF INVESTMENT ADVISORY AGREEMENT
|
|
(4)
|
The costs and profitability of the Fund to the Advisor;
|
|
|
(5)
|
The performance of the Fund; and
|
|
|
(6)
|
Any benefits to the Advisor from serving as an investment advisor to the Fund (other than the advisory fee).
|
The material considerations and determinations of the Trustees, including the Independent Trustees, were as follows:
|
(1)
|
The Trustees considered the services identified below that are provided by the Advisor. Based on this review, the Trustees concluded that the Advisor provides high-quality services to the Fund and noted that their
overall confidence in the Advisor was high. The Trustees also concluded that they were satisfied with the nature, extent, and quality of the advisory services provided to the Fund by the Advisor and that the nature and extent of the services
provided by the Advisor were appropriate to assure that the Fund’s operations are conducted in compliance with applicable laws, rules, and regulations.
|
|
(a)
|
The Advisor acts as the portfolio manager for the Fund. In this capacity, the Advisor does the following:
|
|
(i)
|
manages the composition of the Fund’s portfolio, including the purchase, retention, and disposition of portfolio securities in accordance with the Fund’s investment objectives, policies, and restrictions;
|
|||
|
(ii)
|
seeks best execution for the Fund’s portfolio;
|
|||
|
(iii)
|
manages the use of soft dollars for the Fund; and
|
|||
|
(iv)
|
manages proxy voting for the Fund.
|
|
(b)
|
The Advisor performs a daily reconciliation of portfolio positions and cash for the Fund.
|
||
|
(c)
|
The Advisor monitors the liquidity of each Fund.
|
||
|
(d)
|
The Advisor monitors the Fund’s compliance with its investment objectives and restrictions.
|
||
|
(e)
|
The Advisor monitors compliance with federal securities laws, maintains a compliance program (including a code of ethics), conducts ongoing reviews of the compliance programs of the Fund’s service providers, as
feasible, conducts on-site visits to the Fund’s service providers, monitors incidents of abusive trading practices, reviews Fund expense accruals, payments, and fixed expense ratios, evaluates insurance providers for fidelity bond,
D&O/E&O insurance, and cybersecurity insurance coverage, manages regulatory examination compliance and responses, conducts employee compliance training, reviews reports provided by service providers, and maintains books and records.
|
||
|
(f)
|
The Advisor oversees service providers that provide accounting, administration, distribution, transfer agency, custodial, sales, marketing, public relations, audit, information technology, and legal services to the
Fund.
|
||
|
(g)
|
The Advisor maintains in-house marketing and distribution departments on behalf of the Fund.
|
||
|
(h)
|
The Advisor is actively involved with preparing regulatory filings for the Fund, including writing and annually updating the Fund’s prospectus and related documents.
|
|
HENNESSY FUNDS
|
1-800-966-4354
|
27
|
(i)
|
For each annual report of the Fund, the Advisor prepares a written summary of the Fund’s performance during the most recent 12-month period.
|
||
|
(j)
|
The Advisor oversees distribution of the Fund through third-party broker/dealers and independent financial institutions such as Charles Schwab, Inc., Fidelity, TD Ameritrade, and Pershing. The Advisor participates
in “no transaction fee” (“NTF”) programs with these companies on behalf of the Fund, which allow customers to purchase the Fund through third-party distribution channels without paying a transaction fee. The Advisor compensates, in part, a
number of these third-party providers of NTF programs out of its own revenues.
|
||
|
(k)
|
The Advisor pays the incentive compensation of the Fund’s compliance officers and employs other staff, such as legal, marketing, national accounts, distribution, sales, administrative, and trading oversight
personnel, as well as management executives.
|
||
|
(l)
|
The Advisor provides a quarterly compliance certification to the Board.
|
||
|
(m)
|
The Advisor prepares or reviews all Board materials, frequently presents to the Board and leads Board discussions, prepares or reviews all meeting minutes, and arranges for Board training and education.
|
|
(2)
|
The Trustees compared the performance of the Fund to benchmark indices over various periods and also noted that the Trustees review and discuss reports comparing the investment performance of the Fund to various
indices at each quarterly Board meeting. Based on such information, the Trustees determined that the Advisor manages the Fund in a manner materially consistent with its stated investment objective and style. The Trustees concluded that the
performance of the Fund over various periods warranted continuation of the advisory agreement.
|
|
|
(3)
|
The Trustees reviewed the advisory fees and overall expense ratios of the Fund compared to other funds similar in asset size and investment objective to the Fund using data from Morningstar. As part of the
discussion with management, the Trustees ensured that they understood and were comfortable with the criteria used to determine the mutual funds included in the Morningstar categories for purposes of the materials considered at the meeting.
The Trustees determined that the advisory fee and overall expense ratio of the Fund falls within the range of the advisory fees and overall expense ratios of other comparable funds and concluded that they are reasonable and warranted
continuation of the advisory agreement.
|
|
|
(4)
|
The Trustees also considered whether the Advisor was realizing economies of scale that it should share with the Fund’s shareholders. The Trustees noted that the assets of the Fund had declined over the prior year.
In addition, the Trustees noted that many of the expenses incurred to manage the Fund are asset-based fees, so the Advisor does not realize material economies of scale relating to those expenses as the assets of the Fund increase. For
example, mutual fund platform fees increase as the Fund’s assets grow. The Trustees also considered the Advisor’s efforts to contain expenses through actions such as renegotiating service contracts, the Advisor’s significant marketing efforts
to promote the Funds, the Advisor’s investments in personnel to manage the Funds, and the Advisor’s agreement to waive fees or lower its management fees in certain
|
|
HENNESSYFUNDS.COM
|
28
|
BOARD APPROVAL OF INVESTMENT ADVISORY AGREEMENT
|
|
circumstances. The Trustees noted that it did not appear that the Advisor was realizing economies of scale at current asset levels and concluded that it would continue to monitor economies of scale in the future as
circumstances changed.
|
||
|
(5)
|
The Trustees considered the profitability of the Advisor, including the impact of mutual fund platform fees on the Advisor’s profitability, and also considered the resources and revenues that the Advisor has put
into managing and distributing the Fund. The Trustees then concluded that the profits of the Advisor are reasonable and not excessive when compared to profitability guidelines set forth in relevant court cases.
|
|
|
(6)
|
The Trustees considered the high level of professionalism and knowledge of the Advisor’s employees, along with a very low level of turnover, and concluded that this was beneficial to the Fund and its shareholders.
|
|
|
(7)
|
The Trustees considered any benefits to the Advisor from serving as an advisor to the Fund (other than the advisory fee). The Trustees noted that the Advisor may derive ancillary benefits from, by way of example,
its association with the Fund in the form of proprietary and third-party research products and services received from broker-dealers that execute portfolio trades for the Fund. The Trustees determined that any such products and services have
been used for legitimate purposes relating to the Fund by providing assistance in the investment decision-making process. The Trustees concluded that any additional benefits realized by the Advisor from its relationship with the Fund were
reasonable, which was based on, among other things, the Trustees’ finding that the research, analytical, statistical, and other information and services provided by brokers are merely supplemental to the Advisor’s own efforts in the
performance of its duties under the advisory agreement.
|
After reviewing the materials and information provided at the meeting, as well as other information regularly provided at the Board’s quarterly meetings throughout the year regarding the quality of
services provided by the Advisor, the performance of the Fund, expense information, brokerage commissions information, the adequacy and efficacy of the Advisor’s written policies and procedures, other regulatory compliance issues, trading information
and related matters, and other factors that the Trustees deemed relevant, the Trustees, including the Independent Trustees, approved the continuation of the advisory agreement.
|
HENNESSY FUNDS
|
1-800-966-4354
|
29
For information, questions, or assistance, please call
The Hennessy Funds
1-800-966-4354 or 1-415-899-1555
INVESTMENT ADVISOR
Hennessy Advisors, Inc.
7250 Redwood Boulevard, Suite 200
Novato, California 94945
ADMINISTRATOR,
TRANSFER AGENT,
DIVIDEND PAYING AGENT, &
SHAREHOLDER SERVICING AGENT
U.S. Bancorp Fund Services, LLC
d/b/a U.S. Bank Global Fund Services
P.O. Box 701
Milwaukee, Wisconsin 53201-0701
CUSTODIAN
U.S. Bank N.A.
Custody Operations
1555 North River Center Drive, Suite 302
Milwaukee, Wisconsin 53212
TRUSTEES
Neil J. Hennessy
Robert T. Doyle
J. Dennis DeSousa
Gerald P. Richardson
COUNSEL
Foley & Lardner LLP
777 East Wisconsin Avenue
Milwaukee, Wisconsin 53202-5306
INDEPENDENT REGISTERED
PUBLIC ACCOUNTING FIRM
Tait, Weller & Baker LLP
Two Liberty Place
50 South 16th Street, Suite 2900
Philadelphia, Pennsylvania 19102-2529
DISTRIBUTOR
Quasar Distributors, LLC
111 East Kilbourn Avenue, Suite 2200
Milwaukee, Wisconsin 53202
www.hennessyfunds.com | 1-800-966-4354
This report has been prepared for shareholders and may be distributed to
others only if preceded or accompanied by a current prospectus.
SEMI-ANNUAL REPORT
APRIL 30, 2020

HENNESSY FOCUS FUND
Investor Class HFCSX
Institutional Class HFCIX
IMPORTANT NOTICE REGARDING ELECTRONIC DELIVERY OF SHAREHOLDER REPORTS
Beginning on January 1, 2021, as permitted by regulations adopted by the Securities and Exchange Commission, paper copies of the annual and semi-annual reports will no
longer be sent by mail unless you specifically request paper copies from the Hennessy Funds or from your financial intermediary. Instead, the reports will be made available on a website, and you will be notified by mail each time a report
is posted and provided with a website link to access the report.
If you have already elected to receive shareholder reports electronically, you will not be affected by this change and you need not take any action. You may elect to
receive shareholder reports and other communications from the Hennessy Funds electronically by visiting www.hennessyfunds.com/account or by calling U.S. Bank Global Fund Services at 1-800-261-6950. If you own shares in a Fund through a
financial intermediary, please contact your financial intermediary to make this election.
You may elect to receive paper copies of all future reports free of charge by calling U.S. Bank Global Fund Services at 1-800-261-6950 or, if you own your shares
through a financial intermediary, by contacting your financial intermediary. Your election to receive paper copies of reports will apply to all Funds in the Hennessy Funds family.
hennessyfunds.com | 1-800-966-4354
(This Page Intentionally Left Blank.)
Contents
|
Letter to Shareholders
|
2
|
|
Performance Overview
|
4
|
|
Financial Statements
|
|
|
Schedule of Investments
|
5
|
|
Statement of Assets and Liabilities
|
9
|
|
Statement of Operations
|
10
|
|
Statements of Changes in Net Assets
|
11
|
|
Financial Highlights
|
12
|
|
Notes to the Financial Statements
|
16
|
|
Expense Example
|
24
|
|
Proxy Voting Policy and Proxy Voting Records
|
26
|
|
Availability of Quarterly Portfolio Schedule
|
26
|
|
Federal Tax Distribution Information
|
26
|
|
Important Notice Regarding Delivery of Shareholder Documents
|
26
|
|
Electronic Delivery
|
26
|
|
Board Approval of Investment Advisory Agreements
|
27
|
|
HENNESSY FUNDS
|
1-800-966-4354
|
June 2020
Dear Hennessy Funds Shareholder:
First and foremost, I hope this communication finds you and your loved ones safe and healthy. In many ways, the COVID-19 pandemic has turned the world upside down in recent months, and we at Hennessy have joined the rest
of the world in witnessing and experiencing its profound effect on public health, the global economy, and the everyday lives of people around the world. In response to the crisis, we invoked our business continuity plan in mid-March to ensure a
smooth transition to remote work for all of our employees, who have been working safely and productively from home. We want to assure our Hennessy Funds shareholders that our operations are uninterrupted and functioning normally.
The past six months have been marked by extremes. During the first half of the period from November 2019 through January 2020, the bull market, supported by strong corporate fundamentals, continued to
move higher, and investors appeared focused on record-low unemployment and strong economic growth. In mid-February, the major U.S. market indices hit all-time highs, but then, within just a matter of weeks, lost over one-third of their values as
the COVID-19 pandemic unfolded. Shelter-in-place and business closure orders rippled through the nation, causing initial unemployment claims to skyrocket to their highest number in history. The market then rallied back and posted double-digit
positive returns in April.
For the six months ended April 30, 2020, on a total return basis, the Dow Jones Industrial Average was down 8.9% and the S&P 500® Index was down 3.2%. Small-cap and mid-cap stocks generally fared worse than large-cap stocks during the period, and the Financial sector was particularly hard hit as the Federal Reserve aggressively cut the federal funds rate
in an effort to stabilize the economy. The Energy sector was crushed by both the sudden loss of demand due to COVID-19 and the oversupply caused by the surprise market-share battle between Russia and Saudi Arabia, and the S&P 500® Energy Sector Index ended the six-month period down over 30%.
The COVID-19 pandemic is an unprecedented event, and the duration and full extent of the economic impact is unknown. In the moment, there is always the concern that ‘this time is different.’ But, when
you are able to look at past financial, political, and health crises with the benefit of 20/20 hindsight, history has demonstrated that our economy and financial markets have always rebounded and recovered eventually. If you look back to the last
market downturn in 2008, economic fundamentals were weak compared to the market in 2020, where the overall underpinnings were – and are still – quite strong. Publicly listed companies today have plenty of cash, with over $5 trillion on balance
sheets of the S&P 500® companies alone, and I believe that most will survive and that many may emerge from the current crisis even stronger.
|
HENNESSYFUNDS.COM
|
2
|
LETTER TO SHAREHOLDERS
|
We understand that this market volatility and economic uncertainty is jarring to many investors, and we continue to monitor events and the markets. We remain focused on managing our high-conviction
portfolios for the long-term benefit of our shareholders, and we are confident in the time-tested strategies and rigorous research that led to their formation. We encourage shareholders to maintain a long-term investment horizon and to remain
focused on long-term goals. As always, but especially in these trying times, we are here to support our shareholders, and we thank you for your continued investment and trust. Should you have any questions or would like to speak with us directly,
please don’t hesitate to call (800) 966-4354 or email us at fundsinfo@hennessyfunds.com.
Best regards,
Neil J. Hennessy
President and Chief Investment Officer
Past performance does not guarantee future results.
Mutual fund investing involves risk. Principal loss is possible.
The Dow Jones Industrial Average and S&P 500® Index are commonly used to measure the performance of U.S. stocks. The S&P 500® Energy Sector Index is an index that comprises those companies included in the S&P 500 that are classified as members of the GICS energy sector. One cannot invest
directly in an index.
|
HENNESSY FUNDS
|
1-800-966-4354
|
3
Performance Overview (Unaudited)
AVERAGE ANNUAL TOTAL RETURN FOR PERIODS ENDED APRIL 30, 2020
|
Six
|
One
|
Five
|
Ten
|
|
|
Months(1)
|
Year
|
Years
|
Years
|
|
|
Hennessy Focus Fund –
|
||||
|
Investor Class (HFCSX)
|
-17.53%
|
-10.23%
|
4.01%
|
9.77%
|
|
Hennessy Focus Fund –
|
||||
|
Institutional Class (HFCIX)
|
-17.40%
|
-9.94%
|
4.39%
|
10.12%
|
|
Russell 3000® Index
|
-4.33%
|
-1.04%
|
8.33%
|
11.29%
|
|
Russell Midcap® Growth Index
|
-1.78%
|
0.23%
|
8.88%
|
12.19%
|
Expense ratios: 1.47% (Investor Class); 1.12% (Institutional Class)
|
(1)
|
Periods of less than one year are not annualized.
|
_______________
Performance data quoted represents past performance; past performance does not guarantee future results. The investment return and principal value of an investment will fluctuate so that an investor’s
shares, when redeemed, may be worth more or less than their original cost. The performance table does not reflect the deduction of taxes that a shareholder would pay on Fund distributions or the redemption of Fund shares. Current performance of the
Fund may be lower or higher than the performance quoted. Performance data current to the most recent month end may be obtained by visiting www.hennessyfunds.com. Performance for periods on or prior to October 26, 2012, is that of the FBR Focus
Fund.
The Russell 3000® Index comprises the 3,000 largest U.S. companies based on market capitalization, representing approximately 98% of the
investable U.S. equities market. The Russell Midcap® Growth Index comprises approximately 65% of the total market value of the Russell Midcap® Index and includes companies with higher price-to-book ratios and higher forecasted growth values. One cannot invest directly in an index. These indices are used herein
for comparative purposes in accordance with SEC regulations.
Frank Russell Company (“Russell”) is the source and owner of the trademarks, service marks, and copyrights related to the Russell Indexes. Russell®
is a trademark of Russell. Neither Russell nor its licensors accept any liability for any errors or omissions in the Russell Indexes or Russell ratings or underlying data and no party may rely on any Russell Indexes or Russell ratings or underlying
data contained in this communication. No further distribution of Russell data is permitted without Russell’s express written consent. Russell does not promote, sponsor, or endorse the content of this communication.
The expense ratios presented are from the most recent prospectus. The expense ratios for the current reporting period are available in the Financial Highlights section of this report.
|
HENNESSYFUNDS.COM
|
4
|
PERFORMANCE OVERVIEW/SCHEDULE OF INVESTMENTS
|
Financial Statements
|
Schedule of Investments as of April 30, 2020 (Unaudited)
|
HENNESSY FOCUS FUND
(% of Net Assets)

|
TOP TEN HOLDINGS (EXCLUDING MONEY MARKET FUNDS)
|
% NET ASSETS
|
|
Brookfield Asset Management, Inc., Class A
|
10.32%
|
|
CarMax, Inc.
|
10.19%
|
|
O’Reilly Automotive, Inc.
|
9.85%
|
|
American Tower Corp., Class A
|
9.37%
|
|
Markel Corp.
|
8.67%
|
|
Aon PLC
|
7.92%
|
|
Encore Capital Group, Inc.
|
7.07%
|
|
American Woodmark Corp.
|
6.05%
|
|
NVR, Inc.
|
5.77%
|
|
Ashtead Group PLC
|
5.58%
|
Note: For presentation purposes, the Fund has grouped some of the industry categories. For purposes of categorizing securities for compliance with Section 8(b)(1) of the Investment Company Act of 1940, as amended, the
Fund uses more specific industry classifications.
The Global Industry Classification Standard (GICS®) was developed by and is the exclusive property and a service mark of MSCI, Inc. and
Standard & Poor’s Financial Services LLC. It has been licensed for use by the Hennessy Funds.
|
HENNESSY FUNDS
|
1-800-966-4354
|
5
|
COMMON STOCKS – 89.09%
|
Number
|
% of
|
||||||||||
|
|
of Shares
|
Value
|
Net Assets
|
|||||||||
|
Consumer Discretionary – 27.14%
|
||||||||||||
|
CarMax, Inc. (a)
|
1,559,717
|
$
|
114,873,157
|
10.19
|
%
|
|||||||
|
NVR, Inc. (a)
|
20,984
|
65,050,400
|
5.77
|
%
|
||||||||
|
O’Reilly Automotive, Inc. (a)
|
287,218
|
110,963,802
|
9.85
|
%
|
||||||||
|
Restoration Hardware Holdings, Inc. (a)
|
104,116
|
14,969,799
|
1.33
|
%
|
||||||||
|
|
305,857,158
|
27.14
|
%
|
|||||||||
|
Financials – 38.86%
|
||||||||||||
|
Aon PLC (b)
|
516,581
|
89,198,041
|
7.92
|
%
|
||||||||
|
Brookfield Asset Management, Inc., Class A (b)
|
3,439,047
|
116,308,586
|
10.32
|
%
|
||||||||
|
Encore Capital Group, Inc. (a)(d)
|
3,067,416
|
79,691,468
|
7.07
|
%
|
||||||||
|
Markel Corp. (a)
|
112,831
|
97,693,593
|
8.67
|
%
|
||||||||
|
Marlin Business Services Corp. (d)
|
1,010,273
|
10,749,305
|
0.95
|
%
|
||||||||
|
The Charles Schwab Corp.
|
1,175,168
|
44,327,337
|
3.93
|
%
|
||||||||
|
|
437,968,330
|
38.86
|
%
|
|||||||||
|
Industrials – 17.87%
|
||||||||||||
|
American Woodmark Corp. (a)(d)
|
1,325,021
|
68,119,330
|
6.05
|
%
|
||||||||
|
Ametek, Inc.
|
316,322
|
26,529,926
|
2.35
|
%
|
||||||||
|
Ashtead Group PLC (b)
|
2,293,317
|
62,823,085
|
5.58
|
%
|
||||||||
|
Hexcel Corp.
|
1,134,608
|
39,246,091
|
3.48
|
%
|
||||||||
|
Mistras Group, Inc. (a)
|
971,558
|
4,614,900
|
0.41
|
%
|
||||||||
|
|
201,333,332
|
17.87
|
%
|
|||||||||
|
Information Technology – 5.22%
|
||||||||||||
|
SS&C Technologies Holdings, Inc.
|
1,067,191
|
58,866,255
|
5.22
|
%
|
||||||||
|
|
||||||||||||
|
Total Common Stocks
|
||||||||||||
|
(Cost $595,132,355)
|
1,004,025,075
|
89.09
|
%
|
|||||||||
|
|
||||||||||||
|
REITS – 9.37%
|
||||||||||||
|
Financials – 9.37%
|
||||||||||||
|
American Tower Corp., Class A
|
443,706
|
105,602,028
|
9.37
|
%
|
||||||||
|
|
||||||||||||
|
Total REITS
|
||||||||||||
|
(Cost $871,527)
|
105,602,028
|
9.37
|
%
|
|||||||||
The accompanying notes are an integral part of these financial statements.
|
HENNESSYFUNDS.COM
|
6
|
SCHEDULE OF INVESTMENTS
|
|
SHORT-TERM INVESTMENTS – 1.72%
|
Number
|
% of
|
||||||||||
|
|
of Shares
|
Value
|
Net Assets
|
|||||||||
|
Money Market Funds – 1.72%
|
||||||||||||
|
First American Government Obligations Fund,
|
||||||||||||
|
Institutional Class, 0.25% (c)
|
19,440,273
|
$
|
19,440,273
|
1.72
|
%
|
|||||||
|
|
||||||||||||
|
Total Short-Term Investments
|
||||||||||||
|
(Cost $19,440,273)
|
19,440,273
|
1.72
|
%
|
|||||||||
|
|
||||||||||||
|
Total Investments
|
||||||||||||
|
(Cost $615,444,155) – 100.18%
|
1,129,067,376
|
100.18
|
%
|
|||||||||
|
Liabilities in Excess of Other Assets – (0.18)%
|
(2,058,696
|
)
|
(0.18
|
)%
|
||||||||
|
|
||||||||||||
|
TOTAL NET ASSETS – 100.00%
|
$
|
1,127,008,680
|
100.00
|
%
|
||||||||
Percentages are stated as a percent of net assets.
PLC – Public Limited Company
REIT – Real Estate Investment Trust
|
(a)
|
Non-income-producing security.
|
|
(b)
|
U.S.-traded security of a foreign corporation.
|
|
(c)
|
The rate listed is the fund’s seven-day yield as of April 30, 2020.
|
|
(d)
|
Investment in affiliated security. Investment represents five percent or more of the outstanding voting securities of the issuer, making the issuer an affiliate of the Fund, as defined in the Investment Company
Act of 1940, as amended, for the six months ended April 30, 2020. Details of transactions with affiliated companies for the six months ended April 30, 2020, are as follows:
|
|
Common Stocks
|
|||||||||||||||||
|
American
|
Encore
|
Marlin
|
|||||||||||||||
|
Woodmark
|
Capital
|
Business
|
|||||||||||||||
|
Corp.
|
Group, Inc.
|
Services Corp.
|
Total
|
||||||||||||||
|
Beginning Cost – November 1, 2019
|
$
|
63,553,435
|
$
|
104,853,067
|
$
|
15,865,289
|
$
|
184,271,791
|
|||||||||
|
Purchase Cost
|
$
|
—
|
$
|
—
|
$
|
—
|
$
|
—
|
|||||||||
|
Sales Cost
|
$
|
(2,365,758
|
)
|
$
|
(733,287
|
)
|
$
|
—
|
$
|
(3,099,045
|
)
|
||||||
|
Ending Cost – April 30, 2020
|
$
|
61,187,677
|
$
|
104,119,780
|
$
|
15,865,289
|
$
|
181,172,746
|
|||||||||
|
Dividend Income
|
$
|
—
|
$
|
—
|
$
|
282,876
|
$
|
282,876
|
|||||||||
|
Net Change in Unrealized
|
|||||||||||||||||
|
Appreciation/Depreciation
|
$
|
(63,726,485
|
)
|
$
|
(21,880,632
|
)
|
$
|
(13,234,576
|
)
|
$
|
(98,841,693
|
)
|
|||||
|
Realized Gain/Loss
|
$
|
750,628
|
$
|
(182,630
|
)
|
$
|
—
|
$
|
567,998
|
||||||||
|
Shares
|
1,325,021
|
3,067,416
|
1,010,273
|
5,402,710
|
|||||||||||||
|
Market Value – April 30, 2020
|
$
|
68,119,330
|
$
|
79,691,468
|
$
|
10,749,305
|
$
|
158,560,103
|
|||||||||
The accompanying notes are an integral part of these financial statements.
|
HENNESSY FUNDS
|
1-800-966-4354
|
7
Summary of Fair Value Exposure as of April 30, 2020
The following is a summary of the inputs used to value the Fund’s net assets as of April 30, 2020 (see Note 3 in the accompanying Notes to the Financial Statements):
|
Common Stocks
|
Level 1
|
Level 2
|
Level 3
|
Total
|
||||||||||||
|
Consumer Discretionary
|
$
|
305,857,158
|
$
|
—
|
$
|
—
|
$
|
305,857,158
|
||||||||
|
Financials
|
437,968,330
|
—
|
—
|
437,968,330
|
||||||||||||
|
Industrials
|
201,333,332
|
—
|
—
|
201,333,332
|
||||||||||||
|
Information Technology
|
58,866,255
|
—
|
—
|
58,866,255
|
||||||||||||
|
Total Common Stocks
|
$
|
1,004,025,075
|
$
|
—
|
$
|
—
|
$
|
1,004,025,075
|
||||||||
|
REITS
|
||||||||||||||||
|
Financials
|
$
|
105,602,028
|
$
|
—
|
$
|
—
|
$
|
105,602,028
|
||||||||
|
Total REITS
|
$
|
105,602,028
|
$
|
—
|
$
|
—
|
$
|
105,602,028
|
||||||||
|
Short-Term Investments
|
||||||||||||||||
|
Money Market Funds
|
$
|
19,440,273
|
$
|
—
|
$
|
—
|
$
|
19,440,273
|
||||||||
|
Total Short-Term Investments
|
$
|
19,440,273
|
$
|
—
|
$
|
—
|
$
|
19,440,273
|
||||||||
|
Total Investments
|
$
|
1,129,067,376
|
$
|
—
|
$
|
—
|
$
|
1,129,067,376
|
||||||||
The accompanying notes are an integral part of these financial statements.
|
HENNESSYFUNDS.COM
|
8
|
SCHEDULE OF INVESTMENTS/STATEMENT OF ASSETS AND LIABILITIES
|
Financial Statements
|
Statement of Assets and Liabilities as of April 30, 2020 (Unaudited)
|
|
ASSETS:
|
||||
|
Investments in unaffiliated securities, at value (cost $434,271,409)
|
$
|
970,507,273
|
||
|
Investments in affiliated securities, at value (cost $181,172,746)
|
158,560,103
|
|||
|
Total investments in securities, at value (cost $615,444,155)
|
1,129,067,376
|
|||
|
Dividends and interest receivable
|
230,604
|
|||
|
Receivable for fund shares sold
|
771,727
|
|||
|
Receivable for securities sold
|
1,376,981
|
|||
|
Prepaid expenses and other assets
|
52,645
|
|||
|
Total assets
|
1,131,499,333
|
|||
|
LIABILITIES:
|
||||
|
Payable for fund shares redeemed
|
3,077,192
|
|||
|
Payable to advisor
|
811,578
|
|||
|
Payable to administrator
|
191,372
|
|||
|
Payable to auditor
|
11,373
|
|||
|
Accrued distribution fees
|
110,426
|
|||
|
Accrued service fees
|
58,014
|
|||
|
Accrued expenses and other payables
|
230,698
|
|||
|
Total liabilities
|
4,490,653
|
|||
|
NET ASSETS
|
$
|
1,127,008,680
|
||
|
NET ASSETS CONSISTS OF:
|
||||
|
Capital stock
|
$
|
355,862,305
|
||
|
Total distributable earnings
|
771,146,375
|
|||
|
Total net assets
|
$
|
1,127,008,680
|
||
|
NET ASSETS:
|
||||
|
Investor Class
|
||||
|
Shares authorized (no par value)
|
Unlimited
|
|||
|
Net assets applicable to outstanding shares
|
$
|
717,212,003
|
||
|
Shares issued and outstanding
|
11,308,379
|
|||
|
Net asset value, offering price, and redemption price per share
|
$
|
63.42
|
||
|
Institutional Class
|
||||
|
Shares authorized (no par value)
|
Unlimited
|
|||
|
Net assets applicable to outstanding shares
|
$
|
409,796,677
|
||
|
Shares issued and outstanding
|
6,251,196
|
|||
|
Net asset value, offering price, and redemption price per share
|
$
|
65.55
|
||
The accompanying notes are an integral part of these financial statements.
|
HENNESSY FUNDS
|
1-800-966-4354
|
9
Financial Statements
|
Statement of Operations for the six months ended April 30, 2020 (Unaudited)
|
|
INVESTMENT INCOME:
|
||||
|
Dividend income from unaffiliated securities(1)
|
$
|
4,303,415
|
||
|
Dividend income from affiliated securities
|
282,876
|
|||
|
Interest income
|
216,294
|
|||
|
Total investment income
|
4,802,585
|
|||
|
EXPENSES:
|
||||
|
Investment advisory fees (See Note 5)
|
7,126,066
|
|||
|
Sub-transfer agent expenses – Investor Class (See Note 5)
|
1,093,264
|
|||
|
Sub-transfer agent expenses – Institutional Class (See Note 5)
|
309,559
|
|||
|
Administration, accounting, custody, and transfer agent fees (See Note 5)
|
802,719
|
|||
|
Distribution fees – Investor Class (See Note 5)
|
777,946
|
|||
|
Service fees – Investor Class (See Note 5)
|
518,630
|
|||
|
Reports to shareholders
|
48,453
|
|||
|
Federal and state registration fees
|
36,493
|
|||
|
Trustees’ fees and expenses
|
17,872
|
|||
|
Compliance expense (See Note 5)
|
13,462
|
|||
|
Audit fees
|
11,375
|
|||
|
Legal fees
|
8,964
|
|||
|
Interest expense (See Note 7)
|
4,172
|
|||
|
Other expenses
|
90,112
|
|||
|
Total expenses
|
10,859,087
|
|||
|
NET INVESTMENT LOSS
|
$
|
(6,056,502
|
)
|
|
|
REALIZED AND UNREALIZED GAINS (LOSSES):
|
||||
|
Net realized gain on investments:
|
||||
|
Unaffiliated investments
|
$
|
271,791,120
|
||
|
Affiliated investments
|
567,998
|
|||
|
Net change in unrealized appreciation/depreciation on investments:
|
||||
|
Unaffiliated investments
|
(449,646,491
|
)
|
||
|
Affiliated investments
|
(98,841,693
|
)
|
||
|
Net loss on investments
|
(276,129,066
|
)
|
||
|
NET DECREASE IN NET ASSETS RESULTING FROM OPERATIONS
|
$
|
(282,185,568
|
)
|
|
|
(1)
|
Net of foreign taxes withheld of $152,136.
|
The accompanying notes are an integral part of these financial statements.
|
HENNESSYFUNDS.COM
|
10
|
STATEMENT OF OPERATIONS/STATEMENTS OF CHANGES IN NET ASSETS
|
Financial Statements
|
Statements of Changes in Net Assets
|
|
Six Months Ended
|
||||||||
|
April 30, 2020
|
Year Ended
|
|||||||
|
(Unaudited)
|
October 31, 2019
|
|||||||
|
OPERATIONS:
|
||||||||
|
Net investment loss
|
$
|
(6,056,502
|
)
|
$
|
(10,051,840
|
)
|
||
|
Net realized gain on investments
|
272,359,118
|
247,439,832
|
||||||
|
Net change in unrealized
|
||||||||
|
appreciation/depreciation on investments
|
(548,488,184
|
)
|
152,257,794
|
|||||
|
Net increase (decrease) in net assets
|
||||||||
|
resulting from operations
|
(282,185,568
|
)
|
389,645,786
|
|||||
|
DISTRIBUTIONS TO SHAREHOLDERS:
|
||||||||
|
Distributable earnings – Investor Class
|
(124,333,581
|
)
|
(222,108,992
|
)
|
||||
|
Distributable earnings – Institutional Class
|
(60,331,162
|
)
|
(129,337,592
|
)
|
||||
|
Total distributions
|
(184,664,743
|
)
|
(351,446,584
|
)
|
||||
|
CAPITAL SHARE TRANSACTIONS:
|
||||||||
|
Proceeds from shares subscribed – Investor Class
|
71,800,907
|
68,175,822
|
||||||
|
Proceeds from shares subscribed – Institutional Class
|
74,823,478
|
106,498,153
|
||||||
|
Dividends reinvested – Investor Class
|
122,154,479
|
218,459,005
|
||||||
|
Dividends reinvested – Institutional Class
|
53,173,071
|
112,851,020
|
||||||
|
Cost of shares redeemed – Investor Class
|
(387,949,323
|
)
|
(449,379,880
|
)
|
||||
|
Cost of shares redeemed – Institutional Class
|
(139,590,290
|
)
|
(446,765,359
|
)
|
||||
|
Net decrease in net assets derived
|
||||||||
|
from capital share transactions
|
(205,587,678
|
)
|
(390,161,239
|
)
|
||||
|
TOTAL DECREASE IN NET ASSETS
|
(672,437,989
|
)
|
(351,962,037
|
)
|
||||
|
NET ASSETS:
|
||||||||
|
Beginning of period
|
1,799,446,669
|
2,151,408,706
|
||||||
|
End of period
|
$
|
1,127,008,680
|
$
|
1,799,446,669
|
||||
|
CHANGES IN SHARES OUTSTANDING:
|
||||||||
|
Shares sold – Investor Class
|
888,118
|
874,775
|
||||||
|
Shares sold – Institutional Class
|
967,498
|
1,347,453
|
||||||
|
Shares issued to holders as reinvestment
|
||||||||
|
of dividends – Investor Class
|
1,522,553
|
3,226,392
|
||||||
|
Shares issued to holders as reinvestment
|
||||||||
|
of dividends – Institutional Class
|
642,032
|
1,620,026
|
||||||
|
Shares redeemed – Investor Class
|
(5,356,609
|
)
|
(5,945,263
|
)
|
||||
|
Shares redeemed – Institutional Class
|
(2,033,339
|
)
|
(5,770,900
|
)
|
||||
|
Net decrease in shares outstanding
|
(3,369,747
|
)
|
(4,647,517
|
)
|
||||
The accompanying notes are an integral part of these financial statements.
|
HENNESSY FUNDS
|
1-800-966-4354
|
11
Financial Statements
|
Financial Highlights
|
For an Investor Class share outstanding throughout each period
|
Six Months Ended
|
||||
|
April 30, 2020
|
||||
|
(Unaudited)
|
||||
|
PER SHARE DATA:
|
||||
|
Net asset value, beginning of period
|
$
|
85.11
|
||
|
Income from investment operations:
|
||||
|
Net investment loss
|
(0.34
|
)(1)
|
||
|
Net realized and unrealized gains (losses) on investments
|
(12.79
|
)
|
||
|
Total from investment operations
|
(13.13
|
)
|
||
|
Less distributions:
|
||||
|
Dividends from net investment income
|
—
|
|||
|
Dividends from net realized gains
|
(8.56
|
)
|
||
|
Total distributions
|
(8.56
|
)
|
||
|
Net asset value, end of period
|
$
|
63.42
|
||
|
TOTAL RETURN
|
-17.53
|
%(2)
|
||
|
SUPPLEMENTAL DATA AND RATIOS:
|
||||
|
Net assets, end of period (millions)
|
$
|
717.21
|
||
|
Ratio of expenses to average net assets
|
1.49
|
%(3)
|
||
|
Ratio of net investment loss to average net assets
|
(0.88
|
)%(3)
|
||
|
Portfolio turnover rate(4)
|
2
|
%(2)
|
||
|
(1)
|
Calculated using the average shares outstanding method.
|
|
(2)
|
Not annualized.
|
|
(3)
|
Annualized.
|
|
(4)
|
Calculated on the basis of the Fund as a whole.
|
The accompanying notes are an integral part of these financial statements.
|
HENNESSYFUNDS.COM
|
12
|
FINANCIAL HIGHLIGHTS — INVESTOR CLASS
|
|
Year Ended October 31,
|
||||||||||||||||||
|
2019
|
2018
|
2017
|
2016
|
2015
|
||||||||||||||
|
$
|
83.20
|
$
|
84.92
|
$
|
70.63
|
$
|
71.94
|
$
|
69.46
|
|||||||||
|
(0.52
|
)(1)
|
(0.86
|
)
|
(0.51
|
)
|
(0.45
|
)
|
(0.33
|
)
|
|||||||||
|
16.90
|
(0.85
|
)
|
14.80
|
(0.72
|
)
|
8.07
|
||||||||||||
|
16.38
|
(1.71
|
)
|
14.29
|
(1.17
|
)
|
7.74
|
||||||||||||
|
—
|
—
|
—
|
—
|
(0.02
|
)
|
|||||||||||||
|
(14.47
|
)
|
(0.01
|
)
|
—
|
(0.14
|
)
|
(5.24
|
)
|
||||||||||
|
(14.47
|
)
|
(0.01
|
)
|
—
|
(0.14
|
)
|
(5.26
|
)
|
||||||||||
|
$
|
85.11
|
$
|
83.20
|
$
|
84.92
|
$
|
70.63
|
$
|
71.94
|
|||||||||
|
24.16
|
%
|
-2.02
|
%
|
20.23
|
%
|
-1.63
|
%
|
11.83
|
%
|
|||||||||
|
$
|
1,213.20
|
$
|
1,339.45
|
$
|
1,675.00
|
$
|
1,626.71
|
$
|
1,615.36
|
|||||||||
|
1.47
|
%
|
1.47
|
%
|
1.48
|
%
|
1.47
|
%
|
1.46
|
%
|
|||||||||
|
(0.67
|
)%
|
(0.72
|
)%
|
(0.51
|
)%
|
(0.65
|
)%
|
(0.55
|
)%
|
|||||||||
|
2
|
%
|
13
|
%
|
5
|
%
|
2
|
%
|
4
|
%
|
|||||||||
The accompanying notes are an integral part of these financial statements.
|
HENNESSY FUNDS
|
1-800-966-4354
|
13
Financial Statements
|
Financial Highlights
|
For an Institutional Class share outstanding throughout each period
|
Six Months Ended
|
||||
|
April 30, 2020
|
||||
|
(Unaudited)
|
||||
|
PER SHARE DATA:
|
||||
|
Net asset value, beginning of period
|
$
|
87.83
|
||
|
Income from investment operations:
|
||||
|
Net investment loss
|
(0.21
|
)(1)
|
||
|
Net realized and unrealized gains (losses) on investments
|
(13.23
|
)
|
||
|
Total from investment operations
|
(13.44
|
)
|
||
|
Less distributions:
|
||||
|
Dividends from net investment income
|
—
|
|||
|
Dividends from net realized gains
|
(8.84
|
)
|
||
|
Total distributions
|
(8.84
|
)
|
||
|
Net asset value, end of period
|
$
|
65.55
|
||
|
TOTAL RETURN
|
-17.40
|
%(2)
|
||
|
SUPPLEMENTAL DATA AND RATIOS:
|
||||
|
Net assets, end of period (millions)
|
$
|
409.80
|
||
|
Ratio of expenses to average net assets
|
1.14
|
%(3)
|
||
|
Ratio of net investment loss to average net assets
|
(0.54
|
)%(3)
|
||
|
Portfolio turnover rate(4)
|
2
|
%(2)
|
||
|
(1)
|
Calculated using the average shares outstanding method.
|
|
(2)
|
Not annualized.
|
|
(3)
|
Annualized.
|
|
(4)
|
Calculated on the basis of the Fund as a whole.
|
The accompanying notes are an integral part of these financial statements.
|
HENNESSYFUNDS.COM
|
14
|
FINANCIAL HIGHLIGHTS — INSTITUTIONAL CLASS
|
|
Year Ended October 31,
|
||||||||||||||||||
|
2019
|
2018
|
2017
|
2016
|
2015
|
||||||||||||||
|
$
|
85.66
|
$
|
87.10
|
$
|
72.17
|
$
|
73.24
|
$
|
70.50
|
|||||||||
|
(0.25
|
)(1)
|
(0.28
|
)
|
(0.11
|
)
|
(0.14
|
)
|
(0.08
|
)
|
|||||||||
|
17.41
|
(1.15
|
)
|
15.04
|
(0.79
|
)
|
8.19
|
||||||||||||
|
17.16
|
(1.43
|
)
|
14.93
|
(0.93
|
)
|
8.11
|
||||||||||||
|
—
|
—
|
—
|
—
|
(0.05
|
)
|
|||||||||||||
|
(14.99
|
)
|
(0.01
|
)
|
—
|
(0.14
|
)
|
(5.32
|
)
|
||||||||||
|
(14.99
|
)
|
(0.01
|
)
|
—
|
(0.14
|
)
|
(5.37
|
)
|
||||||||||
|
$
|
87.83
|
$
|
85.66
|
$
|
87.10
|
$
|
72.17
|
$
|
73.24
|
|||||||||
|
24.59
|
%
|
-1.65
|
%
|
20.69
|
%
|
-1.27
|
%
|
12.23
|
%
|
|||||||||
|
$
|
586.25
|
$
|
811.96
|
$
|
1,057.32
|
$
|
765.82
|
$
|
520.06
|
|||||||||
|
1.12
|
%
|
1.09
|
%
|
1.10
|
%
|
1.10
|
%
|
1.11
|
%
|
|||||||||
|
(0.32
|
)%
|
(0.34
|
)%
|
(0.13
|
)%
|
(0.28
|
)%
|
(0.19
|
)%
|
|||||||||
|
2
|
%
|
13
|
%
|
5
|
%
|
2
|
%
|
4
|
%
|
|||||||||
The accompanying notes are an integral part of these financial statements.
|
HENNESSY FUNDS
|
1-800-966-4354
|
15
Financial Statements
|
Notes to the Financial Statements April 30, 2020 (Unaudited)
|
1). ORGANIZATION
The Hennessy Focus Fund (the “Fund”) is a series of Hennessy Funds Trust (the “Trust”), which was organized as a Delaware statutory trust on September 17, 1992. The Fund is an open-end management investment company
registered under the Investment Company Act of 1940, as amended. The investment objective of the Fund is capital appreciation. The Fund is a non-diversified fund.
The Fund offers Investor Class and Institutional Class shares. Each class of shares differs principally in its respective 12b-1 distribution and service, shareholder servicing, and sub-transfer agent
expenses. There are no sales charges. Each class has identical rights to earnings, assets, and voting privileges, except for class-specific expenses and exclusive rights to vote on matters affecting only one class.
As an investment company, the Fund follows the investment company accounting and reporting guidance of the Financial Accounting Standards Board (“FASB”) Accounting Standard Codification Topic 946
“Financial Services—Investment Companies.”
2). SIGNIFICANT ACCOUNTING POLICIES
The following is a summary of significant accounting policies consistently followed by the Fund in the preparation of the financial statements. These policies conform to U.S. generally accepted accounting principles
(“GAAP”).
|
a).
|
Securities Valuation – All investments in securities are recorded at their estimated fair value, as described in Note 3.
|
|
b).
|
Federal Income Taxes –No provision for federal income taxes or excise taxes has been made because the Fund has elected to be taxed as a regulated investment company and intends to distribute substantially all of
its taxable income to its shareholders and otherwise comply with the provisions of the Internal Revenue Code of 1986, as amended, applicable to regulated investment companies. Net investment income/loss and realized gains/losses for federal
income tax purposes may differ from those reported in the financial statements because of temporary book and tax basis differences. Temporary differences are primarily the result of the treatment of wash sales for tax reporting purposes.
The Fund recognizes interest and penalties related to income tax benefits, if any, in the Statement of Operations as an income tax expense. Distributions from net realized gains for book purposes may include short-term capital gains, which
are included as ordinary income to shareholders for tax purposes. The Fund may utilize equalization accounting for tax purposes and designate earnings and profits, including net realized gains distributed to shareholders on redemption of
shares, as part of the dividends paid deduction for income tax purposes.
|
|
c).
|
Accounting for Uncertainty in Income Taxes – The Fund has accounting policies regarding recognition and measurement of tax positions taken or expected to be taken on a tax return. The tax returns of the Fund for
the prior three fiscal years are open for examination. The Fund has reviewed all open tax years in major jurisdictions and concluded that there is no impact on the Fund’s net assets and no tax liability resulting from unrecognized tax
benefits relating to uncertain income tax positions taken or expected to be taken on a tax return. The Fund’s major tax jurisdictions are U.S. federal and Delaware.
|
|
HENNESSYFUNDS.COM
|
16
|
NOTES TO THE FINANCIAL STATEMENTS
|
|
d).
|
Income and Expenses – Dividend income is recognized on the ex-dividend date or as soon as information is available to the Fund. Interest income, which includes the amortization of premium and accretion of
discount, is recognized on an accrual basis. Other non-cash dividends are recognized as investment income at the fair value of the property received. The Fund is charged for those expenses that are directly attributable to its portfolio,
such as advisory, administration, and certain shareholder service fees. Income, expenses (other than expenses attributable to a specific class), and realized and unrealized gains/losses on investments are allocated to each class of shares
based on such class’s net assets.
|
|
e).
|
Distributions to Shareholders – Dividends from net investment income for the Fund, if any, are declared and paid annually, usually in December. Distributions of net realized capital gains, if any, are declared and
paid annually, usually in December.
|
|
f).
|
Security Transactions – Investment and shareholder transactions are recorded on the trade date. The Fund determines the realized gain/loss from an investment transaction by comparing the original cost of the
security lot sold with the net sale proceeds. Discounts and premiums on securities purchased are accreted or amortized, respectively, over the life of each such security.
|
|
g).
|
Use of Estimates – The preparation of financial statements in conformity with GAAP requires management to make estimates and assumptions that affect the reported amounts of assets and liabilities and disclosure of
contingent assets and liabilities at the date of the financial statements and the reported change in net assets during the reporting period. Actual results could differ from those estimates.
|
|
h).
|
Share Valuation – The net asset value (“NAV”) per share of the Fund is calculated by dividing (i) the total value of the securities held by the Fund, plus cash and other assets, minus all liabilities (including
estimated accrued expenses) by (ii) the total number of shares outstanding for the Fund, rounded to the nearest $0.01. The Fund’s shares will not be priced on days the New York Stock Exchange is closed for trading. The offering and
redemption price per share for the Fund is equal to the Fund’s NAV per share.
|
|
i).
|
Foreign Currency – Values of investments denominated in foreign currencies are converted into U.S. dollars using the spot market rate of exchange at the time of valuation. Purchases and sales of investments and
income are translated into U.S. dollars using the spot market rate of exchange prevailing on the respective dates of such transactions. The Fund does not isolate the portion of the results of operations resulting from fluctuations in
foreign exchange rates on investments from fluctuations resulting from changes in the market prices of securities held. Such fluctuations are included with the net realized and unrealized gain/loss on investments. Foreign investments
present additional risks due to currency fluctuations, economic and political factors, lower liquidity, government regulations, differences in accounting standards, and other factors.
|
|
j).
|
REIT Equity Securities – The Fund may invest in the equity securities of real estate investment trusts (“REITs”). Distributions received from REITs may be classified as dividends, capital gains, or return of
capital. Investments in REITs may require the Fund to accrue and distribute income not yet received. To generate sufficient cash to make the requisite distributions, the Fund may be required to sell securities in its portfolio (including
when it is not advantageous to do so) that it otherwise would have continued to hold. At other times, investments in a REIT may result in the Fund’s receipt of cash in excess of the REIT’s earnings. If the Fund distributes these amounts,
these distributions could constitute a return of capital to Fund
|
|
HENNESSY FUNDS
|
1-800-966-4354
|
17
|
shareholders for U.S. federal income tax purposes. Dividends received by the Fund from a REIT generally will not constitute qualified dividend income and will not qualify for the dividends-received deduction.
|
3). SECURITIES VALUATION
The Fund follows fair value accounting standards that establish an authoritative definition of fair value and set out a hierarchy for measuring fair value. These standards require additional disclosures about the various
inputs and valuation techniques used to develop the measurements of fair value and a discussion of changes in valuation techniques and related inputs during the period. These inputs are summarized in the three broad levels listed below:
|
Level 1 –
|
Unadjusted, quoted prices in active markets for identical instruments that the Fund has the ability to access at the date of measurement.
|
|
|
Level 2 –
|
Other significant observable inputs (including, but not limited to, quoted prices in active markets for similar instruments, quoted prices in markets that are not active for identical or similar instruments, and
model-derived valuations in which all significant inputs and significant value drivers are observable in active markets, such as interest rates, prepayment speeds, credit risk curves, default rates, and similar data).
|
|
|
Level 3 –
|
Significant unobservable inputs (including the Fund’s own assumptions about what market participants would use to price the asset or liability based on the best available information) when observable inputs are
unavailable.
|
The following is a description of the valuation techniques applied to the Fund’s major categories of assets and liabilities measured at fair value on a recurring basis:
|
Equity Securities – Equity securities, including common stocks, preferred stocks, foreign-issued common stocks, exchange-traded funds, closed-end mutual funds,
partnerships, rights, and real estate investment trusts, that are traded on a securities exchange for which a last-quoted sales price is readily available will generally be valued at the last sales price as reported by the primary exchange
on which the securities are listed. Securities listed on The NASDAQ Stock Market (“NASDAQ”) will generally be valued at the NASDAQ Official Closing Price, which may differ from the last sales price reported. Securities traded on a
securities exchange for which a last-quoted sales price is not readily available will generally be valued at the mean between the bid and ask prices. To the extent these securities are actively traded and valuation adjustments are not
applied, they are classified in Level 1 of the fair value hierarchy. Securities traded on foreign exchanges generally are not valued at the same time the Fund calculates its NAV because most foreign markets close well before such time. The
earlier close of most foreign markets gives rise to the possibility that significant events, including broad market moves, may have occurred in the interim. In certain circumstances, it may be determined that a foreign security needs to be
fair valued because it appears that the value of the security might have been materially affected by events occurring after the close of the market in which the security is principally traded, but before the time the Fund calculates its
NAV, such as by a development that affects an entire market or region (e.g., a weather-related event) or a potentially global development (e.g., a terrorist attack that may be expected to have an effect on investor expectations worldwide).
|
|
|
Registered Investment Companies – Investments in open-end registered investment companies, commonly referred to as mutual funds, generally are priced at the ending NAV
provided by the applicable mutual fund’s service agent and will be classified in Level 1 of the fair value hierarchy.
|
|
HENNESSYFUNDS.COM
|
18
|
NOTES TO THE FINANCIAL STATEMENTS
|
|
Debt Securities – Debt securities, including corporate bonds, asset-backed securities, mortgage-backed securities, municipal bonds, U.S. Treasuries, and U.S. government
agency issues, are generally valued at market on the basis of valuations furnished by an independent pricing service that utilizes both dealer-supplied valuations and formula-based techniques. The pricing service may consider recently
executed transactions in securities of the issuer or comparable issuers, market price quotations (where observable), bond spreads, and fundamental data relating to the issuer. In addition, the model may incorporate observable market data,
such as reported sales of similar securities, broker quotes, yields, bids, offers, and reference data. Certain securities are valued primarily using dealer quotations. These securities are generally classified in Level 2 of the fair value
hierarchy.
|
|
|
Short-Term Securities – Short-term equity investments, including money market funds, are valued in the manner specified above. Short-term debt investments with an original
term to maturity of 60 days or less are valued at amortized cost, which approximates fair market value. If the original term to maturity of a short-term debt investment exceeded 60 days, then the values as of the 61st day prior to maturity
are amortized. Amortized cost is not used if its use would be inappropriate due to credit or other impairments of the issuer, in which case the security’s fair value would be determined, as described below. Short-term securities are
generally classified in Level 1 or Level 2 of the fair value hierarchy depending on the inputs used and market activity levels for specific securities.
|
The Board of Trustees of the Fund (the “Board”) has adopted fair value pricing procedures that are followed when a price for a security is not readily available or if a significant event has occurred
that indicates the closing price of a security no longer represents the true value of that security. Fair value pricing determinations are made in good faith in accordance with these procedures. There are numerous criteria that will be given
consideration in determining a fair value of a security, such as the trading volume of a security and markets, the values of other similar securities, and news events with direct bearing on a security or markets. Fair value pricing results in an
estimated price for a security that reflects the amount the Fund might reasonably expect to receive in a current sale. Depending on the relative significance of the valuation inputs, these securities may be classified in either Level 2 or Level 3
of the fair value hierarchy.
The fair value of foreign securities may be determined with the assistance of a pricing service using correlations between the movement of prices of such securities and indices of domestic securities
and other appropriate indicators, such as closing market prices of relevant American Depositary Receipts or futures contracts. Using fair value pricing means that the Fund’s NAV reflects the affected portfolio securities’ values as determined by
the Board or its designee, pursuant to the fair value pricing procedures adopted by the Board, instead of being determined by the market. Using a fair value pricing methodology to price a foreign security may result in a value that is different
from such foreign security’s most recent closing price and from the value used by other investment companies to calculate their NAVs. Such securities are generally classified in Level 2 of the fair value hierarchy. Because the Fund may invest in
foreign securities, the value of the Fund’s portfolio securities may change on days when you will not be able to purchase or redeem your shares.
The Board has delegated day-to-day valuation matters to the Valuation and Liquidity Committee comprising representatives from Hennessy Advisors, Inc., the Fund’s investment advisor (the “Advisor”). The
function of the Valuation and Liquidity Committee is to value securities where current and reliable market quotations are not readily available. All actions taken by the Valuation and Liquidity Committee are reviewed by the Board.
|
HENNESSY FUNDS
|
1-800-966-4354
|
19
The Fund has performed an analysis of all existing investments to determine the significance and character of all inputs to their fair value determinations. Various inputs are used to determine the
value of the Fund’s investments. The inputs or methodology used for valuing securities are not necessarily an indication of the risk associated with investing in those securities. Details related to the fair value hierarchy of the Fund’s securities
as of April 30, 2020, are included in the Schedule of Investments.
4). INVESTMENT TRANSACTIONS
Purchases and sales of investment securities (excluding government and short-term investments) for the Fund during the six months ended April 30, 2020, were $25,433,487 and $409,676,325, respectively.
There were no purchases or sales/maturities of long-term U.S. government securities for the Fund during the six months ended April 30, 2020.
The Fund is permitted to purchase or sell securities from or to another fund in the Hennessy Funds family of funds (collectively, the “Hennessy Funds”) under specified conditions outlined in procedures
adopted by the Board. The procedures have been designed to ensure that any purchase or sale of securities by the Fund from or to another Hennessy Fund complies with Rule 17a-7 of the Investment Company Act of 1940, as amended. During the six months
ended April 30, 2020, the Fund did not engage in purchases or sales of securities pursuant to Rule 17a-7 of the Investment Company Act of 1940, as amended.
5). INVESTMENT ADVISORY FEE AND OTHER TRANSACTIONS WITH AFFILIATES
The Advisor provides the Fund with investment advisory services under an Investment Advisory Agreement. The Advisor oversees the provision of investment advice and furnishes office space, facilities, and most of the
personnel needed by the Fund. As compensation for its services, the Advisor is entitled to a monthly fee from the Fund. The fee is based on the average daily net assets of the Fund at an annual rate of 0.90%. The net investment advisory fees
expensed by the Fund during the six months ended April 30, 2020, are included in the Statement of Operations.
The Advisor has delegated the day-to-day management of the Fund to a sub-advisor, Broad Run Investment Management, LLC. The Advisor pays the sub-advisory fees from its own assets, and these fees are not
an additional expense of the Fund. During the six months ended April 30, 2020, the Advisor (not the Fund) paid a sub-advisory fee at the rate of 0.29% of the daily net assets of the Fund.
The Board has approved a Shareholder Servicing Agreement for Investor Class shares of the Fund, which was instituted to compensate the Advisor for the non-investment advisory services it provides to the
Fund. The Shareholder Servicing Agreement provides for a monthly fee paid to the Advisor at an annual rate of 0.10% of the average daily net assets of the Fund attributable to Investor Class shares. The shareholder service fees expensed by the Fund
during the six months ended April 30, 2020, are included in the Statement of Operations.
The Fund has adopted a plan pursuant to Rule 12b-1 under the Investment Company Act of 1940, as amended, that authorizes payments in connection with the distribution of the Fund’s shares at an annual
rate of up to 0.25% of the Fund’s average daily net assets attributable to Investor Class shares. Even though the authorized rate is up to 0.25%, the Fund is currently only using up to 0.15% of its average daily net assets attributable to Investor
Class shares for such purpose. Amounts paid under the plan may be spent on any activities or expenses primarily intended to result in the sale of shares, including, but not limited to, advertising, shareholder account servicing, printing and
|
HENNESSYFUNDS.COM
|
20
|
NOTES TO THE FINANCIAL STATEMENTS
|
mailing of prospectuses to other than current shareholders, printing and mailing of sales literature, and compensation for sales and marketing activities or to financial institutions and others, such as dealers and
distributors. The distribution fees expensed by the Fund during the six months ended April 30, 2020, are included in the Statement of Operations.
The Fund has entered into agreements with various brokers, dealers, and financial intermediaries in connection with the sale of shares of the Fund. The agreements provide for periodic payments of
sub-transfer agent expenses by the Fund to the brokers, dealers, and financial intermediaries for providing certain shareholder maintenance services. These shareholder services include the pre-processing and quality control of new accounts,
shareholder correspondence, answering customer inquiries regarding account status, and facilitating shareholder telephone transactions. The sub-transfer agent fees expensed by the Fund during the six months ended April 30, 2020, are included in the
Statement of Operations.
U.S. Bancorp Fund Services, LLC, d/b/a U.S. Bank Global Fund Services (“Fund Services”) provides the Fund with administrative, accounting, and transfer agent services. As administrator, Fund Services is
responsible for activities such as (i) preparing various federal and state regulatory filings, reports, and returns for the Fund, (ii) preparing reports and materials to be supplied to the Board, (iii) monitoring the activities of the Fund’s
custodian, transfer agent, and accountants, and (iv) coordinating the preparation and payment of the Fund’s expenses and reviewing the Fund’s expense accruals. U.S. Bank N.A., an affiliate of Fund Services, serves as the Fund’s custodian. The
servicing agreements between the Trust and Fund Services and U.S. Bank N.A. contain a fee schedule that is inclusive of administrative, accounting, custody, and transfer agent fees. The administrative, accounting, custody, and transfer agent fees
expensed by the Fund during the six months ended April 30, 2020, are included in the Statement of Operations.
Quasar Distributors, LLC (“Quasar”) acts as the Fund’s principal underwriter in a continuous public offering of the Fund’s shares. Quasar was an affiliate of Fund Services and U.S. Bank N.A. through
March 30, 2020. Effective March 31, 2020, Foreside Financial Group, LLC (“Foreside”) acquired Quasar from Fund Services. As a result of the acquisition, Quasar became a wholly owned broker-dealer subsidiary of Foreside and is no longer affiliated
with Fund Services or U.S. Bank N.A. The Board approved a new Distribution Agreement to enable Quasar to continue serving as the Fund’s distributor.
The officers of the Fund are affiliated with the Advisor. With the exception of the Chief Compliance Officer and the Senior Compliance Officer, such officers receive no compensation from the Fund for
serving in their respective roles. The Fund, along with the other Hennessy Funds, makes reimbursement payments on an equal basis to the Advisor for a portion of the salary and benefits associated with the office of the Chief Compliance Officer and
for all of the salary and benefits associated with the office of the Senior Compliance Officer. The compliance fees expensed by the Fund during the six months ended April 30, 2020, are included in the Statement of Operations.
6). GUARANTEES AND INDEMNIFICATIONS
Under the Hennessy Funds’ organizational documents, their officers and trustees are indemnified by the Hennessy Funds against certain liabilities arising out of the performance of their duties to the Hennessy Funds.
Additionally, in the normal course of business, the Hennessy Funds enter into contracts with service providers that contain general indemnification clauses. The Fund’s maximum exposure under these arrangements is unknown as this would involve
future claims that may be made against the Fund that have not yet occurred. Currently, the Fund expects the risk of loss to be remote.
|
HENNESSY FUNDS
|
1-800-966-4354
|
21
7). LINE OF CREDIT
The Fund has an uncommitted line of credit with the other Hennessy Funds in the amount of the lesser of (i) $100,000,000 or (ii) 33.33% of each Hennessy Fund’s net assets, or 30% for the Hennessy Gas Utility Fund and 10%
for the Hennessy Balanced Fund, intended to provide short-term financing, if necessary, subject to certain restrictions, in connection with shareholder redemptions. The credit facility is with the Hennessy Funds’ custodian bank, U.S. Bank N.A.
Borrowings under this arrangement bear interest at the bank’s prime rate and are secured by all of the Fund’s assets (as to its own borrowings only). During the six months ended April 30, 2020, the Fund had an outstanding average daily balance and
a weighted average interest rate of $206,209 and 4.00%, respectively. The interest expensed by the Fund during the six months ended April 30, 2020, is included in the Statement of Operations. The maximum amount outstanding for the Fund during the
period was $10,356,000. As of April 30, 2020, the Fund did not have any borrowings outstanding under the line of credit.
8). FEDERAL TAX INFORMATION
As of October 31, 2019, the Fund’s most recent fiscal year end, the components of accumulated earnings (losses) for income tax purposes were as follows:
|
Investments
|
|||||
|
Cost of investments for tax purposes
|
$
|
736,862,699
|
|||
|
Gross tax unrealized appreciation
|
$
|
1,085,596,555
|
|||
|
Gross tax unrealized depreciation
|
(23,485,150
|
)
|
|||
|
Net tax unrealized appreciation/(depreciation)
|
$
|
1,062,111,405
|
|||
|
Undistributed ordinary income
|
$
|
—
|
|||
|
Undistributed long-term capital gains
|
184,664,689
|
||||
|
Total distributable earnings
|
$
|
184,664,689
|
|||
|
Other accumulated gain/(loss)
|
$
|
(8,779,408
|
)
|
||
|
Total accumulated gain/(loss)
|
$
|
1,237,996,686
|
|||
As of October 31, 2019, the Fund had no tax basis capital losses to offset future capital gains.
As of October 31, 2019, the Fund deferred, on a tax basis, a late-year ordinary loss of $8,779,408. Late-year ordinary losses are net ordinary losses incurred after December 31, 2018, but within the
taxable year, that are deemed to arise on the first day of the Fund’s next taxable year.
During fiscal year 2020 (year to date) and fiscal year 2019, the tax character of distributions paid by the Fund was as follows:
|
Six Months Ended
|
Year Ended
|
||||||||
|
April 30, 2020
|
October 31, 2019
|
||||||||
|
Ordinary income(1)
|
$
|
—
|
$
|
—
|
|||||
|
Long-term capital gain
|
184,664,743
|
351,446,584
|
|||||||
|
$
|
184,664,743
|
$
|
351,446,584
|
||||||
|
(1) Ordinary income includes short-term capital gain.
|
9). EVENTS SUBSEQUENT TO PERIOD END
Management has evaluated the Fund’s related events and transactions that occurred subsequent to April 30, 2020, through the date of issuance of the Fund’s financial statements. Management has determined that there were no
subsequent events requiring recognition or disclosure in the financial statements.
|
HENNESSYFUNDS.COM
|
22
|
NOTES TO THE FINANCIAL STATEMENTS
|
(This Page Intentionally Left Blank.)
|
HENNESSY FUNDS
|
1-800-966-4354
|
23
Expense Example (Unaudited)
April 30, 2020
As a shareholder of the Fund, you incur ongoing costs, including management fees, service fees, and other Fund expenses. This Example is intended to help you understand your ongoing costs (in dollars) of investing in the
Fund and to compare these costs with the ongoing costs of investing in other mutual funds. The Example is based on an investment of $1,000 invested at the beginning of the period and held for the entire period from November 1, 2019, through April
30, 2020.
Actual Expenses
The first line of the table below under the “Investor Class” and “Institutional Class” headings provides information about actual account values and actual expenses. Although the Fund charges no sales loads or transaction
fees, you will be assessed fees for outgoing wire transfers, returned checks and stop payment orders at prevailing rates charged by U.S. Bank Global Fund Services, the Fund’s transfer agent. If you request that a redemption be made by wire
transfer, currently a $15 fee is charged by the Fund’s transfer agent. IRA accounts will be charged a $15 annual maintenance fee. The example below includes, but is not limited to, management fees, shareholder servicing fees, accounting, custody,
and transfer agent fees. However, the example below does not include portfolio trading commissions and related expenses. You may use the information in this line, together with the amount you invested, to estimate the expenses that you paid over
the period. Simply divide your account value by $1,000 (for example, an $8,600 account value divided by $1,000 = 8.6), then multiply the result by the number in the first line of the table under the “Investor Class” or “Institutional Class”
headings in the column entitled “Expenses Paid During Period” to estimate the expenses you paid on your account during this period.
Hypothetical Example for Comparison Purposes
The second line of the table below under the “Investor Class” and “Institutional Class” headings provides information about hypothetical account values and hypothetical expenses based on the Fund’s actual expense ratios
and an assumed rate of return of 5% per year before expenses, which is not the Fund’s actual return. The hypothetical account values and expenses may not be used to estimate the actual ending account balance or expenses you paid for the period. You
may use this information to compare the ongoing costs of investing in the Fund and other funds. To do so, compare this 5% hypothetical example with the 5% hypothetical examples that appear in the shareholder reports of the other funds. Please note
that the expenses shown in the table are meant to highlight your ongoing costs only. Therefore, the second line of the table under the “Investor Class” and “Institutional Class” headings is useful in comparing ongoing costs only and will not help
you determine the relative total costs of owning different funds.
|
HENNESSYFUNDS.COM
|
24
|
EXPENSE EXAMPLE
|
|
Beginning
|
Ending
|
||
|
Account Value
|
Account Value
|
Expenses Paid
|
|
|
November 1, 2019
|
April 30, 2020
|
During Period(1)
|
|
|
Investor Class
|
|||
|
Actual
|
$1,000.00
|
$ 824.70
|
$6.76
|
|
Hypothetical (5% return before expenses)
|
$1,000.00
|
$1,017.45
|
$7.47
|
|
Institutional Class
|
|||
|
Actual
|
$1,000.00
|
$ 826.00
|
$5.18
|
|
Hypothetical (5% return before expenses)
|
$1,000.00
|
$1,019.19
|
$5.72
|
|
(1)
|
Expenses are equal to the Fund’s annualized expense ratio of 1.49% for Investor Class shares or 1.14% for Institutional Class shares, as applicable, multiplied by the average account value over the period,
multiplied by 182/366 days (to reflect the half-year period).
|
|
HENNESSY FUNDS
|
1-800-966-4354
|
25
How to Obtain a Copy of the Fund’s Proxy
Voting Policy and Proxy Voting Records
A description of the policies and procedures the Fund uses to determine how to vote proxies relating to portfolio securities is available without charge (1) by calling 1-800-966-4354, (2) on the Hennessy Funds’ website at
www.hennessyfunds.com/proxy-voting/voting-policy, or (3) on the U.S. Securities and Exchange Commission’s (the “SEC”) website at www.sec.gov. The Fund’s proxy voting record is available without charge on both the Hennessy Funds’ website at
www.hennessyfunds.com/proxy-voting/voting-record and the SEC’s website at www.sec.gov no later than August 31 for the prior 12 months ending June 30.
Availability of Quarterly Portfolio Schedule
The Fund files a complete schedule of portfolio holdings with the SEC for the first and third quarters of each fiscal year as an exhibit to its reports on Form N-PORT. The Fund’s Forms N-PORT are available on the SEC’s
website at www.sec.gov or on request by calling 1-800-966-4354.
Federal Tax Distribution Information (Unaudited)
For fiscal year 2019, certain dividends paid by the Fund may be subject to a maximum tax rate of 23.8%, as provided for by the Jobs and Growth Tax Relief Reconciliation Act of 2003. The percentage of dividends declared
from ordinary income designated as qualified dividend income was 0.00%.
For corporate shareholders, the percent of ordinary income distributions that qualified for the corporate dividends received deduction for fiscal year 2019 was 0.00%.
The percentage of taxable ordinary income distributions that were designated as short-term capital gain distributions under Section 871(k)(2)(C) of the Internal Revenue Code of 1986, as amended, for the
Fund was 0.00%.
Important Notice Regarding Delivery
of Shareholder Documents
To help keep the Fund’s costs as low as possible, we generally deliver a single copy of shareholder reports, proxy statements, and prospectuses to shareholders who share an address and have the same last name. This
process does not apply to account statements. You may request an individual copy of a shareholder document at any time. If you would like to receive separate mailings of shareholder documents, please call U.S. Bank Global Fund Services at
1-800-261-6950 or 1-414-765-4124, and individual delivery will begin within 30 days of your request. If your account is held through a financial institution or other intermediary, please contact such intermediary directly to request individual
delivery.
Electronic Delivery
The Funds offer shareholders the option to receive account statements, prospectuses, tax forms, and shareholder reports online. To sign up for eDelivery, please visit www.hennessyfunds.com/account. You may change your
delivery preference at any time by visiting our website or calling U.S. Bank Global Fund Services at 1-800-261-6950 or 1-414-765-4124.
|
HENNESSYFUNDS.COM
|
26
|
PROXY VOTING — BOARD APPROVAL OF INVESTMENT ADVISORY AGREEMENTS
|
Board Approval of Investment Advisory
Agreements
At its meeting on March 12, 2020, the Board of Trustees of the Fund (the “Board,” and the members thereof, the “Trustees”) unanimously approved the continuation of the investment advisory agreement of the Fund with
Hennessy Advisors, Inc. (the “Advisor”) and the sub-advisory agreement for the Fund between the Advisor and Broad Run Investment Management, LLC (the “Sub-Advisor”). As part of the process of approving the continuation of the advisory and
sub-advisory agreements, the Trustees reviewed their fiduciary duties and the relevant factors for them to consider with respect to approving the advisory and sub-advisory agreements. In addition, the Trustees who are not deemed “interested
persons” (as defined by the Investment Company Act of 1940, as amended) of the Fund (the “Independent Trustees”) met in executive session to discuss the approval of the advisory and sub-advisory agreements.
In advance of the meeting, the Advisor sent detailed information to the Trustees to assist them in their evaluation of the advisory and sub-advisory agreements. This information included, but was not
limited to, the following:
|
(1)
|
A memorandum from outside legal counsel that described the fiduciary duties of the Board with respect to approving the continuation of the advisory and sub-advisory agreements and the relevant factors for
consideration;
|
|
|
(2)
|
A memorandum from the Advisor that listed the factors relevant to the Board’s approval of the continuation of the advisory and sub-advisory agreements and also referenced the documents that had been provided to
help the Board assess each such factor;
|
|
|
(3)
|
An inventory of the services provided by the Advisor and the Sub-Advisor and the distinction between the Advisor-provided services and the Sub-Advisor-provided services;
|
|
|
(4)
|
A written discussion of economies of scale;
|
|
|
(5)
|
Summaries of the key terms of the advisory and sub-advisory agreements;
|
|
|
(6)
|
A recent Fund fact sheet, which included performance information over various periods;
|
|
|
(7)
|
A peer expense comparison of the net expense ratio and investment advisory fee of the Fund;
|
|
|
(8)
|
The Advisor’s financial statements from its most recent Form 10-K and Form 10-Q;
|
|
|
(9)
|
A completed questionnaire from the Sub-Advisor;
|
|
|
(10)
|
A summary of the Sub-Advisor’s questionnaire and relevant information from the Sub-Advisor’s Form ADV Parts I and II;
|
|
|
(11)
|
The Sub-Advisor’s Code of Ethics; and
|
|
|
(12)
|
Financial information of the Sub-Advisor.
|
All of the factors discussed were considered as a whole by the Trustees and by the Independent Trustees meeting in executive session. The factors were viewed in their totality by the Trustees, with no
single factor being the principal or determinative factor in the Trustees’ determination of whether to approve the continuation of the advisory and sub-advisory agreements. The Trustees recognized that the management and fee
|
HENNESSY FUNDS
|
1-800-966-4354
|
27
arrangements for the Fund are the result of years of review and discussion between the Independent Trustees and the Advisor, that certain aspects of such arrangements may receive greater scrutiny in some years than in
others, and that the Trustees’ conclusions may be based, in part, on their consideration of these same arrangements and information received during the course of the year and in prior years.
Prior to approving the continuation of the advisory and sub-advisory agreements, the Trustees, including the Independent Trustees in executive session, considered, among other items:
|
(1)
|
The nature and quality of the advisory services provided by the Advisor and the Sub-Advisor;
|
|
|
(2)
|
A comparison of the fees and expenses of the Fund to other similar funds;
|
|
|
(3)
|
Whether economies of scale are recognized by the Fund;
|
|
|
(4)
|
The costs and profitability of the Fund to the Advisor and the Sub-Advisor;
|
|
|
(5)
|
The performance of the Fund; and
|
|
|
(6)
|
Any benefits to the Advisor and the Sub-Advisor from serving as an investment advisor to the Fund (other than the advisory and sub-advisory fees).
|
The material considerations and determinations of the Trustees, including the Independent Trustees, were as follows:
|
(1)
|
The Trustees considered the services identified below that are provided by the Advisor. Based on this review, the Trustees concluded that the Advisor provides high-quality services to the Fund and noted that their
overall confidence in the Advisor was high. The Trustees also concluded that they were satisfied with the nature, extent, and quality of the advisory services provided to the Fund by the Advisor and that the nature and extent of the
services provided by the Advisor were appropriate to assure that the Fund’s operations are conducted in compliance with applicable laws, rules, and regulations.
|
|
(a)
|
The Advisor oversees the Sub-Advisor for the Fund, and the Sub-Advisor acts as the portfolio manager for the Fund.
|
||
|
(b)
|
The Advisor performs a daily reconciliation of portfolio positions and cash for the Fund.
|
||
|
(c)
|
The Advisor monitors the liquidity of each Fund.
|
||
|
(d)
|
The Advisor monitors the Fund’s compliance with its investment objectives and restrictions.
|
||
|
(e)
|
The Advisor monitors compliance with federal securities laws, maintains a compliance program (including a code of ethics), conducts ongoing reviews of the compliance programs of the Sub-Advisor and the Fund’s
other service providers, as feasible, conducts on-site visits to the Sub-Advisor and the Fund’s other service providers, monitors incidents of abusive trading practices, reviews Fund expense accruals, payments, and fixed expense ratios,
evaluates insurance providers for fidelity bond, D&O/E&O insurance, and cybersecurity insurance coverage, manages regulatory examination compliance and responses, conducts employee compliance training, reviews reports provided by
service providers, and maintains books and records.
|
|
HENNESSYFUNDS.COM
|
28
|
BOARD APPROVAL OF INVESTMENT ADVISORY AGREEMENTS
|
|
(f)
|
The Advisor oversees the selection and continued employment of the Sub-Advisor, reviews the Fund’s investment performance, and monitors the Sub-Advisor’s adherence to the Fund’s investment objectives, policies,
and restrictions.
|
||
|
(g)
|
The Advisor oversees service providers that provide accounting, administration, distribution, transfer agency, custodial, sales, marketing, public relations, audit, information technology, and legal services to
the Fund.
|
||
|
(h)
|
The Advisor maintains in-house marketing and distribution departments on behalf of the Fund.
|
||
|
(i)
|
The Advisor is actively involved with preparing regulatory filings for the Fund, including writing and annually updating the Fund’s prospectus and related documents.
|
||
|
(j)
|
For each annual report of the Fund, the Advisor reviews the written summary prepared by the Sub-Advisor of the Fund’s performance during the most recent 12-month period.
|
||
|
(k)
|
The Advisor oversees distribution of the Fund through third-party broker/dealers and independent financial institutions such as Charles Schwab, Inc., Fidelity, TD Ameritrade, and Pershing. The Advisor participates
in “no transaction fee” (“NTF”) programs with these companies on behalf of the Fund, which allow customers to purchase the Fund through third-party distribution channels without paying a transaction fee. The Advisor compensates, in part, a
number of these third-party providers of NTF programs out of its own revenues.
|
||
|
(l)
|
The Advisor pays the incentive compensation of the Fund’s compliance officers and employs other staff, such as legal, marketing, national accounts, distribution, sales, administrative, and trading oversight
personnel, as well as management executives.
|
||
|
(m)
|
The Advisor provides a quarterly compliance certification to the Board.
|
||
|
(n)
|
The Advisor prepares or reviews all Board materials, frequently presents to the Board and leads Board discussions, prepares or reviews all meeting minutes, and arranges for Board training and education.
|
|
(2)
|
The Trustees considered the services identified below that are provided by the Sub-Advisor:
|
|
(a)
|
The Sub-Advisor acts as the portfolio manager for the Fund. In this capacity, the Sub-Advisor does the following:
|
|
(i)
|
manages the composition of the Fund’s portfolio, including the purchase, retention, and disposition of portfolio securities in accordance with the Fund’s investment objectives, policies, and restrictions;
|
|||
|
(ii)
|
seeks best execution for the Fund’s portfolio;
|
|||
|
(iii)
|
manages the use of soft dollars for the Fund; and
|
|||
|
(iv)
|
manages proxy voting for the Fund.
|
|
(b)
|
The Sub-Advisor ensures that its compliance program includes policies and procedures relevant to the Fund and the Sub-Advisor’s duties as a portfolio manager to the Fund.
|
||
|
(c)
|
For each annual report of the Fund, the Sub-Advisor prepares a written summary of the Fund’s performance during the most recent 12-month period.
|
|
HENNESSY FUNDS
|
1-800-966-4354
|
29
|
(d)
|
The Sub-Advisor provides a quarterly compliance certification to the Board regarding trading and allocation practices, supervisory matters, the Sub-Advisor’s compliance program (including its code of ethics),
compliance with the Fund’s policies, and general firm updates.
|
|
(3)
|
The Trustees considered the distinction between the services performed by the Advisor and the Sub-Advisor. The Trustees noted that the management of the Fund, including the oversight of the Sub-Advisor, involves
more comprehensive and substantive duties than the duties of the Sub-Advisor. Specifically, the Trustees considered the lists of services identified above and concluded that the services performed by the Advisor for the Fund require a
higher level of service and oversight than the services performed by the Sub-Advisor. Based on this determination, the Trustees concluded that the differential in advisory fees between the Advisor and the Sub-Advisor is reasonable.
|
|
|
(4)
|
The Trustees compared the performance of the Fund to benchmark indices over various periods and also noted that the Trustees review and discuss reports comparing the investment performance of the Fund to various
indices at each quarterly Board meeting. Based on such information, the Trustees determined that the Advisor and the Sub-Advisor manage the Fund in a manner materially consistent with its stated investment objective and style. The Trustees
concluded that the performance of the Fund over various periods warranted continuation of the advisory and sub-advisory agreements.
|
|
|
(5)
|
The Trustees reviewed the advisory fees and overall expense ratios of the Fund compared to other funds similar in asset size and investment objective to the Fund using data from Morningstar. As part of the
discussion with management, the Trustees ensured that they understood and were comfortable with the criteria used to determine the mutual funds included in the Morningstar categories for purposes of the materials considered at the meeting.
The Trustees determined that the advisory fee and overall expense ratio of the Fund falls within the range of the advisory fees and overall expense ratios of other comparable funds and concluded that they are reasonable and warranted
continuation of the advisory and sub-advisory agreements.
|
|
|
(6)
|
The Trustees also considered whether the Advisor was realizing economies of scale that it should share with the Fund’s shareholders. The Trustees noted that the assets of the Fund had declined over the prior year.
In addition, the Trustees noted that many of the expenses incurred to manage the Fund are asset-based fees, so the Advisor does not realize material economies of scale relating to those expenses as the assets of the Fund increase. For
example, mutual fund platform fees increase as the Fund’s assets grow. The Trustees also considered the Advisor’s efforts to contain expenses through actions such as renegotiating service contracts, the Advisor’s significant marketing
efforts to promote the Funds, the Advisor’s investments in personnel to manage the Funds, and the Advisor’s agreement to waive fees or lower its management fees in certain circumstances. The Trustees determined that it did not appear that
the Advisor was realizing significant economies of scale and concluded that it would continue to monitor economies of scale in the future as circumstances changed.
|
|
|
(7)
|
The Trustees considered the profitability of the Advisor and the Sub-Advisor, including the impact of mutual fund platform fees on the Advisor’s profitability, and also considered the resources and revenues that
the Advisor has put into
|
|
HENNESSYFUNDS.COM
|
30
|
BOARD APPROVAL OF INVESTMENT ADVISORY AGREEMENTS
|
|
managing and distributing the Fund. The Trustees then concluded that the profits of the Advisor and the Sub-Advisor are reasonable and not excessive when compared to profitability guidelines set forth in relevant
court cases.
|
||
|
(8)
|
The Trustees considered the high level of professionalism and knowledge of the Advisor’s employees, along with a very low level of turnover, and concluded that this was beneficial to the Fund and its shareholders.
|
|
|
(9)
|
The Trustees considered any benefits to the Advisor and the Sub-Advisor from serving as an advisor to the Fund (other than the advisory and sub-advisory fees). The Trustees noted that the Advisor and the
Sub-Advisor may derive ancillary benefits from, by way of example, their association with the Fund in the form of proprietary and third-party research products and services received from broker-dealers that execute portfolio trades for the
Fund. The Trustees determined that any such products and services have been used for legitimate purposes relating to the Fund by providing assistance in the investment decision-making process. The Trustees concluded that any additional
benefits realized by the Advisor and the Sub-Advisor from their relationship with the Fund were reasonable, which was based on, among other things, the Trustees’ findings that (i) the research, analytical, statistical, and other information
and services provided by brokers are merely supplemental to the Advisor’s and the Sub-Advisor’s own efforts in the performance of their duties under the advisory and sub-advisory agreements and (ii) although the Sub-Advisor could derive
benefits from the conversion of Fund shareholders into separate account clients, the Fund also could benefit from potential institutional shareholders who might choose to invest in the Fund.
|
After reviewing the materials and information provided at the meeting, as well as other information regularly provided at the Board’s quarterly meetings throughout the year regarding the quality of
services provided by the Advisor and the Sub-Advisor, the performance of the Fund, expense information, brokerage commissions information, the adequacy and efficacy of the Advisor’s and the Sub-Advisor’s written policies and procedures, other
regulatory compliance issues, trading information and related matters, and other factors that the Trustees deemed relevant, the Trustees, including the Independent Trustees, approved the continuation of the advisory and sub-advisory agreements.
|
HENNESSY FUNDS
|
1-800-966-4354
|
31
(This Page Intentionally Left Blank.)
For information, questions, or assistance, please call
The Hennessy Funds
1-800-966-4354 or 1-415-899-1555
INVESTMENT ADVISOR
Hennessy Advisors, Inc.
7250 Redwood Boulevard, Suite 200
Novato, California 94945
ADMINISTRATOR,
TRANSFER AGENT,
DIVIDEND PAYING AGENT, &
SHAREHOLDER SERVICING AGENT
U.S. Bancorp Fund Services, LLC
d/b/a U.S. Bank Global Fund Services
P.O. Box 701
Milwaukee, Wisconsin 53201-0701
CUSTODIAN
U.S. Bank N.A.
Custody Operations
1555 North River Center Drive, Suite 302
Milwaukee, Wisconsin 53212
TRUSTEES
Neil J. Hennessy
Robert T. Doyle
J. Dennis DeSousa
Gerald P. Richardson
COUNSEL
Foley & Lardner LLP
777 East Wisconsin Avenue
Milwaukee, Wisconsin 53202-5306
INDEPENDENT REGISTERED
PUBLIC ACCOUNTING FIRM
Tait, Weller & Baker LLP
Two Liberty Place
50 South 16th Street, Suite 2900
Philadelphia, Pennsylvania 19102-2529
DISTRIBUTOR
Quasar Distributors, LLC
111 East Kilbourn Avenue, Suite 2200
Milwaukee, Wisconsin 53202
www.hennessyfunds.com | 1-800-966-4354
This report has been prepared for shareholders and may be distributed to
others only if preceded or accompanied by a current prospectus.
SEMI-ANNUAL REPORT
APRIL 30, 2020
HENNESSY CORNERSTONE MID CAP 30 FUND
Investor Class HFMDX
Institutional Class HIMDX
IMPORTANT NOTICE REGARDING ELECTRONIC DELIVERY OF SHAREHOLDER REPORTS
Beginning on January 1, 2021, as permitted by regulations adopted by the Securities and Exchange Commission, paper copies of the annual and semi-annual reports will
no longer be sent by mail unless you specifically request paper copies from the Hennessy Funds or from your financial intermediary. Instead, the reports will be made available on a website, and you will be notified by mail each time a
report is posted and provided with a website link to access the report.
If you have already elected to receive shareholder reports electronically, you will not be affected by this change and you need not take any action. You may elect to
receive shareholder reports and other communications from the Hennessy Funds electronically by visiting www.hennessyfunds.com/account or by calling U.S. Bank Global Fund Services at 1-800-261-6950. If you own shares in a Fund through a
financial intermediary, please contact your financial intermediary to make this election.
You may elect to receive paper copies of all future reports free of charge by calling U.S. Bank Global Fund Services at 1-800-261-6950 or, if you own your shares
through a financial intermediary, by contacting your financial intermediary. Your election to receive paper copies of reports will apply to all Funds in the Hennessy Funds family.
hennessyfunds.com | 1-800-966-4354
(This Page Intentionally Left Blank.)
Contents
|
Letter to Shareholders
|
2
|
|
Performance Overview
|
4
|
|
Financial Statements
|
|
|
Schedule of Investments
|
5
|
|
Statement of Assets and Liabilities
|
9
|
|
Statement of Operations
|
10
|
|
Statements of Changes in Net Assets
|
11
|
|
Financial Highlights
|
12
|
|
Notes to the Financial Statements
|
16
|
|
Expense Example
|
23
|
|
Proxy Voting Policy and Proxy Voting Records
|
25
|
|
Availability of Quarterly Portfolio Schedule
|
25
|
|
Federal Tax Distribution Information
|
25
|
|
Important Notice Regarding Delivery of Shareholder Documents
|
25
|
|
Electronic Delivery
|
25
|
|
Board Approval of Investment Advisory Agreement
|
26
|
|
HENNESSY FUNDS
|
1-800-966-4354
|
June 2020
Dear Hennessy Funds Shareholder:
First and foremost, I hope this communication finds you and your loved ones safe and healthy. In many ways, the COVID-19 pandemic has turned the world upside down in recent months, and we at Hennessy have joined the
rest of the world in witnessing and experiencing its profound effect on public health, the global economy, and the everyday lives of people around the world. In response to the crisis, we invoked our business continuity plan in mid-March to
ensure a smooth transition to remote work for all of our employees, who have been working safely and productively from home. We want to assure our Hennessy Funds shareholders that our operations are uninterrupted and functioning normally.
The past six months have been marked by extremes. During the first half of the period from November 2019 through January 2020, the bull market, supported by strong corporate fundamentals, continued to
move higher, and investors appeared focused on record-low unemployment and strong economic growth. In mid-February, the major U.S. market indices hit all-time highs, but then, within just a matter of weeks, lost over one-third of their values as
the COVID-19 pandemic unfolded. Shelter-in-place and business closure orders rippled through the nation, causing initial unemployment claims to skyrocket to their highest number in history. The market then rallied back and posted double-digit
positive returns in April.
For the six months ended April 30, 2020, on a total return basis, the Dow Jones Industrial Average was down 8.9% and the S&P 500® Index was down 3.2%. Small-cap and mid-cap stocks generally fared worse than large-cap stocks during the period, and the Financial sector was particularly hard hit as the Federal Reserve aggressively cut the federal funds rate
in an effort to stabilize the economy. The Energy sector was crushed by both the sudden loss of demand due to COVID-19 and the oversupply caused by the surprise market-share battle between Russia and Saudi Arabia, and the S&P 500® Energy Sector Index ended the six-month period down over 30%.
The COVID-19 pandemic is an unprecedented event, and the duration and full extent of the economic impact is unknown. In the moment, there is always the concern that ‘this time is different.’ But, when
you are able to look at past financial, political, and health crises with the benefit of 20/20 hindsight, history has demonstrated that our economy and financial markets have always rebounded and recovered eventually. If you look back to the last
market downturn in 2008, economic fundamentals were weak compared to the market in 2020, where the overall underpinnings were – and are still – quite strong. Publicly listed companies today have plenty of cash, with over $5 trillion on balance
sheets of the S&P 500® companies alone, and I believe that most will survive and that many may emerge from the current crisis even stronger.
|
HENNESSYFUNDS.COM
|
2
|
LETTER TO SHAREHOLDERS
|
We understand that this market volatility and economic uncertainty is jarring to many investors, and we continue to monitor events and the markets. We remain focused on managing our high-conviction
portfolios for the long-term benefit of our shareholders, and we are confident in the time-tested strategies and rigorous research that led to their formation. We encourage shareholders to maintain a long-term investment horizon and to remain
focused on long-term goals. As always, but especially in these trying times, we are here to support our shareholders, and we thank you for your continued investment and trust. Should you have any questions or would like to speak with us directly,
please don’t hesitate to call (800) 966-4354 or email us at fundsinfo@hennessyfunds.com.
Best regards,
Neil J. Hennessy
President and Chief Investment Officer
Past performance does not guarantee future results.
Mutual fund investing involves risk. Principal loss is possible.
The Dow Jones Industrial Average and S&P 500® Index are commonly used to measure the performance of U.S. stocks. The S&P 500® Energy Sector Index is an index that comprises those companies included in the S&P 500 that are classified as members of the GICS energy sector. One cannot invest
directly in an index.
|
HENNESSY FUNDS
|
1-800-966-4354
|
3
Performance Overview (Unaudited)
AVERAGE ANNUAL TOTAL RETURN FOR PERIODS ENDED APRIL 30, 2020
|
Six
|
One
|
Five
|
Ten
|
|
|
Months(1)
|
Year
|
Years
|
Years
|
|
|
Hennessy Cornerstone
|
||||
|
Mid Cap 30 Fund –
|
||||
|
Investor Class (HFMDX)
|
-20.57%
|
-23.80%
|
-4.01%
|
5.75%
|
|
Hennessy Cornerstone
|
||||
|
Mid Cap 30 Fund –
|
||||
|
Institutional Class (HIMDX)
|
-20.47%
|
-23.53%
|
-3.68%
|
6.11%
|
|
Russell Midcap® Index
|
-11.63%
|
-10.00%
|
4.81%
|
9.83%
|
|
S&P 500® Index
|
-3.16%
|
0.86%
|
9.12%
|
11.69%
|
Expense ratios: 1.36% (Investor Class); 1.00% (Institutional Class)
|
(1)
|
Periods of less than one year are not annualized.
|
_______________
Performance data quoted represents past performance; past performance does not guarantee future results. The investment return and principal value of an investment will fluctuate so that an
investor’s shares, when redeemed, may be worth more or less than their original cost. The performance table does not reflect the deduction of taxes that a shareholder would pay on Fund distributions or the redemption of Fund shares. Current
performance of the Fund may be lower or higher than the performance quoted. Performance data current to the most recent month end may be obtained by visiting www.hennessyfunds.com.
The Russell Midcap® Index comprises approximately 800 of the smallest securities of the Russell 1000® Index based on a combination of market capitalization and current index membership. The S&P 500® Index is a
capitalization-weighted index that is designed to represent the broad domestic economy through changes in the aggregate market value of 500 stocks across all major industries. One cannot invest directly in an index. These indices are used herein
for comparative purposes in accordance with SEC regulations.
Frank Russell Company (“Russell”) is the source and owner of the trademarks, service marks, and copyrights related to the Russell Indexes. Russell® is a trademark of Russell. Neither Russell nor its licensors accept any liability for any errors or omissions in the Russell Indexes or Russell ratings or underlying data and no party may rely on any Russell Indexes or Russell
ratings or underlying data contained in this communication. No further distribution of Russell data is permitted without Russell’s express written consent. Russell does not promote, sponsor, or endorse the content of this communication.
Standard & Poor’s Financial Services LLC is the source and owner of the S&P® and S&P 500® trademarks.
The expense ratios presented are from the most recent prospectus. The expense ratios for the current reporting period are available in the Financial Highlights section of this report.
|
HENNESSYFUNDS.COM
|
4
|
PERFORMANCE OVERVIEW/SCHEDULE OF INVESTMENTS
|
Financial Statements
|
Schedule of Investments as of April 30, 2020
(Unaudited)
|
HENNESSY CORNERSTONE MID CAP 30 FUND
(% of Net Assets)
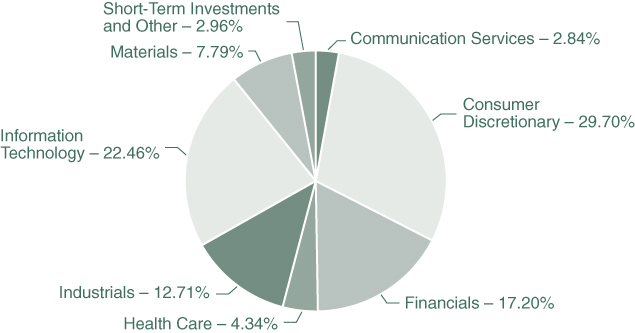
|
TOP TEN HOLDINGS (EXCLUDING MONEY MARKET FUNDS)
|
% NET ASSETS
|
|
Synaptics, Inc.
|
6.66%
|
|
Syneos Health, Inc.
|
4.34%
|
|
Crown Holdings, Inc.
|
4.06%
|
|
AECOM Technology Corp.
|
3.93%
|
|
Itron, Inc.
|
3.87%
|
|
Packaging Corp. of America
|
3.73%
|
|
Landstar System, Inc.
|
3.71%
|
|
Williams-Sonoma, Inc.
|
3.65%
|
|
Lithia Motors, Inc., Class A
|
3.42%
|
|
Restoration Hardware Holdings, Inc.
|
3.38%
|
Note: For presentation purposes, the Fund has grouped some of the industry categories. For purposes of categorizing securities for compliance with Section 8(b)(1) of the Investment Company Act of 1940, as amended, the
Fund uses more specific industry classifications.
The Global Industry Classification Standard (GICS®) was developed by and is the exclusive property and a service mark of MSCI, Inc. and Standard & Poor’s Financial Services LLC. It has been licensed for use by the Hennessy Funds.
|
HENNESSY FUNDS
|
1-800-966-4354
|
5
|
COMMON STOCKS – 97.04%
|
Number
|
% of
|
||||||||||
|
|
of Shares
|
Value
|
Net Assets
|
|||||||||
|
Communication Services – 2.84%
|
||||||||||||
|
News Corp.
|
697,300
|
$
|
6,910,243
|
2.84
|
%
|
|||||||
|
|
||||||||||||
|
Consumer Discretionary – 29.70%
|
||||||||||||
|
KB Home
|
286,800
|
7,525,632
|
3.09
|
%
|
||||||||
|
Lithia Motors, Inc., Class A
|
75,300
|
8,325,168
|
3.42
|
%
|
||||||||
|
Meritage Homes Corp. (a)
|
136,800
|
7,190,208
|
2.95
|
%
|
||||||||
|
Restoration Hardware Holdings, Inc. (a)
|
57,300
|
8,238,594
|
3.38
|
%
|
||||||||
|
Scientific Games Corp. (a)
|
499,100
|
6,293,651
|
2.59
|
%
|
||||||||
|
Skechers U.S.A., Inc. (a)
|
268,100
|
7,555,058
|
3.10
|
%
|
||||||||
|
Taylor Morrison Home Corp. (a)
|
377,400
|
5,491,170
|
2.26
|
%
|
||||||||
|
Toll Brothers, Inc.
|
239,900
|
5,762,398
|
2.37
|
%
|
||||||||
|
Whirlpool Corp.
|
62,900
|
7,028,446
|
2.89
|
%
|
||||||||
|
Williams-Sonoma, Inc.
|
143,600
|
8,880,224
|
3.65
|
%
|
||||||||
|
|
72,290,549
|
29.70
|
%
|
|||||||||
|
Financials – 17.20%
|
||||||||||||
|
American Financial Group, Inc.
|
92,000
|
6,094,080
|
2.50
|
%
|
||||||||
|
Brighthouse Financial, Inc. (a)
|
255,400
|
6,566,334
|
2.70
|
%
|
||||||||
|
First American Financial Corp.
|
164,700
|
7,595,964
|
3.12
|
%
|
||||||||
|
Hanover Insurance Group, Inc.
|
72,400
|
7,267,512
|
2.99
|
%
|
||||||||
|
LPL Financial Holdings, Inc.
|
128,100
|
7,714,182
|
3.17
|
%
|
||||||||
|
Old Republic International Corp.
|
415,400
|
6,625,630
|
2.72
|
%
|
||||||||
|
|
41,863,702
|
17.20
|
%
|
|||||||||
|
Health Care – 4.34%
|
||||||||||||
|
Syneos Health, Inc. (a)
|
189,400
|
10,566,626
|
4.34
|
%
|
||||||||
|
Industrials – 12.71%
|
||||||||||||
|
AECOM Technology Corp. (a)
|
264,000
|
9,572,640
|
3.93
|
%
|
||||||||
|
Landstar System, Inc.
|
87,300
|
9,018,963
|
3.71
|
%
|
||||||||
|
MasTec, Inc. (a)
|
152,200
|
5,463,980
|
2.24
|
%
|
||||||||
|
Owens Corning
|
158,700
|
6,881,232
|
2.83
|
%
|
||||||||
|
|
30,936,815
|
12.71
|
%
|
|||||||||
|
Information Technology – 22.46%
|
||||||||||||
|
Itron, Inc. (a)
|
134,700
|
9,404,754
|
3.87
|
%
|
||||||||
|
Jabil, Inc.
|
275,700
|
7,840,908
|
3.22
|
%
|
||||||||
|
NCR Corp. (a)
|
323,800
|
6,644,376
|
2.73
|
%
|
||||||||
|
SunPower Corp. (a)
|
935,600
|
6,876,660
|
2.83
|
%
|
||||||||
The accompanying notes are an integral part of these financial statements.
|
HENNESSYFUNDS.COM
|
6
|
SCHEDULE OF INVESTMENTS
|
|
COMMON STOCKS
|
Number
|
% of
|
||||||||||
|
|
of Shares
|
Value
|
Net Assets
|
|||||||||
|
Information Technology (Continued)
|
||||||||||||
|
Synaptics, Inc. (a)
|
247,900
|
$
|
16,210,181
|
6.66
|
%
|
|||||||
|
Synnex Corp.
|
87,600
|
7,670,256
|
3.15
|
%
|
||||||||
|
|
54,647,135
|
22.46
|
%
|
|||||||||
|
Materials – 7.79%
|
||||||||||||
|
Crown Holdings, Inc. (a)
|
153,500
|
9,886,935
|
4.06
|
%
|
||||||||
|
Packaging Corp. of America
|
93,800
|
9,065,770
|
3.73
|
%
|
||||||||
|
|
18,952,705
|
7.79
|
%
|
|||||||||
|
Total Common Stocks
|
||||||||||||
|
(Cost $290,576,420)
|
236,167,775
|
97.04
|
%
|
|||||||||
|
|
||||||||||||
|
SHORT-TERM INVESTMENTS – 0.52%
|
||||||||||||
|
Money Market Funds – 0.52%
|
||||||||||||
|
First American Government Obligations Fund,
|
||||||||||||
|
Institutional Class, 0.25% (b)
|
1,261,916
|
1,261,916
|
0.52
|
%
|
||||||||
|
|
||||||||||||
|
Total Short-Term Investments
|
||||||||||||
|
(Cost $1,261,916)
|
1,261,916
|
0.52
|
%
|
|||||||||
|
|
||||||||||||
|
Total Investments
|
||||||||||||
|
(Cost $291,838,336) – 97.56%
|
237,429,691
|
97.56
|
%
|
|||||||||
|
Other Assets in Excess of Liabilities – 2.44%
|
5,944,730
|
2.44
|
%
|
|||||||||
|
|
||||||||||||
|
TOTAL NET ASSETS – 100.00%
|
$
|
243,374,421
|
100.00
|
%
|
||||||||
Percentages are stated as a percent of net assets.
|
(a)
|
Non-income-producing security.
|
|
(b)
|
The rate listed is the fund’s seven-day yield as of April 30, 2020.
|
The accompanying notes are an integral part of these financial statements.
|
HENNESSY FUNDS
|
1-800-966-4354
|
7
Summary of Fair Value Exposure as of April 30, 2020
The following is a summary of the inputs used to value the Fund’s net assets as of April 30, 2020 (see Note 3 in the accompanying Notes to the Financial Statements):
|
Common Stocks
|
Level 1
|
Level 2
|
Level 3
|
Total
|
||||||||||||
|
Communication Services
|
$
|
6,910,243
|
$
|
—
|
$
|
—
|
$
|
6,910,243
|
||||||||
|
Consumer Discretionary
|
72,290,549
|
—
|
—
|
72,290,549
|
||||||||||||
|
Financials
|
41,863,702
|
—
|
—
|
41,863,702
|
||||||||||||
|
Health Care
|
10,566,626
|
—
|
—
|
10,566,626
|
||||||||||||
|
Industrials
|
30,936,815
|
—
|
—
|
30,936,815
|
||||||||||||
|
Information Technology
|
54,647,135
|
—
|
—
|
54,647,135
|
||||||||||||
|
Materials
|
18,952,705
|
—
|
—
|
18,952,705
|
||||||||||||
|
Total Common Stocks
|
$
|
236,167,775
|
$
|
—
|
$
|
—
|
$
|
236,167,775
|
||||||||
|
Short-Term Investments
|
||||||||||||||||
|
Money Market Funds
|
$
|
1,261,916
|
$
|
—
|
$
|
—
|
$
|
1,261,916
|
||||||||
|
Total Short-Term Investments
|
$
|
1,261,916
|
$
|
—
|
$
|
—
|
$
|
1,261,916
|
||||||||
|
Total Investments
|
$
|
237,429,691
|
$
|
—
|
$
|
—
|
$
|
237,429,691
|
||||||||
The accompanying notes are an integral part of these financial statements.
|
HENNESSYFUNDS.COM
|
8
|
SCHEDULE OF INVESTMENTS/STATEMENT OF ASSETS AND LIABILITIES
|
Financial Statements
|
Statement of Assets and Liabilities as of April 30, 2020 (Unaudited)
|
|
ASSETS:
|
||||
|
Investments in securities, at value (cost $291,838,336)
|
$
|
237,429,691
|
||
|
Dividends and interest receivable
|
71,468
|
|||
|
Receivable for fund shares sold
|
48,732
|
|||
|
Receivable for securities sold
|
6,308,772
|
|||
|
Prepaid expenses and other assets
|
28,012
|
|||
|
Total assets
|
243,886,675
|
|||
|
LIABILITIES:
|
||||
|
Payable for fund shares redeemed
|
229,926
|
|||
|
Payable to advisor
|
132,390
|
|||
|
Payable to administrator
|
34,919
|
|||
|
Payable to auditor
|
11,379
|
|||
|
Accrued distribution fees
|
13,620
|
|||
|
Accrued service fees
|
10,024
|
|||
|
Accrued trustees fees
|
3,538
|
|||
|
Accrued expenses and other payables
|
76,458
|
|||
|
Total liabilities
|
512,254
|
|||
|
NET ASSETS
|
$
|
243,374,421
|
||
|
NET ASSETS CONSISTS OF:
|
||||
|
Capital stock
|
$
|
388,546,990
|
||
|
Accumulated deficit
|
(145,172,569
|
)
|
||
|
Total net assets
|
$
|
243,374,421
|
||
|
NET ASSETS:
|
||||
|
Investor Class
|
||||
|
Shares authorized (no par value)
|
Unlimited
|
|||
|
Net assets applicable to outstanding shares
|
$
|
136,417,034
|
||
|
Shares issued and outstanding
|
14,303,676
|
|||
|
Net asset value, offering price, and redemption price per share
|
$
|
9.54
|
||
|
Institutional Class
|
||||
|
Shares authorized (no par value)
|
Unlimited
|
|||
|
Net assets applicable to outstanding shares
|
$
|
106,957,387
|
||
|
Shares issued and outstanding
|
10,797,183
|
|||
|
Net asset value, offering price, and redemption price per share
|
$
|
9.91
|
||
The accompanying notes are an integral part of these financial statements.
|
HENNESSY FUNDS
|
1-800-966-4354
|
9
Financial Statements
|
Statement of Operations for the six months ended April 30, 2020 (Unaudited)
|
|
INVESTMENT INCOME:
|
||||
|
Dividend income
|
$
|
1,946,949
|
||
|
Interest income
|
35,920
|
|||
|
Total investment income
|
1,982,869
|
|||
|
EXPENSES:
|
||||
|
Investment advisory fees (See Note 5)
|
1,197,031
|
|||
|
Sub-transfer agent expenses – Investor Class (See Note 5)
|
184,847
|
|||
|
Sub-transfer agent expenses – Institutional Class (See Note 5)
|
79,548
|
|||
|
Administration, accounting, custody, and transfer agent fees (See Note 5)
|
170,507
|
|||
|
Distribution fees – Investor Class (See Note 5)
|
135,062
|
|||
|
Service fees – Investor Class (See Note 5)
|
90,042
|
|||
|
Federal and state registration fees
|
25,104
|
|||
|
Reports to shareholders
|
22,857
|
|||
|
Compliance expense (See Note 5)
|
13,462
|
|||
|
Audit fees
|
11,375
|
|||
|
Trustees’ fees and expenses
|
10,279
|
|||
|
Legal fees
|
2,285
|
|||
|
Interest expense (See Note 7)
|
221
|
|||
|
Other expenses
|
24,234
|
|||
|
Total expenses
|
1,966,854
|
|||
|
NET INVESTMENT INCOME
|
$
|
16,015
|
||
|
REALIZED AND UNREALIZED GAINS (LOSSES):
|
||||
|
Net realized loss on investments
|
$
|
(2,425,383
|
)
|
|
|
Net change in unrealized appreciation/depreciation on investments
|
(63,834,710
|
)
|
||
|
Net loss on investments
|
(66,260,093
|
)
|
||
|
NET DECREASE IN NET ASSETS RESULTING FROM OPERATIONS
|
$
|
(66,244,078
|
)
|
|
The accompanying notes are an integral part of these financial statements.
|
HENNESSYFUNDS.COM
|
10
|
STATEMENT OF OPERATIONS/STATEMENTS OF CHANGES IN NET ASSETS
|
Financial Statements
|
Statements of Changes in Net Assets
|
|
Six Months Ended
|
||||||||
|
April 30, 2020
|
Year Ended
|
|||||||
|
(Unaudited)
|
October 31, 2019
|
|||||||
|
OPERATIONS:
|
||||||||
|
Net investment income
|
$
|
16,015
|
$
|
66,757
|
||||
|
Net realized loss on investments
|
(2,425,383
|
)
|
(81,390,911
|
)
|
||||
|
Net change in unrealized
|
||||||||
|
appreciation/depreciation on investments
|
(63,834,710
|
)
|
70,748,582
|
|||||
|
Net decrease in net assets resulting from operations
|
(66,244,078
|
)
|
(10,575,572
|
)
|
||||
|
DISTRIBUTIONS TO SHAREHOLDERS:
|
||||||||
|
Distributable earnings – Investor Class
|
—
|
(84,472,220
|
)
|
|||||
|
Distributable earnings – Institutional Class
|
—
|
(78,382,312
|
)
|
|||||
|
Total distributions
|
—
|
(162,854,532
|
)
|
|||||
|
CAPITAL SHARE TRANSACTIONS:
|
||||||||
|
Proceeds from shares subscribed – Investor Class
|
4,939,861
|
5,388,708
|
||||||
|
Proceeds from shares subscribed – Institutional Class
|
2,476,446
|
13,304,783
|
||||||
|
Dividends reinvested – Investor Class
|
—
|
83,056,407
|
||||||
|
Dividends reinvested – Institutional Class
|
—
|
76,949,798
|
||||||
|
Cost of shares redeemed – Investor Class
|
(37,339,663
|
)
|
(130,835,008
|
)
|
||||
|
Cost of shares redeemed – Institutional Class
|
(35,351,769
|
)
|
(167,228,188
|
)
|
||||
|
Net decrease in net assets derived
|
||||||||
|
from capital share transactions
|
(65,275,125
|
)
|
(119,363,500
|
)
|
||||
|
TOTAL DECREASE IN NET ASSETS
|
(131,519,203
|
)
|
(292,793,604
|
)
|
||||
|
NET ASSETS:
|
||||||||
|
Beginning of period
|
374,893,624
|
667,687,228
|
||||||
|
End of period
|
$
|
243,374,421
|
$
|
374,893,624
|
||||
|
CHANGES IN SHARES OUTSTANDING:
|
||||||||
|
Shares sold – Investor Class
|
509,844
|
436,901
|
||||||
|
Shares sold – Institutional Class
|
218,322
|
981,434
|
||||||
|
Shares issued to holders as reinvestment
|
||||||||
|
of dividends – Investor Class
|
—
|
7,160,035
|
||||||
|
Shares issued to holders as reinvestment
|
||||||||
|
of dividends – Institutional Class
|
—
|
6,417,832
|
||||||
|
Shares redeemed – Investor Class
|
(3,363,637
|
)
|
(10,498,154
|
)
|
||||
|
Shares redeemed – Institutional Class
|
(2,971,669
|
)
|
(12,799,172
|
)
|
||||
|
Net decrease in shares outstanding
|
(5,607,140
|
)
|
(8,301,124
|
)
|
||||
The accompanying notes are an integral part of these financial statements.
|
HENNESSY FUNDS
|
1-800-966-4354
|
11
Financial Statements
|
Financial Highlights
|
For an Investor Class share outstanding throughout each period
|
Six Months Ended
|
||||
|
April 30, 2020
|
||||
|
(Unaudited)
|
||||
|
PER SHARE DATA:
|
||||
|
Net asset value, beginning of period
|
$
|
12.01
|
||
|
Income from investment operations:
|
||||
|
Net investment income (loss)
|
(0.01
|
)(1)
|
||
|
Net realized and unrealized gains (losses) on investments
|
(2.46
|
)
|
||
|
Total from investment operations
|
(2.47
|
)
|
||
|
Less distributions:
|
||||
|
Dividends from net investment income
|
—
|
|||
|
Dividends from net realized gains
|
—
|
|||
|
Total distributions
|
—
|
|||
|
Net asset value, end of period
|
$
|
9.54
|
||
|
TOTAL RETURN
|
-20.57
|
%(2)
|
||
|
SUPPLEMENTAL DATA AND RATIOS:
|
||||
|
Net assets, end of period (millions)
|
$
|
136.42
|
||
|
Ratio of expenses to average net assets
|
1.37
|
%(3)
|
||
|
Ratio of net investment income (loss) to average net assets
|
(0.15
|
)%(3)
|
||
|
Portfolio turnover rate(4)
|
0
|
%(2)
|
||
|
(1)
|
Calculated using the average shares outstanding method.
|
|
(2)
|
Not annualized.
|
|
(3)
|
Annualized.
|
|
(4)
|
Calculated on the basis of the Fund as a whole.
|
The accompanying notes are an integral part of these financial statements.
|
HENNESSYFUNDS.COM
|
12
|
FINANCIAL HIGHLIGHTS — INVESTOR CLASS
|
|
Year Ended October 31,
|
||||||||||||||||||
|
2019
|
2018
|
2017
|
2016
|
2015
|
||||||||||||||
|
$
|
16.87
|
$
|
22.46
|
$
|
18.37
|
$
|
20.12
|
$
|
19.00
|
|||||||||
|
(0.02
|
)(1)
|
(0.06
|
)
|
(0.15
|
)
|
(0.07
|
)
|
0.10
|
||||||||||
|
(0.34
|
)
|
(1.87
|
)
|
4.36
|
(1.51
|
)
|
2.16
|
|||||||||||
|
(0.36
|
)
|
(1.93
|
)
|
4.21
|
(1.58
|
)
|
2.26
|
|||||||||||
|
—
|
—
|
—
|
(0.03
|
)
|
—
|
|||||||||||||
|
(4.50
|
)
|
(3.66
|
)
|
(0.12
|
)
|
(0.14
|
)
|
(1.14
|
)
|
|||||||||
|
(4.50
|
)
|
(3.66
|
)
|
(0.12
|
)
|
(0.17
|
)
|
(1.14
|
)
|
|||||||||
|
$
|
12.01
|
$
|
16.87
|
$
|
22.46
|
$
|
18.37
|
$
|
20.12
|
|||||||||
|
-1.22
|
%
|
-10.54
|
%
|
23.02
|
%
|
-7.89
|
%
|
12.35
|
%
|
|||||||||
|
$
|
206.11
|
$
|
338.39
|
$
|
351.16
|
$
|
485.15
|
$
|
765.90
|
|||||||||
|
1.36
|
%
|
1.31
|
%
|
1.34
|
%
|
1.35
|
%
|
1.17
|
%
|
|||||||||
|
(0.15
|
)%
|
(0.47
|
)%
|
(0.33
|
)%
|
(0.24
|
)%
|
0.27
|
%
|
|||||||||
|
70
|
%
|
181
|
%
|
106
|
%
|
108
|
%
|
5
|
%
|
|||||||||
The accompanying notes are an integral part of these financial statements.
|
HENNESSY FUNDS
|
1-800-966-4354
|
13
Financial Statements
|
Financial Highlights
|
For an Institutional Class share outstanding throughout each period
|
Six Months Ended
|
||||
|
April 30, 2020
|
||||
|
(Unaudited)
|
||||
|
PER SHARE DATA:
|
||||
|
Net asset value, beginning of period
|
$
|
12.46
|
||
|
Income from investment operations:
|
||||
|
Net investment income (loss)
|
0.01
|
(1)
|
||
|
Net realized and unrealized gains (losses) on investments
|
(2.56
|
)
|
||
|
Total from investment operations
|
(2.55
|
)
|
||
|
Less distributions:
|
||||
|
Dividends from net investment income
|
—
|
|||
|
Dividends from net realized gains
|
—
|
|||
|
Total distributions
|
—
|
|||
|
Net asset value, end of period
|
$
|
9.91
|
||
|
TOTAL RETURN
|
-20.47
|
%(3)
|
||
|
SUPPLEMENTAL DATA AND RATIOS:
|
||||
|
Net assets, end of period (millions)
|
$
|
106.96
|
||
|
Ratio of expenses to average net assets:
|
1.02
|
%(4)
|
||
|
Ratio of net investment income (loss) to average net assets:
|
0.20
|
%(4)
|
||
|
Portfolio turnover rate(5)
|
0
|
%(3)
|
||
|
(1)
|
Calculated using the average shares outstanding method.
|
|
(2)
|
Amount is between $(0.005) and 0.005.
|
|
(3)
|
Not annualized.
|
|
(4)
|
Annualized.
|
|
(5)
|
Calculated on the basis of the Fund as a whole.
|
The accompanying notes are an integral part of these financial statements.
|
HENNESSYFUNDS.COM
|
14
|
FINANCIAL HIGHLIGHTS — INSTITUTIONAL CLASS
|
|
Year Ended October 31,
|
||||||||||||||||||
|
2019
|
2018
|
2017
|
2016
|
2015
|
||||||||||||||
|
$
|
17.38
|
$
|
23.07
|
$
|
18.80
|
$
|
20.55
|
$
|
19.36
|
|||||||||
|
0.03
|
(1)
|
(0.00
|
)(2)
|
0.02
|
0.00
|
(2)
|
(0.03
|
)
|
||||||||||
|
(0.36
|
)
|
(1.92
|
)
|
4.38
|
(1.54
|
)
|
2.38
|
|||||||||||
|
(0.33
|
)
|
(1.92
|
)
|
4.40
|
(1.54
|
)
|
2.35
|
|||||||||||
|
—
|
—
|
—
|
(0.06
|
)
|
—
|
|||||||||||||
|
(4.59
|
)
|
(3.77
|
)
|
(0.13
|
)
|
(0.15
|
)
|
(1.16
|
)
|
|||||||||
|
(4.59
|
)
|
(3.77
|
)
|
(0.13
|
)
|
(0.21
|
)
|
(1.16
|
)
|
|||||||||
|
$
|
12.46
|
$
|
17.38
|
$
|
23.07
|
$
|
18.80
|
$
|
20.55
|
|||||||||
|
-0.84
|
%
|
-10.22
|
%
|
23.47
|
%
|
-7.53
|
%
|
12.62
|
%
|
|||||||||
|
$
|
168.79
|
$
|
329.30
|
$
|
620.38
|
$
|
754.97
|
$
|
306.04
|
|||||||||
|
1.00
|
%
|
0.95
|
%
|
0.97
|
%
|
0.97
|
%
|
0.96
|
%
|
|||||||||
|
0.20
|
%
|
(0.12
|
)%
|
0.04
|
%
|
0.07
|
%
|
0.41
|
%
|
|||||||||
|
70
|
%
|
181
|
%
|
106
|
%
|
108
|
%
|
5
|
%
|
|||||||||
The accompanying notes are an integral part of these financial statements.
|
HENNESSY FUNDS
|
1-800-966-4354
|
15
Financial Statements
|
Notes to the Financial Statements April 30, 2020 (Unaudited)
|
1). ORGANIZATION
The Hennessy Cornerstone Mid Cap 30 Fund (the “Fund”) is a series of Hennessy Funds Trust (the “Trust”), which was organized as a Delaware statutory trust on September 17, 1992. The Fund is an open-end management
investment company registered under the Investment Company Act of 1940, as amended. The investment objective of the Fund is long-term growth of capital. The Fund is a diversified fund.
The Fund offers Investor Class and Institutional Class shares. Each class of shares differs principally in its respective 12b-1 distribution and service, shareholder servicing, and sub-transfer agent
expenses. There are no sales charges. Each class has identical rights to earnings, assets, and voting privileges, except for class-specific expenses and exclusive rights to vote on matters affecting only one class.
As an investment company, the Fund follows the investment company accounting and reporting guidance of the Financial Accounting Standards Board (“FASB”) Accounting Standard Codification Topic 946
“Financial Services—Investment Companies.”
2). SIGNIFICANT ACCOUNTING POLICIES
The following is a summary of significant accounting policies consistently followed by the Fund in the preparation of the financial statements. These policies conform to U.S. generally accepted accounting principles
(“GAAP”).
|
a).
|
Securities Valuation – All investments in securities are recorded at their estimated fair value, as described in Note 3.
|
|
b).
|
Federal Income Taxes – No provision for federal income taxes or excise taxes has been made because the Fund has elected to be taxed as a regulated investment company and intends to distribute substantially all
of its taxable income to its shareholders and otherwise comply with the provisions of the Internal Revenue Code of 1986, as amended, applicable to regulated investment companies. Net investment income/loss and realized gains/losses for
federal income tax purposes may differ from those reported in the financial statements because of temporary book and tax basis differences. Temporary differences are primarily the result of the treatment of wash sales for tax reporting
purposes. The Fund recognizes interest and penalties related to income tax benefits, if any, in the Statement of Operations as an income tax expense. Distributions from net realized gains for book purposes may include short-term capital
gains, which are included as ordinary income to shareholders for tax purposes. The Fund may utilize equalization accounting for tax purposes and designate earnings and profits, including net realized gains distributed to shareholders on
redemption of shares, as part of the dividends paid deduction for income tax purposes.
|
|
c).
|
Accounting for Uncertainty in Income Taxes – The Fund has accounting policies regarding recognition and measurement of tax positions taken or expected to be taken on a tax return. The tax returns of the Fund for
the prior three fiscal years are open for examination. The Fund has reviewed all open tax years in major jurisdictions and concluded that there is no impact on the Fund’s net assets and no tax liability resulting from unrecognized tax
benefits relating to uncertain income tax positions taken or expected to be taken on a tax return. The Fund’s major tax jurisdictions are U.S. federal and Delaware.
|
|
HENNESSYFUNDS.COM
|
16
|
NOTES TO THE FINANCIAL STATEMENTS
|
|
d).
|
Income and Expenses – Dividend income is recognized on the ex-dividend date or as soon as information is available to the Fund. Interest income, which includes the amortization of premium and accretion of
discount, is recognized on an accrual basis. Other non-cash dividends are recognized as investment income at the fair value of the property received. The Fund is charged for those expenses that are directly attributable to its portfolio,
such as advisory, administration, and certain shareholder service fees. Income, expenses (other than expenses attributable to a specific class), and realized and unrealized gains/losses on investments are allocated to each class of shares
based on such class’s net assets.
|
|
e).
|
Distributions to Shareholders – Dividends from net investment income for the Fund, if any, are declared and paid annually, usually in December. Distributions of net realized capital gains, if any, are declared
and paid annually, usually in December.
|
|
f).
|
Security Transactions – Investment and shareholder transactions are recorded on the trade date. The Fund determines the realized gain/loss from an investment transaction by comparing the original cost of the
security lot sold with the net sale proceeds. Discounts and premiums on securities purchased are accreted or amortized, respectively, over the life of each such security.
|
|
g).
|
Use of Estimates – The preparation of financial statements in conformity with GAAP requires management to make estimates and assumptions that affect the reported amounts of assets and liabilities and disclosure
of contingent assets and liabilities at the date of the financial statements and the reported change in net assets during the reporting period. Actual results could differ from those estimates.
|
|
h).
|
Share Valuation – The net asset value (“NAV”) per share of the Fund is calculated by dividing (i) the total value of the securities held by the Fund, plus cash and other assets, minus all liabilities (including
estimated accrued expenses) by (ii) the total number of shares outstanding for the Fund, rounded to the nearest $0.01. The Fund’s shares will not be priced on days the New York Stock Exchange is closed for trading. The offering and
redemption price per share for the Fund is equal to the Fund’s NAV per share.
|
3). SECURITIES VALUATION
The Fund follows fair value accounting standards that establish an authoritative definition of fair value and set out a hierarchy for measuring fair value. These standards require additional disclosures about the
various inputs and valuation techniques used to develop the measurements of fair value and a discussion of changes in valuation techniques and related inputs during the period. These inputs are summarized in the three broad levels listed below:
|
Level 1 –
|
Unadjusted, quoted prices in active markets for identical instruments that the Fund has the ability to access at the date of measurement.
|
|
|
Level 2 –
|
Other significant observable inputs (including, but not limited to, quoted prices in active markets for similar instruments, quoted prices in markets that are not active for identical or similar instruments, and
model-derived valuations in which all significant inputs and significant value drivers are observable in active markets, such as interest rates, prepayment speeds, credit risk curves, default rates, and similar data).
|
|
|
Level 3 –
|
Significant unobservable inputs (including the Fund’s own assumptions about what market participants would use to price the asset or liability based on the best available information) when observable inputs are
unavailable.
|
|
HENNESSY FUNDS
|
1-800-966-4354
|
17
The following is a description of the valuation techniques applied to the Fund’s major categories of assets and liabilities measured at fair value on a recurring basis:
|
Equity Securities – Equity securities, including common stocks, preferred stocks, exchange-traded funds, closed-end mutual funds, partnerships, rights, and real estate
investment trusts, that are traded on a securities exchange for which a last-quoted sales price is readily available will generally be valued at the last sales price as reported by the primary exchange on which the securities are listed.
Securities listed on The NASDAQ Stock Market (“NASDAQ”) will generally be valued at the NASDAQ Official Closing Price, which may differ from the last sales price reported. Securities traded on a securities exchange for which a last-quoted
sales price is not readily available will generally be valued at the mean between the bid and ask prices. To the extent these securities are actively traded and valuation adjustments are not applied, they are classified in Level 1 of the
fair value hierarchy.
|
|
|
Registered Investment Companies – Investments in open-end registered investment companies, commonly referred to as mutual funds, generally are priced at the ending NAV
provided by the applicable mutual fund’s service agent and will be classified in Level 1 of the fair value hierarchy.
|
|
|
Debt Securities – Debt securities, including corporate bonds, asset-backed securities, mortgage-backed securities, municipal bonds, U.S. Treasuries, and U.S. government
agency issues, are generally valued at market on the basis of valuations furnished by an independent pricing service that utilizes both dealer-supplied valuations and formula-based techniques. The pricing service may consider recently
executed transactions in securities of the issuer or comparable issuers, market price quotations (where observable), bond spreads, and fundamental data relating to the issuer. In addition, the model may incorporate observable market data,
such as reported sales of similar securities, broker quotes, yields, bids, offers, and reference data. Certain securities are valued primarily using dealer quotations. These securities are generally classified in Level 2 of the fair value
hierarchy.
|
|
|
Short-Term Securities – Short-term equity investments, including money market funds, are valued in the manner specified above. Short-term debt investments with an
original term to maturity of 60 days or less are valued at amortized cost, which approximates fair market value. If the original term to maturity of a short-term debt investment exceeded 60 days, then the values as of the 61st day prior
to maturity are amortized. Amortized cost is not used if its use would be inappropriate due to credit or other impairments of the issuer, in which case the security’s fair value would be determined, as described below. Short-term
securities are generally classified in Level 1 or Level 2 of the fair value hierarchy depending on the inputs used and market activity levels for specific securities.
|
The Board of Trustees of the Fund (the “Board”) has adopted fair value pricing procedures that are followed when a price for a security is not readily available or if a significant event has occurred
that indicates the closing price of a security no longer represents the true value of that security. Fair value pricing determinations are made in good faith in accordance with these procedures. There are numerous criteria that will be given
consideration in determining a fair value of a security, such as the trading volume of a security and markets, the values of other similar securities, and news events with direct bearing on a security or markets. Fair value pricing results in an
estimated price for a security that reflects the amount the Fund might reasonably expect to receive in a current sale. Depending on the relative significance of the valuation inputs, these securities may be classified in either Level 2 or Level 3
of the fair value hierarchy.
|
HENNESSYFUNDS.COM
|
18
|
NOTES TO THE FINANCIAL STATEMENTS
|
The Board has delegated day-to-day valuation matters to the Valuation and Liquidity Committee comprising representatives from Hennessy Advisors, Inc., the Fund’s investment advisor (the “Advisor”).
The function of the Valuation and Liquidity Committee is to value securities where current and reliable market quotations are not readily available. All actions taken by the Valuation and Liquidity Committee are reviewed by the Board.
The Fund has performed an analysis of all existing investments to determine the significance and character of all inputs to their fair value determinations. Various inputs are used to determine the
value of the Fund’s investments. The inputs or methodology used for valuing securities are not necessarily an indication of the risk associated with investing in those securities. Details related to the fair value hierarchy of the Fund’s
securities as of April 30, 2020, are included in the Schedule of Investments.
4). INVESTMENT TRANSACTIONS
Purchases and sales of investment securities (excluding government and short-term investments) for the Fund during the six months ended April 30, 2020, were $0 and $66,179,569, respectively.
There were no purchases or sales/maturities of long-term U.S. government securities for the Fund during the six months ended April 30, 2020.
The Fund is permitted to purchase or sell securities from or to another fund in the Hennessy Funds family of funds (collectively, the “Hennessy Funds”) under specified conditions outlined in
procedures adopted by the Board. The procedures have been designed to ensure that any purchase or sale of securities by the Fund from or to another Hennessy Fund complies with Rule 17a-7 of the Investment Company Act of 1940, as amended. During
the six months ended April 30, 2020, the Fund did not engage in purchases or sales of securities pursuant to Rule 17a-7 of the Investment Company Act of 1940, as amended.
5). INVESTMENT ADVISORY FEE AND OTHER TRANSACTIONS WITH AFFILIATES
The Advisor provides the Fund with investment advisory services under an Investment Advisory Agreement. The Advisor furnishes all investment advice, office space, and facilities and most of the personnel needed by the
Fund. As compensation for its services, the Advisor is entitled to a monthly fee from the Fund. The fee is based on the average daily net assets of the Fund at an annual rate of 0.74%. The net investment advisory fees expensed by the Fund during
the six months ended April 30, 2020, are included in the Statement of Operations.
The Board has approved a Shareholder Servicing Agreement for Investor Class shares of the Fund, which was instituted to compensate the Advisor for the non-investment advisory services it provides to
the Fund. The Shareholder Servicing Agreement provides for a monthly fee paid to the Advisor at an annual rate of 0.10% of the average daily net assets of the Fund attributable to Investor Class shares. The shareholder service fees expensed by
the Fund during the six months ended April 30, 2020, are included in the Statement of Operations.
The Fund has adopted a plan pursuant to Rule 12b-1 under the Investment Company Act of 1940, as amended, that authorizes payments in connection with the distribution of the Fund’s shares at an annual
rate of up to 0.25% of the Fund’s average daily net assets attributable to Investor Class shares. Even though the authorized rate is up to 0.25%, the Fund is currently only using up to 0.15% of its average daily net assets attributable to
Investor Class shares for such purpose. Amounts paid under the plan may be spent on any activities or expenses primarily intended to result in the sale of shares,
|
HENNESSY FUNDS
|
1-800-966-4354
|
19
including, but not limited to, advertising, shareholder account servicing, printing and mailing of prospectuses to other than current shareholders, printing and mailing of sales literature, and compensation for sales
and marketing activities or to financial institutions and others, such as dealers and distributors. The distribution fees expensed by the Fund during the six months ended April 30, 2020, are included in the Statement of Operations.
The Fund has entered into agreements with various brokers, dealers, and financial intermediaries in connection with the sale of shares of the Fund. The agreements provide for periodic payments of
sub-transfer agent expenses by the Fund to the brokers, dealers, and financial intermediaries for providing certain shareholder maintenance services. These shareholder services include the pre-processing and quality control of new accounts,
shareholder correspondence, answering customer inquiries regarding account status, and facilitating shareholder telephone transactions. The sub-transfer agent fees expensed by the Fund during the six months ended April 30, 2020, are included in
the Statement of Operations.
U.S. Bancorp Fund Services, LLC, d/b/a U.S. Bank Global Fund Services (“Fund Services”) provides the Fund with administrative, accounting, and transfer agent services. As administrator, Fund Services
is responsible for activities such as (i) preparing various federal and state regulatory filings, reports, and returns for the Fund, (ii) preparing reports and materials to be supplied to the Board, (iii) monitoring the activities of the Fund’s
custodian, transfer agent, and accountants, and (iv) coordinating the preparation and payment of the Fund’s expenses and reviewing the Fund’s expense accruals. U.S. Bank N.A., an affiliate of Fund Services, serves as the Fund’s custodian. The
servicing agreements between the Trust and Fund Services and U.S. Bank N.A. contain a fee schedule that is inclusive of administrative, accounting, custody, and transfer agent fees. The administrative, accounting, custody, and transfer agent fees
expensed by the Fund during the six months ended April 30, 2020, are included in the Statement of Operations.
Quasar Distributors, LLC (“Quasar”) acts as the Fund’s principal underwriter in a continuous public offering of the Fund’s shares. Quasar was an affiliate of Fund Services and U.S. Bank N.A. through
March 30, 2020. Effective March 31, 2020, Foreside Financial Group, LLC (“Foreside”) acquired Quasar from Fund Services. As a result of the acquisition, Quasar became a wholly owned broker-dealer subsidiary of Foreside and is no longer affiliated
with Fund Services or U.S. Bank N.A. The Board approved a new Distribution Agreement to enable Quasar to continue serving as the Fund’s distributor.
The officers of the Fund are affiliated with the Advisor. With the exception of the Chief Compliance Officer and the Senior Compliance Officer, such officers receive no compensation from the Fund for
serving in their respective roles. The Fund, along with the other Hennessy Funds, makes reimbursement payments on an equal basis to the Advisor for a portion of the salary and benefits associated with the office of the Chief Compliance Officer
and for all of the salary and benefits associated with the office of the Senior Compliance Officer. The compliance fees expensed by the Fund during the six months ended April 30, 2020, are included in the Statement of Operations.
6). GUARANTEES AND INDEMNIFICATIONS
Under the Hennessy Funds’ organizational documents, their officers and trustees are indemnified by the Hennessy Funds against certain liabilities arising out of the performance of their duties to the Hennessy Funds.
Additionally, in the normal course of business, the Hennessy Funds enter into contracts with service providers that contain general indemnification clauses. The Fund’s maximum exposure under these arrangements is unknown as this would involve
future claims that may be made against the Fund that have not yet occurred. Currently, the Fund expects the risk of loss to be remote.
|
HENNESSYFUNDS.COM
|
20
|
NOTES TO THE FINANCIAL STATEMENTS
|
7). LINE OF CREDIT
The Fund has an uncommitted line of credit with the other Hennessy Funds in the amount of the lesser of (i) $100,000,000 or (ii) 33.33% of each Hennessy Fund’s net assets, or 30% for the Hennessy Gas Utility Fund and
10% for the Hennessy Balanced Fund, intended to provide short-term financing, if necessary, subject to certain restrictions, in connection with shareholder redemptions. The credit facility is with the Hennessy Funds’ custodian bank, U.S. Bank
N.A. Borrowings under this arrangement bear interest at the bank’s prime rate and are secured by all of the Fund’s assets (as to its own borrowings only). During the six months ended April 30, 2020, the Fund had an outstanding average daily
balance and a weighted average interest rate of $9,412 and 4.64%, respectively. The interest expensed by the Fund during the six months ended April 30, 2020, is included in the Statement of Operations. The maximum amount outstanding for the Fund
during the period was $531,000. As of April 30, 2020, the Fund did not have any borrowings outstanding under the line of credit.
8). FEDERAL TAX INFORMATION
As of October 31, 2019, the Fund’s most recent fiscal year end, the components of accumulated earnings (losses) for income tax purposes were as follows:
|
Investments
|
|||||
|
Cost of investments for tax purposes
|
$
|
366,713,711
|
|||
|
Gross tax unrealized appreciation
|
$
|
15,338,127
|
|||
|
Gross tax unrealized depreciation
|
(6,545,308
|
)
|
|||
|
Net tax unrealized appreciation/(depreciation)
|
$
|
8,792,819
|
|||
|
Undistributed ordinary income
|
$
|
—
|
|||
|
Undistributed long-term capital gains
|
—
|
||||
|
Total distributable earnings
|
$
|
—
|
|||
|
Other accumulated gain/(loss)
|
$
|
(87,721,310
|
)
|
||
|
Total accumulated gain/(loss)
|
$
|
(78,928,491
|
)
|
||
The difference between book-basis unrealized appreciation/depreciation and tax-basis unrealized appreciation/depreciation (as shown above) is attributable primarily to wash sales.
As of October 31, 2019, the Fund had capital loss carryforwards as follows:
|
$44,528,232
|
Unlimited Long-Term
|
|
|
$40,746,684
|
Unlimited Short-Term
|
As of October 31, 2019, the Fund deferred, on a tax basis, a late-year ordinary loss of $2,446,394. Late-year ordinary losses are net ordinary losses incurred after December 31, 2018, but within the
taxable year, that are deemed to arise on the first day of the Fund’s next taxable year.
During fiscal year 2020 (year to date) and fiscal year 2019, the tax character of distributions paid by the Fund was as follows:
|
Six Months Ended
|
Year Ended
|
||||||||
|
April 30, 2020
|
October 31, 2019
|
||||||||
|
Ordinary income(1)
|
$
|
—
|
$
|
5,427,863
|
|||||
|
Long-term capital gain
|
—
|
157,426,669
|
|||||||
|
$
|
—
|
$
|
162,854,532
|
||||||
|
(1) Ordinary income includes short-term capital gain.
|
|
HENNESSY FUNDS
|
1-800-966-4354
|
21
9). EVENTS SUBSEQUENT TO PERIOD END
Management has evaluated the Fund’s related events and transactions that occurred subsequent to April 30, 2020, through the date of issuance of the Fund’s financial statements. Management has determined that there were
no subsequent events requiring recognition or disclosure in the financial statements.
|
HENNESSYFUNDS.COM
|
22
|
NOTES TO THE FINANCIAL STATEMENTS/EXPENSE EXAMPLE
|
Expense Example (Unaudited)
April 30, 2020
As a shareholder of the Fund, you incur ongoing costs, including management fees, service fees, and other Fund expenses. This Example is intended to help you understand your ongoing costs (in dollars) of investing in
the Fund and to compare these costs with the ongoing costs of investing in other mutual funds. The Example is based on an investment of $1,000 invested at the beginning of the period and held for the entire period from November 1, 2019, through
April 30, 2020.
Actual Expenses
The first line of the table below under the “Investor Class” and “Institutional Class” headings provides information about actual account values and actual expenses. Although the Fund charges no sales loads or
transaction fees, you will be assessed fees for outgoing wire transfers, returned checks and stop payment orders at prevailing rates charged by U.S. Bank Global Fund Services, the Fund’s transfer agent. If you request that a redemption be made by
wire transfer, currently a $15 fee is charged by the Fund’s transfer agent. IRA accounts will be charged a $15 annual maintenance fee. The example below includes, but is not limited to, management fees, shareholder servicing fees, accounting,
custody, and transfer agent fees. However, the example below does not include portfolio trading commissions and related expenses. You may use the information in this line, together with the amount you invested, to estimate the expenses that you
paid over the period. Simply divide your account value by $1,000 (for example, an $8,600 account value divided by $1,000 = 8.6), then multiply the result by the number in the first line of the table under the “Investor Class” or “Institutional
Class” headings in the column entitled “Expenses Paid During Period” to estimate the expenses you paid on your account during this period.
Hypothetical Example for Comparison Purposes
The second line of the table below under the “Investor Class” and “Institutional Class” headings provides information about hypothetical account values and hypothetical expenses based on the Fund’s actual expense ratios
and an assumed rate of return of 5% per year before expenses, which is not the Fund’s actual return. The hypothetical account values and expenses may not be used to estimate the actual ending account balance or expenses you paid for the period.
You may use this information to compare the ongoing costs of investing in the Fund and other funds. To do so, compare this 5% hypothetical example with the 5% hypothetical examples that appear in the shareholder reports of the other funds. Please
note that the expenses shown in the table are meant to highlight your ongoing costs only. Therefore, the second line of the table under the “Investor Class” and “Institutional Class” headings is useful in comparing ongoing costs only and will not
help you determine the relative total costs of owning different funds.
|
HENNESSY FUNDS
|
1-800-966-4354
|
23
|
Beginning
|
Ending
|
||
|
Account Value
|
Account Value
|
Expenses Paid
|
|
|
November 1, 2019
|
April 30, 2020
|
During Period(1)
|
|
|
Investor Class
|
|||
|
Actual
|
$1,000.00
|
$ 794.30
|
$6.11
|
|
Hypothetical (5% return before expenses)
|
$1,000.00
|
$1,018.05
|
$6.87
|
|
Institutional Class
|
|||
|
Actual
|
$1,000.00
|
$ 795.30
|
$4.55
|
|
Hypothetical (5% return before expenses)
|
$1,000.00
|
$1,019.79
|
$5.12
|
|
(1)
|
Expenses are equal to the Fund’s annualized expense ratio of 1.37% for Investor Class shares or 1.02% for Institutional Class shares, as applicable, multiplied by the average account value over the period,
multiplied by 182/366 days (to reflect the half-year period).
|
|
HENNESSYFUNDS.COM
|
24
|
EXPENSE EXAMPLE — ELECTRONIC DELIVERY
|
How to Obtain a Copy of the Fund’s Proxy
Voting Policy and Proxy Voting Records
A description of the policies and procedures the Fund uses to determine how to vote proxies relating to portfolio securities is available without charge (1) by calling 1-800-966-4354, (2) on the Hennessy Funds’ website
at www.hennessyfunds.com/proxy-voting/voting-policy, or (3) on the U.S. Securities and Exchange Commission’s (the “SEC”) website at www.sec.gov. The Fund’s proxy voting record is available without charge on both the Hennessy Funds’ website at
www.hennessyfunds.com/proxy-voting/voting-record and the SEC’s website at www.sec.gov no later than August 31 for the prior 12 months ending June 30.
Availability of Quarterly Portfolio Schedule
The Fund files a complete schedule of portfolio holdings with the SEC for the first and third quarters of each fiscal year as an exhibit to its reports on Form N-PORT. The Fund’s Forms N-PORT are available on the SEC’s
website at www.sec.gov or on request by calling 1-800-966-4354.
Federal Tax Distribution Information (Unaudited)
For fiscal year 2019, certain dividends paid by the Fund may be subject to a maximum tax rate of 23.8%, as provided for by the Jobs and Growth Tax Relief Reconciliation Act of 2003. The percentage of dividends declared
from ordinary income designated as qualified dividend income was 100.00%.
For corporate shareholders, the percent of ordinary income distributions that qualified for the corporate dividends received deduction for fiscal year 2019 was 100.00%.
The percentage of taxable ordinary income distributions that were designated as short-term capital gain distributions under Section 871(k)(2)(C) of the Internal Revenue Code of 1986, as amended, for
the Fund was 100.00%.
Important Notice Regarding Delivery
of Shareholder Documents
To help keep the Fund’s costs as low as possible, we generally deliver a single copy of shareholder reports, proxy statements, and prospectuses to shareholders who share an address and have the same last name. This
process does not apply to account statements. You may request an individual copy of a shareholder document at any time. If you would like to receive separate mailings of shareholder documents, please call U.S. Bank Global Fund Services at
1-800-261-6950 or 1-414-765-4124, and individual delivery will begin within 30 days of your request. If your account is held through a financial institution or other intermediary, please contact such intermediary directly to request individual
delivery.
Electronic Delivery
The Funds offer shareholders the option to receive account statements, prospectuses, tax forms, and shareholder reports online. To sign up for eDelivery, please visit www.hennessyfunds.com/account. You may change your
delivery preference at any time by visiting our website or calling U.S. Bank Global Fund Services at 1-800-261-6950 or 1-414-765-4124.
|
HENNESSY FUNDS
|
1-800-966-4354
|
25
Board Approval of Investment Advisory
Agreement
At its meeting on March 12, 2020, the Board of Trustees of the Fund (the “Board,” and the members thereof, the “Trustees”) unanimously approved the continuation of the investment advisory agreement of the Fund with
Hennessy Advisors, Inc. (the “Advisor”). As part of the process of approving the continuation of the advisory agreement, the Trustees reviewed their fiduciary duties and the relevant factors for them to consider with respect to approving the
advisory agreement. In addition, the Trustees who are not deemed “interested persons” (as defined by the Investment Company Act of 1940, as amended) of the Fund (the “Independent Trustees”) met in executive session to discuss the approval of the
advisory agreement.
In advance of the meeting, the Advisor sent detailed information to the Trustees to assist them in their evaluation of the advisory agreement. This information included, but was not limited to, the
following:
|
(1)
|
A memorandum from outside legal counsel that described the fiduciary duties of the Board with respect to approving the continuation of the advisory agreement and the relevant factors for consideration;
|
|
|
(2)
|
A memorandum from the Advisor that listed the factors relevant to the Board’s approval of the continuation of the advisory agreement and also referenced the documents that had been provided to help the Board
assess each such factor;
|
|
|
(3)
|
An inventory of the services provided by the Advisor;
|
|
|
(4)
|
A written discussion of economies of scale;
|
|
|
(5)
|
A summary of the key terms of the advisory agreement;
|
|
|
(6)
|
A recent Fund fact sheet, which included performance information over various periods;
|
|
|
(7)
|
A peer expense comparison of the net expense ratio and investment advisory fee of the Fund; and
|
|
|
(8)
|
The Advisor’s financial statements from its most recent Form 10-K and Form 10-Q.
|
All of the factors discussed were considered as a whole by the Trustees and by the Independent Trustees meeting in executive session. The factors were viewed in their totality by the Trustees, with no
single factor being the principal or determinative factor in the Trustees’ determination of whether to approve the continuation of the advisory agreement. The Trustees recognized that the management and fee arrangements for the Fund are the
result of years of review and discussion between the Independent Trustees and the Advisor, that certain aspects of such arrangements may receive greater scrutiny in some years than in others, and that the Trustees’ conclusions may be based, in
part, on their consideration of these same arrangements and information received during the course of the year and in prior years.
Prior to approving the continuation of the advisory agreement, the Trustees, including the Independent Trustees in executive session, considered, among other items:
|
(1)
|
The nature and quality of the advisory services provided by the Advisor;
|
|
|
(2)
|
A comparison of the fees and expenses of the Fund to other similar funds;
|
|
|
(3)
|
Whether economies of scale are recognized by the Fund;
|
|
HENNESSYFUNDS.COM
|
26
|
BOARD APPROVAL OF INVESTMENT ADVISORY AGREEMENT
|
|
(4)
|
The costs and profitability of the Fund to the Advisor;
|
|
|
(5)
|
The performance of the Fund; and
|
|
|
(6)
|
Any benefits to the Advisor from serving as an investment advisor to the Fund (other than the advisory fee).
|
The material considerations and determinations of the Trustees, including the Independent Trustees, were as follows:
|
(1)
|
The Trustees considered the services identified below that are provided by the Advisor. Based on this review, the Trustees concluded that the Advisor provides high-quality services to the Fund and noted that
their overall confidence in the Advisor was high. The Trustees also concluded that they were satisfied with the nature, extent, and quality of the advisory services provided to the Fund by the Advisor and that the nature and extent of the
services provided by the Advisor were appropriate to assure that the Fund’s operations are conducted in compliance with applicable laws, rules, and regulations.
|
|
(a)
|
The Advisor acts as the portfolio manager for the Fund. In this capacity, the Advisor does the following:
|
|
(i)
|
manages the composition of the Fund’s portfolio, including the purchase, retention, and disposition of portfolio securities in accordance with the Fund’s investment objectives, policies, and restrictions;
|
|||
|
(ii)
|
seeks best execution for the Fund’s portfolio;
|
|||
|
(iii)
|
manages the use of soft dollars for the Fund; and
|
|||
|
(iv)
|
manages proxy voting for the Fund.
|
|
(b)
|
The Advisor performs a daily reconciliation of portfolio positions and cash for the Fund.
|
||
|
(c)
|
The Advisor monitors the liquidity of each Fund.
|
||
|
(d)
|
The Advisor monitors the Fund’s compliance with its investment objectives and restrictions.
|
||
|
(e)
|
The Advisor monitors compliance with federal securities laws, maintains a compliance program (including a code of ethics), conducts ongoing reviews of the compliance programs of the Fund’s service providers, as
feasible, conducts on-site visits to the Fund’s service providers, monitors incidents of abusive trading practices, reviews Fund expense accruals, payments, and fixed expense ratios, evaluates insurance providers for fidelity bond,
D&O/E&O insurance, and cybersecurity insurance coverage, manages regulatory examination compliance and responses, conducts employee compliance training, reviews reports provided by service providers, and maintains books and
records.
|
||
|
(f)
|
The Advisor oversees service providers that provide accounting, administration, distribution, transfer agency, custodial, sales, marketing, public relations, audit, information technology, and legal services to
the Fund.
|
||
|
(g)
|
The Advisor maintains in-house marketing and distribution departments on behalf of the Fund.
|
||
|
(h)
|
The Advisor is actively involved with preparing regulatory filings for the Fund, including writing and annually updating the Fund’s prospectus and related documents.
|
|
HENNESSY FUNDS
|
1-800-966-4354
|
27
|
(i)
|
For each annual report of the Fund, the Advisor prepares a written summary of the Fund’s performance during the most recent 12-month period.
|
||
|
(j)
|
The Advisor oversees distribution of the Fund through third-party broker/dealers and independent financial institutions such as Charles Schwab, Inc., Fidelity, TD Ameritrade, and Pershing. The Advisor
participates in “no transaction fee” (“NTF”) programs with these companies on behalf of the Fund, which allow customers to purchase the Fund through third-party distribution channels without paying a transaction fee. The Advisor
compensates, in part, a number of these third-party providers of NTF programs out of its own revenues.
|
||
|
(k)
|
The Advisor pays the incentive compensation of the Fund’s compliance officers and employs other staff, such as legal, marketing, national accounts, distribution, sales, administrative, and trading oversight
personnel, as well as management executives.
|
||
|
(l)
|
The Advisor provides a quarterly compliance certification to the Board.
|
||
|
(m)
|
The Advisor prepares or reviews all Board materials, frequently presents to the Board and leads Board discussions, prepares or reviews all meeting minutes, and arranges for Board training and education.
|
|
(2)
|
The Trustees compared the performance of the Fund to benchmark indices over various periods and also noted that the Trustees review and discuss reports comparing the investment performance of the Fund to various
indices at each quarterly Board meeting. Based on such information, the Trustees determined that the Advisor manages the Fund in a manner materially consistent with its stated investment objective and style. The Trustees concluded that
the performance of the Fund over various periods warranted continuation of the advisory agreement.
|
|
|
(3)
|
The Trustees reviewed the advisory fees and overall expense ratios of the Fund compared to other funds similar in asset size and investment objective to the Fund using data from Morningstar. As part of the
discussion with management, the Trustees ensured that they understood and were comfortable with the criteria used to determine the mutual funds included in the Morningstar categories for purposes of the materials considered at the
meeting. The Trustees determined that the advisory fee and overall expense ratio of the Fund falls within the range of the advisory fees and overall expense ratios of other comparable funds and concluded that they are reasonable and
warranted continuation of the advisory agreement.
|
|
|
(4)
|
The Trustees also considered whether the Advisor was realizing economies of scale that it should share with the Fund’s shareholders. The Trustees noted that the assets of the Fund had declined over the prior
year. In addition, the Trustees noted that many of the expenses incurred to manage the Fund are asset-based fees, so the Advisor does not realize material economies of scale relating to those expenses as the assets of the Fund increase.
For example, mutual fund platform fees increase as the Fund’s assets grow. The Trustees also considered the Advisor’s efforts to contain expenses through actions such as renegotiating service contracts, the Advisor’s significant marketing
efforts to promote the Funds, the Advisor’s investments in personnel to manage the Funds, and the Advisor’s agreement to waive fees or lower its management fees in certain
|
|
HENNESSYFUNDS.COM
|
28
|
BOARD APPROVAL OF INVESTMENT ADVISORY AGREEMENT
|
|
circumstances. The Trustees noted that it did not appear that the Advisor was realizing economies of scale at current asset levels and concluded that it would continue to monitor economies of scale in the future
as circumstances changed.
|
||
|
(5)
|
The Trustees considered the profitability of the Advisor, including the impact of mutual fund platform fees on the Advisor’s profitability, and also considered the resources and revenues that the Advisor has put
into managing and distributing the Fund. The Trustees then concluded that the profits of the Advisor are reasonable and not excessive when compared to profitability guidelines set forth in relevant court cases.
|
|
|
(6)
|
The Trustees considered the high level of professionalism and knowledge of the Advisor’s employees, along with a very low level of turnover, and concluded that this was beneficial to the Fund and its
shareholders.
|
|
|
(7)
|
The Trustees considered any benefits to the Advisor from serving as an advisor to the Fund (other than the advisory fee). The Trustees noted that the Advisor may derive ancillary benefits from, by way of
example, its association with the Fund in the form of proprietary and third-party research products and services received from broker-dealers that execute portfolio trades for the Fund. The Trustees determined that any such products and
services have been used for legitimate purposes relating to the Fund by providing assistance in the investment decision-making process. The Trustees concluded that any additional benefits realized by the Advisor from its relationship with
the Fund were reasonable, which was based on, among other things, the Trustees’ finding that the research, analytical, statistical, and other information and services provided by brokers are merely supplemental to the Advisor’s own
efforts in the performance of its duties under the advisory agreement.
|
After reviewing the materials and information provided at the meeting, as well as other information regularly provided at the Board’s quarterly meetings throughout the year regarding the quality of
services provided by the Advisor, the performance of the Fund, expense information, brokerage commissions information, the adequacy and efficacy of the Advisor’s written policies and procedures, other regulatory compliance issues, trading
information and related matters, and other factors that the Trustees deemed relevant, the Trustees, including the Independent Trustees, approved the continuation of the advisory agreement.
|
HENNESSY FUNDS
|
1-800-966-4354
|
29
For information, questions, or assistance, please call
The Hennessy Funds
1-800-966-4354 or 1-415-899-1555
INVESTMENT ADVISOR
Hennessy Advisors, Inc.
7250 Redwood Boulevard, Suite 200
Novato, California 94945
ADMINISTRATOR,
TRANSFER AGENT,
DIVIDEND PAYING AGENT, &
SHAREHOLDER SERVICING AGENT
U.S. Bancorp Fund Services, LLC
d/b/a U.S. Bank Global Fund Services
P.O. Box 701
Milwaukee, Wisconsin 53201-0701
CUSTODIAN
U.S. Bank N.A.
Custody Operations
1555 North River Center Drive, Suite 302
Milwaukee, Wisconsin 53212
TRUSTEES
Neil J. Hennessy
Robert T. Doyle
J. Dennis DeSousa
Gerald P. Richardson
COUNSEL
Foley & Lardner LLP
777 East Wisconsin Avenue
Milwaukee, Wisconsin 53202-5306
INDEPENDENT REGISTERED
PUBLIC ACCOUNTING FIRM
Tait, Weller & Baker LLP
Two Liberty Place
50 South 16th Street, Suite 2900
Philadelphia, Pennsylvania 19102-2529
DISTRIBUTOR
Quasar Distributors, LLC
111 East Kilbourn Avenue, Suite 2200
Milwaukee, Wisconsin 53202
www.hennessyfunds.com | 1-800-966-4354
This report has been prepared for shareholders and may be distributed to
others only if preceded or accompanied by a current prospectus.
SEMI-ANNUAL REPORT
APRIL 30, 2020
HENNESSY CORNERSTONE LARGE GROWTH FUND
Investor Class HFLGX
Institutional Class HILGX
IMPORTANT NOTICE REGARDING ELECTRONIC DELIVERY OF SHAREHOLDER REPORTS
Beginning on January 1, 2021, as permitted by regulations adopted by the Securities and Exchange Commission, paper copies of the annual and semi-annual reports will
no longer be sent by mail unless you specifically request paper copies from the Hennessy Funds or from your financial intermediary. Instead, the reports will be made available on a website, and you will be notified by mail each time a
report is posted and provided with a website link to access the report.
If you have already elected to receive shareholder reports electronically, you will not be affected by this change and you need not take any action. You may elect
to receive shareholder reports and other communications from the Hennessy Funds electronically by visiting www.hennessyfunds.com/account or by calling U.S. Bank Global Fund Services at 1-800-261-6950. If you own shares in a Fund
through a financial intermediary, please contact your financial intermediary to make this election.
You may elect to receive paper copies of all future reports free of charge by calling U.S. Bank Global Fund Services at 1-800-261-6950 or, if you own your shares
through a financial intermediary, by contacting your financial intermediary. Your election to receive paper copies of reports will apply to all Funds in the Hennessy Funds family.
hennessyfunds.com | 1-800-966-4354
(This Page Intentionally Left Blank.)
Contents
|
Letter to Shareholders
|
2
|
|
Performance Overview
|
4
|
|
Financial Statements
|
|
|
Schedule of Investments
|
5
|
|
Statement of Assets and Liabilities
|
9
|
|
Statement of Operations
|
10
|
|
Statements of Changes in Net Assets
|
11
|
|
Financial Highlights
|
12
|
|
Notes to the Financial Statements
|
16
|
|
Expense Example
|
23
|
|
Proxy Voting Policy and Proxy Voting Records
|
25
|
|
Availability of Quarterly Portfolio Schedule
|
25
|
|
Federal Tax Distribution Information
|
25
|
|
Important Notice Regarding Delivery of Shareholder Documents
|
25
|
|
Electronic Delivery
|
25
|
|
Board Approval of Investment Advisory Agreement
|
26
|
|
HENNESSY FUNDS
|
1-800-966-4354
|
June 2020
Dear Hennessy Funds Shareholder:
First and foremost, I hope this communication finds you and your loved ones safe and healthy. In many ways, the COVID-19 pandemic has turned the world upside down in recent months, and we at Hennessy have joined the
rest of the world in witnessing and experiencing its profound effect on public health, the global economy, and the everyday lives of people around the world. In response to the crisis, we invoked our business continuity plan in mid-March to
ensure a smooth transition to remote work for all of our employees, who have been working safely and productively from home. We want to assure our Hennessy Funds shareholders that our operations are uninterrupted and functioning normally.
The past six months have been marked by extremes. During the first half of the period from November 2019 through January 2020, the bull market, supported by strong corporate fundamentals, continued
to move higher, and investors appeared focused on record-low unemployment and strong economic growth. In mid-February, the major U.S. market indices hit all-time highs, but then, within just a matter of weeks, lost over one-third of their
values as the COVID-19 pandemic unfolded. Shelter-in-place and business closure orders rippled through the nation, causing initial unemployment claims to skyrocket to their highest number in history. The market then rallied back and posted
double-digit positive returns in April.
For the six months ended April 30, 2020, on a total return basis, the Dow Jones Industrial Average was down 8.9% and the S&P 500® Index was down 3.2%. Small-cap and mid-cap stocks generally fared worse than large-cap stocks during the period, and the Financial sector was particularly hard hit as the Federal Reserve aggressively cut the federal funds
rate in an effort to stabilize the economy. The Energy sector was crushed by both the sudden loss of demand due to COVID-19 and the oversupply caused by the surprise market-share battle between Russia and Saudi Arabia, and the S&P 500® Energy Sector Index ended the six-month period down over 30%.
The COVID-19 pandemic is an unprecedented event, and the duration and full extent of the economic impact is unknown. In the moment, there is always the concern that ‘this time is different.’ But,
when you are able to look at past financial, political, and health crises with the benefit of 20/20 hindsight, history has demonstrated that our economy and financial markets have always rebounded and recovered eventually. If you look back to
the last market downturn in 2008, economic fundamentals were weak compared to the market in 2020, where the overall underpinnings were – and are still – quite strong. Publicly listed companies today have plenty of cash, with over $5 trillion
on balance sheets of the S&P 500® companies alone, and I believe that most will survive and that many may emerge from the current crisis even stronger.
|
HENNESSYFUNDS.COM
|
2
|
LETTER TO SHAREHOLDERS
|
We understand that this market volatility and economic uncertainty is jarring to many investors, and we continue to monitor events and the markets. We remain focused on managing our high-conviction
portfolios for the long-term benefit of our shareholders, and we are confident in the time-tested strategies and rigorous research that led to their formation. We encourage shareholders to maintain a long-term investment horizon and to remain
focused on long-term goals. As always, but especially in these trying times, we are here to support our shareholders, and we thank you for your continued investment and trust. Should you have any questions or would like to speak with us
directly, please don’t hesitate to call (800) 966-4354 or email us at fundsinfo@hennessyfunds.com.
Best regards,
Neil J. Hennessy
President and Chief Investment Officer
Past performance does not guarantee future results.
Mutual fund investing involves risk. Principal loss is possible.
The Dow Jones Industrial Average and S&P 500® Index are commonly used to measure the performance of U.S. stocks. The S&P 500® Energy Sector Index is an index that comprises those companies included in the S&P 500 that are classified as members of the GICS energy sector. One cannot
invest directly in an index.
|
HENNESSY FUNDS
|
1-800-966-4354
|
3
Performance Overview (Unaudited)
AVERAGE ANNUAL TOTAL RETURN FOR PERIODS ENDED APRIL 30, 2020
|
Six
|
One
|
Five
|
Ten
|
|
|
Months(1)
|
Year
|
Years
|
Years
|
|
|
Hennessy Cornerstone
|
||||
|
Large Growth Fund –
|
||||
|
Investor Class (HFLGX)
|
-13.00%
|
-10.88%
|
2.82%
|
8.46%
|
|
Hennessy Cornerstone
|
||||
|
Large Growth Fund –
|
||||
|
Institutional Class (HILGX)
|
-12.84%
|
-10.66%
|
3.08%
|
8.73%
|
|
Russell 1000® Index
|
-3.56%
|
0.09%
|
8.74%
|
11.57%
|
|
S&P 500® Index
|
-3.16%
|
0.86%
|
9.12%
|
11.69%
|
Expense ratios: 1.31% (Investor Class); 1.00% (Institutional Class)
|
(1)
|
Periods of less than one year are not annualized.
|
_______________
Performance data quoted represents past performance; past performance does not guarantee future results. The investment return and principal value of an investment will fluctuate so that an
investor’s shares, when redeemed, may be worth more or less than their original cost. The performance table does not reflect the deduction of taxes that a shareholder would pay on Fund distributions or the redemption of Fund shares. Current
performance of the Fund may be lower or higher than the performance quoted. Performance data current to the most recent month end may be obtained by visiting www.hennessyfunds.com.
The Russell 1000® Index comprises the 1,000 largest companies in the Russell 3000® Index based on market capitalization. The S&P 500® Index is a capitalization-weighted index designed to reflect the broad
domestic economy through changes in aggregate market value of 500 stocks representing all major industries. One cannot invest directly in an index. These indices are used herein for comparative purposes in accordance with SEC regulations.
Frank Russell Company (“Russell”) is the source and owner of the trademarks, service marks, and copyrights related to the Russell Indexes. Russell® is a trademark of Russell. Neither Russell nor its licensors accept any liability for any errors or omissions in the Russell Indexes or Russell ratings or underlying data and no party may rely on any Russell Indexes or
Russell ratings or underlying data contained in this communication. No further distribution of Russell data is permitted without Russell’s express written consent. Russell does not promote, sponsor, or endorse the content of this communication.
Standard & Poor’s Financial Services LLC is the source and owner of the S&P® and S&P 500® trademarks.
The expense ratios presented are from the most recent prospectus. The expense ratios for the current reporting period are available in the Financial Highlights section of this report.
|
HENNESSYFUNDS.COM
|
4
|
PERFORMANCE OVERVIEW/SCHEDULE OF INVESTMENTS
|
Financial Statements
|
Schedule of Investments as of April 30, 2020
(Unaudited)
|
HENNESSY CORNERSTONE LARGE GROWTH FUND
(% of Net Assets)
|
TOP TEN HOLDINGS (EXCLUDING MONEY MARKET FUNDS)
|
% NET ASSETS
|
|
Amgen, Inc.
|
2.56%
|
|
General Mills, Inc.
|
2.56%
|
|
eBay, Inc.
|
2.45%
|
|
Tractor Supply Co.
|
2.45%
|
|
Electronic Arts, Inc.
|
2.43%
|
|
Walmart, Inc.
|
2.39%
|
|
Oracle Corp.
|
2.34%
|
|
3M Co.
|
2.33%
|
|
Cummins, Inc.
|
2.29%
|
|
United Parcel Service, Inc., Class B
|
2.27%
|
Note: For presentation purposes, the Fund has grouped some of the industry categories. For purposes of categorizing securities for compliance with Section 8(b)(1) of the Investment Company Act of 1940, as amended, the
Fund uses more specific industry classifications.
The Global Industry Classification Standard (GICS®) was developed by and is the exclusive property and a service mark of MSCI, Inc. and
Standard & Poor’s Financial Services LLC. It has been licensed for use by the Hennessy Funds.
|
HENNESSY FUNDS
|
1-800-966-4354
|
5
|
COMMON STOCKS – 98.35%
|
Number
|
% of
|
||||||||||
|
|
of Shares
|
Value
|
Net Assets
|
|||||||||
|
Communication Services – 5.69%
|
||||||||||||
|
Electronic Arts, Inc. (a)
|
22,700
|
$
|
2,593,702
|
2.43
|
%
|
|||||||
|
Omnicom Group, Inc.
|
32,300
|
1,842,069
|
1.73
|
%
|
||||||||
|
ViacomCBS, Inc.
|
94,388
|
1,629,137
|
1.53
|
%
|
||||||||
|
|
6,064,908
|
5.69
|
%
|
|||||||||
|
Consumer Discretionary – 19.96%
|
||||||||||||
|
Advance Auto Parts, Inc.
|
17,400
|
2,103,834
|
1.98
|
%
|
||||||||
|
AutoZone, Inc. (a)
|
2,300
|
2,346,736
|
2.20
|
%
|
||||||||
|
Best Buy Co., Inc.
|
29,200
|
2,240,516
|
2.10
|
%
|
||||||||
|
Darden Restaurants, Inc.
|
21,400
|
1,579,106
|
1.48
|
%
|
||||||||
|
DR Horton, Inc.
|
41,200
|
1,945,464
|
1.83
|
%
|
||||||||
|
eBay, Inc.
|
65,600
|
2,612,848
|
2.45
|
%
|
||||||||
|
Las Vegas Sands Corp.
|
39,800
|
1,911,196
|
1.79
|
%
|
||||||||
|
PulteGroup, Inc.
|
55,200
|
1,560,504
|
1.47
|
%
|
||||||||
|
Target Corp.
|
21,400
|
2,348,436
|
2.21
|
%
|
||||||||
|
Tractor Supply Co.
|
25,700
|
2,606,751
|
2.45
|
%
|
||||||||
|
|
21,255,391
|
19.96
|
%
|
|||||||||
|
Consumer Staples – 6.66%
|
||||||||||||
|
General Mills, Inc.
|
45,600
|
2,730,984
|
2.56
|
%
|
||||||||
|
Sysco Corp.
|
32,300
|
1,817,521
|
1.71
|
%
|
||||||||
|
Walmart, Inc.
|
20,900
|
2,540,395
|
2.39
|
%
|
||||||||
|
|
7,088,900
|
6.66
|
%
|
|||||||||
|
Energy – 4.90%
|
||||||||||||
|
ConocoPhillips
|
44,500
|
1,873,450
|
1.76
|
%
|
||||||||
|
EOG Resources, Inc.
|
35,700
|
1,696,107
|
1.59
|
%
|
||||||||
|
Pioneer Natural Resources Co.
|
18,400
|
1,643,304
|
1.55
|
%
|
||||||||
|
|
5,212,861
|
4.90
|
%
|
|||||||||
|
Financials – 4.22%
|
||||||||||||
|
T. Rowe Price Group, Inc.
|
18,900
|
2,185,407
|
2.05
|
%
|
||||||||
|
The Progressive Corp.
|
29,900
|
2,311,270
|
2.17
|
%
|
||||||||
|
|
4,496,677
|
4.22
|
%
|
|||||||||
|
Health Care – 10.64%
|
||||||||||||
|
Amgen, Inc.
|
11,400
|
2,727,108
|
2.56
|
%
|
||||||||
|
Biogen, Inc. (a)
|
7,400
|
2,196,542
|
2.06
|
%
|
||||||||
|
HCA Healthcare, Inc.
|
18,000
|
1,977,840
|
1.86
|
%
|
||||||||
The accompanying notes are an integral part of these financial statements.
|
HENNESSYFUNDS.COM
|
6
|
SCHEDULE OF INVESTMENTS
|
|
COMMON STOCKS
|
Number
|
% of
|
||||||||||
|
|
of Shares
|
Value
|
Net Assets
|
|||||||||
|
Health Care (Continued)
|
||||||||||||
|
Henry Schein, Inc. (a)
|
37,900
|
$
|
2,067,824
|
1.94
|
%
|
|||||||
|
Merck & Co., Inc.
|
29,800
|
2,364,332
|
2.22
|
%
|
||||||||
|
|
11,333,646
|
10.64
|
%
|
|||||||||
|
Industrials – 31.65%
|
||||||||||||
|
3M Co.
|
16,300
|
2,476,296
|
2.33
|
%
|
||||||||
|
American Airlines Group, Inc.
|
103,500
|
1,243,035
|
1.17
|
%
|
||||||||
|
Caterpillar, Inc.
|
18,600
|
2,164,668
|
2.03
|
%
|
||||||||
|
CSX Corp.
|
31,700
|
2,099,491
|
1.97
|
%
|
||||||||
|
Cummins, Inc.
|
14,900
|
2,436,150
|
2.29
|
%
|
||||||||
|
Deere & Co.
|
14,400
|
2,088,864
|
1.96
|
%
|
||||||||
|
Delta Air Lines, Inc.
|
47,000
|
1,217,770
|
1.14
|
%
|
||||||||
|
Emerson Electric Co.
|
35,900
|
2,047,377
|
1.92
|
%
|
||||||||
|
General Dynamics Corp.
|
13,800
|
1,802,556
|
1.69
|
%
|
||||||||
|
Masco Corp.
|
54,000
|
2,216,160
|
2.08
|
%
|
||||||||
|
Norfolk Southern Corp.
|
12,300
|
2,104,530
|
1.98
|
%
|
||||||||
|
PACCAR, Inc.
|
34,200
|
2,367,666
|
2.22
|
%
|
||||||||
|
Southwest Airlines Co.
|
48,200
|
1,506,250
|
1.41
|
%
|
||||||||
|
Union Pacific Corp.
|
14,000
|
2,237,060
|
2.10
|
%
|
||||||||
|
United Airlines Holdings, Inc. (a)
|
33,900
|
1,002,762
|
0.94
|
%
|
||||||||
|
United Parcel Service, Inc., Class B
|
25,500
|
2,413,830
|
2.27
|
%
|
||||||||
|
United Rentals, Inc. (a)
|
17,800
|
2,287,300
|
2.15
|
%
|
||||||||
|
|
33,711,765
|
31.65
|
%
|
|||||||||
|
Information Technology – 14.63%
|
||||||||||||
|
Cisco Systems, Inc.
|
56,000
|
2,373,280
|
2.23
|
%
|
||||||||
|
Cognizant Technology Solutions Corp., Class A
|
37,100
|
2,152,542
|
2.02
|
%
|
||||||||
|
Intel Corp.
|
40,050
|
2,402,199
|
2.26
|
%
|
||||||||
|
International Business Machines Corp.
|
16,900
|
2,121,964
|
1.99
|
%
|
||||||||
|
NetApp, Inc.
|
49,000
|
2,144,730
|
2.01
|
%
|
||||||||
|
Oracle Corp.
|
47,000
|
2,489,590
|
2.34
|
%
|
||||||||
|
The Western Union Co.
|
99,500
|
1,897,465
|
1.78
|
%
|
||||||||
|
|
15,581,770
|
14.63
|
%
|
|||||||||
|
Total Common Stocks
|
||||||||||||
|
(Cost $114,262,337)
|
104,745,918
|
98.35
|
%
|
|||||||||
The accompanying notes are an integral part of these financial statements.
|
HENNESSY FUNDS
|
1-800-966-4354
|
7
|
SHORT-TERM INVESTMENTS – 1.82%
|
Number
|
% of
|
||||||||||
|
|
of Shares
|
Value
|
Net Assets
|
|||||||||
|
Money Market Funds – 1.82%
|
||||||||||||
|
First American Government Obligations Fund,
|
||||||||||||
|
Institutional Class, 0.25% (b)
|
1,940,247
|
$
|
1,940,247
|
1.82
|
%
|
|||||||
|
|
||||||||||||
|
Total Short-Term Investments
|
||||||||||||
|
(Cost $1,940,247)
|
1,940,247
|
1.82
|
%
|
|||||||||
|
|
||||||||||||
|
Total Investments
|
||||||||||||
|
(Cost $116,202,584) – 100.17%
|
106,686,165
|
100.17
|
%
|
|||||||||
|
Liabilities in Excess of Other Assets – (0.17)%
|
(178,796
|
)
|
(0.17
|
)%
|
||||||||
|
|
||||||||||||
|
TOTAL NET ASSETS – 100.00%
|
$
|
106,507,369
|
100.00
|
%
|
||||||||
Percentages are stated as a percent of net assets.
|
(a)
|
Non-income-producing security.
|
|
(b)
|
The rate listed is the fund’s seven-day yield as of April 30, 2020.
|
Summary of Fair Value Exposure as of April 30, 2020
The following is a summary of the inputs used to value the Fund’s net assets as of April 30, 2020 (see Note 3 in the accompanying Notes to the Financial Statements):
|
Common Stocks
|
Level 1
|
Level 2
|
Level 3
|
Total
|
||||||||||||
|
Communication Services
|
$
|
6,064,908
|
$
|
—
|
$
|
—
|
$
|
6,064,908
|
||||||||
|
Consumer Discretionary
|
21,255,391
|
—
|
—
|
21,255,391
|
||||||||||||
|
Consumer Staples
|
7,088,900
|
—
|
—
|
7,088,900
|
||||||||||||
|
Energy
|
5,212,861
|
—
|
—
|
5,212,861
|
||||||||||||
|
Financials
|
4,496,677
|
—
|
—
|
4,496,677
|
||||||||||||
|
Health Care
|
11,333,646
|
—
|
—
|
11,333,646
|
||||||||||||
|
Industrials
|
33,711,765
|
—
|
—
|
33,711,765
|
||||||||||||
|
Information Technology
|
15,581,770
|
—
|
—
|
15,581,770
|
||||||||||||
|
Total Common Stocks
|
$
|
104,745,918
|
$
|
—
|
$
|
—
|
$
|
104,745,918
|
||||||||
|
Short-Term Investments
|
||||||||||||||||
|
Money Market Funds
|
$
|
1,940,247
|
$
|
—
|
$
|
—
|
$
|
1,940,247
|
||||||||
|
Total Short-Term Investments
|
$
|
1,940,247
|
$
|
—
|
$
|
—
|
$
|
1,940,247
|
||||||||
|
Total Investments
|
$
|
106,686,165
|
$
|
—
|
$
|
—
|
$
|
106,686,165
|
||||||||
The accompanying notes are an integral part of these financial statements.
|
HENNESSYFUNDS.COM
|
8
|
SCHEDULE OF INVESTMENTS/STATEMENT OF ASSETS AND LIABILITIES
|
Financial Statements
|
Statement of Assets and Liabilities as of April 30, 2020 (Unaudited)
|
|
ASSETS:
|
||||
|
Investments in securities, at value (cost $116,202,584)
|
$
|
106,686,165
|
||
|
Dividends and interest receivable
|
75,668
|
|||
|
Receivable for fund shares sold
|
151,044
|
|||
|
Prepaid expenses and other assets
|
18,084
|
|||
|
Total assets
|
106,930,961
|
|||
|
LIABILITIES:
|
||||
|
Payable for fund shares redeemed
|
113,727
|
|||
|
Payable to advisor
|
60,813
|
|||
|
Payable to administrator
|
18,891
|
|||
|
Payable to auditor
|
11,373
|
|||
|
Accrued distribution fees
|
186,996
|
|||
|
Accrued service fees
|
7,307
|
|||
|
Accrued trustees fees
|
5,587
|
|||
|
Accrued expenses and other payables
|
18,898
|
|||
|
Total liabilities
|
423,592
|
|||
|
NET ASSETS
|
$
|
106,507,369
|
||
|
NET ASSETS CONSISTS OF:
|
||||
|
Capital stock
|
$
|
108,785,790
|
||
|
Accumulated deficit
|
(2,278,421
|
)
|
||
|
Total net assets
|
$
|
106,507,369
|
||
|
NET ASSETS:
|
||||
|
Investor Class
|
||||
|
Shares authorized (no par value)
|
Unlimited
|
|||
|
Net assets applicable to outstanding shares
|
$
|
94,659,502
|
||
|
Shares issued and outstanding
|
10,579,575
|
|||
|
Net asset value, offering price, and redemption price per share
|
$
|
8.95
|
||
|
Institutional Class
|
||||
|
Shares authorized (no par value)
|
Unlimited
|
|||
|
Net assets applicable to outstanding shares
|
$
|
11,847,867
|
||
|
Shares issued and outstanding
|
1,311,145
|
|||
|
Net asset value, offering price, and redemption price per share
|
$
|
9.04
|
||
The accompanying notes are an integral part of these financial statements.
|
HENNESSY FUNDS
|
1-800-966-4354
|
9
Financial Statements
|
Statement of Operations for the six months ended April 30, 2020 (Unaudited)
|
|
INVESTMENT INCOME:
|
||||
|
Dividend income
|
$
|
1,549,700
|
||
|
Interest income
|
17,984
|
|||
|
Total investment income
|
1,567,684
|
|||
|
EXPENSES:
|
||||
|
Investment advisory fees (See Note 5)
|
459,636
|
|||
|
Distribution fees – Investor Class (See Note 5)
|
82,827
|
|||
|
Administration, accounting, custody, and transfer agent fees (See Note 5)
|
68,037
|
|||
|
Sub-transfer agent expenses – Investor Class (See Note 5)
|
55,374
|
|||
|
Sub-transfer agent expenses – Institutional Class (See Note 5)
|
3,814
|
|||
|
Service fees – Investor Class (See Note 5)
|
55,218
|
|||
|
Federal and state registration fees
|
18,641
|
|||
|
Compliance expense (See Note 5)
|
13,462
|
|||
|
Audit fees
|
11,375
|
|||
|
Trustees’ fees and expenses
|
8,829
|
|||
|
Reports to shareholders
|
7,282
|
|||
|
Legal fees
|
642
|
|||
|
Interest expense (See Note 7)
|
465
|
|||
|
Other expenses
|
8,846
|
|||
|
Total expenses before recoupment and reimbursement by advisor
|
794,448
|
|||
|
Expense recoupment by advisor – Investor Class (See Note 5)
|
1,621
|
|||
|
Expense reimbursement by advisor – Institutional Class (See Note 5)
|
(162
|
)
|
||
|
Net expenses
|
795,907
|
|||
|
NET INVESTMENT INCOME
|
$
|
771,777
|
||
|
REALIZED AND UNREALIZED GAINS (LOSSES):
|
||||
|
Net realized gain on investments
|
$
|
6,648,556
|
||
|
Net change in unrealized appreciation/depreciation on investments
|
(23,638,322
|
)
|
||
|
Net loss on investments
|
(16,989,766
|
)
|
||
|
NET DECREASE IN NET ASSETS RESULTING FROM OPERATIONS
|
$
|
(16,217,989
|
)
|
|
The accompanying notes are an integral part of these financial statements.
|
HENNESSYFUNDS.COM
|
10
|
STATEMENT OF OPERATIONS/STATEMENTS OF CHANGES IN NET ASSETS
|
Financial Statements
|
Statements of Changes in Net Assets
|
|
Six Months Ended
|
||||||||
|
April 30, 2020
|
Year Ended
|
|||||||
|
(Unaudited)
|
October 31, 2019
|
|||||||
|
OPERATIONS:
|
||||||||
|
Net investment income
|
$
|
771,777
|
$
|
1,763,273
|
||||
|
Net realized gain on investments
|
6,648,556
|
2,328,575
|
||||||
|
Net change in unrealized
|
||||||||
|
appreciation/depreciation on investments
|
(23,638,322
|
)
|
5,977,384
|
|||||
|
Net increase (decrease) in net assets
|
||||||||
|
resulting from operations
|
(16,217,989
|
)
|
10,069,232
|
|||||
|
DISTRIBUTIONS TO SHAREHOLDERS:
|
||||||||
|
Distributable earnings – Investor Class
|
(2,977,504
|
)
|
(24,244,915
|
)
|
||||
|
Distributable earnings – Institutional Class
|
(399,991
|
)
|
(3,824,749
|
)
|
||||
|
Total distributions
|
(3,377,495
|
)
|
(28,069,664
|
)
|
||||
|
CAPITAL SHARE TRANSACTIONS:
|
||||||||
|
Proceeds from shares subscribed – Investor Class
|
912,868
|
1,986,421
|
||||||
|
Proceeds from shares subscribed – Institutional Class
|
1,391,062
|
4,246,408
|
||||||
|
Dividends reinvested – Investor Class
|
2,817,178
|
22,928,508
|
||||||
|
Dividends reinvested – Institutional Class
|
392,293
|
3,735,099
|
||||||
|
Cost of shares redeemed – Investor Class
|
(9,168,541
|
)
|
(17,643,309
|
)
|
||||
|
Cost of shares redeemed – Institutional Class
|
(6,276,955
|
)
|
(6,379,370
|
)
|
||||
|
Net increase (decrease) in net assets derived
|
||||||||
|
from capital share transactions
|
(9,932,095
|
)
|
8,873,757
|
|||||
|
TOTAL DECREASE IN NET ASSETS
|
(29,527,579
|
)
|
(9,126,675
|
)
|
||||
|
NET ASSETS:
|
||||||||
|
Beginning of period
|
136,034,948
|
145,161,623
|
||||||
|
End of period
|
$
|
106,507,369
|
$
|
136,034,948
|
||||
|
CHANGES IN SHARES OUTSTANDING:
|
||||||||
|
Shares sold – Investor Class
|
98,992
|
191,986
|
||||||
|
Shares sold – Institutional Class
|
159,560
|
412,298
|
||||||
|
Shares issued to holders as reinvestment
|
||||||||
|
of dividends – Investor Class
|
255,707
|
2,404,367
|
||||||
|
Shares issued to holders as reinvestment
|
||||||||
|
of dividends – Institutional Class
|
35,229
|
387,740
|
||||||
|
Shares redeemed – Investor Class
|
(937,239
|
)
|
(1,718,603
|
)
|
||||
|
Shares redeemed – Institutional Class
|
(613,053
|
)
|
(625,689
|
)
|
||||
|
Net increase (decrease) in shares outstanding
|
(1,000,804
|
)
|
1,052,099
|
|||||
The accompanying notes are an integral part of these financial statements.
|
HENNESSY FUNDS
|
1-800-966-4354
|
11
Financial Statements
|
Financial Highlights
|
For an Investor Class share outstanding throughout each period
|
Six Months Ended
|
||||
|
April 30, 2020
|
||||
|
(Unaudited)
|
||||
|
PER SHARE DATA:
|
||||
|
Net asset value, beginning of period
|
$
|
10.54
|
||
|
Income from investment operations:
|
||||
|
Net investment income
|
0.06
|
(1)
|
||
|
Net realized and unrealized gains (losses) on investments
|
(1.38
|
)
|
||
|
Total from investment operations
|
(1.32
|
)
|
||
|
Less distributions:
|
||||
|
Dividends from net investment income
|
(0.14
|
)
|
||
|
Dividends from net realized gains
|
(0.13
|
)
|
||
|
Total distributions
|
(0.27
|
)
|
||
|
Net asset value, end of period
|
$
|
8.95
|
||
|
TOTAL RETURN
|
-13.00
|
%(2)
|
||
|
SUPPLEMENTAL DATA AND RATIOS:
|
||||
|
Net assets, end of period (millions)
|
$
|
94.66
|
||
|
Ratio of expenses to average net assets:
|
||||
|
Before expense reimbursement/recoupment
|
1.31
|
%(3)
|
||
|
After expense reimbursement/recoupment
|
1.31
|
%(3)
|
||
|
Ratio of net investment income to average net assets:
|
||||
|
Before expense reimbursement/recoupment
|
1.21
|
%(3)
|
||
|
After expense reimbursement/recoupment
|
1.21
|
%(3)
|
||
|
Portfolio turnover rate(4)
|
61
|
%(2)
|
||
|
(1)
|
Calculated using the average shares outstanding method.
|
|
(2)
|
Not annualized.
|
|
(3)
|
Annualized.
|
|
(4)
|
Calculated on the basis of the Fund as a whole.
|
The accompanying notes are an integral part of these financial statements.
|
HENNESSYFUNDS.COM
|
12
|
FINANCIAL HIGHLIGHTS — INVESTOR CLASS
|
|
Year Ended October 31,
|
||||||||||||||||||
|
2019
|
2018
|
2017
|
2016
|
2015
|
||||||||||||||
|
$
|
12.24
|
$
|
11.75
|
$
|
10.27
|
$
|
12.99
|
$
|
15.16
|
|||||||||
|
0.13
|
(1)
|
0.06
|
0.11
|
0.09
|
0.17
|
|||||||||||||
|
0.56
|
0.94
|
1.49
|
0.08
|
0.04
|
||||||||||||||
|
0.69
|
1.00
|
1.60
|
0.17
|
0.21
|
||||||||||||||
|
(0.09
|
)
|
(0.08
|
)
|
(0.12
|
)
|
(0.16
|
)
|
(0.14
|
)
|
|||||||||
|
(2.30
|
)
|
(0.43
|
)
|
—
|
(2.73
|
)
|
(2.24
|
)
|
||||||||||
|
(2.39
|
)
|
(0.51
|
)
|
(0.12
|
)
|
(2.89
|
)
|
(2.38
|
)
|
|||||||||
|
$
|
10.54
|
$
|
12.24
|
$
|
11.75
|
$
|
10.27
|
$
|
12.99
|
|||||||||
|
7.84
|
%
|
8.53
|
%
|
15.70
|
%
|
2.63
|
%
|
1.11
|
%
|
|||||||||
|
$
|
117.62
|
$
|
125.91
|
$
|
91.74
|
$
|
87.73
|
$
|
98.64
|
|||||||||
|
1.31
|
%
|
1.24
|
%
|
1.25
|
%
|
1.25
|
%
|
1.09
|
%
|
|||||||||
|
1.29
|
%
|
1.24
|
%
|
1.25
|
%
|
1.25
|
%
|
1.09
|
%
|
|||||||||
|
1.24
|
%
|
0.81
|
%
|
0.95
|
%
|
1.22
|
%
|
1.37
|
%
|
|||||||||
|
1.26
|
%
|
0.81
|
%
|
0.95
|
%
|
1.22
|
%
|
1.37
|
%
|
|||||||||
|
57
|
%
|
70
|
%
|
65
|
%
|
53
|
%
|
79
|
%
|
|||||||||
The accompanying notes are an integral part of these financial statements.
|
HENNESSY FUNDS
|
1-800-966-4354
|
13
Financial Statements
|
Financial Highlights
|
For an Institutional Class share outstanding throughout each period
|
Six Months Ended
|
||||
|
April 30, 2020
|
||||
|
(Unaudited)
|
||||
|
PER SHARE DATA:
|
||||
|
Net asset value, beginning of period
|
$
|
10.65
|
||
|
Income from investment operations:
|
||||
|
Net investment income
|
0.08
|
(1)
|
||
|
Net realized and unrealized gains (losses) on investments
|
(1.39
|
)
|
||
|
Total from investment operations
|
(1.31
|
)
|
||
|
Less distributions:
|
||||
|
Dividends from net investment income
|
(0.17
|
)
|
||
|
Dividends from net realized gains
|
(0.13
|
)
|
||
|
Total distributions
|
(0.30
|
)
|
||
|
Net asset value, end of period
|
$
|
9.04
|
||
|
TOTAL RETURN
|
-12.84
|
%(2)
|
||
|
SUPPLEMENTAL DATA AND RATIOS:
|
||||
|
Net assets, end of period (millions)
|
$
|
11.85
|
||
|
Ratio of expenses to average net assets:
|
||||
|
Before expense reimbursement
|
1.01
|
%(3)
|
||
|
After expense reimbursement
|
1.01
|
%(3)
|
||
|
Ratio of net investment income to average net assets:
|
||||
|
Before expense reimbursement
|
1.50
|
%(3)
|
||
|
After expense reimbursement
|
1.50
|
%(3)
|
||
|
Portfolio turnover rate(4)
|
61
|
%(2)
|
||
|
(1)
|
Calculated using the average shares outstanding method.
|
|
(2)
|
Not annualized.
|
|
(3)
|
Annualized.
|
|
(4)
|
Calculated on the basis of the Fund as a whole.
|
The accompanying notes are an integral part of these financial statements.
|
HENNESSYFUNDS.COM
|
14
|
FINANCIAL HIGHLIGHTS — INSTITUTIONAL CLASS
|
|
Year Ended October 31,
|
||||||||||||||||||
|
2019
|
2018
|
2017
|
2016
|
2015
|
||||||||||||||
|
$
|
12.38
|
$
|
11.87
|
$
|
10.37
|
$
|
13.10
|
$
|
15.30
|
|||||||||
|
0.16
|
(1)
|
0.14
|
0.13
|
0.13
|
0.20
|
|||||||||||||
|
0.56
|
0.90
|
1.52
|
0.07
|
0.02
|
||||||||||||||
|
0.72
|
1.04
|
1.65
|
0.20
|
0.22
|
||||||||||||||
|
(0.12
|
)
|
(0.10
|
)
|
(0.15
|
)
|
(0.17
|
)
|
(0.16
|
)
|
|||||||||
|
(2.33
|
)
|
(0.43
|
)
|
—
|
(2.76
|
)
|
(2.26
|
)
|
||||||||||
|
(2.45
|
)
|
(0.53
|
)
|
(0.15
|
)
|
(2.93
|
)
|
(2.42
|
)
|
|||||||||
|
$
|
10.65
|
$
|
12.38
|
$
|
11.87
|
$
|
10.37
|
$
|
13.10
|
|||||||||
|
8.12
|
%
|
8.82
|
%
|
16.00
|
%
|
2.92
|
%
|
1.19
|
%
|
|||||||||
|
$
|
18.42
|
$
|
19.25
|
$
|
12.17
|
$
|
12.24
|
$
|
13.82
|
|||||||||
|
1.00
|
%
|
0.96
|
%
|
1.00
|
%
|
1.01
|
%
|
0.99
|
%
|
|||||||||
|
0.98
|
%
|
0.96
|
%
|
1.00
|
%
|
1.01
|
%
|
0.99
|
%
|
|||||||||
|
1.56
|
%
|
1.08
|
%
|
1.20
|
%
|
1.47
|
%
|
1.47
|
%
|
|||||||||
|
1.58
|
%
|
1.08
|
%
|
1.20
|
%
|
1.47
|
%
|
1.47
|
%
|
|||||||||
|
57
|
%
|
70
|
%
|
65
|
%
|
53
|
%
|
79
|
%
|
|||||||||
The accompanying notes are an integral part of these financial statements.
|
HENNESSY FUNDS
|
1-800-966-4354
|
15
Financial Statements
|
Notes to the Financial Statements April 30, 2020 (Unaudited)
|
1). ORGANIZATION
The Hennessy Cornerstone Large Growth Fund (the “Fund”) is a series of Hennessy Funds Trust (the “Trust”), which was organized as a Delaware statutory trust on September 17, 1992. The Fund is an open-end management
investment company registered under the Investment Company Act of 1940, as amended. The investment objective of the Fund is long-term growth of capital. The Fund is a diversified fund.
The Fund offers Investor Class and Institutional Class shares. Each class of shares differs principally in its respective 12b-1 distribution and service, shareholder servicing, and sub-transfer
agent expenses. There are no sales charges. Each class has identical rights to earnings, assets, and voting privileges, except for class-specific expenses and exclusive rights to vote on matters affecting only one class.
As an investment company, the Fund follows the investment company accounting and reporting guidance of the Financial Accounting Standards Board (“FASB”) Accounting Standard Codification Topic 946
“Financial Services—Investment Companies.”
2). SIGNIFICANT ACCOUNTING POLICIES
The following is a summary of significant accounting policies consistently followed by the Fund in the preparation of the financial statements. These policies conform to U.S. generally accepted accounting principles
(“GAAP”).
|
a).
|
Securities Valuation – All investments in securities are recorded at their estimated fair value, as described in Note 3.
|
|
b).
|
Federal Income Taxes – No provision for federal income taxes or excise taxes has been made because the Fund has elected to be taxed as a regulated investment company and intends to distribute substantially all
of its taxable income to its shareholders and otherwise comply with the provisions of the Internal Revenue Code of 1986, as amended, applicable to regulated investment companies. Net investment income/loss and realized gains/losses for
federal income tax purposes may differ from those reported in the financial statements because of temporary book and tax basis differences. Temporary differences are primarily the result of the treatment of wash sales for tax reporting
purposes. The Fund recognizes interest and penalties related to income tax benefits, if any, in the Statement of Operations as an income tax expense. Distributions from net realized gains for book purposes may include short-term capital
gains, which are included as ordinary income to shareholders for tax purposes. The Fund may utilize equalization accounting for tax purposes and designate earnings and profits, including net realized gains distributed to shareholders on
redemption of shares, as part of the dividends paid deduction for income tax purposes.
|
|
c).
|
Accounting for Uncertainty in Income Taxes – The Fund has accounting policies regarding recognition and measurement of tax positions taken or expected to be taken on a tax return. The tax returns of the Fund
for the prior three fiscal years are open for examination. The Fund has reviewed all open tax years in major jurisdictions and concluded that there is no impact on the Fund’s net assets and no tax liability resulting from unrecognized
tax benefits relating to uncertain income tax positions taken or expected to be taken on a tax return. The Fund’s major tax jurisdictions are U.S. federal and Delaware.
|
|
HENNESSYFUNDS.COM
|
16
|
NOTES TO THE FINANCIAL STATEMENTS
|
|
d).
|
Income and Expenses – Dividend income is recognized on the ex-dividend date or as soon as information is available to the Fund. Interest income, which includes the amortization of premium and accretion of
discount, is recognized on an accrual basis. Other non-cash dividends are recognized as investment income at the fair value of the property received. The Fund is charged for those expenses that are directly attributable to its
portfolio, such as advisory, administration, and certain shareholder service fees. Income, expenses (other than expenses attributable to a specific class), and realized and unrealized gains/losses on investments are allocated to each
class of shares based on such class’s net assets.
|
|
e).
|
Distributions to Shareholders – Dividends from net investment income for the Fund, if any, are declared and paid annually, usually in December. Distributions of net realized capital gains, if any, are declared
and paid annually, usually in December.
|
|
f).
|
Security Transactions – Investment and shareholder transactions are recorded on the trade date. The Fund determines the realized gain/loss from an investment transaction by comparing the original cost of the
security lot sold with the net sale proceeds. Discounts and premiums on securities purchased are accreted or amortized, respectively, over the life of each such security.
|
|
g).
|
Use of Estimates – The preparation of financial statements in conformity with GAAP requires management to make estimates and assumptions that affect the reported amounts of assets and liabilities and
disclosure of contingent assets and liabilities at the date of the financial statements and the reported change in net assets during the reporting period. Actual results could differ from those estimates.
|
|
h).
|
Share Valuation – The net asset value (“NAV”) per share of the Fund is calculated by dividing (i) the total value of the securities held by the Fund, plus cash and other assets, minus all liabilities
(including estimated accrued expenses) by (ii) the total number of shares outstanding for the Fund, rounded to the nearest $0.01. The Fund’s shares will not be priced on days the New York Stock Exchange is closed for trading. The
offering and redemption price per share for the Fund is equal to the Fund’s NAV per share.
|
3). SECURITIES VALUATION
The Fund follows fair value accounting standards that establish an authoritative definition of fair value and set out a hierarchy for measuring fair value. These standards require additional disclosures about the
various inputs and valuation techniques used to develop the measurements of fair value and a discussion of changes in valuation techniques and related inputs during the period. These inputs are summarized in the three broad levels listed below:
|
Level 1 –
|
Unadjusted, quoted prices in active markets for identical instruments that the Fund has the ability to access at the date of measurement.
|
|
|
Level 2 –
|
Other significant observable inputs (including, but not limited to, quoted prices in active markets for similar instruments, quoted prices in markets that are not active for identical or similar instruments,
and model-derived valuations in which all significant inputs and significant value drivers are observable in active markets, such as interest rates, prepayment speeds, credit risk curves, default rates, and similar data).
|
|
|
Level 3 –
|
Significant unobservable inputs (including the Fund’s own assumptions about what market participants would use to price the asset or liability based on the best available information) when observable inputs
are unavailable.
|
|
HENNESSY FUNDS
|
1-800-966-4354
|
17
The following is a description of the valuation techniques applied to the Fund’s major categories of assets and liabilities measured at fair value on a recurring basis:
|
Equity Securities – Equity securities, including common stocks, preferred stocks, exchange-traded funds, closed-end mutual funds, partnerships, rights, and real estate
investment trusts, that are traded on a securities exchange for which a last-quoted sales price is readily available will generally be valued at the last sales price as reported by the primary exchange on which the securities are
listed. Securities listed on The NASDAQ Stock Market (“NASDAQ”) will generally be valued at the NASDAQ Official Closing Price, which may differ from the last sales price reported. Securities traded on a securities exchange for which a
last-quoted sales price is not readily available will generally be valued at the mean between the bid and ask prices. To the extent these securities are actively traded and valuation adjustments are not applied, they are classified in
Level 1 of the fair value hierarchy.
|
|
|
Registered Investment Companies – Investments in open-end registered investment companies, commonly referred to as mutual funds, generally are priced at the ending NAV
provided by the applicable mutual fund’s service agent and will be classified in Level 1 of the fair value hierarchy.
|
|
|
Debt Securities – Debt securities, including corporate bonds, asset-backed securities, mortgage-backed securities, municipal bonds, U.S. Treasuries, and U.S. government
agency issues, are generally valued at market on the basis of valuations furnished by an independent pricing service that utilizes both dealer-supplied valuations and formula-based techniques. The pricing service may consider recently
executed transactions in securities of the issuer or comparable issuers, market price quotations (where observable), bond spreads, and fundamental data relating to the issuer. In addition, the model may incorporate observable market
data, such as reported sales of similar securities, broker quotes, yields, bids, offers, and reference data. Certain securities are valued primarily using dealer quotations. These securities are generally classified in Level 2 of the
fair value hierarchy.
|
|
|
Short-Term Securities – Short-term equity investments, including money market funds, are valued in the manner specified above. Short-term debt investments with an
original term to maturity of 60 days or less are valued at amortized cost, which approximates fair market value. If the original term to maturity of a short-term debt investment exceeded 60 days, then the values as of the 61st day prior
to maturity are amortized. Amortized cost is not used if its use would be inappropriate due to credit or other impairments of the issuer, in which case the security’s fair value would be determined, as described below. Short-term
securities are generally classified in Level 1 or Level 2 of the fair value hierarchy depending on the inputs used and market activity levels for specific securities.
|
The Board of Trustees of the Fund (the “Board”) has adopted fair value pricing procedures that are followed when a price for a security is not readily available or if a significant event has
occurred that indicates the closing price of a security no longer represents the true value of that security. Fair value pricing determinations are made in good faith in accordance with these procedures. There are numerous criteria that will be
given consideration in determining a fair value of a security, such as the trading volume of a security and markets, the values of other similar securities, and news events with direct bearing on a security or markets. Fair value pricing
results in an estimated price for a security that reflects the amount the Fund might reasonably expect to receive in a current sale. Depending on the relative significance of the valuation inputs, these securities may be classified in either
Level 2 or Level 3 of the fair value hierarchy.
|
HENNESSYFUNDS.COM
|
18
|
NOTES TO THE FINANCIAL STATEMENTS
|
The Board has delegated day-to-day valuation matters to the Valuation and Liquidity Committee comprising representatives from Hennessy Advisors, Inc., the Fund’s investment advisor (the “Advisor”).
The function of the Valuation and Liquidity Committee is to value securities where current and reliable market quotations are not readily available. All actions taken by the Valuation and Liquidity Committee are reviewed by the Board.
The Fund has performed an analysis of all existing investments to determine the significance and character of all inputs to their fair value determinations. Various inputs are used to determine the
value of the Fund’s investments. The inputs or methodology used for valuing securities are not necessarily an indication of the risk associated with investing in those securities. Details related to the fair value hierarchy of the Fund’s
securities as of April 30, 2020, are included in the Schedule of Investments.
4). INVESTMENT TRANSACTIONS
Purchases and sales of investment securities (excluding government and short-term investments) for the Fund during the six months ended April 30, 2020, were $73,305,975 and $85,630,097, respectively.
There were no purchases or sales/maturities of long-term U.S. government securities for the Fund during the six months ended April 30, 2020.
The Fund is permitted to purchase or sell securities from or to another fund in the Hennessy Funds family of funds (collectively, the “Hennessy Funds”) under specified conditions outlined in
procedures adopted by the Board. The procedures have been designed to ensure that any purchase or sale of securities by the Fund from or to another Hennessy Fund complies with Rule 17a-7 of the Investment Company Act of 1940, as amended. During
the six months ended April 30, 2020, the Fund did not engage in purchases or sales of securities pursuant to Rule 17a-7 of the Investment Company Act of 1940, as amended.
5). INVESTMENT ADVISORY FEE AND OTHER TRANSACTIONS WITH AFFILIATES
The Advisor provides the Fund with investment advisory services under an Investment Advisory Agreement. The Advisor furnishes all investment advice, office space, and facilities and most of the personnel needed by the
Fund. As compensation for its services, the Advisor is entitled to a monthly fee from the Fund. The fee is based on the average daily net assets of the Fund at an annual rate of 0.74%. The net investment advisory fees expensed by the Fund
during the six months ended April 30, 2020, are included in the Statement of Operations.
From December 1, 2017, through November 30, 2019, the Advisor contractually agreed to limit total annual operating expenses to 1.29% of the Fund’s net assets for Investor Class shares and 0.98% of
the Fund’s net assets for Institutional Class shares (in each case, excluding all federal, state, and local taxes, interest, brokerage commissions, extraordinary items, and acquired fund fees and expenses and other costs incurred in connection
with the purchase and sale of securities).
For three years following the date on which expenses were waived or incurred, the Advisor may recoup waived or reimbursed expenses from the Fund if total operating expenses, including such
recoupment, does not exceed the expense limitation in effect (i) at the time the Advisor waived or reimbursed such expenses and (ii) at the time the Advisor recoups such expenses. As of April 30, 2020, expenses subject to potential recovery for
Investor Class and Institutional Class shares and the fiscal years in which they expire were as follows:
|
Fiscal Year
|
Fiscal Year
|
||||||||||||
|
2022
|
2023
|
Total
|
|||||||||||
|
Investor Class
|
$
|
20,122
|
$
|
—
|
$
|
20,122
|
|||||||
|
Institutional Class
|
$
|
2,872
|
$
|
162
|
$
|
3,034
|
|||||||
|
HENNESSY FUNDS
|
1-800-966-4354
|
19
The Advisor recouped $1,459 from the Fund during the six months ended April 30, 2020.
The Board has approved a Shareholder Servicing Agreement for Investor Class shares of the Fund, which was instituted to compensate the Advisor for the non-investment advisory services it provides to
the Fund. The Shareholder Servicing Agreement provides for a monthly fee paid to the Advisor at an annual rate of 0.10% of the average daily net assets of the Fund attributable to Investor Class shares. The shareholder service fees expensed by
the Fund during the six months ended April 30, 2020, are included in the Statement of Operations.
The Fund has adopted a plan pursuant to Rule 12b-1 under the Investment Company Act of 1940, as amended, that authorizes payments in connection with the distribution of the Fund’s shares at an
annual rate of up to 0.25% of the Fund’s average daily net assets attributable to Investor Class shares. Even though the authorized rate is up to 0.25%, the Fund is currently only using up to 0.15% of its average daily net assets attributable
to Investor Class shares for such purpose. Amounts paid under the plan may be spent on any activities or expenses primarily intended to result in the sale of shares, including, but not limited to, advertising, shareholder account servicing,
printing and mailing of prospectuses to other than current shareholders, printing and mailing of sales literature, and compensation for sales and marketing activities or to financial institutions and others, such as dealers and distributors.
The distribution fees expensed by the Fund during the six months ended April 30, 2020, are included in the Statement of Operations.
The Fund has entered into agreements with various brokers, dealers, and financial intermediaries in connection with the sale of shares of the Fund. The agreements provide for periodic payments of
sub-transfer agent expenses by the Fund to the brokers, dealers, and financial intermediaries for providing certain shareholder maintenance services. These shareholder services include the pre-processing and quality control of new accounts,
shareholder correspondence, answering customer inquiries regarding account status, and facilitating shareholder telephone transactions. The sub-transfer agent fees expensed by the Fund during the six months ended April 30, 2020, are included in
the Statement of Operations.
U.S. Bancorp Fund Services, LLC, d/b/a U.S. Bank Global Fund Services (“Fund Services”) provides the Fund with administrative, accounting, and transfer agent services. As administrator, Fund
Services is responsible for activities such as (i) preparing various federal and state regulatory filings, reports, and returns for the Fund, (ii) preparing reports and materials to be supplied to the Board, (iii) monitoring the activities of
the Fund’s custodian, transfer agent, and accountants, and (iv) coordinating the preparation and payment of the Fund’s expenses and reviewing the Fund’s expense accruals. U.S. Bank N.A., an affiliate of Fund Services, serves as the Fund’s
custodian. The servicing agreements between the Trust and Fund Services and U.S. Bank N.A. contain a fee schedule that is inclusive of administrative, accounting, custody, and transfer agent fees. The administrative, accounting, custody, and
transfer agent fees expensed by the Fund during the six months ended April 30, 2020, are included in the Statement of Operations.
Quasar Distributors, LLC (“Quasar”) acts as the Fund’s principal underwriter in a continuous public offering of the Fund’s shares. Quasar was an affiliate of Fund Services and U.S. Bank N.A. through
March 30, 2020. Effective March 31, 2020, Foreside Financial Group, LLC (“Foreside”) acquired Quasar from Fund Services. As a result of the acquisition, Quasar became a wholly owned broker-dealer subsidiary of Foreside and is no longer
affiliated with Fund Services or U.S. Bank N.A. The Board approved a new Distribution Agreement to enable Quasar to continue serving as the Fund’s distributor.
|
HENNESSYFUNDS.COM
|
20
|
NOTES TO THE FINANCIAL STATEMENTS
|
The officers of the Fund are affiliated with the Advisor. With the exception of the Chief Compliance Officer and the Senior Compliance Officer, such officers receive no compensation from the Fund
for serving in their respective roles. The Fund, along with the other Hennessy Funds, makes reimbursement payments on an equal basis to the Advisor for a portion of the salary and benefits associated with the office of the Chief Compliance
Officer and for all of the salary and benefits associated with the office of the Senior Compliance Officer. The compliance fees expensed by the Fund during the six months ended April 30, 2020, are included in the Statement of Operations.
6). GUARANTEES AND INDEMNIFICATIONS
Under the Hennessy Funds’ organizational documents, their officers and trustees are indemnified by the Hennessy Funds against certain liabilities arising out of the performance of their duties to the Hennessy Funds.
Additionally, in the normal course of business, the Hennessy Funds enter into contracts with service providers that contain general indemnification clauses. The Fund’s maximum exposure under these arrangements is unknown as this would involve
future claims that may be made against the Fund that have not yet occurred. Currently, the Fund expects the risk of loss to be remote.
7). LINE OF CREDIT
The Fund has an uncommitted line of credit with the other Hennessy Funds in the amount of the lesser of (i) $100,000,000 or (ii) 33.33% of each Hennessy Fund’s net assets, or 30% for the Hennessy Gas Utility Fund and
10% for the Hennessy Balanced Fund, intended to provide short-term financing, if necessary, subject to certain restrictions, in connection with shareholder redemptions. The credit facility is with the Hennessy Funds’ custodian bank, U.S. Bank
N.A. Borrowings under this arrangement bear interest at the bank’s prime rate and are secured by all of the Fund’s assets (as to its own borrowings only). During the six months ended April 30, 2020, the Fund had an outstanding average daily
balance and a weighted average interest rate of $19,379 and 4.75%, respectively. The interest expensed by the Fund during the six months ended April 30, 2020, is included in the Statement of Operations. The maximum amount outstanding for the
Fund during the period was $1,250,000. As of April 30, 2020, the Fund did not have any borrowings outstanding under the line of credit.
8). FEDERAL TAX INFORMATION
As of October 31, 2019, the Fund’s most recent fiscal year end, the components of accumulated earnings (losses) for income tax purposes were as follows:
|
Investments
|
|||||
|
Cost of investments for tax purposes
|
$
|
122,265,671
|
|||
|
Gross tax unrealized appreciation
|
$
|
23,118,894
|
|||
|
Gross tax unrealized depreciation
|
(9,179,228
|
)
|
|||
|
Net tax unrealized appreciation/(depreciation)
|
$
|
13,939,666
|
|||
|
Undistributed ordinary income
|
$
|
3,097,822
|
|||
|
Undistributed long-term capital gains
|
279,575
|
||||
|
Total distributable earnings
|
$
|
3,377,397
|
|||
|
Other accumulated gain/(loss)
|
$
|
—
|
|||
|
Total accumulated gain/(loss)
|
$
|
17,317,063
|
|||
The difference between book-basis unrealized appreciation/depreciation and tax-basis unrealized appreciation/depreciation (as shown above) is attributable primarily to wash sales.
|
HENNESSY FUNDS
|
1-800-966-4354
|
21
As of October 31, 2019, the Fund had no tax basis capital losses to offset future capital gains.
As of October 31, 2019, the Fund did not defer, on a tax basis, any late-year ordinary losses. Late-year ordinary losses are net ordinary losses incurred after December 31, 2018, but within the
taxable year, that are deemed to arise on the first day of the Fund’s next taxable year.
During fiscal year 2020 (year to date) and fiscal year 2019, the tax character of distributions paid by the Fund was as follows:
|
Six Months Ended
|
Year Ended
|
||||||||
|
April 30, 2020
|
October 31, 2019
|
||||||||
|
Ordinary income(1)
|
$
|
3,097,827
|
$
|
1,289,774
|
|||||
|
Long-term capital gain
|
279,668
|
26,779,890
|
|||||||
|
$
|
3,377,495
|
$
|
28,069,664
|
||||||
|
(1) Ordinary income includes short-term capital gain.
|
9). EVENTS SUBSEQUENT TO PERIOD END
Management has evaluated the Fund’s related events and transactions that occurred subsequent to April 30, 2020, through the date of issuance of the Fund’s financial statements. Management has determined that there
were no subsequent events requiring recognition or disclosure in the financial statements.
|
HENNESSYFUNDS.COM
|
22
|
NOTES TO THE FINANCIAL STATEMENTS/EXPENSE EXAMPLE
|
Expense Example (Unaudited)
April 30, 2020
As a shareholder of the Fund, you incur ongoing costs, including management fees, service fees, and other Fund expenses. This Example is intended to help you understand your ongoing costs (in dollars) of investing in
the Fund and to compare these costs with the ongoing costs of investing in other mutual funds. The Example is based on an investment of $1,000 invested at the beginning of the period and held for the entire period from November 1, 2019, through
April 30, 2020.
Actual Expenses
The first line of the table below under the “Investor Class” and “Institutional Class” headings provides information about actual account values and actual expenses. Although the Fund charges no sales loads or
transaction fees, you will be assessed fees for outgoing wire transfers, returned checks and stop payment orders at prevailing rates charged by U.S. Bank Global Fund Services, the Fund’s transfer agent. If you request that a redemption be made
by wire transfer, currently a $15 fee is charged by the Fund’s transfer agent. IRA accounts will be charged a $15 annual maintenance fee. The example below includes, but is not limited to, management fees, shareholder servicing fees,
accounting, custody, and transfer agent fees. However, the example below does not include portfolio trading commissions and related expenses. You may use the information in this line, together with the amount you invested, to estimate the
expenses that you paid over the period. Simply divide your account value by $1,000 (for example, an $8,600 account value divided by $1,000 = 8.6), then multiply the result by the number in the first line of the table under the “Investor Class”
or “Institutional Class” headings in the column entitled “Expenses Paid During Period” to estimate the expenses you paid on your account during this period.
Hypothetical Example for Comparison Purposes
The second line of the table below under the “Investor Class” and “Institutional Class” headings provides information about hypothetical account values and hypothetical expenses based on the Fund’s actual expense
ratios and an assumed rate of return of 5% per year before expenses, which is not the Fund’s actual return. The hypothetical account values and expenses may not be used to estimate the actual ending account balance or expenses you paid for the
period. You may use this information to compare the ongoing costs of investing in the Fund and other funds. To do so, compare this 5% hypothetical example with the 5% hypothetical examples that appear in the shareholder reports of the other
funds. Please note that the expenses shown in the table are meant to highlight your ongoing costs only. Therefore, the second line of the table under the “Investor Class” and “Institutional Class” headings is useful in comparing ongoing costs
only and will not help you determine the relative total costs of owning different funds.
|
HENNESSY FUNDS
|
1-800-966-4354
|
23
|
Beginning
|
Ending
|
||
|
Account Value
|
Account Value
|
Expenses Paid
|
|
|
November 1, 2019
|
April 30, 2020
|
During Period(1)
|
|
|
Investor Class
|
|||
|
Actual
|
$1,000.00
|
$ 870.00
|
$6.09
|
|
Hypothetical (5% return before expenses)
|
$1,000.00
|
$1,018.35
|
$6.57
|
|
Institutional Class
|
|||
|
Actual
|
$1,000.00
|
$ 871.60
|
$4.70
|
|
Hypothetical (5% return before expenses)
|
$1,000.00
|
$1,019.84
|
$5.07
|
|
(1)
|
Expenses are equal to the Fund’s annualized expense ratio of 1.31% for Investor Class shares or 1.01% for Institutional Class shares, as applicable, multiplied by the average account value over the period,
multiplied by 182/366 days (to reflect the half-year period).
|
|
HENNESSYFUNDS.COM
|
24
|
EXPENSE EXAMPLE — ELECTRONIC DELIVERY
|
How to Obtain a Copy of the Fund’s Proxy
Voting Policy and Proxy Voting Records
A description of the policies and procedures the Fund uses to determine how to vote proxies relating to portfolio securities is available without charge (1) by calling 1-800-966-4354, (2) on the Hennessy Funds’
website at www.hennessyfunds.com/proxy-voting/voting-policy, or (3) on the U.S. Securities and Exchange Commission’s (the “SEC”) website at www.sec.gov. The Fund’s proxy voting record is available without charge on both the Hennessy Funds’
website at www.hennessyfunds.com/proxy-voting/voting-record and the SEC’s website at www.sec.gov no later than August 31 for the prior 12 months ending June 30.
Availability of Quarterly Portfolio Schedule
The Fund files a complete schedule of portfolio holdings with the SEC for the first and third quarters of each fiscal year as an exhibit to its reports on Form N-PORT. The Fund’s Forms N-PORT are available on the
SEC’s website at www.sec.gov or on request by calling 1-800-966-4354.
Federal Tax Distribution Information
(Unaudited)
For fiscal year 2019, certain dividends paid by the Fund may be subject to a maximum tax rate of 23.8%, as provided for by the Jobs and Growth Tax Relief Reconciliation Act of 2003. The percentage of dividends
declared from ordinary income designated as qualified dividend income was 100.00%.
For corporate shareholders, the percent of ordinary income distributions that qualified for the corporate dividends received deduction for fiscal year 2019 was 100.00%.
The percentage of taxable ordinary income distributions that were designated as short-term capital gain distributions under Section 871(k)(2)(C) of the Internal Revenue Code of 1986, as amended, for
the Fund was 0.00%.
Important Notice Regarding Delivery
of Shareholder Documents
To help keep the Fund’s costs as low as possible, we generally deliver a single copy of shareholder reports, proxy statements, and prospectuses to shareholders who share an address and have the same last name. This
process does not apply to account statements. You may request an individual copy of a shareholder document at any time. If you would like to receive separate mailings of shareholder documents, please call U.S. Bank Global Fund Services at
1-800-261-6950 or 1-414-765-4124, and individual delivery will begin within 30 days of your request. If your account is held through a financial institution or other intermediary, please contact such intermediary directly to request individual
delivery.
Electronic Delivery
The Funds offer shareholders the option to receive account statements, prospectuses, tax forms, and shareholder reports online. To sign up for eDelivery, please visit www.hennessyfunds.com/account. You may change your
delivery preference at any time by visiting our website or calling U.S. Bank Global Fund Services at 1-800-261-6950 or 1-414-765-4124.
|
HENNESSY FUNDS
|
1-800-966-4354
|
25
Board Approval of Investment Advisory
Agreement
At its meeting on March 12, 2020, the Board of Trustees of the Fund (the “Board,” and the members thereof, the “Trustees”) unanimously approved the continuation of the investment advisory agreement of the Fund with
Hennessy Advisors, Inc. (the “Advisor”). As part of the process of approving the continuation of the advisory agreement, the Trustees reviewed their fiduciary duties and the relevant factors for them to consider with respect to approving the
advisory agreement. In addition, the Trustees who are not deemed “interested persons” (as defined by the Investment Company Act of 1940, as amended) of the Fund (the “Independent Trustees”) met in executive session to discuss the approval of
the advisory agreement.
In advance of the meeting, the Advisor sent detailed information to the Trustees to assist them in their evaluation of the advisory agreement. This information included, but was not limited to, the
following:
|
(1)
|
A memorandum from outside legal counsel that described the fiduciary duties of the Board with respect to approving the continuation of the advisory agreement and the relevant factors for consideration;
|
|
|
(2)
|
A memorandum from the Advisor that listed the factors relevant to the Board’s approval of the continuation of the advisory agreement and also referenced the documents that had been provided to help the Board
assess each such factor;
|
|
|
(3)
|
An inventory of the services provided by the Advisor;
|
|
|
(4)
|
A written discussion of economies of scale;
|
|
|
(5)
|
A summary of the key terms of the advisory agreement;
|
|
|
(6)
|
A recent Fund fact sheet, which included performance information over various periods;
|
|
|
(7)
|
A peer expense comparison of the net expense ratio and investment advisory fee of the Fund; and
|
|
|
(8)
|
The Advisor’s financial statements from its most recent Form 10-K and Form 10-Q.
|
All of the factors discussed were considered as a whole by the Trustees and by the Independent Trustees meeting in executive session. The factors were viewed in their totality by the Trustees, with
no single factor being the principal or determinative factor in the Trustees’ determination of whether to approve the continuation of the advisory agreement. The Trustees recognized that the management and fee arrangements for the Fund are the
result of years of review and discussion between the Independent Trustees and the Advisor, that certain aspects of such arrangements may receive greater scrutiny in some years than in others, and that the Trustees’ conclusions may be based, in
part, on their consideration of these same arrangements and information received during the course of the year and in prior years.
Prior to approving the continuation of the advisory agreement, the Trustees, including the Independent Trustees in executive session, considered, among other items:
|
(1)
|
The nature and quality of the advisory services provided by the Advisor;
|
|
|
(2)
|
A comparison of the fees and expenses of the Fund to other similar funds;
|
|
|
(3)
|
Whether economies of scale are recognized by the Fund;
|
|
HENNESSYFUNDS.COM
|
26
|
BOARD APPROVAL OF INVESTMENT ADVISORY AGREEMENT
|
|
(4)
|
The costs and profitability of the Fund to the Advisor;
|
|
|
(5)
|
The performance of the Fund; and
|
|
|
(6)
|
Any benefits to the Advisor from serving as an investment advisor to the Fund (other than the advisory fee).
|
The material considerations and determinations of the Trustees, including the Independent Trustees, were as follows:
|
(1)
|
The Trustees considered the services identified below that are provided by the Advisor. Based on this review, the Trustees concluded that the Advisor provides high-quality services to the Fund and noted that
their overall confidence in the Advisor was high. The Trustees also concluded that they were satisfied with the nature, extent, and quality of the advisory services provided to the Fund by the Advisor and that the nature and extent of
the services provided by the Advisor were appropriate to assure that the Fund’s operations are conducted in compliance with applicable laws, rules, and regulations.
|
|
(a)
|
The Advisor acts as the portfolio manager for the Fund. In this capacity, the Advisor does the following:
|
|
(i)
|
manages the composition of the Fund’s portfolio, including the purchase, retention, and disposition of portfolio securities in accordance with the Fund’s investment objectives, policies, and restrictions;
|
|||
|
(ii)
|
seeks best execution for the Fund’s portfolio;
|
|||
|
(iii)
|
manages the use of soft dollars for the Fund; and
|
|||
|
(iv)
|
manages proxy voting for the Fund.
|
|
(b)
|
The Advisor performs a daily reconciliation of portfolio positions and cash for the Fund.
|
||
|
(c)
|
The Advisor monitors the liquidity of each Fund.
|
||
|
(d)
|
The Advisor monitors the Fund’s compliance with its investment objectives and restrictions.
|
||
|
(e)
|
The Advisor monitors compliance with federal securities laws, maintains a compliance program (including a code of ethics), conducts ongoing reviews of the compliance programs of the Fund’s service providers,
as feasible, conducts on-site visits to the Fund’s service providers, monitors incidents of abusive trading practices, reviews Fund expense accruals, payments, and fixed expense ratios, evaluates insurance providers for fidelity bond,
D&O/E&O insurance, and cybersecurity insurance coverage, manages regulatory examination compliance and responses, conducts employee compliance training, reviews reports provided by service providers, and maintains books and
records.
|
||
|
(f)
|
The Advisor oversees service providers that provide accounting, administration, distribution, transfer agency, custodial, sales, marketing, public relations, audit, information technology, and legal services
to the Fund.
|
||
|
(g)
|
The Advisor maintains in-house marketing and distribution departments on behalf of the Fund.
|
||
|
(h)
|
The Advisor is actively involved with preparing regulatory filings for the Fund, including writing and annually updating the Fund’s prospectus and related documents.
|
|
HENNESSY FUNDS
|
1-800-966-4354
|
27
|
(i)
|
For each annual report of the Fund, the Advisor prepares a written summary of the Fund’s performance during the most recent 12-month period.
|
||
|
(j)
|
The Advisor oversees distribution of the Fund through third-party broker/dealers and independent financial institutions such as Charles Schwab, Inc., Fidelity, TD Ameritrade, and Pershing. The Advisor
participates in “no transaction fee” (“NTF”) programs with these companies on behalf of the Fund, which allow customers to purchase the Fund through third-party distribution channels without paying a transaction fee. The Advisor
compensates, in part, a number of these third-party providers of NTF programs out of its own revenues.
|
||
|
(k)
|
The Advisor pays the incentive compensation of the Fund’s compliance officers and employs other staff, such as legal, marketing, national accounts, distribution, sales, administrative, and trading oversight
personnel, as well as management executives.
|
||
|
(l)
|
The Advisor provides a quarterly compliance certification to the Board.
|
||
|
(m)
|
The Advisor prepares or reviews all Board materials, frequently presents to the Board and leads Board discussions, prepares or reviews all meeting minutes, and arranges for Board training and education.
|
|
(2)
|
The Trustees compared the performance of the Fund to benchmark indices over various periods and also noted that the Trustees review and discuss reports comparing the investment performance of the Fund to
various indices at each quarterly Board meeting. Based on such information, the Trustees determined that the Advisor manages the Fund in a manner materially consistent with its stated investment objective and style. The Trustees
concluded that the performance of the Fund over various periods warranted continuation of the advisory agreement.
|
|
|
(3)
|
The Trustees reviewed the advisory fees and overall expense ratios of the Fund compared to other funds similar in asset size and investment objective to the Fund using data from Morningstar. As part of the
discussion with management, the Trustees ensured that they understood and were comfortable with the criteria used to determine the mutual funds included in the Morningstar categories for purposes of the materials considered at the
meeting. The Trustees determined that the advisory fee and overall expense ratio of the Fund falls within the range of the advisory fees and overall expense ratios of other comparable funds and concluded that they are reasonable and
warranted continuation of the advisory agreement.
|
|
|
(4)
|
The Trustees also considered whether the Advisor was realizing economies of scale that it should share with the Fund’s shareholders. The Trustees noted that the assets of the Fund had declined over the prior
year. In addition, the Trustees noted that many of the expenses incurred to manage the Fund are asset-based fees, so the Advisor does not realize material economies of scale relating to those expenses as the assets of the Fund increase.
For example, mutual fund platform fees increase as the Fund’s assets grow. The Trustees also considered the Advisor’s efforts to contain expenses through actions such as renegotiating service contracts, the Advisor’s significant
marketing efforts to promote the Funds, the Advisor’s investments in personnel to manage the Funds, and the Advisor’s agreement to waive fees or lower its management fees in certain
|
|
HENNESSYFUNDS.COM
|
28
|
BOARD APPROVAL OF INVESTMENT ADVISORY AGREEMENT
|
|
circumstances. The Trustees noted that it did not appear that the Advisor was realizing economies of scale at current asset levels and concluded that it would continue to monitor economies of scale in the
future as circumstances changed.
|
||
|
(5)
|
The Trustees considered the profitability of the Advisor, including the impact of mutual fund platform fees on the Advisor’s profitability, and also considered the resources and revenues that the Advisor has
put into managing and distributing the Fund. The Trustees then concluded that the profits of the Advisor are reasonable and not excessive when compared to profitability guidelines set forth in relevant court cases.
|
|
|
(6)
|
The Trustees considered the high level of professionalism and knowledge of the Advisor’s employees, along with a very low level of turnover, and concluded that this was beneficial to the Fund and its
shareholders.
|
|
|
(7)
|
The Trustees considered any benefits to the Advisor from serving as an advisor to the Fund (other than the advisory fee). The Trustees noted that the Advisor may derive ancillary benefits from, by way of
example, its association with the Fund in the form of proprietary and third-party research products and services received from broker-dealers that execute portfolio trades for the Fund. The Trustees determined that any such products and
services have been used for legitimate purposes relating to the Fund by providing assistance in the investment decision-making process. The Trustees concluded that any additional benefits realized by the Advisor from its relationship
with the Fund were reasonable, which was based on, among other things, the Trustees’ finding that the research, analytical, statistical, and other information and services provided by brokers are merely supplemental to the Advisor’s own
efforts in the performance of its duties under the advisory agreement.
|
After reviewing the materials and information provided at the meeting, as well as other information regularly provided at the Board’s quarterly meetings throughout the year regarding the quality
of services provided by the Advisor, the performance of the Fund, expense information, brokerage commissions information, the adequacy and efficacy of the Advisor’s written policies and procedures, other regulatory compliance issues, trading
information and related matters, and other factors that the Trustees deemed relevant, the Trustees, including the Independent Trustees, approved the continuation of the advisory agreement.
|
HENNESSY FUNDS
|
1-800-966-4354
|
29
For information, questions, or assistance, please call
The Hennessy Funds
1-800-966-4354 or 1-415-899-1555
INVESTMENT ADVISOR
Hennessy Advisors, Inc.
7250 Redwood Boulevard, Suite 200
Novato, California 94945
ADMINISTRATOR,
TRANSFER AGENT,
DIVIDEND PAYING AGENT, &
SHAREHOLDER SERVICING AGENT
U.S. Bancorp Fund Services, LLC
d/b/a U.S. Bank Global Fund Services
P.O. Box 701
Milwaukee, Wisconsin 53201-0701
CUSTODIAN
U.S. Bank N.A.
Custody Operations
1555 North River Center Drive, Suite 302
Milwaukee, Wisconsin 53212
TRUSTEES
Neil J. Hennessy
Robert T. Doyle
J. Dennis DeSousa
Gerald P. Richardson
COUNSEL
Foley & Lardner LLP
777 East Wisconsin Avenue
Milwaukee, Wisconsin 53202-5306
INDEPENDENT REGISTERED
PUBLIC ACCOUNTING FIRM
Tait, Weller & Baker LLP
Two Liberty Place
50 South 16th Street, Suite 2900
Philadelphia, Pennsylvania 19102-2529
DISTRIBUTOR
Quasar Distributors, LLC
111 East Kilbourn Avenue, Suite 2200
Milwaukee, Wisconsin 53202
www.hennessyfunds.com | 1-800-966-4354
This report has been prepared for shareholders and may be distributed to
others only if preceded or accompanied by a current prospectus.
SEMI-ANNUAL REPORT
APRIL 30, 2020

HENNESSY CORNERSTONE VALUE FUND
Investor Class HFCVX
Institutional Class HICVX
IMPORTANT NOTICE REGARDING ELECTRONIC DELIVERY OF SHAREHOLDER REPORTS
Beginning on January 1, 2021, as permitted by regulations adopted by the Securities and Exchange Commission, paper copies of the annual and semi-annual reports
will no longer be sent by mail unless you specifically request paper copies from the Hennessy Funds or from your financial intermediary. Instead, the reports will be made available on a website, and you will be notified by mail each
time a report is posted and provided with a website link to access the report.
If you have already elected to receive shareholder reports electronically, you will not be affected by this change and you need not take any action. You may elect
to receive shareholder reports and other communications from the Hennessy Funds electronically by visiting www.hennessyfunds.com/account or by calling U.S. Bank Global Fund Services at 1-800-261-6950. If you own shares in a Fund
through a financial intermediary, please contact your financial intermediary to make this election.
You may elect to receive paper copies of all future reports free of charge by calling U.S. Bank Global Fund Services at 1-800-261-6950 or, if you own your shares
through a financial intermediary, by contacting your financial intermediary. Your election to receive paper copies of reports will apply to all Funds in the Hennessy Funds family.
hennessyfunds.com | 1-800-966-4354
(This Page Intentionally Left Blank.)
Contents
|
Letter to Shareholders
|
2
|
|
Performance Overview
|
4
|
|
Financial Statements
|
|
|
Schedule of Investments
|
5
|
|
Statement of Assets and Liabilities
|
9
|
|
Statement of Operations
|
10
|
|
Statements of Changes in Net Assets
|
11
|
|
Financial Highlights
|
12
|
|
Notes to the Financial Statements
|
16
|
|
Expense Example
|
23
|
|
Proxy Voting Policy and Proxy Voting Records
|
25
|
|
Availability of Quarterly Portfolio Schedule
|
25
|
|
Federal Tax Distribution Information
|
25
|
|
Important Notice Regarding Delivery of Shareholder Documents
|
25
|
|
Electronic Delivery
|
25
|
|
Board Approval of Investment Advisory Agreement
|
26
|
|
HENNESSY FUNDS
|
1-800-966-4354
|
June 2020
Dear Hennessy Funds Shareholder:
First and foremost, I hope this communication finds you and your loved ones safe and healthy. In many ways, the COVID-19 pandemic has turned the world upside down in recent months, and we at Hennessy have joined the
rest of the world in witnessing and experiencing its profound effect on public health, the global economy, and the everyday lives of people around the world. In response to the crisis, we invoked our business continuity plan in mid-March to
ensure a smooth transition to remote work for all of our employees, who have been working safely and productively from home. We want to assure our Hennessy Funds shareholders that our operations are uninterrupted and functioning normally.
The past six months have been marked by extremes. During the first half of the period from November 2019 through January 2020, the bull market, supported by strong corporate fundamentals,
continued to move higher, and investors appeared focused on record-low unemployment and strong economic growth. In mid-February, the major U.S. market indices hit all-time highs, but then, within just a matter of weeks, lost over one-third of
their values as the COVID-19 pandemic unfolded. Shelter-in-place and business closure orders rippled through the nation, causing initial unemployment claims to skyrocket to their highest number in history. The market then rallied back and
posted double-digit positive returns in April.
For the six months ended April 30, 2020, on a total return basis, the Dow Jones Industrial Average was down 8.9% and the S&P 500® Index was down 3.2%. Small-cap and mid-cap stocks generally fared worse than large-cap stocks during the period, and the Financial sector was particularly hard hit as the Federal Reserve aggressively cut the federal funds
rate in an effort to stabilize the economy. The Energy sector was crushed by both the sudden loss of demand due to COVID-19 and the oversupply caused by the surprise market-share battle between Russia and Saudi Arabia, and the S&P 500® Energy Sector Index ended the six-month period down over 30%.
The COVID-19 pandemic is an unprecedented event, and the duration and full extent of the economic impact is unknown. In the moment, there is always the concern that ‘this time is different.’ But,
when you are able to look at past financial, political, and health crises with the benefit of 20/20 hindsight, history has demonstrated that our economy and financial markets have always rebounded and recovered eventually. If you look back to
the last market downturn in 2008, economic fundamentals were weak compared to the market in 2020, where the overall underpinnings were – and are still – quite strong. Publicly listed companies today have plenty of cash, with over $5 trillion
on balance sheets of the S&P 500® companies alone, and I believe that most will survive and that many may emerge from the current crisis even stronger.
|
HENNESSYFUNDS.COM
|
2
|
LETTER TO SHAREHOLDERS
|
We understand that this market volatility and economic uncertainty is jarring to many investors, and we continue to monitor events and the markets. We remain focused on managing our
high-conviction portfolios for the long-term benefit of our shareholders, and we are confident in the time-tested strategies and rigorous research that led to their formation. We encourage shareholders to maintain a long-term investment
horizon and to remain focused on long-term goals. As always, but especially in these trying times, we are here to support our shareholders, and we thank you for your continued investment and trust. Should you have any questions or would like
to speak with us directly, please don’t hesitate to call (800) 966-4354 or email us at fundsinfo@hennessyfunds.com.
Best regards,
Neil J. Hennessy
President and Chief Investment Officer
Past performance does not guarantee future results.
Mutual fund investing involves risk. Principal loss is possible.
The Dow Jones Industrial Average and S&P 500® Index are commonly used to measure the performance of U.S. stocks. The S&P 500® Energy Sector Index is an index that comprises those companies included in the S&P 500 that are classified as members of the GICS energy sector. One cannot
invest directly in an index.
|
HENNESSY FUNDS
|
1-800-966-4354
|
3
Performance Overview (Unaudited)
AVERAGE ANNUAL TOTAL RETURN FOR PERIODS ENDED APRIL 30, 2020
|
Six
|
One
|
Five
|
Ten
|
|
|
Months(1)
|
Year
|
Years
|
Years
|
|
|
Hennessy Cornerstone Value Fund –
|
||||
|
Investor Class (HFCVX)
|
-16.89%
|
-16.46%
|
1.80%
|
6.90%
|
|
Hennessy Cornerstone Value Fund –
|
||||
|
Institutional Class (HICVX)
|
-16.80%
|
-16.37%
|
2.01%
|
7.14%
|
|
Russell 1000® Value Index
|
-13.66%
|
-11.01%
|
3.90%
|
8.54%
|
|
S&P 500® Index
|
-3.16%
|
0.86%
|
9.12%
|
11.69%
|
Expense ratios: 1.23% (Investor Class); 1.08% (Institutional Class)
|
(1)
|
Periods of less than one year are not annualized.
|
_______________
Performance data quoted represents past performance; past performance does not guarantee future results. The investment return and principal value of an investment will fluctuate so that an
investor’s shares, when redeemed, may be worth more or less than their original cost. The performance table does not reflect the deduction of taxes that a shareholder would pay on Fund distributions or the redemption of Fund shares. Current
performance of the Fund may be lower or higher than the performance quoted. Performance data current to the most recent month end may be obtained by visiting www.hennessyfunds.com.
The Russell 1000® Value Index comprises those Russell 1000®
companies with lower price-to-book ratios and lower forecasted growth value. The S&P 500® Index is a capitalization-weighted index that is designed to
represent the broad domestic economy through changes in the aggregate market value of 500 stocks across all major industries. One cannot invest directly in an index. These indices are used herein for comparative purposes in accordance with
SEC regulations.
Frank Russell Company (“Russell”) is the source and owner of the trademarks, service marks, and copyrights related to the Russell Indexes. Russell® is a trademark of Russell. Neither Russell nor its licensors accept any liability for any errors or omissions in the Russell Indexes or Russell ratings or underlying data and no party may rely on any Russell Indexes or
Russell ratings or underlying data contained in this communication. No further distribution of Russell data is permitted without Russell’s express written consent. Russell does not promote, sponsor, or endorse the content of this
communication.
Standard & Poor’s Financial Services LLC is the source and owner of the S&P® and S&P 500® trademarks.
The expense ratios presented are from the most recent prospectus. The expense ratios for the current reporting period are available in the Financial Highlights section of this report.
|
HENNESSYFUNDS.COM
|
4
|
PERFORMANCE OVERVIEW/SCHEDULE OF INVESTMENTS
|
Financial Statements
|
Schedule of Investments as of April 30, 2020
(Unaudited)
|
HENNESSY CORNERSTONE VALUE FUND
(% of Net Assets)
|
TOP TEN HOLDINGS (EXCLUDING MONEY MARKET FUNDS)
|
% NET ASSETS
|
|
Gilead Sciences, Inc.
|
2.96%
|
|
The Kraft Heinz Co.
|
2.73%
|
|
General Mills, Inc.
|
2.72%
|
|
Amgen, Inc.
|
2.63%
|
|
Pfizer, Inc.
|
2.63%
|
|
Verizon Communications, Inc.
|
2.42%
|
|
GlaxoSmithKline PLC – ADR
|
2.39%
|
|
3M Co.
|
2.37%
|
|
Merck & Co., Inc.
|
2.36%
|
|
Bristol-Myers Squibb Co.
|
2.27%
|
Note: For presentation purposes, the Fund has grouped some of the industry categories. For purposes of categorizing securities for compliance with Section 8(b)(1) of the Investment Company Act of 1940, as amended,
the Fund uses more specific industry classifications.
The Global Industry Classification Standard (GICS®) was developed by and is the exclusive property and a service mark of MSCI, Inc.
and Standard & Poor’s Financial Services LLC. It has been licensed for use by the Hennessy Funds.
|
HENNESSY FUNDS
|
1-800-966-4354
|
5
|
COMMON STOCKS – 98.29%
|
Number
|
% of
|
||||||||||
|
|
of Shares
|
Value
|
Net Assets
|
|||||||||
|
Communication Services – 4.36%
|
||||||||||||
|
AT&T, Inc.
|
129,060
|
$
|
3,932,458
|
1.94
|
%
|
|||||||
|
Verizon Communications, Inc.
|
85,500
|
4,911,975
|
2.42
|
%
|
||||||||
|
|
8,844,433
|
4.36
|
%
|
|||||||||
|
Consumer Discretionary – 5.89%
|
||||||||||||
|
Carnival Corp. (a)
|
119,400
|
1,898,460
|
0.93
|
%
|
||||||||
|
Ford Motor Co.
|
630,745
|
3,210,492
|
1.58
|
%
|
||||||||
|
General Motors Co.
|
143,600
|
3,200,844
|
1.58
|
%
|
||||||||
|
Las Vegas Sands Corp.
|
75,900
|
3,644,718
|
1.80
|
%
|
||||||||
|
|
11,954,514
|
5.89
|
%
|
|||||||||
|
Consumer Staples – 19.94%
|
||||||||||||
|
Altria Group, Inc.
|
108,400
|
4,254,700
|
2.10
|
%
|
||||||||
|
Archer Daniels Midland Co.
|
113,400
|
4,211,676
|
2.07
|
%
|
||||||||
|
General Mills, Inc.
|
92,300
|
5,527,847
|
2.72
|
%
|
||||||||
|
PepsiCo, Inc.
|
34,100
|
4,511,089
|
2.22
|
%
|
||||||||
|
Philip Morris International, Inc.
|
55,500
|
4,140,300
|
2.04
|
%
|
||||||||
|
The Coca-Cola Co.
|
82,800
|
3,799,692
|
1.87
|
%
|
||||||||
|
The Kraft Heinz Co.
|
182,600
|
5,538,258
|
2.73
|
%
|
||||||||
|
Unilever PLC – ADR (a)
|
83,400
|
4,325,958
|
2.13
|
%
|
||||||||
|
Walgreens Boots Alliance, Inc.
|
96,700
|
4,186,143
|
2.06
|
%
|
||||||||
|
|
40,495,663
|
19.94
|
%
|
|||||||||
|
Energy – 15.96%
|
||||||||||||
|
BP PLC – ADR (a)
|
140,700
|
3,348,660
|
1.65
|
%
|
||||||||
|
Canadian Natural Resources Ltd. (a)
|
165,400
|
2,772,104
|
1.37
|
%
|
||||||||
|
Chevron Corp.
|
45,675
|
4,202,100
|
2.07
|
%
|
||||||||
|
ConocoPhillips
|
85,200
|
3,586,920
|
1.77
|
%
|
||||||||
|
Exxon Mobil Corp.
|
84,110
|
3,908,592
|
1.92
|
%
|
||||||||
|
Marathon Petroleum Corp.
|
84,200
|
2,701,136
|
1.33
|
%
|
||||||||
|
Occidental Petroleum Corp.
|
118,160
|
1,961,456
|
0.97
|
%
|
||||||||
|
Royal Dutch Shell PLC – ADR (a)
|
101,200
|
3,352,756
|
1.65
|
%
|
||||||||
|
Suncor Energy, Inc. (a)
|
163,700
|
2,922,045
|
1.44
|
%
|
||||||||
|
Total S.A. – ADR (a)
|
103,700
|
3,645,055
|
1.79
|
%
|
||||||||
|
|
32,400,824
|
15.96
|
%
|
|||||||||
The accompanying notes are an integral part of these financial statements.
|
HENNESSYFUNDS.COM
|
6
|
SCHEDULE OF INVESTMENTS
|
|
COMMON STOCKS
|
Number
|
% of
|
||||||||||
|
|
of Shares
|
Value
|
Net Assets
|
|||||||||
|
Financials – 12.15%
|
||||||||||||
|
Citigroup, Inc.
|
65,100
|
$
|
3,161,256
|
1.56
|
%
|
|||||||
|
JPMorgan Chase & Co.
|
36,600
|
3,504,816
|
1.73
|
%
|
||||||||
|
MetLife, Inc.
|
97,100
|
3,503,368
|
1.72
|
%
|
||||||||
|
Royal Bank of Canada (a)
|
60,200
|
3,707,718
|
1.83
|
%
|
||||||||
|
The Bank of New York Mellon Corp.
|
110,500
|
4,148,170
|
2.04
|
%
|
||||||||
|
Toronto-Dominion Bank (a)
|
86,800
|
3,625,636
|
1.78
|
%
|
||||||||
|
Wells Fargo & Co.
|
104,300
|
3,029,915
|
1.49
|
%
|
||||||||
|
|
24,680,879
|
12.15
|
%
|
|||||||||
|
Health Care – 19.47%
|
||||||||||||
|
AbbVie, Inc.
|
52,400
|
4,307,280
|
2.12
|
%
|
||||||||
|
Amgen, Inc.
|
22,300
|
5,334,606
|
2.63
|
%
|
||||||||
|
Bristol-Myers Squibb Co.
|
75,800
|
4,609,398
|
2.27
|
%
|
||||||||
|
CVS Health Corp.
|
69,600
|
4,283,880
|
2.11
|
%
|
||||||||
|
Gilead Sciences, Inc.
|
71,400
|
5,997,600
|
2.96
|
%
|
||||||||
|
GlaxoSmithKline PLC – ADR (a)
|
115,500
|
4,859,085
|
2.39
|
%
|
||||||||
|
Merck & Co., Inc.
|
60,400
|
4,792,136
|
2.36
|
%
|
||||||||
|
Pfizer, Inc.
|
139,300
|
5,343,548
|
2.63
|
%
|
||||||||
|
|
39,527,533
|
19.47
|
%
|
|||||||||
|
Industrials – 9.74%
|
||||||||||||
|
3M Co.
|
31,700
|
4,815,864
|
2.37
|
%
|
||||||||
|
Caterpillar, Inc.
|
36,300
|
4,224,594
|
2.08
|
%
|
||||||||
|
Delta Air Lines, Inc.
|
86,000
|
2,228,260
|
1.10
|
%
|
||||||||
|
Emerson Electric Co.
|
69,000
|
3,935,070
|
1.94
|
%
|
||||||||
|
United Parcel Service, Inc., Class B
|
48,300
|
4,572,078
|
2.25
|
%
|
||||||||
|
|
19,775,866
|
9.74
|
%
|
|||||||||
|
Information Technology – 8.72%
|
||||||||||||
|
Cisco Systems, Inc.
|
107,500
|
4,555,850
|
2.24
|
%
|
||||||||
|
International Business Machines Corp.
|
33,200
|
4,168,592
|
2.05
|
%
|
||||||||
|
Qualcomm, Inc.
|
57,200
|
4,499,924
|
2.22
|
%
|
||||||||
|
Texas Instruments, Inc.
|
38,700
|
4,491,909
|
2.21
|
%
|
||||||||
|
|
17,716,275
|
8.72
|
%
|
|||||||||
|
Materials – 2.06%
|
||||||||||||
|
Nutrien Ltd. (a)
|
116,900
|
4,174,499
|
2.06
|
%
|
||||||||
|
|
||||||||||||
|
Total Common Stocks
|
||||||||||||
|
(Cost $242,660,643)
|
199,570,486
|
98.29
|
%
|
|||||||||
The accompanying notes are an integral part of these financial statements.
|
HENNESSY FUNDS
|
1-800-966-4354
|
7
|
SHORT-TERM INVESTMENTS – 1.79%
|
Number
|
% of
|
||||||||||
|
|
of Shares
|
Value
|
Net Assets
|
|||||||||
|
Money Market Funds – 1.79%
|
||||||||||||
|
First American Government Obligations Fund,
|
||||||||||||
|
Institutional Class, 0.25% (b)
|
3,634,203
|
$
|
3,634,203
|
1.79
|
%
|
|||||||
|
|
||||||||||||
|
Total Short-Term Investments
|
||||||||||||
|
(Cost $3,634,203)
|
3,634,203
|
1.79
|
%
|
|||||||||
|
|
||||||||||||
|
Total Investments
|
||||||||||||
|
(Cost $246,294,846) – 100.08%
|
203,204,689
|
100.08
|
%
|
|||||||||
|
Liabilities in Excess of Other Assets – (0.08)%
|
(170,732
|
)
|
(0.08
|
)%
|
||||||||
|
|
||||||||||||
|
TOTAL NET ASSETS – 100.00%
|
$
|
203,033,957
|
100.00
|
%
|
||||||||
Percentages are stated as a percent of net assets.
ADR – American Depositary Receipt
PLC – Public Limited Company
|
(a)
|
U.S.-traded security of a foreign corporation.
|
|
(b)
|
The rate listed is the fund’s seven-day yield as of April 30, 2020.
|
Summary of Fair Value Exposure as of April 30, 2020
The following is a summary of the inputs used to value the Fund’s net assets as of April 30, 2020 (see Note 3 in the accompanying Notes to the Financial Statements):
|
Common Stocks
|
Level 1
|
Level 2
|
Level 3
|
Total
|
||||||||||||
|
Communication Services
|
$
|
8,844,433
|
$
|
—
|
$
|
—
|
$
|
8,844,433
|
||||||||
|
Consumer Discretionary
|
11,954,514
|
—
|
—
|
11,954,514
|
||||||||||||
|
Consumer Staples
|
40,495,663
|
—
|
—
|
40,495,663
|
||||||||||||
|
Energy
|
32,400,824
|
—
|
—
|
32,400,824
|
||||||||||||
|
Financials
|
24,680,879
|
—
|
—
|
24,680,879
|
||||||||||||
|
Health Care
|
39,527,533
|
—
|
—
|
39,527,533
|
||||||||||||
|
Industrials
|
19,775,866
|
—
|
—
|
19,775,866
|
||||||||||||
|
Information Technology
|
17,716,275
|
—
|
—
|
17,716,275
|
||||||||||||
|
Materials
|
4,174,499
|
—
|
—
|
4,174,499
|
||||||||||||
|
Total Common Stocks
|
$
|
199,570,486
|
$
|
—
|
$
|
—
|
$
|
199,570,486
|
||||||||
|
Short-Term Investments
|
||||||||||||||||
|
Money Market Funds
|
$
|
3,634,203
|
$
|
—
|
$
|
—
|
$
|
3,634,203
|
||||||||
|
Total Short-Term Investments
|
$
|
3,634,203
|
$
|
—
|
$
|
—
|
$
|
3,634,203
|
||||||||
|
Total Investments
|
$
|
203,204,689
|
$
|
—
|
$
|
—
|
$
|
203,204,689
|
||||||||
The accompanying notes are an integral part of these financial statements.
|
HENNESSYFUNDS.COM
|
8
|
SCHEDULE OF INVESTMENTS/STATEMENT OF ASSETS AND LIABILITIES
|
Financial Statements
|
Statement of Assets and Liabilities as of April 30, 2020 (Unaudited)
|
|
ASSETS:
|
||||
|
Investments in securities, at value (cost $246,294,846)
|
$
|
203,204,689
|
||
|
Cash
|
41,845
|
|||
|
Dividends and interest receivable
|
410,755
|
|||
|
Receivable for fund shares sold
|
3,045
|
|||
|
Prepaid expenses and other assets
|
20,565
|
|||
|
Total assets
|
203,680,899
|
|||
|
LIABILITIES:
|
||||
|
Payable for fund shares redeemed
|
59,581
|
|||
|
Payable to advisor
|
118,050
|
|||
|
Payable to administrator
|
34,104
|
|||
|
Payable to auditor
|
11,373
|
|||
|
Accrued distribution fees
|
374,889
|
|||
|
Accrued service fees
|
15,569
|
|||
|
Accrued trustees fees
|
4,536
|
|||
|
Accrued expenses and other payables
|
28,840
|
|||
|
Total liabilities
|
646,942
|
|||
|
NET ASSETS
|
$
|
203,033,957
|
||
|
NET ASSETS CONSISTS OF:
|
||||
|
Capital stock
|
$
|
243,018,967
|
||
|
Accumulated deficit
|
(39,985,010
|
)
|
||
|
Total net assets
|
$
|
203,033,957
|
||
|
NET ASSETS:
|
||||
|
Investor Class
|
||||
|
Shares authorized (no par value)
|
Unlimited
|
|||
|
Net assets applicable to outstanding shares
|
$
|
198,085,733
|
||
|
Shares issued and outstanding
|
14,581,676
|
|||
|
Net asset value, offering price, and redemption price per share
|
$
|
13.58
|
||
|
Institutional Class
|
||||
|
Shares authorized (no par value)
|
Unlimited
|
|||
|
Net assets applicable to outstanding shares
|
$
|
4,948,224
|
||
|
Shares issued and outstanding
|
364,053
|
|||
|
Net asset value, offering price, and redemption price per share
|
$
|
13.59
|
||
The accompanying notes are an integral part of these financial statements.
|
HENNESSY FUNDS
|
1-800-966-4354
|
9
Financial Statements
|
Statement of Operations for the six months ended April 30, 2020 (Unaudited)
|
|
INVESTMENT INCOME:
|
||||
|
Dividend income(1)
|
$
|
4,777,568
|
||
|
Interest income
|
37,945
|
|||
|
Total investment income
|
4,815,513
|
|||
|
EXPENSES:
|
||||
|
Investment advisory fees (See Note 5)
|
888,672
|
|||
|
Distribution fees – Investor Class (See Note 5)
|
175,662
|
|||
|
Administration, accounting, custody, and transfer agent fees (See Note 5)
|
126,377
|
|||
|
Service fees – Investor Class (See Note 5)
|
117,108
|
|||
|
Sub-transfer agent expenses – Investor Class (See Note 5)
|
89,308
|
|||
|
Sub-transfer agent expenses – Institutional Class (See Note 5)
|
3,177
|
|||
|
Federal and state registration fees
|
19,945
|
|||
|
Compliance expense (See Note 5)
|
13,462
|
|||
|
Audit fees
|
11,375
|
|||
|
Reports to shareholders
|
11,016
|
|||
|
Trustees’ fees and expenses
|
9,553
|
|||
|
Legal fees
|
1,281
|
|||
|
Other expenses
|
14,930
|
|||
|
Total expenses
|
1,481,866
|
|||
|
NET INVESTMENT INCOME
|
$
|
3,333,647
|
||
|
REALIZED AND UNREALIZED GAINS (LOSSES):
|
||||
|
Net realized gain on investments
|
$
|
1,313,644
|
||
|
Net change in unrealized appreciation/depreciation on investments
|
(46,914,128
|
)
|
||
|
Net loss on investments
|
(45,600,484
|
)
|
||
|
NET DECREASE IN NET ASSETS RESULTING FROM OPERATIONS
|
$
|
(42,266,837
|
)
|
|
|
(1)
|
Net of foreign taxes withheld and issuance fees of $104,704.
|
The accompanying notes are an integral part of these financial statements.
|
HENNESSYFUNDS.COM
|
10
|
STATEMENT OF OPERATIONS/STATEMENTS OF CHANGES IN NET ASSETS
|
Financial Statements
|
Statements of Changes in Net Assets
|
|
Six Months Ended
|
||||||||
|
April 30, 2020
|
Year Ended
|
|||||||
|
(Unaudited)
|
October 31, 2019
|
|||||||
|
OPERATIONS:
|
||||||||
|
Net investment income
|
$
|
3,333,647
|
$
|
7,177,446
|
||||
|
Net realized gain on investments
|
1,313,644
|
11,149,160
|
||||||
|
Net change in unrealized
|
||||||||
|
appreciation/depreciation on investments
|
(46,914,128
|
)
|
(5,555,727
|
)
|
||||
|
Net increase (decrease) in net assets
|
||||||||
|
resulting from operations
|
(42,266,837
|
)
|
12,770,879
|
|||||
|
DISTRIBUTIONS TO SHAREHOLDERS:
|
||||||||
|
Distributable earnings – Investor Class
|
(16,696,863
|
)
|
(36,817,937
|
)
|
||||
|
Distributable earnings – Institutional Class
|
(434,493
|
)
|
(980,722
|
)
|
||||
|
Total distributions
|
(17,131,356
|
)
|
(37,798,659
|
)
|
||||
|
CAPITAL SHARE TRANSACTIONS:
|
||||||||
|
Proceeds from shares subscribed – Investor Class
|
998,842
|
2,177,066
|
||||||
|
Proceeds from shares subscribed – Institutional Class
|
555,343
|
1,522,914
|
||||||
|
Dividends reinvested – Investor Class
|
15,770,353
|
34,854,971
|
||||||
|
Dividends reinvested – Institutional Class
|
399,784
|
893,462
|
||||||
|
Cost of shares redeemed – Investor Class
|
(14,752,516
|
)
|
(25,540,967
|
)
|
||||
|
Cost of shares redeemed – Institutional Class
|
(929,266
|
)
|
(2,463,013
|
)
|
||||
|
Net increase in net assets derived
|
||||||||
|
from capital share transactions
|
2,042,540
|
11,444,433
|
||||||
|
TOTAL DECREASE IN NET ASSETS
|
(57,355,653
|
)
|
(13,583,347
|
)
|
||||
|
NET ASSETS:
|
||||||||
|
Beginning of period
|
260,389,610
|
273,972,957
|
||||||
|
End of period
|
$
|
203,033,957
|
$
|
260,389,610
|
||||
|
CHANGES IN SHARES OUTSTANDING:
|
||||||||
|
Shares sold – Investor Class
|
62,799
|
128,721
|
||||||
|
Shares sold – Institutional Class
|
34,336
|
90,985
|
||||||
|
Shares issued to holders as reinvestment
|
||||||||
|
of dividends – Investor Class
|
906,647
|
2,133,897
|
||||||
|
Shares issued to holders as reinvestment
|
||||||||
|
of dividends – Institutional Class
|
22,969
|
54,603
|
||||||
|
Shares redeemed – Investor Class
|
(959,893
|
)
|
(1,518,570
|
)
|
||||
|
Shares redeemed – Institutional Class
|
(62,175
|
)
|
(150,029
|
)
|
||||
|
Net increase in shares outstanding
|
4,683
|
739,607
|
||||||
The accompanying notes are an integral part of these financial statements.
|
HENNESSY FUNDS
|
1-800-966-4354
|
11
Financial Statements
|
Financial Highlights
|
For an Investor Class share outstanding throughout each period
|
Six Months Ended
|
||||
|
April 30, 2020
|
||||
|
(Unaudited)
|
||||
|
PER SHARE DATA:
|
||||
|
Net asset value, beginning of period
|
$
|
17.43
|
||
|
Income from investment operations:
|
||||
|
Net investment income
|
0.22
|
(1)
|
||
|
Net realized and unrealized gains (losses) on investments
|
(2.93
|
)
|
||
|
Total from investment operations
|
(2.71
|
)
|
||
|
Less distributions:
|
||||
|
Dividends from net investment income
|
(0.47
|
)
|
||
|
Dividends from net realized gains
|
(0.67
|
)
|
||
|
Total distributions
|
(1.14
|
)
|
||
|
Net asset value, end of period
|
$
|
13.58
|
||
|
TOTAL RETURN
|
-16.89
|
%(2)
|
||
|
SUPPLEMENTAL DATA AND RATIOS:
|
||||
|
Net assets, end of period (millions)
|
$
|
198.09
|
||
|
Ratio of expenses to average net assets
|
1.24
|
%(3)
|
||
|
Ratio of net investment income to average net assets
|
2.77
|
%(3)
|
||
|
Portfolio turnover rate(4)
|
30
|
%(2)
|
||
|
(1)
|
Calculated using the average shares outstanding method.
|
|
(2)
|
Not annualized.
|
|
(3)
|
Annualized.
|
|
(4)
|
Calculated on the basis of the Fund as a whole.
|
The accompanying notes are an integral part of these financial statements.
|
HENNESSYFUNDS.COM
|
12
|
FINANCIAL HIGHLIGHTS — INVESTOR CLASS
|
|
Year Ended October 31,
|
||||||||||||||||||
|
2019
|
2018
|
2017
|
2016
|
2015
|
||||||||||||||
|
$
|
19.29
|
$
|
21.48
|
$
|
18.36
|
$
|
17.69
|
$
|
18.41
|
|||||||||
|
0.47
|
(1)
|
0.41
|
0.45
|
0.43
|
0.44
|
|||||||||||||
|
0.30
|
0.35
|
3.10
|
0.67
|
(0.75
|
)
|
|||||||||||||
|
0.77
|
0.76
|
3.55
|
1.10
|
(0.31
|
)
|
|||||||||||||
|
(0.41
|
)
|
(0.42
|
)
|
(0.43
|
)
|
(0.43
|
)
|
(0.41
|
)
|
|||||||||
|
(2.22
|
)
|
(2.53
|
)
|
—
|
—
|
—
|
||||||||||||
|
(2.63
|
)
|
(2.95
|
)
|
(0.43
|
)
|
(0.43
|
)
|
(0.41
|
)
|
|||||||||
|
$
|
17.43
|
$
|
19.29
|
$
|
21.48
|
$
|
18.36
|
$
|
17.69
|
|||||||||
|
5.22
|
%
|
3.64
|
%
|
19.63
|
%
|
6.41
|
%
|
-1.77
|
%
|
|||||||||
|
$
|
253.95
|
$
|
266.76
|
$
|
281.07
|
$
|
126.53
|
$
|
129.86
|
|||||||||
|
1.23
|
%
|
1.21
|
%
|
1.22
|
%
|
1.25
|
%
|
1.10
|
%
|
|||||||||
|
2.75
|
%
|
2.21
|
%
|
2.36
|
%
|
2.33
|
%
|
2.32
|
%
|
|||||||||
|
27
|
%
|
41
|
%
|
72
|
%
|
36
|
%
|
46
|
%
|
|||||||||
The accompanying notes are an integral part of these financial statements.
|
HENNESSY FUNDS
|
1-800-966-4354
|
13
Financial Statements
|
Financial Highlights
|
For an Institutional Class share outstanding throughout each period
|
Six Months Ended
|
||||
|
April 30, 2020
|
||||
|
(Unaudited)
|
||||
|
PER SHARE DATA:
|
||||
|
Net asset value, beginning of period
|
$
|
17.45
|
||
|
Income from investment operations:
|
||||
|
Net investment income
|
0.24
|
(1)
|
||
|
Net realized and unrealized gains (losses) on investments
|
(2.93
|
)
|
||
|
Total from investment operations
|
(2.69
|
)
|
||
|
Less distributions:
|
||||
|
Dividends from net investment income
|
(0.49
|
)
|
||
|
Dividends from net realized gains
|
(0.68
|
)
|
||
|
Total distributions
|
(1.17
|
)
|
||
|
Net asset value, end of period
|
$
|
13.59
|
||
|
TOTAL RETURN
|
-16.80
|
%(2)
|
||
|
SUPPLEMENTAL DATA AND RATIOS:
|
||||
|
Net assets, end of period (millions)
|
$
|
4.95
|
||
|
Ratio of expenses to average net assets:
|
1.02
|
%(3)
|
||
|
Ratio of net investment income to average net assets:
|
2.99
|
%(3)
|
||
|
Portfolio turnover rate(4)
|
30
|
%(2)
|
||
|
(1)
|
Calculated using the average shares outstanding method.
|
|
(2)
|
Not annualized.
|
|
(3)
|
Annualized.
|
|
(4)
|
Calculated on the basis of the Fund as a whole.
|
The accompanying notes are an integral part of these financial statements.
|
HENNESSYFUNDS.COM
|
14
|
FINANCIAL HIGHLIGHTS — INSTITUTIONAL CLASS
|
|
Year Ended October 31,
|
||||||||||||||||||
|
2019
|
2018
|
2017
|
2016
|
2015
|
||||||||||||||
|
$
|
19.33
|
$
|
21.52
|
$
|
18.40
|
$
|
17.67
|
$
|
18.41
|
|||||||||
|
0.50
|
(1)
|
0.45
|
0.43
|
0.48
|
0.53
|
|||||||||||||
|
0.29
|
0.35
|
3.18
|
0.67
|
(0.83
|
)
|
|||||||||||||
|
0.79
|
0.80
|
3.61
|
1.15
|
(0.30
|
)
|
|||||||||||||
|
(0.45
|
)
|
(0.46
|
)
|
(0.49
|
)
|
(0.42
|
)
|
(0.44
|
)
|
|||||||||
|
(2.22
|
)
|
(2.53
|
)
|
—
|
—
|
—
|
||||||||||||
|
(2.67
|
)
|
(2.99
|
)
|
(0.49
|
)
|
(0.42
|
)
|
(0.44
|
)
|
|||||||||
|
$
|
17.45
|
$
|
19.33
|
$
|
21.52
|
$
|
18.40
|
$
|
17.67
|
|||||||||
|
5.37
|
%
|
3.88
|
%
|
19.95
|
%
|
6.72
|
%
|
-1.72
|
%
|
|||||||||
|
$
|
6.44
|
$
|
7.22
|
$
|
7.40
|
$
|
1.88
|
$
|
1.75
|
|||||||||
|
1.08
|
%
|
0.98
|
%
|
0.97
|
%
|
0.95
|
%
|
1.00
|
%
|
|||||||||
|
2.92
|
%
|
2.43
|
%
|
2.60
|
%
|
2.63
|
%
|
2.43
|
%
|
|||||||||
|
27
|
%
|
41
|
%
|
72
|
%
|
36
|
%
|
46
|
%
|
|||||||||
The accompanying notes are an integral part of these financial statements.
|
HENNESSY FUNDS
|
1-800-966-4354
|
15
Financial Statements
|
Notes to the Financial Statements April 30, 2020 (Unaudited)
|
1). ORGANIZATION
The Hennessy Cornerstone Value Fund (the “Fund”) is a series of Hennessy Funds Trust (the “Trust”), which was organized as a Delaware statutory trust on September 17, 1992. The Fund is an open-end management
investment company registered under the Investment Company Act of 1940, as amended. The investment objective of the Fund is total return, consisting of capital appreciation and current income. The Fund is a diversified fund.
The Fund offers Investor Class and Institutional Class shares. Each class of shares differs principally in its respective 12b-1 distribution and service, shareholder servicing, and sub-transfer
agent expenses. There are no sales charges. Each class has identical rights to earnings, assets, and voting privileges, except for class-specific expenses and exclusive rights to vote on matters affecting only one class.
As an investment company, the Fund follows the investment company accounting and reporting guidance of the Financial Accounting Standards Board (“FASB”) Accounting Standard Codification Topic 946
“Financial Services—Investment Companies.”
2). SIGNIFICANT ACCOUNTING POLICIES
The following is a summary of significant accounting policies consistently followed by the Fund in the preparation of the financial statements. These policies conform to U.S. generally accepted accounting principles
(“GAAP”).
|
a).
|
Securities Valuation – All investments in securities are recorded at their estimated fair value, as described in Note 3.
|
|
b).
|
Federal Income Taxes – No provision for federal income taxes or excise taxes has been made because the Fund has elected to be taxed as a regulated investment company and intends to distribute substantially
all of its taxable income to its shareholders and otherwise comply with the provisions of the Internal Revenue Code of 1986, as amended, applicable to regulated investment companies. Net investment income/loss and realized
gains/losses for federal income tax purposes may differ from those reported in the financial statements because of temporary book and tax basis differences. Temporary differences are primarily the result of the treatment of wash sales
for tax reporting purposes. The Fund recognizes interest and penalties related to income tax benefits, if any, in the Statement of Operations as an income tax expense. Distributions from net realized gains for book purposes may
include short-term capital gains, which are included as ordinary income to shareholders for tax purposes. The Fund may utilize equalization accounting for tax purposes and designate earnings and profits, including net realized gains
distributed to shareholders on redemption of shares, as part of the dividends paid deduction for income tax purposes.
|
|
c).
|
Accounting for Uncertainty in Income Taxes – The Fund has accounting policies regarding recognition and measurement of tax positions taken or expected to be taken on a tax return. The tax returns of the Fund
for the prior three fiscal years are open for examination. The Fund has reviewed all open tax years in major jurisdictions and concluded that there is no impact on the Fund’s net assets and no tax liability resulting from unrecognized
tax benefits relating to uncertain income tax positions taken or expected to be taken on a tax return. The Fund’s major tax jurisdictions are U.S. federal and Delaware.
|
|
HENNESSYFUNDS.COM
|
16
|
NOTES TO THE FINANCIAL STATEMENTS
|
|
d).
|
Income and Expenses – Dividend income is recognized on the ex-dividend date or as soon as information is available to the Fund. Interest income, which includes the amortization of premium and accretion of
discount, is recognized on an accrual basis. Other non-cash dividends are recognized as investment income at the fair value of the property received. The Fund is charged for those expenses that are directly attributable to its
portfolio, such as advisory, administration, and certain shareholder service fees. Income, expenses (other than expenses attributable to a specific class), and realized and unrealized gains/losses on investments are allocated to each
class of shares based on such class’s net assets.
|
|
e).
|
Distributions to Shareholders – Dividends from net investment income for the Fund, if any, are declared and paid annually, usually in December. Distributions of net realized capital gains, if any, are
declared and paid annually, usually in December.
|
|
f).
|
Security Transactions – Investment and shareholder transactions are recorded on the trade date. The Fund determines the realized gain/loss from an investment transaction by comparing the original cost of the
security lot sold with the net sale proceeds. Discounts and premiums on securities purchased are accreted or amortized, respectively, over the life of each such security.
|
|
g).
|
Use of Estimates – The preparation of financial statements in conformity with GAAP requires management to make estimates and assumptions that affect the reported amounts of assets and liabilities and
disclosure of contingent assets and liabilities at the date of the financial statements and the reported change in net assets during the reporting period. Actual results could differ from those estimates.
|
|
h).
|
Share Valuation – The net asset value (“NAV”) per share of the Fund is calculated by dividing (i) the total value of the securities held by the Fund, plus cash and other assets, minus all liabilities
(including estimated accrued expenses) by (ii) the total number of shares outstanding for the Fund, rounded to the nearest $0.01. The Fund’s shares will not be priced on days the New York Stock Exchange is closed for trading. The
offering and redemption price per share for the Fund is equal to the Fund’s NAV per share.
|
3). SECURITIES VALUATION
The Fund follows fair value accounting standards that establish an authoritative definition of fair value and set out a hierarchy for measuring fair value. These standards require additional disclosures about the
various inputs and valuation techniques used to develop the measurements of fair value and a discussion of changes in valuation techniques and related inputs during the period. These inputs are summarized in the three broad levels listed
below:
|
Level 1 –
|
Unadjusted, quoted prices in active markets for identical instruments that the Fund has the ability to access at the date of measurement.
|
|
|
Level 2 –
|
Other significant observable inputs (including, but not limited to, quoted prices in active markets for similar instruments, quoted prices in markets that are not active for identical or similar instruments,
and model-derived valuations in which all significant inputs and significant value drivers are observable in active markets, such as interest rates, prepayment speeds, credit risk curves, default rates, and similar data).
|
|
|
Level 3 –
|
Significant unobservable inputs (including the Fund’s own assumptions about what market participants would use to price the asset or liability based on the best available information) when observable inputs
are unavailable.
|
|
HENNESSY FUNDS
|
1-800-966-4354
|
17
The following is a description of the valuation techniques applied to the Fund’s major categories of assets and liabilities measured at fair value on a recurring basis:
|
Equity Securities – Equity securities, including common stocks, preferred stocks, foreign-issued common stocks, exchange-traded funds, closed-end mutual funds,
partnerships, rights, and real estate investment trusts, that are traded on a securities exchange for which a last-quoted sales price is readily available will generally be valued at the last sales price as reported by the primary
exchange on which the securities are listed. Securities listed on The NASDAQ Stock Market (“NASDAQ”) will generally be valued at the NASDAQ Official Closing Price, which may differ from the last sales price reported. Securities traded
on a securities exchange for which a last-quoted sales price is not readily available will generally be valued at the mean between the bid and ask prices. To the extent these securities are actively traded and valuation adjustments
are not applied, they are classified in Level 1 of the fair value hierarchy. Securities traded on foreign exchanges generally are not valued at the same time the Fund calculates its NAV because most foreign markets close well before
such time. The earlier close of most foreign markets gives rise to the possibility that significant events, including broad market moves, may have occurred in the interim. In certain circumstances, it may be determined that a foreign
security needs to be fair valued because it appears that the value of the security might have been materially affected by events occurring after the close of the market in which the security is principally traded, but before the time
the Fund calculates its NAV, such as by a development that affects an entire market or region (e.g., a weather-related event) or a potentially global development (e.g., a terrorist attack that may be expected to have an effect on
investor expectations worldwide).
|
|
|
Registered Investment Companies – Investments in open-end registered investment companies, commonly referred to as mutual funds, generally are priced at the ending
NAV provided by the applicable mutual fund’s service agent and will be classified in Level 1 of the fair value hierarchy.
|
|
|
Debt Securities – Debt securities, including corporate bonds, asset-backed securities, mortgage-backed securities, municipal bonds, U.S. Treasuries, and U.S.
government agency issues, are generally valued at market on the basis of valuations furnished by an independent pricing service that utilizes both dealer-supplied valuations and formula-based techniques. The pricing service may
consider recently executed transactions in securities of the issuer or comparable issuers, market price quotations (where observable), bond spreads, and fundamental data relating to the issuer. In addition, the model may incorporate
observable market data, such as reported sales of similar securities, broker quotes, yields, bids, offers, and reference data. Certain securities are valued primarily using dealer quotations. These securities are generally classified
in Level 2 of the fair value hierarchy.
|
|
|
Short-Term Securities – Short-term equity investments, including money market funds, are valued in the manner specified above. Short-term debt investments with an
original term to maturity of 60 days or less are valued at amortized cost, which approximates fair market value. If the original term to maturity of a short-term debt investment exceeded 60 days, then the values as of the 61st day
prior to maturity are amortized. Amortized cost is not used if its use would be inappropriate due to credit or other impairments of the issuer, in which case the security’s fair value would be determined, as described below.
Short-term securities are generally classified in Level 1 or Level 2 of the fair value hierarchy depending on the inputs used and market activity levels for specific securities.
|
|
HENNESSYFUNDS.COM
|
18
|
NOTES TO THE FINANCIAL STATEMENTS
|
The Board of Trustees of the Fund (the “Board”) has adopted fair value pricing procedures that are followed when a price for a security is not readily available or if a significant event has
occurred that indicates the closing price of a security no longer represents the true value of that security. Fair value pricing determinations are made in good faith in accordance with these procedures. There are numerous criteria that will
be given consideration in determining a fair value of a security, such as the trading volume of a security and markets, the values of other similar securities, and news events with direct bearing on a security or markets. Fair value pricing
results in an estimated price for a security that reflects the amount the Fund might reasonably expect to receive in a current sale. Depending on the relative significance of the valuation inputs, these securities may be classified in either
Level 2 or Level 3 of the fair value hierarchy.
The fair value of foreign securities may be determined with the assistance of a pricing service using correlations between the movement of prices of such securities and indices of domestic
securities and other appropriate indicators, such as closing market prices of relevant American Depositary Receipts or futures contracts. Using fair value pricing means that the Fund’s NAV reflects the affected portfolio securities’ values as
determined by the Board or its designee, pursuant to the fair value pricing procedures adopted by the Board, instead of being determined by the market. Using a fair value pricing methodology to price a foreign security may result in a value
that is different from such foreign security’s most recent closing price and from the value used by other investment companies to calculate their NAVs. Such securities are generally classified in Level 2 of the fair value hierarchy. Because
the Fund may invest in foreign securities, the value of the Fund’s portfolio securities may change on days when you will not be able to purchase or redeem your shares.
The Board has delegated day-to-day valuation matters to the Valuation and Liquidity Committee comprising representatives from Hennessy Advisors, Inc., the Fund’s investment advisor (the
“Advisor”). The function of the Valuation and Liquidity Committee is to value securities where current and reliable market quotations are not readily available. All actions taken by the Valuation and Liquidity Committee are reviewed by the
Board.
The Fund has performed an analysis of all existing investments to determine the significance and character of all inputs to their fair value determinations. Various inputs are used to determine
the value of the Fund’s investments. The inputs or methodology used for valuing securities are not necessarily an indication of the risk associated with investing in those securities. Details related to the fair value hierarchy of the Fund’s
securities as of April 30, 2020, are included in the Schedule of Investments.
4). INVESTMENT TRANSACTIONS
Purchases and sales of investment securities (excluding government and short-term investments) for the Fund during the six months ended April 30, 2020, were $69,278,230 and $78,301,299, respectively.
There were no purchases or sales/maturities of long-term U.S. government securities for the Fund during the six months ended April 30, 2020.
The Fund is permitted to purchase or sell securities from or to another fund in the Hennessy Funds family of funds (collectively, the “Hennessy Funds”) under specified conditions outlined in
procedures adopted by the Board. The procedures have been designed to ensure that any purchase or sale of securities by the Fund from or to another Hennessy Fund complies with Rule 17a-7 of the Investment Company Act of 1940, as amended.
During the six months ended April 30, 2020, the Fund did not engage in purchases or sales of securities pursuant to Rule 17a-7 of the Investment Company Act of 1940, as amended.
|
HENNESSY FUNDS
|
1-800-966-4354
|
19
5). INVESTMENT ADVISORY FEE AND OTHER TRANSACTIONS WITH AFFILIATES
The Advisor provides the Fund with investment advisory services under an Investment Advisory Agreement. The Advisor furnishes all investment advice, office space, and facilities and most of the personnel needed by
the Fund. As compensation for its services, the Advisor is entitled to a monthly fee from the Fund. The fee is based on the average daily net assets of the Fund at an annual rate of 0.74%. The net investment advisory fees expensed by the Fund
during the six months ended April 30, 2020, are included in the Statement of Operations.
The Board has approved a Shareholder Servicing Agreement for Investor Class shares of the Fund, which was instituted to compensate the Advisor for the non-investment advisory services it provides
to the Fund. The Shareholder Servicing Agreement provides for a monthly fee paid to the Advisor at an annual rate of 0.10% of the average daily net assets of the Fund attributable to Investor Class shares. The shareholder service fees
expensed by the Fund during the six months ended April 30, 2020, are included in the Statement of Operations.
The Fund has adopted a plan pursuant to Rule 12b-1 under the Investment Company Act of 1940, as amended, that authorizes payments in connection with the distribution of the Fund’s shares at an
annual rate of up to 0.25% of the Fund’s average daily net assets attributable to Investor Class shares. Even though the authorized rate is up to 0.25%, the Fund is currently only using up to 0.15% of its average daily net assets attributable
to Investor Class shares for such purpose. Amounts paid under the plan may be spent on any activities or expenses primarily intended to result in the sale of shares, including, but not limited to, advertising, shareholder account servicing,
printing and mailing of prospectuses to other than current shareholders, printing and mailing of sales literature, and compensation for sales and marketing activities or to financial institutions and others, such as dealers and distributors.
The distribution fees expensed by the Fund during the six months ended April 30, 2020, are included in the Statement of Operations.
The Fund has entered into agreements with various brokers, dealers, and financial intermediaries in connection with the sale of shares of the Fund. The agreements provide for periodic payments of
sub-transfer agent expenses by the Fund to the brokers, dealers, and financial intermediaries for providing certain shareholder maintenance services. These shareholder services include the pre-processing and quality control of new accounts,
shareholder correspondence, answering customer inquiries regarding account status, and facilitating shareholder telephone transactions. The sub-transfer agent fees expensed by the Fund during the six months ended April 30, 2020, are included
in the Statement of Operations.
U.S. Bancorp Fund Services, LLC, d/b/a U.S. Bank Global Fund Services (“Fund Services”) provides the Fund with administrative, accounting, and transfer agent services. As administrator, Fund
Services is responsible for activities such as (i) preparing various federal and state regulatory filings, reports, and returns for the Fund, (ii) preparing reports and materials to be supplied to the Board, (iii) monitoring the activities of
the Fund’s custodian, transfer agent, and accountants, and (iv) coordinating the preparation and payment of the Fund’s expenses and reviewing the Fund’s expense accruals. U.S. Bank N.A., an affiliate of Fund Services, serves as the Fund’s
custodian. The servicing agreements between the Trust and Fund Services and U.S. Bank N.A. contain a fee schedule that is inclusive of administrative, accounting, custody, and transfer agent fees. The administrative, accounting, custody, and
transfer agent fees expensed by the Fund during the six months ended April 30, 2020, are included in the Statement of Operations.
|
HENNESSYFUNDS.COM
|
20
|
NOTES TO THE FINANCIAL STATEMENTS
|
Quasar Distributors, LLC (“Quasar”) acts as the Fund’s principal underwriter in a continuous public offering of the Fund’s shares. Quasar was an affiliate of Fund Services and U.S. Bank N.A.
through March 30, 2020. Effective March 31, 2020, Foreside Financial Group, LLC (“Foreside”) acquired Quasar from Fund Services. As a result of the acquisition, Quasar became a wholly owned broker-dealer subsidiary of Foreside and is no
longer affiliated with Fund Services or U.S. Bank N.A. The Board approved a new Distribution Agreement to enable Quasar to continue serving as the Fund’s distributor.
The officers of the Fund are affiliated with the Advisor. With the exception of the Chief Compliance Officer and the Senior Compliance Officer, such officers receive no compensation from the Fund
for serving in their respective roles. The Fund, along with the other Hennessy Funds, makes reimbursement payments on an equal basis to the Advisor for a portion of the salary and benefits associated with the office of the Chief Compliance
Officer and for all of the salary and benefits associated with the office of the Senior Compliance Officer. The compliance fees expensed by the Fund during the six months ended April 30, 2020, are included in the Statement of Operations.
6). GUARANTEES AND INDEMNIFICATIONS
Under the Hennessy Funds’ organizational documents, their officers and trustees are indemnified by the Hennessy Funds against certain liabilities arising out of the performance of their duties to the Hennessy Funds.
Additionally, in the normal course of business, the Hennessy Funds enter into contracts with service providers that contain general indemnification clauses. The Fund’s maximum exposure under these arrangements is unknown as this would involve
future claims that may be made against the Fund that have not yet occurred. Currently, the Fund expects the risk of loss to be remote.
7). LINE OF CREDIT
The Fund has an uncommitted line of credit with the other Hennessy Funds in the amount of the lesser of (i) $100,000,000 or (ii) 33.33% of each Hennessy Fund’s net assets, or 30% for the Hennessy Gas Utility Fund
and 10% for the Hennessy Balanced Fund, intended to provide short-term financing, if necessary, subject to certain restrictions, in connection with shareholder redemptions. The credit facility is with the Hennessy Funds’ custodian bank, U.S.
Bank N.A. Borrowings under this arrangement bear interest at the bank’s prime rate and are secured by all of the Fund’s assets (as to its own borrowings only). During the six months ended April 30, 2020, the Fund did not have any borrowings
outstanding under the line of credit.
8). FEDERAL TAX INFORMATION
As of October 31, 2019, the Fund’s most recent fiscal year end, the components of accumulated earnings (losses) for income tax purposes were as follows:
|
Investments
|
|||||
|
Cost of investments for tax purposes
|
$
|
256,839,158
|
|||
|
Gross tax unrealized appreciation
|
$
|
30,378,700
|
|||
|
Gross tax unrealized depreciation
|
(26,875,325
|
)
|
|||
|
Net tax unrealized appreciation/(depreciation)
|
$
|
3,503,375
|
|||
|
Undistributed ordinary income
|
$
|
5,925,833
|
|||
|
Undistributed long-term capital gains
|
9,983,975
|
||||
|
Total distributable earnings
|
$
|
15,909,808
|
|||
|
Other accumulated gain/(loss)
|
$
|
—
|
|||
|
Total accumulated gain/(loss)
|
$
|
19,413,183
|
|||
|
HENNESSY FUNDS
|
1-800-966-4354
|
21
The difference between book-basis unrealized appreciation/depreciation and tax-basis unrealized appreciation/depreciation (as shown above) is attributable primarily to wash sales.
As of October 31, 2019, the Fund had no tax basis capital losses to offset future capital gains.
As of October 31, 2019, the Fund did not defer, on a tax basis, any late-year ordinary losses. Late-year ordinary losses are net ordinary losses incurred after December 31, 2018, but within the
taxable year, that are deemed to arise on the first day of the Fund’s next taxable year.
During fiscal year 2020 (year to date) and fiscal year 2019, the tax character of distributions paid by the Fund was as follows:
|
Six Months Ended
|
Year Ended
|
||||||||
|
April 30, 2020
|
October 31, 2019
|
||||||||
|
Ordinary income(1)
|
$
|
7,147,330
|
$
|
21,936,197
|
|||||
|
Long-term capital gain
|
9,984,026
|
15,862,462
|
|||||||
|
$
|
17,131,356
|
$
|
37,798,659
|
||||||
|
(1) Ordinary income includes short-term capital gain.
|
9). EVENTS SUBSEQUENT TO PERIOD END
Management has evaluated the Fund’s related events and transactions that occurred subsequent to April 30, 2020, through the date of issuance of the Fund’s financial statements. Management has determined that there
were no subsequent events requiring recognition or disclosure in the financial statements.
|
HENNESSYFUNDS.COM
|
22
|
NOTES TO THE FINANCIAL STATEMENTS/EXPENSE EXAMPLE
|
Expense Example (Unaudited)
April 30, 2020
As a shareholder of the Fund, you incur ongoing costs, including management fees, service fees, and other Fund expenses. This Example is intended to help you understand your ongoing costs (in dollars) of investing
in the Fund and to compare these costs with the ongoing costs of investing in other mutual funds. The Example is based on an investment of $1,000 invested at the beginning of the period and held for the entire period from November 1, 2019,
through April 30, 2020.
Actual Expenses
The first line of the table below under the “Investor Class” and “Institutional Class” headings provides information about actual account values and actual expenses. Although the Fund charges no sales loads or
transaction fees, you will be assessed fees for outgoing wire transfers, returned checks and stop payment orders at prevailing rates charged by U.S. Bank Global Fund Services, the Fund’s transfer agent. If you request that a redemption be
made by wire transfer, currently a $15 fee is charged by the Fund’s transfer agent. IRA accounts will be charged a $15 annual maintenance fee. The example below includes, but is not limited to, management fees, shareholder servicing fees,
accounting, custody, and transfer agent fees. However, the example below does not include portfolio trading commissions and related expenses. You may use the information in this line, together with the amount you invested, to estimate the
expenses that you paid over the period. Simply divide your account value by $1,000 (for example, an $8,600 account value divided by $1,000 = 8.6), then multiply the result by the number in the first line of the table under the “Investor
Class” or “Institutional Class” headings in the column entitled “Expenses Paid During Period” to estimate the expenses you paid on your account during this period.
Hypothetical Example for Comparison Purposes
The second line of the table below under the “Investor Class” and “Institutional Class” headings provides information about hypothetical account values and hypothetical expenses based on the Fund’s actual expense
ratios and an assumed rate of return of 5% per year before expenses, which is not the Fund’s actual return. The hypothetical account values and expenses may not be used to estimate the actual ending account balance or expenses you paid for
the period. You may use this information to compare the ongoing costs of investing in the Fund and other funds. To do so, compare this 5% hypothetical example with the 5% hypothetical examples that appear in the shareholder reports of the
other funds. Please note that the expenses shown in the table are meant to highlight your ongoing costs only. Therefore, the second line of the table under the “Investor Class” and “Institutional Class” headings is useful in comparing ongoing
costs only and will not help you determine the relative total costs of owning different funds.
|
HENNESSY FUNDS
|
1-800-966-4354
|
23
|
Beginning
|
Ending
|
||
|
Account Value
|
Account Value
|
Expenses Paid
|
|
|
November 1, 2019
|
April 30, 2020
|
During Period(1)
|
|
|
Investor Class
|
|||
|
Actual
|
$1,000.00
|
$ 831.10
|
$5.65
|
|
Hypothetical (5% return before expenses)
|
$1,000.00
|
$1,018.70
|
$6.22
|
|
Institutional Class
|
|||
|
Actual
|
$1,000.00
|
$ 832.00
|
$4.65
|
|
Hypothetical (5% return before expenses)
|
$1,000.00
|
$1,019.79
|
$5.12
|
|
(1)
|
Expenses are equal to the Fund’s annualized expense ratio of 1.24% for Investor Class shares or 1.02% for Institutional Class shares, as applicable, multiplied by the average account value over the period,
multiplied by 182/366 days (to reflect the half-year period).
|
|
HENNESSYFUNDS.COM
|
24
|
EXPENSE EXAMPLE — ELECTRONIC DELIVERY
|
How to Obtain a Copy of the Fund’s Proxy
Voting Policy and Proxy Voting Records
A description of the policies and procedures the Fund uses to determine how to vote proxies relating to portfolio securities is available without charge (1) by calling 1-800-966-4354, (2) on the Hennessy Funds’
website at www.hennessyfunds.com/proxy-voting/voting-policy, or (3) on the U.S. Securities and Exchange Commission’s (the “SEC”) website at www.sec.gov. The Fund’s proxy voting record is available without charge on both the Hennessy Funds’
website at www.hennessyfunds.com/proxy-voting/voting-record and the SEC’s website at www.sec.gov no later than August 31 for the prior 12 months ending June 30.
Availability of Quarterly Portfolio Schedule
The Fund files a complete schedule of portfolio holdings with the SEC for the first and third quarters of each fiscal year as an exhibit to its reports on Form N-PORT. The Fund’s Forms N-PORT are available on the
SEC’s website at www.sec.gov or on request by calling 1-800-966-4354.
Federal Tax Distribution Information (Unaudited)
For fiscal year 2019, certain dividends paid by the Fund may be subject to a maximum tax rate of 23.8%, as provided for by the Jobs and Growth Tax Relief Reconciliation Act of 2003. The percentage of dividends
declared from ordinary income designated as qualified dividend income was 49.21%.
For corporate shareholders, the percent of ordinary income distributions that qualified for the corporate dividends received deduction for fiscal year 2019 was 33.20%.
The percentage of taxable ordinary income distributions that were designated as short-term capital gain distributions under Section 871(k)(2)(C) of the Internal Revenue Code of 1986, as amended,
for the Fund was 70.55%.
Important Notice Regarding Delivery
of Shareholder Documents
To help keep the Fund’s costs as low as possible, we generally deliver a single copy of shareholder reports, proxy statements, and prospectuses to shareholders who share an address and have the same last name. This
process does not apply to account statements. You may request an individual copy of a shareholder document at any time. If you would like to receive separate mailings of shareholder documents, please call U.S. Bank Global Fund Services at
1-800-261-6950 or 1-414-765-4124, and individual delivery will begin within 30 days of your request. If your account is held through a financial institution or other intermediary, please contact such intermediary directly to request
individual delivery.
Electronic Delivery
The Funds offer shareholders the option to receive account statements, prospectuses, tax forms, and shareholder reports online. To sign up for eDelivery, please visit www.hennessyfunds.com/account. You may change
your delivery preference at any time by visiting our website or calling U.S. Bank Global Fund Services at 1-800-261-6950 or 1-414-765-4124.
|
HENNESSY FUNDS
|
1-800-966-4354
|
25
Board Approval of Investment Advisory
Agreement
At its meeting on March 12, 2020, the Board of Trustees of the Fund (the “Board,” and the members thereof, the “Trustees”) unanimously approved the continuation of the investment advisory agreement of the Fund with
Hennessy Advisors, Inc. (the “Advisor”). As part of the process of approving the continuation of the advisory agreement, the Trustees reviewed their fiduciary duties and the relevant factors for them to consider with respect to approving the
advisory agreement. In addition, the Trustees who are not deemed “interested persons” (as defined by the Investment Company Act of 1940, as amended) of the Fund (the “Independent Trustees”) met in executive session to discuss the approval of
the advisory agreement.
In advance of the meeting, the Advisor sent detailed information to the Trustees to assist them in their evaluation of the advisory agreement. This information included, but was not limited to,
the following:
|
(1)
|
A memorandum from outside legal counsel that described the fiduciary duties of the Board with respect to approving the continuation of the advisory agreement and the relevant factors for consideration;
|
|
|
(2)
|
A memorandum from the Advisor that listed the factors relevant to the Board’s approval of the continuation of the advisory agreement and also referenced the documents that had been provided to help the Board
assess each such factor;
|
|
|
(3)
|
An inventory of the services provided by the Advisor;
|
|
|
(4)
|
A written discussion of economies of scale;
|
|
|
(5)
|
A summary of the key terms of the advisory agreement;
|
|
|
(6)
|
A recent Fund fact sheet, which included performance information over various periods;
|
|
|
(7)
|
A peer expense comparison of the net expense ratio and investment advisory fee of the Fund; and
|
|
|
(8)
|
The Advisor’s financial statements from its most recent Form 10-K and Form 10-Q.
|
All of the factors discussed were considered as a whole by the Trustees and by the Independent Trustees meeting in executive session. The factors were viewed in their totality by the Trustees,
with no single factor being the principal or determinative factor in the Trustees’ determination of whether to approve the continuation of the advisory agreement. The Trustees recognized that the management and fee arrangements for the Fund
are the result of years of review and discussion between the Independent Trustees and the Advisor, that certain aspects of such arrangements may receive greater scrutiny in some years than in others, and that the Trustees’ conclusions may be
based, in part, on their consideration of these same arrangements and information received during the course of the year and in prior years.
Prior to approving the continuation of the advisory agreement, the Trustees, including the Independent Trustees in executive session, considered, among other items:
|
(1)
|
The nature and quality of the advisory services provided by the Advisor;
|
|
|
(2)
|
A comparison of the fees and expenses of the Fund to other similar funds;
|
|
|
(3)
|
Whether economies of scale are recognized by the Fund;
|
|
HENNESSYFUNDS.COM
|
26
|
BOARD APPROVAL OF INVESTMENT ADVISORY AGREEMENT
|
|
(4)
|
The costs and profitability of the Fund to the Advisor;
|
|
|
(5)
|
The performance of the Fund; and
|
|
|
(6)
|
Any benefits to the Advisor from serving as an investment advisor to the Fund (other than the advisory fee).
|
The material considerations and determinations of the Trustees, including the Independent Trustees, were as follows:
|
(1)
|
The Trustees considered the services identified below that are provided by the Advisor. Based on this review, the Trustees concluded that the Advisor provides high-quality services to the Fund and noted that
their overall confidence in the Advisor was high. The Trustees also concluded that they were satisfied with the nature, extent, and quality of the advisory services provided to the Fund by the Advisor and that the nature and extent of
the services provided by the Advisor were appropriate to assure that the Fund’s operations are conducted in compliance with applicable laws, rules, and regulations.
|
|
(a)
|
The Advisor acts as the portfolio manager for the Fund. In this capacity, the Advisor does the following:
|
|
(i)
|
manages the composition of the Fund’s portfolio, including the purchase, retention, and disposition of portfolio securities in accordance with the Fund’s investment objectives, policies, and restrictions;
|
|||
|
(ii)
|
seeks best execution for the Fund’s portfolio;
|
|||
|
(iii)
|
manages the use of soft dollars for the Fund; and
|
|||
|
(iv)
|
manages proxy voting for the Fund.
|
|
(b)
|
The Advisor performs a daily reconciliation of portfolio positions and cash for the Fund.
|
||
|
(c)
|
The Advisor monitors the liquidity of each Fund.
|
||
|
(d)
|
The Advisor monitors the Fund’s compliance with its investment objectives and restrictions.
|
||
|
(e)
|
The Advisor monitors compliance with federal securities laws, maintains a compliance program (including a code of ethics), conducts ongoing reviews of the compliance programs of the Fund’s service providers,
as feasible, conducts on-site visits to the Fund’s service providers, monitors incidents of abusive trading practices, reviews Fund expense accruals, payments, and fixed expense ratios, evaluates insurance providers for fidelity bond,
D&O/E&O insurance, and cybersecurity insurance coverage, manages regulatory examination compliance and responses, conducts employee compliance training, reviews reports provided by service providers, and maintains books and
records.
|
||
|
(f)
|
The Advisor oversees service providers that provide accounting, administration, distribution, transfer agency, custodial, sales, marketing, public relations, audit, information technology, and legal services
to the Fund.
|
||
|
(g)
|
The Advisor maintains in-house marketing and distribution departments on behalf of the Fund.
|
||
|
(h)
|
The Advisor is actively involved with preparing regulatory filings for the Fund, including writing and annually updating the Fund’s prospectus and related documents.
|
|
HENNESSY FUNDS
|
1-800-966-4354
|
27
|
(i)
|
For each annual report of the Fund, the Advisor prepares a written summary of the Fund’s performance during the most recent 12-month period.
|
||
|
(j)
|
The Advisor oversees distribution of the Fund through third-party broker/dealers and independent financial institutions such as Charles Schwab, Inc., Fidelity, TD Ameritrade, and Pershing. The Advisor
participates in “no transaction fee” (“NTF”) programs with these companies on behalf of the Fund, which allow customers to purchase the Fund through third-party distribution channels without paying a transaction fee. The Advisor
compensates, in part, a number of these third-party providers of NTF programs out of its own revenues.
|
||
|
(k)
|
The Advisor pays the incentive compensation of the Fund’s compliance officers and employs other staff, such as legal, marketing, national accounts, distribution, sales, administrative, and trading oversight
personnel, as well as management executives.
|
||
|
(l)
|
The Advisor provides a quarterly compliance certification to the Board.
|
||
|
(m)
|
The Advisor prepares or reviews all Board materials, frequently presents to the Board and leads Board discussions, prepares or reviews all meeting minutes, and arranges for Board training and education.
|
|
(2)
|
The Trustees compared the performance of the Fund to benchmark indices over various periods and also noted that the Trustees review and discuss reports comparing the investment performance of the Fund to
various indices at each quarterly Board meeting. Based on such information, the Trustees determined that the Advisor manages the Fund in a manner materially consistent with its stated investment objective and style. The Trustees
concluded that the performance of the Fund over various periods warranted continuation of the advisory agreement.
|
|
|
(3)
|
The Trustees reviewed the advisory fees and overall expense ratios of the Fund compared to other funds similar in asset size and investment objective to the Fund using data from Morningstar. As part of the
discussion with management, the Trustees ensured that they understood and were comfortable with the criteria used to determine the mutual funds included in the Morningstar categories for purposes of the materials considered at the
meeting. The Trustees determined that the advisory fee and overall expense ratio of the Fund falls within the range of the advisory fees and overall expense ratios of other comparable funds and concluded that they are reasonable and
warranted continuation of the advisory agreement.
|
|
|
(4)
|
The Trustees also considered whether the Advisor was realizing economies of scale that it should share with the Fund’s shareholders. The Trustees noted that the assets of the Fund had declined over the prior
year. In addition, the Trustees noted that many of the expenses incurred to manage the Fund are asset-based fees, so the Advisor does not realize material economies of scale relating to those expenses as the assets of the Fund
increase. For example, mutual fund platform fees increase as the Fund’s assets grow. The Trustees also considered the Advisor’s efforts to contain expenses through actions such as renegotiating service contracts, the Advisor’s
significant marketing efforts to promote the Funds, the Advisor’s investments in personnel to manage the Funds, and the Advisor’s agreement to waive fees or lower its management fees in certain
|
|
HENNESSYFUNDS.COM
|
28
|
BOARD APPROVAL OF INVESTMENT ADVISORY AGREEMENT
|
|
circumstances. The Trustees noted that it did not appear that the Advisor was realizing economies of scale at current asset levels and concluded that it would continue to monitor economies of scale in the
future as circumstances changed.
|
||
|
(5)
|
The Trustees considered the profitability of the Advisor, including the impact of mutual fund platform fees on the Advisor’s profitability, and also considered the resources and revenues that the Advisor has
put into managing and distributing the Fund. The Trustees then concluded that the profits of the Advisor are reasonable and not excessive when compared to profitability guidelines set forth in relevant court cases.
|
|
|
(6)
|
The Trustees considered the high level of professionalism and knowledge of the Advisor’s employees, along with a very low level of turnover, and concluded that this was beneficial to the Fund and its
shareholders.
|
|
|
(7)
|
The Trustees considered any benefits to the Advisor from serving as an advisor to the Fund (other than the advisory fee). The Trustees noted that the Advisor may derive ancillary benefits from, by way of
example, its association with the Fund in the form of proprietary and third-party research products and services received from broker-dealers that execute portfolio trades for the Fund. The Trustees determined that any such products
and services have been used for legitimate purposes relating to the Fund by providing assistance in the investment decision-making process. The Trustees concluded that any additional benefits realized by the Advisor from its
relationship with the Fund were reasonable, which was based on, among other things, the Trustees’ finding that the research, analytical, statistical, and other information and services provided by brokers are merely supplemental to
the Advisor’s own efforts in the performance of its duties under the advisory agreement.
|
After reviewing the materials and information provided at the meeting, as well as other information regularly provided at the Board’s quarterly meetings throughout the year regarding the quality
of services provided by the Advisor, the performance of the Fund, expense information, brokerage commissions information, the adequacy and efficacy of the Advisor’s written policies and procedures, other regulatory compliance issues, trading
information and related matters, and other factors that the Trustees deemed relevant, the Trustees, including the Independent Trustees, approved the continuation of the advisory agreement.
|
HENNESSY FUNDS
|
1-800-966-4354
|
29
For information, questions, or assistance, please call
The Hennessy Funds
1-800-966-4354 or 1-415-899-1555
INVESTMENT ADVISOR
Hennessy Advisors, Inc.
7250 Redwood Boulevard, Suite 200
Novato, California 94945
ADMINISTRATOR,
TRANSFER AGENT,
DIVIDEND PAYING AGENT, &
SHAREHOLDER SERVICING AGENT
U.S. Bancorp Fund Services, LLC
d/b/a U.S. Bank Global Fund Services
P.O. Box 701
Milwaukee, Wisconsin 53201-0701
CUSTODIAN
U.S. Bank N.A.
Custody Operations
1555 North River Center Drive, Suite 302
Milwaukee, Wisconsin 53212
TRUSTEES
Neil J. Hennessy
Robert T. Doyle
J. Dennis DeSousa
Gerald P. Richardson
COUNSEL
Foley & Lardner LLP
777 East Wisconsin Avenue
Milwaukee, Wisconsin 53202-5306
INDEPENDENT REGISTERED
PUBLIC ACCOUNTING FIRM
Tait, Weller & Baker LLP
Two Liberty Place
50 South 16th Street, Suite 2900
Philadelphia, Pennsylvania 19102-2529
DISTRIBUTOR
Quasar Distributors, LLC
111 East Kilbourn Avenue, Suite 2200
Milwaukee, Wisconsin 53202
www.hennessyfunds.com | 1-800-966-4354
This report has been prepared for shareholders and may be distributed to
others only if preceded or accompanied by a current prospectus.
SEMI-ANNUAL REPORT
APRIL 30, 2020
HENNESSY TOTAL RETURN FUND
Investor Class HDOGX
IMPORTANT NOTICE REGARDING ELECTRONIC DELIVERY OF SHAREHOLDER REPORTS
Beginning on January 1, 2021, as permitted by regulations adopted by the Securities and Exchange Commission, paper copies of the annual and semi-annual reports
will no longer be sent by mail unless you specifically request paper copies from the Hennessy Funds or from your financial intermediary. Instead, the reports will be made available on a website, and you will be notified by mail
each time a report is posted and provided with a website link to access the report.
If you have already elected to receive shareholder reports electronically, you will not be affected by this change and you need not take any action. You may
elect to receive shareholder reports and other communications from the Hennessy Funds electronically by visiting www.hennessyfunds.com/account or by calling U.S. Bank Global Fund Services at 1-800-261-6950. If you own shares in a
Fund through a financial intermediary, please contact your financial intermediary to make this election.
You may elect to receive paper copies of all future reports free of charge by calling U.S. Bank Global Fund Services at 1-800-261-6950 or, if you own your
shares through a financial intermediary, by contacting your financial intermediary. Your election to receive paper copies of reports will apply to all Funds in the Hennessy Funds family.
hennessyfunds.com | 1-800-966-4354
(This Page Intentionally Left Blank.)
Contents
|
Letter to Shareholders
|
2
|
|
Performance Overview
|
4
|
|
Financial Statements
|
|
|
Schedule of Investments
|
5
|
|
Statement of Assets and Liabilities
|
9
|
|
Statement of Operations
|
10
|
|
Statements of Changes in Net Assets
|
11
|
|
Statement of Cash Flows
|
12
|
|
Financial Highlights
|
14
|
|
Notes to the Financial Statements
|
16
|
|
Expense Example
|
24
|
|
Proxy Voting Policy and Proxy Voting Records
|
25
|
|
Availability of Quarterly Portfolio Schedule
|
25
|
|
Federal Tax Distribution Information
|
25
|
|
Important Notice Regarding Delivery of Shareholder Documents
|
25
|
|
Electronic Delivery
|
25
|
|
Board Approval of Investment Advisory Agreement
|
26
|
|
HENNESSY FUNDS
|
1-800-966-4354
|
June 2020
Dear Hennessy Funds Shareholder:
First and foremost, I hope this communication finds you and your loved ones safe and healthy. In many ways, the COVID-19 pandemic has turned the world upside down in recent months, and we at Hennessy have joined
the rest of the world in witnessing and experiencing its profound effect on public health, the global economy, and the everyday lives of people around the world. In response to the crisis, we invoked our business continuity plan in
mid-March to ensure a smooth transition to remote work for all of our employees, who have been working safely and productively from home. We want to assure our Hennessy Funds shareholders that our operations are uninterrupted and
functioning normally.
The past six months have been marked by extremes. During the first half of the period from November 2019 through January 2020, the bull market, supported by strong corporate fundamentals,
continued to move higher, and investors appeared focused on record-low unemployment and strong economic growth. In mid-February, the major U.S. market indices hit all-time highs, but then, within just a matter of weeks, lost over one-third
of their values as the COVID-19 pandemic unfolded. Shelter-in-place and business closure orders rippled through the nation, causing initial unemployment claims to skyrocket to their highest number in history. The market then rallied back
and posted double-digit positive returns in April.
For the six months ended April 30, 2020, on a total return basis, the Dow Jones Industrial Average was down 8.9% and the S&P 500® Index was down 3.2%. Small-cap and mid-cap stocks generally fared worse than large-cap stocks during the period, and the Financial sector was particularly hard hit as the Federal Reserve aggressively cut the
federal funds rate in an effort to stabilize the economy. The Energy sector was crushed by both the sudden loss of demand due to COVID-19 and the oversupply caused by the surprise market-share battle between Russia and Saudi Arabia, and the
S&P 500® Energy Sector Index ended the six-month period down over 30%.
The COVID-19 pandemic is an unprecedented event, and the duration and full extent of the economic impact is unknown. In the moment, there is always the concern that ‘this time is different.’
But, when you are able to look at past financial, political, and health crises with the benefit of 20/20 hindsight, history has demonstrated that our economy and financial markets have always rebounded and recovered eventually. If you look
back to the last market downturn in 2008, economic fundamentals were weak compared to the market in 2020, where the overall underpinnings were – and are still – quite strong. Publicly listed companies today have plenty of cash, with over
$5 trillion on balance sheets of the S&P 500® companies alone, and I believe that most will survive and that many may emerge from the current crisis even
stronger.
|
HENNESSYFUNDS.COM
|
2
|
LETTER TO SHAREHOLDERS
|
We understand that this market volatility and economic uncertainty is jarring to many investors, and we continue to monitor events and the markets. We remain focused on managing our
high-conviction portfolios for the long-term benefit of our shareholders, and we are confident in the time-tested strategies and rigorous research that led to their formation. We encourage shareholders to maintain a long-term investment
horizon and to remain focused on long-term goals. As always, but especially in these trying times, we are here to support our shareholders, and we thank you for your continued investment and trust. Should you have any questions or would
like to speak with us directly, please don’t hesitate to call (800) 966-4354 or email us at fundsinfo@hennessyfunds.com.
Best regards,
Neil J. Hennessy
President and Chief Investment Officer
Past performance does not guarantee future results.
Mutual fund investing involves risk. Principal loss is possible.
The Dow Jones Industrial Average and S&P 500® Index are commonly used to measure the performance of U.S. stocks. The S&P 500® Energy Sector Index is an index that comprises those companies included in the S&P 500 that are classified as members of the GICS energy sector. One cannot
invest directly in an index.
|
HENNESSY FUNDS
|
1-800-966-4354
|
3
Performance Overview (Unaudited)
AVERAGE ANNUAL TOTAL RETURN FOR PERIODS ENDED APRIL 30, 2020
|
Six
|
One
|
Five
|
Ten
|
|
|
Months(1)
|
Year
|
Years
|
Years
|
|
|
Hennessy Total Return
|
||||
|
Fund (HDOGX)
|
-8.65%
|
-7.58%
|
4.52%
|
7.47%
|
|
75/25 Blended DJIA/Treasury Index
|
-6.12%
|
-3.66%
|
7.27%
|
8.52%
|
|
Dow Jones Industrial Average
|
-8.87%
|
-6.16%
|
9.06%
|
11.01%
|
Expense ratio: 2.32%
|
(1)
|
Periods of less than one year are not annualized.
|
_______________
Performance data quoted represents past performance; past performance does not guarantee future results. The investment return and principal value of an investment will fluctuate so that an
investor’s shares, when redeemed, may be worth more or less than their original cost. The performance table does not reflect the deduction of taxes that a shareholder would pay on Fund distributions or the redemption of Fund shares. Current
performance of the Fund may be lower or higher than the performance quoted. Performance data current to the most recent month end may be obtained by visiting www.hennessyfunds.com.
The 75/25 Blended DJIA/Treasury Index consists of 75% common stocks represented by the Dow Jones Industrial Average and 25% short-duration Treasury securities represented by the ICE BofAML 3-Month U.S. Treasury
Bill Index, which comprises U.S. Treasury securities maturing in three months. The Dow Jones Industrial Average is a price-weighted average of 30 significant stocks traded on the NYSE or The NASDAQ Stock Market. One cannot invest directly
in an index. These indices are used herein for comparative purposes in accordance with SEC regulations.
The Dow Jones Industrial Average is the property of the Dow Jones & Company, Inc. Dow Jones & Company, Inc. is not affiliated with the Fund or its investment advisor. Dow Jones & Company, Inc. has not
participated in any way in the creation of the Fund or in the selection of stocks included in the Fund and has not approved any information included in this report.
The expense ratio presented is from the most recent prospectus. The expense ratio for the current reporting period is available in the Financial Highlights section of this report.
|
HENNESSYFUNDS.COM
|
4
|
PERFORMANCE OVERVIEW/SCHEDULE OF INVESTMENTS
|
Financial Statements
|
Schedule of Investments as of April 30, 2020 (Unaudited)
|
HENNESSY TOTAL RETURN FUND
(% of Net Assets)
|
TOP TEN HOLDINGS (EXCLUDING MONEY MARKET FUNDS)
|
% NET ASSETS
|
|
U.S. Treasury Bill, 0.280%, 07/16/2020
|
36.42%
|
|
U.S. Treasury Bill, 0.080%, 05/14/2020
|
20.80%
|
|
U.S. Treasury Bill, 0.115%, 06/18/2020
|
10.41%
|
|
Pfizer, Inc.
|
8.20%
|
|
Verizon Communications, Inc.
|
7.99%
|
|
International Business Machines Corp.
|
7.41%
|
|
Chevron Corp.
|
7.18%
|
|
3M Co.
|
7.14%
|
|
Cisco Systems, Inc.
|
6.49%
|
|
Walgreens Boots Alliance, Inc.
|
6.41%
|
Note: For presentation purposes, the Fund has grouped some of the industry categories. For purposes of categorizing securities for compliance with Section 8(b)(1) of the Investment Company Act of 1940, as amended,
the Fund uses more specific industry classifications.
The Global Industry Classification Standard (GICS®) was developed by and is the exclusive property and a service mark of MSCI, Inc.
and Standard & Poor’s Financial Services LLC. It has been licensed for use by the Hennessy Funds.
|
HENNESSY FUNDS
|
1-800-966-4354
|
5
|
COMMON STOCKS – 72.01%
|
Number
|
% of
|
||||||||||
|
|
of Shares
|
Value
|
Net Assets
|
|||||||||
|
Communication Services – 7.99%
|
||||||||||||
|
Verizon Communications, Inc.
|
80,200
|
$
|
4,607,490
|
7.99
|
%
|
|||||||
|
|
||||||||||||
|
Consumer Staples – 12.79%
|
||||||||||||
|
The Coca-Cola Co.
|
80,200
|
3,680,378
|
6.38
|
%
|
||||||||
|
Walgreens Boots Alliance, Inc.
|
85,300
|
3,692,637
|
6.41
|
%
|
||||||||
|
|
7,373,015
|
12.79
|
%
|
|||||||||
|
Energy – 13.56%
|
||||||||||||
|
Chevron Corp.
|
45,000
|
4,140,000
|
7.18
|
%
|
||||||||
|
Exxon Mobil Corp.
|
79,200
|
3,680,424
|
6.38
|
%
|
||||||||
|
|
7,820,424
|
13.56
|
%
|
|||||||||
|
Health Care – 9.32%
|
||||||||||||
|
Johnson & Johnson
|
4,300
|
645,172
|
1.12
|
%
|
||||||||
|
Pfizer, Inc.
|
123,300
|
4,729,788
|
8.20
|
%
|
||||||||
|
|
5,374,960
|
9.32
|
%
|
|||||||||
|
Industrials – 8.11%
|
||||||||||||
|
3M Co.
|
27,100
|
4,117,032
|
7.14
|
%
|
||||||||
|
Caterpillar, Inc.
|
4,800
|
558,624
|
0.97
|
%
|
||||||||
|
|
4,675,656
|
8.11
|
%
|
|||||||||
|
Information Technology – 13.90%
|
||||||||||||
|
Cisco Systems, Inc.
|
88,300
|
3,742,154
|
6.49
|
%
|
||||||||
|
International Business Machines Corp.
|
34,000
|
4,269,040
|
7.41
|
%
|
||||||||
|
|
8,011,194
|
13.90
|
%
|
|||||||||
|
Materials – 6.34%
|
||||||||||||
|
Dow, Inc.
|
99,600
|
3,654,324
|
6.34
|
%
|
||||||||
|
|
||||||||||||
|
Total Common Stocks
|
||||||||||||
|
(Cost $43,417,214)
|
41,517,063
|
72.01
|
%
|
|||||||||
The accompanying notes are an integral part of these financial statements.
|
HENNESSYFUNDS.COM
|
6
|
SCHEDULE OF INVESTMENTS
|
|
SHORT-TERM INVESTMENTS – 68.74%
|
Number of Shares/
|
% of
|
||||||||||
|
|
Par Amount
|
Value
|
Net Assets
|
|||||||||
|
Money Market Funds – 1.11%
|
||||||||||||
|
First American Government Obligations Fund,
|
||||||||||||
|
Institutional Class, 0.25% (a)
|
641,482
|
$
|
641,482
|
1.11
|
%
|
|||||||
|
|
||||||||||||
|
U.S. Treasury Bills – 67.63%
|
||||||||||||
|
0.080%, 05/14/2020 (b)(c)
|
12,000,000
|
11,993,392
|
20.80
|
%
|
||||||||
|
0.115%, 06/18/2020 (b)(c)
|
6,000,000
|
6,000,000
|
10.41
|
%
|
||||||||
|
0.280%, 07/16/2020 (b)(c)
|
21,000,000
|
20,996,176
|
36.42
|
%
|
||||||||
|
|
38,989,568
|
67.63
|
%
|
|||||||||
|
Total Short-Term Investments
|
||||||||||||
|
(Cost $39,629,554)
|
39,631,050
|
68.74
|
%
|
|||||||||
|
|
||||||||||||
|
Total Investments
|
||||||||||||
|
(Cost $83,046,768) – 140.75%
|
81,148,113
|
140.75
|
%
|
|||||||||
|
Liabilities in Excess of Other Assets – (40.75)%
|
(23,494,553
|
)
|
(40.75
|
)%
|
||||||||
|
|
||||||||||||
|
TOTAL NET ASSETS – 100.00%
|
$
|
57,653,560
|
100.00
|
%
|
||||||||
Percentages are stated as a percent of net assets.
|
(a)
|
The rate listed is the fund’s seven-day yield as of April 30, 2020.
|
|
(b)
|
The rate listed is the discount rate at issue.
|
|
(c)
|
All or a portion of this security is pledged as collateral for securities sold subject to repurchase. The aggregate fair value of the collateral is $25,993,044.
|
Summary of Fair Value Exposure as of April 30, 2020
The following is a summary of the inputs used to value the Fund’s net assets as of April 30, 2020 (see Note 3 in the accompanying Notes to the Financial Statements):
|
Common Stocks
|
Level 1
|
Level 2
|
Level 3
|
Total
|
||||||||||||
|
Communication Services
|
$
|
4,607,490
|
$
|
—
|
$
|
—
|
$
|
4,607,490
|
||||||||
|
Consumer Staples
|
7,373,015
|
—
|
—
|
7,373,015
|
||||||||||||
|
Energy
|
7,820,424
|
—
|
—
|
7,820,424
|
||||||||||||
|
Health Care
|
5,374,960
|
—
|
—
|
5,374,960
|
||||||||||||
|
Industrials
|
4,675,656
|
—
|
—
|
4,675,656
|
||||||||||||
|
Information Technology
|
8,011,194
|
—
|
—
|
8,011,194
|
||||||||||||
|
Materials
|
3,654,324
|
—
|
—
|
3,654,324
|
||||||||||||
|
Total Common Stocks
|
$
|
41,517,063
|
$
|
—
|
$
|
—
|
$
|
41,517,063
|
||||||||
|
Short-Term Investments
|
||||||||||||||||
|
Money Market Funds
|
$
|
641,482
|
$
|
—
|
$
|
—
|
$
|
641,482
|
||||||||
|
U.S. Treasury Bills
|
—
|
38,989,568
|
—
|
38,989,568
|
||||||||||||
|
Total Short-Term Investments
|
$
|
641,482
|
$
|
38,989,568
|
$
|
—
|
$
|
39,631,050
|
||||||||
|
Total Investments
|
$
|
42,158,545
|
$
|
38,989,568
|
$
|
—
|
$
|
81,148,113
|
||||||||
The accompanying notes are an integral part of these financial statements.
|
HENNESSY FUNDS
|
1-800-966-4354
|
7
Schedule of Reverse Repurchase Agreements
|
Principal
|
Maturity
|
Maturity
|
|||||||||
|
Face Value
|
Counterparty
|
Rate
|
Trade Date
|
Date
|
Amount
|
||||||
|
$
|
7,196,000
|
Jefferies LLC
|
1.80%
|
02/13/20
|
05/14/20
|
$
|
7,228,382
|
||||
|
3,598,000
|
Jefferies LLC
|
0.70%
|
03/19/20
|
06/18/20
|
3,604,297
|
||||||
|
12,593,000
|
Jefferies LLC
|
0.35%
|
04/16/20
|
07/16/20
|
12,604,019
|
||||||
|
$
|
23,387,000
|
$
|
23,436,698
|
||||||||
As of April 30, 2020, the fair value of securities held as collateral for reverse repurchase agreements was $25,993,044, as noted on the Schedule of Investments.
Reverse repurchase agreements are not included in the fair value hierarchy because they are carried at face value. Due to the short-term nature of the reverse repurchase agreements, face value
approximates fair value. The face value of the reverse repurchase agreements as of April 30, 2020, was $23,387,000. The face value plus interest due at maturity is equal to $23,436,698.
The accompanying notes are an integral part of these financial statements.
|
HENNESSYFUNDS.COM
|
8
|
SCHEDULE OF INVESTMENTS/STATEMENT OF ASSETS AND LIABILITIES
|
Financial Statements
|
Statement of Assets and Liabilities as of April 30, 2020 (Unaudited)
|
|
ASSETS:
|
||||
|
Investments in securities, at value (cost $83,046,768)
|
$
|
81,148,113
|
||
|
Dividends and interest receivable
|
54,562
|
|||
|
Receivable for fund shares sold
|
151
|
|||
|
Prepaid expenses and other assets
|
10,583
|
|||
|
Total assets
|
81,213,409
|
|||
|
LIABILITIES:
|
||||
|
Payable for fund shares redeemed
|
8,766
|
|||
|
Payable to advisor
|
27,554
|
|||
|
Payable to administrator
|
11,343
|
|||
|
Payable to auditor
|
11,373
|
|||
|
Accrued distribution fees
|
58,605
|
|||
|
Accrued service fees
|
4,592
|
|||
|
Reverse repurchase agreements
|
23,387,000
|
|||
|
Accrued interest payable
|
32,357
|
|||
|
Accrued trustees fees
|
6,246
|
|||
|
Accrued expenses and other payables
|
12,013
|
|||
|
Total liabilities
|
23,559,849
|
|||
|
NET ASSETS
|
$
|
57,653,560
|
||
|
NET ASSETS CONSISTS OF:
|
||||
|
Capital stock
|
$
|
55,362,389
|
||
|
Total distributable earnings
|
2,291,171
|
|||
|
Total net assets
|
$
|
57,653,560
|
||
|
NET ASSETS:
|
||||
|
Investor Class
|
||||
|
Shares authorized (no par value)
|
Unlimited
|
|||
|
Net assets applicable to outstanding shares
|
$
|
57,653,560
|
||
|
Shares issued and outstanding
|
4,569,034
|
|||
|
Net asset value, offering price, and redemption price per share
|
$
|
12.62
|
||
The accompanying notes are an integral part of these financial statements.
|
HENNESSY FUNDS
|
1-800-966-4354
|
9
Financial Statements
|
Statement of Operations for the six months ended April 30, 2020 (Unaudited)
|
|
INVESTMENT INCOME:
|
||||
|
Dividend income
|
$
|
928,826
|
||
|
Interest income
|
339,383
|
|||
|
Total investment income
|
1,268,209
|
|||
|
EXPENSES:
|
||||
|
Interest expense (See Notes 7 and 9)
|
251,216
|
|||
|
Investment advisory fees (See Note 5)
|
193,074
|
|||
|
Distribution fees – Investor Class (See Note 5)
|
48,268
|
|||
|
Administration, accounting, custody, and transfer agent fees (See Note 5)
|
38,006
|
|||
|
Service fees – Investor Class (See Note 5)
|
32,179
|
|||
|
Sub-transfer agent expenses – Investor Class (See Note 5)
|
27,982
|
|||
|
Compliance expense (See Note 5)
|
13,462
|
|||
|
Federal and state registration fees
|
12,817
|
|||
|
Audit fees
|
11,375
|
|||
|
Trustees’ fees and expenses
|
8,559
|
|||
|
Reports to shareholders
|
6,008
|
|||
|
Legal fees
|
366
|
|||
|
Other expenses
|
4,371
|
|||
|
Total expenses
|
647,683
|
|||
|
NET INVESTMENT INCOME
|
$
|
620,526
|
||
|
REALIZED AND UNREALIZED GAINS (LOSSES):
|
||||
|
Net realized gain on investments
|
$
|
4,463,183
|
||
|
Net change in unrealized appreciation/depreciation on investments
|
(10,859,112
|
)
|
||
|
Net loss on investments
|
(6,395,929
|
)
|
||
|
NET DECREASE IN NET ASSETS RESULTING FROM OPERATIONS
|
$
|
(5,775,403
|
)
|
|
The accompanying notes are an integral part of these financial statements.
|
HENNESSYFUNDS.COM
|
10
|
STATEMENT OF OPERATIONS/STATEMENTS OF CHANGES IN NET ASSETS
|
Financial Statements
|
Statements of Changes in Net Assets
|
|
Six Months Ended
|
||||||||
|
April 30, 2020
|
Year Ended
|
|||||||
|
(Unaudited)
|
October 31, 2019
|
|||||||
|
OPERATIONS:
|
||||||||
|
Net investment income
|
$
|
620,526
|
$
|
1,326,399
|
||||
|
Net realized gain (loss) on investments
|
4,463,183
|
(174,948
|
)
|
|||||
|
Net change in unrealized
|
||||||||
|
appreciation/depreciation on investments
|
(10,859,112
|
)
|
4,513,627
|
|||||
|
Net increase (decrease) in net assets
|
||||||||
|
resulting from operations
|
(5,775,403
|
)
|
5,665,078
|
|||||
|
DISTRIBUTIONS TO SHAREHOLDERS:
|
||||||||
|
Distributable earnings – Investor Class
|
(685,864
|
)
|
(3,434,351
|
)
|
||||
|
Total distributions
|
(685,864
|
)
|
(3,434,351
|
)
|
||||
|
CAPITAL SHARE TRANSACTIONS:
|
||||||||
|
Proceeds from shares subscribed – Investor Class
|
872,039
|
20,299,985
|
||||||
|
Dividends reinvested – Investor Class
|
649,975
|
3,277,777
|
||||||
|
Cost of shares redeemed – Investor Class
|
(10,348,466
|
)
|
(24,470,559
|
)
|
||||
|
Net decrease in net assets derived
|
||||||||
|
from capital share transactions
|
(8,826,452
|
)
|
(892,797
|
)
|
||||
|
TOTAL INCREASE (DECREASE) IN NET ASSETS
|
(15,287,719
|
)
|
1,337,930
|
|||||
|
NET ASSETS:
|
||||||||
|
Beginning of period
|
72,941,279
|
71,603,349
|
||||||
|
End of period
|
$
|
57,653,560
|
$
|
72,941,279
|
||||
|
CHANGES IN SHARES OUTSTANDING:
|
||||||||
|
Shares sold – Investor Class
|
65,479
|
1,488,984
|
||||||
|
Shares issued to holders as reinvestment
|
||||||||
|
of dividends – Investor Class
|
52,678
|
242,975
|
||||||
|
Shares redeemed – Investor Class
|
(767,367
|
)
|
(1,788,558
|
)
|
||||
|
Net decrease in shares outstanding
|
(649,210
|
)
|
(56,599
|
)
|
||||
The accompanying notes are an integral part of these financial statements.
|
HENNESSY FUNDS
|
1-800-966-4354
|
11
Financial Statements
|
Statement of Cash Flows for the six months ended April 30, 2020 (Unaudited)
|
|
Cash flows from operating activities:
|
||||
|
Net decrease in net assets from operations
|
$
|
(5,775,403
|
)
|
|
|
Adjustments to reconcile net increase in net assets resulting from
|
||||
|
operations to net cash used in operating activities:
|
||||
|
Payments to purchase securities
|
(15,370,436
|
)
|
||
|
Proceeds from sale of securities
|
19,582,452
|
|||
|
Proceeds from securities litigation
|
295
|
|||
|
Net sale of short term investments
|
10,508,656
|
|||
|
Realized gain on investments in securities
|
(4,463,183
|
)
|
||
|
Net accretion of discount on securities
|
(331,457
|
)
|
||
|
Change in unrealized appreciation/depreciation
|
||||
|
on investments in securities
|
10,859,112
|
|||
|
Decreases in operating assets:
|
||||
|
Decrease in dividends and interest receivable
|
33,889
|
|||
|
Decrease in prepaid expenses and other assets
|
5,219
|
|||
|
Decreases in operating liabilities:
|
||||
|
Decrease in payable to advisor
|
(9,612
|
)
|
||
|
Decrease in payable to administrator
|
(3,947
|
)
|
||
|
Decrease in payable for distribution fees
|
(2,047
|
)
|
||
|
Decrease in payable for service fees
|
(1,602
|
)
|
||
|
Decrease in accrued interest payable
|
(45,265
|
)
|
||
|
Decrease in accrued audit fees
|
(11,175
|
)
|
||
|
Decrease in accrued trustee fees
|
(356
|
)
|
||
|
Decrease in other accrued expenses and payables
|
(7,322
|
)
|
||
|
Net cash provided by operating securities
|
14,967,818
|
|||
|
Cash flows from financing activities:
|
||||
|
Decrease in reverse repurchase agreements
|
(5,397,000
|
)
|
||
|
Proceeds on shares sold
|
872,148
|
|||
|
Payment on shares redeemed
|
(10,407,077
|
)
|
||
|
Distributions paid in cash, net of reinvestments
|
(35,889
|
)
|
||
|
Net cash provided by financing activities
|
(14,967,818
|
)
|
||
|
Net increase in cash
|
—
|
|||
|
Cash:
|
||||
|
Beginning balance
|
—
|
|||
|
Ending balance
|
$
|
—
|
||
|
Supplemental information:
|
||||
|
Non-cash financing activities not included herein, consisting
|
||||
|
of dividend reinvestment of dividends and distributions
|
$
|
649,975
|
||
|
Cash paid for interest
|
$
|
296,481
|
||
The accompanying notes are an integral part of these financial statements.
|
HENNESSYFUNDS.COM
|
12
|
STATEMENT OF CASH FLOWS
|
(This Page Intentionally Left Blank.)
|
HENNESSY FUNDS
|
1-800-966-4354
|
13
Financial Statements
|
Financial Highlights
|
For an Investor Class share outstanding throughout each period
|
Six Months Ended
|
||||
|
April 30, 2020
|
||||
|
(Unaudited)
|
||||
|
PER SHARE DATA:
|
||||
|
Net asset value, beginning of period
|
$
|
13.98
|
||
|
Income from investment operations:
|
||||
|
Net investment income
|
0.13
|
(1)
|
||
|
Net realized and unrealized gains (losses) on investments
|
(1.34
|
)
|
||
|
Total from investment operations
|
(1.21
|
)
|
||
|
Less distributions:
|
||||
|
Dividends from net investment income
|
(0.15
|
)
|
||
|
Dividends from net realized gains
|
—
|
|||
|
Total distributions
|
(0.15
|
)
|
||
|
Net asset value, end of period
|
$
|
12.62
|
||
|
TOTAL RETURN
|
-8.65
|
%(2)
|
||
|
SUPPLEMENTAL DATA AND RATIOS:
|
||||
|
Net assets, end of period (millions)
|
$
|
57.65
|
||
|
Ratio of expenses, including interest expense, to average net assets
|
2.01
|
%(3)
|
||
|
Ratio of net investment income to average net assets
|
1.93
|
%(3)
|
||
|
Portfolio turnover rate
|
34
|
%(2)
|
||
|
(1)
|
Calculated using the average shares outstanding method.
|
|
(2)
|
Not annualized.
|
|
(3)
|
Annualized.
|
The accompanying notes are an integral part of these financial statements.
|
HENNESSYFUNDS.COM
|
14
|
FINANCIAL HIGHLIGHTS — INVESTOR CLASS
|
|
Year Ended October 31,
|
||||||||||||||||||
|
2019
|
2018
|
2017
|
2016
|
2015
|
||||||||||||||
|
$
|
13.57
|
$
|
14.66
|
$
|
13.84
|
$
|
14.19
|
$
|
15.27
|
|||||||||
|
0.24
|
(1)
|
0.23
|
0.20
|
0.16
|
0.20
|
|||||||||||||
|
0.81
|
0.43
|
1.48
|
0.88
|
(0.02
|
)
|
|||||||||||||
|
1.05
|
0.66
|
1.68
|
1.04
|
0.18
|
||||||||||||||
|
(0.24
|
)
|
(0.23
|
)
|
(0.20
|
)
|
(0.16
|
)
|
(0.20
|
)
|
|||||||||
|
(0.40
|
)
|
(1.52
|
)
|
(0.66
|
)
|
(1.23
|
)
|
(1.06
|
)
|
|||||||||
|
(0.64
|
)
|
(1.75
|
)
|
(0.86
|
)
|
(1.39
|
)
|
(1.26
|
)
|
|||||||||
|
$
|
13.98
|
$
|
13.57
|
$
|
14.66
|
$
|
13.84
|
$
|
14.19
|
|||||||||
|
7.93
|
%
|
4.92
|
%
|
12.56
|
%
|
8.20
|
%
|
1.22
|
%
|
|||||||||
|
$
|
72.94
|
$
|
71.60
|
$
|
77.75
|
$
|
83.87
|
$
|
69.42
|
|||||||||
|
2.31
|
%
|
1.95
|
%
|
1.57
|
%
|
1.44
|
%
|
1.28
|
%
|
|||||||||
|
1.74
|
%
|
1.67
|
%
|
1.38
|
%
|
1.22
|
%
|
1.40
|
%
|
|||||||||
|
30
|
%
|
10
|
%
|
36
|
%
|
44
|
%
|
27
|
%
|
|||||||||
The accompanying notes are an integral part of these financial statements.
|
HENNESSY FUNDS
|
1-800-966-4354
|
15
Financial Statements
|
Notes to the Financial Statements April 30, 2020 (Unaudited)
|
1). ORGANIZATION
The Hennessy Total Return Fund (the “Fund”) is a series of Hennessy Funds Trust (the “Trust”), which was organized as a Delaware statutory trust on September 17, 1992. The Fund is an open-end management investment
company registered under the Investment Company Act of 1940, as amended. The investment objective of the Fund is total return, consisting of capital appreciation and current income. The Fund is a non-diversified fund and offers Investor
Class shares.
As an investment company, the Fund follows the investment company accounting and reporting guidance of the Financial Accounting Standards Board (“FASB”) Accounting Standard Codification Topic
946 “Financial Services—Investment Companies.”
2). SIGNIFICANT ACCOUNTING POLICIES
The following is a summary of significant accounting policies consistently followed by the Fund in the preparation of the financial statements. These policies conform to U.S. generally accepted accounting
principles (“GAAP”).
|
a).
|
Securities Valuation – All investments in securities are recorded at their estimated fair value, as described in Note 3.
|
|
b).
|
Federal Income Taxes – No provision for federal income taxes or excise taxes has been made because the Fund has elected to be taxed as a regulated investment company and intends to distribute substantially
all of its taxable income to its shareholders and otherwise comply with the provisions of the Internal Revenue Code of 1986, as amended, applicable to regulated investment companies. Net investment income/loss and realized
gains/losses for federal income tax purposes may differ from those reported in the financial statements because of temporary book and tax basis differences. Temporary differences are primarily the result of the treatment of wash
sales for tax reporting purposes. The Fund recognizes interest and penalties related to income tax benefits, if any, in the Statement of Operations as an income tax expense. Distributions from net realized gains for book purposes
may include short-term capital gains, which are included as ordinary income to shareholders for tax purposes. The Fund may utilize equalization accounting for tax purposes and designate earnings and profits, including net realized
gains distributed to shareholders on redemption of shares, as part of the dividends paid deduction for income tax purposes.
|
|
c).
|
Accounting for Uncertainty in Income Taxes – The Fund has accounting policies regarding recognition and measurement of tax positions taken or expected to be taken on a tax return. The tax returns of the
Fund for the prior three fiscal years are open for examination. The Fund has reviewed all open tax years in major jurisdictions and concluded that there is no impact on the Fund’s net assets and no tax liability resulting from
unrecognized tax benefits relating to uncertain income tax positions taken or expected to be taken on a tax return. The Fund’s major tax jurisdictions are U.S. federal and Delaware.
|
|
d).
|
Income and Expenses – Dividend income is recognized on the ex-dividend date or as soon as information is available to the Fund. Interest income, which includes the amortization of premium and accretion of
discount, is recognized on an accrual basis.
|
|
HENNESSYFUNDS.COM
|
16
|
NOTES TO THE FINANCIAL STATEMENTS
|
|
Other non-cash dividends are recognized as investment income at the fair value of the property received. The Fund is charged for those expenses that are directly attributable to its portfolio, such as
advisory, administration, and certain shareholder service fees.
|
|
|
e).
|
Distributions to Shareholders – Dividends from net investment income for the Fund, if any, are declared and paid at the end of each calendar quarter. Distributions of net realized capital gains, if any,
are declared and paid annually, usually in December.
|
|
f).
|
Security Transactions – Investment and shareholder transactions are recorded on the trade date. The Fund determines the realized gain/loss from an investment transaction by comparing the original cost of
the security lot sold with the net sale proceeds. Discounts and premiums on securities purchased are accreted or amortized, respectively, over the life of each such security.
|
|
g).
|
Use of Estimates – The preparation of financial statements in conformity with GAAP requires management to make estimates and assumptions that affect the reported amounts of assets and liabilities and
disclosure of contingent assets and liabilities at the date of the financial statements and the reported change in net assets during the reporting period. Actual results could differ from those estimates.
|
|
h).
|
Share Valuation – The net asset value (“NAV”) per share of the Fund is calculated by dividing (i) the total value of the securities held by the Fund, plus cash and other assets, minus all liabilities
(including estimated accrued expenses) by (ii) the total number of shares outstanding for the Fund, rounded to the nearest $0.01. The Fund’s shares will not be priced on days the New York Stock Exchange is closed for trading. The
offering and redemption price per share for the Fund is equal to the Fund’s NAV per share.
|
|
i).
|
Derivatives – The Fund may invest in derivatives such as options, futures contracts, options on futures contracts, and swaps, for a variety of reasons, including to hedge certain risks, provide a
substitute for purchasing or selling particular securities, or increase potential income gain. Derivatives are financial contracts based on an underlying or notional amount, require no initial investment or an initial net investment
that is smaller than would normally be required to have a similar response to changes in market factors, and require or permit net settlement. Derivatives may allow the Fund to increase or decrease its level of risk more quickly and
efficiently than transactions in other types of instruments. The main reason for utilizing derivative instruments is for hedging purposes.
|
|
The Fund follows the financial accounting reporting rules as required by the Derivatives and Hedging Topic of the FASB Accounting
Standards Codification. Under such rules, the Fund is required to include enhanced disclosure that enables investors to understand how and why an entity uses derivatives, how derivatives are accounted for, and how derivatives
instruments affect an entity’s results of operations and financial position. During the six months ended April 30, 2020, the Fund did not hold any derivative instruments.
|
|
j).
|
Repurchase and Reverse Repurchase Agreements – The Fund may enter into repurchase agreements and reverse repurchase agreements with member banks or security dealers of the Federal Reserve Board whom the
investment advisor deems creditworthy. Transactions involving repurchase agreements and reverse repurchase agreements are treated as collateralized financing transactions and are recorded at their contracted resell or repurchase
amounts, which approximates fair value. Interest on repurchase agreements and reverse repurchase agreements is included in interest receivable and interest payable, respectively.
|
|
HENNESSY FUNDS
|
1-800-966-4354
|
17
|
In connection with repurchase agreements, securities pledged as collateral are held by the custodian bank until the respective
agreements mature. Provisions of the repurchase agreements ensure that the market value of the collateral, including accrued interest thereon, is sufficient to cover the repurchase amount in the event of default of the counterparty.
If the counterparty defaults and the fair value of the collateral declines, or if the counterparty enters an insolvency proceeding, realization of the collateral by the Fund may be delayed or limited.
|
|
|
As of April 30, 2020, securities with a fair value of $25,993,044, which are included in investments in securities in the Statement of
Assets and Liabilities, were pledged to collateralize reverse repurchase agreements.
|
|
k).
|
Offsetting Assets and Liabilities – The Fund follows the financial reporting rules regarding offsetting assets and liabilities and related netting arrangements to enable users of its financial statements
to understand the effect of those arrangements on its financial position. Reverse repurchase transactions are entered into by the Fund under Master Repurchase Agreements (“MRAs”) that permit the Fund, under certain circumstances,
including an event of default (such as bankruptcy or insolvency), to offset payables under the MRA with collateral held with the counterparty and create one single net payment from the Fund. Upon a bankruptcy or insolvency of the
MRA counterparty, the Fund is considered an unsecured creditor with respect to excess collateral and, as such, the return of excess collateral may be delayed. In the event the buyer of securities under an MRA files for bankruptcy or
becomes insolvent, the Fund’s use of the proceeds of the MRA may be restricted while the other party, or its trustee or receiver, determines whether or not to enforce the Fund’s obligation to repurchase the securities. For
additional information regarding the offsetting of assets and liabilities as of April 30, 2020, please refer to the table in Note 9.
|
3). SECURITIES VALUATION
The Fund follows fair value accounting standards that establish an authoritative definition of fair value and set out a hierarchy for measuring fair value. These standards require additional disclosures about the
various inputs and valuation techniques used to develop the measurements of fair value and a discussion of changes in valuation techniques and related inputs during the period. These inputs are summarized in the three broad levels listed
below:
|
Level 1 –
|
Unadjusted, quoted prices in active markets for identical instruments that the Fund has the ability to access at the date of measurement.
|
|
|
Level 2 –
|
Other significant observable inputs (including, but not limited to, quoted prices in active markets for similar instruments, quoted prices in markets that are not active for identical or similar
instruments, and model-derived valuations in which all significant inputs and significant value drivers are observable in active markets, such as interest rates, prepayment speeds, credit risk curves, default rates, and similar
data).
|
|
|
Level 3 –
|
Significant unobservable inputs (including the Fund’s own assumptions about what market participants would use to price the asset or liability based on the best available information) when observable
inputs are unavailable.
|
The following is a description of the valuation techniques applied to the Fund’s major categories of assets and liabilities measured at fair value on a recurring basis:
|
Equity Securities – Equity securities, including common stocks, preferred stocks, exchange-traded funds, closed-end mutual funds, partnerships, rights, and real
estate investment trusts, that are traded on a securities exchange for which a last-quoted
|
|
HENNESSYFUNDS.COM
|
18
|
NOTES TO THE FINANCIAL STATEMENTS
|
|
sales price is readily available will generally be valued at the last sales price as reported by the primary exchange on which the securities are listed. Securities listed on The NASDAQ Stock Market
(“NASDAQ”) will generally be valued at the NASDAQ Official Closing Price, which may differ from the last sales price reported. Securities traded on a securities exchange for which a last-quoted sales price is not readily available
will generally be valued at the mean between the bid and ask prices. To the extent these securities are actively traded and valuation adjustments are not applied, they are classified in Level 1 of the fair value hierarchy.
|
|
|
Registered Investment Companies – Investments in open-end registered investment companies, commonly referred to as mutual funds, generally are priced at the ending
NAV provided by the applicable mutual fund’s service agent and will be classified in Level 1 of the fair value hierarchy.
|
|
|
Debt Securities – Debt securities, including corporate bonds, asset-backed securities, mortgage-backed securities, municipal bonds, U.S. Treasuries, and U.S.
government agency issues, are generally valued at market on the basis of valuations furnished by an independent pricing service that utilizes both dealer-supplied valuations and formula-based techniques. The pricing service may
consider recently executed transactions in securities of the issuer or comparable issuers, market price quotations (where observable), bond spreads, and fundamental data relating to the issuer. In addition, the model may incorporate
observable market data, such as reported sales of similar securities, broker quotes, yields, bids, offers, and reference data. Certain securities are valued primarily using dealer quotations. These securities are generally
classified in Level 2 of the fair value hierarchy.
|
|
|
Short-Term Securities – Short-term equity investments, including money market funds, are valued in the manner specified above. Short-term debt investments with an
original term to maturity of 60 days or less are valued at amortized cost, which approximates fair market value. If the original term to maturity of a short-term debt investment exceeded 60 days, then the values as of the 61st day
prior to maturity are amortized. Amortized cost is not used if its use would be inappropriate due to credit or other impairments of the issuer, in which case the security’s fair value would be determined, as described below.
Short-term securities are generally classified in Level 1 or Level 2 of the fair value hierarchy depending on the inputs used and market activity levels for specific securities.
|
The Board of Trustees of the Fund (the “Board”) has adopted fair value pricing procedures that are followed when a price for a security is not readily available or if a significant event has
occurred that indicates the closing price of a security no longer represents the true value of that security. Fair value pricing determinations are made in good faith in accordance with these procedures. There are numerous criteria that
will be given consideration in determining a fair value of a security, such as the trading volume of a security and markets, the values of other similar securities, and news events with direct bearing on a security or markets. Fair value
pricing results in an estimated price for a security that reflects the amount the Fund might reasonably expect to receive in a current sale. Depending on the relative significance of the valuation inputs, these securities may be classified
in either Level 2 or Level 3 of the fair value hierarchy.
The Board has delegated day-to-day valuation matters to the Valuation and Liquidity Committee comprising representatives from Hennessy Advisors, Inc., the Fund’s investment advisor (the
“Advisor”). The function of the Valuation and Liquidity Committee is to value securities where current and reliable market quotations are not readily available. All actions taken by the Valuation and Liquidity Committee are reviewed by the
Board.
|
HENNESSY FUNDS
|
1-800-966-4354
|
19
The Fund has performed an analysis of all existing investments to determine the significance and character of all inputs to their fair value determinations. Various inputs are used to determine
the value of the Fund’s investments. The inputs or methodology used for valuing securities are not necessarily an indication of the risk associated with investing in those securities. Details related to the fair value hierarchy of the
Fund’s securities as of April 30, 2020, are included in the Schedule of Investments.
4). INVESTMENT TRANSACTIONS
Purchases and sales of investment securities (excluding government and short-term investments) for the Fund during the six months ended April 30, 2020, were $15,370,436 and $19,582,452, respectively.
There were no purchases or sales/maturities of long-term U.S. government securities for the Fund during the six months ended April 30, 2020.
The Fund is permitted to purchase or sell securities from or to another fund in the Hennessy Funds family of funds (collectively, the “Hennessy Funds”) under specified conditions outlined in
procedures adopted by the Board. The procedures have been designed to ensure that any purchase or sale of securities by the Fund from or to another Hennessy Fund complies with Rule 17a-7 of the Investment Company Act of 1940, as amended.
During the six months ended April 30, 2020, the Fund did not engage in purchases or sales of securities pursuant to Rule 17a-7 of the Investment Company Act of 1940, as amended.
5). INVESTMENT ADVISORY FEE AND OTHER TRANSACTIONS WITH AFFILIATES
The Advisor provides the Fund with investment advisory services under an Investment Advisory Agreement. The Advisor furnishes all investment advice, office space, and facilities and most of the personnel needed by
the Fund. As compensation for its services, the Advisor is entitled to a monthly fee from the Fund. The fee is based on the average daily net assets of the Fund at an annual rate of 0.60%. The net investment advisory fees expensed by the
Fund during the six months ended April 30, 2020, are included in the Statement of Operations.
The Board has approved a Shareholder Servicing Agreement for the Fund, which was instituted to compensate the Advisor for the non-investment advisory services it provides to the Fund. The
Shareholder Servicing Agreement provides for a monthly fee paid to the Advisor at an annual rate of 0.10% of the average daily net assets of the Fund. The shareholder service fees expensed by the Fund during the six months ended April 30,
2020, are included in the Statement of Operations.
The Fund has adopted a plan pursuant to Rule 12b-1 under the Investment Company Act of 1940, as amended, that authorizes payments in connection with the distribution of the Fund’s shares at an
annual rate of up to 0.25% of the Fund’s average daily net assets. Even though the authorized rate is up to 0.25%, the Fund is currently only using up to 0.15% of its average daily net assets for such purpose. Amounts paid under the plan
may be spent on any activities or expenses primarily intended to result in the sale of shares, including, but not limited to, advertising, shareholder account servicing, printing and mailing of prospectuses to other than current
shareholders, printing and mailing of sales literature, and compensation for sales and marketing activities or to financial institutions and others, such as dealers and distributors. The distribution fees expensed by the Fund during the six
months ended April 30, 2020, are included in the Statement of Operations.
The Fund has entered into agreements with various brokers, dealers, and financial intermediaries in connection with the sale of shares of the Fund. The agreements provide for periodic payments
of sub-transfer agent expenses by the Fund to the brokers, dealers,
|
HENNESSYFUNDS.COM
|
20
|
NOTES TO THE FINANCIAL STATEMENTS
|
and financial intermediaries for providing certain shareholder maintenance services. These shareholder services include the pre-processing and quality control of new accounts, shareholder correspondence, answering
customer inquiries regarding account status, and facilitating shareholder telephone transactions. The sub-transfer agent fees expensed by the Fund during the six months ended April 30, 2020, are included in the Statement of Operations.
U.S. Bancorp Fund Services, LLC, d/b/a U.S. Bank Global Fund Services (“Fund Services”) provides the Fund with administrative, accounting, and transfer agent services. As administrator, Fund
Services is responsible for activities such as (i) preparing various federal and state regulatory filings, reports, and returns for the Fund, (ii) preparing reports and materials to be supplied to the Board, (iii) monitoring the activities
of the Fund’s custodian, transfer agent, and accountants, and (iv) coordinating the preparation and payment of the Fund’s expenses and reviewing the Fund’s expense accruals. U.S. Bank N.A., an affiliate of Fund Services, serves as the
Fund’s custodian. The servicing agreements between the Trust and Fund Services and U.S. Bank N.A. contain a fee schedule that is inclusive of administrative, accounting, custody, and transfer agent fees. The administrative, accounting,
custody, and transfer agent fees expensed by the Fund during the six months ended April 30, 2020, are included in the Statement of Operations.
Quasar Distributors, LLC (“Quasar”) acts as the Fund’s principal underwriter in a continuous public offering of the Fund’s shares. Quasar was an affiliate of Fund Services and U.S. Bank N.A.
through March 30, 2020. Effective March 31, 2020, Foreside Financial Group, LLC (“Foreside”) acquired Quasar from Fund Services. As a result of the acquisition, Quasar became a wholly owned broker-dealer subsidiary of Foreside and is no
longer affiliated with Fund Services or U.S. Bank N.A. The Board approved a new Distribution Agreement to enable Quasar to continue serving as the Fund’s distributor.
The officers of the Fund are affiliated with the Advisor. With the exception of the Chief Compliance Officer and the Senior Compliance Officer, such officers receive no compensation from the
Fund for serving in their respective roles. The Fund, along with the other Hennessy Funds, makes reimbursement payments on an equal basis to the Advisor for a portion of the salary and benefits associated with the office of the Chief
Compliance Officer and for all of the salary and benefits associated with the office of the Senior Compliance Officer. The compliance fees expensed by the Fund during the six months ended April 30, 2020, are included in the Statement of
Operations.
6). GUARANTEES AND INDEMNIFICATIONS
Under the Hennessy Funds’ organizational documents, their officers and trustees are indemnified by the Hennessy Funds against certain liabilities arising out of the performance of their duties to the Hennessy
Funds. Additionally, in the normal course of business, the Hennessy Funds enter into contracts with service providers that contain general indemnification clauses. The Fund’s maximum exposure under these arrangements is unknown as this
would involve future claims that may be made against the Fund that have not yet occurred. Currently, the Fund expects the risk of loss to be remote.
7). LINE OF CREDIT
The Fund has an uncommitted line of credit with the other Hennessy Funds in the amount of the lesser of (i) $100,000,000 or (ii) 33.33% of each Hennessy Fund’s net assets, or 30% for the Hennessy Gas Utility Fund
and 10% for the Hennessy Balanced Fund, intended to provide short-term financing, if necessary, subject to certain restrictions, in connection with shareholder redemptions. The credit facility is with the Hennessy Funds’ custodian bank,
U.S. Bank N.A. Borrowings under this arrangement bear
|
HENNESSY FUNDS
|
1-800-966-4354
|
21
interest at the bank’s prime rate and are secured by all of the Fund’s assets (as to its own borrowings only). During the six months ended April 30, 2020, the Fund had an outstanding average daily balance and a
weighted average interest rate of $3,984 and 4.75%, respectively. The interest expensed by the Fund during the six months ended April 30, 2020, is included in the Statement of Operations. The maximum amount outstanding for the Fund during
the period was $417,000. As of April 30, 2020, the Fund did not have any borrowings outstanding under the line of credit.
8). FEDERAL TAX INFORMATION
As of October 31, 2019, the Fund’s most recent fiscal year end, the components of accumulated earnings (losses) for income tax purposes were as follows:
|
Investments
|
|||||
|
Cost of investments for tax purposes
|
$
|
93,073,817
|
|||
|
Gross tax unrealized appreciation
|
$
|
10,143,856
|
|||
|
Gross tax unrealized depreciation
|
(1,284,121
|
)
|
|||
|
Net tax unrealized appreciation/(depreciation)
|
$
|
8,859,735
|
|||
|
Undistributed ordinary income
|
$
|
96,178
|
|||
|
Undistributed long-term capital gains
|
—
|
||||
|
Total distributable earnings
|
$
|
96,178
|
|||
|
Other accumulated gain/(loss)
|
$
|
(203,475
|
)
|
||
|
Total accumulated gain/(loss)
|
$
|
8,752,438
|
|||
The difference between book-basis unrealized appreciation/depreciation and tax-basis unrealized appreciation/depreciation (as shown above) is attributable primarily to wash sales.
As of October 31, 2019, the Fund had capital loss carryforwards as follows:
|
$203,475
|
Unlimited Short-Term
|
As of October 31, 2019, the Fund did not defer, on a tax basis, any late-year ordinary losses. Late-year ordinary losses are net ordinary losses incurred after December 31, 2018, but within the
taxable year, that are deemed to arise on the first day of the Fund’s next taxable year.
During fiscal year 2020 (year to date) and fiscal year 2019, the tax character of distributions paid by the Fund was as follows:
|
Six Months Ended
|
Year Ended
|
||||||||
|
April 30, 2020
|
October 31, 2019
|
||||||||
|
Ordinary income(1)
|
$
|
685,864
|
$
|
1,318,071
|
|||||
|
Long-term capital gain
|
—
|
2,116,280
|
|||||||
|
$
|
685,864
|
$
|
3,434,351
|
||||||
|
(1) Ordinary income includes short-term capital gain.
|
9). REVERSE REPURCHASE AGREEMENTS
The Fund may enter into reverse repurchase agreements with the same parties with which it may enter into repurchase agreements. Under a reverse repurchase agreement, the Fund sells securities and agrees to
repurchase them at a mutually agreed date and price. Reverse repurchase agreements are regarded as a form of secured borrowing by the Fund. Securities sold under reverse repurchase agreements are reflected as a liability in the Statement of
Assets and Liabilities. Interest payments made under reverse repurchase agreements during the six months ended April 30, 2020, totaled $251,120 and are recorded as a component of interest expense in the Statement of Operations.
|
HENNESSYFUNDS.COM
|
22
|
NOTES TO THE FINANCIAL STATEMENTS
|
During the six months ended April 30, 2020, the average daily balance and average interest rate in effect for reverse repurchase agreements were $26,599,500 and 1.85%, respectively. Below is
information about the scheduled maturity date, amount, and interest rate for outstanding reverse repurchase agreements as of April 30, 2020:
|
Maturity Date
|
Amount
|
Interest Rate
|
||
|
May 14, 2020
|
$ 7,196,000
|
1.80%
|
||
|
June 18, 2020
|
$ 3,598,000
|
0.70%
|
||
|
July 16, 2020
|
$12,593,000
|
0.35%
|
Outstanding reverse repurchase agreements as of April 30, 2020, comprised 40.56% of the Fund’s net assets.
Below is information about reverse repurchase agreements eligible for offset in the Statement of Assets and Liabilities, on both a gross and net basis:
|
Gross
|
Net
|
Gross Amounts Not
Offset in the Statement
of Assets and Liabilities
|
|||||||||||||||||||||
|
Amounts
|
Amounts
|
||||||||||||||||||||||
|
Offset
|
Presented
|
||||||||||||||||||||||
|
Gross
|
in the
|
in the
|
|||||||||||||||||||||
|
Amounts of
|
Statement of
|
Statement of
|
Collateral
|
||||||||||||||||||||
|
Recognized
|
Assets and
|
Assets and
|
Financial
|
Pledged
|
Net
|
||||||||||||||||||
|
Liabilities
|
Liabilities
|
Liabilities
|
Instruments
|
(Received)
|
Amount
|
||||||||||||||||||
|
$
|
23,387,000
|
$
|
—
|
$
|
23,387,000
|
$
|
23,387,000
|
$
|
—
|
$
|
—
|
||||||||||||
|
$
|
23,387,000
|
$
|
—
|
$
|
23,387,000
|
$
|
23,387,000
|
$
|
—
|
$
|
—
|
||||||||||||
For additional information, please refer to the “Offsetting Assets and Liabilities” section in Note 2.
10). EVENTS SUBSEQUENT TO PERIOD END
Management has evaluated the Fund’s related events and transactions that occurred subsequent to April 30, 2020, through the date of issuance of the Fund’s financial statements. Management has determined that there
were no subsequent events requiring recognition or disclosure in the financial statements.
|
HENNESSY FUNDS
|
1-800-966-4354
|
23
Expense Example (Unaudited)
April 30, 2020
As a shareholder of the Fund, you incur ongoing costs, including management fees, service fees, and other Fund expenses. This Example is intended to help you understand your ongoing costs (in dollars) of investing
in the Fund and to compare these costs with the ongoing costs of investing in other mutual funds. The Example is based on an investment of $1,000 invested at the beginning of the period and held for the entire period from November 1, 2019,
through April 30, 2020.
Actual Expenses
The first line of the table below provides information about actual account values and actual expenses. Although the Fund charges no sales loads or transaction fees, you will be assessed fees for outgoing wire
transfers, returned checks and stop payment orders at prevailing rates charged by U.S. Bank Global Fund Services, the Fund’s transfer agent. If you request that a redemption be made by wire transfer, currently a $15 fee is charged by the
Fund’s transfer agent. IRA accounts will be charged a $15 annual maintenance fee. The example below includes, but is not limited to, management fees, shareholder servicing fees, accounting, custody, and transfer agent fees. However, the
example below does not include portfolio trading commissions and related expenses. You may use the information in this line, together with the amount you invested, to estimate the expenses that you paid over the period. Simply divide your
account value by $1,000 (for example, an $8,600 account value divided by $1,000 = 8.6), then multiply the result by the number in the first line of the table under the heading entitled “Expenses Paid During Period” to estimate the expenses
you paid on your account during this period.
Hypothetical Example for Comparison Purposes
The second line of the table below provides information about hypothetical account values and hypothetical expenses based on the Fund’s actual expense ratio and an assumed rate of return of 5% per year before
expenses, which is not the Fund’s actual return. The hypothetical account values and expenses may not be used to estimate the actual ending account balance or expenses you paid for the period. You may use this information to compare the
ongoing costs of investing in the Fund and other funds. To do so, compare this 5% hypothetical example with the 5% hypothetical examples that appear in the shareholder reports of the other funds. Please note that the expenses shown in the
table are meant to highlight your ongoing costs only. Therefore, the second line of the table is useful in comparing ongoing costs only and will not help you determine the relative total costs of owning different funds.
|
Beginning
|
Ending
|
||
|
Account Value
|
Account Value
|
Expenses Paid
|
|
|
November 1, 2019
|
April 30, 2020
|
During Period(1)
|
|
|
Investor Class
|
|||
|
Actual
|
$1,000.00
|
$ 913.50
|
$ 9.56
|
|
Hypothetical (5% return before expenses)
|
$1,000.00
|
$1,014.87
|
$10.07
|
|
(1)
|
Expenses are equal to the Fund’s annualized expense ratio of 2.01%, multiplied by the average account value over the period, multiplied by 182/366 days (to reflect the half-year period).
|
|
HENNESSYFUNDS.COM
|
24
|
EXPENSE EXAMPLE — ELECTRONIC DELIVERY
|
How to Obtain a Copy of the Fund’s
Proxy Voting Policy and Proxy Voting Records
A description of the policies and procedures the Fund uses to determine how to vote proxies relating to portfolio securities is available without charge (1) by calling 1-800-966-4354, (2) on the Hennessy Funds’
website at www.hennessyfunds.com/proxy-voting/voting-policy, or (3) on the U.S. Securities and Exchange Commission’s (the “SEC”) website at www.sec.gov. The Fund’s proxy voting record is available without charge on both the Hennessy Funds’
website at www.hennessyfunds.com/proxy-voting/voting-record and the SEC’s website at www.sec.gov no later than August 31 for the prior 12 months ending June 30.
Availability of Quarterly Portfolio Schedule
The Fund files a complete schedule of portfolio holdings with the SEC for the first and third quarters of each fiscal year as an exhibit to its reports on Form N-PORT. The Fund’s Forms N-PORT are available on the
SEC’s website at www.sec.gov or on request by calling 1-800-966-4354.
Federal Tax Distribution Information (Unaudited)
For fiscal year 2019, certain dividends paid by the Fund may be subject to a maximum tax rate of 23.8%, as provided for by the Jobs and Growth Tax Relief Reconciliation Act of 2003. The percentage of dividends
declared from ordinary income designated as qualified dividend income was 100.00%.
For corporate shareholders, the percent of ordinary income distributions that qualified for the corporate dividends received deduction for fiscal year 2019 was 100.00%.
The percentage of taxable ordinary income distributions that were designated as short-term capital gain distributions under Section 871(k)(2)(C) of the Internal Revenue Code of 1986, as amended,
for the Fund was 0.00%.
Important Notice Regarding Delivery
of Shareholder Documents
To help keep the Fund’s costs as low as possible, we generally deliver a single copy of shareholder reports, proxy statements, and prospectuses to shareholders who share an address and have the same last name.
This process does not apply to account statements. You may request an individual copy of a shareholder document at any time. If you would like to receive separate mailings of shareholder documents, please call U.S. Bank Global Fund Services
at 1-800-261-6950 or 1-414-765-4124, and individual delivery will begin within 30 days of your request. If your account is held through a financial institution or other intermediary, please contact such intermediary directly to request
individual delivery.
Electronic Delivery
The Funds offer shareholders the option to receive account statements, prospectuses, tax forms, and shareholder reports online. To sign up for eDelivery, please visit www.hennessyfunds.com/account. You may change
your delivery preference at any time by visiting our website or calling U.S. Bank Global Fund Services at 1-800-261-6950 or 1-414-765-4124.
|
HENNESSY FUNDS
|
1-800-966-4354
|
25
Board Approval of Investment Advisory
Agreement
At its meeting on March 12, 2020, the Board of Trustees of the Fund (the “Board,” and the members thereof, the “Trustees”) unanimously approved the continuation of the investment advisory agreement of the Fund
with Hennessy Advisors, Inc. (the “Advisor”). As part of the process of approving the continuation of the advisory agreement, the Trustees reviewed their fiduciary duties and the relevant factors for them to consider with respect to
approving the advisory agreement. In addition, the Trustees who are not deemed “interested persons” (as defined by the Investment Company Act of 1940, as amended) of the Fund (the “Independent Trustees”) met in executive session to discuss
the approval of the advisory agreement.
In advance of the meeting, the Advisor sent detailed information to the Trustees to assist them in their evaluation of the advisory agreement. This information included, but was not limited to,
the following:
|
(1)
|
A memorandum from outside legal counsel that described the fiduciary duties of the Board with respect to approving the continuation of the advisory agreement and the relevant factors for consideration;
|
|
|
(2)
|
A memorandum from the Advisor that listed the factors relevant to the Board’s approval of the continuation of the advisory agreement and also referenced the documents that had been provided to help the
Board assess each such factor;
|
|
|
(3)
|
An inventory of the services provided by the Advisor;
|
|
|
(4)
|
A written discussion of economies of scale;
|
|
|
(5)
|
A summary of the key terms of the advisory agreement;
|
|
|
(6)
|
A recent Fund fact sheet, which included performance information over various periods;
|
|
|
(7)
|
A peer expense comparison of the net expense ratio and investment advisory fee of the Fund; and
|
|
|
(8)
|
The Advisor’s financial statements from its most recent Form 10-K and Form 10-Q.
|
All of the factors discussed were considered as a whole by the Trustees and by the Independent Trustees meeting in executive session. The factors were viewed in their totality by the Trustees,
with no single factor being the principal or determinative factor in the Trustees’ determination of whether to approve the continuation of the advisory agreement. The Trustees recognized that the management and fee arrangements for the Fund
are the result of years of review and discussion between the Independent Trustees and the Advisor, that certain aspects of such arrangements may receive greater scrutiny in some years than in others, and that the Trustees’ conclusions may
be based, in part, on their consideration of these same arrangements and information received during the course of the year and in prior years.
|
HENNESSYFUNDS.COM
|
26
|
BOARD APPROVAL OF INVESTMENT ADVISORY AGREEMENT
|
Prior to approving the continuation of the advisory agreement, the Trustees, including the Independent Trustees in executive session, considered, among other items:
|
(1)
|
The nature and quality of the advisory services provided by the Advisor;
|
|
|
(2)
|
A comparison of the fees and expenses of the Fund to other similar funds;
|
|
|
(3)
|
Whether economies of scale are recognized by the Fund;
|
|
|
(4)
|
The costs and profitability of the Fund to the Advisor;
|
|
|
(5)
|
The performance of the Fund; and
|
|
|
(6)
|
Any benefits to the Advisor from serving as an investment advisor to the Fund (other than the advisory fee).
|
The material considerations and determinations of the Trustees, including the Independent Trustees, were as follows:
|
(1)
|
The Trustees considered the services identified below that are provided by the Advisor. Based on this review, the Trustees concluded that the Advisor provides high-quality services to the Fund and noted
that their overall confidence in the Advisor was high. The Trustees also concluded that they were satisfied with the nature, extent, and quality of the advisory services provided to the Fund by the Advisor and that the nature and
extent of the services provided by the Advisor were appropriate to assure that the Fund’s operations are conducted in compliance with applicable laws, rules, and regulations.
|
|
(a)
|
The Advisor acts as the portfolio manager for the Fund. In this capacity, the Advisor does the following:
|
|
(i)
|
manages the composition of the Fund’s portfolio, including the purchase, retention, and disposition of portfolio securities in accordance with the Fund’s investment objectives, policies, and restrictions;
|
|||
|
(ii)
|
seeks best execution for the Fund’s portfolio;
|
|||
|
(iii)
|
manages the use of soft dollars for the Fund; and
|
|||
|
(iv)
|
manages proxy voting for the Fund.
|
|
(b)
|
The Advisor performs a daily reconciliation of portfolio positions and cash for the Fund.
|
||
|
(c)
|
The Advisor monitors the liquidity of each Fund.
|
||
|
(d)
|
The Advisor monitors the Fund’s compliance with its investment objectives and restrictions.
|
||
|
(e)
|
The Advisor monitors compliance with federal securities laws, maintains a compliance program (including a code of ethics), conducts ongoing reviews of the compliance programs of the Fund’s service
providers, as feasible, conducts on-site visits to the Fund’s service providers, monitors incidents of abusive trading practices, reviews Fund expense accruals, payments, and fixed expense ratios, evaluates insurance providers for
fidelity bond, D&O/E&O insurance, and cybersecurity insurance coverage, manages regulatory examination compliance and responses, conducts employee compliance training, reviews reports provided by service providers, and
maintains books and records.
|
||
|
(f)
|
The Advisor oversees service providers that provide accounting, administration, distribution, transfer agency, custodial, sales, marketing, public relations, audit, information technology, and legal
services to the Fund.
|
|
HENNESSY FUNDS
|
1-800-966-4354
|
27
|
(g)
|
The Advisor maintains in-house marketing and distribution departments on behalf of the Fund.
|
||
|
(h)
|
The Advisor is actively involved with preparing regulatory filings for the Fund, including writing and annually updating the Fund’s prospectus and related documents.
|
||
|
(i)
|
For each annual report of the Fund, the Advisor prepares a written summary of the Fund’s performance during the most recent 12-month period.
|
||
|
(j)
|
The Advisor oversees distribution of the Fund through third-party broker/dealers and independent financial institutions such as Charles Schwab, Inc., Fidelity, TD Ameritrade, and Pershing. The Advisor
participates in “no transaction fee” (“NTF”) programs with these companies on behalf of the Fund, which allow customers to purchase the Fund through third-party distribution channels without paying a transaction fee. The Advisor
compensates, in part, a number of these third-party providers of NTF programs out of its own revenues.
|
||
|
(k)
|
The Advisor pays the incentive compensation of the Fund’s compliance officers and employs other staff, such as legal, marketing, national accounts, distribution, sales, administrative, and trading
oversight personnel, as well as management executives.
|
||
|
(l)
|
The Advisor provides a quarterly compliance certification to the Board.
|
||
|
(m)
|
The Advisor prepares or reviews all Board materials, frequently presents to the Board and leads Board discussions, prepares or reviews all meeting minutes, and arranges for Board training and education.
|
|
(2)
|
The Trustees compared the performance of the Fund to benchmark indices over various periods and also noted that the Trustees review and discuss reports comparing the investment performance of the Fund to
various indices at each quarterly Board meeting. Based on such information, the Trustees determined that the Advisor manages the Fund in a manner materially consistent with its stated investment objective and style. The Trustees
concluded that the performance of the Fund over various periods warranted continuation of the advisory agreement.
|
|
|
(3)
|
The Trustees reviewed the advisory fees and overall expense ratios of the Fund compared to other funds similar in asset size and investment objective to the Fund using data from Morningstar. As part of the
discussion with management, the Trustees ensured that they understood and were comfortable with the criteria used to determine the mutual funds included in the Morningstar categories for purposes of the materials considered at the
meeting. The Trustees determined that the advisory fee and overall expense ratio of the Fund falls within the range of the advisory fees and overall expense ratios of other comparable funds and concluded that they are reasonable and
warranted continuation of the advisory agreement.
|
|
|
(4)
|
The Trustees also considered whether the Advisor was realizing economies of scale that it should share with the Fund’s shareholders. The Trustees noted that the assets of the Fund had declined over the
prior year. In addition, the Trustees noted that many of the expenses incurred to manage the Fund are asset-based fees, so the Advisor does not realize material economies of scale relating to those expenses as the assets of the Fund
increase. For example, mutual fund platform
|
|
HENNESSYFUNDS.COM
|
28
|
BOARD APPROVAL OF INVESTMENT ADVISORY AGREEMENT
|
|
fees increase as the Fund’s assets grow. The Trustees also considered the Advisor’s efforts to contain expenses through actions such as renegotiating service contracts, the Advisor’s significant marketing
efforts to promote the Funds, the Advisor’s investments in personnel to manage the Funds, and the Advisor’s agreement to waive fees or lower its management fees in certain circumstances. The Trustees noted that it did not appear
that the Advisor was realizing economies of scale at current asset levels and concluded that it would continue to monitor economies of scale in the future as circumstances changed.
|
||
|
(5)
|
The Trustees considered the profitability of the Advisor, including the impact of mutual fund platform fees on the Advisor’s profitability, and also considered the resources and revenues that the Advisor
has put into managing and distributing the Fund. The Trustees then concluded that the profits of the Advisor are reasonable and not excessive when compared to profitability guidelines set forth in relevant court cases.
|
|
|
(6)
|
The Trustees considered the high level of professionalism and knowledge of the Advisor’s employees, along with a very low level of turnover, and concluded that this was beneficial to the Fund and its
shareholders.
|
|
|
(7)
|
The Trustees considered any benefits to the Advisor from serving as an advisor to the Fund (other than the advisory fee). The Trustees noted that the Advisor may derive ancillary benefits from, by way of
example, its association with the Fund in the form of proprietary and third-party research products and services received from broker-dealers that execute portfolio trades for the Fund. The Trustees determined that any such products
and services have been used for legitimate purposes relating to the Fund by providing assistance in the investment decision-making process. The Trustees concluded that any additional benefits realized by the Advisor from its
relationship with the Fund were reasonable, which was based on, among other things, the Trustees’ finding that the research, analytical, statistical, and other information and services provided by brokers are merely supplemental to
the Advisor’s own efforts in the performance of its duties under the advisory agreement.
|
After reviewing the materials and information provided at the meeting, as well as other information regularly provided at the Board’s quarterly meetings throughout the year regarding the quality
of services provided by the Advisor, the performance of the Fund, expense information, brokerage commissions information, the adequacy and efficacy of the Advisor’s written policies and procedures, other regulatory compliance issues,
trading information and related matters, and other factors that the Trustees deemed relevant, the Trustees, including the Independent Trustees, approved the continuation of the advisory agreement.
|
HENNESSY FUNDS
|
1-800-966-4354
|
29
For information, questions, or assistance, please call
The Hennessy Funds
1-800-966-4354 or 1-415-899-1555
INVESTMENT ADVISOR
Hennessy Advisors, Inc.
7250 Redwood Boulevard, Suite 200
Novato, California 94945
ADMINISTRATOR,
TRANSFER AGENT,
DIVIDEND PAYING AGENT, &
SHAREHOLDER SERVICING AGENT
U.S. Bancorp Fund Services, LLC
d/b/a U.S. Bank Global Fund Services
P.O. Box 701
Milwaukee, Wisconsin 53201-0701
CUSTODIAN
U.S. Bank N.A.
Custody Operations
1555 North River Center Drive, Suite 302
Milwaukee, Wisconsin 53212
TRUSTEES
Neil J. Hennessy
Robert T. Doyle
J. Dennis DeSousa
Gerald P. Richardson
COUNSEL
Foley & Lardner LLP
777 East Wisconsin Avenue
Milwaukee, Wisconsin 53202-5306
INDEPENDENT REGISTERED
PUBLIC ACCOUNTING FIRM
Tait, Weller & Baker LLP
Two Liberty Place
50 South 16th Street, Suite 2900
Philadelphia, Pennsylvania 19102-2529
DISTRIBUTOR
Quasar Distributors, LLC
111 East Kilbourn Avenue, Suite 2200
Milwaukee, Wisconsin 53202
www.hennessyfunds.com | 1-800-966-4354
This report has been prepared for shareholders and may be distributed to
others only if preceded or accompanied by a current prospectus.
SEMI-ANNUAL REPORT
APRIL 30, 2020

HENNESSY EQUITY AND INCOME FUND
Investor Class HEIFX
Institutional Class HEIIX
IMPORTANT NOTICE REGARDING ELECTRONIC DELIVERY OF SHAREHOLDER REPORTS
Beginning on January 1, 2021, as permitted by regulations adopted by the Securities and Exchange Commission, paper copies of the annual and semi-annual
reports will no longer be sent by mail unless you specifically request paper copies from the Hennessy Funds or from your financial intermediary. Instead, the reports will be made available on a website, and you will be notified
by mail each time a report is posted and provided with a website link to access the report.
If you have already elected to receive shareholder reports electronically, you will not be affected by this change and you need not take any action. You may
elect to receive shareholder reports and other communications from the Hennessy Funds electronically by visiting www.hennessyfunds.com/account or by calling U.S. Bank Global Fund Services at 1-800-261-6950. If you own shares in a
Fund through a financial intermediary, please contact your financial intermediary to make this election.
You may elect to receive paper copies of all future reports free of charge by calling U.S. Bank Global Fund Services at 1-800-261-6950 or, if you own your
shares through a financial intermediary, by contacting your financial intermediary. Your election to receive paper copies of reports will apply to all Funds in the Hennessy Funds family.
hennessyfunds.com | 1-800-966-4354
(This Page Intentionally Left Blank.)
Contents
|
Letter to Shareholders
|
2
|
|
Performance Overview
|
4
|
|
Financial Statements
|
|
|
Schedule of Investments
|
5
|
|
Statement of Assets and Liabilities
|
16
|
|
Statement of Operations
|
17
|
|
Statements of Changes in Net Assets
|
19
|
|
Financial Highlights
|
20
|
|
Notes to the Financial Statements
|
24
|
|
Expense Example
|
32
|
|
Proxy Voting Policy and Proxy Voting Records
|
34
|
|
Availability of Quarterly Portfolio Schedule
|
34
|
|
Federal Tax Distribution Information
|
34
|
|
Important Notice Regarding Delivery of Shareholder Documents
|
34
|
|
Electronic Delivery
|
34
|
|
Board Approval of Investment Advisory Agreements
|
35
|
|
HENNESSY FUNDS
|
1-800-966-4354
|
June 2020
Dear Hennessy Funds Shareholder:
First and foremost, I hope this communication finds you and your loved ones safe and healthy. In many ways, the COVID-19 pandemic has turned the world upside down in recent months, and we at Hennessy have joined
the rest of the world in witnessing and experiencing its profound effect on public health, the global economy, and the everyday lives of people around the world. In response to the crisis, we invoked our business continuity plan in
mid-March to ensure a smooth transition to remote work for all of our employees, who have been working safely and productively from home. We want to assure our Hennessy Funds shareholders that our operations are uninterrupted and
functioning normally.
The past six months have been marked by extremes. During the first half of the period from November 2019 through January 2020, the bull market, supported by strong corporate fundamentals,
continued to move higher, and investors appeared focused on record-low unemployment and strong economic growth. In mid-February, the major U.S. market indices hit all-time highs, but then, within just a matter of weeks, lost over
one-third of their values as the COVID-19 pandemic unfolded. Shelter-in-place and business closure orders rippled through the nation, causing initial unemployment claims to skyrocket to their highest number in history. The market then
rallied back and posted double-digit positive returns in April.
For the six months ended April 30, 2020, on a total return basis, the Dow Jones Industrial Average was down 8.9% and the S&P 500® Index was down 3.2%. Small-cap and mid-cap stocks generally fared worse than large-cap stocks during the period, and the Financial sector was particularly hard hit as the Federal Reserve aggressively cut the
federal funds rate in an effort to stabilize the economy. The Energy sector was crushed by both the sudden loss of demand due to COVID-19 and the oversupply caused by the surprise market-share battle between Russia and Saudi Arabia, and
the S&P 500® Energy Sector Index ended the six-month period down over 30%.
The COVID-19 pandemic is an unprecedented event, and the duration and full extent of the economic impact is unknown. In the moment, there is always the concern that ‘this time is different.’
But, when you are able to look at past financial, political, and health crises with the benefit of 20/20 hindsight, history has demonstrated that our economy and financial markets have always rebounded and recovered eventually. If you
look back to the last market downturn in 2008, economic fundamentals were weak compared to the market in 2020, where the overall underpinnings were – and are still – quite strong. Publicly listed companies today have plenty of cash, with
over $5 trillion on balance sheets of the S&P 500® companies alone, and I believe that most will survive and that many may emerge from the current crisis
even stronger.
|
HENNESSYFUNDS.COM
|
2
|
LETTER TO SHAREHOLDERS
|
We understand that this market volatility and economic uncertainty is jarring to many investors, and we continue to monitor events and the markets. We remain focused on managing our
high-conviction portfolios for the long-term benefit of our shareholders, and we are confident in the time-tested strategies and rigorous research that led to their formation. We encourage shareholders to maintain a long-term investment
horizon and to remain focused on long-term goals. As always, but especially in these trying times, we are here to support our shareholders, and we thank you for your continued investment and trust. Should you have any questions or would
like to speak with us directly, please don’t hesitate to call (800) 966-4354 or email us at fundsinfo@hennessyfunds.com.
Best regards,
Neil J. Hennessy
President and Chief Investment Officer
Past performance does not guarantee future results.
Mutual fund investing involves risk. Principal loss is possible.
The Dow Jones Industrial Average and S&P 500® Index are commonly used to measure the performance of U.S. stocks. The S&P
500® Energy Sector Index is an index that comprises those companies included in the S&P 500 that are classified as members of the GICS energy sector.
One cannot invest directly in an index.
|
HENNESSY FUNDS
|
1-800-966-4354
|
3
Performance Overview (Unaudited)
AVERAGE ANNUAL TOTAL RETURN FOR PERIODS ENDED APRIL 30, 2020
|
Six
|
One
|
Five
|
Ten
|
|
|
Months(1)
|
Year
|
Years
|
Years
|
|
|
Hennessy Equity and Income Fund –
|
||||
|
Investor Class (HEIFX)
|
-5.70%
|
-3.79%
|
3.43%
|
6.83%
|
|
Hennessy Equity and Income Fund –
|
||||
|
Institutional Class (HEIIX)
|
-5.52%
|
-3.49%
|
3.83%
|
7.17%
|
|
Blended Balanced Index
|
0.05%
|
4.38%
|
6.95%
|
8.48%
|
|
S&P 500® Index
|
-3.16%
|
0.86%
|
9.12%
|
11.69%
|
Expense ratios: 1.55% (Investor Class); 1.18% (Institutional Class)
|
(1)
|
Periods of less than one year are not annualized.
|
_______________
Performance data quoted represents past performance; past performance does not guarantee future results. The investment return and principal value of an investment will fluctuate so that an
investor’s shares, when redeemed, may be worth more or less than their original cost. The performance table does not reflect the deduction of taxes that a shareholder would pay on Fund distributions or the redemption of Fund shares.
Current performance of the Fund may be lower or higher than the performance quoted. Performance data current to the most recent month end may be obtained by visiting www.hennessyfunds.com. Performance for the period on or prior to October
26, 2012, is that of the FBR Balanced Fund.
The Blended Balanced Index consists of 60% common stocks represented by the S&P 500® Index and 40% bonds represented by the
Bloomberg Barclays Intermediate U.S. Government/Credit Index, which measures the performance of U.S. dollar denominated Treasury securities and government-related and investment-grade corporate securities that have $250 million or more of
outstanding face value, are fixed rate and non-convertible, and have remaining maturities of greater than or equal to one year and less than 10 years. The S&P 500® Index is a capitalization-weighted index that is designed to represent the broad domestic economy through changes in the aggregate market value of 500 stocks across all major industries. One cannot invest directly in
an index. These indices are used herein for comparative purposes in accordance with SEC regulations.
Standard & Poor’s Financial Services LLC is the source and owner of the S&P® and S&P 500® trademarks.
The expense ratios presented are from the most recent prospectus. The expense ratios for the current reporting period are available in the Financial Highlights section of this report.
|
HENNESSYFUNDS.COM
|
4
|
PERFORMANCE OVERVIEW/SCHEDULE OF INVESTMENTS
|
Financial Statements
|
Schedule of Investments as of April 30, 2020
(Unaudited)
|
HENNESSY EQUITY AND INCOME FUND
(% of Net Assets)
|
TOP TEN HOLDINGS (EXCLUDING MONEY MARKET FUNDS)
|
% NET ASSETS
|
|
Apple, Inc.
|
4.84%
|
|
Berkshire Hathaway, Inc., Class B
|
3.98%
|
|
Alphabet, Inc., Class C
|
3.29%
|
|
Visa, Inc., Class A
|
2.70%
|
|
Nestlé S.A. – ADR
|
2.40%
|
|
Citrix Systems, Inc.
|
2.32%
|
|
Home Depot, Inc.
|
2.24%
|
|
O’Reilly Automotive, Inc.
|
2.10%
|
|
Norfolk Southern Corp.
|
2.07%
|
|
Air Products and Chemicals, Inc.
|
1.99%
|
Note: For presentation purposes, the Fund has grouped some of the industry categories. For purposes of categorizing securities for compliance with Section 8(b)(1) of the Investment Company Act of 1940, as
amended, the Fund uses more specific industry classifications.
The Global Industry Classification Standard (GICS®) was developed by and is the exclusive property and a service mark of MSCI,
Inc. and Standard & Poor’s Financial Services LLC. It has been licensed for use by the Hennessy Funds.
|
HENNESSY FUNDS
|
1-800-966-4354
|
5
|
COMMON STOCKS – 56.52%
|
Number
|
% of
|
||||||||||
|
|
of Shares
|
Value
|
Net Assets
|
|||||||||
|
Communication Services – 6.48%
|
||||||||||||
|
Alphabet, Inc., Class C (a)
|
2,874
|
$
|
3,876,049
|
3.29
|
%
|
|||||||
|
Fox Corp.
|
59,859
|
1,548,552
|
1.32
|
%
|
||||||||
|
Verizon Communications, Inc.
|
38,313
|
2,201,082
|
1.87
|
%
|
||||||||
|
|
7,625,683
|
6.48
|
%
|
|||||||||
|
Consumer Discretionary – 8.46%
|
||||||||||||
|
CarMax, Inc. (a)
|
31,005
|
2,283,518
|
1.94
|
%
|
||||||||
|
Dollar Tree, Inc. (a)
|
18,669
|
1,487,359
|
1.26
|
%
|
||||||||
|
Home Depot, Inc.
|
11,985
|
2,634,663
|
2.24
|
%
|
||||||||
|
Lowe’s Companies, Inc.
|
10,272
|
1,075,992
|
0.92
|
%
|
||||||||
|
O’Reilly Automotive, Inc. (a)
|
6,391
|
2,469,099
|
2.10
|
%
|
||||||||
|
|
9,950,631
|
8.46
|
%
|
|||||||||
|
Consumer Staples – 4.23%
|
||||||||||||
|
Altria Group, Inc.
|
54,868
|
2,153,569
|
1.83
|
%
|
||||||||
|
Nestlé S.A. – ADR (a)(b)
|
26,872
|
2,824,247
|
2.40
|
%
|
||||||||
|
|
4,977,816
|
4.23
|
%
|
|||||||||
|
Energy – 1.63%
|
||||||||||||
|
Chevron Corp.
|
18,831
|
1,732,452
|
1.47
|
%
|
||||||||
|
Enbridge, Inc. (b)
|
1,575
|
48,321
|
0.04
|
%
|
||||||||
|
Kinder Morgan, Inc.
|
3,300
|
50,259
|
0.04
|
%
|
||||||||
|
Targa Resources Corp.
|
2,500
|
32,400
|
0.03
|
%
|
||||||||
|
The Williams Companies, Inc.
|
3,100
|
60,047
|
0.05
|
%
|
||||||||
|
|
1,923,479
|
1.63
|
%
|
|||||||||
|
Financials – 10.13%
|
||||||||||||
|
Berkshire Hathaway, Inc., Class B (a)
|
25,020
|
4,687,747
|
3.98
|
%
|
||||||||
|
BlackRock, Inc.
|
4,642
|
2,330,470
|
1.98
|
%
|
||||||||
|
The Charles Schwab Corp.
|
42,288
|
1,595,103
|
1.36
|
%
|
||||||||
|
The Progressive Corp.
|
27,228
|
2,104,725
|
1.79
|
%
|
||||||||
|
Wells Fargo & Co.
|
41,424
|
1,203,367
|
1.02
|
%
|
||||||||
|
|
11,921,412
|
10.13
|
%
|
|||||||||
|
Health Care – 2.91%
|
||||||||||||
|
Bristol-Myers Squibb Co.
|
24,123
|
1,466,920
|
1.25
|
%
|
||||||||
|
Pfizer, Inc.
|
50,982
|
1,955,669
|
1.66
|
%
|
||||||||
|
|
3,422,589
|
2.91
|
%
|
|||||||||
|
Industrials – 5.74%
|
||||||||||||
|
FedEx Corp.
|
14,232
|
1,804,191
|
1.53
|
%
|
||||||||
|
General Dynamics Corp.
|
10,341
|
1,350,741
|
1.15
|
%
|
||||||||
The accompanying notes are an integral part of these financial statements.
|
HENNESSYFUNDS.COM
|
6
|
SCHEDULE OF INVESTMENTS
|
|
COMMON STOCKS
|
Number
|
% of
|
||||||||||
|
|
of Shares
|
Value
|
Net Assets
|
|||||||||
|
Industrials (Continued)
|
||||||||||||
|
Norfolk Southern Corp.
|
14,234
|
$
|
2,435,437
|
2.07
|
%
|
|||||||
|
Southwest Airlines Co.
|
37,328
|
1,166,500
|
0.99
|
%
|
||||||||
|
|
6,756,869
|
5.74
|
%
|
|||||||||
|
Information Technology – 11.56%
|
||||||||||||
|
Apple, Inc.
|
19,392
|
5,697,370
|
4.84
|
%
|
||||||||
|
Cisco Systems, Inc.
|
47,056
|
1,994,233
|
1.70
|
%
|
||||||||
|
Citrix Systems, Inc.
|
18,825
|
2,729,813
|
2.32
|
%
|
||||||||
|
Visa, Inc., Class A
|
17,784
|
3,178,357
|
2.70
|
%
|
||||||||
|
|
13,599,773
|
11.56
|
%
|
|||||||||
|
Materials – 5.38%
|
||||||||||||
|
Air Products and Chemicals, Inc.
|
10,376
|
2,340,618
|
1.99
|
%
|
||||||||
|
Martin Marietta Materials, Inc.
|
10,427
|
1,983,528
|
1.69
|
%
|
||||||||
|
NewMarket Corp.
|
4,872
|
2,004,536
|
1.70
|
%
|
||||||||
|
|
6,328,682
|
5.38
|
%
|
|||||||||
|
Total Common Stocks
|
||||||||||||
|
(Cost $54,672,359)
|
66,506,934
|
56.52
|
%
|
|||||||||
|
|
||||||||||||
|
PREFERRED STOCKS – 2.74%
|
||||||||||||
|
Communication Services – 0.07%
|
||||||||||||
|
AT&T, Inc., 5.625%, 08/01/2067
|
3,090
|
81,607
|
0.07
|
%
|
||||||||
|
Consumer Staples – 0.12%
|
||||||||||||
|
CHS, Inc., Series 4, 7.500%, Perpetual
|
5,280
|
138,917
|
0.12
|
%
|
||||||||
|
Energy – 0.08%
|
||||||||||||
|
Enbridge, Inc., Series B, 6.375% to 04/15/2023 then
|
||||||||||||
|
3 Month LIBOR USD + 3.593%, 04/15/2078 (b)(f)
|
4,020
|
94,510
|
0.08
|
%
|
||||||||
|
Financials – 2.47%
|
||||||||||||
|
American International Group, Inc., Series A, 5.850%, Perpetual
|
2,995
|
77,571
|
0.07
|
%
|
||||||||
|
Arch Capital Group Ltd., Series F, 5.450%, Perpetual (b)
|
3,465
|
86,348
|
0.07
|
%
|
||||||||
|
Axis Capital Holdings Ltd., Series E, 5.500%, Perpetual (b)
|
1,845
|
45,424
|
0.04
|
%
|
||||||||
|
BancorpSouth Bank, Series A, 5.500%, Perpetual
|
1,155
|
29,129
|
0.02
|
%
|
||||||||
|
Bank of America Corp.
|
||||||||||||
|
Series GG, 6.000%, Perpetual
|
2,455
|
66,580
|
0.06
|
%
|
||||||||
|
Series CC, 6.200%, Perpetual
|
1,645
|
42,935
|
0.04
|
%
|
||||||||
|
Capital One Financial Corp.
|
||||||||||||
|
Series J, 4.800%, Perpetual
|
1,830
|
40,461
|
0.04
|
%
|
||||||||
|
Series I, 5.000%, Perpetual
|
3,650
|
84,680
|
0.07
|
%
|
||||||||
|
Series H, 6.000%, Perpetual
|
1,595
|
41,741
|
0.04
|
%
|
||||||||
The accompanying notes are an integral part of these financial statements.
|
HENNESSY FUNDS
|
1-800-966-4354
|
7
|
PREFERRED STOCKS
|
Number
|
% of
|
||||||||||
|
|
of Shares
|
Value
|
Net Assets
|
|||||||||
|
Financials (Continued)
|
||||||||||||
|
Citigroup, Inc.
|
||||||||||||
|
Series K, 6.875% to 11/15/2023 then
|
||||||||||||
|
3 Month LIBOR USD + 4.130%, Perpetual (f)
|
1,645
|
$
|
45,007
|
0.04
|
%
|
|||||||
|
Series S, 6.300%, Perpetual
|
2,590
|
66,149
|
0.06
|
%
|
||||||||
|
Citizens Financial Group, Inc., Series D, 6.350% to 04/06/2024
|
||||||||||||
|
then 3 Month LIBOR USD + 3.642%, Perpetual (f)
|
2,075
|
52,788
|
0.04
|
%
|
||||||||
|
Equitable Holdings, Inc., Series A, 5.250%, Perpetual
|
2,480
|
59,818
|
0.05
|
%
|
||||||||
|
Fifth Third Bancorp, Series K, 4.950%, Perpetual
|
3,200
|
77,120
|
0.07
|
%
|
||||||||
|
First Citizens BancShares, Inc., Series A, 5.375%, Perpetual
|
3,470
|
87,409
|
0.07
|
%
|
||||||||
|
First Republic Bank, Series G, 5.500%, Perpetual
|
2,510
|
64,582
|
0.05
|
%
|
||||||||
|
Hartford Financial Services Group, Inc., Series G, 6.000%, Perpetual
|
2,940
|
78,469
|
0.07
|
%
|
||||||||
|
Huntington Bancshares, Inc., Series D, 6.250%, Perpetual
|
4,335
|
111,366
|
0.09
|
%
|
||||||||
|
IBERIABANK Corp.
|
||||||||||||
|
Series D, 6.100% to 05/01/2024 then
|
||||||||||||
|
3 Month LIBOR USD + 3.859%, Perpetual (f)
|
1,185
|
25,561
|
0.02
|
%
|
||||||||
|
Series B, 6.625% to 08/01/2025 then
|
||||||||||||
|
3 Month LIBOR USD + 4.262%, Perpetual (f)
|
1,920
|
46,541
|
0.04
|
%
|
||||||||
|
JPMorgan Chase & Co., Series GG, 4.750%, Perpetual
|
3,365
|
84,798
|
0.07
|
%
|
||||||||
|
KeyCorp
|
||||||||||||
|
Series F, 5.650%, Perpetual
|
1,455
|
37,277
|
0.03
|
%
|
||||||||
|
Series E, 6.125% to 12/15/2026 then
|
||||||||||||
|
3 Month LIBOR USD + 3.892%, Perpetual (f)
|
2,995
|
85,118
|
0.07
|
%
|
||||||||
|
Legg Mason, Inc., 5.450%, 09/15/2056
|
1,570
|
38,575
|
0.03
|
%
|
||||||||
|
MetLife, Inc., Series E, 5.625%, Perpetual
|
3,165
|
82,923
|
0.07
|
%
|
||||||||
|
Morgan Stanley, Series I, 6.375% to 10/15/2024 then
|
||||||||||||
|
3 Month LIBOR USD + 3.708%, Perpetual (f)
|
5,420
|
145,527
|
0.12
|
%
|
||||||||
|
Northern Trust Corp., Series E, 4.700%, Perpetual
|
985
|
24,684
|
0.02
|
%
|
||||||||
|
Prudential Financial, Inc., 5.625%, 08/15/2058
|
1,415
|
37,101
|
0.03
|
%
|
||||||||
|
Regions Financial Corp.
|
||||||||||||
|
Series C, 5.700% to 08/15/2029 then
|
||||||||||||
|
3 Month LIBOR USD + 3.148%, Perpetual (f)
|
1,840
|
48,778
|
0.04
|
%
|
||||||||
|
Series B, 6.375% to 09/15/2024 then
|
||||||||||||
|
3 Month LIBOR USD + 3.536%, Perpetual (f)
|
3,270
|
88,552
|
0.08
|
%
|
||||||||
|
State Street Corp., Series D, 5.900% to 03/15/2024 then
|
||||||||||||
|
3 Month LIBOR USD + 3.108%, Perpetual (f)
|
4,360
|
113,970
|
0.10
|
%
|
||||||||
|
SVB Financial Group, Series A, 5.250%, Perpetual
|
2,415
|
59,940
|
0.05
|
%
|
||||||||
|
Synchrony Financial, Series A, 5.625%, Perpetual
|
3,890
|
81,068
|
0.07
|
%
|
||||||||
|
Synovus Financial Corp.
|
||||||||||||
|
Series E, 5.875% to 07/01/2024 then
|
||||||||||||
|
5 Year CMT Rate + 4.127%, Perpetual (f)
|
1,615
|
34,771
|
0.03
|
%
|
||||||||
|
Series D, 6.300% to 06/21/2023 then
|
||||||||||||
|
3 Month LIBOR USD + 3.352%, Perpetual (f)
|
1,520
|
34,580
|
0.03
|
%
|
||||||||
The accompanying notes are an integral part of these financial statements.
|
HENNESSYFUNDS.COM
|
8
|
SCHEDULE OF INVESTMENTS
|
|
PREFERRED STOCKS
|
Number
|
% of
|
||||||||||
|
|
of Shares
|
Value
|
Net Assets
|
|||||||||
|
Financials (Continued)
|
||||||||||||
|
TCF Financial Corp., Series C, 5.700%, Perpetual
|
1,510
|
$
|
38,037
|
0.03
|
%
|
|||||||
|
The Allstate Corp.
|
||||||||||||
|
Series H, 5.100%, Perpetual
|
2,305
|
59,008
|
0.05
|
%
|
||||||||
|
Series G, 5.625%, Perpetual
|
3,375
|
91,125
|
0.08
|
%
|
||||||||
|
The Goldman Sachs Group, Inc.
|
||||||||||||
|
Series K, 6.375% to 05/10/2024 then
|
||||||||||||
|
3 Month LIBOR USD + 3.550%, Perpetual (f)
|
1,930
|
49,813
|
0.04
|
%
|
||||||||
|
Series N, 6.300%, Perpetual
|
2,015
|
53,115
|
0.05
|
%
|
||||||||
|
Truist Financial Corp., Series F, 5.200%, Perpetual
|
3,215
|
81,018
|
0.07
|
%
|
||||||||
|
U.S. Bancorp
|
||||||||||||
|
Series F, 6.500% to 01/15/2022 then
|
||||||||||||
|
3 Month LIBOR USD + 4.468%, Perpetual (d)(f)
|
2,090
|
56,451
|
0.05
|
%
|
||||||||
|
Series B, 3.500% to 06/10/2020 then
|
||||||||||||
|
3 Month LIBOR USD + 0.600%, Perpetual (f)
|
2,980
|
58,944
|
0.05
|
%
|
||||||||
|
Webster Financial Corp., Series F, 5.250%, Perpetual
|
800
|
19,776
|
0.02
|
%
|
||||||||
|
Wells Fargo & Co.
|
||||||||||||
|
Series Z, 4.750%, Perpetual
|
3,490
|
83,341
|
0.07
|
%
|
||||||||
|
Series X, 5.500%, Perpetual
|
3,265
|
83,747
|
0.07
|
%
|
||||||||
|
|
2,901,716
|
2.47
|
%
|
|||||||||
|
Total Preferred Stocks
|
||||||||||||
|
(Cost $3,217,636)
|
3,216,750
|
2.74
|
%
|
|||||||||
|
|
||||||||||||
|
REITS – 1.58%
|
||||||||||||
|
Financials – 1.58%
|
||||||||||||
|
Annaly Capital Management, Inc., Series F, 6.950% to 09/30/2022
|
||||||||||||
|
then 3 Month LIBOR USD + 4.993%, Perpetual (f)
|
2,720
|
61,254
|
0.05
|
%
|
||||||||
|
Apollo Commercial Real Estate Finance, Inc.
|
4,130
|
33,660
|
0.03
|
%
|
||||||||
|
Chimera Investment Corp.
|
2,930
|
22,766
|
0.02
|
%
|
||||||||
|
Chimera Investment Corp.
|
||||||||||||
|
Series A, 8.000%, Perpetual
|
2,635
|
51,277
|
0.04
|
%
|
||||||||
|
Series B, 8.000% to 03/30/2024 then
|
||||||||||||
|
3 Month LIBOR USD + 5.791%, Perpetual (f)
|
1,320
|
23,390
|
0.02
|
%
|
||||||||
|
Kimco Realty Corp., Series M, 5.250%, Perpetual
|
1,835
|
41,746
|
0.03
|
%
|
||||||||
|
Monmouth Real Estate Investment Corp., Series C, 6.125%, Perpetual
|
3,195
|
78,086
|
0.07
|
%
|
||||||||
|
Starwood Property Trust, Inc.
|
2,730
|
35,326
|
0.03
|
%
|
||||||||
|
STORE Capital Corp.
|
72,725
|
1,459,591
|
1.24
|
%
|
||||||||
|
Vornado Realty Trust, Series M, 5.250%, Perpetual
|
2,565
|
57,277
|
0.05
|
%
|
||||||||
|
|
1,864,373
|
1.58
|
%
|
|||||||||
|
Total REITS
|
||||||||||||
|
(Cost $2,393,671)
|
1,864,373
|
1.58
|
%
|
|||||||||
The accompanying notes are an integral part of these financial statements.
|
HENNESSY FUNDS
|
1-800-966-4354
|
9
|
RIGHTS – 0.00%
|
Number
|
% of
|
||||||||||
|
|
of Shares
|
Value
|
Net Assets
|
|||||||||
|
Financials – 0.00%
|
||||||||||||
|
Golub Capital BDC, Inc. (Expiration: May 6, 2020) (a)
|
800
|
$
|
515
|
0.00
|
%
|
|||||||
|
|
||||||||||||
|
Total Rights
|
||||||||||||
|
(Cost $1,233)
|
515
|
0.00
|
%
|
|||||||||
|
|
||||||||||||
|
CORPORATE BONDS – 21.44%
|
||||||||||||
|
Communication Services – 0.92%
|
||||||||||||
|
AT&T, Inc., 4.250%, 03/01/2027
|
980,000
|
1,081,869
|
0.92
|
%
|
||||||||
|
Consumer Discretionary – 1.10%
|
||||||||||||
|
Alibaba Group Holding Ltd., 3.600%, 11/28/2024 (b)
|
1,000,000
|
1,081,317
|
0.92
|
%
|
||||||||
|
Starbucks Corp., 4.450%, 08/15/2049
|
175,000
|
210,075
|
0.18
|
%
|
||||||||
|
|
1,291,392
|
1.10
|
%
|
|||||||||
|
Energy – 2.59%
|
||||||||||||
|
Boardwalk Pipelines LP, 4.450%, 07/15/2027
|
1,200,000
|
1,035,650
|
0.88
|
%
|
||||||||
|
Canadian Natural Resources Ltd., 3.900%, 02/01/2025 (b)
|
1,000,000
|
955,281
|
0.81
|
%
|
||||||||
|
Husky Energy, Inc., 4.000%, 04/15/2024 (b)
|
750,000
|
692,114
|
0.59
|
%
|
||||||||
|
Ovintiv, Inc., 3.900%, 11/15/2021
|
400,000
|
363,449
|
0.31
|
%
|
||||||||
|
|
3,046,494
|
2.59
|
%
|
|||||||||
|
Financials – 11.47%
|
||||||||||||
|
Aflac, Inc., 3.600%, 04/01/2030
|
300,000
|
337,870
|
0.29
|
%
|
||||||||
|
American International Group, Inc., 4.125%, 02/15/2024
|
1,000,000
|
1,083,535
|
0.92
|
%
|
||||||||
|
Capital One Financial Corp., 4.750%, 07/15/2021
|
500,000
|
516,434
|
0.44
|
%
|
||||||||
|
Comerica Bank, 2.500%, 07/23/2024
|
700,000
|
712,605
|
0.60
|
%
|
||||||||
|
Dell International LLC / EMC Corp., 5.450%, 06/15/2023 (e)
|
1,220,000
|
1,292,457
|
1.10
|
%
|
||||||||
|
Discover Financial Services, 5.200%, 04/27/2022
|
900,000
|
931,641
|
0.79
|
%
|
||||||||
|
General Motors Financial Co, Inc., 3.700%, 05/09/2023
|
1,075,000
|
1,032,580
|
0.88
|
%
|
||||||||
|
Huntington Bancshares, Inc.
|
||||||||||||
|
2.550%, 02/04/2030
|
525,000
|
507,988
|
0.43
|
%
|
||||||||
|
4.000%, 05/15/2025
|
765,000
|
833,242
|
0.71
|
%
|
||||||||
|
Morgan Stanley, 5.500%, 07/28/2021
|
400,000
|
419,782
|
0.36
|
%
|
||||||||
|
Prudential Financial, Inc., 3.878%, 03/27/2028
|
400,000
|
448,025
|
0.38
|
%
|
||||||||
|
Raymond James Financial, Inc.
|
||||||||||||
|
3.625%, 09/15/2026
|
1,500,000
|
1,571,830
|
1.33
|
%
|
||||||||
|
5.625%, 04/01/2024
|
700,000
|
773,355
|
0.66
|
%
|
||||||||
|
Synchrony Financial
|
||||||||||||
|
3.750%, 08/15/2021
|
350,000
|
351,264
|
0.30
|
%
|
||||||||
|
3.950%, 12/01/2027
|
650,000
|
600,043
|
0.51
|
%
|
||||||||
The accompanying notes are an integral part of these financial statements.
|
HENNESSYFUNDS.COM
|
10
|
SCHEDULE OF INVESTMENTS
|
|
CORPORATE BONDS
|
Number
|
% of
|
||||||||||
|
|
of Shares
|
Value
|
Net Assets
|
|||||||||
|
Financials (Continued)
|
||||||||||||
|
Synovus Financial Corp., 3.125%, 11/01/2022
|
1,300,000
|
$
|
1,299,610
|
1.10
|
%
|
|||||||
|
Willis North America, Inc., 3.600%, 05/15/2024
|
750,000
|
789,714
|
0.67
|
%
|
||||||||
|
|
13,501,975
|
11.47
|
%
|
|||||||||
|
Health Care – 2.25%
|
||||||||||||
|
Bristol-Myers Squibb Co., 3.625%, 05/15/2024 (e)
|
1,000,000
|
1,101,603
|
0.93
|
%
|
||||||||
|
Edwards Lifesciences Corp., 4.300%, 06/15/2028
|
700,000
|
797,528
|
0.68
|
%
|
||||||||
|
Express Scripts Holding Co., 3.500%, 06/15/2024
|
700,000
|
749,350
|
0.64
|
%
|
||||||||
|
|
2,648,481
|
2.25
|
%
|
|||||||||
|
Information Technology – 1.59%
|
||||||||||||
|
Autodesk, Inc., 2.850%, 01/15/2030
|
675,000
|
710,151
|
0.61
|
%
|
||||||||
|
Corning, Inc., 6.850%, 03/01/2029
|
275,000
|
355,428
|
0.30
|
%
|
||||||||
|
PayPal Holdings, Inc., 2.850%, 10/01/2029
|
750,000
|
800,677
|
0.68
|
%
|
||||||||
|
|
1,866,256
|
1.59
|
%
|
|||||||||
|
Materials – 1.52%
|
||||||||||||
|
AngloGold Ashanti Holdings PLC, 5.125%, 08/01/2022 (b)
|
1,000,000
|
1,036,094
|
0.88
|
%
|
||||||||
|
Goldcorp, Inc., 3.625%, 06/09/2021
|
750,000
|
755,220
|
0.64
|
%
|
||||||||
|
|
1,791,314
|
1.52
|
%
|
|||||||||
|
Total Corporate Bonds
|
||||||||||||
|
(Cost $24,651,808)
|
25,227,781
|
21.44
|
%
|
|||||||||
|
|
||||||||||||
|
MORTGAGE-BACKED SECURITIES – 7.50%
|
||||||||||||
|
Fannie Mae Pool
|
||||||||||||
|
3.000%, 10/01/2043
|
1,930,960
|
2,065,838
|
1.75
|
%
|
||||||||
|
3.500%, 01/01/2042
|
425,258
|
459,542
|
0.39
|
%
|
||||||||
|
4.000%, 10/01/2041
|
416,081
|
453,920
|
0.39
|
%
|
||||||||
|
4.000%, 12/01/2041
|
405,607
|
444,272
|
0.38
|
%
|
||||||||
|
4.500%, 08/01/2020
|
1,893
|
1,999
|
0.00
|
%
|
||||||||
|
6.000%, 10/01/2037
|
122,682
|
141,509
|
0.12
|
%
|
||||||||
|
Fannie Mae REMICS
|
||||||||||||
|
Series 2013-52, 1.250%, 06/25/2043
|
120,918
|
121,848
|
0.10
|
%
|
||||||||
|
Series 2012-22, 2.000%, 11/25/2040
|
91,710
|
93,874
|
0.08
|
%
|
||||||||
|
Series 2012-16, 2.000%, 11/25/2041
|
89,342
|
92,320
|
0.08
|
%
|
||||||||
|
Series 2010-134, 2.250%, 03/25/2039
|
62,501
|
63,403
|
0.05
|
%
|
||||||||
|
Freddie Mac Gold Pool
|
||||||||||||
|
3.000%, 05/01/2042
|
770,463
|
824,036
|
0.70
|
%
|
||||||||
|
3.000%, 09/01/2042
|
1,450,408
|
1,550,881
|
1.32
|
%
|
||||||||
|
3.500%, 01/01/2048
|
1,373,266
|
1,468,870
|
1.25
|
%
|
||||||||
|
5.000%, 05/01/2020
|
54
|
57
|
0.00
|
%
|
||||||||
|
5.500%, 04/01/2037
|
56,582
|
64,737
|
0.05
|
%
|
||||||||
The accompanying notes are an integral part of these financial statements.
|
HENNESSY FUNDS
|
1-800-966-4354
|
11
|
MORTGAGE-BACKED SECURITIES
|
Number
|
% of
|
||||||||||
|
|
of Shares
|
Value
|
Net Assets
|
|||||||||
|
Freddie Mac REMICS
|
||||||||||||
|
Series 4146, 1.500%, 10/15/2042
|
50,580
|
$
|
50,778
|
0.04
|
%
|
|||||||
|
Series 4309, 2.000%, 10/15/2043
|
73,252
|
75,341
|
0.07
|
%
|
||||||||
|
Series 3928, 2.500%, 08/15/2040
|
140,671
|
143,911
|
0.12
|
%
|
||||||||
|
Series 3870, 2.750%, 01/15/2041
|
52,068
|
54,574
|
0.05
|
%
|
||||||||
|
Series 4016, 3.000%, 09/15/2039
|
232,923
|
235,885
|
0.20
|
%
|
||||||||
|
Series 4322, 3.000%, 05/15/2043
|
210,857
|
223,085
|
0.19
|
%
|
||||||||
|
Government National Mortgage Association,
|
||||||||||||
|
Series 2013-24, 1.750%, 02/16/2043
|
193,006
|
196,726
|
0.17
|
%
|
||||||||
|
|
||||||||||||
|
Total Mortgage-Backed Securities
|
||||||||||||
|
(Cost $8,322,355)
|
8,827,406
|
7.50
|
%
|
|||||||||
|
|
||||||||||||
|
U.S. GOVERNMENT AGENCY ISSUES – 0.43%
|
||||||||||||
|
U.S. Government Agency Issues – 0.43%
|
||||||||||||
|
Fannie Mae, 1.500%, 08/10/2021
|
500,000
|
501,569
|
0.43
|
%
|
||||||||
|
|
||||||||||||
|
Total U.S. Government Agency Issues
|
||||||||||||
|
(Cost $500,000)
|
501,569
|
0.43
|
%
|
|||||||||
|
|
||||||||||||
|
U.S. TREASURY OBLIGATIONS – 6.66%
|
||||||||||||
|
U.S. Treasury Notes – 6.66%
|
||||||||||||
|
U.S. Treasury Notes
|
||||||||||||
|
1.625%, 11/15/2022
|
500,000
|
517,686
|
0.44
|
%
|
||||||||
|
1.750%, 05/15/2023
|
1,250,000
|
1,306,787
|
1.11
|
%
|
||||||||
|
1.875%, 07/31/2026
|
1,775,000
|
1,928,232
|
1.64
|
%
|
||||||||
|
2.625%, 11/15/2020
|
750,000
|
760,181
|
0.64
|
%
|
||||||||
|
2.750%, 02/15/2024
|
1,575,000
|
1,720,441
|
1.46
|
%
|
||||||||
|
3.000%, 10/31/2025
|
450,000
|
513,228
|
0.44
|
%
|
||||||||
|
3.125%, 11/15/2028
|
900,000
|
1,091,039
|
0.93
|
%
|
||||||||
|
|
7,837,594
|
6.66
|
%
|
|||||||||
|
Total U.S. Treasury Obligations
|
||||||||||||
|
(Cost $7,400,498)
|
7,837,594
|
6.66
|
%
|
|||||||||
The accompanying notes are an integral part of these financial statements.
|
HENNESSYFUNDS.COM
|
12
|
SCHEDULE OF INVESTMENTS
|
|
INVESTMENT COMPANIES (EXCLUDING
|
Number
|
% of
|
||||||||||
|
MONEY MARKET FUNDS) – 0.75%
|
of Shares
|
Value
|
Net Assets
|
|||||||||
|
Financials – 0.46%
|
||||||||||||
|
Apollo Investment Corp.
|
4,375
|
$
|
38,544
|
0.03
|
%
|
|||||||
|
Ares Capital Corp.
|
3,345
|
42,950
|
0.04
|
%
|
||||||||
|
Bain Capital Specialty Finance, Inc.
|
3,380
|
34,341
|
0.03
|
%
|
||||||||
|
BlackRock TCP Capital Corp.
|
4,790
|
41,529
|
0.04
|
%
|
||||||||
|
FS Investment Corp.
|
12,055
|
41,469
|
0.03
|
%
|
||||||||
|
Golub Capital BDC, Inc.
|
3,200
|
32,832
|
0.03
|
%
|
||||||||
|
Hercules Capital, Inc.
|
4,625
|
47,452
|
0.04
|
%
|
||||||||
|
Monroe Capital Corp.
|
6,150
|
49,508
|
0.04
|
%
|
||||||||
|
New Mountain Finance Corp.
|
4,755
|
36,376
|
0.03
|
%
|
||||||||
|
Oaktree Specialty Lending Corp.
|
11,905
|
47,739
|
0.04
|
%
|
||||||||
|
TCG BDC, Inc.
|
5,235
|
41,304
|
0.03
|
%
|
||||||||
|
TPG Specialty Lending, Inc.
|
2,650
|
43,619
|
0.04
|
%
|
||||||||
|
TriplePoint Venture Growth BDC Corp.
|
5,675
|
45,627
|
0.04
|
%
|
||||||||
|
|
543,290
|
0.46
|
%
|
|||||||||
|
Other Investment Companies – 0.29%
|
||||||||||||
|
Vanguard High-Yield Corporate Fund
|
62,348
|
339,171
|
0.29
|
%
|
||||||||
|
|
||||||||||||
|
Total Investment Companies (Excluding
|
||||||||||||
|
Money Market Funds)
|
||||||||||||
|
(Cost $1,248,904)
|
882,461
|
0.75
|
%
|
|||||||||
The accompanying notes are an integral part of these financial statements.
|
HENNESSY FUNDS
|
1-800-966-4354
|
13
|
SHORT-TERM INVESTMENTS – 1.71%
|
Number
|
% of
|
||||||||||
|
|
of Shares
|
Value
|
Net Assets
|
|||||||||
|
Money Market Funds – 1.71%
|
||||||||||||
|
First American Government Obligations Fund,
|
||||||||||||
|
Institutional Class, 0.25% (c)
|
2,014,732
|
$
|
2,014,732
|
1.71
|
%
|
|||||||
|
|
||||||||||||
|
Total Short-Term Investments
|
||||||||||||
|
(Cost $2,014,732)
|
2,014,732
|
1.71
|
%
|
|||||||||
|
|
||||||||||||
|
Total Investments
|
||||||||||||
|
(Cost $104,423,196) – 99.33%
|
116,880,115
|
99.33
|
%
|
|||||||||
|
Other Assets in Excess of Liabilities – 0.67%
|
790,643
|
0.67
|
%
|
|||||||||
|
|
||||||||||||
|
TOTAL NET ASSETS – 100.00%
|
$
|
117,670,758
|
100.00
|
%
|
||||||||
Percentages are stated as a percent of net assets.
ADR – American Depositary Receipt
PLC – Public Limited Company
REIT – Real Estate Investment Trust
|
(a)
|
Non-income-producing security.
|
|
(b)
|
U.S.-traded security of a foreign corporation.
|
|
(c)
|
The rate listed is the fund’s seven-day yield as of April 30, 2020.
|
|
(d)
|
Investment in affiliated security for the period from November 1, 2019, through March 30, 2020. Quasar Distributors, LLC, which serves as the Fund’s distributor, was a subsidiary of U.S. Bancorp Fund
Services, LLC through March 30, 2020. Details of transactions with this affiliated company for the period November 1, 2019, through March 30, 2020, are as follows:
|
|
Preferred Stocks
|
|||||
|
U.S. Bancorp
|
|||||
|
Beginning Cost – November 1, 2019
|
$
|
79,260
|
|||
|
Purchase Cost
|
$
|
9,634
|
|||
|
Sales Cost
|
$
|
(28,766
|
)
|
||
|
Ending Cost – March 30, 2020
|
$
|
60,128
|
|||
|
Dividend Income
|
$
|
2,110
|
|||
|
Net Change in Unrealized Appreciation/Depreciation
|
$
|
(1,592
|
)
|
||
|
Realized Gain/Loss
|
$
|
(3,290
|
)
|
||
|
Shares
|
2,090
|
||||
|
Market Value – March 30, 2020
|
$
|
54,653
|
|||
|
(e)
|
Rule 144A security. Security is exempt from registration pursuant to Rule 144A under the Securities Act of 1933, as amended. Rule 144A securities may be resold in transactions exempt from registration to
qualified institutional investors. As of April 30, 2020, the market value of this security totaled $2,394,060 which represents 2.03% of net assets.
|
|
(f)
|
Variable rate security; rate disclosed is the rate as of April 30, 2020.
|
The accompanying notes are an integral part of these financial statements.
|
HENNESSYFUNDS.COM
|
14
|
SCHEDULE OF INVESTMENTS
|
Summary of Fair Value Exposure as of April 30, 2020
The following is a summary of the inputs used to value the Fund’s net assets as of April 30, 2020 (see Note 3 in the accompanying Notes to the Financial Statements):
|
Common Stocks
|
Level 1
|
Level 2
|
Level 3
|
Total
|
||||||||||||
|
Communication Services
|
$
|
7,625,683
|
$
|
—
|
$
|
—
|
$
|
7,625,683
|
||||||||
|
Consumer Discretionary
|
9,950,631
|
—
|
—
|
9,950,631
|
||||||||||||
|
Consumer Staples
|
4,977,816
|
—
|
—
|
4,977,816
|
||||||||||||
|
Energy
|
1,923,479
|
—
|
—
|
1,923,479
|
||||||||||||
|
Financials
|
11,921,412
|
—
|
—
|
11,921,412
|
||||||||||||
|
Health Care
|
3,422,589
|
—
|
—
|
3,422,589
|
||||||||||||
|
Industrials
|
6,756,869
|
—
|
—
|
6,756,869
|
||||||||||||
|
Information Technology
|
13,599,773
|
—
|
—
|
13,599,773
|
||||||||||||
|
Materials
|
6,328,682
|
—
|
—
|
6,328,682
|
||||||||||||
|
Total Common Stocks
|
$
|
66,506,934
|
$
|
—
|
$
|
—
|
$
|
66,506,934
|
||||||||
|
Preferred Stocks
|
||||||||||||||||
|
Communication Services
|
$
|
81,607
|
$
|
—
|
$
|
—
|
$
|
81,607
|
||||||||
|
Consumer Staples
|
138,917
|
—
|
—
|
138,917
|
||||||||||||
|
Energy
|
94,510
|
—
|
—
|
94,510
|
||||||||||||
|
Financials
|
2,901,716
|
—
|
—
|
2,901,716
|
||||||||||||
|
Total Preferred Stocks
|
$
|
3,216,750
|
$
|
—
|
$
|
—
|
$
|
3,216,750
|
||||||||
|
REITS
|
||||||||||||||||
|
Financials
|
$
|
1,864,373
|
$
|
—
|
$
|
—
|
$
|
1,864,373
|
||||||||
|
Total REITS
|
$
|
1,864,373
|
$
|
—
|
$
|
—
|
$
|
1,864,373
|
||||||||
|
Rights
|
||||||||||||||||
|
Financials
|
$
|
515
|
$
|
—
|
$
|
—
|
$
|
515
|
||||||||
|
Total Rights
|
$
|
515
|
$
|
—
|
$
|
—
|
$
|
515
|
||||||||
|
Corporate Bonds
|
||||||||||||||||
|
Communication Services
|
$
|
—
|
$
|
1,081,869
|
$
|
—
|
$
|
1,081,869
|
||||||||
|
Consumer Discretionary
|
—
|
1,291,392
|
—
|
1,291,392
|
||||||||||||
|
Energy
|
—
|
3,046,494
|
—
|
3,046,494
|
||||||||||||
|
Financials
|
—
|
13,501,975
|
—
|
13,501,975
|
||||||||||||
|
Health Care
|
—
|
2,648,481
|
—
|
2,648,481
|
||||||||||||
|
Information Technology
|
—
|
1,866,256
|
—
|
1,866,256
|
||||||||||||
|
Materials
|
—
|
1,791,314
|
—
|
1,791,314
|
||||||||||||
|
Total Corporate Bonds
|
$
|
—
|
$
|
25,227,781
|
$
|
—
|
$
|
25,227,781
|
||||||||
|
Mortgage-Backed Securities
|
$
|
—
|
$
|
8,827,406
|
$
|
—
|
$
|
8,827,406
|
||||||||
|
U.S. Government Agency Issues
|
$
|
—
|
$
|
501,569
|
$
|
—
|
$
|
501,569
|
||||||||
|
U.S. Treasury Obligations
|
||||||||||||||||
|
U.S. Treasury Notes
|
$
|
—
|
$
|
7,837,594
|
$
|
—
|
$
|
7,837,594
|
||||||||
|
Total U.S. Treasury Obligations
|
$
|
—
|
$
|
7,837,594
|
$
|
—
|
$
|
7,837,594
|
||||||||
|
Investment Companies (Excluding
|
||||||||||||||||
|
Money Market Funds)
|
||||||||||||||||
|
Financials
|
$
|
543,290
|
$
|
—
|
$
|
—
|
$
|
543,290
|
||||||||
|
Other Investment Companies
|
339,171
|
—
|
—
|
339,171
|
||||||||||||
|
Total Investment Companies (Excluding
|
||||||||||||||||
|
Money Market Funds)
|
$
|
882,461
|
$
|
—
|
$
|
—
|
$
|
882,461
|
||||||||
|
Short-Term Investments
|
||||||||||||||||
|
Money Market Funds
|
$
|
2,014,732
|
$
|
—
|
$
|
—
|
$
|
2,014,732
|
||||||||
|
Total Short-Term Investments
|
$
|
2,014,732
|
$
|
—
|
$
|
—
|
$
|
2,014,732
|
||||||||
|
Total Investments
|
$
|
74,485,765
|
$
|
42,394,350
|
$
|
—
|
$
|
116,880,115
|
||||||||
The accompanying notes are an integral part of these financial statements.
|
HENNESSY FUNDS
|
1-800-966-4354
|
15
Financial Statements
|
Statement of Assets and Liabilities as of April 30, 2020 (Unaudited)
|
|
ASSETS:
|
||||
|
Investments in securities, at value (cost $104,423,196)
|
$
|
116,880,115
|
||
|
Dividends and interest receivable
|
515,459
|
|||
|
Receivable for fund shares sold
|
20,732
|
|||
|
Receivable for securities sold
|
575,426
|
|||
|
Prepaid expenses and other assets
|
23,498
|
|||
|
Total assets
|
118,015,230
|
|||
|
LIABILITIES:
|
||||
|
Payable for fund shares redeemed
|
180,182
|
|||
|
Payable to advisor
|
75,373
|
|||
|
Payable to administrator
|
20,517
|
|||
|
Payable to auditor
|
11,372
|
|||
|
Accrued distribution fees
|
7,901
|
|||
|
Accrued service fees
|
4,565
|
|||
|
Accrued trustees fees
|
5,333
|
|||
|
Accrued expenses and other payables
|
39,229
|
|||
|
Total liabilities
|
344,472
|
|||
|
NET ASSETS
|
$
|
117,670,758
|
||
|
NET ASSETS CONSISTS OF:
|
||||
|
Capital stock
|
$
|
99,351,527
|
||
|
Total distributable earnings
|
18,319,231
|
|||
|
Total net assets
|
$
|
117,670,758
|
||
|
NET ASSETS:
|
||||
|
Investor Class
|
||||
|
Shares authorized (no par value)
|
Unlimited
|
|||
|
Net assets applicable to outstanding shares
|
$
|
56,214,817
|
||
|
Shares issued and outstanding
|
4,071,181
|
|||
|
Net asset value, offering price, and redemption price per share
|
$
|
13.81
|
||
|
Institutional Class
|
||||
|
Shares authorized (no par value)
|
Unlimited
|
|||
|
Net assets applicable to outstanding shares
|
$
|
61,455,941
|
||
|
Shares issued and outstanding
|
4,731,738
|
|||
|
Net asset value, offering price, and redemption price per share
|
$
|
12.99
|
||
The accompanying notes are an integral part of these financial statements.
|
HENNESSYFUNDS.COM
|
16
|
STATEMENT OF ASSETS AND LIABILITIES/STATEMENT OF OPERATIONS
|
Financial Statements
|
Statement of Operations for the six months ended April 30, 2020 (Unaudited)
|
|
INVESTMENT INCOME:
|
||||
|
Dividend income from unaffiliated securities(1)
|
$
|
1,182,491
|
||
|
Dividend income from affiliated securities
|
2,110
|
|||
|
Interest income
|
792,354
|
|||
|
Total investment income
|
1,976,955
|
|||
|
EXPENSES:
|
||||
|
Investment advisory fees (See Note 5)
|
567,340
|
|||
|
Sub-transfer agent expenses – Investor Class (See Note 5)
|
80,215
|
|||
|
Sub-transfer agent expenses – Institutional Class (See Note 5)
|
38,855
|
|||
|
Administration, accounting, custody, and transfer agent fees (See Note 5)
|
77,261
|
|||
|
Distribution fees – Investor Class (See Note 5)
|
52,441
|
|||
|
Service fees – Investor Class (See Note 5)
|
34,961
|
|||
|
Federal and state registration fees
|
20,371
|
|||
|
Compliance expense (See Note 5)
|
13,462
|
|||
|
Audit fees
|
11,375
|
|||
|
Trustees’ fees and expenses
|
9,012
|
|||
|
Reports to shareholders
|
9,009
|
|||
|
Legal fees
|
912
|
|||
|
Interest expense (See Note 7)
|
80
|
|||
|
Other expenses
|
9,373
|
|||
|
Total expenses
|
924,667
|
|||
|
NET INVESTMENT INCOME
|
$
|
1,052,288
|
||
|
REALIZED AND UNREALIZED GAINS (LOSSES):
|
||||
|
Net realized gain (loss) on investments:
|
||||
|
Unaffiliated investments
|
$
|
5,747,135
|
||
|
Affiliated investments
|
(3,290
|
)
|
||
|
Net change in unrealized appreciation/depreciation on investments:
|
||||
|
Unaffiliated investments
|
(13,993,847
|
)
|
||
|
Affiliated investments
|
(1,592
|
)
|
||
|
Net loss on investments
|
(8,251,594
|
)
|
||
|
NET DECREASE IN NET ASSETS RESULTING FROM OPERATIONS
|
$
|
(7,199,306
|
)
|
|
|
(1)
|
Net of foreign taxes withheld of $11,436.
|
The accompanying notes are an integral part of these financial statements.
|
HENNESSY FUNDS
|
1-800-966-4354
|
17
(This Page Intentionally Left Blank.)
|
HENNESSYFUNDS.COM
|
18
|
STATEMENTS OF CHANGES IN NET ASSETS
|
Financial Statements
|
Statements of Changes in Net Assets
|
|
Six Months Ended
|
||||||||
|
April 30, 2020
|
Year Ended
|
|||||||
|
(Unaudited)
|
October 31, 2019
|
|||||||
|
OPERATIONS:
|
||||||||
|
Net investment income
|
$
|
1,052,288
|
$
|
2,527,023
|
||||
|
Net realized gain on investments
|
5,743,845
|
12,163,724
|
||||||
|
Net change in unrealized
|
||||||||
|
appreciation/depreciation on investments
|
(13,995,439
|
)
|
257,624
|
|||||
|
Net increase (decrease) in net assets
|
||||||||
|
resulting from operations
|
(7,199,306
|
)
|
14,948,371
|
|||||
|
DISTRIBUTIONS TO SHAREHOLDERS:
|
||||||||
|
Distributable earnings – Investor Class
|
(5,528,505
|
)
|
(9,623,337
|
)
|
||||
|
Distributable earnings – Institutional Class
|
(5,606,651
|
)
|
(8,312,271
|
)
|
||||
|
Total distributions
|
(11,135,156
|
)
|
(17,935,608
|
)
|
||||
|
CAPITAL SHARE TRANSACTIONS:
|
||||||||
|
Proceeds from shares subscribed – Investor Class
|
829,381
|
4,045,914
|
||||||
|
Proceeds from shares subscribed – Institutional Class
|
3,387,927
|
9,963,578
|
||||||
|
Dividends reinvested – Investor Class
|
5,335,026
|
9,369,182
|
||||||
|
Dividends reinvested – Institutional Class
|
4,420,347
|
6,581,032
|
||||||
|
Cost of shares redeemed – Investor Class
|
(34,620,159
|
)
|
(39,659,654
|
)
|
||||
|
Cost of shares redeemed – Institutional Class
|
(17,257,552
|
)
|
(32,586,017
|
)
|
||||
|
Net decrease in net assets derived
|
||||||||
|
from capital share transactions
|
(37,905,030
|
)
|
(42,285,965
|
)
|
||||
|
TOTAL DECREASE IN NET ASSETS
|
(56,239,492
|
)
|
(45,273,202
|
)
|
||||
|
NET ASSETS:
|
||||||||
|
Beginning of period
|
173,910,250
|
219,183,452
|
||||||
|
End of period
|
$
|
117,670,758
|
$
|
173,910,250
|
||||
|
CHANGES IN SHARES OUTSTANDING:
|
||||||||
|
Shares sold – Investor Class
|
56,336
|
268,813
|
||||||
|
Shares sold – Institutional Class
|
247,057
|
702,865
|
||||||
|
Shares issued to holders as reinvestment
|
||||||||
|
of dividends – Investor Class
|
357,711
|
647,946
|
||||||
|
Shares issued to holders as reinvestment
|
||||||||
|
of dividends – Institutional Class
|
315,489
|
481,833
|
||||||
|
Shares redeemed – Investor Class
|
(2,290,121
|
)
|
(2,637,769
|
)
|
||||
|
Shares redeemed – Institutional Class
|
(1,261,871
|
)
|
(2,309,628
|
)
|
||||
|
Net decrease in shares outstanding
|
(2,575,399
|
)
|
(2,845,940
|
)
|
||||
The accompanying notes are an integral part of these financial statements.
|
HENNESSY FUNDS
|
1-800-966-4354
|
19
Financial Statements
|
Financial Highlights
|
For an Investor Class share outstanding throughout each period
|
Six Months Ended
|
||||
|
April 30, 2020
|
||||
|
(Unaudited)
|
||||
|
PER SHARE DATA:
|
||||
|
Net asset value, beginning of period
|
$
|
15.72
|
||
|
Income from investment operations:
|
||||
|
Net investment income
|
0.10
|
(1)
|
||
|
Net realized and unrealized gains (losses) on investments
|
(0.92
|
)
|
||
|
Total from investment operations
|
(0.82
|
)
|
||
|
Less distributions:
|
||||
|
Dividends from net investment income
|
(0.09
|
)
|
||
|
Dividends from net realized gains
|
(1.00
|
)
|
||
|
Total distributions
|
(1.09
|
)
|
||
|
Net asset value, end of period
|
$
|
13.81
|
||
|
TOTAL RETURN
|
-5.70
|
%(2)
|
||
|
SUPPLEMENTAL DATA AND RATIOS:
|
||||
|
Net assets, end of period (millions)
|
$
|
56.21
|
||
|
Ratio of expenses to average net assets
|
1.49
|
%(3)
|
||
|
Ratio of net investment income to average net assets
|
1.29
|
%(3)
|
||
|
Portfolio turnover rate(4)
|
13
|
%(2)
|
||
|
(1)
|
Calculated using the average shares outstanding method.
|
|
(2)
|
Not annualized.
|
|
(3)
|
Annualized.
|
|
(4)
|
Calculated on the basis of the Fund as a whole.
|
The accompanying notes are an integral part of these financial statements.
|
HENNESSYFUNDS.COM
|
20
|
FINANCIAL HIGHLIGHTS — INVESTOR CLASS
|
|
Year Ended October 31,
|
||||||||||||||||||
|
2019
|
2018
|
2017
|
2016
|
2015
|
||||||||||||||
|
$
|
15.82
|
$
|
16.24
|
$
|
15.61
|
$
|
16.15
|
$
|
16.68
|
|||||||||
|
0.18
|
(1)
|
0.16
|
0.14
|
0.14
|
0.13
|
|||||||||||||
|
1.02
|
0.40
|
1.95
|
(0.16
|
)
|
0.11
|
|||||||||||||
|
1.20
|
0.56
|
2.09
|
(0.02
|
)
|
0.24
|
|||||||||||||
|
(0.17
|
)
|
(0.14
|
)
|
(0.12
|
)
|
(0.13
|
)
|
(0.13
|
)
|
|||||||||
|
(1.13
|
)
|
(0.84
|
)
|
(1.34
|
)
|
(0.39
|
)
|
(0.64
|
)
|
|||||||||
|
(1.30
|
)
|
(0.98
|
)
|
(1.46
|
)
|
(0.52
|
)
|
(0.77
|
)
|
|||||||||
|
$
|
15.72
|
$
|
15.82
|
$
|
16.24
|
$
|
15.61
|
$
|
16.15
|
|||||||||
|
8.39
|
%
|
3.44
|
%
|
14.16
|
%
|
-0.12
|
%
|
1.43
|
%
|
|||||||||
|
$
|
93.51
|
$
|
121.32
|
$
|
155.33
|
$
|
202.04
|
$
|
292.84
|
|||||||||
|
1.46
|
%
|
1.42
|
%
|
1.43
|
%
|
1.43
|
%
|
1.38
|
%
|
|||||||||
|
1.16
|
%
|
0.89
|
%
|
0.78
|
%
|
0.84
|
%
|
0.83
|
%
|
|||||||||
|
16
|
%
|
18
|
%
|
15
|
%
|
24
|
%
|
39
|
%
|
|||||||||
The accompanying notes are an integral part of these financial statements.
|
HENNESSY FUNDS
|
1-800-966-4354
|
21
Financial Statements
|
Financial Highlights
|
For an Institutional Class share outstanding throughout each period
|
Six Months Ended
|
||||
|
April 30, 2020
|
||||
|
(Unaudited)
|
||||
|
PER SHARE DATA:
|
||||
|
Net asset value, beginning of period
|
$
|
14.80
|
||
|
Income from investment operations:
|
||||
|
Net investment income
|
0.12
|
(1)
|
||
|
Net realized and unrealized gains (losses) on investments
|
(0.87
|
)
|
||
|
Total from investment operations
|
(0.75
|
)
|
||
|
Less distributions:
|
||||
|
Dividends from net investment income
|
(0.12
|
)
|
||
|
Dividends from net realized gains
|
(0.94
|
)
|
||
|
Total distributions
|
(1.06
|
)
|
||
|
Net asset value, end of period
|
$
|
12.99
|
||
|
TOTAL RETURN
|
-5.52
|
%(2)
|
||
|
SUPPLEMENTAL DATA AND RATIOS:
|
||||
|
Net assets, end of period (millions)
|
$
|
61.46
|
||
|
Ratio of expenses to average net assets
|
1.12
|
%(3)
|
||
|
Ratio of net investment income to average net assets
|
1.67
|
%(3)
|
||
|
Portfolio turnover rate(4)
|
13
|
%(2)
|
||
|
(1)
|
Calculated using the average shares outstanding method.
|
|
(2)
|
Not annualized.
|
|
(3)
|
Annualized.
|
|
(4)
|
Calculated on the basis of the Fund as a whole.
|
The accompanying notes are an integral part of these financial statements.
|
HENNESSYFUNDS.COM
|
22
|
FINANCIAL HIGHLIGHTS — INSTITUTIONAL CLASS
|
|
Year Ended October 31,
|
||||||||||||||||||
|
2019
|
2018
|
2017
|
2016
|
2015
|
||||||||||||||
|
$
|
14.93
|
$
|
15.34
|
$
|
14.76
|
$
|
15.28
|
$
|
15.80
|
|||||||||
|
0.22
|
(1)
|
0.19
|
0.16
|
0.18
|
0.19
|
|||||||||||||
|
0.96
|
0.39
|
1.87
|
(0.13
|
)
|
0.09
|
|||||||||||||
|
1.18
|
0.58
|
2.03
|
0.05
|
0.28
|
||||||||||||||
|
(0.24
|
)
|
(0.20
|
)
|
(0.18
|
)
|
(0.20
|
)
|
(0.19
|
)
|
|||||||||
|
(1.07
|
)
|
(0.79
|
)
|
(1.27
|
)
|
(0.37
|
)
|
(0.61
|
)
|
|||||||||
|
(1.31
|
)
|
(0.99
|
)
|
(1.45
|
)
|
(0.57
|
)
|
(0.80
|
)
|
|||||||||
|
$
|
14.80
|
$
|
14.93
|
$
|
15.34
|
$
|
14.76
|
$
|
15.28
|
|||||||||
|
8.76
|
%
|
3.86
|
%
|
14.60
|
%
|
0.30
|
%
|
1.75
|
%
|
|||||||||
|
$
|
80.40
|
$
|
97.86
|
$
|
110.74
|
$
|
129.91
|
$
|
168.84
|
|||||||||
|
1.09
|
%
|
1.02
|
%
|
1.05
|
%
|
1.03
|
%
|
1.04
|
%
|
|||||||||
|
1.53
|
%
|
1.28
|
%
|
1.16
|
%
|
1.23
|
%
|
1.18
|
%
|
|||||||||
|
16
|
%
|
18
|
%
|
15
|
%
|
24
|
%
|
39
|
%
|
|||||||||
The accompanying notes are an integral part of these financial statements.
|
HENNESSY FUNDS
|
1-800-966-4354
|
23
Financial Statements
|
Notes to the Financial Statements April 30, 2020 (Unaudited)
|
1). ORGANIZATION
The Hennessy Equity and Income Fund (the “Fund”) is a series of Hennessy Funds Trust (the “Trust”), which was organized as a Delaware statutory trust on September 17, 1992. The Fund is an open-end management
investment company registered under the Investment Company Act of 1940, as amended. The investment objective of the Fund is long-term capital growth and current income. The Fund is a diversified fund.
The Fund offers Investor Class and Institutional Class shares. Each class of shares differs principally in its respective 12b-1 distribution and service, shareholder servicing, and
sub-transfer agent expenses. There are no sales charges. Each class has identical rights to earnings, assets, and voting privileges, except for class-specific expenses and exclusive rights to vote on matters affecting only one class.
As an investment company, the Fund follows the investment company accounting and reporting guidance of the Financial Accounting Standards Board (“FASB”) Accounting Standard Codification Topic
946 “Financial Services—Investment Companies.”
2). SIGNIFICANT ACCOUNTING POLICIES
The following is a summary of significant accounting policies consistently followed by the Fund in the preparation of the financial statements. These policies conform to U.S. generally accepted accounting
principles (“GAAP”).
|
a).
|
Securities Valuation – All investments in securities are recorded at their estimated fair value, as described in Note 3.
|
|
b).
|
Federal Income Taxes – No provision for federal income taxes or excise taxes has been made because the Fund has elected to be taxed as a regulated investment company and intends to distribute
substantially all of its taxable income to its shareholders and otherwise comply with the provisions of the Internal Revenue Code of 1986, as amended, applicable to regulated investment companies. Net investment income/loss and
realized gains/losses for federal income tax purposes may differ from those reported in the financial statements because of temporary book and tax basis differences. Temporary differences are primarily the result of the treatment
of wash sales for tax reporting purposes. The Fund recognizes interest and penalties related to income tax benefits, if any, in the Statement of Operations as an income tax expense. Distributions from net realized gains for book
purposes may include short-term capital gains, which are included as ordinary income to shareholders for tax purposes. The Fund may utilize equalization accounting for tax purposes and designate earnings and profits, including net
realized gains distributed to shareholders on redemption of shares, as part of the dividends paid deduction for income tax purposes.
|
|
c).
|
Accounting for Uncertainty in Income Taxes – The Fund has accounting policies regarding recognition and measurement of tax positions taken or expected to be taken on a tax return. The tax returns of the
Fund for the prior three fiscal years are open for examination. The Fund has reviewed all open tax years in major jurisdictions and concluded that there is no impact on the Fund’s net assets and no tax liability resulting from
unrecognized tax benefits relating to uncertain income tax positions taken or expected to be taken on a tax return. The Fund’s major tax jurisdictions are U.S. federal and Delaware.
|
|
HENNESSYFUNDS.COM
|
24
|
NOTES TO THE FINANCIAL STATEMENTS
|
|
d).
|
Income and Expenses – Dividend income is recognized on the ex-dividend date or as soon as information is available to the Fund. Interest income, which includes the amortization of premium and accretion
of discount, is recognized on an accrual basis. Other non-cash dividends are recognized as investment income at the fair value of the property received. The Fund is charged for those expenses that are directly attributable to its
portfolio, such as advisory, administration, and certain shareholder service fees. Income, expenses (other than expenses attributable to a specific class), and realized and unrealized gains/losses on investments are allocated to
each class of shares based on such class’s net assets.
|
|
e).
|
Distributions to Shareholders – Dividends from net investment income for the Fund, if any, are declared and paid at the end of each calendar quarter. Distributions of net realized capital gains, if any,
are declared and paid annually, usually in December.
|
|
f).
|
Security Transactions – Investment and shareholder transactions are recorded on the trade date. The Fund determines the realized gain/loss from an investment transaction by comparing the original cost of
the security lot sold with the net sale proceeds. Discounts and premiums on securities purchased are accreted or amortized, respectively, over the life of each such security.
|
|
g).
|
Use of Estimates – The preparation of financial statements in conformity with GAAP requires management to make estimates and assumptions that affect the reported amounts of assets and liabilities and
disclosure of contingent assets and liabilities at the date of the financial statements and the reported change in net assets during the reporting period. Actual results could differ from those estimates.
|
|
h).
|
Share Valuation – The net asset value (“NAV”) per share of the Fund is calculated by dividing (i) the total value of the securities held by the Fund, plus cash and other assets, minus all liabilities
(including estimated accrued expenses) by (ii) the total number of shares outstanding for the Fund, rounded to the nearest $0.01. The Fund’s shares will not be priced on days the New York Stock Exchange is closed for trading. The
offering and redemption price per share for the Fund is equal to the Fund’s NAV per share.
|
|
i).
|
REIT Equity Securities – The Fund may invest in the equity securities of real estate investment trusts (“REITs”). Distributions received from REITs may be classified as dividends, capital gains, or
return of capital. Investments in REITs may require the Fund to accrue and distribute income not yet received. To generate sufficient cash to make the requisite distributions, the Fund may be required to sell securities in its
portfolio (including when it is not advantageous to do so) that it otherwise would have continued to hold. At other times, investments in a REIT may result in the Fund’s receipt of cash in excess of the REIT’s earnings. If the
Fund distributes these amounts, these distributions could constitute a return of capital to Fund shareholders for U.S. federal income tax purposes. Dividends received by the Fund from a REIT generally will not constitute qualified
dividend income and will not qualify for the dividends-received deduction.
|
|
HENNESSY FUNDS
|
1-800-966-4354
|
25
3). SECURITIES VALUATION
The Fund follows fair value accounting standards that establish an authoritative definition of fair value and set out a hierarchy for measuring fair value. These standards require additional disclosures about
the various inputs and valuation techniques used to develop the measurements of fair value and a discussion of changes in valuation techniques and related inputs during the period. These inputs are summarized in the three broad levels
listed below:
|
Level 1 –
|
Unadjusted, quoted prices in active markets for identical instruments that the Fund has the ability to access at the date of measurement.
|
|
|
Level 2 –
|
Other significant observable inputs (including, but not limited to, quoted prices in active markets for similar instruments, quoted prices in markets that are not active for identical or similar
instruments, and model-derived valuations in which all significant inputs and significant value drivers are observable in active markets, such as interest rates, prepayment speeds, credit risk curves, default rates, and similar
data).
|
|
|
Level 3 –
|
Significant unobservable inputs (including the Fund’s own assumptions about what market participants would use to price the asset or liability based on the best available information) when observable
inputs are unavailable.
|
The following is a description of the valuation techniques applied to the Fund’s major categories of assets and liabilities measured at fair value on a recurring basis:
|
Equity Securities – Equity securities, including common stocks, preferred stocks, foreign-issued common stocks, exchange-traded funds, closed-end mutual funds,
partnerships, rights, and real estate investment trusts, that are traded on a securities exchange for which a last-quoted sales price is readily available will generally be valued at the last sales price as reported by the primary
exchange on which the securities are listed. Securities listed on The NASDAQ Stock Market (“NASDAQ”) will generally be valued at the NASDAQ Official Closing Price, which may differ from the last sales price reported. Securities
traded on a securities exchange for which a last-quoted sales price is not readily available will generally be valued at the mean between the bid and ask prices. To the extent these securities are actively traded and valuation
adjustments are not applied, they are classified in Level 1 of the fair value hierarchy. Securities traded on foreign exchanges generally are not valued at the same time the Fund calculates its NAV because most foreign markets
close well before such time. The earlier close of most foreign markets gives rise to the possibility that significant events, including broad market moves, may have occurred in the interim. In certain circumstances, it may be
determined that a foreign security needs to be fair valued because it appears that the value of the security might have been materially affected by events occurring after the close of the market in which the security is
principally traded, but before the time the Fund calculates its NAV, such as by a development that affects an entire market or region (e.g., a weather-related event) or a potentially global development (e.g., a terrorist attack
that may be expected to have an effect on investor expectations worldwide).
|
|
|
Registered Investment Companies – Investments in open-end registered investment companies, commonly referred to as mutual funds, generally are priced at the
ending NAV provided by the applicable mutual fund’s service agent and will be classified in Level 1 of the fair value hierarchy.
|
|
HENNESSYFUNDS.COM
|
26
|
NOTES TO THE FINANCIAL STATEMENTS
|
|
Debt Securities – Debt securities, including corporate bonds, asset-backed securities, mortgage-backed securities, municipal bonds, U.S. Treasuries, and U.S.
government agency issues, are generally valued at market on the basis of valuations furnished by an independent pricing service that utilizes both dealer-supplied valuations and formula-based techniques. The pricing service may
consider recently executed transactions in securities of the issuer or comparable issuers, market price quotations (where observable), bond spreads, and fundamental data relating to the issuer. In addition, the model may
incorporate observable market data, such as reported sales of similar securities, broker quotes, yields, bids, offers, and reference data. Certain securities are valued primarily using dealer quotations. These securities are
generally classified in Level 2 of the fair value hierarchy.
|
|
|
Short-Term Securities – Short-term equity investments, including money market funds, are valued in the manner specified above. Short-term debt investments with an
original term to maturity of 60 days or less are valued at amortized cost, which approximates fair market value. If the original term to maturity of a short-term debt investment exceeded 60 days, then the values as of the 61st day
prior to maturity are amortized. Amortized cost is not used if its use would be inappropriate due to credit or other impairments of the issuer, in which case the security’s fair value would be determined, as described below.
Short-term securities are generally classified in Level 1 or Level 2 of the fair value hierarchy depending on the inputs used and market activity levels for specific securities.
|
The Board of Trustees of the Fund (the “Board”) has adopted fair value pricing procedures that are followed when a price for a security is not readily available or if a significant event has
occurred that indicates the closing price of a security no longer represents the true value of that security. Fair value pricing determinations are made in good faith in accordance with these procedures. There are numerous criteria that
will be given consideration in determining a fair value of a security, such as the trading volume of a security and markets, the values of other similar securities, and news events with direct bearing on a security or markets. Fair value
pricing results in an estimated price for a security that reflects the amount the Fund might reasonably expect to receive in a current sale. Depending on the relative significance of the valuation inputs, these securities may be
classified in either Level 2 or Level 3 of the fair value hierarchy.
The fair value of foreign securities may be determined with the assistance of a pricing service using correlations between the movement of prices of such securities and indices of domestic
securities and other appropriate indicators, such as closing market prices of relevant American Depositary Receipts or futures contracts. Using fair value pricing means that the Fund’s NAV reflects the affected portfolio securities’
values as determined by the Board or its designee, pursuant to the fair value pricing procedures adopted by the Board, instead of being determined by the market. Using a fair value pricing methodology to price a foreign security may
result in a value that is different from such foreign security’s most recent closing price and from the value used by other investment companies to calculate their NAVs. Such securities are generally classified in Level 2 of the fair
value hierarchy. Because the Fund may invest in foreign securities, the value of the Fund’s portfolio securities may change on days when you will not be able to purchase or redeem your shares.
The Board has delegated day-to-day valuation matters to the Valuation and Liquidity Committee comprising representatives from Hennessy Advisors, Inc., the Fund’s investment advisor (the
“Advisor”). The function of the Valuation and Liquidity Committee is to value securities where current and reliable market quotations are not readily available. All actions taken by the Valuation and Liquidity Committee are reviewed by
the Board.
|
HENNESSY FUNDS
|
1-800-966-4354
|
27
The Fund has performed an analysis of all existing investments to determine the significance and character of all inputs to their fair value determinations. Various inputs are used to
determine the value of the Fund’s investments. The inputs or methodology used for valuing securities are not necessarily an indication of the risk associated with investing in those securities. Details related to the fair value hierarchy
of the Fund’s securities as of April 30, 2020, are included in the Schedule of Investments.
4). INVESTMENT TRANSACTIONS
Purchases and sales of investment securities (excluding government and short-term investments) for the Fund during the six months ended April 30, 2020, were $16,651,409 and $51,978,831, respectively.
Purchases and sales/maturities of long-term U.S. government securities for the Fund during the six months ended April 30, 2020, were $1,086,961 and $10,922,267, respectively.
The Fund is permitted to purchase or sell securities from or to another fund in the Hennessy Funds family of funds (collectively, the “Hennessy Funds”) under specified conditions outlined in
procedures adopted by the Board. The procedures have been designed to ensure that any purchase or sale of securities by the Fund from or to another Hennessy Fund complies with Rule 17a-7 of the Investment Company Act of 1940, as amended.
During the six months ended April 30, 2020, the Fund did not engage in purchases or sales of securities pursuant to Rule 17a-7 of the Investment Company Act of 1940, as amended.
5). INVESTMENT ADVISORY FEE AND OTHER TRANSACTIONS WITH AFFILIATES
The Advisor provides the Fund with investment advisory services under an Investment Advisory Agreement. The Advisor oversees the provision of investment advice and furnishes office space, facilities, and most of
the personnel needed by the Fund. As compensation for its services, the Advisor is entitled to a monthly fee from the Fund. The fee is based on the average daily net assets of the Fund at an annual rate of 0.80%. The net investment
advisory fees expensed by the Fund during the six months ended April 30, 2020, are included in the Statement of Operations.
The Advisor has delegated the day-to-day management of the equity allocation of the Fund to a sub-advisor, The London Company of Virginia, LLC, and has delegated the day-to-day management of
the fixed income allocation of the Fund to a sub-advisor, FCI Advisors. The Advisor pays the sub-advisory fees from its own assets, and these fees are not an additional expense of the Fund. During the six months ended April 30, 2020, the
Advisor (not the Fund) paid a sub-advisory fee at the rate of 0.33% of the daily net assets of the equity allocation of the Fund and 0.27% of the daily net assets of the fixed income allocation of the Fund.
The Board has approved a Shareholder Servicing Agreement for Investor Class shares of the Fund, which was instituted to compensate the Advisor for the non-investment advisory services it
provides to the Fund. The Shareholder Servicing Agreement provides for a monthly fee paid to the Advisor at an annual rate of 0.10% of the average daily net assets of the Fund attributable to Investor Class shares. The shareholder service
fees expensed by the Fund during the six months ended April 30, 2020, are included in the Statement of Operations.
The Fund has adopted a plan pursuant to Rule 12b-1 under the Investment Company Act of 1940, as amended, that authorizes payments in connection with the distribution of the Fund’s shares at an
annual rate of up to 0.25% of the Fund’s average daily net assets attributable to Investor Class shares. Even though the authorized rate is
|
HENNESSYFUNDS.COM
|
28
|
NOTES TO THE FINANCIAL STATEMENTS
|
up to 0.25%, the Fund is currently only using up to 0.15% of its average daily net assets attributable to Investor Class shares for such purpose. Amounts paid under the plan may be spent on any activities or
expenses primarily intended to result in the sale of shares, including, but not limited to, advertising, shareholder account servicing, printing and mailing of prospectuses to other than current shareholders, printing and mailing of sales
literature, and compensation for sales and marketing activities or to financial institutions and others, such as dealers and distributors. The distribution fees expensed by the Fund during the six months ended April 30, 2020, are included
in the Statement of Operations.
The Fund has entered into agreements with various brokers, dealers, and financial intermediaries in connection with the sale of shares of the Fund. The agreements provide for periodic payments
of sub-transfer agent expenses by the Fund to the brokers, dealers, and financial intermediaries for providing certain shareholder maintenance services. These shareholder services include the pre-processing and quality control of new
accounts, shareholder correspondence, answering customer inquiries regarding account status, and facilitating shareholder telephone transactions. The sub-transfer agent fees expensed by the Fund during the six months ended April 30, 2020,
are included in the Statement of Operations.
U.S. Bancorp Fund Services, LLC, d/b/a U.S. Bank Global Fund Services (“Fund Services”) provides the Fund with administrative, accounting, and transfer agent services. As administrator, Fund
Services is responsible for activities such as (i) preparing various federal and state regulatory filings, reports, and returns for the Fund, (ii) preparing reports and materials to be supplied to the Board, (iii) monitoring the
activities of the Fund’s custodian, transfer agent, and accountants, and (iv) coordinating the preparation and payment of the Fund’s expenses and reviewing the Fund’s expense accruals. U.S. Bank N.A., an affiliate of Fund Services, serves
as the Fund’s custodian. The servicing agreements between the Trust and Fund Services and U.S. Bank N.A. contain a fee schedule that is inclusive of administrative, accounting, custody, and transfer agent fees. The administrative,
accounting, custody, and transfer agent fees expensed by the Fund during the six months ended April 30, 2020, are included in the Statement of Operations.
Quasar Distributors, LLC (“Quasar”) acts as the Fund’s principal underwriter in a continuous public offering of the Fund’s shares. Quasar was an affiliate of Fund Services and U.S. Bank N.A.
through March 30, 2020. Effective March 31, 2020, Foreside Financial Group, LLC (“Foreside”) acquired Quasar from Fund Services. As a result of the acquisition, Quasar became a wholly owned broker-dealer subsidiary of Foreside and is no
longer affiliated with Fund Services or U.S. Bank N.A. The Board approved a new Distribution Agreement to enable Quasar to continue serving as the Fund’s distributor.
The officers of the Fund are affiliated with the Advisor. With the exception of the Chief Compliance Officer and the Senior Compliance Officer, such officers receive no compensation from the
Fund for serving in their respective roles. The Fund, along with the other Hennessy Funds, makes reimbursement payments on an equal basis to the Advisor for a portion of the salary and benefits associated with the office of the Chief
Compliance Officer and for all of the salary and benefits associated with the office of the Senior Compliance Officer. The compliance fees expensed by the Fund during the six months ended April 30, 2020, are included in the Statement of
Operations.
|
HENNESSY FUNDS
|
1-800-966-4354
|
29
6). GUARANTEES AND INDEMNIFICATIONS
Under the Hennessy Funds’ organizational documents, their officers and trustees are indemnified by the Hennessy Funds against certain liabilities arising out of the performance of their duties to the Hennessy
Funds. Additionally, in the normal course of business, the Hennessy Funds enter into contracts with service providers that contain general indemnification clauses. The Fund’s maximum exposure under these arrangements is unknown as this
would involve future claims that may be made against the Fund that have not yet occurred. Currently, the Fund expects the risk of loss to be remote.
7). LINE OF CREDIT
The Fund has an uncommitted line of credit with the other Hennessy Funds in the amount of the lesser of (i) $100,000,000 or (ii) 33.33% of each Hennessy Fund’s net assets, or 30% for the Hennessy Gas Utility
Fund and 10% for the Hennessy Balanced Fund, intended to provide short-term financing, if necessary, subject to certain restrictions, in connection with shareholder redemptions. The credit facility is with the Hennessy Funds’ custodian
bank, U.S. Bank N.A. Borrowings under this arrangement bear interest at the bank’s prime rate and are secured by all of the Fund’s assets (as to its own borrowings only). During the six months ended April 30, 2020, the Fund had an
outstanding average daily balance and a weighted average interest rate of $3,341 and 4.75%, respectively. The interest expensed by the Fund during the six months ended April 30, 2020, is included in the Statement of Operations. The
maximum amount outstanding for the Fund during the period was $608,000. As of April 30, 2020, the Fund did not have any borrowings outstanding under the line of credit.
8). FEDERAL TAX INFORMATION
As of October 31, 2019, the Fund’s most recent fiscal year end, the components of accumulated earnings (losses) for income tax purposes were as follows:
|
Investments
|
|||||
|
Cost of investments for tax purposes
|
$
|
146,980,836
|
|||
|
Gross tax unrealized appreciation
|
$
|
30,352,943
|
|||
|
Gross tax unrealized depreciation
|
(3,914,105
|
)
|
|||
|
Net tax unrealized appreciation/(depreciation)
|
$
|
26,438,838
|
|||
|
Undistributed ordinary income
|
$
|
85,038
|
|||
|
Undistributed long-term capital gains
|
10,129,817
|
||||
|
Total distributable earnings
|
$
|
10,214,855
|
|||
|
Other accumulated gain/(loss)
|
$
|
—
|
|||
|
Total accumulated gain/(loss)
|
$
|
36,653,693
|
|||
The difference between book-basis unrealized appreciation/depreciation and tax-basis unrealized appreciation/depreciation (as shown above) is attributable primarily to wash sales.
As of October 31, 2019, the Fund had no tax basis capital losses to offset future capital gains.
As of October 31, 2019, the Fund did not defer, on a tax basis, any late-year ordinary losses. Late-year ordinary losses are net ordinary losses incurred after December 31, 2018, but within
the taxable year, that are deemed to arise on the first day of the Fund’s next taxable year.
|
HENNESSYFUNDS.COM
|
30
|
NOTES TO THE FINANCIAL STATEMENTS
|
During fiscal year 2020 (year to date) and fiscal year 2019, the tax character of distributions paid by the Fund was as follows:
|
Six Months Ended
|
Year Ended
|
||||||||
|
April 30, 2020
|
October 31, 2019
|
||||||||
|
Ordinary income(1)
|
$
|
1,005,295
|
$
|
2,694,614
|
|||||
|
Long-term capital gain
|
10,129,861
|
15,240,994
|
|||||||
|
$
|
11,135,156
|
$
|
17,935,608
|
||||||
|
(1) Ordinary income includes short-term capital gain.
|
9). EVENTS SUBSEQUENT TO PERIOD END
Management has evaluated the Fund’s related events and transactions that occurred subsequent to April 30, 2020, through the date of issuance of the Fund’s financial statements. Management has determined that
there were no subsequent events requiring recognition or disclosure in the financial statements.
|
HENNESSY FUNDS
|
1-800-966-4354
|
31
Expense Example (Unaudited)
April 30, 2020
As a shareholder of the Fund, you incur ongoing costs, including management fees, service fees, and other Fund expenses. This Example is intended to help you understand your ongoing costs (in dollars) of
investing in the Fund and to compare these costs with the ongoing costs of investing in other mutual funds. The Example is based on an investment of $1,000 invested at the beginning of the period and held for the entire period from
November 1, 2019, through April 30, 2020.
Actual Expenses
The first line of the table below under the “Investor Class” and “Institutional Class” headings provides information about actual account values and actual expenses. Although the Fund charges no sales loads or
transaction fees, you will be assessed fees for outgoing wire transfers, returned checks and stop payment orders at prevailing rates charged by U.S. Bank Global Fund Services, the Fund’s transfer agent. If you request that a redemption be
made by wire transfer, currently a $15 fee is charged by the Fund’s transfer agent. IRA accounts will be charged a $15 annual maintenance fee. The example below includes, but is not limited to, management fees, shareholder servicing fees,
accounting, custody, and transfer agent fees. However, the example below does not include portfolio trading commissions and related expenses. You may use the information in this line, together with the amount you invested, to estimate the
expenses that you paid over the period. Simply divide your account value by $1,000 (for example, an $8,600 account value divided by $1,000 = 8.6), then multiply the result by the number in the first line of the table under the “Investor
Class” or “Institutional Class” headings in the column entitled “Expenses Paid During Period” to estimate the expenses you paid on your account during this period.
Hypothetical Example for Comparison Purposes
The second line of the table below under the “Investor Class” and “Institutional Class” headings provides information about hypothetical account values and hypothetical expenses based on the Fund’s actual
expense ratios and an assumed rate of return of 5% per year before expenses, which is not the Fund’s actual return. The hypothetical account values and expenses may not be used to estimate the actual ending account balance or expenses you
paid for the period. You may use this information to compare the ongoing costs of investing in the Fund and other funds. To do so, compare this 5% hypothetical example with the 5% hypothetical examples that appear in the shareholder
reports of the other funds. Please note that the expenses shown in the table are meant to highlight your ongoing costs only. Therefore, the second line of the table under the “Investor Class” and “Institutional Class” headings is useful
in comparing ongoing costs only and will not help you determine the relative total costs of owning different funds.
|
HENNESSYFUNDS.COM
|
32
|
EXPENSE EXAMPLE
|
|
Beginning
|
Ending
|
||
|
Account Value
|
Account Value
|
Expenses Paid
|
|
|
November 1, 2019
|
April 30, 2020
|
During Period(1)
|
|
|
Investor Class
|
|||
|
Actual
|
$1,000.00
|
$ 943.00
|
$7.20
|
|
Hypothetical (5% return before expenses)
|
$1,000.00
|
$1,017.45
|
$7.47
|
|
Institutional Class
|
|||
|
Actual
|
$1,000.00
|
$ 944.80
|
$5.42
|
|
Hypothetical (5% return before expenses)
|
$1,000.00
|
$1,019.29
|
$5.62
|
|
(1)
|
Expenses are equal to the Fund’s annualized expense ratio of 1.49% for Investor Class shares or 1.12% for Institutional Class shares, as applicable, multiplied by the average account value over the
period, multiplied by 182/366 days (to reflect the half-year period).
|
|
HENNESSY FUNDS
|
1-800-966-4354
|
33
How to Obtain a Copy of the Fund’s Proxy
Voting Policy and Proxy Voting Records
A description of the policies and procedures the Fund uses to determine how to vote proxies relating to portfolio securities is available without charge (1) by calling 1-800-966-4354, (2) on the Hennessy Funds’
website at www.hennessyfunds.com/proxy-voting/voting-policy, or (3) on the U.S. Securities and Exchange Commission’s (the “SEC”) website at www.sec.gov. The Fund’s proxy voting record is available without charge on both the Hennessy
Funds’ website at www.hennessyfunds.com/proxy-voting/voting-record and the SEC’s website at www.sec.gov no later than August 31 for the prior 12 months ending June 30.
Availability of Quarterly Portfolio Schedule
The Fund files a complete schedule of portfolio holdings with the SEC for the first and third quarters of each fiscal year as an exhibit to its reports on Form N-PORT. The Fund’s Forms N-PORT are available on
the SEC’s website at www.sec.gov or on request by calling 1-800-966-4354.
Federal Tax Distribution Information (Unaudited)
For fiscal year 2019, certain dividends paid by the Fund may be subject to a maximum tax rate of 23.8%, as provided for by the Jobs and Growth Tax Relief Reconciliation Act of 2003. The percentage of dividends
declared from ordinary income designated as qualified dividend income was 100.00%.
For corporate shareholders, the percent of ordinary income distributions that qualified for the corporate dividends received deduction for fiscal year 2019 was 100.00%.
The percentage of taxable ordinary income distributions that were designated as short-term capital gain distributions under Section 871(k)(2)(C) of the Internal Revenue Code of 1986, as
amended, for the Fund was 4.97%.
Important Notice Regarding Delivery
of Shareholder Documents
To help keep the Fund’s costs as low as possible, we generally deliver a single copy of shareholder reports, proxy statements, and prospectuses to shareholders who share an address and have the same last name.
This process does not apply to account statements. You may request an individual copy of a shareholder document at any time. If you would like to receive separate mailings of shareholder documents, please call U.S. Bank Global Fund
Services at 1-800-261-6950 or 1-414-765-4124, and individual delivery will begin within 30 days of your request. If your account is held through a financial institution or other intermediary, please contact such intermediary directly to
request individual delivery.
Electronic Delivery
The Funds offer shareholders the option to receive account statements, prospectuses, tax forms, and shareholder reports online. To sign up for eDelivery, please visit www.hennessyfunds.com/account. You may
change your delivery preference at any time by visiting our website or calling U.S. Bank Global Fund Services at 1-800-261-6950 or 1-414-765-4124.
|
HENNESSYFUNDS.COM
|
34
|
PROXY VOTING — BOARD APPROVAL OF INVESTMENT ADVISORY AGREEMENTS
|
Board Approval of Investment Advisory
Agreements
At its meeting on March 12, 2020, the Board of Trustees of the Fund (the “Board,” and the members thereof, the “Trustees”) unanimously approved the continuation of the investment advisory agreement of the Fund
with Hennessy Advisors, Inc. (the “Advisor”) and the sub-advisory agreement for the equity allocation of the Fund between the Advisor and The London Company, LLC, and the sub-advisory agreement for the fixed income allocation of the Fund
between the Advisor and Financial Counselors, Inc. (with The London Company, LLC and Financial Counselors, Inc., each herein referred to individually as a “Sub-Advisor” and together as the “Sub-Advisors”). As part of the process of
approving the continuation of the advisory and sub-advisory agreements, the Trustees reviewed their fiduciary duties and the relevant factors for them to consider with respect to approving the advisory and sub-advisory agreements. In
addition, the Trustees who are not deemed “interested persons” (as defined by the Investment Company Act of 1940, as amended) of the Fund (the “Independent Trustees”) met in executive session to discuss the approval of the advisory and
sub-advisory agreements.
In advance of the meeting, the Advisor sent detailed information to the Trustees to assist them in their evaluation of the advisory and sub-advisory agreements. This information included, but
was not limited to, the following:
|
(1)
|
A memorandum from outside legal counsel that described the fiduciary duties of the Board with respect to approving the continuation of the advisory and sub-advisory agreements and the relevant factors
for consideration;
|
|
|
(2)
|
A memorandum from the Advisor that listed the factors relevant to the Board’s approval of the continuation of the advisory and sub-advisory agreements and also referenced the documents that had been
provided to help the Board assess each such factor;
|
|
|
(3)
|
An inventory of the services provided by the Advisor and the Sub-Advisors and the distinction between the Advisor-provided services and the Sub-Advisor-provided services;
|
|
|
(4)
|
A written discussion of economies of scale;
|
|
|
(5)
|
Summaries of the key terms of the advisory and sub-advisory agreements;
|
|
|
(6)
|
A recent Fund fact sheet, which included performance information over various periods;
|
|
|
(7)
|
A peer expense comparison of the net expense ratio and investment advisory fee of the Fund;
|
|
|
(8)
|
The Advisor’s financial statements from its most recent Form 10-K and Form 10-Q;
|
|
|
(9)
|
A completed questionnaire from each Sub-Advisor;
|
|
|
(10)
|
Summaries of each Sub-Advisor’s questionnaire and relevant information from such Sub-Advisor’s Form ADV Parts I and II;
|
|
|
(11)
|
Each Sub-Advisor’s Code of Ethics; and
|
|
|
(12)
|
Financial information for the holding company of each Sub-Advisor.
|
|
HENNESSY FUNDS
|
1-800-966-4354
|
35
All of the factors discussed were considered as a whole by the Trustees and by the Independent Trustees meeting in executive session. The factors were viewed in their totality by the Trustees,
with no single factor being the principal or determinative factor in the Trustees’ determination of whether to approve the continuation of the advisory and sub-advisory agreements. The Trustees recognized that the management and fee
arrangements for the Fund are the result of years of review and discussion between the Independent Trustees and the Advisor, that certain aspects of such arrangements may receive greater scrutiny in some years than in others, and that the
Trustees’ conclusions may be based, in part, on their consideration of these same arrangements and information received during the course of the year and in prior years.
Prior to approving the continuation of the advisory and sub-advisory agreements, the Trustees, including the Independent Trustees in executive session, considered, among other items:
|
(1)
|
The nature and quality of the advisory services provided by the Advisor and the Sub-Advisors;
|
|
|
(2)
|
A comparison of the fees and expenses of the Fund to other similar funds;
|
|
|
(3)
|
Whether economies of scale are recognized by the Fund;
|
|
|
(4)
|
The costs and profitability of the Fund to the Advisor and the Sub-Advisors;
|
|
|
(5)
|
The performance of the Fund; and
|
|
|
(6)
|
Any benefits to the Advisor and the Sub-Advisors from serving as an investment advisor to the Fund (other than the advisory and sub-advisory fees).
|
The material considerations and determinations of the Trustees, including the Independent Trustees, were as follows:
|
(1)
|
The Trustees considered the services identified below that are provided by the Advisor. Based on this review, the Trustees concluded that the Advisor provides high-quality services to the Fund and noted
that their overall confidence in the Advisor was high. The Trustees also concluded that they were satisfied with the nature, extent, and quality of the advisory services provided to the Fund by the Advisor and that the nature and
extent of the services provided by the Advisor were appropriate to assure that the Fund’s operations are conducted in compliance with applicable laws, rules, and regulations.
|
|
(a)
|
The Advisor oversees the Sub-Advisors for the Fund, and the Sub-Advisors act as the portfolio managers for the Fund.
|
||
|
(b)
|
The Advisor performs a daily reconciliation of portfolio positions and cash for the Fund.
|
||
|
(c)
|
The Advisor monitors the liquidity of each Fund.
|
||
|
(d)
|
The Advisor monitors the Fund’s compliance with its investment objectives and restrictions.
|
||
|
(e)
|
The Advisor monitors compliance with federal securities laws, maintains a compliance program (including a code of ethics), conducts ongoing reviews of the compliance programs of the Sub-Advisors and the
Fund’s other service providers, as feasible, conducts on-site visits to the Sub-Advisors and the Fund’s other service providers, monitors incidents of abusive trading practices, reviews Fund expense accruals, payments, and fixed
expense ratios, evaluates insurance providers for fidelity bond, D&O/E&O
|
|
HENNESSYFUNDS.COM
|
36
|
BOARD APPROVAL OF INVESTMENT ADVISORY AGREEMENTS
|
|
insurance, and cybersecurity insurance coverage, manages regulatory examination compliance and responses, conducts employee compliance training, reviews reports provided by service providers, and
maintains books and records.
|
|||
|
(f)
|
The Advisor oversees the selection and continued employment of each Sub-Advisor, reviews the Fund’s investment performance, and monitors each Sub-Advisor’s adherence to the Fund’s investment objectives,
policies, and restrictions.
|
||
|
(g)
|
The Advisor oversees service providers that provide accounting, administration, distribution, transfer agency, custodial, sales, marketing, public relations, audit, information technology, and legal
services to the Fund.
|
||
|
(h)
|
The Advisor maintains in-house marketing and distribution departments on behalf of the Fund.
|
||
|
(i)
|
The Advisor is actively involved with preparing regulatory filings for the Fund, including writing and annually updating the Fund’s prospectus and related documents.
|
||
|
(j)
|
For each annual report of the Fund, the Advisor reviews the written summaries prepared by the Sub-Advisors of the Fund’s performance during the most recent 12-month period.
|
||
|
(k)
|
The Advisor oversees distribution of the Fund through third-party broker/dealers and independent financial institutions such as Charles Schwab, Inc., Fidelity, TD Ameritrade, and Pershing. The Advisor
participates in “no transaction fee” (“NTF”) programs with these companies on behalf of the Fund, which allow customers to purchase the Fund through third-party distribution channels without paying a transaction fee. The Advisor
compensates, in part, a number of these third-party providers of NTF programs out of its own revenues.
|
||
|
(l)
|
The Advisor pays the incentive compensation of the Fund’s compliance officers and employs other staff, such as legal, marketing, national accounts, distribution, sales, administrative, and trading
oversight personnel, as well as management executives.
|
||
|
(m)
|
The Advisor provides a quarterly compliance certification to the Board.
|
||
|
(n)
|
The Advisor prepares or reviews all Board materials, frequently presents to the Board and leads Board discussions, prepares or reviews all meeting minutes, and arranges for Board training and education.
|
|
(2)
|
The Trustees considered the services identified below that are provided by each Sub-Advisor:
|
|
(a)
|
Each Sub-Advisor acts as the portfolio manager for the Fund. In this capacity, each Sub-Advisor does the following:
|
|
(i)
|
manages the composition of the Fund’s portfolio, including the purchase, retention, and disposition of portfolio securities in accordance with the Fund’s investment objectives, policies, and
restrictions;
|
|||
|
(ii)
|
seeks best execution for the Fund’s portfolio;
|
|||
|
(iii)
|
manages the use of soft dollars for the Fund; and
|
|||
|
(iv)
|
manages proxy voting for the Fund.
|
|
HENNESSY FUNDS
|
1-800-966-4354
|
37
|
(b)
|
Each Sub-Advisor ensures that its compliance program includes policies and procedures relevant to the Fund and the Sub-Advisor’s duties as a portfolio manager to the Fund.
|
||
|
(c)
|
For each annual report of the Fund, each Sub-Advisor prepares a written summary of the Fund’s performance (with respect to the equity allocation or the fixed income allocation, as applicable) during the
most recent 12-month period.
|
||
|
(d)
|
Each Sub-Advisor provides a quarterly compliance certification to the Board regarding trading and allocation practices, supervisory matters, the Sub-Advisor’s compliance program (including its code of
ethics), compliance with the Fund’s policies, and general firm updates.
|
|
(3)
|
The Trustees considered the distinction between the services performed by the Advisor and the Sub-Advisors. The Trustees noted that the management of the Fund, including the oversight of the
Sub-Advisors, involves more comprehensive and substantive duties than the duties of the Sub-Advisors. Specifically, the Trustees considered the lists of services identified above and concluded that the services performed by the
Advisor for the Fund require a higher level of service and oversight than the services performed by the Sub-Advisors. Based on this determination, the Trustees concluded that the differential in advisory fees between the Advisor
and the Sub-Advisors is reasonable.
|
|
|
(4)
|
The Trustees compared the performance of the Fund to benchmark indices over various periods and also noted that the Trustees review and discuss reports comparing the investment performance of the Fund to
various indices at each quarterly Board meeting. Based on such information, the Trustees determined that the Advisor and the Sub-Advisors manage the Fund in a manner materially consistent with its stated investment objective and
style. The Trustees concluded that the performance of the Fund over various periods warranted continuation of the advisory and sub-advisory agreements.
|
|
|
(5)
|
The Trustees reviewed the advisory fees and overall expense ratios of the Fund compared to other funds similar in asset size and investment objective to the Fund using data from Morningstar. As part of
the discussion with management, the Trustees ensured that they understood and were comfortable with the criteria used to determine the mutual funds included in the Morningstar categories for purposes of the materials considered at
the meeting. The Trustees determined that the advisory fee and overall expense ratio of the Fund falls within the range of the advisory fees and overall expense ratios of other comparable funds and concluded that they are
reasonable and warranted continuation of the advisory and sub-advisory agreements.
|
|
|
(6)
|
The Trustees also considered whether the Advisor was realizing economies of scale that it should share with the Fund’s shareholders. The Trustees noted that the assets of the Fund had declined over the
prior year. In addition, the Trustees noted that many of the expenses incurred to manage the Fund are asset-based fees, so the Advisor does not realize material economies of scale relating to those expenses as the assets of the
Fund increase. For example, mutual fund platform fees increase as the Fund’s assets grow. The Trustees also considered the Advisor’s efforts to contain expenses through actions such as renegotiating service contracts, the
Advisor’s significant marketing efforts to promote the
|
|
HENNESSYFUNDS.COM
|
38
|
BOARD APPROVAL OF INVESTMENT ADVISORY AGREEMENTS
|
|
Funds, the Advisor’s investments in personnel to manage the Funds, and the Advisor’s agreement to waive fees or lower its management fees in certain circumstances. The Trustees noted that it did not
appear that the Advisor was realizing economies of scale at current asset levels and concluded that it would continue to monitor economies of scale in the future as circumstances changed.
|
||
|
(7)
|
The Trustees considered the profitability of the Advisor and the Sub-Advisors, including the impact of mutual fund platform fees on the Advisor’s profitability, and also considered the resources and
revenues that the Advisor has put into managing and distributing the Fund. The Trustees then concluded that the profits of the Advisor and the Sub-Advisors are reasonable and not excessive when compared to profitability guidelines
set forth in relevant court cases.
|
|
|
(8)
|
The Trustees considered the high level of professionalism and knowledge of the Advisor’s employees, along with a very low level of turnover, and concluded that this was beneficial to the Fund and its
shareholders.
|
|
|
(9)
|
The Trustees considered any benefits to the Advisor and the Sub-Advisors from serving as an advisor to the Fund (other than the advisory and sub-advisory fees). The Trustees noted that the Advisor and
the Sub-Advisors may derive ancillary benefits from, by way of example, their association with the Fund in the form of proprietary and third-party research products and services received from broker-dealers that execute portfolio
trades for the Fund. The Trustees determined that any such products and services have been used for legitimate purposes relating to the Fund by providing assistance in the investment decision-making process. The Trustees concluded
that any additional benefits realized by the Advisor and the Sub-Advisors from their relationship with the Fund were reasonable, which was based on, among other things, the Trustees’ findings that (i) the research, analytical,
statistical, and other information and services provided by brokers are merely supplemental to the Advisor’s and the Sub-Advisors’ own efforts in the performance of their duties under the advisory and sub-advisory agreements and
(ii) although the Sub-Advisors could derive benefits from the conversion of Fund shareholders into separate account clients, the Fund also could benefit from potential institutional shareholders who might choose to invest in the
Fund.
|
After reviewing the materials and information provided at the meeting, as well as other information regularly provided at the Board’s quarterly meetings throughout the year regarding the
quality of services provided by the Advisor and the Sub-Advisors, the performance of the Fund, expense information, brokerage commissions information, the adequacy and efficacy of the Advisor’s and the Sub-Advisors’ written policies and
procedures, other regulatory compliance issues, trading information and related matters, and other factors that the Trustees deemed relevant, the Trustees, including the Independent Trustees, approved the continuation of the advisory and
sub-advisory agreements.
|
HENNESSY FUNDS
|
1-800-966-4354
|
39
(This Page Intentionally Left Blank.)
For information, questions, or assistance, please call
The Hennessy Funds
1-800-966-4354 or 1-415-899-1555
INVESTMENT ADVISOR
Hennessy Advisors, Inc.
7250 Redwood Boulevard, Suite 200
Novato, California 94945
ADMINISTRATOR,
TRANSFER AGENT,
DIVIDEND PAYING AGENT, &
SHAREHOLDER SERVICING AGENT
U.S. Bancorp Fund Services, LLC
d/b/a U.S. Bank Global Fund Services
P.O. Box 701
Milwaukee, Wisconsin 53201-0701
CUSTODIAN
U.S. Bank N.A.
Custody Operations
1555 North River Center Drive, Suite 302
Milwaukee, Wisconsin 53212
TRUSTEES
Neil J. Hennessy
Robert T. Doyle
J. Dennis DeSousa
Gerald P. Richardson
COUNSEL
Foley & Lardner LLP
777 East Wisconsin Avenue
Milwaukee, Wisconsin 53202-5306
INDEPENDENT REGISTERED
PUBLIC ACCOUNTING FIRM
Tait, Weller & Baker LLP
Two Liberty Place
50 South 16th Street, Suite 2900
Philadelphia, Pennsylvania 19102-2529
DISTRIBUTOR
Quasar Distributors, LLC
111 East Kilbourn Avenue, Suite 2200
Milwaukee, Wisconsin 53202
www.hennessyfunds.com | 1-800-966-4354
This report has been prepared for shareholders and may be distributed to
others only if preceded or accompanied by a current prospectus.
SEMI-ANNUAL REPORT
APRIL 30, 2020
HENNESSY BALANCED FUND
Investor Class HBFBX
IMPORTANT NOTICE REGARDING ELECTRONIC DELIVERY OF SHAREHOLDER REPORTS
Beginning on January 1, 2021, as permitted by regulations adopted by the Securities and Exchange Commission, paper copies of the annual and semi-annual
reports will no longer be sent by mail unless you specifically request paper copies from the Hennessy Funds or from your financial intermediary. Instead, the reports will be made available on a website, and you will be notified
by mail each time a report is posted and provided with a website link to access the report.
If you have already elected to receive shareholder reports electronically, you will not be affected by this change and you need not take any action. You may
elect to receive shareholder reports and other communications from the Hennessy Funds electronically by visiting www.hennessyfunds.com/account or by calling U.S. Bank Global Fund Services at 1-800-261-6950. If you own shares in
a Fund through a financial intermediary, please contact your financial intermediary to make this election.
You may elect to receive paper copies of all future reports free of charge by calling U.S. Bank Global Fund Services at 1-800-261-6950 or, if you own your
shares through a financial intermediary, by contacting your financial intermediary. Your election to receive paper copies of reports will apply to all Funds in the Hennessy Funds family.
hennessyfunds.com | 1-800-966-4354
(This Page Intentionally Left Blank.)
Contents
|
Letter to Shareholders
|
2
|
|
Performance Overview
|
4
|
|
Financial Statements
|
|
|
Schedule of Investments
|
5
|
|
Statement of Assets and Liabilities
|
8
|
|
Statement of Operations
|
9
|
|
Statements of Changes in Net Assets
|
11
|
|
Financial Highlights
|
12
|
|
Notes to the Financial Statements
|
14
|
|
Expense Example
|
20
|
|
Proxy Voting Policy and Proxy Voting Records
|
21
|
|
Availability of Quarterly Portfolio Schedule
|
21
|
|
Federal Tax Distribution Information
|
21
|
|
Important Notice Regarding Delivery of Shareholder Documents
|
21
|
|
Electronic Delivery
|
21
|
|
Board Approval of Investment Advisory Agreement
|
22
|
|
HENNESSY FUNDS
|
1-800-966-4354
|
June 2020
Dear Hennessy Funds Shareholder:
First and foremost, I hope this communication finds you and your loved ones safe and healthy. In many ways, the COVID-19 pandemic has turned the world upside down in recent months, and we at Hennessy have
joined the rest of the world in witnessing and experiencing its profound effect on public health, the global economy, and the everyday lives of people around the world. In response to the crisis, we invoked our business continuity plan
in mid-March to ensure a smooth transition to remote work for all of our employees, who have been working safely and productively from home. We want to assure our Hennessy Funds shareholders that our operations are uninterrupted and
functioning normally.
The past six months have been marked by extremes. During the first half of the period from November 2019 through January 2020, the bull market, supported by strong corporate fundamentals,
continued to move higher, and investors appeared focused on record-low unemployment and strong economic growth. In mid-February, the major U.S. market indices hit all-time highs, but then, within just a matter of weeks, lost over
one-third of their values as the COVID-19 pandemic unfolded. Shelter-in-place and business closure orders rippled through the nation, causing initial unemployment claims to skyrocket to their highest number in history. The market then
rallied back and posted double-digit positive returns in April.
For the six months ended April 30, 2020, on a total return basis, the Dow Jones Industrial Average was down 8.9% and the S&P 500® Index was down 3.2%. Small-cap and mid-cap stocks generally fared worse than large-cap stocks during the period, and the Financial sector was particularly hard hit as the Federal Reserve aggressively cut
the federal funds rate in an effort to stabilize the economy. The Energy sector was crushed by both the sudden loss of demand due to COVID-19 and the oversupply caused by the surprise market-share battle between Russia and Saudi Arabia,
and the S&P 500® Energy Sector Index ended the six-month period down over 30%.
The COVID-19 pandemic is an unprecedented event, and the duration and full extent of the economic impact is unknown. In the moment, there is always the concern that ‘this time is different.’
But, when you are able to look at past financial, political, and health crises with the benefit of 20/20 hindsight, history has demonstrated that our economy and financial markets have always rebounded and recovered eventually. If you
look back to the last market downturn in 2008, economic fundamentals were weak compared to the market in 2020, where the overall underpinnings were – and are still – quite strong. Publicly listed companies today have plenty of cash,
with over $5 trillion on balance sheets of the S&P 500® companies alone, and I believe that most will survive and that many may emerge from the current
crisis even stronger.
|
HENNESSYFUNDS.COM
|
2
|
LETTER TO SHAREHOLDERS
|
We understand that this market volatility and economic uncertainty is jarring to many investors, and we continue to monitor events and the markets. We remain focused on managing our
high-conviction portfolios for the long-term benefit of our shareholders, and we are confident in the time-tested strategies and rigorous research that led to their formation. We encourage shareholders to maintain a long-term investment
horizon and to remain focused on long-term goals. As always, but especially in these trying times, we are here to support our shareholders, and we thank you for your continued investment and trust. Should you have any questions or would
like to speak with us directly, please don’t hesitate to call (800) 966-4354 or email us at fundsinfo@hennessyfunds.com.
Best regards,
Neil J. Hennessy
President and Chief Investment Officer
Past performance does not guarantee future results.
Mutual fund investing involves risk. Principal loss is possible.
The Dow Jones Industrial Average and S&P 500® Index are commonly used to measure the performance of U.S. stocks. The S&P
500® Energy Sector Index is an index that comprises those companies included in the S&P 500 that are classified as members of the GICS energy sector.
One cannot invest directly in an index.
|
HENNESSY FUNDS
|
1-800-966-4354
|
3
Performance Overview (Unaudited)
AVERAGE ANNUAL TOTAL RETURN FOR PERIODS ENDED APRIL 30, 2020
|
Six
|
One
|
Five
|
Ten
|
|
|
Months(1)
|
Year
|
Years
|
Years
|
|
|
Hennessy Balanced Fund (HBFBX)
|
-6.03%
|
-5.39%
|
3.31%
|
4.89%
|
|
50/50 Blended DJIA/Treasury Index
|
-3.03%
|
-0.68%
|
5.56%
|
6.13%
|
|
Dow Jones Industrial Average
|
-8.87%
|
-6.16%
|
9.06%
|
11.01%
|
Expense ratio: 1.89%
|
(1)
|
Periods of less than one year are not annualized.
|
_______________
Performance data quoted represents past performance; past performance does not guarantee future results. The investment return and principal value of an investment will fluctuate so that an
investor’s shares, when redeemed, may be worth more or less than their original cost. The performance table does not reflect the deduction of taxes that a shareholder would pay on Fund distributions or the redemption of Fund shares.
Current performance of the Fund may be lower or higher than the performance quoted. Performance data current to the most recent month end may be obtained by visiting www.hennessyfunds.com.
The 50/50 Blended DJIA/Treasury Index consists of 50% common stocks represented by the Dow Jones Industrial Average and 50% short-duration Treasury securities represented by the ICE BofAML 1-Year U.S. Treasury
Note Index, which comprises U.S. Treasury securities maturing in approximately one year. The Dow Jones Industrial Average is a price-weighted average of 30 significant stocks traded on the NYSE or The NASDAQ Stock Market. One cannot
invest directly in an index. These indices are used herein for comparative purposes in accordance with SEC regulations.
The Dow Jones Industrial Average is the property of the Dow Jones & Company, Inc. Dow Jones & Company, Inc. is not affiliated with the Fund or its investment advisor. Dow Jones & Company, Inc. has
not participated in any way in the creation of the Fund or in the selection of stocks included in the Fund and has not approved any information included in this report.
The expense ratio presented is from the most recent prospectus. The expense ratio for the current reporting period is available in the Financial Highlights section of this report.
|
HENNESSYFUNDS.COM
|
4
|
PERFORMANCE OVERVIEW/SCHEDULE OF INVESTMENTS
|
Financial Statements
|
Schedule of Investments as of April 30, 2020 (Unaudited)
|
HENNESSY BALANCED FUND
(% of Net Assets)

|
TOP TEN HOLDINGS (EXCLUDING MONEY MARKET FUNDS)
|
% NET ASSETS
|
|
U.S. Treasury Bill, 0.165%, 01/28/2021
|
21.63%
|
|
U.S. Treasury Bill, 1.525%, 12/03/2020
|
8.65%
|
|
U.S. Treasury Bill, 0.130%, 11/05/2020
|
6.06%
|
|
U.S. Treasury Bill, 0.095%, 05/21/2020
|
6.05%
|
|
U.S. Treasury Bill, 0.115%, 06/18/2020
|
6.05%
|
|
Verizon Communications, Inc.
|
5.22%
|
|
Pfizer, Inc.
|
5.21%
|
|
International Business Machines Corp.
|
4.67%
|
|
3M Co.
|
4.47%
|
|
The Coca-Cola Co.
|
4.41%
|
Note: For presentation purposes, the Fund has grouped some of the industry categories. For purposes of categorizing securities for compliance with Section 8(b)(1) of the Investment Company Act of 1940, as
amended, the Fund uses more specific industry classifications.
The Global Industry Classification Standard (GICS®) was developed by and is the exclusive property and a service mark of MSCI,
Inc. and Standard & Poor’s Financial Services LLC. It has been licensed for use by the Hennessy Funds.
|
HENNESSY FUNDS
|
1-800-966-4354
|
5
|
COMMON STOCKS – 44.37%
|
Number
|
% of
|
||||||||||
|
|
of Shares
|
Value
|
Net Assets
|
|||||||||
|
Communication Services – 5.22%
|
||||||||||||
|
Verizon Communications, Inc.
|
10,500
|
$
|
603,225
|
5.22
|
%
|
|||||||
|
Consumer Staples – 8.66%
|
||||||||||||
|
The Coca-Cola Co.
|
11,100
|
509,379
|
4.41
|
%
|
||||||||
|
Walgreens Boots Alliance, Inc.
|
11,350
|
491,341
|
4.25
|
%
|
||||||||
|
|
1,000,720
|
8.66
|
%
|
|||||||||
|
Energy – 7.44%
|
||||||||||||
|
Chevron Corp.
|
5,150
|
473,800
|
4.10
|
%
|
||||||||
|
Exxon Mobil Corp.
|
8,300
|
385,701
|
3.34
|
%
|
||||||||
|
|
859,501
|
7.44
|
%
|
|||||||||
|
Financials – 0.58%
|
||||||||||||
|
JPMorgan Chase & Co.
|
700
|
67,032
|
0.58
|
%
|
||||||||
|
Health Care – 5.90%
|
||||||||||||
|
Merck & Co., Inc.
|
1,000
|
79,340
|
0.69
|
%
|
||||||||
|
Pfizer, Inc.
|
15,700
|
602,252
|
5.21
|
%
|
||||||||
|
|
681,592
|
5.90
|
%
|
|||||||||
|
Industrials – 7.50%
|
||||||||||||
|
3M Co.
|
3,400
|
516,528
|
4.47
|
%
|
||||||||
|
Caterpillar, Inc.
|
3,000
|
349,140
|
3.03
|
%
|
||||||||
|
|
865,668
|
7.50
|
%
|
|||||||||
|
Information Technology – 5.83%
|
||||||||||||
|
Cisco Systems, Inc.
|
3,150
|
133,497
|
1.16
|
%
|
||||||||
|
International Business Machines Corp.
|
4,300
|
539,908
|
4.67
|
%
|
||||||||
|
|
673,405
|
5.83
|
%
|
|||||||||
|
Materials – 3.24%
|
||||||||||||
|
Dow, Inc.
|
9,350
|
343,052
|
2.97
|
%
|
||||||||
|
DuPont de Nemours, Inc.
|
650
|
30,563
|
0.27
|
%
|
||||||||
|
|
373,615
|
3.24
|
%
|
|||||||||
|
Total Common Stocks
|
||||||||||||
|
(Cost $5,568,859)
|
5,124,758
|
44.37
|
%
|
|||||||||
The accompanying notes are an integral part of these financial statements.
|
HENNESSYFUNDS.COM
|
6
|
SCHEDULE OF INVESTMENTS
|
|
SHORT-TERM INVESTMENTS – 55.83%
|
Number of Shares/
|
% of
|
||||||||||
|
|
Par Amount
|
Value
|
Net Assets
|
|||||||||
|
Money Market Funds – 3.93%
|
||||||||||||
|
First American Government Obligations
|
||||||||||||
|
Fund, Institutional Class, 0.25% (a)
|
453,516
|
$
|
453,516
|
3.93
|
%
|
|||||||
|
U.S. Treasury Bills – 51.90%
|
||||||||||||
|
0.095%, 05/21/2020 (b)
|
700,000
|
699,125
|
6.05
|
%
|
||||||||
|
0.115%, 06/18/2020 (b)
|
700,000
|
698,278
|
6.05
|
%
|
||||||||
|
0.280%, 07/16/2020 (b)
|
400,000
|
399,927
|
3.46
|
%
|
||||||||
|
0.130%, 11/05/2020 (b)
|
700,000
|
699,607
|
6.06
|
%
|
||||||||
|
1.525%, 12/03/2020 (b)
|
1,000,000
|
999,378
|
8.65
|
%
|
||||||||
|
0.165%, 01/28/2021 (b)
|
2,500,000
|
2,497,403
|
21.63
|
%
|
||||||||
|
|
5,993,718
|
51.90
|
%
|
|||||||||
|
Total Short-Term Investments
|
||||||||||||
|
(Cost $6,407,510)
|
6,447,234
|
55.83
|
%
|
|||||||||
|
|
||||||||||||
|
Total Investments
|
||||||||||||
|
(Cost $11,976,369) – 100.20%
|
11,571,992
|
100.20
|
%
|
|||||||||
|
Liabilities in Excess of Other Assets – (0.20)%
|
(22,870
|
)
|
(0.20
|
)%
|
||||||||
|
|
||||||||||||
|
TOTAL NET ASSETS – 100.00%
|
$
|
11,549,122
|
100.00
|
%
|
||||||||
Percentages are stated as a percent of net assets.
|
(a)
|
The rate listed is the fund’s seven-day yield as of April 30, 2020.
|
|
(b)
|
The rate listed is the discount rate at issue.
|
Summary of Fair Value Exposure as of April 30, 2020
The following is a summary of the inputs used to value the Fund’s net assets as of April 30, 2020 (see Note 3 in the accompanying Notes to the Financial Statements):
|
Common Stocks
|
Level 1
|
Level 2
|
Level 3
|
Total
|
||||||||||||
|
Communication Services
|
$
|
603,225
|
$
|
—
|
$
|
—
|
$
|
603,225
|
||||||||
|
Consumer Staples
|
1,000,720
|
—
|
—
|
1,000,720
|
||||||||||||
|
Energy
|
859,501
|
—
|
—
|
859,501
|
||||||||||||
|
Financials
|
67,032
|
—
|
—
|
67,032
|
||||||||||||
|
Health Care
|
681,592
|
—
|
—
|
681,592
|
||||||||||||
|
Industrials
|
865,668
|
—
|
—
|
865,668
|
||||||||||||
|
Information Technology
|
673,405
|
—
|
—
|
673,405
|
||||||||||||
|
Materials
|
373,615
|
—
|
—
|
373,615
|
||||||||||||
|
Total Common Stocks
|
$
|
5,124,758
|
$
|
—
|
$
|
—
|
$
|
5,124,758
|
||||||||
|
Short-Term Investments
|
||||||||||||||||
|
Money Market Funds
|
$
|
453,516
|
$
|
—
|
$
|
—
|
$
|
453,516
|
||||||||
|
U.S. Treasury Bills
|
—
|
5,993,718
|
—
|
5,993,718
|
||||||||||||
|
Total Short-Term Investments
|
$
|
453,516
|
$
|
5,993,718
|
$
|
—
|
$
|
6,447,234
|
||||||||
|
Total Investments
|
$
|
5,578,274
|
$
|
5,993,718
|
$
|
—
|
$
|
11,571,992
|
||||||||
The accompanying notes are an integral part of these financial statements.
|
HENNESSY FUNDS
|
1-800-966-4354
|
7
Financial Statements
|
Statement of Assets and Liabilities as of April 30, 2020 (Unaudited)
|
|
ASSETS:
|
||||
|
Investments in securities, at value (cost $11,976,369)
|
$
|
11,571,992
|
||
|
Dividends and interest receivable
|
9,659
|
|||
|
Prepaid expenses and other assets
|
15,054
|
|||
|
Total assets
|
11,596,705
|
|||
|
LIABILITIES:
|
||||
|
Payable for fund shares redeemed
|
3,554
|
|||
|
Payable to advisor
|
5,583
|
|||
|
Payable to administrator
|
4,244
|
|||
|
Payable to auditor
|
11,459
|
|||
|
Accrued distribution fees
|
11,714
|
|||
|
Accrued service fees
|
931
|
|||
|
Accrued trustees fees
|
6,741
|
|||
|
Accrued expenses and other payables
|
3,357
|
|||
|
Total liabilities
|
47,583
|
|||
|
NET ASSETS
|
$
|
11,549,122
|
||
|
NET ASSETS CONSISTS OF:
|
||||
|
Capital stock
|
$
|
11,730,265
|
||
|
Accumulated deficit
|
(181,143
|
)
|
||
|
Total net assets
|
$
|
11,549,122
|
||
|
NET ASSETS:
|
||||
|
Investor Class
|
||||
|
Shares authorized (no par value)
|
Unlimited
|
|||
|
Net assets applicable to outstanding shares
|
$
|
11,549,122
|
||
|
Shares issued and outstanding
|
1,039,406
|
|||
|
Net asset value, offering price, and redemption price per share
|
$
|
11.11
|
||
The accompanying notes are an integral part of these financial statements.
|
HENNESSYFUNDS.COM
|
8
|
STATEMENT OF ASSETS AND LIABILITIES/STATEMENT OF OPERATIONS
|
Financial Statements
|
Statement of Operations for the six months ended April 30, 2020 (Unaudited)
|
|
INVESTMENT INCOME:
|
||||
|
Dividend income
|
$
|
117,898
|
||
|
Interest income
|
59,279
|
|||
|
Total investment income
|
177,177
|
|||
|
EXPENSES:
|
||||
|
Investment advisory fees (See Note 5)
|
35,872
|
|||
|
Compliance expense (See Note 5)
|
13,462
|
|||
|
Administration, accounting, custody, and transfer agent fees (See Note 5)
|
11,642
|
|||
|
Audit fees
|
11,463
|
|||
|
Federal and state registration fees
|
10,725
|
|||
|
Distribution fees – Investor Class (See Note 5)
|
8,968
|
|||
|
Trustees’ fees and expenses
|
8,197
|
|||
|
Service fees – Investor Class (See Note 5)
|
5,979
|
|||
|
Sub-transfer agent expenses – Investor Class (See Note 5)
|
3,851
|
|||
|
Reports to shareholders
|
3,003
|
|||
|
Other expenses
|
1,913
|
|||
|
Total expenses
|
115,075
|
|||
|
NET INVESTMENT INCOME
|
$
|
62,102
|
||
|
REALIZED AND UNREALIZED GAINS (LOSSES):
|
||||
|
Net realized gain on investments
|
$
|
231,547
|
||
|
Net change in unrealized appreciation/depreciation on investments
|
(1,026,260
|
)
|
||
|
Net loss on investments
|
(794,713
|
)
|
||
|
NET DECREASE IN NET ASSETS RESULTING FROM OPERATIONS
|
$
|
(732,611
|
)
|
|
The accompanying notes are an integral part of these financial statements.
|
HENNESSY FUNDS
|
1-800-966-4354
|
9
(This Page Intentionally Left Blank.)
|
HENNESSYFUNDS.COM
|
10
|
STATEMENTS OF CHANGES IN NET ASSETS
|
Financial Statements
|
Statements of Changes in Net Assets
|
|
Six Months Ended
|
||||||||
|
April 30, 2020
|
Year Ended
|
|||||||
|
(Unaudited)
|
October 31, 2019
|
|||||||
|
OPERATIONS:
|
||||||||
|
Net investment income
|
$
|
62,102
|
$
|
130,489
|
||||
|
Net realized gain on investments
|
231,547
|
507,439
|
||||||
|
Net change in unrealized
|
||||||||
|
appreciation/depreciation on investments
|
(1,026,260
|
)
|
107,778
|
|||||
|
Net increase (decrease) in net assets
|
||||||||
|
resulting from operations
|
(732,611
|
)
|
745,706
|
|||||
|
DISTRIBUTIONS TO SHAREHOLDERS:
|
||||||||
|
Distributable earnings – Investor Class
|
(559,075
|
)
|
(681,988
|
)
|
||||
|
Total distributions
|
(559,075
|
)
|
(681,988
|
)
|
||||
|
CAPITAL SHARE TRANSACTIONS:
|
||||||||
|
Proceeds from shares subscribed – Investor Class
|
587,634
|
2,194,903
|
||||||
|
Dividends reinvested – Investor Class
|
550,366
|
673,592
|
||||||
|
Cost of shares redeemed – Investor Class
|
(600,726
|
)
|
(2,249,250
|
)
|
||||
|
Net increase in net assets derived
|
||||||||
|
from capital share transactions
|
537,274
|
619,245
|
||||||
|
TOTAL INCREASE (DECREASE) IN NET ASSETS
|
(754,412
|
)
|
682,963
|
|||||
|
NET ASSETS:
|
||||||||
|
Beginning of period
|
12,303,534
|
11,620,571
|
||||||
|
End of period
|
$
|
11,549,122
|
$
|
12,303,534
|
||||
|
CHANGES IN SHARES OUTSTANDING:
|
||||||||
|
Shares sold – Investor Class
|
50,929
|
179,722
|
||||||
|
Shares issued to holders as reinvestment
|
||||||||
|
of dividends – Investor Class
|
45,906
|
56,316
|
||||||
|
Shares redeemed – Investor Class
|
(51,505
|
)
|
(183,674
|
)
|
||||
|
Net increase in shares outstanding
|
45,330
|
52,364
|
||||||
The accompanying notes are an integral part of these financial statements.
|
HENNESSY FUNDS
|
1-800-966-4354
|
11
Financial Statements
|
Financial Highlights
|
For an Investor Class share outstanding throughout each period
|
Six Months Ended
|
||||
|
April 30, 2020
|
||||
|
(Unaudited)
|
||||
|
PER SHARE DATA:
|
||||
|
Net asset value, beginning of period
|
$
|
12.38
|
||
|
Income from investment operations:
|
||||
|
Net investment income
|
0.06
|
(1)
|
||
|
Net realized and unrealized gains (losses) on investments
|
(0.77
|
)
|
||
|
Total from investment operations
|
(0.71
|
)
|
||
|
Less distributions:
|
||||
|
Dividends from net investment income
|
(0.06
|
)
|
||
|
Dividends from net realized gains
|
(0.50
|
)
|
||
|
Total distributions
|
(0.56
|
)
|
||
|
Net asset value, end of period
|
$
|
11.11
|
||
|
TOTAL RETURN
|
-6.03
|
%(2)
|
||
|
SUPPLEMENTAL DATA AND RATIOS:
|
||||
|
Net assets, end of period (millions)
|
$
|
11.55
|
||
|
Ratio of expenses to average net assets
|
1.92
|
%(3)
|
||
|
Ratio of net investment income to average net assets
|
1.04
|
%(3)
|
||
|
Portfolio turnover rate
|
13
|
%(2)
|
||
|
(1)
|
Calculated using the average shares outstanding method.
|
|
(2)
|
Not annualized.
|
|
(3)
|
Annualized.
|
The accompanying notes are an integral part of these financial statements.
|
HENNESSYFUNDS.COM
|
12
|
FINANCIAL HIGHLIGHTS — INVESTOR CLASS
|
|
Year Ended October 31,
|
||||||||||||||||||
|
2019
|
2018
|
2017
|
2016
|
2015
|
||||||||||||||
|
$
|
12.34
|
$
|
12.88
|
$
|
12.68
|
$
|
12.37
|
$
|
12.98
|
|||||||||
|
0.13
|
(1)
|
0.09
|
0.06
|
0.04
|
0.03
|
|||||||||||||
|
0.59
|
0.33
|
1.09
|
0.58
|
(0.01
|
)
|
|||||||||||||
|
0.72
|
0.42
|
1.15
|
0.62
|
0.02
|
||||||||||||||
|
(0.13
|
)
|
(0.08
|
)
|
(0.05
|
)
|
(0.04
|
)
|
(0.03
|
)
|
|||||||||
|
(0.55
|
)
|
(0.88
|
)
|
(0.90
|
)
|
(0.27
|
)
|
(0.60
|
)
|
|||||||||
|
(0.68
|
)
|
(0.96
|
)
|
(0.95
|
)
|
(0.31
|
)
|
(0.63
|
)
|
|||||||||
|
$
|
12.38
|
$
|
12.34
|
$
|
12.88
|
$
|
12.68
|
$
|
12.37
|
|||||||||
|
6.05
|
%
|
3.46
|
%
|
9.56
|
%
|
5.20
|
%
|
0.11
|
%
|
|||||||||
|
$
|
12.30
|
$
|
11.62
|
$
|
12.24
|
$
|
12.08
|
$
|
11.63
|
|||||||||
|
1.88
|
%
|
1.84
|
%
|
1.82
|
%
|
1.68
|
%
|
1.68
|
%
|
|||||||||
|
1.04
|
%
|
0.70
|
%
|
0.45
|
%
|
0.33
|
%
|
0.20
|
%
|
|||||||||
|
52
|
%
|
21
|
%
|
31
|
%
|
51
|
%
|
34
|
%
|
|||||||||
The accompanying notes are an integral part of these financial statements.
|
HENNESSY FUNDS
|
1-800-966-4354
|
13
Financial Statements
|
Notes to the Financial Statements April 30, 2020 (Unaudited)
|
1). ORGANIZATION
The Hennessy Balanced Fund (the “Fund”) is a series of Hennessy Funds Trust (the “Trust”), which was organized as a Delaware statutory trust on September 17, 1992. The Fund is an open-end management investment
company registered under the Investment Company Act of 1940, as amended. The investment objective of the Fund is a combination of capital appreciation and current income. The Fund is a non-diversified fund and offers Investor Class
shares.
As an investment company, the Fund follows the investment company accounting and reporting guidance of the Financial Accounting Standards Board (“FASB”) Accounting Standard Codification
Topic 946 “Financial Services—Investment Companies.”
2). SIGNIFICANT ACCOUNTING POLICIES
The following is a summary of significant accounting policies consistently followed by the Fund in the preparation of the financial statements. These policies conform to U.S. generally accepted accounting
principles (“GAAP”).
|
a).
|
Securities Valuation – All investments in securities are recorded at their estimated fair value, as described in Note 3.
|
|
b).
|
Federal Income Taxes – No provision for federal income taxes or excise taxes has been made because the Fund has elected to be taxed as a regulated investment company and intends to distribute
substantially all of its taxable income to its shareholders and otherwise comply with the provisions of the Internal Revenue Code of 1986, as amended, applicable to regulated investment companies. Net investment income/loss and
realized gains/losses for federal income tax purposes may differ from those reported in the financial statements because of temporary book and tax basis differences. Temporary differences are primarily the result of the
treatment of wash sales for tax reporting purposes. The Fund recognizes interest and penalties related to income tax benefits, if any, in the Statement of Operations as an income tax expense. Distributions from net realized
gains for book purposes may include short-term capital gains, which are included as ordinary income to shareholders for tax purposes. The Fund may utilize equalization accounting for tax purposes and designate earnings and
profits, including net realized gains distributed to shareholders on redemption of shares, as part of the dividends paid deduction for income tax purposes.
|
|
c).
|
Accounting for Uncertainty in Income Taxes – The Fund has accounting policies regarding recognition and measurement of tax positions taken or expected to be taken on a tax return. The tax returns of
the Fund for the prior three fiscal years are open for examination. The Fund has reviewed all open tax years in major jurisdictions and concluded that there is no impact on the Fund’s net assets and no tax liability resulting
from unrecognized tax benefits relating to uncertain income tax positions taken or expected to be taken on a tax return. The Fund’s major tax jurisdictions are U.S. federal and Delaware.
|
|
d).
|
Income and Expenses – Dividend income is recognized on the ex-dividend date or as soon as information is available to the Fund. Interest income, which includes the amortization of premium and accretion
of discount, is recognized on an accrual basis.
|
|
HENNESSYFUNDS.COM
|
14
|
NOTES TO THE FINANCIAL STATEMENTS
|
|
Other non-cash dividends are recognized as investment income at the fair value of the property received. The Fund is charged for those expenses that are directly attributable to its portfolio, such as
advisory, administration, and certain shareholder service fees.
|
|
|
e).
|
Distributions to Shareholders – Dividends from net investment income for the Fund, if any, are declared and paid at the end of each calendar quarter. Distributions of net realized capital gains, if
any, are declared and paid annually, usually in December.
|
|
f).
|
Security Transactions – Investment and shareholder transactions are recorded on the trade date. The Fund determines the realized gain/loss from an investment transaction by comparing the original cost
of the security lot sold with the net sale proceeds. Discounts and premiums on securities purchased are accreted or amortized, respectively, over the life of each such security.
|
|
g).
|
Use of Estimates – The preparation of financial statements in conformity with GAAP requires management to make estimates and assumptions that affect the reported amounts of assets and liabilities and
disclosure of contingent assets and liabilities at the date of the financial statements and the reported change in net assets during the reporting period. Actual results could differ from those estimates.
|
|
h).
|
Share Valuation – The net asset value (“NAV”) per share of the Fund is calculated by dividing (i) the total value of the securities held by the Fund, plus cash and other assets, minus all liabilities
(including estimated accrued expenses) by (ii) the total number of shares outstanding for the Fund, rounded to the nearest $0.01. The Fund’s shares will not be priced on days the New York Stock Exchange is closed for trading.
The offering and redemption price per share for the Fund is equal to the Fund’s NAV per share.
|
3). SECURITIES VALUATION
The Fund follows fair value accounting standards that establish an authoritative definition of fair value and set out a hierarchy for measuring fair value. These standards require additional disclosures about
the various inputs and valuation techniques used to develop the measurements of fair value and a discussion of changes in valuation techniques and related inputs during the period. These inputs are summarized in the three broad levels
listed below:
|
Level 1 –
|
Unadjusted, quoted prices in active markets for identical instruments that the Fund has the ability to access at the date of measurement.
|
|
|
Level 2 –
|
Other significant observable inputs (including, but not limited to, quoted prices in active markets for similar instruments, quoted prices in markets that are not active for identical or similar
instruments, and model-derived valuations in which all significant inputs and significant value drivers are observable in active markets, such as interest rates, prepayment speeds, credit risk curves, default rates, and similar
data).
|
|
|
Level 3 –
|
Significant unobservable inputs (including the Fund’s own assumptions about what market participants would use to price the asset or liability based on the best available information) when observable
inputs are unavailable.
|
The following is a description of the valuation techniques applied to the Fund’s major categories of assets and liabilities measured at fair value on a recurring basis:
|
Equity Securities – Equity securities, including common stocks, preferred stocks, exchange-traded funds, closed-end mutual funds, partnerships, rights, and real
estate investment trusts, that are traded on a securities exchange for which a last-quoted sales price is readily available will generally be valued at the last sales price as
|
|
HENNESSY FUNDS
|
1-800-966-4354
|
15
|
reported by the primary exchange on which the securities are listed. Securities listed on The NASDAQ Stock Market (“NASDAQ”) will generally be valued at the NASDAQ Official Closing Price, which may
differ from the last sales price reported. Securities traded on a securities exchange for which a last-quoted sales price is not readily available will generally be valued at the mean between the bid and ask prices. To the
extent these securities are actively traded and valuation adjustments are not applied, they are classified in Level 1 of the fair value hierarchy.
|
|
|
Registered Investment Companies – Investments in open-end registered investment companies, commonly referred to as mutual funds, generally are priced at the
ending NAV provided by the applicable mutual fund’s service agent and will be classified in Level 1 of the fair value hierarchy.
|
|
|
Debt Securities – Debt securities, including corporate bonds, asset-backed securities, mortgage-backed securities, municipal bonds, U.S. Treasuries, and U.S.
government agency issues, are generally valued at market on the basis of valuations furnished by an independent pricing service that utilizes both dealer-supplied valuations and formula-based techniques. The pricing service may
consider recently executed transactions in securities of the issuer or comparable issuers, market price quotations (where observable), bond spreads, and fundamental data relating to the issuer. In addition, the model may
incorporate observable market data, such as reported sales of similar securities, broker quotes, yields, bids, offers, and reference data. Certain securities are valued primarily using dealer quotations. These securities are
generally classified in Level 2 of the fair value hierarchy.
|
|
|
Short-Term Securities – Short-term equity investments, including money market funds, are valued in the manner specified above. Short-term debt investments with
an original term to maturity of 60 days or less are valued at amortized cost, which approximates fair market value. If the original term to maturity of a short-term debt investment exceeded 60 days, then the values as of the
61st day prior to maturity are amortized. Amortized cost is not used if its use would be inappropriate due to credit or other impairments of the issuer, in which case the security’s fair value would be determined, as described
below. Short-term securities are generally classified in Level 1 or Level 2 of the fair value hierarchy depending on the inputs used and market activity levels for specific securities.
|
The Board of Trustees of the Fund (the “Board”) has adopted fair value pricing procedures that are followed when a price for a security is not readily available or if a significant event has
occurred that indicates the closing price of a security no longer represents the true value of that security. Fair value pricing determinations are made in good faith in accordance with these procedures. There are numerous criteria that
will be given consideration in determining a fair value of a security, such as the trading volume of a security and markets, the values of other similar securities, and news events with direct bearing on a security or markets. Fair
value pricing results in an estimated price for a security that reflects the amount the Fund might reasonably expect to receive in a current sale. Depending on the relative significance of the valuation inputs, these securities may be
classified in either Level 2 or Level 3 of the fair value hierarchy.
The Board has delegated day-to-day valuation matters to the Valuation and Liquidity Committee comprising representatives from Hennessy Advisors, Inc., the Fund’s investment advisor (the
“Advisor”). The function of the Valuation and Liquidity Committee is to value securities where current and reliable market quotations are not readily available. All actions taken by the Valuation and Liquidity Committee are reviewed by
the Board.
|
HENNESSYFUNDS.COM
|
16
|
NOTES TO THE FINANCIAL STATEMENTS
|
The Fund has performed an analysis of all existing investments to determine the significance and character of all inputs to their fair value determinations. Various inputs are used to
determine the value of the Fund’s investments. The inputs or methodology used for valuing securities are not necessarily an indication of the risk associated with investing in those securities. Details related to the fair value
hierarchy of the Fund’s securities as of April 30, 2020, are included in the Schedule of Investments.
4). INVESTMENT TRANSACTIONS
Purchases and sales of investment securities (excluding government and short-term investments) for the Fund during the six months ended April 30, 2020, were $737,581 and $855,727, respectively.
There were no purchases or sales/maturities of long-term U.S. government securities for the Fund during the six months ended April 30, 2020.
The Fund is permitted to purchase or sell securities from or to another fund in the Hennessy Funds family of funds (collectively, the “Hennessy Funds”) under specified conditions outlined in
procedures adopted by the Board. The procedures have been designed to ensure that any purchase or sale of securities by the Fund from or to another Hennessy Fund complies with Rule 17a-7 of the Investment Company Act of 1940, as
amended. During the six months ended April 30, 2020, the Fund did not engage in purchases or sales of securities pursuant to Rule 17a-7 of the Investment Company Act of 1940, as amended.
5). INVESTMENT ADVISORY FEE AND OTHER TRANSACTIONS WITH AFFILIATES
The Advisor provides the Fund with investment advisory services under an Investment Advisory Agreement. The Advisor furnishes all investment advice, office space, and facilities and most of the personnel
needed by the Fund. As compensation for its services, the Advisor is entitled to a monthly fee from the Fund. The fee is based on the average daily net assets of the Fund at an annual rate of 0.60%. The net investment advisory fees
expensed by the Fund during the six months ended April 30, 2020, are included in the Statement of Operations.
The Board has approved a Shareholder Servicing Agreement for the Fund, which was instituted to compensate the Advisor for the non-investment advisory services it provides to the Fund. The
Shareholder Servicing Agreement provides for a monthly fee paid to the Advisor at an annual rate of 0.10% of the average daily net assets of the Fund. The shareholder service fees expensed by the Fund during the six months ended April
30, 2020, are included in the Statement of Operations.
The Fund has adopted a plan pursuant to Rule 12b-1 under the Investment Company Act of 1940, as amended, that authorizes payments in connection with the distribution of the Fund’s shares at
an annual rate of up to 0.25% of the Fund’s average daily net assets. Even though the authorized rate is up to 0.25%, the Fund is currently only using up to 0.15% of its average daily net assets for such purpose. Amounts paid under the
plan may be spent on any activities or expenses primarily intended to result in the sale of shares, including, but not limited to, advertising, shareholder account servicing, printing and mailing of prospectuses to other than current
shareholders, printing and mailing of sales literature, and compensation for sales and marketing activities or to financial institutions and others, such as dealers and distributors. The distribution fees expensed by the Fund during the
six months ended April 30, 2020, are included in the Statement of Operations.
The Fund has entered into agreements with various brokers, dealers, and financial intermediaries in connection with the sale of shares of the Fund. The agreements provide for periodic
payments of sub-transfer agent expenses by the Fund to the brokers, dealers,
|
HENNESSY FUNDS
|
1-800-966-4354
|
17
and financial intermediaries for providing certain shareholder maintenance services. These shareholder services include the pre-processing and quality control of new accounts, shareholder correspondence,
answering customer inquiries regarding account status, and facilitating shareholder telephone transactions. The sub-transfer agent fees expensed by the Fund during the six months ended April 30, 2020, are included in the Statement of
Operations.
U.S. Bancorp Fund Services, LLC, d/b/a U.S. Bank Global Fund Services (“Fund Services”) provides the Fund with administrative, accounting, and transfer agent services. As administrator, Fund
Services is responsible for activities such as (i) preparing various federal and state regulatory filings, reports, and returns for the Fund, (ii) preparing reports and materials to be supplied to the Board, (iii) monitoring the
activities of the Fund’s custodian, transfer agent, and accountants, and (iv) coordinating the preparation and payment of the Fund’s expenses and reviewing the Fund’s expense accruals. U.S. Bank N.A., an affiliate of Fund Services,
serves as the Fund’s custodian. The servicing agreements between the Trust and Fund Services and U.S. Bank N.A. contain a fee schedule that is inclusive of administrative, accounting, custody, and transfer agent fees. The
administrative, accounting, custody, and transfer agent fees expensed by the Fund during the six months ended April 30, 2020, are included in the Statement of Operations.
Quasar Distributors, LLC (“Quasar”) acts as the Fund’s principal underwriter in a continuous public offering of the Fund’s shares. Quasar was an affiliate of Fund Services and U.S. Bank N.A.
through March 30, 2020. Effective March 31, 2020, Foreside Financial Group, LLC (“Foreside”) acquired Quasar from Fund Services. As a result of the acquisition, Quasar became a wholly owned broker-dealer subsidiary of Foreside and is no
longer affiliated with Fund Services or U.S. Bank N.A. The Board approved a new Distribution Agreement to enable Quasar to continue serving as the Fund’s distributor.
The officers of the Fund are affiliated with the Advisor. With the exception of the Chief Compliance Officer and the Senior Compliance Officer, such officers receive no compensation from the
Fund for serving in their respective roles. The Fund, along with the other Hennessy Funds, makes reimbursement payments on an equal basis to the Advisor for a portion of the salary and benefits associated with the office of the Chief
Compliance Officer and for all of the salary and benefits associated with the office of the Senior Compliance Officer. The compliance fees expensed by the Fund during the six months ended April 30, 2020, are included in the Statement of
Operations.
6). GUARANTEES AND INDEMNIFICATIONS
Under the Hennessy Funds’ organizational documents, their officers and trustees are indemnified by the Hennessy Funds against certain liabilities arising out of the performance of their duties to the Hennessy
Funds. Additionally, in the normal course of business, the Hennessy Funds enter into contracts with service providers that contain general indemnification clauses. The Fund’s maximum exposure under these arrangements is unknown as this
would involve future claims that may be made against the Fund that have not yet occurred. Currently, the Fund expects the risk of loss to be remote.
7). LINE OF CREDIT
The Fund has an uncommitted line of credit with the other Hennessy Funds in the amount of the lesser of (i) $100,000,000 or (ii) 33.33% of each Hennessy Fund’s net assets, or 30% for the Hennessy Gas Utility
Fund and 10% for the Fund, intended to provide short-term financing, if necessary, subject to certain restrictions, in connection with shareholder redemptions. The credit facility is with the Hennessy Funds’ custodian bank, U.S. Bank
N.A. Borrowings under this arrangement bear interest at the bank’s prime
|
HENNESSYFUNDS.COM
|
18
|
NOTES TO THE FINANCIAL STATEMENTS
|
rate and are secured by all of the Fund’s assets (as to its own borrowings only). During the six months ended April 30, 2020, the Fund did not have any borrowings outstanding under the line of credit.
8). FEDERAL TAX INFORMATION
As of October 31, 2019, the Fund’s most recent fiscal year end, the components of accumulated earnings (losses) for income tax purposes were as follows:
|
Investments
|
|||||
|
Cost of investments for tax purposes
|
$
|
11,736,170
|
|||
|
Gross tax unrealized appreciation
|
$
|
755,819
|
|||
|
Gross tax unrealized depreciation
|
(143,056
|
)
|
|||
|
Net tax unrealized appreciation/(depreciation)
|
$
|
612,763
|
|||
|
Undistributed ordinary income
|
$
|
28,357
|
|||
|
Undistributed long-term capital gains
|
469,423
|
||||
|
Total distributable earnings
|
$
|
497,780
|
|||
|
Other accumulated gain/(loss)
|
$
|
—
|
|||
|
Total accumulated gain/(loss)
|
$
|
1,110,543
|
|||
The difference between book-basis unrealized appreciation/depreciation and tax-basis unrealized appreciation/depreciation (as shown above) is attributable primarily to wash sales.
As of October 31, 2019, the Fund had no tax basis capital losses to offset future capital gains.
As of October 31, 2019, the Fund did not defer, on a tax basis, any late-year ordinary losses. Late-year ordinary losses are net ordinary losses incurred after December 31, 2018, but within
the taxable year, that are deemed to arise on the first day of the Fund’s next taxable year.
During fiscal year 2020 (year to date) and fiscal year 2019, the tax character of distributions paid by the Fund was as follows:
|
Six Months Ended
|
Year Ended
|
||||||||
|
April 30, 2020
|
October 31, 2019
|
||||||||
|
Ordinary income(1)
|
$
|
89,643
|
$
|
133,769
|
|||||
|
Long-term capital gain
|
469,432
|
548,219
|
|||||||
|
$
|
559,075
|
$
|
681,988
|
||||||
(1) Ordinary income includes short-term capital gain.
9). EVENTS SUBSEQUENT TO PERIOD END
Management has evaluated the Fund’s related events and transactions that occurred subsequent to April 30, 2020, through the date of issuance of the Fund’s financial statements. Management has determined that
there were no subsequent events requiring recognition or disclosure in the financial statements.
|
HENNESSY FUNDS
|
1-800-966-4354
|
19
Expense Example (Unaudited)
April 30, 2020
As a shareholder of the Fund, you incur ongoing costs, including management fees, service fees, and other Fund expenses. This Example is intended to help you understand your ongoing costs (in dollars) of
investing in the Fund and to compare these costs with the ongoing costs of investing in other mutual funds. The Example is based on an investment of $1,000 invested at the beginning of the period and held for the entire period from
November 1, 2019, through April 30, 2020.
Actual Expenses
The first line of the table below provides information about actual account values and actual expenses. Although the Fund charges no sales loads or transaction fees, you will be assessed fees for outgoing wire
transfers, returned checks and stop payment orders at prevailing rates charged by U.S. Bank Global Fund Services, the Fund’s transfer agent. If you request that a redemption be made by wire transfer, currently a $15 fee is charged by
the Fund’s transfer agent. IRA accounts will be charged a $15 annual maintenance fee. The example below includes, but is not limited to, management fees, shareholder servicing fees, accounting, custody, and transfer agent fees. However,
the example below does not include portfolio trading commissions and related expenses. You may use the information in this line, together with the amount you invested, to estimate the expenses that you paid over the period. Simply
divide your account value by $1,000 (for example, an $8,600 account value divided by $1,000 = 8.6), then multiply the result by the number in the first line of the table under the heading entitled “Expenses Paid During Period” to
estimate the expenses you paid on your account during this period.
Hypothetical Example for Comparison Purposes
The second line of the table below provides information about hypothetical account values and hypothetical expenses based on the Fund’s actual expense ratio and an assumed rate of return of 5% per year before
expenses, which is not the Fund’s actual return. The hypothetical account values and expenses may not be used to estimate the actual ending account balance or expenses you paid for the period. You may use this information to compare the
ongoing costs of investing in the Fund and other funds. To do so, compare this 5% hypothetical example with the 5% hypothetical examples that appear in the shareholder reports of the other funds. Please note that the expenses shown in
the table are meant to highlight your ongoing costs only. Therefore, the second line of the table is useful in comparing ongoing costs only and will not help you determine the relative total costs of owning different funds.
|
Beginning
|
Ending
|
||
|
Account Value
|
Account Value
|
Expenses Paid
|
|
|
November 1, 2019
|
April 30, 2020
|
During Period(1)
|
|
|
Investor Class
|
|||
|
Actual
|
$1,000.00
|
$ 939.70
|
$9.26
|
|
Hypothetical (5% return before expenses)
|
$1,000.00
|
$1,015.32
|
$9.62
|
|
(1)
|
Expenses are equal to the Fund’s annualized expense ratio of 1.92%, multiplied by the average account value over the period, multiplied by 182/366 days (to reflect the half-year period).
|
|
HENNESSYFUNDS.COM
|
20
|
EXPENSE EXAMPLE — ELECTRONIC DELIVERY
|
How to Obtain a Copy of the Fund’s
Proxy Voting Policy and Proxy Voting Records
A description of the policies and procedures the Fund uses to determine how to vote proxies relating to portfolio securities is available without charge (1) by calling 1-800-966-4354, (2) on the Hennessy
Funds’ website at www.hennessyfunds.com/proxy-voting/voting-policy, or (3) on the U.S. Securities and Exchange Commission’s (the “SEC”) website at www.sec.gov. The Fund’s proxy voting record is available without charge on both the
Hennessy Funds’ website at www.hennessyfunds.com/proxy-voting/voting-record and the SEC’s website at www.sec.gov no later than August 31 for the prior 12 months ending June 30.
Availability of Quarterly Portfolio Schedule
The Fund files a complete schedule of portfolio holdings with the SEC for the first and third quarters of each fiscal year as an exhibit to its reports on Form N-PORT. The Fund’s Forms N-PORT are available on
the SEC’s website at www.sec.gov or on request by calling 1-800-966-4354.
Federal Tax Distribution Information
(Unaudited)
For fiscal year 2019, certain dividends paid by the Fund may be subject to a maximum tax rate of 23.8%, as provided for by the Jobs and Growth Tax Relief Reconciliation Act of 2003. The percentage of dividends
declared from ordinary income designated as qualified dividend income was 100.00%.
For corporate shareholders, the percent of ordinary income distributions that qualified for the corporate dividends received deduction for fiscal year 2019 was 100.00%.
The percentage of taxable ordinary income distributions that were designated as short-term capital gain distributions under Section 871(k)(2)(C) of the Internal Revenue Code of 1986, as
amended, for the Fund was 0.00%.
Important Notice Regarding Delivery
of Shareholder Documents
To help keep the Fund’s costs as low as possible, we generally deliver a single copy of shareholder reports, proxy statements, and prospectuses to shareholders who share an address and have the same last name.
This process does not apply to account statements. You may request an individual copy of a shareholder document at any time. If you would like to receive separate mailings of shareholder documents, please call U.S. Bank Global Fund
Services at 1-800-261-6950 or 1-414-765-4124, and individual delivery will begin within 30 days of your request. If your account is held through a financial institution or other intermediary, please contact such intermediary directly to
request individual delivery.
Electronic Delivery
The Funds offer shareholders the option to receive account statements, prospectuses, tax forms, and shareholder reports online. To sign up for eDelivery, please visit www.hennessyfunds.com/account. You may
change your delivery preference at any time by visiting our website or calling U.S. Bank Global Fund Services at 1-800-261-6950 or 1-414-765-4124.
|
HENNESSY FUNDS
|
1-800-966-4354
|
21
Board Approval of Investment Advisory
Agreement
At its meeting on March 12, 2020, the Board of Trustees of the Fund (the “Board,” and the members thereof, the “Trustees”) unanimously approved the continuation of the investment advisory agreement of the Fund
with Hennessy Advisors, Inc. (the “Advisor”). As part of the process of approving the continuation of the advisory agreement, the Trustees reviewed their fiduciary duties and the relevant factors for them to consider with respect to
approving the advisory agreement. In addition, the Trustees who are not deemed “interested persons” (as defined by the Investment Company Act of 1940, as amended) of the Fund (the “Independent Trustees”) met in executive session to
discuss the approval of the advisory agreement.
In advance of the meeting, the Advisor sent detailed information to the Trustees to assist them in their evaluation of the advisory agreement. This information included, but was not limited
to, the following:
|
(1)
|
A memorandum from outside legal counsel that described the fiduciary duties of the Board with respect to approving the continuation of the advisory agreement and the relevant factors for consideration;
|
|
|
(2)
|
A memorandum from the Advisor that listed the factors relevant to the Board’s approval of the continuation of the advisory agreement and also referenced the documents that had been provided to help the
Board assess each such factor;
|
|
|
(3)
|
An inventory of the services provided by the Advisor;
|
|
|
(4)
|
A written discussion of economies of scale;
|
|
|
(5)
|
A summary of the key terms of the advisory agreement;
|
|
|
(6)
|
A recent Fund fact sheet, which included performance information over various periods;
|
|
|
(7)
|
A peer expense comparison of the net expense ratio and investment advisory fee of the Fund; and
|
|
|
(8)
|
The Advisor’s financial statements from its most recent Form 10-K and Form 10-Q.
|
All of the factors discussed were considered as a whole by the Trustees and by the Independent Trustees meeting in executive session. The factors were viewed in their totality by the
Trustees, with no single factor being the principal or determinative factor in the Trustees’ determination of whether to approve the continuation of the advisory agreement. The Trustees recognized that the management and fee
arrangements for the Fund are the result of years of review and discussion between the Independent Trustees and the Advisor, that certain aspects of such arrangements may receive greater scrutiny in some years than in others, and that
the Trustees’ conclusions may be based, in part, on their consideration of these same arrangements and information received during the course of the year and in prior years.
|
HENNESSYFUNDS.COM
|
22
|
BOARD APPROVAL OF INVESTMENT ADVISORY AGREEMENT
|
Prior to approving the continuation of the advisory agreement, the Trustees, including the Independent Trustees in executive session, considered, among other items:
|
(1)
|
The nature and quality of the advisory services provided by the Advisor;
|
|
|
(2)
|
A comparison of the fees and expenses of the Fund to other similar funds;
|
|
|
(3)
|
Whether economies of scale are recognized by the Fund;
|
|
|
(4)
|
The costs and profitability of the Fund to the Advisor;
|
|
|
(5)
|
The performance of the Fund; and
|
|
|
(6)
|
Any benefits to the Advisor from serving as an investment advisor to the Fund (other than the advisory fee).
|
The material considerations and determinations of the Trustees, including the Independent Trustees, were as follows:
|
(1)
|
The Trustees considered the services identified below that are provided by the Advisor. Based on this review, the Trustees concluded that the Advisor provides high-quality services to the Fund and
noted that their overall confidence in the Advisor was high. The Trustees also concluded that they were satisfied with the nature, extent, and quality of the advisory services provided to the Fund by the Advisor and that the
nature and extent of the services provided by the Advisor were appropriate to assure that the Fund’s operations are conducted in compliance with applicable laws, rules, and regulations.
|
|
(a)
|
The Advisor acts as the portfolio manager for the Fund. In this capacity, the Advisor does the following:
|
|
(i)
|
manages the composition of the Fund’s portfolio, including the purchase, retention, and disposition of portfolio securities in accordance with the Fund’s investment objectives, policies, and
restrictions;
|
|||
|
(ii)
|
seeks best execution for the Fund’s portfolio;
|
|||
|
(iii)
|
manages the use of soft dollars for the Fund; and
|
|||
|
(iv)
|
manages proxy voting for the Fund.
|
|
(b)
|
The Advisor performs a daily reconciliation of portfolio positions and cash for the Fund.
|
||
|
(c)
|
The Advisor monitors the liquidity of each Fund.
|
||
|
(d)
|
The Advisor monitors the Fund’s compliance with its investment objectives and restrictions.
|
||
|
(e)
|
The Advisor monitors compliance with federal securities laws, maintains a compliance program (including a code of ethics), conducts ongoing reviews of the compliance programs of the Fund’s service
providers, as feasible, conducts on-site visits to the Fund’s service providers, monitors incidents of abusive trading practices, reviews Fund expense accruals, payments, and fixed expense ratios, evaluates insurance providers
for fidelity bond, D&O/E&O insurance, and cybersecurity insurance coverage, manages regulatory examination compliance and responses, conducts employee compliance training, reviews reports provided by service providers,
and maintains books and records.
|
||
|
(f)
|
The Advisor oversees service providers that provide accounting, administration, distribution, transfer agency, custodial, sales, marketing, public relations, audit, information technology, and legal
services to the Fund.
|
|
HENNESSY FUNDS
|
1-800-966-4354
|
23
|
(g)
|
The Advisor maintains in-house marketing and distribution departments on behalf of the Fund.
|
||
|
(h)
|
The Advisor is actively involved with preparing regulatory filings for the Fund, including writing and annually updating the Fund’s prospectus and related documents.
|
||
|
(i)
|
For each annual report of the Fund, the Advisor prepares a written summary of the Fund’s performance during the most recent 12-month period.
|
||
|
(j)
|
The Advisor oversees distribution of the Fund through third-party broker/dealers and independent financial institutions such as Charles Schwab, Inc., Fidelity, TD Ameritrade, and Pershing. The Advisor
participates in “no transaction fee” (“NTF”) programs with these companies on behalf of the Fund, which allow customers to purchase the Fund through third-party distribution channels without paying a transaction fee. The Advisor
compensates, in part, a number of these third-party providers of NTF programs out of its own revenues.
|
||
|
(k)
|
The Advisor pays the incentive compensation of the Fund’s compliance officers and employs other staff, such as legal, marketing, national accounts, distribution, sales, administrative, and trading
oversight personnel, as well as management executives.
|
||
|
(l)
|
The Advisor provides a quarterly compliance certification to the Board.
|
||
|
(m)
|
The Advisor prepares or reviews all Board materials, frequently presents to the Board and leads Board discussions, prepares or reviews all meeting minutes, and arranges for Board training and
education.
|
|
(2)
|
The Trustees compared the performance of the Fund to benchmark indices over various periods and also noted that the Trustees review and discuss reports comparing the investment performance of the Fund
to various indices at each quarterly Board meeting. Based on such information, the Trustees determined that the Advisor manages the Fund in a manner materially consistent with its stated investment objective and style. The
Trustees concluded that the performance of the Fund over various periods warranted continuation of the advisory agreement.
|
|
|
(3)
|
The Trustees reviewed the advisory fees and overall expense ratios of the Fund compared to other funds similar in asset size and investment objective to the Fund using data from Morningstar. As part of
the discussion with management, the Trustees ensured that they understood and were comfortable with the criteria used to determine the mutual funds included in the Morningstar categories for purposes of the materials considered
at the meeting. The Trustees determined that the advisory fee and overall expense ratio of the Fund falls within the range of the advisory fees and overall expense ratios of other comparable funds and concluded that they are
reasonable and warranted continuation of the advisory agreement.
|
|
|
(4)
|
The Trustees also considered whether the Advisor was realizing economies of scale that it should share with the Fund’s shareholders. The Trustees noted that the assets of the Fund had declined over the
prior year. In addition, the Trustees noted that many of the expenses incurred to manage the Fund are asset-based fees, so the Advisor does not realize material economies of scale relating to those expenses as the assets of the
Fund increase. For example, mutual fund platform
|
|
HENNESSYFUNDS.COM
|
24
|
BOARD APPROVAL OF INVESTMENT ADVISORY AGREEMENT
|
|
fees increase as the Fund’s assets grow. The Trustees also considered the Advisor’s efforts to contain expenses through actions such as renegotiating service contracts, the Advisor’s significant
marketing efforts to promote the Funds, the Advisor’s investments in personnel to manage the Funds, and the Advisor’s agreement to waive fees or lower its management fees in certain circumstances. The Trustees noted that it did
not appear that the Advisor was realizing economies of scale at current asset levels and concluded that it would continue to monitor economies of scale in the future as circumstances changed.
|
||
|
(5)
|
The Trustees considered the profitability of the Advisor, including the impact of mutual fund platform fees on the Advisor’s profitability, and also considered the resources and revenues that the
Advisor has put into managing and distributing the Fund. The Trustees then concluded that the profits of the Advisor are reasonable and not excessive when compared to profitability guidelines set forth in relevant court cases.
|
|
|
(6)
|
The Trustees considered the high level of professionalism and knowledge of the Advisor’s employees, along with a very low level of turnover, and concluded that this was beneficial to the Fund and its
shareholders.
|
|
|
(7)
|
The Trustees considered any benefits to the Advisor from serving as an advisor to the Fund (other than the advisory fee). The Trustees noted that the Advisor may derive ancillary benefits from, by way
of example, its association with the Fund in the form of proprietary and third-party research products and services received from broker-dealers that execute portfolio trades for the Fund. The Trustees determined that any such
products and services have been used for legitimate purposes relating to the Fund by providing assistance in the investment decision-making process. The Trustees concluded that any additional benefits realized by the Advisor
from its relationship with the Fund were reasonable, which was based on, among other things, the Trustees’ finding that the research, analytical, statistical, and other information and services provided by brokers are merely
supplemental to the Advisor’s own efforts in the performance of its duties under the advisory agreement.
|
After reviewing the materials and information provided at the meeting, as well as other information regularly provided at the Board’s quarterly meetings throughout the year regarding the
quality of services provided by the Advisor, the performance of the Fund, expense information, brokerage commissions information, the adequacy and efficacy of the Advisor’s written policies and procedures, other regulatory compliance
issues, trading information and related matters, and other factors that the Trustees deemed relevant, the Trustees, including the Independent Trustees, approved the continuation of the advisory agreement.
|
HENNESSY FUNDS
|
1-800-966-4354
|
25
For information, questions, or assistance, please call
The Hennessy Funds
1-800-966-4354 or 1-415-899-1555
INVESTMENT ADVISOR
Hennessy Advisors, Inc.
7250 Redwood Boulevard, Suite 200
Novato, California 94945
ADMINISTRATOR,
TRANSFER AGENT,
DIVIDEND PAYING AGENT, &
SHAREHOLDER SERVICING AGENT
U.S. Bancorp Fund Services, LLC
d/b/a U.S. Bank Global Fund Services
P.O. Box 701
Milwaukee, Wisconsin 53201-0701
CUSTODIAN
U.S. Bank N.A.
Custody Operations
1555 North River Center Drive, Suite 302
Milwaukee, Wisconsin 53212
TRUSTEES
Neil J. Hennessy
Robert T. Doyle
J. Dennis DeSousa
Gerald P. Richardson
COUNSEL
Foley & Lardner LLP
777 East Wisconsin Avenue
Milwaukee, Wisconsin 53202-5306
INDEPENDENT REGISTERED
PUBLIC ACCOUNTING FIRM
Tait, Weller & Baker LLP
Two Liberty Place
50 South 16th Street, Suite 2900
Philadelphia, Pennsylvania 19102-2529
DISTRIBUTOR
Quasar Distributors, LLC
111 East Kilbourn Avenue, Suite 2200
Milwaukee, Wisconsin 53202
www.hennessyfunds.com | 1-800-966-4354
This report has been prepared for shareholders and may be distributed to
others only if preceded or accompanied by a current prospectus.
SEMI-ANNUAL REPORT
APRIL 30, 2020

HENNESSY BP ENERGY FUND
Investor Class HNRGX
Institutional Class HNRIX
IMPORTANT NOTICE REGARDING ELECTRONIC DELIVERY OF SHAREHOLDER REPORTS
Beginning on January 1, 2021, as permitted by regulations adopted by the Securities and Exchange Commission, paper copies of the annual and semi-annual
reports will no longer be sent by mail unless you specifically request paper copies from the Hennessy Funds or from your financial intermediary. Instead, the reports will be made available on a website, and you will be
notified by mail each time a report is posted and provided with a website link to access the report.
If you have already elected to receive shareholder reports electronically, you will not be affected by this change and you need not take any action. You
may elect to receive shareholder reports and other communications from the Hennessy Funds electronically by visiting www.hennessyfunds.com/account or by calling U.S. Bank Global Fund Services at 1-800-261-6950. If you own
shares in a Fund through a financial intermediary, please contact your financial intermediary to make this election.
You may elect to receive paper copies of all future reports free of charge by calling U.S. Bank Global Fund Services at 1-800-261-6950 or, if you own your
shares through a financial intermediary, by contacting your financial intermediary. Your election to receive paper copies of reports will apply to all Funds in the Hennessy Funds family.
hennessyfunds.com | 1-800-966-4354
(This Page Intentionally Left Blank.)
Contents
|
Letter to Shareholders
|
2
|
|
Performance Overview
|
4
|
|
Financial Statements
|
|
|
Schedule of Investments
|
5
|
|
Statement of Assets and Liabilities
|
9
|
|
Statement of Operations
|
10
|
|
Statements of Changes in Net Assets
|
11
|
|
Financial Highlights
|
12
|
|
Notes to the Financial Statements
|
16
|
|
Expense Example
|
24
|
|
Proxy Voting Policy and Proxy Voting Records
|
26
|
|
Availability of Quarterly Portfolio Schedule
|
26
|
|
Important Notice Regarding Delivery of Shareholder Documents
|
26
|
|
Electronic Delivery
|
26
|
|
Board Approval of Investment Advisory Agreements
|
27
|
|
HENNESSY FUNDS
|
1-800-966-4354
|
June 2020
Dear Hennessy Funds Shareholder:
First and foremost, I hope this communication finds you and your loved ones safe and healthy. In many ways, the COVID-19 pandemic has turned the world upside down in recent months, and we at Hennessy have
joined the rest of the world in witnessing and experiencing its profound effect on public health, the global economy, and the everyday lives of people around the world. In response to the crisis, we invoked our business continuity
plan in mid-March to ensure a smooth transition to remote work for all of our employees, who have been working safely and productively from home. We want to assure our Hennessy Funds shareholders that our operations are uninterrupted
and functioning normally.
The past six months have been marked by extremes. During the first half of the period from November 2019 through January 2020, the bull market, supported by strong corporate fundamentals,
continued to move higher, and investors appeared focused on record-low unemployment and strong economic growth. In mid-February, the major U.S. market indices hit all-time highs, but then, within just a matter of weeks, lost over
one-third of their values as the COVID-19 pandemic unfolded. Shelter-in-place and business closure orders rippled through the nation, causing initial unemployment claims to skyrocket to their highest number in history. The market then
rallied back and posted double-digit positive returns in April.
For the six months ended April 30, 2020, on a total return basis, the Dow Jones Industrial Average was down 8.9% and the S&P 500® Index was down 3.2%. Small-cap and mid-cap stocks generally fared worse than large-cap stocks during the period, and the Financial sector was particularly hard hit as the Federal Reserve aggressively cut
the federal funds rate in an effort to stabilize the economy. The Energy sector was crushed by both the sudden loss of demand due to COVID-19 and the oversupply caused by the surprise market-share battle between Russia and Saudi
Arabia, and the S&P 500® Energy Sector Index ended the six-month period down over 30%.
The COVID-19 pandemic is an unprecedented event, and the duration and full extent of the economic impact is unknown. In the moment, there is always the concern that ‘this time is
different.’ But, when you are able to look at past financial, political, and health crises with the benefit of 20/20 hindsight, history has demonstrated that our economy and financial markets have always rebounded and recovered
eventually. If you look back to the last market downturn in 2008, economic fundamentals were weak compared to the market in 2020, where the overall underpinnings were – and are still – quite strong. Publicly listed companies today
have plenty of cash, with over $5 trillion on balance sheets of the S&P 500® companies alone, and I believe that most will survive and that many may
emerge from the current crisis even stronger.
|
HENNESSYFUNDS.COM
|
2
|
LETTER TO SHAREHOLDERS
|
We understand that this market volatility and economic uncertainty is jarring to many investors, and we continue to monitor events and the markets. We remain focused on managing our
high-conviction portfolios for the long-term benefit of our shareholders, and we are confident in the time-tested strategies and rigorous research that led to their formation. We encourage shareholders to maintain a long-term
investment horizon and to remain focused on long-term goals. As always, but especially in these trying times, we are here to support our shareholders, and we thank you for your continued investment and trust. Should you have any
questions or would like to speak with us directly, please don’t hesitate to call (800) 966-4354 or email us at fundsinfo@hennessyfunds.com.
Best regards,
Neil J. Hennessy
President and Chief Investment Officer
Past performance does not guarantee future results.
Mutual fund investing involves risk. Principal loss is possible.
The Dow Jones Industrial Average and S&P 500® Index are commonly used to measure the performance of U.S. stocks. The
S&P 500® Energy Sector Index is an index that comprises those companies included in the S&P 500 that are classified as members of the GICS energy
sector. One cannot invest directly in an index.
|
HENNESSY FUNDS
|
1-800-966-4354
|
3
Performance Overview (Unaudited)
AVERAGE ANNUAL TOTAL RETURN FOR PERIODS ENDED APRIL 30, 2020
|
Six
|
One
|
Five
|
Since Inception
|
|
|
Months(1)
|
Year
|
Years
|
(12/31/13)
|
|
|
Hennessy BP Energy Fund –
|
||||
|
Investor Class (HNRGX)
|
-36.72%
|
-48.44%
|
-16.61%
|
-11.62%
|
|
Hennessy BP Energy Fund –
|
||||
|
Institutional Class (HNRIX)
|
-36.68%
|
-48.31%
|
-16.37%
|
-11.41%
|
|
S&P 500® Energy Index
|
-30.58%
|
-38.29%
|
-10.78%
|
-9.28%
|
|
S&P 500® Index
|
-3.16%
|
0.86%
|
9.12%
|
9.66%
|
Expense ratios: 1.98% (Investor Class); 1.67% (Institutional Class)
|
(1)
|
Periods of less than one year are not annualized.
|
_______________
Performance data quoted represents past performance; past performance does not guarantee future results. The investment return and principal value of an investment will fluctuate so that
an investor’s shares, when redeemed, may be worth more or less than their original cost. The performance table does not reflect the deduction of taxes that a shareholder would pay on Fund distributions or the redemption of Fund
shares. Current performance of the Fund may be lower or higher than the performance quoted. Performance data current to the most recent month end may be obtained by visiting www.hennessyfunds.com. Performance for periods on or prior
to October 26, 2018, is that of the BP Capital TwinLine Energy Fund.
The S&P 500® Energy Index comprises those companies included in the S&P 500® that are classified in the Energy sector. The S&P 500® Index is a capitalization-weighted index that
is designed to represent the broad domestic economy through changes in the aggregate market value of 500 stocks across all major industries. One cannot invest directly in an index. These indices are used herein for comparative
purposes in accordance with SEC regulations.
Standard & Poor’s Financial Services LLC is the source and owner of the S&P® and S&P 500® trademarks.
The expense ratios presented are from the most recent prospectus. The expense ratios for the current reporting period are available in the Financial Highlights section of this report.
|
HENNESSYFUNDS.COM
|
4
|
PERFORMANCE OVERVIEW/SCHEDULE OF INVESTMENTS
|
Financial Statements
|
Schedule of Investments as of April 30,
2020 (Unaudited)
|
HENNESSY BP ENERGY FUND
(% of Total Assets)

|
TOP TEN HOLDINGS (EXCLUDING MONEY MARKET FUNDS)
|
% TOTAL ASSETS
|
|
Cabot Oil & Gas Corp.
|
7.14%
|
|
Pioneer Natural Resources Co.
|
6.93%
|
|
EOG Resources, Inc.
|
6.88%
|
|
Marathon Petroleum Corp.
|
6.19%
|
|
Energy Transfer LP
|
6.05%
|
|
PDC Energy, Inc.
|
5.95%
|
|
Concho Resources, Inc.
|
5.56%
|
|
WPX Energy, Inc.
|
5.27%
|
|
Enterprise Products Partners LP
|
5.12%
|
|
MPLX LP
|
4.76%
|
Note: The Fund concentrates its investments in the Energy industry. For presentation purposes, the Fund uses custom categories.
|
HENNESSY FUNDS
|
1-800-966-4354
|
5
|
COMMON STOCKS – 77.10%
|
Number
|
% of
|
||||||||||
|
|
of Shares
|
Value
|
Net Assets
|
|||||||||
|
Downstream – 10.57%
|
||||||||||||
|
Marathon Petroleum Corp.
|
29,500
|
$
|
946,360
|
6.32
|
%
|
|||||||
|
Valero Energy Corp.
|
10,050
|
636,668
|
4.25
|
%
|
||||||||
|
|
1,583,028
|
10.57
|
%
|
|||||||||
|
Exploration & Production – 44.93%
|
||||||||||||
|
Cabot Oil & Gas Corp.
|
50,500
|
1,091,810
|
7.29
|
%
|
||||||||
|
Concho Resources, Inc.
|
14,980
|
849,666
|
5.67
|
%
|
||||||||
|
Diamondback Energy, Inc.
|
14,030
|
610,866
|
4.08
|
%
|
||||||||
|
EOG Resources, Inc.
|
22,160
|
1,052,822
|
7.03
|
%
|
||||||||
|
Parsley Energy, Inc., – Class A
|
37,030
|
349,933
|
2.34
|
%
|
||||||||
|
PDC Energy, Inc. (a)
|
70,000
|
909,300
|
6.07
|
%
|
||||||||
|
Pioneer Natural Resources Co.
|
11,860
|
1,059,217
|
7.07
|
%
|
||||||||
|
WPX Energy, Inc. (a)
|
131,450
|
805,788
|
5.38
|
%
|
||||||||
|
|
6,729,402
|
44.93
|
%
|
|||||||||
|
Midstream – 9.98%
|
||||||||||||
|
Cheniere Energy, Inc. (a)
|
12,350
|
576,621
|
3.85
|
%
|
||||||||
|
ONEOK, Inc.
|
15,430
|
461,820
|
3.08
|
%
|
||||||||
|
The Williams Companies, Inc.
|
23,540
|
455,970
|
3.05
|
%
|
||||||||
|
|
1,494,411
|
9.98
|
%
|
|||||||||
|
Oil Services – 3.47%
|
||||||||||||
|
Schlumberger Ltd. (b)
|
30,860
|
519,065
|
3.47
|
%
|
||||||||
|
Renewable – 5.60%
|
||||||||||||
|
First Solar, Inc. (a)
|
9,880
|
434,819
|
2.90
|
%
|
||||||||
|
TPI Composites, Inc. (a)
|
23,050
|
404,066
|
2.70
|
%
|
||||||||
|
|
838,885
|
5.60
|
%
|
|||||||||
|
Utility – 2.55%
|
||||||||||||
|
NextEra Energy, Inc.
|
1,650
|
381,348
|
2.55
|
%
|
||||||||
|
|
||||||||||||
|
Total Common Stocks
|
||||||||||||
|
(Cost $17,265,028)
|
11,546,139
|
77.10
|
%
|
|||||||||
The accompanying notes are an integral part of these financial statements.
|
HENNESSYFUNDS.COM
|
6
|
SCHEDULE OF INVESTMENTS
|
|
PARTNERSHIPS & TRUSTS – 21.02%
|
Number
|
% of
|
||||||||||
|
|
of Shares
|
Value
|
Net Assets
|
|||||||||
|
Midstream – 21.02%
|
||||||||||||
|
Energy Transfer LP
|
110,136
|
$
|
925,142
|
6.18
|
%
|
|||||||
|
Enterprise Products Partners LP
|
44,629
|
783,685
|
5.23
|
%
|
||||||||
|
MPLX LP
|
40,194
|
727,511
|
4.86
|
%
|
||||||||
|
Plains All American Pipeline LP
|
80,620
|
711,875
|
4.75
|
%
|
||||||||
|
|
3,148,213
|
21.02
|
%
|
|||||||||
|
Total Partnerships & Trusts
|
||||||||||||
|
(Cost $5,535,041)
|
3,148,213
|
21.02
|
%
|
|||||||||
|
|
||||||||||||
|
SHORT-TERM INVESTMENTS – 0.01%
|
||||||||||||
|
Money Market Funds – 0.01%
|
||||||||||||
|
First American Government Obligations Fund,
|
||||||||||||
|
Institutional Class, 0.25% (c)
|
969
|
969
|
0.01
|
%
|
||||||||
|
|
||||||||||||
|
Total Short-Term Investments
|
||||||||||||
|
(Cost $969)
|
969
|
0.01
|
%
|
|||||||||
|
|
||||||||||||
|
Total Investments
|
||||||||||||
|
(Cost $22,801,038) – 98.13%
|
14,695,321
|
98.13
|
%
|
|||||||||
|
Other Assets in Excess of Liabilities – 1.87%
|
280,786
|
1.87
|
%
|
|||||||||
|
|
||||||||||||
|
TOTAL NET ASSETS – 100.00%
|
$
|
14,976,107
|
100.00
|
%
|
||||||||
Percentages are stated as a percent of net assets.
|
(a)
|
Non-income-producing security.
|
|
(b)
|
U.S.-traded security of a foreign corporation.
|
|
(c)
|
The rate listed is the fund’s seven-day yield as of April 30, 2020.
|
The accompanying notes are an integral part of these financial statements.
|
HENNESSY FUNDS
|
1-800-966-4354
|
7
Summary of Fair Value Exposure as of April 30, 2020
The following is a summary of the inputs used to value the Fund’s net assets as of April 30, 2020 (see Note 3 in the accompanying Notes to the Financial Statements):
|
Common Stocks
|
Level 1
|
Level 2
|
Level 3
|
Total
|
||||||||||||
|
Downstream
|
$
|
1,583,028
|
$
|
—
|
$
|
—
|
$
|
1,583,028
|
||||||||
|
Exploration & Production
|
6,729,402
|
—
|
—
|
6,729,402
|
||||||||||||
|
Midstream
|
1,494,411
|
—
|
—
|
1,494,411
|
||||||||||||
|
Oil Services
|
519,065
|
—
|
—
|
519,065
|
||||||||||||
|
Renewable
|
838,885
|
—
|
—
|
838,885
|
||||||||||||
|
Utility
|
381,348
|
—
|
—
|
381,348
|
||||||||||||
|
Total Common Stocks
|
$
|
11,546,139
|
$
|
—
|
$
|
—
|
$
|
11,546,139
|
||||||||
|
Partnerships & Trusts
|
||||||||||||||||
|
Midstream
|
$
|
3,148,213
|
$
|
—
|
$
|
—
|
$
|
3,148,213
|
||||||||
|
Total Partnerships & Trusts
|
$
|
3,148,213
|
$
|
—
|
$
|
—
|
$
|
3,148,213
|
||||||||
|
Short-Term Investments
|
||||||||||||||||
|
Money Market Funds
|
$
|
969
|
$
|
—
|
$
|
—
|
$
|
969
|
||||||||
|
Total Short-Term Investments
|
$
|
969
|
$
|
—
|
$
|
—
|
$
|
969
|
||||||||
|
Total Investments
|
$
|
14,695,321
|
$
|
—
|
$
|
—
|
$
|
14,695,321
|
||||||||
The accompanying notes are an integral part of these financial statements.
|
HENNESSYFUNDS.COM
|
8
|
SCHEDULE OF INVESTMENTS/STATEMENT OF ASSETS AND LIABILITIES
|
Financial Statements
|
Statement of Assets and Liabilities as of April 30, 2020 (Unaudited)
|
|
ASSETS:
|
||||
|
Investments in securities, at value (cost $22,801,038)
|
$
|
14,695,321
|
||
|
Dividends and interest receivable
|
6,061
|
|||
|
Receivable for fund shares sold
|
529,000
|
|||
|
Return of capital receivable
|
42,739
|
|||
|
Prepaid expenses and other assets
|
19,710
|
|||
|
Total assets
|
15,292,831
|
|||
|
LIABILITIES:
|
||||
|
Payable for fund shares redeemed
|
207,823
|
|||
|
Payable to advisor
|
5,022
|
|||
|
Payable to administrator
|
4,122
|
|||
|
Payable to auditor
|
11,373
|
|||
|
Accrued distribution fees
|
1,521
|
|||
|
Accrued service fees
|
243
|
|||
|
Loans payable
|
75,000
|
|||
|
Accrued trustees fees
|
6,452
|
|||
|
Accrued expenses and other payables
|
5,168
|
|||
|
Total liabilities
|
316,724
|
|||
|
NET ASSETS
|
$
|
14,976,107
|
||
|
NET ASSETS CONSISTS OF:
|
||||
|
Capital stock
|
$
|
60,031,017
|
||
|
Accumulated deficit
|
(45,054,910
|
)
|
||
|
Total net assets
|
$
|
14,976,107
|
||
|
NET ASSETS:
|
||||
|
Investor Class
|
||||
|
Shares authorized (no par value)
|
Unlimited
|
|||
|
Net assets applicable to outstanding shares
|
$
|
4,104,220
|
||
|
Shares issued and outstanding
|
460,679
|
|||
|
Net asset value, offering price, and redemption price per share
|
$
|
8.91
|
||
|
Institutional Class
|
||||
|
Shares authorized (no par value)
|
Unlimited
|
|||
|
Net assets applicable to outstanding shares
|
$
|
10,871,887
|
||
|
Shares issued and outstanding
|
1,207,625
|
|||
|
Net asset value, offering price, and redemption price per share
|
$
|
9.00
|
||
The accompanying notes are an integral part of these financial statements.
|
HENNESSY FUNDS
|
1-800-966-4354
|
9
Financial Statements
|
Statement of Operations for the six months ended April 30, 2020 (Unaudited)
|
|
INVESTMENT INCOME:
|
||||
|
Distributions received from master limited partnerships
|
$
|
294,873
|
||
|
Return of capital on distributions received
|
(294,873
|
)
|
||
|
Dividend income from common stock(1)
|
548,704
|
|||
|
Interest income
|
6,053
|
|||
|
Total investment income
|
554,757
|
|||
|
EXPENSES:
|
||||
|
Investment advisory fees (See Note 5)
|
213,331
|
|||
|
Administration, accounting, custody, and transfer agent fees (See Note 5)
|
23,534
|
|||
|
Federal and state registration fees
|
16,827
|
|||
|
Compliance expense (See Note 5)
|
13,462
|
|||
|
Audit fees
|
11,375
|
|||
|
Sub-transfer agent expenses – Investor Class (See Note 5)
|
3,031
|
|||
|
Sub-transfer agent expenses – Institutional Class (See Note 5)
|
7,759
|
|||
|
Trustees’ fees and expenses
|
8,469
|
|||
|
Reports to shareholders
|
5,647
|
|||
|
Distribution fees – Investor Class (See Note 5)
|
3,978
|
|||
|
Interest expense (See Note 7)
|
3,118
|
|||
|
Service fees – Investor Class (See Note 5)
|
2,652
|
|||
|
Legal fees
|
904
|
|||
|
Other expenses
|
3,535
|
|||
|
Total expenses before reimbursement by advisor
|
317,622
|
|||
|
Expense reimbursement by advisor – Investor Class (See Note 5)
|
(3,874
|
)
|
||
|
Expense reimbursement by advisor – Institutional Class (See Note 5)
|
(5,336
|
)
|
||
|
Net expenses
|
308,412
|
|||
|
NET INVESTMENT INCOME
|
$
|
246,345
|
||
|
REALIZED AND UNREALIZED GAINS (LOSSES):
|
||||
|
Net realized loss on investments
|
$
|
(14,462,499
|
)
|
|
|
Net change in unrealized appreciation/depreciation on investments
|
(1,614,081
|
)
|
||
|
Net loss on investments
|
(16,076,580
|
)
|
||
|
NET DECREASE IN NET ASSETS RESULTING FROM OPERATIONS
|
$
|
(15,830,235
|
)
|
|
|
(1)
|
Net of foreign taxes withheld and issuance fees of $4,578.
|
The accompanying notes are an integral part of these financial statements.
|
HENNESSYFUNDS.COM
|
10
|
STATEMENT OF OPERATIONS/STATEMENTS OF CHANGES IN NET ASSETS
|
Financial Statements
|
Statements of Changes in Net Assets
|
|
Six Months Ended
|
||||||||
|
April 30, 2020
|
Year Ended
|
|||||||
|
(Unaudited)
|
October 31, 2019
|
|||||||
|
OPERATIONS:
|
||||||||
|
Net investment income (loss)
|
$
|
246,345
|
$
|
(122,873
|
)
|
|||
|
Net realized loss on investments
|
(14,462,499
|
)
|
(21,032,537
|
)
|
||||
|
Net change in unrealized
|
||||||||
|
appreciation/depreciation on investments
|
(1,614,081
|
)
|
1,070,019
|
|||||
|
Net decrease in net assets resulting from operations
|
(15,830,235
|
)
|
(20,085,391
|
)
|
||||
|
DISTRIBUTIONS TO SHAREHOLDERS:
|
||||||||
|
Distributable earnings – Institutional Class
|
(79,003
|
)
|
—
|
|||||
|
Total distributions
|
(79,003
|
)
|
—
|
|||||
|
CAPITAL SHARE TRANSACTIONS:
|
||||||||
|
Proceeds from shares subscribed – Investor Class
|
1,226,789
|
1,329,654
|
||||||
|
Proceeds from shares subscribed – Institutional Class
|
1,683,142
|
21,431,696
|
||||||
|
Dividends reinvested – Institutional Class
|
77,299
|
—
|
||||||
|
Cost of shares redeemed – Investor Class
|
(1,750,609
|
)
|
(9,317,247
|
)
|
||||
|
Cost of shares redeemed – Institutional Class
|
(21,551,990
|
)
|
(39,120,012
|
)
|
||||
|
Net decrease in net assets derived
|
||||||||
|
from capital share transactions
|
(20,315,369
|
)
|
(25,675,909
|
)
|
||||
|
TOTAL DECREASE IN NET ASSETS
|
(36,224,607
|
)
|
(45,761,300
|
)
|
||||
|
NET ASSETS:
|
||||||||
|
Beginning of period
|
51,200,714
|
96,962,014
|
||||||
|
End of period
|
$
|
14,976,107
|
$
|
51,200,714
|
||||
|
CHANGES IN SHARES OUTSTANDING:
|
||||||||
|
Shares sold – Investor Class
|
143,860
|
83,075
|
||||||
|
Shares sold – Institutional Class
|
174,370
|
1,375,469
|
||||||
|
Shares issued to holders as reinvestment
|
||||||||
|
of dividends – Institutional Class
|
5,019
|
—
|
||||||
|
Shares redeemed – Investor Class
|
(168,111
|
)
|
(588,930
|
)
|
||||
|
Shares redeemed – Institutional Class
|
(2,083,457
|
)
|
(2,524,419
|
)
|
||||
|
Net decrease in shares outstanding
|
(1,928,319
|
)
|
(1,654,805
|
)
|
||||
The accompanying notes are an integral part of these financial statements.
|
HENNESSY FUNDS
|
1-800-966-4354
|
11
Financial Statements
|
Financial Highlights
|
For an Investor Class share outstanding throughout each period
|
Six Months Ended
|
||||
|
April 30, 2020
|
||||
|
(Unaudited)
|
||||
|
PER SHARE DATA:
|
||||
|
Net asset value, beginning of period
|
$
|
14.08
|
||
|
Income from investment operations:
|
||||
|
Net investment income (loss)(3)
|
0.09
|
|||
|
Net realized and unrealized gains (losses) on investments
|
(5.26
|
)
|
||
|
Total from investment operations
|
(5.17
|
)
|
||
|
Less distributions:
|
||||
|
Dividends from net realized gains
|
—
|
|||
|
Total distributions
|
—
|
|||
|
Net asset value, end of period
|
$
|
8.91
|
||
|
TOTAL RETURN
|
-36.72
|
%(4)
|
||
|
SUPPLEMENTAL DATA AND RATIOS:
|
||||
|
Net assets, end of period (millions)
|
$
|
4.10
|
||
|
Ratio of expenses to average net assets:
|
||||
|
Before expense reimbursement
|
2.18
|
%(5)
|
||
|
After expense reimbursement
|
2.03
|
%(5)
|
||
|
Ratio of net investment income (loss) to average net assets:
|
||||
|
Before expense reimbursement
|
1.34
|
%(5)
|
||
|
After expense reimbursement
|
1.49
|
%(5)
|
||
|
Portfolio turnover rate(6)
|
41
|
%(4)
|
||
|
(1)
|
The period ended October 31, 2018, consists of 11 months due to the Fund’s fiscal year end change from November 30 to October 31, effective October 26, 2018.
|
|
(2)
|
Fund commenced operations on December 31, 2013.
|
|
(3)
|
Calculated using the average shares outstanding method.
|
|
(4)
|
Not annualized.
|
|
(5)
|
Annualized.
|
|
(6)
|
Calculated on the basis of the Fund as a whole.
|
The accompanying notes are an integral part of these financial statements.
|
HENNESSYFUNDS.COM
|
12
|
FINANCIAL HIGHLIGHTS — INVESTOR CLASS
|
|
Year Ended
|
Period Ended
|
Period Ended
|
||||||||||||||||||||
|
October 31,
|
October 31,
|
Year Ended November 30,
|
November 30,
|
|||||||||||||||||||
|
2019
|
2018(1)
|
2017
|
2016
|
2015
|
2014(2)
|
|||||||||||||||||
|
$
|
18.32
|
$
|
19.47
|
$
|
20.54
|
$
|
16.41
|
$
|
20.45
|
$
|
20.00
|
|||||||||||
|
(0.07
|
)
|
(0.20
|
)
|
(0.23
|
)
|
(0.15
|
)
|
(0.10
|
)
|
(0.11
|
)
|
|||||||||||
|
(4.17
|
)
|
(0.95
|
)
|
(0.84
|
)
|
4.28
|
(3.46
|
)
|
0.56
|
|||||||||||||
|
(4.24
|
)
|
(1.15
|
)
|
(1.07
|
)
|
4.13
|
(3.56
|
)
|
0.45
|
|||||||||||||
|
—
|
—
|
—
|
—
|
(0.48
|
)
|
—
|
||||||||||||||||
|
—
|
—
|
—
|
—
|
(0.48
|
)
|
—
|
||||||||||||||||
|
$
|
14.08
|
$
|
18.32
|
$
|
19.47
|
$
|
20.54
|
$
|
16.41
|
$
|
20.45
|
|||||||||||
|
-23.14
|
%
|
-5.91
|
%(4)
|
-5.21
|
%
|
25.17
|
%
|
-17.57
|
%
|
2.25
|
%(4)
|
|||||||||||
|
$
|
6.83
|
$
|
18.16
|
$
|
22.66
|
$
|
19.64
|
$
|
18.72
|
$
|
15.14
|
|||||||||||
|
1.97
|
%
|
1.82
|
%(5)
|
1.87
|
%
|
1.89
|
%
|
1.87
|
%
|
1.98
|
%(5)
|
|||||||||||
|
1.97
|
%
|
1.82
|
%(5)
|
1.87
|
%
|
1.89
|
%
|
1.87
|
%
|
1.98
|
%(5)
|
|||||||||||
|
(0.46
|
)%
|
(1.05
|
)%(5)
|
(1.21
|
)%
|
(0.92
|
)%
|
(0.51
|
)%
|
(0.53
|
)%(5)
|
|||||||||||
|
(0.46
|
)%
|
(1.05
|
)%(5)
|
(1.21
|
)%
|
(0.92
|
)%
|
(0.51
|
)%
|
(0.53
|
)%(5)
|
|||||||||||
|
87
|
%
|
72
|
%(4)
|
84
|
%
|
83
|
%
|
79
|
%
|
72
|
%(4)
|
|||||||||||
The accompanying notes are an integral part of these financial statements.
|
HENNESSY FUNDS
|
1-800-966-4354
|
13
Financial Statements
|
Financial Highlights
|
For an Institutional Class share outstanding throughout each period
|
Six Months Ended
|
||||
|
April 30, 2020
|
||||
|
(Unaudited)
|
||||
|
PER SHARE DATA:
|
||||
|
Net asset value, beginning of period
|
$
|
14.26
|
||
|
Income from investment operations:
|
||||
|
Net investment income (loss)(3)
|
0.09
|
|||
|
Net realized and unrealized gains (losses) on investments
|
(5.32
|
)
|
||
|
Total from investment operations
|
(5.23
|
)
|
||
|
Less distributions:
|
||||
|
Dividends from net investment income
|
(0.03
|
)
|
||
|
Dividends from net realized gains
|
—
|
|||
|
Total distributions
|
(0.03
|
)
|
||
|
Net asset value, end of period
|
$
|
9.00
|
||
|
TOTAL RETURN
|
-36.68
|
%(4)
|
||
|
SUPPLEMENTAL DATA AND RATIOS:
|
||||
|
Net assets, end of period (millions)
|
$
|
10.87
|
||
|
Ratio of expenses to average net assets:
|
||||
|
Before expense reimbursement
|
1.80
|
%(5)
|
||
|
After expense reimbursement
|
1.77
|
%(5)
|
||
|
Ratio of net investment income (loss) to average net assets:
|
||||
|
Before expense reimbursement
|
1.40
|
%(5)
|
||
|
After expense reimbursement
|
1.43
|
%(5)
|
||
|
Portfolio turnover rate(6)
|
41
|
%(4)
|
||
|
(1)
|
The period ended October 31, 2018, consists of 11 months due to the Fund’s fiscal year end change from November 30 to October 31, effective October 26, 2018.
|
|
(2)
|
Fund commenced operations on December 31, 2013.
|
|
(3)
|
Calculated using the average shares outstanding method.
|
|
(4)
|
Not annualized.
|
|
(5)
|
Annualized.
|
|
(6)
|
Calculated on the basis of the Fund as a whole.
|
The accompanying notes are an integral part of these financial statements.
|
HENNESSYFUNDS.COM
|
14
|
FINANCIAL HIGHLIGHTS — INSTITUTIONAL CLASS
|
|
Year Ended
|
Period Ended
|
Period Ended
|
||||||||||||||||||||
|
October 31,
|
October 31,
|
Year Ended November 30,
|
November 30,
|
|||||||||||||||||||
|
2019
|
2018(1)
|
2017
|
2016
|
2015
|
2014(2)
|
|||||||||||||||||
|
$
|
18.50
|
$
|
19.61
|
$
|
20.64
|
$
|
16.46
|
$
|
20.45
|
$
|
20.00
|
|||||||||||
|
(0.02
|
)
|
(0.15
|
)
|
(0.19
|
)
|
(0.11
|
)
|
(0.04
|
)
|
(0.06
|
)
|
|||||||||||
|
(4.22
|
)
|
(0.96
|
)
|
(0.84
|
)
|
4.32
|
(3.47
|
)
|
0.51
|
|||||||||||||
|
(4.24
|
)
|
(1.11
|
)
|
(1.03
|
)
|
4.21
|
(3.51
|
)
|
0.45
|
|||||||||||||
|
—
|
—
|
—
|
(0.03
|
)
|
—
|
—
|
||||||||||||||||
|
—
|
—
|
—
|
—
|
(0.48
|
)
|
—
|
||||||||||||||||
|
—
|
—
|
—
|
(0.03
|
)
|
(0.48
|
)
|
—
|
|||||||||||||||
|
$
|
14.26
|
$
|
18.50
|
$
|
19.61
|
$
|
20.64
|
$
|
16.46
|
$
|
20.45
|
|||||||||||
|
-22.92
|
%
|
-5.66
|
%(4)
|
-4.99
|
%
|
25.61
|
%
|
-17.32
|
%
|
2.25
|
%(4)
|
|||||||||||
|
$
|
44.37
|
$
|
78.81
|
$
|
122.45
|
$
|
126.92
|
$
|
100.05
|
$
|
68.31
|
|||||||||||
|
1.66
|
%
|
1.57
|
%(5)
|
1.62
|
%
|
1.60
|
%
|
1.54
|
%
|
1.73
|
%(5)
|
|||||||||||
|
1.66
|
%
|
1.57
|
%(5)
|
1.62
|
%
|
1.60
|
%
|
1.54
|
%
|
1.73
|
%(5)
|
|||||||||||
|
(0.12
|
)%
|
(0.79
|
)%(5)
|
(0.98
|
)%
|
(0.65
|
)%
|
(0.20
|
)%
|
(0.28
|
)%(5)
|
|||||||||||
|
(0.12
|
)%
|
(0.79
|
)%(5)
|
(0.98
|
)%
|
(0.65
|
)%
|
(0.20
|
)%
|
(0.28
|
)%(5)
|
|||||||||||
|
87
|
%
|
72
|
%(4)
|
84
|
%
|
83
|
%
|
79
|
%
|
72
|
%(4)
|
|||||||||||
The accompanying notes are an integral part of these financial statements.
|
HENNESSY FUNDS
|
1-800-966-4354
|
15
Financial Statements
|
Notes to the Financial Statements April 30, 2020 (Unaudited)
|
1). ORGANIZATION
The Hennessy BP Energy Fund (the “Fund”) is a series of Hennessy Funds Trust (the “Trust”), which was organized as a Delaware statutory trust on September 17, 1992. The Fund is an open-end management
investment company registered under the Investment Company Act of 1940, as amended. The investment objective of the Fund is to seek total return. The Fund is a diversified fund.
The Fund offers Investor Class and Institutional Class shares. Each class of shares differs principally in its respective 12b-1 distribution and service, shareholder servicing, and
sub-transfer agent expenses. There are no sales charges. Each class has identical rights to earnings, assets, and voting privileges, except for class-specific expenses and exclusive rights to vote on matters affecting only one class.
As an investment company, the Fund follows the investment company accounting and reporting guidance of the Financial Accounting Standards Board (“FASB”) Accounting Standard Codification
Topic 946 “Financial Services—Investment Companies.”
2). SIGNIFICANT ACCOUNTING POLICIES
The following is a summary of significant accounting policies consistently followed by the Fund in the preparation of the financial statements. These policies conform to U.S. generally accepted accounting
principles (“GAAP”).
|
a).
|
Securities Valuation – All investments in securities are recorded at their estimated fair value, as described in Note 3.
|
|
b).
|
Federal Income Taxes – No provision for federal income taxes or excise taxes has been made because the Fund has elected to be taxed as a regulated investment company and intends to distribute
substantially all of its taxable income to its shareholders and otherwise comply with the provisions of the Internal Revenue Code of 1986, as amended, applicable to regulated investment companies. Net investment income/loss
and realized gains/losses for federal income tax purposes may differ from those reported in the financial statements because of temporary book and tax basis differences. Temporary differences are primarily the result of the
treatment of wash sales for tax reporting purposes and investments in companies organized as partnerships for tax purposes. The Fund recognizes interest and penalties related to income tax benefits, if any, in the Statement of
Operations as an income tax expense. Distributions from net realized gains for book purposes may include short-term capital gains, which are included as ordinary income to shareholders for tax purposes. The Fund may utilize
equalization accounting for tax purposes and designate earnings and profits, including net realized gains distributed to shareholders on redemption of shares, as part of the dividends paid deduction for income tax purposes.
|
|
c).
|
Accounting for Uncertainty in Income Taxes – The Fund has accounting policies regarding recognition and measurement of tax positions taken or expected to be taken on a tax return. The tax returns of
the Fund for the prior three fiscal years are open for examination. The Fund has reviewed all open tax years in major jurisdictions and concluded that there is no impact on the Fund’s net assets and no
|
|
HENNESSYFUNDS.COM
|
16
|
NOTES TO THE FINANCIAL STATEMENTS
|
|
tax liability resulting from unrecognized tax benefits relating to uncertain income tax positions taken or expected to be taken on a tax return. The Fund’s major tax jurisdictions are U.S. federal
and Delaware.
|
|
|
d).
|
Income and Expenses – Dividend income is recognized on the ex-dividend date or as soon as information is available to the Fund. Interest income, which includes the amortization of premium and
accretion of discount, is recognized on an accrual basis. Other non-cash dividends are recognized as investment income at the fair value of the property received. The Fund is charged for those expenses that are directly
attributable to its portfolio, such as advisory, administration, and certain shareholder service fees. Income, expenses (other than expenses attributable to a specific class), and realized and unrealized gains/losses on
investments are allocated to each class of shares based on such class’s net assets. Distributions received from the Fund’s investments in master limited partnerships (“MLPs”) generally consist of ordinary income, capital
gains, and return of capital. The Fund records investment income on the ex-date of the distributions. For financial statement purposes, the Fund uses return of capital and income estimates to allocate the dividend income
received. Such estimates are based on historical information available from the MLPs and other industry sources. These estimates may subsequently be revised based on information received from the MLPs after their tax reporting
periods are concluded, as the actual character of these distributions is not known until after the fiscal year end of the Fund.
|
|
e).
|
Distributions to Shareholders – Dividends from net investment income for the Fund, if any, are declared and paid annually, usually in December. Distributions of net realized capital gains, if any,
are declared and paid annually, usually in December.
|
|
f).
|
Security Transactions – Investment and shareholder transactions are recorded on the trade date. The Fund determines the realized gain/loss from an investment transaction by comparing the original
cost of the security lot sold with the net sale proceeds. Discounts and premiums on securities purchased are accreted or amortized, respectively, over the life of each such security.
|
|
g).
|
Use of Estimates – The preparation of financial statements in conformity with GAAP requires management to make estimates and assumptions that affect the reported amounts of assets and liabilities and
disclosure of contingent assets and liabilities at the date of the financial statements and the reported change in net assets during the reporting period. Actual results could differ from those estimates.
|
|
h).
|
Share Valuation – The net asset value (“NAV”) per share of the Fund is calculated by dividing (i) the total value of the securities held by the Fund, plus cash and other assets, minus all liabilities
(including estimated accrued expenses) by (ii) the total number of shares outstanding for the Fund, rounded to the nearest $0.01. The Fund’s shares will not be priced on days the New York Stock Exchange is closed for trading.
The offering and redemption price per share for the Fund is equal to the Fund’s NAV per share.
|
|
i).
|
Partnership Accounting Policy – To the extent the Fund receives distributions from underlying partnerships in which it invests, the Fund records its pro rata share of income/loss and capital
gains/losses and accordingly adjusts the cost basis of the underlying partnerships for return of capital.
|
3). SECURITIES VALUATION
The Fund follows fair value accounting standards that establish an authoritative definition of fair value and set out a hierarchy for measuring fair value. These standards require additional disclosures
about the various inputs and valuation techniques used to develop
|
HENNESSY FUNDS
|
1-800-966-4354
|
17
the measurements of fair value and a discussion of changes in valuation techniques and related inputs during the period. These inputs are summarized in the three broad levels listed below:
|
Level 1 –
|
Unadjusted, quoted prices in active markets for identical instruments that the Fund has the ability to access at the date of measurement.
|
|
|
Level 2 –
|
Other significant observable inputs (including, but not limited to, quoted prices in active markets for similar instruments, quoted prices in markets that are not active for identical or similar
instruments, and model-derived valuations in which all significant inputs and significant value drivers are observable in active markets, such as interest rates, prepayment speeds, credit risk curves, default rates, and
similar data).
|
|
|
Level 3 –
|
Significant unobservable inputs (including the Fund’s own assumptions about what market participants would use to price the asset or liability based on the best available information) when observable
inputs are unavailable.
|
The following is a description of the valuation techniques applied to the Fund’s major categories of assets and liabilities measured at fair value on a recurring basis:
|
Equity Securities – Equity securities, including common stocks, preferred stocks, foreign-issued common stocks, exchange-traded funds, closed-end mutual
funds, partnerships, rights, MLPs, and real estate investment trusts, that are traded on a securities exchange for which a last-quoted sales price is readily available will generally be valued at the last sales price as
reported by the primary exchange on which the securities are listed. Securities listed on The NASDAQ Stock Market (“NASDAQ”) will generally be valued at the NASDAQ Official Closing Price, which may differ from the last sales
price reported. Securities traded on a securities exchange for which a last-quoted sales price is not readily available will generally be valued at the mean between the bid and ask prices. To the extent these securities are
actively traded and valuation adjustments are not applied, they are classified in Level 1 of the fair value hierarchy. Securities traded on foreign exchanges generally are not valued at the same time the Fund calculates its
NAV because most foreign markets close well before such time. The earlier close of most foreign markets gives rise to the possibility that significant events, including broad market moves, may have occurred in the interim. In
certain circumstances, it may be determined that a foreign security needs to be fair valued because it appears that the value of the security might have been materially affected by events occurring after the close of the
market in which the security is principally traded, but before the time the Fund calculates its NAV, such as by a development that affects an entire market or region (e.g., a weather-related event) or a potentially global
development (e.g., a terrorist attack that may be expected to have an effect on investor expectations worldwide).
|
|
|
Registered Investment Companies – Investments in open-end registered investment companies, commonly referred to as mutual funds, generally are priced at the
ending NAV provided by the applicable mutual fund’s service agent and will be classified in Level 1 of the fair value hierarchy.
|
|
|
Debt Securities – Debt securities, including corporate bonds, asset-backed securities, mortgage-backed securities, municipal bonds, U.S. Treasuries, and U.S.
government agency issues, are generally valued at market on the basis of valuations furnished by an independent pricing service that utilizes both dealer-supplied valuations and formula-based techniques. The pricing service
may consider recently executed transactions in securities of the issuer or comparable issuers, market price quotations (where observable), bond spreads, and fundamental data relating to the issuer. In
|
|
HENNESSYFUNDS.COM
|
18
|
NOTES TO THE FINANCIAL STATEMENTS
|
|
addition, the model may incorporate observable market data, such as reported sales of similar securities, broker quotes, yields, bids, offers, and reference data. Certain securities are valued
primarily using dealer quotations. These securities are generally classified in Level 2 of the fair value hierarchy.
|
|
|
Short-Term Securities – Short-term equity investments, including money market funds, are valued in the manner specified above. Short-term debt investments
with an original term to maturity of 60 days or less are valued at amortized cost, which approximates fair market value. If the original term to maturity of a short-term debt investment exceeded 60 days, then the values as of
the 61st day prior to maturity are amortized. Amortized cost is not used if its use would be inappropriate due to credit or other impairments of the issuer, in which case the security’s fair value would be determined, as
described below. Short-term securities are generally classified in Level 1 or Level 2 of the fair value hierarchy depending on the inputs used and market activity levels for specific securities.
|
The Board of Trustees of the Fund (the “Board”) has adopted fair value pricing procedures that are followed when a price for a security is not readily available or if a significant event
has occurred that indicates the closing price of a security no longer represents the true value of that security. Fair value pricing determinations are made in good faith in accordance with these procedures. There are numerous
criteria that will be given consideration in determining a fair value of a security, such as the trading volume of a security and markets, the values of other similar securities, and news events with direct bearing on a security or
markets. Fair value pricing results in an estimated price for a security that reflects the amount the Fund might reasonably expect to receive in a current sale. Depending on the relative significance of the valuation inputs, these
securities may be classified in either Level 2 or Level 3 of the fair value hierarchy.
The fair value of foreign securities may be determined with the assistance of a pricing service using correlations between the movement of prices of such securities and indices of domestic
securities and other appropriate indicators, such as closing market prices of relevant American Depositary Receipts or futures contracts. Using fair value pricing means that the Fund’s NAV reflects the affected portfolio securities’
values as determined by the Board or its designee, pursuant to the fair value pricing procedures adopted by the Board, instead of being determined by the market. Using a fair value pricing methodology to price a foreign security may
result in a value that is different from such foreign security’s most recent closing price and from the value used by other investment companies to calculate their NAVs. Such securities are generally classified in Level 2 of the fair
value hierarchy. Because the Fund may invest in foreign securities, the value of the Fund’s portfolio securities may change on days when you will not be able to purchase or redeem your shares.
The Board has delegated day-to-day valuation matters to the Valuation and Liquidity Committee comprising representatives from Hennessy Advisors, Inc., the Fund’s investment advisor (the
“Advisor”). The function of the Valuation and Liquidity Committee is to value securities where current and reliable market quotations are not readily available. All actions taken by the Valuation and Liquidity Committee are reviewed
by the Board.
The Fund has performed an analysis of all existing investments to determine the significance and character of all inputs to their fair value determinations. Various inputs are used to
determine the value of the Fund’s investments. The inputs or methodology used for valuing securities are not necessarily an indication of the risk associated with investing in those securities. Details related to the fair value
hierarchy of the Fund’s securities as of April 30, 2020, are included in the Schedule of Investments.
|
HENNESSY FUNDS
|
1-800-966-4354
|
19
4). INVESTMENT TRANSACTIONS
Purchases and sales of investment securities (excluding government and short-term investments) for the Fund during the six months ended April 30, 2020, were $13,472,070 and $30,885,551, respectively.
There were no purchases or sales/maturities of long-term U.S. government securities for the Fund during the six months ended April 30, 2020.
The Fund is permitted to purchase or sell securities from or to another fund in the Hennessy Funds family of funds (collectively, the “Hennessy Funds”) under specified conditions outlined
in procedures adopted by the Board. The procedures have been designed to ensure that any purchase or sale of securities by the Fund from or to another Hennessy Fund complies with Rule 17a-7 of the Investment Company Act of 1940, as
amended. During the six months ended April 30, 2020, the Fund did not engage in purchases or sales of securities pursuant to Rule 17a-7 of the Investment Company Act of 1940, as amended.
5). INVESTMENT ADVISORY FEE AND OTHER TRANSACTIONS WITH AFFILIATES
The Advisor provides the Fund with investment advisory services under an Investment Advisory Agreement. The Advisor oversees the provision of investment advice and furnishes office space, facilities, and
most of the personnel needed by the Fund. As compensation for its services, the Advisor is entitled to a monthly fee from the Fund. The fee is based on the average daily net assets of the Fund at an annual rate of 1.25 %. The net
investment advisory fees expensed by the Fund during the six months ended April 30, 2020, are included in the Statement of Operations.
The Advisor has delegated the day-to-day management of the Fund to a sub-advisor, BP Capital Fund Advisors, LLC. The Advisor pays the sub-advisory fees from its own assets, and these fees
are not an additional expense of the Fund. During the six months ended April 30, 2020, the Advisor (not the Fund) paid a sub-advisory fee at the rate of 0.40% of the daily net assets of the Fund.
The Advisor has contractually agreed to limit total annual operating expenses to 2.00% of the Fund’s net assets for Investor Class shares and 1.75% of the Fund’s net assets for
Institutional Class shares (in each case, excluding all federal, state, and local taxes, interest, brokerage commissions, dividend and interest expenses on short sales, extraordinary items, and acquired fund fees and expenses and
other costs incurred in connection with the purchase and sale of securities) through October 25, 2020.
For three years following the date on which expenses were waived or incurred, the Advisor may recoup waived or reimbursed expenses from the Fund if total operating expenses, including such
recoupment, does not exceed the expense limitation in effect (i) at the time the Advisor waived or reimbursed such expenses and (ii) at the time the Advisor recoups such expenses. As of April 30, 2020, expenses subject to potential
recovery were $3,874 for Investor Class shares and $5,336 for Institutional Class shares, which will expire in fiscal year 2023. The Advisor did not recoup expenses from the Fund during the six months ended April 30, 2020.
The Board has approved a Shareholder Servicing Agreement for Investor Class shares of the Fund, which was instituted to compensate the Advisor for the non-investment advisory services it
provides to the Fund. The Shareholder Servicing Agreement provides for a monthly fee paid to the Advisor at an annual rate of 0.10% of the average daily net assets of the Fund attributable to Investor Class shares. The shareholder
service fees expensed by the Fund during the six months ended April 30, 2020, are included in the Statement of Operations.
|
HENNESSYFUNDS.COM
|
20
|
NOTES TO THE FINANCIAL STATEMENTS
|
The Fund has adopted a plan pursuant to Rule 12b-1 under the Investment Company Act of 1940, as amended, that authorizes payments in connection with the distribution of the Fund’s shares
at an annual rate of up to 0.25% of the Fund’s average daily net assets attributable to Investor Class shares. Even though the authorized rate is up to 0.25%, the Fund is currently only using up to 0.15% of its average daily net
assets attributable to Investor Class shares for such purpose. Amounts paid under the plan may be spent on any activities or expenses primarily intended to result in the sale of shares, including, but not limited to, advertising,
shareholder account servicing, printing and mailing of prospectuses to other than current shareholders, printing and mailing of sales literature, and compensation for sales and marketing activities or to financial institutions and
others, such as dealers and distributors. The distribution fees expensed by the Fund during the six months ended April 30, 2020, are included in the Statement of Operations.
The Fund has entered into agreements with various brokers, dealers, and financial intermediaries in connection with the sale of shares of the Fund. The agreements provide for periodic
payments of sub-transfer agent expenses by the Fund to the brokers, dealers, and financial intermediaries for providing certain shareholder maintenance services. These shareholder services include the pre-processing and quality
control of new accounts, shareholder correspondence, answering customer inquiries regarding account status, and facilitating shareholder telephone transactions. The sub-transfer agent fees expensed by the Fund during the six months
ended April 30, 2020, are included in the Statement of Operations.
U.S. Bancorp Fund Services, LLC, d/b/a U.S. Bank Global Fund Services (“Fund Services”) provides the Fund with administrative, accounting, and transfer agent services. As administrator,
Fund Services is responsible for activities such as (i) preparing various federal and state regulatory filings, reports, and returns for the Fund, (ii) preparing reports and materials to be supplied to the Board, (iii) monitoring the
activities of the Fund’s custodian, transfer agent, and accountants, and (iv) coordinating the preparation and payment of the Fund’s expenses and reviewing the Fund’s expense accruals. U.S. Bank N.A., an affiliate of Fund Services,
serves as the Fund’s custodian. The servicing agreements between the Trust and Fund Services and U.S. Bank N.A. contain a fee schedule that is inclusive of administrative, accounting, custody, and transfer agent fees. The
administrative, accounting, custody, and transfer agent fees expensed by the Fund during the six months ended April 30, 2020, are included in the Statement of Operations.
Quasar Distributors, LLC (“Quasar”) acts as the Fund’s principal underwriter in a continuous public offering of the Fund’s shares. Quasar was an affiliate of Fund Services and U.S. Bank
N.A. through March 30, 2020. Effective March 31, 2020, Foreside Financial Group, LLC (“Foreside”) acquired Quasar from Fund Services. As a result of the acquisition, Quasar became a wholly owned broker-dealer subsidiary of Foreside
and is no longer affiliated with Fund Services or U.S. Bank N.A. The Board approved a new Distribution Agreement to enable Quasar to continue serving as the Fund’s distributor.
The officers of the Fund are affiliated with the Advisor. With the exception of the Chief Compliance Officer and the Senior Compliance Officer, such officers receive no compensation from
the Fund for serving in their respective roles. The Fund, along with the other Hennessy Funds, makes reimbursement payments on an equal basis to the Advisor for a portion of the salary and benefits associated with the office of the
Chief Compliance Officer and for all of the salary and benefits associated with the office of the Senior Compliance Officer. The compliance fees expensed by the Fund during the six months ended April 30, 2020, are included in the
Statement of Operations.
|
HENNESSY FUNDS
|
1-800-966-4354
|
21
6). GUARANTEES AND INDEMNIFICATIONS
Under the Hennessy Funds’ organizational documents, their officers and trustees are indemnified by the Hennessy Funds against certain liabilities arising out of the performance of their duties to the
Hennessy Funds. Additionally, in the normal course of business, the Hennessy Funds enter into contracts with service providers that contain general indemnification clauses. The Fund’s maximum exposure under these arrangements is
unknown as this would involve future claims that may be made against the Fund that have not yet occurred. Currently, the Fund expects the risk of loss to be remote.
7). LINE OF CREDIT
The Fund has an uncommitted line of credit with the other Hennessy Funds in the amount of the lesser of (i) $100,000,000 or (ii) 33.33% of each Hennessy Fund’s net assets, or 30% for the Hennessy Gas Utility
Fund and 10% for the Hennessy Balanced Fund, intended to provide short-term financing, if necessary, subject to certain restrictions, in connection with shareholder redemptions. The credit facility is with the Hennessy Funds’
custodian bank, U.S. Bank N.A. Borrowings under this arrangement bear interest at the bank’s prime rate and are secured by all of the Fund’s assets (as to its own borrowings only). During the six months ended April 30, 2020, the Fund
had an outstanding average daily balance and a weighted average interest rate of $159,632 and 3.86%, respectively. The interest expensed by the Fund during the six months ended April 30, 2020, is included in the Statement of
Operations. The maximum amount outstanding for the Fund during the period was $2,754,000. As of April 30, 2020, the Fund had a loan payable of $75,000.
8). FEDERAL TAX INFORMATION
As of October 31, 2019, the Fund’s most recent fiscal year end, the components of accumulated earnings (losses) for income tax purposes were as follows:
|
Investments
|
|||||
|
Cost of investments for tax purposes
|
$
|
58,501,243
|
|||
|
Gross tax unrealized appreciation
|
$
|
1,872,760
|
|||
|
Gross tax unrealized depreciation
|
(9,141,728
|
)
|
|||
|
Net tax unrealized appreciation/(depreciation)
|
$
|
(7,268,968
|
)
|
||
|
Undistributed ordinary income
|
$
|
79,002
|
|||
|
Undistributed long-term capital gains
|
—
|
||||
|
Total distributable earnings
|
$
|
79,002
|
|||
|
Other accumulated gain/(loss)
|
$
|
(21,955,706
|
)
|
||
|
Total accumulated gain/(loss)
|
$
|
(29,145,672
|
)
|
||
The difference between book-basis unrealized appreciation/depreciation and tax-basis unrealized appreciation/depreciation (as shown above) is attributable primarily to wash sales and
partnership adjustments.
As of October 31, 2019, the Fund had capital loss carryforwards as follows:
|
$ 9,883,167
|
Unlimited Long-Term
|
|
|
12,072,539
|
Unlimited Short-Term
|
As of October 31, 2019, the Fund did not defer, on a tax basis, any late-year ordinary losses. Late-year ordinary losses are net ordinary losses incurred after December 31, 2018, but
within the taxable year, that are deemed to arise on the first day of the Fund’s next taxable year.
|
HENNESSYFUNDS.COM
|
22
|
NOTES TO THE FINANCIAL STATEMENTS
|
During fiscal year 2020 (year to date) and fiscal year 2019, the tax character of distributions paid by the Fund was as follows:
|
Six Months Ended
|
Year Ended
|
||||||||
|
April 30, 2020
|
October 31, 2019
|
||||||||
|
Ordinary income(1)
|
$
|
79,003
|
$
|
—
|
|||||
|
Long-term capital gain
|
—
|
—
|
|||||||
|
$
|
79,003
|
$
|
—
|
||||||
|
(1) Ordinary income includes short-term capital gain.
|
9). EVENTS SUBSEQUENT TO PERIOD END
Management has evaluated the Fund’s related events and transactions that occurred subsequent to April 30, 2020, through the date of issuance of the Fund’s financial statements. Management has determined that
there were no subsequent events requiring recognition or disclosure in the financial statements.
|
HENNESSY FUNDS
|
1-800-966-4354
|
23
Expense Example (Unaudited)
April 30, 2020
As a shareholder of the Fund, you incur ongoing costs, including management fees, service fees, and other Fund expenses. This Example is intended to help you understand your ongoing costs (in dollars) of
investing in the Fund and to compare these costs with the ongoing costs of investing in other mutual funds. The Example is based on an investment of $1,000 invested at the beginning of the period and held for the entire period from
November 1, 2019, through April 30, 2020.
Actual Expenses
The first line of the table below under the “Investor Class” and “Institutional Class” headings provides information about actual account values and actual expenses. Although the Fund charges no sales loads
or transaction fees, you will be assessed fees for outgoing wire transfers, returned checks and stop payment orders at prevailing rates charged by U.S. Bank Global Fund Services, the Fund’s transfer agent. If you request that a
redemption be made by wire transfer, currently a $15 fee is charged by the Fund’s transfer agent. IRA accounts will be charged a $15 annual maintenance fee. The example below includes, but is not limited to, management fees,
shareholder servicing fees, accounting, custody, and transfer agent fees. However, the example below does not include portfolio trading commissions and related expenses. You may use the information in this line, together with the
amount you invested, to estimate the expenses that you paid over the period. Simply divide your account value by $1,000 (for example, an $8,600 account value divided by $1,000 = 8.6), then multiply the result by the number in the
first line of the table under the “Investor Class” or “Institutional Class” headings in the column entitled “Expenses Paid During Period” to estimate the expenses you paid on your account during this period.
Hypothetical Example for Comparison Purposes
The second line of the table below under the “Investor Class” and “Institutional Class” headings provides information about hypothetical account values and hypothetical expenses based on the Fund’s actual
expense ratios and an assumed rate of return of 5% per year before expenses, which is not the Fund’s actual return. The hypothetical account values and expenses may not be used to estimate the actual ending account balance or expenses
you paid for the period. You may use this information to compare the ongoing costs of investing in the Fund and other funds. To do so, compare this 5% hypothetical example with the 5% hypothetical examples that appear in the
shareholder reports of the other funds. Please note that the expenses shown in the table are meant to highlight your ongoing costs only. Therefore, the second line of the table under the “Investor Class” and “Institutional Class”
headings is useful in comparing ongoing costs only and will not help you determine the relative total costs of owning different funds.
|
HENNESSYFUNDS.COM
|
24
|
EXPENSE EXAMPLE
|
|
Beginning
|
Ending
|
||
|
Account Value
|
Account Value
|
Expenses Paid
|
|
|
November 1, 2019
|
April 30, 2020
|
During Period(1)
|
|
|
Investor Class
|
|||
|
Actual
|
$1,000.00
|
$ 632.80
|
$ 8.24
|
|
Hypothetical (5% return before expenses)
|
$1,000.00
|
$1,014.77
|
$10.17
|
|
Institutional Class
|
|||
|
Actual
|
$1,000.00
|
$ 633.20
|
$ 7.19
|
|
Hypothetical (5% return before expenses)
|
$1,000.00
|
$1,016.06
|
$ 8.87
|
|
(1)
|
Expenses are equal to the Fund’s annualized expense ratio of 2.03% for Investor Class shares or 1.77% for Institutional Class shares, as applicable, multiplied by the average account value over the
period, multiplied by 182/366 days (to reflect the half-year period).
|
|
HENNESSY FUNDS
|
1-800-966-4354
|
25
How to Obtain a Copy of the Fund’s Proxy
Voting Policy and Proxy Voting Records
A description of the policies and procedures the Fund uses to determine how to vote proxies relating to portfolio securities is available without charge (1) by calling 1-800-966-4354, (2) on the Hennessy
Funds’ website at www.hennessyfunds.com/proxy-voting/voting-policy, or (3) on the U.S. Securities and Exchange Commission’s (the “SEC”) website at www.sec.gov. The Fund’s proxy voting record is available without charge on both the
Hennessy Funds’ website at www.hennessyfunds.com/proxy-voting/voting-record and the SEC’s website at www.sec.gov no later than August 31 for the prior 12 months ending June 30.
Availability of Quarterly Portfolio Schedule
The Fund files a complete schedule of portfolio holdings with the SEC for the first and third quarters of each fiscal year as an exhibit to its reports on Form N-PORT. The Fund’s Forms N-PORT are available
on the SEC’s website at www.sec.gov or on request by calling 1-800-966-4354.
Important Notice Regarding Delivery
of Shareholder Documents
To help keep the Fund’s costs as low as possible, we generally deliver a single copy of shareholder reports, proxy statements, and prospectuses to shareholders who share an address and have the same last
name. This process does not apply to account statements. You may request an individual copy of a shareholder document at any time. If you would like to receive separate mailings of shareholder documents, please call U.S. Bank Global
Fund Services at 1-800-261-6950 or 1-414-765-4124, and individual delivery will begin within 30 days of your request. If your account is held through a financial institution or other intermediary, please contact such intermediary
directly to request individual delivery.
Electronic Delivery
The Funds offer shareholders the option to receive account statements, prospectuses, tax forms, and shareholder reports online. To sign up for eDelivery, please visit www.hennessyfunds.com/account. You may
change your delivery preference at any time by visiting our website or calling U.S. Bank Global Fund Services at 1-800-261-6950 or 1-414-765-4124.
|
HENNESSYFUNDS.COM
|
26
|
PROXY VOTING — BOARD APPROVAL OF INVESTMENT ADVISORY AGREEMENTS
|
Board Approval of Investment Advisory
Agreements
At its meeting on March 12, 2020, the Board of Trustees of the Fund (the “Board,” and the members thereof, the “Trustees”) unanimously approved the continuation of the investment advisory agreement of the
Fund with Hennessy Advisors, Inc. (the “Advisor”) and the sub-advisory agreement for the Fund between the Advisor and BP Capital Fund Advisors, LLC (the “Sub-Advisor”). As part of the process of approving the continuation of the
advisory and sub-advisory agreements, the Trustees reviewed their fiduciary duties and the relevant factors for them to consider with respect to approving the advisory and sub-advisory agreements. In addition, the Trustees who are not
deemed “interested persons” (as defined by the Investment Company Act of 1940, as amended) of the Fund (the “Independent Trustees”) met in executive session to discuss the approval of the advisory and sub-advisory agreements.
In advance of the meeting, the Advisor sent detailed information to the Trustees to assist them in their evaluation of the advisory and sub-advisory agreements. This information included,
but was not limited to, the following:
|
(1)
|
A memorandum from outside legal counsel that described the fiduciary duties of the Board with respect to approving the continuation of the advisory and sub-advisory agreements and the relevant
factors for consideration;
|
|
|
(2)
|
A memorandum from the Advisor that listed the factors relevant to the Board’s approval of the continuation of the advisory and sub-advisory agreements and also referenced the documents that had been
provided to help the Board assess each such factor;
|
|
|
(3)
|
An inventory of the services provided by the Advisor and the Sub-Advisor and the distinction between the Advisor-provided services and the Sub-Advisor-provided services;
|
|
|
(4)
|
A written discussion of economies of scale;
|
|
|
(5)
|
Summaries of the key terms of the advisory and sub-advisory agreements;
|
|
|
(6)
|
A recent Fund fact sheet, which included performance information over various periods;
|
|
|
(7)
|
A peer expense comparison of the net expense ratio and investment advisory fee of the Fund;
|
|
|
(8)
|
The Advisor’s financial statements from its most recent Form 10-K and Form 10-Q;
|
|
|
(9)
|
A completed questionnaire from the Sub-Advisor;
|
|
|
(10)
|
A summary of the Sub-Advisor’s questionnaire and relevant information from the Sub-Advisor’s Form ADV Parts I and II;
|
|
|
(11)
|
The Sub-Advisor’s Code of Ethics; and
|
|
|
(12)
|
Financial information of the Sub-Advisor.
|
All of the factors discussed were considered as a whole by the Trustees and by the Independent Trustees meeting in executive session. The factors were viewed in their totality by the
Trustees, with no single factor being the principal or determinative factor in the Trustees’ determination of whether to approve the continuation of the advisory and sub-advisory agreements. The Trustees recognized that the management
and fee
|
HENNESSY FUNDS
|
1-800-966-4354
|
27
arrangements for the Fund are the result of years of review and discussion between the Independent Trustees and the Advisor, that certain aspects of such arrangements may receive greater scrutiny in some
years than in others, and that the Trustees’ conclusions may be based, in part, on their consideration of these same arrangements and information received during the course of the year and in prior years.
Prior to approving the continuation of the advisory and sub-advisory agreements, the Trustees, including the Independent Trustees in executive session, considered, among other items:
|
(1)
|
The nature and quality of the advisory services provided by the Advisor and the Sub-Advisor;
|
|
|
(2)
|
A comparison of the fees and expenses of the Fund to other similar funds;
|
|
|
(3)
|
Whether economies of scale are recognized by the Fund;
|
|
|
(4)
|
The costs and profitability of the Fund to the Advisor and the Sub-Advisor;
|
|
|
(5)
|
The performance of the Fund; and
|
|
|
(6)
|
Any benefits to the Advisor and the Sub-Advisor from serving as an investment advisor to the Fund (other than the advisory and sub-advisory fees).
|
The material considerations and determinations of the Trustees, including the Independent Trustees, were as follows:
|
(1)
|
The Trustees considered the services identified below that are provided by the Advisor. Based on this review, the Trustees concluded that the Advisor provides high-quality services to the Fund and
noted that their overall confidence in the Advisor was high. The Trustees also concluded that they were satisfied with the nature, extent, and quality of the advisory services provided to the Fund by the Advisor and that the
nature and extent of the services provided by the Advisor were appropriate to assure that the Fund’s operations are conducted in compliance with applicable laws, rules, and regulations.
|
|
(a)
|
The Advisor oversees the Sub-Advisor for the Fund, and the Sub-Advisor acts as the portfolio manager for the Fund.
|
||
|
(b)
|
The Advisor performs a daily reconciliation of portfolio positions and cash for the Fund.
|
||
|
(c)
|
The Advisor monitors the liquidity of each Fund.
|
||
|
(d)
|
The Advisor monitors the Fund’s compliance with its investment objectives and restrictions.
|
||
|
(e)
|
The Advisor monitors compliance with federal securities laws, maintains a compliance program (including a code of ethics), conducts ongoing reviews of the compliance programs of the Sub-Advisor and
the Fund’s other service providers, as feasible, conducts on-site visits to the Sub-Advisor and the Fund’s other service providers, monitors incidents of abusive trading practices, reviews Fund expense accruals, payments, and
fixed expense ratios, evaluates insurance providers for fidelity bond, D&O/E&O insurance, and cybersecurity insurance coverage, manages regulatory examination compliance and responses, conducts employee compliance
training, reviews reports provided by service providers, and maintains books and records.
|
|
HENNESSYFUNDS.COM
|
28
|
BOARD APPROVAL OF INVESTMENT ADVISORY AGREEMENTS
|
|
(f)
|
The Advisor oversees the selection and continued employment of the Sub-Advisor, reviews the Fund’s investment performance, and monitors the Sub-Advisor’s adherence to the Fund’s investment
objectives, policies, and restrictions.
|
||
|
(g)
|
The Advisor oversees service providers that provide accounting, administration, distribution, transfer agency, custodial, sales, marketing, public relations, audit, information technology, and legal
services to the Fund.
|
||
|
(h)
|
The Advisor maintains in-house marketing and distribution departments on behalf of the Fund.
|
||
|
(i)
|
The Advisor is actively involved with preparing regulatory filings for the Fund, including writing and annually updating the Fund’s prospectus and related documents.
|
||
|
(j)
|
For each annual report of the Fund, the Advisor reviews the written summary prepared by the Sub-Advisor of the Fund’s performance during the most recent 12-month period.
|
||
|
(k)
|
The Advisor oversees distribution of the Fund through third-party broker/dealers and independent financial institutions such as Charles Schwab, Inc., Fidelity, TD Ameritrade, and Pershing. The
Advisor participates in “no transaction fee” (“NTF”) programs with these companies on behalf of the Fund, which allow customers to purchase the Fund through third-party distribution channels without paying a transaction fee.
The Advisor compensates, in part, a number of these third-party providers of NTF programs out of its own revenues.
|
||
|
(l)
|
The Advisor pays the incentive compensation of the Fund’s compliance officers and employs other staff, such as legal, marketing, national accounts, distribution, sales, administrative, and trading
oversight personnel, as well as management executives.
|
||
|
(m)
|
The Advisor provides a quarterly compliance certification to the Board.
|
||
|
(n)
|
The Advisor prepares or reviews all Board materials, frequently presents to the Board and leads Board discussions, prepares or reviews all meeting minutes, and arranges for Board training and
education.
|
|
(2)
|
The Trustees considered the services identified below that are provided by the Sub-Advisor:
|
|
(a)
|
The Sub-Advisor acts as the portfolio manager for the Fund. In this capacity, the Sub-Advisor does the following:
|
|
(i)
|
manages the composition of the Fund’s portfolio, including the purchase, retention, and disposition of portfolio securities in accordance with the Fund’s investment objectives, policies, and
restrictions;
|
|||
|
(ii)
|
seeks best execution for the Fund’s portfolio;
|
|||
|
(iii)
|
manages the use of soft dollars for the Fund; and
|
|||
|
(iv)
|
manages proxy voting for the Fund.
|
|
(b)
|
The Sub-Advisor ensures that its compliance program includes policies and procedures relevant to the Fund and the Sub-Advisor’s duties as a portfolio manager to the Fund.
|
||
|
(c)
|
For each annual report of the Fund, the Sub-Advisor prepares a written summary of the Fund’s performance during the most recent 12-month period.
|
|
HENNESSY FUNDS
|
1-800-966-4354
|
29
|
(d)
|
The Sub-Advisor provides a quarterly compliance certification to the Board regarding trading and allocation practices, supervisory matters, the Sub-Advisor’s compliance program (including its code of
ethics), compliance with the Fund’s policies, and general firm updates.
|
|
(3)
|
The Trustees considered the distinction between the services performed by the Advisor and the Sub-Advisor. The Trustees noted that the management of the Fund, including the oversight of the
Sub-Advisor, involves more comprehensive and substantive duties than the duties of the Sub-Advisor. Specifically, the Trustees considered the lists of services identified above and concluded that the services performed by the
Advisor for the Fund require a higher level of service and oversight than the services performed by the Sub-Advisor. Based on this determination, the Trustees concluded that the differential in advisory fees between the
Advisor and the Sub-Advisor is reasonable.
|
|
|
(4)
|
The Trustees compared the performance of the Fund to benchmark indices over various periods and also noted that the Trustees review and discuss reports comparing the investment performance of the
Fund to various indices at each quarterly Board meeting. Based on such information, the Trustees determined that the Advisor and the Sub-Advisor manage the Fund in a manner materially consistent with its stated investment
objective and style. The Trustees concluded that the performance of the Fund over various periods warranted continuation of the advisory and sub-advisory agreements.
|
|
|
(5)
|
The Trustees reviewed the advisory fees and overall expense ratios of the Fund compared to other funds similar in asset size and investment objective to the Fund using data from Morningstar. As part
of the discussion with management, the Trustees ensured that they understood and were comfortable with the criteria used to determine the mutual funds included in the Morningstar categories for purposes of the materials
considered at the meeting. The Trustees determined that the advisory fee and overall expense ratio of the Fund falls within the range of the advisory fees and overall expense ratios of other comparable funds and concluded that
they are reasonable and warranted continuation of the advisory and sub-advisory agreements.
|
|
|
(6)
|
The Trustees also considered whether the Advisor was realizing economies of scale that it should share with the Fund’s shareholders. The Trustees noted that the assets of the Fund had declined over
the prior year. In addition, the Trustees noted that many of the expenses incurred to manage the Fund are asset-based fees, so the Advisor does not realize material economies of scale relating to those expenses as the assets
of the Fund increase. For example, mutual fund platform fees increase as the Fund’s assets grow. The Trustees also considered the Advisor’s efforts to contain expenses through actions such as renegotiating service contracts,
the Advisor’s significant marketing efforts to promote the Funds, the Advisor’s investments in personnel to manage the Funds, and the Advisor’s agreement to waive fees or lower its management fees in certain circumstances. The
Trustees noted that it did not appear that the Advisor was realizing economies of scale at current asset levels and concluded that it would continue to monitor economies of scale in the future as circumstances changed.
|
|
|
(7)
|
The Trustees considered the profitability of the Advisor and the Sub-Advisor, including the impact of mutual fund platform fees on the Advisor’s profitability, and also considered the resources and
revenues that the Advisor has put into
|
|
HENNESSYFUNDS.COM
|
30
|
BOARD APPROVAL OF INVESTMENT ADVISORY AGREEMENTS
|
|
managing and distributing the Fund. The Trustees then concluded that the profits of the Advisor and the Sub-Advisor are reasonable and not excessive when compared to profitability guidelines set
forth in relevant court cases.
|
||
|
(8)
|
The Trustees considered the high level of professionalism and knowledge of the Advisor’s employees, along with a very low level of turnover, and concluded that this was beneficial to the Fund and its
shareholders.
|
|
|
(9)
|
The Trustees considered any benefits to the Advisor and the Sub-Advisor from serving as an advisor to the Fund (other than the advisory and sub-advisory fees). The Trustees noted that the Advisor and
the Sub-Advisor may derive ancillary benefits from, by way of example, their association with the Fund in the form of proprietary and third-party research products and services received from broker-dealers that execute
portfolio trades for the Fund. The Trustees determined that any such products and services have been used for legitimate purposes relating to the Fund by providing assistance in the investment decision-making process. The
Trustees concluded that any additional benefits realized by the Advisor and the Sub-Advisor from their relationship with the Fund were reasonable, which was based on, among other things, the Trustees’ findings that (i) the
research, analytical, statistical, and other information and services provided by brokers are merely supplemental to the Advisor’s and the Sub-Advisor’s own efforts in the performance of their duties under the advisory and
sub-advisory agreements and (ii) although the Sub-Advisor could derive benefits from the conversion of Fund shareholders into separate account clients, the Fund also could benefit from potential institutional shareholders who
might choose to invest in the Fund.
|
After reviewing the materials and information provided at the meeting, as well as other information regularly provided at the Board’s quarterly meetings throughout the year regarding the
quality of services provided by the Advisor and the Sub-Advisor, the performance of the Fund, expense information, brokerage commissions information, the adequacy and efficacy of the Advisor’s and the Sub-Advisor’s written policies
and procedures, other regulatory compliance issues, trading information and related matters, and other factors that the Trustees deemed relevant, the Trustees, including the Independent Trustees, approved the continuation of the
advisory and sub-advisory agreements.
|
HENNESSY FUNDS
|
1-800-966-4354
|
31
(This Page Intentionally Left Blank.)
For information, questions, or assistance, please call
The Hennessy Funds
1-800-966-4354 or 1-415-899-1555
INVESTMENT ADVISOR
Hennessy Advisors, Inc.
7250 Redwood Boulevard, Suite 200
Novato, California 94945
ADMINISTRATOR,
TRANSFER AGENT,
DIVIDEND PAYING AGENT, &
SHAREHOLDER SERVICING AGENT
U.S. Bancorp Fund Services, LLC
d/b/a U.S. Bank Global Fund Services
P.O. Box 701
Milwaukee, Wisconsin 53201-0701
CUSTODIAN
U.S. Bank N.A.
Custody Operations
1555 North River Center Drive, Suite 302
Milwaukee, Wisconsin 53212
TRUSTEES
Neil J. Hennessy
Robert T. Doyle
J. Dennis DeSousa
Gerald P. Richardson
COUNSEL
Foley & Lardner LLP
777 East Wisconsin Avenue
Milwaukee, Wisconsin 53202-5306
INDEPENDENT REGISTERED
PUBLIC ACCOUNTING FIRM
Tait, Weller & Baker LLP
Two Liberty Place
50 South 16th Street, Suite 2900
Philadelphia, Pennsylvania 19102-2529
DISTRIBUTOR
Quasar Distributors, LLC
111 East Kilbourn Avenue, Suite 2200
Milwaukee, Wisconsin 53202
www.hennessyfunds.com | 1-800-966-4354
This report has been prepared for shareholders and may be distributed to
others only if preceded or accompanied by a current prospectus.
SEMI-ANNUAL REPORT
APRIL 30, 2020
HENNESSY BP MIDSTREAM FUND
Investor Class HMSFX
Institutional Class HMSIX
IMPORTANT NOTICE REGARDING ELECTRONIC DELIVERY OF SHAREHOLDER REPORTS
Beginning on January 1, 2021, as permitted by regulations adopted by the Securities and Exchange Commission, paper copies of the annual and semi-annual
reports will no longer be sent by mail unless you specifically request paper copies from the Hennessy Funds or from your financial intermediary. Instead, the reports will be made available on a website, and you will be
notified by mail each time a report is posted and provided with a website link to access the report.
If you have already elected to receive shareholder reports electronically, you will not be affected by this change and you need not take any action. You
may elect to receive shareholder reports and other communications from the Hennessy Funds electronically by visiting www.hennessyfunds.com/account or by calling U.S. Bank Global Fund Services at 1-800-261-6950. If you own
shares in a Fund through a financial intermediary, please contact your financial intermediary to make this election.
You may elect to receive paper copies of all future reports free of charge by calling U.S. Bank Global Fund Services at 1-800-261-6950 or, if you own
your shares through a financial intermediary, by contacting your financial intermediary. Your election to receive paper copies of reports will apply to all Funds in the Hennessy Funds family.
hennessyfunds.com | 1-800-966-4354
(This Page Intentionally Left Blank.)
Contents
|
Letter to Shareholders
|
2
|
|
Performance Overview
|
4
|
|
Financial Statements
|
|
|
Schedule of Investments
|
5
|
|
Statement of Assets and Liabilities
|
8
|
|
Statement of Operations
|
9
|
|
Statements of Changes in Net Assets
|
11
|
|
Financial Highlights
|
12
|
|
Notes to the Financial Statements
|
16
|
|
Expense Example
|
26
|
|
Proxy Voting Policy and Proxy Voting Records
|
28
|
|
Availability of Quarterly Portfolio Schedule
|
28
|
|
Federal Tax Distribution Information
|
28
|
|
Important Notice Regarding Delivery of Shareholder Documents
|
28
|
|
Electronic Delivery
|
28
|
|
Board Approval of Investment Advisory Agreements
|
29
|
|
HENNESSY FUNDS
|
1-800-966-4354
|
June 2020
Dear Hennessy Funds Shareholder:
First and foremost, I hope this communication finds you and your loved ones safe and healthy. In many ways, the COVID-19 pandemic has turned the world upside down in recent months, and we at Hennessy have
joined the rest of the world in witnessing and experiencing its profound effect on public health, the global economy, and the everyday lives of people around the world. In response to the crisis, we invoked our business continuity
plan in mid-March to ensure a smooth transition to remote work for all of our employees, who have been working safely and productively from home. We want to assure our Hennessy Funds shareholders that our operations are
uninterrupted and functioning normally.
The past six months have been marked by extremes. During the first half of the period from November 2019 through January 2020, the bull market, supported by strong corporate
fundamentals, continued to move higher, and investors appeared focused on record-low unemployment and strong economic growth. In mid-February, the major U.S. market indices hit all-time highs, but then, within just a matter of
weeks, lost over one-third of their values as the COVID-19 pandemic unfolded. Shelter-in-place and business closure orders rippled through the nation, causing initial unemployment claims to skyrocket to their highest number in
history. The market then rallied back and posted double-digit positive returns in April.
For the six months ended April 30, 2020, on a total return basis, the Dow Jones Industrial Average was down 8.9% and the S&P 500® Index was down 3.2%. Small-cap and mid-cap stocks generally fared worse than large-cap stocks during the period, and the Financial sector was particularly hard hit as the Federal Reserve aggressively
cut the federal funds rate in an effort to stabilize the economy. The Energy sector was crushed by both the sudden loss of demand due to COVID-19 and the oversupply caused by the surprise market-share battle between Russia and Saudi
Arabia, and the S&P 500® Energy Sector Index ended the six-month period down over 30%.
The COVID-19 pandemic is an unprecedented event, and the duration and full extent of the economic impact is unknown. In the moment, there is always the concern that ‘this time is
different.’ But, when you are able to look at past financial, political, and health crises with the benefit of 20/20 hindsight, history has demonstrated that our economy and financial markets have always rebounded and recovered
eventually. If you look back to the last market downturn in 2008, economic fundamentals were weak compared to the market in 2020, where the overall underpinnings were – and are still – quite strong. Publicly listed companies today
have plenty of cash, with over $5 trillion on balance sheets of the S&P 500® companies alone, and I believe that most will survive and that many
may emerge from the current crisis even stronger.
|
HENNESSYFUNDS.COM
|
2
|
LETTER TO SHAREHOLDERS
|
We understand that this market volatility and economic uncertainty is jarring to many investors, and we continue to monitor events and the markets. We remain focused on managing our
high-conviction portfolios for the long-term benefit of our shareholders, and we are confident in the time-tested strategies and rigorous research that led to their formation. We encourage shareholders to maintain a long-term
investment horizon and to remain focused on long-term goals. As always, but especially in these trying times, we are here to support our shareholders, and we thank you for your continued investment and trust. Should you have any
questions or would like to speak with us directly, please don’t hesitate to call (800) 966-4354 or email us at fundsinfo@hennessyfunds.com.
Best regards,
Neil J. Hennessy
President and Chief Investment Officer
Past performance does not guarantee future results.
Mutual fund investing involves risk. Principal loss is possible.
The Dow Jones Industrial Average and S&P 500® Index are commonly used to measure the performance of U.S. stocks. The
S&P 500® Energy Sector Index is an index that comprises those companies included in the S&P 500 that are classified as members of the GICS
energy sector. One cannot invest directly in an index.
|
HENNESSY FUNDS
|
1-800-966-4354
|
3
Performance Overview (Unaudited)
AVERAGE ANNUAL TOTAL RETURN FOR PERIODS ENDED APRIL 30, 2020
|
Six
|
One
|
Five
|
Since Inception
|
|
|
Months(1)
|
Year
|
Years
|
(12/31/13)
|
|
|
Hennessy BP Midstream Fund –
|
||||
|
Investor Class (HMSFX)
|
-31.87%
|
-38.37%
|
-14.32%
|
-9.52%
|
|
Hennessy BP Midstream Fund –
|
||||
|
Institutional Class (HMSIX)
|
-31.77%
|
-38.23%
|
-14.10%
|
-9.29%
|
|
Alerian MLP Index
|
-34.48%
|
-40.79%
|
-15.03%
|
-11.33%
|
|
S&P 500® Index
|
-3.16%
|
0.86%
|
9.12%
|
9.66%
|
| Expense ratios: |
Gross 1.89%, Net 1.76%(2) (Investor Class);
|
|
|
Gross 1.56%, Net 1.51%(2) (Institutional Class)
|
|
(1)
|
Periods of less than one year are not annualized.
|
|
(2)
|
The Fund’s investment advisor has contractually agreed to limit expenses until February 28, 2021.
|
_______________
Performance data quoted represents past performance; past performance does not guarantee future results. The investment return and principal value of an investment will fluctuate so
that an investor’s shares, when redeemed, may be worth more or less than their original cost. The performance table does not reflect the deduction of taxes that a shareholder would pay on Fund distributions or the redemption of Fund
shares. Current performance of the Fund may be lower or higher than the performance quoted. Performance data current to the most recent month end may be obtained by visiting www.hennessyfunds.com. Performance for periods on or prior
to October 26, 2018, is that of the BP Capital TwinLine MLP Fund.
The Alerian MLP Index comprises companies that earn a majority of their cash flow from midstream activities involving energy commodities. The S&P 500® Index is a capitalization-weighted index that is designed to represent the broad domestic economy through changes in the aggregate market value of 500 stocks across all major industries. One cannot
invest directly in an index. These indices are used herein for comparative purposes in accordance with SEC regulations.
Standard & Poor’s Financial Services LLC is the source and owner of the S&P® and S&P 500® trademarks.
The expense ratios presented are from the most recent prospectus. The expense ratios for the current reporting period are available in the Financial Highlights section of this report.
|
HENNESSYFUNDS.COM
|
4
|
PERFORMANCE OVERVIEW/SCHEDULE OF INVESTMENTS
|
Financial Statements
|
Schedule of Investments as of April 30,
2020 (Unaudited)
|
HENNESSY BP MIDSTREAM FUND
(% of Total Assets)
|
TOP TEN HOLDINGS (EXCLUDING MONEY MARKET FUNDS)
|
% TOTAL ASSETS
|
|
Energy Transfer LP
|
15.22%
|
|
The Williams Companies, Inc.
|
12.41%
|
|
Enterprise Products Partners LP
|
12.13%
|
|
MPLX LP
|
11.16%
|
|
Phillips 66 Partners LP
|
7.96%
|
|
Kinder Morgan, Inc.
|
7.70%
|
|
Magellan Midstream Partners LP
|
7.19%
|
|
Shell Midstream Partners LP
|
7.16%
|
|
Plains All American Pipeline LP
|
5.46%
|
|
ONEOK, Inc.
|
4.61%
|
Note: The Fund concentrates its investments in the Energy industry. For presentation purposes, the Fund uses custom categories.
|
HENNESSY FUNDS
|
1-800-966-4354
|
5
|
COMMON STOCKS – 27.36%
|
Number
|
% of
|
||||||||||
|
|
of Shares
|
Value
|
Net Assets
|
|||||||||
|
Gathering & Processing – 2.58%
|
||||||||||||
|
Targa Resources Corp.
|
60,100
|
$
|
778,896
|
2.58
|
%
|
|||||||
|
Natural Gas/NGL Transportation – 24.78%
|
||||||||||||
|
Kinder Morgan, Inc.
|
153,090
|
2,331,561
|
7.72
|
%
|
||||||||
|
ONEOK, Inc.
|
46,626
|
1,395,516
|
4.62
|
%
|
||||||||
|
The Williams Companies, Inc.
|
193,952
|
3,756,850
|
12.44
|
%
|
||||||||
|
|
7,483,927
|
24.78
|
%
|
|||||||||
|
Total Common Stocks
|
||||||||||||
|
(Cost $10,746,986)
|
8,262,823
|
27.36
|
%
|
|||||||||
|
|
||||||||||||
|
PARTNERSHIPS & TRUSTS – 71.73%
|
||||||||||||
|
Crude Oil & Refined Products – 40.94%
|
||||||||||||
|
Magellan Midstream Partners LP
|
52,900
|
2,175,777
|
7.20
|
%
|
||||||||
|
MPLX LP
|
186,749
|
3,380,157
|
11.19
|
%
|
||||||||
|
Phillips 66 Partners LP
|
56,619
|
2,409,138
|
7.98
|
%
|
||||||||
|
Plains All American Pipeline LP
|
187,326
|
1,654,089
|
5.48
|
%
|
||||||||
|
Shell Midstream Partners LP
|
147,564
|
2,167,715
|
7.18
|
%
|
||||||||
|
TC PipeLines LP
|
17,200
|
576,200
|
1.91
|
%
|
||||||||
|
|
12,363,076
|
40.94
|
%
|
|||||||||
|
Gathering & Processing – 1.07%
|
||||||||||||
|
Crestwood Equity Partners LP
|
29,400
|
321,636
|
1.07
|
%
|
||||||||
|
Natural Gas/NGL Transportation – 29.72%
|
||||||||||||
|
Cheniere Energy Partners LP
|
20,600
|
694,838
|
2.30
|
%
|
||||||||
|
Energy Transfer LP
|
548,700
|
4,609,080
|
15.26
|
%
|
||||||||
|
Enterprise Products Partners LP
|
209,100
|
3,671,796
|
12.16
|
%
|
||||||||
|
|
8,975,714
|
29.72
|
%
|
|||||||||
|
Total Partnerships & Trusts
|
||||||||||||
|
(Cost $26,528,861)
|
21,660,426
|
71.73
|
%
|
|||||||||
The accompanying notes are an integral part of these financial statements.
|
HENNESSYFUNDS.COM
|
6
|
SCHEDULE OF INVESTMENTS
|
|
SHORT-TERM INVESTMENTS – 0.31%
|
Number
|
% of
|
||||||||||
|
|
of Shares
|
Value
|
Net Assets
|
|||||||||
|
Money Market Funds – 0.31%
|
||||||||||||
|
First American Government Obligations Fund,
|
||||||||||||
|
Institutional Class, 0.25% (a)
|
94,786
|
$
|
94,786
|
0.31
|
%
|
|||||||
|
|
||||||||||||
|
Total Short-Term Investments
|
||||||||||||
|
(Cost $94,786)
|
94,786
|
0.31
|
%
|
|||||||||
|
|
||||||||||||
|
Total Investments
|
||||||||||||
|
(Cost $37,370,633) – 99.40%
|
30,018,035
|
99.40
|
%
|
|||||||||
|
Other Assets in Excess of Liabilities – 0.60%
|
182,110
|
0.60
|
%
|
|||||||||
|
|
||||||||||||
|
TOTAL NET ASSETS – 100.00%
|
$
|
30,200,145
|
100.00
|
%
|
||||||||
Percentages are stated as a percent of net assets.
|
(a)
|
The rate listed is the fund’s seven-day yield as of April 30, 2020.
|
Summary of Fair Value Exposure as of April 30, 2020
The following is a summary of the inputs used to value the Fund’s net assets as of April 30, 2020 (see Note 3 in the accompanying Notes to the Financial Statements):
|
Common Stocks
|
Level 1
|
Level 2
|
Level 3
|
Total
|
||||||||||||
|
Gathering & Processing
|
$
|
778,896
|
$
|
—
|
$
|
—
|
$
|
778,896
|
||||||||
|
Natural Gas/NGL Transportation
|
7,483,927
|
—
|
—
|
7,483,927
|
||||||||||||
|
Total Common Stocks
|
$
|
8,262,823
|
$
|
—
|
$
|
—
|
$
|
8,262,823
|
||||||||
|
Partnerships & Trusts
|
||||||||||||||||
|
Crude Oil & Refined Products
|
$
|
12,363,076
|
$
|
—
|
$
|
—
|
$
|
12,363,076
|
||||||||
|
Gathering & Processing
|
321,636
|
—
|
—
|
321,636
|
||||||||||||
|
Natural Gas/NGL Transportation
|
8,975,714
|
—
|
—
|
8,975,714
|
||||||||||||
|
Total Partnerships & Trusts
|
$
|
21,660,426
|
$
|
—
|
$
|
—
|
$
|
21,660,426
|
||||||||
|
Short-Term Investments
|
||||||||||||||||
|
Money Market Funds
|
$
|
94,786
|
$
|
—
|
$
|
—
|
$
|
94,786
|
||||||||
|
Total Short-Term Investments
|
$
|
94,786
|
$
|
—
|
$
|
—
|
$
|
94,786
|
||||||||
|
Total Investments
|
$
|
30,018,035
|
$
|
—
|
$
|
—
|
$
|
30,018,035
|
||||||||
The accompanying notes are an integral part of these financial statements.
|
HENNESSY FUNDS
|
1-800-966-4354
|
7
Financial Statements
|
Statement of Assets and Liabilities as of April 30, 2020 (Unaudited)
|
|
ASSETS:
|
||||
|
Investments in securities, at value (cost $37,370,633)
|
$
|
30,018,035
|
||
|
Dividends and interest receivable
|
24,361
|
|||
|
Receivable for fund shares sold
|
4,163
|
|||
|
Return of capital receivable
|
212,775
|
|||
|
Prepaid expenses and other assets
|
19,659
|
|||
|
Total assets
|
30,278,993
|
|||
|
LIABILITIES:
|
||||
|
Payable for fund shares redeemed
|
9,226
|
|||
|
Payable to advisor
|
12,188
|
|||
|
Payable to administrator
|
7,558
|
|||
|
Payable to auditor
|
20,385
|
|||
|
Accrued distribution fees
|
1,644
|
|||
|
Accrued service fees
|
440
|
|||
|
Accrued trustees fees
|
6,482
|
|||
|
Accrued expenses and other payables
|
20,925
|
|||
|
Total liabilities
|
78,848
|
|||
|
NET ASSETS
|
$
|
30,200,145
|
||
|
NET ASSETS CONSISTS OF:
|
||||
|
Capital stock
|
$
|
58,232,910
|
||
|
Accumulated deficit
|
(28,032,765
|
)
|
||
|
Total net assets
|
$
|
30,200,145
|
||
|
NET ASSETS:
|
||||
|
Investor Class
|
||||
|
Shares authorized (no par value)
|
Unlimited
|
|||
|
Net assets applicable to outstanding shares
|
$
|
6,434,828
|
||
|
Shares issued and outstanding
|
912,721
|
|||
|
Net asset value, offering price, and redemption price per share
|
$
|
7.05
|
||
|
Institutional Class
|
||||
|
Shares authorized (no par value)
|
Unlimited
|
|||
|
Net assets applicable to outstanding shares
|
$
|
23,765,317
|
||
|
Shares issued and outstanding
|
3,306,513
|
|||
|
Net asset value, offering price, and redemption price per share
|
$
|
7.19
|
||
The accompanying notes are an integral part of these financial statements.
|
HENNESSYFUNDS.COM
|
8
|
STATEMENT OF ASSETS AND LIABILITIES/STATEMENT OF OPERATIONS
|
Financial Statements
|
Statement of Operations for the six months ended April 30, 2020 (Unaudited)
|
|
INVESTMENT INCOME:
|
||||
|
Distributions received from master limited partnerships
|
$
|
1,183,453
|
||
|
Return of capital on distributions received
|
(1,171,451
|
)
|
||
|
Dividend income
|
178,340
|
|||
|
Interest income
|
1,036
|
|||
|
Total investment income
|
191,378
|
|||
|
EXPENSES:
|
||||
|
Investment advisory fees (See Note 5)
|
185,484
|
|||
|
Administration, accounting, custody, and transfer agent fees (See Note 5)
|
22,957
|
|||
|
Audit fees
|
20,384
|
|||
|
Federal and state registration fees
|
18,183
|
|||
|
Sub-transfer agent expenses – Investor Class (See Note 5)
|
5,237
|
|||
|
Sub-transfer agent expenses – Institutional Class (See Note 5)
|
12,488
|
|||
|
Compliance expense (See Note 5)
|
13,461
|
|||
|
Trustees’ fees and expenses
|
8,379
|
|||
|
Distribution fees – Investor Class (See Note 5)
|
5,768
|
|||
|
Reports to shareholders
|
4,372
|
|||
|
Service fees – Investor Class (See Note 5)
|
3,846
|
|||
|
Interest expense (See Note 7)
|
2,103
|
|||
|
Legal fees
|
810
|
|||
|
Other expenses
|
3,169
|
|||
|
Total expenses before reimbursement by advisor
|
306,641
|
|||
|
Expense reimbursement by advisor – Investor Class (See Note 5)
|
(10,825
|
)
|
||
|
Expense reimbursement by advisor – Institutional Class (See Note 5)
|
(31,901
|
)
|
||
|
Net expenses
|
263,915
|
|||
|
NET INVESTMENT LOSS
|
$
|
(72,537
|
)
|
|
|
REALIZED AND UNREALIZED GAINS (LOSSES):
|
||||
|
Net realized loss on investments
|
$
|
(2,911,545
|
)
|
|
|
Net change in unrealized appreciation/depreciation on investments
|
(6,518,796
|
)
|
||
|
Net loss on investments
|
(9,430,341
|
)
|
||
|
NET DECREASE IN NET ASSETS RESULTING FROM OPERATIONS
|
$
|
(9,502,878
|
)
|
|
The accompanying notes are an integral part of these financial statements.
|
HENNESSY FUNDS
|
1-800-966-4354
|
9
(This Page Intentionally Left Blank.)
|
HENNESSYFUNDS.COM
|
10
|
STATEMENTS OF CHANGES IN NET ASSETS
|
Financial Statements
|
Statements of Changes in Net Assets
|
|
Six Months Ended
|
||||||||
|
April 30, 2020
|
Year Ended
|
|||||||
|
(Unaudited)
|
October 31, 2019
|
|||||||
|
OPERATIONS:
|
||||||||
|
Net investment loss
|
$
|
(72,537
|
)
|
$
|
(416,883
|
)
|
||
|
Net realized loss on investments
|
(2,911,545
|
)
|
(7,333,710
|
)
|
||||
|
Net change in unrealized
|
||||||||
|
appreciation/deprecation on investments
|
(6,518,796
|
)
|
4,667,798
|
|||||
|
Net decrease in net assets resulting from operations
|
(9,502,878
|
)
|
(3,082,795
|
)
|
||||
|
DISTRIBUTIONS TO SHAREHOLDERS FROM:
|
||||||||
|
Return of capital – Investor Class
|
(419,969
|
)
|
(1,434,045
|
)
|
||||
|
Return of capital – Institutional Class
|
(1,341,299
|
)
|
(3,424,486
|
)
|
||||
|
Total distributions
|
(1,761,268
|
)
|
(4,858,531
|
)
|
||||
|
CAPITAL SHARE TRANSACTIONS:
|
||||||||
|
Proceeds from shares subscribed – Investor Class
|
921,441
|
4,058,933
|
||||||
|
Proceeds from shares subscribed – Institutional Class
|
7,965,785
|
12,131,475
|
||||||
|
Dividends reinvested – Investor Class
|
409,410
|
1,406,032
|
||||||
|
Dividends reinvested – Institutional Class
|
1,305,052
|
3,358,312
|
||||||
|
Cost of shares redeemed – Investor Class
|
(1,129,753
|
)
|
(14,125,321
|
)
|
||||
|
Cost of shares redeemed – Institutional Class
|
(8,984,281
|
)
|
(39,908,798
|
)
|
||||
|
Net increase (decrease) in net assets derived
|
||||||||
|
from capital share transactions
|
487,654
|
(33,079,367
|
)
|
|||||
|
TOTAL DECREASE IN NET ASSETS
|
(10,776,492
|
)
|
(41,020,693
|
)
|
||||
|
NET ASSETS:
|
||||||||
|
Beginning of period
|
40,976,637
|
81,997,330
|
||||||
|
End of period
|
$
|
30,200,145
|
$
|
40,976,637
|
||||
|
CHANGES IN SHARES OUTSTANDING:
|
||||||||
|
Shares sold – Investor Class
|
153,528
|
324,948
|
||||||
|
Shares sold – Institutional Class
|
1,335,251
|
1,014,731
|
||||||
|
Shares issued to holders as reinvestment
|
||||||||
|
of dividends – Investor Class
|
41,838
|
116,121
|
||||||
|
Shares issued to holders as reinvestment
|
||||||||
|
of dividends – Institutional Class
|
130,871
|
273,922
|
||||||
|
Shares redeemed – Investor Class
|
(126,119
|
)
|
(1,182,757
|
)
|
||||
|
Shares redeemed – Institutional Class
|
(1,025,998
|
)
|
(3,247,364
|
)
|
||||
|
Net increase (decrease) in shares outstanding
|
509,371
|
(2,700,399
|
)
|
|||||
The accompanying notes are an integral part of these financial statements.
|
HENNESSY FUNDS
|
1-800-966-4354
|
11
Financial Statements
|
Financial Highlights
|
For an Investor Class share outstanding throughout each period
|
Six Months Ended
|
||||
|
April 30, 2020
|
||||
|
(Unaudited)
|
||||
|
PER SHARE DATA:
|
||||
|
Net asset value, beginning of period
|
$
|
10.90
|
||
|
Income from investment operations:
|
||||
|
Net investment loss(3)(4)
|
(0.03
|
)
|
||
|
Net realized and unrealized gains (losses) on investments
|
(3.31
|
)
|
||
|
Total from investment operations
|
(3.34
|
)
|
||
|
Less distributions:
|
||||
|
Dividends from return of capital
|
(0.51
|
)
|
||
|
Total distributions
|
(0.51
|
)
|
||
|
Net asset value, end of period
|
$
|
7.05
|
||
|
TOTAL RETURN
|
-31.87
|
%(5)
|
||
|
SUPPLEMENTAL DATA AND RATIOS:
|
||||
|
Net assets, end of period (millions)
|
$
|
6.43
|
||
|
Ratio of expenses to average net assets:
|
||||
|
Before expense reimbursement
|
2.04
|
%(6)
|
||
|
After expense reimbursement
|
1.76
|
%(6)
|
||
|
Ratio of net investment loss to average net assets:
|
||||
|
Before expense reimbursement(4)
|
(0.88
|
)%(6)
|
||
|
After expense reimbursement(4)
|
(0.60
|
)%(6)
|
||
|
Portfolio turnover rate(8)
|
22
|
%(5)
|
||
|
(1)
|
The period ended October 31, 2018, consists of 11 months due to the Fund’s fiscal year end change from November 30 to October 31, effective October 26, 2018.
|
|
(2)
|
Fund commenced operations on December 31, 2013.
|
|
(3)
|
Calculated using the average shares outstanding method.
|
|
(4)
|
Includes current and deferred tax benefit/expense from net investment income/loss only.
|
|
(5)
|
Not annualized.
|
|
(6)
|
Annualized.
|
|
(7)
|
Includes an estimated deferred tax expense/benefit of -1.32% for fiscal year 2015 or 3.98% for the period ended November 30, 2014. See Note 2.b in the Notes to the Financial Statements.
|
|
(8)
|
Calculated on the basis of the Fund as a whole.
|
The accompanying notes are an integral part of these financial statements.
|
HENNESSYFUNDS.COM
|
12
|
FINANCIAL HIGHLIGHTS — INVESTOR CLASS
|
|
Year Ended
|
Period Ended
|
Period Ended
|
||||||||||||||||||||
|
October 31,
|
October 31,
|
Year Ended November 30,
|
November 30,
|
|||||||||||||||||||
|
2019
|
2018(1)
|
2017
|
2016
|
2015
|
2014(2)
|
|||||||||||||||||
|
$
|
12.66
|
$
|
14.51
|
$
|
16.54
|
$
|
15.45
|
$
|
22.25
|
$
|
20.00
|
|||||||||||
|
(0.10
|
)
|
(0.16
|
)
|
(0.22
|
)
|
(0.17
|
)
|
(0.20
|
)
|
(0.20
|
)
|
|||||||||||
|
(0.63
|
)
|
(0.66
|
)
|
(0.78
|
)
|
2.29
|
(5.60
|
)
|
2.87
|
|||||||||||||
|
(0.73
|
)
|
(0.82
|
)
|
(1.00
|
)
|
2.12
|
(5.80
|
)
|
2.67
|
|||||||||||||
|
(1.03
|
)
|
(1.03
|
)
|
(1.03
|
)
|
(1.03
|
)
|
(1.00
|
)
|
(0.42
|
)
|
|||||||||||
|
(1.03
|
)
|
(1.03
|
)
|
(1.03
|
)
|
(1.03
|
)
|
(1.00
|
)
|
(0.42
|
)
|
|||||||||||
|
$
|
10.90
|
$
|
12.66
|
$
|
14.51
|
$
|
16.54
|
$
|
15.45
|
$
|
22.25
|
|||||||||||
|
-6.28
|
%
|
-6.15
|
%(5)
|
-6.49
|
%
|
14.78
|
%
|
-27.17
|
%
|
13.37
|
%(5)
|
|||||||||||
|
$
|
9.20
|
$
|
20.07
|
$
|
16.86
|
$
|
13.43
|
$
|
8.76
|
$
|
7.17
|
|||||||||||
|
1.89
|
%
|
1.86
|
%(6)
|
1.91
|
%
|
2.21
|
%
|
1.38
|
%(7)
|
8.02
|
%(6)(7)
|
|||||||||||
|
1.76
|
%
|
1.78
|
%(6)
|
1.77
|
%
|
1.74
|
%
|
0.42
|
%(7)
|
5.73
|
%(6)(7)
|
|||||||||||
|
(0.92
|
)%
|
(1.34
|
)%(6)
|
(1.50
|
)%
|
(1.60
|
)%
|
(1.97
|
)%
|
(3.28
|
)%(6)
|
|||||||||||
|
(0.79
|
)%
|
(1.26
|
)%(6)
|
(1.36
|
)%
|
(1.13
|
)%
|
(1.01
|
)%
|
(0.99
|
)%(6)
|
|||||||||||
|
41
|
%
|
64
|
%(5)
|
63
|
%
|
139
|
%
|
96
|
%
|
70
|
%(5)
|
|||||||||||
The accompanying notes are an integral part of these financial statements.
|
HENNESSY FUNDS
|
1-800-966-4354
|
13
Financial Statements
|
Financial Highlights
|
For an Institutional Class share outstanding throughout each period
|
Six Months Ended
|
||||
|
April 30, 2020
|
||||
|
(Unaudited)
|
||||
|
PER SHARE DATA:
|
||||
|
Net asset value, beginning of period
|
$
|
11.09
|
||
|
Income from investment operations:
|
||||
|
Net investment loss(3)(4)
|
(0.02
|
)
|
||
|
Net realized and unrealized gains (losses) on investments
|
(3.37
|
)
|
||
|
Total from investment operations
|
(3.39
|
)
|
||
|
Less distributions:
|
||||
|
Dividends from return of capital
|
(0.51
|
)
|
||
|
Total distributions
|
(0.51
|
)
|
||
|
Net asset value, end of period
|
$
|
7.19
|
||
|
TOTAL RETURN
|
-31.77
|
%(5)
|
||
|
SUPPLEMENTAL DATA AND RATIOS:
|
||||
|
Net assets, end of period (millions)
|
$
|
23.77
|
||
|
Ratio of expenses to average net assets:
|
||||
|
Before expense reimbursement
|
1.76
|
%(6)
|
||
|
After expense reimbursement
|
1.51
|
%(6)
|
||
|
Ratio of net investment loss to average net assets:
|
||||
|
Before expense reimbursement(4)
|
(0.63
|
)%(6)
|
||
|
After expense reimbursement(4)
|
(0.38
|
)%(6)
|
||
|
Portfolio turnover rate(8)
|
22
|
%(5)
|
||
|
(1)
|
The period ended October 31, 2018, consists of 11 months due to the Fund’s fiscal year end change from November 30 to October 31, effective October 26, 2018.
|
|
(2)
|
Fund commenced operations on December 31, 2013.
|
|
(3)
|
Calculated using the average shares outstanding method.
|
|
(4)
|
Includes current and deferred tax benefit/expense from net investment income/loss only.
|
|
(5)
|
Not annualized.
|
|
(6)
|
Annualized.
|
|
(7)
|
Includes an estimated deferred tax expense/benefit of -1.32% for fiscal year 2015 or 3.98% for the period ended November 30, 2014. See Note 2.b in the Notes to the Financial Statements.
|
|
(8)
|
Calculated on the basis of the Fund as a whole.
|
The accompanying notes are an integral part of these financial statements.
|
HENNESSYFUNDS.COM
|
14
|
FINANCIAL HIGHLIGHTS — INSTITUTIONAL CLASS
|
|
Year Ended
|
Period Ended
|
Period Ended
|
||||||||||||||||||||
|
October 31,
|
October 31,
|
Year Ended November 30,
|
November 30,
|
|||||||||||||||||||
|
2019
|
2018(1)
|
2017
|
2016
|
2015
|
2014(2)
|
|||||||||||||||||
|
$
|
12.83
|
$
|
14.66
|
$
|
16.66
|
$
|
15.53
|
$
|
22.28
|
$
|
20.00
|
|||||||||||
|
(0.09
|
)
|
(0.14
|
)
|
(0.18
|
)
|
(0.12
|
)
|
(0.14
|
)
|
(0.15
|
)
|
|||||||||||
|
(0.62
|
)
|
(0.66
|
)
|
(0.79
|
)
|
2.28
|
(5.61
|
)
|
2.87
|
|||||||||||||
|
(0.71
|
)
|
(0.80
|
)
|
(0.97
|
)
|
2.16
|
(5.75
|
)
|
2.72
|
|||||||||||||
|
(1.03
|
)
|
(1.03
|
)
|
(1.03
|
)
|
(1.03
|
)
|
(1.00
|
)
|
(0.44
|
)
|
|||||||||||
|
(1.03
|
)
|
(1.03
|
)
|
(1.03
|
)
|
(1.03
|
)
|
(1.00
|
)
|
(0.44
|
)
|
|||||||||||
|
$
|
11.09
|
$
|
12.83
|
$
|
14.66
|
$
|
16.66
|
$
|
15.53
|
$
|
22.28
|
|||||||||||
|
-6.10
|
%
|
-5.94
|
%(5)
|
-6.25
|
%
|
14.97
|
%
|
-26.90
|
%
|
13.60
|
%(5)
|
|||||||||||
|
$
|
31.78
|
$
|
61.92
|
$
|
82.59
|
$
|
33.22
|
$
|
15.72
|
$
|
7.79
|
|||||||||||
|
1.56
|
%
|
1.58
|
%(6)
|
1.66
|
%
|
1.95
|
%
|
1.10
|
%(7)
|
7.77
|
%(6)(7)
|
|||||||||||
|
1.51
|
%
|
1.52
|
%(6)
|
1.52
|
%
|
1.48
|
%
|
0.18
|
%(7)
|
5.48
|
%(6)(7)
|
|||||||||||
|
(0.76
|
)%
|
(1.15
|
)%(6)
|
(1.28
|
)%
|
(1.28
|
)%
|
(1.63
|
)%
|
(3.03
|
)%(6)
|
|||||||||||
|
(0.71
|
)%
|
(1.09
|
)%(6)
|
(1.14
|
)%
|
(0.81
|
)%
|
(0.71
|
)%
|
(0.74
|
)%(6)
|
|||||||||||
|
41
|
%
|
64
|
%(5)
|
63
|
%
|
139
|
%
|
96
|
%
|
70
|
%(5)
|
|||||||||||
The accompanying notes are an integral part of these financial statements.
|
HENNESSY FUNDS
|
1-800-966-4354
|
15
Financial Statements
|
Notes to the Financial Statements April 30, 2020 (Unaudited)
|
1). ORGANIZATION
The Hennessy BP Midstream Fund (the “Fund”) is a series of Hennessy Funds Trust (the “Trust”), which was organized as a Delaware statutory trust on September 17, 1992. The Fund is an open-end management
investment company registered under the Investment Company Act of 1940, as amended. The investment objective of the Fund is to seek capital appreciation through distribution growth along with current income. The Fund is treated as a
regular corporation, or “C” corporation, for U.S. federal income tax purposes. Because the Fund is treated as a “C” corporation, it will not be taxed as a regulated investment company under Subchapter M of the Code and is not
required to comply with the diversification requirements applicable to regulated investment companies. The Fund is a non-diversified fund.
The Fund offers Investor Class and Institutional Class shares. Each class of shares differs principally in its respective 12b-1 distribution and service, shareholder servicing, and
sub-transfer agent expenses. There are no sales charges. Each class has identical rights to earnings, assets, and voting privileges, except for class-specific expenses and exclusive rights to vote on matters affecting only one
class.
As an investment company, the Fund follows the investment company accounting and reporting guidance of the Financial Accounting Standards Board (“FASB”) Accounting Standard Codification
Topic 946 “Financial Services—Investment Companies.”
2). SIGNIFICANT ACCOUNTING POLICIES
The following is a summary of significant accounting policies consistently followed by the Fund in the preparation of the financial statements. These policies conform to U.S. generally accepted accounting
principles (“GAAP”).
|
a).
|
Securities Valuation – All investments in securities are recorded at their estimated fair value, as described in Note 3.
|
|
b).
|
Federal Income Taxes – The Fund is taxed as a corporation and is obligated to pay U.S. federal and state income tax on its taxable income. Currently, the maximum marginal regular federal income tax
rate for a corporation is 21%. The Fund invests a substantial portion of its assets in master limited partnerships (“MLPs”), which are treated as partnerships for federal income tax purposes. As a limited partner in MLPs,
the Fund reports its allocable share of each MLP’s taxable income in computing its own taxable income.
|
|
In calculating the Fund’s daily net asset value, the Fund will account for its deferred tax asset and liability balances. In
accordance with GAAP, the Fund will accrue a deferred income tax liability balance for its future tax liability associated with the capital appreciation of its investments and the distributions received by the Fund on equity
securities of MLPs considered to be return of capital and for any net operating gains. This accrual will be based on the current effective federal income tax rate plus an estimated state income tax rate.
|
|
|
Deferred income taxes reflect the net tax effect of temporary differences between the carrying amount of assets and
liabilities for financial reporting and tax purposes. A valuation allowance is recognized if, based on the weight of available evidence, it is more likely than not that at least some portion of a deferred income tax asset
will not be
|
|
HENNESSYFUNDS.COM
|
16
|
NOTES TO THE FINANCIAL STATEMENTS
|
|
realized. From time to time as new information becomes available, the Fund will modify its estimates or assumption regarding the deferred tax liabilities or assets. As of April 30, 2020, the Fund
has placed a full valuation allowance on its deferred tax assets.
|
|
c).
|
Accounting for Uncertainty in Income Taxes – The Fund has accounting policies regarding recognition and measurement of tax positions taken or expected to be taken on a tax return. The tax returns
of the Fund for the prior three fiscal years are open for examination. The Fund has reviewed all open tax years in major jurisdictions and concluded that there is no impact on the Fund’s net assets and no tax liability
resulting from unrecognized tax benefits relating to uncertain income tax positions taken or expected to be taken on a tax return. The Fund files U.S. federal income tax returns and income tax returns in various states.
|
|
d).
|
Income and Expenses – Dividend income is recognized on the ex-dividend date or as soon as information is available to the Fund. Interest income, which includes the amortization of premium and
accretion of discount, is recognized on an accrual basis. Other non-cash dividends are recognized as investment income at the fair value of the property received. The Fund is charged for those expenses that are directly
attributable to its portfolio, such as advisory, administration, and certain shareholder service fees. Income, expenses (other than expenses attributable to a specific class), and realized and unrealized gains/losses on
investments are allocated to each class of shares based on such class’s net assets. Distributions received from the Fund’s investments in MLPs generally consist of ordinary income, capital gains, and return of capital. The
Fund records investment income on the ex-date of the distributions. For financial statement purposes, the Fund uses return of capital and income estimates to allocate the dividend income received. Such estimates are based on
historical information available from the MLPs and other industry sources. These estimates may subsequently be revised based on information received from the MLPs after their tax reporting periods are concluded, as the
actual character of these distributions is not known until after the fiscal year end of the Fund.
|
|
e).
|
Distributions to Shareholders – The Fund typically makes cash distributions to its shareholders quarterly at the end of the months of February, May, August, and November. Due to the tax treatment
of the Fund’s allocations and distributions from MLPs, a significant portion of the Fund’s distributions to shareholders typically is treated as return of capital to shareholders for U.S. federal income tax purposes
(i.e., as distributions in excess of the Fund’s current and accumulated earnings and profits as described below). However, no assurance can be given in this regard; just as the Fund’s corporate income tax liability can
fluctuate materially from year to year, the extent to which the Fund is able to make return-of-capital distributions also can vary materially from year to year depending on a number of different factors, including the
composition of the Fund’s portfolio, the level of allocations of net income and other tax items for the Fund from its underlying MLP investments during a particular taxable year, the length of time the Fund has owned the MLP
equity securities in its portfolio, and the extent to which the Fund disposes of MLP equity securities during a particular year, including, if necessary, to meet Fund shareholder redemption requests.
|
|
In general, a distribution will constitute a return of capital to a shareholder rather than a dividend to the extent such
distribution exceeds the Fund’s current and accumulated earnings and profits. The portion of any distribution treated as a return of capital will constitute a tax-free return of capital to the extent of the shareholder’s
basis in its Fund shares and thereafter generally will be taxable to the shareholder as a capital gain. Any such distribution, in turn, will result in a reduction in a shareholder’s basis in the Fund’s shares (but not below
zero) to the extent of the
|
|
HENNESSY FUNDS
|
1-800-966-4354
|
17
|
return of capital and in the shareholder’s recognizing more gain or less loss (that is, increase of a shareholder’s tax liability) when the shareholder later sells shares of the Fund. To maintain a
more stable distribution rate, the Fund may distribute less or more than the entire amount of cash it receives from its investments in a particular period. Any undistributed cash would be available to supplement future
distributions, and until distributed would add to the Fund’s net asset value. Correspondingly, such amounts, once distributed, will be deducted from the Fund’s net asset value. In addition, the Fund may opt not to make
distributions in quarters in which the Fund believes that a distribution could cause adverse tax consequences to shareholders, including when the Fund believes that a distribution may not constitute a tax-free return of
capital as described above.
|
|
|
f).
|
Security Transactions – Investment and shareholder transactions are recorded on the trade date. The Fund determines the realized gain/loss from an investment transaction by comparing the original
cost of the security lot sold with the net sale proceeds. Discounts and premiums on securities purchased are accreted or amortized, respectively, over the life of each such security.
|
|
g).
|
Use of Estimates – The preparation of financial statements in conformity with GAAP requires management to make estimates and assumptions that affect the reported amounts of assets and liabilities
and disclosure of contingent assets and liabilities at the date of the financial statements and the reported change in net assets during the reporting period. Actual results could differ from those estimates.
|
|
h).
|
Share Valuation – The net asset value (“NAV”) per share of the Fund is calculated by dividing (i) the total value of the securities held by the Fund, plus cash and other assets, minus all
liabilities (including estimated accrued expenses) by (ii) the total number of shares outstanding for the Fund, rounded to the nearest $0.01. The Fund’s shares will not be priced on days the New York Stock Exchange is closed
for trading. The offering and redemption price per share for the Fund is equal to the Fund’s NAV per share.
|
|
i).
|
Partnership Accounting Policy – To the extent the Fund receives distributions from underlying partnerships in which it invests, the Fund records its pro rata share of income/loss and capital
gains/losses and accordingly adjusts the cost basis of the underlying partnerships for return of capital.
|
3). SECURITIES VALUATION
The Fund follows fair value accounting standards that establish an authoritative definition of fair value and set out a hierarchy for measuring fair value. These standards require additional disclosures
about the various inputs and valuation techniques used to develop the measurements of fair value and a discussion of changes in valuation techniques and related inputs during the period. These inputs are summarized in the three
broad levels listed below:
|
Level 1 –
|
Unadjusted, quoted prices in active markets for identical instruments that the Fund has the ability to access at the date of measurement.
|
|
|
Level 2 –
|
Other significant observable inputs (including, but not limited to, quoted prices in active markets for similar instruments, quoted prices in markets that are not active for identical or similar
instruments, and model-derived valuations in which all significant inputs and significant value drivers are observable in active markets, such as interest rates, prepayment speeds, credit risk curves, default rates, and
similar data).
|
|
|
Level 3 –
|
Significant unobservable inputs (including the Fund’s own assumptions about what market participants would use to price the asset or liability based on the best available information) when
observable inputs are unavailable.
|
|
HENNESSYFUNDS.COM
|
18
|
NOTES TO THE FINANCIAL STATEMENTS
|
The following is a description of the valuation techniques applied to the Fund’s major categories of assets and liabilities measured at fair value on a recurring basis:
|
Equity Securities – Equity securities, including common stocks, preferred stocks, foreign-issued common stocks, exchange-traded funds, closed-end mutual
funds, partnerships, rights, MLPs, and real estate investment trusts, that are traded on a securities exchange for which a last-quoted sales price is readily available will generally be valued at the last sales price as
reported by the primary exchange on which the securities are listed. Securities listed on The NASDAQ Stock Market (“NASDAQ”) will generally be valued at the NASDAQ Official Closing Price, which may differ from the last sales
price reported. Securities traded on a securities exchange for which a last-quoted sales price is not readily available will generally be valued at the mean between the bid and ask prices. To the extent these securities are
actively traded and valuation adjustments are not applied, they are classified in Level 1 of the fair value hierarchy. Securities traded on foreign exchanges generally are not valued at the same time the Fund calculates its
NAV because most foreign markets close well before such time. The earlier close of most foreign markets gives rise to the possibility that significant events, including broad market moves, may have occurred in the interim.
In certain circumstances, it may be determined that a foreign security needs to be fair valued because it appears that the value of the security might have been materially affected by events occurring after the close of the
market in which the security is principally traded, but before the time the Fund calculates its NAV, such as by a development that affects an entire market or region (e.g., a weather-related event) or a potentially global
development (e.g., a terrorist attack that may be expected to have an effect on investor expectations worldwide).
|
|
|
Registered Investment Companies – Investments in open-end registered investment companies, commonly referred to as mutual funds, generally are priced at the
ending NAV provided by the applicable mutual fund’s service agent and will be classified in Level 1 of the fair value hierarchy.
|
|
|
Debt Securities – Debt securities, including corporate bonds, asset-backed securities, mortgage-backed securities, municipal bonds, U.S. Treasuries, and
U.S. government agency issues, are generally valued at market on the basis of valuations furnished by an independent pricing service that utilizes both dealer-supplied valuations and formula-based techniques. The pricing
service may consider recently executed transactions in securities of the issuer or comparable issuers, market price quotations (where observable), bond spreads, and fundamental data relating to the issuer. In addition, the
model may incorporate observable market data, such as reported sales of similar securities, broker quotes, yields, bids, offers, and reference data. Certain securities are valued primarily using dealer quotations. These
securities are generally classified in Level 2 of the fair value hierarchy.
|
|
|
Short-Term Securities – Short-term equity investments, including money market funds, are valued in the manner specified above. Short-term debt investments
with an original term to maturity of 60 days or less are valued at amortized cost, which approximates fair market value. If the original term to maturity of a short-term debt investment exceeded 60 days, then the values as
of the 61st day prior to maturity are amortized. Amortized cost is not used if its use would be inappropriate due to credit or other impairments of the issuer, in which case the security’s fair value would be determined, as
described below. Short-term securities are generally classified in Level 1 or Level 2 of the fair value hierarchy depending on the inputs used and market activity levels for specific securities.
|
|
HENNESSY FUNDS
|
1-800-966-4354
|
19
The Board of Trustees of the Fund (the “Board”) has adopted fair value pricing procedures that are followed when a price for a security is not readily available or if a significant event
has occurred that indicates the closing price of a security no longer represents the true value of that security. Fair value pricing determinations are made in good faith in accordance with these procedures. There are numerous
criteria that will be given consideration in determining a fair value of a security, such as the trading volume of a security and markets, the values of other similar securities, and news events with direct bearing on a security or
markets. Fair value pricing results in an estimated price for a security that reflects the amount the Fund might reasonably expect to receive in a current sale. Depending on the relative significance of the valuation inputs, these
securities may be classified in either Level 2 or Level 3 of the fair value hierarchy.
The fair value of foreign securities may be determined with the assistance of a pricing service using correlations between the movement of prices of such securities and indices of
domestic securities and other appropriate indicators, such as closing market prices of relevant American Depositary Receipts or futures contracts. Using fair value pricing means that the Fund’s NAV reflects the affected portfolio
securities’ values as determined by the Board or its designee, pursuant to the fair value pricing procedures adopted by the Board, instead of being determined by the market. Using a fair value pricing methodology to price a foreign
security may result in a value that is different from such foreign security’s most recent closing price and from the value used by other investment companies to calculate their NAVs. Such securities are generally classified in Level
2 of the fair value hierarchy. Because the Fund may invest in foreign securities, the value of the Fund’s portfolio securities may change on days when you will not be able to purchase or redeem your shares.
The Board has delegated day-to-day valuation matters to the Valuation and Liquidity Committee comprising representatives from Hennessy Advisors, Inc., the Fund’s investment advisor (the
“Advisor”). The function of the Valuation and Liquidity Committee is to value securities where current and reliable market quotations are not readily available. All actions taken by the Valuation and Liquidity Committee are reviewed
by the Board.
The Fund has performed an analysis of all existing investments to determine the significance and character of all inputs to their fair value determinations. Various inputs are used to
determine the value of the Fund’s investments. The inputs or methodology used for valuing securities are not necessarily an indication of the risk associated with investing in those securities. Details related to the fair value
hierarchy of the Fund’s securities as of April 30, 2020, are included in the Schedule of Investments.
4). INVESTMENT TRANSACTIONS
Purchases and sales of investment securities (excluding government and short-term investments) for the Fund during the six months ended April 30, 2020, were $7,477,945 and $7,475,266, respectively.
There were no purchases or sales/maturities of long-term U.S. government securities for the Fund during the six months ended April 30, 2020.
The Fund is permitted to purchase or sell securities from or to another fund in the Hennessy Funds family of funds (collectively, the “Hennessy Funds”) under specified conditions
outlined in procedures adopted by the Board. The procedures have been designed to ensure that any purchase or sale of securities by the Fund from or to another Hennessy Fund complies with Rule 17a-7 of the Investment Company Act of
1940, as amended. During the six months ended April 30, 2020, the Fund did not engage in purchases or sales of securities pursuant to Rule 17a-7 of the Investment Company Act of 1940, as amended.
|
HENNESSYFUNDS.COM
|
20
|
NOTES TO THE FINANCIAL STATEMENTS
|
5). INVESTMENT ADVISORY FEE AND OTHER TRANSACTIONS WITH AFFILIATES
The Advisor provides the Fund with investment advisory services under an Investment Advisory Agreement. The Advisor oversees the provision of investment advice and furnishes office space, facilities, and
most of the personnel needed by the Fund. As compensation for its services, the Advisor is entitled to a monthly fee from the Fund. The fee is based on the average daily net assets of the Fund at an annual rate of 1.10%. The net
investment advisory fees expensed by the Fund during the six months ended April 30, 2020, are included in the Statement of Operations.
The Advisor has delegated the day-to-day management of the Fund to a sub-advisor, BP Capital Fund Advisors, LLC. The Advisor pays the sub-advisory fees from its own assets, and these
fees are not an additional expense of the Fund. During the six months ended April 30, 2020, the Advisor (not the Fund) paid a sub-advisory fee at the rate of 0.40% of the daily net assets of the Fund.
The Advisor has contractually agreed to limit total annual operating expenses to 1.75% of the Fund’s net assets for Investor Class shares and 1.50% of the Fund’s net assets for
Institutional Class shares (in each case, excluding all federal, state, and local taxes, interest, brokerage commissions, dividend and interest expenses on short sales, extraordinary items, and acquired fund fees and expenses and
other costs incurred in connection with the purchase and sale of securities) through February 28, 2021.
For three years following the date on which expenses were waived or incurred, the Advisor may recoup waived or reimbursed expenses from the Fund if total operating expenses, including
such recoupment, does not exceed the expense limitation in effect (i) at the time the Advisor waived or reimbursed such expenses and (ii) at the time the Advisor recoups such expenses. As of April 30, 2020, expenses subject to
potential recovery for Investor Class and Institutional Class shares and the fiscal years in which they expire were as follows:
|
Fiscal Year
|
Fiscal Year
|
||||
|
2022
|
2023
|
Total
|
|||
|
Investor Class
|
$22,275
|
$10,825
|
$33,100
|
||
|
Institutional Class
|
$22,981
|
$31,901
|
$54,882
|
The Advisor did not recoup expenses from the Fund during the six months ended April 30, 2020.
The Board has approved a Shareholder Servicing Agreement for Investor Class shares of the Fund, which was instituted to compensate the Advisor for the non-investment advisory services it
provides to the Fund. The Shareholder Servicing Agreement provides for a monthly fee paid to the Advisor at an annual rate of 0.10% of the average daily net assets of the Fund attributable to Investor Class shares. The shareholder
service fees expensed by the Fund during the six months ended April 30, 2020, are included in the Statement of Operations.
The Fund has adopted a plan pursuant to Rule 12b-1 under the Investment Company Act of 1940, as amended, that authorizes payments in connection with the distribution of the Fund’s shares
at an annual rate of up to 0.25% of the Fund’s average daily net assets attributable to Investor Class shares. Even though the authorized rate is up to 0.25%, the Fund is currently only using up to 0.15% of its average daily net
assets attributable to Investor Class shares for such purpose. Amounts paid under the plan may be spent on any activities or expenses primarily intended to result in the sale of shares, including, but not limited to, advertising,
shareholder account servicing, printing and mailing of prospectuses to other than current shareholders, printing and mailing of sales
|
HENNESSY FUNDS
|
1-800-966-4354
|
21
literature, and compensation for sales and marketing activities or to financial institutions and others, such as dealers and distributors. The distribution fees expensed by the Fund during the six months
ended April 30, 2020, are included in the Statement of Operations.
The Fund has entered into agreements with various brokers, dealers, and financial intermediaries in connection with the sale of shares of the Fund. The agreements provide for periodic
payments of sub-transfer agent expenses by the Fund to the brokers, dealers, and financial intermediaries for providing certain shareholder maintenance services. These shareholder services include the pre-processing and quality
control of new accounts, shareholder correspondence, answering customer inquiries regarding account status, and facilitating shareholder telephone transactions. The sub-transfer agent fees expensed by the Fund during the six months
ended April 30, 2020, are included in the Statement of Operations.
U.S. Bancorp Fund Services, LLC, d/b/a U.S. Bank Global Fund Services (“Fund Services”) provides the Fund with administrative, accounting, and transfer agent services. As administrator,
Fund Services is responsible for activities such as (i) preparing various federal and state regulatory filings, reports, and returns for the Fund, (ii) preparing reports and materials to be supplied to the Board, (iii) monitoring
the activities of the Fund’s custodian, transfer agent, and accountants, and (iv) coordinating the preparation and payment of the Fund’s expenses and reviewing the Fund’s expense accruals. U.S. Bank N.A., an affiliate of Fund
Services, serves as the Fund’s custodian. The servicing agreements between the Trust and Fund Services and U.S. Bank N.A. contain a fee schedule that is inclusive of administrative, accounting, custody, and transfer agent fees. The
administrative, accounting, custody, and transfer agent fees expensed by the Fund during the six months ended April 30, 2020, are included in the Statement of Operations.
Quasar Distributors, LLC (“Quasar”) acts as the Fund’s principal underwriter in a continuous public offering of the Fund’s shares. Quasar was an affiliate of Fund Services and U.S. Bank
N.A. through March 30, 2020. Effective March 31, 2020, Foreside Financial Group, LLC (“Foreside”) acquired Quasar from Fund Services. As a result of the acquisition, Quasar became a wholly owned broker-dealer subsidiary of Foreside
and is no longer affiliated with Fund Services or U.S. Bank N.A. The Board approved a new Distribution Agreement to enable Quasar to continue serving as the Fund’s distributor.
The officers of the Fund are affiliated with the Advisor. With the exception of the Chief Compliance Officer and the Senior Compliance Officer, such officers receive no compensation from
the Fund for serving in their respective roles. The Fund, along with the other Hennessy Funds, makes reimbursement payments on an equal basis to the Advisor for a portion of the salary and benefits associated with the office of the
Chief Compliance Officer and for all of the salary and benefits associated with the office of the Senior Compliance Officer. The compliance fees expensed by the Fund during the six months ended April 30, 2020, are included in the
Statement of Operations.
6). GUARANTEES AND INDEMNIFICATIONS
Under the Hennessy Funds’ organizational documents, their officers and trustees are indemnified by the Hennessy Funds against certain liabilities arising out of the performance of their duties to the
Hennessy Funds. Additionally, in the normal course of business, the Hennessy Funds enter into contracts with service providers that contain general indemnification clauses. The Fund’s maximum exposure under these arrangements is
unknown as this would involve future claims that may be made against the Fund that have not yet occurred. Currently, the Fund expects the risk of loss to be remote.
|
HENNESSYFUNDS.COM
|
22
|
NOTES TO THE FINANCIAL STATEMENTS
|
7). LINE OF CREDIT
The Fund has an uncommitted line of credit with the other Hennessy Funds in the amount of the lesser of (i) $100,000,000 or (ii) 33.33% of each Hennessy Fund’s net assets, or 30% for the Hennessy Gas
Utility Fund and 10% for the Hennessy Balanced Fund, intended to provide short-term financing, if necessary, subject to certain restrictions, in connection with shareholder redemptions. The credit facility is with the Hennessy
Funds’ custodian bank, U.S. Bank N.A. Borrowings under this arrangement bear interest at the bank’s prime rate and are secured by all of the Fund’s assets (as to its own borrowings only). During the six months ended April 30, 2020,
the Fund had an outstanding average daily balance and a weighted average interest rate of $95,297 and 4.36%, respectively. The interest expensed by the Fund during the six months ended April 30, 2020, is included in the Statement of
Operations. The maximum amount outstanding for the Fund during the period was $1,116,000. As of April 30, 2020, the Fund did not have any borrowings outstanding under the line of credit.
8). FEDERAL TAX INFORMATION
As of April 30, 2020, the Fund’s most recent fiscal period end, the components of accumulated earnings (losses) for income tax purposes were as follows:
|
Investments
|
|||||
|
Cost of investments for tax purposes
|
$
|
32,325,904
|
|||
|
Gross tax unrealized appreciation
|
$
|
1,815,318
|
|||
|
Gross tax unrealized depreciation
|
(4,123,187
|
)
|
|||
|
Net tax unrealized appreciation/(depreciation)
|
$
|
(2,307,869
|
)
|
||
As of April 30, 2020, deferred tax assets consisted of the following:
|
Deferred tax assets (liabilities):
|
|||||
|
Net operating losses
|
$
|
555,357
|
|||
|
Capital loss
|
5,558,759
|
||||
|
Unrealized (gain) loss on investments
|
537,837
|
||||
|
Total deferred tax assets, net
|
6,651,953
|
||||
|
Valuation allowance
|
(6,651,953
|
)
|
|||
|
Net
|
$
|
—
|
|||
For the six months ended April, 30, 2020, the Fund had an effective tax rate of 0% and a federal statutory rate of 21%, with the difference resulting from a change in the valuation
allowance of the deferred tax assets.
Deferred income tax assets and liabilities are recorded for differences between the financial statement and tax basis of the assets and liabilities that will result in taxable or
deductible amounts in the future based on enacted laws and rates applicable to the periods in which the differences are expected to affect taxable income. Valuation allowances are established when necessary to reduce deferred tax
assets to the amount expected to be realized. The Fund has evaluated the available evidence supporting the realization of its gross deferred tax assets, including the amount and timing of future taxable income, and has determined
that, based on net losses to date, it may not utilize all of its deferred tax assets in the future. As of April 30, 2020, the Fund established a valuation allowance in the amount of $6,651,953 against its deferred tax assets.
To the extent the Fund has a net capital loss in any tax year, the net capital loss may be carried forward five years to offset any future realized capital gains. To the extent the Fund
had a net operating loss that arose in a tax year ending prior to January 1, 2018, the effective date of the Tax Cuts and Jobs Act of 2017, the net operating loss may be carried forward
|
HENNESSY FUNDS
|
1-800-966-4354
|
23
20 years to offset any future ordinary income. Any net operating loss arising in a tax year ending after December 31, 2017, may be carried forward indefinitely. As of April 30, 2020, the Fund had capital
loss carryforwards of $24,084,752 that expire as follows:
|
Amount
|
Expiration
|
||||
|
$
|
1,511,860
|
11/30/2020
|
|||
|
2,137,300
|
11/30/2021
|
||||
|
6,130,957
|
10/31/2023
|
||||
|
10,009,278
|
10/31/2024
|
||||
|
4,295,357
|
10/31/2025
|
||||
As of April 30, 2020, the Fund had net operating loss carryforwards of $2,097,178 that expire as follows:
|
Amount
|
Expiration
|
||||
|
$
|
233,560
|
11/30/2037
|
|||
|
1,863,618
|
Indefinite
|
||||
Total income taxes have been computed by applying the federal statutory income tax rate of 21% plus a blended state income tax rate. The Fund applied this effective rate to net
investment income and realized and unrealized gains on investments before taxes in computing its total income taxes.
|
Tax expense (benefit) at statutory rates
|
$
|
(1,995,605
|
)
|
||
|
State income tax expense, net of federal benefit
|
(188,912
|
)
|
|||
|
Tax expense (benefit) on permanent items(1)
|
(7,933
|
)
|
|||
|
Tax expense (benefit) due to change in effective state rates
|
—
|
||||
|
Total current tax expense (benefit)
|
—
|
||||
|
Change in valuation allowance
|
2,192,450
|
||||
|
Total tax expense
|
$
|
—
|
|
(1) Permanent items consist of dividends-received deductions.
|
The Fund recognizes the tax benefits of uncertain tax positions only where the position is “more likely than not” to be sustained assuming examination by tax authorities. Management has
analyzed the Fund’s tax positions and has concluded that no liability for unrecognized tax benefits should be recorded related to uncertain tax positions taken on U.S. federal tax returns and state tax returns filed or expected to
be filed since inception of the Fund. No income tax returns are currently under examination. Generally, tax authorities can examine all tax returns filed for the last three years. Due to the nature of the Fund’s investments, the
Fund may be required to file income tax returns in several states. The Fund is not aware of any tax positions for which it is reasonably possible that the total amounts of unrecognized tax benefits will change materially.
During fiscal year 2020 (year to date) and fiscal year 2019, the tax character of distributions paid by the Fund was as follows:
|
Six Months Ended
|
Year Ended
|
||||||||
|
April 30, 2020
|
October 31, 2019
|
||||||||
|
Ordinary income(1)
|
$
|
—
|
$
|
—
|
|||||
|
Long-term capital gain
|
—
|
—
|
|||||||
|
Return of capital
|
1,761,268
|
4,858,531
|
|||||||
|
$
|
1,761,268
|
$
|
4,858,531
|
||||||
|
(1) Ordinary income includes short-term capital gain.
|
|
HENNESSYFUNDS.COM
|
24
|
NOTES TO THE FINANCIAL STATEMENTS
|
9). EVENTS SUBSEQUENT TO PERIOD END
Management has evaluated the Fund’s related events and transactions that occurred subsequent to April 30, 2020, through the date of issuance of the Fund’s financial statements. Management has determined
that there were no subsequent events requiring recognition or disclosure in the financial statements.
|
HENNESSY FUNDS
|
1-800-966-4354
|
25
Expense Example (Unaudited)
April 30, 2020
As a shareholder of the Fund, you incur ongoing costs, including management fees, service fees, and other Fund expenses. This Example is intended to help you understand your ongoing costs (in dollars) of
investing in the Fund and to compare these costs with the ongoing costs of investing in other mutual funds. The Example is based on an investment of $1,000 invested at the beginning of the period and held for the entire period from
November 1, 2019, through April 30, 2020.
Actual Expenses
The first line of the table below under the “Investor Class” and “Institutional Class” headings provides information about actual account values and actual expenses. Although the Fund charges no sales
loads or transaction fees, you will be assessed fees for outgoing wire transfers, returned checks and stop payment orders at prevailing rates charged by U.S. Bank Global Fund Services, the Fund’s transfer agent. If you request that
a redemption be made by wire transfer, currently a $15 fee is charged by the Fund’s transfer agent. IRA accounts will be charged a $15 annual maintenance fee. The example below includes, but is not limited to, management fees,
shareholder servicing fees, accounting, custody, and transfer agent fees. However, the example below does not include portfolio trading commissions and related expenses. You may use the information in this line, together with the
amount you invested, to estimate the expenses that you paid over the period. Simply divide your account value by $1,000 (for example, an $8,600 account value divided by $1,000 = 8.6), then multiply the result by the number in the
first line of the table under the “Investor Class” or “Institutional Class” headings in the column entitled “Expenses Paid During Period” to estimate the expenses you paid on your account during this period.
Hypothetical Example for Comparison Purposes
The second line of the table below under the “Investor Class” and “Institutional Class” headings provides information about hypothetical account values and hypothetical expenses based on the Fund’s actual
expense ratios and an assumed rate of return of 5% per year before expenses, which is not the Fund’s actual return. The hypothetical account values and expenses may not be used to estimate the actual ending account balance or
expenses you paid for the period. You may use this information to compare the ongoing costs of investing in the Fund and other funds. To do so, compare this 5% hypothetical example with the 5% hypothetical examples that appear in
the shareholder reports of the other funds. Please note that the expenses shown in the table are meant to highlight your ongoing costs only. Therefore, the second line of the table under the “Investor Class” and “Institutional
Class” headings is useful in comparing ongoing costs only and will not help you determine the relative total costs of owning different funds.
|
HENNESSYFUNDS.COM
|
26
|
EXPENSE EXAMPLE
|
|
Beginning
|
Ending
|
||
|
Account Value
|
Account Value
|
Expenses Paid
|
|
|
November 1, 2019
|
April 30, 2020
|
During Period(1)
|
|
|
Investor Class
|
|||
|
Actual
|
$1,000.00
|
$ 681.30
|
$7.36
|
|
Hypothetical (5% return before expenses)
|
$1,000.00
|
$1,016.11
|
$8.82
|
|
Institutional Class
|
|||
|
Actual
|
$1,000.00
|
$ 682.30
|
$6.32
|
|
Hypothetical (5% return before expenses)
|
$1,000.00
|
$1,017.35
|
$7.57
|
|
(1)
|
Expenses are equal to the Fund’s annualized expense ratio of 1.76% for Investor Class shares or 1.51% for Institutional Class shares, as applicable, multiplied by the average account value over the
period, multiplied by 182/366 days (to reflect the half-year period).
|
|
HENNESSY FUNDS
|
1-800-966-4354
|
27
How to Obtain a Copy of the Fund’s Proxy
Voting Policy and Proxy Voting Records
A description of the policies and procedures the Fund uses to determine how to vote proxies relating to portfolio securities is available without charge (1) by calling 1-800-966-4354, (2) on the Hennessy
Funds’ website at www.hennessyfunds.com/proxy-voting/voting-policy, or (3) on the U.S. Securities and Exchange Commission’s (the “SEC”) website at www.sec.gov. The Fund’s proxy voting record is available without charge on both the
Hennessy Funds’ website at www.hennessyfunds.com/proxy-voting/voting-record and the SEC’s website at www.sec.gov no later than August 31 for the prior 12 months ending June 30.
Availability of Quarterly Portfolio Schedule
The Fund files a complete schedule of portfolio holdings with the SEC for the first and third quarters of each fiscal year as an exhibit to its reports on Form N-PORT. The Fund’s Forms N-PORT are available
on the SEC’s website at www.sec.gov or on request by calling 1-800-966-4354.
Federal Tax Distribution Information (Unaudited)
For fiscal year 2019, certain dividends paid by the Fund may be subject to a maximum tax rate of 23.8%, as provided for by the Jobs and Growth Tax Relief Reconciliation Act of 2003. The percentage of
dividends declared from ordinary income designated as qualified dividend income was 0.00%.
For corporate shareholders, the percent of ordinary income distributions that qualified for the corporate dividends received deduction for fiscal year 2019 was 0.00%.
The percentage of taxable ordinary income distributions that were designated as short-term capital gain distributions under Section 871(k)(2)(C) of the Internal Revenue Code of 1986, as
amended, for the Fund was 0.00%.
Important Notice Regarding Delivery
of Shareholder Documents
To help keep the Fund’s costs as low as possible, we generally deliver a single copy of shareholder reports, proxy statements, and prospectuses to shareholders who share an address and have the same last
name. This process does not apply to account statements. You may request an individual copy of a shareholder document at any time. If you would like to receive separate mailings of shareholder documents, please call U.S. Bank Global
Fund Services at 1-800-261-6950 or 1-414-765-4124, and individual delivery will begin within 30 days of your request. If your account is held through a financial institution or other intermediary, please contact such intermediary
directly to request individual delivery.
Electronic Delivery
The Funds offer shareholders the option to receive account statements, prospectuses, tax forms, and shareholder reports online. To sign up for eDelivery, please visit www.hennessyfunds.com/account. You may
change your delivery preference at any time by visiting our website or calling U.S. Bank Global Fund Services at 1-800-261-6950 or 1-414-765-4124.
|
HENNESSYFUNDS.COM
|
28
|
PROXY VOTING — BOARD APPROVAL OF INVESTMENT ADVISORY AGREEMENTS
|
Board Approval of Investment Advisory
Agreements
At its meeting on March 12, 2020, the Board of Trustees of the Fund (the “Board,” and the members thereof, the “Trustees”) unanimously approved the continuation of the investment advisory agreement of the
Fund with Hennessy Advisors, Inc. (the “Advisor”) and the sub-advisory agreement for the Fund between the Advisor and BP Capital Fund Advisors, LLC (the “Sub-Advisor”). As part of the process of approving the continuation of the
advisory and sub-advisory agreements, the Trustees reviewed their fiduciary duties and the relevant factors for them to consider with respect to approving the advisory and sub-advisory agreements. In addition, the Trustees who are
not deemed “interested persons” (as defined by the Investment Company Act of 1940, as amended) of the Fund (the “Independent Trustees”) met in executive session to discuss the approval of the advisory and sub-advisory agreements.
In advance of the meeting, the Advisor sent detailed information to the Trustees to assist them in their evaluation of the advisory and sub-advisory agreements. This information
included, but was not limited to, the following:
|
(1)
|
A memorandum from outside legal counsel that described the fiduciary duties of the Board with respect to approving the continuation of the advisory and sub-advisory agreements and the relevant
factors for consideration;
|
|
|
(2)
|
A memorandum from the Advisor that listed the factors relevant to the Board’s approval of the continuation of the advisory and sub-advisory agreements and also referenced the documents that had
been provided to help the Board assess each such factor;
|
|
|
(3)
|
An inventory of the services provided by the Advisor and the Sub-Advisor and the distinction between the Advisor-provided services and the Sub-Advisor-provided services;
|
|
|
(4)
|
A written discussion of economies of scale;
|
|
|
(5)
|
Summaries of the key terms of the advisory and sub-advisory agreements;
|
|
|
(6)
|
A recent Fund fact sheet, which included performance information over various periods;
|
|
|
(7)
|
A peer expense comparison of the net expense ratio and investment advisory fee of the Fund;
|
|
|
(8)
|
The Advisor’s financial statements from its most recent Form 10-K and Form 10-Q;
|
|
|
(9)
|
A completed questionnaire from the Sub-Advisor;
|
|
|
(10)
|
A summary of the Sub-Advisor’s questionnaire and relevant information from the Sub-Advisor’s Form ADV Parts I and II;
|
|
|
(11)
|
The Sub-Advisor’s Code of Ethics; and
|
|
|
(12)
|
Financial information of the Sub-Advisor.
|
All of the factors discussed were considered as a whole by the Trustees and by the Independent Trustees meeting in executive session. The factors were viewed in their totality by the
Trustees, with no single factor being the principal or determinative factor in the Trustees’ determination of whether to approve the continuation of the advisory and sub-advisory agreements. The Trustees recognized that the
management and fee
|
HENNESSY FUNDS
|
1-800-966-4354
|
29
arrangements for the Fund are the result of years of review and discussion between the Independent Trustees and the Advisor, that certain aspects of such arrangements may receive greater scrutiny in some
years than in others, and that the Trustees’ conclusions may be based, in part, on their consideration of these same arrangements and information received during the course of the year and in prior years.
Prior to approving the continuation of the advisory and sub-advisory agreements, the Trustees, including the Independent Trustees in executive session, considered, among other items:
|
(1)
|
The nature and quality of the advisory services provided by the Advisor and the Sub-Advisor;
|
|
|
(2)
|
A comparison of the fees and expenses of the Fund to other similar funds;
|
|
|
(3)
|
Whether economies of scale are recognized by the Fund;
|
|
|
(4)
|
The costs and profitability of the Fund to the Advisor and the Sub-Advisor;
|
|
|
(5)
|
The performance of the Fund; and
|
|
|
(6)
|
Any benefits to the Advisor and the Sub-Advisor from serving as an investment advisor to the Fund (other than the advisory and sub-advisory fees).
|
The material considerations and determinations of the Trustees, including the Independent Trustees, were as follows:
|
(1)
|
The Trustees considered the services identified below that are provided by the Advisor. Based on this review, the Trustees concluded that the Advisor provides high-quality services to the Fund and
noted that their overall confidence in the Advisor was high. The Trustees also concluded that they were satisfied with the nature, extent, and quality of the advisory services provided to the Fund by the Advisor and that the
nature and extent of the services provided by the Advisor were appropriate to assure that the Fund’s operations are conducted in compliance with applicable laws, rules, and regulations.
|
|
(a)
|
The Advisor oversees the Sub-Advisor for the Fund, and the Sub-Advisor acts as the portfolio manager for the Fund.
|
||
|
(b)
|
The Advisor performs a daily reconciliation of portfolio positions and cash for the Fund.
|
||
|
(c)
|
The Advisor monitors the liquidity of each Fund.
|
||
|
(d)
|
The Advisor monitors the Fund’s compliance with its investment objectives and restrictions.
|
||
|
(e)
|
The Advisor monitors compliance with federal securities laws, maintains a compliance program (including a code of ethics), conducts ongoing reviews of the compliance programs of the Sub-Advisor and
the Fund’s other service providers, as feasible, conducts on-site visits to the Sub-Advisor and the Fund’s other service providers, monitors incidents of abusive trading practices, reviews Fund expense accruals, payments,
and fixed expense ratios, evaluates insurance providers for fidelity bond, D&O/E&O insurance, and cybersecurity insurance coverage, manages regulatory examination compliance and responses, conducts employee
compliance training, reviews reports provided by service providers, and maintains books and records.
|
|
HENNESSYFUNDS.COM
|
30
|
BOARD APPROVAL OF INVESTMENT ADVISORY AGREEMENTS
|
|
(f)
|
The Advisor oversees the selection and continued employment of the Sub-Advisor, reviews the Fund’s investment performance, and monitors the Sub-Advisor’s adherence to the Fund’s investment
objectives, policies, and restrictions.
|
||
|
(g)
|
The Advisor oversees service providers that provide accounting, administration, distribution, transfer agency, custodial, sales, marketing, public relations, audit, information technology, and
legal services to the Fund.
|
||
|
(h)
|
The Advisor maintains in-house marketing and distribution departments on behalf of the Fund.
|
||
|
(i)
|
The Advisor is actively involved with preparing regulatory filings for the Fund, including writing and annually updating the Fund’s prospectus and related documents.
|
||
|
(j)
|
For each annual report of the Fund, the Advisor reviews the written summary prepared by the Sub-Advisor of the Fund’s performance during the most recent 12-month period.
|
||
|
(k)
|
The Advisor oversees distribution of the Fund through third-party broker/dealers and independent financial institutions such as Charles Schwab, Inc., Fidelity, TD Ameritrade, and Pershing. The
Advisor participates in “no transaction fee” (“NTF”) programs with these companies on behalf of the Fund, which allow customers to purchase the Fund through third-party distribution channels without paying a transaction fee.
The Advisor compensates, in part, a number of these third-party providers of NTF programs out of its own revenues.
|
||
|
(l)
|
The Advisor pays the incentive compensation of the Fund’s compliance officers and employs other staff, such as legal, marketing, national accounts, distribution, sales, administrative, and trading
oversight personnel, as well as management executives.
|
||
|
(m)
|
The Advisor provides a quarterly compliance certification to the Board.
|
||
|
(n)
|
The Advisor prepares or reviews all Board materials, frequently presents to the Board and leads Board discussions, prepares or reviews all meeting minutes, and arranges for Board training and
education.
|
|
(2)
|
The Trustees considered the services identified below that are provided by the Sub-Advisor:
|
|
(a)
|
The Sub-Advisor acts as the portfolio manager for the Fund. In this capacity, the Sub-Advisor does the following:
|
|
(i)
|
manages the composition of the Fund’s portfolio, including the purchase, retention, and disposition of portfolio securities in accordance with the Fund’s investment objectives, policies, and
restrictions;
|
|||
|
(ii)
|
seeks best execution for the Fund’s portfolio;
|
|||
|
(iii)
|
manages the use of soft dollars for the Fund; and
|
|||
|
(iv)
|
manages proxy voting for the Fund.
|
|
(b)
|
The Sub-Advisor ensures that its compliance program includes policies and procedures relevant to the Fund and the Sub-Advisor’s duties as a portfolio manager to the Fund.
|
||
|
(c)
|
For each annual report of the Fund, the Sub-Advisor prepares a written summary of the Fund’s performance during the most recent 12-month period.
|
|
HENNESSY FUNDS
|
1-800-966-4354
|
31
|
(d)
|
The Sub-Advisor provides a quarterly compliance certification to the Board regarding trading and allocation practices, supervisory matters, the Sub-Advisor’s compliance program (including its code
of ethics), compliance with the Fund’s policies, and general firm updates.
|
|
(3)
|
The Trustees considered the distinction between the services performed by the Advisor and the Sub-Advisor. The Trustees noted that the management of the Fund, including the oversight of the
Sub-Advisor, involves more comprehensive and substantive duties than the duties of the Sub-Advisor. Specifically, the Trustees considered the lists of services identified above and concluded that the services performed by
the Advisor for the Fund require a higher level of service and oversight than the services performed by the Sub-Advisor. Based on this determination, the Trustees concluded that the differential in advisory fees between the
Advisor and the Sub-Advisor is reasonable.
|
|
|
(4)
|
The Trustees compared the performance of the Fund to benchmark indices over various periods and also noted that the Trustees review and discuss reports comparing the investment performance of the
Fund to various indices at each quarterly Board meeting. Based on such information, the Trustees determined that the Advisor and the Sub-Advisor manage the Fund in a manner materially consistent with its stated investment
objective and style. The Trustees concluded that the performance of the Fund over various periods warranted continuation of the advisory and sub-advisory agreements.
|
|
|
(5)
|
The Trustees reviewed the advisory fees and overall expense ratios of the Fund compared to other funds similar in asset size and investment objective to the Fund using data from Morningstar. As
part of the discussion with management, the Trustees ensured that they understood and were comfortable with the criteria used to determine the mutual funds included in the Morningstar categories for purposes of the materials
considered at the meeting. The Trustees determined that the advisory fee and overall expense ratio of the Fund falls within the range of the advisory fees and overall expense ratios of other comparable funds and concluded
that they are reasonable and warranted continuation of the advisory and sub-advisory agreements.
|
|
|
(6)
|
The Trustees also considered whether the Advisor was realizing economies of scale that it should share with the Fund’s shareholders. The Trustees noted that the assets of the Fund had declined over
the prior year. In addition, the Trustees noted that many of the expenses incurred to manage the Fund are asset-based fees, so the Advisor does not realize material economies of scale relating to those expenses as the assets
of the Fund increase. For example, mutual fund platform fees increase as the Fund’s assets grow. The Trustees also considered the Advisor’s efforts to contain expenses through actions such as renegotiating service contracts,
the Advisor’s significant marketing efforts to promote the Funds, the Advisor’s investments in personnel to manage the Funds, and the Advisor’s agreement to waive fees or lower its management fees in certain circumstances.
The Trustees noted that it did not appear that the Advisor was realizing economies of scale at current asset levels and concluded that it would continue to monitor economies of scale in the future as circumstances changed.
|
|
|
(7)
|
The Trustees considered the profitability of the Advisor and the Sub-Advisor, including the impact of mutual fund platform fees on the Advisor’s profitability, and also considered the resources and
revenues that the Advisor has put into
|
|
HENNESSYFUNDS.COM
|
32
|
BOARD APPROVAL OF INVESTMENT ADVISORY AGREEMENTS
|
|
managing and distributing the Fund. The Trustees then concluded that the profits of the Advisor and the Sub-Advisor are reasonable and not excessive when compared to profitability guidelines set
forth in relevant court cases.
|
||
|
(8)
|
The Trustees considered the high level of professionalism and knowledge of the Advisor’s employees, along with a very low level of turnover, and concluded that this was beneficial to the Fund and
its shareholders.
|
|
|
(9)
|
The Trustees considered any benefits to the Advisor and the Sub-Advisor from serving as an advisor to the Fund (other than the advisory and sub-advisory fees). The Trustees noted that the Advisor
and the Sub-Advisor may derive ancillary benefits from, by way of example, their association with the Fund in the form of proprietary and third-party research products and services received from broker-dealers that execute
portfolio trades for the Fund. The Trustees determined that any such products and services have been used for legitimate purposes relating to the Fund by providing assistance in the investment decision-making process. The
Trustees concluded that any additional benefits realized by the Advisor and the Sub-Advisor from their relationship with the Fund were reasonable, which was based on, among other things, the Trustees’ findings that (i) the
research, analytical, statistical, and other information and services provided by brokers are merely supplemental to the Advisor’s and the Sub-Advisor’s own efforts in the performance of their duties under the advisory and
sub-advisory agreements and (ii) although the Sub-Advisor could derive benefits from the conversion of Fund shareholders into separate account clients, the Fund also could benefit from potential institutional shareholders
who might choose to invest in the Fund.
|
After reviewing the materials and information provided at the meeting, as well as other information regularly provided at the Board’s quarterly meetings throughout the year regarding the
quality of services provided by the Advisor and the Sub-Advisor, the performance of the Fund, expense information, brokerage commissions information, the adequacy and efficacy of the Advisor’s and the Sub-Advisor’s written policies
and procedures, other regulatory compliance issues, trading information and related matters, and other factors that the Trustees deemed relevant, the Trustees, including the Independent Trustees, approved the continuation of the
advisory and sub-advisory agreements.
|
HENNESSY FUNDS
|
1-800-966-4354
|
33
For information, questions, or assistance, please call
The Hennessy Funds
1-800-966-4354 or 1-415-899-1555
INVESTMENT ADVISOR
Hennessy Advisors, Inc.
7250 Redwood Boulevard, Suite 200
Novato, California 94945
ADMINISTRATOR,
TRANSFER AGENT,
DIVIDEND PAYING AGENT, &
SHAREHOLDER SERVICING AGENT
U.S. Bancorp Fund Services, LLC
d/b/a U.S. Bank Global Fund Services
P.O. Box 701
Milwaukee, Wisconsin 53201-0701
CUSTODIAN
U.S. Bank N.A.
Custody Operations
1555 North River Center Drive, Suite 302
Milwaukee, Wisconsin 53212
TRUSTEES
Neil J. Hennessy
Robert T. Doyle
J. Dennis DeSousa
Gerald P. Richardson
COUNSEL
Foley & Lardner LLP
777 East Wisconsin Avenue
Milwaukee, Wisconsin 53202-5306
INDEPENDENT REGISTERED
PUBLIC ACCOUNTING FIRM
Tait, Weller & Baker LLP
Two Liberty Place
50 South 16th Street, Suite 2900
Philadelphia, Pennsylvania 19102-2529
DISTRIBUTOR
Quasar Distributors, LLC
111 East Kilbourn Avenue, Suite 2200
Milwaukee, Wisconsin 53202
www.hennessyfunds.com | 1-800-966-4354
This report has been prepared for shareholders and may be distributed to
others only if preceded or accompanied by a current prospectus.
SEMI-ANNUAL REPORT
APRIL 30, 2020

HENNESSY GAS UTILITY FUND
Investor Class GASFX
Institutional Class HGASX
IMPORTANT NOTICE REGARDING ELECTRONIC DELIVERY OF SHAREHOLDER REPORTS
Beginning on January 1, 2021, as permitted by regulations adopted by the Securities and Exchange Commission, paper copies of the annual and
semi-annual reports will no longer be sent by mail unless you specifically request paper copies from the Hennessy Funds or from your financial intermediary. Instead, the reports will be made available on a website, and
you will be notified by mail each time a report is posted and provided with a website link to access the report.
If you have already elected to receive shareholder reports electronically, you will not be affected by this change and you need not take any action.
You may elect to receive shareholder reports and other communications from the Hennessy Funds electronically by visiting www.hennessyfunds.com/account or by calling U.S. Bank Global Fund Services at 1-800-261-6950. If you
own shares in a Fund through a financial intermediary, please contact your financial intermediary to make this election.
You may elect to receive paper copies of all future reports free of charge by calling U.S. Bank Global Fund Services at 1-800-261-6950 or, if you own
your shares through a financial intermediary, by contacting your financial intermediary. Your election to receive paper copies of reports will apply to all Funds in the Hennessy Funds family.
hennessyfunds.com | 1-800-966-4354
(This Page Intentionally Left Blank.)
Contents
|
Letter to Shareholders
|
2
|
|
Performance Overview
|
4
|
|
Financial Statements
|
|
|
Schedule of Investments
|
5
|
|
Statement of Assets and Liabilities
|
9
|
|
Statement of Operations
|
10
|
|
Statements of Changes in Net Assets
|
11
|
|
Financial Highlights
|
12
|
|
Notes to the Financial Statements
|
16
|
|
Expense Example
|
23
|
|
Proxy Voting Policy and Proxy Voting Records
|
25
|
|
Availability of Quarterly Portfolio Schedule
|
25
|
|
Federal Tax Distribution Information
|
25
|
|
Important Notice Regarding Delivery of Shareholder Documents
|
25
|
|
Electronic Delivery
|
25
|
|
Board Approval of Investment Advisory Agreement
|
26
|
|
HENNESSY FUNDS
|
1-800-966-4354
|
June 2020
Dear Hennessy Funds Shareholder:
First and foremost, I hope this communication finds you and your loved ones safe and healthy. In many ways, the COVID-19 pandemic has turned the world upside down in recent months, and we at Hennessy
have joined the rest of the world in witnessing and experiencing its profound effect on public health, the global economy, and the everyday lives of people around the world. In response to the crisis, we invoked our business
continuity plan in mid-March to ensure a smooth transition to remote work for all of our employees, who have been working safely and productively from home. We want to assure our Hennessy Funds shareholders that our operations are
uninterrupted and functioning normally.
The past six months have been marked by extremes. During the first half of the period from November 2019 through January 2020, the bull market, supported by strong corporate
fundamentals, continued to move higher, and investors appeared focused on record-low unemployment and strong economic growth. In mid-February, the major U.S. market indices hit all-time highs, but then, within just a matter of
weeks, lost over one-third of their values as the COVID-19 pandemic unfolded. Shelter-in-place and business closure orders rippled through the nation, causing initial unemployment claims to skyrocket to their highest number in
history. The market then rallied back and posted double-digit positive returns in April.
For the six months ended April 30, 2020, on a total return basis, the Dow Jones Industrial Average was down 8.9% and the S&P 500® Index was down 3.2%. Small-cap and mid-cap stocks generally fared worse than large-cap stocks during the period, and the Financial sector was particularly hard hit as the Federal Reserve
aggressively cut the federal funds rate in an effort to stabilize the economy. The Energy sector was crushed by both the sudden loss of demand due to COVID-19 and the oversupply caused by the surprise market-share battle between
Russia and Saudi Arabia, and the S&P 500® Energy Sector Index ended the six-month period down over 30%.
The COVID-19 pandemic is an unprecedented event, and the duration and full extent of the economic impact is unknown. In the moment, there is always the concern that ‘this time is
different.’ But, when you are able to look at past financial, political, and health crises with the benefit of 20/20 hindsight, history has demonstrated that our economy and financial markets have always rebounded and recovered
eventually. If you look back to the last market downturn in 2008, economic fundamentals were weak compared to the market in 2020, where the overall underpinnings were – and are still – quite strong. Publicly listed companies
today have plenty of cash, with over $5 trillion on balance sheets of the S&P 500® companies alone, and I believe that most will survive and that
many may emerge from the current crisis even stronger.
|
HENNESSYFUNDS.COM
|
2
|
LETTER TO SHAREHOLDERS
|
We understand that this market volatility and economic uncertainty is jarring to many investors, and we continue to monitor events and the markets. We remain focused on managing our
high-conviction portfolios for the long-term benefit of our shareholders, and we are confident in the time-tested strategies and rigorous research that led to their formation. We encourage shareholders to maintain a long-term
investment horizon and to remain focused on long-term goals. As always, but especially in these trying times, we are here to support our shareholders, and we thank you for your continued investment and trust. Should you have any
questions or would like to speak with us directly, please don’t hesitate to call (800) 966-4354 or email us at fundsinfo@hennessyfunds.com.
Best regards,
Neil J. Hennessy
President and Chief Investment Officer
Past performance does not guarantee future results.
Mutual fund investing involves risk. Principal loss is possible.
The Dow Jones Industrial Average and S&P 500® Index are commonly used to measure the performance of U.S. stocks. The
S&P 500® Energy Sector Index is an index that comprises those companies included in the S&P 500 that are classified as members of the GICS
energy sector. One cannot invest directly in an index.
|
HENNESSY FUNDS
|
1-800-966-4354
|
3
Performance Overview (Unaudited)
AVERAGE ANNUAL TOTAL RETURN FOR PERIODS ENDED APRIL 30, 2020
|
Six
|
One
|
Five
|
Ten
|
|
|
Months(1)
|
Year
|
Years
|
Years
|
|
|
Hennessy Gas Utility Fund –
|
||||
|
Investor Class (GASFX)
|
-12.56%
|
-9.47%
|
1.80%
|
9.13%
|
|
Hennessy Gas Utility Fund –
|
||||
|
Institutional Class (HGASX)(2)
|
-12.42%
|
-9.22%
|
2.01%
|
9.24%
|
|
AGA Stock Index
|
-12.27%
|
-8.44%
|
3.06%
|
10.05%
|
|
S&P 500® Index
|
-3.16%
|
0.86%
|
9.12%
|
11.69%
|
Expense ratios: 1.00% (Investor Class); 0.69% (Institutional Class)
|
(1)
|
Periods of less than one year are not annualized.
|
|
(2)
|
The inception date of Institutional Class shares is March 1, 2017. Performance shown prior to the inception of Institutional Class shares reflects the performance of Investor Class shares and
includes expenses that are not applicable to, and are higher than, those of Institutional Class shares.
|
_______________
Performance data quoted represents past performance; past performance does not guarantee future results. The investment return and principal value of an investment will fluctuate so
that an investor’s shares, when redeemed, may be worth more or less than their original cost. The performance table does not reflect the deduction of taxes that a shareholder would pay on Fund distributions or the redemption of
Fund shares. Current performance of the Fund may be lower or higher than the performance quoted. Performance data current to the most recent month end may be obtained by visiting www.hennessyfunds.com. Performance for periods on
or prior to October 26, 2012, is that of the FBR Gas Utility Index Fund.
The AGA Stock Index is a capitalization-weighted index consisting of publicly traded members of the American Gas Association whose securities are traded on a U.S. stock exchange. The S&P 500® Index is a capitalization-weighted index that is designed to represent the broad domestic economy through changes in the aggregate market value of 500
stocks across all major industries. One cannot invest directly in an index. These indices are used herein for comparative purposes in accordance with SEC regulations.
Standard & Poor’s Financial Services LLC is the source and owner of the S&P® and S&P 500® trademarks.
The expense ratios presented are from the most recent prospectus. The expense ratios for the current reporting period are available in the Financial Highlights section of this report.
|
HENNESSYFUNDS.COM
|
4
|
PERFORMANCE OVERVIEW/SCHEDULE OF INVESTMENTS
|
Financial Statements
|
Schedule of Investments as of April
30, 2020 (Unaudited)
|
HENNESSY GAS UTILITY FUND
(% of Net Assets)
|
TOP TEN HOLDINGS (EXCLUDING MONEY MARKET FUNDS)
|
% NET ASSETS
|
|
Cheniere Energy, Inc.
|
5.48%
|
|
Enbridge, Inc.
|
5.24%
|
|
Kinder Morgan, Inc.
|
5.16%
|
|
National Grid PLC – ADR
|
5.14%
|
|
Atmos Energy Corp.
|
4.93%
|
|
Dominion Energy, Inc.
|
4.91%
|
|
Sempra Energy
|
4.83%
|
|
TC Energy Corp.
|
4.81%
|
|
The Southern Co.
|
4.81%
|
|
WEC Energy Group, Inc.
|
4.81%
|
Note: For presentation purposes, the Fund has grouped some of the industry categories. For purposes of categorizing securities for compliance with Section 8(b)(1) of the Investment Company Act of 1940,
as amended, the Fund uses more specific industry classifications.
The Global Industry Classification Standard (GICS®) was developed by and is the exclusive property and a service mark of
MSCI, Inc. and Standard & Poor’s Financial Services LLC. It has been licensed for use by the Hennessy Funds.
|
HENNESSY FUNDS
|
1-800-966-4354
|
5
|
COMMON STOCKS – 98.73%
|
Number
|
% of
|
||||||||||
|
|
of Shares
|
Value
|
Net Assets
|
|||||||||
|
Energy – 20.85%
|
||||||||||||
|
Cheniere Energy, Inc. (a)
|
751,917
|
$
|
35,107,005
|
5.48
|
%
|
|||||||
|
Enbridge, Inc. (b)
|
1,094,765
|
33,587,390
|
5.24
|
%
|
||||||||
|
Kinder Morgan, Inc.
|
2,174,101
|
33,111,558
|
5.16
|
%
|
||||||||
|
TC Energy Corp. (b)
|
665,353
|
30,845,765
|
4.81
|
%
|
||||||||
|
Tellurian, Inc. (a)
|
717,690
|
1,019,120
|
0.16
|
%
|
||||||||
|
|
133,670,838
|
20.85
|
%
|
|||||||||
|
Financials – 2.68%
|
||||||||||||
|
Berkshire Hathaway, Inc., Class A (a)
|
61
|
17,183,700
|
2.68
|
%
|
||||||||
|
Utilities – 75.20%
|
||||||||||||
|
Algonquin Power & Utilities Corp. (b)
|
215,664
|
2,986,946
|
0.47
|
%
|
||||||||
|
ALLETE, Inc.
|
775
|
44,609
|
0.01
|
%
|
||||||||
|
Ameren Corp.
|
85,440
|
6,215,760
|
0.97
|
%
|
||||||||
|
Atmos Energy Corp.
|
310,086
|
31,619,469
|
4.93
|
%
|
||||||||
|
Avangrid, Inc.
|
150,900
|
6,488,700
|
1.01
|
%
|
||||||||
|
Avista Corp.
|
47,772
|
2,056,107
|
0.32
|
%
|
||||||||
|
Black Hills Corp.
|
120,147
|
7,441,905
|
1.16
|
%
|
||||||||
|
Centerpoint Energy, Inc.
|
474,828
|
8,086,321
|
1.26
|
%
|
||||||||
|
Chesapeake Utilities Corp.
|
45,858
|
4,030,001
|
0.63
|
%
|
||||||||
|
CMS Energy Corp.
|
332,998
|
19,010,856
|
2.97
|
%
|
||||||||
|
Consolidated Edison, Inc.
|
240,836
|
18,977,877
|
2.96
|
%
|
||||||||
|
Corning Natural Gas Holding Corp.
|
11,099
|
193,622
|
0.03
|
%
|
||||||||
|
Dominion Energy, Inc.
|
407,877
|
31,459,553
|
4.91
|
%
|
||||||||
|
DTE Energy Co.
|
163,904
|
17,003,401
|
2.65
|
%
|
||||||||
|
Duke Energy Corp.
|
226,687
|
19,191,321
|
2.99
|
%
|
||||||||
|
Entergy Corp.
|
6,360
|
607,444
|
0.10
|
%
|
||||||||
|
Eversource Energy
|
85,175
|
6,873,623
|
1.07
|
%
|
||||||||
|
Exelon Corp.
|
196,831
|
7,298,494
|
1.14
|
%
|
||||||||
|
Fortis, Inc. (b)
|
269,276
|
10,434,445
|
1.63
|
%
|
||||||||
|
MDU Resources Group, Inc.
|
315,807
|
7,093,025
|
1.11
|
%
|
||||||||
|
MGE Energy, Inc.
|
25,929
|
1,676,569
|
0.26
|
%
|
||||||||
|
National Fuel Gas Co.
|
196,924
|
8,073,884
|
1.26
|
%
|
||||||||
|
National Grid PLC – ADR (b)
|
562,444
|
32,936,721
|
5.14
|
%
|
||||||||
|
New Jersey Resources Corp.
|
226,034
|
7,635,429
|
1.19
|
%
|
||||||||
|
NiSource, Inc.
|
873,181
|
21,925,575
|
3.42
|
%
|
||||||||
The accompanying notes are an integral part of these financial statements.
|
HENNESSYFUNDS.COM
|
6
|
SCHEDULE OF INVESTMENTS
|
|
COMMON STOCKS
|
Number
|
% of
|
||||||||||
|
|
of Shares
|
Value
|
Net Assets
|
|||||||||
|
Utilities (Continued)
|
||||||||||||
|
Northwest Natural Holding Co.
|
109,503
|
$
|
7,128,645
|
1.11
|
%
|
|||||||
|
NorthWestern Corp.
|
36,998
|
2,134,415
|
0.33
|
%
|
||||||||
|
ONE Gas, Inc.
|
191,875
|
15,294,356
|
2.39
|
%
|
||||||||
|
PG&E Corp. (a)
|
512,449
|
5,452,457
|
0.85
|
%
|
||||||||
|
PPL Corp.
|
248,319
|
6,312,269
|
0.98
|
%
|
||||||||
|
Public Service Enterprise Group, Inc.
|
373,690
|
18,949,820
|
2.96
|
%
|
||||||||
|
RGC Resources, Inc.
|
34,254
|
851,897
|
0.13
|
%
|
||||||||
|
Sempra Energy
|
250,240
|
30,992,224
|
4.83
|
%
|
||||||||
|
South Jersey Industries, Inc.
|
296,671
|
8,481,824
|
1.32
|
%
|
||||||||
|
Southwest Gas Holdings, Inc.
|
160,817
|
12,189,929
|
1.90
|
%
|
||||||||
|
Spire, Inc.
|
151,491
|
11,052,783
|
1.72
|
%
|
||||||||
|
The Southern Co.
|
544,200
|
30,872,466
|
4.81
|
%
|
||||||||
|
UGI Corp.
|
208,352
|
6,288,063
|
0.98
|
%
|
||||||||
|
Unitil Corp.
|
32,098
|
1,614,850
|
0.25
|
%
|
||||||||
|
WEC Energy Group, Inc.
|
340,940
|
30,872,117
|
4.81
|
%
|
||||||||
|
Xcel Energy, Inc.
|
225,699
|
14,345,428
|
2.24
|
%
|
||||||||
|
|
482,195,200
|
75.20
|
%
|
|||||||||
|
Total Common Stocks
|
||||||||||||
|
(Cost $360,328,687)
|
633,049,738
|
98.73
|
%
|
|||||||||
|
|
||||||||||||
|
PARTNERSHIPS – 0.54%
|
||||||||||||
|
Energy – 0.54%
|
||||||||||||
|
Plains GP Holdings LP, Class A
|
379,055
|
3,483,516
|
0.54
|
%
|
||||||||
|
|
||||||||||||
|
Total Partnerships
|
||||||||||||
|
(Cost $7,457,592)
|
3,483,516
|
0.54
|
%
|
|||||||||
The accompanying notes are an integral part of these financial statements.
|
HENNESSY FUNDS
|
1-800-966-4354
|
7
|
SHORT-TERM INVESTMENTS – 0.76%
|
Number
|
% of
|
||||||||||
|
|
of Shares
|
Value
|
Net Assets
|
|||||||||
|
Money Market Funds – 0.76%
|
||||||||||||
|
First American Government Obligations Fund,
|
||||||||||||
|
Institutional Class, 0.25% (c)
|
4,863,321
|
$
|
4,863,321
|
0.76
|
%
|
|||||||
|
|
||||||||||||
|
Total Short-Term Investments
|
||||||||||||
|
(Cost $4,863,321)
|
4,863,321
|
0.76
|
%
|
|||||||||
|
|
||||||||||||
|
Total Investments
|
||||||||||||
|
(Cost $372,649,600) – 100.03%
|
641,396,575
|
100.03
|
%
|
|||||||||
|
Liabilities in Excess of Other Assets – (0.03)%
|
(168,412
|
)
|
(0.03
|
)%
|
||||||||
|
|
||||||||||||
|
TOTAL NET ASSETS – 100.00%
|
$
|
641,228,163
|
100.00
|
%
|
||||||||
Percentages are stated as a percent of net assets.
PLC – Public Limited Company
ADR – American Depositary Receipt
|
(a)
|
Non-income-producing security.
|
|
(b)
|
U.S.-traded security of a foreign corporation.
|
|
(c)
|
The rate listed is the fund’s seven-day yield as of April 30, 2020.
|
Summary of Fair Value Exposure as of April 30, 2020
The following is a summary of the inputs used to value the Fund’s net assets as of April 30, 2020 (see Note 3 in the accompanying Notes to the Financial Statements):
|
Common Stocks
|
Level 1
|
Level 2
|
Level 3
|
Total
|
||||||||||||
|
Energy
|
$
|
133,670,838
|
$
|
—
|
$
|
—
|
$
|
133,670,838
|
||||||||
|
Financials
|
17,183,700
|
—
|
—
|
17,183,700
|
||||||||||||
|
Utilities
|
482,001,578
|
193,622
|
—
|
482,195,200
|
||||||||||||
|
Total Common Stocks
|
$
|
632,856,116
|
$
|
193,622
|
$
|
—
|
$
|
633,049,738
|
||||||||
|
Partnerships
|
||||||||||||||||
|
Energy
|
$
|
3,483,516
|
$
|
—
|
$
|
—
|
$
|
3,483,516
|
||||||||
|
Total Partnerships
|
$
|
3,483,516
|
$
|
—
|
$
|
—
|
$
|
3,483,516
|
||||||||
|
Short-Term Investments
|
||||||||||||||||
|
Money Market Funds
|
$
|
4,863,321
|
$
|
—
|
$
|
—
|
$
|
4,863,321
|
||||||||
|
Total Short-Term Investments
|
$
|
4,863,321
|
$
|
—
|
$
|
—
|
$
|
4,863,321
|
||||||||
|
Total Investments
|
$
|
641,202,953
|
$
|
193,622
|
$
|
—
|
$
|
641,396,575
|
||||||||
The accompanying notes are an integral part of these financial statements.
|
HENNESSYFUNDS.COM
|
8
|
SCHEDULE OF INVESTMENTS/STATEMENT OF ASSETS AND LIABILITIES
|
Financial Statements
|
Statement of Assets and Liabilities as of April 30, 2020 (Unaudited)
|
|
ASSETS:
|
||||
|
Investments in securities, at value (cost $372,649,600)
|
$
|
641,396,575
|
||
|
Cash
|
375,834
|
|||
|
Dividends and interest receivable
|
242,468
|
|||
|
Receivable for fund shares sold
|
114,001
|
|||
|
Return of capital receivable
|
68,230
|
|||
|
Prepaid expenses and other assets
|
36,161
|
|||
|
Total assets
|
642,233,269
|
|||
|
LIABILITIES:
|
||||
|
Payable for fund shares redeemed
|
338,932
|
|||
|
Payable to advisor
|
209,645
|
|||
|
Payable to sub-transfer agents
|
161,173
|
|||
|
Payable to administrator
|
107,712
|
|||
|
Payable to auditor
|
11,378
|
|||
|
Accrued distribution fees
|
94,662
|
|||
|
Accrued service fees
|
45,707
|
|||
|
Accrued expenses and other payables
|
35,897
|
|||
|
Total liabilities
|
1,005,106
|
|||
|
NET ASSETS
|
$
|
641,228,163
|
||
|
NET ASSETS CONSISTS OF:
|
||||
|
Capital stock
|
$
|
404,152,347
|
||
|
Total distributable earnings
|
237,075,816
|
|||
|
Total net assets
|
$
|
641,228,163
|
||
|
NET ASSETS:
|
||||
|
Investor Class
|
||||
|
Shares authorized (no par value)
|
Unlimited
|
|||
|
Net assets applicable to outstanding shares
|
$
|
559,153,218
|
||
|
Shares issued and outstanding
|
22,957,819
|
|||
|
Net asset value, offering price, and redemption price per share
|
$
|
24.36
|
||
|
Institutional Class
|
||||
|
Shares authorized (no par value)
|
Unlimited
|
|||
|
Net assets applicable to outstanding shares
|
$
|
82,074,945
|
||
|
Shares issued and outstanding
|
3,378,660
|
|||
|
Net asset value, offering price, and redemption price per share
|
$
|
24.29
|
||
The accompanying notes are an integral part of these financial statements.
|
HENNESSY FUNDS
|
1-800-966-4354
|
9
Financial Statements
|
Statement of Operations for the six months ended April 30, 2020 (Unaudited)
|
|
INVESTMENT INCOME:
|
||||
|
Dividend income(1)
|
$
|
12,226,890
|
||
|
Interest income
|
24,850
|
|||
|
Total investment income
|
12,251,740
|
|||
|
EXPENSES:
|
||||
|
Investment advisory fees (See Note 5)
|
1,551,797
|
|||
|
Sub-transfer agent expenses – Investor Class (See Note 5)
|
671,732
|
|||
|
Sub-transfer agent expenses – Institutional Class (See Note 5)
|
53,585
|
|||
|
Distribution fees – Investor Class (See Note 5)
|
508,280
|
|||
|
Administration, accounting, custody, and transfer agent fees (See Note 5)
|
395,679
|
|||
|
Service fees – Investor Class (See Note 5)
|
338,854
|
|||
|
Reports to shareholders
|
34,406
|
|||
|
Federal and state registration fees
|
23,828
|
|||
|
Compliance expense (See Note 5)
|
13,462
|
|||
|
Trustees’ fees and expenses
|
12,811
|
|||
|
Audit fees
|
11,375
|
|||
|
Interest expense (See Note 7)
|
7,184
|
|||
|
Legal fees
|
4,299
|
|||
|
Other expenses
|
191,581
|
|||
|
Total expenses
|
3,818,873
|
|||
|
NET INVESTMENT INCOME
|
$
|
8,432,867
|
||
|
REALIZED AND UNREALIZED GAINS (LOSSES):
|
||||
|
Net realized gain on investments
|
$
|
25,308,279
|
||
|
Net change in unrealized appreciation/depreciation on investments
|
(135,548,373
|
)
|
||
|
Net loss on investments
|
(110,240,094
|
)
|
||
|
NET DECREASE IN NET ASSETS RESULTING FROM OPERATIONS
|
$
|
(101,807,227
|
)
|
|
|
(1)
|
Net of foreign taxes withheld and issuance fees of $372,054.
|
The accompanying notes are an integral part of these financial statements.
|
HENNESSYFUNDS.COM
|
10
|
STATEMENT OF OPERATIONS/STATEMENTS OF CHANGES IN NET ASSETS
|
Financial Statements
|
Statements of Changes in Net Assets
|
|
Six Months Ended
|
||||||||
|
April 30, 2020
|
Year Ended
|
|||||||
|
(Unaudited)
|
October 31, 2019
|
|||||||
|
OPERATIONS:
|
||||||||
|
Net investment income
|
$
|
8,432,867
|
$
|
18,043,168
|
||||
|
Net realized gain on investments
|
25,308,279
|
63,413,446
|
||||||
|
Net change in unrealized
|
||||||||
|
appreciation/depreciation on investments
|
(135,548,373
|
)
|
46,797,092
|
|||||
|
Net increase (decrease) in net assets
|
||||||||
|
resulting from operations
|
(101,807,227
|
)
|
128,253,706
|
|||||
|
DISTRIBUTIONS TO SHAREHOLDERS:
|
||||||||
|
Distributable earnings – Investor Class
|
(42,983,904
|
)
|
(87,242,469
|
)
|
||||
|
Distributable earnings – Institutional Class
|
(6,343,991
|
)
|
(10,746,642
|
)
|
||||
|
Total distributions
|
(49,327,895
|
)
|
(97,989,111
|
)
|
||||
|
CAPITAL SHARE TRANSACTIONS:
|
||||||||
|
Proceeds from shares subscribed – Investor Class
|
9,680,042
|
27,141,120
|
||||||
|
Proceeds from shares subscribed – Institutional Class
|
10,794,545
|
29,423,854
|
||||||
|
Dividends reinvested – Investor Class
|
40,982,164
|
83,615,102
|
||||||
|
Dividends reinvested – Institutional Class
|
5,640,190
|
9,491,172
|
||||||
|
Cost of shares redeemed – Investor Class
|
(123,629,129
|
)
|
(198,693,830
|
)
|
||||
|
Cost of shares redeemed – Institutional Class
|
(22,394,216
|
)
|
(42,887,435
|
)
|
||||
|
Net decrease in net assets derived
|
||||||||
|
from capital share transactions
|
(78,926,404
|
)
|
(91,910,017
|
)
|
||||
|
TOTAL DECREASE IN NET ASSETS
|
(230,061,526
|
)
|
(61,645,422
|
)
|
||||
|
NET ASSETS:
|
||||||||
|
Beginning of period
|
871,289,689
|
932,935,111
|
||||||
|
End of period
|
$
|
641,228,163
|
$
|
871,289,689
|
||||
|
CHANGES IN SHARES OUTSTANDING:
|
||||||||
|
Shares sold – Investor Class
|
364,553
|
951,713
|
||||||
|
Shares sold – Institutional Class
|
401,576
|
1,020,364
|
||||||
|
Shares issued to holders as reinvestment
|
||||||||
|
of dividends – Investor Class
|
1,515,277
|
3,050,796
|
||||||
|
Shares issued to holders as reinvestment
|
||||||||
|
of dividends – Institutional Class
|
209,392
|
346,698
|
||||||
|
Shares redeemed – Investor Class
|
(4,701,423
|
)
|
(6,995,506
|
)
|
||||
|
Shares redeemed – Institutional Class
|
(857,916
|
)
|
(1,502,291
|
)
|
||||
|
Net decrease in shares outstanding
|
(3,068,541
|
)
|
(3,128,226
|
)
|
||||
The accompanying notes are an integral part of these financial statements.
|
HENNESSY FUNDS
|
1-800-966-4354
|
11
Financial Statements
|
Financial Highlights
|
For an Investor Class share outstanding throughout each period
|
Six Months Ended
|
||||
|
April 30, 2020
|
||||
|
(Unaudited)
|
||||
|
PER SHARE DATA:
|
||||
|
Net asset value, beginning of period
|
$
|
29.64
|
||
|
Income from investment operations:
|
||||
|
Net investment income
|
0.29
|
(1)
|
||
|
Net realized and unrealized gains (losses) on investments
|
(3.86
|
)
|
||
|
Total from investment operations
|
(3.57
|
)
|
||
|
Less distributions:
|
||||
|
Dividends from net investment income
|
(0.27
|
)
|
||
|
Dividends from net realized gains
|
(1.44
|
)
|
||
|
Total distributions
|
(1.71
|
)
|
||
|
Net asset value, end of period
|
$
|
24.36
|
||
|
TOTAL RETURN
|
-12.56
|
%(2)
|
||
|
SUPPLEMENTAL DATA AND RATIOS:
|
||||
|
Net assets, end of period (millions)
|
$
|
559.15
|
||
|
Ratio of expenses to average net assets
|
1.03
|
%(3)
|
||
|
Ratio of net investment income to average net assets
|
2.13
|
%(3)
|
||
|
Portfolio turnover rate(4)
|
7
|
%(2)
|
||
|
(1)
|
Calculated using the average shares outstanding method.
|
|
(2)
|
Not annualized.
|
|
(3)
|
Annualized.
|
|
(4)
|
Calculated on the basis of the Fund as a whole.
|
The accompanying notes are an integral part of these financial statements.
|
HENNESSYFUNDS.COM
|
12
|
FINANCIAL HIGHLIGHTS — INVESTOR CLASS
|
|
Year Ended October 31,
|
||||||||||||||||||
|
2019
|
2018
|
2017
|
2016
|
2015
|
||||||||||||||
|
$
|
28.68
|
$
|
30.35
|
$
|
28.57
|
$
|
27.69
|
$
|
31.30
|
|||||||||
|
0.56
|
(1)
|
0.65
|
0.70
|
0.62
|
0.69
|
|||||||||||||
|
3.50
|
(1.52
|
)
|
2.20
|
1.58
|
(2.69
|
)
|
||||||||||||
|
4.06
|
(0.87
|
)
|
2.90
|
2.20
|
(2.00
|
)
|
||||||||||||
|
(0.62
|
)
|
(0.64
|
)
|
(0.72
|
)
|
(0.69
|
)
|
(0.70
|
)
|
|||||||||
|
(2.48
|
)
|
(0.16
|
)
|
(0.40
|
)
|
(0.63
|
)
|
(0.91
|
)
|
|||||||||
|
(3.10
|
)
|
(0.80
|
)
|
(1.12
|
)
|
(1.32
|
)
|
(1.61
|
)
|
|||||||||
|
$
|
29.64
|
$
|
28.68
|
$
|
30.35
|
$
|
28.57
|
$
|
27.69
|
|||||||||
|
15.28
|
%
|
-2.86
|
%
|
10.39
|
%
|
8.52
|
%
|
-6.59
|
%
|
|||||||||
|
$
|
764.10
|
$
|
825.18
|
$
|
1,306.70
|
$
|
1,454.93
|
$
|
1,649.21
|
|||||||||
|
1.00
|
%
|
1.01
|
%
|
1.01
|
%
|
1.01
|
%
|
0.93
|
%
|
|||||||||
|
1.98
|
%
|
2.18
|
%
|
2.34
|
%
|
2.25
|
%
|
2.33
|
%
|
|||||||||
|
12
|
%
|
14
|
%
|
18
|
%
|
38
|
%
|
37
|
%
|
|||||||||
The accompanying notes are an integral part of these financial statements.
|
HENNESSY FUNDS
|
1-800-966-4354
|
13
Financial Statements
|
Financial Highlights
|
For an Institutional Class share outstanding throughout each period
|
Six Months Ended
|
||||
|
April 30, 2020
|
||||
|
(Unaudited)
|
||||
|
PER SHARE DATA:
|
||||
|
Net asset value, beginning of period
|
$
|
29.56
|
||
|
Income from investment operations:
|
||||
|
Net investment income
|
0.34
|
(2)
|
||
|
Net realized and unrealized gains (losses) on investments
|
(3.86
|
)
|
||
|
Total from investment operations
|
(3.52
|
)
|
||
|
Less distributions:
|
||||
|
Dividends from net investment income
|
(0.31
|
)
|
||
|
Dividends from net realized gains
|
(1.44
|
)
|
||
|
Total distributions
|
(1.75
|
)
|
||
|
Net asset value, end of period
|
$
|
24.29
|
||
|
TOTAL RETURN
|
-12.42
|
%(3)
|
||
|
SUPPLEMENTAL DATA AND RATIOS:
|
||||
|
Net assets, end of period (millions)
|
$
|
82.07
|
||
|
Ratio of expenses to average net assets
|
0.69
|
%(5)
|
||
|
Ratio of net investment income to average net assets
|
2.47
|
%(5)
|
||
|
Portfolio turnover rate(6)
|
7
|
%(3)
|
||
|
(1)
|
Institutional Class shares commenced operations on March 1, 2017.
|
|
(2)
|
Calculated using the average shares outstanding method.
|
|
(3)
|
Not annualized.
|
|
(4)
|
Actual return from inception date of March 1, 2017, to the year end of October 31, 2017.
|
|
(5)
|
Annualized.
|
|
(6)
|
Calculated on the basis of the Fund as a whole.
|
The accompanying notes are an integral part of these financial statements.
|
HENNESSYFUNDS.COM
|
14
|
FINANCIAL HIGHLIGHTS — INSTITUTIONAL CLASS
|
|
Period Ended
|
||||||||||||||||||
|
Year Ended October 31,
|
October 31,
|
|||||||||||||||||
|
2019
|
2018
|
2017(1)
|
||||||||||||||||
|
$
|
28.65
|
$
|
30.32
|
$
|
29.68
|
|
|
|||||||||||
|
0.64
|
(2)
|
0.71
|
0.62
|
|||||||||||||||
|
3.50
|
(1.47
|
)
|
0.72
|
|||||||||||||||
|
4.14
|
(0.76
|
)
|
1.34
|
|||||||||||||||
|
(0.73
|
)
|
(0.75
|
)
|
(0.70
|
)
|
|||||||||||||
|
(2.50
|
)
|
(0.16
|
)
|
—
|
||||||||||||||
|
(3.23
|
)
|
(0.91
|
)
|
(0.70
|
)
|
|||||||||||||
|
$
|
29.56
|
$
|
28.65
|
$
|
30.32
|
|||||||||||||
|
15.63
|
%
|
-2.51
|
%
|
4.56
|
%(3)(4)
|
|||||||||||||
|
$
|
107.18
|
$
|
107.75
|
$
|
84.62
|
|||||||||||||
|
0.69
|
%
|
0.65
|
%
|
0.64
|
%(5)
|
|||||||||||||
|
2.25
|
%
|
2.47
|
%
|
1.23
|
%(5)
|
|||||||||||||
|
12
|
%
|
14
|
%
|
18
|
%(3)
|
|||||||||||||
The accompanying notes are an integral part of these financial statements.
|
HENNESSY FUNDS
|
1-800-966-4354
|
15
Financial Statements
|
Notes to the Financial Statements April 30, 2020 (Unaudited)
|
1). ORGANIZATION
The Hennessy Gas Utility Fund (the “Fund”) is a series of Hennessy Funds Trust (the “Trust”), which was organized as a Delaware statutory trust on September 17, 1992. The Fund is an open-end management
investment company registered under the Investment Company Act of 1940, as amended. The investment objective of the Fund is income and capital appreciation. The Fund is a diversified fund.
The Fund offers Investor Class and Institutional Class shares. Each class of shares differs principally in its respective 12b-1 distribution and service, shareholder servicing, and
sub-transfer agent expenses. There are no sales charges. Each class has identical rights to earnings, assets, and voting privileges, except for class-specific expenses and exclusive rights to vote on matters affecting only one
class.
As an investment company, the Fund follows the investment company accounting and reporting guidance of the Financial Accounting Standards Board (“FASB”) Accounting Standard
Codification Topic 946 “Financial Services—Investment Companies.”
2). SIGNIFICANT ACCOUNTING POLICIES
The following is a summary of significant accounting policies consistently followed by the Fund in the preparation of the financial statements. These policies conform to U.S. generally accepted
accounting principles (“GAAP”).
|
a).
|
Securities Valuation – All investments in securities are recorded at their estimated fair value, as described in Note 3.
|
|
b).
|
Federal Income Taxes – No provision for federal income taxes or excise taxes has been made because the Fund has elected to be taxed as a regulated investment company and intends to distribute
substantially all of its taxable income to its shareholders and otherwise comply with the provisions of the Internal Revenue Code of 1986, as amended, applicable to regulated investment companies. Net investment
income/loss and realized gains/losses for federal income tax purposes may differ from those reported in the financial statements because of temporary book and tax basis differences. Temporary differences are primarily the
result of the treatment of wash sales for tax reporting purposes. The Fund recognizes interest and penalties related to income tax benefits, if any, in the Statement of Operations as an income tax expense. Distributions
from net realized gains for book purposes may include short-term capital gains, which are included as ordinary income to shareholders for tax purposes. The Fund may utilize equalization accounting for tax purposes and
designate earnings and profits, including net realized gains distributed to shareholders on redemption of shares, as part of the dividends paid deduction for income tax purposes.
|
|
c).
|
Accounting for Uncertainty in Income Taxes – The Fund has accounting policies regarding recognition and measurement of tax positions taken or expected to be taken on a tax return. The tax returns
of the Fund for the prior three fiscal years are open for examination. The Fund has reviewed all open tax years in major jurisdictions and concluded that there is no impact on the Fund’s net assets and no tax liability
resulting from unrecognized tax benefits relating to uncertain income tax positions taken or expected to be taken on a tax return. The Fund’s major tax jurisdictions are U.S. federal and Delaware.
|
|
HENNESSYFUNDS.COM
|
16
|
NOTES TO THE FINANCIAL STATEMENTS
|
|
d).
|
Income and Expenses – Dividend income is recognized on the ex-dividend date or as soon as information is available to the Fund. Interest income, which includes the amortization of premium and
accretion of discount, is recognized on an accrual basis. Other non-cash dividends are recognized as investment income at the fair value of the property received. The Fund is charged for those expenses that are directly
attributable to its portfolio, such as advisory, administration, and certain shareholder service fees. Income, expenses (other than expenses attributable to a specific class), and realized and unrealized gains/losses on
investments are allocated to each class of shares based on such class’s net assets.
|
|
e).
|
Distributions to Shareholders – Dividends from net investment income for the Fund, if any, are declared and paid at the end of each calendar quarter. Distributions of net realized capital gains,
if any, are declared and paid annually, usually in December.
|
|
f).
|
Security Transactions – Investment and shareholder transactions are recorded on the trade date. The Fund determines the realized gain/loss from an investment transaction by comparing the original
cost of the security lot sold with the net sale proceeds. Discounts and premiums on securities purchased are accreted or amortized, respectively, over the life of each such security.
|
|
g).
|
Use of Estimates – The preparation of financial statements in conformity with GAAP requires management to make estimates and assumptions that affect the reported amounts of assets and liabilities
and disclosure of contingent assets and liabilities at the date of the financial statements and the reported change in net assets during the reporting period. Actual results could differ from those estimates.
|
|
h).
|
Share Valuation – The net asset value (“NAV”) per share of the Fund is calculated by dividing (i) the total value of the securities held by the Fund, plus cash and other assets, minus all
liabilities (including estimated accrued expenses) by (ii) the total number of shares outstanding for the Fund, rounded to the nearest $0.01. The Fund’s shares will not be priced on days the New York Stock Exchange is
closed for trading. The offering and redemption price per share for the Fund is equal to the Fund’s NAV per share.
|
3). SECURITIES VALUATION
The Fund follows fair value accounting standards that establish an authoritative definition of fair value and set out a hierarchy for measuring fair value. These standards require additional disclosures
about the various inputs and valuation techniques used to develop the measurements of fair value and a discussion of changes in valuation techniques and related inputs during the period. These inputs are summarized in the three
broad levels listed below:
|
Level 1 –
|
Unadjusted, quoted prices in active markets for identical instruments that the Fund has the ability to access at the date of measurement.
|
|
|
Level 2 –
|
Other significant observable inputs (including, but not limited to, quoted prices in active markets for similar instruments, quoted prices in markets that are not active for identical or similar
instruments, and model-derived valuations in which all significant inputs and significant value drivers are observable in active markets, such as interest rates, prepayment speeds, credit risk curves, default rates, and
similar data).
|
|
|
Level 3 –
|
Significant unobservable inputs (including the Fund’s own assumptions about what market participants would use to price the asset or liability based on the best available information) when
observable inputs are unavailable.
|
|
HENNESSY FUNDS
|
1-800-966-4354
|
17
The following is a description of the valuation techniques applied to the Fund’s major categories of assets and liabilities measured at fair value on a recurring basis:
|
Equity Securities – Equity securities, including common stocks, preferred stocks, foreign-issued common stocks, exchange-traded funds, closed-end mutual
funds, partnerships, rights, and real estate investment trusts, that are traded on a securities exchange for which a last-quoted sales price is readily available will generally be valued at the last sales price as reported
by the primary exchange on which the securities are listed. Securities listed on The NASDAQ Stock Market (“NASDAQ”) will generally be valued at the NASDAQ Official Closing Price, which may differ from the last sales price
reported. Securities traded on a securities exchange for which a last-quoted sales price is not readily available will generally be valued at the mean between the bid and ask prices. To the extent these securities are
actively traded and valuation adjustments are not applied, they are classified in Level 1 of the fair value hierarchy. Securities traded on foreign exchanges generally are not valued at the same time the Fund calculates
its NAV because most foreign markets close well before such time. The earlier close of most foreign markets gives rise to the possibility that significant events, including broad market moves, may have occurred in the
interim. In certain circumstances, it may be determined that a foreign security needs to be fair valued because it appears that the value of the security might have been materially affected by events occurring after the
close of the market in which the security is principally traded, but before the time the Fund calculates its NAV, such as by a development that affects an entire market or region (e.g., a weather-related event) or a
potentially global development (e.g., a terrorist attack that may be expected to have an effect on investor expectations worldwide).
|
|
|
Registered Investment Companies – Investments in open-end registered investment companies, commonly referred to as mutual funds, generally are priced at
the ending NAV provided by the applicable mutual fund’s service agent and will be classified in Level 1 of the fair value hierarchy.
|
|
|
Debt Securities – Debt securities, including corporate bonds, asset-backed securities, mortgage-backed securities, municipal bonds, U.S. Treasuries, and
U.S. government agency issues, are generally valued at market on the basis of valuations furnished by an independent pricing service that utilizes both dealer-supplied valuations and formula-based techniques. The pricing
service may consider recently executed transactions in securities of the issuer or comparable issuers, market price quotations (where observable), bond spreads, and fundamental data relating to the issuer. In addition, the
model may incorporate observable market data, such as reported sales of similar securities, broker quotes, yields, bids, offers, and reference data. Certain securities are valued primarily using dealer quotations. These
securities are generally classified in Level 2 of the fair value hierarchy.
|
|
|
Short-Term Securities – Short-term equity investments, including money market funds, are valued in the manner specified above. Short-term debt investments
with an original term to maturity of 60 days or less are valued at amortized cost, which approximates fair market value. If the original term to maturity of a short-term debt investment exceeded 60 days, then the values as
of the 61st day prior to maturity are amortized. Amortized cost is not used if its use would be inappropriate due to credit or other impairments of the issuer, in which case the security’s fair value would be determined,
as described below. Short-term securities are generally classified in Level 1 or Level 2 of the fair value hierarchy depending on the inputs used and market activity levels for specific securities.
|
|
HENNESSYFUNDS.COM
|
18
|
NOTES TO THE FINANCIAL STATEMENTS
|
The Board of Trustees of the Fund (the “Board”) has adopted fair value pricing procedures that are followed when a price for a security is not readily available or if a significant
event has occurred that indicates the closing price of a security no longer represents the true value of that security. Fair value pricing determinations are made in good faith in accordance with these procedures. There are
numerous criteria that will be given consideration in determining a fair value of a security, such as the trading volume of a security and markets, the values of other similar securities, and news events with direct bearing on a
security or markets. Fair value pricing results in an estimated price for a security that reflects the amount the Fund might reasonably expect to receive in a current sale. Depending on the relative significance of the valuation
inputs, these securities may be classified in either Level 2 or Level 3 of the fair value hierarchy.
The fair value of foreign securities may be determined with the assistance of a pricing service using correlations between the movement of prices of such securities and indices of
domestic securities and other appropriate indicators, such as closing market prices of relevant American Depositary Receipts or futures contracts. Using fair value pricing means that the Fund’s NAV reflects the affected portfolio
securities’ values as determined by the Board or its designee, pursuant to the fair value pricing procedures adopted by the Board, instead of being determined by the market. Using a fair value pricing methodology to price a
foreign security may result in a value that is different from such foreign security’s most recent closing price and from the value used by other investment companies to calculate their NAVs. Such securities are generally
classified in Level 2 of the fair value hierarchy. Because the Fund may invest in foreign securities, the value of the Fund’s portfolio securities may change on days when you will not be able to purchase or redeem your shares.
The Board has delegated day-to-day valuation matters to the Valuation and Liquidity Committee comprising representatives from Hennessy Advisors, Inc., the Fund’s investment advisor
(the “Advisor”). The function of the Valuation and Liquidity Committee is to value securities where current and reliable market quotations are not readily available. All actions taken by the Valuation and Liquidity Committee are
reviewed by the Board.
The Fund has performed an analysis of all existing investments to determine the significance and character of all inputs to their fair value determinations. Various inputs are used to
determine the value of the Fund’s investments. The inputs or methodology used for valuing securities are not necessarily an indication of the risk associated with investing in those securities. Details related to the fair value
hierarchy of the Fund’s securities as of April 30, 2020, are included in the Schedule of Investments.
4). INVESTMENT TRANSACTIONS
Purchases and sales of investment securities (excluding government and short-term investments) for the Fund during the six months ended April 30, 2020, were $51,051,293 and $167,092,866, respectively.
There were no purchases or sales/maturities of long-term U.S. government securities for the Fund during the six months ended April 30, 2020.
The Fund is permitted to purchase or sell securities from or to another fund in the Hennessy Funds family of funds (collectively, the “Hennessy Funds”) under specified conditions
outlined in procedures adopted by the Board. The procedures have been designed to ensure that any purchase or sale of securities by the Fund from or to another Hennessy Fund complies with Rule 17a-7 of the Investment Company Act
of 1940, as amended. During the six months ended April 30, 2020, the Fund did not engage in purchases or sales of securities pursuant to Rule 17a-7 of the Investment Company Act of 1940, as amended.
|
HENNESSY FUNDS
|
1-800-966-4354
|
19
5). INVESTMENT ADVISORY FEE AND OTHER TRANSACTIONS WITH AFFILIATES
The Advisor provides the Fund with investment advisory services under an Investment Advisory Agreement. The Advisor furnishes all investment advice, office space, and facilities and most of the personnel
needed by the Fund. As compensation for its services, the Advisor is entitled to a monthly fee from the Fund. The fee is based on the average daily net assets of the Fund at an annual rate of 0.40%. The net investment advisory
fees expensed by the Fund during the six months ended April 30, 2020, are included in the Statement of Operations.
The Board has approved a Shareholder Servicing Agreement for Investor Class shares of the Fund, which was instituted to compensate the Advisor for the non-investment advisory services
it provides to the Fund. The Shareholder Servicing Agreement provides for a monthly fee paid to the Advisor at an annual rate of 0.10% of the average daily net assets of the Fund attributable to Investor Class shares. The
shareholder service fees expensed by the Fund during the six months ended April 30, 2020, are included in the Statement of Operations.
The Fund has adopted a plan pursuant to Rule 12b-1 under the Investment Company Act of 1940, as amended, that authorizes payments in connection with the distribution of the Fund’s
shares at an annual rate of up to 0.25% of the Fund’s average daily net assets attributable to Investor Class shares. Even though the authorized rate is up to 0.25%, the Fund is currently only using up to 0.15% of its average
daily net assets attributable to Investor Class shares for such purpose. Amounts paid under the plan may be spent on any activities or expenses primarily intended to result in the sale of shares, including, but not limited to,
advertising, shareholder account servicing, printing and mailing of prospectuses to other than current shareholders, printing and mailing of sales literature, and compensation for sales and marketing activities or to financial
institutions and others, such as dealers and distributors. The distribution fees expensed by the Fund during the six months ended April 30, 2020, are included in the Statement of Operations.
The Fund has entered into agreements with various brokers, dealers, and financial intermediaries in connection with the sale of shares of the Fund. The agreements provide for periodic
payments of sub-transfer agent expenses by the Fund to the brokers, dealers, and financial intermediaries for providing certain shareholder maintenance services. These shareholder services include the pre-processing and quality
control of new accounts, shareholder correspondence, answering customer inquiries regarding account status, and facilitating shareholder telephone transactions. The sub-transfer agent fees expensed by the Fund during the six
months ended April 30, 2020, are included in the Statement of Operations.
The Fund has entered into an Administrative Services Agreement among the Fund, the Advisor, and the American Gas Association (“AGA”), pursuant to which the AGA provides administrative
services to the Fund, including overseeing the calculation of the AGA Stock Index. ScottMadden, Inc. performs the actual computations required to produce the AGA Stock Index and receives a fee for such calculations pursuant to a
contractual arrangement with AGA. AGA does not furnish other securities advice to the Fund or the Advisor or make recommendations regarding the purchase or sale of securities by the Fund. Under the terms of the Administrative
Services Agreement, which has been approved by the Board, AGA provides the Fund with current information regarding the common stock composition of the AGA Stock Index at least monthly. In addition, on request, AGA provides the
Fund and the Advisor with information on the natural gas industry. The Fund pays AGA a fee at an annual rate of 0.04% of the average daily net assets of the Fund.
|
HENNESSYFUNDS.COM
|
20
|
NOTES TO THE FINANCIAL STATEMENTS
|
U.S. Bancorp Fund Services, LLC, d/b/a U.S. Bank Global Fund Services (“Fund Services”) provides the Fund with administrative, accounting, and transfer agent services. As
administrator, Fund Services is responsible for activities such as (i) preparing various federal and state regulatory filings, reports, and returns for the Fund, (ii) preparing reports and materials to be supplied to the Board,
(iii) monitoring the activities of the Fund’s custodian, transfer agent, and accountants, and (iv) coordinating the preparation and payment of the Fund’s expenses and reviewing the Fund’s expense accruals. U.S. Bank N.A., an
affiliate of Fund Services, serves as the Fund’s custodian. The servicing agreements between the Trust and Fund Services and U.S. Bank N.A. contain a fee schedule that is inclusive of administrative, accounting, custody, and
transfer agent fees. The administrative, accounting, custody, and transfer agent fees expensed by the Fund during the six months ended April 30, 2020, are included in the Statement of Operations.
Quasar Distributors, LLC (“Quasar”) acts as the Fund’s principal underwriter in a continuous public offering of the Fund’s shares. Quasar was an affiliate of Fund Services and U.S.
Bank N.A. through March 30, 2020. Effective March 31, 2020, Foreside Financial Group, LLC (“Foreside”) acquired Quasar from Fund Services. As a result of the acquisition, Quasar became a wholly owned broker-dealer subsidiary of
Foreside and is no longer affiliated with Fund Services or U.S. Bank N.A. The Board approved a new Distribution Agreement to enable Quasar to continue serving as the Fund’s distributor.
The officers of the Fund are affiliated with the Advisor. With the exception of the Chief Compliance Officer and the Senior Compliance Officer, such officers receive no compensation
from the Fund for serving in their respective roles. The Fund, along with the other Hennessy Funds, makes reimbursement payments on an equal basis to the Advisor for a portion of the salary and benefits associated with the office
of the Chief Compliance Officer and for all of the salary and benefits associated with the office of the Senior Compliance Officer. The compliance fees expensed by the Fund during the six months ended April 30, 2020, are included
in the Statement of Operations.
6). GUARANTEES AND INDEMNIFICATIONS
Under the Hennessy Funds’ organizational documents, their officers and trustees are indemnified by the Hennessy Funds against certain liabilities arising out of the performance of their duties to the
Hennessy Funds. Additionally, in the normal course of business, the Hennessy Funds enter into contracts with service providers that contain general indemnification clauses. The Fund’s maximum exposure under these arrangements is
unknown as this would involve future claims that may be made against the Fund that have not yet occurred. Currently, the Fund expects the risk of loss to be remote.
7). LINE OF CREDIT
The Fund has an uncommitted line of credit with the other Hennessy Funds in the amount of the lesser of (i) $100,000,000 or (ii) 33.33% of each Hennessy Fund’s net assets, or 30% for the Fund and 10% for
the Hennessy Balanced Fund, intended to provide short-term financing, if necessary, subject to certain restrictions, in connection with shareholder redemptions. The credit facility is with the Hennessy Funds’ custodian bank, U.S.
Bank N.A. Borrowings under this arrangement bear interest at the bank’s prime rate and are secured by all of the Fund’s assets (as to its own borrowings only). During the six months ended April 30, 2020, the Fund had an
outstanding average daily balance and a weighted average interest rate of $314,313 and 4.52%, respectively. The interest expensed by the Fund during the six months ended April 30, 2020, is included in the Statement of Operations.
The maximum amount outstanding for the Fund during the period was $8,078,000. As of April 30, 2020, the Fund did not have any borrowings outstanding under the line of credit.
|
HENNESSY FUNDS
|
1-800-966-4354
|
21
8). FEDERAL TAX INFORMATION
As of October 31, 2019, the Fund’s most recent fiscal year end, the components of accumulated earnings (losses) for income tax purposes were as follows:
|
Investments
|
|||||
|
Cost of investments for tax purposes
|
$
|
524,740,694
|
|||
|
Gross tax unrealized appreciation
|
$
|
421,155,305
|
|||
|
Gross tax unrealized depreciation
|
(74,581,422
|
)
|
|||
|
Net tax unrealized appreciation/(depreciation)
|
$
|
346,573,883
|
|||
|
Undistributed ordinary income
|
$
|
—
|
|||
|
Undistributed long-term capital gains
|
41,637,055
|
||||
|
Total distributable earnings
|
$
|
41,637,055
|
|||
|
Other accumulated gain/(loss)
|
$
|
—
|
|||
|
Total accumulated gain/(loss)
|
$
|
388,210,938
|
|||
The difference between book-basis unrealized appreciation/depreciation and tax-basis unrealized appreciation/depreciation (as shown above) is attributable primarily to wash sales.
As of October 31, 2019, the Fund had no tax basis capital losses to offset future capital gains.
As of October 31, 2019, the Fund did not defer, on a tax basis, any late-year ordinary losses. Late-year ordinary losses are net ordinary losses incurred after December 31, 2018, but
within the taxable year, that are deemed to arise on the first day of the Fund’s next taxable year.
During fiscal year 2020 (year to date) and fiscal year 2019, the tax character of distributions paid by the Fund was as follows:
|
Six Months Ended
|
Year Ended
|
||||||||
|
April 30, 2020
|
October 31, 2019
|
||||||||
|
Ordinary income(1)
|
$
|
7,690,808
|
$
|
18,139,310
|
|||||
|
Long-term capital gain
|
41,637,087
|
79,849,801
|
|||||||
|
$
|
49,327,895
|
$
|
97,989,111
|
||||||
|
(1) Ordinary income includes short-term capital gain.
|
9). EVENTS SUBSEQUENT TO PERIOD END
Management has evaluated the Fund’s related events and transactions that occurred subsequent to April 30, 2020, through the date of issuance of the Fund’s financial statements. Management has determined
that there were no subsequent events requiring recognition or disclosure in the financial statements.
|
HENNESSYFUNDS.COM
|
22
|
NOTES TO THE FINANCIAL STATEMENTS/EXPENSE EXAMPLE
|
Expense Example (Unaudited)
April 30, 2020
As a shareholder of the Fund, you incur ongoing costs, including management fees, service fees, and other Fund expenses. This Example is intended to help you understand your ongoing costs (in dollars) of
investing in the Fund and to compare these costs with the ongoing costs of investing in other mutual funds. The Example is based on an investment of $1,000 invested at the beginning of the period and held for the entire period
from November 1, 2019, through April 30, 2020.
Actual Expenses
The first line of the table below under the “Investor Class” and “Institutional Class” headings provides information about actual account values and actual expenses. Although the Fund charges no sales
loads or transaction fees, you will be assessed fees for outgoing wire transfers, returned checks and stop payment orders at prevailing rates charged by U.S. Bank Global Fund Services, the Fund’s transfer agent. If you request
that a redemption be made by wire transfer, currently a $15 fee is charged by the Fund’s transfer agent. IRA accounts will be charged a $15 annual maintenance fee. The example below includes, but is not limited to, management
fees, shareholder servicing fees, accounting, custody, and transfer agent fees. However, the example below does not include portfolio trading commissions and related expenses. You may use the information in this line, together
with the amount you invested, to estimate the expenses that you paid over the period. Simply divide your account value by $1,000 (for example, an $8,600 account value divided by $1,000 = 8.6), then multiply the result by the
number in the first line of the table under the “Investor Class” or “Institutional Class” headings in the column entitled “Expenses Paid During Period” to estimate the expenses you paid on your account during this period.
Hypothetical Example for Comparison Purposes
The second line of the table below under the “Investor Class” and “Institutional Class” headings provides information about hypothetical account values and hypothetical expenses based on the Fund’s
actual expense ratios and an assumed rate of return of 5% per year before expenses, which is not the Fund’s actual return. The hypothetical account values and expenses may not be used to estimate the actual ending account balance
or expenses you paid for the period. You may use this information to compare the ongoing costs of investing in the Fund and other funds. To do so, compare this 5% hypothetical example with the 5% hypothetical examples that appear
in the shareholder reports of the other funds. Please note that the expenses shown in the table are meant to highlight your ongoing costs only. Therefore, the second line of the table under the “Investor Class” and “Institutional
Class” headings is useful in comparing ongoing costs only and will not help you determine the relative total costs of owning different funds.
|
HENNESSY FUNDS
|
1-800-966-4354
|
23
|
Beginning
|
Ending
|
||
|
Account Value
|
Account Value
|
Expenses Paid
|
|
|
November 1, 2019
|
April 30, 2020
|
During Period(1)
|
|
|
Investor Class
|
|||
|
Actual
|
$1,000.00
|
$ 874.40
|
$4.80
|
|
Hypothetical (5% return before expenses)
|
$1,000.00
|
$1,019.74
|
$5.17
|
|
Institutional Class
|
|||
|
Actual
|
$1,000.00
|
$ 875.80
|
$3.22
|
|
Hypothetical (5% return before expenses)
|
$1,000.00
|
$1,021.43
|
$3.47
|
|
(1)
|
Expenses are equal to the Fund’s annualized expense ratio of 1.03% for Investor Class shares or 0.69% for Institutional Class shares, as applicable, multiplied by the average account value over
the period, multiplied by 182/366 days (to reflect the half-year period).
|
|
HENNESSYFUNDS.COM
|
24
|
EXPENSE EXAMPLE — ELECTRONIC DELIVERY
|
How to Obtain a Copy of the Fund’s Proxy
Voting Policy and Proxy Voting Records
A description of the policies and procedures the Fund uses to determine how to vote proxies relating to portfolio securities is available without charge (1) by calling 1-800-966-4354, (2) on the Hennessy
Funds’ website at www.hennessyfunds.com/proxy-voting/voting-policy, or (3) on the U.S. Securities and Exchange Commission’s (the “SEC”) website at www.sec.gov. The Fund’s proxy voting record is available without charge on both the
Hennessy Funds’ website at www.hennessyfunds.com/proxy-voting/voting-record and the SEC’s website at www.sec.gov no later than August 31 for the prior 12 months ending June 30.
Availability of Quarterly Portfolio Schedule
The Fund files a complete schedule of portfolio holdings with the SEC for the first and third quarters of each fiscal year as an exhibit to its reports on Form N-PORT. The Fund’s Forms N-PORT are
available on the SEC’s website at www.sec.gov or on request by calling 1-800-966-4354.
Federal Tax Distribution Information (Unaudited)
For fiscal year 2019, certain dividends paid by the Fund may be subject to a maximum tax rate of 23.8%, as provided for by the Jobs and Growth Tax Relief Reconciliation Act of 2003. The percentage of
dividends declared from ordinary income designated as qualified dividend income was 100.00%.
For corporate shareholders, the percent of ordinary income distributions that qualified for the corporate dividends received deduction for fiscal year 2019 was 100.00%.
The percentage of taxable ordinary income distributions that were designated as short-term capital gain distributions under Section 871(k)(2)(C) of the Internal Revenue Code of 1986,
as amended, for the Fund was 0.00%.
Important Notice Regarding Delivery
of Shareholder Documents
To help keep the Fund’s costs as low as possible, we generally deliver a single copy of shareholder reports, proxy statements, and prospectuses to shareholders who share an address and have the same last
name. This process does not apply to account statements. You may request an individual copy of a shareholder document at any time. If you would like to receive separate mailings of shareholder documents, please call U.S. Bank
Global Fund Services at 1-800-261-6950 or 1-414-765-4124, and individual delivery will begin within 30 days of your request. If your account is held through a financial institution or other intermediary, please contact such
intermediary directly to request individual delivery.
Electronic Delivery
The Funds offer shareholders the option to receive account statements, prospectuses, tax forms, and shareholder reports online. To sign up for eDelivery, please visit www.hennessyfunds.com/account. You
may change your delivery preference at any time by visiting our website or calling U.S. Bank Global Fund Services at 1-800-261-6950 or 1-414-765-4124.
|
HENNESSY FUNDS
|
1-800-966-4354
|
25
Board Approval of Investment Advisory
Agreement
At its meeting on March 12, 2020, the Board of Trustees of the Fund (the “Board,” and the members thereof, the “Trustees”) unanimously approved the continuation of the investment advisory agreement of
the Fund with Hennessy Advisors, Inc. (the “Advisor”). As part of the process of approving the continuation of the advisory agreement, the Trustees reviewed their fiduciary duties and the relevant factors for them to consider with
respect to approving the advisory agreement. In addition, the Trustees who are not deemed “interested persons” (as defined by the Investment Company Act of 1940, as amended) of the Fund (the “Independent Trustees”) met in
executive session to discuss the approval of the advisory agreement.
In advance of the meeting, the Advisor sent detailed information to the Trustees to assist them in their evaluation of the advisory agreement. This information included, but was not
limited to, the following:
|
(1)
|
A memorandum from outside legal counsel that described the fiduciary duties of the Board with respect to approving the continuation of the advisory agreement and the relevant factors for
consideration;
|
|
|
(2)
|
A memorandum from the Advisor that listed the factors relevant to the Board’s approval of the continuation of the advisory agreement and also referenced the documents that had been provided to
help the Board assess each such factor;
|
|
|
(3)
|
An inventory of the services provided by the Advisor;
|
|
|
(4)
|
A written discussion of economies of scale;
|
|
|
(5)
|
A summary of the key terms of the advisory agreement;
|
|
|
(6)
|
A recent Fund fact sheet, which included performance information over various periods;
|
|
|
(7)
|
A peer expense comparison of the net expense ratio and investment advisory fee of the Fund; and
|
|
|
(8)
|
The Advisor’s financial statements from its most recent Form 10-K and Form 10-Q.
|
All of the factors discussed were considered as a whole by the Trustees and by the Independent Trustees meeting in executive session. The factors were viewed in their totality by the
Trustees, with no single factor being the principal or determinative factor in the Trustees’ determination of whether to approve the continuation of the advisory agreement. The Trustees recognized that the management and fee
arrangements for the Fund are the result of years of review and discussion between the Independent Trustees and the Advisor, that certain aspects of such arrangements may receive greater scrutiny in some years than in others, and
that the Trustees’ conclusions may be based, in part, on their consideration of these same arrangements and information received during the course of the year and in prior years.
Prior to approving the continuation of the advisory agreement, the Trustees, including the Independent Trustees in executive session, considered, among other items:
|
(1)
|
The nature and quality of the advisory services provided by the Advisor;
|
|
|
(2)
|
A comparison of the fees and expenses of the Fund to other similar funds;
|
|
|
(3)
|
Whether economies of scale are recognized by the Fund;
|
|
HENNESSYFUNDS.COM
|
26
|
BOARD APPROVAL OF INVESTMENT ADVISORY AGREEMENT
|
|
(4)
|
The costs and profitability of the Fund to the Advisor;
|
|
|
(5)
|
The performance of the Fund; and
|
|
|
(6)
|
Any benefits to the Advisor from serving as an investment advisor to the Fund (other than the advisory fee).
|
The material considerations and determinations of the Trustees, including the Independent Trustees, were as follows:
|
(1)
|
The Trustees considered the services identified below that are provided by the Advisor. Based on this review, the Trustees concluded that the Advisor provides high-quality services to the Fund
and noted that their overall confidence in the Advisor was high. The Trustees also concluded that they were satisfied with the nature, extent, and quality of the advisory services provided to the Fund by the Advisor and
that the nature and extent of the services provided by the Advisor were appropriate to assure that the Fund’s operations are conducted in compliance with applicable laws, rules, and regulations.
|
|
(a)
|
The Advisor acts as the portfolio manager for the Fund. In this capacity, the Advisor does the following:
|
|
(i)
|
manages the composition of the Fund’s portfolio, including the purchase, retention, and disposition of portfolio securities in accordance with the Fund’s investment objectives, policies, and
restrictions;
|
|||
|
(ii)
|
seeks best execution for the Fund’s portfolio;
|
|||
|
(iii)
|
manages the use of soft dollars for the Fund; and
|
|||
|
(iv)
|
manages proxy voting for the Fund.
|
|
(b)
|
The Advisor performs a daily reconciliation of portfolio positions and cash for the Fund.
|
||
|
(c)
|
The Advisor monitors the liquidity of each Fund.
|
||
|
(d)
|
The Advisor monitors the Fund’s compliance with its investment objectives and restrictions.
|
||
|
(e)
|
The Advisor monitors compliance with federal securities laws, maintains a compliance program (including a code of ethics), conducts ongoing reviews of the compliance programs of the Fund’s
service providers, as feasible, conducts on-site visits to the Fund’s service providers, monitors incidents of abusive trading practices, reviews Fund expense accruals, payments, and fixed expense ratios, evaluates
insurance providers for fidelity bond, D&O/E&O insurance, and cybersecurity insurance coverage, manages regulatory examination compliance and responses, conducts employee compliance training, reviews reports
provided by service providers, and maintains books and records.
|
||
|
(f)
|
The Advisor oversees service providers that provide accounting, administration, distribution, transfer agency, custodial, sales, marketing, public relations, audit, information technology, and
legal services to the Fund.
|
||
|
(g)
|
The Advisor maintains in-house marketing and distribution departments on behalf of the Fund.
|
||
|
(h)
|
The Advisor is actively involved with preparing regulatory filings for the Fund, including writing and annually updating the Fund’s prospectus and related documents.
|
|
HENNESSY FUNDS
|
1-800-966-4354
|
27
|
(i)
|
For each annual report of the Fund, the Advisor prepares a written summary of the Fund’s performance during the most recent 12-month period.
|
||
|
(j)
|
The Advisor oversees distribution of the Fund through third-party broker/dealers and independent financial institutions such as Charles Schwab, Inc., Fidelity, TD Ameritrade, and Pershing. The
Advisor participates in “no transaction fee” (“NTF”) programs with these companies on behalf of the Fund, which allow customers to purchase the Fund through third-party distribution channels without paying a transaction
fee. The Advisor compensates, in part, a number of these third-party providers of NTF programs out of its own revenues.
|
||
|
(k)
|
The Advisor pays the incentive compensation of the Fund’s compliance officers and employs other staff, such as legal, marketing, national accounts, distribution, sales, administrative, and
trading oversight personnel, as well as management executives.
|
||
|
(l)
|
The Advisor provides a quarterly compliance certification to the Board.
|
||
|
(m)
|
The Advisor prepares or reviews all Board materials, frequently presents to the Board and leads Board discussions, prepares or reviews all meeting minutes, and arranges for Board training and
education.
|
|
(2)
|
The Trustees compared the performance of the Fund to benchmark indices over various periods and also noted that the Trustees review and discuss reports comparing the investment performance of the
Fund to various indices at each quarterly Board meeting. Based on such information, the Trustees determined that the Advisor manages the Fund in a manner materially consistent with its stated investment objective and
style. The Trustees concluded that the performance of the Fund over various periods warranted continuation of the advisory agreement.
|
|
|
(3)
|
The Trustees reviewed the advisory fees and overall expense ratios of the Fund compared to other funds similar in asset size and investment objective to the Fund using data from Morningstar. As
part of the discussion with management, the Trustees ensured that they understood and were comfortable with the criteria used to determine the mutual funds included in the Morningstar categories for purposes of the
materials considered at the meeting. The Trustees determined that the advisory fee and overall expense ratio of the Fund falls within the range of the advisory fees and overall expense ratios of other comparable funds and
concluded that they are reasonable and warranted continuation of the advisory agreement.
|
|
|
(4)
|
The Trustees also considered whether the Advisor was realizing economies of scale that it should share with the Fund’s shareholders. The Trustees noted that the assets of the Fund had declined
over the prior year. In addition, the Trustees noted that many of the expenses incurred to manage the Fund are asset-based fees, so the Advisor does not realize material economies of scale relating to those expenses as the
assets of the Fund increase. For example, mutual fund platform fees increase as the Fund’s assets grow. The Trustees also considered the Advisor’s efforts to contain expenses through actions such as renegotiating service
contracts, the Advisor’s significant marketing efforts to promote the Funds, the Advisor’s investments in personnel to manage the Funds, and the Advisor’s agreement to waive fees or lower its management fees in certain
|
|
HENNESSYFUNDS.COM
|
28
|
BOARD APPROVAL OF INVESTMENT ADVISORY AGREEMENT
|
|
circumstances. The Trustees noted that it did not appear that the Advisor was realizing economies of scale at current asset levels and concluded that it would continue to monitor economies of
scale in the future as circumstances changed.
|
||
|
(5)
|
The Trustees considered the profitability of the Advisor, including the impact of mutual fund platform fees on the Advisor’s profitability, and also considered the resources and revenues that the
Advisor has put into managing and distributing the Fund. The Trustees then concluded that the profits of the Advisor are reasonable and not excessive when compared to profitability guidelines set forth in relevant court
cases.
|
|
|
(6)
|
The Trustees considered the high level of professionalism and knowledge of the Advisor’s employees, along with a very low level of turnover, and concluded that this was beneficial to the Fund and
its shareholders.
|
|
|
(7)
|
The Trustees considered any benefits to the Advisor from serving as an advisor to the Fund (other than the advisory fee). The Trustees noted that the Advisor may derive ancillary benefits from,
by way of example, its association with the Fund in the form of proprietary and third-party research products and services received from broker-dealers that execute portfolio trades for the Fund. The Trustees determined
that any such products and services have been used for legitimate purposes relating to the Fund by providing assistance in the investment decision-making process. The Trustees concluded that any additional benefits
realized by the Advisor from its relationship with the Fund were reasonable, which was based on, among other things, the Trustees’ finding that the research, analytical, statistical, and other information and services
provided by brokers are merely supplemental to the Advisor’s own efforts in the performance of its duties under the advisory agreement.
|
After reviewing the materials and information provided at the meeting, as well as other information regularly provided at the Board’s quarterly meetings throughout the year regarding
the quality of services provided by the Advisor, the performance of the Fund, expense information, brokerage commissions information, the adequacy and efficacy of the Advisor’s written policies and procedures, other regulatory
compliance issues, trading information and related matters, and other factors that the Trustees deemed relevant, the Trustees, including the Independent Trustees, approved the continuation of the advisory agreement.
|
HENNESSY FUNDS
|
1-800-966-4354
|
29
For information, questions, or assistance, please call
The Hennessy Funds
1-800-966-4354 or 1-415-899-1555
INVESTMENT ADVISOR
Hennessy Advisors, Inc.
7250 Redwood Boulevard, Suite 200
Novato, California 94945
ADMINISTRATOR,
TRANSFER AGENT,
DIVIDEND PAYING AGENT, &
SHAREHOLDER SERVICING AGENT
U.S. Bancorp Fund Services, LLC
d/b/a U.S. Bank Global Fund Services
P.O. Box 701
Milwaukee, Wisconsin 53201-0701
CUSTODIAN
U.S. Bank N.A.
Custody Operations
1555 North River Center Drive, Suite 302
Milwaukee, Wisconsin 53212
TRUSTEES
Neil J. Hennessy
Robert T. Doyle
J. Dennis DeSousa
Gerald P. Richardson
COUNSEL
Foley & Lardner LLP
777 East Wisconsin Avenue
Milwaukee, Wisconsin 53202-5306
INDEPENDENT REGISTERED
PUBLIC ACCOUNTING FIRM
Tait, Weller & Baker LLP
Two Liberty Place
50 South 16th Street, Suite 2900
Philadelphia, Pennsylvania 19102-2529
DISTRIBUTOR
Quasar Distributors, LLC
111 East Kilbourn Avenue, Suite 2200
Milwaukee, Wisconsin 53202
www.hennessyfunds.com | 1-800-966-4354
This report has been prepared for shareholders and may be distributed to
others only if preceded or accompanied by a current prospectus.
SEMI-ANNUAL REPORT
APRIL 30, 2020

HENNESSY JAPAN FUND
Investor Class HJPNX
Institutional Class HJPIX
IMPORTANT NOTICE REGARDING ELECTRONIC DELIVERY OF SHAREHOLDER REPORTS
Beginning on January 1, 2021, as permitted by regulations adopted by the Securities and Exchange Commission, paper copies of the annual and
semi-annual reports will no longer be sent by mail unless you specifically request paper copies from the Hennessy Funds or from your financial intermediary. Instead, the reports will be made available on a website, and
you will be notified by mail each time a report is posted and provided with a website link to access the report.
If you have already elected to receive shareholder reports electronically, you will not be affected by this change and you need not take any action.
You may elect to receive shareholder reports and other communications from the Hennessy Funds electronically by visiting www.hennessyfunds.com/account or by calling U.S. Bank Global Fund Services at 1-800-261-6950. If
you own shares in a Fund through a financial intermediary, please contact your financial intermediary to make this election.
You may elect to receive paper copies of all future reports free of charge by calling U.S. Bank Global Fund Services at 1-800-261-6950 or, if you
own your shares through a financial intermediary, by contacting your financial intermediary. Your election to receive paper copies of reports will apply to all Funds in the Hennessy Funds family.
hennessyfunds.com | 1-800-966-4354
(This Page Intentionally Left Blank.)
Contents
|
Letter to Shareholders
|
2
|
|
Performance Overview
|
4
|
|
Financial Statements
|
|
|
Schedule of Investments
|
5
|
|
Statement of Assets and Liabilities
|
8
|
|
Statement of Operations
|
9
|
|
Statements of Changes in Net Assets
|
11
|
|
Financial Highlights
|
12
|
|
Notes to the Financial Statements
|
16
|
|
Expense Example
|
24
|
|
Proxy Voting Policy and Proxy Voting Records
|
26
|
|
Availability of Quarterly Portfolio Schedule
|
26
|
|
Federal Tax Distribution Information
|
26
|
|
Important Notice Regarding Delivery of Shareholder Documents
|
26
|
|
Electronic Delivery
|
27
|
|
Board Approval of Investment Advisory Agreements
|
28
|
|
HENNESSY FUNDS
|
1-800-966-4354
|
May 2020
Dear Hennessy Funds Shareholder:
Over the six months ended April 30, 2020, the Japanese stock market lost 9.96% in U.S. dollar terms as measured by the Tokyo Stock Price Index (TOPIX). A variety of geopolitical developments continued
to affect Japanese stocks from November 2019 to January 2020, including the trade dispute between the United States and China, a series of protests in Hong Kong, and the standoff between the United States and Iran. By the end of
January, growing concerns about the global spread of the novel coronavirus (COVID-19) and the expectation of a severe negative impact on the economy caused the Japanese stock market to begin to fall sharply. The spread of
COVID-19, not only in China and Japan but also Europe and the United States, accelerated the decline in stock prices worldwide. While monetary easing and fiscal policy changes in various countries led to initial expectations of
an early economic recovery, this rebound proved temporary because there was no sign that the virus, and its negative effects on the world economy, were subsiding at the time of this writing.
The ultimate economic impact of the COVID-19 pandemic remains uncertain. To date in Japan, the number of confirmed infections and the mortality rate remain fairly low relative to
other developed countries on a population-adjusted basis, perhaps thanks to Japan’s “mask-wearing” culture. Japan declared a state of emergency on April 7, 2020, later than many other affected countries, and did not implement
stringent lockdowns. As in other parts of the world, Japan is experiencing severe contraction in economic activity, and it is too early to assess the overall long-term impact of COVID-19 in Japan.
Japan swiftly put together an approximately $1 trillion economic stimulus package, which is approximately 20% of Japan’s GDP and is double the scale of the stimulus package launched
amid the 2008 financial crisis. As a percent of GDP, Japan’s COVID-19 stimulus package is larger than the United States’ stimulus package (11% of GDP) and Germany’s stimulus package (5% of GDP). On the monetary policy side, the
Bank of Japan (BOJ) has pledged to boost purchases of assets including government bonds, commercial paper, corporate bonds, and ETFs. For example, the BOJ said it would aggressively buy ETFs at an annual rate of JPY 12 trillion
(equivalent to approximately $112 billion), two times the amount it previously had pledged to buy. While prior to the COVID-19 pandemic we had argued that the BOJ’s quantitative easing had largely done its part, with around $5
trillion worth of monetary base already in the financial system, and that the government should take the lead by pushing through structural reforms going forward, we believe that economic rescue plans should be prioritized above
all else in times of stress like today.
Japan has a reform-minded, pro-growth government led by Prime Minister Abe and a pro-business, pro-inflation central bank led by the BOJ Governor Kuroda. We are confident that this
favorable combination will provide a strong basis for Japan’s economic recovery. Assuming full recovery of earnings over the next 12 to 24 months, we believe current valuations of Japanese stocks are very attractive. Moreover,
we believe that the stock market has already priced in the impact of the postponement of the 2020 Tokyo Olympics. Therefore, we believe that the sharp recent decline in the market should provide an attractive entry point for
investors keen to gain long-term exposure to Japan.
|
HENNESSYFUNDS.COM
|
2
|
LETTER TO SHAREHOLDERS
|
We remain optimistic about the long-term prospects for Japan and its stock market. Thank you for your continued confidence and investment in the Hennessy Japan Funds.
Sincerely,
 |
 |
|
Tadahiro Fujimura
|
Masakazu Takeda
|
|
Portfolio Manager,
|
Portfolio Manager,
|
|
Hennessy Japan Small Cap Fund;
|
Hennessy Japan Fund;
|
|
Chief Investment Officer
|
Fund Manager
|
|
SPARX Asset Management Co., Ltd.
|
SPARX Asset Management Co., Ltd.
|
SPARX Asset Management Co., Ltd., located in Tokyo, Japan, is the sub-advisor to the Hennessy Japan Fund and the Hennessy Japan Small Cap Fund.
Past performance does not guarantee future results.
Mutual fund investing involves risk. Principal loss is possible.
Opinions expressed are those of Tadahiro Fujimura and Masakazu Takeda and are subject to change, are not guaranteed, and should not be considered investment advice.
The Tokyo Stock Price Index (TOPIX) is a capitalization-weighted index of all the companies listed on the First Section of the Tokyo Stock Exchange. One cannot invest directly in an index.
|
HENNESSY FUNDS
|
1-800-966-4354
|
3
Performance Overview (Unaudited)
AVERAGE ANNUAL TOTAL RETURN FOR PERIODS ENDED APRIL 30, 2020
|
Six
|
One
|
Five
|
Ten
|
|
|
Months(1)
|
Year
|
Years
|
Years
|
|
|
Hennessy Japan Fund –
|
||||
|
Investor Class (HJPNX)
|
-7.98%
|
-4.99%
|
7.77%
|
10.92%
|
|
Hennessy Japan Fund –
|
||||
|
Institutional Class (HJPIX)
|
-7.80%
|
-4.64%
|
8.18%
|
11.27%
|
|
Russell/Nomura
|
||||
|
Total MarketTM Index
|
-9.13%
|
-2.54%
|
2.95%
|
5.10%
|
|
Tokyo Price Index (TOPIX)
|
-9.96%
|
-3.11%
|
2.87%
|
4.96%
|
Expense ratios: 1.44% (Investor Class); 1.04% (Institutional Class)
|
(1)
|
Periods of less than one year are not annualized.
|
_______________
Performance data quoted represents past performance; past performance does not guarantee future results. The investment return and principal value of an investment will fluctuate so
that an investor’s shares, when redeemed, may be worth more or less than their original cost. The performance table does not reflect the deduction of taxes that a shareholder would pay on Fund distributions or the redemption of
Fund shares. Current performance of the Fund may be lower or higher than the performance quoted. Performance data current to the most recent month end may be obtained by visiting www.hennessyfunds.com.
The Russell/Nomura Total Market™ Index contains the top 98% of all stocks listed on Japan’s stock exchanges and
registered on Japan’s over-the-counter market based on market capitalization. The Tokyo Price Index (TOPIX) is a market capitalization-weighted index of all the companies listed on the First Section of the Tokyo Stock Exchange.
One cannot invest directly in an index. These indices are used herein for comparative purposes in accordance with SEC regulations.
Frank Russell Company (“Russell”) is the source and owner of the trademarks, service marks, and copyrights related to the Russell Indexes. Russell® is a trademark of Russell. Neither Russell nor its licensors accept any liability for any errors or omissions in the Russell Indexes or Russell ratings or underlying data and no party may rely on
any Russell Indexes or Russell ratings or underlying data contained in this communication. No further distribution of Russell data is permitted without Russell’s express written consent. Russell does not promote, sponsor, or
endorse the content of this communication.
The expense ratios presented are from the most recent prospectus. The expense ratios for the current reporting period are available in the Financial Highlights section of this report.
|
HENNESSYFUNDS.COM
|
4
|
PERFORMANCE OVERVIEW/SCHEDULE OF INVESTMENTS
|
Financial Statements
|
Schedule of Investments as of April
30, 2020 (Unaudited)
|
HENNESSY JAPAN FUND
(% of Net Assets)
|
TOP TEN HOLDINGS (EXCLUDING MONEY MARKET FUNDS)
|
% NET ASSETS
|
|
Keyence Corp.
|
6.32%
|
|
Unicharm Corp.
|
5.85%
|
|
Rohto Pharmaceutical Co., Ltd.
|
5.84%
|
|
Daikin Industries, Ltd.
|
5.81%
|
|
Sony Corp.
|
5.77%
|
|
Terumo Corp.
|
5.69%
|
|
Kao Corp.
|
5.56%
|
|
Shimano, Inc.
|
5.50%
|
|
Recruit Holdings Co., Ltd.
|
5.45%
|
|
SoftBank Group Co.
|
5.40%
|
Note: For presentation purposes, the Fund has grouped some of the industry categories. For purposes of categorizing securities for compliance with Section 8(b)(1) of the Investment Company Act of 1940,
as amended, the Fund uses more specific industry classifications.
The Global Industry Classification Standard (GICS®) was developed by and is the exclusive property and a service mark of
MSCI, Inc. and Standard & Poor’s Financial Services LLC. It has been licensed for use by the Hennessy Funds.
|
HENNESSY FUNDS
|
1-800-966-4354
|
5
|
COMMON STOCKS – 98.67%
|
Number
|
% of
|
||||||||||
|
|
of Shares
|
Value
|
Net Assets
|
|||||||||
|
Communication Services – 5.40%
|
||||||||||||
|
SoftBank Group Co.
|
748,200
|
$
|
32,069,827
|
5.40
|
%
|
|||||||
|
Consumer Discretionary – 22.27%
|
||||||||||||
|
Asics Corp.
|
891,700
|
8,455,425
|
1.42
|
%
|
||||||||
|
Fast Retailing Co., Ltd.
|
55,200
|
26,178,435
|
4.41
|
%
|
||||||||
|
Nitori Holdings Co., Ltd.
|
178,300
|
27,329,064
|
4.60
|
%
|
||||||||
|
Ryohin Keikaku Co., Ltd.
|
284,100
|
3,381,217
|
0.57
|
%
|
||||||||
|
Shimano, Inc.
|
221,700
|
32,668,760
|
5.50
|
%
|
||||||||
|
Sony Corp.
|
532,000
|
34,236,388
|
5.77
|
%
|
||||||||
|
|
132,249,289
|
22.27
|
%
|
|||||||||
|
Consumer Staples – 19.21%
|
||||||||||||
|
Ariake Japan Co., Ltd.
|
202,200
|
11,660,696
|
1.96
|
%
|
||||||||
|
Kao Corp.
|
427,900
|
32,998,084
|
5.56
|
%
|
||||||||
|
Rohto Pharmaceutical Co., Ltd.
|
1,191,100
|
34,655,759
|
5.84
|
%
|
||||||||
|
Unicharm Corp.
|
943,400
|
34,767,625
|
5.85
|
%
|
||||||||
|
|
114,082,164
|
19.21
|
%
|
|||||||||
|
Financials – 2.96%
|
||||||||||||
|
Anicom Holdings, Inc.
|
475,200
|
17,543,053
|
2.96
|
%
|
||||||||
|
Health Care – 10.78%
|
||||||||||||
|
Takeda Pharmaceutical Co., Ltd.
|
839,000
|
30,255,559
|
5.09
|
%
|
||||||||
|
Terumo Corp.
|
1,017,600
|
33,766,631
|
5.69
|
%
|
||||||||
|
|
64,022,190
|
10.78
|
%
|
|||||||||
|
Industrials – 29.44%
|
||||||||||||
|
Daikin Industries, Ltd.
|
268,900
|
34,508,201
|
5.81
|
%
|
||||||||
|
Kubota Corp.
|
1,883,000
|
23,384,407
|
3.94
|
%
|
||||||||
|
Misumi Group, Inc.
|
1,288,600
|
30,608,589
|
5.16
|
%
|
||||||||
|
Mitsubishi Corp.
|
1,136,700
|
24,107,123
|
4.06
|
%
|
||||||||
|
Nidec Corp.
|
512,400
|
29,828,899
|
5.02
|
%
|
||||||||
|
Recruit Holdings Co., Ltd.
|
1,108,600
|
32,339,189
|
5.45
|
%
|
||||||||
|
|
174,776,408
|
29.44
|
%
|
|||||||||
|
Information Technology – 6.32%
|
||||||||||||
|
Keyence Corp.
|
105,100
|
37,521,976
|
6.32
|
%
|
||||||||
|
Materials – 0.58%
|
||||||||||||
|
Fuji Seal International, Inc.
|
197,300
|
3,424,921
|
0.58
|
%
|
||||||||
The accompanying notes are an integral part of these financial statements.
|
HENNESSYFUNDS.COM
|
6
|
SCHEDULE OF INVESTMENTS
|
|
COMMON STOCKS
|
Number
|
% of
|
||||||||||
|
|
of Shares
|
Value
|
Net Assets
|
|||||||||
|
Real Estate – 1.71%
|
||||||||||||
|
Relo Group, Inc.
|
469,100
|
$
|
10,161,822
|
1.71
|
%
|
|||||||
|
|
||||||||||||
|
Total Common Stocks
|
||||||||||||
|
(Cost $486,135,416)
|
585,851,650
|
98.67
|
%
|
|||||||||
|
|
||||||||||||
|
SHORT-TERM INVESTMENTS – 0.83%
|
||||||||||||
|
Money Market Funds – 0.83%
|
||||||||||||
|
First American Government Obligations Fund,
|
||||||||||||
|
Institutional Class, 0.25% (a)
|
4,949,578
|
4,949,578
|
0.83
|
%
|
||||||||
|
|
||||||||||||
|
Total Short-Term Investments
|
||||||||||||
|
(Cost $4,949,578)
|
4,949,578
|
0.83
|
%
|
|||||||||
|
|
||||||||||||
|
Total Investments
|
||||||||||||
|
(Cost $491,084,994) – 99.50%
|
590,801,228
|
99.50
|
%
|
|||||||||
|
Other Assets in Excess of Liabilities – 0.50%
|
2,951,022
|
0.50
|
%
|
|||||||||
|
|
||||||||||||
|
TOTAL NET ASSETS – 100.00%
|
$
|
593,752,250
|
100.00
|
%
|
||||||||
Percentages are stated as a percent of net assets.
|
(a)
|
The rate listed is the fund’s seven-day yield as of April 30, 2020.
|
Summary of Fair Value Exposure as of April 30, 2020
The following is a summary of the inputs used to value the Fund’s net assets as of April 30, 2020 (see Note 3 in the accompanying Notes to the Financial Statements):
|
Common Stocks
|
Level 1
|
Level 2
|
Level 3
|
Total
|
||||||||||||
|
Communication Services
|
$
|
—
|
$
|
32,069,827
|
$
|
—
|
$
|
32,069,827
|
||||||||
|
Consumer Discretionary
|
—
|
132,249,289
|
—
|
132,249,289
|
||||||||||||
|
Consumer Staples
|
—
|
114,082,164
|
—
|
114,082,164
|
||||||||||||
|
Financials
|
—
|
17,543,053
|
—
|
17,543,053
|
||||||||||||
|
Health Care
|
—
|
64,022,190
|
—
|
64,022,190
|
||||||||||||
|
Industrials
|
—
|
174,776,408
|
—
|
174,776,408
|
||||||||||||
|
Information Technology
|
—
|
37,521,976
|
—
|
37,521,976
|
||||||||||||
|
Materials
|
—
|
3,424,921
|
—
|
3,424,921
|
||||||||||||
|
Real Estate
|
—
|
10,161,822
|
—
|
10,161,822
|
||||||||||||
|
Total Common Stocks
|
$
|
—
|
$
|
585,851,650
|
$
|
—
|
$
|
585,851,650
|
||||||||
|
Short-Term Investments
|
||||||||||||||||
|
Money Market Funds
|
$
|
4,949,578
|
$
|
—
|
$
|
—
|
$
|
4,949,578
|
||||||||
|
Total Short-Term Investments
|
$
|
4,949,578
|
$
|
—
|
$
|
—
|
$
|
4,949,578
|
||||||||
|
Total Investments
|
$
|
4,949,578
|
$
|
585,851,650
|
$
|
—
|
$
|
590,801,228
|
||||||||
The accompanying notes are an integral part of these financial statements.
|
HENNESSY FUNDS
|
1-800-966-4354
|
7
Financial Statements
|
Statement of Assets and Liabilities as of April 30, 2020 (Unaudited)
|
|
ASSETS:
|
||||
|
Investments in securities, at value (cost $491,084,994)
|
$
|
590,801,228
|
||
|
Dividends and interest receivable
|
2,982,515
|
|||
|
Receivable for fund shares sold
|
2,003,317
|
|||
|
Receivable for securities sold
|
2,235,796
|
|||
|
Prepaid expenses and other assets
|
27,371
|
|||
|
Total assets
|
598,050,227
|
|||
|
LIABILITIES:
|
||||
|
Payable for fund shares redeemed
|
3,669,594
|
|||
|
Payable to advisor
|
380,948
|
|||
|
Payable to administrator
|
99,689
|
|||
|
Payable to auditor
|
10,902
|
|||
|
Accrued distribution fees
|
9,230
|
|||
|
Accrued service fees
|
5,482
|
|||
|
Accrued trustees fees
|
709
|
|||
|
Accrued expenses and other payables
|
121,423
|
|||
|
Total liabilities
|
4,297,977
|
|||
|
NET ASSETS
|
$
|
593,752,250
|
||
|
NET ASSETS CONSISTS OF:
|
||||
|
Capital stock
|
$
|
521,005,003
|
||
|
Total distributable earnings
|
72,747,247
|
|||
|
Total net assets
|
$
|
593,752,250
|
||
|
NET ASSETS:
|
||||
|
Investor Class
|
||||
|
Shares authorized (no par value)
|
Unlimited
|
|||
|
Net assets applicable to outstanding shares
|
$
|
67,900,849
|
||
|
Shares issued and outstanding
|
1,987,455
|
|||
|
Net asset value, offering price, and redemption price per share
|
$
|
34.16
|
||
|
Institutional Class
|
||||
|
Shares authorized (no par value)
|
Unlimited
|
|||
|
Net assets applicable to outstanding shares
|
$
|
525,851,401
|
||
|
Shares issued and outstanding
|
14,932,137
|
|||
|
Net asset value, offering price, and redemption price per share
|
$
|
35.22
|
||
The accompanying notes are an integral part of these financial statements.
|
HENNESSYFUNDS.COM
|
8
|
STATEMENT OF ASSETS AND LIABILITIES/STATEMENT OF OPERATIONS
|
Financial Statements
|
Statement of Operations for the six months ended April 30, 2020 (Unaudited)
|
|
INVESTMENT INCOME:
|
||||
|
Dividend income(1)
|
$
|
4,427,275
|
||
|
Interest income
|
96,037
|
|||
|
Total investment income
|
4,523,312
|
|||
|
EXPENSES:
|
||||
|
Investment advisory fees (See Note 5)
|
2,688,638
|
|||
|
Sub-transfer agent expenses – Investor Class (See Note 5)
|
91,253
|
|||
|
Sub-transfer agent expenses – Institutional Class (See Note 5)
|
293,410
|
|||
|
Administration, accounting, custody, and transfer agent fees (See Note 5)
|
342,312
|
|||
|
Distribution fees – Investor Class (See Note 5)
|
60,556
|
|||
|
Service fees – Investor Class (See Note 5)
|
40,371
|
|||
|
Federal and state registration fees
|
39,967
|
|||
|
Reports to shareholders
|
23,107
|
|||
|
Compliance expense (See Note 5)
|
13,462
|
|||
|
Trustees’ fees and expenses
|
11,722
|
|||
|
Audit fees
|
10,905
|
|||
|
Interest expense (See Note 7)
|
3,993
|
|||
|
Legal fees
|
3,113
|
|||
|
Other expenses
|
28,372
|
|||
|
Total expenses
|
3,651,181
|
|||
|
NET INVESTMENT INCOME
|
$
|
872,131
|
||
|
REALIZED AND UNREALIZED GAINS (LOSSES):
|
||||
|
Net realized loss on investments
|
$
|
(27,645,838
|
)
|
|
|
Net change in unrealized appreciation/depreciation on investments
|
(34,481,264
|
)
|
||
|
Net loss on investments
|
(62,127,102
|
)
|
||
|
NET DECREASE IN NET ASSETS RESULTING FROM OPERATIONS
|
$
|
(61,254,971
|
)
|
|
|
(1)
|
Net of foreign taxes withheld of $491,919.
|
The accompanying notes are an integral part of these financial statements.
|
HENNESSY FUNDS
|
1-800-966-4354
|
9
(This Page Intentionally Left Blank.)
|
HENNESSYFUNDS.COM
|
10
|
STATEMENTS OF CHANGES IN NET ASSETS
|
Financial Statements
|
Statements of Changes in Net Assets
|
|
Six Months Ended
|
||||||||
|
April 30, 2020
|
Year Ended
|
|||||||
|
(Unaudited)
|
October 31, 2019
|
|||||||
|
OPERATIONS:
|
||||||||
|
Net investment income
|
$
|
872,131
|
$
|
3,262,016
|
||||
|
Net realized gain (loss) on investments
|
(27,645,838
|
)
|
941,773
|
|||||
|
Net change in unrealized
|
||||||||
|
appreciation/depreciation on investments
|
(34,481,264
|
)
|
64,311,703
|
|||||
|
Net increase (decrease) in net assets
|
||||||||
|
resulting from operations
|
(61,254,971
|
)
|
68,515,492
|
|||||
|
DISTRIBUTIONS TO SHAREHOLDERS:
|
||||||||
|
Distributable earnings – Investor Class
|
(117,482
|
)
|
(35,216
|
)
|
||||
|
Distributable earnings – Institutional Class
|
(3,035,474
|
)
|
(1,309,459
|
)
|
||||
|
Total distributions
|
(3,152,956
|
)
|
(1,344,675
|
)
|
||||
|
CAPITAL SHARE TRANSACTIONS:
|
||||||||
|
Proceeds from shares subscribed – Investor Class
|
12,177,276
|
35,974,622
|
||||||
|
Proceeds from shares subscribed – Institutional Class
|
116,260,913
|
382,329,976
|
||||||
|
Dividends reinvested – Investor Class
|
113,374
|
34,287
|
||||||
|
Dividends reinvested – Institutional Class
|
2,957,410
|
1,275,785
|
||||||
|
Cost of shares redeemed – Investor Class
|
(24,668,042
|
)
|
(60,746,390
|
)
|
||||
|
Cost of shares redeemed – Institutional Class
|
(147,315,933
|
)
|
(230,489,467
|
)
|
||||
|
Net increase (decrease) in net assets derived
|
||||||||
|
from capital share transactions
|
(40,475,002
|
)
|
128,378,813
|
|||||
|
TOTAL INCREASE (DECREASE) IN NET ASSETS
|
(104,882,929
|
)
|
195,549,630
|
|||||
|
NET ASSETS:
|
||||||||
|
Beginning of period
|
698,635,179
|
503,085,549
|
||||||
|
End of period
|
$
|
593,752,250
|
$
|
698,635,179
|
||||
|
CHANGES IN SHARES OUTSTANDING:
|
||||||||
|
Shares sold – Investor Class
|
345,812
|
1,043,125
|
||||||
|
Shares sold – Institutional Class
|
3,246,679
|
10,907,846
|
||||||
|
Shares issued to holders as reinvestment
|
||||||||
|
of dividends – Investor Class
|
2,962
|
1,053
|
||||||
|
Shares issued to holders as reinvestment
|
||||||||
|
of dividends – Institutional Class
|
75,037
|
38,071
|
||||||
|
Shares redeemed – Investor Class
|
(708,034
|
)
|
(1,770,416
|
)
|
||||
|
Shares redeemed – Institutional Class
|
(4,323,602
|
)
|
(6,541,834
|
)
|
||||
|
Net increase (decrease) in shares outstanding
|
(1,361,146
|
)
|
3,677,845
|
|||||
The accompanying notes are an integral part of these financial statements.
|
HENNESSY FUNDS
|
1-800-966-4354
|
11
Financial Statements
|
Financial Highlights
|
For an Investor Class share outstanding throughout each period
|
Six Months Ended
|
||||
|
April 30, 2020
|
||||
|
(Unaudited)
|
||||
|
PER SHARE DATA:
|
||||
|
Net asset value, beginning of period
|
$
|
37.17
|
||
|
Income from investment operations:
|
||||
|
Net investment income (loss)
|
(0.02
|
)(1)
|
||
|
Net realized and unrealized gains (losses) on investments
|
(2.94
|
)
|
||
|
Total from investment operations
|
(2.96
|
)
|
||
|
Less distributions:
|
||||
|
Dividends from net investment income
|
(0.02
|
)
|
||
|
Dividends from net realized gains
|
(0.03
|
)
|
||
|
Total distributions
|
(0.05
|
)
|
||
|
Net asset value, end of period
|
$
|
34.16
|
||
|
TOTAL RETURN
|
-7.98
|
%(3)
|
||
|
SUPPLEMENTAL DATA AND RATIOS:
|
||||
|
Net assets, end of period (millions)
|
$
|
67.90
|
||
|
Ratio of expenses to average net assets
|
1.42
|
%(4)
|
||
|
Ratio of net investment income (loss) to average net assets
|
(0.09
|
)%(4)
|
||
|
Portfolio turnover rate(5)
|
8
|
%(3)
|
||
|
(1)
|
Calculated using the average shares outstanding method.
|
|
(2)
|
Amount is between $(0.005) and $0.005.
|
|
(3)
|
Not annualized.
|
|
(4)
|
Annualized.
|
|
(5)
|
Calculated on the basis of the Fund as a whole.
|
The accompanying notes are an integral part of these financial statements.
|
HENNESSYFUNDS.COM
|
12
|
FINANCIAL HIGHLIGHTS — INVESTOR CLASS
|
|
Year Ended October 31,
|
||||||||||||||||||
|
2019
|
2018
|
2017
|
2016
|
2015
|
||||||||||||||
|
$
|
33.63
|
$
|
32.75
|
$
|
27.81
|
$
|
24.07
|
$
|
21.77
|
|||||||||
|
0.05
|
(1)
|
(0.00
|
)(2)
|
(0.03
|
)
|
(0.11
|
)
|
(0.10
|
)
|
|||||||||
|
3.50
|
0.89
|
4.97
|
3.85
|
2.40
|
||||||||||||||
|
3.55
|
0.89
|
4.94
|
3.74
|
2.30
|
||||||||||||||
|
(0.01
|
)
|
(0.01
|
)
|
—
|
—
|
—
|
||||||||||||
|
—
|
—
|
—
|
—
|
—
|
||||||||||||||
|
(0.01
|
)
|
(0.01
|
)
|
—
|
—
|
—
|
||||||||||||
|
$
|
37.17
|
$
|
33.63
|
$
|
32.75
|
$
|
27.81
|
$
|
24.07
|
|||||||||
|
10.60
|
%
|
2.70
|
%
|
17.76
|
%
|
15.54
|
%
|
10.56
|
%
|
|||||||||
|
$
|
87.22
|
$
|
103.33
|
$
|
84.44
|
$
|
61.85
|
$
|
61.56
|
|||||||||
|
1.43
|
%
|
1.43
|
%
|
1.46
|
%
|
1.50
|
%
|
1.53
|
%
|
|||||||||
|
0.14
|
%
|
(0.02
|
)%
|
(0.15
|
)%
|
(0.38
|
)%
|
(0.44
|
)%
|
|||||||||
|
9
|
%
|
1
|
%
|
0
|
%
|
5
|
%
|
21
|
%
|
|||||||||
The accompanying notes are an integral part of these financial statements.
|
HENNESSY FUNDS
|
1-800-966-4354
|
13
Financial Statements
|
Financial Highlights
|
For an Institutional Class share outstanding throughout each period
|
Six Months Ended
|
||||
|
April 30, 2020
|
||||
|
(Unaudited)
|
||||
|
PER SHARE DATA:
|
||||
|
Net asset value, beginning of period
|
$
|
38.37
|
||
|
Income from investment operations:
|
||||
|
Net investment income (loss)
|
0.06
|
(1)
|
||
|
Net realized and unrealized gains (losses) on investments
|
(3.02
|
)
|
||
|
Total from investment operations
|
(2.96
|
)
|
||
|
Less distributions:
|
||||
|
Dividends from net investment income
|
(0.16
|
)
|
||
|
Dividends from net realized gains
|
(0.03
|
)
|
||
|
Total distributions
|
(0.19
|
)
|
||
|
Net asset value, end of period
|
$
|
35.22
|
||
|
TOTAL RETURN
|
-7.80
|
%(2)
|
||
|
SUPPLEMENTAL DATA AND RATIOS:
|
||||
|
Net assets, end of period (millions)
|
$
|
525.85
|
||
|
Ratio of expenses to average net assets
|
1.04
|
%(3)
|
||
|
Ratio of net investment income (loss) to average net assets
|
0.31
|
%(3)
|
||
|
Portfolio turnover rate(4)
|
8
|
%(2)
|
||
|
(1)
|
Calculated using the average shares outstanding method.
|
|
(2)
|
Not annualized.
|
|
(3)
|
Annualized.
|
|
(4)
|
Calculated on the basis of the Fund as a whole.
|
The accompanying notes are an integral part of these financial statements.
|
HENNESSYFUNDS.COM
|
14
|
FINANCIAL HIGHLIGHTS — INSTITUTIONAL CLASS
|
|
Year Ended October 31,
|
||||||||||||||||||
|
2019
|
2018
|
2017
|
2016
|
2015
|
||||||||||||||
|
$
|
34.67
|
$
|
33.64
|
$
|
28.45
|
$
|
24.55
|
$
|
22.15
|
|||||||||
|
0.21
|
(1)
|
0.15
|
0.03
|
(0.01
|
)
|
(0.02
|
)
|
|||||||||||
|
3.60
|
0.91
|
5.16
|
3.91
|
2.42
|
||||||||||||||
|
3.81
|
1.06
|
5.19
|
3.90
|
2.40
|
||||||||||||||
|
(0.11
|
)
|
(0.03
|
)
|
—
|
—
|
—
|
||||||||||||
|
—
|
—
|
—
|
—
|
—
|
||||||||||||||
|
(0.11
|
)
|
(0.03
|
)
|
—
|
—
|
—
|
||||||||||||
|
$
|
38.37
|
$
|
34.67
|
$
|
33.64
|
$
|
28.45
|
$
|
24.55
|
|||||||||
|
11.02
|
%
|
3.14
|
%
|
18.24
|
%
|
15.89
|
%
|
10.84
|
%
|
|||||||||
|
$
|
611.41
|
$
|
399.76
|
$
|
177.42
|
$
|
67.78
|
$
|
54.13
|
|||||||||
|
1.03
|
%
|
1.01
|
%
|
1.05
|
%
|
1.17
|
%
|
1.27
|
%
|
|||||||||
|
0.59
|
%
|
0.49
|
%
|
0.30
|
%
|
(0.03
|
)%
|
(0.08
|
)%
|
|||||||||
|
9
|
%
|
1
|
%
|
0
|
%
|
5
|
%
|
21
|
%
|
|||||||||
The accompanying notes are an integral part of these financial statements.
|
HENNESSY FUNDS
|
1-800-966-4354
|
15
Financial Statements
|
Notes to the Financial Statements April 30, 2020 (Unaudited)
|
1). ORGANIZATION
The Hennessy Japan Fund (the “Fund”) is a series of Hennessy Funds Trust (the “Trust”), which was organized as a Delaware statutory trust on September 17, 1992. The Fund is an open-end management
investment company registered under the Investment Company Act of 1940, as amended. The investment objective of the Fund is long-term capital appreciation. The Fund is a diversified fund, but employs a relatively concentrated
investment strategy and may hold securities of fewer issuers than other diversified funds.
The Fund offers Investor Class and Institutional Class shares. Each class of shares differs principally in its respective 12b-1 distribution and service, shareholder servicing, and
sub-transfer agent expenses. There are no sales charges. Each class has identical rights to earnings, assets, and voting privileges, except for class-specific expenses and exclusive rights to vote on matters affecting only one
class.
As an investment company, the Fund follows the investment company accounting and reporting guidance of the Financial Accounting Standards Board (“FASB”) Accounting Standard
Codification Topic 946 “Financial Services—Investment Companies.”
2). SIGNIFICANT ACCOUNTING POLICIES
The following is a summary of significant accounting policies consistently followed by the Fund in the preparation of the financial statements. These policies conform to U.S. generally accepted
accounting principles (“GAAP”).
|
a).
|
Securities Valuation – All investments in securities are recorded at their estimated fair value, as described in Note 3.
|
|
b).
|
Federal Income Taxes – No provision for federal income taxes or excise taxes has been made because the Fund has elected to be taxed as a regulated investment company and intends to distribute
substantially all of its taxable income to its shareholders and otherwise comply with the provisions of the Internal Revenue Code of 1986, as amended, applicable to regulated investment companies. Net investment
income/loss and realized gains/losses for federal income tax purposes may differ from those reported in the financial statements because of temporary book and tax basis differences. Temporary differences are primarily
the result of the treatment of wash sales for tax reporting purposes. The Fund recognizes interest and penalties related to income tax benefits, if any, in the Statement of Operations as an income tax expense.
Distributions from net realized gains for book purposes may include short-term capital gains, which are included as ordinary income to shareholders for tax purposes. The Fund may utilize equalization accounting for tax
purposes and designate earnings and profits, including net realized gains distributed to shareholders on redemption of shares, as part of the dividends paid deduction for income tax purposes.
|
|
c).
|
Accounting for Uncertainty in Income Taxes – The Fund has accounting policies regarding recognition and measurement of tax positions taken or expected to be taken on a tax return. The tax
returns of the Fund for the prior three fiscal years are open for examination. The Fund has reviewed all open tax years in major jurisdictions and concluded that there is no impact on the Fund’s net assets and no tax
liability resulting from unrecognized tax benefits relating to uncertain income tax
|
|
HENNESSYFUNDS.COM
|
16
|
NOTES TO THE FINANCIAL STATEMENTS
|
|
positions taken or expected to be taken on a tax return. The Fund’s major tax jurisdictions are U.S. federal and Delaware.
|
|
|
d).
|
Income and Expenses – Dividend income is recognized on the ex-dividend date or as soon as information is available to the Fund. Interest income, which includes the amortization of premium and
accretion of discount, is recognized on an accrual basis. Other non-cash dividends are recognized as investment income at the fair value of the property received. The Fund is charged for those expenses that are directly
attributable to its portfolio, such as advisory, administration, and certain shareholder service fees. Income, expenses (other than expenses attributable to a specific class), and realized and unrealized gains/losses on
investments are allocated to each class of shares based on such class’s net assets.
|
|
e).
|
Distributions to Shareholders – Dividends from net investment income for the Fund, if any, are declared and paid annually, usually in December. Distributions of net realized capital gains, if
any, are declared and paid annually, usually in December.
|
|
f).
|
Security Transactions – Investment and shareholder transactions are recorded on the trade date. The Fund determines the realized gain/loss from an investment transaction by comparing the
original cost of the security lot sold with the net sale proceeds. Discounts and premiums on securities purchased are accreted or amortized, respectively, over the life of each such security.
|
|
g).
|
Use of Estimates – The preparation of financial statements in conformity with GAAP requires management to make estimates and assumptions that affect the reported amounts of assets and
liabilities and disclosure of contingent assets and liabilities at the date of the financial statements and the reported change in net assets during the reporting period. Actual results could differ from those estimates.
|
|
h).
|
Share Valuation – The net asset value (“NAV”) per share of the Fund is calculated by dividing (i) the total value of the securities held by the Fund, plus cash and other assets, minus all
liabilities (including estimated accrued expenses) by (ii) the total number of shares outstanding for the Fund, rounded to the nearest $0.01. The Fund’s shares will not be priced on days the New York Stock Exchange is
closed for trading. The offering and redemption price per share for the Fund is equal to the Fund’s NAV per share.
|
|
i).
|
Foreign Currency – Values of investments denominated in foreign currencies are converted into U.S. dollars using the spot market rate of exchange at the time of valuation. Purchases and sales
of investments and income are translated into U.S. dollars using the spot market rate of exchange prevailing on the respective dates of such transactions. The Fund does not isolate the portion of the results of
operations resulting from fluctuations in foreign exchange rates on investments from fluctuations resulting from changes in the market prices of securities held. Such fluctuations are included with the net realized and
unrealized gain/loss on investments. Foreign investments present additional risks due to currency fluctuations, economic and political factors, lower liquidity, government regulations, differences in accounting
standards, and other factors.
|
|
j).
|
REIT Equity Securities – The Fund may invest in the equity securities of real estate investment trusts (“REITs”). Distributions received from REITs may be classified as dividends, capital
gains, or return of capital. Investments in REITs may require the Fund to accrue and distribute income not yet received. To generate sufficient cash to make the requisite distributions, the Fund may be required to sell
securities in its portfolio (including when it is not advantageous to do so) that it otherwise would have continued to hold. At other times, investments in a REIT may result in the
|
|
HENNESSY FUNDS
|
1-800-966-4354
|
17
|
Fund’s receipt of cash in excess of the REIT’s earnings. If the Fund distributes these amounts, these distributions could constitute a return of capital to Fund shareholders for U.S. federal
income tax purposes. Dividends received by the Fund from a REIT generally will not constitute qualified dividend income and will not qualify for the dividends-received deduction.
|
3). SECURITIES VALUATION
The Fund follows fair value accounting standards that establish an authoritative definition of fair value and set out a hierarchy for measuring fair value. These standards require additional
disclosures about the various inputs and valuation techniques used to develop the measurements of fair value and a discussion of changes in valuation techniques and related inputs during the period. These inputs are summarized
in the three broad levels listed below:
|
Level 1 –
|
Unadjusted, quoted prices in active markets for identical instruments that the Fund has the ability to access at the date of measurement.
|
|
|
Level 2 –
|
Other significant observable inputs (including, but not limited to, quoted prices in active markets for similar instruments, quoted prices in markets that are not active for identical or
similar instruments, and model-derived valuations in which all significant inputs and significant value drivers are observable in active markets, such as interest rates, prepayment speeds, credit risk curves, default
rates, and similar data).
|
|
|
Level 3 –
|
Significant unobservable inputs (including the Fund’s own assumptions about what market participants would use to price the asset or liability based on the best available information) when
observable inputs are unavailable.
|
The following is a description of the valuation techniques applied to the Fund’s major categories of assets and liabilities measured at fair value on a recurring basis:
|
Equity Securities – Equity securities, including common stocks, preferred stocks, foreign-issued common stocks, exchange-traded funds, closed-end mutual
funds, partnerships, rights, and real estate investment trusts, that are traded on a securities exchange for which a last-quoted sales price is readily available will generally be valued at the last sales price as
reported by the primary exchange on which the securities are listed. Securities listed on The NASDAQ Stock Market (“NASDAQ”) will generally be valued at the NASDAQ Official Closing Price, which may differ from the last
sales price reported. Securities traded on a securities exchange for which a last-quoted sales price is not readily available will generally be valued at the mean between the bid and ask prices. To the extent these
securities are actively traded and valuation adjustments are not applied, they are classified in Level 1 of the fair value hierarchy. Securities traded on foreign exchanges generally are not valued at the same time the
Fund calculates its NAV because most foreign markets close well before such time. The earlier close of most foreign markets gives rise to the possibility that significant events, including broad market moves, may have
occurred in the interim. In certain circumstances, it may be determined that a foreign security needs to be fair valued because it appears that the value of the security might have been materially affected by events
occurring after the close of the market in which the security is principally traded, but before the time the Fund calculates its NAV, such as by a development that affects an entire market or region (e.g., a
weather-related event) or a potentially global development (e.g., a terrorist attack that may be expected to have an effect on investor expectations worldwide).
|
|
HENNESSYFUNDS.COM
|
18
|
NOTES TO THE FINANCIAL STATEMENTS
|
|
Registered Investment Companies – Investments in open-end registered investment companies, commonly referred to as mutual funds, generally are priced at
the ending NAV provided by the applicable mutual fund’s service agent and will be classified in Level 1 of the fair value hierarchy.
|
|
|
Debt Securities – Debt securities, including corporate bonds, asset-backed securities, mortgage-backed securities, municipal bonds, U.S. Treasuries, and
U.S. government agency issues, are generally valued at market on the basis of valuations furnished by an independent pricing service that utilizes both dealer-supplied valuations and formula-based techniques. The pricing
service may consider recently executed transactions in securities of the issuer or comparable issuers, market price quotations (where observable), bond spreads, and fundamental data relating to the issuer. In addition,
the model may incorporate observable market data, such as reported sales of similar securities, broker quotes, yields, bids, offers, and reference data. Certain securities are valued primarily using dealer quotations.
These securities are generally classified in Level 2 of the fair value hierarchy.
|
|
|
Short-Term Securities – Short-term equity investments, including money market funds, are valued in the manner specified above. Short-term debt
investments with an original term to maturity of 60 days or less are valued at amortized cost, which approximates fair market value. If the original term to maturity of a short-term debt investment exceeded 60 days, then
the values as of the 61st day prior to maturity are amortized. Amortized cost is not used if its use would be inappropriate due to credit or other impairments of the issuer, in which case the security’s fair value would
be determined, as described below. Short-term securities are generally classified in Level 1 or Level 2 of the fair value hierarchy depending on the inputs used and market activity levels for specific securities.
|
The Board of Trustees of the Fund (the “Board”) has adopted fair value pricing procedures that are followed when a price for a security is not readily available or if a significant
event has occurred that indicates the closing price of a security no longer represents the true value of that security. Fair value pricing determinations are made in good faith in accordance with these procedures. There are
numerous criteria that will be given consideration in determining a fair value of a security, such as the trading volume of a security and markets, the values of other similar securities, and news events with direct bearing on a
security or markets. Fair value pricing results in an estimated price for a security that reflects the amount the Fund might reasonably expect to receive in a current sale. Depending on the relative significance of the valuation
inputs, these securities may be classified in either Level 2 or Level 3 of the fair value hierarchy.
The fair value of foreign securities may be determined with the assistance of a pricing service using correlations between the movement of prices of such securities and indices of
domestic securities and other appropriate indicators, such as closing market prices of relevant American Depositary Receipts or futures contracts. Using fair value pricing means that the Fund’s NAV reflects the affected
portfolio securities’ values as determined by the Board or its designee, pursuant to the fair value pricing procedures adopted by the Board, instead of being determined by the market. Using a fair value pricing methodology to
price a foreign security may result in a value that is different from such foreign security’s most recent closing price and from the value used by other investment companies to calculate their NAVs. Such securities are generally
classified in Level 2 of the fair value hierarchy. Because the Fund invests in foreign securities, the value of the Fund’s portfolio securities may change on days when you will not be able to purchase or redeem your shares.
|
HENNESSY FUNDS
|
1-800-966-4354
|
19
The Board has delegated day-to-day valuation matters to the Valuation and Liquidity Committee comprising representatives from Hennessy Advisors, Inc., the Fund’s investment advisor
(the “Advisor”). The function of the Valuation and Liquidity Committee is to value securities where current and reliable market quotations are not readily available. All actions taken by the Valuation and Liquidity Committee are
reviewed by the Board.
The Fund has performed an analysis of all existing investments to determine the significance and character of all inputs to their fair value determinations. Various inputs are used
to determine the value of the Fund’s investments. The inputs or methodology used for valuing securities are not necessarily an indication of the risk associated with investing in those securities. Details related to the fair
value hierarchy of the Fund’s securities as of April 30, 2020, are included in the Schedule of Investments.
4). INVESTMENT TRANSACTIONS
Purchases and sales of investment securities (excluding government and short-term investments) for the Fund during the six months ended April 30, 2020, were $55,277,672 and $82,305,464, respectively.
There were no purchases or sales/maturities of long-term U.S. government securities for the Fund during the six months ended April 30, 2020.
The Fund is permitted to purchase or sell securities from or to another fund in the Hennessy Funds family of funds (collectively, the “Hennessy Funds”) under specified conditions
outlined in procedures adopted by the Board. The procedures have been designed to ensure that any purchase or sale of securities by the Fund from or to another Hennessy Fund complies with Rule 17a-7 of the Investment Company Act
of 1940, as amended. During the six months ended April 30, 2020, the Fund did not engage in purchases or sales of securities pursuant to Rule 17a-7 of the Investment Company Act of 1940, as amended.
5). INVESTMENT ADVISORY FEE AND OTHER TRANSACTIONS WITH AFFILIATES
The Advisor provides the Fund with investment advisory services under an Investment Advisory Agreement. The Advisor oversees the provision of investment advice and furnishes office space, facilities,
and most of the personnel needed by the Fund. As compensation for its services, the Advisor is entitled to a monthly fee from the Fund. The fee is based on the average daily net assets of the Fund at an annual rate of 0.80%. The
net investment advisory fees expensed by the Fund during the six months ended April 30, 2020, are included in the Statement of Operations.
The Advisor has delegated the day-to-day management of the Fund to a sub-advisor, SPARX Asset Management Co., Ltd. The Advisor pays the sub-advisory fees from its own assets, and
these fees are not an additional expense of the Fund. During the six months ended April 30, 2020, the Advisor (not the Fund) paid a sub-advisory fee at the average rate of 0.36% of the daily net assets of the Fund. Pursuant to
the sub-advisory agreement, the Advisor pays sub-advisory fees at the rate of 0.35% of the first $500 million of daily net assets, 0.40% of daily net assets between $500 million and $1 billion, and 0.42% of daily net assets over
$1 billion.
The Board has approved a Shareholder Servicing Agreement for Investor Class shares of the Fund, which was instituted to compensate the Advisor for the non-investment advisory
services it provides to the Fund. The Shareholder Servicing Agreement provides for a monthly fee paid to the Advisor at an annual rate of 0.10% of the average daily net assets of the Fund attributable to Investor Class shares.
The shareholder service fees expensed by the Fund during the six months ended April 30, 2020, are included in the Statement of Operations.
|
HENNESSYFUNDS.COM
|
20
|
NOTES TO THE FINANCIAL STATEMENTS
|
The Fund has adopted a plan pursuant to Rule 12b-1 under the Investment Company Act of 1940, as amended, that authorizes payments in connection with the distribution of the Fund’s
shares at an annual rate of up to 0.25% of the Fund’s average daily net assets attributable to Investor Class shares. Even though the authorized rate is up to 0.25%, the Fund is currently only using up to 0.15% of its average
daily net assets attributable to Investor Class shares for such purpose. Amounts paid under the plan may be spent on any activities or expenses primarily intended to result in the sale of shares, including, but not limited to,
advertising, shareholder account servicing, printing and mailing of prospectuses to other than current shareholders, printing and mailing of sales literature, and compensation for sales and marketing activities or to financial
institutions and others, such as dealers and distributors. The distribution fees expensed by the Fund during the six months ended April 30, 2020, are included in the Statement of Operations.
The Fund has entered into agreements with various brokers, dealers, and financial intermediaries in connection with the sale of shares of the Fund. The agreements provide for
periodic payments of sub-transfer agent expenses by the Fund to the brokers, dealers, and financial intermediaries for providing certain shareholder maintenance services. These shareholder services include the pre-processing and
quality control of new accounts, shareholder correspondence, answering customer inquiries regarding account status, and facilitating shareholder telephone transactions. The sub-transfer agent fees expensed by the Fund during the
six months ended April 30, 2020, are included in the Statement of Operations.
U.S. Bancorp Fund Services, LLC, d/b/a U.S. Bank Global Fund Services (“Fund Services”) provides the Fund with administrative, accounting, and transfer agent services. As
administrator, Fund Services is responsible for activities such as (i) preparing various federal and state regulatory filings, reports, and returns for the Fund, (ii) preparing reports and materials to be supplied to the Board,
(iii) monitoring the activities of the Fund’s custodian, transfer agent, and accountants, and (iv) coordinating the preparation and payment of the Fund’s expenses and reviewing the Fund’s expense accruals. U.S. Bank N.A., an
affiliate of Fund Services, serves as the Fund’s custodian. The servicing agreements between the Trust and Fund Services and U.S. Bank N.A. contain a fee schedule that is inclusive of administrative, accounting, custody, and
transfer agent fees. The administrative, accounting, custody, and transfer agent fees expensed by the Fund during the six months ended April 30, 2020, are included in the Statement of Operations.
Quasar Distributors, LLC (“Quasar”) acts as the Fund’s principal underwriter in a continuous public offering of the Fund’s shares. Quasar was an affiliate of Fund Services and U.S.
Bank N.A. through March 30, 2020. Effective March 31, 2020, Foreside Financial Group, LLC (“Foreside”) acquired Quasar from Fund Services. As a result of the acquisition, Quasar became a wholly owned broker-dealer subsidiary of
Foreside and is no longer affiliated with Fund Services or U.S. Bank N.A. The Board approved a new Distribution Agreement to enable Quasar to continue serving as the Fund’s distributor.
The officers of the Fund are affiliated with the Advisor. With the exception of the Chief Compliance Officer and the Senior Compliance Officer, such officers receive no compensation
from the Fund for serving in their respective roles. The Fund, along with the other Hennessy Funds, makes reimbursement payments on an equal basis to the Advisor for a portion of the salary and benefits associated with the
office of the Chief Compliance Officer and for all of the salary and benefits associated with the office of the Senior Compliance Officer. The compliance fees expensed by the Fund during the six months ended April 30, 2020, are
included in the Statement of Operations.
|
HENNESSY FUNDS
|
1-800-966-4354
|
21
6). GUARANTEES AND INDEMNIFICATIONS
Under the Hennessy Funds’ organizational documents, their officers and trustees are indemnified by the Hennessy Funds against certain liabilities arising out of the performance of their duties to the
Hennessy Funds. Additionally, in the normal course of business, the Hennessy Funds enter into contracts with service providers that contain general indemnification clauses. The Fund’s maximum exposure under these arrangements is
unknown as this would involve future claims that may be made against the Fund that have not yet occurred. Currently, the Fund expects the risk of loss to be remote.
7). LINE OF CREDIT
The Fund has an uncommitted line of credit with the other Hennessy Funds in the amount of the lesser of (i) $100,000,000 or (ii) 33.33% of each Hennessy Fund’s net assets, or 30% for the Hennessy Gas
Utility Fund and 10% for the Hennessy Balanced Fund, intended to provide short-term financing, if necessary, subject to certain restrictions, in connection with shareholder redemptions. The credit facility is with the Hennessy
Funds’ custodian bank, U.S. Bank N.A. Borrowings under this arrangement bear interest at the bank’s prime rate and are secured by all of the Fund’s assets (as to its own borrowings only). During the six months ended April 30,
2020, the Fund had an outstanding average daily balance and a weighted average interest rate of $220,099 and 3.59%, respectively. The interest expensed by the Fund during the six months ended April 30, 2020, is included in the
Statement of Operations. The maximum amount outstanding for the Fund during the period was $10,211,000. As of April 30, 2020, the Fund did not have any borrowings outstanding under the line of credit.
8). FEDERAL TAX INFORMATION
As of October 31, 2019, the Fund’s most recent fiscal year end, the components of accumulated earnings (losses) for income tax purposes were as follows:
|
Investments
|
|||||
|
Cost of investments for tax purposes
|
$
|
561,371,434
|
|||
|
Gross tax unrealized appreciation
|
$
|
154,957,601
|
|||
|
Gross tax unrealized depreciation
|
(20,873,572
|
)
|
|||
|
Net tax unrealized appreciation/(depreciation)
|
$
|
134,084,029
|
|||
|
Undistributed ordinary income
|
$
|
2,548,524
|
|||
|
Undistributed long-term capital gains
|
522,621
|
||||
|
Total distributable earnings
|
$
|
3,071,145
|
|||
|
Other accumulated gain/(loss)
|
$
|
—
|
|||
|
Total accumulated gain/(loss)
|
$
|
137,155,174
|
|||
The difference between book-basis unrealized appreciation/depreciation and tax-basis unrealized appreciation/depreciation (as shown above) is attributable primarily to wash sales.
As of October 31, 2019, the Fund had no tax basis capital losses to offset future capital gains.
During fiscal year 2019, the capital losses utilized by the Fund were $279,907.
As of October 31, 2019, the Fund did not defer, on a tax basis, any late-year ordinary losses. Late-year ordinary losses are net ordinary losses incurred after December 31, 2018, but
within the taxable year, that are deemed to arise on the first day of the Fund’s next taxable year.
|
HENNESSYFUNDS.COM
|
22
|
NOTES TO THE FINANCIAL STATEMENTS
|
During fiscal year 2020 (year to date) and fiscal year 2019, the tax character of distributions paid by the Fund was as follows:
|
Six Months Ended
|
Year Ended
|
||||||||
|
April 30, 2020
|
October 31, 2019
|
||||||||
|
Ordinary income(1)
|
$
|
2,630,234
|
$
|
1,344,675
|
|||||
|
Long-term capital gain
|
522,722
|
—
|
|||||||
|
$
|
3,152,956
|
$
|
1,344,675
|
||||||
|
(1) Ordinary income includes short-term capital gain.
|
9). EVENTS SUBSEQUENT TO PERIOD END
Management has evaluated the Fund’s related events and transactions that occurred subsequent to April 30, 2020, through the date of issuance of the Fund’s financial statements. Management has
determined that there were no subsequent events requiring recognition or disclosure in the financial statements.
|
HENNESSY FUNDS
|
1-800-966-4354
|
23
Expense Example (Unaudited)
April 30, 2020
As a shareholder of the Fund, you incur ongoing costs, including management fees, service fees, and other Fund expenses. This Example is intended to help you understand your ongoing costs (in dollars)
of investing in the Fund and to compare these costs with the ongoing costs of investing in other mutual funds. The Example is based on an investment of $1,000 invested at the beginning of the period and held for the entire
period from November 1, 2019, through April 30, 2020.
Actual Expenses
The first line of the table below under the “Investor Class” and “Institutional Class” headings provides information about actual account values and actual expenses. Although the Fund charges no sales
loads or transaction fees, you will be assessed fees for outgoing wire transfers, returned checks and stop payment orders at prevailing rates charged by U.S. Bank Global Fund Services, the Fund’s transfer agent. If you request
that a redemption be made by wire transfer, currently a $15 fee is charged by the Fund’s transfer agent. IRA accounts will be charged a $15 annual maintenance fee. The example below includes, but is not limited to, management
fees, shareholder servicing fees, accounting, custody, and transfer agent fees. However, the example below does not include portfolio trading commissions and related expenses. You may use the information in this line, together
with the amount you invested, to estimate the expenses that you paid over the period. Simply divide your account value by $1,000 (for example, an $8,600 account value divided by $1,000 = 8.6), then multiply the result by the
number in the first line of the table under the “Investor Class” or “Institutional Class” headings in the column entitled “Expenses Paid During Period” to estimate the expenses you paid on your account during this period.
Hypothetical Example for Comparison Purposes
The second line of the table below under the “Investor Class” and “Institutional Class” headings provides information about hypothetical account values and hypothetical expenses based on the Fund’s
actual expense ratios and an assumed rate of return of 5% per year before expenses, which is not the Fund’s actual return. The hypothetical account values and expenses may not be used to estimate the actual ending account
balance or expenses you paid for the period. You may use this information to compare the ongoing costs of investing in the Fund and other funds. To do so, compare this 5% hypothetical example with the 5% hypothetical examples
that appear in the shareholder reports of the other funds. Please note that the expenses shown in the table are meant to highlight your ongoing costs only. Therefore, the second line of the table under the “Investor Class” and
“Institutional Class” headings is useful in comparing ongoing costs only and will not help you determine the relative total costs of owning different funds.
|
HENNESSYFUNDS.COM
|
24
|
EXPENSE EXAMPLE
|
|
Beginning
|
Ending
|
||
|
Account Value
|
Account Value
|
Expenses Paid
|
|
|
November 1, 2019
|
April 30, 2020
|
During Period(1)
|
|
|
Investor Class
|
|||
|
Actual
|
$1,000.00
|
$ 920.20
|
$6.78
|
|
Hypothetical (5% return before expenses)
|
$1,000.00
|
$1,017.80
|
$7.12
|
|
Institutional Class
|
|||
|
Actual
|
$1,000.00
|
$ 922.00
|
$4.97
|
|
Hypothetical (5% return before expenses)
|
$1,000.00
|
$1,019.69
|
$5.22
|
|
(1)
|
Expenses are equal to the Fund’s annualized expense ratio of 1.42% for Investor Class shares or 1.04% for Institutional Class shares, as applicable, multiplied by the average account value over
the period, multiplied by 182/366 days (to reflect the half-year period).
|
|
HENNESSY FUNDS
|
1-800-966-4354
|
25
How to Obtain a Copy of the Fund’s Proxy
Voting Policy and Proxy Voting Records
A description of the policies and procedures the Fund uses to determine how to vote proxies relating to portfolio securities is available without charge (1) by calling 1-800-966-4354, (2) on the
Hennessy Funds’ website at www.hennessyfunds.com/proxy-voting/voting-policy, or (3) on the U.S. Securities and Exchange Commission’s (the “SEC”) website at www.sec.gov. The Fund’s proxy voting record is available without charge
on both the Hennessy Funds’ website at www.hennessyfunds.com/proxy-voting/voting-record and the SEC’s website at www.sec.gov no later than August 31 for the prior 12 months ending June 30.
Availability of Quarterly Portfolio Schedule
The Fund files a complete schedule of portfolio holdings with the SEC for the first and third quarters of each fiscal year as an exhibit to its reports on Form N-PORT. The Fund’s Forms N-PORT are
available on the SEC’s website at www.sec.gov or on request by calling 1-800-966-4354.
Federal Tax Distribution Information (Unaudited)
For fiscal year 2019, certain dividends paid by the Fund may be subject to a maximum tax rate of 23.8%, as provided for by the Jobs and Growth Tax Relief Reconciliation Act of 2003. The percentage of
dividends declared from ordinary income designated as qualified dividend income was 100.00%.
For corporate shareholders, the percent of ordinary income distributions that qualified for the corporate dividends received deduction for fiscal year 2019 was 0.00%.
The percentage of taxable ordinary income distributions that were designated as short-term capital gain distributions under Section 871(k)(2)(C) of the Internal Revenue Code of 1986,
as amended, for the Fund was 0.00%.
For the year ended October 31, 2019, the Fund earned foreign-source income and paid foreign taxes as noted below, which it intends to pass through to its shareholders pursuant to
Section 853 of the Internal Revenue Code.
|
Gross Foreign Income
|
Foreign Tax Paid
|
|||
|
Japan
|
$10,290,290
|
$1,029,031
|
Important Notice Regarding Delivery
of Shareholder Documents
To help keep the Fund’s costs as low as possible, we generally deliver a single copy of shareholder reports, proxy statements, and prospectuses to shareholders who share an address and have the same
last name. This process does not apply to account statements. You may request an individual copy of a shareholder document at any time. If you would like to receive separate mailings of shareholder documents, please call U.S.
Bank Global Fund Services at 1-800-261-6950 or 1-414-765-4124, and individual delivery will begin within 30 days of your request. If your account is held through a financial institution or other intermediary, please contact such
intermediary directly to request individual delivery.
|
HENNESSYFUNDS.COM
|
26
|
PROXY VOTING — ELECTRONIC DELIVERY
|
Electronic Delivery
The Funds offer shareholders the option to receive account statements, prospectuses, tax forms, and shareholder reports online. To sign up for eDelivery, please visit www.hennessyfunds.com/account. You
may change your delivery preference at any time by visiting our website or calling U.S. Bank Global Fund Services at 1-800-261-6950 or 1-414-765-4124.
|
HENNESSY FUNDS
|
1-800-966-4354
|
27
Board Approval of Investment Advisory
Agreements
At its meeting on March 12, 2020, the Board of Trustees of the Fund (the “Board,” and the members thereof, the “Trustees”) unanimously approved the continuation of the investment advisory agreement of
the Fund with Hennessy Advisors, Inc. (the “Advisor”) and the sub-advisory agreement for the Fund between the Advisor and SPARX Asset Management Co., Ltd. (the “Sub-Advisor”). As part of the process of approving the continuation
of the advisory and sub-advisory agreements, the Trustees reviewed their fiduciary duties and the relevant factors for them to consider with respect to approving the advisory and sub-advisory agreements. In addition, the
Trustees who are not deemed “interested persons” (as defined by the Investment Company Act of 1940, as amended) of the Fund (the “Independent Trustees”) met in executive session to discuss the approval of the advisory and
sub-advisory agreements.
In advance of the meeting, the Advisor sent detailed information to the Trustees to assist them in their evaluation of the advisory and sub-advisory agreements. This information
included, but was not limited to, the following:
|
(1)
|
A memorandum from outside legal counsel that described the fiduciary duties of the Board with respect to approving the continuation of the advisory and sub-advisory agreements and the relevant
factors for consideration;
|
|
|
(2)
|
A memorandum from the Advisor that listed the factors relevant to the Board’s approval of the continuation of the advisory and sub-advisory agreements and also referenced the documents that had
been provided to help the Board assess each such factor;
|
|
|
(3)
|
An inventory of the services provided by the Advisor and the Sub-Advisor and the distinction between the Advisor-provided services and the Sub-Advisor-provided services;
|
|
|
(4)
|
A written discussion of economies of scale;
|
|
|
(5)
|
Summaries of the key terms of the advisory and sub-advisory agreements;
|
|
|
(6)
|
A recent Fund fact sheet, which included performance information over various periods;
|
|
|
(7)
|
A peer expense comparison of the net expense ratio and investment advisory fee of the Fund;
|
|
|
(8)
|
The Advisor’s financial statements from its most recent Form 10-K and Form 10-Q;
|
|
|
(9)
|
A completed questionnaire from the Sub-Advisor;
|
|
|
(10)
|
A summary of the Sub-Advisor’s questionnaire and relevant information from the Sub-Advisor’s Form ADV Parts I and II;
|
|
|
(11)
|
The Sub-Advisor’s Code of Ethics; and
|
|
|
(12)
|
Financial information of the Sub-Advisor’s parent company.
|
All of the factors discussed were considered as a whole by the Trustees and by the Independent Trustees meeting in executive session. The factors were viewed in their totality by the
Trustees, with no single factor being the principal or determinative factor in the Trustees’ determination of whether to approve the continuation of the advisory and sub-advisory agreements. The Trustees recognized that the
management and fee
|
HENNESSYFUNDS.COM
|
28
|
BOARD APPROVAL OF INVESTMENT ADVISORY AGREEMENTS
|
arrangements for the Fund are the result of years of review and discussion between the Independent Trustees and the Advisor, that certain aspects of such arrangements may receive greater scrutiny in
some years than in others, and that the Trustees’ conclusions may be based, in part, on their consideration of these same arrangements and information received during the course of the year and in prior years.
Prior to approving the continuation of the advisory and sub-advisory agreements, the Trustees, including the Independent Trustees in executive session, considered, among other items:
|
(1)
|
The nature and quality of the advisory services provided by the Advisor and the Sub-Advisor;
|
|
|
(2)
|
A comparison of the fees and expenses of the Fund to other similar funds;
|
|
|
(3)
|
Whether economies of scale are recognized by the Fund;
|
|
|
(4)
|
The costs and profitability of the Fund to the Advisor and the Sub-Advisor;
|
|
|
(5)
|
The performance of the Fund; and
|
|
|
(6)
|
Any benefits to the Advisor and the Sub-Advisor from serving as an investment advisor to the Fund (other than the advisory and sub-advisory fees).
|
The material considerations and determinations of the Trustees, including the Independent Trustees, were as follows:
|
(1)
|
The Trustees considered the services identified below that are provided by the Advisor. Based on this review, the Trustees concluded that the Advisor provides high-quality services to the Fund
and noted that their overall confidence in the Advisor was high. The Trustees also concluded that they were satisfied with the nature, extent, and quality of the advisory services provided to the Fund by the Advisor and
that the nature and extent of the services provided by the Advisor were appropriate to assure that the Fund’s operations are conducted in compliance with applicable laws, rules, and regulations.
|
|
(a)
|
The Advisor oversees the Sub-Advisor for the Fund, and the Sub-Advisor acts as the portfolio manager for the Fund.
|
||
|
(b)
|
The Advisor performs a daily reconciliation of portfolio positions and cash for the Fund.
|
||
|
(c)
|
The Advisor monitors the liquidity of each Fund.
|
||
|
(d)
|
The Advisor monitors the Fund’s compliance with its investment objectives and restrictions.
|
||
|
(e)
|
The Advisor monitors compliance with federal securities laws, maintains a compliance program (including a code of ethics), conducts ongoing reviews of the compliance programs of the Sub-Advisor
and the Fund’s other service providers, as feasible, conducts on-site visits to the Sub-Advisor and the Fund’s other service providers, monitors incidents of abusive trading practices, reviews Fund expense accruals,
payments, and fixed expense ratios, evaluates insurance providers for fidelity bond, D&O/E&O insurance, and cybersecurity insurance coverage, manages regulatory examination compliance and responses, conducts
employee compliance training, reviews reports provided by service providers, and maintains books and records.
|
|
HENNESSY FUNDS
|
1-800-966-4354
|
29
|
(f)
|
The Advisor oversees the selection and continued employment of the Sub-Advisor, reviews the Fund’s investment performance, and monitors the Sub-Advisor’s adherence to the Fund’s investment
objectives, policies, and restrictions.
|
||
|
(g)
|
The Advisor oversees service providers that provide accounting, administration, distribution, transfer agency, custodial, sales, marketing, public relations, audit, information technology, and
legal services to the Fund.
|
||
|
(h)
|
The Advisor maintains in-house marketing and distribution departments on behalf of the Fund.
|
||
|
(i)
|
The Advisor is actively involved with preparing regulatory filings for the Fund, including writing and annually updating the Fund’s prospectus and related documents.
|
||
|
(j)
|
For each annual report of the Fund, the Advisor reviews the written summary prepared by the Sub-Advisor of the Fund’s performance during the most recent 12-month period.
|
||
|
(k)
|
The Advisor oversees distribution of the Fund through third-party broker/dealers and independent financial institutions such as Charles Schwab, Inc., Fidelity, TD Ameritrade, and Pershing. The
Advisor participates in “no transaction fee” (“NTF”) programs with these companies on behalf of the Fund, which allow customers to purchase the Fund through third-party distribution channels without paying a transaction
fee. The Advisor compensates, in part, a number of these third-party providers of NTF programs out of its own revenues.
|
||
|
(l)
|
The Advisor pays the incentive compensation of the Fund’s compliance officers and employs other staff, such as legal, marketing, national accounts, distribution, sales, administrative, and
trading oversight personnel, as well as management executives.
|
||
|
(m)
|
The Advisor provides a quarterly compliance certification to the Board.
|
||
|
(n)
|
The Advisor prepares or reviews all Board materials, frequently presents to the Board and leads Board discussions, prepares or reviews all meeting minutes, and arranges for Board training and
education.
|
|
(2)
|
The Trustees considered the services identified below that are provided by the Sub-Advisor:
|
|
(a)
|
The Sub-Advisor acts as the portfolio manager for the Fund. In this capacity, the Sub-Advisor does the following:
|
|
(i)
|
manages the composition of the Fund’s portfolio, including the purchase, retention, and disposition of portfolio securities in accordance with the Fund’s investment objectives, policies, and
restrictions;
|
|||
|
(ii)
|
seeks best execution for the Fund’s portfolio; and
|
|||
|
(iii)
|
manages proxy voting for the Fund.
|
|
(b)
|
The Sub-Advisor ensures that its compliance program includes policies and procedures relevant to the Fund and the Sub-Advisor’s duties as a portfolio manager to the Fund.
|
||
|
(c)
|
For each annual report of the Fund, the Sub-Advisor prepares a written summary of the Fund’s performance during the most recent 12-month period.
|
|
HENNESSYFUNDS.COM
|
30
|
BOARD APPROVAL OF INVESTMENT ADVISORY AGREEMENTS
|
|
(d)
|
The Sub-Advisor provides a quarterly compliance certification to the Board regarding trading and allocation practices, supervisory matters, the Sub-Advisor’s compliance program (including its
code of ethics), compliance with the Fund’s policies, and general firm updates.
|
|
(3)
|
The Trustees considered the distinction between the services performed by the Advisor and the Sub-Advisor. The Trustees noted that the management of the Fund, including the oversight of the
Sub-Advisor, involves more comprehensive and substantive duties than the duties of the Sub-Advisor. Specifically, the Trustees considered the lists of services identified above and concluded that the services performed
by the Advisor for the Fund require a higher level of service and oversight than the services performed by the Sub-Advisor. Based on this determination, the Trustees concluded that the differential in advisory fees
between the Advisor and the Sub-Advisor is reasonable.
|
|
|
(4)
|
The Trustees compared the performance of the Fund to benchmark indices over various periods and also noted that the Trustees review and discuss reports comparing the investment performance of
the Fund to various indices at each quarterly Board meeting. Based on such information, the Trustees determined that the Advisor and the Sub-Advisor manage the Fund in a manner materially consistent with its stated
investment objective and style. The Trustees concluded that the performance of the Fund over various periods warranted continuation of the advisory and sub-advisory agreements.
|
|
|
(5)
|
The Trustees reviewed the advisory fees and overall expense ratios of the Fund compared to other funds similar in asset size and investment objective to the Fund using data from Morningstar. As
part of the discussion with management, the Trustees ensured that they understood and were comfortable with the criteria used to determine the mutual funds included in the Morningstar categories for purposes of the
materials considered at the meeting. The Trustees determined that the advisory fee and overall expense ratio of the Fund falls within the range of the advisory fees and overall expense ratios of other comparable funds
and concluded that they are reasonable and warranted continuation of the advisory and sub-advisory agreements.
|
|
|
(6)
|
The Trustees also considered whether the Advisor was realizing economies of scale that it should share with the Fund’s shareholders. The Trustees noted that the assets of the Fund had remained
relatively flat over the prior year. In addition, the Trustees noted that many of the expenses incurred to manage the Fund are asset-based fees, so the Advisor does not realize material economies of scale relating to
those expenses as the assets of the Fund increase. For example, mutual fund platform fees increase as the Fund’s assets grow. The Trustees also considered the Advisor’s efforts to contain expenses through actions such as
renegotiating service contracts, the Advisor’s significant marketing efforts to promote the Funds, the Advisor’s investments in personnel to manage the Funds, and the Advisor’s agreement to waive fees or lower its
management fees in certain circumstances. The Trustees noted that it did not appear that the Advisor was realizing economies of scale at current asset levels and concluded that it would continue to monitor economies of
scale in the future as circumstances changed.
|
|
HENNESSY FUNDS
|
1-800-966-4354
|
31
|
(7)
|
The Trustees considered the profitability of the Advisor and the Sub-Advisor, including the impact of mutual fund platform fees on the Advisor’s profitability, and also considered the resources
and revenues that the Advisor has put into managing and distributing the Fund. The Trustees then concluded that the profits of the Advisor and the Sub-Advisor are reasonable and not excessive when compared to
profitability guidelines set forth in relevant court cases.
|
|
|
(8)
|
The Trustees considered the high level of professionalism and knowledge of the Advisor’s employees, along with a very low level of turnover, and concluded that this was beneficial to the Fund
and its shareholders.
|
|
|
(9)
|
The Trustees considered any benefits to the Advisor and the Sub-Advisor from serving as an advisor to the Fund (other than the advisory and sub-advisory fees). The Trustees noted that the
Advisor and the Sub-Advisor may derive ancillary benefits from, by way of example, their association with the Fund in the form of proprietary and third-party research products and services received from broker-dealers
that execute portfolio trades for the Fund. The Trustees determined that any such products and services have been used for legitimate purposes relating to the Fund by providing assistance in the investment
decision-making process. The Trustees concluded that any additional benefits realized by the Advisor and the Sub-Advisor from their relationship with the Fund were reasonable, which was based on, among other things, the
Trustees’ findings that (i) the research, analytical, statistical, and other information and services provided by brokers are merely supplemental to the Advisor’s and the Sub-Advisor’s own efforts in the performance of
their duties under the advisory and sub-advisory agreements and (ii) although the Sub-Advisor could derive benefits from the conversion of Fund shareholders into separate account clients, the Fund also could benefit from
potential institutional shareholders who might choose to invest in the Fund.
|
After reviewing the materials and information provided at the meeting, as well as other information regularly provided at the
Board’s quarterly meetings throughout the year regarding the quality of services provided by the Advisor and the Sub-Advisor, the performance of the Fund, expense information, brokerage commissions information, the adequacy and
efficacy of the Advisor’s and the Sub-Advisor’s written policies and procedures, other regulatory compliance issues, trading information and related matters, and other factors that the Trustees deemed relevant, the Trustees,
including the Independent Trustees, approved the continuation of the advisory and sub-advisory agreements.
|
HENNESSYFUNDS.COM
|
32
|
BOARD APPROVAL OF INVESTMENT ADVISORY AGREEMENTS
|
(This Page Intentionally Left Blank.)
For information, questions, or assistance, please call
The Hennessy Funds
1-800-966-4354 or 1-415-899-1555
INVESTMENT ADVISOR
Hennessy Advisors, Inc.
7250 Redwood Boulevard, Suite 200
Novato, California 94945
ADMINISTRATOR,
TRANSFER AGENT,
DIVIDEND PAYING AGENT, &
SHAREHOLDER SERVICING AGENT
U.S. Bancorp Fund Services, LLC
d/b/a U.S. Bank Global Fund Services
P.O. Box 701
Milwaukee, Wisconsin 53201-0701
CUSTODIAN
U.S. Bank N.A.
Custody Operations
1555 North River Center Drive, Suite 302
Milwaukee, Wisconsin 53212
TRUSTEES
Neil J. Hennessy
Robert T. Doyle
J. Dennis DeSousa
Gerald P. Richardson
COUNSEL
Foley & Lardner LLP
777 East Wisconsin Avenue
Milwaukee, Wisconsin 53202-5306
INDEPENDENT REGISTERED
PUBLIC ACCOUNTING FIRM
Tait, Weller & Baker LLP
Two Liberty Place
50 South 16th Street, Suite 2900
Philadelphia, Pennsylvania 19102-2529
DISTRIBUTOR
Quasar Distributors, LLC
111 East Kilbourn Avenue, Suite 2200
Milwaukee, Wisconsin 53202
www.hennessyfunds.com | 1-800-966-4354
This report has been prepared for shareholders and may be distributed to
others only if preceded or accompanied by a current prospectus.
SEMI-ANNUAL REPORT
APRIL 30, 2020

HENNESSY JAPAN SMALL CAP FUND
Investor Class HJPSX
Institutional Class HJSIX
IMPORTANT NOTICE REGARDING ELECTRONIC DELIVERY OF SHAREHOLDER REPORTS
Beginning on January 1, 2021, as permitted by regulations adopted by the Securities and Exchange Commission, paper copies of the annual and
semi-annual reports will no longer be sent by mail unless you specifically request paper copies from the Hennessy Funds or from your financial intermediary. Instead, the reports will be made available on a website,
and you will be notified by mail each time a report is posted and provided with a website link to access the report.
If you have already elected to receive shareholder reports electronically, you will not be affected by this change and you need not take any action. You may elect to receive shareholder reports and other communications from the Hennessy Funds electronically by visiting www.hennessyfunds.com/account or by calling U.S. Bank Global Fund Services at 1-800-261-6950.
If you own shares in a Fund through a financial intermediary, please contact your financial intermediary to make this election.
You may elect to receive paper copies of all future reports free of charge by calling U.S. Bank Global Fund Services at 1-800-261-6950 or, if you
own your shares through a financial intermediary, by contacting your financial intermediary. Your election to receive paper copies of reports will apply to all Funds in the Hennessy Funds family.
hennessyfunds.com | 1-800-966-4354
(This Page Intentionally Left Blank.)
Contents
|
Letter to Shareholders
|
2
|
|
Performance Overview
|
4
|
|
Financial Statements
|
|
|
Schedule of Investments
|
5
|
|
Statement of Assets and Liabilities
|
10
|
|
Statement of Operations
|
11
|
|
Statements of Changes in Net Assets
|
13
|
|
Financial Highlights
|
14
|
|
Notes to the Financial Statements
|
18
|
|
Expense Example
|
25
|
|
Proxy Voting Policy and Proxy Voting Records
|
27
|
|
Availability of Quarterly Portfolio Schedule
|
27
|
|
Federal Tax Distribution Information
|
27
|
|
Important Notice Regarding Delivery of Shareholder Documents
|
27
|
|
Electronic Delivery
|
28
|
|
Board Approval of Investment Advisory Agreements
|
29
|
|
HENNESSY FUNDS
|
1-800-966-4354
|
May 2020
Dear Hennessy Funds Shareholder:
Over the six months ended April 30, 2020, the Japanese stock market lost 9.96% in U.S. dollar terms as measured by the Tokyo Stock Price Index (TOPIX). A variety of geopolitical developments
continued to affect Japanese stocks from November 2019 to January 2020, including the trade dispute between the United States and China, a series of protests in Hong Kong, and the standoff between the United States and Iran.
By the end of January, growing concerns about the global spread of the novel coronavirus (COVID-19) and the expectation of a severe negative impact on the economy caused the Japanese stock market to begin to fall sharply. The
spread of COVID-19, not only in China and Japan but also Europe and the United States, accelerated the decline in stock prices worldwide. While monetary easing and fiscal policy changes in various countries led to initial
expectations of an early economic recovery, this rebound proved temporary because there was no sign that the virus, and its negative effects on the world economy, were subsiding at the time of this writing.
The ultimate economic impact of the COVID-19 pandemic remains uncertain. To date in Japan, the number of confirmed infections and the mortality rate remain fairly low relative to
other developed countries on a population-adjusted basis, perhaps thanks to Japan’s “mask-wearing” culture. Japan declared a state of emergency on April 7, 2020, later than many other affected countries, and did not implement
stringent lockdowns. As in other parts of the world, Japan is experiencing severe contraction in economic activity, and it is too early to assess the overall long-term impact of COVID-19 in Japan.
Japan swiftly put together an approximately $1 trillion economic stimulus package, which is approximately 20% of Japan’s GDP and is double the scale of the stimulus package
launched amid the 2008 financial crisis. As a percent of GDP, Japan’s COVID-19 stimulus package is larger than the United States’ stimulus package (11% of GDP) and Germany’s stimulus package (5% of GDP). On the monetary policy
side, the Bank of Japan (BOJ) has pledged to boost purchases of assets including government bonds, commercial paper, corporate bonds, and ETFs. For example, the BOJ said it would aggressively buy ETFs at an annual rate of JPY
12 trillion (equivalent to approximately $112 billion), two times the amount it previously had pledged to buy. While prior to the COVID-19 pandemic we had argued that the BOJ’s quantitative easing had largely done its part,
with around $5 trillion worth of monetary base already in the financial system, and that the government should take the lead by pushing through structural reforms going forward, we believe that economic rescue plans should be
prioritized above all else in times of stress like today.
Japan has a reform-minded, pro-growth government led by Prime Minister Abe and a pro-business, pro-inflation central bank led by the BOJ Governor Kuroda. We are confident that this
favorable combination will provide a strong basis for Japan’s economic recovery. Assuming full recovery of earnings over the next 12 to 24 months, we believe current valuations of Japanese stocks are very attractive. Moreover,
we believe that the stock market has already priced in the impact of the postponement of the 2020 Tokyo Olympics. Therefore, we believe that the sharp recent decline in the market should provide an attractive entry point for
investors keen to gain long-term exposure to Japan.
|
HENNESSYFUNDS.COM
|
2
|
LETTER TO SHAREHOLDERS
|
We remain optimistic about the long-term prospects for Japan and its stock market. Thank you for your continued confidence and investment in the Hennessy Japan Funds.
Sincerely,
|
|
|
Tadahiro Fujimura
|
Masakazu Takeda
|
|
Portfolio Manager,
|
Portfolio Manager,
|
|
Hennessy Japan Small Cap Fund;
|
Hennessy Japan Fund;
|
|
Chief Investment Officer
|
Fund Manager
|
|
SPARX Asset Management Co., Ltd.
|
SPARX Asset Management Co., Ltd.
|
SPARX Asset Management Co., Ltd., located in Tokyo, Japan, is the sub-advisor to the Hennessy Japan Fund and the Hennessy Japan Small Cap Fund.
Past performance does not guarantee future results.
Mutual fund investing involves risk. Principal loss is possible.
Opinions expressed are those of Tadahiro Fujimura and Masakazu Takeda and are subject to change, are not guaranteed, and should not be considered investment advice.
The Tokyo Stock Price Index (TOPIX) is a capitalization-weighted index of all the companies listed on the First Section of the Tokyo Stock Exchange. One cannot invest directly in an index.
|
HENNESSY FUNDS
|
1-800-966-4354
|
3
Performance Overview (Unaudited)
AVERAGE ANNUAL TOTAL RETURN FOR PERIODS ENDED APRIL 30, 2020
|
Six
|
One
|
Five
|
Ten
|
|
|
Months(1)
|
Year
|
Years
|
Years
|
|
|
Hennessy Japan Small Cap Fund –
|
||||
|
Investor Class (HJPSX)
|
-13.34%
|
-7.78%
|
7.80%
|
10.21%
|
|
Hennessy Japan Small Cap Fund –
|
||||
|
Institutional Class (HJSIX)(2)
|
-13.15%
|
-7.46%
|
8.17%
|
10.40%
|
|
Russell/Nomura
|
||||
|
Small CapTM Index
|
-12.14%
|
-6.67%
|
4.43%
|
6.55%
|
|
Tokyo Price Index (TOPIX)
|
-9.96%
|
-3.11%
|
2.87%
|
4.96%
|
Expense ratios: 1.52% (Investor Class); 1.12% (Institutional Class)
|
(1)
|
Periods of less than one year are not annualized.
|
|
(2)
|
The inception date of Institutional Class shares is June 15, 2015. Performance shown prior to the inception of Institutional Class shares reflects the performance of Investor Class shares and
includes expenses that are not applicable to, and are higher than, those of Institutional Class shares.
|
_______________
Performance data quoted represents past performance; past performance does not guarantee future results. The investment return and principal value of an investment will fluctuate
so that an investor’s shares, when redeemed, may be worth more or less than their original cost. The performance table does not reflect the deduction of taxes that a shareholder would pay on Fund distributions or the
redemption of Fund shares. Current performance of the Fund may be lower or higher than the performance quoted. Performance data current to the most recent month end may be obtained by visiting www.hennessyfunds.com.
The Russell/Nomura Small Cap™ Index contains the bottom 15% of the Russell/Nomura Total Market™ Index based on market capitalization. The Russell/Nomura Total Market™
Index contains the top 98% of all stocks listed on Japan’s stock exchanges and registered on Japan’s over-the-counter market based on market capitalization. The Tokyo Price Index (TOPIX) is a market capitalization-weighted
index of all the companies listed on the First Section of the Tokyo Stock Exchange. One cannot invest directly in an index. These indices are used herein for comparative purposes in accordance with SEC regulations.
Frank Russell Company (“Russell”) is the source and owner of the trademarks, service marks, and copyrights related to the Russell Indexes. Russell® is a trademark of Russell. Neither Russell nor its licensors accept any liability for any errors or omissions in the Russell Indexes or Russell ratings or underlying data and no party may rely on
any Russell Indexes or Russell ratings or underlying data contained in this communication. No further distribution of Russell data is permitted without Russell’s express written consent. Russell does not promote, sponsor, or
endorse the content of this communication.
The expense ratios presented are from the most recent prospectus. The expense ratios for the current reporting period are available in the Financial Highlights section of this report.
|
HENNESSYFUNDS.COM
|
4
|
PERFORMANCE OVERVIEW/SCHEDULE OF INVESTMENTS
|
Financial Statements
|
Schedule of Investments as of April
30, 2020 (Unaudited)
|
HENNESSY JAPAN SMALL CAP FUND
(% of Net Assets)

|
TOP TEN HOLDINGS (EXCLUDING MONEY MARKET FUNDS)
|
% NET ASSETS
|
|
Cosmos Pharmaceutical Corp.
|
2.45%
|
|
Kobe Bussan Co., Ltd.
|
2.45%
|
|
Nihon Unisys Ltd.
|
2.37%
|
|
Tocalo Co., Ltd.
|
2.28%
|
|
Lifenet Insurance Co.
|
2.25%
|
|
Benefit One, Inc.
|
2.24%
|
|
Elecom Co., Ltd.
|
2.24%
|
|
Nippon Koei Co., Ltd.
|
2.22%
|
|
Nihon Flush Co., Ltd.
|
2.15%
|
|
Towa Corp.
|
2.15%
|
Note: For presentation purposes, the Fund has grouped some of the industry categories. For purposes of categorizing securities for compliance with Section 8(b)(1) of the Investment Company Act of
1940, as amended, the Fund uses more specific industry classifications.
The Global Industry Classification Standard (GICS®) was developed by and is the exclusive property and a service mark
of MSCI, Inc. and Standard & Poor’s Financial Services LLC. It has been licensed for use by the Hennessy Funds.
|
HENNESSY FUNDS
|
1-800-966-4354
|
5
|
COMMON STOCKS – 97.60%
|
Number
|
% of
|
||||||||||
|
|
of Shares
|
Value
|
Net Assets
|
|||||||||
|
Communication Services – 2.97%
|
||||||||||||
|
CyberAgent, Inc.
|
30,000
|
$
|
1,259,580
|
1.52
|
%
|
|||||||
|
Kakaku.com, Inc.
|
59,200
|
1,207,996
|
1.45
|
%
|
||||||||
|
|
2,467,576
|
2.97
|
%
|
|||||||||
|
Consumer Discretionary – 10.33%
|
||||||||||||
|
Kushikatsu Tanaka Holdings Co.
|
33,800
|
424,608
|
0.51
|
%
|
||||||||
|
Matsuoka Corp.
|
84,600
|
1,453,827
|
1.75
|
%
|
||||||||
|
Musashi Seimitsu Industry Co., Ltd.
|
115,800
|
937,577
|
1.13
|
%
|
||||||||
|
Nojima Corp.
|
74,700
|
1,294,776
|
1.56
|
%
|
||||||||
|
Pacific Industrial Co., Ltd.
|
183,300
|
1,553,302
|
1.87
|
%
|
||||||||
|
Saizeriya Co., Ltd.
|
83,700
|
1,659,182
|
2.00
|
%
|
||||||||
|
Seiren Co., Ltd.
|
106,400
|
1,259,774
|
1.51
|
%
|
||||||||
|
|
8,583,046
|
10.33
|
%
|
|||||||||
|
Consumer Staples – 7.81%
|
||||||||||||
|
Cosmos Pharmaceutical Corp.
|
7,600
|
2,034,441
|
2.45
|
%
|
||||||||
|
Kobe Bussan Co., Ltd.
|
42,200
|
2,038,639
|
2.45
|
%
|
||||||||
|
Nishimoto Co., Ltd.
|
69,000
|
1,159,264
|
1.39
|
%
|
||||||||
|
Starzen Co., Ltd.
|
30,900
|
1,261,441
|
1.52
|
%
|
||||||||
|
|
6,493,785
|
7.81
|
%
|
|||||||||
|
Energy – 1.57%
|
||||||||||||
|
Iwatani Corp.
|
38,100
|
1,301,580
|
1.57
|
%
|
||||||||
|
Financials – 3.12%
|
||||||||||||
|
AEON Financial Service Co., Ltd.
|
70,000
|
727,948
|
0.87
|
%
|
||||||||
|
Lifenet Insurance Co. (a)
|
285,300
|
1,867,263
|
2.25
|
%
|
||||||||
|
|
2,595,211
|
3.12
|
%
|
|||||||||
|
Health Care – 2.69%
|
||||||||||||
|
CYBERDYNE, Inc. (a)
|
138,100
|
548,206
|
0.66
|
%
|
||||||||
|
Ship Healthcare Holdings, Inc.
|
37,300
|
1,686,961
|
2.03
|
%
|
||||||||
|
|
2,235,167
|
2.69
|
%
|
|||||||||
|
Industrials – 38.87%
|
||||||||||||
|
Bell System24 Holdings, Inc.
|
137,000
|
1,621,367
|
1.95
|
%
|
||||||||
|
Benefit One, Inc.
|
105,800
|
1,857,419
|
2.24
|
%
|
||||||||
|
Daihen Corp.
|
60,900
|
1,733,936
|
2.09
|
%
|
||||||||
|
Fugi Corp.
|
83,600
|
1,399,740
|
1.68
|
%
|
||||||||
|
Hanwa Co., Ltd.
|
96,900
|
1,539,360
|
1.85
|
%
|
||||||||
The accompanying notes are an integral part of these financial statements.
|
HENNESSYFUNDS.COM
|
6
|
SCHEDULE OF INVESTMENTS
|
|
COMMON STOCKS
|
Number
|
% of
|
||||||||||
|
|
of Shares
|
Value
|
Net Assets
|
|||||||||
|
Industrials (Continued)
|
||||||||||||
|
Hito Communications Holdings, Inc.
|
143,100
|
$
|
1,291,035
|
1.55
|
%
|
|||||||
|
Juki Corp.
|
125,800
|
689,737
|
0.83
|
%
|
||||||||
|
Kawada Technologies, Inc.
|
33,900
|
1,582,101
|
1.90
|
%
|
||||||||
|
Kito Corp.
|
168,300
|
1,704,046
|
2.05
|
%
|
||||||||
|
METAWATER Co., Ltd.
|
43,000
|
1,710,039
|
2.06
|
%
|
||||||||
|
MIRAIT Holdings Corp.
|
137,100
|
1,771,028
|
2.13
|
%
|
||||||||
|
Mitsubishi Logisnext Co., Ltd.
|
135,600
|
1,261,469
|
1.52
|
%
|
||||||||
|
Morita Holdings Corp.
|
38,900
|
597,776
|
0.72
|
%
|
||||||||
|
Nihon Flush Co., Ltd.
|
159,600
|
1,789,370
|
2.15
|
%
|
||||||||
|
Nippon Koei Co., Ltd.
|
64,500
|
1,846,309
|
2.22
|
%
|
||||||||
|
Okamura Corp.
|
163,600
|
1,182,352
|
1.42
|
%
|
||||||||
|
Sato Holdings Corp.
|
83,100
|
1,708,851
|
2.06
|
%
|
||||||||
|
SBS Holdings, Inc.
|
103,800
|
1,755,245
|
2.11
|
%
|
||||||||
|
Senko Group Holdings Co., Ltd.
|
218,100
|
1,777,483
|
2.14
|
%
|
||||||||
|
Takeei Corp.
|
214,500
|
1,599,405
|
1.92
|
%
|
||||||||
|
Tocalo Co., Ltd.
|
192,700
|
1,897,154
|
2.28
|
%
|
||||||||
|
|
32,315,222
|
38.87
|
%
|
|||||||||
|
Information Technology – 17.78%
|
||||||||||||
|
Digital Garage, Inc.
|
49,600
|
1,777,117
|
2.14
|
%
|
||||||||
|
Elecom Co., Ltd.
|
47,300
|
1,865,333
|
2.24
|
%
|
||||||||
|
Macnica Fuji Electronics Holdings, Inc.
|
119,800
|
1,630,765
|
1.96
|
%
|
||||||||
|
Mimaki Engineering Co., Ltd.
|
209,200
|
789,030
|
0.95
|
%
|
||||||||
|
Nihon Unisys Ltd.
|
68,200
|
1,972,405
|
2.37
|
%
|
||||||||
|
Nippon Signal Company, Ltd.
|
162,400
|
1,509,775
|
1.82
|
%
|
||||||||
|
Rorze Corp.
|
12,700
|
522,531
|
0.63
|
%
|
||||||||
|
Sun Corp.
|
82,000
|
1,194,732
|
1.44
|
%
|
||||||||
|
Towa Corp.
|
207,200
|
1,789,949
|
2.15
|
%
|
||||||||
|
Transcosmos, Inc.
|
86,800
|
1,731,975
|
2.08
|
%
|
||||||||
|
|
14,783,612
|
17.78
|
%
|
|||||||||
|
Materials – 7.79%
|
||||||||||||
|
Asia Pile Holdings Co.
|
424,600
|
1,647,421
|
1.98
|
%
|
||||||||
|
Kanto Denka Kogyo Co., Ltd.
|
55,700
|
442,803
|
0.53
|
%
|
||||||||
|
Kuriyama Holdings Corp.
|
159,800
|
715,169
|
0.86
|
%
|
||||||||
|
Sanyo Chemical Industries Ltd.
|
32,600
|
1,284,274
|
1.55
|
%
|
||||||||
The accompanying notes are an integral part of these financial statements.
|
HENNESSY FUNDS
|
1-800-966-4354
|
7
|
COMMON STOCKS
|
Number
|
% of
|
||||||||||
|
|
of Shares
|
Value
|
Net Assets
|
|||||||||
|
Materials (Continued)
|
||||||||||||
|
Stella Chemifa Corp.
|
57,600
|
$
|
1,256,120
|
1.51
|
%
|
|||||||
|
Tokyo Ohka Kogyo Co., Ltd.
|
26,200
|
1,126,834
|
1.36
|
%
|
||||||||
|
|
6,472,621
|
7.79
|
%
|
|||||||||
|
Real Estate – 3.06%
|
||||||||||||
|
Star Mica Holdings Co., Ltd.
|
115,400
|
1,574,526
|
1.89
|
%
|
||||||||
|
Tosei Corp.
|
100,300
|
973,399
|
1.17
|
%
|
||||||||
|
|
2,547,925
|
3.06
|
%
|
|||||||||
|
Utilities – 1.61%
|
||||||||||||
|
EF-ON, Inc.
|
292,800
|
1,341,170
|
1.61
|
%
|
||||||||
|
|
||||||||||||
|
Total Common Stocks
|
||||||||||||
|
(Cost $85,234,828)
|
81,136,915
|
97.60
|
%
|
|||||||||
|
|
||||||||||||
|
SHORT-TERM INVESTMENTS – 0.99%
|
||||||||||||
|
Money Market Funds – 0.99%
|
||||||||||||
|
First American Government Obligations Fund,
|
||||||||||||
|
Institutional Class, 0.25% (b)
|
822,126
|
822,126
|
0.99
|
%
|
||||||||
|
|
||||||||||||
|
Total Short-Term Investments
|
||||||||||||
|
(Cost $822,126)
|
822,126
|
0.99
|
%
|
|||||||||
|
|
||||||||||||
|
Total Investments
|
||||||||||||
|
(Cost $86,056,954) – 98.59%
|
81,959,041
|
98.59
|
%
|
|||||||||
|
Other Assets in Excess of Liabilities – 1.41%
|
1,168,080
|
1.41
|
%
|
|||||||||
|
|
||||||||||||
|
TOTAL NET ASSETS – 100.00%
|
$
|
83,127,121
|
100.00
|
%
|
||||||||
Percentages are stated as a percent of net assets.
|
(a)
|
Non-income-producing security.
|
|
(b)
|
The rate listed is the fund’s seven-day yield as of April 30, 2020.
|
The accompanying notes are an integral part of these financial statements.
|
HENNESSYFUNDS.COM
|
8
|
SCHEDULE OF INVESTMENTS
|
Summary of Fair Value Exposure as of April 30, 2020
The following is a summary of the inputs used to value the Fund’s net assets as of April 30, 2020 (see Note 3 in the accompanying Notes to the Financial Statements):
|
Common Stocks
|
Level 1
|
Level 2
|
Level 3
|
Total
|
||||||||||||
|
Communication Services
|
$
|
—
|
$
|
2,467,576
|
$
|
—
|
$
|
2,467,576
|
||||||||
|
Consumer Discretionary
|
—
|
8,583,046
|
—
|
8,583,046
|
||||||||||||
|
Consumer Staples
|
—
|
6,493,785
|
—
|
6,493,785
|
||||||||||||
|
Energy
|
—
|
1,301,580
|
—
|
1,301,580
|
||||||||||||
|
Financials
|
—
|
2,595,211
|
—
|
2,595,211
|
||||||||||||
|
Health Care
|
—
|
2,235,167
|
—
|
2,235,167
|
||||||||||||
|
Industrials
|
—
|
32,315,222
|
—
|
32,315,222
|
||||||||||||
|
Information Technology
|
—
|
14,783,612
|
—
|
14,783,612
|
||||||||||||
|
Materials
|
—
|
6,472,621
|
—
|
6,472,621
|
||||||||||||
|
Real Estate
|
—
|
2,547,925
|
—
|
2,547,925
|
||||||||||||
|
Utilities
|
—
|
1,341,170
|
—
|
1,341,170
|
||||||||||||
|
Total Common Stocks
|
$
|
—
|
$
|
81,136,915
|
$
|
—
|
$
|
81,136,915
|
||||||||
|
Short-Term Investments
|
||||||||||||||||
|
Money Market Funds
|
$
|
822,126
|
$
|
—
|
$
|
—
|
$
|
822,126
|
||||||||
|
Total Short-Term Investments
|
$
|
822,126
|
$
|
—
|
$
|
—
|
$
|
822,126
|
||||||||
|
Total Investments
|
$
|
822,126
|
$
|
81,136,915
|
$
|
—
|
$
|
81,959,041
|
||||||||
The accompanying notes are an integral part of these financial statements.
|
HENNESSY FUNDS
|
1-800-966-4354
|
9
Financial Statements
|
Statement of Assets and Liabilities as of April 30, 2020 (Unaudited)
|
|
ASSETS:
|
||||
|
Investments in securities, at value (cost $86,056,954)
|
$
|
81,959,041
|
||
|
Dividends and interest receivable
|
886,738
|
|||
|
Receivable for fund shares sold
|
233,049
|
|||
|
Receivable for securities sold
|
367,628
|
|||
|
Prepaid expenses and other assets
|
20,003
|
|||
|
Total assets
|
83,466,459
|
|||
|
LIABILITIES:
|
||||
|
Payable for fund shares redeemed
|
218,302
|
|||
|
Payable to advisor
|
52,932
|
|||
|
Payable to administrator
|
14,157
|
|||
|
Payable to auditor
|
11,376
|
|||
|
Accrued distribution fees
|
7,052
|
|||
|
Accrued service fees
|
3,637
|
|||
|
Accrued trustees fees
|
5,741
|
|||
|
Accrued expenses and other payables
|
26,141
|
|||
|
Total liabilities
|
339,338
|
|||
|
NET ASSETS
|
$
|
83,127,121
|
||
|
NET ASSETS CONSISTS OF:
|
||||
|
Capital stock
|
$
|
91,598,530
|
||
|
Accumulated deficit
|
(8,471,409
|
)
|
||
|
Total net assets
|
$
|
83,127,121
|
||
|
NET ASSETS:
|
||||
|
Investor Class
|
||||
|
Shares authorized (no par value)
|
Unlimited
|
|||
|
Net assets applicable to outstanding shares
|
$
|
46,633,407
|
||
|
Shares issued and outstanding
|
3,533,092
|
|||
|
Net asset value, offering price, and redemption price per share
|
$
|
13.20
|
||
|
Institutional Class
|
||||
|
Shares authorized (no par value)
|
Unlimited
|
|||
|
Net assets applicable to outstanding shares
|
$
|
36,493,714
|
||
|
Shares issued and outstanding
|
2,797,027
|
|||
|
Net asset value, offering price, and redemption price per share
|
$
|
13.05
|
||
The accompanying notes are an integral part of these financial statements.
|
HENNESSYFUNDS.COM
|
10
|
STATEMENT OF ASSETS AND LIABILITIES/STATEMENT OF OPERATIONS
|
Financial Statements
|
Statement of Operations for the six months ended April 30, 2020 (Unaudited)
|
|
INVESTMENT INCOME:
|
||||
|
Dividend income(1)
|
$
|
1,091,157
|
||
|
Interest income
|
22,666
|
|||
|
Total investment income
|
1,113,823
|
|||
|
EXPENSES:
|
||||
|
Investment advisory fees (See Note 5)
|
448,150
|
|||
|
Sub-transfer agent expenses – Investor Class (See Note 5)
|
65,319
|
|||
|
Sub-transfer agent expenses – Institutional Class (See Note 5)
|
19,607
|
|||
|
Administration, accounting, custody, and transfer agent fees (See Note 5)
|
62,729
|
|||
|
Distribution fees – Investor Class (See Note 5)
|
43,554
|
|||
|
Service fees – Investor Class (See Note 5)
|
29,036
|
|||
|
Federal and state registration fees
|
22,486
|
|||
|
Compliance expense (See Note 5)
|
13,462
|
|||
|
Audit fees
|
11,375
|
|||
|
Reports to shareholders
|
10,100
|
|||
|
Trustees’ fees and expenses
|
8,832
|
|||
|
Interest expense (See Note 7)
|
3,076
|
|||
|
Legal fees
|
730
|
|||
|
Other expenses
|
8,205
|
|||
|
Total expenses
|
746,661
|
|||
|
NET INVESTMENT INCOME
|
$
|
367,162
|
||
|
REALIZED AND UNREALIZED GAINS (LOSSES):
|
||||
|
Net realized gain on investments
|
$
|
524,902
|
||
|
Net change in unrealized appreciation/depreciation on investments
|
(17,097,644
|
)
|
||
|
Net loss on investments
|
(16,572,742
|
)
|
||
|
NET DECREASE IN NET ASSETS RESULTING FROM OPERATIONS
|
$
|
(16,205,580
|
)
|
|
|
(1)
|
Net of foreign taxes withheld of $121,240.
|
The accompanying notes are an integral part of these financial statements.
|
HENNESSY FUNDS
|
1-800-966-4354
|
11
(This Page Intentionally Left Blank.)
|
HENNESSYFUNDS.COM
|
12
|
STATEMENTS OF CHANGES IN NET ASSETS
|
Financial Statements
|
Statements of Changes in Net Assets
|
|
Six Months Ended
|
||||||||
|
April 30, 2020
|
Year Ended
|
|||||||
|
(Unaudited)
|
October 31, 2019
|
|||||||
|
OPERATIONS:
|
||||||||
|
Net investment income
|
$
|
367,162
|
$
|
628,672
|
||||
|
Net realized gain (loss) on investments
|
524,902
|
(3,898,603
|
)
|
|||||
|
Net change in unrealized
|
||||||||
|
appreciation/depreciation on investments
|
(17,097,644
|
)
|
9,297,065
|
|||||
|
Net increase (decrease) in net assets
|
||||||||
|
resulting from operations
|
(16,205,580
|
)
|
6,027,134
|
|||||
|
DISTRIBUTIONS TO SHAREHOLDERS:
|
||||||||
|
Distributable earnings – Investor Class
|
(876,351
|
)
|
(3,091,719
|
)
|
||||
|
Distributable earnings – Institutional Class
|
(1,083,137
|
)
|
(3,196,949
|
)
|
||||
|
Total distributions
|
(1,959,488
|
)
|
(6,288,668
|
)
|
||||
|
CAPITAL SHARE TRANSACTIONS:
|
||||||||
|
Proceeds from shares subscribed – Investor Class
|
6,533,731
|
16,258,683
|
||||||
|
Proceeds from shares subscribed – Institutional Class
|
11,172,800
|
30,397,388
|
||||||
|
Dividends reinvested – Investor Class
|
843,742
|
3,007,874
|
||||||
|
Dividends reinvested – Institutional Class
|
990,567
|
2,892,147
|
||||||
|
Cost of shares redeemed – Investor Class
|
(17,839,944
|
)
|
(54,044,581
|
)
|
||||
|
Cost of shares redeemed – Institutional Class
|
(30,495,233
|
)
|
(67,515,691
|
)
|
||||
|
Net decrease in net assets derived
|
||||||||
|
from capital share transactions
|
(28,794,337
|
)
|
(69,004,180
|
)
|
||||
|
TOTAL DECREASE IN NET ASSETS
|
(46,959,405
|
)
|
(69,265,714
|
)
|
||||
|
NET ASSETS:
|
||||||||
|
Beginning of period
|
130,086,526
|
199,352,240
|
||||||
|
End of period
|
$
|
83,127,121
|
$
|
130,086,526
|
||||
|
CHANGES IN SHARES OUTSTANDING:
|
||||||||
|
Shares sold – Investor Class
|
448,491
|
1,129,349
|
||||||
|
Shares sold – Institutional Class
|
830,081
|
2,150,721
|
||||||
|
Shares issued to holders as reinvestment
|
||||||||
|
of dividends – Investor Class
|
52,999
|
211,079
|
||||||
|
Shares issued to holders as reinvestment
|
||||||||
|
of dividends – Institutional Class
|
63,013
|
206,255
|
||||||
|
Shares redeemed – Investor Class
|
(1,264,731
|
)
|
(3,779,544
|
)
|
||||
|
Shares redeemed – Institutional Class
|
(2,269,019
|
)
|
(4,821,215
|
)
|
||||
|
Net decrease in shares outstanding
|
(2,139,166
|
)
|
(4,903,355
|
)
|
||||
The accompanying notes are an integral part of these financial statements.
|
HENNESSY FUNDS
|
1-800-966-4354
|
13
Financial Statements
|
Financial Highlights
|
For an Investor Class share outstanding throughout each period
|
Six Months Ended
|
||||
|
April 30, 2020
|
||||
|
(Unaudited)
|
||||
|
PER SHARE DATA:
|
||||
|
Net asset value, beginning of period
|
$
|
15.43
|
||
|
Income from investment operations:
|
||||
|
Net investment income (loss)
|
0.04
|
(1)
|
||
|
Net realized and unrealized gains (losses) on investments
|
(2.06
|
)
|
||
|
Total from investment operations
|
(2.02
|
)
|
||
|
Less distributions:
|
||||
|
Dividends from net investment income
|
(0.21
|
)
|
||
|
Dividends from net realized gains
|
—
|
|||
|
Total distributions
|
(0.21
|
)
|
||
|
Net asset value, end of period
|
$
|
13.20
|
||
|
TOTAL RETURN
|
-13.34
|
%(2)
|
||
|
SUPPLEMENTAL DATA AND RATIOS:
|
||||
|
Net assets, end of period (millions)
|
$
|
46.63
|
||
|
Ratio of expenses to average net assets
|
1.53
|
%(3)
|
||
|
Ratio of net investment income (loss) to average net assets
|
0.55
|
%(3)
|
||
|
Portfolio turnover rate(4)
|
9
|
%(2)
|
||
|
(1)
|
Calculated using the average shares outstanding method.
|
|
(2)
|
Not annualized.
|
|
(3)
|
Annualized.
|
|
(4)
|
Calculated on the basis of the Fund as a whole.
|
The accompanying notes are an integral part of these financial statements.
|
HENNESSYFUNDS.COM
|
14
|
FINANCIAL HIGHLIGHTS — INVESTOR CLASS
|
|
Year Ended October 31,
|
||||||||||||||||||
|
2019
|
2018
|
2017
|
2016
|
2015
|
||||||||||||||
|
$
|
14.99
|
$
|
14.92
|
$
|
11.29
|
$
|
10.29
|
$
|
10.51
|
|||||||||
|
0.03
|
(1)
|
0.05
|
0.08
|
0.03
|
(0.02
|
)
|
||||||||||||
|
0.88
|
0.35
|
3.77
|
1.31
|
0.71
|
||||||||||||||
|
0.91
|
0.40
|
3.85
|
1.34
|
0.69
|
||||||||||||||
|
—
|
(0.05
|
)
|
(0.12
|
)
|
—
|
—
|
||||||||||||
|
(0.47
|
)
|
(0.28
|
)
|
(0.10
|
)
|
(0.34
|
)
|
(0.91
|
)
|
|||||||||
|
(0.47
|
)
|
(0.33
|
)
|
(0.22
|
)
|
(0.34
|
)
|
(0.91
|
)
|
|||||||||
|
$
|
15.43
|
$
|
14.99
|
$
|
14.92
|
$
|
11.29
|
$
|
10.29
|
|||||||||
|
6.30
|
%
|
2.64
|
%
|
34.82
|
%
|
13.44
|
%
|
7.37
|
%
|
|||||||||
|
$
|
66.30
|
$
|
100.93
|
$
|
69.86
|
$
|
26.23
|
$
|
22.68
|
|||||||||
|
1.52
|
%
|
1.46
|
%
|
1.60
|
%
|
1.91
|
%
|
2.12
|
%
|
|||||||||
|
0.23
|
%
|
0.21
|
%
|
0.26
|
%
|
0.25
|
%
|
(0.38
|
)%
|
|||||||||
|
21
|
%
|
35
|
%
|
41
|
%
|
22
|
%
|
75
|
%
|
|||||||||
The accompanying notes are an integral part of these financial statements.
|
HENNESSY FUNDS
|
1-800-966-4354
|
15
Financial Statements
|
Financial Highlights
|
For an Institutional Class share outstanding throughout each period
|
Six Months Ended
|
||||
|
April 30, 2020
|
||||
|
(Unaudited)
|
||||
|
PER SHARE DATA:
|
||||
|
Net asset value, beginning of period
|
$
|
15.28
|
||
|
Income from investment operations:
|
||||
|
Net investment income (loss)
|
0.06
|
(2)
|
||
|
Net realized and unrealized gains (losses) on investments
|
(2.02
|
)
|
||
|
Total from investment operations
|
(1.96
|
)
|
||
|
Less distributions:
|
||||
|
Dividends from net investment income
|
(0.27
|
)
|
||
|
Dividends from net realized gains
|
—
|
|||
|
Total distributions
|
(0.27
|
)
|
||
|
Net asset value, end of period
|
$
|
13.05
|
||
|
TOTAL RETURN
|
-13.15
|
%(3)
|
||
|
SUPPLEMENTAL DATA AND RATIOS:
|
||||
|
Net assets, end of period (millions)
|
$
|
36.49
|
||
|
Ratio of expenses to average net assets
|
1.12
|
%(4)
|
||
|
Ratio of net investment income (loss) to average net assets
|
0.77
|
%(4)
|
||
|
Portfolio turnover rate(5)
|
9
|
%(3)
|
||
|
(1)
|
Institutional Class shares commenced operations on June 15, 2015.
|
|
(2)
|
Calculated using the average shares outstanding method.
|
|
(3)
|
Not annualized.
|
|
(4)
|
Annualized.
|
|
(5)
|
Calculated on the basis of the Fund as a whole.
|
The accompanying notes are an integral part of these financial statements.
|
HENNESSYFUNDS.COM
|
16
|
FINANCIAL HIGHLIGHTS — INSTITUTIONAL CLASS
|
|
Period Ended
|
||||||||||||||||||
|
Year Ended October 31,
|
October 31,
|
|||||||||||||||||
|
2019
|
2018
|
2017
|
2016
|
2015(1)
|
||||||||||||||
|
$
|
14.83
|
$
|
14.72
|
$
|
11.33
|
$
|
10.30
|
$
|
10.89
|
|||||||||
|
0.09
|
(2)
|
0.11
|
0.05
|
0.06
|
(0.01
|
)
|
||||||||||||
|
0.86
|
0.36
|
3.78
|
1.31
|
(0.58
|
)
|
|||||||||||||
|
0.95
|
0.47
|
3.83
|
1.37
|
(0.59
|
)
|
|||||||||||||
|
(0.04
|
)
|
(0.08
|
)
|
(0.10
|
)
|
—
|
—
|
|||||||||||
|
(0.46
|
)
|
(0.28
|
)
|
(0.34
|
)
|
(0.34
|
)
|
—
|
||||||||||
|
(0.50
|
)
|
(0.36
|
)
|
(0.44
|
)
|
(0.34
|
)
|
—
|
||||||||||
|
$
|
15.28
|
$
|
14.83
|
$
|
14.72
|
$
|
11.33
|
$
|
10.30
|
|||||||||
|
6.73
|
%
|
3.12
|
%
|
35.17
|
%
|
13.73
|
%
|
-5.42
|
%(3)
|
|||||||||
|
$
|
63.78
|
$
|
98.42
|
$
|
28.71
|
$
|
3.42
|
$
|
2.65
|
|||||||||
|
1.12
|
%
|
1.04
|
%
|
1.19
|
%
|
1.63
|
%
|
1.86
|
%(4)
|
|||||||||
|
0.61
|
%
|
0.77
|
%
|
0.80
|
%
|
0.63
|
%
|
(1.04
|
)%(4)
|
|||||||||
|
21
|
%
|
35
|
%
|
41
|
%
|
22
|
%
|
75
|
%(3)
|
|||||||||
The accompanying notes are an integral part of these financial statements.
|
HENNESSY FUNDS
|
1-800-966-4354
|
17
Financial Statements
|
Notes to the Financial Statements April 30, 2020 (Unaudited)
|
1). ORGANIZATION
The Hennessy Japan Small Cap Fund (the “Fund”) is a series of Hennessy Funds Trust (the “Trust”), which was organized as a Delaware statutory trust on September 17, 1992. The Fund is an open-end
management investment company registered under the Investment Company Act of 1940, as amended. The investment objective of the Fund is long-term capital appreciation. The Fund is a diversified fund.
The Fund offers Investor Class and Institutional Class shares. Each class of shares differs principally in its respective 12b-1 distribution and service, shareholder servicing, and
sub-transfer agent expenses. There are no sales charges. Each class has identical rights to earnings, assets, and voting privileges, except for class-specific expenses and exclusive rights to vote on matters affecting only one
class.
As an investment company, the Fund follows the investment company accounting and reporting guidance of the Financial Accounting Standards Board (“FASB”) Accounting Standard
Codification Topic 946 “Financial Services—Investment Companies.”
2). SIGNIFICANT ACCOUNTING POLICIES
The following is a summary of significant accounting policies consistently followed by the Fund in the preparation of the financial statements. These policies conform to U.S. generally accepted
accounting principles (“GAAP”).
|
a).
|
Securities Valuation – All investments in securities are recorded at their estimated fair value, as described in Note 3.
|
|
b).
|
Federal Income Taxes – No provision for federal income taxes or excise taxes has been made because the Fund has elected to be taxed as a regulated investment company and intends to distribute
substantially all of its taxable income to its shareholders and otherwise comply with the provisions of the Internal Revenue Code of 1986, as amended, applicable to regulated investment companies. Net investment
income/loss and realized gains/losses for federal income tax purposes may differ from those reported in the financial statements because of temporary book and tax basis differences. Temporary differences are primarily
the result of the treatment of wash sales for tax reporting purposes. The Fund recognizes interest and penalties related to income tax benefits, if any, in the Statement of Operations as an income tax expense.
Distributions from net realized gains for book purposes may include short-term capital gains, which are included as ordinary income to shareholders for tax purposes. The Fund may utilize equalization accounting for tax
purposes and designate earnings and profits, including net realized gains distributed to shareholders on redemption of shares, as part of the dividends paid deduction for income tax purposes.
|
|
c).
|
Accounting for Uncertainty in Income Taxes – The Fund has accounting policies regarding recognition and measurement of tax positions taken or expected to be taken on a tax return. The tax
returns of the Fund for the prior three fiscal years are open for examination. The Fund has reviewed all open tax years in major jurisdictions and concluded that there is no impact on the Fund’s net assets and no tax
liability resulting from unrecognized tax benefits relating to uncertain income tax positions taken or expected to be taken on a tax return. The Fund’s major tax jurisdictions are U.S. federal and Delaware.
|
|
HENNESSYFUNDS.COM
|
18
|
NOTES TO THE FINANCIAL STATEMENTS
|
|
d).
|
Income and Expenses – Dividend income is recognized on the ex-dividend date or as soon as information is available to the Fund. Interest income, which includes the amortization of premium and
accretion of discount, is recognized on an accrual basis. Other non-cash dividends are recognized as investment income at the fair value of the property received. The Fund is charged for those expenses that are
directly attributable to its portfolio, such as advisory, administration, and certain shareholder service fees. Income, expenses (other than expenses attributable to a specific class), and realized and unrealized
gains/losses on investments are allocated to each class of shares based on such class’s net assets.
|
|
e).
|
Distributions to Shareholders – Dividends from net investment income for the Fund, if any, are declared and paid annually, usually in December. Distributions of net realized capital gains, if
any, are declared and paid annually, usually in December.
|
|
f).
|
Security Transactions – Investment and shareholder transactions are recorded on the trade date. The Fund determines the realized gain/loss from an investment transaction by comparing the
original cost of the security lot sold with the net sale proceeds. Discounts and premiums on securities purchased are accreted or amortized, respectively, over the life of each such security.
|
|
g).
|
Use of Estimates – The preparation of financial statements in conformity with GAAP requires management to make estimates and assumptions that affect the reported amounts of assets and
liabilities and disclosure of contingent assets and liabilities at the date of the financial statements and the reported change in net assets during the reporting period. Actual results could differ from those
estimates.
|
|
h).
|
Share Valuation – The net asset value (“NAV”) per share of the Fund is calculated by dividing (i) the total value of the securities held by the Fund, plus cash and other assets, minus all
liabilities (including estimated accrued expenses) by (ii) the total number of shares outstanding for the Fund, rounded to the nearest $0.01. The Fund’s shares will not be priced on days the New York Stock Exchange is
closed for trading. The offering and redemption price per share for the Fund is equal to the Fund’s NAV per share.
|
|
i).
|
Foreign Currency – Values of investments denominated in foreign currencies are converted into U.S. dollars using the spot market rate of exchange at the time of valuation. Purchases and sales
of investments and income are translated into U.S. dollars using the spot market rate of exchange prevailing on the respective dates of such transactions. The Fund does not isolate the portion of the results of
operations resulting from fluctuations in foreign exchange rates on investments from fluctuations resulting from changes in the market prices of securities held. Such fluctuations are included with the net realized and
unrealized gain/loss on investments. Foreign investments present additional risks due to currency fluctuations, economic and political factors, lower liquidity, government regulations, differences in accounting
standards, and other factors.
|
|
j).
|
REIT Equity Securities – The Fund may invest in the equity securities of real estate investment trusts (“REITs”). Distributions received from REITs may be classified as dividends, capital
gains, or return of capital. Investments in REITs may require the Fund to accrue and distribute income not yet received. To generate sufficient cash to make the requisite distributions, the Fund may be required to sell
securities in its portfolio (including when it is not advantageous to do so) that it otherwise would have continued to hold. At other times, investments in a REIT may result in the Fund’s receipt of cash in excess of
the REIT’s earnings. If the Fund distributes these amounts, these distributions could constitute a return of capital to Fund
|
|
HENNESSY FUNDS
|
1-800-966-4354
|
19
|
shareholders for U.S. federal income tax purposes. Dividends received by the Fund from a REIT generally will not constitute qualified dividend income and will not qualify for the
dividends-received deduction.
|
3). SECURITIES VALUATION
The Fund follows fair value accounting standards that establish an authoritative definition of fair value and set out a hierarchy for measuring fair value. These standards require additional
disclosures about the various inputs and valuation techniques used to develop the measurements of fair value and a discussion of changes in valuation techniques and related inputs during the period. These inputs are summarized
in the three broad levels listed below:
|
Level 1 –
|
Unadjusted, quoted prices in active markets for identical instruments that the Fund has the ability to access at the date of measurement.
|
|
|
Level 2 –
|
Other significant observable inputs (including, but not limited to, quoted prices in active markets for similar instruments, quoted prices in markets that are not active for identical or
similar instruments, and model-derived valuations in which all significant inputs and significant value drivers are observable in active markets, such as interest rates, prepayment speeds, credit risk curves, default
rates, and similar data).
|
|
|
Level 3 –
|
Significant unobservable inputs (including the Fund’s own assumptions about what market participants would use to price the asset or liability based on the best available information) when
observable inputs are unavailable.
|
The following is a description of the valuation techniques applied to the Fund’s major categories of assets and liabilities measured at fair value on a recurring basis:
|
Equity Securities – Equity securities, including common stocks, preferred stocks, foreign-issued common stocks, exchange-traded funds, closed-end
mutual funds, partnerships, rights, and real estate investment trusts, that are traded on a securities exchange for which a last-quoted sales price is readily available will generally be valued at the last sales price
as reported by the primary exchange on which the securities are listed. Securities listed on The NASDAQ Stock Market (“NASDAQ”) will generally be valued at the NASDAQ Official Closing Price, which may differ from the
last sales price reported. Securities traded on a securities exchange for which a last-quoted sales price is not readily available will generally be valued at the mean between the bid and ask prices. To the extent
these securities are actively traded and valuation adjustments are not applied, they are classified in Level 1 of the fair value hierarchy. Securities traded on foreign exchanges generally are not valued at the same
time the Fund calculates its NAV because most foreign markets close well before such time. The earlier close of most foreign markets gives rise to the possibility that significant events, including broad market moves,
may have occurred in the interim. In certain circumstances, it may be determined that a foreign security needs to be fair valued because it appears that the value of the security might have been materially affected by
events occurring after the close of the market in which the security is principally traded, but before the time the Fund calculates its NAV, such as by a development that affects an entire market or region (e.g., a
weather-related event) or a potentially global development (e.g., a terrorist attack that may be expected to have an effect on investor expectations worldwide).
|
|
|
Registered Investment Companies – Investments in open-end registered investment companies, commonly referred to as mutual funds, generally are priced
at the ending NAV provided by the applicable mutual fund’s service agent and will be classified in Level 1 of the fair value hierarchy.
|
|
HENNESSYFUNDS.COM
|
20
|
NOTES TO THE FINANCIAL STATEMENTS
|
|
Debt Securities – Debt securities, including corporate bonds, asset-backed securities, mortgage-backed securities, municipal bonds, U.S. Treasuries,
and U.S. government agency issues, are generally valued at market on the basis of valuations furnished by an independent pricing service that utilizes both dealer-supplied valuations and formula-based techniques. The
pricing service may consider recently executed transactions in securities of the issuer or comparable issuers, market price quotations (where observable), bond spreads, and fundamental data relating to the issuer. In
addition, the model may incorporate observable market data, such as reported sales of similar securities, broker quotes, yields, bids, offers, and reference data. Certain securities are valued primarily using dealer
quotations. These securities are generally classified in Level 2 of the fair value hierarchy.
|
|
|
Short-Term Securities – Short-term equity investments, including money market funds, are valued in the manner specified above. Short-term debt
investments with an original term to maturity of 60 days or less are valued at amortized cost, which approximates fair market value. If the original term to maturity of a short-term debt investment exceeded 60 days,
then the values as of the 61st day prior to maturity are amortized. Amortized cost is not used if its use would be inappropriate due to credit or other impairments of the issuer, in which case the security’s fair value
would be determined, as described below. Short-term securities are generally classified in Level 1 or Level 2 of the fair value hierarchy depending on the inputs used and market activity levels for specific securities.
|
The Board of Trustees of the Fund (the “Board”) has adopted fair value pricing procedures that are followed when a price for a security is not readily available or if a significant
event has occurred that indicates the closing price of a security no longer represents the true value of that security. Fair value pricing determinations are made in good faith in accordance with these procedures. There are
numerous criteria that will be given consideration in determining a fair value of a security, such as the trading volume of a security and markets, the values of other similar securities, and news events with direct bearing on
a security or markets. Fair value pricing results in an estimated price for a security that reflects the amount the Fund might reasonably expect to receive in a current sale. Depending on the relative significance of the
valuation inputs, these securities may be classified in either Level 2 or Level 3 of the fair value hierarchy.
The fair value of foreign securities may be determined with the assistance of a pricing service using correlations between the movement of prices of such securities and indices of
domestic securities and other appropriate indicators, such as closing market prices of relevant American Depositary Receipts or futures contracts. Using fair value pricing means that the Fund’s NAV reflects the affected
portfolio securities’ values as determined by the Board or its designee, pursuant to the fair value pricing procedures adopted by the Board, instead of being determined by the market. Using a fair value pricing methodology to
price a foreign security may result in a value that is different from such foreign security’s most recent closing price and from the value used by other investment companies to calculate their NAVs. Such securities are
generally classified in Level 2 of the fair value hierarchy. Because the Fund invests in foreign securities, the value of the Fund’s portfolio securities may change on days when you will not be able to purchase or redeem your
shares.
The Board has delegated day-to-day valuation matters to the Valuation and Liquidity Committee comprising representatives from Hennessy Advisors, Inc., the Fund’s investment advisor
(the “Advisor”). The function of the Valuation and Liquidity Committee is to value securities where current and reliable market quotations are not readily available. All actions taken by the Valuation and Liquidity Committee
are reviewed by the Board.
|
HENNESSY FUNDS
|
1-800-966-4354
|
21
The Fund has performed an analysis of all existing investments to determine the significance and character of all inputs to their fair value determinations. Various inputs are used
to determine the value of the Fund’s investments. The inputs or methodology used for valuing securities are not necessarily an indication of the risk associated with investing in those securities. Details related to the fair
value hierarchy of the Fund’s securities as of April 30, 2020, are included in the Schedule of Investments.
4). INVESTMENT TRANSACTIONS
Purchases and sales of investment securities (excluding government and short-term investments) for the Fund during the six months ended April 30, 2020, were $9,245,593 and $36,981,473, respectively.
There were no purchases or sales/maturities of long-term U.S. government securities for the Fund during the six months ended April 30, 2020.
The Fund is permitted to purchase or sell securities from or to another fund in the Hennessy Funds family of funds (collectively, the “Hennessy Funds”) under specified conditions
outlined in procedures adopted by the Board. The procedures have been designed to ensure that any purchase or sale of securities by the Fund from or to another Hennessy Fund complies with Rule 17a-7 of the Investment Company
Act of 1940, as amended. During the six months ended April 30, 2020, the Fund did not engage in purchases or sales of securities pursuant to Rule 17a-7 of the Investment Company Act of 1940, as amended.
5). INVESTMENT ADVISORY FEE AND OTHER TRANSACTIONS WITH AFFILIATES
The Advisor provides the Fund with investment advisory services under an Investment Advisory Agreement. The Advisor oversees the provision of investment advice and furnishes office space, facilities,
and most of the personnel needed by the Fund. As compensation for its services, the Advisor is entitled to a monthly fee from the Fund. The fee is based on the average daily net assets of the Fund at an annual rate of 0.80%.
The net investment advisory fees expensed by the Fund during the six months ended April 30, 2020, are included in the Statement of Operations.
The Advisor has delegated the day-to-day management of the Fund to a sub-advisor, SPARX Asset Management Co., Ltd. The Advisor pays the sub-advisory fees from its own assets, and
these fees are not an additional expense of the Fund. During the six months ended April 30, 2020, the Advisor (not the Fund) paid a sub-advisory fee at the average rate of 0.35% of the daily net assets of the Fund. Pursuant to
the sub-advisory agreement, the Advisor pays sub-advisory fees at the rate of 0.35% of the first $500 million of daily net assets, 0.40% of daily net assets between $500 million and $1 billion, and 0.42% of daily net assets
over $1 billion.
The Board has approved a Shareholder Servicing Agreement for Investor Class shares of the Fund, which was instituted to compensate the Advisor for the non-investment advisory
services it provides to the Fund. The Shareholder Servicing Agreement provides for a monthly fee paid to the Advisor at an annual rate of 0.10% of the average daily net assets of the Fund attributable to Investor Class shares.
The shareholder service fees expensed by the Fund during the six months ended April 30, 2020, are included in the Statement of Operations.
The Fund has adopted a plan pursuant to Rule 12b-1 under the Investment Company Act of 1940, as amended, that authorizes payments in connection with the distribution of the Fund’s
shares at an annual rate of up to 0.25% of the Fund’s average daily net assets attributable to Investor Class shares. Even though the authorized rate is up to 0.25%, the Fund is currently only using up to 0.15% of its average
daily net assets attributable to Investor Class shares for such purpose. Amounts paid under the plan may be spent on any activities or expenses primarily intended to result in the sale of shares,
|
HENNESSYFUNDS.COM
|
22
|
NOTES TO THE FINANCIAL STATEMENTS
|
including, but not limited to, advertising, shareholder account servicing, printing and mailing of prospectuses to other than current shareholders, printing and mailing of sales literature, and
compensation for sales and marketing activities or to financial institutions and others, such as dealers and distributors. The distribution fees expensed by the Fund during the six months ended April 30, 2020, are included in
the Statement of Operations.
The Fund has entered into agreements with various brokers, dealers, and financial intermediaries in connection with the sale of shares of the Fund. The agreements provide for
periodic payments of sub-transfer agent expenses by the Fund to the brokers, dealers, and financial intermediaries for providing certain shareholder maintenance services. These shareholder services include the pre-processing
and quality control of new accounts, shareholder correspondence, answering customer inquiries regarding account status, and facilitating shareholder telephone transactions. The sub-transfer agent fees expensed by the Fund
during the six months ended April 30, 2020, are included in the Statement of Operations.
U.S. Bancorp Fund Services, LLC, d/b/a U.S. Bank Global Fund Services (“Fund Services”) provides the Fund with administrative, accounting, and transfer agent services. As
administrator, Fund Services is responsible for activities such as (i) preparing various federal and state regulatory filings, reports, and returns for the Fund, (ii) preparing reports and materials to be supplied to the
Board, (iii) monitoring the activities of the Fund’s custodian, transfer agent, and accountants, and (iv) coordinating the preparation and payment of the Fund’s expenses and reviewing the Fund’s expense accruals. U.S. Bank
N.A., an affiliate of Fund Services, serves as the Fund’s custodian. The servicing agreements between the Trust and Fund Services and U.S. Bank N.A. contain a fee schedule that is inclusive of administrative, accounting,
custody, and transfer agent fees. The administrative, accounting, custody, and transfer agent fees expensed by the Fund during the six months ended April 30, 2020, are included in the Statement of Operations.
Quasar Distributors, LLC (“Quasar”) acts as the Fund’s principal underwriter in a continuous public offering of the Fund’s shares. Quasar was an affiliate of Fund Services and U.S.
Bank N.A. through March 30, 2020. Effective March 31, 2020, Foreside Financial Group, LLC (“Foreside”) acquired Quasar from Fund Services. As a result of the acquisition, Quasar became a wholly owned broker-dealer subsidiary
of Foreside and is no longer affiliated with Fund Services or U.S. Bank N.A. The Board approved a new Distribution Agreement to enable Quasar to continue serving as the Fund’s distributor.
The officers of the Fund are affiliated with the Advisor. With the exception of the Chief Compliance Officer and the Senior Compliance Officer, such officers receive no
compensation from the Fund for serving in their respective roles. The Fund, along with the other Hennessy Funds, makes reimbursement payments on an equal basis to the Advisor for a portion of the salary and benefits associated
with the office of the Chief Compliance Officer and for all of the salary and benefits associated with the office of the Senior Compliance Officer. The compliance fees expensed by the Fund during the six months ended April 30,
2020, are included in the Statement of Operations.
6). GUARANTEES AND INDEMNIFICATIONS
Under the Hennessy Funds’ organizational documents, their officers and trustees are indemnified by the Hennessy Funds against certain liabilities arising out of the performance of their duties to the
Hennessy Funds. Additionally, in the normal course of business, the Hennessy Funds enter into contracts with service providers that contain general indemnification clauses. The Fund’s maximum exposure under these arrangements
is unknown as this would involve future claims that may be made against the Fund that have not yet occurred. Currently, the Fund expects the risk of loss to be remote.
|
HENNESSY FUNDS
|
1-800-966-4354
|
23
7). LINE OF CREDIT
The Fund has an uncommitted line of credit with the other Hennessy Funds in the amount of the lesser of (i) $100,000,000 or (ii) 33.33% of each Hennessy Fund’s net assets, or 30% for the Hennessy Gas
Utility Fund and 10% for the Hennessy Balanced Fund, intended to provide short-term financing, if necessary, subject to certain restrictions, in connection with shareholder redemptions. The credit facility is with the Hennessy
Funds’ custodian bank, U.S. Bank N.A. Borrowings under this arrangement bear interest at the bank’s prime rate and are secured by all of the Fund’s assets (as to its own borrowings only). During the six months ended April 30,
2020, the Fund had an outstanding average daily balance and a weighted average interest rate of $131,275 and 4.63%, respectively. The interest expensed by the Fund during the six months ended April 30, 2020, is included in the
Statement of Operations. The maximum amount outstanding for the Fund during the period was $9,020,000. As of April 30, 2020, the Fund did not have any borrowings outstanding under the line of credit.
8). FEDERAL TAX INFORMATION
As of October 31, 2019, the Fund’s most recent fiscal year end, the components of accumulated earnings (losses) for income tax purposes were as follows:
|
Investments
|
|||||
|
Cost of investments for tax purposes
|
$
|
117,570,374
|
|||
|
Gross tax unrealized appreciation
|
$
|
22,229,518
|
|||
|
Gross tax unrealized depreciation
|
(11,332,904
|
)
|
|||
|
Net tax unrealized appreciation/(depreciation)
|
$
|
11,896,614
|
|||
|
Undistributed ordinary income
|
$
|
1,959,489
|
|||
|
Undistributed long-term capital gains
|
—
|
||||
|
Total distributable earnings
|
$
|
1,959,489
|
|||
|
Other accumulated gain/(loss)
|
$
|
(4,162,444
|
)
|
||
|
Total accumulated gain/(loss)
|
$
|
9,693,659
|
|||
The difference between book-basis unrealized appreciation/depreciation and tax-basis unrealized appreciation/depreciation (as shown above) is attributable primarily to wash sales
and investments in passive foreign investment companies.
As of October 31, 2019, the Fund had capital loss carryforwards as follows:
|
$4,162,444
|
Unlimited Short-Term
|
As of October 31, 2019, the Fund did not defer, on a tax basis, any late-year ordinary losses. Late-year ordinary losses are net ordinary losses incurred after December 31, 2018,
but within the taxable year, that are deemed to arise on the first day of the Fund’s next taxable year.
During fiscal year 2020 (year to date) and fiscal year 2019, the tax character of distributions paid by the Fund was as follows:
|
Six Months Ended
|
Year Ended
|
||||||||
|
April 30, 2020
|
October 31, 2019
|
||||||||
|
Ordinary income(1)
|
$
|
1,959,488
|
$
|
275,405
|
|||||
|
Long-term capital gain
|
—
|
6,013,263
|
|||||||
|
$
|
1,959,488
|
$
|
6,288,668
|
||||||
|
(1) Ordinary income includes short-term capital gain.
|
9). EVENTS SUBSEQUENT TO PERIOD END
Management has evaluated the Fund’s related events and transactions that occurred subsequent to April 30, 2020, through the date of issuance of the Fund’s financial statements. Management has
determined that there were no subsequent events requiring recognition or disclosure in the financial statements.
|
HENNESSYFUNDS.COM
|
24
|
NOTES TO THE FINANCIAL STATEMENTS/EXPENSE EXAMPLE
|
Expense Example (Unaudited)
April 30, 2020
As a shareholder of the Fund, you incur ongoing costs, including management fees, service fees, and other Fund expenses. This Example is intended to help you understand your ongoing costs (in
dollars) of investing in the Fund and to compare these costs with the ongoing costs of investing in other mutual funds. The Example is based on an investment of $1,000 invested at the beginning of the period and held for the
entire period from November 1, 2019, through April 30, 2020.
Actual Expenses
The first line of the table below under the “Investor Class” and “Institutional Class” headings provides information about actual account values and actual expenses. Although the Fund charges no
sales loads or transaction fees, you will be assessed fees for outgoing wire transfers, returned checks and stop payment orders at prevailing rates charged by U.S. Bank Global Fund Services, the Fund’s transfer agent. If you
request that a redemption be made by wire transfer, currently a $15 fee is charged by the Fund’s transfer agent. IRA accounts will be charged a $15 annual maintenance fee. The example below includes, but is not limited to,
management fees, shareholder servicing fees, accounting, custody, and transfer agent fees. However, the example below does not include portfolio trading commissions and related expenses. You may use the information in this
line, together with the amount you invested, to estimate the expenses that you paid over the period. Simply divide your account value by $1,000 (for example, an $8,600 account value divided by $1,000 = 8.6), then multiply the
result by the number in the first line of the table under the “Investor Class” or “Institutional Class” headings in the column entitled “Expenses Paid During Period” to estimate the expenses you paid on your account during
this period.
Hypothetical Example for Comparison Purposes
The second line of the table below under the “Investor Class” and “Institutional Class” headings provides information about hypothetical account values and hypothetical expenses based on the Fund’s
actual expense ratios and an assumed rate of return of 5% per year before expenses, which is not the Fund’s actual return. The hypothetical account values and expenses may not be used to estimate the actual ending account
balance or expenses you paid for the period. You may use this information to compare the ongoing costs of investing in the Fund and other funds. To do so, compare this 5% hypothetical example with the 5% hypothetical examples
that appear in the shareholder reports of the other funds. Please note that the expenses shown in the table are meant to highlight your ongoing costs only. Therefore, the second line of the table under the “Investor Class” and
“Institutional Class” headings is useful in comparing ongoing costs only and will not help you determine the relative total costs of owning different funds.
|
HENNESSY FUNDS
|
1-800-966-4354
|
25
|
Beginning
|
Ending
|
||
|
Account Value
|
Account Value
|
Expenses Paid
|
|
|
November 1, 2019
|
April 30, 2020
|
During Period(1)
|
|
|
Investor Class
|
|||
|
Actual
|
$1,000.00
|
$ 866.60
|
$7.10
|
|
Hypothetical (5% return before expenses)
|
$1,000.00
|
$1,017.26
|
$7.67
|
|
Institutional Class
|
|||
|
Actual
|
$1,000.00
|
$ 868.50
|
$5.20
|
|
Hypothetical (5% return before expenses)
|
$1,000.00
|
$1,019.29
|
$5.62
|
|
(1)
|
Expenses are equal to the Fund’s annualized expense ratio of 1.53% for Investor Class shares or 1.12% for Institutional Class shares, as applicable, multiplied by the average account value
over the period, multiplied by 182/366 days (to reflect the half-year period).
|
|
HENNESSYFUNDS.COM
|
26
|
EXPENSE EXAMPLE — IMPORTANT NOTICE REGARDING DELIVERY OF SHAREHOLDER DOCUMENTS
|
How to Obtain a Copy of the Fund’s Proxy
Voting Policy and Proxy Voting Records
A description of the policies and procedures the Fund uses to determine how to vote proxies relating to portfolio securities is available without charge (1) by calling 1-800-966-4354, (2) on the
Hennessy Funds’ website at www.hennessyfunds.com/proxy-voting/voting-policy, or (3) on the U.S. Securities and Exchange Commission’s (the “SEC”) website at www.sec.gov. The Fund’s proxy voting record is available without
charge on both the Hennessy Funds’ website at www.hennessyfunds.com/proxy-voting/voting-record and the SEC’s website at www.sec.gov no later than August 31 for the prior 12 months ending June 30.
Availability of Quarterly Portfolio Schedule
The Fund files a complete schedule of portfolio holdings with the SEC for the first and third quarters of each fiscal year as an exhibit to its reports on Form N-PORT. The Fund’s Forms N-PORT are
available on the SEC’s website at www.sec.gov or on request by calling 1-800-966-4354.
Federal Tax Distribution Information (Unaudited)
For fiscal year 2019, certain dividends paid by the Fund may be subject to a maximum tax rate of 23.8%, as provided for by the Jobs and Growth Tax Relief Reconciliation Act of 2003. The percentage of
dividends declared from ordinary income designated as qualified dividend income was 100.00%.
For corporate shareholders, the percent of ordinary income distributions that qualified for the corporate dividends received deduction for fiscal year 2019 was 0.00%.
The percentage of taxable ordinary income distributions that were designated as short-term capital gain distributions under Section 871(k)(2)(C) of the Internal Revenue Code of
1986, as amended, for the Fund was 0.94%.
For the year ended October 31, 2019, the Fund earned foreign-source income and paid foreign taxes as noted below, which it intends to pass through to its shareholders pursuant to
Section 853 of the Internal Revenue Code.
|
Gross Foreign Income
|
Foreign Tax Paid
|
|||
|
Japan
|
$2,851,789
|
$285,661
|
Important Notice Regarding Delivery
of Shareholder Documents
To help keep the Fund’s costs as low as possible, we generally deliver a single copy of shareholder reports, proxy statements, and prospectuses to shareholders who share an address and have the same
last name. This process does not apply to account statements. You may request an individual copy of a shareholder document at any time. If you would like to receive separate mailings of shareholder documents, please call U.S.
Bank Global Fund Services at 1-800-261-6950 or 1-414-765-4124, and individual delivery will begin within 30 days of your request. If your account is held through a financial institution or other intermediary, please contact
such intermediary directly to request individual delivery.
|
HENNESSY FUNDS
|
1-800-966-4354
|
27
Electronic Delivery
The Funds offer shareholders the option to receive account statements, prospectuses, tax forms, and shareholder reports online. To sign up for eDelivery, please visit www.hennessyfunds.com/account.
You may change your delivery preference at any time by visiting our website or calling U.S. Bank Global Fund Services at 1-800-261-6950 or 1-414-765-4124.
|
HENNESSYFUNDS.COM
|
28
|
ELECTRONIC DELIVERY/BOARD APPROVAL OF INVESTMENT ADVISORY AGREEMENTS
|
Board Approval of Investment Advisory
Agreements
At its meeting on March 12, 2020, the Board of Trustees of the Fund (the “Board,” and the members thereof, the “Trustees”) unanimously approved the continuation of the investment advisory agreement
of the Fund with Hennessy Advisors, Inc. (the “Advisor”) and the sub-advisory agreement for the Fund between the Advisor and SPARX Asset Management Co., Ltd. (the “Sub-Advisor”). As part of the process of approving the
continuation of the advisory and sub-advisory agreements, the Trustees reviewed their fiduciary duties and the relevant factors for them to consider with respect to approving the advisory and sub-advisory agreements. In
addition, the Trustees who are not deemed “interested persons” (as defined by the Investment Company Act of 1940, as amended) of the Fund (the “Independent Trustees”) met in executive session to discuss the approval of the
advisory and sub-advisory agreements.
In advance of the meeting, the Advisor sent detailed information to the Trustees to assist them in their evaluation of the advisory and sub-advisory agreements. This information
included, but was not limited to, the following:
|
(1)
|
A memorandum from outside legal counsel that described the fiduciary duties of the Board with respect to approving the continuation of the advisory and sub-advisory agreements and the
relevant factors for consideration;
|
|
|
(2)
|
A memorandum from the Advisor that listed the factors relevant to the Board’s approval of the continuation of the advisory and sub-advisory agreements and also referenced the documents that
had been provided to help the Board assess each such factor;
|
|
|
(3)
|
An inventory of the services provided by the Advisor and the Sub-Advisor and the distinction between the Advisor-provided services and the Sub-Advisor-provided services;
|
|
|
(4)
|
A written discussion of economies of scale;
|
|
|
(5)
|
Summaries of the key terms of the advisory and sub-advisory agreements;
|
|
|
(6)
|
A recent Fund fact sheet, which included performance information over various periods;
|
|
|
(7)
|
A peer expense comparison of the net expense ratio and investment advisory fee of the Fund;
|
|
|
(8)
|
The Advisor’s financial statements from its most recent Form 10-K and Form 10-Q;
|
|
|
(9)
|
A completed questionnaire from the Sub-Advisor;
|
|
|
(10)
|
A summary of the Sub-Advisor’s questionnaire and relevant information from the Sub-Advisor’s Form ADV Parts I and II;
|
|
|
(11)
|
The Sub-Advisor’s Code of Ethics; and
|
|
|
(12)
|
Financial information of the Sub-Advisor’s parent company.
|
All of the factors discussed were considered as a whole by the Trustees and by the Independent Trustees meeting in executive session. The factors were viewed in their totality by
the Trustees, with no single factor being the principal or determinative factor in the Trustees’ determination of whether to approve the continuation of the advisory and sub-advisory agreements. The Trustees recognized that
the management and fee
|
HENNESSY FUNDS
|
1-800-966-4354
|
29
arrangements for the Fund are the result of years of review and discussion between the Independent Trustees and the Advisor, that certain aspects of such arrangements may receive greater scrutiny in
some years than in others, and that the Trustees’ conclusions may be based, in part, on their consideration of these same arrangements and information received during the course of the year and in prior years.
Prior to approving the continuation of the advisory and sub-advisory agreements, the Trustees, including the Independent Trustees in executive session, considered, among other
items:
|
(1)
|
The nature and quality of the advisory services provided by the Advisor and the Sub-Advisor;
|
|
|
(2)
|
A comparison of the fees and expenses of the Fund to other similar funds;
|
|
|
(3)
|
Whether economies of scale are recognized by the Fund;
|
|
|
(4)
|
The costs and profitability of the Fund to the Advisor and the Sub-Advisor;
|
|
|
(5)
|
The performance of the Fund; and
|
|
|
(6)
|
Any benefits to the Advisor and the Sub-Advisor from serving as an investment advisor to the Fund (other than the advisory and sub-advisory fees).
|
The material considerations and determinations of the Trustees, including the Independent Trustees, were as follows:
|
(1)
|
The Trustees considered the services identified below that are provided by the Advisor. Based on this review, the Trustees concluded that the Advisor provides high-quality services to the
Fund and noted that their overall confidence in the Advisor was high. The Trustees also concluded that they were satisfied with the nature, extent, and quality of the advisory services provided to the Fund by the
Advisor and that the nature and extent of the services provided by the Advisor were appropriate to assure that the Fund’s operations are conducted in compliance with applicable laws, rules, and regulations.
|
|
(a)
|
The Advisor oversees the Sub-Advisor for the Fund, and the Sub-Advisor acts as the portfolio manager for the Fund.
|
||
|
(b)
|
The Advisor performs a daily reconciliation of portfolio positions and cash for the Fund.
|
||
|
(c)
|
The Advisor monitors the liquidity of each Fund.
|
||
|
(d)
|
The Advisor monitors the Fund’s compliance with its investment objectives and restrictions.
|
||
|
(e)
|
The Advisor monitors compliance with federal securities laws, maintains a compliance program (including a code of ethics), conducts ongoing reviews of the compliance programs of the
Sub-Advisor and the Fund’s other service providers, as feasible, conducts on-site visits to the Sub-Advisor and the Fund’s other service providers, monitors incidents of abusive trading practices, reviews Fund expense
accruals, payments, and fixed expense ratios, evaluates insurance providers for fidelity bond, D&O/E&O insurance, and cybersecurity insurance coverage, manages regulatory examination compliance and responses,
conducts employee compliance training, reviews reports provided by service providers, and maintains books and records.
|
|
HENNESSYFUNDS.COM
|
30
|
BOARD APPROVAL OF INVESTMENT ADVISORY AGREEMENTS
|
|
(f)
|
The Advisor oversees the selection and continued employment of the Sub-Advisor, reviews the Fund’s investment performance, and monitors the Sub-Advisor’s adherence to the Fund’s investment
objectives, policies, and restrictions.
|
||
|
(g)
|
The Advisor oversees service providers that provide accounting, administration, distribution, transfer agency, custodial, sales, marketing, public relations, audit, information technology,
and legal services to the Fund.
|
||
|
(h)
|
The Advisor maintains in-house marketing and distribution departments on behalf of the Fund.
|
||
|
(i)
|
The Advisor is actively involved with preparing regulatory filings for the Fund, including writing and annually updating the Fund’s prospectus and related documents.
|
||
|
(j)
|
For each annual report of the Fund, the Advisor reviews the written summary prepared by the Sub-Advisor of the Fund’s performance during the most recent 12-month period.
|
||
|
(k)
|
The Advisor oversees distribution of the Fund through third-party broker/dealers and independent financial institutions such as Charles Schwab, Inc., Fidelity, TD Ameritrade, and Pershing.
The Advisor participates in “no transaction fee” (“NTF”) programs with these companies on behalf of the Fund, which allow customers to purchase the Fund through third-party distribution channels without paying a
transaction fee. The Advisor compensates, in part, a number of these third-party providers of NTF programs out of its own revenues.
|
||
|
(l)
|
The Advisor pays the incentive compensation of the Fund’s compliance officers and employs other staff, such as legal, marketing, national accounts, distribution, sales, administrative, and
trading oversight personnel, as well as management executives.
|
||
|
(m)
|
The Advisor provides a quarterly compliance certification to the Board.
|
||
|
(n)
|
The Advisor prepares or reviews all Board materials, frequently presents to the Board and leads Board discussions, prepares or reviews all meeting minutes, and arranges for Board training and
education.
|
|
(2)
|
The Trustees considered the services identified below that are provided by the Sub-Advisor:
|
|
(a)
|
The Sub-Advisor acts as the portfolio manager for the Fund. In this capacity, the Sub-Advisor does the following:
|
|
(i)
|
manages the composition of the Fund’s portfolio, including the purchase, retention, and disposition of portfolio securities in accordance with the Fund’s investment objectives, policies, and
restrictions;
|
|||
|
(ii)
|
seeks best execution for the Fund’s portfolio; and
|
|||
|
(iii)
|
manages proxy voting for the Fund.
|
|
(b)
|
The Sub-Advisor ensures that its compliance program includes policies and procedures relevant to the Fund and the Sub-Advisor’s duties as a portfolio manager to the Fund.
|
||
|
(c)
|
For each annual report of the Fund, the Sub-Advisor prepares a written summary of the Fund’s performance during the most recent 12-month period.
|
|
HENNESSY FUNDS
|
1-800-966-4354
|
31
|
(d)
|
The Sub-Advisor provides a quarterly compliance certification to the Board regarding trading and allocation practices, supervisory matters, the Sub-Advisor’s compliance program (including its
code of ethics), compliance with the Fund’s policies, and general firm updates.
|
|
(3)
|
The Trustees considered the distinction between the services performed by the Advisor and the Sub-Advisor. The Trustees noted that the management of the Fund, including the oversight of the
Sub-Advisor, involves more comprehensive and substantive duties than the duties of the Sub-Advisor. Specifically, the Trustees considered the lists of services identified above and concluded that the services performed
by the Advisor for the Fund require a higher level of service and oversight than the services performed by the Sub-Advisor. Based on this determination, the Trustees concluded that the differential in advisory fees
between the Advisor and the Sub-Advisor is reasonable.
|
|
|
(4)
|
The Trustees compared the performance of the Fund to benchmark indices over various periods and also noted that the Trustees review and discuss reports comparing the investment performance of
the Fund to various indices at each quarterly Board meeting. Based on such information, the Trustees determined that the Advisor and the Sub-Advisor manage the Fund in a manner materially consistent with its stated
investment objective and style. The Trustees concluded that the performance of the Fund over various periods warranted continuation of the advisory and sub-advisory agreements.
|
|
|
(5)
|
The Trustees reviewed the advisory fees and overall expense ratios of the Fund compared to other funds similar in asset size and investment objective to the Fund using data from Morningstar.
As part of the discussion with management, the Trustees ensured that they understood and were comfortable with the criteria used to determine the mutual funds included in the Morningstar categories for purposes of the
materials considered at the meeting. The Trustees determined that the advisory fee and overall expense ratio of the Fund falls within the range of the advisory fees and overall expense ratios of other comparable funds
and concluded that they are reasonable and warranted continuation of the advisory and sub-advisory agreements.
|
|
|
(6)
|
The Trustees also considered whether the Advisor was realizing economies of scale that it should share with the Fund’s shareholders. The Trustees noted that the assets of the Fund had
declined over the prior year. In addition, the Trustees noted that many of the expenses incurred to manage the Fund are asset-based fees, so the Advisor does not realize material economies of scale relating to those
expenses as the assets of the Fund increase. For example, mutual fund platform fees increase as the Fund’s assets grow. The Trustees also considered the Advisor’s efforts to contain expenses through actions such as
renegotiating service contracts, the Advisor’s significant marketing efforts to promote the Funds, the Advisor’s investments in personnel to manage the Funds, and the Advisor’s agreement to waive fees or lower its
management fees in certain circumstances. The Trustees noted that it did not appear that the Advisor was realizing economies of scale at current asset levels and concluded that it would continue to monitor economies of
scale in the future as circumstances changed.
|
|
|
(7)
|
The Trustees considered the profitability of the Advisor and the Sub-Advisor, including the impact of mutual fund platform fees on the Advisor’s profitability, and also considered the
resources and revenues that the Advisor has put into
|
|
HENNESSYFUNDS.COM
|
32
|
BOARD APPROVAL OF INVESTMENT ADVISORY AGREEMENTS
|
|
managing and distributing the Fund. The Trustees then concluded that the profits of the Advisor and the Sub-Advisor are reasonable and not excessive when compared to profitability guidelines
set forth in relevant court cases.
|
||
|
(8)
|
The Trustees considered the high level of professionalism and knowledge of the Advisor’s employees, along with a very low level of turnover, and concluded that this was beneficial to the Fund
and its shareholders.
|
|
|
(9)
|
The Trustees considered any benefits to the Advisor and the Sub-Advisor from serving as an advisor to the Fund (other than the advisory and sub-advisory fees). The Trustees noted that the
Advisor and the Sub-Advisor may derive ancillary benefits from, by way of example, their association with the Fund in the form of proprietary and third-party research products and services received from broker-dealers
that execute portfolio trades for the Fund. The Trustees determined that any such products and services have been used for legitimate purposes relating to the Fund by providing assistance in the investment
decision-making process. The Trustees concluded that any additional benefits realized by the Advisor and the Sub-Advisor from their relationship with the Fund were reasonable, which was based on, among other things,
the Trustees’ findings that (i) the research, analytical, statistical, and other information and services provided by brokers are merely supplemental to the Advisor’s and the Sub-Advisor’s own efforts in the
performance of their duties under the advisory and sub-advisory agreements and (ii) although the Sub-Advisor could derive benefits from the conversion of Fund shareholders into separate account clients, the Fund also
could benefit from potential institutional shareholders who might choose to invest in the Fund.
|
After reviewing the materials and information provided at the meeting, as well as other information regularly provided at the Board’s quarterly meetings throughout the year
regarding the quality of services provided by the Advisor and the Sub-Advisor, the performance of the Fund, expense information, brokerage commissions information, the adequacy and efficacy of the Advisor’s and the
Sub-Advisor’s written policies and procedures, other regulatory compliance issues, trading information and related matters, and other factors that the Trustees deemed relevant, the Trustees, including the Independent Trustees,
approved the continuation of the advisory and sub-advisory agreements.
|
HENNESSY FUNDS
|
1-800-966-4354
|
33
For information, questions, or assistance, please call
The Hennessy Funds
1-800-966-4354 or 1-415-899-1555
INVESTMENT ADVISOR
Hennessy Advisors, Inc.
7250 Redwood Boulevard, Suite 200
Novato, California 94945
ADMINISTRATOR,
TRANSFER AGENT,
DIVIDEND PAYING AGENT, &
SHAREHOLDER SERVICING AGENT
U.S. Bancorp Fund Services, LLC
d/b/a U.S. Bank Global Fund Services
P.O. Box 701
Milwaukee, Wisconsin 53201-0701
CUSTODIAN
U.S. Bank N.A.
Custody Operations
1555 North River Center Drive, Suite 302
Milwaukee, Wisconsin 53212
TRUSTEES
Neil J. Hennessy
Robert T. Doyle
J. Dennis DeSousa
Gerald P. Richardson
COUNSEL
Foley & Lardner LLP
777 East Wisconsin Avenue
Milwaukee, Wisconsin 53202-5306
INDEPENDENT REGISTERED
PUBLIC ACCOUNTING FIRM
Tait, Weller & Baker LLP
Two Liberty Place
50 South 16th Street, Suite 2900
Philadelphia, Pennsylvania 19102-2529
DISTRIBUTOR
Quasar Distributors, LLC
111 East Kilbourn Avenue, Suite 2200
Milwaukee, Wisconsin 53202
www.hennessyfunds.com | 1-800-966-4354
This report has been prepared for shareholders and may be distributed to
others only if preceded or accompanied by a current prospectus.
SEMI-ANNUAL REPORT
APRIL 30, 2020

HENNESSY LARGE CAP FINANCIAL FUND
Investor Class HLFNX
Institutional Class HILFX
IMPORTANT NOTICE REGARDING ELECTRONIC DELIVERY OF SHAREHOLDER REPORTS
Beginning on January 1, 2021, as permitted by regulations adopted by the Securities and Exchange Commission, paper copies of the annual and
semi-annual reports will no longer be sent by mail unless you specifically request paper copies from the Hennessy Funds or from your financial intermediary. Instead, the reports will be made available on a website,
and you will be notified by mail each time a report is posted and provided with a website link to access the report.
If you have already elected to receive shareholder reports electronically, you will not be affected by this change and you need not take any action. You may elect to receive shareholder reports and other communications from the Hennessy Funds electronically by visiting www.hennessyfunds.com/account or by calling U.S. Bank Global Fund Services at
1-800-261-6950. If you own shares in a Fund through a financial intermediary, please contact your financial intermediary to make this election.
You may elect to receive paper copies of all future reports free of charge by calling U.S. Bank Global Fund Services at 1-800-261-6950 or, if
you own your shares through a financial intermediary, by contacting your financial intermediary. Your election to receive paper copies of reports will apply to all Funds in the Hennessy Funds family.
hennessyfunds.com | 1-800-966-4354
(This Page Intentionally Left Blank.)
Contents
|
Letter to Shareholders
|
2
|
|
Performance Overview
|
4
|
|
Financial Statements
|
|
|
Schedule of Investments
|
5
|
|
Statement of Assets and Liabilities
|
8
|
|
Statement of Operations
|
9
|
|
Statements of Changes in Net Assets
|
11
|
|
Financial Highlights
|
12
|
|
Notes to the Financial Statements
|
16
|
|
Expense Example
|
23
|
|
Proxy Voting Policy and Proxy Voting Records
|
25
|
|
Availability of Quarterly Portfolio Schedule
|
25
|
|
Federal Tax Distribution Information
|
25
|
|
Important Notice Regarding Delivery of Shareholder Documents
|
25
|
|
Electronic Delivery
|
25
|
|
Board Approval of Investment Advisory Agreement
|
26
|
|
HENNESSY FUNDS
|
1-800-966-4354
|
June 2020
Dear Hennessy Funds Shareholder:
First and foremost, I hope this communication finds you and your loved ones safe and healthy. In many ways, the COVID-19 pandemic has turned the world upside down in recent months, and we at
Hennessy have joined the rest of the world in witnessing and experiencing its profound effect on public health, the global economy, and the everyday lives of people around the world. In response to the crisis, we invoked
our business continuity plan in mid-March to ensure a smooth transition to remote work for all of our employees, who have been working safely and productively from home. We want to assure our Hennessy Funds shareholders that
our operations are uninterrupted and functioning normally.
The past six months have been marked by extremes. During the first half of the period from November 2019 through January 2020, the bull market, supported by strong corporate
fundamentals, continued to move higher, and investors appeared focused on record-low unemployment and strong economic growth. In mid-February, the major U.S. market indices hit all-time highs, but then, within just a matter
of weeks, lost over one-third of their values as the COVID-19 pandemic unfolded. Shelter-in-place and business closure orders rippled through the nation, causing initial unemployment claims to skyrocket to their highest
number in history. The market then rallied back and posted double-digit positive returns in April.
For the six months ended April 30, 2020, on a total return basis, the Dow Jones Industrial Average was down 8.9% and the S&P 500® Index was down 3.2%. Small-cap and mid-cap stocks generally fared worse than large-cap stocks during the period, and the Financial sector was particularly hard hit as the
Federal Reserve aggressively cut the federal funds rate in an effort to stabilize the economy. The Energy sector was crushed by both the sudden loss of demand due to COVID-19 and the oversupply caused by the surprise
market-share battle between Russia and Saudi Arabia, and the S&P 500® Energy Sector Index ended the six-month period down over 30%.
The COVID-19 pandemic is an unprecedented event, and the duration and full extent of the economic impact is unknown. In the moment, there is always the concern that ‘this time is
different.’ But, when you are able to look at past financial, political, and health crises with the benefit of 20/20 hindsight, history has demonstrated that our economy and financial markets have always rebounded and
recovered eventually. If you look back to the last market downturn in 2008, economic fundamentals were weak compared to the market in 2020, where the overall underpinnings were – and are still – quite strong. Publicly
listed companies today have plenty of cash, with over $5 trillion on balance sheets of the S&P 500® companies alone, and I believe that
most will survive and that many may emerge from the current crisis even stronger.
|
HENNESSYFUNDS.COM
|
2
|
LETTER TO SHAREHOLDERS
|
We understand that this market volatility and economic uncertainty is jarring to many investors, and we continue to monitor events and the markets. We remain focused on managing
our high-conviction portfolios for the long-term benefit of our shareholders, and we are confident in the time-tested strategies and rigorous research that led to their formation. We encourage shareholders to maintain a
long-term investment horizon and to remain focused on long-term goals. As always, but especially in these trying times, we are here to support our shareholders, and we thank you for your continued investment and trust.
Should you have any questions or would like to speak with us directly, please don’t hesitate to call (800) 966-4354 or email us at fundsinfo@hennessyfunds.com.
Best regards,
Neil J. Hennessy
President and Chief Investment Officer
Past performance does not guarantee future results.
Mutual fund investing involves risk. Principal loss is possible.
The Dow Jones Industrial Average and S&P 500® Index are commonly used to measure the performance of U.S. stocks.
The S&P 500® Energy Sector Index is an index that comprises those companies included in the S&P 500 that are classified as members of
the GICS energy sector. One cannot invest directly in an index.
|
HENNESSY FUNDS
|
1-800-966-4354
|
3
Performance Overview (Unaudited)
AVERAGE ANNUAL TOTAL RETURN FOR PERIODS ENDED APRIL 30, 2020
|
|
Six
|
One
|
Five
|
Ten
|
|
|
Months(1)
|
Year
|
Years
|
Years
|
|
Hennessy Large Cap Financial Fund –
|
||||
|
Investor Class (HLFNX)
|
-9.77%
|
-10.08%
|
5.15%
|
6.42%
|
|
Hennessy Large Cap Financial Fund –
|
||||
|
Institutional Class (HILFX)(2)
|
-9.66%
|
-9.78%
|
5.54%
|
6.62%
|
|
Russell 1000® Financial
|
||||
|
Services Index
|
-15.76%
|
-11.28%
|
7.01%
|
8.97%
|
|
Russell 1000® Index
|
-3.56%
|
0.09%
|
8.74%
|
11.57%
|
Expense ratios: 1.83% (Investor Class); 1.44% (Institutional Class)
|
(1)
|
Periods of less than one year are not annualized.
|
|
(2)
|
The inception date of Institutional Class shares is June 15, 2015. Performance shown prior to the inception of Institutional Class shares reflects the performance of Investor Class shares
and includes expenses that are not applicable to, and are higher than, those of Institutional Class shares.
|
_______________
Performance data quoted represents past performance; past performance does not guarantee future results. The investment return and principal value of an investment will
fluctuate so that an investor’s shares, when redeemed, may be worth more or less than their original cost. The performance table does not reflect the deduction of taxes that a shareholder would pay on Fund distributions or
the redemption of Fund shares. Current performance of the Fund may be lower or higher than the performance quoted. Performance data current to the most recent month end may be obtained by visiting www.hennessyfunds.com.
Performance for periods on or prior to October 26, 2012, is that of the FBR Large Cap Financial Fund.
The Russell 1000® Financial Services Index is a subset of the Russell 1000® Index that measures the performance of the securities classified in the financial services sector of the large-capitalization U.S. equity market. The Russell 1000® Index comprises the 1,000 largest companies in the Russell 3000®
Index based on market capitalization. One cannot invest directly in an index. These indices are used herein for comparative purposes in accordance with SEC regulations.
Frank Russell Company (“Russell”) is the source and owner of the trademarks, service marks, and copyrights related to the Russell Indexes. Russell® is a trademark of Russell. Neither Russell nor its licensors accept any liability for any errors or omissions in the Russell Indexes or Russell ratings or underlying data and no party may
rely on any Russell Indexes or Russell ratings or underlying data contained in this communication. No further distribution of Russell data is permitted without Russell’s express written consent. Russell does not promote,
sponsor, or endorse the content of this communication.
The expense ratios presented are from the most recent prospectus. The expense ratios for the current reporting period are available in the Financial Highlights section of this report.
|
HENNESSYFUNDS.COM
|
4
|
PERFORMANCE OVERVIEW/SCHEDULE OF INVESTMENTS
|
Financial Statements
|
Schedule of Investments as of April
30, 2020 (Unaudited)
|
HENNESSY LARGE CAP FINANCIAL FUND
(% of Net Assets)
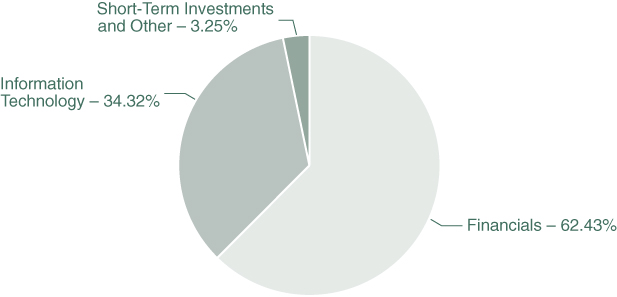
|
TOP TEN HOLDINGS (EXCLUDING MONEY MARKET FUNDS)
|
% NET ASSETS
|
|
PayPal Holdings, Inc.
|
5.33%
|
|
Citigroup, Inc.
|
5.08%
|
|
Moody’s Corp.
|
4.98%
|
|
Square, Inc., Class A
|
4.98%
|
|
Bank of America Corp.
|
4.97%
|
|
The Blackstone Group, Inc.
|
4.93%
|
|
Mastercard, Inc., Class A
|
4.91%
|
|
Apple, Inc.
|
4.87%
|
|
Visa, Inc., Class A
|
4.79%
|
|
Fiserv, Inc.
|
4.73%
|
Note: For presentation purposes, the Fund has grouped some of the industry categories. For purposes of categorizing securities for compliance with Section 8(b)(1) of the Investment Company Act of
1940, as amended, the Fund uses more specific industry classifications.
The Global Industry Classification Standard (GICS®) was developed by and is the exclusive property and a service
mark of MSCI, Inc. and Standard & Poor’s Financial Services LLC. It has been licensed for use by the Hennessy Funds.
|
HENNESSY FUNDS
|
1-800-966-4354
|
5
|
COMMON STOCKS – 96.75%
|
Number
|
% of
|
||||||||||
|
|
of Shares
|
Value
|
Net Assets
|
|||||||||
|
Financials – 62.43%
|
||||||||||||
|
American Express Co.
|
6,000
|
$
|
547,500
|
1.40
|
%
|
|||||||
|
Bank of America Corp.
|
81,000
|
1,948,050
|
4.97
|
%
|
||||||||
|
Berkshire Hathaway, Inc., Class B (a)
|
9,500
|
1,779,920
|
4.54
|
%
|
||||||||
|
Capital One Financial Corp.
|
28,000
|
1,813,280
|
4.62
|
%
|
||||||||
|
Citigroup, Inc.
|
41,000
|
1,990,960
|
5.08
|
%
|
||||||||
|
Citizens Financial Group, Inc.
|
67,000
|
1,500,130
|
3.83
|
%
|
||||||||
|
Comerica, Inc.
|
32,000
|
1,115,520
|
2.84
|
%
|
||||||||
|
Fifth Third Bancorp
|
60,000
|
1,121,400
|
2.86
|
%
|
||||||||
|
JPMorgan Chase & Co.
|
19,000
|
1,819,440
|
4.64
|
%
|
||||||||
|
Moody’s Corp.
|
8,000
|
1,951,200
|
4.98
|
%
|
||||||||
|
The Blackstone Group, Inc.
|
37,000
|
1,932,880
|
4.93
|
%
|
||||||||
|
The Charles Schwab Corp.
|
42,000
|
1,584,240
|
4.04
|
%
|
||||||||
|
The Goldman Sachs Group, Inc.
|
10,000
|
1,834,200
|
4.68
|
%
|
||||||||
|
The PNC Financial Services Group, Inc.
|
16,000
|
1,706,720
|
4.35
|
%
|
||||||||
|
Wells Fargo & Co.
|
63,000
|
1,830,150
|
4.67
|
%
|
||||||||
|
|
24,475,590
|
62.43
|
%
|
|||||||||
|
Information Technology – 34.32%
|
||||||||||||
|
Apple, Inc.
|
6,500
|
1,909,700
|
4.87
|
%
|
||||||||
|
Fidelity National Information Services, Inc.
|
14,000
|
1,846,460
|
4.71
|
%
|
||||||||
|
Fiserv, Inc. (a)
|
18,000
|
1,855,080
|
4.73
|
%
|
||||||||
|
Mastercard, Inc., Class A
|
7,000
|
1,924,790
|
4.91
|
%
|
||||||||
|
PayPal Holdings, Inc. (a)
|
17,000
|
2,091,000
|
5.33
|
%
|
||||||||
|
Square, Inc., Class A (a)
|
30,000
|
1,954,200
|
4.98
|
%
|
||||||||
|
Visa, Inc., Class A
|
10,500
|
1,876,560
|
4.79
|
%
|
||||||||
|
|
13,457,790
|
34.32
|
%
|
|||||||||
|
Total Common Stocks
|
||||||||||||
|
(Cost $31,323,453)
|
37,933,380
|
96.75
|
%
|
|||||||||
The accompanying notes are an integral part of these financial statements.
|
HENNESSYFUNDS.COM
|
6
|
SCHEDULE OF INVESTMENTS
|
|
SHORT-TERM INVESTMENTS – 3.85%
|
Number
|
% of
|
||||||||||
|
|
of Shares
|
Value
|
Net Assets
|
|||||||||
|
Money Market Funds – 3.85%
|
||||||||||||
|
First American Government Obligations Fund,
|
||||||||||||
|
Institutional Class, 0.25% (b)
|
1,508,965
|
$
|
1,508,965
|
3.85
|
%
|
|||||||
|
|
||||||||||||
|
Total Short-Term Investments
|
||||||||||||
|
(Cost $1,508,965)
|
1,508,965
|
3.85
|
%
|
|||||||||
|
|
||||||||||||
|
Total Investments
|
||||||||||||
|
(Cost $32,832,418) – 100.60%
|
39,442,345
|
100.60
|
%
|
|||||||||
|
Liabilities in Excess of Other Assets – (0.60)%
|
(235,486
|
)
|
(0.60
|
)%
|
||||||||
|
|
||||||||||||
|
TOTAL NET ASSETS – 100.00%
|
$
|
39,206,859
|
100.00
|
%
|
||||||||
Percentages are stated as a percent of net assets.
|
(a)
|
Non-income-producing security.
|
|
(b)
|
The rate listed is the fund’s seven-day yield as of April 30, 2020.
|
The Fund invested in an affiliated security during the six months ended April 30, 2020. Quasar Distributors, LLC, which serves as the Fund’s distributor, was a subsidiary of
U.S. Bancorp Fund Services LLC, through March 30, 2020. Details of transactions with this affiliated company for the period ended November 1, 2019, through March 30, 2020, are as follows:
|
|
Common Stocks
|
|||
|
|
U.S. Bancorp
|
|||
|
Beginning Cost – November 1, 2019
|
$
|
489,030
|
||
|
Purchase Cost
|
$
|
—
|
||
|
Sales Cost
|
$
|
(489,030
|
)
|
|
|
Ending Cost – March 30, 2020
|
$
|
—
|
||
|
Dividend Income
|
$
|
2,100
|
||
|
Net Change in Unrealized Appreciation/Depreciation
|
$
|
(24,150
|
)
|
|
|
Realized Gain/Loss
|
$
|
31,875
|
||
|
Shares
|
—
|
|||
|
Market Value – March 30, 2020
|
$
|
—
|
||
Summary of Fair Value Exposure as of April 30, 2020
The following is a summary of the inputs used to value the Fund’s net assets as of April 30, 2020 (see Note 3 in the accompanying Notes to the Financial Statements):
|
Common Stocks
|
Level 1
|
Level 2
|
Level 3
|
Total
|
||||||||||||
|
Financials
|
$
|
24,475,590
|
$
|
—
|
$
|
—
|
$
|
24,475,590
|
||||||||
|
Information Technology
|
13,457,790
|
—
|
—
|
13,457,790
|
||||||||||||
|
Total Common Stocks
|
$
|
37,933,380
|
$
|
—
|
$
|
—
|
$
|
37,933,380
|
||||||||
|
Short-Term Investments
|
||||||||||||||||
|
Money Market Funds
|
$
|
1,508,965
|
$
|
—
|
$
|
—
|
$
|
1,508,965
|
||||||||
|
Total Short-Term Investments
|
$
|
1,508,965
|
$
|
—
|
$
|
—
|
$
|
1,508,965
|
||||||||
|
Total Investments
|
$
|
39,442,345
|
$
|
—
|
$
|
—
|
$
|
39,442,345
|
||||||||
The accompanying notes are an integral part of these financial statements.
|
HENNESSY FUNDS
|
1-800-966-4354
|
7
Financial Statements
|
Statement of Assets and Liabilities as of April 30, 2020 (Unaudited)
|
|
ASSETS:
|
||||
|
Investments in securities, at value (cost $32,832,418)
|
$
|
39,442,345
|
||
|
Dividends and interest receivable
|
53,778
|
|||
|
Receivable for fund shares sold
|
149,253
|
|||
|
Prepaid expenses and other assets
|
20,392
|
|||
|
Total assets
|
39,665,768
|
|||
|
LIABILITIES:
|
||||
|
Payable for securities purchased
|
377,296
|
|||
|
Payable for fund shares redeemed
|
12,250
|
|||
|
Payable to advisor
|
27,768
|
|||
|
Payable to administrator
|
9,038
|
|||
|
Payable to auditor
|
11,373
|
|||
|
Accrued distribution fees
|
3,376
|
|||
|
Accrued service fees
|
1,665
|
|||
|
Accrued trustees fees
|
6,427
|
|||
|
Accrued expenses and other payables
|
9,716
|
|||
|
Total liabilities
|
458,909
|
|||
|
NET ASSETS
|
$
|
39,206,859
|
||
|
NET ASSETS CONSISTS OF:
|
||||
|
Capital stock
|
$
|
36,675,020
|
||
|
Total distributable earnings
|
2,531,839
|
|||
|
Total net assets
|
$
|
39,206,859
|
||
|
NET ASSETS:
|
||||
|
Investor Class
|
||||
|
Shares authorized (no par value)
|
Unlimited
|
|||
|
Net assets applicable to outstanding shares
|
$
|
21,869,493
|
||
|
Shares issued and outstanding
|
1,071,110
|
|||
|
Net asset value, offering price, and redemption price per share
|
$
|
20.42
|
||
|
Institutional Class
|
||||
|
Shares authorized (no par value)
|
Unlimited
|
|||
|
Net assets applicable to outstanding shares
|
$
|
17,337,366
|
||
|
Shares issued and outstanding
|
845,989
|
|||
|
Net asset value, offering price, and redemption price per share
|
$
|
20.49
|
||
The accompanying notes are an integral part of these financial statements.
|
HENNESSYFUNDS.COM
|
8
|
STATEMENT OF ASSETS AND LIABILITIES/STATEMENT OF OPERATIONS
|
Financial Statements
|
Statement of Operations for the six months ended April 30, 2020 (Unaudited)
|
|
INVESTMENT INCOME:
|
||||
|
Dividend income from unaffiliated securities
|
$
|
348,785
|
||
|
Dividend income from affiliated securities
|
2,100
|
|||
|
Interest income
|
6,983
|
|||
|
Total investment income
|
357,868
|
|||
|
EXPENSES:
|
||||
|
Investment advisory fees (See Note 5)
|
202,502
|
|||
|
Sub-transfer agent expenses – Investor Class (See Note 5)
|
22,467
|
|||
|
Sub-transfer agent expenses – Institutional Class (See Note 5)
|
11,859
|
|||
|
Administration, accounting, custody, and transfer agent fees (See Note 5)
|
28,083
|
|||
|
Federal and state registration fees
|
19,843
|
|||
|
Distribution fees – Investor Class (See Note 5)
|
17,426
|
|||
|
Compliance expense (See Note 5)
|
13,462
|
|||
|
Service fees – Investor Class (See Note 5)
|
11,617
|
|||
|
Audit fees
|
11,375
|
|||
|
Trustees’ fees and expenses
|
8,377
|
|||
|
Reports to shareholders
|
4,285
|
|||
|
Interest expense (See Note 7)
|
410
|
|||
|
Legal fees
|
184
|
|||
|
Other expenses
|
4,105
|
|||
|
Total expenses
|
355,995
|
|||
|
NET INVESTMENT INCOME
|
$
|
1,873
|
||
|
REALIZED AND UNREALIZED GAINS (LOSSES):
|
||||
|
Net realized gain (loss) on investments:
|
||||
|
Unaffiliated investments
|
$
|
(1,167,325
|
)
|
|
|
Affiliated investments
|
31,875
|
|||
|
Net change in unrealized appreciation/deprecation on investments:
|
||||
|
Unaffiliated investments
|
(2,552,865
|
)
|
||
|
Affiliated investments
|
(24,150
|
)
|
||
|
Net loss on investments
|
(3,712,465
|
)
|
||
|
NET DECREASE IN NET ASSETS RESULTING FROM OPERATIONS
|
$
|
(3,710,592
|
)
|
|
The accompanying notes are an integral part of these financial statements.
|
HENNESSY FUNDS
|
1-800-966-4354
|
9
(This Page Intentionally Left Blank.)
|
HENNESSYFUNDS.COM
|
10
|
STATEMENTS OF CHANGES IN NET ASSETS
|
Financial Statements
|
Statements of Changes in Net Assets
|
|
Six Months Ended
|
||||||||
|
April 30, 2020
|
Year Ended
|
|||||||
|
(Unaudited)
|
October 31, 2019
|
|||||||
|
OPERATIONS:
|
||||||||
|
Net investment income (loss)
|
$
|
1,873
|
$
|
(54,782
|
)
|
|||
|
Net realized loss on investments
|
(1,135,450
|
)
|
(2,153,768
|
)
|
||||
|
Net change in unrealized
|
||||||||
|
appreciation/depreciation on investments
|
(2,577,015
|
)
|
3,586,065
|
|||||
|
Net increase (decrease) in net assets
|
||||||||
|
resulting from operations
|
(3,710,592
|
)
|
1,377,515
|
|||||
|
DISTRIBUTIONS TO SHAREHOLDERS:
|
||||||||
|
Distributable earnings – Investor Class
|
—
|
(982,872
|
)
|
|||||
|
Distributable earnings – Institutional Class
|
—
|
(250,041
|
)
|
|||||
|
Total distributions
|
—
|
(1,232,913
|
)
|
|||||
|
CAPITAL SHARE TRANSACTIONS:
|
||||||||
|
Proceeds from shares subscribed – Investor Class
|
3,331,723
|
2,668,470
|
||||||
|
Proceeds from shares subscribed – Institutional Class
|
5,367,903
|
19,568,396
|
||||||
|
Dividends reinvested – Investor Class
|
—
|
961,534
|
||||||
|
Dividends reinvested – Institutional Class
|
—
|
249,016
|
||||||
|
Cost of shares redeemed – Investor Class
|
(3,213,421
|
)
|
(21,047,821
|
)
|
||||
|
Cost of shares redeemed – Institutional Class
|
(8,167,479
|
)
|
(6,788,374
|
)
|
||||
|
Net decrease in net assets derived
|
||||||||
|
from capital share transactions
|
(2,681,274
|
)
|
(4,388,779
|
)
|
||||
|
TOTAL DECREASE IN NET ASSETS
|
(6,391,866
|
)
|
(4,244,177
|
)
|
||||
|
NET ASSETS:
|
||||||||
|
Beginning of period
|
45,598,725
|
49,842,902
|
||||||
|
End of period
|
$
|
39,206,859
|
$
|
45,598,725
|
||||
|
CHANGES IN SHARES OUTSTANDING:
|
||||||||
|
Shares sold – Investor Class
|
173,995
|
122,976
|
||||||
|
Shares sold – Institutional Class
|
289,653
|
863,528
|
||||||
|
Shares issued to holders as reinvestment
|
||||||||
|
of dividends – Investor Class
|
—
|
48,710
|
||||||
|
Shares issued to holders as reinvestment
|
||||||||
|
of dividends – Institutional Class
|
—
|
12,634
|
||||||
|
Shares redeemed – Investor Class
|
(146,859
|
)
|
(1,040,638
|
)
|
||||
|
Shares redeemed – Institutional Class
|
(412,403
|
)
|
(321,223
|
)
|
||||
|
Net decrease in shares outstanding
|
(95,614
|
)
|
(314,013
|
)
|
||||
The accompanying notes are an integral part of these financial statements.
|
HENNESSY FUNDS
|
1-800-966-4354
|
11
Financial Statements
|
Financial Highlights
|
For an Investor Class share outstanding throughout each period
|
Six Months Ended
|
||||
|
April 30, 2020
|
||||
|
(Unaudited)
|
||||
|
PER SHARE DATA:
|
||||
|
Net asset value, beginning of period
|
$
|
22.63
|
||
|
Income from investment operations:
|
||||
|
Net investment income (loss)
|
(0.02
|
)(1)
|
||
|
Net realized and unrealized gains (losses) on investments
|
(2.19
|
)
|
||
|
Total from investment operations
|
(2.21
|
)
|
||
|
Less distributions:
|
||||
|
Dividends from net investment income
|
—
|
|||
|
Dividends from net realized gains
|
—
|
|||
|
Total distributions
|
—
|
|||
|
Net asset value, end of period
|
$
|
20.42
|
||
|
TOTAL RETURN
|
-9.77
|
%(2)
|
||
|
SUPPLEMENTAL DATA AND RATIOS:
|
||||
|
Net assets, end of period (millions)
|
$
|
21.87
|
||
|
Ratio of expenses to average net assets
|
1.75
|
%(3)
|
||
|
Ratio of net investment income (loss) to average net assets
|
(0.15
|
)%(3)
|
||
|
Portfolio turnover rate(4)
|
54
|
%(2)
|
||
|
(1)
|
Calculated using the average shares outstanding method.
|
|
(2)
|
Not annualized.
|
|
(3)
|
Annualized.
|
|
(4)
|
Calculated on the basis of the Fund as a whole.
|
The accompanying notes are an integral part of these financial statements.
|
HENNESSYFUNDS.COM
|
12
|
FINANCIAL HIGHLIGHTS — INVESTOR CLASS
|
|
Year Ended October 31,
|
||||||||||||||||||
|
2019
|
2018
|
2017
|
2016
|
2015
|
||||||||||||||
|
$
|
21.43
|
$
|
22.02
|
$
|
16.23
|
$
|
18.36
|
$
|
20.87
|
|||||||||
|
(0.05
|
)(1)
|
(0.07
|
)
|
(0.08
|
)
|
0.07
|
0.01
|
|||||||||||
|
1.84
|
0.48
|
5.97
|
(0.49
|
)
|
(0.40
|
)
|
||||||||||||
|
1.79
|
0.41
|
5.89
|
(0.42
|
)
|
(0.39
|
)
|
||||||||||||
|
—
|
—
|
(0.10
|
)
|
(0.02
|
)
|
—
|
||||||||||||
|
(0.59
|
)
|
(1.00
|
)
|
—
|
(1.69
|
)
|
(2.12
|
)
|
||||||||||
|
(0.59
|
)
|
(1.00
|
)
|
(0.10
|
)
|
(1.71
|
)
|
(2.12
|
)
|
|||||||||
|
$
|
22.63
|
$
|
21.43
|
$
|
22.02
|
$
|
16.23
|
$
|
18.36
|
|||||||||
|
8.75
|
%
|
1.82
|
%
|
36.41
|
%
|
-2.57
|
%
|
-2.57
|
%
|
|||||||||
|
$
|
23.63
|
$
|
40.99
|
$
|
26.33
|
$
|
26.67
|
$
|
100.73
|
|||||||||
|
1.82
|
%
|
1.69
|
%
|
1.81
|
%
|
1.66
|
%
|
1.57
|
%
|
|||||||||
|
(0.23
|
)%
|
(0.44
|
)%
|
(0.41
|
)%
|
0.16
|
%
|
0.03
|
%
|
|||||||||
|
83
|
%
|
64
|
%
|
76
|
%
|
141
|
%
|
74
|
%
|
|||||||||
The accompanying notes are an integral part of these financial statements.
|
HENNESSY FUNDS
|
1-800-966-4354
|
13
Financial Statements
|
Financial Highlights
|
For an Institutional Class share outstanding throughout each period
|
Six Months Ended
|
||||
|
April 30, 2020
|
||||
|
(Unaudited)
|
||||
|
PER SHARE DATA:
|
||||
|
Net asset value, beginning of period
|
$
|
22.68
|
||
|
Income from investment operations:
|
||||
|
Net investment income
|
0.02
|
(2)
|
||
|
Net realized and unrealized gains (losses) on investments
|
(2.21
|
)
|
||
|
Total from investment operations
|
(2.19
|
)
|
||
|
Less distributions:
|
||||
|
Dividends from net investment income
|
—
|
|||
|
Dividends from net realized gains
|
—
|
|||
|
Total distributions
|
—
|
|||
|
Net asset value, end of period
|
$
|
20.49
|
||
|
TOTAL RETURN
|
-9.66
|
%(3)
|
||
|
SUPPLEMENTAL DATA AND RATIOS:
|
||||
|
Net assets, end of period (millions)
|
$
|
17.34
|
||
|
Ratio of expenses to average net assets
|
1.41
|
%(4)
|
||
|
Ratio of net investment income (loss) to average net assets
|
0.18
|
%(4)
|
||
|
Portfolio turnover rate(5)
|
54
|
%(3)
|
||
|
(1)
|
Institutional Class shares commenced operations on June 15, 2015.
|
|
(2)
|
Calculated using the average shares outstanding method.
|
|
(3)
|
Not annualized.
|
|
(4)
|
Annualized.
|
|
(5)
|
Calculated on the basis of the Fund as a whole.
|
The accompanying notes are an integral part of these financial statements.
|
HENNESSYFUNDS.COM
|
14
|
FINANCIAL HIGHLIGHTS — INSTITUTIONAL CLASS
|
|
Period Ended
|
||||||||||||||||||
|
Year Ended October 31,
|
October 31,
|
|||||||||||||||||
|
2019
|
2018
|
2017
|
2016
|
2015(1)
|
||||||||||||||
|
$
|
21.39
|
$
|
21.91
|
$
|
16.26
|
$
|
18.39
|
$
|
19.72
|
|||||||||
|
0.01
|
(2)
|
0.03
|
0.18
|
0.02
|
0.01
|
|||||||||||||
|
1.87
|
0.45
|
5.78
|
(0.36
|
)
|
(1.34
|
)
|
||||||||||||
|
1.88
|
0.48
|
5.96
|
(0.34
|
)
|
(1.33
|
)
|
||||||||||||
|
—
|
—
|
(0.31
|
)
|
(0.09
|
)
|
—
|
||||||||||||
|
(0.59
|
)
|
(1.00
|
)
|
—
|
(1.70
|
)
|
—
|
|||||||||||
|
(0.59
|
)
|
(1.00
|
)
|
(0.31
|
)
|
(1.79
|
)
|
—
|
||||||||||
|
$
|
22.68
|
$
|
21.39
|
$
|
21.91
|
$
|
16.26
|
$
|
18.39
|
|||||||||
|
9.16
|
%
|
2.16
|
%
|
36.92
|
%
|
-2.14
|
%
|
-6.74
|
%(3)
|
|||||||||
|
$
|
21.97
|
$
|
8.85
|
$
|
5.83
|
$
|
0.35
|
$
|
0.29
|
|||||||||
|
1.43
|
%
|
1.34
|
%
|
1.50
|
%
|
1.24
|
%
|
1.19
|
%(4)
|
|||||||||
|
0.05
|
%
|
(0.07
|
)%
|
(0.17
|
)%
|
0.52
|
%
|
0.25
|
%(4)
|
|||||||||
|
83
|
%
|
64
|
%
|
76
|
%
|
141
|
%
|
74
|
%(3)
|
|||||||||
The accompanying notes are an integral part of these financial statements.
|
HENNESSY FUNDS
|
1-800-966-4354
|
15
Financial Statements
|
Notes to the Financial Statements April 30, 2020 (Unaudited)
|
1). ORGANIZATION
The Hennessy Large Cap Financial Fund (the “Fund”) is a series of Hennessy Funds Trust (the “Trust”), which was organized as a Delaware statutory trust on September 17, 1992. The Fund is an
open-end management investment company registered under the Investment Company Act of 1940, as amended. The investment objective of the Fund is capital appreciation. The Fund is a non-diversified fund.
The Fund offers Investor Class and Institutional Class shares. Each class of shares differs principally in its respective 12b-1 distribution and service, shareholder servicing,
and sub-transfer agent expenses. There are no sales charges. Each class has identical rights to earnings, assets, and voting privileges, except for class-specific expenses and exclusive rights to vote on matters affecting
only one class.
As an investment company, the Fund follows the investment company accounting and reporting guidance of the Financial Accounting Standards Board (“FASB”) Accounting Standard
Codification Topic 946 “Financial Services—Investment Companies.”
2). SIGNIFICANT ACCOUNTING POLICIES
The following is a summary of significant accounting policies consistently followed by the Fund in the preparation of the financial statements. These policies conform to U.S. generally accepted
accounting principles (“GAAP”).
|
a).
|
Securities Valuation – All investments in securities are recorded at their estimated fair value, as described in Note 3.
|
|
b).
|
Federal Income Taxes – No provision for federal income taxes or excise taxes has been made because the Fund has elected to be taxed as a regulated investment company and intends to
distribute substantially all of its taxable income to its shareholders and otherwise comply with the provisions of the Internal Revenue Code of 1986, as amended, applicable to regulated investment companies. Net
investment income/loss and realized gains/losses for federal income tax purposes may differ from those reported in the financial statements because of temporary book and tax basis differences. Temporary differences
are primarily the result of the treatment of wash sales for tax reporting purposes. The Fund recognizes interest and penalties related to income tax benefits, if any, in the Statement of Operations as an income tax
expense. Distributions from net realized gains for book purposes may include short-term capital gains, which are included as ordinary income to shareholders for tax purposes. The Fund may utilize equalization
accounting for tax purposes and designate earnings and profits, including net realized gains distributed to shareholders on redemption of shares, as part of the dividends paid deduction for income tax purposes.
|
|
c).
|
Accounting for Uncertainty in Income Taxes – The Fund has accounting policies regarding recognition and measurement of tax positions taken or expected to be taken on a tax return. The tax
returns of the Fund for the prior three fiscal years are open for examination. The Fund has reviewed all open tax years in major jurisdictions and concluded that there is no impact on the Fund’s net assets and no tax
liability resulting from unrecognized tax benefits relating to uncertain income tax positions taken or expected to be taken on a tax return. The Fund’s major tax jurisdictions are U.S. federal and Delaware.
|
|
HENNESSYFUNDS.COM
|
16
|
NOTES TO THE FINANCIAL STATEMENTS
|
|
d).
|
Income and Expenses – Dividend income is recognized on the ex-dividend date or as soon as information is available to the Fund. Interest income, which includes the amortization of premium
and accretion of discount, is recognized on an accrual basis. Other non-cash dividends are recognized as investment income at the fair value of the property received. The Fund is charged for those expenses that are
directly attributable to its portfolio, such as advisory, administration, and certain shareholder service fees. Income, expenses (other than expenses attributable to a specific class), and realized and unrealized
gains/losses on investments are allocated to each class of shares based on such class’s net assets.
|
|
e).
|
Distributions to Shareholders – Dividends from net investment income for the Fund, if any, are declared and paid annually, usually in December. Distributions of net realized capital gains,
if any, are declared and paid annually, usually in December.
|
|
f).
|
Security Transactions – Investment and shareholder transactions are recorded on the trade date. The Fund determines the realized gain/loss from an investment transaction by comparing the
original cost of the security lot sold with the net sale proceeds. Discounts and premiums on securities purchased are accreted or amortized, respectively, over the life of each such security.
|
|
g).
|
Use of Estimates – The preparation of financial statements in conformity with GAAP requires management to make estimates and assumptions that affect the reported amounts of assets and
liabilities and disclosure of contingent assets and liabilities at the date of the financial statements and the reported change in net assets during the reporting period. Actual results could differ from those
estimates.
|
|
h).
|
Share Valuation – The net asset value (“NAV”) per share of the Fund is calculated by dividing (i) the total value of the securities held by the Fund, plus cash and other assets, minus all
liabilities (including estimated accrued expenses) by (ii) the total number of shares outstanding for the Fund, rounded to the nearest $0.01. The Fund’s shares will not be priced on days the New York Stock Exchange
is closed for trading. The offering and redemption price per share for the Fund is equal to the Fund’s NAV per share.
|
3). SECURITIES VALUATION
The Fund follows fair value accounting standards that establish an authoritative definition of fair value and set out a hierarchy for measuring fair value. These standards require additional
disclosures about the various inputs and valuation techniques used to develop the measurements of fair value and a discussion of changes in valuation techniques and related inputs during the period. These inputs are
summarized in the three broad levels listed below:
|
Level 1 –
|
Unadjusted, quoted prices in active markets for identical instruments that the Fund has the ability to access at the date of measurement.
|
|
|
Level 2 –
|
Other significant observable inputs (including, but not limited to, quoted prices in active markets for similar instruments, quoted prices in markets that are not active for identical or
similar instruments, and model-derived valuations in which all significant inputs and significant value drivers are observable in active markets, such as interest rates, prepayment speeds, credit risk curves, default
rates, and similar data).
|
|
|
Level 3 –
|
Significant unobservable inputs (including the Fund’s own assumptions about what market participants would use to price the asset or liability based on the best available information) when
observable inputs are unavailable.
|
|
HENNESSY FUNDS
|
1-800-966-4354
|
17
The following is a description of the valuation techniques applied to the Fund’s major categories of assets and liabilities measured at fair value on a recurring basis:
|
Equity Securities – Equity securities, including common stocks, preferred stocks, foreign-issued common stocks, exchange-traded funds, closed-end
mutual funds, partnerships, rights, and real estate investment trusts, that are traded on a securities exchange for which a last-quoted sales price is readily available will generally be valued at the last sales
price as reported by the primary exchange on which the securities are listed. Securities listed on The NASDAQ Stock Market (“NASDAQ”) will generally be valued at the NASDAQ Official Closing Price, which may differ
from the last sales price reported. Securities traded on a securities exchange for which a last-quoted sales price is not readily available will generally be valued at the mean between the bid and ask prices. To the
extent these securities are actively traded and valuation adjustments are not applied, they are classified in Level 1 of the fair value hierarchy. Securities traded on foreign exchanges generally are not valued at
the same time the Fund calculates its NAV because most foreign markets close well before such time. The earlier close of most foreign markets gives rise to the possibility that significant events, including broad
market moves, may have occurred in the interim. In certain circumstances, it may be determined that a foreign security needs to be fair valued because it appears that the value of the security might have been
materially affected by events occurring after the close of the market in which the security is principally traded, but before the time the Fund calculates its NAV, such as by a development that affects an entire
market or region (e.g., a weather-related event) or a potentially global development (e.g., a terrorist attack that may be expected to have an effect on investor expectations worldwide).
|
|
|
Registered Investment Companies – Investments in open-end registered investment companies, commonly referred to as mutual funds, generally are
priced at the ending NAV provided by the applicable mutual fund’s service agent and will be classified in Level 1 of the fair value hierarchy.
|
|
|
Debt Securities – Debt securities, including corporate bonds, asset-backed securities, mortgage-backed securities, municipal bonds, U.S. Treasuries,
and U.S. government agency issues, are generally valued at market on the basis of valuations furnished by an independent pricing service that utilizes both dealer-supplied valuations and formula-based techniques. The
pricing service may consider recently executed transactions in securities of the issuer or comparable issuers, market price quotations (where observable), bond spreads, and fundamental data relating to the issuer. In
addition, the model may incorporate observable market data, such as reported sales of similar securities, broker quotes, yields, bids, offers, and reference data. Certain securities are valued primarily using dealer
quotations. These securities are generally classified in Level 2 of the fair value hierarchy.
|
|
|
Short-Term Securities – Short-term equity investments, including money market funds, are valued in the manner specified above. Short-term debt
investments with an original term to maturity of 60 days or less are valued at amortized cost, which approximates fair market value. If the original term to maturity of a short-term debt investment exceeded 60 days,
then the values as of the 61st day prior to maturity are amortized. Amortized cost is not used if its use would be inappropriate due to credit or other impairments of the issuer, in which case the security’s fair
value would be determined, as described below. Short-term securities are generally classified in Level 1 or Level 2 of the fair value hierarchy depending on the inputs used and market activity levels for specific
securities.
|
|
HENNESSYFUNDS.COM
|
18
|
NOTES TO THE FINANCIAL STATEMENTS
|
The Board of Trustees of the Fund (the “Board”) has adopted fair value pricing procedures that are followed when a price for a security is not readily available or if a
significant event has occurred that indicates the closing price of a security no longer represents the true value of that security. Fair value pricing determinations are made in good faith in accordance with these
procedures. There are numerous criteria that will be given consideration in determining a fair value of a security, such as the trading volume of a security and markets, the values of other similar securities, and news
events with direct bearing on a security or markets. Fair value pricing results in an estimated price for a security that reflects the amount the Fund might reasonably expect to receive in a current sale. Depending on the
relative significance of the valuation inputs, these securities may be classified in either Level 2 or Level 3 of the fair value hierarchy.
The fair value of foreign securities may be determined with the assistance of a pricing service using correlations between the movement of prices of such securities and indices
of domestic securities and other appropriate indicators, such as closing market prices of relevant American Depositary Receipts or futures contracts. Using fair value pricing means that the Fund’s NAV reflects the affected
portfolio securities’ values as determined by the Board or its designee, pursuant to the fair value pricing procedures adopted by the Board, instead of being determined by the market. Using a fair value pricing methodology
to price a foreign security may result in a value that is different from such foreign security’s most recent closing price and from the value used by other investment companies to calculate their NAVs. Such securities are
generally classified in Level 2 of the fair value hierarchy. Because the Fund may invest in foreign securities, the value of the Fund’s portfolio securities may change on days when you will not be able to purchase or redeem
your shares.
The Board has delegated day-to-day valuation matters to the Valuation and Liquidity Committee comprising representatives from Hennessy Advisors, Inc., the Fund’s investment
advisor (the “Advisor”). The function of the Valuation and Liquidity Committee is to value securities where current and reliable market quotations are not readily available. All actions taken by the Valuation and Liquidity
Committee are reviewed by the Board.
The Fund has performed an analysis of all existing investments to determine the significance and character of all inputs to their fair value determinations. Various inputs are
used to determine the value of the Fund’s investments. The inputs or methodology used for valuing securities are not necessarily an indication of the risk associated with investing in those securities. Details related to the
fair value hierarchy of the Fund’s securities as of April 30, 2020, are included in the Schedule of Investments.
4). INVESTMENT TRANSACTIONS
Purchases and sales of investment securities (excluding government and short-term investments) for the Fund during the six months ended April 30, 2020, were $23,539,378 and $26,252,689,
respectively.
There were no purchases or sales/maturities of long-term U.S. government securities for the Fund during the six months ended April 30, 2020.
The Fund is permitted to purchase or sell securities from or to another fund in the Hennessy Funds family of funds (collectively, the “Hennessy Funds”) under specified conditions
outlined in procedures adopted by the Board. The procedures have been designed to ensure that any purchase or sale of securities by the Fund from or to another Hennessy Fund complies with Rule 17a-7 of the Investment Company
Act of 1940, as amended. During the six months ended April 30, 2020, the Fund did not engage in purchases or sales of securities pursuant to Rule 17a-7 of the Investment Company Act of 1940, as amended.
|
HENNESSY FUNDS
|
1-800-966-4354
|
19
5). INVESTMENT ADVISORY FEE AND OTHER TRANSACTIONS WITH AFFILIATES
The Advisor provides the Fund with investment advisory services under an Investment Advisory Agreement. The Advisor furnishes all investment advice, office space, and facilities and most of the
personnel needed by the Fund. As compensation for its services, the Advisor is entitled to a monthly fee from the Fund. The fee is based on the average daily net assets of the Fund at an annual rate of 0.90%. The net
investment advisory fees expensed by the Fund during the six months ended April 30, 2020, are included in the Statement of Operations.
The Board has approved a Shareholder Servicing Agreement for Investor Class shares of the Fund, which was instituted to compensate the Advisor for the non-investment advisory
services it provides to the Fund. The Shareholder Servicing Agreement provides for a monthly fee paid to the Advisor at an annual rate of 0.10% of the average daily net assets of the Fund attributable to Investor Class
shares. The shareholder service fees expensed by the Fund during the six months ended April 30, 2020, are included in the Statement of Operations.
The Fund has adopted a plan pursuant to Rule 12b-1 under the Investment Company Act of 1940, as amended, that authorizes payments in connection with the distribution of the
Fund’s shares at an annual rate of up to 0.25% of the Fund’s average daily net assets attributable to Investor Class shares. Even though the authorized rate is up to 0.25%, the Fund is currently only using up to 0.15% of its
average daily net assets attributable to Investor Class shares for such purpose. Amounts paid under the plan may be spent on any activities or expenses primarily intended to result in the sale of shares, including, but not
limited to, advertising, shareholder account servicing, printing and mailing of prospectuses to other than current shareholders, printing and mailing of sales literature, and compensation for sales and marketing activities
or to financial institutions and others, such as dealers and distributors. The distribution fees expensed by the Fund during the six months ended April 30, 2020, are included in the Statement of Operations.
The Fund has entered into agreements with various brokers, dealers, and financial intermediaries in connection with the sale of shares of the Fund. The agreements provide for
periodic payments of sub-transfer agent expenses by the Fund to the brokers, dealers, and financial intermediaries for providing certain shareholder maintenance services. These shareholder services include the pre-processing
and quality control of new accounts, shareholder correspondence, answering customer inquiries regarding account status, and facilitating shareholder telephone transactions. The sub-transfer agent fees expensed by the Fund
during the six months ended April 30, 2020, are included in the Statement of Operations.
U.S. Bancorp Fund Services, LLC, d/b/a U.S. Bank Global Fund Services (“Fund Services”) provides the Fund with administrative, accounting, and transfer agent services. As
administrator, Fund Services is responsible for activities such as (i) preparing various federal and state regulatory filings, reports, and returns for the Fund, (ii) preparing reports and materials to be supplied to the
Board, (iii) monitoring the activities of the Fund’s custodian, transfer agent, and accountants, and (iv) coordinating the preparation and payment of the Fund’s expenses and reviewing the Fund’s expense accruals. U.S. Bank
N.A., an affiliate of Fund Services, serves as the Fund’s custodian. The servicing agreements between the Trust and Fund Services and U.S. Bank N.A. contain a fee schedule that is inclusive of administrative, accounting,
custody, and transfer agent fees. The administrative, accounting, custody, and transfer agent fees expensed by the Fund during the six months ended April 30, 2020, are included in the Statement of Operations.
Quasar Distributors, LLC (“Quasar”) acts as the Fund’s principal underwriter in a continuous public offering of the Fund’s shares. Quasar was an affiliate of Fund Services
|
HENNESSYFUNDS.COM
|
20
|
NOTES TO THE FINANCIAL STATEMENTS
|
and U.S. Bank N.A. through March 30, 2020. Effective March 31, 2020, Foreside Financial Group, LLC (“Foreside”) acquired Quasar from Fund Services. As a result of the acquisition, Quasar became a
wholly owned broker-dealer subsidiary of Foreside and is no longer affiliated with Fund Services or U.S. Bank N.A. The Board approved a new Distribution Agreement to enable Quasar to continue serving as the Fund’s
distributor.
The officers of the Fund are affiliated with the Advisor. With the exception of the Chief Compliance Officer and the Senior Compliance Officer, such officers receive no
compensation from the Fund for serving in their respective roles. The Fund, along with the other Hennessy Funds, makes reimbursement payments on an equal basis to the Advisor for a portion of the salary and benefits
associated with the office of the Chief Compliance Officer and for all of the salary and benefits associated with the office of the Senior Compliance Officer. The compliance fees expensed by the Fund during the six months
ended April 30, 2020, are included in the Statement of Operations.
6). GUARANTEES AND INDEMNIFICATIONS
Under the Hennessy Funds’ organizational documents, their officers and trustees are indemnified by the Hennessy Funds against certain liabilities arising out of the performance of their duties to
the Hennessy Funds. Additionally, in the normal course of business, the Hennessy Funds enter into contracts with service providers that contain general indemnification clauses. The Fund’s maximum exposure under these
arrangements is unknown as this would involve future claims that may be made against the Fund that have not yet occurred. Currently, the Fund expects the risk of loss to be remote.
7). LINE OF CREDIT
The Fund has an uncommitted line of credit with the other Hennessy Funds in the amount of the lesser of (i) $100,000,000 or (ii) 33.33% of each Hennessy Fund’s net assets, or 30% for the Hennessy
Gas Utility Fund and 10% for the Hennessy Balanced Fund, intended to provide short-term financing, if necessary, subject to certain restrictions, in connection with shareholder redemptions. The credit facility is with the
Hennessy Funds’ custodian bank, U.S. Bank N.A. Borrowings under this arrangement bear interest at the bank’s prime rate and are secured by all of the Fund’s assets (as to its own borrowings only). During the six months ended
April 30, 2020, the Fund had an outstanding average daily balance and a weighted average interest rate of $24,989 and 3.25%, respectively. The interest expensed by the Fund during the six months ended April 30, 2020, is
included in the Statement of Operations. The maximum amount outstanding for the Fund during the period was $2,375,000. As of April 30, 2020, the Fund did not have any borrowings outstanding under the line of credit.
8). FEDERAL TAX INFORMATION
As of October 31, 2019, the Fund’s most recent fiscal year end, the components of accumulated earnings (losses) for income tax purposes were as follows:
|
Investments
|
|||||
|
Cost of investments for tax purposes
|
$
|
36,407,512
|
|||
|
Gross tax unrealized appreciation
|
$
|
9,841,735
|
|||
|
Gross tax unrealized depreciation
|
(1,047,941
|
)
|
|||
|
Net tax unrealized appreciation/(depreciation)
|
$
|
8,793,794
|
|||
|
Undistributed ordinary income
|
$
|
—
|
|||
|
Undistributed long-term capital gains
|
—
|
||||
|
Total distributable earnings
|
$
|
—
|
|||
|
Other accumulated gain/(loss)
|
$
|
(2,551,363
|
)
|
||
|
Total accumulated gain/(loss)
|
$
|
6,242,431
|
|||
|
HENNESSY FUNDS
|
1-800-966-4354
|
21
The difference between book-basis unrealized appreciation/depreciation and tax-basis unrealized appreciation/depreciation (as shown above) is attributable primarily to wash sales
and late-year ordinary losses.
As of October 31, 2019, the Fund had capital loss carryforwards as follows:
$2,487,109 Unlimited Short-Term
As of October 31, 2019, the Fund deferred, on a tax basis, a late-year ordinary loss of $64,254. Late-year ordinary losses are net ordinary losses incurred after December 31,
2018, but within the taxable year, that are deemed to arise on the first day of the Fund’s next taxable year.
During fiscal year 2020 (year to date) and fiscal year 2019, the tax character of distributions paid by the Fund was as follows:
|
Six Months Ended
|
Year Ended
|
||||||||
|
April 30, 2020
|
October 31, 2019
|
||||||||
|
Ordinary income(1)
|
$
|
—
|
$
|
—
|
|||||
|
Long-term capital gain
|
—
|
1,232,913
|
|||||||
|
$
|
—
|
$
|
1,232,913
|
||||||
|
(1) Ordinary income includes short-term capital gain.
|
9). EVENTS SUBSEQUENT TO PERIOD END
Management has evaluated the Fund’s related events and transactions that occurred subsequent to April 30, 2020, through the date of issuance of the Fund’s financial statements. Management has
determined that there were no subsequent events requiring recognition or disclosure in the financial statements.
|
HENNESSYFUNDS.COM
|
22
|
NOTES TO THE FINANCIAL STATEMENTS/EXPENSE EXAMPLE
|
Expense Example (Unaudited)
April 30, 2020
As a shareholder of the Fund, you incur ongoing costs, including management fees, service fees, and other Fund expenses. This Example is intended to help you understand your ongoing costs (in
dollars) of investing in the Fund and to compare these costs with the ongoing costs of investing in other mutual funds. The Example is based on an investment of $1,000 invested at the beginning of the period and held for the
entire period from November 1, 2019, through April 30, 2020.
Actual Expenses
The first line of the table below under the “Investor Class” and “Institutional Class” headings provides information about actual account values and actual expenses. Although the Fund charges no
sales loads or transaction fees, you will be assessed fees for outgoing wire transfers, returned checks and stop payment orders at prevailing rates charged by U.S. Bank Global Fund Services, the Fund’s transfer agent. If you
request that a redemption be made by wire transfer, currently a $15 fee is charged by the Fund’s transfer agent. IRA accounts will be charged a $15 annual maintenance fee. The example below includes, but is not limited to,
management fees, shareholder servicing fees, accounting, custody, and transfer agent fees. However, the example below does not include portfolio trading commissions and related expenses. You may use the information in this
line, together with the amount you invested, to estimate the expenses that you paid over the period. Simply divide your account value by $1,000 (for example, an $8,600 account value divided by $1,000 = 8.6), then multiply
the result by the number in the first line of the table under the “Investor Class” or “Institutional Class” headings in the column entitled “Expenses Paid During Period” to estimate the expenses you paid on your account
during this period.
Hypothetical Example for Comparison Purposes
The second line of the table below under the “Investor Class” and “Institutional Class” headings provides information about hypothetical account values and hypothetical expenses based on the Fund’s
actual expense ratios and an assumed rate of return of 5% per year before expenses, which is not the Fund’s actual return. The hypothetical account values and expenses may not be used to estimate the actual ending account
balance or expenses you paid for the period. You may use this information to compare the ongoing costs of investing in the Fund and other funds. To do so, compare this 5% hypothetical example with the 5% hypothetical
examples that appear in the shareholder reports of the other funds. Please note that the expenses shown in the table are meant to highlight your ongoing costs only. Therefore, the second line of the table under the “Investor
Class” and “Institutional Class” headings is useful in comparing ongoing costs only and will not help you determine the relative total costs of owning different funds.
|
HENNESSY FUNDS
|
1-800-966-4354
|
23
|
Beginning
|
Ending
|
||
|
Account Value
|
Account Value
|
Expenses Paid
|
|
|
November 1, 2019
|
April 30, 2020
|
During Period(1)
|
|
|
Investor Class
|
|||
|
Actual
|
$1,000.00
|
$ 902.30
|
$8.28
|
|
Hypothetical (5% return before expenses)
|
$1,000.00
|
$1,016.16
|
$8.77
|
|
Institutional Class
|
|||
|
Actual
|
$1,000.00
|
$ 903.40
|
$6.67
|
|
Hypothetical (5% return before expenses)
|
$1,000.00
|
$1,017.85
|
$7.07
|
|
(1)
|
Expenses are equal to the Fund’s annualized expense ratio of 1.75% for Investor Class shares or 1.41% for Institutional Class shares, as applicable, multiplied by the average account value
over the period, multiplied by 182/366 days (to reflect the half-year period).
|
|
HENNESSYFUNDS.COM
|
24
|
EXPENSE EXAMPLE — ELECTRONIC DELIVERY
|
How to Obtain a Copy of the Fund’s Proxy
Voting Policy and Proxy Voting Records
A description of the policies and procedures the Fund uses to determine how to vote proxies relating to portfolio securities is available without charge (1) by calling 1-800-966-4354, (2) on the
Hennessy Funds’ website at www.hennessyfunds.com/proxy-voting/voting-policy, or (3) on the U.S. Securities and Exchange Commission’s (the “SEC”) website at www.sec.gov. The Fund’s proxy voting record is available without
charge on both the Hennessy Funds’ website at www.hennessyfunds.com/proxy-voting/voting-record and the SEC’s website at www.sec.gov no later than August 31 for the prior 12 months ending June 30.
Availability of Quarterly Portfolio Schedule
The Fund files a complete schedule of portfolio holdings with the SEC for the first and third quarters of each fiscal year as an exhibit to its reports on Form N-PORT. The Fund’s Forms N-PORT are
available on the SEC’s website at www.sec.gov or on request by calling 1-800-966-4354.
Federal Tax Distribution Information (Unaudited)
For fiscal year 2019, certain dividends paid by the Fund may be subject to a maximum tax rate of 23.8%, as provided for by the Jobs and Growth Tax Relief Reconciliation Act of 2003. The percentage
of dividends declared from ordinary income designated as qualified dividend income was 0.00%.
For corporate shareholders, the percent of ordinary income distributions that qualified for the corporate dividends received deduction for fiscal year 2019 was 0.00%.
The percentage of taxable ordinary income distributions that were designated as short-term capital gain distributions under Section 871(k)(2)(C) of the Internal Revenue Code of
1986, as amended, for the Fund was 0.00%.
Important Notice Regarding Delivery
of Shareholder Documents
To help keep the Fund’s costs as low as possible, we generally deliver a single copy of shareholder reports, proxy statements, and prospectuses to shareholders who share an address and have the
same last name. This process does not apply to account statements. You may request an individual copy of a shareholder document at any time. If you would like to receive separate mailings of shareholder documents, please
call U.S. Bank Global Fund Services at 1-800-261-6950 or 1-414-765-4124, and individual delivery will begin within 30 days of your request. If your account is held through a financial institution or other intermediary,
please contact such intermediary directly to request individual delivery.
Electronic Delivery
The Funds offer shareholders the option to receive account statements, prospectuses, tax forms, and shareholder reports online. To sign up for eDelivery, please visit www.hennessyfunds.com/account.
You may change your delivery preference at any time by visiting our website or calling U.S. Bank Global Fund Services at 1-800-261-6950 or 1-414-765-4124.
|
HENNESSY FUNDS
|
1-800-966-4354
|
25
Board Approval of Investment Advisory
Agreement
At its meeting on March 12, 2020, the Board of Trustees of the Fund (the “Board,” and the members thereof, the “Trustees”) unanimously approved the continuation of the investment advisory agreement
of the Fund with Hennessy Advisors, Inc. (the “Advisor”). As part of the process of approving the continuation of the advisory agreement, the Trustees reviewed their fiduciary duties and the relevant factors for them to
consider with respect to approving the advisory agreement. In addition, the Trustees who are not deemed “interested persons” (as defined by the Investment Company Act of 1940, as amended) of the Fund (the “Independent
Trustees”) met in executive session to discuss the approval of the advisory agreement.
In advance of the meeting, the Advisor sent detailed information to the Trustees to assist them in their evaluation of the advisory agreement. This information included, but was
not limited to, the following:
|
(1)
|
A memorandum from outside legal counsel that described the fiduciary duties of the Board with respect to approving the continuation of the advisory agreement and the relevant factors for
consideration;
|
|
|
(2)
|
A memorandum from the Advisor that listed the factors relevant to the Board’s approval of the continuation of the advisory agreement and also referenced the documents that had been provided
to help the Board assess each such factor;
|
|
|
(3)
|
An inventory of the services provided by the Advisor;
|
|
|
(4)
|
A written discussion of economies of scale;
|
|
|
(5)
|
A summary of the key terms of the advisory agreement;
|
|
|
(6)
|
A recent Fund fact sheet, which included performance information over various periods;
|
|
|
(7)
|
A peer expense comparison of the net expense ratio and investment advisory fee of the Fund; and
|
|
|
(8)
|
The Advisor’s financial statements from its most recent Form 10-K and Form 10-Q.
|
All of the factors discussed were considered as a whole by the Trustees and by the Independent Trustees meeting in executive session. The factors were viewed in their totality by
the Trustees, with no single factor being the principal or determinative factor in the Trustees’ determination of whether to approve the continuation of the advisory agreement. The Trustees recognized that the management and
fee arrangements for the Fund are the result of years of review and discussion between the Independent Trustees and the Advisor, that certain aspects of such arrangements may receive greater scrutiny in some years than in
others, and that the Trustees’ conclusions may be based, in part, on their consideration of these same arrangements and information received during the course of the year and in prior years.
Prior to approving the continuation of the advisory agreement, the Trustees, including the Independent Trustees in executive session, considered, among other items:
|
(1)
|
The nature and quality of the advisory services provided by the Advisor;
|
|
|
(2)
|
A comparison of the fees and expenses of the Fund to other similar funds;
|
|
|
(3)
|
Whether economies of scale are recognized by the Fund;
|
|
HENNESSYFUNDS.COM
|
26
|
BOARD APPROVAL OF INVESTMENT ADVISORY AGREEMENT
|
|
(4)
|
The costs and profitability of the Fund to the Advisor;
|
|
|
(5)
|
The performance of the Fund; and
|
|
|
(6)
|
Any benefits to the Advisor from serving as an investment advisor to the Fund (other than the advisory fee).
|
The material considerations and determinations of the Trustees, including the Independent Trustees, were as follows:
|
(1)
|
The Trustees considered the services identified below that are provided by the Advisor. Based on this review, the Trustees concluded that the Advisor provides high-quality services to the
Fund and noted that their overall confidence in the Advisor was high. The Trustees also concluded that they were satisfied with the nature, extent, and quality of the advisory services provided to the Fund by the
Advisor and that the nature and extent of the services provided by the Advisor were appropriate to assure that the Fund’s operations are conducted in compliance with applicable laws, rules, and regulations.
|
|
(a)
|
The Advisor acts as the portfolio manager for the Fund. In this capacity, the Advisor does the following:
|
|
(i)
|
manages the composition of the Fund’s portfolio, including the purchase, retention, and disposition of portfolio securities in accordance with the Fund’s investment objectives, policies,
and restrictions;
|
|||
|
(ii)
|
seeks best execution for the Fund’s portfolio;
|
|||
|
(iii)
|
manages the use of soft dollars for the Fund; and
|
|||
|
(iv)
|
manages proxy voting for the Fund.
|
|
(b)
|
The Advisor performs a daily reconciliation of portfolio positions and cash for the Fund.
|
||
|
(c)
|
The Advisor monitors the liquidity of each Fund.
|
||
|
(d)
|
The Advisor monitors the Fund’s compliance with its investment objectives and restrictions.
|
||
|
(e)
|
The Advisor monitors compliance with federal securities laws, maintains a compliance program (including a code of ethics), conducts ongoing reviews of the compliance programs of the Fund’s
service providers, as feasible, conducts on-site visits to the Fund’s service providers, monitors incidents of abusive trading practices, reviews Fund expense accruals, payments, and fixed expense ratios, evaluates
insurance providers for fidelity bond, D&O/E&O insurance, and cybersecurity insurance coverage, manages regulatory examination compliance and responses, conducts employee compliance training, reviews reports
provided by service providers, and maintains books and records.
|
||
|
(f)
|
The Advisor oversees service providers that provide accounting, administration, distribution, transfer agency, custodial, sales, marketing, public relations, audit, information technology,
and legal services to the Fund.
|
||
|
(g)
|
The Advisor maintains in-house marketing and distribution departments on behalf of the Fund.
|
||
|
(h)
|
The Advisor is actively involved with preparing regulatory filings for the Fund, including writing and annually updating the Fund’s prospectus and related documents.
|
|
HENNESSY FUNDS
|
1-800-966-4354
|
27
|
(i)
|
For each annual report of the Fund, the Advisor prepares a written summary of the Fund’s performance during the most recent 12-month period.
|
||
|
(j)
|
The Advisor oversees distribution of the Fund through third-party broker/dealers and independent financial institutions such as Charles Schwab, Inc., Fidelity, TD Ameritrade, and Pershing.
The Advisor participates in “no transaction fee” (“NTF”) programs with these companies on behalf of the Fund, which allow customers to purchase the Fund through third-party distribution channels without paying a
transaction fee. The Advisor compensates, in part, a number of these third-party providers of NTF programs out of its own revenues.
|
||
|
(k)
|
The Advisor pays the incentive compensation of the Fund’s compliance officers and employs other staff, such as legal, marketing, national accounts, distribution, sales, administrative, and
trading oversight personnel, as well as management executives.
|
||
|
(l)
|
The Advisor provides a quarterly compliance certification to the Board.
|
||
|
(m)
|
The Advisor prepares or reviews all Board materials, frequently presents to the Board and leads Board discussions, prepares or reviews all meeting minutes, and arranges for Board training
and education.
|
|
(2)
|
The Trustees compared the performance of the Fund to benchmark indices over various periods and also noted that the Trustees review and discuss reports comparing the investment performance
of the Fund to various indices at each quarterly Board meeting. Based on such information, the Trustees determined that the Advisor manages the Fund in a manner materially consistent with its stated investment
objective and style. The Trustees concluded that the performance of the Fund over various periods warranted continuation of the advisory agreement.
|
|
|
(3)
|
The Trustees reviewed the advisory fees and overall expense ratios of the Fund compared to other funds similar in asset size and investment objective to the Fund using data from
Morningstar. As part of the discussion with management, the Trustees ensured that they understood and were comfortable with the criteria used to determine the mutual funds included in the Morningstar categories for
purposes of the materials considered at the meeting. The Trustees determined that the advisory fee and overall expense ratio of the Fund falls within the range of the advisory fees and overall expense ratios of other
comparable funds and concluded that they are reasonable and warranted continuation of the advisory agreement.
|
|
|
(4)
|
The Trustees also considered whether the Advisor was realizing economies of scale that it should share with the Fund’s shareholders. In addition, the Trustees noted that many of the
expenses incurred to manage the Fund are asset-based fees, so the Advisor does not realize material economies of scale relating to those expenses as the assets of the Fund increase. For example, mutual fund platform
fees increase as the Fund’s assets grow. The Trustees also considered the Advisor’s efforts to contain expenses through actions such as renegotiating service contracts, the Advisor’s significant marketing efforts to
promote the Funds, the Advisor’s investments in personnel to manage the Funds, and the Advisor’s agreement to waive fees or lower its management fees in certain circumstances. The Trustees noted that it did not
appear that the Advisor was
|
|
HENNESSYFUNDS.COM
|
28
|
BOARD APPROVAL OF INVESTMENT ADVISORY AGREEMENT
|
|
realizing economies of scale at current asset levels and concluded that it would continue to monitor economies of scale in the future as circumstances changed.
|
||
|
(5)
|
The Trustees considered the profitability of the Advisor, including the impact of mutual fund platform fees on the Advisor’s profitability, and also considered the resources and revenues
that the Advisor has put into managing and distributing the Fund. The Trustees then concluded that the profits of the Advisor are reasonable and not excessive when compared to profitability guidelines set forth in
relevant court cases.
|
|
|
(6)
|
The Trustees considered the high level of professionalism and knowledge of the Advisor’s employees, along with a very low level of turnover, and concluded that this was beneficial to the
Fund and its shareholders.
|
|
|
(7)
|
The Trustees considered any benefits to the Advisor from serving as an advisor to the Fund (other than the advisory fee). The Trustees noted that the Advisor may derive ancillary benefits
from, by way of example, its association with the Fund in the form of proprietary and third-party research products and services received from broker-dealers that execute portfolio trades for the Fund. The Trustees
determined that any such products and services have been used for legitimate purposes relating to the Fund by providing assistance in the investment decision-making process. The Trustees concluded that any additional
benefits realized by the Advisor from its relationship with the Fund were reasonable, which was based on, among other things, the Trustees’ finding that the research, analytical, statistical, and other information
and services provided by brokers are merely supplemental to the Advisor’s own efforts in the performance of its duties under the advisory agreement.
|
After reviewing the materials and information provided at the meeting, as well as other information regularly provided at the Board’s quarterly meetings throughout the year
regarding the quality of services provided by the Advisor, the performance of the Fund, expense information, brokerage commissions information, the adequacy and efficacy of the Advisor’s written policies and procedures,
other regulatory compliance issues, trading information and related matters, and other factors that the Trustees deemed relevant, the Trustees, including the Independent Trustees, approved the continuation of the advisory
agreement.
|
HENNESSY FUNDS
|
1-800-966-4354
|
29
For information, questions, or assistance, please call
The Hennessy Funds
1-800-966-4354 or 1-415-899-1555
INVESTMENT ADVISOR
Hennessy Advisors, Inc.
7250 Redwood Boulevard, Suite 200
Novato, California 94945
ADMINISTRATOR,
TRANSFER AGENT,
DIVIDEND PAYING AGENT, &
SHAREHOLDER SERVICING AGENT
U.S. Bancorp Fund Services, LLC
d/b/a U.S. Bank Global Fund Services
P.O. Box 701
Milwaukee, Wisconsin 53201-0701
CUSTODIAN
U.S. Bank N.A.
Custody Operations
1555 North River Center Drive, Suite 302
Milwaukee, Wisconsin 53212
TRUSTEES
Neil J. Hennessy
Robert T. Doyle
J. Dennis DeSousa
Gerald P. Richardson
COUNSEL
Foley & Lardner LLP
777 East Wisconsin Avenue
Milwaukee, Wisconsin 53202-5306
INDEPENDENT REGISTERED
PUBLIC ACCOUNTING FIRM
Tait, Weller & Baker LLP
Two Liberty Place
50 South 16th Street, Suite 2900
Philadelphia, Pennsylvania 19102-2529
DISTRIBUTOR
Quasar Distributors, LLC
111 East Kilbourn Avenue, Suite 2200
Milwaukee, Wisconsin 53202
www.hennessyfunds.com | 1-800-966-4354
This report has been prepared for shareholders and may be distributed to
others only if preceded or accompanied by a current prospectus.
SEMI-ANNUAL REPORT
APRIL 30, 2020
HENNESSY SMALL CAP FINANCIAL FUND
Investor Class HSFNX
Institutional Class HISFX
IMPORTANT NOTICE REGARDING ELECTRONIC DELIVERY OF SHAREHOLDER REPORTS
Beginning on January 1, 2021, as permitted by regulations adopted by the Securities and Exchange Commission, paper copies of the annual and
semi-annual reports will no longer be sent by mail unless you specifically request paper copies from the Hennessy Funds or from your financial intermediary. Instead, the reports will be made available on a
website, and you will be notified by mail each time a report is posted and provided with a website link to access the report.
If you have already elected to receive shareholder reports electronically, you will not be affected by this change and you need not take any action. You may elect to receive shareholder reports and other communications from the Hennessy Funds electronically by visiting www.hennessyfunds.com/account or by calling U.S. Bank Global Fund Services at
1-800-261-6950. If you own shares in a Fund through a financial intermediary, please contact your financial intermediary to make this election.
You may elect to receive paper copies of all future reports free of charge by calling U.S. Bank Global Fund Services at 1-800-261-6950 or, if
you own your shares through a financial intermediary, by contacting your financial intermediary. Your election to receive paper copies of reports will apply to all Funds in the Hennessy Funds family.
hennessyfunds.com | 1-800-966-4354
(This Page Intentionally Left Blank.)
Contents
|
Letter to Shareholders
|
2
|
|
Performance Overview
|
4
|
|
Financial Statements
|
|
|
Schedule of Investments
|
5
|
|
Statement of Assets and Liabilities
|
8
|
|
Statement of Operations
|
9
|
|
Statements of Changes in Net Assets
|
11
|
|
Financial Highlights
|
12
|
|
Notes to the Financial Statements
|
16
|
|
Expense Example
|
23
|
|
Proxy Voting Policy and Proxy Voting Records
|
25
|
|
Availability of Quarterly Portfolio Schedule
|
25
|
|
Federal Tax Distribution Information
|
25
|
|
Important Notice Regarding Delivery of Shareholder Documents
|
25
|
|
Electronic Delivery
|
25
|
|
Board Approval of Investment Advisory Agreement
|
26
|
|
HENNESSY FUNDS
|
1-800-966-4354
|
June 2020
Dear Hennessy Funds Shareholder:
First and foremost, I hope this communication finds you and your loved ones safe and healthy. In many ways, the COVID-19 pandemic has turned the world upside down in recent months, and we at
Hennessy have joined the rest of the world in witnessing and experiencing its profound effect on public health, the global economy, and the everyday lives of people around the world. In response to the crisis, we invoked
our business continuity plan in mid-March to ensure a smooth transition to remote work for all of our employees, who have been working safely and productively from home. We want to assure our Hennessy Funds shareholders
that our operations are uninterrupted and functioning normally.
The past six months have been marked by extremes. During the first half of the period from November 2019 through January 2020, the bull market, supported by strong corporate
fundamentals, continued to move higher, and investors appeared focused on record-low unemployment and strong economic growth. In mid-February, the major U.S. market indices hit all-time highs, but then, within just a
matter of weeks, lost over one-third of their values as the COVID-19 pandemic unfolded. Shelter-in-place and business closure orders rippled through the nation, causing initial unemployment claims to skyrocket to their
highest number in history. The market then rallied back and posted double-digit positive returns in April.
For the six months ended April 30, 2020, on a total return basis, the Dow Jones Industrial Average was down 8.9% and the S&P 500® Index was down 3.2%. Small-cap and mid-cap stocks generally fared worse than large-cap stocks during the period, and the Financial sector was particularly hard hit as the
Federal Reserve aggressively cut the federal funds rate in an effort to stabilize the economy. The Energy sector was crushed by both the sudden loss of demand due to COVID-19 and the oversupply caused by the surprise
market-share battle between Russia and Saudi Arabia, and the S&P 500® Energy Sector Index ended the six-month period down over 30%.
The COVID-19 pandemic is an unprecedented event, and the duration and full extent of the economic impact is unknown. In the moment, there is always the concern that ‘this time
is different.’ But, when you are able to look at past financial, political, and health crises with the benefit of 20/20 hindsight, history has demonstrated that our economy and financial markets have always rebounded and
recovered eventually. If you look back to the last market downturn in 2008, economic fundamentals were weak compared to the market in 2020, where the overall underpinnings were – and are still – quite strong. Publicly
listed companies today have plenty of cash, with over $5 trillion on balance sheets of the S&P 500® companies alone, and I believe that
most will survive and that many may emerge from the current crisis even stronger.
|
HENNESSYFUNDS.COM
|
2
|
LETTER TO SHAREHOLDERS
|
We understand that this market volatility and economic uncertainty is jarring to many investors, and we continue to monitor events and the markets. We remain focused on
managing our high-conviction portfolios for the long-term benefit of our shareholders, and we are confident in the time-tested strategies and rigorous research that led to their formation. We encourage shareholders to
maintain a long-term investment horizon and to remain focused on long-term goals. As always, but especially in these trying times, we are here to support our shareholders, and we thank you for your continued investment and
trust. Should you have any questions or would like to speak with us directly, please don’t hesitate to call (800) 966-4354 or email us at fundsinfo@hennessyfunds.com.
Best regards,
Neil J. Hennessy
President and Chief Investment Officer
Past performance does not guarantee future results.
Mutual fund investing involves risk. Principal loss is possible.
The Dow Jones Industrial Average and S&P 500® Index are commonly used to measure the performance of U.S.
stocks. The S&P 500® Energy Sector Index is an index that comprises those companies included in the S&P 500 that are classified as
members of the GICS energy sector. One cannot invest directly in an index.
|
HENNESSY FUNDS
|
1-800-966-4354
|
3
Performance Overview (Unaudited)
AVERAGE ANNUAL TOTAL RETURN FOR PERIODS ENDED APRIL 30, 2020
|
Six
|
One
|
Five
|
Ten
|
|
|
Months(1)
|
Year
|
Years
|
Years
|
|
|
Hennessy Small Cap Financial Fund –
|
||||
|
Investor Class (HSFNX)
|
-27.19%
|
-26.55%
|
0.31%
|
2.68%
|
|
Hennessy Small Cap Financial Fund –
|
||||
|
Institutional Class (HISFX)
|
-27.06%
|
-26.38%
|
0.68%
|
2.99%
|
|
Russell 2000® Financial
|
||||
|
Services Index
|
-26.36%
|
-24.18%
|
1.96%
|
6.64%
|
|
Russell 2000® Index
|
-15.47%
|
-16.39%
|
2.88%
|
7.69%
|
Expense ratios: 1.59% (Investor Class); 1.24% (Institutional Class)
|
(1)
|
Periods of less than one year are not annualized.
|
_______________
Performance data quoted represents past performance; past performance does not guarantee future results. The investment return and principal value of an investment will
fluctuate so that an investor’s shares, when redeemed, may be worth more or less than their original cost. The performance table does not reflect the deduction of taxes that a shareholder would pay on Fund distributions or
the redemption of Fund shares. Current performance of the Fund may be lower or higher than the performance quoted. Performance data current to the most recent month end may be obtained by visiting www.hennessyfunds.com.
Performance for periods on or prior to October 26, 2012, is that of the FBR Small Cap Financial Fund.
The Russell 2000® Financial Services Index is a subset of the Russell 2000® Index that measures the performance of the securities classified in the financial services sector of the small-capitalization U.S. equity market. The Russell 2000® Index comprises the smallest 2,000 companies in the Russell 3000®
Index based on market capitalization, representing approximately 8% of the Russell 3000® Index in terms of total market capitalization. One
cannot invest directly in an index. These indices are used herein for comparative purposes in accordance with SEC regulations.
Frank Russell Company (“Russell”) is the source and owner of the trademarks, service marks, and copyrights related to the Russell Indexes. Russell® is a trademark of Russell. Neither Russell nor its licensors accept any liability for any errors or omissions in the Russell Indexes or Russell ratings or underlying data and
no party may rely on any Russell Indexes or Russell ratings or underlying data contained in this communication. No further distribution of Russell data is permitted without Russell’s express written consent. Russell does
not promote, sponsor, or endorse the content of this communication.
The expense ratios presented are from the most recent prospectus. The expense ratios for the current reporting period are available in the Financial Highlights section of this report.
|
HENNESSYFUNDS.COM
|
4
|
PERFORMANCE OVERVIEW/SCHEDULE OF INVESTMENTS
|
Financial Statements
|
Schedule of Investments as of April 30, 2020 (Unaudited)
|
HENNESSY SMALL CAP FINANCIAL FUND
(% of Net Assets)
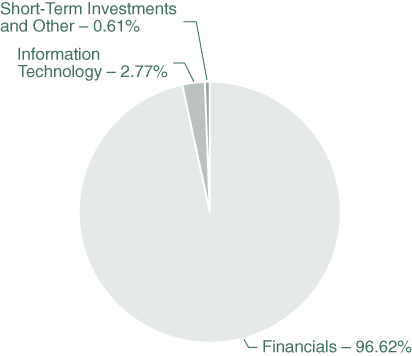
|
TOP TEN HOLDINGS (EXCLUDING MONEY MARKET FUNDS)
|
% NET ASSETS
|
|
PennyMac Financial Services, Inc.
|
5.25%
|
|
First Midwest Bancorp, Inc.
|
5.15%
|
|
Meridian Bancorp, Inc.
|
5.13%
|
|
Hingham Institution for Savings
|
4.84%
|
|
First BanCorp.
|
4.71%
|
|
Opus Bank
|
4.71%
|
|
Wintrust Financial Corp.
|
4.64%
|
|
Webster Financial Corp.
|
4.47%
|
|
Synovus Financial Corp.
|
4.16%
|
|
Lakeland Bancorp, Inc.
|
4.07%
|
Note: For presentation purposes, the Fund has grouped some of the industry categories. For purposes of categorizing securities for compliance with Section 8(b)(1) of the Investment Company Act of
1940, as amended, the Fund uses more specific industry classifications.
The Global Industry Classification Standard (GICS®) was developed by and is the exclusive property and a service
mark of MSCI, Inc. and Standard & Poor’s Financial Services LLC. It has been licensed for use by the Hennessy Funds.
|
HENNESSY FUNDS
|
1-800-966-4354
|
5
|
COMMON STOCKS – 99.39%
|
Number
|
% of
|
||||||||||
|
|
of Shares
|
Value
|
Net Assets
|
|||||||||
|
Financials – 96.62%
|
||||||||||||
|
Associated Banc-Corp.
|
145,000
|
$
|
2,050,300
|
3.24
|
%
|
|||||||
|
Atlantic Union Bankshares Corp.
|
65,000
|
1,551,550
|
2.46
|
%
|
||||||||
|
Banc of California, Inc.
|
185,000
|
1,927,700
|
3.05
|
%
|
||||||||
|
Berkshire Hills Bancorp, Inc.
|
105,000
|
1,789,200
|
2.83
|
%
|
||||||||
|
Brookline Bancorp, Inc.
|
90,000
|
918,900
|
1.45
|
%
|
||||||||
|
Cadence BanCorp
|
255,000
|
1,688,100
|
2.67
|
%
|
||||||||
|
CIT Group, Inc.
|
50,000
|
949,000
|
1.50
|
%
|
||||||||
|
Columbia Financial, Inc. (a)
|
55,000
|
778,525
|
1.23
|
%
|
||||||||
|
ConnectOne Bancorp, Inc.
|
160,000
|
2,390,400
|
3.78
|
%
|
||||||||
|
First BanCorp. (b)
|
510,000
|
2,973,300
|
4.71
|
%
|
||||||||
|
First Midwest Bancorp, Inc.
|
220,000
|
3,251,600
|
5.15
|
%
|
||||||||
|
Green Dot Corp., Class A (a)
|
20,000
|
610,000
|
0.97
|
%
|
||||||||
|
HarborOne Bancorp, Inc. (a)
|
125,000
|
1,002,500
|
1.59
|
%
|
||||||||
|
Hingham Institution for Savings
|
20,000
|
3,060,400
|
4.84
|
%
|
||||||||
|
HomeTrust Bancshares, Inc.
|
120,000
|
1,844,400
|
2.92
|
%
|
||||||||
|
Independent Bank Corp.
|
22,500
|
1,640,025
|
2.60
|
%
|
||||||||
|
Kearny Financial Corp. of Maryland
|
80,000
|
744,000
|
1.18
|
%
|
||||||||
|
Lakeland Bancorp, Inc.
|
230,000
|
2,573,700
|
4.07
|
%
|
||||||||
|
Meridian Bancorp, Inc.
|
275,000
|
3,239,500
|
5.13
|
%
|
||||||||
|
Nicolet Bankshares, Inc. (a)
|
35,000
|
1,925,700
|
3.05
|
%
|
||||||||
|
OceanFirst Financial Corp.
|
45,000
|
758,250
|
1.20
|
%
|
||||||||
|
Opus Bank
|
155,000
|
2,979,100
|
4.71
|
%
|
||||||||
|
PennyMac Financial Services, Inc.
|
110,000
|
3,318,700
|
5.25
|
%
|
||||||||
|
People’s United Financial, Inc.
|
150,000
|
1,903,500
|
3.01
|
%
|
||||||||
|
Sterling Bancorp
|
135,000
|
1,664,550
|
2.63
|
%
|
||||||||
|
Synovus Financial Corp.
|
125,000
|
2,626,250
|
4.16
|
%
|
||||||||
|
Texas Capital Bancshares, Inc. (a)
|
72,500
|
2,014,050
|
3.19
|
%
|
||||||||
|
Umpqua Holdings Corp.
|
165,000
|
2,066,625
|
3.27
|
%
|
||||||||
|
United Community Banks, Inc.
|
50,000
|
1,057,250
|
1.67
|
%
|
||||||||
|
Webster Financial Corp.
|
100,000
|
2,825,000
|
4.47
|
%
|
||||||||
|
Wintrust Financial Corp.
|
70,000
|
2,933,000
|
4.64
|
%
|
||||||||
|
|
61,055,075
|
96.62
|
%
|
|||||||||
The accompanying notes are an integral part of these financial statements.
|
HENNESSYFUNDS.COM
|
6
|
SCHEDULE OF INVESTMENTS
|
|
COMMON STOCKS
|
Number
|
% of
|
||||||||||
|
|
of Shares
|
Value
|
Net Assets
|
|||||||||
|
Information Technology – 2.77%
|
||||||||||||
|
Alliance Data Systems Corp.
|
35,000
|
$
|
1,752,450
|
2.77
|
%
|
|||||||
|
|
||||||||||||
|
Total Common Stocks
|
||||||||||||
|
(Cost $68,763,156)
|
62,807,525
|
99.39
|
%
|
|||||||||
|
|
||||||||||||
|
SHORT-TERM INVESTMENTS – 0.73%
|
||||||||||||
|
Money Market Funds – 0.73%
|
||||||||||||
|
First American Government Obligations Fund,
|
||||||||||||
|
Institutional Class, 0.25% (c)
|
460,107
|
460,107
|
0.73
|
%
|
||||||||
|
|
||||||||||||
|
Total Short-Term Investments
|
||||||||||||
|
(Cost $460,107)
|
460,107
|
0.73
|
%
|
|||||||||
|
|
||||||||||||
|
Total Investments
|
||||||||||||
|
(Cost $69,223,263) – 100.12%
|
63,267,632
|
100.12
|
%
|
|||||||||
|
Liabilities in Excess of Other Assets – (0.12)%
|
(73,966
|
)
|
(0.12
|
)%
|
||||||||
|
|
||||||||||||
|
TOTAL NET ASSETS – 100.00%
|
$
|
63,193,666
|
100.00
|
%
|
||||||||
Percentages are stated as a percent of net assets.
|
(a)
|
Non-income-producing security.
|
|
(b)
|
U.S.-traded security of a foreign corporation.
|
|
(c)
|
The rate listed is the fund’s seven-day yield as of April 30, 2020.
|
Summary of Fair Value Exposure as of April 30, 2020
The following is a summary of the inputs used to value the Fund’s net assets as of April 30, 2020 (see Note 3 in the accompanying Notes to the Financial Statements):
|
Common Stocks
|
Level 1
|
Level 2
|
Level 3
|
Total
|
||||||||||||
|
Financials
|
$
|
61,055,075
|
$
|
—
|
$
|
—
|
$
|
61,055,075
|
||||||||
|
Information Technology
|
1,752,450
|
—
|
—
|
1,752,450
|
||||||||||||
|
Total Common Stocks
|
$
|
62,807,525
|
$
|
—
|
$
|
—
|
$
|
62,807,525
|
||||||||
|
Short-Term Investments
|
||||||||||||||||
|
Money Market Funds
|
$
|
460,107
|
$
|
—
|
$
|
—
|
$
|
460,107
|
||||||||
|
Total Short-Term Investments
|
$
|
460,107
|
$
|
—
|
$
|
—
|
$
|
460,107
|
||||||||
|
Total Investments
|
$
|
63,267,632
|
$
|
—
|
$
|
—
|
$
|
63,267,632
|
||||||||
The accompanying notes are an integral part of these financial statements.
|
HENNESSY FUNDS
|
1-800-966-4354
|
7
Financial Statements
|
Statement of Assets and Liabilities as of April 30, 2020 (Unaudited)
|
|
ASSETS:
|
||||
|
Investments in securities, at value (cost $69,223,263)
|
$
|
63,267,632
|
||
|
Dividends and interest receivable
|
42,445
|
|||
|
Receivable for fund shares sold
|
17,958
|
|||
|
Prepaid expenses and other assets
|
18,662
|
|||
|
Total assets
|
63,346,697
|
|||
|
LIABILITIES:
|
||||
|
Payable for fund shares redeemed
|
46,785
|
|||
|
Payable to advisor
|
42,560
|
|||
|
Payable to administrator
|
11,192
|
|||
|
Payable to auditor
|
11,459
|
|||
|
Accrued distribution fees
|
7,260
|
|||
|
Accrued service fees
|
4,080
|
|||
|
Accrued trustees fees
|
5,916
|
|||
|
Accrued expenses and other payables
|
23,779
|
|||
|
Total liabilities
|
153,031
|
|||
|
NET ASSETS
|
$
|
63,193,666
|
||
|
NET ASSETS CONSISTS OF:
|
||||
|
Capital stock
|
$
|
75,941,941
|
||
|
Accumulated deficit
|
(12,748,275
|
)
|
||
|
Total net assets
|
$
|
63,193,666
|
||
|
NET ASSETS:
|
||||
|
Investor Class
|
||||
|
Shares authorized (no par value)
|
Unlimited
|
|||
|
Net assets applicable to outstanding shares
|
$
|
54,583,397
|
||
|
Shares issued and outstanding
|
3,590,628
|
|||
|
Net asset value, offering price, and redemption price per share
|
$
|
15.20
|
||
|
Institutional Class
|
||||
|
Shares authorized (no par value)
|
Unlimited
|
|||
|
Net assets applicable to outstanding shares
|
$
|
8,610,269
|
||
|
Shares issued and outstanding
|
955,224
|
|||
|
Net asset value, offering price, and redemption price per share
|
$
|
9.01
|
||
The accompanying notes are an integral part of these financial statements.
|
HENNESSYFUNDS.COM
|
8
|
STATEMENT OF ASSETS AND LIABILITIES/STATEMENT OF OPERATIONS
|
Financial Statements
|
Statement of Operations for the six months ended April 30, 2020 (Unaudited)
|
|
INVESTMENT INCOME:
|
||||
|
Dividend income(1)
|
$
|
961,129
|
||
|
Interest income
|
27,603
|
|||
|
Total investment income
|
988,732
|
|||
|
EXPENSES:
|
||||
|
Investment advisory fees (See Note 5)
|
411,827
|
|||
|
Sub-transfer agent expenses – Investor Class (See Note 5)
|
74,268
|
|||
|
Sub-transfer agent expenses – Institutional Class (See Note 5)
|
6,762
|
|||
|
Distribution fees – Investor Class (See Note 5)
|
56,099
|
|||
|
Administration, accounting, custody, and transfer agent fees (See Note 5)
|
52,227
|
|||
|
Service fees – Investor Class (See Note 5)
|
37,399
|
|||
|
Federal and state registration fees
|
24,826
|
|||
|
Compliance expense (See Note 5)
|
13,462
|
|||
|
Audit fees
|
11,463
|
|||
|
Trustees’ fees and expenses
|
8,742
|
|||
|
Reports to shareholders
|
8,647
|
|||
|
Legal fees
|
640
|
|||
|
Other expenses
|
8,382
|
|||
|
Total expenses
|
714,744
|
|||
|
NET INVESTMENT INCOME
|
$
|
273,988
|
||
|
REALIZED AND UNREALIZED GAINS (LOSSES):
|
||||
|
Net realized loss on investments
|
$
|
(5,998,474
|
)
|
|
|
Net change in unrealized appreciation/depreciation on investments
|
(19,807,124
|
)
|
||
|
Net loss on investments
|
(25,805,598
|
)
|
||
|
NET DECREASE IN NET ASSETS RESULTING FROM OPERATIONS
|
$
|
(25,531,610
|
)
|
|
|
(1)
|
Net of foreign taxes withheld of $5,250.
|
The accompanying notes are an integral part of these financial statements.
|
HENNESSY FUNDS
|
1-800-966-4354
|
9
(This Page Intentionally Left Blank.)
|
HENNESSYFUNDS.COM
|
10
|
STATEMENTS OF CHANGES IN NET ASSETS
|
Financial Statements
|
Statements of Changes in Net Assets
|
|
Six Months Ended
|
||||||||
|
April 30, 2020
|
Year Ended
|
|||||||
|
(Unaudited)
|
October 31, 2019
|
|||||||
|
OPERATIONS:
|
||||||||
|
Net investment income
|
$
|
273,988
|
$
|
711,118
|
||||
|
Net realized gain (loss) on investments
|
(5,998,474
|
)
|
4,257,379
|
|||||
|
Net change in unrealized
|
||||||||
|
appreciation/depreciation on investments
|
(19,807,124
|
)
|
849,952
|
|||||
|
Net increase (decrease) in net assets
|
||||||||
|
resulting from operations
|
(25,531,610
|
)
|
5,818,449
|
|||||
|
DISTRIBUTIONS TO SHAREHOLDERS:
|
||||||||
|
Distributable earnings – Investor Class
|
(3,014,018
|
)
|
(7,622,114
|
)
|
||||
|
Distributable earnings – Institutional Class
|
(963,721
|
)
|
(2,386,465
|
)
|
||||
|
Total distributions
|
(3,977,739
|
)
|
(10,008,579
|
)
|
||||
|
CAPITAL SHARE TRANSACTIONS:
|
||||||||
|
Proceeds from shares subscribed – Investor Class
|
755,467
|
7,715,297
|
||||||
|
Proceeds from shares subscribed – Institutional Class
|
1,310,729
|
5,904,217
|
||||||
|
Dividends reinvested – Investor Class
|
2,952,871
|
7,476,720
|
||||||
|
Dividends reinvested – Institutional Class
|
935,074
|
2,340,222
|
||||||
|
Cost of shares redeemed – Investor Class
|
(14,032,670
|
)
|
(45,169,956
|
)
|
||||
|
Cost of shares redeemed – Institutional Class
|
(9,318,453
|
)
|
(21,638,108
|
)
|
||||
|
Net decrease in net assets derived
|
||||||||
|
from capital share transactions
|
(17,396,982
|
)
|
(43,371,608
|
)
|
||||
|
TOTAL DECREASE IN NET ASSETS
|
(46,906,331
|
)
|
(47,561,738
|
)
|
||||
|
NET ASSETS:
|
||||||||
|
Beginning of period
|
110,099,997
|
157,661,735
|
||||||
|
End of period
|
$
|
63,193,666
|
$
|
110,099,997
|
||||
|
CHANGES IN SHARES OUTSTANDING:
|
||||||||
|
Shares sold – Investor Class
|
46,241
|
400,923
|
||||||
|
Shares sold – Institutional Class
|
110,240
|
477,781
|
||||||
|
Shares issued to holders as reinvestment
|
||||||||
|
of dividends – Investor Class
|
136,924
|
373,487
|
||||||
|
Shares issued to holders as reinvestment
|
||||||||
|
of dividends – Institutional Class
|
72,426
|
195,642
|
||||||
|
Shares redeemed – Investor Class
|
(729,057
|
)
|
(2,193,955
|
)
|
||||
|
Shares redeemed – Institutional Class
|
(832,075
|
)
|
(1,754,857
|
)
|
||||
|
Net decrease in shares outstanding
|
(1,195,301
|
)
|
(2,500,979
|
)
|
||||
The accompanying notes are an integral part of these financial statements.
|
HENNESSY FUNDS
|
1-800-966-4354
|
11
Financial Statements
|
Financial Highlights
|
For an Investor Class share outstanding throughout each period
|
Six Months Ended
|
||||
|
April 30, 2020
|
||||
|
(Unaudited)
|
||||
|
PER SHARE DATA:
|
||||
|
Net asset value, beginning of period
|
$
|
21.60
|
||
|
Income from investment operations:
|
||||
|
Net investment income (loss)
|
0.05
|
(1)
|
||
|
Net realized and unrealized gains (losses) on investments
|
(5.70
|
)
|
||
|
Total from investment operations
|
(5.65
|
)
|
||
|
Less distributions:
|
||||
|
Dividends from net investment income
|
(0.09
|
)
|
||
|
Dividends from net realized gains
|
(0.66
|
)
|
||
|
Total distributions
|
(0.75
|
)
|
||
|
Net asset value, end of period
|
$
|
15.20
|
||
|
TOTAL RETURN
|
-27.19
|
%(3)
|
||
|
SUPPLEMENTAL DATA AND RATIOS:
|
||||
|
Net assets, end of period (millions)
|
$
|
54.58
|
||
|
Ratio of expenses to average net assets
|
1.63
|
%(4)
|
||
|
Ratio of net investment income (loss) to average net assets
|
0.53
|
%(4)
|
||
|
Portfolio turnover rate(5)
|
42
|
%(3)
|
||
|
(1)
|
Calculated using the average shares outstanding method.
|
|
(2)
|
Amount is between $(0.005) and $0.005.
|
|
(3)
|
Not annualized.
|
|
(4)
|
Annualized.
|
|
(5)
|
Calculated on the basis of the Fund as a whole.
|
The accompanying notes are an integral part of these financial statements.
|
HENNESSYFUNDS.COM
|
12
|
FINANCIAL HIGHLIGHTS — INVESTOR CLASS
|
|
Year Ended October 31,
|
||||||||||||||||||
|
2019
|
2018
|
2017
|
2016
|
2015
|
||||||||||||||
|
$
|
21.96
|
$
|
26.02
|
$
|
23.48
|
$
|
23.81
|
$
|
24.13
|
|||||||||
|
0.10
|
(1)
|
0.03
|
(0.04
|
)
|
0.10
|
0.03
|
(1)
|
|||||||||||
|
0.93
|
(2.12
|
)
|
5.83
|
1.20
|
2.99
|
|||||||||||||
|
1.03
|
(2.09
|
)
|
5.79
|
1.30
|
3.02
|
|||||||||||||
|
(0.07
|
)
|
0.00
|
(2)
|
(0.06
|
)
|
(0.03
|
)
|
—
|
||||||||||
|
(1.32
|
)
|
(1.97
|
)
|
(3.19
|
)
|
(1.60
|
)
|
(3.34
|
)
|
|||||||||
|
(1.39
|
)
|
(1.97
|
)
|
(3.25
|
)
|
(1.63
|
)
|
(3.34
|
)
|
|||||||||
|
$
|
21.60
|
$
|
21.96
|
$
|
26.02
|
$
|
23.48
|
$
|
23.81
|
|||||||||
|
5.27
|
%
|
-8.79
|
%
|
25.03
|
%
|
5.80
|
%
|
14.51
|
%
|
|||||||||
|
$
|
89.36
|
$
|
122.00
|
$
|
174.01
|
$
|
132.09
|
$
|
218.50
|
|||||||||
|
1.58
|
%
|
1.54
|
%
|
1.52
|
%
|
1.54
|
%
|
1.50
|
%
|
|||||||||
|
0.47
|
%
|
0.11
|
%
|
(0.06
|
)%
|
0.38
|
%
|
0.17
|
%
|
|||||||||
|
46
|
%
|
28
|
%
|
46
|
%
|
46
|
%
|
49
|
%
|
|||||||||
The accompanying notes are an integral part of these financial statements.
|
HENNESSY FUNDS
|
1-800-966-4354
|
13
Financial Statements
|
Financial Highlights
|
For an Institutional Class share outstanding throughout each period
|
Six Months Ended
|
||||
|
April 30, 2020
|
||||
|
(Unaudited)
|
||||
|
PER SHARE DATA:
|
||||
|
Net asset value, beginning of period
|
$
|
12.92
|
||
|
Income from investment operations:
|
||||
|
Net investment income
|
0.05
|
(1)
|
||
|
Net realized and unrealized gains (losses) on investments
|
(3.38
|
)
|
||
|
Total from investment operations
|
(3.33
|
)
|
||
|
Less distributions:
|
||||
|
Dividends from net investment income
|
(0.19
|
)
|
||
|
Dividends from net realized gains
|
(0.39
|
)
|
||
|
Total distributions
|
(0.58
|
)
|
||
|
Net asset value, end of period
|
$
|
9.01
|
||
|
TOTAL RETURN
|
-27.06
|
%(2)
|
||
|
SUPPLEMENTAL DATA AND RATIOS:
|
||||
|
Net assets, end of period (millions)
|
$
|
8.61
|
||
|
Ratio of expenses to average net assets
|
1.25
|
%(3)
|
||
|
Ratio of net investment income to average net assets
|
0.93
|
%(3)
|
||
|
Portfolio turnover rate(4)
|
42
|
%(2)
|
||
|
(1)
|
Calculated using the average shares outstanding method.
|
|
(2)
|
Not annualized.
|
|
(3)
|
Annualized.
|
|
(4)
|
Calculated on the basis of the Fund as a whole.
|
The accompanying notes are an integral part of these financial statements.
|
HENNESSYFUNDS.COM
|
14
|
FINANCIAL HIGHLIGHTS — INSTITUTIONAL CLASS
|
|
Year Ended October 31,
|
||||||||||||||||||
|
2019
|
2018
|
2017
|
2016
|
2015
|
||||||||||||||
|
$
|
13.28
|
$
|
15.69
|
$
|
14.23
|
$
|
14.39
|
$
|
14.53
|
|||||||||
|
0.10
|
(1)
|
0.07
|
0.02
|
0.09
|
0.06
|
(1)
|
||||||||||||
|
0.54
|
(1.27
|
)
|
3.56
|
0.75
|
1.81
|
|||||||||||||
|
0.64
|
(1.20
|
)
|
3.58
|
0.84
|
1.87
|
|||||||||||||
|
(0.18
|
)
|
(0.02
|
)
|
(0.17
|
)
|
(0.04
|
)
|
—
|
||||||||||
|
(0.82
|
)
|
(1.19
|
)
|
(1.95
|
)
|
(0.96
|
)
|
(2.01
|
)
|
|||||||||
|
(1.00
|
)
|
(1.21
|
)
|
(2.12
|
)
|
(1.00
|
)
|
(2.01
|
)
|
|||||||||
|
$
|
12.92
|
$
|
13.28
|
$
|
15.69
|
$
|
14.23
|
$
|
14.39
|
|||||||||
|
5.57
|
%
|
-8.42
|
%
|
25.56
|
%
|
6.22
|
%
|
14.91
|
%
|
|||||||||
|
$
|
20.74
|
$
|
35.66
|
$
|
37.92
|
$
|
21.27
|
$
|
25.94
|
|||||||||
|
1.23
|
%
|
1.15
|
%
|
1.15
|
%
|
1.17
|
%
|
1.17
|
%
|
|||||||||
|
0.84
|
%
|
0.51
|
%
|
0.30
|
%
|
0.72
|
%
|
0.48
|
%
|
|||||||||
|
46
|
%
|
28
|
%
|
46
|
%
|
46
|
%
|
49
|
%
|
|||||||||
The accompanying notes are an integral part of these financial statements.
|
HENNESSY FUNDS
|
1-800-966-4354
|
15
Financial Statements
|
Notes to the Financial Statements April 30, 2020 (Unaudited)
|
1). ORGANIZATION
The Hennessy Small Cap Financial Fund (the “Fund”) is a series of Hennessy Funds Trust (the “Trust”), which was organized as a Delaware statutory trust on September 17, 1992. The Fund is an
open-end management investment company registered under the Investment Company Act of 1940, as amended. The investment objective of the Fund is capital appreciation. The Fund is a non-diversified fund.
The Fund offers Investor Class and Institutional Class shares. Each class of shares differs principally in its respective 12b-1 distribution and service, shareholder servicing,
and sub-transfer agent expenses. There are no sales charges. Each class has identical rights to earnings, assets, and voting privileges, except for class-specific expenses and exclusive rights to vote on matters affecting
only one class.
As an investment company, the Fund follows the investment company accounting and reporting guidance of the Financial Accounting Standards Board (“FASB”) Accounting Standard
Codification Topic 946 “Financial Services—Investment Companies.”
2). SIGNIFICANT ACCOUNTING POLICIES
The following is a summary of significant accounting policies consistently followed by the Fund in the preparation of the financial statements. These policies conform to U.S. generally accepted
accounting principles (“GAAP”).
|
a).
|
Securities Valuation – All investments in securities are recorded at their estimated fair value, as described in Note 3.
|
|
b).
|
Federal Income Taxes – No provision for federal income taxes or excise taxes has been made because the Fund has elected to be taxed as a regulated investment company and intends to
distribute substantially all of its taxable income to its shareholders and otherwise comply with the provisions of the Internal Revenue Code of 1986, as amended, applicable to regulated investment companies. Net
investment income/loss and realized gains/losses for federal income tax purposes may differ from those reported in the financial statements because of temporary book and tax basis differences. Temporary differences
are primarily the result of the treatment of wash sales for tax reporting purposes. The Fund recognizes interest and penalties related to income tax benefits, if any, in the Statement of Operations as an income tax
expense. Distributions from net realized gains for book purposes may include short-term capital gains, which are included as ordinary income to shareholders for tax purposes. The Fund may utilize equalization
accounting for tax purposes and designate earnings and profits, including net realized gains distributed to shareholders on redemption of shares, as part of the dividends paid deduction for income tax purposes.
|
|
c).
|
Accounting for Uncertainty in Income Taxes – The Fund has accounting policies regarding recognition and measurement of tax positions taken or expected to be taken on a tax return. The tax
returns of the Fund for the prior three fiscal years are open for examination. The Fund has reviewed all open tax years in major jurisdictions and concluded that there is no impact on the Fund’s net assets and no
tax liability resulting from unrecognized tax benefits relating to uncertain income tax positions taken or expected to be taken on a tax return. The Fund’s major tax jurisdictions are U.S. federal and Delaware.
|
|
HENNESSYFUNDS.COM
|
16
|
NOTES TO THE FINANCIAL STATEMENTS
|
|
d).
|
Income and Expenses – Dividend income is recognized on the ex-dividend date or as soon as information is available to the Fund. Interest income, which includes the amortization of premium
and accretion of discount, is recognized on an accrual basis. Other non-cash dividends are recognized as investment income at the fair value of the property received. The Fund is charged for those expenses that are
directly attributable to its portfolio, such as advisory, administration, and certain shareholder service fees. Income, expenses (other than expenses attributable to a specific class), and realized and unrealized
gains/losses on investments are allocated to each class of shares based on such class’s net assets.
|
|
e).
|
Distributions to Shareholders – Dividends from net investment income for the Fund, if any, are declared and paid annually, usually in December. Distributions of net realized capital
gains, if any, are declared and paid annually, usually in December.
|
|
f).
|
Security Transactions – Investment and shareholder transactions are recorded on the trade date. The Fund determines the realized gain/loss from an investment transaction by comparing the
original cost of the security lot sold with the net sale proceeds. Discounts and premiums on securities purchased are accreted or amortized, respectively, over the life of each such security.
|
|
g).
|
Use of Estimates – The preparation of financial statements in conformity with GAAP requires management to make estimates and assumptions that affect the reported amounts of assets and
liabilities and disclosure of contingent assets and liabilities at the date of the financial statements and the reported change in net assets during the reporting period. Actual results could differ from those
estimates.
|
|
h).
|
Share Valuation – The net asset value (“NAV”) per share of the Fund is calculated by dividing (i) the total value of the securities held by the Fund, plus cash and other assets, minus all
liabilities (including estimated accrued expenses) by (ii) the total number of shares outstanding for the Fund, rounded to the nearest $0.01. The Fund’s shares will not be priced on days the New York Stock Exchange
is closed for trading. The offering and redemption price per share for the Fund is equal to the Fund’s NAV per share.
|
3). SECURITIES VALUATION
The Fund follows fair value accounting standards that establish an authoritative definition of fair value and set out a hierarchy for measuring fair value. These standards require additional
disclosures about the various inputs and valuation techniques used to develop the measurements of fair value and a discussion of changes in valuation techniques and related inputs during the period. These inputs are
summarized in the three broad levels listed below:
|
Level 1 –
|
Unadjusted, quoted prices in active markets for identical instruments that the Fund has the ability to access at the date of measurement.
|
|
|
Level 2 –
|
Other significant observable inputs (including, but not limited to, quoted prices in active markets for similar instruments, quoted prices in markets that are not active for identical or
similar instruments, and model-derived valuations in which all significant inputs and significant value drivers are observable in active markets, such as interest rates, prepayment speeds, credit risk curves,
default rates, and similar data).
|
|
|
Level 3 –
|
Significant unobservable inputs (including the Fund’s own assumptions about what market participants would use to price the asset or liability based on the best available information)
when observable inputs are unavailable.
|
|
HENNESSY FUNDS
|
1-800-966-4354
|
17
The following is a description of the valuation techniques applied to the Fund’s major categories of assets and liabilities measured at fair value on a recurring basis:
|
Equity Securities – Equity securities, including common stocks, preferred stocks, foreign-issued common stocks, exchange-traded funds, closed-end
mutual funds, partnerships, rights, and real estate investment trusts, that are traded on a securities exchange for which a last-quoted sales price is readily available will generally be valued at the last sales
price as reported by the primary exchange on which the securities are listed. Securities listed on The NASDAQ Stock Market (“NASDAQ”) will generally be valued at the NASDAQ Official Closing Price, which may differ
from the last sales price reported. Securities traded on a securities exchange for which a last-quoted sales price is not readily available will generally be valued at the mean between the bid and ask prices. To
the extent these securities are actively traded and valuation adjustments are not applied, they are classified in Level 1 of the fair value hierarchy. Securities traded on foreign exchanges generally are not valued
at the same time the Fund calculates its NAV because most foreign markets close well before such time. The earlier close of most foreign markets gives rise to the possibility that significant events, including
broad market moves, may have occurred in the interim. In certain circumstances, it may be determined that a foreign security needs to be fair valued because it appears that the value of the security might have been
materially affected by events occurring after the close of the market in which the security is principally traded, but before the time the Fund calculates its NAV, such as by a development that affects an entire
market or region (e.g., a weather-related event) or a potentially global development (e.g., a terrorist attack that may be expected to have an effect on investor expectations worldwide).
|
|
|
Registered Investment Companies – Investments in open-end registered investment companies, commonly referred to as mutual funds, generally are
priced at the ending NAV provided by the applicable mutual fund’s service agent and will be classified in Level 1 of the fair value hierarchy.
|
|
|
Debt Securities – Debt securities, including corporate bonds, asset-backed securities, mortgage-backed securities, municipal bonds, U.S.
Treasuries, and U.S. government agency issues, are generally valued at market on the basis of valuations furnished by an independent pricing service that utilizes both dealer-supplied valuations and formula-based
techniques. The pricing service may consider recently executed transactions in securities of the issuer or comparable issuers, market price quotations (where observable), bond spreads, and fundamental data relating
to the issuer. In addition, the model may incorporate observable market data, such as reported sales of similar securities, broker quotes, yields, bids, offers, and reference data. Certain securities are valued
primarily using dealer quotations. These securities are generally classified in Level 2 of the fair value hierarchy.
|
|
|
Short-Term Securities – Short-term equity investments, including money market funds, are valued in the manner specified above. Short-term debt
investments with an original term to maturity of 60 days or less are valued at amortized cost, which approximates fair market value. If the original term to maturity of a short-term debt investment exceeded 60
days, then the values as of the 61st day prior to maturity are amortized. Amortized cost is not used if its use would be inappropriate due to credit or other impairments of the issuer, in which case the security’s
fair value would be determined, as described below. Short-term securities are generally classified in Level 1 or Level 2 of the fair value hierarchy depending on the inputs used and market activity levels for
specific securities.
|
|
HENNESSYFUNDS.COM
|
18
|
NOTES TO THE FINANCIAL STATEMENTS
|
The Board of Trustees of the Fund (the “Board”) has adopted fair value pricing procedures that are followed when a price for a security is not readily available or if a
significant event has occurred that indicates the closing price of a security no longer represents the true value of that security. Fair value pricing determinations are made in good faith in accordance with these
procedures. There are numerous criteria that will be given consideration in determining a fair value of a security, such as the trading volume of a security and markets, the values of other similar securities, and news
events with direct bearing on a security or markets. Fair value pricing results in an estimated price for a security that reflects the amount the Fund might reasonably expect to receive in a current sale. Depending on the
relative significance of the valuation inputs, these securities may be classified in either Level 2 or Level 3 of the fair value hierarchy.
The fair value of foreign securities may be determined with the assistance of a pricing service using correlations between the movement of prices of such securities and indices
of domestic securities and other appropriate indicators, such as closing market prices of relevant American Depositary Receipts or futures contracts. Using fair value pricing means that the Fund’s NAV reflects the affected
portfolio securities’ values as determined by the Board or its designee, pursuant to the fair value pricing procedures adopted by the Board, instead of being determined by the market. Using a fair value pricing methodology
to price a foreign security may result in a value that is different from such foreign security’s most recent closing price and from the value used by other investment companies to calculate their NAVs. Such securities are
generally classified in Level 2 of the fair value hierarchy. Because the Fund may invest in foreign securities, the value of the Fund’s portfolio securities may change on days when you will not be able to purchase or
redeem your shares.
The Board has delegated day-to-day valuation matters to the Valuation and Liquidity Committee comprising representatives from Hennessy Advisors, Inc., the Fund’s investment
advisor (the “Advisor”). The function of the Valuation and Liquidity Committee is to value securities where current and reliable market quotations are not readily available. All actions taken by the Valuation and Liquidity
Committee are reviewed by the Board.
The Fund has performed an analysis of all existing investments to determine the significance and character of all inputs to their fair value determinations. Various inputs are
used to determine the value of the Fund’s investments. The inputs or methodology used for valuing securities are not necessarily an indication of the risk associated with investing in those securities. Details related to
the fair value hierarchy of the Fund’s securities as of April 30, 2020, are included in the Schedule of Investments.
4). INVESTMENT TRANSACTIONS
Purchases and sales of investment securities (excluding government and short-term investments) for the Fund during the six months ended April 30, 2020, were $36,249,168 and $47,507,541,
respectively.
There were no purchases or sales/maturities of long-term U.S. government securities for the Fund during the six months ended April 30, 2020.
The Fund is permitted to purchase or sell securities from or to another fund in the Hennessy Funds family of funds (collectively, the “Hennessy Funds”) under specified
conditions outlined in procedures adopted by the Board. The procedures have been designed to ensure that any purchase or sale of securities by the Fund from or to another Hennessy Fund complies with Rule 17a-7 of the
Investment Company Act of 1940, as amended. During the six months ended April 30, 2020, the Fund did not engage in purchases or sales of securities pursuant to Rule 17a-7 of the Investment Company Act of 1940, as amended.
|
HENNESSY FUNDS
|
1-800-966-4354
|
19
5). INVESTMENT ADVISORY FEE AND OTHER TRANSACTIONS WITH AFFILIATES
The Advisor provides the Fund with investment advisory services under an Investment Advisory Agreement. The Advisor furnishes all investment advice, office space, and facilities and most of the
personnel needed by the Fund. As compensation for its services, the Advisor is entitled to a monthly fee from the Fund. The fee is based on the average daily net assets of the Fund at an annual rate of 0.90%. The net
investment advisory fees expensed by the Fund during the six months ended April 30, 2020, are included in the Statement of Operations.
The Board has approved a Shareholder Servicing Agreement for Investor Class shares of the Fund, which was instituted to compensate the Advisor for the non-investment advisory
services it provides to the Fund. The Shareholder Servicing Agreement provides for a monthly fee paid to the Advisor at an annual rate of 0.10% of the average daily net assets of the Fund attributable to Investor Class
shares. The shareholder service fees expensed by the Fund during the six months ended April 30, 2020, are included in the Statement of Operations.
The Fund has adopted a plan pursuant to Rule 12b-1 under the Investment Company Act of 1940, as amended, that authorizes payments in connection with the distribution of the
Fund’s shares at an annual rate of up to 0.25% of the Fund’s average daily net assets attributable to Investor Class shares. Even though the authorized rate is up to 0.25%, the Fund is currently only using up to 0.15% of
its average daily net assets attributable to Investor Class shares for such purpose. Amounts paid under the plan may be spent on any activities or expenses primarily intended to result in the sale of shares, including, but
not limited to, advertising, shareholder account servicing, printing and mailing of prospectuses to other than current shareholders, printing and mailing of sales literature, and compensation for sales and marketing
activities or to financial institutions and others, such as dealers and distributors. The distribution fees expensed by the Fund during the six months ended April 30, 2020, are included in the Statement of Operations.
The Fund has entered into agreements with various brokers, dealers, and financial intermediaries in connection with the sale of shares of the Fund. The agreements provide for
periodic payments of sub-transfer agent expenses by the Fund to the brokers, dealers, and financial intermediaries for providing certain shareholder maintenance services. These shareholder services include the
pre-processing and quality control of new accounts, shareholder correspondence, answering customer inquiries regarding account status, and facilitating shareholder telephone transactions. The sub-transfer agent fees
expensed by the Fund during the six months ended April 30, 2020, are included in the Statement of Operations.
U.S. Bancorp Fund Services, LLC, d/b/a U.S. Bank Global Fund Services (“Fund Services”) provides the Fund with administrative, accounting, and transfer agent services. As
administrator, Fund Services is responsible for activities such as (i) preparing various federal and state regulatory filings, reports, and returns for the Fund, (ii) preparing reports and materials to be supplied to the
Board, (iii) monitoring the activities of the Fund’s custodian, transfer agent, and accountants, and (iv) coordinating the preparation and payment of the Fund’s expenses and reviewing the Fund’s expense accruals. U.S. Bank
N.A., an affiliate of Fund Services, serves as the Fund’s custodian. The servicing agreements between the Trust and Fund Services and U.S. Bank N.A. contain a fee schedule that is inclusive of administrative, accounting,
custody, and transfer agent fees. The administrative, accounting, custody, and transfer agent fees expensed by the Fund during the six months ended April 30, 2020, are included in the Statement of Operations.
|
HENNESSYFUNDS.COM
|
20
|
NOTES TO THE FINANCIAL STATEMENTS
|
Quasar Distributors, LLC (“Quasar”) acts as the Fund’s principal underwriter in a continuous public offering of the Fund’s shares. Quasar was an affiliate of Fund Services and
U.S. Bank N.A. through March 30, 2020. Effective March 31, 2020, Foreside Financial Group, LLC (“Foreside”) acquired Quasar from Fund Services. As a result of the acquisition, Quasar became a wholly owned broker-dealer
subsidiary of Foreside and is no longer affiliated with Fund Services or U.S. Bank N.A. The Board approved a new Distribution Agreement to enable Quasar to continue serving as the Fund’s distributor.
The officers of the Fund are affiliated with the Advisor. With the exception of the Chief Compliance Officer and the Senior Compliance Officer, such officers receive no
compensation from the Fund for serving in their respective roles. The Fund, along with the other Hennessy Funds, makes reimbursement payments on an equal basis to the Advisor for a portion of the salary and benefits
associated with the office of the Chief Compliance Officer and for all of the salary and benefits associated with the office of the Senior Compliance Officer. The compliance fees expensed by the Fund during the six months
ended April 30, 2020, are included in the Statement of Operations.
6). GUARANTEES AND INDEMNIFICATIONS
Under the Hennessy Funds’ organizational documents, their officers and trustees are indemnified by the Hennessy Funds against certain liabilities arising out of the performance of their duties to
the Hennessy Funds. Additionally, in the normal course of business, the Hennessy Funds enter into contracts with service providers that contain general indemnification clauses. The Fund’s maximum exposure under these
arrangements is unknown as this would involve future claims that may be made against the Fund that have not yet occurred. Currently, the Fund expects the risk of loss to be remote.
7). LINE OF CREDIT
The Fund has an uncommitted line of credit with the other Hennessy Funds in the amount of the lesser of (i) $100,000,000 or (ii) 33.33% of each Hennessy Fund’s net assets, or 30% for the Hennessy
Gas Utility Fund and 10% for the Hennessy Balanced Fund, intended to provide short-term financing, if necessary, subject to certain restrictions, in connection with shareholder redemptions. The credit facility is with the
Hennessy Funds’ custodian bank, U.S. Bank N.A. Borrowings under this arrangement bear interest at the bank’s prime rate and are secured by all of the Fund’s assets (as to its own borrowings only). During the six months
ended April 30, 2020, the Fund did not have any borrowings outstanding under the line of credit.
8). FEDERAL TAX INFORMATION
As of October 31, 2019, the Fund’s most recent fiscal year end, the components of accumulated earnings (losses) for income tax purposes were as follows:
|
Investments
|
|||||
|
Cost of investments for tax purposes
|
$
|
94,969,593
|
|||
|
Gross tax unrealized appreciation
|
$
|
17,543,168
|
|||
|
Gross tax unrealized depreciation
|
(4,227,881
|
)
|
|||
|
Net tax unrealized appreciation/(depreciation)
|
$
|
13,315,287
|
|||
|
Undistributed ordinary income
|
$
|
166,556
|
|||
|
Undistributed long-term capital gains
|
3,279,231
|
||||
|
Total distributable earnings
|
$
|
3,445,787
|
|||
|
Other accumulated gain/(loss)
|
$
|
—
|
|||
|
Total accumulated gain/(loss)
|
$
|
16,761,074
|
|||
|
HENNESSY FUNDS
|
1-800-966-4354
|
21
The difference between book-basis unrealized appreciation/depreciation and tax-basis unrealized appreciation/depreciation (as shown above) is attributable primarily to wash
sales.
As of October 31, 2019, the Fund had no tax basis capital losses to offset future capital gains.
As of October 31, 2019, the Fund did not defer, on a tax basis, any late-year ordinary losses. Late-year ordinary losses are net ordinary losses incurred after December 31,
2018, but within the taxable year, that are deemed to arise on the first day of the Fund’s next taxable year.
During fiscal year 2020 (year to date) and fiscal year 2019, the tax character of distributions paid by the Fund was as follows:
|
Six Months Ended
|
Year Ended
|
||||||||
|
April 30, 2020
|
October 31, 2019
|
||||||||
|
Ordinary income(1)
|
$
|
698,496
|
$
|
848,924
|
|||||
|
Long-term capital gain
|
3,279,243
|
9,159,655
|
|||||||
|
$
|
3,977,739
|
$
|
10,008,579
|
||||||
|
(1) Ordinary income includes short-term capital gain.
|
9). EVENTS SUBSEQUENT TO PERIOD END
Management has evaluated the Fund’s related events and transactions that occurred subsequent to April 30, 2020, through the date of issuance of the Fund’s financial statements. Management has
determined that there were no subsequent events requiring recognition or disclosure in the financial statements.
|
HENNESSYFUNDS.COM
|
22
|
NOTES TO THE FINANCIAL STATEMENTS/EXPENSE EXAMPLE
|
Expense Example (Unaudited)
April 30, 2020
As a shareholder of the Fund, you incur ongoing costs, including management fees, service fees, and other Fund expenses. This Example is intended to help you understand your ongoing costs (in
dollars) of investing in the Fund and to compare these costs with the ongoing costs of investing in other mutual funds. The Example is based on an investment of $1,000 invested at the beginning of the period and held for
the entire period from November 1, 2019, through April 30, 2020.
Actual Expenses
The first line of the table below under the “Investor Class” and “Institutional Class” headings provides information about actual account values and actual expenses. Although the Fund charges no
sales loads or transaction fees, you will be assessed fees for outgoing wire transfers, returned checks and stop payment orders at prevailing rates charged by U.S. Bank Global Fund Services, the Fund’s transfer agent. If
you request that a redemption be made by wire transfer, currently a $15 fee is charged by the Fund’s transfer agent. IRA accounts will be charged a $15 annual maintenance fee. The example below includes, but is not limited
to, management fees, shareholder servicing fees, accounting, custody, and transfer agent fees. However, the example below does not include portfolio trading commissions and related expenses. You may use the information in
this line, together with the amount you invested, to estimate the expenses that you paid over the period. Simply divide your account value by $1,000 (for example, an $8,600 account value divided by $1,000 = 8.6), then
multiply the result by the number in the first line of the table under the “Investor Class” or “Institutional Class” headings in the column entitled “Expenses Paid During Period” to estimate the expenses you paid on your
account during this period.
Hypothetical Example for Comparison Purposes
The second line of the table below under the “Investor Class” and “Institutional Class” headings provides information about hypothetical account values and hypothetical expenses based on the
Fund’s actual expense ratios and an assumed rate of return of 5% per year before expenses, which is not the Fund’s actual return. The hypothetical account values and expenses may not be used to estimate the actual ending
account balance or expenses you paid for the period. You may use this information to compare the ongoing costs of investing in the Fund and other funds. To do so, compare this 5% hypothetical example with the 5%
hypothetical examples that appear in the shareholder reports of the other funds. Please note that the expenses shown in the table are meant to highlight your ongoing costs only. Therefore, the second line of the table
under the “Investor Class” and “Institutional Class” headings is useful in comparing ongoing costs only and will not help you determine the relative total costs of owning different funds.
|
HENNESSY FUNDS
|
1-800-966-4354
|
23
|
Beginning
|
Ending
|
||
|
Account Value
|
Account Value
|
Expenses Paid
|
|
|
November 1, 2019
|
April 30, 2020
|
During Period(1)
|
|
|
Investor Class
|
|||
|
Actual
|
$1,000.00
|
$ 728.10
|
$7.00
|
|
Hypothetical (5% return before expenses)
|
$1,000.00
|
$1,016.76
|
$8.17
|
|
Institutional Class
|
|||
|
Actual
|
$1,000.00
|
$ 729.40
|
$5.37
|
|
Hypothetical (5% return before expenses)
|
$1,000.00
|
$1,018.65
|
$6.27
|
|
(1)
|
Expenses are equal to the Fund’s annualized expense ratio of 1.63% for Investor Class shares or 1.25% for Institutional Class shares, as applicable, multiplied by the average account
value over the period, multiplied by 182/366 days (to reflect the half-year period).
|
|
HENNESSYFUNDS.COM
|
24
|
EXPENSE EXAMPLE — ELECTRONIC DELIVERY
|
How to Obtain a Copy of the Fund’s Proxy
Voting Policy and Proxy Voting Records
A description of the policies and procedures the Fund uses to determine how to vote proxies relating to portfolio securities is available without charge (1) by calling 1-800-966-4354, (2) on the
Hennessy Funds’ website at www.hennessyfunds.com/proxy-voting/voting-policy, or (3) on the U.S. Securities and Exchange Commission’s (the “SEC”) website at www.sec.gov. The Fund’s proxy voting record is available without
charge on both the Hennessy Funds’ website at www.hennessyfunds.com/proxy-voting/voting-record and the SEC’s website at www.sec.gov no later than August 31 for the prior 12 months ending June 30.
Availability of Quarterly Portfolio Schedule
The Fund files a complete schedule of portfolio holdings with the SEC for the first and third quarters of each fiscal year as an exhibit to its reports on Form N-PORT. The Fund’s Forms N-PORT are
available on the SEC’s website at www.sec.gov or on request by calling 1-800-966-4354.
Federal Tax Distribution Information (Unaudited)
For fiscal year 2019, certain dividends paid by the Fund may be subject to a maximum tax rate of 23.8%, as provided for by the Jobs and Growth Tax Relief Reconciliation Act of 2003. The
percentage of dividends declared from ordinary income designated as qualified dividend income was 100.00%.
For corporate shareholders, the percent of ordinary income distributions that qualified for the corporate dividends received deduction for fiscal year 2019 was 100.00%.
The percentage of taxable ordinary income distributions that were designated as short-term capital gain distributions under Section 871(k)(2)(C) of the Internal Revenue Code of
1986, as amended, for the Fund was 0.00%.
Important Notice Regarding Delivery
of Shareholder Documents
To help keep the Fund’s costs as low as possible, we generally deliver a single copy of shareholder reports, proxy statements, and prospectuses to shareholders who share an address and have the
same last name. This process does not apply to account statements. You may request an individual copy of a shareholder document at any time. If you would like to receive separate mailings of shareholder documents, please
call U.S. Bank Global Fund Services at 1-800-261-6950 or 1-414-765-4124, and individual delivery will begin within 30 days of your request. If your account is held through a financial institution or other intermediary,
please contact such intermediary directly to request individual delivery.
Electronic Delivery
The Funds offer shareholders the option to receive account statements, prospectuses, tax forms, and shareholder reports online. To sign up for eDelivery, please visit
www.hennessyfunds.com/account. You may change your delivery preference at any time by visiting our website or calling U.S. Bank Global Fund Services at 1-800-261-6950 or 1-414-765-4124.
|
HENNESSY FUNDS
|
1-800-966-4354
|
25
Board Approval of Investment Advisory
Agreement
At its meeting on March 12, 2020, the Board of Trustees of the Fund (the “Board,” and the members thereof, the “Trustees”) unanimously approved the continuation of the investment advisory
agreement of the Fund with Hennessy Advisors, Inc. (the “Advisor”). As part of the process of approving the continuation of the advisory agreement, the Trustees reviewed their fiduciary duties and the relevant factors for
them to consider with respect to approving the advisory agreement. In addition, the Trustees who are not deemed “interested persons” (as defined by the Investment Company Act of 1940, as amended) of the Fund (the
“Independent Trustees”) met in executive session to discuss the approval of the advisory agreement.
In advance of the meeting, the Advisor sent detailed information to the Trustees to assist them in their evaluation of the advisory agreement. This information included, but
was not limited to, the following:
|
(1)
|
A memorandum from outside legal counsel that described the fiduciary duties of the Board with respect to approving the continuation of the advisory agreement and the relevant factors for
consideration;
|
|
|
(2)
|
A memorandum from the Advisor that listed the factors relevant to the Board’s approval of the continuation of the advisory agreement and also referenced the documents that had been
provided to help the Board assess each such factor;
|
|
|
(3)
|
An inventory of the services provided by the Advisor;
|
|
|
(4)
|
A written discussion of economies of scale;
|
|
|
(5)
|
A summary of the key terms of the advisory agreement;
|
|
|
(6)
|
A recent Fund fact sheet, which included performance information over various periods;
|
|
|
(7)
|
A peer expense comparison of the net expense ratio and investment advisory fee of the Fund; and
|
|
|
(8)
|
The Advisor’s financial statements from its most recent Form 10-K and Form 10-Q.
|
All of the factors discussed were considered as a whole by the Trustees and by the Independent Trustees meeting in executive session. The factors were viewed in their totality
by the Trustees, with no single factor being the principal or determinative factor in the Trustees’ determination of whether to approve the continuation of the advisory agreement. The Trustees recognized that the
management and fee arrangements for the Fund are the result of years of review and discussion between the Independent Trustees and the Advisor, that certain aspects of such arrangements may receive greater scrutiny in some
years than in others, and that the Trustees’ conclusions may be based, in part, on their consideration of these same arrangements and information received during the course of the year and in prior years.
Prior to approving the continuation of the advisory agreement, the Trustees, including the Independent Trustees in executive session, considered, among other items:
|
(1)
|
The nature and quality of the advisory services provided by the Advisor;
|
|
|
(2)
|
A comparison of the fees and expenses of the Fund to other similar funds;
|
|
|
(3)
|
Whether economies of scale are recognized by the Fund;
|
|
HENNESSYFUNDS.COM
|
26
|
BOARD APPROVAL OF INVESTMENT ADVISORY AGREEMENT
|
|
(4)
|
The costs and profitability of the Fund to the Advisor;
|
|
|
(5)
|
The performance of the Fund; and
|
|
|
(6)
|
Any benefits to the Advisor from serving as an investment advisor to the Fund (other than the advisory fee).
|
The material considerations and determinations of the Trustees, including the Independent Trustees, were as follows:
|
(1)
|
The Trustees considered the services identified below that are provided by the Advisor. Based on this review, the Trustees concluded that the Advisor provides high-quality services to the
Fund and noted that their overall confidence in the Advisor was high. The Trustees also concluded that they were satisfied with the nature, extent, and quality of the advisory services provided to the Fund by the
Advisor and that the nature and extent of the services provided by the Advisor were appropriate to assure that the Fund’s operations are conducted in compliance with applicable laws, rules, and regulations.
|
|
(a)
|
The Advisor acts as the portfolio manager for the Fund. In this capacity, the Advisor does the following:
|
|
(i)
|
manages the composition of the Fund’s portfolio, including the purchase, retention, and disposition of portfolio securities in accordance with the Fund’s investment objectives, policies,
and restrictions;
|
|||
|
(ii)
|
seeks best execution for the Fund’s portfolio;
|
|||
|
(iii)
|
manages the use of soft dollars for the Fund; and
|
|||
|
(iv)
|
manages proxy voting for the Fund.
|
|
(b)
|
The Advisor performs a daily reconciliation of portfolio positions and cash for the Fund.
|
||
|
(c)
|
The Advisor monitors the liquidity of each Fund.
|
||
|
(d)
|
The Advisor monitors the Fund’s compliance with its investment objectives and restrictions.
|
||
|
(e)
|
The Advisor monitors compliance with federal securities laws, maintains a compliance program (including a code of ethics), conducts ongoing reviews of the compliance programs of the
Fund’s service providers, as feasible, conducts on-site visits to the Fund’s service providers, monitors incidents of abusive trading practices, reviews Fund expense accruals, payments, and fixed expense ratios,
evaluates insurance providers for fidelity bond, D&O/E&O insurance, and cybersecurity insurance coverage, manages regulatory examination compliance and responses, conducts employee compliance training,
reviews reports provided by service providers, and maintains books and records.
|
||
|
(f)
|
The Advisor oversees service providers that provide accounting, administration, distribution, transfer agency, custodial, sales, marketing, public relations, audit, information
technology, and legal services to the Fund.
|
||
|
(g)
|
The Advisor maintains in-house marketing and distribution departments on behalf of the Fund.
|
||
|
(h)
|
The Advisor is actively involved with preparing regulatory filings for the Fund, including writing and annually updating the Fund’s prospectus and related documents.
|
|
HENNESSY FUNDS
|
1-800-966-4354
|
27
|
(i)
|
For each annual report of the Fund, the Advisor prepares a written summary of the Fund’s performance during the most recent 12-month period.
|
||
|
(j)
|
The Advisor oversees distribution of the Fund through third-party broker/dealers and independent financial institutions such as Charles Schwab, Inc., Fidelity, TD Ameritrade, and
Pershing. The Advisor participates in “no transaction fee” (“NTF”) programs with these companies on behalf of the Fund, which allow customers to purchase the Fund through third-party distribution channels without
paying a transaction fee. The Advisor compensates, in part, a number of these third-party providers of NTF programs out of its own revenues.
|
||
|
(k)
|
The Advisor pays the incentive compensation of the Fund’s compliance officers and employs other staff, such as legal, marketing, national accounts, distribution, sales, administrative,
and trading oversight personnel, as well as management executives.
|
||
|
(l)
|
The Advisor provides a quarterly compliance certification to the Board.
|
||
|
(m)
|
The Advisor prepares or reviews all Board materials, frequently presents to the Board and leads Board discussions, prepares or reviews all meeting minutes, and arranges for Board training
and education.
|
|
(2)
|
The Trustees compared the performance of the Fund to benchmark indices over various periods and also noted that the Trustees review and discuss reports comparing the investment
performance of the Fund to various indices at each quarterly Board meeting. Based on such information, the Trustees determined that the Advisor manages the Fund in a manner materially consistent with its stated
investment objective and style. The Trustees concluded that the performance of the Fund over various periods warranted continuation of the advisory agreement.
|
|
|
(3)
|
The Trustees reviewed the advisory fees and overall expense ratios of the Fund compared to other funds similar in asset size and investment objective to the Fund using data from
Morningstar. As part of the discussion with management, the Trustees ensured that they understood and were comfortable with the criteria used to determine the mutual funds included in the Morningstar categories for
purposes of the materials considered at the meeting. The Trustees determined that the advisory fee and overall expense ratio of the Fund falls within the range of the advisory fees and overall expense ratios of
other comparable funds and concluded that they are reasonable and warranted continuation of the advisory agreement.
|
|
|
(4)
|
The Trustees also considered whether the Advisor was realizing economies of scale that it should share with the Fund’s shareholders. The Trustees noted that the assets of the Fund had
declined over the prior year. In addition, the Trustees noted that many of the expenses incurred to manage the Fund are asset-based fees, so the Advisor does not realize material economies of scale relating to
those expenses as the assets of the Fund increase. For example, mutual fund platform fees increase as the Fund’s assets grow. The Trustees also considered the Advisor’s efforts to contain expenses through actions
such as renegotiating service contracts, the Advisor’s significant marketing efforts to promote the Funds, the Advisor’s investments in personnel to manage the Funds, and the Advisor’s agreement to waive fees or
lower its management fees in certain
|
|
HENNESSYFUNDS.COM
|
28
|
BOARD APPROVAL OF INVESTMENT ADVISORY AGREEMENT
|
|
circumstances. The Trustees noted that it did not appear that the Advisor was realizing economies of scale at current asset levels and concluded that it would continue to monitor
economies of scale in the future as circumstances changed.
|
||
|
(5)
|
The Trustees considered the profitability of the Advisor, including the impact of mutual fund platform fees on the Advisor’s profitability, and also considered the resources and revenues
that the Advisor has put into managing and distributing the Fund. The Trustees then concluded that the profits of the Advisor are reasonable and not excessive when compared to profitability guidelines set forth in
relevant court cases.
|
|
|
(6)
|
The Trustees considered the high level of professionalism and knowledge of the Advisor’s employees, along with a very low level of turnover, and concluded that this was beneficial to the
Fund and its shareholders.
|
|
|
(7)
|
The Trustees considered any benefits to the Advisor from serving as an advisor to the Fund (other than the advisory fee). The Trustees noted that the Advisor may derive ancillary benefits
from, by way of example, its association with the Fund in the form of proprietary and third-party research products and services received from broker-dealers that execute portfolio trades for the Fund. The Trustees
determined that any such products and services have been used for legitimate purposes relating to the Fund by providing assistance in the investment decision-making process. The Trustees concluded that any
additional benefits realized by the Advisor from its relationship with the Fund were reasonable, which was based on, among other things, the Trustees’ finding that the research, analytical, statistical, and other
information and services provided by brokers are merely supplemental to the Advisor’s own efforts in the performance of its duties under the advisory agreement.
|
After reviewing the materials and information provided at the meeting, as well as other information regularly provided at the Board’s quarterly meetings throughout the year
regarding the quality of services provided by the Advisor, the performance of the Fund, expense information, brokerage commissions information, the adequacy and efficacy of the Advisor’s written policies and procedures,
other regulatory compliance issues, trading information and related matters, and other factors that the Trustees deemed relevant, the Trustees, including the Independent Trustees, approved the continuation of the advisory
agreement.
|
HENNESSY FUNDS
|
1-800-966-4354
|
29
For information, questions, or assistance, please call
The Hennessy Funds
1-800-966-4354 or 1-415-899-1555
INVESTMENT ADVISOR
Hennessy Advisors, Inc.
7250 Redwood Boulevard, Suite 200
Novato, California 94945
ADMINISTRATOR,
TRANSFER AGENT,
DIVIDEND PAYING AGENT, &
SHAREHOLDER SERVICING AGENT
U.S. Bancorp Fund Services, LLC
d/b/a U.S. Bank Global Fund Services
P.O. Box 701
Milwaukee, Wisconsin 53201-0701
CUSTODIAN
U.S. Bank N.A.
Custody Operations
1555 North River Center Drive, Suite 302
Milwaukee, Wisconsin 53212
TRUSTEES
Neil J. Hennessy
Robert T. Doyle
J. Dennis DeSousa
Gerald P. Richardson
COUNSEL
Foley & Lardner LLP
777 East Wisconsin Avenue
Milwaukee, Wisconsin 53202-5306
INDEPENDENT REGISTERED
PUBLIC ACCOUNTING FIRM
Tait, Weller & Baker LLP
Two Liberty Place
50 South 16th Street, Suite 2900
Philadelphia, Pennsylvania 19102-2529
DISTRIBUTOR
Quasar Distributors, LLC
111 East Kilbourn Avenue, Suite 2200
Milwaukee, Wisconsin 53202
www.hennessyfunds.com | 1-800-966-4354
This report has been prepared for shareholders and may be distributed to
others only if preceded or accompanied by a current prospectus.
SEMI-ANNUAL REPORT
APRIL 30, 2020

HENNESSY TECHNOLOGY FUND
Investor Class HTECX
Institutional Class HTCIX
IMPORTANT NOTICE REGARDING ELECTRONIC DELIVERY OF SHAREHOLDER REPORTS
Beginning on January 1, 2021, as permitted by regulations adopted by the Securities and Exchange Commission, paper copies of the annual and
semi-annual reports will no longer be sent by mail unless you specifically request paper copies from the Hennessy Funds or from your financial intermediary. Instead, the reports will be made available on a
website, and you will be notified by mail each time a report is posted and provided with a website link to access the report.
If you have already elected to receive shareholder reports electronically, you will not be affected by this change and you need not take any action. You may elect to receive shareholder reports and other communications from the Hennessy Funds electronically by visiting www.hennessyfunds.com/account or by calling U.S. Bank Global Fund Services at
1-800-261-6950. If you own shares in a Fund through a financial intermediary, please contact your financial intermediary to make this election.
You may elect to receive paper copies of all future reports free of charge by calling U.S. Bank Global Fund Services at 1-800-261-6950 or,
if you own your shares through a financial intermediary, by contacting your financial intermediary. Your election to receive paper copies of reports will apply to all Funds in the Hennessy Funds family.
hennessyfunds.com | 1-800-966-4354
(This Page Intentionally Left Blank.)
Contents
|
Letter to Shareholders
|
2
|
|
Performance Overview
|
4
|
|
Financial Statements
|
|
|
Schedule of Investments
|
5
|
|
Statement of Assets and Liabilities
|
9
|
|
Statement of Operations
|
10
|
|
Statements of Changes in Net Assets
|
11
|
|
Financial Highlights
|
12
|
|
Notes to the Financial Statements
|
16
|
|
Expense Example
|
23
|
|
Proxy Voting Policy and Proxy Voting Records
|
25
|
|
Availability of Quarterly Portfolio Schedule
|
25
|
|
Federal Tax Distribution Information
|
25
|
|
Important Notice Regarding Delivery of Shareholder Documents
|
25
|
|
Electronic Delivery
|
25
|
|
Board Approval of Investment Advisory Agreement
|
26
|
|
HENNESSY FUNDS
|
1-800-966-4354
|
June 2020
Dear Hennessy Funds Shareholder:
First and foremost, I hope this communication finds you and your loved ones safe and healthy. In many ways, the COVID-19 pandemic has turned the world upside down in recent months, and we at
Hennessy have joined the rest of the world in witnessing and experiencing its profound effect on public health, the global economy, and the everyday lives of people around the world. In response to the crisis, we
invoked our business continuity plan in mid-March to ensure a smooth transition to remote work for all of our employees, who have been working safely and productively from home. We want to assure our Hennessy Funds
shareholders that our operations are uninterrupted and functioning normally.
The past six months have been marked by extremes. During the first half of the period from November 2019 through January 2020, the bull market, supported by strong corporate
fundamentals, continued to move higher, and investors appeared focused on record-low unemployment and strong economic growth. In mid-February, the major U.S. market indices hit all-time highs, but then, within just a
matter of weeks, lost over one-third of their values as the COVID-19 pandemic unfolded. Shelter-in-place and business closure orders rippled through the nation, causing initial unemployment claims to skyrocket to their
highest number in history. The market then rallied back and posted double-digit positive returns in April.
For the six months ended April 30, 2020, on a total return basis, the Dow Jones Industrial Average was down 8.9% and the S&P 500® Index was down 3.2%. Small-cap and mid-cap stocks generally fared worse than large-cap stocks during the period, and the Financial sector was particularly hard hit as the
Federal Reserve aggressively cut the federal funds rate in an effort to stabilize the economy. The Energy sector was crushed by both the sudden loss of demand due to COVID-19 and the oversupply caused by the surprise
market-share battle between Russia and Saudi Arabia, and the S&P 500® Energy Sector Index ended the six-month period down over 30%.
The COVID-19 pandemic is an unprecedented event, and the duration and full extent of the economic impact is unknown. In the moment, there is always the concern that ‘this
time is different.’ But, when you are able to look at past financial, political, and health crises with the benefit of 20/20 hindsight, history has demonstrated that our economy and financial markets have always
rebounded and recovered eventually. If you look back to the last market downturn in 2008, economic fundamentals were weak compared to the market in 2020, where the overall underpinnings were – and are still – quite
strong. Publicly listed companies today have plenty of cash, with over $5 trillion on balance sheets of the S&P 500® companies alone,
and I believe that most will survive and that many may emerge from the current crisis even stronger.
|
HENNESSYFUNDS.COM
|
2
|
LETTER TO SHAREHOLDERS
|
We understand that this market volatility and economic uncertainty is jarring to many investors, and we continue to monitor events and the markets. We remain focused on
managing our high-conviction portfolios for the long-term benefit of our shareholders, and we are confident in the time-tested strategies and rigorous research that led to their formation. We encourage shareholders to
maintain a long-term investment horizon and to remain focused on long-term goals. As always, but especially in these trying times, we are here to support our shareholders, and we thank you for your continued investment
and trust. Should you have any questions or would like to speak with us directly, please don’t hesitate to call (800) 966-4354 or email us at fundsinfo@hennessyfunds.com.
Best regards,
Neil J. Hennessy
President and Chief Investment Officer
Past performance does not guarantee future results.
Mutual fund investing involves risk. Principal loss is possible.
The Dow Jones Industrial Average and S&P 500® Index are commonly used to measure the performance of U.S.
stocks. The S&P 500® Energy Sector Index is an index that comprises those companies included in the S&P 500 that are classified as
members of the GICS energy sector. One cannot invest directly in an index.
|
HENNESSY FUNDS
|
1-800-966-4354
|
3
Performance Overview (Unaudited)
AVERAGE ANNUAL TOTAL RETURN FOR PERIODS ENDED APRIL 30, 2020
|
Six
|
One
|
Five
|
Ten
|
|
|
Months(1)
|
Year
|
Years
|
Years
|
|
|
Hennessy Technology Fund –
|
||||
|
Investor Class (HTECX)
|
-5.16%
|
-4.50%
|
8.16%
|
7.84%
|
|
Hennessy Technology Fund –
|
||||
|
Institutional Class (HTCIX)
|
-5.07%
|
-4.23%
|
8.48%
|
8.13%
|
|
NASDAQ Composite Index
|
7.76%
|
10.99%
|
13.74%
|
15.05%
|
|
S&P 500® Index
|
-3.16%
|
0.86%
|
9.12%
|
11.69%
|
|
Expense ratios:
|
Gross 3.85%, Net 1.24%(2) (Investor Class);
|
|
Gross 3.48%, Net 0.99%(2) (Institutional Class)
|
|
(1)
|
Periods of less than one year are not annualized.
|
|
(2)
|
The Fund’s investment advisor has contractually agreed to limit expenses until February 28, 2021.
|
_______________
Performance data quoted represents past performance; past performance does not guarantee future results. The investment return and principal value of an investment will
fluctuate so that an investor’s shares, when redeemed, may be worth more or less than their original cost. The performance table does not reflect the deduction of taxes that a shareholder would pay on Fund distributions
or the redemption of Fund shares. Current performance of the Fund may be lower or higher than the performance quoted. Performance data current to the most recent month end may be obtained by visiting
www.hennessyfunds.com. Performance for periods on or prior to October 26, 2012, is that of the FBR Technology Fund.
The NASDAQ Composite Index comprises all common stocks listed on The NASDAQ Stock Market. The S&P 500® Index
is a capitalization-weighted index that is designed to represent the broad domestic economy through changes in the aggregate market value of 500 stocks across all major industries. One cannot invest directly in an index.
These indices are used herein for comparative purposes in accordance with SEC regulations.
Standard & Poor’s Financial Services LLC is the source and owner of the S&P® and S&P 500® trademarks.
The expense ratios presented are from the most recent prospectus. The expense ratios for the current reporting period are available in the Financial Highlights section of this report.
|
HENNESSYFUNDS.COM
|
4
|
PERFORMANCE OVERVIEW/SCHEDULE OF INVESTMENTS
|
Financial Statements
|
Schedule of Investments as of April 30, 2020 (Unaudited)
|
HENNESSY TECHNOLOGY FUND
(% of Net Assets)

|
TOP TEN HOLDINGS (EXCLUDING MONEY MARKET FUNDS)
|
% NET ASSETS
|
|
Paylocity Holding Corp.
|
1.98%
|
|
ServiceNow, Inc.
|
1.96%
|
|
Expedia Group, Inc.
|
1.95%
|
|
Qurate Retail Group, Inc.
|
1.85%
|
|
Dropbox, Inc.
|
1.82%
|
|
Amazon.com, Inc.
|
1.78%
|
|
DXC Technology Co.
|
1.78%
|
|
Sabre Corp.
|
1.75%
|
|
F5 Networks, Inc.
|
1.74%
|
|
SolarEdge Technologies, Inc.
|
1.73%
|
Note: For presentation purposes, the Fund has grouped some of the industry categories. For purposes of categorizing securities for compliance with Section 8(b)(1) of the Investment Company Act
of 1940, as amended, the Fund uses more specific industry classifications.
The Global Industry Classification Standard (GICS®) was developed by and is the exclusive property and a service
mark of MSCI, Inc. and Standard & Poor’s Financial Services LLC. It has been licensed for use by the Hennessy Funds.
|
HENNESSY FUNDS
|
1-800-966-4354
|
5
|
COMMON STOCKS – 96.39%
|
Number
|
% of
|
||||||||||
|
|
of Shares
|
Value
|
Net Assets
|
|||||||||
|
Communication Services – 3.33%
|
||||||||||||
|
Match Group, Inc. (a)
|
1,052
|
$
|
80,962
|
1.61
|
%
|
|||||||
|
SciPlay Corp. (a)
|
8,151
|
85,993
|
1.72
|
%
|
||||||||
|
|
166,955
|
3.33
|
%
|
|||||||||
|
Consumer Discretionary – 8.43%
|
||||||||||||
|
Amazon.com, Inc. (a)
|
36
|
89,064
|
1.78
|
%
|
||||||||
|
Booking Holdings, Inc. (a)
|
49
|
72,548
|
1.45
|
%
|
||||||||
|
Despegar.com Corp. (a)(b)
|
10,208
|
70,435
|
1.40
|
%
|
||||||||
|
Expedia Group, Inc.
|
1,378
|
97,810
|
1.95
|
%
|
||||||||
|
Qurate Retail Group, Inc. (a)
|
11,499
|
92,625
|
1.85
|
%
|
||||||||
|
|
422,482
|
8.43
|
%
|
|||||||||
|
Information Technology – 84.63%
|
||||||||||||
|
Accenture PLC, Class A (b)
|
443
|
82,039
|
1.64
|
%
|
||||||||
|
Adobe Systems, Inc. (a)
|
237
|
83,813
|
1.67
|
%
|
||||||||
|
Apple, Inc.
|
291
|
85,496
|
1.71
|
%
|
||||||||
|
Applied Materials, Inc.
|
1,577
|
78,345
|
1.56
|
%
|
||||||||
|
Atlassian Corp. PLC (a)(b)
|
535
|
83,187
|
1.66
|
%
|
||||||||
|
Automatic Data Processing, Inc.
|
526
|
77,159
|
1.54
|
%
|
||||||||
|
Avnet, Inc.
|
2,575
|
77,301
|
1.54
|
%
|
||||||||
|
Booz Allen Hamilton Holding Corp., Class A
|
977
|
71,751
|
1.43
|
%
|
||||||||
|
Cardtronics PLC (a)(b)
|
3,420
|
78,318
|
1.56
|
%
|
||||||||
|
CDW Corp.
|
713
|
79,000
|
1.58
|
%
|
||||||||
|
Citrix Systems, Inc.
|
501
|
72,650
|
1.45
|
%
|
||||||||
|
Dropbox, Inc. (a)
|
4,347
|
91,374
|
1.82
|
%
|
||||||||
|
DXC Technology Co.
|
4,918
|
89,163
|
1.78
|
%
|
||||||||
|
eGain Corp. (a)
|
10,267
|
85,216
|
1.70
|
%
|
||||||||
|
Euronet Worldwide, Inc. (a)
|
828
|
75,977
|
1.52
|
%
|
||||||||
|
EVERTEC, Inc. (b)
|
3,108
|
78,757
|
1.57
|
%
|
||||||||
|
F5 Networks, Inc. (a)
|
625
|
87,037
|
1.74
|
%
|
||||||||
|
Fair Isaac Corp. (a)
|
239
|
84,353
|
1.68
|
%
|
||||||||
|
Fortinet, Inc. (a)
|
684
|
73,694
|
1.47
|
%
|
||||||||
|
Hewlett Packard Enterprise Co.
|
7,136
|
71,788
|
1.43
|
%
|
||||||||
|
Intel Corp.
|
1,230
|
73,775
|
1.47
|
%
|
||||||||
|
International Business Machines Corp.
|
613
|
76,968
|
1.54
|
%
|
||||||||
|
Intuit, Inc.
|
297
|
80,134
|
1.60
|
%
|
||||||||
The accompanying notes are an integral part of these financial statements.
|
HENNESSYFUNDS.COM
|
6
|
SCHEDULE OF INVESTMENTS
|
|
COMMON STOCKS
|
Number
|
% of
|
||||||||||
|
|
of Shares
|
Value
|
Net Assets
|
|||||||||
|
Information Technology (Continued)
|
||||||||||||
|
Jabil, Inc.
|
2,843
|
$
|
80,855
|
1.61
|
%
|
|||||||
|
Kimball Electronics, Inc. (a)
|
6,076
|
82,148
|
1.64
|
%
|
||||||||
|
KLA-Tencor Corp.
|
486
|
79,748
|
1.59
|
%
|
||||||||
|
Lam Research Corp.
|
288
|
73,521
|
1.47
|
%
|
||||||||
|
Mastercard, Inc., Class A
|
282
|
77,542
|
1.55
|
%
|
||||||||
|
Maxim Integrated Products, Inc.
|
1,364
|
74,993
|
1.50
|
%
|
||||||||
|
Methode Electronics, Inc.
|
2,747
|
82,465
|
1.65
|
%
|
||||||||
|
Microsoft Corp.
|
440
|
78,852
|
1.57
|
%
|
||||||||
|
NCR Corp. (a)
|
3,542
|
72,682
|
1.45
|
%
|
||||||||
|
NetApp, Inc.
|
1,790
|
78,348
|
1.56
|
%
|
||||||||
|
Oracle Corp.
|
1,409
|
74,635
|
1.49
|
%
|
||||||||
|
Palo Alto Networks, Inc. (a)
|
414
|
81,355
|
1.62
|
%
|
||||||||
|
Paychex, Inc.
|
1,084
|
74,276
|
1.48
|
%
|
||||||||
|
Paylocity Holding Corp. (a)
|
867
|
99,297
|
1.98
|
%
|
||||||||
|
QIWI PLC – ADR (b)
|
6,258
|
76,473
|
1.53
|
%
|
||||||||
|
Qualcomm, Inc.
|
1,029
|
80,951
|
1.61
|
%
|
||||||||
|
Sabre Corp.
|
12,071
|
87,756
|
1.75
|
%
|
||||||||
|
Sanmina Corp. (a)
|
2,738
|
75,925
|
1.51
|
%
|
||||||||
|
Seagate Technology PLC (b)
|
1,461
|
72,977
|
1.46
|
%
|
||||||||
|
ServiceNow, Inc. (a)
|
280
|
98,431
|
1.96
|
%
|
||||||||
|
ShotSpotter, Inc. (a)
|
2,496
|
85,788
|
1.71
|
%
|
||||||||
|
SolarEdge Technologies, Inc. (a)
|
777
|
86,705
|
1.73
|
%
|
||||||||
|
Synnex Corp.
|
938
|
82,131
|
1.64
|
%
|
||||||||
|
Take-Two Interactive Software, Inc. (a)
|
614
|
74,325
|
1.48
|
%
|
||||||||
|
Texas Instruments, Inc.
|
668
|
77,535
|
1.55
|
%
|
||||||||
|
Ubiquiti Networks, Inc.
|
468
|
75,830
|
1.51
|
%
|
||||||||
|
Visa, Inc., Class A
|
421
|
75,241
|
1.50
|
%
|
||||||||
|
Vishay Intertechnology, Inc.
|
5,013
|
83,166
|
1.66
|
%
|
||||||||
|
VMware, Inc., Class A (a)
|
580
|
76,282
|
1.52
|
%
|
||||||||
|
Zebra Technologies Corp. (a)
|
368
|
84,515
|
1.69
|
%
|
||||||||
|
|
4,242,043
|
84.63
|
%
|
|||||||||
|
Total Common Stocks
|
||||||||||||
|
(Cost $4,433,227)
|
4,831,480
|
96.39
|
%
|
|||||||||
The accompanying notes are an integral part of these financial statements.
|
HENNESSY FUNDS
|
1-800-966-4354
|
7
|
SHORT-TERM INVESTMENTS – 3.61%
|
Number
|
% of
|
||||||||||
|
|
of Shares
|
Value
|
Net Assets
|
|||||||||
|
Money Market Funds – 3.61%
|
||||||||||||
|
First American Government Obligations Fund,
|
||||||||||||
|
Institutional Class, 0.25% (c)
|
180,935
|
$
|
180,935
|
3.61
|
%
|
|||||||
|
|
||||||||||||
|
Total Short-Term Investments
|
||||||||||||
|
(Cost $180,935)
|
180,935
|
3.61
|
%
|
|||||||||
|
|
||||||||||||
|
Total Investments
|
||||||||||||
|
(Cost $4,614,162) – 100.00%
|
5,012,415
|
100.00
|
%
|
|||||||||
|
Liabilities in Excess of Other Assets – 0.00%
|
(121
|
)
|
0.00
|
%
|
||||||||
|
|
||||||||||||
|
TOTAL NET ASSETS – 100.00%
|
$
|
5,012,294
|
100.00
|
%
|
||||||||
Percentages are stated as a percent of net assets.
PLC – Public Limited Company
|
(a)
|
Non-income-producing security.
|
|
(b)
|
U.S.-traded security of a foreign corporation.
|
|
(c)
|
The rate listed is the fund’s seven-day yield as of April 30, 2020.
|
Summary of Fair Value Exposure as of April 30, 2020
The following is a summary of the inputs used to value the Fund’s net assets as of April 30, 2020 (see Note 3 in the accompanying Notes to the Financial Statements):
|
Common Stocks
|
Level 1
|
Level 2
|
Level 3
|
Total
|
||||||||||||
|
Communication Services
|
$
|
166,955
|
$
|
—
|
$
|
—
|
$
|
166,955
|
||||||||
|
Consumer Discretionary
|
422,482
|
—
|
—
|
422,482
|
||||||||||||
|
Information Technology
|
4,242,043
|
—
|
—
|
4,242,043
|
||||||||||||
|
Total Common Stocks
|
$
|
4,831,480
|
$
|
—
|
$
|
—
|
$
|
4,831,480
|
||||||||
|
Short-Term Investments
|
||||||||||||||||
|
Money Market Funds
|
$
|
180,935
|
$
|
—
|
$
|
—
|
$
|
180,935
|
||||||||
|
Total Short-Term Investments
|
$
|
180,935
|
$
|
—
|
$
|
—
|
$
|
180,935
|
||||||||
|
Total Investments
|
$
|
5,012,415
|
$
|
—
|
$
|
—
|
$
|
5,012,415
|
||||||||
The accompanying notes are an integral part of these financial statements.
|
HENNESSYFUNDS.COM
|
8
|
SCHEDULE OF INVESTMENTS/STATEMENT OF ASSETS AND LIABILITIES
|
Financial Statements
|
Statement of Assets and Liabilities as of April 30, 2020 (Unaudited)
|
|
ASSETS:
|
||||
|
Investments in securities, at value (cost $4,614,162)
|
$
|
5,012,415
|
||
|
Dividends and interest receivable
|
1,270
|
|||
|
Receivable for fund shares sold
|
322
|
|||
|
Prepaid expenses and other assets
|
16,776
|
|||
|
Due from advisor
|
7,509
|
|||
|
Total assets
|
5,038,292
|
|||
|
LIABILITIES:
|
||||
|
Payable to administrator
|
3,116
|
|||
|
Payable to auditor
|
11,459
|
|||
|
Accrued distribution fees
|
993
|
|||
|
Accrued service fees
|
282
|
|||
|
Accrued trustees fees
|
6,843
|
|||
|
Accrued expenses and other payables
|
3,305
|
|||
|
Total liabilities
|
25,998
|
|||
|
NET ASSETS
|
$
|
5,012,294
|
||
|
NET ASSETS CONSISTS OF:
|
||||
|
Capital stock
|
$
|
4,556,060
|
||
|
Total distributable earnings
|
456,234
|
|||
|
Total net assets
|
$
|
5,012,294
|
||
|
NET ASSETS:
|
||||
|
Investor Class
|
||||
|
Shares authorized (no par value)
|
Unlimited
|
|||
|
Net assets applicable to outstanding shares
|
$
|
3,755,669
|
||
|
Shares issued and outstanding
|
215,195
|
|||
|
Net asset value, offering price, and redemption price per share
|
$
|
17.45
|
||
|
Institutional Class
|
||||
|
Shares authorized (no par value)
|
Unlimited
|
|||
|
Net assets applicable to outstanding shares
|
$
|
1,256,625
|
||
|
Shares issued and outstanding
|
70,114
|
|||
|
Net asset value, offering price, and redemption price per share
|
$
|
17.92
|
||
The accompanying notes are an integral part of these financial statements.
|
HENNESSY FUNDS
|
1-800-966-4354
|
9
Financial Statements
|
Statement of Operations for the six months ended April 30, 2020 (Unaudited)
|
|
INVESTMENT INCOME:
|
||||
|
Dividend income
|
$
|
26,937
|
||
|
Interest income
|
986
|
|||
|
Total investment income
|
27,923
|
|||
|
EXPENSES:
|
||||
|
Investment advisory fees (See Note 5)
|
19,326
|
|||
|
Federal and state registration fees
|
17,636
|
|||
|
Compliance expense (See Note 5)
|
13,462
|
|||
|
Audit fees
|
11,463
|
|||
|
Administration, accounting, custody, and transfer agent fees (See Note 5)
|
8,255
|
|||
|
Trustees’ fees and expenses
|
8,197
|
|||
|
Sub-transfer agent expenses – Investor Class (See Note 5)
|
3,452
|
|||
|
Sub-transfer agent expenses – Institutional Class (See Note 5)
|
358
|
|||
|
Reports to shareholders
|
3,095
|
|||
|
Distribution fees – Investor Class (See Note 5)
|
2,925
|
|||
|
Service fees – Investor Class (See Note 5)
|
1,950
|
|||
|
Other expenses
|
2,097
|
|||
|
Total expenses before reimbursement by advisor
|
92,216
|
|||
|
Expense reimbursement by advisor – Investor Class (See Note 5)
|
(46,725
|
)
|
||
|
Expense reimbursement by advisor – Institutional Class (See Note 5)
|
(15,022
|
)
|
||
|
Net expenses
|
30,469
|
|||
|
NET INVESTMENT LOSS
|
$
|
(2,546
|
)
|
|
|
REALIZED AND UNREALIZED GAINS (LOSSES):
|
||||
|
Net realized gain on investments
|
$
|
88,996
|
||
|
Net change in unrealized appreciation/depreciation on investments
|
(378,872
|
)
|
||
|
Net loss on investments
|
(289,876
|
)
|
||
|
NET DECREASE IN NET ASSETS RESULTING FROM OPERATIONS
|
$
|
(292,422
|
)
|
|
The accompanying notes are an integral part of these financial statements.
|
HENNESSYFUNDS.COM
|
10
|
STATEMENT OF OPERATIONS/STATEMENTS OF CHANGES IN NET ASSETS
|
Financial Statements
|
Statements of Changes in Net Assets
|
|
Six Months Ended
|
||||||||
|
April 30, 2020
|
Year Ended
|
|||||||
|
(Unaudited)
|
October 31, 2019
|
|||||||
|
OPERATIONS:
|
||||||||
|
Net investment loss
|
$
|
(2,546
|
)
|
$
|
(5,958
|
)
|
||
|
Net realized gain on investments
|
88,996
|
156,775
|
||||||
|
Net change in unrealized
|
||||||||
|
appreciation/depreciation on investments
|
(378,872
|
)
|
729,890
|
|||||
|
Net increase (decrease) in net assets
|
||||||||
|
resulting from operations
|
(292,422
|
)
|
880,707
|
|||||
|
DISTRIBUTIONS TO SHAREHOLDERS:
|
||||||||
|
Distributable earnings – Investor Class
|
(108,418
|
)
|
(408,753
|
)
|
||||
|
Distributable earnings – Institutional Class
|
(37,554
|
)
|
(138,693
|
)
|
||||
|
Total distributions
|
(145,972
|
)
|
(547,446
|
)
|
||||
|
CAPITAL SHARE TRANSACTIONS:
|
||||||||
|
Proceeds from shares subscribed – Investor Class
|
297,318
|
371,583
|
||||||
|
Proceeds from shares subscribed – Institutional Class
|
42,505
|
149,605
|
||||||
|
Dividends reinvested – Investor Class
|
106,748
|
401,355
|
||||||
|
Dividends reinvested – Institutional Class
|
37,105
|
137,038
|
||||||
|
Cost of shares redeemed – Investor Class
|
(203,641
|
)
|
(435,464
|
)
|
||||
|
Cost of shares redeemed – Institutional Class
|
(60,553
|
)
|
(124,774
|
)
|
||||
|
Net increase in net assets derived
|
||||||||
|
from capital share transactions
|
219,482
|
499,343
|
||||||
|
TOTAL INCREASE (DECREASE) IN NET ASSETS
|
(218,912
|
)
|
832,604
|
|||||
|
NET ASSETS:
|
||||||||
|
Beginning of period
|
5,231,206
|
4,398,602
|
||||||
|
End of period
|
$
|
5,012,294
|
$
|
5,231,206
|
||||
|
CHANGES IN SHARES OUTSTANDING:
|
||||||||
|
Shares sold – Investor Class
|
16,229
|
21,608
|
||||||
|
Shares sold – Institutional Class
|
2,149
|
8,241
|
||||||
|
Shares issued to holders as reinvestment
|
||||||||
|
of dividends – Investor Class
|
5,574
|
26,633
|
||||||
|
Shares issued to holders as reinvestment
|
||||||||
|
of dividends – Institutional Class
|
1,887
|
8,882
|
||||||
|
Shares redeemed – Investor Class
|
(12,499
|
)
|
(25,732
|
)
|
||||
|
Shares redeemed – Institutional Class
|
(2,939
|
)
|
(7,113
|
)
|
||||
|
Net increase in shares outstanding
|
10,401
|
32,519
|
||||||
The accompanying notes are an integral part of these financial statements.
|
HENNESSY FUNDS
|
1-800-966-4354
|
11
Financial Statements
|
Financial Highlights
|
For an Investor Class share outstanding throughout each period
|
Six Months Ended
|
||||
|
April 30, 2020
|
||||
|
(Unaudited)
|
||||
|
PER SHARE DATA:
|
||||
|
Net asset value, beginning of period
|
$
|
18.90
|
||
|
Income from investment operations:
|
||||
|
Net investment loss
|
(0.01
|
)(1)
|
||
|
Net realized and unrealized gains (losses) on investments
|
(0.92
|
)
|
||
|
Total from investment operations
|
(0.93
|
)
|
||
|
Less distributions:
|
||||
|
Dividends from net realized gains
|
(0.52
|
)
|
||
|
Total distributions
|
(0.52
|
)
|
||
|
Net asset value, end of period
|
$
|
17.45
|
||
|
TOTAL RETURN
|
-5.16
|
%(2)
|
||
|
SUPPLEMENTAL DATA AND RATIOS:
|
||||
|
Net assets, end of period (millions)
|
$
|
3.76
|
||
|
Ratio of expenses to average net assets:
|
||||
|
Before expense reimbursement
|
3.63
|
%(3)
|
||
|
After expense reimbursement
|
1.23
|
%(3)
|
||
|
Ratio of net investment loss to average net assets:
|
||||
|
Before expense reimbursement
|
(2.56
|
)%(3)
|
||
|
After expense reimbursement
|
(0.16
|
)%(3)
|
||
|
Portfolio turnover rate(5)
|
84
|
%(2)
|
||
|
(1)
|
Calculated using the average shares outstanding method.
|
|
(2)
|
Not annualized.
|
|
(3)
|
Annualized.
|
|
(4)
|
The Fund’s current expense limitation agreement, which became effective on February 28, 2017, was in effect for eight months of the year ended October 31, 2017. The Fund previously had
an expense limitation agreement in effect from October 26, 2012, to February 28, 2015.
|
|
(5)
|
Calculated on the basis of the Fund as a whole.
|
The accompanying notes are an integral part of these financial statements.
|
HENNESSYFUNDS.COM
|
12
|
FINANCIAL HIGHLIGHTS — INVESTOR CLASS
|
|
Year Ended October 31,
|
||||||||||||||||||
|
2019
|
2018
|
2017
|
2016
|
2015
|
||||||||||||||
|
$
|
18.04
|
$
|
18.46
|
$
|
15.82
|
$
|
15.36
|
$
|
14.86
|
|||||||||
|
(0.03
|
)(1)
|
(0.05
|
)
|
(0.23
|
)
|
(0.68
|
)
|
(0.38
|
)
|
|||||||||
|
3.15
|
1.26
|
2.87
|
1.14
|
0.88
|
||||||||||||||
|
3.12
|
1.21
|
2.64
|
0.46
|
0.50
|
||||||||||||||
|
(2.26
|
)
|
(1.63
|
)
|
—
|
—
|
—
|
||||||||||||
|
(2.26
|
)
|
(1.63
|
)
|
—
|
—
|
—
|
||||||||||||
|
$
|
18.90
|
$
|
18.04
|
$
|
18.46
|
$
|
15.82
|
$
|
15.36
|
|||||||||
|
20.47
|
%
|
7.25
|
%
|
16.69
|
%
|
2.99
|
%
|
3.36
|
%
|
|||||||||
|
$
|
3.89
|
$
|
3.31
|
$
|
3.20
|
$
|
2.91
|
$
|
4.04
|
|||||||||
|
3.84
|
%
|
3.70
|
%
|
4.16
|
%
|
3.61
|
%
|
3.13
|
%
|
|||||||||
|
1.23
|
%
|
1.23
|
%
|
2.15
|
%(4)
|
3.61
|
%
|
2.75
|
%
|
|||||||||
|
(2.80
|
)%
|
(2.83
|
)%
|
(3.16
|
)%
|
(2.92
|
)%
|
(2.30
|
)%
|
|||||||||
|
(0.19
|
)%
|
(0.36
|
)%
|
(1.15
|
)%(4)
|
(2.92
|
)%
|
(1.92
|
)%
|
|||||||||
|
185
|
%
|
225
|
%
|
267
|
%
|
80
|
%
|
163
|
%
|
|||||||||
The accompanying notes are an integral part of these financial statements.
|
HENNESSY FUNDS
|
1-800-966-4354
|
13
Financial Statements
|
Financial Highlights
|
For an Institutional Class share outstanding throughout each period
|
Six Months Ended
|
||||
|
April 30, 2020
|
||||
|
(Unaudited)
|
||||
|
PER SHARE DATA:
|
||||
|
Net asset value, beginning of period
|
$
|
19.40
|
||
|
Income from investment operations:
|
||||
|
Net investment income (loss)
|
0.01
|
(1)
|
||
|
Net realized and unrealized gains (losses) on investments
|
(0.95
|
)
|
||
|
Total from investment operations
|
(0.94
|
)
|
||
|
Less distributions:
|
||||
|
Dividends from net realized gains
|
(0.54
|
)
|
||
|
Total distributions
|
(0.54
|
)
|
||
|
Net asset value, end of period
|
$
|
17.92
|
||
|
TOTAL RETURN
|
-5.07
|
%(2)
|
||
|
SUPPLEMENTAL DATA AND RATIOS:
|
||||
|
Net assets, end of period (millions)
|
$
|
1.26
|
||
|
Ratio of expenses to average net assets:
|
||||
|
Before expense reimbursement
|
3.25
|
%(3)
|
||
|
After expense reimbursement
|
0.98
|
%(3)
|
||
|
Ratio of net investment income (loss) to average net assets:
|
||||
|
Before expense reimbursement
|
(2.18
|
)%(3)
|
||
|
After expense reimbursement
|
0.09
|
%(3)
|
||
|
Portfolio turnover rate(5)
|
84
|
%(2)
|
||
|
(1)
|
Calculated using the average shares outstanding method.
|
|
(2)
|
Not annualized.
|
|
(3)
|
Annualized.
|
|
(4)
|
The Fund’s current expense limitation agreement, which became effective on February 28, 2017, was in effect for eight months of the year ended October 31, 2017. The Fund previously had
an expense limitation agreement in effect from October 26, 2012, to February 28, 2015.
|
|
(5)
|
Calculated on the basis of the Fund as a whole.
|
The accompanying notes are an integral part of these financial statements.
|
HENNESSYFUNDS.COM
|
14
|
FINANCIAL HIGHLIGHTS — INSTITUTIONAL CLASS
|
|
Year Ended October 31,
|
||||||||||||||||||
|
2019
|
2018
|
2017
|
2016
|
2015
|
||||||||||||||
|
$
|
18.47
|
$
|
18.85
|
$
|
16.11
|
$
|
15.58
|
$
|
15.02
|
|||||||||
|
0.01
|
(1)
|
0.01
|
(0.12
|
)
|
(0.43
|
)
|
(0.25
|
)
|
||||||||||
|
3.23
|
1.28
|
2.86
|
0.96
|
0.81
|
||||||||||||||
|
3.24
|
1.29
|
2.74
|
0.53
|
0.56
|
||||||||||||||
|
(2.31
|
)
|
(1.67
|
)
|
—
|
—
|
—
|
||||||||||||
|
(2.31
|
)
|
(1.67
|
)
|
—
|
—
|
—
|
||||||||||||
|
$
|
19.40
|
$
|
18.47
|
$
|
18.85
|
$
|
16.11
|
$
|
15.58
|
|||||||||
|
20.77
|
%
|
7.54
|
%
|
17.01
|
%
|
3.40
|
%
|
3.73
|
%
|
|||||||||
|
$
|
1.34
|
$
|
1.09
|
$
|
1.22
|
$
|
0.90
|
$
|
0.95
|
|||||||||
|
3.47
|
%
|
3.27
|
%
|
3.74
|
%
|
3.28
|
%
|
2.76
|
%
|
|||||||||
|
0.98
|
%
|
0.98
|
%
|
1.77
|
%(4)
|
3.28
|
%
|
2.44
|
%
|
|||||||||
|
(2.43
|
)%
|
(2.41
|
)%
|
(2.74
|
)%
|
(2.59
|
)%
|
(1.92
|
)%
|
|||||||||
|
0.06
|
%
|
(0.12
|
)%
|
(0.77
|
)%(4)
|
(2.59
|
)%
|
(1.60
|
)%
|
|||||||||
|
185
|
%
|
225
|
%
|
267
|
%
|
80
|
%
|
163
|
%
|
|||||||||
The accompanying notes are an integral part of these financial statements.
|
HENNESSY FUNDS
|
1-800-966-4354
|
15
Financial Statements
|
Notes to the Financial Statements April 30, 2020 (Unaudited)
|
1). ORGANIZATION
The Hennessy Technology Fund (the “Fund”) is a series of Hennessy Funds Trust (the “Trust”), which was organized as a Delaware statutory trust on September 17, 1992. The Fund is an open-end
management investment company registered under the Investment Company Act of 1940, as amended. The investment objective of the Fund is long-term capital appreciation. The Fund is a diversified fund.
The Fund offers Investor Class and Institutional Class shares. Each class of shares differs principally in its respective 12b-1 distribution and service, shareholder
servicing, and sub-transfer agent expenses. There are no sales charges. Each class has identical rights to earnings, assets, and voting privileges, except for class-specific expenses and exclusive rights to vote on
matters affecting only one class.
As an investment company, the Fund follows the investment company accounting and reporting guidance of the Financial Accounting Standards Board (“FASB”) Accounting Standard
Codification Topic 946 “Financial Services—Investment Companies.”
2). SIGNIFICANT ACCOUNTING POLICIES
The following is a summary of significant accounting policies consistently followed by the Fund in the preparation of the financial statements. These policies conform to U.S. generally accepted
accounting principles (“GAAP”).
|
a).
|
Securities Valuation – All investments in securities are recorded at their estimated fair value, as described in Note 3.
|
|
b).
|
Federal Income Taxes – No provision for federal income taxes or excise taxes has been made because the Fund has elected to be taxed as a regulated investment company and intends to
distribute substantially all of its taxable income to its shareholders and otherwise comply with the provisions of the Internal Revenue Code of 1986, as amended, applicable to regulated investment companies. Net
investment income/loss and realized gains/losses for federal income tax purposes may differ from those reported in the financial statements because of temporary book and tax basis differences. Temporary
differences are primarily the result of the treatment of wash sales for tax reporting purposes. The Fund recognizes interest and penalties related to income tax benefits, if any, in the Statement of Operations as
an income tax expense. Distributions from net realized gains for book purposes may include short-term capital gains, which are included as ordinary income to shareholders for tax purposes. The Fund may utilize
equalization accounting for tax purposes and designate earnings and profits, including net realized gains distributed to shareholders on redemption of shares, as part of the dividends paid deduction for income
tax purposes.
|
|
c).
|
Accounting for Uncertainty in Income Taxes – The Fund has accounting policies regarding recognition and measurement of tax positions taken or expected to be taken on a tax return. The
tax returns of the Fund for the prior three fiscal years are open for examination. The Fund has reviewed all open tax years in major jurisdictions and concluded that there is no impact on the Fund’s net assets
and no tax liability resulting from unrecognized tax benefits relating to uncertain income tax positions taken or expected to be taken on a tax return. The Fund’s major tax jurisdictions are U.S. federal and
Delaware.
|
|
HENNESSYFUNDS.COM
|
16
|
NOTES TO THE FINANCIAL STATEMENTS
|
|
d).
|
Income and Expenses – Dividend income is recognized on the ex-dividend date or as soon as information is available to the Fund. Interest income, which includes the amortization of
premium and accretion of discount, is recognized on an accrual basis. Other non-cash dividends are recognized as investment income at the fair value of the property received. The Fund is charged for those
expenses that are directly attributable to its portfolio, such as advisory, administration, and certain shareholder service fees. Income, expenses (other than expenses attributable to a specific class), and
realized and unrealized gains/losses on investments are allocated to each class of shares based on such class’s net assets.
|
|
e).
|
Distributions to Shareholders – Dividends from net investment income for the Fund, if any, are declared and paid annually, usually in December. Distributions of net realized capital
gains, if any, are declared and paid annually, usually in December.
|
|
f).
|
Security Transactions – Investment and shareholder transactions are recorded on the trade date. The Fund determines the realized gain/loss from an investment transaction by comparing
the original cost of the security lot sold with the net sale proceeds. Discounts and premiums on securities purchased are accreted or amortized, respectively, over the life of each such security.
|
|
g).
|
Use of Estimates – The preparation of financial statements in conformity with GAAP requires management to make estimates and assumptions that affect the reported amounts of assets and
liabilities and disclosure of contingent assets and liabilities at the date of the financial statements and the reported change in net assets during the reporting period. Actual results could differ from those
estimates.
|
|
h).
|
Share Valuation – The net asset value (“NAV”) per share of the Fund is calculated by dividing (i) the total value of the securities held by the Fund, plus cash and other assets, minus
all liabilities (including estimated accrued expenses) by (ii) the total number of shares outstanding for the Fund, rounded to the nearest $0.01. The Fund’s shares will not be priced on days the New York Stock
Exchange is closed for trading. The offering and redemption price per share for the Fund is equal to the Fund’s NAV per share.
|
3). SECURITIES VALUATION
The Fund follows fair value accounting standards that establish an authoritative definition of fair value and set out a hierarchy for measuring fair value. These standards require additional
disclosures about the various inputs and valuation techniques used to develop the measurements of fair value and a discussion of changes in valuation techniques and related inputs during the period. These inputs are
summarized in the three broad levels listed below:
|
Level 1 –
|
Unadjusted, quoted prices in active markets for identical instruments that the Fund has the ability to access at the date of measurement.
|
|
|
Level 2 –
|
Other significant observable inputs (including, but not limited to, quoted prices in active markets for similar instruments, quoted prices in markets that are not active for identical
or similar instruments, and model-derived valuations in which all significant inputs and significant value drivers are observable in active markets, such as interest rates, prepayment speeds, credit risk curves,
default rates, and similar data).
|
|
|
Level 3 –
|
Significant unobservable inputs (including the Fund’s own assumptions about what market participants would use to price the asset or liability based on the best available information)
when observable inputs are unavailable.
|
|
HENNESSY FUNDS
|
1-800-966-4354
|
17
The following is a description of the valuation techniques applied to the Fund’s major categories of assets and liabilities measured at fair value on a recurring basis:
|
Equity Securities – Equity securities, including common stocks, preferred stocks, foreign-issued common stocks, exchange-traded funds,
closed-end mutual funds, partnerships, rights, and real estate investment trusts, that are traded on a securities exchange for which a last-quoted sales price is readily available will generally be valued at the
last sales price as reported by the primary exchange on which the securities are listed. Securities listed on The NASDAQ Stock Market (“NASDAQ”) will generally be valued at the NASDAQ Official Closing Price,
which may differ from the last sales price reported. Securities traded on a securities exchange for which a last-quoted sales price is not readily available will generally be valued at the mean between the bid
and ask prices. To the extent these securities are actively traded and valuation adjustments are not applied, they are classified in Level 1 of the fair value hierarchy. Securities traded on foreign exchanges
generally are not valued at the same time the Fund calculates its NAV because most foreign markets close well before such time. The earlier close of most foreign markets gives rise to the possibility that
significant events, including broad market moves, may have occurred in the interim. In certain circumstances, it may be determined that a foreign security needs to be fair valued because it appears that the value
of the security might have been materially affected by events occurring after the close of the market in which the security is principally traded, but before the time the Fund calculates its NAV, such as by a
development that affects an entire market or region (e.g., a weather-related event) or a potentially global development (e.g., a terrorist attack that may be expected to have an effect on investor expectations
worldwide).
|
|
|
Registered Investment Companies – Investments in open-end registered investment companies, commonly referred to as mutual funds, generally are
priced at the ending NAV provided by the applicable mutual fund’s service agent and will be classified in Level 1 of the fair value hierarchy.
|
|
|
Debt Securities – Debt securities, including corporate bonds, asset-backed securities, mortgage-backed securities, municipal bonds, U.S.
Treasuries, and U.S. government agency issues, are generally valued at market on the basis of valuations furnished by an independent pricing service that utilizes both dealer-supplied valuations and formula-based
techniques. The pricing service may consider recently executed transactions in securities of the issuer or comparable issuers, market price quotations (where observable), bond spreads, and fundamental data
relating to the issuer. In addition, the model may incorporate observable market data, such as reported sales of similar securities, broker quotes, yields, bids, offers, and reference data. Certain securities are
valued primarily using dealer quotations. These securities are generally classified in Level 2 of the fair value hierarchy.
|
|
|
Short-Term Securities – Short-term equity investments, including money market funds, are valued in the manner specified above. Short-term debt
investments with an original term to maturity of 60 days or less are valued at amortized cost, which approximates fair market value. If the original term to maturity of a short-term debt investment exceeded 60
days, then the values as of the 61st day prior to maturity are amortized. Amortized cost is not used if its use would be inappropriate due to credit or other impairments of the issuer, in which case the
security’s fair value would be determined, as described below. Short-term securities are generally classified in Level 1 or Level 2 of the fair value hierarchy depending on the inputs used and market activity
levels for specific securities.
|
|
HENNESSYFUNDS.COM
|
18
|
NOTES TO THE FINANCIAL STATEMENTS
|
The Board of Trustees of the Fund (the “Board”) has adopted fair value pricing procedures that are followed when a price for a security is not readily available or if a
significant event has occurred that indicates the closing price of a security no longer represents the true value of that security. Fair value pricing determinations are made in good faith in accordance with these
procedures. There are numerous criteria that will be given consideration in determining a fair value of a security, such as the trading volume of a security and markets, the values of other similar securities, and news
events with direct bearing on a security or markets. Fair value pricing results in an estimated price for a security that reflects the amount the Fund might reasonably expect to receive in a current sale. Depending on
the relative significance of the valuation inputs, these securities may be classified in either Level 2 or Level 3 of the fair value hierarchy.
The fair value of foreign securities may be determined with the assistance of a pricing service using correlations between the movement of prices of such securities and
indices of domestic securities and other appropriate indicators, such as closing market prices of relevant American Depositary Receipts or futures contracts. Using fair value pricing means that the Fund’s NAV reflects
the affected portfolio securities’ values as determined by the Board or its designee, pursuant to the fair value pricing procedures adopted by the Board, instead of being determined by the market. Using a fair value
pricing methodology to price a foreign security may result in a value that is different from such foreign security’s most recent closing price and from the value used by other investment companies to calculate their
NAVs. Such securities are generally classified in Level 2 of the fair value hierarchy. Because the Fund may invest in foreign securities, the value of the Fund’s portfolio securities may change on days when you will not
be able to purchase or redeem your shares.
The Board has delegated day-to-day valuation matters to the Valuation and Liquidity Committee comprising representatives from Hennessy Advisors, Inc., the Fund’s investment
advisor (the “Advisor”). The function of the Valuation and Liquidity Committee is to value securities where current and reliable market quotations are not readily available. All actions taken by the Valuation and
Liquidity Committee are reviewed by the Board.
The Fund has performed an analysis of all existing investments to determine the significance and character of all inputs to their fair value determinations. Various inputs
are used to determine the value of the Fund’s investments. The inputs or methodology used for valuing securities are not necessarily an indication of the risk associated with investing in those securities. Details
related to the fair value hierarchy of the Fund’s securities as of April 30, 2020, are included in the Schedule of Investments.
4). INVESTMENT TRANSACTIONS
Purchases and sales of investment securities (excluding government and short-term investments) for the Fund during the six months ended April 30, 2020, were $4,308,132 and $4,260,539,
respectively.
There were no purchases or sales/maturities of long-term U.S. government securities for the Fund during the six months ended April 30, 2020.
The Fund is permitted to purchase or sell securities from or to another fund in the Hennessy Funds family of funds (collectively, the “Hennessy Funds”) under specified
conditions outlined in procedures adopted by the Board. The procedures have been designed to ensure that any purchase or sale of securities by the Fund from or to another Hennessy Fund complies with Rule 17a-7 of the
Investment Company Act of 1940, as amended. During the six months ended April 30, 2020, the Fund did not engage in purchases or sales of securities pursuant to Rule 17a-7 of the Investment Company Act of 1940, as
amended.
|
HENNESSY FUNDS
|
1-800-966-4354
|
19
5). INVESTMENT ADVISORY FEE AND OTHER TRANSACTIONS WITH AFFILIATES
The Advisor provides the Fund with investment advisory services under an Investment Advisory Agreement. The Advisor furnishes all investment advice, office space, and facilities and most of the
personnel needed by the Fund. As compensation for its services, the Advisor is entitled to a monthly fee from the Fund. The fee is based on the average daily net assets of the Fund at an annual rate of 0.74%. The net
investment advisory fees expensed by the Fund during the six months ended April 30, 2020, are included in the Statement of Operations.
The Advisor has contractually agreed to limit total annual operating expenses to 0.98% of the Fund’s net assets for both Investor Class shares and Institutional Class shares
(excluding all federal, state and local taxes, interest, brokerage commissions, 12b-1 fees, shareholder servicing fees payable to the Advisor, extraordinary items, and acquired fund fees and expenses and other costs
incurred in connection with the purchase and sale of securities) through February 28, 2021.
For three years following the date on which expenses were waived or incurred, the Advisor may recoup waived or reimbursed expenses from the Fund if total operating expenses,
including such recoupment, does not exceed the expense limitation in effect (i) at the time the Advisor waived or reimbursed such expenses and (ii) at the time the Advisor recoups such expenses. As of April 30, 2020,
expenses subject to potential recovery for Investor Class and Institutional Class shares and the fiscal years in which they expire were as follows:
|
Fiscal Year
|
Fiscal Year
|
Fiscal Year
|
Fiscal Year
|
|||
|
2020
|
2021
|
2022
|
2023
|
Total
|
||
|
Investor Class
|
$44,032
|
$83,351
|
$92,255
|
$46,725
|
$266,363
|
|
|
Institutional Class
|
$15,692
|
$26,820
|
$29,447
|
$15,022
|
$ 86,981
|
The Advisor did not recoup expenses from the Fund during the six months ended April 30, 2020.
The Board has approved a Shareholder Servicing Agreement for Investor Class shares of the Fund, which was instituted to compensate the Advisor for the non-investment advisory
services it provides to the Fund. The Shareholder Servicing Agreement provides for a monthly fee paid to the Advisor at an annual rate of 0.10% of the average daily net assets of the Fund attributable to Investor Class
shares. The shareholder service fees expensed by the Fund during the six months ended April 30, 2020, are included in the Statement of Operations.
The Fund has adopted a plan pursuant to Rule 12b-1 under the Investment Company Act of 1940, as amended, that authorizes payments in connection with the distribution of the
Fund’s shares at an annual rate of up to 0.25% of the Fund’s average daily net assets attributable to Investor Class shares. Even though the authorized rate is up to 0.25%, the Fund is currently only using up to 0.15% of
its average daily net assets attributable to Investor Class shares for such purpose. Amounts paid under the plan may be spent on any activities or expenses primarily intended to result in the sale of shares, including,
but not limited to, advertising, shareholder account servicing, printing and mailing of prospectuses to other than current shareholders, printing and mailing of sales literature, and compensation for sales and marketing
activities or to financial institutions and others, such as dealers and distributors. The distribution fees expensed by the Fund during the six months ended April 30, 2020, are included in the Statement of Operations.
The Fund has entered into agreements with various brokers, dealers, and financial intermediaries in connection with the sale of shares of the Fund. The agreements provide for
periodic payments of sub-transfer agent expenses by the Fund to the brokers, dealers,
|
HENNESSYFUNDS.COM
|
20
|
NOTES TO THE FINANCIAL STATEMENTS
|
and financial intermediaries for providing certain shareholder maintenance services. These shareholder services include the pre-processing and quality control of new accounts, shareholder
correspondence, answering customer inquiries regarding account status, and facilitating shareholder telephone transactions. The sub-transfer agent fees expensed by the Fund during the six months ended April 30, 2020, are
included in the Statement of Operations.
U.S. Bancorp Fund Services, LLC, d/b/a U.S. Bank Global Fund Services (“Fund Services”) provides the Fund with administrative, accounting, and transfer agent services. As
administrator, Fund Services is responsible for activities such as (i) preparing various federal and state regulatory filings, reports, and returns for the Fund, (ii) preparing reports and materials to be supplied to the
Board, (iii) monitoring the activities of the Fund’s custodian, transfer agent, and accountants, and (iv) coordinating the preparation and payment of the Fund’s expenses and reviewing the Fund’s expense accruals. U.S.
Bank N.A., an affiliate of Fund Services, serves as the Fund’s custodian. The servicing agreements between the Trust and Fund Services and U.S. Bank N.A. contain a fee schedule that is inclusive of administrative,
accounting, custody, and transfer agent fees. The administrative, accounting, custody, and transfer agent fees expensed by the Fund during the six months ended April 30, 2020, are included in the Statement of Operations.
Quasar Distributors, LLC (“Quasar”) acts as the Fund’s principal underwriter in a continuous public offering of the Fund’s shares. Quasar was an affiliate of Fund Services
and U.S. Bank N.A. through March 30, 2020. Effective March 31, 2020, Foreside Financial Group, LLC (“Foreside”) acquired Quasar from Fund Services. As a result of the acquisition, Quasar became a wholly owned
broker-dealer subsidiary of Foreside and is no longer affiliated with Fund Services or U.S. Bank N.A. The Board approved a new Distribution Agreement to enable Quasar to continue serving as the Fund’s distributor.
The officers of the Fund are affiliated with the Advisor. With the exception of the Chief Compliance Officer and the Senior Compliance Officer, such officers receive no
compensation from the Fund for serving in their respective roles. The Fund, along with the other Hennessy Funds, makes reimbursement payments on an equal basis to the Advisor for a portion of the salary and benefits
associated with the office of the Chief Compliance Officer and for all of the salary and benefits associated with the office of the Senior Compliance Officer. The compliance fees expensed by the Fund during the
six months ended April 30, 2020, are included in the Statement of Operations.
6). GUARANTEES AND INDEMNIFICATIONS
Under the Hennessy Funds’ organizational documents, their officers and trustees are indemnified by the Hennessy Funds against certain liabilities arising out of the performance of their duties
to the Hennessy Funds. Additionally, in the normal course of business, the Hennessy Funds enter into contracts with service providers that contain general indemnification clauses. The Fund’s maximum exposure under these
arrangements is unknown as this would involve future claims that may be made against the Fund that have not yet occurred. Currently, the Fund expects the risk of loss to be remote.
7). LINE OF CREDIT
The Fund has an uncommitted line of credit with the other Hennessy Funds in the amount of the lesser of (i) $100,000,000 or (ii) 33.33% of each Hennessy Fund’s net assets, or 30% for the
Hennessy Gas Utility Fund and 10% for the Hennessy Balanced Fund, intended to provide short-term financing, if necessary, subject to certain restrictions, in connection with shareholder redemptions. The credit facility
is with the Hennessy Funds’ custodian bank, U.S. Bank N.A. Borrowings under this arrangement bear
|
HENNESSY FUNDS
|
1-800-966-4354
|
21
interest at the bank’s prime rate and are secured by all of the Fund’s assets (as to its own borrowings only). During the six months ended April 30, 2020, the Fund did not have any borrowings
outstanding under the line of credit.
8). FEDERAL TAX INFORMATION
As of October 31, 2019, the Fund’s most recent fiscal year end, the components of accumulated earnings (losses) for income tax purposes were as follows:
|
Investments
|
|||||
|
Cost of investments for tax purposes
|
$
|
4,492,391
|
|||
|
Gross tax unrealized appreciation
|
$
|
881,203
|
|||
|
Gross tax unrealized depreciation
|
(132,544
|
)
|
|||
|
Net tax unrealized appreciation/(depreciation)
|
$
|
748,659
|
|||
|
Undistributed ordinary income
|
$
|
61,674
|
|||
|
Undistributed long-term capital gains
|
84,295
|
||||
|
Total distributable earnings
|
$
|
145,969
|
|||
|
Other accumulated gain/(loss)
|
$
|
—
|
|||
|
Total accumulated gain/(loss)
|
$
|
894,628
|
|||
The difference between book-basis unrealized appreciation/depreciation and tax-basis unrealized appreciation/depreciation (as shown above) is attributable primarily to wash
sales.
As of October 31, 2019, the Fund had no tax basis capital losses to offset future capital gains.
As of October 31, 2019, the Fund did not defer, on a tax basis, any late-year ordinary losses. Late-year ordinary losses are net ordinary losses incurred after December 31,
2018, but within the taxable year, that are deemed to arise on the first day of the Fund’s next taxable year.
During fiscal year 2020 (year to date) and fiscal year 2019, the tax character of distributions paid by the Fund was as follows:
|
Six Months Ended
|
Year Ended
|
||||||||
|
April 30, 2020
|
October 31, 2019
|
||||||||
|
Ordinary income(1)
|
$
|
61,675
|
$
|
381,139
|
|||||
|
Long-term capital gain
|
84,297
|
166,307
|
|||||||
|
$
|
145,972
|
$
|
547,446
|
||||||
|
(1) Ordinary income includes short-term capital gain.
|
9). EVENTS SUBSEQUENT TO PERIOD END
Management has evaluated the Fund’s related events and transactions that occurred subsequent to April 30, 2020, through the date of issuance of the Fund’s financial statements. Management has
determined that there were no subsequent events requiring recognition or disclosure in the financial statements.
|
HENNESSYFUNDS.COM
|
22
|
NOTES TO THE FINANCIAL STATEMENTS/EXPENSE EXAMPLE
|
Expense Example (Unaudited)
April 30, 2020
As a shareholder of the Fund, you incur ongoing costs, including management fees, service fees, and other Fund expenses. This Example is intended to help you understand your ongoing costs (in
dollars) of investing in the Fund and to compare these costs with the ongoing costs of investing in other mutual funds. The Example is based on an investment of $1,000 invested at the beginning of the period and held for
the entire period from November 1, 2019, through April 30, 2020.
Actual Expenses
The first line of the table below under the “Investor Class” and “Institutional Class” headings provides information about actual account values and actual expenses. Although the Fund charges
no sales loads or transaction fees, you will be assessed fees for outgoing wire transfers, returned checks and stop payment orders at prevailing rates charged by U.S. Bank Global Fund Services, the Fund’s transfer agent.
If you request that a redemption be made by wire transfer, currently a $15 fee is charged by the Fund’s transfer agent. IRA accounts will be charged a $15 annual maintenance fee. The example below includes, but is not
limited to, management fees, shareholder servicing fees, accounting, custody, and transfer agent fees. However, the example below does not include portfolio trading commissions and related expenses. You may use the
information in this line, together with the amount you invested, to estimate the expenses that you paid over the period. Simply divide your account value by $1,000 (for example, an $8,600 account value divided by $1,000
= 8.6), then multiply the result by the number in the first line of the table under the “Investor Class” or “Institutional Class” headings in the column entitled “Expenses Paid During Period” to estimate the expenses you
paid on your account during this period.
Hypothetical Example for Comparison Purposes
The second line of the table below under the “Investor Class” and “Institutional Class” headings provides information about hypothetical account values and hypothetical expenses based on the
Fund’s actual expense ratios and an assumed rate of return of 5% per year before expenses, which is not the Fund’s actual return. The hypothetical account values and expenses may not be used to estimate the actual ending
account balance or expenses you paid for the period. You may use this information to compare the ongoing costs of investing in the Fund and other funds. To do so, compare this 5% hypothetical example with the 5%
hypothetical examples that appear in the shareholder reports of the other funds. Please note that the expenses shown in the table are meant to highlight your ongoing costs only. Therefore, the second line of the table
under the “Investor Class” and “Institutional Class” headings is useful in comparing ongoing costs only and will not help you determine the relative total costs of owning different funds.
|
HENNESSY FUNDS
|
1-800-966-4354
|
23
|
Beginning
|
Ending
|
||
|
Account Value
|
Account Value
|
Expenses Paid
|
|
|
November 1, 2019
|
April 30, 2020
|
During Period(1)
|
|
|
Investor Class
|
|||
|
Actual
|
$1,000.00
|
$ 948.40
|
$5.96
|
|
Hypothetical (5% return before expenses)
|
$1,000.00
|
$1,018.75
|
$6.17
|
|
Institutional Class
|
|||
|
Actual
|
$1,000.00
|
$ 949.30
|
$4.75
|
|
Hypothetical (5% return before expenses)
|
$1,000.00
|
$1,019.99
|
$4.92
|
|
(1)
|
Expenses are equal to the Fund’s annualized expense ratio of 1.23% for Investor Class shares or 0.98% for Institutional Class shares, as applicable, multiplied by the average account
value over the period, multiplied by 182/366 days (to reflect the half-year period).
|
|
HENNESSYFUNDS.COM
|
24
|
EXPENSE EXAMPLE — ELECTRONIC DELIVERY
|
How to Obtain a Copy of the Fund’s Proxy
Voting Policy and Proxy Voting Records
A description of the policies and procedures the Fund uses to determine how to vote proxies relating to portfolio securities is available without charge (1) by calling 1-800-966-4354, (2) on
the Hennessy Funds’ website at www.hennessyfunds.com/proxy-voting/voting-policy, or (3) on the U.S. Securities and Exchange Commission’s (the “SEC”) website at www.sec.gov. The Fund’s proxy voting record is available
without charge on both the Hennessy Funds’ website at www.hennessyfunds.com/proxy-voting/voting-record and the SEC’s website at www.sec.gov no later than August 31 for the prior 12 months ending June 30.
Availability of Quarterly Portfolio Schedule
The Fund files a complete schedule of portfolio holdings with the SEC for the first and third quarters of each fiscal year as an exhibit to its reports on Form N-PORT. The Fund’s Forms N-PORT
are available on the SEC’s website at www.sec.gov or on request by calling 1-800-966-4354.
Federal Tax Distribution Information (Unaudited)
For fiscal year 2019, certain dividends paid by the Fund may be subject to a maximum tax rate of 23.8%, as provided for by the Jobs and Growth Tax Relief Reconciliation Act of 2003. The
percentage of dividends declared from ordinary income designated as qualified dividend income was 8.73%.
For corporate shareholders, the percent of ordinary income distributions that qualified for the corporate dividends received deduction for fiscal year 2019 was 0.00%.
The percentage of taxable ordinary income distributions that were designated as short-term capital gain distributions under Section 871(k)(2)(C) of the Internal Revenue Code
of 1986, as amended, for the Fund was 100.00%.
Important Notice Regarding Delivery
of Shareholder Documents
To help keep the Fund’s costs as low as possible, we generally deliver a single copy of shareholder reports, proxy statements, and prospectuses to shareholders who share an address and have the
same last name. This process does not apply to account statements. You may request an individual copy of a shareholder document at any time. If you would like to receive separate mailings of shareholder documents, please
call U.S. Bank Global Fund Services at 1-800-261-6950 or 1-414-765-4124, and individual delivery will begin within 30 days of your request. If your account is held through a financial institution or other intermediary,
please contact such intermediary directly to request individual delivery.
Electronic Delivery
The Funds offer shareholders the option to receive account statements, prospectuses, tax forms, and shareholder reports online. To sign up for eDelivery, please visit
www.hennessyfunds.com/account. You may change your delivery preference at any time by visiting our website or calling U.S. Bank Global Fund Services at 1-800-261-6950 or 1-414-765-4124.
|
HENNESSY FUNDS
|
1-800-966-4354
|
25
Board Approval of Investment Advisory
Agreement
At its meeting on March 12, 2020, the Board of Trustees of the Fund (the “Board,” and the members thereof, the “Trustees”) unanimously approved the continuation of the investment advisory
agreement of the Fund with Hennessy Advisors, Inc. (the “Advisor”). As part of the process of approving the continuation of the advisory agreement, the Trustees reviewed their fiduciary duties and the relevant factors
for them to consider with respect to approving the advisory agreement. In addition, the Trustees who are not deemed “interested persons” (as defined by the Investment Company Act of 1940, as amended) of the Fund (the
“Independent Trustees”) met in executive session to discuss the approval of the advisory agreement.
In advance of the meeting, the Advisor sent detailed information to the Trustees to assist them in their evaluation of the advisory agreement. This information included, but
was not limited to, the following:
|
(1)
|
A memorandum from outside legal counsel that described the fiduciary duties of the Board with respect to approving the continuation of the advisory agreement and the relevant factors
for consideration;
|
|
|
(2)
|
A memorandum from the Advisor that listed the factors relevant to the Board’s approval of the continuation of the advisory agreement and also referenced the documents that had been
provided to help the Board assess each such factor;
|
|
|
(3)
|
An inventory of the services provided by the Advisor;
|
|
|
(4)
|
A written discussion of economies of scale;
|
|
|
(5)
|
A summary of the key terms of the advisory agreement;
|
|
|
(6)
|
A recent Fund fact sheet, which included performance information over various periods;
|
|
|
(7)
|
A peer expense comparison of the net expense ratio and investment advisory fee of the Fund; and
|
|
|
(8)
|
The Advisor’s financial statements from its most recent Form 10-K and Form 10-Q.
|
All of the factors discussed were considered as a whole by the Trustees and by the Independent Trustees meeting in executive session. The factors were viewed in their
totality by the Trustees, with no single factor being the principal or determinative factor in the Trustees’ determination of whether to approve the continuation of the advisory agreement. The Trustees recognized that
the management and fee arrangements for the Fund are the result of years of review and discussion between the Independent Trustees and the Advisor, that certain aspects of such arrangements may receive greater scrutiny
in some years than in others, and that the Trustees’ conclusions may be based, in part, on their consideration of these same arrangements and information received during the course of the year and in prior years.
Prior to approving the continuation of the advisory agreement, the Trustees, including the Independent Trustees in executive session, considered, among other items:
|
(1)
|
The nature and quality of the advisory services provided by the Advisor;
|
|
|
(2)
|
A comparison of the fees and expenses of the Fund to other similar funds;
|
|
|
(3)
|
Whether economies of scale are recognized by the Fund;
|
|
HENNESSYFUNDS.COM
|
26
|
BOARD APPROVAL OF INVESTMENT ADVISORY AGREEMENT
|
|
(4)
|
The costs and profitability of the Fund to the Advisor;
|
|
|
(5)
|
The performance of the Fund; and
|
|
|
(6)
|
Any benefits to the Advisor from serving as an investment advisor to the Fund (other than the advisory fee).
|
The material considerations and determinations of the Trustees, including the Independent Trustees, were as follows:
|
(1)
|
The Trustees considered the services identified below that are provided by the Advisor. Based on this review, the Trustees concluded that the Advisor provides high-quality services to
the Fund and noted that their overall confidence in the Advisor was high. The Trustees also concluded that they were satisfied with the nature, extent, and quality of the advisory services provided to the Fund by
the Advisor and that the nature and extent of the services provided by the Advisor were appropriate to assure that the Fund’s operations are conducted in compliance with applicable laws, rules, and regulations.
|
|
(a)
|
The Advisor acts as the portfolio manager for the Fund. In this capacity, the Advisor does the following:
|
|
(i)
|
manages the composition of the Fund’s portfolio, including the purchase, retention, and disposition of portfolio securities in accordance with the Fund’s investment objectives,
policies, and restrictions;
|
|||
|
(ii)
|
seeks best execution for the Fund’s portfolio;
|
|||
|
(iii)
|
manages the use of soft dollars for the Fund; and
|
|||
|
(iv)
|
manages proxy voting for the Fund.
|
|
(b)
|
The Advisor performs a daily reconciliation of portfolio positions and cash for the Fund.
|
||
|
(c)
|
The Advisor monitors the liquidity of each Fund.
|
||
|
(d)
|
The Advisor monitors the Fund’s compliance with its investment objectives and restrictions.
|
||
|
(e)
|
The Advisor monitors compliance with federal securities laws, maintains a compliance program (including a code of ethics), conducts ongoing reviews of the compliance programs of the
Fund’s service providers, as feasible, conducts on-site visits to the Fund’s service providers, monitors incidents of abusive trading practices, reviews Fund expense accruals, payments, and fixed expense ratios,
evaluates insurance providers for fidelity bond, D&O/E&O insurance, and cybersecurity insurance coverage, manages regulatory examination compliance and responses, conducts employee compliance training,
reviews reports provided by service providers, and maintains books and records.
|
||
|
(f)
|
The Advisor oversees service providers that provide accounting, administration, distribution, transfer agency, custodial, sales, marketing, public relations, audit, information
technology, and legal services to the Fund.
|
||
|
(g)
|
The Advisor maintains in-house marketing and distribution departments on behalf of the Fund.
|
||
|
(h)
|
The Advisor is actively involved with preparing regulatory filings for the Fund, including writing and annually updating the Fund’s prospectus and related documents.
|
|
HENNESSY FUNDS
|
1-800-966-4354
|
27
|
(i)
|
For each annual report of the Fund, the Advisor prepares a written summary of the Fund’s performance during the most recent 12-month period.
|
||
|
(j)
|
The Advisor oversees distribution of the Fund through third-party broker/dealers and independent financial institutions such as Charles Schwab, Inc., Fidelity, TD Ameritrade, and
Pershing. The Advisor participates in “no transaction fee” (“NTF”) programs with these companies on behalf of the Fund, which allow customers to purchase the Fund through third-party distribution channels without
paying a transaction fee. The Advisor compensates, in part, a number of these third-party providers of NTF programs out of its own revenues.
|
||
|
(k)
|
The Advisor pays the incentive compensation of the Fund’s compliance officers and employs other staff, such as legal, marketing, national accounts, distribution, sales, administrative,
and trading oversight personnel, as well as management executives.
|
||
|
(l)
|
The Advisor provides a quarterly compliance certification to the Board.
|
||
|
(m)
|
The Advisor prepares or reviews all Board materials, frequently presents to the Board and leads Board discussions, prepares or reviews all meeting minutes, and arranges for Board
training and education.
|
|
(2)
|
The Trustees compared the performance of the Fund to benchmark indices over various periods and also noted that the Trustees review and discuss reports comparing the investment
performance of the Fund to various indices at each quarterly Board meeting. Based on such information, the Trustees determined that the Advisor manages the Fund in a manner materially consistent with its stated
investment objective and style. The Trustees concluded that the performance of the Fund over various periods warranted continuation of the advisory agreement.
|
|
|
(3)
|
The Trustees reviewed the advisory fees and overall expense ratios of the Fund compared to other funds similar in asset size and investment objective to the Fund using data from
Morningstar. As part of the discussion with management, the Trustees ensured that they understood and were comfortable with the criteria used to determine the mutual funds included in the Morningstar categories
for purposes of the materials considered at the meeting. The Trustees determined that the advisory fee and overall expense ratio of the Fund falls within the range of the advisory fees and overall expense ratios
of other comparable funds and concluded that they are reasonable and warranted continuation of the advisory agreement.
|
|
|
(4)
|
The Trustees also considered whether the Advisor was realizing economies of scale that it should share with the Fund’s shareholders. The Trustees noted that the assets of the Fund had
remained relatively flat over the prior year. In addition, the Trustees noted that many of the expenses incurred to manage the Fund are asset-based fees, so the Advisor does not realize material economies of
scale relating to those expenses as the assets of the Fund increase. For example, mutual fund platform fees increase as the Fund’s assets grow. The Trustees also considered the Advisor’s efforts to contain
expenses through actions such as renegotiating service contracts, the Advisor’s significant marketing efforts to promote the Funds, the Advisor’s investments in personnel to manage the Funds, and the Advisor’s
agreement to waive fees or lower its management fees
|
|
HENNESSYFUNDS.COM
|
28
|
BOARD APPROVAL OF INVESTMENT ADVISORY AGREEMENT
|
|
in certain circumstances. The Trustees noted that it did not appear that the Advisor was realizing economies of scale at current asset levels and concluded that it would continue to
monitor economies of scale in the future as circumstances changed.
|
||
|
(5)
|
The Trustees considered the profitability of the Advisor, including the impact of mutual fund platform fees on the Advisor’s profitability, and also considered the resources and
revenues that the Advisor has put into managing and distributing the Fund. The Trustees then concluded that the profits of the Advisor are reasonable and not excessive when compared to profitability guidelines
set forth in relevant court cases.
|
|
|
(6)
|
The Trustees considered the high level of professionalism and knowledge of the Advisor’s employees, along with a very low level of turnover, and concluded that this was beneficial to
the Fund and its shareholders.
|
|
|
(7)
|
The Trustees considered any benefits to the Advisor from serving as an advisor to the Fund (other than the advisory fee). The Trustees noted that the Advisor may derive ancillary
benefits from, by way of example, its association with the Fund in the form of proprietary and third-party research products and services received from broker-dealers that execute portfolio trades for the Fund.
The Trustees determined that any such products and services have been used for legitimate purposes relating to the Fund by providing assistance in the investment decision-making process. The Trustees concluded
that any additional benefits realized by the Advisor from its relationship with the Fund were reasonable, which was based on, among other things, the Trustees’ finding that the research, analytical, statistical,
and other information and services provided by brokers are merely supplemental to the Advisor’s own efforts in the performance of its duties under the advisory agreement.
|
After reviewing the materials and information provided at the meeting, as well as other information regularly provided at the Board’s quarterly meetings throughout the year
regarding the quality of services provided by the Advisor, the performance of the Fund, expense information, brokerage commissions information, the adequacy and efficacy of the Advisor’s written policies and procedures,
other regulatory compliance issues, trading information and related matters, and other factors that the Trustees deemed relevant, the Trustees, including the Independent Trustees, approved the continuation of the
advisory agreement.
|
HENNESSY FUNDS
|
1-800-966-4354
|
29
For information, questions, or assistance, please call
The Hennessy Funds
1-800-966-4354 or 1-415-899-1555
INVESTMENT ADVISOR
Hennessy Advisors, Inc.
7250 Redwood Boulevard, Suite 200
Novato, California 94945
ADMINISTRATOR,
TRANSFER AGENT,
DIVIDEND PAYING AGENT, &
SHAREHOLDER SERVICING AGENT
U.S. Bancorp Fund Services, LLC
d/b/a U.S. Bank Global Fund Services
P.O. Box 701
Milwaukee, Wisconsin 53201-0701
CUSTODIAN
U.S. Bank N.A.
Custody Operations
1555 North River Center Drive, Suite 302
Milwaukee, Wisconsin 53212
TRUSTEES
Neil J. Hennessy
Robert T. Doyle
J. Dennis DeSousa
Gerald P. Richardson
COUNSEL
Foley & Lardner LLP
777 East Wisconsin Avenue
Milwaukee, Wisconsin 53202-5306
INDEPENDENT REGISTERED
PUBLIC ACCOUNTING FIRM
Tait, Weller & Baker LLP
Two Liberty Place
50 South 16th Street, Suite 2900
Philadelphia, Pennsylvania 19102-2529
DISTRIBUTOR
Quasar Distributors, LLC
111 East Kilbourn Avenue, Suite 2200
Milwaukee, Wisconsin 53202
www.hennessyfunds.com | 1-800-966-4354
This report has been prepared for shareholders and may be distributed to
others only if preceded or accompanied by a current prospectus.
Item 2. Code of Ethics.
Not applicable for semi-annual reports.
Item 3. Audit Committee Financial Expert.
Not applicable for semi-annual reports.
Item 4. Principal Accountant Fees and Services.
Not applicable for semi-annual reports.
Item 5. Audit Committee of Listed Registrants.
Not applicable to registrants who are not listed issuers (as defined in Rule 10A-3 under the Securities Exchange Act of 1934).
Item 6. Investments.
The Schedules of Investments are included as part of the reports to shareholders filed under Item 1 of this Form.
Item 7. Disclosure of Proxy Voting Policies and Procedures for Closed-End Management Investment Companies.
Not applicable to open-end investment companies.
Item 8. Portfolio Managers of Closed-End Management Investment Companies.
Not applicable to open-end investment companies.
Item 9. Purchases of Equity Securities by Closed‑End Management Investment Company and Affiliated Purchasers.
Not applicable to open-end investment companies.
Item 10. Submission of Matters to a Vote of Security Holders.
Not applicable.
Item 11. Controls and Procedures.
|
(a)
|
The Registrant’s President and Treasurer have reviewed the Registrant's disclosure controls and procedures (as defined in Rule 30a-3(c) under the Investment Company Act of 1940 (the “Act”)) as of a date within 90 days of the filing of
this report, as required by Rule 30a‑3(b) under the Act and Rules 13a-15(b) or 15d‑15(b) under the Securities Exchange Act of 1934. Based on their review, such officers have concluded that the disclosure controls and procedures are
effective in ensuring that information required to be disclosed in this report is appropriately recorded, processed, summarized and reported and made known to them by others within the Registrant and by the Registrant’s service providers.
|
|
(b)
|
There were no changes in the Registrant's internal control over financial reporting (as defined in Rule 30a-3(d) under the Act) that occurred during the period covered by this report that has materially affected, or is reasonably likely
to materially affect, the Registrant's internal control over financial reporting.
|
Item 12. Disclosure of Securities Lending Activities for Closed-End Management Investment Companies.
Not applicable to open-end investment companies.
Item 13. Exhibits.
|
(a)
|
(1) Code of ethics, or amendments thereto, that is the subject of the disclosure required by Item 2, to the extent that the registrant intends to satisfy Item 2 requirements through filing of an
exhibit. Not applicable.
|
(3) Any written solicitation to purchase securities under Rule 23c‑1 under the Act sent or given during the period covered by the report by or on behalf of the registrant to 10 or more
persons. Not applicable to open-end investment companies.
(4) Change in the registrant’s independent public accountant. Provide the information called for by Item 4 of Form 8-K under the Exchange Act (17 CFR 249.308). Unless otherwise
specified by Item 4, or related to and necessary for a complete understanding of information not previously disclosed, the information should relate to events occurring during the reporting period. There was no change in the registrant’s
independent public accountant for the period covered by this report.
SIGNATURES
Pursuant to the requirements of the Securities Exchange Act of 1934 and the Investment Company Act of 1940, the registrant has duly caused this report to be signed on its behalf by the undersigned, thereunto duly
authorized.
HENNESSY FUNDS TRUST
(Registrant)
By: /s/Neil J. Hennessy
Neil J. Hennessy
President
Date: July 9, 2020
Pursuant to the requirements of the Securities Exchange Act of 1934 and the Investment Company Act of 1940, this report has been signed below by the following persons on behalf of the registrant and in the capacities and
on the dates indicated.
|
By: /s/Neil J. Hennessy
Neil J. Hennessy, President
|
|
Date: July 9, 2020
|
|
By: /s/Teresa M. Nilsen
Teresa M. Nilsen, Treasurer
|
|
Date: July 9, 2020
|