FORM 6-K
SECURITIES AND EXCHANGE COMMISSION
Washington, D.C. 20549
Report of Foreign Issuer
Pursuant to Rule 13a-16 or 15d-16
of the Securities Exchange Act of 1934
For the month of May, 2020
Commission File Number: 001-12518
Banco Santander, S.A.
(Exact name of registrant as specified in its charter)
Ciudad Grupo Santander
28660 Boadilla del Monte (Madrid) Spain
(Address of principal executive office)
Indicate by check mark whether the registrant files or will file annual reports under cover of Form 20-F or Form 40-F:
Form 20-F ☒ Form 40-F ☐
Indicate by check mark if the registrant is submitting the Form 6-K in paper as permitted by Regulation S-T Rule 101(b)(1):
Yes ☐ No ☒
Indicate by check mark if the registrant is submitting the Form 6-K in paper as permitted by Regulation S-T Rule 101(b)(7):
Yes ☐ No ☒
BANCO SANTANDER, S.A.
________________________
TABLE OF CONTENTS
PART 1. INTERIM CONSOLIDATED DIRECTORS' REPORT

Directors' Report | 2020 |
January - March | |
Index

This report was approved by the Board of Directors on 27 April 2020, following a favourable report from the Audit Committee. Important information regarding this report can be found on pages 89 and 90.
Key consolidated data
BALANCE SHEET (EUR million) | Mar-20 | Dec-19 | % | Mar-19 | % | Dec-19 | ||||||
Total assets | 1,540,359 | 1,522,695 | 1.2 | 1,506,151 | 2.3 | 1,522,695 | ||||||
Loans and advances to customers | 935,407 | 942,218 | (0.7 | ) | 910,195 | 2.8 | 942,218 | |||||
Customer deposits | 815,459 | 824,365 | (1.1 | ) | 808,361 | 0.9 | 824,365 | |||||
Total funds | 1,006,948 | 1,050,765 | (4.2 | ) | 1,019,878 | (1.3 | ) | 1,050,765 | ||||
Total equity | 106,113 | 110,659 | (4.1 | ) | 110,365 | (3.9 | ) | 110,659 | ||||
Note: Total funds includes customer deposits, mutual funds, pension funds and managed portfolios | ||||||||||||
INCOME STATEMENT (EUR million) | Q1'20 | Q4'19 | % | Q1'19 | % | 2019 | ||||||
Net interest income | 8,487 | 8,841 | (4.0 | ) | 8,682 | (2.2 | ) | 35,283 | ||||
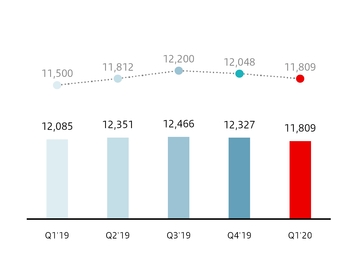
Total income | 11,809 | 12,327 | (4.2 | ) | 12,085 | (2.3 | ) | 49,229 | ||||
Net operating income | 6,220 | 6,356 | (2.1 | ) | 6,327 | (1.7 | ) | 25,949 | ||||
Profit before tax | 1,891 | 3,831 | (50.6 | ) | 3,602 | (47.5 | ) | 12,543 | ||||
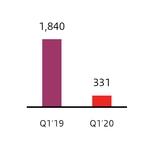
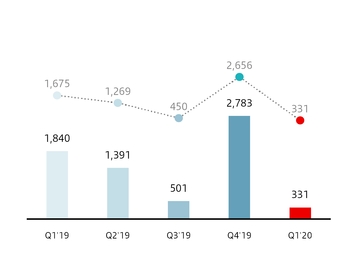
Attributable profit to the parent | 331 | 2,783 | (88.1 | ) | 1,840 | (82.0 | ) | 6,515 | ||||
Change in constant euros: | ||||||||||||
Q1'20 / Q4'19: NII: -1.8%; Total income: -2.0%; Net operating income: +0.8%; Attributable profit: -87.5% | ||||||||||||
Q1'20 / Q1'19: NII: +2.7%; Total income: +2.7%; Net operating income: +4.2%; Attributable profit: -80.2% | ||||||||||||
UNDERLYING INCOME STATEMENT (1) (EUR million) | Q1'20 | Q4'19 | % | Q1'19 | % | 2019 | ||||||
Net interest income | 8,487 | 8,841 | (4.0 | ) | 8,682 | (2.2 | ) | 35,283 | ||||
Total income | 11,814 | 12,592 | (6.2 | ) | 12,085 | (2.2 | ) | 49,494 | ||||
Net operating income | 6,237 | 6,621 | (5.8 | ) | 6,327 | (1.4 | ) | 26,214 | ||||
Profit before tax | 3,556 | 3,506 | 1.4 | 3,684 | (3.5 | ) | 14,929 | |||||
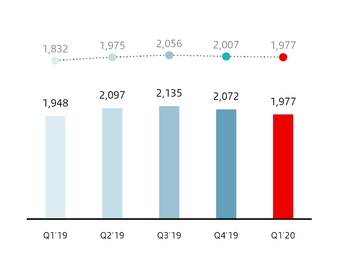
Attributable profit to the parent | 1,977 | 2,072 | (4.6 | ) | 1,948 | 1.5 | 8,252 | |||||
Variations in constant euros: | ||||||||||||
Q1'20 / Q4'19: NII: -1.8%; Total income: -4.1%; Net operating income: -3.1%; Attributable profit: -1.5% | ||||||||||||
Q1'20 / Q1'19: NII: +2.7%; Total income: +2.7%; Net operating income: +4.5%; Attributable profit: +7.9% | ||||||||||||
EPS, PROFITABILITY AND EFFICIENCY (%) | Q1'20 | Q4'19 | % | Q1'19 | % | 2019 | ||||||
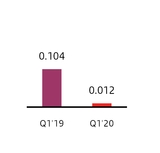
EPS (euros) | 0.012 | 0.161 | (92.8 | ) | 0.104 | (89.0 | ) | 0.362 | ||||
Underlying EPS (euros) (1) | 0.111 | 0.116 | (5.0 | ) | 0.111 | (0.3 | ) | 0.468 | ||||
RoE | 6.31 | 9.10 | 7.85 | 6.62 | ||||||||
RoTE | 8.75 | 12.62 | 11.15 | 9.31 | ||||||||
Underlying RoTE (1) | 11.06 | 11.63 | 11.31 | 11.79 | ||||||||
RoA | 0.49 | 0.68 | 0.63 | 0.54 | ||||||||
RoRWA | 1.25 | 1.69 | 1.54 | 1.33 | ||||||||
Underlying RoRWA (1) | 1.52 | 1.57 | 1.56 | 1.61 | ||||||||
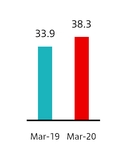
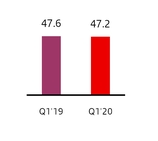
Efficiency ratio | 47.2 | 47.4 | 47.6 | 47.0 | ||||||||
SOLVENCY AND NPL RATIOS (%) | Mar-20 | Dec-19 | Mar-19 | Dec-19 | ||||||
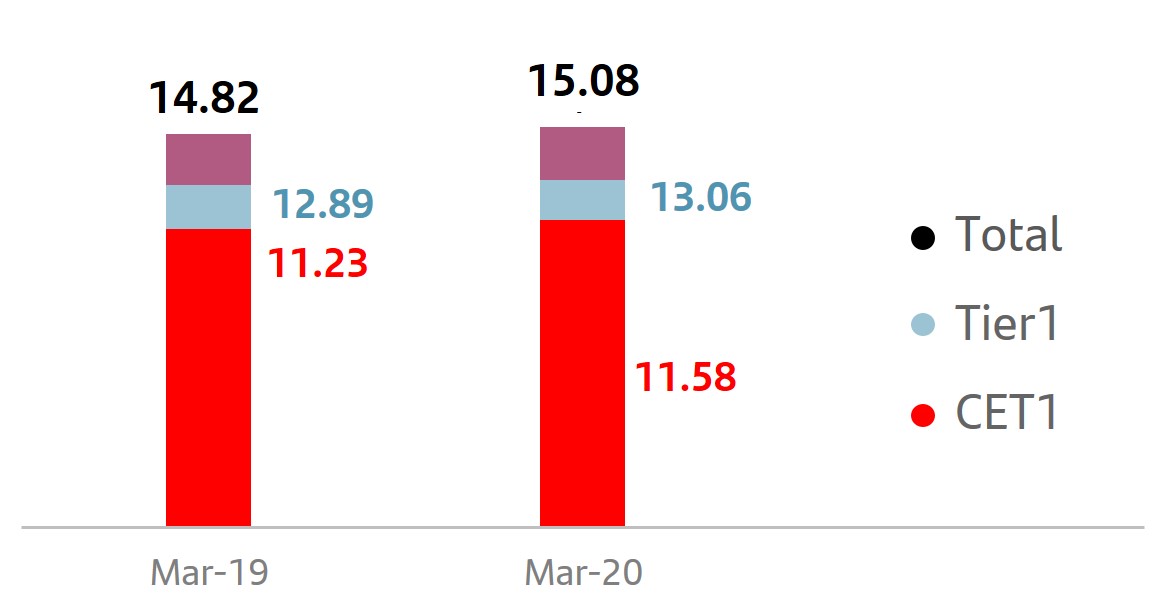
CET1 (2) | 11.58 | 11.65 | 11.23 | 11.65 | ||||||
Fully loaded Total capital ratio (2) | 15.08 | 15.02 | 14.82 | 15.02 | ||||||
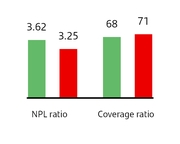
NPL ratio | 3.25 | 3.32 | 3.62 | 3.32 | ||||||
Coverage ratio | 71 | 68 | 68 | 68 | ||||||
MARKET CAPITALISATION AND SHARES | Mar-20 | Dec-19 | % | Mar-19 | % | Dec-19 | ||||||
Shares (millions) | 16,618 | 16,618 | — | 16,237 | 2.3 | 16,618 | ||||||
Share price (euros) | 2.218 | 3.730 | (40.5 | ) | 4.145 | (46.5 | ) | 3.730 | ||||
Market capitalisation (EUR million) | 36,859 | 61,986 | (40.5 | ) | 67,292 | (45.2 | ) | 61,986 | ||||
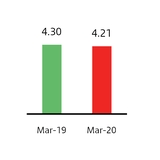
Tangible book value per share (euros) | 4.21 | 4.36 | 4.30 | 4.36 | ||||||||
Price / Tangible book value per share (X) | 0.53 | 0.86 | 0.96 | 0.86 | ||||||||
P/E ratio (X) | 48.29 | 10.30 | 9.94 | 10.30 | ||||||||
OTHER DATA | Mar-20 | Dec-19 | % | Mar-19 | % | Dec-19 | ||||||
Number of shareholders | 4,043,974 | 3,986,093 | 1.5 | 4,089,097 | (1.1 | ) | 3,986,093 | |||||
Number of employees | 194,948 | 196,419 | (0.7 | ) | 202,484 | (3.7 | ) | 196,419 | ||||
Number of branches | 11,902 | 11,952 | (0.4 | ) | 13,277 | (10.4 | ) | 11,952 | ||||
(1) In addition to financial information prepared in accordance with International Financial Reporting Standards (IFRS) and derived from our consolidated financial statements, this report contains certain financial measures that constitute alternative performance measures (APMs) as defined in the Guidelines on Alternative Performance Measures issued by the European Securities and Markets Authority (ESMA) on 5 October 2015 and other non-IFRS measures, including the figures related to “underlying” results, as they are recorded in the separate line of “net capital gains and provisions”, above the line of attributable profit to the parent. Further details are provided on page 14 of this report. For further details of the APMs and non-IFRS measures used, including its definition or a reconciliation between any applicable management indicators and the financial data presented in the consolidated financial statements prepared under IFRS, please see 2019 Annual Financial Report, published in the CNMV on 28 February 2020, our 20-F report for the year ending 31 December 2019 registered with the SEC in the United States as well as the “Alternative performance measures” section of the appendix to this report. |
(2) Data applying the IFRS 9 transitional arrangements. |
January - March 2020 |  | 5 |
Response to the COVID-19 crisis Business model | ||||||||
Response to COVID-19 crisis | ||||||||
In order to support the global effort being made to combat COVID-19, Grupo Santander is implementing various measures to protect our stakeholders. The most relevant measures are detailed below, focused on six main dimensions:
 | Contingency plan |  | Health of our employees | ||
Preserving our critical business and functions is essential to providing our services to customers under the same standards as usual. Consequently, the Group has the necessary contingency plans to ensure the continuity of all our businesses and react effectively in any eventuality. To this end, periodic crisis simulations have been carried out in recent years. In February, in line with our special situations management framework, the highest level corporate crisis committees were activated to coordinate the situation and to give a global response in all geographic areas. Different action plans were implemented to coordinate the different corporate areas and their counterparties in all countries, including all subsidiaries’ Board Chairs, Country Heads, Global Directors and local crisis committees. For example, only in March the corporate crisis committees held follow-up meetings almost on a daily basis at the Bronze and Silver levels, whilst the Gold Committee was held on five occasions and shared information with the board in four meetings. Previous training carried out by the Group for the swift and agile activation of protocols and procedures was key for the continuity of our business with no significant disruption in this unprecedented situation. From the beginning, all units have identified their critical businesses and implemented contingency plans by splitting teams, establishing shifts between critical persons and their back-ups, segregating technological infrastructure, etc. Likewise, the technology area proceeded to increase the capacity of systems and lines, while providing the appropriate equipment to adapt the organisation to the new telecommuting situation. In addition, we have made sure that our key suppliers have contingency plans that ensure the continuity of our activity in order to ensure the proper functioning of our services. | One of our priorities is to protect the health of our employees. To this end, we have laid out a series of measures: • We have provided all our employees the necessary hygiene guidelines to limit the spread of COVID-19.• At the same time, and to avoid the outbreak of COVID-19, we put in place travel and face-to-face meeting restrictions for our employees straight away.• We also established large scale remote working in all Group countries. Currently, 112,000 employees, which account for more than half of the total workforce are telecommuting, almost 100% of the central services employees in some countries.This was reflected in the sharp increase of video and internet call connections (exceeding 780,000 per day) and more than 3 million chat lines in a single day. • As for our branch network, we have also taken measures to combine customer service with the protection of our employees' health, for example: closure of some of our branches, reduce opening hours, shifts, limiting the number of costumers in a branch at a time, in compliance with the authorities' recommendations on safe distances between people and avoiding physical contact.• The Bank has reinforced its hygiene protocol at its branches and ATMs and is promoting the use of digital channels by customers.• We have also made services available for our employees, aimed at ensuring their well-being and balance between professional and family life (Santander Contigo). | ||||
 |  | ||||
January - March 2020 | | 6 |
Response to the COVID-19 crisis Business model | ||||||||
Response to COVID-19 crisis | ||||||||
 | Customers |  | Business, liquidity and risks | ||
Santander has implemented measures to ensure the health and safety of its customers and foster their economic resilience during the crisis in all countries. Of note were: • Provide liquidity and credit facilities for businesses facing hardship.• Facilitate payment deferrals and repayment holidays in many of our markets.• Temporary option to increase credit card and overdraft limits.• Proactive support for vulnerable customers (senior citizens, SMEs, etc.) trying to cover their needs.• Temporary reduction and suspension of fees (withdrawals from ATMs, interest free online purchases, bank transfers, ...).• Ensure COVID-19 health insurance coverage.• Specialised teams to advise customers facing financial difficulties.We also adapted the branch network to the current situation, with some closures, but ensuring the continuity of service in the branch network. On the other hand, we strengthened our contact centres' capabilities, which has enabled us to increase the volume of services by 21% on average compared to normal times. Additionally, following the recommendation issued by the European Central Bank, the Bank's board decided to cancel the payment of the final dividend for 2019 and its dividend policy for 2020 until there is greater visibility on the impact of the crisis. The Bank is reevaluating the situation as the pandemic evolves in each market, and takes action according to the specific needs of every country and market. | Business performance continued its growth trajectory. Group loans and advances to customers increased 7% and customer funds 4% year-on-year, excluding the exchange rate impact, following the rise in the quarter. The positive star of the year was affected in March by the first impacts of the crisis, although, in terms of new business and balances, growth in corporates and large corporates offset the declines in individuals and consumer credit. Since the start of the crisis, business performance and liquidity have been closely monitored n the parent bank and our subsidiaries. Our liquidity position has remained solid at all times. The Group's LCR ratio was 146% at the end of the quarter, the parent bank's was 134% and all our subsidiaries stood above 125%. Likewise, the liquidity buffer is ample. In addition, central banks announced anti-crisis packages to pump liquidity in the system and the Group is rolling out preventive management measures to strengthen its position. Regarding risks, the main indicators are also continuously monitored and reported. The impacts of COVID-19 have not yet materialised in the first quarter indicators, which reflect an improvement in the credit quality and coverage ratios. As acknowledged by the IASB and other regulators and supervisors, it is likely to be difficult at this time to know the specific effects the health crisis and government and central bank support measures, such as mortgage repayment holidays, credit lines and guarantees and other mitigating packages, will have. Nevertheless, and in compliance with the accounting standard (IFRS 9), which includes the incorporation of forward-looking macroeconomic information in the calculation of provisions, that include future effects arising from changes in variables to which the models are sensitive (GDP, unemployment, house prices, etc.), the Group recorded a provisions overlay in the quarter of EUR 1.6 billion, based on the expected deterioration arising from the pandemic. | ||||
 |  | ||||
January - March 2020 | | 7 |
Response to the COVID-19 crisis Business model | ||||||||
Response to COVID-19 crisis | ||||||||
 | Society |  | Information for stakeholders | ||
One of our main priorities is to contribute to the well-being of society as a whole. We have implemented actions and mobilised resources together with governments and institutions to help society combat the health crisis. Santander All. Together. Now. is the motto that brings together the Group's collective efforts around the world to stand beside the people who need it the most at this time. This effort has succeeded in mobilising EUR 100 million worldwide dedicated to solidarity initiatives to fight COVID-19. The main initiatives adopted are: • Creation of a solidarity fund which amounts to EUR 54 million to acquire medical equipment and materials, and to support organisations in the fight against COVID-19. This fund is primarily financed by contributions from senior management, employees and the Group's subsidiaries, as well as contributions from third parties. As a starting point, the Executive Chairman and the CEO, have decided to give up 50% of their compensation in 2020 (fixed and variable) and non-executive directors 20% of their total remuneration. The Group has created employee funds in most of the countries where it operates.Only in Spain, one of the most affected countries, the Bank has donated more than 4 million high-protection masks, 500 non-invasive respirators and thousands of hospital beds and blankets, protective suits and gloves. • Supporting different projects and social initiatives to protect the vulnerable groups most impacted by the effects of the pandemic (especially in the UK and the US). EUR 16 million has been donated so far.• Santander has also mobilised more than EUR 30 million through Santander Universidades, to support collaboration projects with universities that will help to find solutions to the health and educational challenges arising from the COVID-19 crisis, scholarships to foster online education during the confinement period and support the most disadvantaged students.• Launch of Overcome Together, an open and accessible space for individuals and companies, both customers and non-customers, which contains information and resources to help overcome the situation arising from COVID-19. It is already available in Spain, Portugal, Mexico, Brazil, Uruguay and Chile, and will be soon available in other countries.We will continue to monitor the situation of this global health crisis in order to continue to contribute to minimise its impact on society. | Since the crisis started, the Group has been proactive in keeping our people, customers, shareholders and investors informed at all times and providing advice. The communication plan is based on transparency and anticipation, and followed different stages as the COVID-19 pandemic evolved: • First phase of information and prevention: started on 23 January after the COVID-19 outbreak in China, and was focused on informing and raising awareness among Group employees about basic hygiene measures to prevent contagion.• Second phase of recommendations and protections: in early March, the Group focused on communicating its employees in all countries the travelling recommendations, meeting policies and protocols for potential infections.• Third phase regarding the business continuity plan: it began on 10 March, with internal communication focused on contingency plans implementation and telecommuting. We also issued communications to our customers, encouraging the use of digital channels, new branch opening hours and and functionality, and all information regarding public and the Bank's support measures. In addition, the Group announced to its shareholders that the annual general Meeting would be held via remote channels, the changes regarding the 2019 and 2020 dividend policy, on the creation of a fund of an initial value of EUR 25 million to help the health authorities cover its most urgent needs.It is also worth highlighting the commitment of the Bank's senior management, both the Chairman, who held three Ask Ana events to answer the employees' questions, as well as the CEO, Senior Executives and Country Heads, who have been constantly in touch with the teams. The main measures announced by each country can be found on the Group's website (www.santander.com). | ||||
 |  | ||||
January - March 2020 | | 8 |
Response to the COVID-19 crisis Business model | Group financial information | Financial information by segments | Responsible banking Corporate governance Santander share | Appendix | ||||
Business model | ||||||||
Our business model is based on three pillars
1. Our scale Local scale and global reach | 2. Customer focus Unique personal banking relationships strengthen customer loyalty | 3. Diversification Our geographic and business diversification make us more resilient under adverse circumstances | ||||
• Local scale based on three geographic regions, where we maintain a leadership position in our 10 core markets.• Global reach backed by our global businesses, enabling greater collaboration across the Group to generate higher revenue and efficiencies. | • We serve 146 million customers, in markets with a total population of more than one billion people.• We have over 100,000 people talking to our customers every day in our c.12,000 branches and contact centres. | • Geographic diversification in three regions, with a good balance between mature and developing markets.• Global businesses that strengthen our local franchises.• Santander Global Platform supports the digital transformation across the Group. | ||||
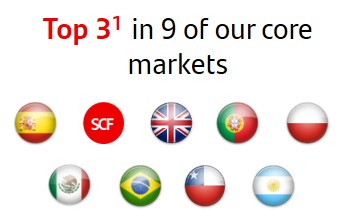 | 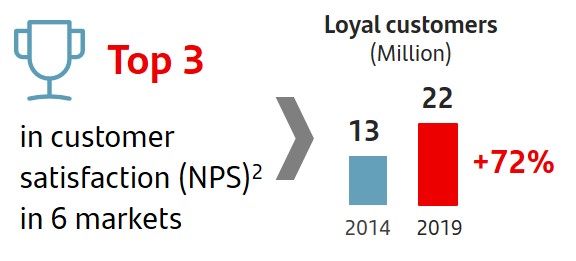 | 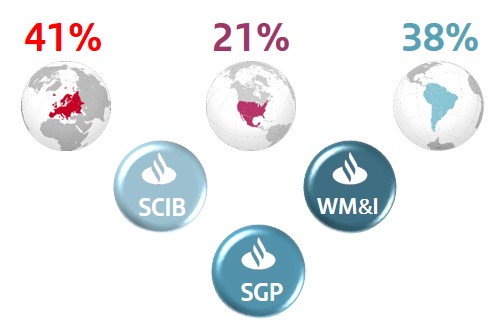 | ||||
1. Market share in lending as of Dec-19 including only privately-owned banks. UK benchmark refers to the mortgage market. | 2. NPS – Customer Satisfaction internal benchmark of active customers’ experience and satisfaction audited by Stiga / Deloitte. | Note. Underlying attributable profit contribution by region, excluding Santander Global Platform and Corporate Centre. | ||||
Our corporate culture: Santander Way
The Santander Way reflects our purpose, our aim, and how we do business. It is the bedrock on which we are building a more responsible bank.

January - March 2020 | | 9 |
GROUP PERFORMANCE

"From the start of this crisis we have been determined to do everything in our power to fight the pandemic and support the recovery, and this remains our utmost priority" |

"Our strong pre-provision profit across the cycle, combined with our resilient balance sheet and capital position, are the key levers to manage the economic downturn" |
 GROWTH
 The Group continued to boost the relationship with customers and increase digital activity
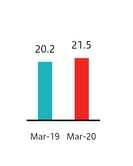
In the current environment, Santander’s strategy continues to focus on providing the best service to our 21.5 million loyal customers, whose number rose 1.2 million year-on-year (+6%), with growth both in individuals and corporates.
The number of digital customers and activity grew at a faster pace (+1.5 million in the quarter, +4.4 million year-on-year), as digital sales represented 43% of total sales in March, rising 7 percentage points compared to 2019.
Loyal customers | Digital customers | |
Millions | Millions | |
+6% |
+13% |
Volumes were negatively impacted by exchange rates in the quarter (-5 pp) and year-on-year. In constant euros, both loans and advances to customers and customer deposits grew strongly in the quarter (+3%) driven by corporates. Conversely, mortgages and consumer lending recorded sharp activity falls in recent weeks, down by 40%-50% in new lending, highly affected by the isolation measures adopted by governments in various countries.
On a year-on-year basis (at constant exchange rates), gross loans and advances to customers (excluding reverse repos) grew 7% and customer funds rose 4%, both with nine of the 10 core markets growing.
Activity Mar-20 vs. Mar-19 | ||||||||||||
% change in constant euros | ||||||||||||
+6% | ||||||||||||
Individuals | ||||||||||||
+7% | ||||||||||||
+2% | Demand | |||||||||||
SMEs and corporates | ||||||||||||
+3% | ||||||||||||
+7% | +4% | Time | ||||||||||
+22% | ||||||||||||
CIB and institutions | -2% | |||||||||||
Mutual funds | ||||||||||||
Gross loans and advances to customers excl. reverse repos | Customer deposits excl. repos + mutual funds | |||||||||||
10 |  | January - March 2020 |
GROUP PERFORMANCE
 PROFITABILITY
 Solid business model based on customers, scale and diversification, which enables us to obtain profits on a recurring basis
In the quarter, attributable profit of EUR 331 million, affected by the recording of a provisions overlay of EUR 1.6 billion in compliance with the accounting rules and based on the expected deterioration of the macroeconomic conditions arising from the COVID-19 health crisis.
Excluding this charge, underlying attributable profit increased 1% to EUR 1,977 million. In constant euros, growth was 8%, driven by higher customer revenue, costs synergies and a stable cost of credit.
Att. profit to the parent | Earnings per share | |
EUR million | Euros | |
By region, underlying attributable profit rose in all countries in the Americas (except Chile) and decreased in Europe, in a more complicated business environment.
The efficiency ratio improved to 47.2%, one of the best among our peers. Underlying RoTE was 11.06% and underlying RoRWA 1.52%.
Efficiency ratio | RoTE | ||||
% | % | ||||
n Total n Underlying* | |||||
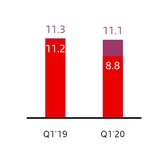 (*) Excluding net capital gains and provisions
 STRENGTH
 Santander maintained its solid capital rations and high levels of credit quality
The CET1 ratio stood at 11.58% virtually unchanged compared to December 2019. In a quarter of strong volume growth, organic generation and the measures adopted regarding dividends, led to an increase of 36 bps, which was offset by negative impacts stemming from corporate operations and regulatory and market impacts.
Net tangible equity per share (TNAV) at quarter-end was EUR 4.21. Considering the dividend remuneration in the period, TNAV per share increased 1.8% in the last 12 months.
CET1* | Tangible equity per share | |
% | Euros | |
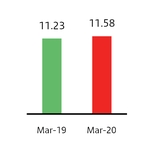
(*) Using the IFRS 9 transitional arrangement
The impacts arising from the COVID-19 crisis are not yet reflected in risk indicators in the first quarter, which maintained the continued improvement in credit quality in the first two months of the year. The NPL ratio improved 7 bps in the quarter.
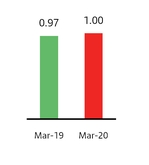
The cost of credit stood at 1.00%, in line with the previous quarter and similar to the first quarter of 2019.
Cost of credit | NPL ratio and coverage | ||||
% | % | ||||
n Mar-19 n Mar-20 | |||||
January - March 2020 | | 11 |
GRUPO SANTANDER RESULTS
• | First quarter attributable profit to the parent of EUR 331 million, including a net negative impact of EUR 1,646 million that is outside the ordinary course performance of our business, of which EUR 1.6 billion corresponds to the creation of a provisions overlay based on the expected deterioration of the macroeconomic conditions arising from the health crisis. |
• | Excluding these charges, underlying attributable profit of 1,977 million euros, 1% more than in the same period of 2019 (+ 8% without exchange rate impact). |
• | Results reflect a negative impact on the year-on-year comparison of exchange rate performance: 5 pp in revenue and 4 pp in costs. |
• | By geographic area, underlying profit grew in all countries in the Americas (except Chile) and fell in Europe in a more complicated business environment. |
• | In 2019, results continued to reflect a solid underlying trend in constant euros: customer revenue continued to increase, costs show the synergies obtained and the cost of credit remained stable. |
• | As regards profitability ratios: underlying RoTE of 11.06% and underlying RoRWA of 1.52% (11.31% and 1.56%, respectively, in the first quarter of 2019). |
Grupo Santander. Summarised income statement | ||||||||||||||
EUR million | ||||||||||||||
Change | Change | |||||||||||||
Q1'20 | Q4'19 | % | % excl. FX | Q1'19 | % | % excl. FX | ||||||||
Net interest income | 8,487 | 8,841 | (4.0 | ) | (1.8 | ) | 8,682 | (2.2 | ) | 2.7 | ||||
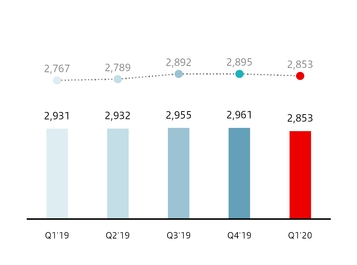
Net fee income (commission income minus commission expense) | 2,853 | 2,961 | (3.6 | ) | (1.5 | ) | 2,931 | (2.7 | ) | 3.1 | ||||
Gains or losses on financial assets and liabilities and exchange differences (net) | 287 | 596 | (51.8 | ) | (51.7 | ) | 277 | 3.6 | 15.2 | |||||
Dividend income | 57 | 100 | (43.0 | ) | (42.9 | ) | 66 | (13.6 | ) | (13.8 | ) | |||
Share of results of entities accounted for using the equity method | 98 | (119 | ) | — | (31.2 | ) | 153 | (35.9 | ) | (33.1 | ) | |||
Other operating income / expenses | 27 | (52 | ) | — | — | (24 | ) | — | 647.0 | |||||
Total income | 11,809 | 12,327 | (4.2 | ) | (2.0 | ) | 12,085 | (2.3 | ) | 2.7 | ||||
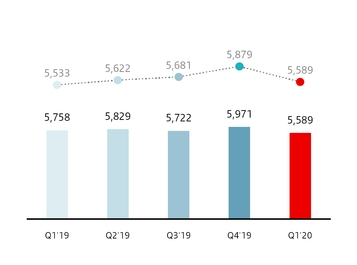
Operating expenses | (5,589 | ) | (5,971 | ) | (6.4 | ) | (4.9 | ) | (5,758 | ) | (2.9 | ) | 1.0 | |
Administrative expenses | (4,860 | ) | (5,179 | ) | (6.2 | ) | (4.6 | ) | (5,011 | ) | (3.0 | ) | 0.9 | |
Staff costs | (2,899 | ) | (3,053 | ) | (5.0 | ) | (3.7 | ) | (3,006 | ) | (3.6 | ) | (0.2 | ) |
Other general administrative expenses | (1,961 | ) | (2,126 | ) | (7.8 | ) | (6.0 | ) | (2,005 | ) | (2.2 | ) | 2.7 | |
Depreciation and amortisation | (729 | ) | (792 | ) | (8.0 | ) | (6.9 | ) | (747 | ) | (2.4 | ) | 1.4 | |
Impairment or reversal of impairment of financial assets not measured at fair value through profit or loss (net)* | (3,934 | ) | (2,542 | ) | 54.8 | 58.5 | (2,246 | ) | 75.2 | 84.6 | ||||
o/w: net loan-loss provisions* | (3,919 | ) | (2,573 | ) | 52.3 | 56.1 | (2,172 | ) | 80.4 | 90.4 | ||||
Impairment on other assets (net) | (14 | ) | (76 | ) | (81.6 | ) | (80.8 | ) | (20 | ) | (30.0 | ) | (29.4 | ) |
Provisions or reversal of provisions | (374 | ) | (979 | ) | (61.8 | ) | (60.3 | ) | (465 | ) | (19.6 | ) | (15.9 | ) |
Gains or losses on non financial assets and investments, net | 18 | 1,038 | (98.3 | ) | (98.3 | ) | 219 | (91.8 | ) | (91.8 | ) | |||
Negative goodwill recognised in results | — | — | — | — | — | — | — | |||||||
Gains or losses on non-current assets held for sale not classified as discontinued operations | (25 | ) | 34 | — | — | (213 | ) | (88.3 | ) | (88.2 | ) | |||
Profit or loss before tax from continuing operations | 1,891 | 3,831 | (50.6 | ) | (49.1 | ) | 3,602 | (47.5 | ) | (42.9 | ) | |||
Tax expense or income from continuing operations | (1,244 | ) | (687 | ) | 81.1 | 74.7 | (1,357 | ) | (8.3 | ) | (0.5 | ) | ||
Profit from the period from continuing operations | 647 | 3,144 | (79.4 | ) | (78.4 | ) | 2,245 | (71.2 | ) | (68.6 | ) | |||
Profit or loss after tax from discontinued operations | — | — | — | — | — | — | — | |||||||
Profit for the period | 647 | 3,144 | (79.4 | ) | (78.4 | ) | 2,245 | (71.2 | ) | (68.6 | ) | |||
Attributable profit to non-controlling interests | (316 | ) | (361 | ) | (12.5 | ) | (7.8 | ) | (405 | ) | (22.0 | ) | (17.6 | ) |
Attributable profit to the parent | 331 | 2,783 | (88.1 | ) | (87.5 | ) | 1,840 | (82.0 | ) | (80.2 | ) | |||
EPS (euros) | 0.012 | 0.161 | (92.8 | ) | 0.104 | (89.0 | ) | |||||||
Diluted EPS (euros) | 0.011 | 0.160 | (92.8 | ) | 0.104 | (89.0 | ) | |||||||
Memorandum items: | ||||||||||||||
Average total assets | 1,536,725 | 1,530,761 | 0.4 | 1,488,505 | 3.2 | |||||||||
Average stockholders' equity | 99,221 | 98,851 | 0.4 | 97,886 | 1.4 | |||||||||
(*) Includes provisions overlay of EUR 1,600 million in Q1'20.
12 | | January - March 2020 |
Evolution of results compared to the first quarter of 2019
Compared to the first quarter of 2019, the underlying trends of the P&L remained solid, as it was only marginally affected by the health crisis derived from the COVID-19 outbreak. Customer revenue continued to grow in constant currency, both net interest income and net fee income, costs reflected the synergies obtained in various units, mainly in Europe, and the cost of credit remained unchanged.
This good performance, however, is not fully reflected in attributable profit to the parent because of the recording of a net negative amount of EUR 1,646 million for charges that are outside the ordinary course performance of our business, primarily due to the aforementioned recording of a provisions overlay due to the COVID-19 outbreak (EUR 1.6 billion), together with several restructuring charges.
This performance is explained in detail below:
u Revenue
Total income was 2% lower than in the first quarter of 2019 at EUR 11,809 million (+3% excluding the exchange rate impact). Net interest income and net fee income accounted for 96% of total income. By lines:
• | Net interest income amounted to EUR 8,487 million, down 2% compared to the first three months of 2019. Excluding the FX impact, growth was 3% due to greater lending and deposit volumes, and management of spreads in an environment of falling interest rates in the past year in numerous markets, and with still negative interest rates in Europe. |
Net interest income | |
EUR million | |
 | constant euros |
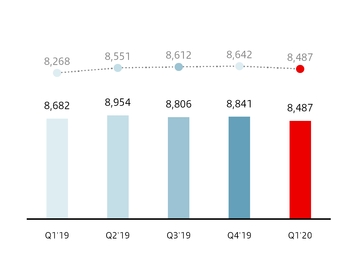
Net interest income recorded rises in seven of the ten core markets in local currency terms. Of note was growth in Argentina driven by the lower cost of funding, Chile, driven by higher inflation, Brazil, backed by increased volumes, and Poland due to the improvement in the cost of deposits and the change of mix in the lending portfolio. Falls were recorded in Portugal and Spain, affected by low interest rates, and the UK, due to the competitive pressure and the fall in SVR balances (Standard Variable Rate).
• | Net fee income was 3% lower at EUR 2,853 million. Excluding the exchange rate impact, net fee income was 3% higher year-on-year, despite the impact of regulatory changes in various units, such as the UK and SCF. The strategy remained focused on increasing loyalty and growing higher value-added products and services. |
Of note was growth in Wealth Management & Insurance and Santander Corporate & Investment Banking, both with rises of 20%. Net fee income from WM&I, including those ceded to the branch network, represented 30% of the Group's total.
By region, increases in South America and North America, and a slight decrease in Europe. By country, growth in seven of our ten core markets, notably Brazil (+7%) driven by cards. In addition,19% growth in Other Europe, which includes the wholesale banking business in the region. On the other hand, falls in SCF (-12%) due to regulatory changes and the first impacts of lower production stemming from COVID-19, and the UK (-12%), driven by overdrafts.
Net fee income | |
EUR million | |
 | constant euros |
January - March 2020 | | 13 |
• | Gains on financial transactions, which account for only 2% of total income, amounted to EUR 287 million with no material change compared to the first quarter of 2019. |
• | Dividend income was EUR 57 million in the first three months of 2020, 14% lower than in the same period of 2020. This item started to be affected by the delay or cancellation of dividend payments by several companies. |
• | The share of results of entities accounted for by the equity method decreased 36% to EUR 98 million (-33% excluding the FX impact) mainly due to lower income from real estate stakes in Spain. |
• | Other operating income amounted to EUR 27 million (loss of EUR 24 million in the first quarter of 2019). |
u Costs
Costs totalled EUR 5,589 million, 3% lower year-on-year. Excluding the exchange rate impact, they rose only 1%.
In real terms (excluding inflation and perimeter), costs were 3% lower, reflecting the successful management carried out over the past three years.
The efficiency ratio improved 0.4 percentage points year-on-year to 47.2%, which has enabled us to remain as one of the world's most efficient global banks.
Total income | |
EUR million | |
 | constant euros |
The Group’s aim is to improve our operational capacity and at the same time manage our costs more efficiently and adapted to each area. For a better comparison, the trends by region and market are detailed below:
• | In Europe, costs reflect the synergies of integrations, and fell 3.4% in nominal terms and 4.6% in real terms. Regarding the latter, of note were the declines in Spain (-8%) and Portugal (-4%) due to the efficiencies resulting from the integration of Popular and the optimisation efforts, the UK (-6%) reflecting cost savings from our transformation programme and Poland (-4%), in an environment of high single-digit salary pressures. |
In SCF, costs rose 1% mainly due to perimeter. Excluding it, costs fell 3% benefiting from the efficiency projects carried out in the various countries.
The efficiency ratio remained stable at around 54%-55%.
• | In North America, costs were 2.5% higher in nominal terms affected by inflation. In real terms, they remained broadly unchanged, with Mexico increasing 1.5%, while in the US they fell 0.7%. The higher revenue enabled us to improve the efficiency ratio in this region to 41.7%. |
• | Lastly, in South America, the increase in costs was significantly distorted by the very high inflation in Argentina. Excluding it, the increase was 3.4% in nominal terms and 0.3% in real terms, with Brazil performing well (-2%). Efficiency improved in all markets (1.1 percentage points in the region). |
We believe this management by region will enable us to continue to optimise costs, while improving customer experience.
Operating expenses | |
EUR million | |
 | constant euros |
14 | | January - March 2020 |
u Impairment or reversal of impairment of financial assets not measured at fair value through profit or loss (net)
Impairment or reversal of impairment of financial assets not measured at fair value through profit or loss (net) was EUR 3,934 million, a 75% increase year-on-year in euros and 85% higher excluding the exchange rate impact.
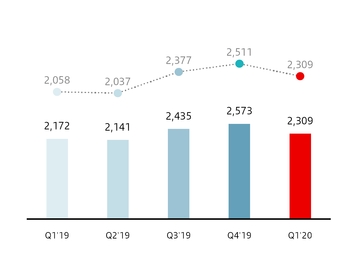
Loan-loss provisions included in this item, excluding the provisions overlay of EUR 1,6 billion aforementioned, amounted to EUR 2,309 million, 6% higher than in the same period of 2019. Excluding the FX impact, growth was 12%, led primarily by the increases in Santander Consumer Finance, Poland, Mexico and Brazil, mostly driven by volume growth, as the Group's cost of credit remained at around 1%.
u Impairment on other assets (net)
Impairment on other assets in the first three months of 2020 amounted to EUR 14 million (EUR 20 million in the same period of 2019).
u Provisions or reversal of provisions
Provisions (net of reversal provisions) stood at EUR 374 million (EUR 465 million in the first quarter of 2019). This line item includes charges for restructuring costs, which are set out on page 14 of this report.
u Gains or losses on non-financial assets and investments (net)
Net gains on non-financial assets and investments were EUR 18 million in the first quarter of 2020, compared to EUR 219 million in the same period of 2019, when capital gains from the sale of 51% our stake in Prisma Medios de Pago S.A. and the revaluation of the remaining stake (49%) were recorded.
u Negative goodwill recognised in results
Both in the first quarter of 2019 as in the first quarter of 2020, this line item recorded EUR 0 million.
u Gains or losses on non-current assets held for sale not classified as discontinued operations
This item, which includes mainly impairment of foreclosed assets recorded and the sale of properties acquired upon foreclosure, were EUR -25 million in March 2020, compared to EUR -213 million in the first three months of 2019.
u Profit before tax
Profit before tax was 48% lower than in 2019, at EUR 1,891 million. (-43% excluding the exchange rate impact).
u Income tax
Corporate income tax was EUR 1,244 million in 2019, an 8% decrease year-on-year (-0.5% excluding the exchange rate impact).
u Attributable profit to non-controlling interests
The attributable profit to non-controlling interests was EUR 316 million, 22% lower year-on-year (-18% excluding the FX impact), mainly due to the share repurchase programme carried out in Mexico in 2019, and the increased stake in SC USA.
u Attributable profit to the parent
Attributable profit to the parent amounted to EUR 331 million in the first quarter of 2020, 82% less compared to the same period of 2019. Excluding the exchange rate impact, -80%.
RoE was 6.31%, RoTE 8.75% and RoRWA 1.25% (7.85%, 11.15% and 1.54%, respectively in the first quarter of 2019).
Earnings per share was EUR 0.012 (EUR 0.104 in March 2019).
Net loan-loss provisions | |
EUR million | |
 | constant euros |
Attributable profit to the parent | |
EUR million | |
 | constant euros |
Note: Excluding provisions overlay in Q1'20.
January - March 2020 | | 15 |
u Underlying attributable profit to the parent
The attributable profit to the parent previously commented was affected, in 2020 and 2019, by results (net of tax) that are outside the ordinary course performance of our business and distort the year-on-year comparison, and are detailed below:
• | In the first quarter of 2020, a provisions overlay of EUR 1.6 billion was recorded and restructuring costs of EUR 46 million as follows: EUR 23 million in the UK, EUR 12 million in Santander Consumer Finance, EUR 2 million in Poland and EUR 9 million in Other Europe. |
• | In the first quarter of 2019, capital gains from the sale of 51% of our stake in the Argentinian entity Prisma Medios de Pago S.A. and the revaluation of the remaining 49% (EUR 150 million), capital losses related to real estate assets in Spain (EUR -180 million) and restructuring costs in the UK and Poland (EUR -78 million). |
Excluding these results from the various P&L lines where they are recorded, and incorporating them separately in the net capital gains and provisions line, underlying attributable profit to the parent was EUR 1,977 million in the first quarter of 2020 and EUR 1,948 million in the first quarter of 2019, 1% higher year-on-year (+8% without the FX impact).
By market, rises in all countries in the Americas, except Chile, notably the US and Mexico, and falls in all markets in Europe, in a more complicated market environment and where the first impacts of the health crisis were most noticeable.
This was reflected in the performance by region, with notable growth in North America (+34%) and South America (+15%), while Europe dropped 16%.
In the first quarter of 2020, the Group’s underlying RoTE was 11.06%, underlying RoRWA was 1.52% (11.31% and 1.56%, respectively in the same period of 2019) and underlying earnings per share EUR 0.111, the same than in March 2019.
Summarised underlying income statement | ||||||||||||||
EUR million | Change | Change | ||||||||||||
Q1'20 | Q4'19 | % | % excl. FX | Q1'19 | % | % excl. FX | ||||||||
Net interest income | 8,487 | 8,841 | (4.0) | (1.8) | 8,682 | (2.2) | 2.7 | |||||||
Net fee income | 2,853 | 2,961 | (3.6) | (1.5) | 2,931 | (2.7) | 3.1 | |||||||
Gains (losses) on financial transactions (1) | 292 | 596 | (51.0) | (50.7) | 277 | 5.4 | 16.9 | |||||||
Other operating income | 182 | 194 | (6.2) | (1.2) | 195 | (6.7) | (15.9) | |||||||
Total income | 11,814 | 12,592 | (6.2) | (4.1) | 12,085 | (2.2) | 2.7 | |||||||
Administrative expenses and amortisations | (5,577 | ) | (5,971 | ) | (6.6) | (5.1) | (5,758 | ) | (3.1) | 0.8 | ||||
Net operating income | 6,237 | 6,621 | (5.8) | (3.1) | 6,327 | (1.4) | 4.5 | |||||||
Net loan-loss provisions | (2,309 | ) | (2,573 | ) | (10.3) | (8.1) | (2,172 | ) | 6.3 | 12.2 | ||||
Other gains (losses) and provisions | (372 | ) | (542 | ) | (31.4) | (29.6) | (471 | ) | (21.0) | (17.3) | ||||
Profit before tax | 3,556 | 3,506 | 1.4 | 4.8 | 3,684 | (3.5) | 2.8 | |||||||
Tax on profit | (1,260 | ) | (1,109 | ) | 13.6 | 17.3 | (1,326 | ) | (5.0) | 1.9 | ||||
Profit from continuing operations | 2,296 | 2,397 | (4.2) | (1.0) | 2,358 | (2.6) | 3.3 | |||||||
Net profit from discontinued operations | — | — | — | — | — | — | — | |||||||
Consolidated profit | 2,296 | 2,397 | (4.2) | (1.0) | 2,358 | (2.6) | 3.3 | |||||||
Non-controlling interests | (319 | ) | (325 | ) | (1.8) | 2.0 | (410 | ) | (22.2) | (18.1) | ||||
Underlying attributable profit to the parent | 1,977 | 2,072 | (4.6) | (1.5) | 1,948 | 1.5 | 7.9 | |||||||
Net capital gains and provisions | (1,646 | ) | 711 | — | — | (108 | ) | 0.0 | 943.0 | |||||
Attributable profit to the parent | 331 | 2,783 | (88.1) | (87.5) | 1,840 | (82.0) | (80.2) | |||||||
(1) Includes exchange differences.
16 | | January - March 2020 |
First quarter results compared to the fourth quarter of 2019
Compared to the fourth quarter of 2019, profit was 88% lower, strongly conditioned by the high charges recorded in the net capital gains and provisions line:
• | In the first quarter of 2020: EUR -1,646 million, detailed on previous pages. |
• | On the other hand, in the fourth quarter of 2019, positive results of EUR 711 million, as follows: EUR 693 million stemming from the agreement with Crédit Agricole S.A. for the integration of the custody businesses and EUR 551 million due to changes in tax regulation in Brazil, and negative results of EUR 225 million related to real estate stakes in Spain, EUR 140 million of restructuring costs and EUR 168 million for intangible assets and other. |
Excluding the capital gains and provisions line in the first quarter of 2020 and in the fourth quarter of 2019, underlying attributable profit was 5% lower in euros. Excluding the exchange rate impact, -2%, with the following evolution by lines:
• | Total income was down 4%: net interest income declined 2%, strongly conditioned by Brazil and the UK (on the other hand, increases in Santander Consumer Finance and Chile). Net fee income was 1% lower, due to the UK, Argentina, where the fourth quarter was above average, and Brazil, where the fourth quarter was seasonally higher due to the collection of insurance premiums. Of particular note were the quarterly increases in Spain and the US, which reached the highest figure in the last five quarters. |
• | Operating expenses decreased 5% driven by the falls in all business units, except Santander Consumer Finance, Poland and the UK. Of note were Brazil , the US and Argentina. |
• | Loan-loss provisions dropped 8% primarily due to the seasonality of SC USA, a single name case in the UK and the strong volume growth in Brazil, all of them recorded in the previous quarter. |
Underlying attributable profit to the parent* | |
EUR million | |
 | constant euros |
(*) Excluding net capital gains and provisions.
January - March 2020 | | 17 |
Response to the COVID-19 crisis Business model | ||||||||
Balance sheet | ||||||||
Grupo Santander. Condensed balance sheet | ||||||||||
EUR million | ||||||||||
Change | ||||||||||
Assets | Mar-20 | Mar-19 | Absolute | % | Dec-19 | |||||
Cash, cash balances at central banks and other demand deposits | 122,456 | 103,500 | 18,956 | 18.3 | 101,067 | |||||
Financial assets held for trading | 125,846 | 98,592 | 27,254 | 27.6 | 108,230 | |||||
Debt securities | 28,969 | 30,162 | (1,193 | ) | (4.0 | ) | 32,041 | |||
Equity instruments | 8,605 | 11,982 | (3,377 | ) | (28.2 | ) | 12,437 | |||
Loans and advances to customers | 298 | 241 | 57 | 23.7 | 355 | |||||
Loans and advances to central banks and credit institutions | — | — | — | — | — | |||||
Derivatives | 87,974 | 56,207 | 31,767 | 56.5 | 63,397 | |||||
Financial assets designated at fair value through profit or loss | 67,142 | 82,149 | (15,007 | ) | (18.3 | ) | 66,980 | |||
Loans and advances to customers | 31,270 | 24,535 | 6,735 | 27.5 | 31,147 | |||||
Loans and advances to central banks and credit institutions | 28,775 | 48,250 | (19,475 | ) | (40.4 | ) | 28,122 | |||
Other (debt securities an equity instruments) | 7,097 | 9,364 | (2,267 | ) | (24.2 | ) | 7,711 | |||
Financial assets at fair value through other comprehensive income | 110,238 | 116,359 | (6,121 | ) | (5.3 | ) | 125,708 | |||
Debt securities | 99,557 | 111,519 | (11,962 | ) | (10.7 | ) | 118,405 | |||
Equity instruments | 2,291 | 2,590 | (299 | ) | (11.5 | ) | 2,863 | |||
Loans and advances to customers | 8,390 | 2,250 | 6,140 | 272.9 | 4,440 | |||||
Loans and advances to central banks and credit institutions | — | — | — | — | — | |||||
Financial assets measured at amortised cost | 981,331 | 980,733 | 598 | 0.1 | 995,482 | |||||
Debt securities | 26,033 | 39,895 | (13,862 | ) | (34.7 | ) | 29,789 | |||
Loans and advances to customers | 895,449 | 883,169 | 12,280 | 1.4 | 906,276 | |||||
Loans and advances to central banks and credit institutions | 59,849 | 57,669 | 2,180 | 3.8 | 59,417 | |||||
Investments in subsidiaries, joint ventures and associates | 8,610 | 7,726 | 884 | 11.4 | 8,772 | |||||
Tangible assets | 34,912 | 33,246 | 1,666 | 5.0 | 35,235 | |||||
Intangible assets | 26,583 | 29,114 | (2,531 | ) | (8.7 | ) | 27,687 | |||
Goodwill | 23,141 | 25,989 | (2,848 | ) | (11.0 | ) | 24,246 | |||
Other intangible assets | 3,442 | 3,125 | 317 | 10.1 | 3,441 | |||||
Other assets | 63,241 | 54,732 | 8,509 | 15.5 | 53,534 | |||||
Total assets | 1,540,359 | 1,506,151 | 34,208 | 2.3 | 1,522,695 | |||||
Liabilities and shareholders' equity | ||||||||||
Financial liabilities held for trading | 100,082 | 67,994 | 32,088 | 47.2 | 77,139 | |||||
Customer deposits | — | — | — | — | — | |||||
Debt securities issued | — | — | — | — | — | |||||
Deposits by central banks and credit institutions | — | — | — | — | — | |||||
Derivatives | 88,121 | 56,509 | 31,612 | 55.9 | 63,016 | |||||
Other | 11,961 | 11,485 | 476 | 4.1 | 14,123 | |||||
Financial liabilities designated at fair value through profit or loss | 67,337 | 74,426 | (7,089 | ) | (9.5 | ) | 60,995 | |||
Customer deposits | 44,638 | 41,063 | 3,575 | 8.7 | 34,917 | |||||
Debt securities issued | 4,287 | 2,709 | 1,578 | 58.3 | 3,758 | |||||
Deposits by central banks and credit institutions | 18,412 | 30,525 | (12,113 | ) | (39.7 | ) | 22,194 | |||
Other | — | 129 | (129 | ) | (100.0 | ) | 126 | |||
Financial liabilities measured at amortised cost | 1,224,749 | 1,211,981 | 12,768 | 1.1 | 1,230,745 | |||||
Customer deposits | 770,821 | 767,298 | 3,523 | 0.5 | 789,448 | |||||
Debt securities issued | 257,606 | 247,552 | 10,054 | 4.1 | 258,219 | |||||
Deposits by central banks and credit institutions | 170,275 | 165,811 | 4,464 | 2.7 | 152,969 | |||||
Other | 26,047 | 31,320 | (5,273 | ) | (16.8 | ) | 30,109 | |||
Liabilities under insurance contracts | 2,280 | 751 | 1,529 | 203.6 | 739 | |||||
Provisions | 12,335 | 13,449 | (1,114 | ) | (8.3 | ) | 13,987 | |||
Other liabilities | 27,463 | 27,185 | 278 | 1.0 | 28,431 | |||||
Total liabilities | 1,434,246 | 1,395,786 | 38,460 | 2.8 | 1,412,036 | |||||
Shareholders' equity | 124,139 | 121,866 | 2,273 | 1.9 | 124,239 | |||||
Capital stock | 8,309 | 8,118 | 191 | 2.4 | 8,309 | |||||
Reserves | 117,161 | 114,145 | 3,016 | 2.6 | 111,077 | |||||
Attributable profit to the Group | 331 | 1,840 | (1,509 | ) | (82.0 | ) | 6,515 | |||
Less: dividends | (1,662 | ) | (2,237 | ) | 575 | (25.7 | ) | (1,662 | ) | |
Other comprehensive income | (27,761 | ) | (23,021 | ) | (4,740 | ) | 20.6 | (24,168 | ) | |
Minority interests | 9,735 | 11,520 | (1,785 | ) | (15.5 | ) | 10,588 | |||
Total equity | 106,113 | 110,365 | (4,252 | ) | (3.9 | ) | 110,659 | |||
Total liabilities and equity | 1,540,359 | 1,506,151 | 34,208 | 2.3 | 1,522,695 | |||||
18 | | January - March 2020 |
Response to the COVID-19 crisis Business model | ||||||||
Balance sheet | ||||||||
GRUPO SANTANDER BALANCE SHEET
• | Strong negative exchange rate impact, both in the quarter (-5 pp) and year-on-year (-6 pp). |
• | Excluding this impact, the following movements were recorded in the quarter, partially affected by the impacts derived from the COVID-19 crisis at the end of March: |
– | Gross loans and advances to customers excluding reverse repos rose 3% driven by the increase in new lending and credit lines granted in the corporate segment, which offset the reduced activity of individuals. |
– | Customer funds increased 1% reflecting two different factors. On one hand, deposits excluding repos rose 3% while, on the other hand, mutual funds were 10% lower, predominantly driven by the impact of markets. |
• | Compared to March 2019: |
– | Gross loans and advances to customers excluding reverse repos rose 7% year-on-year in constant euros with nine of the 10 core markets growing particularly in South America (+16%) and North America (+13%). |
– | Customer funds increased 4% in constant euros, driven by deposits excluding repos, which rose 6%. Growth in nine of our 10 core markets. |
Loans and advances to customers
Gross loans and advances to customers rose to EUR 935,407 million in March 2019, 3% growth in euros year-on-year.
The Group uses gross loans and advances to customers excluding reverse repos for the purpose of analysing traditional commercial banking loans.
• | In the quarter, gross loans and advances to customers excluding reverse repos and the exchange rate impact increased 3%, particularly in March, derived from the impact of the health crisis in activity and the need for funding of the different segments, which varies across countries depending on the expansion of the pandemic. This was reflected in a strong growth in loans to legal entities and institutions in all countries and in the stagnation or reduction of the lending activity of individuals, particularly in Europe. |
Volume growth across all markets, except Argentina and Santander Consumer Finance, the latter affected by the halt in consumer activity driven by the confinement measures in Spain and Italy, followed by France and other countries.
Gross loans and advances to customers (Excl. reverse repos) | |
EUR billion | |
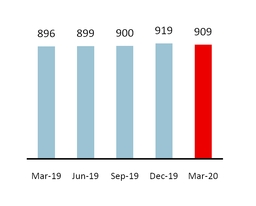
+1% * |
Mar-20 / Mar-19 |
(*) In constant EUR: +7%
The performance of the quarter also affects the year-on-year comparison: gross loans and advances to customers excluding reverse repos and the exchange rate impact rose 7%, with the following performance by region:
In Europe, 4% growth with all markets increasing, except Spain (-4%). Santander Consumer Finance rose 7%, with almost all countries growing, Poland +9%, and the UK +5%, driven by strong residential mortgage activity from late 2019. Portugal grew 2%, shifting the downward trend of previous quarters. Other Europe, which includes most of the wholesale banking business in the region, increased 37%.
In North America, Mexico grew 13% and the US 12%, leading to a 13% increase in the region.
Growth in South America was 16%, with Brazil growing 18%, Chile +13% and Argentina +16%.
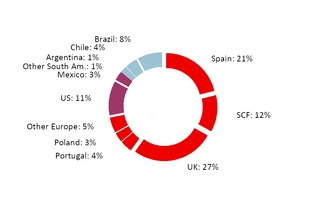
Gross loans and advances to customers excluding reverse repos maintained a balanced structure: individuals (46%), consumer credit (17%), SMEs and corporates (23%) and SCIB (14%).
Gross loans and advances to customers (Excl. reverse repos) | |
% operating areas. March 2020 | |
January - March 2020 | | 19 |
Response to the COVID-19 crisis Business model | ||||||||
Balance sheet | ||||||||
Customer funds
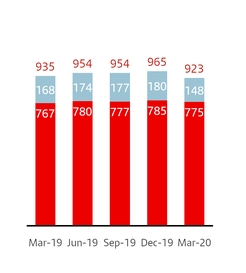
Customer deposits amounted to EUR 815,459 million, 1% growth in the last 12 months (in euros).
The Group uses customer funds (customer deposits excluding repos, and including mutual funds) for the purpose of analysing traditional retail banking funds.
• | In the first quarter, customer funds were 1% higher excluding exchange rate impacts and, as in loans, growth was mainly produced in March: |
Mixed performance by products: customer deposits excluding repos rose 3% (+2% demand deposits and +5% time deposits), while mutual funds dropped 10% due to high market volatility derived from COVID-19, mainly in Europe.
By market, North America rose 12%, with growth of 10% and 14% in the US and Mexico, respectively, South America increased 5% with broad-based growth in the region, notably Argentina, and Europe dropped 2% with decreases in most countries, adversely impacted by the fall in mutual funds.
• | Compared to March 2019, customer funds, excluding the exchange rate impact, increased 4%, as follows: |
By product, deposits excluding repos rose 6%. Demand deposits (+7%) increased in nine of the ten core markets and time deposits grew 3% driven by the US and South America, which offset the falls in the other countries. Mutual funds dropped 2%, due to the aforementioned market volatility, with decreases in most European countries and increases in the Americas.
By market, customer funds rose in all of them except Spain (-4%), due to the falls in time deposits and mutual funds. Of note were Argentina (+34%), Chile (+21%), the US (+18%) and Brazil (+12%). There was more moderate growth in Mexico and Santander Consumer Finance (+10% and +7% respectively), while the others increased less than 5%.
Customer funds | |
EUR billion | |
-1% * |
-12% |
+1% |
l Total |
l Mutual funds |
l Deposits excl. repos |
Mar-20 / Mar-19 |
(*) In constant EUR: +4%
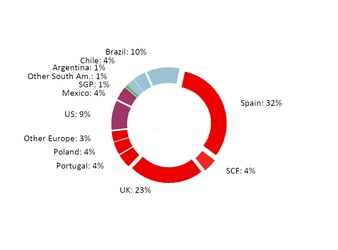
Customer funds continued to be well diversified by products: 63% demand deposits, 21% time deposits and 16% mutual funds.
As well as capturing customer deposits, Grupo Santander, for strategic reasons, maintains a selective policy of issuing securities in the international fixed income markets and strives to adapt the frequency and volume of its market operations to the structural liquidity needs of each unit, as well as to the receptiveness of each market.
• In the first quarter of 2020, the Group issued:
Medium- and long-term covered bonds placed in the market of EUR 6,553 million and senior debt amounting to EUR 6,679 million.
There were EUR 3,663 million of securitisations placed in the market.
Issuances to meet the TLAC (Total Loss-Absorbing Capacity) requirement amounting to EUR 4,125 million, in order to strengthen the Group’s situation (senior non-preferred: EUR 2,625 million, preferred: EUR 1,500 million).
Maturities of medium- and long-term debt of EUR 14,460 million.
• | The net loan-to-deposit ratio was 115% (113% in March 2019). The ratio of deposits plus medium- and long-term funding to the Group’s loans was 112%, underscoring the comfortable funding structure. |
In the first quarter, Fitch Ratings confirmed the rating of long-term debt and deposits at A-/F2, changing the outlook from stable to negative due to the economic consequences that the COVID-19 crisis might have on the rating in the medium term. Additionally, following a change of criteria, Fitch Ratings revised the Bank’s subordinated debt (T2) ratings to BBB (from BBB+) and upgraded the preferred debt (AT1) to BB+ (from BB).
Customer funds | |
% operating areas. March 2020 | |
20 | | January - March 2020 |
SOLVENCY RATIOS
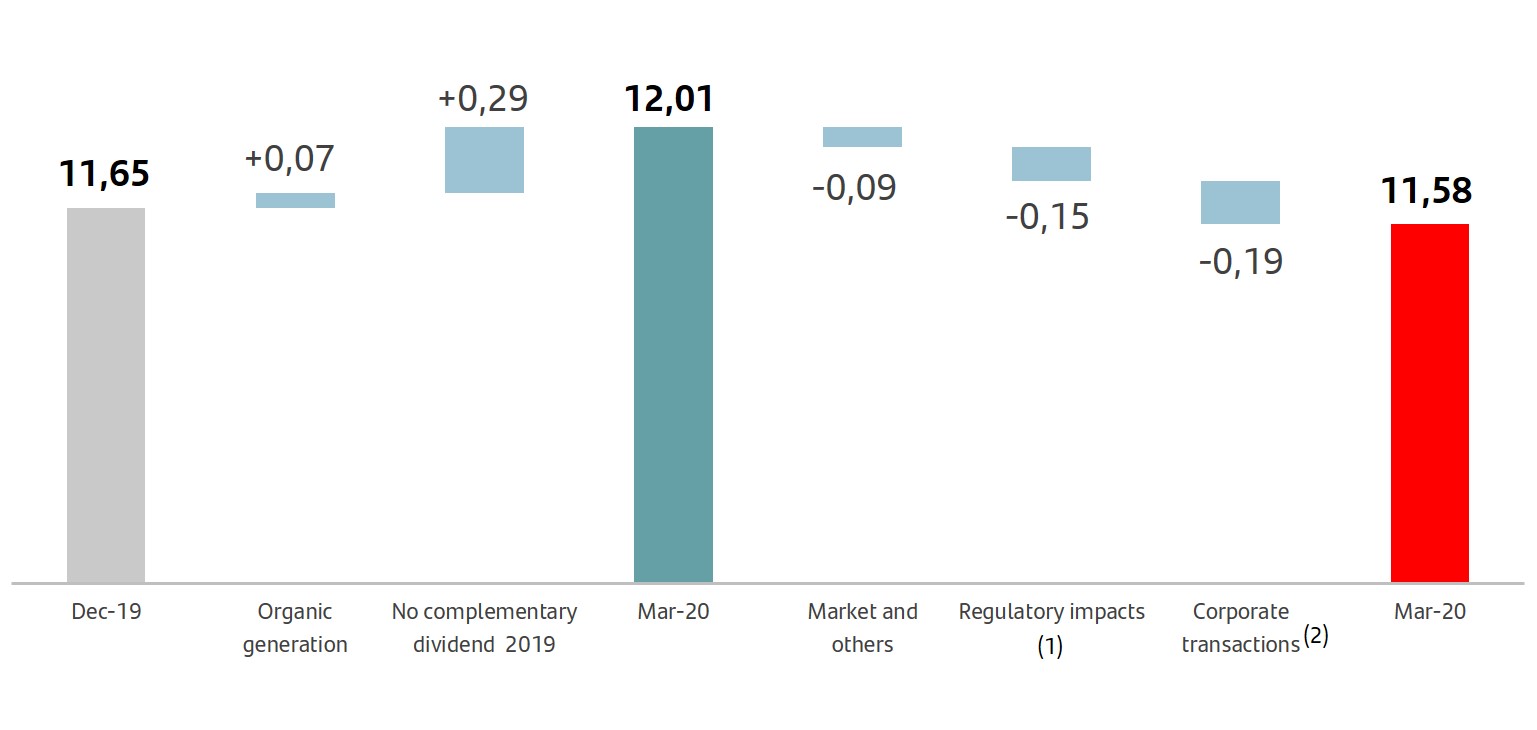
• | At the end of the quarter, the CET1 ratio reached 11.58%. The organic generation and the measures adopted in dividends led to an increase of 36 bps, offset by corporate transactions, regulatory impacts and markets. |
• | Tangible equity per share was EUR 4.21. Including the dividend recorded in the last 12 months, it was EUR 4.37, 1.8% higher year-on-year. |
• | The fully loaded leverage ratio remained broadly stable at 5.04% in the quarter. |
At the end of the quarter, the total phased-in capital ratio stood at 15.09% and the CET1 ratio (phased-in and fully loaded) at 11.58%. We have a strong capital base, comfortably meeting the minimum levels required by the European Central Bank on a consolidated basis (13.02% for the total capital ratio and 8.86% for the CET1 ratio), after the recent measures adopted by regulators of reducing the Pillar 2 R and countercyclical buffer. This results in a CET1 management buffer of 272 bps.
In the quarter, we continued to generate capital organically, +7 bps, after absorbing the sharp growth of risk weighted assets, as a result of increased lending. In addition, the cancellation of the payment of the final dividend against 2019 results, in compliance with the
European Central Bank's recommendation, had a positive impact of 29 bps. The aggregate effect amounted to a generation of 36 bps.
On the other hand, there were several non-recurring impacts in the quarter. Corporate transactions had a negative impact of 19 bps (mainly related to Allianz, Olé put and Elavon) and regulatory impacts of -15 bps (securitisations, Brazil models and IFRS 9), together with the negative performance of markets and exchange rates.
Had the IFRS 9 transitional arrangement not been applied, the total impact on the CET1 would have been -25 bps after the application of the dynamic phased-in.
Eligible capital. Eligible capital. December 2019* | ||||
EUR million | ||||
Phased-in | Fully loaded | |||
CET1 | 68,414 | 68,414 | ||
Basic capital | 77,741 | 77,173 | ||
Eligible capital | 89,196 | 89,097 | ||
Risk-weighted assets | 590,952 | 590,952 | ||
CET1 capital ratio | 11.58 | 11.58 | ||
T1 capital ratio | 13.16 | 13.06 | ||
Total capital ratio | 15.09 | 15.08 | ||
Fully-loaded capital ratio* |
% |
 |
CET1 evolution* |
% |
 |
(1) New securitisation framework (-0.06), Brazil models (-0.05) and phased-out IFRS 9 (-0.04)
(2) Corporate operations: Allianz (-0.09), Put Olé (-0.03) and Elavon and Other (-0.07)
(*) All 2019 and 2020 data was calculated using the IFRS 9 transitional arrangements, unless otherwise indicated.
January - March 2020 | | 21 |
RISK MANAGEMENT
• | The effects related to the COVID-19 situation had not yet materialised in the risk indicators of the first quarter, which reflect the credit quality improvements observed in the first three months of the year. |
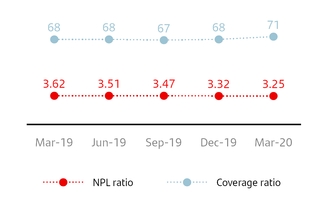
• | The NPL ratio stood at 3.25% as of the end of March which is lower on both a quarterly and an annual basis, while cost of credit remained at 1%. Coverage increased 3 pp to 71%. |
• | Our market risk exposure in this first quarter, remained at low levels, in spite of the recent uncertainty and volatility that is now prevailing in the current context. These exceptional circumstances that the markets have been going through since the final weeks of March did not have a material impact on Santander’s portfolio. |
• | The operational risk profile remained stable, with a similar distribution of losses by category, despite the aforementioned observed volatility and uncertainty. |
u COVID-19 risk management
Santander is executing across all its units the existing business contingency plans, with the goal of ensuring the correct functioning of all our activities as well as providing the necessary support to our customers.
In order to address and closely monitor the potential effects derived from the current situation, the Group has additional governance including crisis management committees in which, among others, the following topics are discussed:
• | Assessment of all risk factors and identification of areas of focus. |
• | Potential impact analysis in all units where the Group operates, through continuous monitoring and scenario analysis. |
• | Analysis and implementation of the different economic mitigating measures adopted by governments and central banks as well as those designed internally by the Bank. |
Continuous monitoring and reporting of the main key risk indicators to the board and senior management is key to facilitate the decision making process.
Even though the COVID-19 situation has deeply altered the normal functioning of the financial markets and the overall economic activity especially since the last few weeks of March, the Group maintained, in the first quarter, the positive trend in terms of credit quality, supported by the positive evolution of the NPL ratio, an appropriate coverage ratio and a stable cost of credit.
Credit risk | ||||||||
EUR million | ||||||||
Mar-20 | Mar-19 | Chg (%) | Dec-19 | |||||
Non-performing loans | 32,743 | 35,590 | (8.0 | ) | 33,799 | |||
NPL ratio (%) | 3.25 | 3.62 | 3.32 | |||||
Loan-loss allowances | 23,361 | 24,129 | (3.2 | ) | 22,965 | |||
For impaired assets | 13,364 | 15,100 | (11.5 | ) | 14,093 | |||
For other assets | 9,997 | 9,029 | 10.7 | 8,872 | ||||
Coverage ratio (%) | 71 | 68 | 68 | |||||
Cost of credit (%) | 1.00 | 0.97 | 1.00 | |||||
u Credit risk management
As acknowledged by the IASB and other regulators and supervisors, it is difficult at this time to know the specific effects of the health crisis and government and central bank support measures, such as mortgage repayment holidays, credit lines and guarantees and other mitigating packages.
Nevertheless, and in compliance with the accounting standard (IFRS 9), which enables the incorporation of forward-looking macroeconomic information in the calculation of provisions, that include future effects arising from changes in variables to which the models are sensitive to (GDP, unemployment, house prices, etc.), the Group recorded a provisions overlay in the quarter of EUR 1.6 billion, based on the expected deterioration in the economic conditions arising from the pandemic.
In terms of the first quarter credit risk performance, non-performing loans amounted to EUR 32,743 million in March, 3% less than in the previous quarter, due to the reductions observed in most of our countries.
The Group’s NPL ratio decreased to 3.25% (-7 bps quarter-on-quarter and -37 bps year-on-year). Reductions were observed on a year-on-year basis in most of the Group’s units.
Loan-loss provisions in the first quarter and excluding the previously mentioned overlay amounted to EUR 2,309 million, 8% less in constant euros than in the fourth quarter, mainly driven by seasonality in SC USA. On a year-on-year basis, 12% increase in constant euros, mainly led by the portfolio growth registered in Brazil and the lower portfolio sales in SCF.
NPL and coverage ratios. Total Group |
% |
22 | | January - March 2020 |
Key metrics geographic performance. Key metrics geographic performance. March 2020 | ||||||||
% | Change (bps) | |||||||
NPL ratio | QoQ | YoY | Coverage ratio | |||||
EUROPE | 3.19 | (6 | ) | (42 | ) | 51 | ||
Spain | 6.88 | (6 | ) | (41 | ) | 42 | ||
Consumer Finance | 2.43 | 13 | 10 | 104 | ||||
United Kingdom | 0.96 | (5 | ) | (21 | ) | 38 | ||
Portugal | 4.56 | (27 | ) | (121 | ) | 55 | ||
Poland | 4.29 | (2 | ) | (10 | ) | 66 | ||
NORTH AMERICA | 2.02 | (18 | ) | (31 | ) | 158 | ||
USA | 2.00 | (20 | ) | (41 | ) | 167 | ||
Mexico | 2.07 | (12 | ) | (5 | ) | 128 | ||
SOUTH AMERICA | 4.63 | (23 | ) | (20 | ) | 86 | ||
Brazil | 4.93 | (39 | ) | (33 | ) | 100 | ||
Chile | 4.63 | (1 | ) | (4 | ) | 54 | ||
Argentina | 3.97 | 58 | 47 | 113 | ||||
GROUP | 3.25 | (7 | ) | (37 | ) | 71 | ||
Non-performing loans by quarter | ||||||||||
EUR million | ||||||||||
Q1'19 | Q2'19 | Q3'19 | Q4'19 | Q1'20 | ||||||
Balance at beginning of period | 35,692 | 35,590 | 34,421 | 34,326 | 33,799 | |||||
Net additions | 2,147 | 2,511 | 3,190 | 2,696 | 2,543 | |||||
Increase in scope of consolidation | — | — | — | — | — | |||||
Exchange rate differences and other | 479 | (162 | ) | (110 | ) | (51 | ) | (964 | ) | |
Write-offs | (2,728 | ) | (3,518 | ) | (3,175 | ) | (3,172 | ) | (2,635 | ) |
Balance at period-end | 35,590 | 34,421 | 34,326 | 33,799 | 32,743 | |||||
Cost of credit remained at 1%, similar levels compared to the previous quarter and to the first quarter of 2019, reflecting the stability of our loan portfolio’s credit quality.
Total loan-loss reserves amounted to EUR 23,361 million. Coverage at the end of March 2020 increased to 71% due to the extraordinary provisions raised as previously explained. It should also be taken into account that in Spain and the UK, a large part of their portfolios has real estate collateral, which justifies lower coverage levels.
The Group’s coverage by IFRS 9 stages remained stable on a year-on-year and quarter-on-quarter basis, with no significant movements.
u Market risk
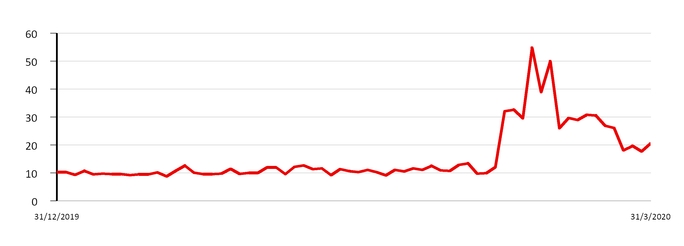
The global corporate banking trading activity risk is mainly interest rate driven, focused on servicing our customer's needs and measured in daily VaR terms at 99%. In the first quarter, after VaR fluctuating around an average value of EUR 10.6 million until the beginning of March, it reached EUR 54.8 million as a result of the market volatility spike caused by the health crisis, decreasing after that point and stabilising at around EUR 30 million, closing Q1'20 at EUR 20.7 million. These figures remain low compared to the size of the Group’s balance sheet and activity.
It should be also mentioned that there are other positions classified for accounting purposes as trading (total VaR of EUR 22.8 million at the end of March 2020).
Coverage ratio by stage | |||||||
EUR billion | |||||||
Exposure1 | Coverage | ||||||
Mar-20 | Mar-20 | Mar-19 | |||||
Stage 1 | 891 | 0.6 | % | 0.5 | % | ||
Stage 2 | 53 | 8.2 | % | 9.1 | % | ||
Stage 3 | 33 | 40.8 | % | 42.4 | % | ||
(1) Exposure subject to impairment. Additionally, there are EUR 31 billion in loans and advances to customers not subject to impairment recorded at mark to market with changes through P&L.
Stage 1: financial instruments for which no significant increase in credit risk is identified since its initial recognition.
Stage 2: if there has been a significant increase in credit risk since the date of initial recognition but the impairment event has not materialised, the financial instrument is classified in Stage 2.
Stage 3: a financial instrument is catalogued in this stage when it shows effective signs of impairment as a result of one or more events that have already occurred resulting in a loss.
January - March 2020 | | 23 |
Trading portfolios*. VaR performance |
EUR million |
(*) Corporate & Investment Banking performance in financial markets.
Trading portfolios (1). VaR by geographic region | |||||||
EUR million | |||||||
2020 | 2019 | ||||||
First quarter | Average | Latest | Average | ||||
Total | 15.8 | 20.7 | 13.5 | ||||
Europe | 10.7 | 19.9 | 6.0 | ||||
North America | 5.6 | 11.7 | 2.7 | ||||
South America | 8.0 | 5.8 | 11.3 | ||||
(1) Activity performance in Santander Corporate & Investment Banking markets.
u Structural and liquidity risk
• | With regards to structural exchange rate risk, Santander’s CET1 ratio coverage remained around 100% in order to protect it from foreign currency movements. |
• | In structural interest rate risk, negative performance in the ALCO activity, mainly in Latin America due to the potential negative impact on its economy, which is highly dependent on trade with China. |
• | In liquidity risk during the first quarter, the Group maintained a comfortable position, supported by a robust liquidity buffer, with ratios well above regulatory limits. |
Trading portfolios (1). VaR by market factor | ||||||||
EUR million | ||||||||
First quarter 2020 | Min. | Avg. | Max. | Last | ||||
VaR total | 8.8 | 15.8 | 54.8 | 20.7 | ||||
Diversification effect | (2.0 | ) | (11.2 | ) | (32.7 | ) | (28.3 | ) |
Interest rate VaR | 6.2 | 11.0 | 29.2 | 20.6 | ||||
Equity VaR | 3.0 | 5.4 | 14.7 | 12.9 | ||||
FX VaR | 2.6 | 5.4 | 12.9 | 8.9 | ||||
Credit spreads VaR | 3.1 | 5.1 | 10.3 | 6.4 | ||||
Commodities VaR | — | — | 0.2 | — | ||||
(1) Activity performance in Corporate & Investment Banking markets.
NOTE: In the North America, South America and Asia portfolios, VaR corresponding to the credit spreads factor other than sovereign risk is not relevant and is included in the interest rate factor.
u Operational risk
• | The COVID-19 situation has driven the Group to put additional focus on several operational risk aspects, such as: |
– | Business continuity plans to support our employees, customers and overall businesses. |
– | Potential increase of cyber risk due to new conditions in business management and remote working. Our cyber security programme continued to be improved by strengthening detection, response and protection mechanisms. |
– | Increase in technological support in order to ensure adequate customer service and correct performance of our services, especially in online banking and call centres. |
– | Continuous follow up on other risk that could increase such as third party, fraud, data risk or conduct and AML. |
• | In terms of the first quarter performance, levels of losses in relative terms by Basel categories were aligned with the first quarter of 2019, and lower than previous quarter. In addition to the COVID-19 situation, the main risk this quarter was the evolution of ongoing legal and regulatory cases (including legacy cases) and legal claims in Brazil. |
24 | | January - March 2020 |
GENERAL BACKGROUND
Grupo Santander carried out its business in the first quarter of 2020 which began on a positive note until the outbreak of the COVID-19 crisis. The development of the pandemic, the confinement measures and suspension of most activity and the economic policy measures created an environment of great economic and financial uncertainty, which led to a strong global recession at the end of the quarter, which will extend to the second quarter of the year, together with significant market volatility.
Country | GDP Change1 | Economic performance | |
 | Eurozone | +1.2% | Confidence indicators plummeted in March, evidencing a sharp contraction in GDP growth. Business surveys expect a decline in employment and increase in unemployment. Inflation fell to 0.8%in March due to lower oil prices. |
 | Spain | +2.0% | The quarter began with a similar growth rate to that of Q4'19. However, conditions changed dramatically in March, as the economic halt resulting from confinement measures due to COVID-19 will lead to a fall in GDP growth. Inflation dropped to 0% in March driven by lower oil prices. |
 | United Kingdom | +1.4% | The rebound in activity at the beginning of the quarter was truncated by the COVID-19 crisis. Inflation in February (1.7%) reflected the fall in oil prices but not the weakening of activity. The unemployment rate ended the year at 3.8% . The Bank of England cut interest rates to 0.1% to address the crisis. |
 | Portugal | +2.2% | The economic standstill in the past weeks will lead to a notable decrease in GDP growth, which had already moderated due to the lower contribution of domestic demand. The jobless rate rose slightly at the end of the year (6.71%) and inflation remained unchanged in March (0.05%). |
 | Poland | +4.1% | The economy grew at a good pace in 2019, but Q1'20 will be affected by the COVID-19 crisis. Inflation remained high in March (4.6%), although the central bank cut its key interest rate to 0.5% from1.0%, to handle the impact from the pandemic. The unemployment rate will rise from 2.9% in Q4'19. |
 | United States | +2.3% | After economic growth slowed down by 0.6 pp in 2019, conditions for the stabilisation of the economy were met at the start of 2020. But the pandemic, with high potential economic impact, and tighter financial conditions led the Fed to cut rates to 0-0.25% in March. |
 | Mexico | -0.1% | The outbreak of COVID-19 raised market volatility and will negatively affect the GDP growth, which was stagnant in 2019. The central bank cut its key interest rate to 6.50% (7.25% in Q4'19) and announced measures to provide liquidity, which will help to ease tensions. Inflation stood at 3.2% in March, in line with the official target. S&P downgraded the sovereign rating (from BBB+ to BBB). |
 | Brazil | +1.1% | The gradual recovery of GDP in 2019 is expected to be dampened by the effects of the pandemic and market volatility generated. Inflation remained low (3.3% in March). The central bank cut its benchmark rate to 3.75% (4.50% in Q4'19) and announced liquidity measures to calm market volatility. |
 | Chile | +1.1% | GDP was impacted in Q4'19 by the social protests that began in mid-October. Activity recovered in the following months, although future uncertainty remained and increased due to the pandemic. Inflation temporarily rebounded to 3.7% in March. The central bank cut the official rate by 125 bps to 0.5% in March and approved measures to inject liquidity and reduce volatility. |
 | Argentina | -2.2% | GDP growth fell 1% in Q4'19 and 2.2% in the year, dampened by consumption and investment. Inflation moderated slightly to 2.5% per month in Q1'20 ( 3.8% in average in Q4'19), due to exchange rate control and price agreements. The main focus was the renegotiation of foreign debt. |
(1) Year-on-year change 2019.
January - March 2020 | | 25 |
Response to the COVID-19 crisis Business model | ||||||||
DESCRIPTION OF SEGMENTS
The segment reporting is based on financial information presented to the chief operating decision maker, which excludes certain items included in the statutory results that distort year-on-year comparisons and are not considered for management reporting purposes. This financial information (underlying basis) is computed by adjusting reported results for the effects of certain gains and losses (e.g.: capital gains, write-downs, impairment of goodwill, etc.). These gains and losses are items that management and investors ordinarily identify and consider separately to better understand the underlying trends in the business.
The Group has aligned the information in this operating segment section in a manner consistent with the underlying information used internally for management reporting purposes and with that presented throughout the Group’s other public documents.
The Group executive committee has been determined to be the chief operating decision maker for the Group. The Group’s operating segments reflect the organisational and management structures. The Group executive committee reviews the internal reporting based on these segments in order to assess performance and allocate resources.
The segments are differentiated by the geographic area where profits are earned and by type of business. The financial information of each reportable segment is prepared by aggregating the figures for the Group’s various geographic areas and business units. The information relates to both the accounting data of the units integrated in each segment and that provided by management information systems. In all cases, the same general principles as those used in the Group are applied.
The businesses included in each of the business areas in this report and the accounting principles under which their results are presented here may differ from the businesses included and accounting principles applied in the financial information separately prepared and disclosed by our subsidiaries (some of which are publicly listed) which in name or geographical description may seem to correspond to the business areas covered in this report. Accordingly, the results of operations and trends shown for our business areas in this document may differ materially from those of such subsidiaries.
In 2020, the Group maintains the general criteria applied in 2019, as well as the business segments with the following exceptions, which only affect the secondary segments:
1. Following the creation of the reporting segment Santander Global Platform in 2019, which comprises our global digital services under a single unit, and its incorporation in both main and secondary segments, in 2020 for better monitoring of its evolution and contribution to the Group's results, at the secondary segment level in addition to the results generated by the platforms, 50% of the results generated by countries in products linked to these platforms are considered. These results were previously included in Retail Banking.
2. Annual adjustment of the perimeter of the Global Customer Relationship Model between Retail Banking and Santander Corporate & Investment Banking and between Retail Banking and Wealth Management & Insurance.
These changes in the secondary segments have no impact on the primary segments and do not affect the Group’s figures.
To allow better comparability of the secondary segments, the data of 2019 has been provided on a new basis.
After these changes, the operating business areas are structured in two levels:
Primary segments
This primary level of segmentation, which is based on the Group’s management structure, comprises five reportable segments: four operating areas plus the Corporate Centre. The operating areas are:
Europe: which comprises all the business activities carried out in the region. Detailed financial information is provided on Spain, Portugal, Poland, Santander Consumer Finance (which incorporates all the region’s business, including the three countries mentioned herewith) and the UK.
North America: which comprises all the business activities carried out in Mexico and the US, which includes the holding company (SHUSA) and the businesses of Santander Bank, Santander Consumer USA, Banco Santander Puerto Rico (whose sale was agreed in the second half of 2019 and is expected to close in the middle of 2020), the specialised unit Banco Santander International and the New York branch.
South America: includes all the financial activities carried out by the Group through its banks and subsidiary banks in the region. Detailed information is provided on Brazil, Chile, Argentina, Uruguay, Peru and Colombia.
Santander Global Platform: which comprises our global digital services under a single unit, includes Global Payments Services (Global Trade Services, Global Merchant Services, Superdigital, Pago FX), our fully digital bank Openbank and Open Digital Services, and Digital Assets (Centres of Digital Expertise, InnoVentures and Digital Assets).
26 | | January - March 2020 |
Response to the COVID-19 crisis Business model | ||||||||
Secondary segments
At this secondary level of segment reporting, the Group is structured into Retail Banking, Santander Corporate & Investment Banking, Wealth Management & Insurance and Santander Global Platform.
Retail banking: this covers all customer banking businesses, including consumer finance, except those of corporate banking, which are managed through Santander Corporate & Investment Banking, asset management, private banking and insurance, which are managed by Wealth Management & Insurance and 50% of the countries’ results generated by digital services, which are included in Santander Global Platform. The results of the hedging positions in each country are also included, conducted within the sphere of each one’s assets and liabilities committee.
Santander Corporate & Investment Banking (SCIB): this business reflects revenue from global corporate banking, investment banking and markets worldwide including treasuries managed globally (always after the appropriate distribution with Retail Banking customers), as well as equity business.
Wealth Management & Insurance: includes the asset management business (Santander Asset Management), the corporate unit of Private Banking and International Private Banking in Miami and Switzerland and the insurance business (Santander Insurance).
Santander Global Platform: which comprises our global digital services under a single unit (breakdown in the primary segment definition), as well as 50% of the results generated by these services in the commercial network.
In addition to these operating units, which report by geographic area and businesses, the Group continues to maintain the area of Corporate Centre, that includes the centralised activities relating to equity stakes in financial companies, financial management of the structural exchange rate position, assumed within the sphere of the Group’s assets and liabilities committee, as well as management of liquidity and of shareholders’ equity via issuances.
As the Group’s holding entity, this area manages all capital and reserves and allocations of capital and liquidity with the rest of businesses. It also incorporates amortisation of goodwill but not the costs related to the Group’s central services (charged to the areas), except for corporate and institutional expenses related to the Group’s functioning.
As described on the previous page, the results of our business areas presented below are provided on the basis of underlying results only and including the impact of foreign exchange rate fluctuations. However, for a better understanding of the actual changes in the performance of our business areas, we provide and discuss the year-on-year changes to our results excluding such impact. On the other hand, certain figures contained in this report, including financial information, have been subject to rounding to enhance their presentation. Accordingly, in certain instances, the sum of the numbers in a column or a row in tables contained in this report may not conform exactly to the total figure given for that column or row. |
January - March 2020 | | 27 |
Response to the COVID-19 crisis Business model | ||||||||
January-March 2020 | ||||||||||||
Main items of the underlying income statement | ||||||||||||
EUR million | ||||||||||||
Primary segments | Net interest income | Net fee income | Total income | Net operating income | Profit before tax | Underlying attributable profit to the parent | ||||||
EUROPE | 3,435 | 1,315 | 4,974 | 2,263 | 1,511 | 974 | ||||||
Spain | 925 | 643 | 1,789 | 844 | 487 | 352 | ||||||
Santander Consumer Finance | 979 | 187 | 1,171 | 656 | 528 | 304 | ||||||
United Kingdom | 898 | 193 | 1,098 | 384 | 260 | 188 | ||||||
Portugal | 202 | 101 | 350 | 199 | 173 | 120 | ||||||
Poland | 296 | 116 | 365 | 193 | 90 | 38 | ||||||
Other | 134 | 74 | 202 | (14 | ) | (27 | ) | (28 | ) | |||
NORTH AMERICA | 2,261 | 461 | 2,936 | 1,712 | 824 | 522 | ||||||
US | 1,462 | 250 | 1,929 | 1,120 | 468 | 273 | ||||||
Mexico | 798 | 211 | 1,007 | 592 | 357 | 249 | ||||||
SOUTH AMERICA | 3,065 | 1,074 | 4,163 | 2,677 | 1,661 | 928 | ||||||
Brazil | 2,270 | 869 | 3,137 | 2,133 | 1,298 | 694 | ||||||
Chile | 448 | 92 | 553 | 322 | 216 | 125 | ||||||
Argentina | 241 | 76 | 318 | 132 | 79 | 59 | ||||||
Other | 106 | 37 | 157 | 91 | 68 | 51 | ||||||
SANTANDER GLOBAL PLATFORM | 31 | 13 | 45 | (26 | ) | (27 | ) | (13 | ) | |||
CORPORATE CENTRE | (304 | ) | (9 | ) | (304 | ) | (389 | ) | (413 | ) | (434 | ) |
TOTAL GROUP | 8,487 | 2,853 | 11,814 | 6,237 | 3,556 | 1,977 | ||||||
Secondary segments | ||||||||||||
RETAIL BANKING | 7,885 | 2,024 | 9,972 | 5,445 | 2,818 | 1,637 | ||||||
CORPORATE & INVESTMENT BANKING | 671 | 404 | 1,300 | 764 | 745 | 491 | ||||||
WEALTH MANAGEMENT & INSURANCE | 132 | 320 | 586 | 342 | 334 | 240 | ||||||
SANTANDER GLOBAL PLATFORM | 103 | 115 | 260 | 74 | 71 | 43 | ||||||
CORPORATE CENTRE | (304 | ) | (9 | ) | (304 | ) | (389 | ) | (413 | ) | (434 | ) |
TOTAL GROUP | 8,487 | 2,853 | 11,814 | 6,237 | 3,556 | 1,977 | ||||||
Underlying attributable profit geographic distribution* | Underlying attributable profit Q1'20. Core markets | |
January - March 2020 | EUR million. % change YoY in constant euros | |
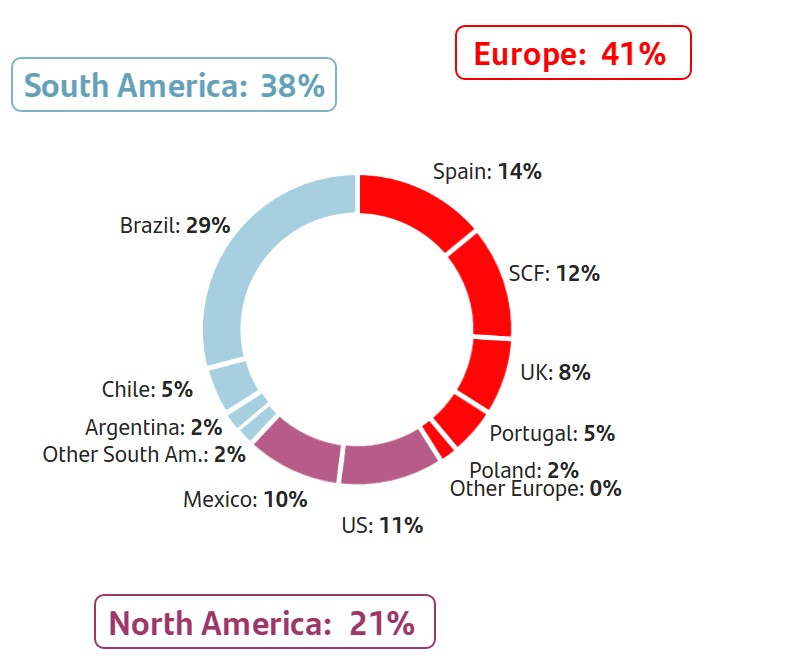 | 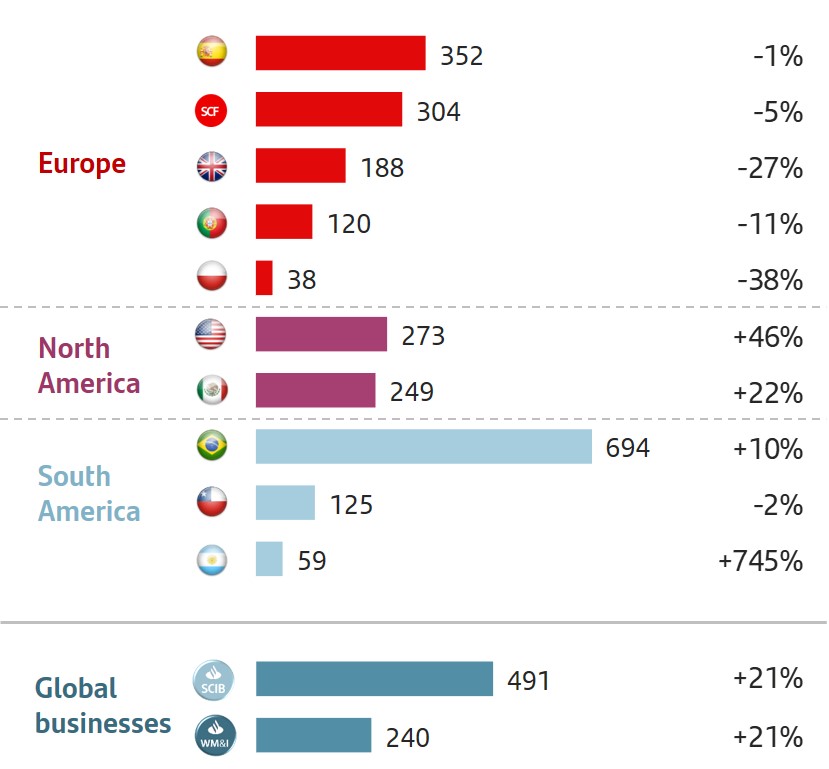 | |
(*) As a % of operating areas. Excluding Corporate Centre and Santander Global Platform. | ||
28 | | January - March 2020 |
Response to the COVID-19 crisis Business model | ||||||||
January-March 2019 | ||||||||||||
Main items of the underlying income statement | ||||||||||||
EUR million | ||||||||||||
Primary segments | Net interest income | Net fee income | Total income | Net operating income | Profit before tax | Underlying attributable profit to the parent | ||||||
EUROPE | 3,561 | 1,327 | 5,225 | 2,423 | 1,768 | 1,163 | ||||||
Spain | 1,009 | 623 | 1,857 | 832 | 478 | 356 | ||||||
Santander Consumer Finance | 941 | 214 | 1,167 | 659 | 561 | 324 | ||||||
United Kingdom | 975 | 216 | 1,206 | 467 | 357 | 254 | ||||||
Portugal | 216 | 98 | 357 | 200 | 193 | 135 | ||||||
Poland | 281 | 113 | 377 | 204 | 127 | 61 | ||||||
Other | 139 | 62 | 261 | 61 | 52 | 32 | ||||||
NORTH AMERICA | 2,173 | 439 | 2,753 | 1,581 | 713 | 386 | ||||||
US | 1,407 | 234 | 1,815 | 1,039 | 370 | 181 | ||||||
Mexico | 766 | 204 | 939 | 542 | 343 | 205 | ||||||
SOUTH AMERICA | 3,222 | 1,178 | 4,487 | 2,842 | 1,785 | 926 | ||||||
Brazil | 2,459 | 931 | 3,411 | 2,286 | 1,409 | 721 | ||||||
Chile | 440 | 103 | 600 | 344 | 279 | 148 | ||||||
Argentina | 213 | 116 | 331 | 129 | 34 | 10 | ||||||
Other | 109 | 29 | 146 | 83 | 63 | 47 | ||||||
SANTANDER GLOBAL PLATFORM | 22 | 2 | 19 | (22 | ) | (23 | ) | (11 | ) | |||
CORPORATE CENTRE | (296 | ) | (14 | ) | (399 | ) | (497 | ) | (559 | ) | (517 | ) |
TOTAL GROUP | 8,682 | 2,931 | 12,085 | 6,327 | 3,684 | 1,948 | ||||||
Secondary segments | ||||||||||||
RETAIL BANKING | 8,083 | 2,178 | 10,412 | 5,718 | 3,184 | 1,763 | ||||||
CORPORATE & INVESTMENT BANKING | 654 | 352 | 1,278 | 717 | 686 | 441 | ||||||
WEALTH MANAGEMENT & INSURANCE | 141 | 273 | 523 | 282 | 285 | 208 | ||||||
SANTANDER GLOBAL PLATFORM | 100 | 142 | 271 | 107 | 88 | 52 | ||||||
CORPORATE CENTRE | (296 | ) | (14 | ) | (399 | ) | (497 | ) | (559 | ) | (517 | ) |
TOTAL GROUP | 8,682 | 2,931 | 12,085 | 6,327 | 3,684 | 1,948 | ||||||
January - March 2020 | | 29 |
EUROPE | |
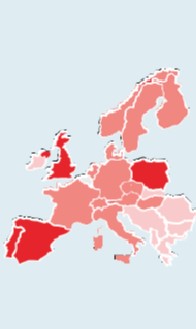 | Highlights (changes in constant euros) • Given the current macroeconomic environment, characterised by lower for longer interest rates, we are working on our franchises to simplify our business model and structures and adapt our technology platforms. • In an environment of high uncertainty generated by the COVID-19 health crisis, loans grew 4%, mainly in SMEs and large corporates, which partially offset the falls in new lending in the consumer and individual segments. • Underlying attributable profit amounted to EUR 974 million, down 16% compared to 2019, due to lower customer revenue and higher provisions (partly due to portfolio sales in SCF in Q1'19). Costs improved 3%, with good performance in all markets, reflecting the optimisation measures. |
EUR 974 Mn | |
Underlying attributable profit | |
Strategy
In Europe, we are further exploring initiatives to enable greater business integration, and aimed at obtaining additional synergies in the medium-term, leveraging our global capabilities to strengthen operational efficiency in the region. For example:
• | Integration of the different technological platforms and acceleration of the digital transformation process, improving customer experience and expanding distribution channels for our products and services. |
• | Simplification of our business, reducing the number of products to gain efficiency and agility but maintaining a full value proposition that is capable of meeting the daily needs of our individual customers and offering tailored solutions for SMEs and large corporates. |
In addition, we are managing regulatory impacts on income and costs.
Business performance
Gross loans and advances to customers (excluding reverse repos) increased by 4%, boosted by SCF (driven by the organic growth in 2019 and the JV in Germany), CIB business, the UK (mortgages) and Poland. Spain was affected by lower balances in institutions, portfolio sales and the fall in mortgages.
Customer deposits (excluding repos) increased 1% year-on-year with rises in all countries except Spain. Mutual funds fell 7%, very impacted by markets, with no material change in customer funds.
Results
Underlying attributable profit amounted to EUR 974 million in the first quarter, 16% less than the previous year. By lines:
• | In an environment of high uncertainty derived from the health crisis, total income dropped 5%. Net interest income was 4% lower, impacted by Spain (smaller ALCO portfolio, average volumes and rates) and the UK (competitive pressure and SVR attrition). Net fee income fell slightly (-1%) whilst gains on financial transactions declined 24%, adversely impacted by CIB. Lastly, decreases in other operating income (-46%) due to lower income from real estate stakes in Spain and higher BFG contribution in Poland. |
• | Costs decreased 3% (-5% in real terms) because of the efficiencies generated and the optimisation processes, mainly in Spain and the UK. |
• | Provisions rose 22%, primarily from higher portfolio sales in SCF in the first quarter of 2019. |
In the quarter, profit dropped 21% mainly due to lower income (NII and gains on financial transactions) affected by lower income from ALCO portfolio sales.
Customers | ||||||
March 2020. Thousands | ||||||
Loyal customers | Digital customers | |||||
 | 9,851 |  | 14,227 | |||
36 | % | /active customers | +6 | % | YoY | |
Activity | ||||||||||
March 2020. EUR billion and % change in constant euros | ||||||||||
+3% | -2% | |||||||||
QoQ | QoQ | |||||||||
653 | 644 | |||||||||
+4% | 0% | |||||||||
YoY | YoY | |||||||||
Gross loans and advances to customers excl. reverse repos | Customer deposits excl. repos + mutual funds | |||||||||
Underlying income statement | |||||||
EUR million and % change in constant euros | |||||||
Q1'20 | / Q4'19 | / Q1'19 | |||||
Revenue | 4,974 | -6 | % | -5 | % | ||
Expenses | -2,712 | -1 | % | -3 | % | ||
LLPs | -556 | +12 | % | +22 | % | ||
PBT | 1,511 | -18 | % | -15 | % | ||
Underlying attrib. profit | 974 | -21 | % | -16 | % | ||
30 | | January - March 2020 |
SPAIN | ||
 | Highlights | |
Given the COVID-19 health crisis, Santander España was the first entity to offer a EUR 20 billion fund to cover SMEs' short-term liquidity needs and launched an ICO-COVID-19 credit line for the tourism and hospitality industry. In addition, other measures were implemented to promote financing for individuals. | ||
• In corporates, focus on loans with ICO guarantee, in which we have already granted EUR 9.6 billion in around 60,000 operations.• Underlying attributable profit in the first quarter was EUR 352 million, 1% lower, as net interest income was impacted by lower average balances and lower ALCO portfolios, which were offset by cost reduction and improved cost of funding (-8 bps compared to Q1'19). | ||
EUR 352 Mn | ||
Underlying attributable profit | ||
Commercial activity
• | Positive commercial dynamism with double-digit production growth up to mid-March in all segments and products, ending the quarter with a 14% year-on-year increase despite the COVID-19 impact. |
• | Residential mortgage activity increased 15% year-on-year, boosted by the launch of the new flexible contracting modules. Subsequently, the priority shifted to the Plan Ayuda a las personas, as a part of the holiday repayment actions for vulnerable customers. |
• | Our digital capabilities enabled us to provide all our services in an environment of fewer open branches and with a record growth in the number of digital customers in the quarter (+139,000) and in the number of accesses to digital channels (99 million in March). |
• | We continue to drive digitalisation, enabling customers to take out support plans and legal repayment holidays digitally and the launch of Financia&Go, the first fully digital invoice financing service for SMEs and self-employed workers on external platforms, fully digital confirming procurement process and car renting though online banking for individuals. |
Business performance
Gross loans and advances to customers (excluding reverse repos) dropped 4% year-on-year. Loans grew in the quarter due to an increase of close to EUR 3 billion in March, notably SMEs and corporates. Significant decreases in loans to individuals, new mortgage lending and consumer lending.
In customer funds, deposits declined mainly dampened by institutions. Mutual funds decreased highly impacted by the markets performance and capturing was flat.
Results
Underlying attributable profit in the first quarter amounted to EUR 352 million, 1% lower year-on-year. By lines:
• | Total income fell 4%, mainly driven by net interest income due to smaller ALCO portfolio and lower stock in wholesale banking. Lower income from real estate stakes were partially offset by higher gains on financial transactions. |
• | Cost reduction efforts were reflected in an 8% decrease year-on-year, delivering on our efficiency plan. |
• | Controlled loan-loss provisions. The NPL ratio fell 41 bps year-on-year to 6.88%. |
Compared to the fourth quarter of 2019, profit declined mainly due to higher provisions, which were far below average in the previous quarter.
Customers | ||||||
March 2020. Thousands | ||||||
Loyal customers | Digital customers | |||||
| 2,535 | | 4,860 | |||
32 | % | /active customers | +6 | % | YoY | |
Activity | ||||||||||
March 2020. EUR billion and % change | ||||||||||
-5% | ||||||||||
+1% | QoQ | |||||||||
QoQ | ||||||||||
192 | 294 | |||||||||
-4% | -4% | |||||||||
YoY | YoY | |||||||||
Gross loans and advances to customers excl. reverse repos | Customer deposits excl. repos + mutual funds | |||||||||
Underlying income statement | |||||||
EUR million and % change | |||||||
Q1'20 | / Q4'19 | / Q1'19 | |||||
Revenue | 1,789 | -1 | % | -4 | % | ||
Expenses | -944 | -3 | % | -8 | % | ||
LLPs | -253 | +44 | % | +5 | % | ||
PBT | 487 | -13 | % | +2 | % | ||
Underlying attrib. profit | 352 | -12 | % | -1 | % | ||
January - March 2020 | | 31 |
SANTANDER CONSUMER FINANCE | ||
 | Highlights (changes in constant euros) | |
All our units have taken measures to protect employees during the COVID-19 crisis. We are adapting to this new situation with a proactive management, to ensure the continuity of our service in branches and call centres and to continue to assist and support customers, dealers and providers affected by the health crisis. | ||
• The crisis has significantly impacted the consumer business in the quarter, particularly in Italy and Spain, which was reflected in the 5% fall in new lending year-on-year.• Underlying attributable profit of EUR 304 million, 5% lower year-on-year. The positive performance of total income (net interest income) was offset by higher costs (perimeter) and provisions (lower portfolio sales). | ||
EUR 304 Mn | ||
Underlying attributable profit | ||
Commercial activity
SCF business model is based on geographic diversification, scale, leadership in efficiency and and a better risk control and recovery system than its competitors, which enables business growth maintaining good credit quality.
We continued to focus on remaining the leader in auto finance and increasing consumer finance by boosting digital channels. To this end, we made an offer in the quarter to acquire up to 50% of Sixt Leasing, which will enable us to grow our leasing activity across Europe, and launched a joint consumer finance operation with Telecom Italia Mobile for its 25 million customers in Italy.
Business performance
Up to February, before the impact of COVID-19, new lending rose 2% compared to the 7% drop in new car sales in Europe.
However, the falls in activity registered in March as a consequence of COVID-19, caused new lending in the quarter to fall 5% year-on-year (new car sales -26% year-on-year). The largest falls were recorded in Italy (-17%) and Spain (-16%), more affected by the isolation measures and decreased activity in recent weeks (10%-20% of usual volumes). In Germany it fell to 50%-70% and only the Nordic countries maintained its regular levels. The stock of credit rose 7% year-on-year.
It should be noted than in China, the first country affected, our financial entity reduced new lending by 83% when the confinement started, although in recent weeks it has almost recovered its usual levels.
Customer deposits excluding repos increased 7% year-on-year and continued to be a product that sets Santander apart from its competitors.
Results
Underlying attributable profit of EUR 304 million in the first quarter, 5% lower than in the same period of 2019:
• | Growth in net interest income (+5% driven by increased volumes) was partially mitigated by fees (European Court of Justice judgement regarding refunding fees to customers who repay loans early). |
• | Costs increased 2% mainly due to perimeter. Excluding this impact, they fell EUR 17 million (-3%) benefiting from the efficiency projects carried out in several units. |
• | Cost of credit remained low for this type of business (0.52%). The 14 bps increase year-on-year was due to portfolio sales and some positive one-offs in the previous year (excluding these impacts the cost of credit would be similar). The NPL ratio stood at 2.43%, 10 bps higher compared to March 2019. |
• | The largest contribution to the underlying attributable profit came from Germany (EUR 84 million), the Nordic countries (EUR 55 million) and Spain (EUR 43 million). |
Compared to the previous quarter, underlying attributable profit fell 4% affected by lower portfolio sales and higher perimeter costs, which were not fully reflected in net interest income, which rose 2%.
Customer loan distribution | |
March 2020 | |
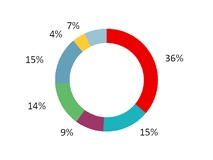
n | Germany |
n | Spain |
n | Italy |
n | France |
n | Nordic countries |
n | Poland |
n | Other |
Activity | ||||||||||
March 2020. EUR billion and % change in constant euros | ||||||||||
0% | ||||||||||
QoQ | -10% | |||||||||
103 | QoQ | |||||||||
+7% | -5% | |||||||||
YoY | 10 | YoY | ||||||||
Gross loans and advances to customers excl. reverse repos | New lending | |||||||||
Underlying income statement | |||||||
EUR million and % change in constant euros | |||||||
Q1'20 | / Q4'19 | / Q1'19 | |||||
Revenue | 1,171 | -1 | % | +1 | % | ||
Expenses | -514 | +3 | % | +2 | % | ||
LLPs | -172 | +18 | % | +44 | % | ||
PBT | 528 | +5 | % | -5 | % | ||
Underlying attrib. profit | 304 | -4 | % | -5 | % | ||
32 | | January - March 2020 |
UNITED KINGDOM | ||
 | Highlights (changes in constant euros) | |
In response to the COVID-19 crisis, we are focused on supporting individuals and businesses. We introduced payment holidays for mortgages and on credit cards and loans, while delivering tailored solutions to business and corporate customers. With our strong foundations, including capital and liquidity, we believe we will continue to be able to support our people, customers and communities. | ||
• Business activity remained solid in the quarter, with growth in mortgages, increased digital customers and a loyalty ratio of nearly 32% as we continue to focus on improving customer experience and strengthen our franchise.• Underlying attributable profit was 27% lower than the first three months of 2019, reflecting the ongoing mortgage margin pressure and SVR attrition. | ||
EUR 188 Mn | ||
Underlying attributable profit | ||
Commercial activity
We continue to focus on building stronger customer relationships and a seamless customer experience. Our purpose to help people and businesses prosper remains unchanged. As a result, the number of loyal customers continued to grow year-on-year as well as digital customer which reached almost 6 million.
We are focused on helping first time buyers while continuing to increase simplicity and ease of online mortgage services.
This quarter we achieved strong net mortgage growth driven by end 2019 new business flows, helping reinforce our Top 3 position. However, at the end of the quarter there was a marked slowdown in mortgage activity related to the COVID-19 lockdown of the UK economy, which is expected to continue.
In Corporate & Commercial Banking new business was up GBP 1.1 bn in Q1’20, with lower business as usual flows offset by COVID-19 demand for extended credit facilities.
Our strategic transformation programme which commenced in 2019, to simplify and digitise the business continues.
Business performance
Gross loans and advances to customers (excluding reverse repos) increased 5% compared to March 2019 driven by the aforementioned strong residential retail mortgage activity from late 2019.
Customer funds were up 4% year-on-year, strongly backed by the 4% increase in deposits.
Results
Underlying attributable profit in the first three months of 2020 of EUR 188 million, down 27% year-on-year (in constant euros):
• | Total revenue 10% lower due to competitive pressures and SVR attrition and net fee income reduction in part driven by overdrafts. |
• | Costs reduced 5%, reflecting lower staff costs and efficiency savings from our 2019 transformation actions. |
• | Loan-loss provisions fell 20%, the cost of credit remained at very low levels (9 basis points) and the NPL ratio decreased to 0.96%, supported by prudent approach to risk management. |
Compared to the fourth quarter of 2019, underlying attributable profit fell by 24%, as the improvement in LLPs and flat costs were not enough to offset the reductions in total income.
Customers | ||||||
March 2020. Thousands | ||||||
Loyal customers | Digital customers | |||||
| 4,543 | | 5,962 | |||
32 | % | /active customers | +6 | % | YoY | |
Activity | ||||||||||
March 2020. EUR billion and % change in constant euros | ||||||||||
+2% | 0% | |||||||||
QoQ | QoQ | |||||||||
244 | 210 | |||||||||
+5% | +4% | |||||||||
YoY | YoY | |||||||||
Gross loans and advances to customers excl. reverse repos | Customer deposits excl. repos + mutual funds | |||||||||
Underlying income statement | |||||||
EUR million and % change in constant euros | |||||||
Q1'20 | / Q4'19 | / Q1'19 | |||||
Revenue | 1,098 | -10 | % | -10 | % | ||
Expenses | -714 | 0 | % | -5 | % | ||
LLPs | -49 | -49 | % | -20 | % | ||
PBT | 260 | -24 | % | -28 | % | ||
Underlying attrib. profit | 188 | -24 | % | -27 | % | ||
January - March 2020 | | 33 |
PORTUGAL | ||
 | Highlights | |
In the environment deriving from the COVID-19 pandemic, the Bank is focusing on supporting society and the economy, with measures to mitigate the effects on households and businesses, especially in terms of liquidity. | ||
• Loans rose 2% year-on-year, benefiting from the increase recorded in the quarter.• Underlying attributable profit decreased 11% year-on-year due to net interest income and the recovery of provisions in the first quarter of 2019. Net operating income remained flat. | ||
EUR 120 Mn | ||
Underlying attributable profit | ||
Commercial activity
The Bank continued with its strategy of offering products and services tailored to customer needs, but adapting it to the health emergency environment:
• | Some of the specific measures adopted to support our customers are: temporary suspension of fees for payment methods, a six-month repayment holiday on loans to individuals, households and businesses, and a rapid participation in credit lines set up by the government to support businesses. |
• | The digital transformation carried out in recent years has enabled the teams to work remotely and to maintain business continuity and the smooth running of the Bank. |
The weight of loyal and digital customers as a percentage of active customers continued to increase, accounting for 46% and 47%, respectively, and digital sales were also strengthened.
Santander was named as Best Bank in Portugal 2020 by Global Finance.
Santander Totta maintained the best risk ratings by the rating agencies, aligned with or above the sovereign’s.
Business performance
Loans and advances to customers rose 2% year-on-year, underpinned by increased new lending to corporates and mortgages in March.
Customer funds were 3% higher year-on-year driven by growth in deposits and mutual funds.
Results
The first quarter underlying attributable profit decreased 11% year-on-year to EUR 120 million:
• | Net interest income fell 6% dampened by lower average interest rates. This fall was offset by the increase in net fee income (+3%), higher ALCO portfolio sales and cost reduction (-4%), which enabled the efficiency ratio to improve to 43.1% and total income to remain stable. |
• | Profit fell adversely impacted by loan-loss provisions, as recoveries from a specific customer were recorded in the first quarter of 2019. The NPL ratio improved to 4.56% and the cost of credit stood at around 0%. |
Compared to the previous quarter, underlying attributable profit decreased 14%. The strong revenue growth driven by ALCO portfolio sales did not offset the contribution to the Single Resolution Fund and the National Contribution Fund in this quarter, and the capital gains from real estate sales in the fourth quarter.
Customers | ||||||
March 2020. Thousands | ||||||
Loyal customers | Digital customers | |||||
| 782 | | 797 | |||
46 | % | /active customers | +5 | % | YoY | |
Activity | ||||||||||
March 2020. EUR billion and % change | ||||||||||
-2% | ||||||||||
+3% | QoQ | |||||||||
QoQ | ||||||||||
37 | 42 | |||||||||
+2% | +3% | |||||||||
YoY | YoY | |||||||||
Gross loans and advances to customers excl. reverse repos | Customer deposits excl. repos + mutual funds | |||||||||
Underlying income statement | |||||||
EUR million and % change | |||||||
Q1'20 | / Q4'19 | / Q1'19 | |||||
Revenue | 350 | +6 | % | -2 | % | ||
Expenses | -151 | -3 | % | -4 | % | ||
LLPs | -5 | +31 | — | ||||
PBT | 173 | -10 | % | -11 | % | ||
Underlying attrib. profit | 120 | -14 | % | -11 | % | ||
34 | | January - March 2020 |
POLAND | ||
 | Highlights (changes in constant euros) | |
In the last three weeks of March, and regarding the emergency situation derived from the COVID-19 outbreak, the Bank took several actions to protect customers and employees, both regarding health and business. The suspension of capital repayments for cash loans, mortgages and SME loans was announced and implemented on 19 March. Other examples include temporary free of charge withdrawals from other ATM networks. | ||
• The Bank’s strategy to be the bank of first choice continues, predicting and responding to customer expectations. In addition, Santander Bank Polska was awarded 5 stars for Santander Private Banking in the prestigious Forbes ranking.• In the first three months, underlying attributable profit was EUR 38 million, 38% less than in the same period of 2019, impacted by the greater BFG and Banking Tax contributions and provisions related to regulatory changes. | ||
EUR 38 Mn | ||
Underlying attributable profit | ||
Commercial activity
In January and February 2020, the Bank recorded strong sales growth, including digital sales. Business in March showed signs of a slowdown due to the COVID-19 crisis. In mid-March, Santander Bank Polska started implementing processes and product solutions in response to the pandemic in Poland. The Bank is able to provide solutions to support our customers in the new reality. The Group provides services to all channels while promoting the use of the digital ones.
In March, due to the COVID-19 outbreak, the Bank intensified the promotion of the use of digital channels among customers. Close to 50% of total sales were digital (+ 3.3 pp versus 2019), with over 65% of credit card sales made through remote channels. The opening of personal accounts through digital channels recorded a fourfold rise, and those from SMEs were 12 times higher than in 2019.
Business performance
Loans rose 9% year-on-year, driven by all the Bank’s target segments. Strong volume growth in CIB (+23%) and consumer loans (+20%). SMEs grew at a slower pace (+10%).
Deposits grew 8% year-on-year. Deposits were 7% higher and SME deposits increased by 27%. CIB’s deposit base showed an annual decrease of 41%. The Group continued to actively manage its deposit base to optimise the cost of funding.
Results
Underlying attributable profit in the first quarter was EUR 38 million, 38% lower than in the same period of 2019:
• | Total income fell 3%. Net interest income up 6% year-on-year, mainly due to the adjustment of the cost of deposits and by the changes in the loan mix towards more profitable products, partially offset by a change in regulations regarding earlier repayments of consumer loans. Net fee income was 3% higher driven by SCIB. These increases were offset by lower gains on financial transactions due to the fall in markets and the higher BFG contribution. |
• | Costs remained virtually unchanged, and the efficiency ratio stood at 47.1%. |
• | Loan-loss provisions increased 57% year-on-year, mainly due higher charges in the retail and a single name in CIB. |
• | Other income was affected by the higher Banking Tax contribution and regulatory changes regarding consumer loans. |
Compared to the previous quarter, underlying attributable profit was down 63%, impacted by lower gains on financial transactions, higher provisions and the aforementioned regulatory factors.
Customers | ||||||
March 2020. Thousands | ||||||
Loyal customers | Digital customers | |||||
| 1,992 | | 2,607 | |||
52 | % | /active customers | +9 | % | YoY | |
Activity | ||||||||||
March 2020. EUR billion and % change in constant euros | ||||||||||
+4% | -2% | |||||||||
QoQ | QoQ | |||||||||
30 | 35 | |||||||||
+9% | +4% | |||||||||
YoY | YoY | |||||||||
Gross loans and advances to customers excl. reverse repos | Customer deposits excl. repos + mutual funds | |||||||||
Underlying income statement | |||||||
EUR million and % change in constant euros | |||||||
Q1'20 | / Q4'19 | / Q1'19 | |||||
Revenue | 365 | -20 | % | -3 | % | ||
Expenses | -172 | +2 | % | 0 | % | ||
LLPs | -68 | +35 | % | +57 | % | ||
PBT | 90 | -56 | % | -29 | % | ||
Underlying attrib. profit | 38 | -63 | % | -38 | % | ||
January - March 2020 | | 35 |
NORTH AMERICA | |
 | Highlights (changes in constant euros) • In North America, the US and Mexico are managed according to their local strategic priorities, while increasing coordination and cooperation between the two units.• In volumes, there was strong year-on-year volume growth, both in gross loans and advances to customers and in customer funds (double-digit growth).• In results, underlying attributable profit increased 34% year-on-year, driven mainly by customer revenue, improved efficiency and reduced non-controlling interests. |
EUR 522 Mn | |
Underlying attributable profit | |
Strategy
In the United States, SBNA's strategy focuses on improving customer satisfaction through digital channels and branches, while continuing to develop the Lead Bank initiative in corporate banking. In SC USA, focus is on managing the relation between profitability, through pricing, and risk, while improving the dealer experience. In Mexico, we remained focused on strengthening the distribution network and developing digital channels with the aim to attract new customers and increase loyalty.
Coordination between the countries has increased as we continue to pursue join initiatives, such as:
• | Continued development of the USMX trade corridor. SCIB and Commercial Banking are working to deepen relationships with existing clients and increase client acquisition in both countries, which is reflected in corridor revenue growth (SCIB: +38%; Commercial: +23%). |
• | Commission-free same-day remittance service from Santander US branches to any bank in Mexico. At the same time, ongoing development of other payment alternatives for the USMX trade corridor, such as PagoFX. |
• | Joint technology programmes between the two countries. |
Business performance
Gross loans and advances to customers (excluding reverse repos) increased 13% with similar growth in both countries, after the strong increases recorded in March.
Customer funds also presented a solid year-on-year performance (+15%) driven by growth in demand deposits in SBNA, corporate loans in the New York branch and deposits in Mexico. Mutual funds remained stable.
Results
In the first quarter, underlying attributable profit amounted to EUR 522 million, 34% higher year-on-year:
• | Positive total income performance in both markets, with rises in net interest income (+2%) and net fee income (+4%). |
• | Costs grew at a slower pace than income, enabling the efficiency ratio to improve to 41.7% (89 bp better than in the same period of 2019). Cost control in the US (-1% in real terms) and year-on-year increase in Mexico, although stable compared to previous quarters. |
• | Loan-loss provisions rose 6% driven mainly by higher volumes. The NPL ratio improved to 2.02%, coverage rose to 158% and the cost of credit improved to 2.75%. |
Compared to the previous quarter, underlying attributable profit surged 37% through customer revenue growth, lower costs and decreased provisions, seasonally higher in the US in the fourth quarter.
Customers | ||||||
March 2020. Thousands | ||||||
Loyal customers | Digital customers | |||||
| 3,628 | | 5,467 | |||
32 | % | /active customers | +30 | % | YoY | |
Activity | ||||||||||
March 2020. EUR billion and % change in constant euros | ||||||||||
+4% | ||||||||||
QoQ | +12% | |||||||||
QoQ | ||||||||||
132 | 120 | |||||||||
+13% | +15% | |||||||||
YoY | YoY | |||||||||
Gross loans and advances to customers excl. reverse repos | Customer deposits excl. repos + mutual funds | |||||||||
Underlying income statement | |||||||
EUR million and % change in constant euros | |||||||
Q1'20 | / Q4'19 | / Q1'19 | |||||
Revenue | 2,936 | 0 | % | +5 | % | ||
Expenses | -1,224 | -6 | % | +2 | % | ||
LLPs | -874 | -17 | % | +6 | % | ||
PBT | 824 | +52 | % | +14 | % | ||
Underlying attrib. profit | 522 | +37 | % | +34 | % | ||
36 | | January - March 2020 |
UNITED STATES | ||
 | Highlights (changes in constant euros) | |
We have implemented specific measures to continue to support our stakeholders throughout the COVID-19 pandemic, such as: temporary payment and mortgage and home equity line of credit foreclosures suspension at the retail network, USD 25 million in loans to Community Development Financial Institutions for small business loans, additional paid leave and pay premiums for certain employees. SC USA expanded payment deferrals, waived late charges and easing extensions for lessees unable to return their vehicles. | ||
• In volumes, the improved year-on-year trend in gross loans and advances to customers excluding reverse repos continues to drive higher revenue to help offset the impact of rate decreases. • Underlying attributable profit increased 46% compared to the same period of 2019, driven by higher revenues and lower provisions. | ||
EUR 273 Mn | ||
Underlying attributable profit | ||
Commercial activity
Santander US remains focused on the following strategic priorities:
Santander Bank: Support customers, employees and communities during COVID-19 crisis; while continuing the digital and branch transformation initiatives that remain key to enhancing customer experience and growing consumer customers and deposits. SBNA continues to enhance its auto finance partnership with SC USA focused on Prime loans.
Santander Consumer USA: The key focus is to continue to support employees, customers, communities impacted by COVID-19, as well as dealers, while remaining disciplined on price in an environment with reduced demand.
Business performance
Gross loans and advances to customers (excluding reverse repos) improved 12% year-on-year due to lending growth in retail banking (auto) and commercial banking. Despite the current unfavorable environment, originations remained stable year-on-year, however due to COVID-19 and shelter-in-place orders, auto manufacturers and many dealerships have closed nationwide, reducing auto financing demand, driving lower applications and volume.
Customer funds presented a strong growth year-on-year (+18%) boosted by demand deposits at SBNA and corporate deposits at the New York branch.
Results
Underlying attributable profit in the first quarter was 273 million, up 46% against the same period of 2019.
• | Total revenue up 3% due to higher loan and leasing volumes, increased net fee income and positive gains on financial transactions performance, which offset lower interest rates. |
• | Controlled costs, with efficiency ratio improvement to 41.9%. |
• | Loan-loss provisions increased 3%, well below balance growth, improving the cost of credit to 2.81% and the NPL ratio to 2.00%. |
Compared to the previous quarter, underlying attributable profit 181% higher, boosted mainly by seasonally lower loan-loss provisions and lower costs in the first quarter.
Customers | ||||||
March 2020. Thousands | ||||||
Loyal customers | Digital customers | |||||
| 328 | | 1,019 | |||
19 | % | /active customers | +6 | % | YoY | |
Activity | ||||||||||
March 2020. EUR billion and % change in constant euros | ||||||||||
+3% | ||||||||||
QoQ | +10% | |||||||||
QoQ | ||||||||||
101 | 82 | |||||||||
+12% | +18% | |||||||||
YoY | YoY | |||||||||
Gross loans and advances to customers excl. reverse repos | Customer deposits excl. repos + mutual funds | |||||||||
Underlying income statement | |||||||
EUR million and % change in constant euros | |||||||
Q1'20 | / Q4'19 | / Q1'19 | |||||
Revenue | 1,929 | +1 | % | +3 | % | ||
Expenses | -809 | -7 | % | 1 | % | ||
LLPs | -646 | -22 | % | +3 | % | ||
PBT | 468 | +199 | % | +23 | % | ||
Underlying attrib. profit | 273 | +181 | % | +46 | % | ||
January - March 2020 | | 37 |
MEXICO | ||
 | Highlights (changes in constant euros) | |
In response to the spread of COVID-19, we have laid out support measures for our customers, such as repayment holiday on loans, credit cards and mortgages, interest-free financing for online supermarket purchases and in pharmacies, laboratories and hospitals. In addition, branch services maintained, although with minimum staffing. Our digital channels and contact centres continue to operate normally. | ||
• Gross loans and advances to customers (excluding reverse repos) increased 13% year-on-year, particularly corporates, CIB and mortgages and customer funds rose 10%, both driven by the strong growth in March due to greater liquidity demand from our customers given the current situation.• Underlying attributable profit rose 22% year-on-year, backed by the sound performance of total income and reduced non-controlling interests, following the increased stake in the second half of 2019. | ||
EUR 249 Mn | ||
Underlying attributable profit | ||
Commercial activity
The commercial strategy continued to focus on improving the distribution model and boosting digital channels to increase customer attraction and loyalty with new products and services:
• | We continued to develop our distribution model with the transformation of 560 branches and 1,138 full function ATMs. |
• | Santander Plus reached 6.8 million customers (52% new). |
• | Launch of the first numberless credit card, becoming the first bank in Mexico to offer this card model, without revealing sensitive data and providing greater security to our customers. |
• | We also began to register customers’ biometric data to make their transactions more secure, by facial and fingerprint scanning. |
• | Alliance with Mazda to become its main partner in auto financing, progressing towards the consolidation in this segment. |
• | We continued to boost customer deposits with the launch of the new version of the Arma tu Kit campaign, which continues to reward customers who increase their balances and use digital banking. |
• | These measures resulted in a strong year-on-year increase in the number of loyal and digital customers (24% and 38% respectively). |
Business performance
Gross loans and advances to customers (excluding reverse repos) increased 13% year-on-year. Of note were corporate loans (+16%) and CIB (+27%). Individuals rose 5%, driven by mortgages (+13%), credit cards (+6%) and payrolls (+8%).
Customer funds increased 10%. Demand deposits were 12% higher, with growth in individuals and corporates and time deposits rose 15% (notably corporates at 22%). Growth in deposits continued to reflect the positive performance of our customer attraction and loyalty strategy. Mutual funds remained broadly unchanged.
Results
Underlying attributable profit in the first quarter was of EUR 249 million, 22% higher than in the same period of 2019:
• | Net interest income rose 5%, underpinned by higher volumes . Net fee income grew 4% mainly from financial advisory services and restructuring, transactional banking and cards. Gains on financial transactions increased benefiting from the weak markets activity in the first quarter of 2019. |
• | Operating expenses were up due to increased amortisations and higher technology investments. |
• | Loan-loss provisions surged 18% compared to the first quarter of 2019, which was affected by a mortgage portfolio sale. Good credit quality in all metrics. |
Compared to the fourth quarter of 2019, underlying attributable profit fell 12% due to the high gains on financial transactions recorded in the previous quarter and higher loan-loss provisions.
Customers | ||||||
March 2020. Thousands | ||||||
Loyal customers | Digital customers | |||||
| 3,300 | | 4,448 | |||
34 | % | /active customers | +38 | % | YoY | |
Activity | ||||||||||
March 2020. EUR billion and % change in constant euros | ||||||||||
+14% | ||||||||||
+9% | QoQ | |||||||||
QoQ | ||||||||||
31 | 38 | |||||||||
+13% | +10% | |||||||||
YoY | YoY | |||||||||
Gross loans and advances to customers excl. reverse repos | Customer deposits excl. repos + mutual funds | |||||||||
Underlying income statement | |||||||
EUR million and % change in constant euros | |||||||
Q1'20 | / Q4'19 | / Q1'19 | |||||
Revenue | 1,007 | -2 | % | +8 | % | ||
Expenses | -415 | -4 | % | +5 | % | ||
LLPs | -228 | +6 | % | +18 | % | ||
PBT | 357 | -7 | % | +4 | % | ||
Underlying attrib. profit | 249 | -12 | % | +22 | % | ||
38 | | January - March 2020 |
SOUTH AMERICA | |
 | Highlights (changes in constant euros) • The banks in the different countries have implemented contingency plans for the COVID-19 crisis. They continue to operate and meet the demands and needs of our customers, with different products and services to help them financially.• The focus remained on the integration of the region, through a wide range of products and services, with a strategy oriented to deliver profitable growth, improve customer satisfaction and loyalty as well as risk control.• We continued to capture business opportunities, exchanging positive experiences across countries, for example in payment methods, consumer finance and microfinance.• Underlying attributable profit increased by 15% year-on-year backed by net interest income, net fee income and improved efficiency. RoTE of 21.1%. |
EUR 928 Mn | |
Underlying attributable profit | |
Strategy
We continued to capture synergies across businesses in the region:
• | In auto financing, we are exporting our experience in Brazil, which maintained its leadership in the country, expanding its business model to other countries. In Peru, for example, we increased our presence in this type of business, while increasing business profitability in Colombia through our digital proposition and strategic alliances. |
• | In terms of financing goods and services, Uruguay continued to lead the local market, increasing its market share and business activity. Colombia, in turn, continued to diversify its business alliances. We also exported the model, successfully in Uruguay and Brazil, to other countries. |
• | Prospera, our micro-credit programme to satisfy the demand for small businesses in Brazil, continued expand in Uruguay as well. |
• | In payment methods, we focused on e-commerce strategies and instant transfers. We are rolling out Getnet, our acquiring business in Brazil, and plan to further expand it to the rest of Latin America. As regards Superdigital, it is already showing positive results in Chile, attracting customers for its transactionality and digital platform. |
• | We remained focused on enhancing our products and services digitally. Sales through digital channels already account for a high percentage of the total in Brazil and Argentina, and continued to grow in Chile. |
Business performance
Gross loans and advances to customers (excluding reverse repos) increased 16% year-on-year, with double-digit growth in all countries.
Customer deposits rose 24%, with all countries growing at double-digit rates in both demand and time deposits. Mutual funds rose 5%.
Results
Underlying attributable profit in the first quarter amounted to EUR 928 million, up 15% year-on-year:
• | Total income increased 8%, underpinned by the sound performance of net interest income (+11%) and net fee income (+7%). |
• | Costs rose 7%, at a slower pace than income, enabling efficiency to improve 97 bps to 35.7%. |
• | Provisions increased 13% driven by the rises in Brazil and Chile, partially offset by the decrease in Argentina. In credit quality, the NPL ratio improved 20 bps to 4.63%, coverage was 86% and cost of credit of 2.94%. |
In the quarter, underlying attributable profit was 4% higher driven by lower costs, seasonally higher in the fourth quarter, and lower provisions.
Customers | ||||||
March 2020. Thousands | ||||||
Loyal customers | Digital customers | |||||
| 7,756 | | 17,762 | |||
25 | % | /active customers | +12 | % | YoY | |
Activity | ||||||||||
March 2020. EUR billion and % change in constant euros | ||||||||||
+5% | ||||||||||
+7% | QoQ | |||||||||
QoQ | ||||||||||
118 | 148 | |||||||||
+16% | +16% | |||||||||
YoY | YoY | |||||||||
Gross loans and advances to customers excl. reverse repos | Customer deposits excl. repos + mutual funds | |||||||||
Underlying income statement | |||||||
EUR million and % change in constant euros | |||||||
Q1'20 | / Q4'19 | / Q1'19 | |||||
Revenue | 4,163 | -7 | % | +8 | % | ||
Expenses | -1,486 | -12 | % | +7 | % | ||
LLPs | -875 | -8 | % | +13 | % | ||
PBT | 1,661 | +4 | % | +7 | % | ||
Underlying attrib. profit | 928 | +4 | % | +15 | % | ||
January - March 2020 | | 39 |
BRAZIL | ||
 | Highlights (changes in constant euros) | |
In response to the expansion of COVID-19, we have launched a series of initiatives to guarantee the health of our employees (between 50-80% of the workforce are telecommuting, bringing forward the additional salary payment from November to April, closure of some branches...) and the service to our customers (adapted opening hours, anticipation of liquidity, greater digital support...) and to society (volunteer programme, donations from the bank and employees...). | ||
• We continued with our sustainable growth strategy focused on customer service, capturing business opportunities in the market in an innovative way and the relentless search for operational excellence, committed to our people, customers, communities and shareholders.• Underlying attributable profit was 10% higher year-on-year, with improved efficiency and reflecting recurrence in profit generation, even in the current worsened environment. RoTE of 22.0%. | ||
EUR 694 Mn | ||
Underlying attributable profit | ||
Commercial activity
We continued to progress in our strategic actions in the quarter. Of note were:
• | We continued to expand to strategic regions in the country through products such as Agribusiness and Prospera Microfinance. We ended the quarter with 36 specialised Agro shops. |
• | In mortgages, we offered financing at a term of more than 30 years. In addition, we continued to drive Usecasa, a product that offers a personal loan using property as collateral. |
• | In acquiring, our strategy is to grow while maintaining profitability. This quarter we delivered a solid increase in the active customer base. We also installed new POS terminals and reached 1.4 million. In cards, we increased credit limit by 10% and we launched a new card together with a leading Latin American travel company. |
• | We also launched Consignado Folha, a credit line to finance SMEs payrolls with a grace period of 60 days. |
• | Santander Brasil was awarded the ECO Prize by Amcham Brasil and the Estadão newspaper, which recognised the Bank's responsible work with Prospera Santander Microfinanzas. |
Business performance
Gross loans and advances to customers excluding reverse repos grew 18% year-on-year. Of note was growth in the corporate and CIB segments following the strong increases recorded in the quarter. As in other countries, new lending started to fall.
Customer deposits excluding repos increased 21%, with rises in both demand deposits (+31%) and time deposits (+17%). Strong growth in the quarter as well. Mutual funds rose 3% year-on-year.
Results
First quarter underlying attributable profit of EUR 694 million (+10% year-on-year). Of note:
• | Total income rose 5% boosted by net interest income (+6% driven by larger volumes which offset margin pressures due to mix effect) and net fee income (+7%), led largely by cards. |
• | Operating expenses increased 2%, well below revenue growth, which enabled the efficiency ratio to improve by 98 bps to 32.0%. |
• | Net loan-loss provisions increased 14%, below loan growth, maintaining high levels of credit quality: the cost of credit was 3.93%, the NPL ratio improved to 4.93% and the coverage ratio stood at 100%. |
In the quarter, underlying attributable profit rose 8% driven by lower costs and provisions, after a seasonally higher fourth quarter.
Customers | ||||||
March 2020. Thousands | ||||||
Loyal customers | Digital customers | |||||
| 5,673 | | 13,828 | |||
22 | % | /active customers | +13 | % | YoY | |
Activity | ||||||||||
March 2020. EUR billion and % change in constant euros | ||||||||||
+2% | ||||||||||
+9% | QoQ | |||||||||
QoQ | ||||||||||
69 | 98 | |||||||||
+18% | +12% | |||||||||
YoY | YoY | |||||||||
Gross loans and advances to customers excl. reverse repos | Customer deposits excl. repos + mutual funds | |||||||||
Underlying income statement | |||||||
EUR million and % change in constant euros | |||||||
Q1'20 | / Q4'19 | / Q1'19 | |||||
Revenue | 3,137 | -5 | % | +5 | % | ||
Expenses | -1,004 | -13 | % | +2 | % | ||
LLPs | -709 | -6 | % | +14 | % | ||
PBT | 1,298 | +6 | % | +5 | % | ||
Underlying attrib. profit | 694 | +8 | % | +10 | % | ||
40 | | January - March 2020 |
CHILE | ||
 | Highlights (changes in constant euros) | |
In response to the spread of COVID-19, Santander Chile carried out various measures to ensure the welfare of customers and employees. In the first case, the Bank designed a plan to benefit more than 500,000 customers, providing support to the consumer, mortgage, SME and business portfolios of around USD 6 billion. In the second case, around 7,100 employees are telecommuting (65% of total workforce). | ||
• Gross loans and advances to customers (excluding reverse repos) increased, with a positive performance in the past month mainly due to corporates. Demand deposits rose 30% year-on-year and growth in account openings hit a record high in March.• Underlying attributable profit decreased 2% year-on-year, due to lower gains on financial transactions and increased provisions (greater ALCO portfolio sales and releases in Q1'19). | ||
EUR 125 Mn | ||
Underlying attributable profit | ||
Commercial activity
Continued focus on transformation in order to increase new customer attraction and loyalty, maintaining a strategy aimed at offering attractive returns based on our digital transformation:
• | We continued to boost the Santander Life programme, which is centred on promoting good credit behaviour and financial education, reaching more than 165,000 customers. |
• | Since its recent launch, Superdigital has exceeded 26,000 customers because of its high transactionality and digital platform. |
All these measures led to a strong year-on-year increase in digital customers (+21%).
Business performance
Gross loans and advances to customers (excluding reverse repos) increased 13% year-on-year, spurred by the increase in new lending to corporates and large corporates in March.
Customer funds reflected a better funding mix. Current accounts continued to rise strongly across all segments due to increased current account openings and the positive performance in transactional banking. These factors led to a 21% increase in customer funds .
Results
First quarter attributable profit amounted to EUR 125 million, 2% lower year-on-year, as follows:
• | Gross income increased 8% year-on-year backed by net interest income, benefiting from higher inflation, and the positive performance of net fee income, driven by digital account openings and increased transactionality. |
• | Costs rose 6% impacted by supplier contract adjustments stemming from higher inflation. Efficiency improved 88 bp to 41.7%. |
• | Loan-loss provisions increased 22% due to releases in Q1'19 and, to a lesser extent, driven by the first impacts of the health crisis. The NPL ratio stood below 5% and the cost of credit stood at 1.10% |
Compared to the fourth quarter of 2019, underlying attributable profit decreased 15%. Customer revenue rose slightly, with positive performance in costs and provisions which was offset by the sharp fall in gains on financial transactions.
Customers | ||||||
March 2020. Thousands | ||||||
Loyal customers | Digital customers | |||||
| 680 | | 1,316 | |||
44 | % | /active customers | +21 | % | YoY | |
Activity | ||||||||||
March 2020. EUR billion and % change in constant euros | ||||||||||
+5% | +7% | |||||||||
QoQ | QoQ | |||||||||
38 | 34 | |||||||||
+8% | +21% | |||||||||
YoY | YoY | |||||||||
Gross loans and advances to customers excl. reverse repos | Customer deposits excl. repos + mutual funds | |||||||||
Underlying income statement | |||||||
EUR million and % change in constant euros | |||||||
Q1'20 | / Q4'19 | / Q1'19 | |||||
Revenue | 553 | -8 | % | +8 | % | ||
Expenses | -230 | -1 | % | +6 | % | ||
LLPs | -107 | -11 | % | +22 | % | ||
PBT | 216 | -16 | % | -9 | % | ||
Underlying attrib. profit | 125 | -15 | % | -2 | % | ||
January - March 2020 | | 41 |
ARGENTINA | ||
 | Highlights (changes in constant euros) | |
In response to the potential risks arising from the spread of COVID-19, we have put contingency plans in place to contribute to the well-being of all: most employees are working remotely, customer operations are being enhanced through digital means and implemented several measures, such as credit lines for SMEs, aimed at working capital in different segments, purchase medical equipment, technology investments to facilitate telecommuting and to pay salaries. | ||
• We continued to focus on four strategic pillars: profitable growth, customer experience, operational excellence and transformation.• Underlying attributable profit reached EUR 59 million boosted by higher net interest income, improved efficiency and lower provisions. | ||
EUR 59 Mn | ||
Underlying attributable profit | ||
Commercial activity
The commercial strategy is focused on transactional business and customer service improvements, while we continue working on the digital transformation of the main processes and products. The aim is to have increasingly digital platforms integrating the latest technology, which enables us to better know our customers and anticipate their needs.
In addition, we redefined our value proposition, with special focus on priority segments and business communities. During the quarter, we continued to boost the digital transformation of the main processes and products, aiming at simplification, digitalisation and remote onboarding, with the launch of the Onboarding Web service for SMEs.
Our customer centred strategy enabled loyal and digital customers to account for 46% and 80%, respectively, of active customers.
Business performance
Gross loans and advances to customers (excluding reverse repos) rose 16% year-on-year, driven by cards and mortgages. In the quarter, 1% fall due to lower activity.
Customer deposits (excluding repos) rose 37% year-on-year (+24% in the quarter). Local currency deposits grew 75% (demand and time deposits) and foreign currency ones declined.
The Bank maintains high levels of liquidity in both pesos and dollars.
Results
Underlying attributable profit in the first quarter of EUR 59 million (EUR 7 million in the first quarter of 2019).
As regards the year-on-year comparison, of note was:
• | Revenue grew 43%. Net interest income rose 68%, underpinned by the lower cost of funding. Net fee income and gains on financial transactions fell slightly. |
• | Costs increased 37%, hit by high inflation and the peso’s depreciation. The efficiency ratio improved to 58.5%, 263 bps lower than in the first quarter of 2019. |
• | Loan-loss provisions decreased 20%, as there were no relevant impacts from one-offs. The NPL ratio stood at 3.97% and the coverage ratio at 113%. |
In the quarter, underlying attributable profit rose 15% benefiting from cost reduction and lower loan-loss provisions.
Customers | ||||||
March 2020. Thousands | ||||||
Loyal customers | Digital customers | |||||
| 1,299 | | 2,249 | |||
46 | % | /active customers | +7 | % | YoY | |
Activity | ||||||||||
March 2020. EUR billion and % change in constant euros | ||||||||||
+24% | ||||||||||
-1% | QoQ | |||||||||
QoQ | ||||||||||
5 | 10 | |||||||||
+16% | +34% | |||||||||
YoY | YoY | |||||||||
Gross loans and advances to customers excl. reverse repos | Customer deposits excl. repos + mutual funds | |||||||||
Underlying income statement | |||||||
EUR million and % change in constant euros | |||||||
Q1'20 | / Q4'19 | / Q1'19 | |||||
Revenue | 318 | -21 | % | +43 | % | ||
Expenses | -186 | -21 | % | +37 | % | ||
LLPs | -39 | -37 | % | -20 | % | ||
PBT | 79 | +52 | % | +250 | % | ||
Underlying attrib. profit | 59 | +15 | % | +745 | % | ||
42 | | January - March 2020 |
Uruguay
Highlights (changes in constant euros)
• | Santander Uruguay remained as the country’s leading privately-owned bank, with a strategy focused on retail banking and improving efficiency and the quality of service. |
• | Underlying attributable profit rose 14% year-on-year, spurred by increased revenue. Activity grew at a steady pace in the quarter, which enabled us to continue gaining market share. |
Commercial activity and business performance
Santander continued to focus on enhancing customer satisfaction and loyalty and making progress in the digital transformation and channel optimisation. These efforts were reflected in the 15% year-on-year increase in loyal customers, while transactions through digital channels rose 33%. On the other hand, the Group’s financial entities in Uruguay continued leading the local market in consumer credit, with a market share of more than 22%.
In line with our strategy of contributing to people’s progress, we continued to expand Prosperá and Santander Locker, a proposal that simplifies the delivery of our products to our customers. We continued to pursue commercial alliances through an agreement with the country's leading retail group, which places us in a unique position to offer discounts to our customers.
Regarding volumes, gross loans and advances to customer (excluding reverse repos) grew 25%, driven by retail loans in local currency. Customer deposits (excluding repos) grew 41% underpinned by both peso and foreign currency balances.
Results
Underlying attributable profit in the first quarter of 2020 of EUR 35 million, 14% higher year-on-year:
• | Gross income rose 14%, backed by customer revenue and the positive performance of gains on financial transactions, due to exchange rate volatility. |
• | Operating expenses rose at a slower pace than total income, improving the efficiency ratio by 131 bps year-on-year to 41.8%. |
• | Loan-loss provisions increased 42% due to extraordinary recoveries recorded in the first quarter of 2019. High coverage (101%) and cost of credit improved to 2.40% (-32 bps year-on-year). |
Compared to the fourth quarter of 2019, underlying attributable profit dropped 6% due to a higher tax burden, from low levels in the previous quarter.
Peru
Highlights (changes in constant euros)
The strategy remained focused on the corporate segment, the country’s large companies and the Group’s global customers, with an increase in product and team capabilities.
The auto loan financial entity continued to expand its business within the Group’s strategy of increasing its presence in this business.
First quarter attributable profit amounted to EUR 12 million (+33% year-on-year). Total income rose 19% mainly due to higher gains on financial transactions. Costs increased 23% and loan-loss provisions were 43% lower.
The NPL ratio was 0.76%, coverage remained high and cost of credit was 0.07%.
Colombia
Highlights (changes in constant euros)
Activity in Colombia remained focused on SCIB clients, large companies and corporates, contributing solutions in treasury, risk hedging, foreign trade, confirming, custody and development of investment banking products supporting the country’s infrastructure plan. In line with this strategy, Santander Investment Banking in Colombia was named leader in the Project Finance ranking by Inframation Deals, one of the main dedicated platforms in the infrastructure sector.
In auto finance, we continued to increase profitability through our digital proposition, consolidating strategic alliances, seeking to also increase our value offering and customer loyalty through the insurance business. On the other hand, we continued to diversify our commercial alliances for financing goods and services in the health, furniture and transport sectors in the first quarter of 2020.
Gross loans and advances to customers (excluding reverse repos) rose 20% with broad-based growth across all business segments, particularly vehicles (+75%). Customer deposits excluding repos increased 38%.
Underlying attributable profit in the first quarter was EUR 6 million (EUR 2 million in the same period of 2019). Total income grew 97%, primarily backed by both net interest income and net fee income.
January - March 2020 | | 43 |
CORPORATE CENTRE | |||
 | Highlights | ||
In the health crisis environment caused by the spread of COVID-19, the Corporate Centre is playing a critical role in supporting the Group through the corporate crisis committees (Gold, Silver and Bronze). Also, in this context and to protect the health of employees, nearly 100% of the staff is teleworking. | |||
• The Corporate Centre’s objective is to aid the operating units by contributing value and carrying out the corporate function of oversight and control. It also carries out functions related to financial and capital management. • The underlying attributable loss decreased compared to 2019, mainly due to foreign currency hedging. | |||
EUR | -434 Mn | ||
Underlying attributable profit | |||
Strategy and functions
The Corporate Centre contributes value to the Group in various ways:
• | It makes the Group’s governance more solid, through global control frameworks and supervision. |
• | Fostering the exchange of best practices in management of costs and generating economies of scale. This enables us to be one of the most efficient banks. |
• | It contributes to the launch of projects that will be developed by global business areas. |
It also coordinates the relationship with European regulators and supervisors and develops functions related to financial and capital management, as follows:
• | Financial Management functions: |
– | Structural management of liquidity risk associated with funding the Group’s recurring activity, stakes of a financial nature and management of net liquidity related to the needs of some business units. |
– | This activity is carried out by the different funding sources (issuances and other), always maintaining an adequate profile in volumes, maturities and costs. The price at which these operations are made with other Group units is the market rate plus the premium, which in liquidity terms, the Group supports by immobilising funds during the term of the operation. |
– | Interest rate risk is also actively managed in order to soften the impact of interest rate changes on net interest income, conducted via high credit quality, very liquid and low capital consumption derivatives. |
– | Strategic management of the exposure to exchange rates in equity and dynamic in the countervalue of the units’ annual results in euros. Net investments in equity are currently covered by EUR 23,692 million (mainly Brazil, the UK, Mexico, Chile, the US, Poland and Norway) with different instruments (spot, fx, forwards). |
• | Management of total capital and reserves: efficient capital allocation to each of the units in order to maximise shareholder return. |
Results
First quarter underlying attributable loss of EUR 434 million, 16% lower than in the same period of 2019 (EUR -517 million).
• | Positive impact of EUR 93 million in gains on financial transactions mainly due to foreign currency hedging. |
• | On the other hand, the positive trend on operating expenses continued, improving 13% compared to the first quarter of 2019, driven by ongoing streamlining and simplification measures. |
CORPORATE CENTRE | |||||||||||
EUR million | |||||||||||
Q1'20 | Q4'19 | Chg. | Q1'19 | Chg. | |||||||
Gross income | -304 | -381 | -20 | % | -399 | -24 | % | ||||
Net operating income | -389 | -471 | -17 | % | -497 | -22 | % | ||||
PBT | -413 | -529 | -22 | % | -559 | -26 | % | ||||
Underlying attrib. profit | -434 | -459 | -6 | % | -517 | -16 | % | ||||
44 | | January - March 2020 |
Response to the COVID-19 crisis Business model | ||||||||
Secondary segments | ||||||||
RETAIL BANKING | |
 | Highlights (changes in constant euros) • In the quarter, Santander continued to support its customers, corporates and governments in all countries with the usual product and services and the launch of extraordinary measures arising from the global health crisis.• The Group continued to focus on improving customer satisfaction, increasing loyalty and boosting the use of remote channels. In March, we had almost 146 million customers, of which more than 21 million are loyal and increased by more than 4 million in twelve months the number of digital customers.• Underlying attributable profit of EUR 1,637 million in the first quarter, 4% lower year-on-year, driven by higher provisions. |
EUR 1,637 Mn | |
Underlying attributable profit | |
Commercial activity
Santander wants to be the reference bank for individual customers, SMEs and other companies. To this end, we continued to launch different commercial initiatives, including:
• | In individuals, we are offering mortgages of up to 90% of the property’s value and at a term of more than 30 years in Brazil. We continued to expand Santander Life in Chile and launched a numberless credit card in Mexico, providing greater security to our customers. |
• | In auto finance, we signed strategic agreements in Europe, the joint initiative between SBNA and SC USA regarding prime auto loans continued to thrive and Peru and Colombia continued to increase their activity in this business. |
• | In the SME segment, we continued to move forward with products such as Prospera in Brazil and Uruguay and Financia&Go in Spain, the first fully digital invoice financing service for SMEs and self-employed workers on external platforms. In Argentina, we launched the digital onboarding service for SMEs. |
• | Of note in corporates were strategies such as the Trade Club Alliance in the UK, a digital platform to foster international trade. |
We also continued with the conversion of the branch network, though greater digitalisation of our businesses, which was reflected on the increase in the number of digital customers and transactions, particularly in those countries where the government adopted confinement measures.
In addition to this initiatives, framed within the Bank’s regular activity, in the last weeks of the quarter and in the areas where our customers are being most affected by the crisis, the Bank has defined a number of support measures, such as pre-approved credit lines, repayment holidays and special policies, further detailed on the COVID-19 section in this report and on each entity's website.
Results
Underlying attributable profit in the first quarter was EUR 1,637 million, 4% lower year-on-year as follows:
• | Total income remained flat, as the increase in net interest income was offset by lower gains on financial transactions and other income. |
• | Costs had no material change. |
• | Loan-loss provisions up 13% primarily due to higher volumes. Cost of credit stood al 1.17% and the NPL ratio improved both year-on-year (-32 bps) and to quarter-on-quarter (-8 bps). |
Customers | ||||||
March 2020. Thousands | ||||||
Loyal customers | Digital customers | |||||
| 21,453 | | 38,279 | |||
31 | % | /active customers | +13 | % | YoY | |
Activity | ||||||||||
March 2020. EUR billion and % change in constant euros | ||||||||||
+2% | -1% | |||||||||
QoQ | QoQ | |||||||||
760 | 669 | |||||||||
+4% | +3% | |||||||||
YoY | YoY | |||||||||
Gross loans and advances to customers excl. reverse repos | Customer deposits excl. repos + mutual funds | |||||||||
Underlying income statement | |||||||
EUR million and % change in constant euros | |||||||
Q1'20 | / Q4'19 | / Q1'19 | |||||
Revenue | 9,972 | -5 | % | 0 | % | ||
Expenses | -4,526 | -5 | % | +1 | % | ||
LLPs | -2,289 | -4 | % | +13 | % | ||
PBT | 2,818 | -3 | % | -7 | % | ||
Underlying attrib. profit | 1,637 | -9 | % | -4 | % | ||
January - March 2020 | | 45 |
Response to the COVID-19 crisis Business model | ||||||||
Secondary segments | ||||||||
CORPORATE & INVESTMENT BANKING | ||
 | Highlights (changes in constant euros) | |
In the context of the COVID-19 health crisis, the initial efforts focused on implementing contingency plans to protect employees and provide business continuity. The strong relationship with our global clients (corporates, governments, societies and institutions) has been essential to support them in their capital issuances and provide financing solutions and transactional services. | ||
• These measures were reflected in the 16% increase in lending volumes to EUR 125,306 million in the quarter. Deposits rose 24% compared to December 2019.• Underlying attributable profit in the quarter was 21% higher year-on-year at EUR 491 million, driven by double-digit growth across almost all core businesses, which more than offset the negative impact from the increase counterparty credit risk (CVA), due to volatility in the financial markets. | ||
EUR 491 Mn | ||
Underlying attributable profit | ||
Commercial activity
• | Cash management: sustained growth in all geographic areas. Of note was the positive performance of Spain, the UK and Europe with double-digit growth year-on-year. |
• | Export & Agency Finance: we maintained leadership positions in export financing backed by export credit agencies (ECA) in the quarter, supporting our clients in their export activities and with strong increases in Europe and Asia. |
• | Trade & Working Capital Solutions: Of note was activity in Continental Europe, the Americas and Asia, with strong growth in all products and strengthening support for our clients, especially in Receivables and Supply Chain Finance programmes. |
• | Debt Capital Markets: significant growth in the quarter, backed by the positive performance in Spain, the UK and the US. We continued to focus on activities related to sustainable financing, being a reference for the issuance of green bonds, while maintaining our leadership in Latin America by number of transactions and significant positions in Europe. |
• | Corporate Finance: in merger and acquisitions (M&A) we strengthened our position as the leader in our main markets, with noteworthy operations such as advising Cellnex on the purchase of Omtel in Portugal as well as Mexico Infrastructure Partners on the largest transaction in the infrastructure sector in Mexico. |
• | Syndicated Corporate Loans: we continued to play a significant role, although with a reduced volume of acquisitions during the year due to low M&A activity. In line with our responsible banking strategy, we increased our range of sustainable finance products via green loans or loans linked to sustainable indices. |
• | Structured Financing: Santander maintained its global leadership position in Project Finance, remaining among the top 10 global competitors with a position of over USD 1 billion in three deals. |
• | Global markets: The activity was heavily impacted by the crisis, particularly in the management of positions subject to CVA. Positive performance in other Markets businesses, with good evolution in institutional sales in the UK, Mexico, Chile and Asia, and in the corporate segment in Spain, Europe and the Americas. |
Business performance
The exceptional circumstances generated by the COVID-19 health crisis defined the end of the first quarter of the year. In this regard, we have supported our customers through contingency lines and other financing solutions. In March, we assisted our customers by extending more than EUR 15 billion in credit facilities.
In the quarter, the volume of loans and advances to customers excluding reverse repos rose to EUR 125,306 million, 16% higher than in December 2019. This led to an increase in risk weighted assets, both due to the increase in the volume of granted loans and higher market volatility. We are developing mitigation measures to minimise this increase.
Customer deposits excluding repurchase agreements rose 24% in the quarter to more than EUR 92 billion, driven by higher liquidity from our clients.
Activity | ||||||||||
March 2020. EUR billion and % change in constant euros | ||||||||||
+16% | +20% | |||||||||
QoQ | QoQ | |||||||||
125 | 101 | |||||||||
+29% | +19% | |||||||||
YoY | YoY | |||||||||
Gross loans and advances to customers excl. reverse repos | Customer deposits excl. repos + mutual funds | |||||||||
46 | | January - March 2020 |
Response to the COVID-19 crisis Business model | ||||||||
Secondary segments | ||||||||
Results (in constant euros)
First quarter underlying attributable profit was 21% higher to EUR 491 million, boosted by total income, which grew driven by net interest income (+9%) and especially net fee income (+20%), which broadly offset the negative impact from gains on financial transactions from the increase in the market value of counterparty credit risk (CVA) due to volatility in the financial markets derived from the expansion of COVID-19.
Strong growth year-on-year in most core businesses: Global Transation Banking, Global Debt Financing, Corporate Finance, and Global Markets, the latter excluding the aforementioned negative results from CVA performance.
Costs fell 1% and loan-loss provisions were very low, as in the first quarter of 2019.
Compared to the fourth quarter of 2019, underlying attributable profit rose also 21%, as lower income was offset by cost reduction and lower provisions.
Total income breakdown | |
Constant EUR million | |
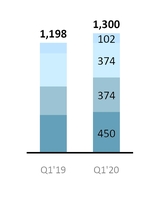
TOTAL | +9 | % |
Capital & Other | -6 | % |
Global Markets | +3 | % |
Global Debt Financing | +21 | % |
Global Transaction Banking | +8 | % |
(*) In euros: +2% | ||
Underlying income statement | |||||||
EUR million and % change in constant euros | |||||||
Q1'20 | / Q4'19 | / Q1'19 | |||||
Revenue | 1,300 | -8 | % | +9 | % | ||
Expenses | -536 | -11 | % | -1 | % | ||
LLPs | -4 | -97 | % | -49 | % | ||
PBT | 745 | +15 | % | +19 | % | ||
Underlying attrib. profit | 491 | +21 | % | +21 | % | ||
January - March 2020 | | 47 |
Response to the COVID-19 crisis Business model | ||||||||
Secondary segments | ||||||||
WEALTH MANAGEMENT & INSURANCE | ||
 | Highlights (changes in constant euros) | |
In response to the challenges posed by COVID-19, almost all employees are working remotely, critical people and processes were identified and business continuity plans were activated. In addition, follow-up and interaction with clients, with market updates and daily reports on the situation, reinforcing relationships and trust. | ||
• Underlying attributable profit rose 21% compared to the first quarter of 2019.• Total contribution (net profit + net fee income) of EUR 596 million, 7% higher than in the first quarter of 2019.• Assets under management reached EUR 345 billion, 2% lower year-on-year, affected by the crisis at the end of the quarter. | ||
EUR 240 Mn | ||
Underlying attributable profit | ||
Commercial activity
We continued to progress in our plan to make us the best responsible wealth manager in Europe and Latin America:
• | In Private Banking, we performed well early this year, increasing contribution to profit year-on-year. This was achieved by strengthening the value proposition in all our countries, connecting and coordinating investment teams to leverage our global scale and developing a more innovative new product offering (for example with alternative funds), mainly in Spain, Miami, Switzerland and Brazil. |
We continued to connect our global platform, which allows our clients to be considered Private Banking clients in all our countries and to operate between them in a simple and efficient way. In this regard, total volume of shared business across our markets reached EUR 5,850 million, 25% higher than March 2019. Additionally, we continued to boost digitalisation of our transactions through the new private banking app for clients, Virginia, and service tools for our managers (SPiRIT).
Collaboration volumes | ||||
EUR million | ||||
5,850 |  | |||
• | In Santander Asset Management we remained focused on enhancing our product offering, such as the Santander GO range (with a volume of more than EUR 900 million since its launch), while we continue working on developing our Global Multi Asset Solutions platform and others. |
We continued to progress in our operational and technological transformation by implementing the Aladdin platform, along with the centralisation of some investment and control functions. This quarter we included in our perimeter the Allianz-Popular operation in Spain and continued to progress in our sustainability strategy (ESG), widening our product offering and reaching EUR 3.8 billion ESG assets under management in March 2020.
• | In Insurance, focus remained on the strategy of strengthening the product offering for our clients, completing it in all the countries where we operate, and reached 20 million total protected customers worldwide. |
Of note were the progress of the alliance with Mapfre, having distributed the first products for SMEs and corporates in Spain.
In digital terms, Brazil launched a new end-to-end product for the travel sector, and in the UK we signed a new alliance with Aviva, where 50% of sales are made through digital channels, with tailored offers and a simple, fully digital process. In Latin America we continued to develop a sound operation of non-related insurance, where of note was the performance of Autocompara as market leader in the distribution of auto insurance with more than one million insurance policies in its portfolio.
Business performance
Total assets under management amounted to EUR 345 billion, 2% lower than in the first quarter of 2019:
This growth reflects the strong commercial activity early this year, with a slight slowdown and markets impact, particularly at the end of the quarter, due to the COVID-19 crisis.
• | In Private Banking, the volume of customer assets and liabilities amounted to EUR 213 million in March 2020, 3% lower year-on-year, conditioned by the impact of markets, especially in the custody business. |
However, activity levels, particularly at the beginning of the quarter, led to 17% growth in fee income which, backed by a sound cost management (the efficiency ratio improved 7 pp year-on-year to 49%), increased contribution to attributable profit to117 million, 21% more than in the first quarter of 2019.
Business performance: SAM and Private Banking | ||||||
March 2020. EUR billion and % change in constant euros | ||||||
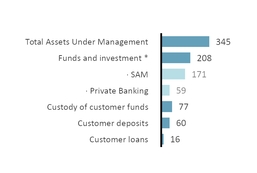
/ Mar-19 | |
-2 | % |
-2 | % |
-1 | % |
-3 | % |
-10 | % |
+8 | % |
+6 | % |
Note: Total assets marketed and/or managed in 2020 and 2019.
(*) Total adjusted customer funds of private banking managed by SAM. 2019 data Pro forma including Popular asset management Joint Ventures, fully integrated in 2020.
January - March 2020 | | 48 |
Response to the COVID-19 crisis Business model | ||||||||
Secondary segments | ||||||||
• | In SAM, total assets under management rose to EUR 171 billion, 1% lower compared to the same period of 2019, due to the impact of the crisis on the market. In February, we reached EUR 183 billion, up 6% compared to March 2019. |
Net sales in the first two months amounted to EUR 1.1 billion. However, they were negative in the quarter (EUR -2.3 billion). The contribution to profit of SAM was EUR 141 million, 6% higher year-on-year.
• | In Insurance, the volume of gross written premiums in the quarter decreased 23% year-on-year to EUR 1.7 billion, with a decline of 3% in protection and 35% in savings insurance, driven by the current interest rate environment. Production was impacted by lower activity, and will be further affected during the crisis. |
The total contribution to net profit and total fees generated amounted to EUR 333 million, 3% more than in the first quarter of 2019.
Results
Underlying attributable profit was EUR 240 million in the first quarter of 2020, 21% growth year-on-year:
• | Total income rose 15% mainly driven by net fee income (+20%) due to the higher average balance managed and the greater contribution of the insurance business. |
• | Total fee income generated, including those ceded to the branch network, amounted to EUR 852 million and represented 30% of the Group's total. |
Total fee income generated | ||||
EUR million | ||||
852 |  | |||
• | Operating expenses were 2% higher, well bellow income growth, due to the Allianz-Popular perimeter integration. |
• | Higher loan-loss provisions due to the recoveries recorded a year earlier. |
The total contribution to the Group (including net profit and total fees generated net of taxes) was EUR 596 million in March 2020, 7% growth year-on-year.
Total profit contribution | ||||||
EUR million and % change in constant euros | ||||||
Q1'20 | Q1'20 | |||||
 | 596 | | 596 | |||
-5 | % | / Q4'19 | +7 | % | / Q1'19 | |
Compared to the fourth quarter of 2019, underlying attributable profit dropped 5% due to the recovery in loan-loss provisions recorded in the previous quarter.
Underlying income statement | |||||||
EUR million and % change in constant euros | |||||||
Q1'20 | / Q4'19 | / Q1'19 | |||||
Revenue | 586 | +1 | % | +15 | % | ||
Expenses | -244 | +1 | % | +2 | % | ||
LLPs | -7 | — | — | ||||
PBT | 334 | -6 | % | +22 | % | ||
Underlying attrib. profit | 240 | -5 | % | +21 | % | ||
January - March 2020 | | 49 |
Response to the COVID-19 crisis Business model | ||||||||
Secondary segments | ||||||||
SANTANDER GLOBAL PLATFORM (SGP) | ||
 | Highlights (changes in constant euros) • Santander Global Platform (SGP) aims to accelerate our growth by deploying global payments and financial solutions for SMEs and individuals in high-growth and large addressable markets.• SGP leverages our scale and footprint, our expertise in payments and our track-record scaling up fintech solutions to build best-in-class services.• In the first quarter of 2020 we continued to make relevant progress on developing our platforms. We deployed our Global Merchant Solution (GMS) in Mexico for our Mexican merchants. Likewise, and to strengthen our expansion plan, we acquired the acquiring business of our partner Elavon in Mexico and, in addition to Ebury in 2019, we acquired Mercury TFS in GTS this year. | |
GMS/Getnet GTS/OneTrade & Ebury Superdigital Openbank | ||
Strategy
Santander Global Platform is focused on offering global payment solutions to customers. These solutions are all being built based on customer experience and as a driver of loyalty. SGP offers these solutions to both our banks (B2C) and to third parties (B2B2C), helping to expand our market to non-customers and new geographic areas, generating new significant revenue opportunities. The area continued to advance according to the envisaged schedule.
Bringing best-in-class banking solutions to SMEs:
• | Global Merchant Services is a single open platform for the global development of the acquiring business through the unique brand Getnet. This business has a high strategic value in the relationship with our customers given the relevance of collections and value-added services for merchants. |
In the quarter, we finished building this platform on the back of the available functionalities in Brazil's Getnet and incorporating new features such as its flexible cloud-based architecture. At the same time, it was rolled out in Mexico and we expect to expand it gradually, according to the market conditions. In addition, and to strengthen the expansion plan, we acquired 50% of the acquiring business in Mexico from our partner Elavon inc., with whom we had a joint venture which dated back to 2010, and will now be fully owned by the Group.
At the end of the quarter, the acquiring business had more than one million active businesses and reached a total income of EUR 144 million, excluding Corporate & Investment Banking and WM&I,. In Brazil, Getnet recorded strong turnover growth (+30% year-on-year) with 12% market share gains in a highly competitive environment. Progress was also recorded in countries such as Mexico, Spain and Portugal, consolidating significant market shares.
We remained focused on expanding to other countries where the Group operates, first in Latin America, followed by Europe and the rest of geographic areas. This plan will enable us to continue strengthening our global presence, capture synergies across different countries and enhancing our global value proposition through a single open platform.

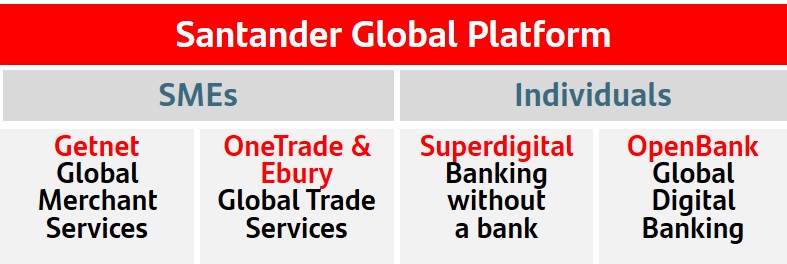
• | Global Trade Services, our global platform to serve companies that trade internationally using international payments, FX, trade finance and multi-country accounts. The revenue pool for global transaction banking services in the Group's Retail Banking, excluding Corporate & Investment Banking and WM&I, was EUR 307 million in the first quarter. |
Regarding the development of the Global International Trade Platform, OneTrade, continued progressing as scheduled. The first services are expected to be launched in April in the main countries where the Bank operates, and will be further rolled out to the rest in the following months. In addition, new services will be included during 2020 regarding international payments (instant payments), FX Digital and international financing of business, all included in one single platform, OneTrade, for all the Group's customers in different countries.
To accelerate the development of this opportunity, together with the already announced acquisition of 50.1% Ebury's stake in November 2019, Global Trade Services acquired in March 50.1% of the Mercury TFS though a EUR 30 million investment. Mercury TFS is a company specialised in software solutions that enables to digitalise and automatise the management of trade financial activity, both for customers as for internal management. This operation will strengthen the Group's international trade offer and consolidate its position as the bank of choice for SMEs and corporates with international operations.
Mercury's offer will be included in OneTrade, as well as the Santander Trade Club Platform and Trade Club Alliance, providing customers in a single platform, and in a fully integrated way, the access to all services associated with their international business operations.

50 | | January - March 2020 |
Response to the COVID-19 crisis Business model | ||||||||
Secondary segments | ||||||||
Bringing best-in-class digital banking solutions to individuals:
• | Superdigital, our financial inclusion platform for individuals that require a simple, flexible pre-banking service. It enables us to meet the financial needs of the underserved in a cost-effective way, providing them with basic financial products and a path to access credit, thus serving them responsibly and profitably. |
Superdigital also integrates with GMS for small merchants. With a special focus on Latin America, where there are c.300 million unbanked and underbanked consumers.
As of today, Superdigital operates in Brazil, Mexico and Chile, active customers grew c.60% year-on-year, whereas transactions are growing by c.70% year-on-year. We aim to expand Superdigital to 7 countries in Latin America later this year.

• | Openbank, our global, full-service digital bank caters the current account and cards also offered by neobanks, including loans and mortgages, and a state-of-the-art robo-advisory and open platform brokerage services. |
Active now in Spain, the Netherlands, Germany and Portugal, Openbank grew in Q1 its loan book by 84% year-on-year and new customers in the period by 78% compared with Q1’19. Deposits grew 9% YoY. Loyal customers keep showing an industry record benchmark engagement ratio of 4.4 products per customer.
This quarter, Openbank launched the first travel card that works by subscription, that can be turned-on and off from the app, and our customers pay only when they use it, as compared to competing neobank products that charge full year fees.
This new travel card, branded R42, is available in plastic and metal and offers privileged exchange rates when used abroad, free ATM withdrawals, travel insurance and a concierge service.

Other activities
• | Santander InnoVentures, our venture capital investments in the fintech ecosystem, continued to grow. As at end-March, it had invested more than USD 150 million in 31 companies in 9 countries. We are implementing 13 projects across our banks for the benefit of our customer base. |
Results
Looking at SGP's activity in Q1'20 in a broad sense, i.e. if, in addition to considering the results generated by the digital platforms, 50% of the results generated by the countries on the products related with the platform (e.g. merchant acquiring, trade finance products, etc.) are also included, revenue of SGP as secondary segment is close to EUR 260 million in and pro forma underlying attributable profit is positive at EUR 43 million in the first quarter of 2020.
This is the net result of two components: on the one hand, the investment in building the platforms and, on the other hand, 50% of the profit obtained from commercial relationships with our customers:
• | The construction of platforms is where most of the spend is concentrated. We are making progress in the development of new solutions and rolling it out in countries. This has a negative impact of EUR 31 million on the income statement for the first quarter. |
• | Profit obtained from commercial relationships with our customers linked to the global SGP platforms, and according to the criteria for allocating the aforementioned results, resulted in EUR 74 million in the quarter. |
We regularly assess the market valuations of the businesses included in SGP, based on multiples of comparable companies, to ensure our investments in digital are creating value.
Underlying income statement | |||||||
EUR million and % change in constant euros | |||||||
Q1'20 | / Q4'19 | / Q1'19 | |||||
Revenue | 260 | +6 | % | +5 | % | ||
Expenses | -186 | -7 | % | +20 | % | ||
LLPs | -5 | -69 | % | -70 | % | ||
PBT | 71 | +180 | % | -5 | % | ||
Underlying attrib. profit | 43 | +740 | % | -5 | % | ||
January - March 2020 | | 51 |
Responsible banking | ||||||||
Responsible banking | ||||||||
RESPONSIBLE BANKING
Santander strives every day to contribute to the progress of people and companies in a Simple, Personal and Fair way in all that we do, to earn the confidence of our employees, customers, shareholders and society.
In order to meet our commitment to be a more responsible bank and help society address the main global issues, we have identified two challenges: adapt to the new business environment and contribute to more inclusive and sustainable growth, with the following goals set on 2019 for the coming years:
 | Santander Responsible banking targets |
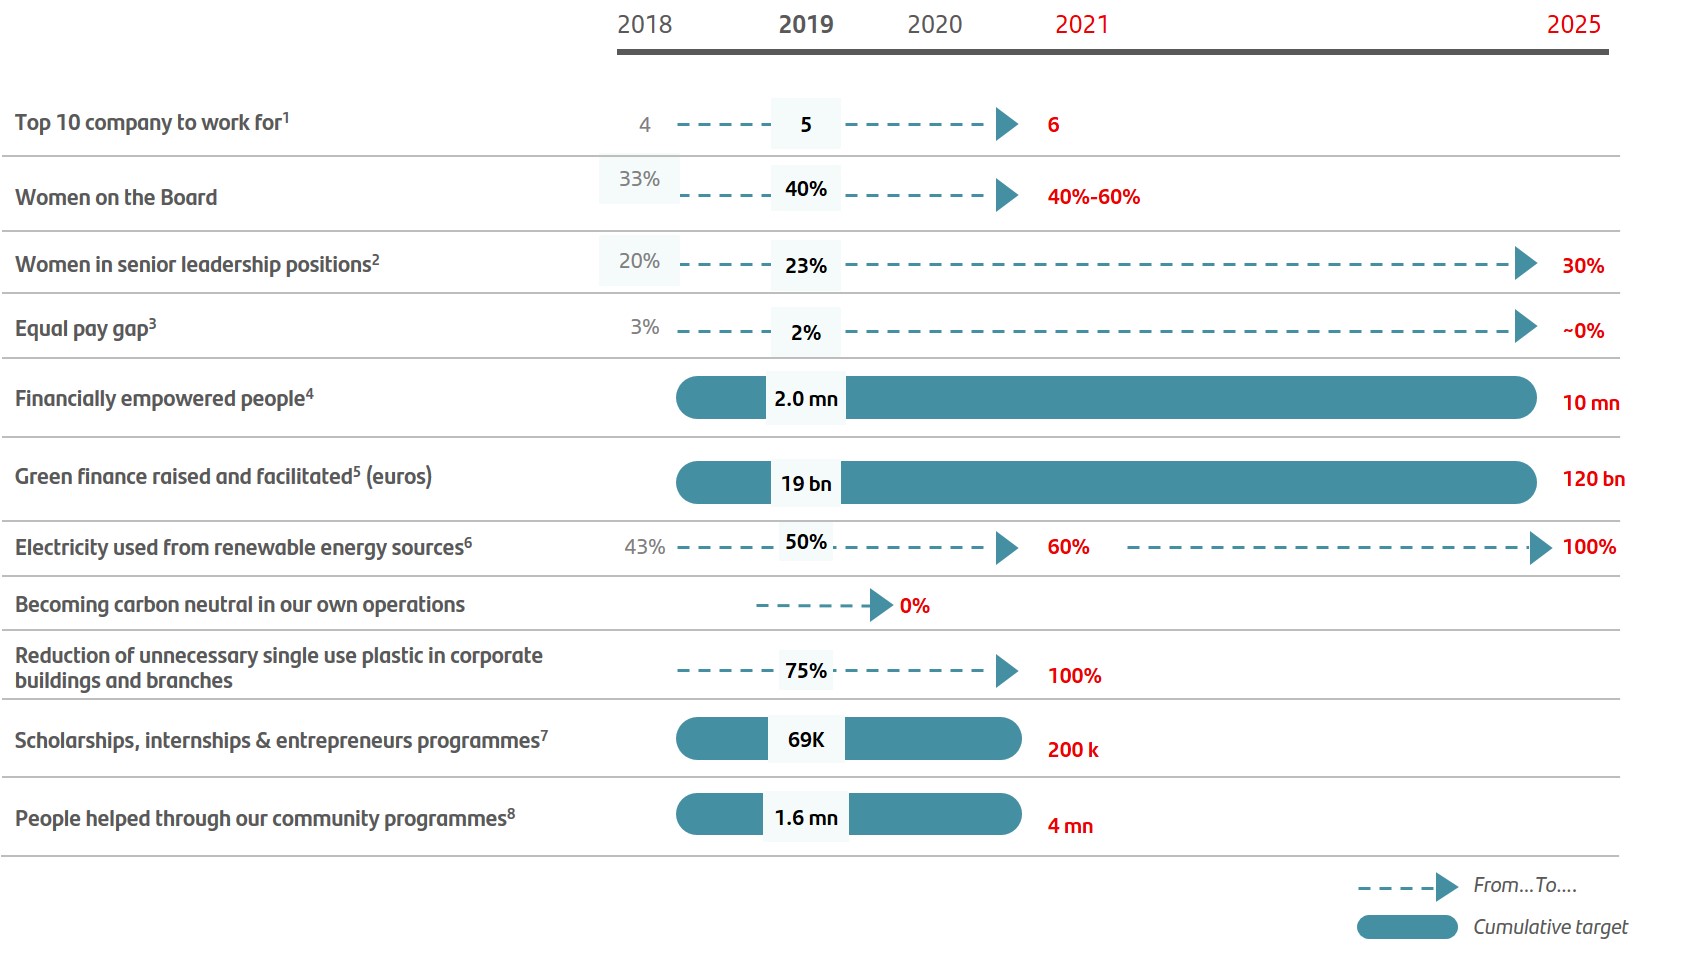
More information on our public commitments in responsible banking can be found on our website.
1. | According to relevant external indexes in each country (Great Place to Work, Top Employer, Merco, etc.). |
2. Senior positions represent 1% of total workforce.
3. Calculation of equal pay gap compares employees of the same job, level and function.
4. People (unbanked, underbanked or financially vulnerable), who are given access to the financial system, receive tailored finance and increase their knowledge and resilience through financial education.
5. Includes Santander overall contribution to green finance: project finance, syndicated loans, green bonds, capital finance, export finance, advisory, structuring and other products to help our clients in the transition to a low carbon economy. Commitment from 2019 to 2030 is 220Bn.
6. In those countries where it is possible to certify renewable sourced electricity for the properties occupied by the Group.
7. People supported through Santander Universities initiative (students who will receive a Santander scholarship, will achieve an internship in an SME or participate in entrepreneurship programmes supported by the bank).
8. People helped through our community investment programmes (excluded Santander Universities and financial education initiatives).
52 | | January - March 2020 |
Responsible banking | ||||||||
Responsible banking | ||||||||
| First quarter highlights |
 | The Group is supporting its stakeholders in the difficulties they may have as a result of the current pandemic. To this end, we have put in place various contingency plans in the countries in which we operate, which have been discussed in previous sections of this report. |
In addition, the Group continued to develop responsible banking initiatives in the quarter, in the areas of environmental sustainability, diversity and support to the communities. The most relevant are detailed below. | |
We were recognised for our excellent results in this area with the Gold Class distinction in The Sustainability Yearbook 2020 released by S&P Global, as Santander ranked 1st in the Dow Jones Sustainability Index. We achieved a total score of 86 points out of 100, reaching the maximum score of 100 in a number of assessed areas, including tax strategy, privacy protection, environmental reporting and financial inclusion. | |
 | As part of our corporate commitment with the environment, Santander continued financing green alternatives and renewable energies in its different countries: Santander Argentina was involved in the placement of the first green bond issued on the primary local debt market. The placement, which also involved other banks and financial institutions, amounted to USD 48.4 million. This operation is another step towards the goal of bringing sustainability principles into the Argentinian capital market in line with world markets. In retail baking, Santander Polska launched a leasing offer to finance a wide range of solar installations. |
 | Regarding our diversity and inclusion commitments, we have also announced our membership to The Valuable 500, committing to include disability inclusion in the board's agenda, and signed the UN Women Empowerment principles. |
We were awarded Top Employers 2020 for the excellent working conditions in Spain, Poland, the UK and Chile, and Santander Consumer Finance in Germany, the Netherlands, Austria, Italy, Poland and Belgium. To continue working in line with our corporate culture, we implemented a minimum standard for parental leave to be implemented in 2020, offering at least 14 paid weeks for mothers and four weeks for the secondary parent. | |
 | In addition to the measures implemented to minimise the impacts of the COVID-19 pandemic, we continued to invest in the communities where we operate. |
In collaboration with MIT Professional Education, we launched the Santander Scholarships MIT Leading Digital Transformation, in which 2,500 university students and eligible professionals from 14 countries will benefit from specialised training in digital transformation. Additionally, Santander and the British Council launched the Santander British Council Summer Experience, 90 full scholarships to foster the learning of English and knowledge of British culture among young people from 12 countries in the international networks in which both institutions operate. | |
As a result of these efforts, Banco Santander was ranked the world’s most sustainable bank in the Dow Jones Sustainability Index for the first time and was also first in Europe for the second year running. The index evaluates the Group’s performance across economic, environmental and social dimensions. | |
Also, we continue to form part of the various sustainability indices, providing non-financial information to the ESG markets, investors and analysts. | |
 | |
January - March 2020 | | 53 |
Response to the COVID-19 crisis Business model | Corporate governance | |||||||
Corporate governance | ||||||||
CORPORATE GOVERNANCE
A responsible bank has a solid governance model with well-defined functions; it manages risks and opportunities prudently and defines its long-term strategy watching out for the interests of all its stakeholders and society in general |  |
ˆ Changes in the board
• | As of 27 February 2020, the Board submitted a resolution to the General Shareholders’ Meeting recommending the appointment of Mr Sergio Rial as a new executive director of the Group which was approved on 3 April 2020. Mr Sergio Rial will fill the vacancy left by Mr Ignacio Benjumea with effect from the approval of his election. |
• | The aforementioned General Shareholders’ Meeting also agreed to appoint Mr Luis Isasi as an external director. As announced on 26 November 2019, Mr Luis Isasi will replace Mr Guillermo de la Dehesa on 3 April 2020. |
• | Both appointments are subject to regulatory approval. |
ˆ Changes in the composition of the board committees
• | After leaving the Board on 3 April 2020, Mr Guillermo de la Dehesa also ceased to be a member of the executive, appointments, remuneration and innovation and technology committees. |
• | As of April 2020, Mrs Pamela Walkden was appointed, with effects from 26 April, as Group audit committee Chairman replacing Ms Belén Romana, who will remain a member of the committee, having completed the four year period since her appointment as chairman, as provided by the regulation of the board. |
ˆ Annual General Meeting
The Annual General Shareholder’s Meeting was held on 3 April 2020.
• | In accordance of Royal Decree 463/2020 of 14 March declaring the state of emergency to address the health situation caused by COVID-19, in accordance with articles 40 and 41 of Royal Decree-Law 8/2020 of 17 March on urgent extraordinary measures to address the economic and social impact of COVID-19 and in order to safeguard the general interests, health and safety of shareholders, employees and other people who participate in organising and holding the general meeting, by resolution of the board of directors announced on 10 and 23 March, the venue of the ordinary general shareholders’ meeting was changed to the Ciudad Grupo Santander in Boadilla del Monte (Madrid), and was held without the shareholders attending in person but using the software applications to remotely attend the meeting established in the Bank’s bylaws and regulations for the general shareholders’ meeting to guarantee the rights of all shareholders to receive information, to remotely attend the meetings, to participate and to vote at the general meeting. |
• | Furthermore, and in compliance with the ECB recommendation issued on 27 March, on 2 April a material fact was published, announcing the decision of the Board to withdraw from the agenda of the ordinary general shareholders meeting the proposals under points Two and Seven A, regarding, respectively, the application of the Banks 2019 results and the capital increase to instrument, through the application of the Santander Dividendo Elección programme, the part of the remuneration corresponding to the final dividend against 2019 results initially contemplated. A further general shareholders meeting will be held no later than 31 October in which shareholders’ will have the opportunity to decide on the new proposed application of 2019 results, which might differ from the one initially proposed for the aforementioned General Shareholders’ Meeting and, if needed, on any supplementary resolutions. |
54 | | January - March 2020 |
Response to the COVID-19 crisis Business model | Corporate governance | |||||||
Corporate governance | ||||||||
• | The decision to withdraw from the agenda the aforementioned proposals was as provided for by the joint communication issued by the Spanish National Securities Commission and the Spanish Registrars Society on 26 March 2020, articles 40.6.bis and 41.3 Royal Decree-Law 8/2020 on 17 March, according to the First Final Provision of Royal Decree Law 11/2020 on 31 March. |
• | At the AGM, a total of 589.268 shareholders were present or represented, holders of 10,802,580,226 shares. The quorum was 65.0% of the Bank’s share capital. |
• | The agreements submitted to a vote received an average 94.37% of favourable votes. The Bank’s management during 2019 was approved by 99.68% of votes. |
• | The remuneration policy for directors for 2020, 2021 and 2022 was submitted to the Meeting’s binding approval, and received 94.40% of votes in favour. |
• | All the proposed agreements, the reports of administrators and other legal documentation regarding the AGM were published on the Group’s website on February 28 when the meeting was called. The documentation includes the 2019 Annual Report which has a section on corporate governance setting out the main activities of the board and of its committees in 2019, including detailed information on the regulations and procedures on which the Bank’s corporate governance system is based, as well as the annual report on directors’ remuneration. |
• | In addition as the appointments of Mr Luis Isasi and Mr Sergio Rial as new directors, the board approved the ratification and re-election of Mrs Pamela Walkden as independent director and the re-election of Mrs Ana Botín-Sanz de Sautuola as an executive director, Mr Rodrigo Echenique as an external director and Mrs Esther Giménez-Salinas and Mrs Sol Daurella as independent directors. |
Full information on the agreements approved by the annual general meeting can be found at www.santander.com.
January - March 2020 | | 55 |
Response to the COVID-19 crisis Business model | Santander share | |||||||
Santander share | ||||||||
SANTANDER SHARE
Banco Santander, following the ECB recommendation urging financial institutions, given the uncertainty resulting from the COVID-19 emergency, to preserve capital by cancelling the payment of dividends against 2019 and 2020 earnings, has decided to cancel the final dividend charged against 2019 earnings and hold a further general shareholders meeting expected in October 2020, to consider a dividend payment if the uncertainties relating to the COVID-19 crisis are resolved.
The Group, even before the ECB’s announcement, had agreed to cancel the interim dividend charged against 2020 and suspend its decision on 2020 dividends until there is more clarity regarding the impact of the crisis. This decision was taken to ensure the Bank has as much flexibility as possible to allow it to maximise lending and support businesses and individuals affected by the COVID-19 pandemic.
ˆShareholder remuneration
The Santander share is listed in five markets, in Spain, Mexico and Poland as an ordinary share, in the UK as a CDI and in the US as an ADR.
The rapid spread of COVID-19 worldwide increased uncertainty and risk aversion, conditioning market performance in the quarter. As a response to the healthcare measures that governments have implemented and which are impacting the economy, in the US and Europe, central banks and governments are using the tools to counteract the economic slowdown. Central banks have redoubled their monetary policy efforts, and governments have put in place support packages for businesses and households, laying the groundwork for the restoration of market confidence.
The European Central Bank announced a new asset purchase programme of EUR 750 billion to counter the risk to the monetary policy transmission mechanism, and the Fed cut interest rates twice to 0%.
In the midst of the global health crisis, the disagreement between Russia and Saudi Arabia regarding the need of production cuts triggered the price war that plunged the oil price.
In this context, the main markets reported significant falls in the quarter. In Spain, the Ibex 35 dropped 28.9% and, in Europe, the DJ Stoxx 50 fell 19.8%.
As such, the leading European banking index, DJ Stoxx Bank decreased 38.7% while the MSCI World Banks index declined 36.6%. The Santander Share price ended the quarter at EUR 2.218, 40.5% lower.
Share price | ||||
 |  | |||
START 31/12/2019 | END 31/03/2020 | |||
€3.730 | €2.218 | |||
 |  | |||
Maximum 17/02/2020 | Minimum 16/03/2020 | |||
€3.964 | €1.928 | |||
Comparative share performance |
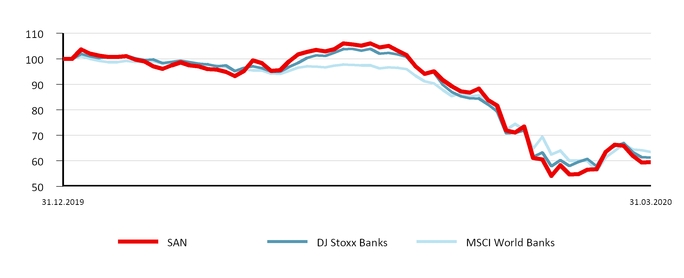
56 | | January - March 2020 |
Response to the COVID-19 crisis Business model | Santander share | |||||||
Santander share | ||||||||
SANTANDER SHARE
ˆMarket capitalisation and trading
As at 31 March 2020, Santander was the largest bank in the Eurozone by market capitalisation and the 29th in the world among financial entities (EUR 36,859 million).
The share’s weighting in the DJ Stoxx 50 was 1.1% and 6.9% in the DJ Stoxx Banks. In the domestic market, its weight in the Ibex 35 as at end-March was 10.5%.
A total of 5,119 million shares were traded in the year for an effective value of EUR 15,595 million and a liquidity ratio of 31%.
The daily trading volume was 80 million shares with an effective value of EUR 244 million.
ˆShareholder base
The total number of Santander shareholders at 31 March 2020 was 4,043,974 of which 3,768,316 were European (77.64% of the capital stock) and 259,139 from the Americas (21.09%).
Excluding the board, which holds 1.10% of the Bank’s capital stock, retail shareholders account for 40.71% and institutional shareholders 58.19%.
Share capital distribution by geographic area | ||
March 2020 | ||
The Americas | Europe | Other |
21.09% | 77.64% | 1.27% |
 | ||
 | 1st | Bank in the Eurozone by market capitalisation |
EUR 36,859 million | ||
The Santander share | ||
March 2020 | ||
Shares and trading data | ||
Shares (number) | 16,618,114,582 | |
Average daily turnover (number of shares) | 79,988,463 | |
Share liquidity (%) | 31 | |
(Number of shares traded during the year / number of shares) | ||
Stock market indicators | ||
Price / Tangible book value (X) | 0.53 | |
P/E ratio (X) | 48.29 | |
Free float (%) | 99.83 | |
Share capital distribution by type of shareholder | |
March 2020 | |
Institutional |
58.19% |
Board (*) |
1.10% |
Retail |
40.71% |
(*) Shares owned or represented by directors.
January - March 2020 | | 57 |
Financial report January - March 2020 
58 | | January - March 2020 |
Response to the COVID-19 crisis Business model | ||||||||
Group financial information | ||||||||
Net fee income. Consolidated | ||||||||
EUR million | ||||||||
Q1'20 | Q4'19 | Change (%) | Q1'19 | Change (%) | ||||
Fees from services | 1,705 | 1,791 | (4.8) | 1,779 | (4.2) | |||
Wealth management and marketing of customer funds | 928 | 948 | (2.1) | 936 | (0.9) | |||
Securities and custody | 220 | 222 | (0.9) | 216 | 1.9 | |||
Net fee income | 2,853 | 2,961 | (3.6) | 2,931 | (2.7) | |||
Operating expenses. Consolidated | ||||||||
EUR million | ||||||||
Q1'20 | Q4'19 | Change (%) | Q1'19 | Change (%) | ||||
Staff costs | 2,899 | 3,053 | (5.0) | 3,006 | (3.6) | |||
Other general administrative expenses | 1,949 | 2,126 | (8.3) | 2,005 | (2.8) | |||
Information technology | 498 | 588 | (15.3) | 551 | (9.6) | |||
Communications | 133 | 128 | 3.9 | 132 | 0.8 | |||
Advertising | 136 | 196 | (30.6) | 157 | (13.4) | |||
Buildings and premises | 210 | 218 | (3.7) | 211 | (0.5) | |||
Printed and office material | 26 | 27 | (3.7) | 32 | (18.8) | |||
Taxes (other than tax on profits) | 138 | 132 | 4.5 | 126 | 9.5 | |||
Other expenses | 808 | 837 | (3.5) | 796 | 1.5 | |||
Administrative expenses | 4,848 | 5,179 | (6.4) | 5,011 | (3.3) | |||
Depreciation and amortisation | 729 | 792 | (8.0) | 747 | (2.4) | |||
Operating expenses | 5,577 | 5,971 | (6.6) | 5,758 | (3.1) | |||
Operating means. Consolidated | |||||||||||||
Employees | Branches | ||||||||||||
Mar-20 | Mar-19 | Change | Mar-20 | Mar-19 | Change | ||||||||
Europe | 85,805 | 93,060 | (7,255 | ) | 5,329 | 6,696 | (1,367 | ) | |||||
Spain | 27,354 | 31,325 | (3,971 | ) | 3,222 | 4,365 | (1,143 | ) | |||||
Santander Consumer Finance | 13,859 | 14,796 | (937 | ) | 417 | 433 | (16 | ) | |||||
United Kingdom | 24,500 | 25,485 | (985 | ) | 615 | 754 | (139 | ) | |||||
Portugal | 6,512 | 6,735 | (223 | ) | 529 | 561 | (32 | ) | |||||
Poland | 11,034 | 12,551 | (1,517 | ) | 535 | 571 | (36 | ) | |||||
Other | 2,546 | 2,168 | 378 | 11 | 12 | (1 | ) | ||||||
North America | 37,398 | 37,149 | 249 | 2,048 | 2,071 | (23 | ) | ||||||
US | 17,277 | 17,279 | (2 | ) | 619 | 659 | (40 | ) | |||||
Mexico | 20,121 | 19,870 | 251 | 1,429 | 1,412 | 17 | |||||||
South America | 68,624 | 69,973 | (1,349 | ) | 4,524 | 4,509 | 15 | ||||||
Brazil | 45,807 | 46,793 | (986 | ) | 3,617 | 3,562 | 55 | ||||||
Chile | 11,437 | 11,888 | (451 | ) | 366 | 380 | (14 | ) | |||||
Argentina | 9,290 | 9,271 | 19 | 438 | 468 | (30 | ) | ||||||
Other | 2,090 | 2,021 | 69 | 103 | 99 | 4 | |||||||
Santander Global Platform | 1,424 | 545 | 879 | 1 | 1 | — | |||||||
Corporate Centre | 1,697 | 1,757 | (60 | ) | |||||||||
Total Group | 194,948 | 202,484 | (7,536 | ) | 11,902 | 13,277 | (1,375 | ) | |||||
Net loan-loss provisions. Consolidated | ||||||||||
EUR million | ||||||||||
Q1'20 | Q4'19 | Change (%) | Q1'19 | Change (%) | ||||||
Non-performing loans | 2,616 | 2,974 | (12.0) | 2,515 | 4.0 | |||||
Country-risk | (6 | ) | 1 | — | 1 | — | ||||
Recovery of written-off assets | (301 | ) | (402 | ) | (25.1) | (344 | ) | (12.5) | ||
Net loan-loss provisions | 2,309 | 2,573 | (10.3) | 2,172 | 6.3 | |||||
Note: Excluding provisions overlay in Q1'20.
January - March 2020 | | 59 |
Response to the COVID-19 crisis Business model | ||||||||
Group financial information | ||||||||
Loans and advances to customers. Consolidated | |||||||||
EUR million | |||||||||
Change | |||||||||
Mar-20 | Mar-19 | Absolute | % | Dec-19 | |||||
Commercial bills | 34,619 | 31,980 | 2,639 | 8.3 | 37,753 | ||||
Secured loans | 499,667 | 495,005 | 4,662 | 0.9 | 513,929 | ||||
Other term loans | 279,295 | 269,908 | 9,387 | 3.5 | 267,138 | ||||
Finance leases | 35,360 | 34,030 | 1,330 | 3.9 | 35,788 | ||||
Receivable on demand | 9,418 | 8,247 | 1,171 | 14.2 | 7,714 | ||||
Credit cards receivable | 19,052 | 22,687 | (3,635 | ) | (16.0) | 23,876 | |||
Impaired assets | 31,697 | 34,086 | (2,389 | ) | (7.0) | 32,559 | |||
Gross loans and advances to customers (excl. reverse repos) | 909,108 | 895,943 | 13,165 | 1.5 | 918,757 | ||||
Reverse repos | 49,005 | 37,696 | 11,309 | 30.0 | 45,703 | ||||
Gross loans and advances to customers | 958,113 | 933,639 | 24,474 | 2.6 | 964,460 | ||||
Loan-loss allowances | 22,706 | 23,444 | (738 | ) | (3.1) | 22,242 | |||
Loans and advances to customers | 935,407 | 910,195 | 25,212 | 2.8 | 942,218 | ||||
Total funds. Consolidated | |||||||||
EUR million | |||||||||
Change | |||||||||
Mar-20 | Mar-19 | Absolute | % | Dec-19 | |||||
Demand deposits | 584,015 | 565,477 | 18,538 | 3.3 | 588,534 | ||||
Time deposits | 191,054 | 202,018 | (10,964 | ) | (5.4) | 196,920 | |||
Mutual funds | 148,003 | 167,870 | (19,867 | ) | (11.8) | 180,405 | |||
Customer funds | 923,072 | 935,365 | (12,293 | ) | (1.3) | 965,859 | |||
Pension funds | 14,549 | 15,623 | (1,074 | ) | (6.9) | 15,878 | |||
Managed portfolios | 28,937 | 28,024 | 913 | 3.3 | 30,117 | ||||
Repos | 40,390 | 40,866 | (476 | ) | (1.2) | 38,911 | |||
Total funds | 1,006,948 | 1,019,878 | (12,930 | ) | (1.3) | 1,050,765 | |||
Eligible capital (fully loaded) | |||||||||
EUR million | |||||||||
Change | |||||||||
Mar-20 | Mar-19 | Absolute | % | Dec-19 | |||||
Capital stock and reserves | 124,727 | 119,866 | 4,861 | 4.1 | 120,260 | ||||
Attributable profit | 331 | 1,840 | (1,509 | ) | (82.0) | 6,515 | |||
Dividends | — | (920 | ) | 920 | (100.0) | (3,423 | ) | ||
Other retained earnings | (30,166 | ) | (24,315 | ) | (5,851 | ) | 24.1 | (25,385 | ) |
Minority interests | 6,911 | 7,138 | (227 | ) | (3.2) | 6,441 | |||
Goodwill and intangible assets | (27,103 | ) | (29,218 | ) | 2,115 | (7.2) | (28,478 | ) | |
Other deductions | (6,285 | ) | (6,301 | ) | 15 | (0.2) | (5,432 | ) | |
Core CET1 | 68,414 | 68,090 | 324 | 0.5 | 70,497 | ||||
Preferred shares and other eligible T1 | 8,760 | 10,059 | (1,299 | ) | (12.9) | 8,467 | |||
Tier 1 | 77,173 | 78,149 | (975 | ) | (1.2) | 78,964 | |||
Generic funds and eligible T2 instruments | 11,924 | 11,694 | 229 | 2.0 | 11,973 | ||||
Eligible capital | 89,097 | 89,843 | (746 | ) | (0.8) | 90,937 | |||
Risk-weighted assets | 590,952 | 606,300 | (15,347 | ) | (2.5) | 605,244 | |||
CET1 capital ratio | 11.58 | 11.23 | 0.35 | 11.65 | |||||
T1 capital ratio | 13.06 | 12.89 | 0.17 | 13.05 | |||||
Total capital ratio | 15.08 | 14.82 | 0.26 | 15.02 | |||||
60 | | January - March 2020 |
EUROPE | |||||||||||
EUR million | |||||||||||
/ | Q4'19 | / | Q1'19 | ||||||||
Underlying income statement | Q1'20 | % | % excl. FX | % | % excl. FX | ||||||
Net interest income | 3,435 | (2.7 | ) | (2.5 | ) | (3.5 | ) | (3.6 | ) | ||
Net fee income | 1,315 | (0.3 | ) | (0.2 | ) | (0.9 | ) | (1.1 | ) | ||
Gains (losses) on financial transactions (1) | 142 | (66.9 | ) | (66.9 | ) | (23.4 | ) | (23.6 | ) | ||
Other operating income | 83 | 546.9 | 534.8 | (45.6 | ) | (45.7 | ) | ||||
Total income | 4,974 | (6.0 | ) | (5.8 | ) | (4.8 | ) | (4.9 | ) | ||
Administrative expenses and amortisations | (2,712 | ) | (0.8 | ) | (0.7 | ) | (3.2 | ) | (3.4 | ) | |
Net operating income | 2,263 | (11.6 | ) | (11.4 | ) | (6.6 | ) | (6.6 | ) | ||
Net loan-loss provisions | (556 | ) | 11.7 | 12.1 | 21.8 | 22.3 | |||||
Other gains (losses) and provisions | (195 | ) | (6.5 | ) | (6.8 | ) | (1.4 | ) | (1.5 | ) | |
Profit before tax | 1,511 | (18.4 | ) | (18.2 | ) | (14.6 | ) | (14.6 | ) | ||
Tax on profit | (438 | ) | (9.0 | ) | (8.9 | ) | (10.9 | ) | (10.9 | ) | |
Profit from continuing operations | 1,072 | (21.7 | ) | (21.5 | ) | (16.0 | ) | (16.0 | ) | ||
Net profit from discontinued operations | — | — | — | — | — | ||||||
Consolidated profit | 1,072 | (21.7 | ) | (21.5 | ) | (16.0 | ) | (16.0 | ) | ||
Non-controlling interests | (99 | ) | (25.1 | ) | (24.9 | ) | (12.8 | ) | (12.8 | ) | |
Underlying attributable profit to the parent | 974 | (21.3 | ) | (21.1 | ) | (16.3 | ) | (16.3 | ) | ||
Balance sheet | |||||||||||
Loans and advances to customers | 681,075 | 0.6 | 2.9 | 3.8 | 5.8 | ||||||
Cash, central banks and credit institutions | 189,610 | 5.1 | 6.3 | 4.4 | 5.3 | ||||||
Debt instruments | 82,119 | (21.3 | ) | (20.1 | ) | (29.2 | ) | (28.3 | ) | ||
Other financial assets | 60,788 | 12.8 | 12.9 | 11.6 | 11.7 | ||||||
Other asset accounts | 47,697 | 15.0 | 16.3 | 6.5 | 7.5 | ||||||
Total assets | 1,061,290 | 0.4 | 2.2 | 0.8 | 2.3 | ||||||
Customer deposits | 580,842 | (3.3 | ) | (1.2 | ) | (1.1 | ) | 0.5 | |||
Central banks and credit institutions | 198,127 | 4.4 | 5.2 | (1.9 | ) | (1.3 | ) | ||||
Marketable debt securities | 136,012 | 1.8 | 4.5 | 5.3 | 7.8 | ||||||
Other financial liabilities | 72,115 | 18.6 | 18.9 | 19.7 | 20.0 | ||||||
Other liabilities accounts | 17,881 | 9.1 | 11.1 | (3.0 | ) | (1.7 | ) | ||||
Total liabilities | 1,004,978 | 0.4 | 2.2 | 0.8 | 2.3 | ||||||
Total equity | 56,312 | 0.3 | 2.7 | 1.2 | 3.4 | ||||||
Memorandum items: | |||||||||||
Gross loans and advances to customers (2) | 652,651 | 0.3 | 2.5 | 2.1 | 3.9 | ||||||
Customer funds | 644,106 | (4.0 | ) | (2.2 | ) | (1.3 | ) | 0.2 | |||
Customer deposits (3) | 567,332 | (2.4 | ) | (0.4 | ) | (0.4 | ) | 1.2 | |||
Mutual funds | 76,774 | (14.4 | ) | (13.8 | ) | (7.2 | ) | (6.6 | ) | ||
Ratios (%) and operating means | |||||||||||
Underlying RoTE | 7.94 | (2.08 | ) | (1.67 | ) | ||||||
Efficiency ratio | 54.5 | 2.9 | 0.9 | ||||||||
NPL ratio | 3.19 | (0.06 | ) | (0.42 | ) | ||||||
NPL coverage | 50.7 | 0.9 | 1.2 | ||||||||
Number of employees | 85,805 | (0.9 | ) | (7.8 | ) | ||||||
Number of branches | 5,329 | (0.1 | ) | (20.4 | ) | ||||||
(1) Includes exchange differences.
(2) Excluding reverse repos.
(3) Excluding repos.
January - March 2020 | | 61 |
Spain | |||||||
EUR million | |||||||
/ Q4'19 | / Q1'19 | ||||||
Underlying income statement | Q1'20 | % | % | ||||
Net interest income | 925 | (0.9 | ) | (8.3 | ) | ||
Net fee income | 643 | 3.8 | 3.2 | ||||
Gains (losses) on financial transactions (1) | 156 | (59.7 | ) | 30.9 | |||
Other operating income | 64 | — | (39.1 | ) | |||
Total income | 1,789 | (1.3 | ) | (3.7 | ) | ||
Administrative expenses and amortisations | (944 | ) | (3.4 | ) | (7.8 | ) | |
Net operating income | 844 | 1.2 | 1.5 | ||||
Net loan-loss provisions | (253 | ) | 43.7 | 4.5 | |||
Other gains (losses) and provisions | (104 | ) | 3.5 | (7.3 | ) | ||
Profit before tax | 487 | (12.6 | ) | 2.0 | |||
Tax on profit | (135 | ) | (14.1 | ) | 10.9 | ||
Profit from continuing operations | 352 | (12.0 | ) | (1.1 | ) | ||
Net profit from discontinued operations | — | — | — | ||||
Consolidated profit | 352 | (12.0 | ) | (1.1 | ) | ||
Non-controlling interests | — | (93.7 | ) | — | |||
Underlying attributable profit to the parent | 352 | (12.0 | ) | (1.1 | ) | ||
Balance sheet | |||||||
Loans and advances to customers | 186,296 | 0.6 | (4.1 | ) | |||
Cash, central banks and credit institutions | 78,407 | 0.1 | (2.6 | ) | |||
Debt instruments | 24,458 | (28.7 | ) | (41.7 | ) | ||
Other financial assets | 1,407 | 1.1 | (26.9 | ) | |||
Other asset accounts | 25,209 | 5.4 | 2.0 | ||||
Total assets | 315,778 | (2.3 | ) | (8.0 | ) | ||
Customer deposits | 234,716 | (2.4 | ) | (3.2 | ) | ||
Central banks and credit institutions | 20,341 | (19.4 | ) | (56.4 | ) | ||
Marketable debt securities | 29,503 | 9.9 | 26.2 | ||||
Other financial liabilities | 8,968 | — | 11.7 | ||||
Other liabilities accounts | 6,231 | 19.3 | (16.8 | ) | |||
Total liabilities | 299,759 | (2.3 | ) | (8.7 | ) | ||
Total equity | 16,019 | (2.3 | ) | 5.2 | |||
Memorandum items: | |||||||
Gross loans and advances to customers (2) | 192,490 | 0.6 | (4.4 | ) | |||
Customer funds | 293,889 | (4.8 | ) | (4.2 | ) | ||
Customer deposits (3) | 234,716 | (2.3 | ) | (3.0 | ) | ||
Mutual funds | 59,173 | (13.8 | ) | (8.8 | ) | ||
Ratios (%) and operating means | |||||||
Underlying RoTE | 9.00 | (1.26 | ) | (0.61 | ) | ||
Efficiency ratio | 52.8 | (1.2 | ) | (2.4 | ) | ||
NPL ratio | 6.88 | (0.06 | ) | (0.41 | ) | ||
NPL coverage | 42.0 | 0.9 | (1.3 | ) | |||
Number of employees | 27,354 | (1.0 | ) | (12.7 | ) | ||
Number of branches | 3,222 | (0.4 | ) | (26.2 | ) | ||
(1) Includes exchange differences.
(2) Excluding reverse repos.
(3) Excluding repos.
62 | | January - March 2020 |
Santander Consumer Finance | |||||||||||
EUR million | |||||||||||
/ | Q4'19 | / | Q1'19 | ||||||||
Underlying income statement | Q1'20 | % | % excl. FX | % | % excl. FX | ||||||
Net interest income | 979 | 1.9 | 2.5 | 4.0 | 5.2 | ||||||
Net fee income | 187 | (4.4 | ) | (4.2 | ) | (12.8 | ) | (12.5 | ) | ||
Gains (losses) on financial transactions (1) | (9 | ) | 171.8 | 177.3 | — | — | |||||
Other operating income | 15 | (54.9 | ) | (54.9 | ) | 34.2 | 35.5 | ||||
Total income | 1,171 | (1.2 | ) | (0.7 | ) | 0.3 | 1.2 | ||||
Administrative expenses and amortisations | (514 | ) | 3.0 | 3.4 | 1.2 | 2.1 | |||||
Net operating income | 656 | (4.3 | ) | (3.8 | ) | (0.4 | ) | 0.6 | |||
Net loan-loss provisions | (172 | ) | 15.9 | 17.7 | 41.4 | 44.3 | |||||
Other gains (losses) and provisions | 44 | — | — | 85.4 | 84.0 | ||||||
Profit before tax | 528 | 4.8 | 5.3 | (5.9 | ) | (5.2 | ) | ||||
Tax on profit | (149 | ) | 35.0 | 35.4 | (6.5 | ) | (5.9 | ) | |||
Profit from continuing operations | 380 | (3.7 | ) | (3.2 | ) | (5.6 | ) | (4.9 | ) | ||
Net profit from discontinued operations | — | — | — | — | — | ||||||
Consolidated profit | 380 | (3.7 | ) | (3.2 | ) | (5.6 | ) | (4.9 | ) | ||
Non-controlling interests | (76 | ) | 0.1 | 0.1 | (3.1 | ) | (3.1 | ) | |||
Underlying attributable profit to the parent | 304 | (4.6 | ) | (4.0 | ) | (6.2 | ) | (5.3 | ) | ||
Balance sheet | |||||||||||
Loans and advances to customers | 99,989 | (2.2 | ) | (0.2 | ) | 4.4 | 7.0 | ||||
Cash, central banks and credit institutions | 12,186 | 47.6 | 51.7 | 93.5 | 100.4 | ||||||
Debt instruments | 2,710 | (15.2 | ) | (10.6 | ) | (21.3 | ) | (17.7 | ) | ||
Other financial assets | 39 | 18.2 | 20.6 | 18.0 | 20.9 | ||||||
Other asset accounts | 3,986 | (0.4 | ) | 1.0 | 6.9 | 8.6 | |||||
Total assets | 118,911 | 1.0 | 3.2 | 8.8 | 11.6 | ||||||
Customer deposits | 38,119 | (3.7 | ) | (1.0 | ) | 3.3 | 6.4 | ||||
Central banks and credit institutions | 28,302 | 12.5 | 14.3 | 14.3 | 16.6 | ||||||
Marketable debt securities | 36,931 | 0.4 | 2.2 | 15.2 | 17.9 | ||||||
Other financial liabilities | 1,080 | (23.6 | ) | (22.3 | ) | (9.6 | ) | (8.4 | ) | ||
Other liabilities accounts | 3,476 | (10.1 | ) | (8.8 | ) | (7.4 | ) | (6.2 | ) | ||
Total liabilities | 107,909 | 1.0 | 3.2 | 9.4 | 12.1 | ||||||
Total equity | 11,001 | 0.6 | 3.8 | 3.8 | 7.2 | ||||||
Memorandum items: | |||||||||||
Gross loans and advances to customers (2) | 102,542 | (2.1 | ) | — | 4.5 | 7.1 | |||||
Customer funds | 38,119 | (3.7 | ) | (1.0 | ) | 3.4 | 6.6 | ||||
Customer deposits (3) | 38,119 | (3.7 | ) | (1.0 | ) | 3.4 | 6.6 | ||||
Mutual funds | — | — | — | — | — | ||||||
Ratios (%) and operating means | |||||||||||
Underlying RoTE | 13.86 | (0.76 | ) | (0.99 | ) | ||||||
Efficiency ratio | 43.9 | 1.8 | 0.4 | ||||||||
NPL ratio | 2.43 | 0.13 | 0.10 | ||||||||
NPL coverage | 103.8 | (2.3 | ) | (1.5 | ) | ||||||
Number of employees | 13,859 | (4.1 | ) | (6.3 | ) | ||||||
Number of branches | 417 | 0.2 | (3.7 | ) | |||||||
(1) Includes exchange differences.
(2) Excluding reverse repos.
(3) Excluding repos.
January - March 2020 | | 63 |
United Kingdom | |||||||||||
EUR million | |||||||||||
/ | Q4'19 | / | Q1'19 | ||||||||
Underlying income statement | Q1'20 | % | % excl. FX | % | % excl. FX | ||||||
Net interest income | 898 | (6.5 | ) | (6.4 | ) | (7.8 | ) | (9.0 | ) | ||
Net fee income | 193 | (14.4 | ) | (14.4 | ) | (10.7 | ) | (11.8 | ) | ||
Gains (losses) on financial transactions (1) | (7 | ) | — | — | — | — | |||||
Other operating income | 13 | (49.3 | ) | (49.8 | ) | (6.9 | ) | (8.1 | ) | ||
Total income | 1,098 | (10.0 | ) | (9.9 | ) | (9.0 | ) | (10.1 | ) | ||
Administrative expenses and amortisations | (714 | ) | 0.3 | 0.4 | (3.4 | ) | (4.6 | ) | |||
Net operating income | 384 | (24.4 | ) | (24.4 | ) | (17.8 | ) | (18.8 | ) | ||
Net loan-loss provisions | (49 | ) | (48.6 | ) | (49.0 | ) | (18.6 | ) | (19.6 | ) | |
Other gains (losses) and provisions | (74 | ) | 12.1 | 11.4 | 49.4 | 47.5 | |||||
Profit before tax | 260 | (24.6 | ) | (24.4 | ) | (27.0 | ) | (27.9 | ) | ||
Tax on profit | (66 | ) | (26.1 | ) | (26.0 | ) | (31.6 | ) | (32.4 | ) | |
Profit from continuing operations | 194 | (24.1 | ) | (23.8 | ) | (25.3 | ) | (26.3 | ) | ||
Net profit from discontinued operations | — | — | — | — | — | ||||||
Consolidated profit | 194 | (24.1 | ) | (23.8 | ) | (25.3 | ) | (26.3 | ) | ||
Non-controlling interests | (6 | ) | (0.3 | ) | (0.3 | ) | 15.2 | 13.7 | |||
Underlying attributable profit to the parent | 188 | (24.7 | ) | (24.4 | ) | (26.2 | ) | (27.1 | ) | ||
Balance sheet | |||||||||||
Loans and advances to customers | 267,963 | (2.0 | ) | 2.1 | 1.7 | 5.0 | |||||
Cash, central banks and credit institutions | 37,568 | (4.4 | ) | (0.4 | ) | (0.6 | ) | 2.7 | |||
Debt instruments | 16,943 | (16.1 | ) | (12.6 | ) | (28.6 | ) | (26.2 | ) | ||
Other financial assets | 1,103 | 17.0 | 21.9 | 46.3 | 51.1 | ||||||
Other asset accounts | 12,276 | 44.5 | 50.5 | 19.6 | 23.6 | ||||||
Total assets | 335,852 | (1.9 | ) | 2.2 | (0.1 | ) | 3.2 | ||||
Customer deposits | 216,059 | (5.8 | ) | (1.9 | ) | (0.4 | ) | 2.9 | |||
Central banks and credit institutions | 30,219 | 20.5 | 25.6 | 19.7 | 23.7 | ||||||
Marketable debt securities | 64,066 | (0.4 | ) | 3.7 | (5.2 | ) | (2.1 | ) | |||
Other financial liabilities | 3,112 | 16.5 | 21.4 | (29.6 | ) | (27.3 | ) | ||||
Other liabilities accounts | 5,071 | 15.0 | 19.8 | 10.9 | 14.6 | ||||||
Total liabilities | 318,528 | (2.2 | ) | 1.8 | — | 3.2 | |||||
Total equity | 17,324 | 4.3 | 8.6 | (0.6 | ) | 2.7 | |||||
Memorandum items: | |||||||||||
Gross loans and advances to customers (2) | 243,599 | (2.3 | ) | 1.8 | 1.3 | 4.7 | |||||
Customer funds | 210,269 | (4.0 | ) | 0.1 | 0.2 | 3.5 | |||||
Customer deposits (3) | 203,423 | (3.5 | ) | 0.6 | 0.9 | 4.3 | |||||
Mutual funds | 6,846 | (16.7 | ) | (13.2 | ) | (17.3 | ) | (14.6 | ) | ||
Ratios (%) and operating means | |||||||||||
Underlying RoTE | 5.16 | (1.57 | ) | (1.75 | ) | ||||||
Efficiency ratio | 65.0 | 6.7 | 3.8 | ||||||||
NPL ratio | 0.96 | (0.05 | ) | (0.21 | ) | ||||||
NPL coverage | 37.7 | 1.2 | 6.8 | ||||||||
Number of employees | 24,500 | — | (3.9 | ) | |||||||
Number of branches | 615 | (0.2 | ) | (18.4 | ) | ||||||
(1) Includes exchange differences.
(2) Excluding reverse repos.
(3) Excluding repos.
64 | | January - March 2020 |
Portugal | |||||||
EUR million | |||||||
/ Q4'19 | / Q1'19 | ||||||
Underlying income statement | Q1'20 | % | % | ||||
Net interest income | 202 | (5.2 | ) | (6.4 | ) | ||
Net fee income | 101 | 3.4 | 3.1 | ||||
Gains (losses) on financial transactions (1) | 56 | 442.4 | 12.8 | ||||
Other operating income | (9 | ) | — | 47.5 | |||
Total income | 350 | 5.6 | (2.0 | ) | |||
Administrative expenses and amortisations | (151 | ) | (3.3 | ) | (4.0 | ) | |
Net operating income | 199 | 13.6 | (0.4 | ) | |||
Net loan-loss provisions | (5 | ) | 31.1 | — | |||
Other gains (losses) and provisions | (21 | ) | — | 6.0 | |||
Profit before tax | 173 | (10.1 | ) | (10.6 | ) | ||
Tax on profit | (53 | ) | 1.6 | (9.0 | ) | ||
Profit from continuing operations | 120 | (14.4 | ) | (11.4 | ) | ||
Net profit from discontinued operations | — | — | — | ||||
Consolidated profit | 120 | (14.4 | ) | (11.4 | ) | ||
Non-controlling interests | — | (44.1 | ) | (18.5 | ) | ||
Underlying attributable profit to the parent | 120 | (14.3 | ) | (11.3 | ) | ||
Balance sheet | |||||||
Loans and advances to customers | 36,366 | 2.7 | 2.7 | ||||
Cash, central banks and credit institutions | 5,138 | 9.9 | 22.5 | ||||
Debt instruments | 11,346 | (9.8 | ) | (14.0 | ) | ||
Other financial assets | 1,552 | (8.5 | ) | (15.7 | ) | ||
Other asset accounts | 1,684 | (4.8 | ) | (14.6 | ) | ||
Total assets | 56,086 | (0.1 | ) | (0.9 | ) | ||
Customer deposits | 38,882 | (1.0 | ) | 1.7 | |||
Central banks and credit institutions | 7,997 | (0.1 | ) | (1.9 | ) | ||
Marketable debt securities | 3,337 | (1.4 | ) | (21.1 | ) | ||
Other financial liabilities | 301 | 8.8 | 5.3 | ||||
Other liabilities accounts | 1,666 | 9.9 | 17.5 | ||||
Total liabilities | 52,183 | (0.5 | ) | (0.3 | ) | ||
Total equity | 3,903 | 5.8 | (9.0 | ) | |||
Memorandum items: | |||||||
Gross loans and advances to customers (2) | 37,286 | 2.7 | 2.2 | ||||
Customer funds | 41,583 | (1.8 | ) | 3.3 | |||
Customer deposits (3) | 38,882 | (1.0 | ) | 1.7 | |||
Mutual funds | 2,700 | (11.9 | ) | 35.0 | |||
Ratios (%) and operating means | |||||||
Underlying RoTE | 12.91 | (1.39 | ) | (0.14 | ) | ||
Efficiency ratio | 43.1 | (4.0 | ) | (0.9 | ) | ||
NPL ratio | 4.56 | (0.27 | ) | (1.21 | ) | ||
NPL coverage | 54.8 | 2.0 | 4.1 | ||||
Number of employees | 6,512 | (1.1 | ) | (3.3 | ) | ||
Number of branches | 529 | (2.4 | ) | (5.7 | ) | ||
(1) Includes exchange differences.
(2) Excluding reverse repos.
(3) Excluding repos.
January - March 2020 | | 65 |
Poland | |||||||||||
EUR million | |||||||||||
/ | Q4'19 | / | Q1'19 | ||||||||
Underlying income statement | Q1'20 | % | % excl. FX | % | % excl. FX | ||||||
Net interest income | 296 | (3.7 | ) | (2.9 | ) | 5.3 | 5.8 | ||||
Net fee income | 116 | (0.9 | ) | — | 2.6 | 3.1 | |||||
Gains (losses) on financial transactions (1) | 8 | (72.0 | ) | (71.8 | ) | (54.9 | ) | (54.7 | ) | ||
Other operating income | (56 | ) | — | — | 55.5 | 56.2 | |||||
Total income | 365 | (20.5 | ) | (19.9 | ) | (3.3 | ) | (2.8 | ) | ||
Administrative expenses and amortisations | (172 | ) | 1.3 | 2.2 | (0.9 | ) | (0.5 | ) | |||
Net operating income | 193 | (33.3 | ) | (32.8 | ) | (5.3 | ) | (4.8 | ) | ||
Net loan-loss provisions | (68 | ) | 33.5 | 34.6 | 56.5 | 57.2 | |||||
Other gains (losses) and provisions | (36 | ) | 4.8 | 5.7 | 6.8 | 7.2 | |||||
Profit before tax | 90 | (56.3 | ) | (55.9 | ) | (29.4 | ) | (29.1 | ) | ||
Tax on profit | (35 | ) | (33.0 | ) | (32.4 | ) | (6.7 | ) | (6.2 | ) | |
Profit from continuing operations | 55 | (64.2 | ) | (63.9 | ) | (39.0 | ) | (38.7 | ) | ||
Net profit from discontinued operations | — | — | — | — | — | ||||||
Consolidated profit | 55 | (64.2 | ) | (63.9 | ) | (39.0 | ) | (38.7 | ) | ||
Non-controlling interests | (17 | ) | (65.3 | ) | (65.0 | ) | (40.1 | ) | (39.8 | ) | |
Underlying attributable profit to the parent | 38 | (63.7 | ) | (63.4 | ) | (38.4 | ) | (38.2 | ) | ||
Balance sheet | |||||||||||
Loans and advances to customers | 29,220 | (2.7 | ) | 4.0 | 2.8 | 8.8 | |||||
Cash, central banks and credit institutions | 3,547 | 4.4 | 11.6 | 32.8 | 40.5 | ||||||
Debt instruments | 8,574 | (7.7 | ) | (1.3 | ) | (23.9 | ) | (19.4 | ) | ||
Other financial assets | 741 | 17.7 | 25.8 | 36.2 | 44.1 | ||||||
Other asset accounts | 1,334 | (0.5 | ) | 6.4 | 1.9 | 7.8 | |||||
Total assets | 43,417 | (2.8 | ) | 3.9 | (1.8 | ) | 3.9 | ||||
Customer deposits | 31,687 | (5.4 | ) | 1.2 | (2.3 | ) | 3.4 | ||||
Central banks and credit institutions | 2,475 | 6.8 | 14.1 | (26.1 | ) | (21.8 | ) | ||||
Marketable debt securities | 2,360 | 8.7 | 16.2 | 31.6 | 39.2 | ||||||
Other financial liabilities | 826 | 8.4 | 15.9 | 10.2 | 16.7 | ||||||
Other liabilities accounts | 1,217 | 31.9 | 41.0 | 48.5 | 57.2 | ||||||
Total liabilities | 38,565 | (2.8 | ) | 4.0 | (1.5 | ) | 4.2 | ||||
Total equity | 4,852 | (3.5 | ) | 3.1 | (4.1 | ) | 1.5 | ||||
Memorandum items: | |||||||||||
Gross loans and advances to customers (2) | 30,076 | (2.7 | ) | 4.0 | 2.6 | 8.5 | |||||
Customer funds | 34,661 | (8.6 | ) | (2.3 | ) | (1.5 | ) | 4.2 | |||
Customer deposits (3) | 31,673 | (5.4 | ) | 1.1 | 1.8 | 7.7 | |||||
Mutual funds | 2,988 | (32.8 | ) | (28.1 | ) | (26.6 | ) | (22.3 | ) | ||
Ratios (%) and operating means | |||||||||||
Underlying RoTE | 4.73 | (8.60 | ) | (3.03 | ) | ||||||
Efficiency ratio | 47.1 | 10.2 | 1.1 | ||||||||
NPL ratio | 4.29 | (0.02 | ) | (0.10 | ) | ||||||
NPL coverage | 66.2 | (0.6 | ) | (1.4 | ) | ||||||
Number of employees | 11,034 | (0.1 | ) | (12.1 | ) | ||||||
Number of branches | 535 | 3.9 | (6.3 | ) | |||||||
(1) Includes exchange differences.
(2) Excluding reverse repos.
(3) Excluding repos.
66 | | January - March 2020 |
Other Europe | |||||||||||
EUR million | |||||||||||
/ | Q4'19 | / | Q1'19 | ||||||||
Underlying income statement | Q1'20 | % | % excl. FX | % | % excl. FX | ||||||
Net interest income | 134 | (13.2 | ) | (13.3 | ) | (3.4 | ) | (3.6 | ) | ||
Net fee income | 74 | 17.3 | 17.3 | 20.1 | 19.0 | ||||||
Gains (losses) on financial transactions (1) | (62 | ) | — | — | — | — | |||||
Other operating income | 55 | (18.5 | ) | (18.6 | ) | (13.1 | ) | (13.1 | ) | ||
Total income | 202 | (29.3 | ) | (29.4 | ) | (22.5 | ) | (23.0 | ) | ||
Administrative expenses and amortisations | (216 | ) | (1.4 | ) | (1.6 | ) | 8.3 | 7.6 | |||
Net operating income | (14 | ) | — | — | — | — | |||||
Net loan-loss provisions | (9 | ) | (61.9 | ) | (61.9 | ) | 294.6 | 294.8 | |||
Other gains (losses) and provisions | (4 | ) | — | — | (33.7 | ) | (33.7 | ) | |||
Profit before tax | (27 | ) | — | — | — | — | |||||
Tax on profit | (1 | ) | (95.6 | ) | (95.6 | ) | (95.2 | ) | (95.2 | ) | |
Profit from continuing operations | (28 | ) | — | — | — | — | |||||
Net profit from discontinued operations | — | — | — | — | — | ||||||
Consolidated profit | (28 | ) | — | — | — | — | |||||
Non-controlling interests | — | — | — | — | — | ||||||
Underlying attributable profit to the parent | (28 | ) | — | — | — | — | |||||
Balance sheet | |||||||||||
Loans and advances to customers | 61,240 | 21.3 | 20.7 | 59.2 | 58.4 | ||||||
Cash, central banks and credit institutions | 52,765 | 13.7 | 13.8 | 5.1 | 5.0 | ||||||
Debt instruments | 18,088 | (27.2 | ) | (27.3 | ) | (19.3 | ) | (19.5 | ) | ||
Other financial assets | 55,945 | 13.7 | 13.7 | 13.4 | 13.3 | ||||||
Other asset accounts | 3,207 | 64.1 | 61.1 | 14.2 | 12.7 | ||||||
Total assets | 191,246 | 10.6 | 10.4 | 17.2 | 16.9 | ||||||
Customer deposits | 21,378 | 17.2 | 16.8 | 5.0 | 4.7 | ||||||
Central banks and credit institutions | 108,792 | 4.6 | 4.4 | 16.0 | 15.7 | ||||||
Marketable debt securities | (185 | ) | — | — | — | — | |||||
Other financial liabilities | 57,827 | 23.8 | 23.8 | 26.8 | 26.8 | ||||||
Other liabilities accounts | 219 | (51.1 | ) | (51.3 | ) | (41.4 | ) | (41.8 | ) | ||
Total liabilities | 188,033 | 11.0 | 10.8 | 17.4 | 17.2 | ||||||
Total equity | 3,213 | (7.4 | ) | (8.4 | ) | 6.0 | 4.8 | ||||
Memorandum items: | |||||||||||
Gross loans and advances to customers (2) | 46,658 | 22.7 | 22.0 | 37.8 | 37.1 | ||||||
Customer funds | 25,585 | 8.9 | 8.7 | 8.8 | 8.5 | ||||||
Customer deposits (3) | 20,518 | 12.7 | 12.5 | 2.4 | 2.1 | ||||||
Mutual funds | 5,067 | (4.2 | ) | (4.2 | ) | 46.0 | 46.0 | ||||
Resources | |||||||||||
Number of employees | 2,546 | 7.2 | 17.4 | ||||||||
(1) Includes exchange differences.
(2) Excluding reverse repos.
(3) Excluding repos.
January - March 2020 | | 67 |
NORTH AMERICA | |||||||||||
EUR million | |||||||||||
/ | Q4'19 | / | Q1'19 | ||||||||
Underlying income statement | Q1'20 | % | % excl. FX | % | % excl. FX | ||||||
Net interest income | 2,261 | (0.2 | ) | 0.5 | 4.0 | 2.2 | |||||
Net fee income | 461 | 7.9 | 9.1 | 5.0 | 3.5 | ||||||
Gains (losses) on financial transactions (1) | 68 | (17.6 | ) | (16.8 | ) | 464.1 | 441.9 | ||||
Other operating income | 146 | (16.1 | ) | (16.5 | ) | 12.7 | 8.6 | ||||
Total income | 2,936 | (0.4 | ) | 0.2 | 6.6 | 4.7 | |||||
Administrative expenses and amortisations | (1,224 | ) | (6.9 | ) | (6.4 | ) | 4.4 | 2.5 | |||
Net operating income | 1,712 | 4.7 | 5.6 | 8.3 | 6.3 | ||||||
Net loan-loss provisions | (874 | ) | (16.8 | ) | (16.7 | ) | 8.6 | 6.3 | |||
Other gains (losses) and provisions | (14 | ) | (55.4 | ) | (55.5 | ) | (78.3 | ) | (78.8 | ) | |
Profit before tax | 824 | 48.9 | 52.2 | 15.6 | 14.0 | ||||||
Tax on profit | (211 | ) | 60.2 | 63.5 | 12.7 | 10.9 | |||||
Profit from continuing operations | 613 | 45.4 | 48.7 | 16.6 | 15.2 | ||||||
Net profit from discontinued operations | — | — | — | — | — | ||||||
Consolidated profit | 613 | 45.4 | 48.7 | 16.6 | 15.2 | ||||||
Non-controlling interests | (91 | ) | 177.9 | 192.6 | (34.8 | ) | (35.7 | ) | |||
Underlying attributable profit to the parent | 522 | 34.2 | 37.0 | 35.1 | 33.5 | ||||||
Balance sheet | |||||||||||
Loans and advances to customers | 135,826 | 1.6 | 4.8 | 9.2 | 12.2 | ||||||
Cash, central banks and credit institutions | 33,173 | 45.0 | 55.7 | 1.4 | 8.2 | ||||||
Debt instruments | 30,262 | (10.3 | ) | (2.2 | ) | 23.1 | 31.5 | ||||
Other financial assets | 18,150 | 68.7 | 88.1 | 114.4 | 135.4 | ||||||
Other asset accounts | 23,183 | 1.9 | 3.1 | 14.7 | 15.4 | ||||||
Total assets | 240,593 | 7.5 | 12.4 | 14.4 | 18.8 | ||||||
Customer deposits | 117,771 | 19.1 | 25.6 | 17.1 | 22.6 | ||||||
Central banks and credit institutions | 31,082 | (20.2 | ) | (15.9 | ) | 33.0 | 41.7 | ||||
Marketable debt securities | 42,024 | (4.7 | ) | (3.9 | ) | (10.0 | ) | (10.0 | ) | ||
Other financial liabilities | 19,555 | 66.2 | 87.6 | 79.3 | 100.5 | ||||||
Other liabilities accounts | 6,652 | 6.7 | 12.1 | 18.1 | 23.4 | ||||||
Total liabilities | 217,084 | 8.6 | 13.8 | 16.0 | 20.7 | ||||||
Total equity | 23,509 | (1.6 | ) | 1.6 | 1.1 | 3.8 | |||||
Memorandum items: | |||||||||||
Gross loans and advances to customers (2) | 131,913 | 1.0 | 4.3 | 9.4 | 12.5 | ||||||
Customer funds | 119,985 | 5.8 | 11.6 | 9.5 | 15.2 | ||||||
Customer deposits (3) | 101,389 | 9.9 | 14.9 | 13.6 | 18.5 | ||||||
Mutual funds | 18,596 | (12.2 | ) | (3.7 | ) | (8.4 | ) | (0.1 | ) | ||
Ratios (%) and operating means | |||||||||||
Underlying RoTE | 9.92 | 2.52 | 1.47 | ||||||||
Efficiency ratio | 41.7 | (2.9 | ) | (0.9 | ) | ||||||
NPL ratio | 2.02 | (0.18 | ) | (0.31 | ) | ||||||
NPL coverage | 157.6 | 4.6 | 4.2 | ||||||||
Number of employees | 37,398 | (1.2 | ) | 0.7 | |||||||
Number of branches | 2,048 | 0.2 | (1.1 | ) | |||||||
(1) Includes exchange differences.
(2) Excluding reverse repos.
(3) Excluding repos.
68 | | January - March 2020 |
United States | |||||||||||
EUR million | |||||||||||
/ | Q4'19 | / | Q1'19 | ||||||||
Underlying income statement | Q1'20 | % | % excl. FX | % | % excl. FX | ||||||
Net interest income | 1,462 | 0.9 | 0.5 | 3.9 | 0.9 | ||||||
Net fee income | 250 | 8.5 | 8.1 | 6.6 | 3.5 | ||||||
Gains (losses) on financial transactions (1) | 46 | 39.0 | 38.4 | 193.1 | 184.5 | ||||||
Other operating income | 170 | (6.2 | ) | (6.5 | ) | 8.1 | 4.9 | ||||
Total income | 1,929 | 1.8 | 1.4 | 6.3 | 3.2 | ||||||
Administrative expenses and amortisations | (809 | ) | (6.9 | ) | (7.4 | ) | 4.3 | 1.3 | |||
Net operating income | 1,120 | 9.2 | 8.9 | 7.8 | 4.6 | ||||||
Net loan-loss provisions | (646 | ) | (22.0 | ) | (22.5 | ) | 5.7 | 2.6 | |||
Other gains (losses) and provisions | (6 | ) | (84.0 | ) | (84.0 | ) | (89.3 | ) | (89.6 | ) | |
Profit before tax | 468 | 195.6 | 199.4 | 26.4 | 22.7 | ||||||
Tax on profit | (124 | ) | 149.4 | 151.7 | 12.0 | 8.7 | |||||
Profit from continuing operations | 344 | 216.7 | 221.2 | 32.6 | 28.7 | ||||||
Net profit from discontinued operations | — | — | — | — | — | ||||||
Consolidated profit | 344 | 216.7 | 221.2 | 32.6 | 28.7 | ||||||
Non-controlling interests | (71 | ) | 571.4 | 617.0 | (9.2 | ) | (11.8 | ) | |||
Underlying attributable profit to the parent | 273 | 178.5 | 180.9 | 50.6 | 46.1 | ||||||
Balance sheet | |||||||||||
Loans and advances to customers | 104,889 | 6.3 | 3.6 | 14.9 | 12.0 | ||||||
Cash, central banks and credit institutions | 19,765 | 54.1 | 50.3 | 9.4 | 6.7 | ||||||
Debt instruments | 15,959 | (4.3 | ) | (6.7 | ) | 18.8 | 15.9 | ||||
Other financial assets | 7,249 | 67.8 | 63.7 | 104.4 | 99.3 | ||||||
Other asset accounts | 19,897 | 5.4 | 2.8 | 17.4 | 14.5 | ||||||
Total assets | 167,759 | 10.8 | 8.1 | 17.1 | 14.1 | ||||||
Customer deposits | 83,705 | 32.1 | 28.8 | 29.1 | 25.9 | ||||||
Central banks and credit institutions | 18,220 | (27.5 | ) | (29.3 | ) | 39.7 | 36.2 | ||||
Marketable debt securities | 36,086 | (2.8 | ) | (5.2 | ) | (11.6 | ) | (13.8 | ) | ||
Other financial liabilities | 7,402 | 78.5 | 74.1 | 103.2 | 98.1 | ||||||
Other liabilities accounts | 4,254 | 3.9 | 1.4 | 15.3 | 12.5 | ||||||
Total liabilities | 149,668 | 11.8 | 9.0 | 18.7 | 15.8 | ||||||
Total equity | 18,091 | 3.1 | 0.5 | 4.8 | 2.2 | ||||||
Memorandum items: | |||||||||||
Gross loans and advances to customers (2) | 101,146 | 5.6 | 3.0 | 15.3 | 12.4 | ||||||
Customer funds | 82,155 | 13.2 | 10.4 | 20.9 | 17.9 | ||||||
Customer deposits (3) | 72,884 | 16.4 | 13.5 | 23.8 | 20.7 | ||||||
Mutual funds | 9,271 | (7.3) | (9.5) | 1.9 | (0.6) | ||||||
Ratios (%) and operating means | |||||||||||
Underlying RoTE | 6.98 | 4.49 | 1.91 | ||||||||
Efficiency ratio | 41.9 | (3.9 | ) | (0.8 | ) | ||||||
NPL ratio | 2.00 | (0.20 | ) | (0.41 | ) | ||||||
NPL coverage | 166.8 | 5.0 | 5.8 | ||||||||
Number of employees | 17,277 | (0.5 | ) | — | |||||||
Number of branches | 619 | (0.3 | ) | (6.1 | ) | ||||||
(1) Includes exchange differences.
(2) Excluding reverse repos.
(3) Excluding repos.
January - March 2020 | | 69 |
Mexico | |||||||||||
EUR million | |||||||||||
/ | Q4'19 | / | Q1'19 | ||||||||
Underlying income statement | Q1'20 | % | % excl. FX | % | % excl. FX | ||||||
Net interest income | 798 | (2.1 | ) | 0.5 | 4.2 | 4.7 | |||||
Net fee income | 211 | 7.2 | 10.2 | 3.2 | 3.6 | ||||||
Gains (losses) on financial transactions (1) | 22 | (56.0 | ) | (55.2 | ) | — | — | ||||
Other operating income | (24 | ) | 229.8 | 249.0 | (13.6 | ) | (13.2 | ) | |||
Total income | 1,007 | (4.5 | ) | (1.9 | ) | 7.2 | 7.7 | ||||
Administrative expenses and amortisations | (415 | ) | (6.8 | ) | (4.3 | ) | 4.6 | 5.0 | |||
Net operating income | 592 | (2.8 | ) | (0.2 | ) | 9.2 | 9.7 | ||||
Net loan-loss provisions | (228 | ) | 2.7 | 5.5 | 17.9 | 18.4 | |||||
Other gains (losses) and provisions | (8 | ) | — | — | 38.0 | 38.6 | |||||
Profit before tax | 357 | (9.8 | ) | (7.4 | ) | 3.9 | 4.3 | ||||
Tax on profit | (88 | ) | 6.5 | 9.4 | 13.7 | 14.2 | |||||
Profit from continuing operations | 269 | (14.1 | ) | (11.8 | ) | 1.1 | 1.5 | ||||
Net profit from discontinued operations | — | — | — | — | — | ||||||
Consolidated profit | 269 | (14.1 | ) | (11.8 | ) | 1.1 | 1.5 | ||||
Non-controlling interests | (20 | ) | (10.2 | ) | (6.1 | ) | (67.5 | ) | (67.3 | ) | |
Underlying attributable profit to the parent | 249 | (14.4 | ) | (12.3 | ) | 21.5 | 22.0 | ||||
Balance sheet | |||||||||||
Loans and advances to customers | 30,937 | (11.7 | ) | 9.0 | (6.4 | ) | 12.9 | ||||
Cash, central banks and credit institutions | 13,408 | 33.3 | 64.5 | (8.5 | ) | 10.4 | |||||
Debt instruments | 14,303 | (16.2 | ) | 3.4 | 28.3 | 54.9 | |||||
Other financial assets | 10,901 | 69.3 | 108.8 | 121.7 | 167.5 | ||||||
Other asset accounts | 3,286 | (14.8 | ) | 5.1 | 0.6 | 21.4 | |||||
Total assets | 72,834 | 0.5 | 24.0 | 8.6 | 31.1 | ||||||
Customer deposits | 34,066 | (4.2 | ) | 18.2 | (4.5 | ) | 15.2 | ||||
Central banks and credit institutions | 12,862 | (6.9 | ) | 14.8 | 24.5 | 50.3 | |||||
Marketable debt securities | 5,938 | (14.7 | ) | 5.2 | 1.8 | 22.8 | |||||
Other financial liabilities | 12,152 | 59.5 | 96.8 | 67.3 | 101.9 | ||||||
Other liabilities accounts | 2,398 | 11.8 | 38.0 | 23.5 | 49.0 | ||||||
Total liabilities | 67,416 | 2.0 | 25.8 | 10.4 | 33.3 | ||||||
Total equity | 5,418 | (14.7 | ) | 5.2 | (9.4 | ) | 9.3 | ||||
Memorandum items: | |||||||||||
Gross loans and advances to customers (2) | 30,768 | (11.7 | ) | 8.9 | (6.4 | ) | 13.0 | ||||
Customer funds | 37,830 | (7.3 | ) | 14.4 | (9.1 | ) | 9.7 | ||||
Customer deposits (3) | 28,505 | (3.8 | ) | 18.7 | (6.3 | ) | 13.1 | ||||
Mutual funds | 9,325 | (16.6 | ) | 2.9 | (16.8 | ) | 0.4 | ||||
Ratios (%) and operating means | |||||||||||
Underlying RoTE | 17.96 | (3.13 | ) | (2.15 | ) | ||||||
Efficiency ratio | 41.2 | (1.0 | ) | (1.1 | ) | ||||||
NPL ratio | 2.07 | (0.12 | ) | (0.05 | ) | ||||||
NPL coverage | 128.4 | 0.1 | (1.7 | ) | |||||||
Number of employees | 20,121 | (1.8 | ) | 1.3 | |||||||
Number of branches | 1,429 | 0.5 | 1.2 | ||||||||
(1) Includes exchange differences.
(2) Excluding reverse repos.
(3) Excluding repos.
70 | | January - March 2020 |
SOUTH AMERICA | |||||||||||
EUR million | |||||||||||
/ | Q4'19 | / | Q1'19 | ||||||||
Underlying income statement | Q1'20 | % | % excl. FX | % | % excl. FX | ||||||
Net interest income | 3,065 | (8.7 | ) | (3.7 | ) | (4.9 | ) | 10.8 | |||
Net fee income | 1,074 | (12.6 | ) | (8.1 | ) | (8.8 | ) | 6.8 | |||
Gains (losses) on financial transactions (1) | 68 | (46.1 | ) | (44.8 | ) | (57.5 | ) | (48.4 | ) | ||
Other operating income | (43 | ) | — | 559.4 | (40.1 | ) | (22.9 | ) | |||
Total income | 4,163 | (11.7 | ) | (6.8 | ) | (7.2 | ) | 8.2 | |||
Administrative expenses and amortisations | (1,486 | ) | (15.6 | ) | (11.6 | ) | (9.7 | ) | 6.6 | ||
Net operating income | 2,677 | (9.3 | ) | (3.8 | ) | (5.8 | ) | 9.1 | |||
Net loan-loss provisions | (875 | ) | (13.8 | ) | (8.4 | ) | (3.1 | ) | 13.1 | ||
Other gains (losses) and provisions | (142 | ) | (43.2 | ) | (39.7 | ) | (8.1 | ) | 8.2 | ||
Profit before tax | 1,661 | (1.6 | ) | 4.2 | (7.0 | ) | 7.1 | ||||
Tax on profit | (603 | ) | 3.7 | 9.7 | (12.8 | ) | 0.6 | ||||
Profit from continuing operations | 1,057 | (4.4 | ) | 1.3 | (3.2 | ) | 11.3 | ||||
Net profit from discontinued operations | — | — | — | — | — | ||||||
Consolidated profit | 1,057 | (4.4 | ) | 1.3 | (3.2 | ) | 11.3 | ||||
Non-controlling interests | (130 | ) | (18.6 | ) | (13.1 | ) | (22.4 | ) | (10.4 | ) | |
Underlying attributable profit to the parent | 928 | (2.1 | ) | 3.8 | 0.2 | 15.2 | |||||
Balance sheet | |||||||||||
Loans and advances to customers | 113,261 | (9.5 | ) | 7.9 | (8.2 | ) | 16.9 | ||||
Cash, central banks and credit institutions | 45,888 | (10.7 | ) | 8.2 | 3.3 | 34.4 | |||||
Debt instruments | 44,696 | (2.0 | ) | 21.4 | (2.8 | ) | 25.7 | ||||
Other financial assets | 19,260 | 30.1 | 52.4 | 114.9 | 173.6 | ||||||
Other asset accounts | 17,137 | 1.4 | 23.0 | 8.8 | 40.3 | ||||||
Total assets | 240,240 | (5.3 | ) | 14.0 | 0.8 | 29.3 | |||||
Customer deposits | 106,432 | (7.3 | ) | 11.2 | (4.5 | ) | 22.7 | ||||
Central banks and credit institutions | 45,699 | 8.8 | 31.7 | 17.8 | 50.5 | ||||||
Marketable debt securities | 26,951 | (9.7 | ) | 8.3 | (13.1 | ) | 10.6 | ||||
Other financial liabilities | 33,522 | (1.6 | ) | 18.9 | 29.4 | 67.2 | |||||
Other liabilities accounts | 8,529 | (19.6 | ) | (1.4 | ) | (4.2 | ) | 23.8 | |||
Total liabilities | 221,134 | (4.4 | ) | 15.1 | 2.3 | 31.3 | |||||
Total equity | 19,106 | (15.0 | ) | 2.7 | (14.4 | ) | 9.7 | ||||
Memorandum items: | |||||||||||
Gross loans and advances to customers (2) | 117,614 | (10.3 | ) | 7.1 | (8.9 | ) | 16.1 | ||||
Customer funds | 148,102 | (13.2 | ) | 5.0 | (9.7 | ) | 16.3 | ||||
Customer deposits (3) | 95,933 | (5.6 | ) | 12.6 | (3.6 | ) | 23.8 | ||||
Mutual funds | 52,169 | (24.5 | ) | (6.6 | ) | (19.1 | ) | 4.6 | |||
Ratios (%) and operating means | |||||||||||
Underlying RoTE | 21.12 | 1.36 | 1.54 | ||||||||
Efficiency ratio | 35.7 | (1.7 | ) | (1.0 | ) | ||||||
NPL ratio | 4.63 | (0.23 | ) | (0.20 | ) | ||||||
NPL coverage | 86.3 | (2.1 | ) | (7.8 | ) | ||||||
Number of employees | 68,624 | (1.3 | ) | (1.9 | ) | ||||||
Number of branches | 4,524 | (1.0 | ) | 0.3 | |||||||
(1) Includes exchange differences.
(2) Excluding reverse repos.
(3) Excluding repos.
January - March 2020 | | 71 |
Brazil | |||||||||||
EUR million | |||||||||||
/ | Q4'19 | / | Q1'19 | ||||||||
Underlying income statement | Q1'20 | % | % excl. FX | % | % excl. FX | ||||||
Net interest income | 2,270 | (10.4 | ) | (3.8 | ) | (7.7 | ) | 5.6 | |||
Net fee income | 869 | (10.7 | ) | (4.0 | ) | (6.6 | ) | 6.8 | |||
Gains (losses) on financial transactions (1) | 14 | (45.7 | ) | (43.2 | ) | (76.0 | ) | (72.6 | ) | ||
Other operating income | (17 | ) | — | — | (54.3 | ) | (47.7 | ) | |||
Total income | 3,137 | (12.0 | ) | (5.4 | ) | (8.0 | ) | 5.1 | |||
Administrative expenses and amortisations | (1,004 | ) | (19.2 | ) | (12.9 | ) | (10.8 | ) | 2.0 | ||
Net operating income | 2,133 | (8.2 | ) | (1.4 | ) | (6.7 | ) | 6.7 | |||
Net loan-loss provisions | (709 | ) | (12.8 | ) | (6.1 | ) | (0.2 | ) | 14.1 | ||
Other gains (losses) and provisions | (127 | ) | (38.1 | ) | (33.2 | ) | (24.2 | ) | (13.3 | ) | |
Profit before tax | 1,298 | (0.6 | ) | 6.4 | (7.9 | ) | 5.3 | ||||
Tax on profit | (529 | ) | 0.1 | 7.1 | (10.6 | ) | 2.2 | ||||
Profit from continuing operations | 768 | (1.1 | ) | 5.9 | (5.9 | ) | 7.6 | ||||
Net profit from discontinued operations | — | — | — | — | — | ||||||
Consolidated profit | 768 | (1.1 | ) | 5.9 | (5.9 | ) | 7.6 | ||||
Non-controlling interests | (74 | ) | (14.8 | ) | (8.8 | ) | (22.3 | ) | (11.2 | ) | |
Underlying attributable profit to the parent | 694 | 0.7 | 7.8 | (3.7 | ) | 10.1 | |||||
Balance sheet | |||||||||||
Loans and advances to customers | 65,970 | (12.8 | ) | 10.1 | (8.0 | ) | 19.5 | ||||
Cash, central banks and credit institutions | 30,070 | (19.7 | ) | 1.3 | (9.8 | ) | 17.2 | ||||
Debt instruments | 37,932 | (4.2 | ) | 20.9 | (7.6 | ) | 20.1 | ||||
Other financial assets | 5,885 | (13.3 | ) | 9.4 | 3.8 | 34.8 | |||||
Other asset accounts | 12,410 | (1.1 | ) | 24.9 | 4.7 | 36.0 | |||||
Total assets | 152,267 | (11.5 | ) | 11.7 | (6.9 | ) | 20.9 | ||||
Customer deposits | 64,578 | (13.6 | ) | 9.1 | (8.1 | ) | 19.4 | ||||
Central banks and credit institutions | 32,941 | 8.6 | 37.1 | 11.0 | 44.3 | ||||||
Marketable debt securities | 16,278 | (14.1 | ) | 8.4 | (18.6 | ) | 5.8 | ||||
Other financial liabilities | 19,126 | (18.9 | ) | 2.3 | (10.1 | ) | 16.8 | ||||
Other liabilities accounts | 6,654 | (22.9 | ) | (2.7 | ) | (8.0 | ) | 19.6 | |||
Total liabilities | 139,577 | (10.7 | ) | 12.8 | (6.0 | ) | 22.2 | ||||
Total equity | 12,689 | (19.6 | ) | 1.5 | (16.5 | ) | 8.5 | ||||
Memorandum items: | |||||||||||
Gross loans and advances to customers (2) | 69,041 | (13.9 | ) | 8.7 | (9.6 | ) | 17.5 | ||||
Customer funds | 98,212 | (19.3 | ) | 1.8 | (13.7 | ) | 12.2 | ||||
Customer deposits (3) | 54,244 | (12.2 | ) | 10.8 | (7.1 | ) | 20.8 | ||||
Mutual funds | 43,969 | (26.7 | ) | (7.4 | ) | (20.6 | ) | 3.1 | |||
Ratios (%) and operating means | |||||||||||
Underlying RoTE | 22.04 | 2.29 | 1.06 | ||||||||
Efficiency ratio | 32.0 | (2.8 | ) | (1.0 | ) | ||||||
NPL ratio | 4.93 | (0.39 | ) | (0.33 | ) | ||||||
NPL coverage | 99.9 | 0.1 | (7.8 | ) | |||||||
Number of employees | 45,807 | (1.9 | ) | (2.1 | ) | ||||||
Number of branches | 3,617 | (1.1 | ) | 1.5 | |||||||
(1) Includes exchange differences.
(2) Excluding reverse repos.
(3) Excluding repos.
72 | | January - March 2020 |
Chile | |||||||||||
EUR million | |||||||||||
/ | Q4'19 | / | Q1'19 | ||||||||
Underlying income statement | Q1'20 | % | % excl. FX | % | % excl. FX | ||||||
Net interest income | 448 | (3.5 | ) | 2.8 | 1.8 | 19.1 | |||||
Net fee income | 92 | (9.9 | ) | (3.9 | ) | (10.4 | ) | 4.8 | |||
Gains (losses) on financial transactions (1) | 13 | (81.5 | ) | (80.2 | ) | (75.5 | ) | (71.3 | ) | ||
Other operating income | (1 | ) | 2.8 | 23.6 | — | — | |||||
Total income | 553 | (13.4 | ) | (7.7 | ) | (7.8 | ) | 7.8 | |||
Administrative expenses and amortisations | (230 | ) | (6.5 | ) | (0.7 | ) | (9.8 | ) | 5.6 | ||
Net operating income | 322 | (17.8 | ) | (12.1 | ) | (6.4 | ) | 9.5 | |||
Net loan-loss provisions | (107 | ) | (17.6 | ) | (11.2 | ) | 4.2 | 21.9 | |||
Other gains (losses) and provisions | 1 | (93.0 | ) | (92.7 | ) | (97.8 | ) | (97.4 | ) | ||
Profit before tax | 216 | (21.1 | ) | (16.1 | ) | (22.6 | ) | (9.4 | ) | ||
Tax on profit | (37 | ) | (19.2 | ) | (14.8 | ) | (39.2 | ) | (28.8 | ) | |
Profit from continuing operations | 180 | (21.5 | ) | (16.4 | ) | (18.0 | ) | (4.1 | ) | ||
Net profit from discontinued operations | — | — | — | — | — | ||||||
Consolidated profit | 180 | (21.5 | ) | (16.4 | ) | (18.0 | ) | (4.1 | ) | ||
Non-controlling interests | (55 | ) | (23.6 | ) | (18.6 | ) | (22.5 | ) | (9.3 | ) | |
Underlying attributable profit to the parent | 125 | (20.6 | ) | (15.4 | ) | (15.9 | ) | (1.6 | ) | ||
Balance sheet | |||||||||||
Loans and advances to customers | 36,595 | (5.2 | ) | 4.8 | (7.7 | ) | 12.8 | ||||
Cash, central banks and credit institutions | 9,322 | 23.4 | 36.3 | 132.7 | 184.6 | ||||||
Debt instruments | 3,850 | (24.0 | ) | (16.0 | ) | 1.8 | 24.5 | ||||
Other financial assets | 13,176 | 67.7 | 85.4 | 316.2 | 408.8 | ||||||
Other asset accounts | 3,429 | 10.9 | 22.6 | 17.9 | 44.2 | ||||||
Total assets | 66,372 | 6.8 | 18.0 | 24.0 | 51.6 | ||||||
Customer deposits | 27,205 | (0.5 | ) | 10.0 | 1.7 | 24.4 | |||||
Central banks and credit institutions | 9,243 | 12.4 | 24.2 | 54.5 | 88.9 | ||||||
Marketable debt securities | 10,475 | (2.3 | ) | 8.0 | (2.1 | ) | 19.7 | ||||
Other financial liabilities | 13,661 | 41.4 | 56.3 | 266.2 | 347.8 | ||||||
Other liabilities accounts | 1,202 | (7.1 | ) | 2.7 | 13.4 | 38.7 | |||||
Total liabilities | 61,786 | 7.9 | 19.3 | 28.1 | 56.7 | ||||||
Total equity | 4,587 | (6.5 | ) | 3.3 | (13.4 | ) | 5.9 | ||||
Memorandum items: | |||||||||||
Gross loans and advances to customers (2) | 37,550 | (5.3 | ) | 4.7 | (8.0 | ) | 12.5 | ||||
Customer funds | 33,939 | (3.3 | ) | 6.9 | (0.7 | ) | 21.5 | ||||
Customer deposits (3) | 27,041 | (0.1 | ) | 10.4 | 1.3 | 23.9 | |||||
Mutual funds | 6,898 | (14.1 | ) | (5.1 | ) | (7.8 | ) | 12.7 | |||
Ratios (%) and operating means | |||||||||||
Underlying RoTE | 15.15 | (3.41 | ) | (1.20 | ) | ||||||
Efficiency ratio | 41.7 | 3.1 | (0.9 | ) | |||||||
NPL ratio | 4.63 | (0.01 | ) | (0.04 | ) | ||||||
NPL coverage | 54.3 | (1.7 | ) | (5.4 | ) | ||||||
Number of employees | 11,437 | (1.2 | ) | (3.8 | ) | ||||||
Number of branches | 366 | (2.4 | ) | (3.7 | ) | ||||||
(1) Includes exchange differences.
(2) Excluding reverse repos.
(3) Excluding repos.
January - March 2020 | | 73 |
Argentina | |||||||||||
EUR million | |||||||||||
/ | Q4'19 | / | Q1'19 | ||||||||
Underlying income statement | Q1'20 | % | % excl. FX | % | % excl. FX | ||||||
Net interest income | 241 | (3.5 | ) | (14.7 | ) | 13.0 | 68.0 | ||||
Net fee income | 76 | (35.8 | ) | (43.3 | ) | (34.7 | ) | (2.9 | ) | ||
Gains (losses) on financial transactions (1) | 23 | 45.7 | 19.8 | (38.4 | ) | (8.5 | ) | ||||
Other operating income | (22 | ) | (10.1 | ) | (30.2 | ) | (38.3 | ) | (8.2 | ) | |
Total income | 318 | (11.5 | ) | (21.3 | ) | (4.0 | ) | 42.7 | |||
Administrative expenses and amortisations | (186 | ) | (11.2 | ) | (20.9 | ) | (8.1 | ) | 36.5 | ||
Net operating income | 132 | (11.9 | ) | (21.9 | ) | 2.5 | 52.3 | ||||
Net loan-loss provisions | (39 | ) | (26.0 | ) | (37.0 | ) | (45.9 | ) | (19.6 | ) | |
Other gains (losses) and provisions | (14 | ) | (74.9 | ) | (75.1 | ) | (39.9 | ) | (10.7 | ) | |
Profit before tax | 79 | 84.5 | 51.7 | 135.4 | 249.8 | ||||||
Tax on profit | (20 | ) | — | — | (13.9 | ) | 28.0 | ||||
Profit from continuing operations | 59 | 24.6 | 14.7 | 464.8 | 739.5 | ||||||
Net profit from discontinued operations | — | — | — | — | — | ||||||
Consolidated profit | 59 | 24.6 | 14.7 | 464.8 | 739.5 | ||||||
Non-controlling interests | — | (12.5 | ) | (21.9 | ) | 185.0 | 323.7 | ||||
Underlying attributable profit to the parent | 59 | 24.9 | 15.1 | 468.6 | 745.1 | ||||||
Balance sheet | |||||||||||
Loans and advances to customers | 4,521 | (5.7 | ) | (1.0 | ) | (25.6 | ) | 7.9 | |||
Cash, central banks and credit institutions | 3,395 | (13.2 | ) | (9.0 | ) | (29.5 | ) | 2.1 | |||
Debt instruments | 2,226 | 419.3 | 444.7 | 420.4 | 654.5 | ||||||
Other financial assets | 77 | (11.9 | ) | (7.6 | ) | (32.6 | ) | (2.3 | ) | ||
Other asset accounts | 824 | (1.5 | ) | 3.4 | 1.7 | 47.4 | |||||
Total assets | 11,042 | 9.8 | 15.2 | (9.8 | ) | 30.8 | |||||
Customer deposits | 8,305 | 18.6 | 24.4 | (5.8 | ) | 36.6 | |||||
Central banks and credit institutions | 686 | (33.5 | ) | (30.3 | ) | (28.8 | ) | 3.2 | |||
Marketable debt securities | 87 | 22.7 | 28.7 | (64.8 | ) | (48.9 | ) | ||||
Other financial liabilities | 631 | (15.4 | ) | (11.3 | ) | (25.9 | ) | 7.4 | |||
Other liabilities accounts | 388 | (1.2 | ) | 3.7 | (1.9 | ) | 42.2 | ||||
Total liabilities | 10,097 | 9.2 | 14.6 | (10.4 | ) | 29.8 | |||||
Total equity | 945 | 16.6 | 22.3 | (2.5 | ) | 41.3 | |||||
Memorandum items: | |||||||||||
Gross loans and advances to customers (2) | 4,724 | (5.4 | ) | (0.8 | ) | (20.0 | ) | 15.9 | |||
Customer funds | 9,569 | 18.2 | 23.9 | (7.9 | ) | 33.6 | |||||
Customer deposits (3) | 8,305 | 18.6 | 24.4 | (5.8 | ) | 36.6 | |||||
Mutual funds | 1,264 | 15.3 | 20.9 | (19.4 | ) | 16.9 | |||||
Ratios (%) and operating means | |||||||||||
Underlying RoTE | 30.06 | (1.61 | ) | 24.98 | |||||||
Efficiency ratio | 58.5 | 0.2 | (2.6 | ) | |||||||
NPL ratio | 3.97 | 0.58 | 0.47 | ||||||||
NPL coverage | 112.5 | (11.5 | ) | (6.1 | ) | ||||||
Number of employees | 9,290 | 1.2 | 0.2 | ||||||||
Number of branches | 438 | — | (6.4 | ) | |||||||
(1) Includes exchange differences.
(2) Excluding reverse repos.
(3) Excluding repos.
74 | | January - March 2020 |
Other South America | |||||||||||
EUR million | |||||||||||
/ | Q4'19 | / | Q1'19 | ||||||||
Underlying income statement | Q1'20 | % | % excl. FX | % | % excl. FX | ||||||
Net interest income | 106 | (2.2 | ) | 1.4 | (3.1 | ) | 9.4 | ||||
Net fee income | 37 | 6.8 | 10.9 | 28.1 | 44.7 | ||||||
Gains (losses) on financial transactions (1) | 18 | 44.1 | 47.3 | 72.2 | 89.5 | ||||||
Other operating income | (4 | ) | 63.7 | 69.7 | 60.0 | 84.2 | |||||
Total income | 157 | 2.6 | 6.3 | 7.3 | 20.9 | ||||||
Administrative expenses and amortisations | (66 | ) | 2.6 | 6.2 | 5.0 | 18.7 | |||||
Net operating income | 91 | 2.6 | 6.3 | 9.1 | 22.6 | ||||||
Net loan-loss provisions | (21 | ) | 3.9 | 10.3 | 14.2 | 28.9 | |||||
Other gains (losses) and provisions | (2 | ) | (15.7 | ) | (10.0 | ) | 27.6 | 48.4 | |||
Profit before tax | 68 | 2.9 | 5.7 | 7.2 | 20.2 | ||||||
Tax on profit | (17 | ) | 41.1 | 40.9 | 6.5 | 18.5 | |||||
Profit from continuing operations | 51 | (5.9 | ) | (2.6 | ) | 7.5 | 20.8 | ||||
Net profit from discontinued operations | — | — | — | — | — | ||||||
Consolidated profit | 51 | (5.9 | ) | (2.6 | ) | 7.5 | 20.8 | ||||
Non-controlling interests | — | (100.0 | ) | (100.0 | ) | — | — | ||||
Underlying attributable profit to the parent | 51 | (6.3 | ) | (3.1 | ) | 8.4 | 22.0 | ||||
Balance sheet | |||||||||||
Loans and advances to customers | 6,175 | 0.8 | 11.0 | 5.4 | 22.6 | ||||||
Cash, central banks and credit institutions | 3,101 | 28.0 | 43.5 | 36.6 | 64.6 | ||||||
Debt instruments | 688 | 33.1 | 51.9 | (6.5 | ) | 15.6 | |||||
Other financial assets | 122 | 74.9 | 78.0 | — | — | ||||||
Other asset accounts | 474 | 10.5 | 16.9 | 162.9 | 216.3 | ||||||
Total assets | 10,560 | 10.4 | 22.1 | 16.6 | 37.6 | ||||||
Customer deposits | 6,344 | 10.8 | 24.5 | 11.8 | 35.2 | ||||||
Central banks and credit institutions | 2,829 | 17.9 | 25.9 | 29.1 | 43.0 | ||||||
Marketable debt securities | 112 | 17.5 | 18.9 | 87.9 | 89.7 | ||||||
Other financial liabilities | 104 | 60.9 | 77.6 | 117.5 | 169.9 | ||||||
Other liabilities accounts | 286 | (3.6 | ) | 7.3 | 28.7 | 54.2 | |||||
Total liabilities | 9,674 | 12.8 | 24.6 | 18.0 | 39.1 | ||||||
Total equity | 886 | (10.1 | ) | (0.5 | ) | 3.0 | 23.0 | ||||
Memorandum items: | |||||||||||
Gross loans and advances to customers (2) | 6,299 | 0.6 | 10.8 | 5.0 | 22.2 | ||||||
Customer funds | 6,382 | 10.8 | 24.5 | 11.8 | 35.2 | ||||||
Customer deposits (3) | 6,344 | 10.8 | 24.5 | 11.8 | 35.2 | ||||||
Mutual funds | 38 | 5.5 | 20.6 | 14.3 | 45.5 | ||||||
Resources | |||||||||||
Number of employees | 2,090 | 1.1 | 3.4 | ||||||||
(1) Includes exchange differences.
(2) Excluding reverse repos.
(3) Excluding repos.
January - March 2020 | | 75 |
SANTANDER GLOBAL PLATFORM (primary segment) | |||||||||||
EUR million | |||||||||||
Underlying income statement | Q1'20 | Q4'19 | % | Q1'19 | % | ||||||
Net interest income | 31 | 23 | 36.2 | 22 | 38.3 | ||||||
Net fee income | 13 | 2 | 548.5 | 2 | 747.6 | ||||||
Gains (losses) on financial transactions (1) | — | (3 | ) | — | (1 | ) | — | ||||
Other operating income | 1 | (3 | ) | — | (4 | ) | — | ||||
Total income | 45 | 18 | 149.8 | 19 | 142.0 | ||||||
Administrative expenses and amortisations | (71 | ) | (72 | ) | (1.6 | ) | (41 | ) | 72.4 | ||
Net operating income | (26 | ) | (54 | ) | (52.6 | ) | (22 | ) | 14.2 | ||
Net loan-loss provisions | — | — | 13.0 | — | 213.0 | ||||||
Other gains (losses) and provisions | (1 | ) | (4 | ) | (75.4 | ) | (1 | ) | 57.4 | ||
Profit before tax | (27 | ) | (58 | ) | (53.7 | ) | (23 | ) | 16.7 | ||
Tax on profit | 14 | 16 | (9.9 | ) | 12 | 14.2 | |||||
Profit from continuing operations | (13 | ) | (43 | ) | (69.5 | ) | (11 | ) | 19.5 | ||
Net profit from discontinued operations | — | — | — | — | — | ||||||
Consolidated profit | (13 | ) | (43 | ) | (69.5 | ) | (11 | ) | 19.5 | ||
Non-controlling interests | — | — | — | — | — | ||||||
Underlying attributable profit to the parent | (13 | ) | (43 | ) | (70.0 | ) | (11 | ) | 17.6 | ||
Balance sheet | |||||||||||
Loans and advances to customers | 791 | 702 | 12.6 | 417 | 89.8 | ||||||
Cash, central banks and credit institutions | 9,423 | 9,063 | 4.0 | 8,673 | 8.6 | ||||||
Debt instruments | 10 | 10 | 2.2 | — | — | ||||||
Other financial assets | 205 | 187 | 9.7 | 152 | 34.9 | ||||||
Other asset accounts | 318 | 272 | 16.8 | 129 | 147.2 | ||||||
Total assets | 10,747 | 10,234 | 5.0 | 9,370 | 14.7 | ||||||
Customer deposits | 9,674 | 9,460 | 2.3 | 8,804 | 9.9 | ||||||
Central banks and credit institutions | 144 | 82 | 75.8 | 75 | 92.0 | ||||||
Marketable debt securities | — | — | — | — | — | ||||||
Other financial liabilities | 134 | 105 | 27.5 | 41 | 230.9 | ||||||
Other liabilities accounts | 98 | 112 | (12.4 | ) | 60 | 62.9 | |||||
Total liabilities | 10,051 | 9,760 | 3.0 | 8,980 | 11.9 | ||||||
Total equity | 696 | 474 | 46.9 | 390 | 78.2 | ||||||
Memorandum items: | |||||||||||
Gross loans and advances to customers (2) | 794 | 706 | 12.5 | 420 | 89.1 | ||||||
Customer funds | 10,127 | 9,910 | 2.2 | 9,183 | 10.3 | ||||||
Customer deposits (3) | 9,674 | 9,460 | 2.3 | 8,804 | 9.9 | ||||||
Mutual funds | 453 | 450 | 0.7 | 379 | 19.7 | ||||||
Resources | |||||||||||
Number of employees | 1,424 | 820 | 73.7 | 545 | 161.3 | ||||||
(1) Includes exchange differences..
(2) Excluding reverse repos.
(3) Excluding repos.
76 | | January - March 2020 |
CORPORATE CENTRE | |||||||||||
EUR million | |||||||||||
Underlying income statement | Q1'20 | Q4'19 | % | Q1'19 | % | ||||||
Net interest income | (304 | ) | (333 | ) | (8.6 | ) | (296 | ) | 2.8 | ||
Net fee income | (9 | ) | (15 | ) | (37.5 | ) | (14 | ) | (32.9 | ) | |
Gains (losses) on financial transactions (1) | 14 | (39 | ) | — | (79 | ) | — | ||||
Other operating income | (5 | ) | 5 | — | (11 | ) | (56.6 | ) | |||
Total income | (304 | ) | (381 | ) | (20.2 | ) | (399 | ) | (23.8 | ) | |
Administrative expenses and amortisations | (85 | ) | (89 | ) | (5.2 | ) | (97 | ) | (12.9 | ) | |
Net operating income | (389 | ) | (471 | ) | (17.4 | ) | (497 | ) | (21.6 | ) | |
Net loan-loss provisions | (3 | ) | (10 | ) | (64.5 | ) | (8 | ) | (55.6 | ) | |
Other gains (losses) and provisions | (20 | ) | (49 | ) | (58.2 | ) | (55 | ) | (62.9 | ) | |
Profit before tax | (413 | ) | (529 | ) | (22.0 | ) | (559 | ) | (26.2 | ) | |
Tax on profit | (21 | ) | 71 | — | 33 | — | |||||
Profit from continuing operations | (434 | ) | (458 | ) | (5.3 | ) | (526 | ) | (17.5 | ) | |
Net profit from discontinued operations | — | — | — | — | — | ||||||
Consolidated profit | (434 | ) | (458 | ) | (5.3 | ) | (526 | ) | (17.5 | ) | |
Non-controlling interests | — | (1 | ) | — | 10 | (99.8 | ) | ||||
Underlying attributable profit to the parent | (434 | ) | (459 | ) | (5.5 | ) | (517 | ) | (16.0 | ) | |
Balance sheet | |||||||||||
Loans and advances to customers | 4,454 | 5,764 | (22.7 | ) | 6,139 | (27.4 | ) | ||||
Cash, central banks and credit institutions | 46,836 | 32,803 | 42.8 | 26,755 | 75.1 | ||||||
Debt instruments | 1,292 | 840 | 53.9 | 954 | 35.4 | ||||||
Other financial assets | 3,745 | 2,406 | 55.7 | 2,207 | 69.7 | ||||||
Other asset accounts | 131,526 | 126,539 | 3.9 | 132,551 | (0.8 | ) | |||||
Total assets | 187,853 | 168,352 | 11.6 | 168,605 | 11.4 | ||||||
Customer deposits | 740 | 793 | (6.7 | ) | 163 | 355.0 | |||||
Central banks and credit institutions | 27,484 | 12,254 | 124.3 | 16,921 | 62.4 | ||||||
Marketable debt securities | 56,906 | 54,495 | 4.4 | 43,441 | 31.0 | ||||||
Other financial liabilities | 803 | 636 | 26.2 | 2,321 | (65.4 | ) | |||||
Other liabilities accounts | 8,917 | 9,810 | (9.1 | ) | 8,356 | 6.7 | |||||
Total liabilities | 94,849 | 77,989 | 21.6 | 71,201 | 33.2 | ||||||
Total equity | 93,004 | 90,362 | 2.9 | 97,404 | (4.5 | ) | |||||
Memorandum items: | |||||||||||
Gross loans and advances to customers (2) | 6,135 | 5,859 | 4.7 | 6,414 | (4.4 | ) | |||||
Customer funds | 751 | 804 | (6.6 | ) | 176 | 327.9 | |||||
Customer deposits (3) | 740 | 793 | (6.7 | ) | 163 | 355.0 | |||||
Mutual funds | 11 | 11 | 0.3 | 13 | (16.9 | ) | |||||
Resources | |||||||||||
Number of employees | 1,697 | 1,651 | 2.8 | 1,757 | (3.4 | ) | |||||
(1) Includes exchange differences.
(2) Excluding reverse repos.
(3) Excluding repos.
January - March 2020 | | 77 |
RETAIL BANKING | |||||||||||
EUR million | |||||||||||
/ | Q4'19 | / | Q1'19 | ||||||||
Underlying income statement | Q1'20 | % | % excl. FX | % | % excl. FX | ||||||
Net interest income | 7,885 | (4.2 | ) | (1.9 | ) | (2.5 | ) | 2.2 | |||
Net fee income | 2,024 | (5.5 | ) | (3.1 | ) | (7.1 | ) | (1.3 | ) | ||
Gains (losses) on financial transactions (1) | 50 | (84.1 | ) | (84.1 | ) | (31.3 | ) | (34.9 | ) | ||
Other operating income | 13 | (51.6 | ) | (35.6 | ) | (83.0 | ) | (87.1 | ) | ||
Total income | 9,972 | (6.9 | ) | (4.7 | ) | (4.2 | ) | 0.3 | |||
Administrative expenses and amortisations | (4,526 | ) | (6.2 | ) | (4.6 | ) | (3.6 | ) | 0.6 | ||
Net operating income | 5,445 | (7.4 | ) | (4.8 | ) | (4.8 | ) | — | |||
Net loan-loss provisions | (2,289 | ) | (6.1 | ) | (3.8 | ) | 6.8 | 12.7 | |||
Other gains (losses) and provisions | (338 | ) | (25.7 | ) | (23.5 | ) | (13.6 | ) | (8.8 | ) | |
Profit before tax | 2,818 | (5.7 | ) | (2.7 | ) | (11.5 | ) | (7.4 | ) | ||
Tax on profit | (919 | ) | 6.0 | 9.7 | (13.7 | ) | (8.2 | ) | |||
Profit from continuing operations | 1,899 | (10.5 | ) | (7.8 | ) | (10.4 | ) | (7.0 | ) | ||
Net profit from discontinued operations | — | — | — | — | — | ||||||
Consolidated profit | 1,899 | (10.5 | ) | (7.8 | ) | (10.4 | ) | (7.0 | ) | ||
Non-controlling interests | (262 | ) | (0.4 | ) | 3.1 | (26.4 | ) | (23.3 | ) | ||
Underlying attributable profit to the parent | 1,637 | (11.9 | ) | (9.3 | ) | (7.2 | ) | (3.7 | ) | ||
(1) Includes exchange differences.
CORPORATE & INVESTMENT BANKING | |||||||||||
EUR million | |||||||||||
/ | Q4'19 | / | Q1'19 | ||||||||
Underlying income statement | Q1'20 | % | % excl. FX | % | % excl. FX | ||||||
Net interest income | 671 | (6.3 | ) | (5.1 | ) | 2.6 | 8.6 | ||||
Net fee income | 404 | 8.4 | 10.2 | 14.8 | 20.2 | ||||||
Gains (losses) on financial transactions (1) | 165 | (39.6 | ) | (38.7 | ) | (23.7 | ) | (12.0 | ) | ||
Other operating income | 60 | (5.1 | ) | (5.6 | ) | 8.3 | 7.3 | ||||
Total income | 1,300 | (8.8 | ) | (7.6 | ) | 1.8 | 8.6 | ||||
Administrative expenses and amortisations | (536 | ) | (11.9 | ) | (11.0 | ) | (4.4 | ) | (1.0 | ) | |
Net operating income | 764 | (6.5 | ) | (5.0 | ) | 6.6 | 16.5 | ||||
Net loan-loss provisions | (4 | ) | (96.6 | ) | (96.5 | ) | (53.5 | ) | (48.6 | ) | |
Other gains (losses) and provisions | (15 | ) | (52.8 | ) | (52.1 | ) | (31.0 | ) | (29.5 | ) | |
Profit before tax | 745 | 13.3 | 15.2 | 8.6 | 19.0 | ||||||
Tax on profit | (218 | ) | 4.4 | 6.3 | 7.9 | 18.8 | |||||
Profit from continuing operations | 527 | 17.4 | 19.4 | 8.9 | 19.1 | ||||||
Net profit from discontinued operations | — | — | — | — | — | ||||||
Consolidated profit | 527 | 17.4 | 19.4 | 8.9 | 19.1 | ||||||
Non-controlling interests | (36 | ) | (7.4 | ) | (2.6 | ) | (14.7 | ) | (6.0 | ) | |
Underlying attributable profit to the parent | 491 | 19.8 | 21.3 | 11.2 | 21.4 | ||||||
(1) Includes exchange differences.
78 | | January - March 2020 |
WEALTH MANAGEMENT & INSURANCE | |||||||||||
EUR million | |||||||||||
/ | Q4'19 | / | Q1'19 | ||||||||
Underlying income statement | Q1'20 | % | % excl. FX | % | % excl. FX | ||||||
Net interest income | 132 | (9.0 | ) | (8.9 | ) | (5.7 | ) | (3.5 | ) | ||
Net fee income | 320 | (2.9 | ) | (1.3 | ) | 17.2 | 20.2 | ||||
Gains (losses) on financial transactions (1) | 21 | 73.7 | 77.3 | (37.0 | ) | (35.1 | ) | ||||
Other operating income | 113 | 11.3 | 15.2 | 48.1 | 56.5 | ||||||
Total income | 586 | (0.4 | ) | 1.2 | 12.1 | 15.4 | |||||
Administrative expenses and amortisations | (244 | ) | 0.1 | 0.9 | 1.0 | 2.2 | |||||
Net operating income | 342 | (0.8 | ) | 1.4 | 21.5 | 27.1 | |||||
Net loan-loss provisions | (7 | ) | — | — | — | — | |||||
Other gains (losses) and provisions | (1 | ) | (70.9 | ) | (70.1 | ) | (50.7 | ) | (48.1 | ) | |
Profit before tax | 334 | (7.4 | ) | (5.6 | ) | 17.1 | 22.4 | ||||
Tax on profit | (82 | ) | (7.6 | ) | (6.5 | ) | 22.8 | 28.0 | |||
Profit from continuing operations | 252 | (7.4 | ) | (5.2 | ) | 15.4 | 20.7 | ||||
Net profit from discontinued operations | — | — | — | — | — | ||||||
Consolidated profit | 252 | (7.4 | ) | (5.2 | ) | 15.4 | 20.7 | ||||
Non-controlling interests | (11 | ) | (21.0 | ) | (15.9 | ) | 9.4 | 23.8 | |||
Underlying attributable profit to the parent | 240 | (6.6 | ) | (4.7 | ) | 15.7 | 20.5 | ||||
(1) Includes exchange differences.
SANTANDER GLOBAL PLATFORM (secondary segment) | |||||||||||
EUR million | |||||||||||
/ | Q4'19 | / | Q1'19 | ||||||||
Underlying income statement | Q1'20 | % | % excl. FX | % | % excl. FX | ||||||
Net interest income | 103 | 23.4 | 26.2 | 2.7 | 10.9 | ||||||
Net fee income | 115 | (13.0) | (11.5) | (19.0) | (10.0) | ||||||
Gains (losses) on financial transactions (1) | 42 | 12.0 | 14.3 | 25.5 | 31.7 | ||||||
Other operating income | — | — | — | — | — | ||||||
Total income | 260 | 4.4 | 6.4 | (4.1) | 4.8 | ||||||
Administrative expenses and amortisations | (186 | ) | (8.1) | (6.9) | 13.0 | 20.4 | |||||
Net operating income | 74 | 57.9 | 65.6 | (30.5) | (21.0) | ||||||
Net loan-loss provisions | (5 | ) | (69.2 | ) | (68.9 | ) | (70.7 | ) | (70.3 | ) | |
Other gains (losses) and provisions | 2 | — | — | — | — | ||||||
Profit before tax | 71 | 156.8 | 179.5 | (18.9) | (5.3) | ||||||
Tax on profit | (19 | ) | 29.9 | 40.0 | (23.4) | (6.2) | |||||
Profit from continuing operations | 52 | 301.3 | 342.3 | (17.1) | (4.9) | ||||||
Net profit from discontinued operations | — | — | — | — | — | ||||||
Consolidated profit | 52 | 301.3 | 342.3 | (17.1) | (4.9) | ||||||
Non-controlling interests | (9 | ) | 32.5 | 39.5 | (13.4) | (4.2) | |||||
Underlying attributable profit to the parent | 43 | 619.7 | 739.9 | (17.8) | (5.0) | ||||||
(1) Includes exchange differences.
January - March 2020 | | 79 |
ALTERNATIVE PERFORMANCE MEASURES (APMs)
In addition to the financial information prepared under IFRS, this consolidated directors’ report contains financial measures that constitute alternative performance measures (‘APMs’) to comply with the guidelines on alternative performance measures issued by the European Securities and Markets Authority on 5 October 2015 and non-IFRS measures.
The financial measures contained in this consolidated directors’ report that qualify as APMs and non-IFRS measures have been calculated using the financial information from Santander but are not defined or detailed in the applicable financial information framework or under IFRS and have neither been audited nor reviewed by our auditors.
We use these APMs and non-IFRS measures when planning, monitoring and evaluating our performance. We consider these APMs and non-IFRS financial measures to be useful metrics for management and investors to facilitate operating performance comparisons from period to period. While we believe that these APMs and non-IFRS financial measures are useful in evaluating our business, this information should be considered as supplemental in nature and is not meant as a substitute of IFRS measures. In addition, the way in which Santander defines and calculates these APMs and non-IFRS measures may differ from the calculations and by other
companies with similar measures and, therefore, may not be comparable.
The APMs and non-IFRS measures we use in this document can be categorised as follows:
Underlying results
In addition to IFRS results measures, we present some results measures which are non-IFRS measures and which we refer to as underlying measures. These underlying measures allow in our view a better year-on-year comparability as they exclude items outside the ordinary course performance of our business which are grouped in the non-IFRS line net capital gains and provisions and are further detailed on page 14 of this report.
In addition, the results by business areas in the 'Geographic businesses' section are presented only on an underlying basis in accordance with IFRS 8, and reconciled on an aggregate basis to our IFRS consolidated results to the consolidated financial statements, which are set out below.
Reconciliation of underlying results to statutory results | ||||||
EUR million | ||||||
January-March 2020 | ||||||
Underlying results | Adjustments | Statutory results | ||||
Net interest income | 8,487 | — | 8,487 | |||
Net fee income | 2,853 | — | 2,853 | |||
Gains (losses) on financial transactions (1) | 292 | (5 | ) | 287 | ||
Other operating income | 182 | — | 182 | |||
Total income | 11,814 | (5 | ) | 11,809 | ||
Administrative expenses and amortisations | (5,577 | ) | (12 | ) | (5,589 | ) |
Net operating income | 6,237 | (17 | ) | 6,220 | ||
Net loan-loss provisions | (2,309 | ) | (1,610 | ) | (3,919 | ) |
Other gains (losses) and provisions | (372 | ) | (38 | ) | (410 | ) |
Profit before tax | 3,556 | (1,665 | ) | 1,891 | ||
Tax on profit | (1,260 | ) | 16 | (1,244 | ) | |
Profit from continuing operations | 2,296 | (1,649 | ) | 647 | ||
Net profit from discontinued operations | — | — | — | |||
Consolidated profit | 2,296 | (1,649 | ) | 647 | ||
Non-controlling interests | (319 | ) | 3 | (316 | ) | |
Attributable profit to the parent | 1,977 | (1,646 | ) | 331 | ||
(1) Includes exchange differences.
Explanation of adjustments:
Recording of a provisions overlay based on the expected deterioration of the macroeconomic conditions arising from the health crisis of EUR -1,600 million and restructuring costs for a net impact of EUR -46 million.
80 | | January - March 2020 |
Reconciliation of underlying results to statutory results | ||||||
EUR million | ||||||
January-March 2019 | ||||||
Underlying results | Adjustments | Statutory results | ||||
Net interest income | 8,682 | — | 8,682 | |||
Net fee income | 2,931 | — | 2,931 | |||
Gains (losses) on financial transactions (1) | 277 | — | 277 | |||
Other operating income | 195 | — | 195 | |||
Total income | 12,085 | — | 12,085 | |||
Administrative expenses and amortisations | (5,758 | ) | — | (5,758 | ) | |
Net operating income | 6,327 | — | 6,327 | |||
Net loan-loss provisions | (2,172 | ) | — | (2,172 | ) | |
Other gains (losses) and provisions | (471 | ) | (82 | ) | (553 | ) |
Profit before tax | 3,684 | (82 | ) | 3,602 | ||
Tax on profit | (1,326 | ) | (31 | ) | (1,357 | ) |
Profit from continuing operations | 2,358 | (113 | ) | 2,245 | ||
Net profit from discontinued operations | — | — | — | |||
Consolidated profit | 2,358 | (113 | ) | 2,245 | ||
Non-controlling interests | (410 | ) | 5 | (405 | ) | |
Attributable profit to the parent | 1,948 | (108 | ) | 1,840 | ||
(1) Includes exchange differences.
Explanation of adjustments:
Net capital gains from the sale of our stake in Prisma of EUR 150 million, net capital losses of EUR -180 million related to real estate assets (Spain) and restructuring costs for a net impact of EUR -78 million.
Profitability and efficiency ratios
The purpose of the profitability and efficiency ratios is to measure the ratio of profit to capital, to tangible capital, to assets and to risk weighted assets, while the efficiency ratio measures how much general administrative expenses (personnel and other) and amortisation costs are needed to generate revenue.
Ratio | Formula | Relevance of the metric | ||
RoE | Attributable profit to the parent | This ratio measures the return that shareholders obtain on the funds invested in the Bank and as such measures the company's ability to pay shareholders. | ||
(Return on equity) | Average stockholders’ equity (1) (excl. minority interests) | |||
RoTE | Attributable profit to the parent | This is a very common indicator, used to evaluate the profitability of the company as a percentage of its tangible equity. It's measured as the return that shareholders receive as a percentage of the funds invested in the entity less intangible assets. | ||
(Return on tangible equity) | Average stockholders' equity (1) (excl. minority interests) - intangible assets | |||
Underlying RoTE | Attributable profit to the parent | This indicator measures the profitability of the tangible equity of a company arising from ordinary activities, i.e. excluding results from non-recurring operations. | ||
Average stockholders' equity(1) (excl. minority interests) - intangible assets | ||||
RoA | Consolidated profit | This metric, commonly used by analysts, measures the profitability of a company as a percentage of its total assets. It is an indicator that reflects the efficiency of the company's total funds in generating profit over a given period. | ||
(Return on assets) | Average total assets | |||
RoRWA | Consolidated profit | The return adjusted for risk is an derivative of the RoA metric. The difference is that RoRWA measures profit in relation to the bank's risk weighted assets | ||
(Return on risk weighted assets) | Average risk weighted assets | |||
Underlying RoRWA | Underlying consolidated profit | This relates the consolidated profit (excluding non-recurring results) to the bank's risk weighted assets. | ||
Average risk weighted assets | ||||
Efficiency ratio | Operating expenses (2) | One of the most commonly used indicators when comparing productivity of different financial entities. It measures the amount of funds used to generate the bank's total income. | ||
Total income | ||||
1. Stockholders’ equity = Capital and Reserves + Accumulated other comprehensive income + Attributable profit to the parent + Dividends.
2. Operating expenses = Administrative expenses + amortisations.
January - March 2020 | | 81 |
Profitability and efficiency (1) (2) (3) (4) | Q1'20 | Q4'19 | Q1'19 | |||
RoE | 6.31 | % | 9.10 | % | 7.85 | % |
Attributable profit to the parent | 6,259 | 8,999 | 7,684 | |||
Average stockholders' equity (excluding minority interests) | 99,221 | 98,851 | 97,886 | |||
RoTE | 8.75 | % | 12.62 | % | 11.15 | % |
Attributable profit to the parent | 6,259 | 8,999 | 7,684 | |||
Average stockholders' equity (excluding minority interests) | 99,221 | 98,851 | 97,886 | |||
(-) Average intangible assets | 27,721 | 27,562 | 28,978 | |||
Average stockholders' equity (excl. minority interests) - intangible assets | 71,500 | 71,289 | 68,908 | |||
Underlying RoTE | 11.06 | % | 11.63 | % | 11.31 | % |
Attributable profit to the parent | 6,259 | 8,999 | 7,684 | |||
(-) Net capital gains and provisions | (1,646) | 711 | (108) | |||
Underlying attributable profit to the parent | 7,904 | 8,288 | 7,792 | |||
Average stockholders' equity (excl. minority interests) - intangible assets | 71,500 | 71,289 | 68,908 | |||
RoA | 0.49 | % | 0.68 | % | 0.63 | % |
Consolidated profit | 7,536 | 10,335 | 9,318 | |||
Average total assets | 1,536,725 | 1,530,761 | 1,488,505 | |||
RoRWA | 1.25 | % | 1.69 | % | 1.54 | % |
Consolidated profit | 7,536 | 10,335 | 9,318 | |||
Average risk weighted assets | 603,069 | 612,149 | 603,340 | |||
Underlying RoRWA | 1.52 | % | 1.57 | % | 1.56 | % |
Consolidated profit | 7,536 | 10,335 | 9,318 | |||
(-) Net capital gains and provisions | (1,649) | 746 | (113) | |||
Underlying consolidated profit | 9,186 | 9,589 | 9,431 | |||
Average risk weighted assets | 603,069 | 612,149 | 603,340 | |||
Efficiency ratio | 47.2 | % | 47.4 | % | 47.6 | % |
Underlying operating expenses | 5,577 | 5,971 | 5,758 | |||
Operating expenses | 5,589 | 5,971 | 5,758 | |||
Net capital gains and provisions impact in operating expenses | (12) | — | — | |||
Underlying total income | 11,814 | 12,592 | 12,085 | |||
Total income | 11,809 | 12,327 | 12,085 | |||
Net capital gains and provisions impact in total income | 5 | 265 | — | |||
(1) Averages included in the RoE, RoTE, RoA and RoRWA denominators are calculated using 4 months' worth of data in the case of quarterly figures (from December to March in Q1 and September to December in Q4).
(2) For periods less than one year, and if there are results in the net capital gains and provisions line, the profit used to calculate RoE and RoTE is the annualised underlying attributable profit to which said results are added without annualising.
(3) For periods less than one year, and if there are results in the net capital gains and provisions line, the profit used to calculate RoA and RoRWA is the annualised underlying consolidated profit, to which said results are added without annualising.
(4) The risk weighted assets included in the denominator of the RoRWA metric are calculated in line with the criteria laid out in the CRR (Capital Requirements Regulation).
Efficiency ratio | ||||||||||||
Q1'20 | Q1'19 | |||||||||||
% | Total income | Operating expenses | % | Total income | Operating expenses | |||||||
Europe | 54.5 | 4,974 | 2,712 | 53.6 | 5,225 | 2,802 | ||||||
Spain | 52.8 | 1,789 | 944 | 55.2 | 1,857 | 1,025 | ||||||
Santander Consumer Finance | 43.9 | 1,171 | 514 | 43.5 | 1,167 | 508 | ||||||
United Kingdom | 65.0 | 1,098 | 714 | 61.3 | 1,206 | 739 | ||||||
Portugal | 43.1 | 350 | 151 | 44.0 | 357 | 157 | ||||||
Poland | 47.1 | 365 | 172 | 45.9 | 377 | 173 | ||||||
North America | 41.7 | 2,936 | 1,224 | 42.6 | 2,753 | 1,172 | ||||||
US | 41.9 | 1,929 | 809 | 42.7 | 1,815 | 775 | ||||||
Mexico | 41.2 | 1,007 | 415 | 42.3 | 939 | 397 | ||||||
South America | 35.7 | 4,163 | 1,486 | 36.7 | 4,487 | 1,645 | ||||||
Brazil | 32.0 | 3,137 | 1,004 | 33.0 | 3,411 | 1,125 | ||||||
Chile | 41.7 | 553 | 230 | 42.6 | 600 | 255 | ||||||
Argentina | 58.5 | 318 | 186 | 61.1 | 331 | 202 | ||||||
82 | | January - March 2020 |
Underlying RoTE | ||||||||||||
Q1'20 | Q1'19 | |||||||||||
% | Underlying attributable profit to the parent | Average stockholders' equity (excl. minority interests) - intangible assets | % | Underlying attributable profit to the parent | Average stockholders' equity (excl. minority interests) - intangible assets | |||||||
Europe | 7.94 | 3,895 | 49,049 | 9.61 | 4,653 | 48,433 | ||||||
Spain | 9.00 | 1,409 | 15,650 | 9.61 | 1,424 | 14,820 | ||||||
Santander Consumer Finance | 13.86 | 1,216 | 8,778 | 14.85 | 1,297 | 8,733 | ||||||
United Kingdom | 5.16 | 751 | 14,556 | 6.91 | 1,018 | 14,724 | ||||||
Portugal | 12.91 | 479 | 3,705 | 13.05 | 540 | 4,135 | ||||||
Poland | 4.73 | 151 | 3,192 | 7.76 | 245 | 3,161 | ||||||
North America | 9.92 | 2,089 | 21,068 | 8.45 | 1,546 | 18,297 | ||||||
US | 6.98 | 1,092 | 15,648 | 5.07 | 725 | 14,305 | ||||||
Mexico | 17.96 | 997 | 5,550 | 20.11 | 820 | 4,080 | ||||||
South America | 21.12 | 3,711 | 17,571 | 19.58 | 3,704 | 18,910 | ||||||
Brazil | 22.04 | 2,775 | 12,590 | 20.98 | 2,882 | 13,738 | ||||||
Chile | 15.15 | 499 | 3,294 | 16.34 | 593 | 3,630 | ||||||
Argentina | 30.06 | 235 | 782 | 5.08 | 41 | 814 | ||||||
Credit risk indicators
The credit risk indicators measure the quality of the credit portfolio and the percentage of non-performing loans covered by provisions.
Ratio | Formula | Relevance of the metric | ||
NPL ratio (Non-performing loans) | Non-performing loans and advances to customers, customer guarantees and customer commitments granted | The NPL ratio is an important variable regarding financial institutions' activity since it gives an indication of the level of risk the entities are exposed to. It calculates risks that are, in accounting terms, declared to be non-performing as a percentage of the total outstanding amount of customer credit and contingent liabilities. | ||
Total Risk (1) | ||||
Coverage ratio | Provisions to cover impairment losses on loans and advances to customers, customer guarantees and customer commitments granted | The coverage ratio is a fundamental metric in the financial sector. It reflects the level of provisions as a percentage of the non-performing assets (credit risk). Therefore it is a good indicator of the entity's solvency against client defaults both present and future. | ||
Non-performing loans and advances to customers, customer guarantees and customer commitments granted | ||||
Cost of Credit | Allowances for loan-loss provisions over the last 12 months | This ratio quantifies loan-loss provisions arising from credit risk over a defined period of time for a given loan portfolio. As such, it acts as an indicator of credit quality. | ||
Average loans and advances to customers over the last 12 months | ||||
(1) Total risk = Total loans and advances and guarantees to customers (performing and non-performing) + non-performing contingent liabilities.
Credit risk | Mar-20 | Dec-19 | Mar-19 | |||
NPL ratio | 3.25 | % | 3.32 | % | 3.62 | % |
Non-performing loans and advances to customers customer guarantees and customer commitments granted | 32,743 | 33,799 | 35,590 | |||
Total risk | 1,008,275 | 1,016,507 | 983,790 | |||
Coverage ratio | 71 | % | 68 | % | 68 | % |
Provisions to cover impairment losses on loans and advances to customers, customer guarantees and customer commitments granted | 23,361 | 22,965 | 24,129 | |||
Non-performing loans and advances to customers customer guarantees and customer commitments granted | 32,743 | 33,799 | 35,590 | |||
Cost of credit | 1.00 | % | 1.00 | % | 0.97 | % |
Underlying allowances for loan-loss provisions over the last 12 months | 9,458 | 9,321 | 8,762 | |||
Allowances for loan-loss provisions over the last 12 months | 11,068 | 9,321 | 8,762 | |||
Net capital gains and provisions impact in allowances for loan-loss provisions | (1,610) | — | — | |||
Average loans and advances to customers over the last 12 months | 944,853 | 935,488 | 899,201 | |||
January - March 2020 | | 83 |
NPL ratio | ||||||||||
Q1'20 | Q1'19 | |||||||||
% | Non-performing loans and advances to customers customer guarantees and customer commitments granted | Total risk | % | Non-performing loans and advances to customers customer guarantees and customer commitments granted | Total risk | |||||
Europe | 3.19 | 23,199 | 726,929 | 3.61 | 25,314 | 701,283 | ||||
Spain | 6.88 | 14,724 | 214,072 | 7.29 | 16,264 | 223,123 | ||||
Santander Consumer Finance | 2.43 | 2,494 | 102,833 | 2.33 | 2,295 | 98,373 | ||||
United Kingdom | 0.96 | 2,603 | 270,280 | 1.17 | 3,110 | 266,134 | ||||
Portugal | 4.56 | 1,776 | 38,956 | 5.77 | 2,201 | 38,129 | ||||
Poland | 4.29 | 1,387 | 32,368 | 4.39 | 1,364 | 31,066 | ||||
North America | 2.02 | 2,936 | 145,566 | 2.33 | 3,118 | 133,887 | ||||
US | 2.00 | 2,238 | 111,853 | 2.41 | 2,353 | 97,820 | ||||
Mexico | 2.07 | 698 | 33,713 | 2.12 | 765 | 36,067 | ||||
South America | 4.63 | 5,969 | 128,953 | 4.83 | 6,841 | 141,757 | ||||
Brazil | 4.93 | 3,809 | 77,202 | 5.26 | 4,477 | 85,096 | ||||
Chile | 4.63 | 1,839 | 39,707 | 4.67 | 2,013 | 43,127 | ||||
Argentina | 3.97 | 190 | 4,776 | 3.50 | 224 | 6,398 | ||||
Coverage ratio | ||||||||||||
Q1'20 | Q1'19 | |||||||||||
% | Provisions to cover impairment losses on loans and advances to customers, customer guarantees and customer commitments granted | Non-performing loans and advances to customers customer guarantees and customer commitments granted | % | Provisions to cover impairment losses on loans and advances to customers, customer guarantees and customer commitments granted | Non-performing loans and advances to customers customer guarantees and customer commitments granted | |||||||
Europe | 50.7 | 11,766 | 23,199 | 49.5 | 12,523 | 25,314 | ||||||
Spain | 42.0 | 6,189 | 14,724 | 43.3 | 7,044 | 16,264 | ||||||
Santander Consumer Finance | 103.8 | 2,588 | 2,494 | 105.3 | 2,416 | 2,295 | ||||||
United Kingdom | 37.7 | 981 | 2,603 | 30.9 | 960 | 3,110 | ||||||
Portugal | 54.8 | 973 | 1,776 | 50.7 | 1,116 | 2,201 | ||||||
Poland | 66.2 | 919 | 1,387 | 67.6 | 922 | 1,364 | ||||||
North America | 157.6 | 4,629 | 2,936 | 153.4 | 4,782 | 3,118 | ||||||
US | 166.8 | 3,733 | 2,238 | 161.0 | 3,788 | 2,353 | ||||||
Mexico | 128.4 | 897 | 698 | 130.1 | 994 | 765 | ||||||
South America | 86.3 | 5,149 | 5,969 | 94.1 | 6,439 | 6,841 | ||||||
Brazil | 99.9 | 3,806 | 3,809 | 107.7 | 4,822 | 4,477 | ||||||
Chile | 54.3 | 998 | 1,839 | 59.7 | 1,202 | 2,013 | ||||||
Argentina | 112.5 | 213 | 190 | 118.6 | 266 | 224 | ||||||
84 | | January - March 2020 |
Other indicators
The market capitalisation indicator provides information on the volume of tangible equity per share. The loan-to-deposit ratio (LTD) identifies the relationship between net customer loans and advances and customer deposits, assessing the proportion of loans and advances granted by the Group that are funded by customer deposits.
The Group also uses gross customer loan magnitudes excluding reverse repurchase agreements (repos) and customer deposits excluding repos. In order to analyse the evolution of the traditional commercial banking business of granting loans and capturing deposits, repos and reverse repos are excluded, as they are mainly treasury business products and highly volatile.
Ratio | Formula | Relevance of the metric | ||
TNAV per share | Tangible book value (1) | This is a very commonly used ratio used to measure the company's accounting value per share having deducted the intangible assets. It is useful in evaluating the amount each shareholder would receive if the company were to enter into liquidation and had to sell all the company's tangible assets. | ||
(Tangible equity net asset value per share) | Number of shares excluding treasury stock | |||
Price / tangible book value per share (X) | Share price | This is one of the most commonly used ratios by market participants for the valuation of listed companies both in absolute terms and relative to other entities. This ratio measures the relationship between the price paid for a company and its accounting equity value. | ||
TNAV per share | ||||
LTD ratio | Net loans and advances to customers | This is an indicator of the bank's liquidity. It measures the total (net) loans and advances to customers as a percentage of customer deposits. | ||
(Loan-to-deposit) | Customer deposits | |||
Loans and advances (excl. reverse repos) | Gross loans and advances to customers excluding reverse repos | In order to aid analysis of the commercial banking activity, reverse repos are excluded as they are highly volatile treasury products. | ||
Deposits (excl. repos) | Customer deposits excluding repos | In order to aid analysis of the commercial banking activity, repos are excluded as they are highly volatile treasury products. | ||
PAT + After tax fees paid to SAN (in Wealth Management & Insurance) | Net profit + fees paid from Santander Asset Management and Santander Insurance to Santander, net of taxes, excluding Private Banking customers | Metric to assess Wealth Management & Insurance's total contribution to Grupo Santander profit. | ||
(1) Tangible book value = Stockholders' equity - intangible assets
Others | Mar-20 | Dec-19 | Mar-19 | |||
TNAV (tangible book value) per share | 4.21 | 4.36 | 4.30 | |||
Tangible book value (EUR million) | 69,795 | 72,384 | 69,731 | |||
Number of shares excl. treasury stock (million) | 16,590 | 16,610 | 16,235 | |||
Price / Tangible book value per share (X) | 0.53 | 0.86 | 0.96 | |||
Share price (euros) | 2.218 | 3.730 | 4.145 | |||
TNAV (tangible book value) per share | 4.21 | 4.36 | 4.30 | |||
Loan-to-deposit ratio | 115 | % | 114 | % | 113 | % |
Net loans and advances to customers | 935,407 | 942,218 | 910,195 | |||
Customer deposits | 815,459 | 824,365 | 808,361 | |||
Q1'20 | Q4'19 | Q1'19 | ||||
PAT + After tax fees paid to SAN (in WM&I) (Constant EUR million) | 596 | 629 | 556 | |||
Profit after tax | 252 | 266 | 209 | |||
Net fee income net of tax | 344 | 364 | 347 | |||
January - March 2020 | | 85 |
Local currency measures
We make use of certain financial measures in local currency to help in the assessment of our ongoing operating performance. These non-IFRS financial measures include the results of operations of our subsidiary banks located outside the Eurozone, excluding the impact of foreign exchange. Because changes in foreign currency exchange rates do not have an operating impact on the results, we believe that evaluating their performance on a local currency basis provides an additional and meaningful assessment of performance to both management and the company’s investors.
The Group presents, at both the Group level as well as the business unit level, the real changes in the income statement as well as the changes excluding the exchange rate effect, as it considers the latter facilitates analysis, since it enables businesses movements to be identified without taking into account the impact of converting each local currency into euros.
Said variations, excluding the impact of exchange rate movements, are calculated by converting P&L lines for the different business units comprising the Group into our presentation currency, the euro, applying the average exchange rate for the first quarter of 2020 to all periods contemplated in the analysis.
The Group presents, at both the Group level as well as the business unit level, the changes in euros in the balance sheet as well as the changes excluding the exchange rate effect for loans and advances to customers excluding reverse repos and customer funds (which comprise deposits and mutual funds) excluding repos. As with the income statement, the reason is to facilitate analysis by isolating the changes in the balance sheet that are not caused by converting each local currency into euros.
These changes excluding the impact of exchange rate movements are calculated by converting loans and advances to customers excluding reverse repos and customer funds excluding repos, into our presentation currency, the euro, applying the closing exchange rate on the last working day of March 2020 to all periods contemplated in the analysis.
The average and period-end exchange rates for the main currencies in which the Group operates are set out in the table below.
Exchange rates: 1 euro / currency parity | |||||||||||
Average (income statement) | Period-end (balance sheet) | ||||||||||
Q1'20 | Q1'19 | Mar-20 | Dec-19 | Mar-19 | |||||||
US dollar | 1.102 | 1.136 | 1.096 | 1.123 | 1.124 | ||||||
Pound sterling | 0.861 | 0.872 | 0.886 | 0.851 | 0.858 | ||||||
Brazilian real | 4.889 | 4.277 | 5.700 | 4.516 | 4.387 | ||||||
Mexican peso | 21.898 | 21.804 | 26.177 | 21.220 | 21.691 | ||||||
Chilean peso | 886.223 | 757.486 | 934.656 | 845.673 | 764.435 | ||||||
Argentine peso | 67.819 | 44.208 | 70.546 | 67.258 | 48.659 | ||||||
Polish zloty | 4.321 | 4.302 | 4.551 | 4.257 | 4.301 | ||||||
86 | | January - March 2020 |
Response to the COVID-19 crisis Business model | ||||||||
Interim condensed consolidated financial statements | ||||||||
INTERIM CONDENSED CONSOLIDATED FINANCIAL STATEMENTS
• | CONSOLIDATED BALANCE SHEET |
• | CONSOLIDATED INCOME STATEMENT |
NOTE: | The following financial information for the first three months of 2020 and 2019 (attached herewith) corresponds to the condensed consolidated financial statements prepared in accordance with the International Financial Reporting Standards. |
Interim condensed consolidated balance sheet | ||||||
EUR million | ||||||
ASSETS | Mar-20 | Dec-19 | Mar-19 | |||
Cash, cash balances at central banks and other deposits on demand | 122,456 | 101,067 | 103,500 | |||
Financial assets held for trading | 125,846 | 108,230 | 98,592 | |||
Non-trading financial assets mandatorily at fair value through profit or loss | 4,483 | 4,911 | 6,661 | |||
Financial assets designated at fair value through profit or loss | 62,659 | 62,069 | 75,488 | |||
Financial assets at fair value through other comprehensive income | 110,238 | 125,708 | 116,359 | |||
Financial assets at amortised cost | 981,331 | 995,482 | 980,733 | |||
Hedging derivatives | 12,755 | 7,216 | 7,270 | |||
Changes in the fair value of hedged items in portfolio hedges of interest risk | 2,089 | 1,702 | 1,435 | |||
Investments | 8,610 | 8,772 | 7,726 | |||
Joint ventures companies | 1,266 | 1,325 | 956 | |||
Associated entities | 7,344 | 7,447 | 6,770 | |||
Assets under insurance or reinsurance contracts | 312 | 292 | 332 | |||
Tangible assets | 34,912 | 35,235 | 33,246 | |||
Property, plant and equipment | 33,972 | 34,262 | 32,149 | |||
For own-use | 14,089 | 15,041 | 14,771 | |||
Leased out under an operating lease | 19,883 | 19,221 | 17,378 | |||
Investment property | 940 | 973 | 1,097 | |||
Of which Leased out under an operating lease | 806 | 823 | 786 | |||
Intangible assets | 26,583 | 27,687 | 29,114 | |||
Goodwill | 23,141 | 24,246 | 25,989 | |||
Other intangible assets | 3,442 | 3,441 | 3,125 | |||
Tax assets | 29,607 | 29,585 | 29,634 | |||
Current tax assets | 7,516 | 6,827 | 6,415 | |||
Deferred tax assets | 22,091 | 22,758 | 23,219 | |||
Other assets | 13,564 | 10,138 | 11,501 | |||
Insurance contracts linked to pensions | 186 | 192 | 204 | |||
Inventories | 5 | 5 | 4 | |||
Other | 13,373 | 9,941 | 11,293 | |||
Non-current assets held for sale | 4,914 | 4,601 | 4,560 | |||
TOTAL ASSETS | 1,540,359 | 1,522,695 | 1,506,151 | |||
January - March 2020 | | 87 |
Response to the COVID-19 crisis Business model | ||||||||
Interim condensed consolidated financial statements | ||||||||
Interim condensed consolidated balance sheet | ||||||
EUR million | ||||||
LIABILITIES | Mar-20 | Dec-19 | Mar-19 | |||
Financial liabilities held for trading | 100,082 | 77,139 | 67,994 | |||
Financial liabilities designated at fair value through profit or loss | 67,337 | 60,995 | 74,426 | |||
Financial liabilities at amortised cost | 1,224,749 | 1,230,745 | 1,211,981 | |||
Hedging derivatives | 6,673 | 6,048 | 7,273 | |||
Changes in the fair value of hedged items in portfolio hedges of interest rate risk | 264 | 269 | 313 | |||
Liabilities under insurance or reinsurance contracts | 2,280 | 739 | 751 | |||
Provisions | 12,335 | 13,987 | 13,449 | |||
Pensions and other post-retirement obligations | 5,507 | 6,358 | 5,737 | |||
Other long term employee benefits | 1,273 | 1,382 | 1,160 | |||
Taxes and other legal contingencies | 2,519 | 3,057 | 3,205 | |||
Contingent liabilities and commitments | 668 | 739 | 710 | |||
Other provisions | 2,368 | 2,451 | 2,637 | |||
Tax liabilities | 9,405 | 9,322 | 8,783 | |||
Current tax liabilities | 2,588 | 2,800 | 2,699 | |||
Deferred tax liabilities | 6,817 | 6,522 | 6,084 | |||
Other liabilities | 11,121 | 12,792 | 10,816 | |||
Liabilities associated with non-current assets held for sale | — | — | — | |||
TOTAL LIABILITIES | 1,434,246 | 1,412,036 | 1,395,786 | |||
EQUITY | ||||||
Shareholders´ equity | 124,139 | 124,239 | 121,866 | |||
Capital | 8,309 | 8,309 | 8,118 | |||
Called up paid capital | 8,309 | 8,309 | 8,118 | |||
Unpaid capital which has been called up | — | — | — | |||
Share premium | 52,446 | 52,446 | 50,993 | |||
Equity instruments issued other than capital | 604 | 598 | 573 | |||
Equity component of the compound financial instrument | — | — | — | |||
Other equity instruments issued | 604 | 598 | 573 | |||
Other equity | 171 | 146 | 172 | |||
Accumulated retained earnings | 67,594 | 61,028 | 64,346 | |||
Revaluation reserves | — | — | — | |||
Other reserves | (3,580 | ) | (3,110 | ) | (1,933 | ) |
(-) Own shares | (74 | ) | (31 | ) | (6 | ) |
Profit attributable to shareholders of the parent | 331 | 6,515 | 1,840 | |||
(-) Interim dividends | (1,662 | ) | (1,662 | ) | (2,237 | ) |
Other comprehensive income | (27,761 | ) | (24,168 | ) | (23,021 | ) |
Items not reclassified to profit or loss | (3,484 | ) | (4,288 | ) | (3,469 | ) |
Items that may be reclassified to profit or loss | (24,277 | ) | (19,880 | ) | (19,552 | ) |
Non-controlling interest | 9,735 | 10,588 | 11,520 | |||
Other comprehensive income | (1,696 | ) | (982 | ) | (1,137 | ) |
Other elements | 11,431 | 11,570 | 12,657 | |||
TOTAL EQUITY | 106,113 | 110,659 | 110,365 | |||
TOTAL LIABILITIES AND EQUITY | 1,540,359 | 1,522,695 | 1,506,151 | |||
MEMORANDUM ITEMS | ||||||
Loans commitment granted | 217,767 | 241,179 | 221,305 | |||
Financial guarantees granted | 12,810 | 13,650 | 12,265 | |||
Other commitments granted | 73,128 | 68,895 | 79,472 | |||
January - March 2020 | | 88 |
Response to the COVID-19 crisis Business model | ||||||||
Interim condensed consolidated financial statements | ||||||||
Interim condensed consolidated income statement | ||||
EUR million | ||||
Q1'20 | Q1'19 | |||
Interest income | 13,208 | 14,280 | ||
Financial assets at fair value through other comprehensive income | 1,145 | 1,022 | ||
Financial assets at amortised cost | 11,402 | 11,987 | ||
Other interest income | 661 | 1,271 | ||
Interest expense | (4,721 | ) | (5,598 | ) |
Net interest income | 8,487 | 8,682 | ||
Dividend income | 57 | 66 | ||
Share of results of entities accounted for using the equity method | 98 | 153 | ||
Commission income | 3,765 | 3,746 | ||
Commission expense | (912 | ) | (815 | ) |
Gain or losses on financial assets and liabilities not measured at fair value through profit or loss, net | 312 | 116 | ||
Financial assets at amortised cost | (23 | ) | 5 | |
Other financial assets and liabilities | 335 | 111 | ||
Gain or losses on financial assets and liabilities held for trading, net | 3,975 | 28 | ||
Reclassification of financial assets at fair value through other comprehensive income | — | — | ||
Reclassification of financial assets at amortised cost | — | — | ||
Other gains (losses) | 3,975 | 28 | ||
Gains or losses on non-trading financial assets and liabilities mandatorily at fair value through profit or loss | (41 | ) | 131 | |
Reclassification of financial assets at fair value through other comprehensive income | — | — | ||
Reclassification of financial assets at amortised cost | — | — | ||
Other gains (losses) | (41 | ) | 131 | |
Gain or losses on financial assets and liabilities measured at fair value through profit or loss, net | (55 | ) | (76 | ) |
Gain or losses from hedge accounting, net | 138 | (29 | ) | |
Exchange differences (profit or loss) net | (4,042 | ) | 107 | |
Other operating income | 435 | 419 | ||
Other operating expenses | (451 | ) | (469 | ) |
Income from assets under insurance and reinsurance contracts | 452 | 882 | ||
Expenses from liabilities under insurance and reinsurance contracts | (409 | ) | (856 | ) |
Total income | 11,809 | 12,085 | ||
Administrative expenses | (4,860 | ) | (5,011 | ) |
Staff costs | (2,899 | ) | (3,006 | ) |
Other general administrative expenses | (1,961 | ) | (2,005 | ) |
Depreciation and amortisation cost | (729 | ) | (747 | ) |
Provisions or reversal of provisions, net | (374 | ) | (465 | ) |
Impairment or reversal of impairment at financial assets not measured at fair value through profit or loss and net gains and losses from changes | (3,934 | ) | (2,246 | ) |
Financial assets at fair value with changes in other comprehensive income | (1 | ) | (3 | ) |
Financial assets at amortised cost | (3,933 | ) | (2,243 | ) |
Impairment of investments in subsidiaries, joint ventures and associates, net | — | — | ||
Impairment on non-financial assets, net | (14 | ) | (20 | ) |
Tangible assets | (3 | ) | (20 | ) |
Intangible assets | (8 | ) | (1 | ) |
Others | (3 | ) | 1 | |
Gain or losses on non financial assets and investments, net | 18 | 219 | ||
Negative goodwill recognised in results | — | — | ||
Gains or losses on non-current assets held for sale not classified as discontinued operations | (25 | ) | (213 | ) |
Profit or loss before tax from continuing operations | 1,891 | 3,602 | ||
Tax expense or income from continuing operations | (1,244 | ) | (1,357 | ) |
Profit for the period from continuing operations | 647 | 2,245 | ||
Profit or loss after tax from discontinued operations | — | — | ||
Profit for the period | 647 | 2,245 | ||
Profit attributable to non-controlling interests | 316 | 405 | ||
Profit attributable to the parent | 331 | 1,840 | ||
Earnings per share | ||||
Basic | 0.012 | 0.104 | ||
Diluted | 0.011 | 0.104 | ||
January - March 2020 | | 89 |
GLOSSARY
• | Active customer: Those customers who comply with the minimum balance, income and/or transactionality requirements as defined according to the business area |
• | ALCO: Assets and Liabilities Committee |
• | APM: Alternative Performance Measures |
• | bps: basis points |
• | CET1: Core equity tier 1 |
• | CNMV: Spanish National Securities Market Commission (Comisión Nacional del Mercado de Valores) |
• | COVID-19: Corona Virus Disease 19 |
• | Digital customers: Every consumer of a commercial bank’s services who has logged on to their personal online banking and/or mobile banking in the last 30 days |
• | EBA: European Banking Authority |
• | ECB: European Central Bank |
• | EPS: Earnings per share |
• | ESG: Environmental, Social and Governance |
• | ESMA: European Securities and Markets Authority |
• | Fed: Federal Reserve |
• | FX: Foreign Exchange |
• | GDP: Gross Domestic Product |
• | IFRS 9: International Financial Reporting Standard 9, regarding financial instruments |
• | IFRS 16: International Financial Reporting Standard 16, regarding leases |
• | Loyal customers: Active customers who receive most of their financial services from the Group according to the commercial segment that they belong to. Various engaged customer levels have been defined taking profitability into account. |
• | NPLs: Non-performing loans |
• | P/E ratio: Price / earnings per share ratio |
• | PBT: Profit before tax |
• | pp: percentage points |
• | PPI: Payment protection insurance |
• | Repos: Repurchase agreements |
• | RoA: Return on assets |
• | RoE: Return on equity |
• | RoRWA: Return on risk weighted assets |
• | RoTE: Return on tangible equity |
• | RWAs: Risk weighted assets |
• | SAM: Santander Asset Management |
• | SBNA: Santander Bank N.A. |
• | SCF: Santander Consumer Finance |
• | SCIB: Santander Corporate & Investment Banking |
• | SC USA: Santander Consumer USA |
• | SEC: Securities and Exchanges Commission |
• | SGP: Santander Global Platform |
• | SH USA: Santander Holdings USA, Inc. |
• | SMEs: Small and medium enterprises |
• | SPF: Simple, Personal and Fair |
• | SREP: Supervisory Review and Evaluation Process |
• | SSM: Single Supervisory Mechanism, the system of banking supervision in Europe. It comprises the ECB and the national supervisory authorities of the participating countries |
• | T1: Tier 1 |
• | TLAC: The total loss-absorption capacity requirement which is required to be met under the CRD V package |
• | TNAV: Tangible net asset value |
• | TRIM: Targeted review of internal models |
• | VaR: Value at Risk |
• | WM&I: Wealth Management & Insurance |
90 | | January - March 2020 |
Response to the COVID-19 crisis Business model | ||||||||
Important information | ||||||||
Important information
Non-IFRS and alternative performance measures
In addition to the financial information prepared in accordance with International Financial Reporting Standards (“IFRS”), this report contains certain financial measures that constitute alternative performance measures (“APMs”) as defined in the Guidelines on Alternative Performance Measures issued by the European Securities and Markets Authority (ESMA) on 5 October 2015 (ESMA/2015/1415en) and other non-IFRS measures (“Non-IFRS Measures”). The financial measures contained in this report that qualify as APMs and non-IFRS measures have been calculated using the financial information from Santander Group but are not defined or detailed in the applicable financial reporting framework and have neither been audited nor reviewed by our auditors. We use these APMs and non-IFRS measures when planning, monitoring and evaluating our performance. We consider these APMs and non-IFRS measures to be useful metrics for management and investors to facilitate operating performance comparisons from period to period. While we believe that these APMs and non-IFRS measures are useful in evaluating our business, this information should be considered as supplemental in nature and is not meant as a substitute of IFRS measures. In addition, other companies, including companies in our industry, may calculate or use such measures differently, which reduces their usefulness as comparative measures. For further details of the APMs and non-IFRS Measures used, including its definition or a reconciliation between any applicable management indicators and the financial data presented in the consolidated financial statements prepared under IFRS, please see 2019 Annual Financial Report, published in the CNMV on 28 February 2020, our 20-F report for the year ending 31 December 2019 registered with the SEC in the United States as well as the section “Alternative performance measures” of the annex to this report.
The businesses included in each of our geographic segments and the accounting principles under which their results are presented here may differ from the included businesses and local applicable accounting principles of our public subsidiaries in such geographies. Accordingly, the results of operations and trends shown for our geographic segments may differ materially from those of such subsidiaries.
Forward-looking statements
Santander cautions that this report contains statements that constitute “forward-looking statements” within the meaning of the U.S. Private Securities Litigation Reform Act of 1995. Forward-looking statements may be identified by words such as “expect”, “project”, “anticipate”, “should”, “intend”, “probability”, “risk”, “VaR”, “RoRAC”, “RoRWA”, “TNAV”, “target”, “goal”, “objective”, “estimate”, “future” and similar expressions. These forward-looking statements are found in various places throughout this report and include, without limitation, statements concerning our future business development and economic performance and our shareholder remuneration policy. While these forward-looking statements represent our judgment and future expectations concerning the development of our business, a number of risks, uncertainties and other important factors could cause actual developments and results to differ materially from our expectations. The following important factors, in addition to those discussed elsewhere in this report, and in our annual report on Form 20-F for the year ended December 31, 2018, filed with the U.S. Securities and Exchange Commission, could affect our future results and could cause outcomes to differ materially from those anticipated in any forward-looking statement: (1) general economic or industry conditions in areas in which we have significant business activities or investments, including a worsening of the economic environment, increasing in the volatility of the capital markets, inflation or deflation, and changes in demographics, consumer spending, investment or saving habits; (2) exposure to various types of market risks, principally including interest rate risk, foreign exchange rate risk, equity price risk and risks associated with the replacement of benchmark indices; (3) potential losses associated with prepayment of our loan and investment portfolio, declines in the value of collateral securing our loan portfolio, and counterparty risk; (4) political stability in Spain, the UK, other European countries, Latin America and the US (5) changes in laws, regulations or taxes, including changes in regulatory capital and liquidity requirements, including as a result of the UK exiting the European Union and increased regulation in light of the global financial crisis; (6) our ability to integrate successfully our acquisitions and the challenges inherent in diverting management’s focus and resources from other strategic opportunities and from operational matters while we integrate these acquisitions; and (7) changes in our ability to access liquidity and funding on acceptable terms, including as a result of changes in our credit spreads or a downgrade in our credit ratings or those of our more significant subsidiaries. Numerous factors could affect the future results of Santander and could result in those results deviating materially from those anticipated in the forward-looking statements. Other unknown or unpredictable factors could cause actual results to differ materially from those in the forward-looking statements.
Forward-looking statements speak only as of the date of this report and are based on the knowledge, information available and views taken on such date; such knowledge, information and views may change at any time. Santander does not undertake any obligation to update or revise any forward-looking statement, whether as a result of new information, future events or otherwise.
January - March 2020 | | 91 |
Response to the COVID-19 crisis Business model | ||||||||
Important information | ||||||||
No offer
The information contained in this report is subject to, and must be read in conjunction with, all other publicly available information, including, where relevant any fuller disclosure document published by Santander. Any person at any time acquiring securities must do so only on the basis of such person’s own judgment as to the merits or the suitability of the securities for its purpose and only on such information as is contained in such public information having taken all such professional or other advice as it considers necessary or appropriate in the circumstances and not in reliance on the information contained in this report. No investment activity should be undertaken on the basis of the information contained in this report. In making this report available Santander gives no advice and makes no recommendation to buy, sell or otherwise deal in shares in Santander or in any other securities or investments whatsoever.
Neither this report nor any of the information contained therein constitutes an offer to sell or the solicitation of an offer to buy any securities. No offering of securities shall be made in the United States except pursuant to registration under the U.S. Securities Act of 1933, as amended, or an exemption therefrom. Nothing contained in this report is intended to constitute an invitation or inducement to engage in investment activity for the purposes of the prohibition on financial promotion in the U.K. Financial Services and Markets Act 2000.
Historical performance is not indicative of future results
Statements as to historical performance or financial accretion are not intended to mean that future performance, share price or future earnings (including earnings per share) for any period will necessarily match or exceed those of any prior period. Nothing in this report should be construed as a profit forecast.
This document is a translation of a document originally issued in Spanish. Should there be any discrepancies between the English and the Spanish versions, only the original Spanish version should be binding. |
92 | | January - March 2020 |
PART 2. INTERIM UNAUDITED CONSOLIDATED FINANCIAL STATEMENTS | |
January - March 2020 | |
Simple Personal Fair |  |
Banco Santander, S.A. and Companies composing Santander Group Interim Condensed Consolidated Financial Statements for the three-month period ended 31 March 2020 |
Translation of interim condensed consolidated financial statements originally issued in Spanish and prepared in accordance with the regulatory financial reporting framework applicable to the Group in Spain (see Notes 1 and 17). In the event of a discrepancy, the Spanish-language version prevails.
95
Translation of interim condensed consolidated financial statements originally issued in Spanish and prepared in accordance with the regulatory financial reporting framework applicable to the Group in Spain (see Notes 1 and 17). In the event of a discrepancy, the Spanish-language version prevails.
SANTANDER GROUP
CONDENSED CONSOLIDATED BALANCE SHEETS AS AT 31 MARCH 2020 AND 31 DECEMBER 2019
(Million euros)
ASSETS | Note | 31-03-2020 | 31-12-2019 (*) |
CASH, CASH BALANCES AT CENTRAL BANKS AND OTHER DEPOSITS ON DEMAND | 122,456 | 101,067 | |
FINANCIAL ASSETS HELD FOR TRADING | 5 | 125,846 | 108.230 |
NON-TRADING FINANCIAL ASSETS MANDATORILY AT FAIR VALUE THROUGH PROFIT OR LOSS | 5 | 4,483 | 4,911 |
FINANCIAL ASSETS DESIGNATED AT FAIR VALUE THROUGH PROFIT OR LOSS | 5 | 62,659 | 62,069 |
FINANCIAL ASSETS AT FAIR VALUE THROUGH OTHER COMPREHENSIVE INCOME | 5 | 110,238 | 125,708 |
FINANCIAL ASSETS AT AMORTISED COST | 5 | 981,331 | 995,482 |
HEDGING DERIVATIVES | 12,755 | 7,216 | |
CHANGES IN THE FAIR VALUE OF HEDGED ITEMS IN PORTFOLIO HEDGES OF INTEREST RISK | 2,089 | 1,702 | |
INVESTMENTS | 8,610 | 8,772 | |
Joint ventures entities | 1,266 | 1,325 | |
Associated entities | 7,344 | 7,447 | |
ASSETS UNDER INSURANCE OR REINSURANCE CONTRACTS | 312 | 292 | |
TANGIBLE ASSETS | 7 | 34,912 | 35,235 |
Property, plant and equipment | 33,972 | 34,262 | |
For own-use | 14,089 | 15,041 | |
Leased out under an operating lease | 19,883 | 19,221 | |
Investment property | 940 | 973 | |
Of which Leased out under an operating lease | 806 | 823 | |
INTANGIBLE ASSETS | 8 | 26,583 | 27,687 |
Goodwill | 23,141 | 24,246 | |
Other intangible assets | 3,442 | 3,441 | |
TAX ASSETS | 29,607 | 29,585 | |
Current tax assets | 7,516 | 6,827 | |
Deferred tax assets | 22,091 | 22,758 | |
OTHER ASSETS | 13,564 | 10,138 | |
Insurance contracts linked to pensions | 186 | 192 | |
Inventories | 5 | 5 | |
Other | 13,373 | 9,941 | |
NON-CURRENT ASSETS HELD FOR SALE | 6 | 4,914 | 4,601 |
TOTAL ASSETS | 1,540,359 | 1,522,695 | |
(*) Presented for comparison purposes only (see Note 1.e).
The accompanying explanatory Notes 1 to 17 are an integral part of the condensed consolidated balance sheet as at 31 March 2020.
96
Translation of interim condensed consolidated financial statements originally issued in Spanish and prepared in accordance with the regulatory financial reporting framework applicable to the Group in Spain (see Notes 1 and 17). In the event of a discrepancy, the Spanish-language version prevails.
SANTANDER GROUP
CONDENSED CONSOLIDATED BALANCE SHEETS AS AT 31 MARCH 2020 AND 31 DECEMBER 2019
(Million euros)
LIABILITIES | Note | 31-03-2020 | 31-12-2019 (*) | ||
FINANCIAL LIABILITIES HELD FOR TRADING | 9 | 100,082 | 77,139 | ||
FINANCIAL LIABILITIES DESIGNATED AT FAIR VALUE THROUGH PROFIT OR LOSS | 9 | 67,337 | 60,995 | ||
FINANCIAL LIABILITIES AT AMORTISED COST | 9 | 1,224,749 | 1.230.745 | ||
HEDGING DERIVATIVES | 6,673 | 6,048 | |||
CHANGES IN THE FAIR VALUE OF HEDGED ITEMS IN PORTFOLIO HEDGES OF INTEREST RATE RISK | 264 | 269 | |||
LIABILITIES UNDER INSURANCE OR REINSURANCE CONTRACTS | 2,280 | 739 | |||
PROVISIONS | 12,335 | 13,987 | |||
Pensions and other post-retirement obligations | 10 | 5,507 | 6,358 | ||
Other long term employee benefits | 10 | 1,273 | 1,382 | ||
Taxes and other legal contingencies | 10 | 2,519 | 3,057 | ||
Contingent liabilities and commitments | 14 | 668 | 739 | ||
Other provisions | 10 | 2,368 | 2,451 | ||
TAX LIABILITIES | 9,405 | 9,322 | |||
Current tax liabilities | 2,588 | 2,800 | |||
Deferred tax liabilities | 6,817 | 6,522 | |||
OTHER LIABILITIES | 11,121 | 12,792 | |||
LIABILITIES ASSOCIATED WITH NON-CURRENT ASSETS HELD FOR SALE | — | — | |||
TOTAL LIABILITIES | 1,434,246 | 1,412,036 | |||
SHAREHOLDERS´ EQUITY | 124,139 | 124,239 | |||
CAPITAL | 11 | 8,309 | 8,309 | ||
Called up paid capital | 8,309 | 8,309 | |||
Unpaid capital which has been called up | — | — | |||
SHARE PREMIUM | 52,446 | 52,446 | |||
EQUITY INSTRUMENTS ISSUED OTHER THAN CAPITAL | 604 | 598 | |||
Equity component of the compound financial instrument | — | — | |||
Other equity instruments issued | 604 | 598 | |||
OTHER EQUITY | 171 | 146 | |||
ACCUMULATED RETAINED EARNINGS | 67,594 | 61,028 | |||
REVALUATION RESERVES | — | — | |||
OTHER RESERVES | (3,580) | (3,110) | |||
(-) OWN SHARES | (74) | (31) | |||
PROFIT ATTRIBUTABLE TO SHAREHOLDERS OF THE PARENT | 3 | 331 | 6,515 | ||
(-) INTERIM DIVIDENDS | (1,662) | (1,662) | |||
OTHER COMPREHENSIVE INCOME (LOSS) | (27,761) | (24,168) | |||
ITEMS NOT RECLASSIFIED TO PROFIT OR LOSS | 11 | (3,484) | (4,288) | ||
ITEMS THAT MAY BE RECLASSIFIED TO PROFIT OR LOSS | 11 | (24,277) | (19,880) | ||
NON-CONTROLLING INTEREST | 9,735 | 10,588 | |||
Other comprehensive income | (1,696) | (982) | |||
Other elements | 11,431 | 11,570 | |||
EQUITY | 106,113 | 110,659 | |||
TOTAL LIABILITIES AND EQUITY | 1,540,359 | 1,522,695 | |||
MEMORANDUM ITEMS: OFF BALANCE SHEET AMOUNTS | 14 | ||||
Loans commitment granted | 217,767 | 241,179 | |||
Financial guarantees granted | 12,810 | 13,650 | |||
Other commitments granted | 73,128 | 68,895 | |||
(*) Presented for comparison purposes only (see Note 1.e).
The accompanying explanatory Notes 1 to 17 are an integral part of the condensed consolidated balance sheet as at 31 March 2020.
97
Translation of interim condensed consolidated financial statements originally issued in Spanish and prepared in accordance with the regulatory financial reporting framework applicable to the Group in Spain (see Notes 1 and 17). In the event of a discrepancy, the Spanish-language version prevails.
SANTANDER GROUP
CONDENSED CONSOLIDATED INCOME STATEMENTS
FOR THE THREE-MONTH PERIODS ENDED 31 MARCH 2020 AND 2019
(Million euros)
Debit/Credit | |||||
Note | 01-01-2020 to 31-03-2020 | 01-01-2019 to 31-03-2019(*) | |||
Interest income | 13,208 | 14,280 | |||
Financial assets at fair value with changes in other comprehensive income | 1,145 | 1,022 | |||
Financial assets at amortised cost | 11,402 | 11,987 | |||
Other interest income | 661 | 1,271 | |||
Interest expense | (4,721) | (5,598) | |||
Interest income/ (charges) | 8,487 | 8,682 | |||
Dividend income | 57 | 66 | |||
Income from companies accounted for using the equity method | 98 | 153 | |||
Commission income | 3,765 | 3,746 | |||
Commission expense | (912) | (815) | |||
Gain or losses on financial assets and liabilities not measured at fair value through profit or loss, net | 312 | 116 | |||
Financial assets at amortised cost | (23) | 5 | |||
Other financial assets and liabilities | 335 | 111 | |||
Gain or losses on financial assets and liabilities held for trading, net | 3,975 | 28 | |||
Reclassification of financial assets from fair value with changes in other comprehensive income | — | — | |||
Reclassification of financial assets from amortised cost | — | — | |||
Other gains or (-) losses | 3,975 | 28 | |||
Gains or losses on non-trading financial assets and liabilities mandatorily at fair value through profit or loss | (41) | 131 | |||
Reclassification of financial assets from fair value with changes in other comprehensive income | — | — | |||
Reclassification of financial assets from amortised cost | — | — | |||
Other gains or (-) losses | (41) | 131 | |||
Gain or losses on financial assets and liabilities measured at fair value through profit or loss, net | (55) | (76) | |||
Gain or losses from hedge accounting, net | 138 | (29) | |||
Exchange differences, net | (4,042) | 107 | |||
Other operating income | 435 | 419 | |||
Other operating expenses | (451) | (469) | |||
Income from assets under insurance and reinsurance contracts | 452 | 882 | |||
Expenses from liabilities under insurance and reinsurance contracts | (409) | (856) | |||
Total income | 11,809 | 12,085 | |||
Administrative expenses | (4,860) | (5,011) | |||
Staff costs | (2,899) | (3,006) | |||
Other general administrative expenses | (1,961) | (2,005) | |||
Depreciation and amortisation | (729) | (747) | |||
Provisions or reversal of provisions, net | (374) | (465) | |||
Impairment or reversal of impairment at financial assets not measured at fair value through profit or loss, net | (3,934) | (2,246) | |||
Financial assets at fair value through other comprehensive income | (1) | (3) | |||
Financial assets at amortised cost | 5 | (3,933) | (2,243) | ||
Impairment of investments in subsidiaries, joint ventures and associates, net | — | — | |||
Impairment on non-financial assets, net | (14) | (20) | |||
Tangible assets | (3) | (20) | |||
Intangible assets | (8) | (1) | |||
Others | (3) | 1 | |||
Gain or losses on non financial assets and investments, net | 18 | 219 | |||
Negative goodwill recognised in results | — | — | |||
Gains or losses on non-current assets held for sale not classified as discontinued operations | 6 | (25) | (213) | ||
Operating profit/(loss) before tax | 1,891 | 3,602 | |||
Tax expense or income from continuing operations | (1,244) | (1,357) | |||
Profit for the period from continuing operations | 647 | 2,245 | |||
Profit or loss after tax from discontinued operations | — | — | |||
Profit for the period | 647 | 2,245 | |||
Profit attributable to non-controlling interests | 316 | 405 | |||
Profit attributable to the parent | 331 | 1,840 | |||
Earnings per share | 3 | ||||
Basic | 0.01 | 0.10 | |||
Diluted | 0.01 | 0.10 | |||
(*) Presented for comparison purposes only (see Note 1.e).
The accompanying explanatory Notes 1 to 17 are an integral part of the condensed consolidated income statement for the three-month period ended 31 March 2020.
98
Translation of interim condensed consolidated financial statements originally issued in Spanish and prepared in accordance with the regulatory financial reporting framework applicable to the Group in Spain (see Notes 1 and 17). In the event of a discrepancy, the Spanish-language version prevails.
SANTANDER GROUP
CONDENSED CONSOLIDATED STATEMENTS OF RECOGNISED INCOME AND EXPENSE
FOR THE THREE MONTH PERIODS ENDED 31 MARCH 2020 AND 2019
(Million euros)
Note | 01-01-2020 to 31-03-2020 | 01-01-2019 to 31-03-2019(*) | |||
CONSOLIDATED PROFIT FOR THE PERIOD | 647 | 2,245 | |||
OTHER RECOGNISED INCOME AND EXPENSE | (4,307) | 1,258 | |||
Items that will not be reclassified to profit or loss | 830 | (530) | |||
Actuarial gains and losses on defined benefit pension plans | 11 | 2,322 | (468) | ||
Non-current assets held for sale | — | — | |||
Other recognised income and expense of investments in subsidiaries, joint ventures and associates | (7) | 0 | |||
Changes in the fair value of equity instruments measured at fair value through other comprehensive income | (883) | (118) | |||
Gains or losses resulting from the accounting for hedges of equity instruments measured at fair value through other comprehensive income, net | |||||
— | — | ||||
Changes in the fair value of equity instruments measured at fair value through other comprehensive income (hedged item) | 17 | — | |||
Changes in the fair value of equity instruments measured at fair value through other comprehensive income (hedging instrument) | (17) | — | |||
Changes in the fair value of financial liabilities at fair value through profit or loss attributable to changes in credit risk | 6 | (84) | |||
Income tax relating to items that will not be reclassified | (608) | 140 | |||
Items that may be reclassified to profit or loss | (5,137) | 1,788 | |||
Hedges of net investments in foreign operations (effective portion) | 11 | 2,267 | (733) | ||
Revaluation gains (losses) | 2,267 | (733) | |||
Amounts transferred to income statement | — | — | |||
Other reclassifications | — | — | |||
Exchanges differences | 11 | (7,604) | 2,111 | ||
Revaluation gains (losses) | (7,604) | 2,111 | |||
Amounts transferred to income statement | — | — | |||
Other reclassifications | — | — | |||
Cash flow hedges (effective portion) | 970 | (179) | |||
Revaluation gains (losses) | 2,452 | (1,046) | |||
Amounts transferred to income statement | (1,482) | 867 | |||
Transferred to initial carrying amount of hedged items | — | — | |||
Other reclassifications | — | — | |||
Hedging instruments (items not designated) | — | — | |||
Revaluation gains (losses) | — | — | |||
Amounts transferred to income statement | — | — | |||
Other reclassifications | — | — | |||
Debt instruments at fair value with changes in other comprehensive income | (923) | 720 | |||
Revaluation gains (losses) | (944) | 835 | |||
Amounts transferred to income statement | (352) | (115) | |||
Other reclassifications | 373 | — | |||
Non-current assets held for sale | — | — | |||
Revaluation gains (losses) | — | — | |||
Amounts transferred to income statement | — | — | |||
Other reclassifications | — | — | |||
Share of other recognised income and expense of investments | (119) | 38 | |||
Income tax relating to items that may be reclassified to profit or loss | 272 | (169) | |||
Total recognised income and expenses | (3,660) | 3,503 | |||
Attributable to non-controlling interests | (398) | 560 | |||
Attributable to the parent | (3,262) | 2,943 | |||
(*) Presented for comparison purposes only (see Note 1.e).
The accompanying explanatory Notes 1 to 17 are an integral part of the condensed consolidated statement of recognised income and expense for the three-month period ended 31 March 2020.
99
Translation of interim condensed consolidated financial statements originally issued in Spanish and prepared in accordance with the regulatory financial reporting framework applicable to the Group in Spain (see Notes 1 and 17). In the event of a discrepancy, the Spanish-language version prevails.
SANTANDER GROUP
CONDENSED CONSOLIDATED STATEMENTS OF CHANGES IN TOTAL EQUITY
FOR THE THREE-MONTH PERIODS ENDED 31 MARCH 2020 AND 2019
(Million euros)
Capital | Share premium | Equity instruments issued (not capital) | Other equity instruments | Accumulated retained earnings | Revaluation reserves | Other reserves | (-) Own shares | Profit Attributable to shareholders of the parent | (-) Interim dividends | Other comprehensive income | Non-Controlling interest | Total | ||||||||||||||||
Other comprehensive income | Others items | |||||||||||||||||||||||||||
Balance as at 31-12-2019 (*) | 8,309 | 52,446 | 598 | 146 | 61,028 | — | (3,110 | ) | (31 | ) | 6,515 | (1,662 | ) | (24,168 | ) | (982 | ) | 11,570 | 110,659 | |||||||||
Adjustments due to errors | — | — | — | — | — | — | — | — | — | — | — | — | — | — | ||||||||||||||
Adjustments due to changes in accounting policies | — | — | — | — | — | — | — | — | — | — | — | — | — | — | ||||||||||||||
Opening balance as at 01-01-2020 (*) | 8,309 | 52,446 | 598 | 146 | 61,028 | — | (3,110 | ) | (31 | ) | 6,515 | (1,662 | ) | (24,168 | ) | (982 | ) | 11,570 | 110,659 | |||||||||
Total recognised income and expense | — | — | — | — | — | — | — | — | 331 | — | (3,593 | ) | (714 | ) | 316 | (3,660 | ) | |||||||||||
Other changes in equity | — | — | 6 | 25 | 6,566 | — | (470 | ) | (43 | ) | (6,515 | ) | — | — | — | (455 | ) | (886 | ) | |||||||||
Issuance of ordinary shares | — | — | — | — | — | — | — | — | — | — | — | — | 80 | 80 | ||||||||||||||
Issuance of preferred shares | — | — | — | — | — | — | — | — | — | — | — | — | — | — | ||||||||||||||
Issuance of other financial instruments | — | — | — | — | — | — | — | — | — | — | — | — | — | — | ||||||||||||||
Maturity of other financial instruments | — | — | — | — | — | — | — | — | — | — | — | — | — | — | ||||||||||||||
Conversion of financial liabilities into equity | — | — | — | — | — | — | — | — | — | — | — | — | — | — | ||||||||||||||
Capital reduction | — | — | — | — | — | — | — | — | — | — | — | — | — | — | ||||||||||||||
Dividends | — | — | — | — | — | — | — | — | — | — | — | — | (113 | ) | (113 | ) | ||||||||||||
Purchase of equity instruments | — | — | — | — | — | — | — | (313 | ) | — | — | — | — | — | (313 | ) | ||||||||||||
Disposal of equity instruments | — | — | — | — | — | — | 1 | 270 | — | — | — | — | — | 271 | ||||||||||||||
Transfer from equity to liabilities | — | — | — | — | — | — | — | — | — | — | — | — | — | — | ||||||||||||||
Transfer from liabilities to equity | — | — | — | — | — | — | — | — | — | — | — | — | — | — | ||||||||||||||
Transfers between equity items | — | — | — | — | 6,566 | — | (51 | ) | — | (6,515 | ) | — | — | — | — | — | ||||||||||||
Increases (decreases) due to business combinations | — | — | — | — | — | — | — | — | — | — | — | — | — | — | ||||||||||||||
Share-based payment | — | — | — | (56 | ) | — | — | — | — | — | — | — | — | — | (56 | ) | ||||||||||||
Others increases or (-) decreases of the equity | — | — | 6 | 81 | — | — | (420 | ) | — | — | — | — | — | (422 | ) | (755 | ) | |||||||||||
Balance as at 31-03-2020 | 8,309 | 52,446 | 604 | 171 | 67,594 | — | (3,580 | ) | (74 | ) | 331 | (1,662 | ) | (27,761 | ) | (1,696 | ) | 11,431 | 106,113 | |||||||||
(*) Presented for comparison purposes only (see Note 1.e).
The accompanying explanatory Notes 1 to 17 are an integral part of the condensed consolidated statement of changes in total equity for the three-month period ended 31 March 2020.
100
Translation of interim condensed consolidated financial statements originally issued in Spanish and prepared in accordance with the regulatory financial reporting framework applicable to the Group in Spain (see Notes 1 and 17). In the event of a discrepancy, the Spanish-language version prevails.
SANTANDER GROUP
CONDENSED CONSOLIDATED STATEMENTS OF CHANGES IN TOTAL EQUITY
FOR THE THREE-MONTH PERIODS ENDED 31 MARCH 2020 AND 2019
(Million euros)
Capital | Share premium | Equity instruments issued (not capital) | Other equity instruments | Accumulated retained earnings | Revaluation reserves | Other reserves | (-) Own shares | Profit Attributable to shareholders of the parent | (-) Interim dividends | Other comprehensive income | Non-Controlling interest | Total | ||||||||||||||||
Other comprehensive income | Others items | |||||||||||||||||||||||||||
Balance as at 31-12-2018 (*) | 8,118 | 50,993 | 565 | 234 | 56,756 | — | (3,567 | ) | (59 | ) | 7,810 | (2,237 | ) | (22,141 | ) | (1,292 | ) | 12,181 | 107,361 | |||||||||
Adjustments due to errors | — | — | — | — | — | — | — | — | — | — | — | — | — | — | ||||||||||||||
Adjustments due to changes in accounting policies | — | — | — | — | — | — | 1,593 | — | — | — | (1,984 | ) | — | — | (391 | ) | ||||||||||||
Opening balance as at 01-01-2019 (*) | 8,118 | 50,993 | 565 | 234 | 56,756 | — | (1,974 | ) | (59 | ) | 7,810 | (2,237 | ) | (24,125 | ) | (1,292 | ) | 12,181 | 106,970 | |||||||||
Total recognised income and expense | — | — | — | — | — | — | — | — | 1,840 | — | 1,103 | 155 | 405 | 3,503 | ||||||||||||||
Other changes in equity | — | — | 8 | (62 | ) | 7,590 | — | 42 | 53 | (7,810 | ) | — | — | — | 71 | (108 | ) | |||||||||||
Issuance of ordinary shares | — | — | — | — | — | — | — | — | — | — | — | — | — | — | ||||||||||||||
Issuance of preferred shares | — | — | — | — | — | — | — | — | — | — | — | — | — | — | ||||||||||||||
Issuance of other financial instruments | — | — | — | — | — | — | — | — | — | — | — | — | — | — | ||||||||||||||
Maturity of other financial instruments | — | — | — | — | — | — | — | — | — | — | — | — | — | — | ||||||||||||||
Conversion of financial liabilities into equity | — | — | — | — | — | — | — | — | — | — | — | — | — | — | ||||||||||||||
Capital reduction | — | — | — | — | — | — | — | — | — | — | — | — | — | — | ||||||||||||||
Dividends | — | — | — | — | — | — | — | — | — | — | — | — | (136 | ) | (136 | ) | ||||||||||||
Purchase of equity instruments | — | — | — | — | — | — | — | (317 | ) | — | — | — | — | — | (317 | ) | ||||||||||||
Disposal of equity instruments | — | — | — | — | — | — | (6 | ) | 370 | — | — | — | — | — | 364 | |||||||||||||
Transfer from equity to liabilities | — | — | — | — | — | — | — | — | — | — | — | — | — | — | ||||||||||||||
Transfer from liabilities to equity | — | — | — | — | — | — | — | — | — | — | — | — | — | — | ||||||||||||||
Transfers between equity items | — | — | — | — | 7,590 | — | 220 | — | (7,810 | ) | — | — | — | — | — | |||||||||||||
Increases (decreases) due to business combinations | — | — | — | — | — | — | — | — | — | — | — | — | 78 | 78 | ||||||||||||||
Share-based payment | — | — | — | — | — | — | — | — | — | — | — | — | — | — | ||||||||||||||
Others increases or (-) decreases of the equity | — | — | 8 | (62 | ) | — | — | (172 | ) | — | — | — | — | — | 129 | (97 | ) | |||||||||||
Balance as at 31-03-2019 (*) | 8,118 | 50,993 | 573 | 172 | 64,346 | — | (1,932 | ) | (6 | ) | 1,840 | (2,237 | ) | (23,022 | ) | (1,137 | ) | 12,657 | 110,365 | |||||||||
(*) Presented for comparison purposes only (see Note 1.e).
The accompanying explanatory Notes 1 to 17 are an integral part of the condensed consolidated statement of changes in total equity for the three-month period ended 31 March 2020.
101
Translation of interim condensed consolidated financial statements originally issued in Spanish and prepared in accordance with the regulatory financial reporting framework applicable to the Group in Spain (see Notes 1 and 17). In the event of a discrepancy, the Spanish-language version prevails.
SANTANDER GROUP
CONDENSED CONSOLIDATED STATEMENTS OF CASH FLOWS
FOR THE THREE-MONTH PERIODS ENDED 31 MARCH 2020 AND 2019
(Million euros)
Note | 31-03-2020 | 31-03-2019 (*) | |||
A. CASH FLOWS FROM OPERATING ACTIVITIES | 26,461 | (9,493) | |||
Profit for the period | 647 | 2,245 | |||
Adjustments made to obtain the cash flows from operating activities | 5,907 | 5,230 | |||
Depreciation and amortisation cost | 729 | 747 | |||
Other adjustments | 5,178 | 4,483 | |||
Net increase/(decrease) in operating assets | 65,877 | 32,421 | |||
Financial assets held-for-trading | 24,478 | 4,974 | |||
Non-trading financial assets mandatorily at fair value through profit or loss | (395) | (4,344) | |||
Financial assets at fair value through profit or loss | 3,100 | 17,551 | |||
Financial assets at fair value through other comprehensive income | (6,610) | (7,055) | |||
Financial assets at amortised cost | 37,980 | 20,673 | |||
Other operating assets | 7,324 | 622 | |||
Net increase/(decrease) in operating liabilities | 86,460 | 15,620 | |||
Liabilities held-for-trading financial | 27,663 | (2,882) | |||
Financial liabilities designated at fair value through profit or loss | 9,477 | 5,778 | |||
Financial liabilities at amortised cost | 49,886 | 17,101 | |||
Other operating liabilities | (566) | (4,377) | |||
Income tax recovered/(paid) | (676) | (167) | |||
B. CASH FLOWS FROM INVESTING ACTIVITIES | (2,079) | 422 | |||
Payments | 3,024 | 2,508 | |||
Tangible assets | 7 | 1,707 | 2,231 | ||
Intangible assets | 267 | 219 | |||
Investments | 97 | 0 | |||
Subsidiaries and other business units | 2 | 953 | 58 | ||
Non-current assets held for sale and associated liabilities | — | — | |||
Other payments related to investing activities | — | — | |||
Proceeds | 945 | 2,930 | |||
Tangible assets | 7 | 451 | 966 | ||
Intangible assets | — | — | |||
Investments | 21 | 211 | |||
Subsidiaries and other business units | 329 | 70 | |||
Non-current assets held for sale and associated liabilities | 6 | 144 | 1,683 | ||
Other proceeds related to investing activities | — | — | |||
C. CASH FLOW FROM FINANCING ACTIVITIES | (1,396) | (2,806) | |||
Payments | 3,246 | 4,222 | |||
Dividends | 3 | — | 1,055 | ||
Subordinated liabilities | 1,763 | 2,425 | |||
Redemption of own equity instruments | — | — | |||
Acquisition of own equity instruments | 313 | 317 | |||
Other payments related to financing activities | 1,170 | 425 | |||
Proceeds | 1,850 | 1,416 | |||
Subordinated liabilities | 1,500 | 1,056 | |||
Issuance of own equity instruments | 11 | — | — | ||
Disposal of own equity instruments | 272 | 360 | |||
Other proceeds related to financing activities | 78 | 0 | |||
D. EFFECT OF FOREIGN EXCHANGE RATE DIFFERENCES | (1,597) | 1,714 | |||
E. NET INCREASE/(DECREASE) IN CASH AND CASH EQUIVALENTS | 21,389 | (10,163) | |||
F. CASH AND CASH EQUIVALENTS AT BEGINNING OF PERIOD | 101,067 | 113,663 | |||
G. CASH AND CASH EQUIVALENTS AT END OF PERIOD | 122,456 | 103,500 | |||
COMPONENTS OF CASH AND CASH EQUIVALENTS AT END OF PERIOD | |||||
Cash | 8,363 | 8,174 | |||
Cash equivalents at central banks | 98,306 | 80,527 | |||
Other financial assets | 15,787 | 14,799 | |||
Less: Bank overdrafts refundable on demand | — | — | |||
TOTAL CASH AND CASH EQUIVALENTS AT END OF PERIOD | 122,456 | 103,500 | |||
In which: restricted cash | — | — | |||
(*) Presented for comparison purposes only (see Note 1.e).
The accompanying explanatory Notes 1 to 17 are an integral part of the condensed consolidated statement of cash flows for the three-month period ended 31 March 2020.
102
Translation of interim condensed consolidated financial statements originally issued in Spanish and prepared in accordance with the regulatory financial reporting framework applicable to the Group in Spain (see Notes 1 and 17). In the event of a discrepancy, the Spanish-language version prevails.
Banco Santander, S.A. and Companies composing Santander Group
Explanatory notes to the interim condensed consolidated financial statements for the three-month period ended 31 March, 2020
1. Introduction, basis of presentation of the interim condensed consolidated financial statements and other information
a) | Introduction |
Banco Santander, S.A. (the “Bank” or “Banco Santander”) is a private-law entity subject to the rules and regulations applicable to banks operating in Spain. The Bylaws and other public information of the Bank can be consulted at its registered office at Paseo de Pereda 9-12, Santander.
In addition to the operations carried on directly by it, the Bank is the head of a group of subsidiaries that engage in various business activities and which compose, together with it, Santander Group (the “Group” or “Santander Group”).
The Group's interim condensed consolidated financial statements for the three month period ended 31 March 2020 (“interim financial statements”) were prepared and authorised by the Group's directors at the meeting held on 11 May 2020. The Group’s consolidated annual accounts for year 2019 were approved by the shareholders at the Bank’s annual general meeting on 3 April 2020.
b) | Basis of presentation of the interim financial statements |
Under Regulation (EC) no. 1606/2002 of the European Parliament and of the Council of 19 July 2002, all companies governed by the law of an EU Member State and whose securities are admitted to trading on a regulated market of any Member State must prepare their consolidated annual accounts for the years beginning on or after 1 January 2005 in accordance with the International Financial Reporting Standards (“IFRSs”) as previously adopted by the European Union (“EU-IFRSs”). In order to adapt the accounting system of Spanish credit institutions to these standards, the Bank of Spain issued Circular 4/2004, of 22 December, on Public and Confidential Financial Reporting Rules and Formats, which was repealed on 1 January 2018 by Bank of Spain Circular 4/2017, of 27 November 2017, and subsequent modifications.
The consolidated annual accounts for 2019 were approved at the board of directors meeting on 27 February 2020) in compliance with International Financial Reporting Standards as adopted by the European Union, taking into account Bank of Spain Circular 4/2017, and subsequent modifications, using the basis of consolidation, accounting policies and measurement bases described in Note 2 to the aforementioned consolidated annual accounts and, accordingly, they presented fairly the Group’s consolidated equity and consolidated financial position at 31 December 2019 and the consolidated results of its operations, and the consolidated cash flows in 2019. The aforementioned consolidated annual accounts, which are included in the Group’s Form 20-F filed with the U.S. Securities and Exchange Commission on March 6, 2020, and these interim financial statements are also in compliance with International Financial Reporting Standards as issued by the International Accounting Standards Board (“IFRS-IASB”, and together with EU-IFRS, “IFRS”).
These interim financial statements were prepared and are presented in accordance with International Accounting Standard (IAS 34), Interim Financial Reporting, for the preparation of interim condensed financial statements and contain disclosures relating to the three-month period ended on 31 March 2020.
In accordance with IAS 34, the interim financial statements are intended only to provide an update on the content of the latest consolidated annual accounts authorised for issue, focusing on new activities, events and circumstances occurring during the first quarter, and does not duplicate information previously reported in the latest consolidated annual accounts. Consequently, these interim financial statements do not include all the information that would be required for a complete set of consolidated annual accounts prepared in accordance with IFRSs and, accordingly, for a proper comprehension of the information included in these interim financial statements, they should be read together with the Group’s consolidated annual accounts for the year ended 31 December 2019.
Santander Group policies include presenting the interim financial statements for its use in the different markets using the Euro as its presentation currency. The amounts held in other currencies and the balances of entities whose functional currency is not the Euro, have been translated to the presentation currency in accordance with the criteria indicated in Note 2.a to the consolidated annual accounts for 2019. As indicated in that note, for practical reasons, the balance sheet amount has been converted to the closing exchange rate, the equity to the historical type, and the income and expenses have been converted by applying the average exchange rate of the period; the application of such exchange rate or that corresponding to the date of each transaction does not lead to significant differences in the interim financial statements of the Group.
The accounting policies and methods used in authorising and preparing these interim financial statements are the same as those applied in the consolidated annual accounts for 2019, taking into account the standards and interpretations that became applicable during the first three months of 2020, which are detailed below:
– | Modification of IFRS conceptual framework: The IFRS Framework, which sets out the fundamental concepts of financial reporting, is amended. The revised Framework includes: a new chapter about measurement; guidance on financial reporting; improved definitions, in particular the definition of liabilities; and clarifications such as management functions, prudence and measurement uncertainty in financial reporting. |
103
– | Modification of IAS 1 Presentation of financial statements and IAS 8 Accounting policies, changes in accounting estimates and errors which use a consistent definition of materiality throughout International Financial Reporting Standards and the Conceptual Framework for Financial Reporting, clarify when information is material and incorporate some of the guidance in IAS 1 about immaterial information. |
– | Modification of IFRS 3 Business combinations - amendments are introduced. The amendments are intended to assist entities to determine whether a transaction should be accounted for as a business combination or as an asset acquisition. IFRS 3 continues to adopt a market participant’s perspective to determine whether an acquired set of activities and assets is a business. The amendments are mainly due to: clarify the minimum requirements for a business; remove the assessment of whether market participants are capable of replacing any missing elements; add guidance to help entities assess whether an acquired process is substantive; narrow the definitions of a business and of outputs; and introduce an optional fair value concentration test. |
The aforementioned amendments to accounting standards and interpretations have not had a significant effect on the Group’s interim financial statements.
All accounting policies and measurement bases with a material effect on the interim financial statements for 31 March 2020 were applied in their preparation.
By the time of the preparation and authorisation of these interim financial statements, there were no standards to be adopted by the European Union whose effective date of implementation by the IASB is January 1, 2020.
c) | Use of critical estimates |
The consolidated results and the determination of the consolidated equity are sensitive to the accounting principles and policies, valuation criteria and estimates used by the directors of the Bank in preparing the interim financial statements. The main accounting principles, policies, and valuation criteria are indicated in Note 2 of the consolidated annual accounts of the year 2019, except for those indicated in these interim financial statements due to the rules that have come into effect during the first three months of the year 2020.
The interim financial statements contain estimates made by the senior management of the Bank and of the consolidated entities in order to quantify certain of the assets, liabilities, income, expenses and obligations reported herein. These estimates, which were made on the basis of the best information available, relate basically to the following:
1. The income tax expense, which, in accordance with IAS 34, is recognised in interim periods based on the best estimate of the weighted average tax rate expected by the Group for the full financial year;
2. The impairment losses on certain assets - Financial assets at fair value through other comprehensive income, financial assets at amortised cost, non-current assets held for sale, investments in subsidiaries, joint ventures and associates, tangible assets and intangible assets;
3. The assumptions used in the calculation of the post-employment benefit liabilities and commitments and other obligations
4. The useful life of the tangible and intangible assets;
5. The measurement of goodwill impairment arising on consolidation;
6. The calculation of provisions and the consideration of contingent liabilities;
7. The fair value of certain unquoted assets and liabilities;
8. The recoverability of deferred tax assets; and
9. The fair value of the identifiable assets acquired and the liabilities assumed in business combinations in accordance with IFRS 3.
To update the above estimates, the Group's management has considered that since March 2020, COVID-19, a new strain of Coronavirus, has spread to many countries, including Spain. This event has resulted the viral outbreak to be classified as a pandemic by the World Health Organization, which significantly affects economic activity worldwide and, as a result, the Group's operations and financial results. The extent to which COVID-19 will ultimately impact the Group's results will depend on future developments, including actions to contain or treat the disease and mitigate its impact on the economies of the affected countries, which generate uncertainties in the Group’s estimates. For this reason, the Group's management has assessed the current situation according to the best information available, then developing the potential impacts of COVID-19 on the estimates made during the three-month period ended March 31, 2020. From the results of this evaluation, the following aspects stand out:
- Impairment losses: The rapid evolution of the events has required the authorities to adopt immediate and extraordinary measures throughout the world to help mitigate the spread of COVID-19. These measures, which include travel restrictions, quarantines in certain areas and forced closings for certain types of public places and businesses, are adversely affecting the levels of economic activity in the main geographies where the Group operates. This pandemic has generated an unexpected, unpredictable and unprecedented crisis. In turn, these events have generated a high degree of uncertainty that can negatively affect consumer and business confidence.
104
The accounting standard (IFRS 9) requires that the forecasts on future macroeconomic conditions be considered when estimating the provisions for expected losses. In this way, and given that certain assumptions implemented in the Group's current expected loss models are not updated in accordance with the current uncertainty environment due to the suddenness of the event, the Group's management has carried out a process during the quarter to update these estimates taking into account what is indicated by regulatory and supervisory bodies, including the International Accounting Standards Board (“IASB”), the European Central Bank (“ECB”), the European Banking Authority (“EBA”) and the European Markets and Securities Authority (“ESMA”), among others.
In the IASB statement of 27 March 2020 on the application of IFRS 9 in light of current uncertainty resulting from the COVID-19 pandemic, it indicated that a mechanistic approach of the expected loss calculation methodology should not be made. In addition, it indicated that entities are required to develop estimates based on the best available information on past events, current conditions and forecasts of economic conditions. Regarding the forecasts of economic conditions, it establishes that both the effects of COVID-19 and the mitigating support measures that are being carried out must be considered. The ECB, in its communication of 1 April 2020, and in line with the accounting standard, establishes the use of forecasts that avoid pro-cyclical assumptions given the high volatility of prospective scenarios and establishes the use of long-term macroeconomic forecasts.
As indicated by the regulatory bodies, the current environment of uncertainty makes it necessary to apply significant judgments in estimating the potential impacts on the Group's provisions for credit losses. These potential impacts will depend in part on future developments that cannot be currently predicted and include public and / or private actions to contain the health crisis. The impacts will also depend on support measures from governments, central banks and financial entities, such as moratoriums, guarantees and the availability of credit. Although the health crisis is impacting the different geographies of the Group, said crisis is expected to be of different intensity and possibly of a different duration. Additionally, the support measures that the public and private sectors are promoting to face the crisis also vary in different geographies. That said, the complexity of reasonably estimating the Group's expected credit losses increases through the possibility that in some geographies the exit from the economic crisis will be slower than estimated.
The Group has implemented its business continuity plans in all units, with the aim of ensuring the proper functioning of all our activities, as well as providing the necessary support to its clients. In order to address and closely monitor the possible effects derived from the current situation, the Group has launched the planned specific additional governance, including crisis management committees, which address, among others, the following topics:
•Evaluation of all risk factors and identification of focus areas.
•Analysis of the potential impact on all the units in which the Group operates, through continuous monitoring and scenario analysis.
•Analysis and implementation of the various economic mitigation measures adopted by governments and central banks, as well as those designed internally by the Group.
Continuous monitoring and reporting of the main risk indicators, to the Board and to senior management, is key to facilitating the decision-making process. Despite the fact that the situation of COVID-19 has profoundly altered the normal functioning of financial markets and global economic activity, especially since the last weeks of March, the Group maintained the positive trend in terms of credit quality in the first quarter, supported by the positive evolution of the past-due ratio, an adequate coverage ratio and a stable cost of credit.
As previously mentioned about the high degree of uncertainty, and given that the effects related to the COVID-19 situation have not yet materialized in the risk indicators and in the expected credit loss models that estimate the provisions for credit losses in the first quarter, the Group's management, complying with the accounting standard, has updated its accounting estimates adjusting qualitatively the expected credit loss models to incorporate information that reflects the prospective macroeconomic environment, which includes the future effects of changes in variables to which the models are sensitive (such as, for example, gross domestic product, unemployment, housing prices, interest rates, exchange rates, etc.), in the Group's provisions for credit losses and recorded in the first quarter of 2020 an additional provision for impairment of financial assets at amortized cost of 1,600 million euros for the effect of the COVID-19 pandemic. As of March 31, 2020, the balance of provisions covering impairment losses on assets that make up the balance of financial assets at amortized cost amounts to 23,050 million euros.
In order to estimate this provision, the Group has followed the recommendations of the supervisory and regulatory bodies mentioned above, giving greater weight to the medium and long-term projections to avoid the undesired effects of volatility and procyclicality. These medium and long-term macroeconomic forecasts include different scenarios of economic recovery, both with regards to the recovery of activity prior to the pandemic (complete or incomplete recovery), and the time period in which such recovery takes place (periods between 1 and 3 years).
Under this approach, the Group has evaluated the sensitivity of its portfolios to medium and long-term macroeconomic forecasts in various scenarios, also considering the public and private support measures that are being carried out in the different geographies in which it operates. In this way, the Group's management has developed, giving it greater weight, a scenario of economic recovery in the short term but reflecting the permanent impact of the COVID-19 situation in the medium term. In addition, another scenario has been established, giving it a lower weight, which reflects the potential additional impact of a slower economic recovery.
105
These scenarios, which are consistent with the current market consensus, have been constructed under a situation of high uncertainty given the multitude of unknowns existing in the different geographies where the Group operates. The current environment of uncertainty includes unknowns regarding health and other economic, fiscal and monetary policies that may be taking and developing in the future. This qualitative approach, as well as the respective scenarios and weightings, are documented and approved in the risk management process and in accordance with the governance established by the Group.
Given the current uncertainty and the evolution of the COVID-19 situation in the main geographies where the Group operates, the Group's management will review these estimates in future periods and will determine if additional adjustments are necessary to update them with new and reliable internal or external information available. The outcome of the pandemic is uncertain, and it is unknown how long the adverse conditions associated with it will last and what the final impact will be on the Group. It is possible that the estimates made to calculate the provisions for credit losses during the first quarter of 2020 may be materially impacted in the short term and require additional provisions during the current financial year.
Significant increase in credit risk
As a consequence of the COVID-19 situation, the Group has implemented certain measures voluntarily, or required by local regulation, in several of the different geographies where it operates. One of the main measures is the moratorium or deferrals of payments of certain mortgage and personal loans, and loans to companies with partial government guarantees.
In this context and related to the treatment of the significant increase in credit risk, the Group has carried out an evaluation of the measures announced in the different geographies, considering available information and in line with the criteria established in its risk management policy. According to what was published by the different supervisors, the existence of a public or private moratorium is not considered an automatic significant increase in credit risk, but an evaluation should be made of whether the potential deterioration is due to a temporary situation as a result of the situation of COVID-19 or if it is a permanent situation in the whole life of the operation. At the end of 31 March 2020 , considering the date on which the pandemic spread, it has not had a significant impact on the Group. Therefore, the loans have been classified based on the Group's current staging criteria prior to COVID-19. Likewise, the Group will evaluate, as published by the different supervisors, the impact of the potential significant increase in credit risk because of the increase in moratoriums granted during the second quarter.
- Liabilities and commitments for post-employment compensation and other obligations: considering the long-term nature of these commitments, the valuation and hypothesis-setting criteria are maintained for recording and accounting for post-employment and long-term commitments. On the other hand, eligible assets are quantified at market value and the reference discount rate to determine the value of the obligation continues to be the interest rate of corporate bonds with high credit ratings at the accounting reference date consistent with the duration of the obligations, although the high volatility of the spreads corresponding to said bonds in the last days of the first quarter has been taken into account.
- Useful life of tangible and intangible assets: based on the type of Group assets, there have been no significant changes in the estimates made at the end of 2019 due to COVID-19.
- Goodwill: the current environment of uncertainty caused by COVID-19 has been considered in the evaluation of the recoverability of the cash-generating units (CGUs) that support the Group's goodwill.
As indicated above, the pandemic caused by COVID-19 is having a negative effect on the economic environment, however, there is a high degree of uncertainty as to how it will ultimately impact the main variables used by management to assess the valuation of goodwill, including the long-term business plans of the Group's various CGUs, as well as their ability to generate results and adapt to the new situation, discount rates and terminal growth rates.
However, the Group has reviewed the main variables used at the end of the 2019 fiscal year and has evaluated their sensitivity to the negative effects derived from COVID-19, concluding that they are considered reasonable during the first quarter of 2020.
According with all of the above, and based on the analysis made of the information available on the evolution of the different CGUs that could have indications of impairment, the Group's management have concluded that during the first three months of 2020 there were no reductions in value that required an impairment charge.
It should be noted that given the sensitivity in value in use to changes in the main variables used, any significant future impact that may negatively affect the future benefits, and the values in use, of CGUs could place the Group in a situation of potential goodwill impairment in geographies such as Santander UK, in which the excess of the value in use over the book value is at reduced levels after the impairment of the Goodwill registered by the Group in 2019 for an amount of EUR 1,491 million. The Group's management will update and approve the business plans of all the CGUs during the current year and will evaluate if there are indications of impairment to carry out an impairment test on this CGU or any other.
- Provisions and contingent liabilities: the Group's management, after its analysis, has concluded that there have been no significant changes in the estimates made at the end of the 2019 fiscal year in relation to the probability of the obligations that the Group has to meet at 31 March 2020 due to the situation produced to date by COVID-19.
- Market risk: the events described above related to COVID-19 have had a significant impact on financial markets during the last weeks of the first quarter. In general, stock markets have suffered considerable declines, government bond yields have hit record lows, volatilities have increased, and credit spreads have increased. During the first days after the consideration of COVID-19 as a global pandemic and the announcement of restrictive measures in most of the world economies, there was also a decrease in liquidity, an expansion of bid-offer spreads in some instruments and a certain loss of convergence between the different price contributors.
106
Subsequently, and especially after the measures adopted by most central banks and financial regulators at a global level, market conditions have been normalizing. Although without returning to levels prior to the current crisis, certain assets have recovered part of the accumulated losses, liquidity has recovered and volatility has decreased in most markets and terms from the highs reached in previous weeks. Likewise, at the end of the quarter, there was no significant reduction in observables price from sources used for the valuation of financial instruments, but an increase of the price ranges.
The strong initial price falls have generally led to lower valuations at the end of the quarter in many of the financial assets, especially those linked to credit and equity risk, as a consequence of the increase in the spreads of the counterparties in the market and the elimination of the suggested dividend payment from the authorities. However, the certain normalization of market conditions in recent weeks has meant that no significant worsening of observability conditions has been detected in the inputs used for the valuation of portfolio instruments, nor less access to price contributors. and real market operations. Consequently, considering the composition of the Group's portfolios, the impact on the classification within the fair value hierarchy has been moderate. During the quarter, there have been some reclassifications of asset to Level 3, especially in credit instruments due to the lower observability of spreads, but in general in most markets, underlying and terms, the classifications in force in the previous quarter have been maintained according to our observability and significance criteria. On the other hand, the lower valuations of certain assets and the low levels of risk maintained in this difficult market environment, have caused some decrease in the total amount of Level 3 instruments due to the decreased in the portfolio positions, partially offsetting the aforementioned increase.
The Group's management will continue to rigorously monitored the evolution of the markets, their liquidity and the observability conditions of the valuation inputs in order to apply the criteria established in the Group for the leveling of assets and liabilities measured at fair value. In the event of a further worsening of market conditions and if this were to continue over time, a greater future impact on the current classification of financial instruments within the levels of the fair value hierarchy may be required.
- Deferred tax assets: with respect to the main countries where the Group has recognized deferred tax assets, the Group estimates that their recovery period would not be affected by a significant drop in results in the current year derived from the impact of COVID-19, to the extent that in the medium term the economic environment recovers to the levels prior to this event. In any case, it is important to note that, according to the current legislation of these countries, tax credits for negative tax bases, deductions or other temporary differences do not have an expiration date and, therefore, an increase in the recovery period does not it would necessarily require a write-down of these tax credits.
During the three-month period ended 31 March 2020, there have been no additional significant changes in the estimates made at the end of 2019, other than those indicated in this interim financial information.
d) | Contingent assets and liabilities |
Note 2.o to the Group's consolidated annual accounts for the year ended 31 December 2019 includes information on the contingent assets and liabilities at that date. There were no significant changes in the Group’s contingent assets and liabilities from 31 December 2019 to the date of formal preparation of these interim financial statements.
e) | Comparative information |
The information for the year 2019 contained in these interim financial statements is only presented for comparison purposes with the information relating to the three-month period ended 31 March 2020.
Based on the meeting held on 3 March 2020 by the International Financial Reporting Interpretations Committee (IFRIC), the Group changed its accounting policy in relation to the presentation of exchange differences and the effects of hyperinflation of operations generated in Argentina. In this way, the Group reclassified at 1 January 2019 an amount of EUR -1,984 million (EUR -2,136 million at 31 December 2019) from “Other reserves” to “Other comprehensive income”, relating to the accrued amount of exchange rate differences arising from foreign operations in a hyperinflationary economy and the amount relating to the adjustment of the Argentine companies’ carrying costs reflecting the changes in the purchasing power of the currency due to inflation. This reclassification between different equity items has no impact on the Group's total equity.
In order to interpret the changes in the balances with respect to 31 December 2019, it is necessary to take into consideration the exchange rate effect arising from the volume of foreign currency balances held by the Group in view of its geographic diversity (Note 51.b to the consolidated annual accounts for the year ended 31 December 2019) and the impact of the appreciation/depreciation of the various currencies against the euro in the first three months of 2020: Mexican peso (-18.94%), US dollar (2.54%), Brazilian real (-20.78%), Argentine peso (-4.66%), Pound sterling (-4.02%), Chilean peso (-9.52%) and Polish zloty (-6.46%); as well as the evolution of the average exchange rates between comparable periods: Mexican peso (-0.43%), US dollar (3.02%), Brazilian real (-12.53%), Pound sterling (1.26%), Chilean peso (-14.53%) and Polish zloty (-0.46%).
f) | Seasonality of the Group’s transactions |
The business activities carried on by the Group entities, and their transactions are not cyclical or seasonal in nature. Therefore, no specific disclosures are included in these explanatory notes to the interim financial statements for the three-month period ended 31 March 2020.
g) | Materiality |
In determining the note disclosures to be made on the various items in the interim financial statements or other matters, the Group, in accordance with IAS 34, took into account their materiality in relation to the interim financial statements for the three-month period ended 31 March 2020.
107
h) | Events after the reporting period |
From 1 April 2020 until the date of preparation of the interim financial statements for the three-month period ended 31 March 2020, the following significant events occurred at:
On 2 April 2020, Banco Santander, S.A. announced its decision to withdraw the payment of the additional dividend for 2019 as well as the dividend policy for 2020, and to postpone any decision on dividends against 2020 until there is greater visibility of the effects of the COVID-19 crisis and the results for 2020 are known.
i) | Other information |
United Kingdom Referendum
On 31 January 2020 the United Kingdom ceased to be a member of the European Union . The UK and the European Union agreed withdrawal terms which establish a transition period until 31 December 2020. During the transition period (i) the United Kingdom will be treated as if it were still a member of the European Union for trading purposes, (ii) European Union legislation will continue to apply in the United Kingdom and (iii) negotiations on a trade agreement will be conducted, as well as on the extent of legislative and regulatory convergence and regulatory cooperation. The European Union will also carry out regulatory equivalence assessments for financial services. Such assessments, even if positive, do not guarantee that equivalence will be granted. Although the withdrawal agreement foresees the possibility to extend the transition period for two more years after the 31 January 2020, this is not automatic and the United Kingdom has enshrined the 31 December 2020 date in local legislation passing the withdrawal agreement as the end of the transition period, signalling a current desire not to extend it.
Uncertainty remains around the terms of the United Kingdom´s relationship with the European Union at the end of the transition period. If the transition period were to end without a comprehensive trade agreement, the United Kingdom’s and Europe´s economic growth may be negatively impacted. At the end of the transition period, even if a trade agreement is entered into force and/or if equivalence is granted to certain areas of the United Kingdom’s financial services, contingency measures may still be necessary in certain economic or financial matters to avoid uncertainty and adverse economic effects and there will be some changes in the products and services that Santander United Kingdom can continue to offer into the European Economic Area (EEA) and to EEA residents or EEA incorporated entities. Where possible, Santander UK would look to service such EEA customers from Banco Santander S.A. instead.
While the longer term effects of the United Kingdom’s anticipated withdrawal from the European Union are difficult to predict, there is ongoing political and economic uncertainty, which is likely to continue in the medium term depending on its result, and could have adverse effect on the operations, financial situation and prospects of Santander UK, especially in the Retail and Commercial banking segments. We have identified a number of risks to Santander as a consequence of this uncertainty and the result of the withdrawal process, including the following:
Increased market volatility could have a negative impact on the Group´s cost of or access to funding, especially in an environment in which credit ratings are impacted, it could affect interest and currency exchange rates and the value of assets in our banking book or of securities held by the Group for liquidity purposes.
The Group in the UK is subject to significant regulation and supervision by the European Union. Although legislation has now been passed transferring the European Union regulations into United Kingdom law, there remains significant uncertainty as to the legal and regulatory environment in which the Group´s UK subsidiaries will operate when the transition period ends, and the basis on which cross-border financial business will take place after that date.
Furthermore, at the operational level, the Group's UK subsidiaries and other financial institutions may no longer be able to rely on the European cross-border framework for financial services and it is not clear what the alternative regime will be after Brexit. This uncertainty and the actions taken as a result of it, as well as the new or amended rules, could have significant adverse impacts on the Group's operations, profitability and business.
An adverse effect on the UK economy could have a negative impact on the Group's customers in that country. However, given the current uncertainty, the Group has continued to focus on perfecting the Brexit contingency plans.
The materialisation of one or more of the above risks would have a material adverse effect on the Group's operations, financial situation and prospects.
The Group considered these circumstances in the review of the goodwill assigned to Santander UK, which was impaired in 2019 (see note 8).
2. | Santander Group |
Appendices I, II and III to the consolidated annual accounts for the year ended 31 December 2019 provide relevant information on the Group companies at that date and on the companies accounted for under the equity method.
Also, Note 3 to the aforementioned consolidated annual accounts includes a description of the most significant acquisitions and disposals of companies performed by the Group in 2019, 2018 and 2017.
The most significant transactions taking place during the first quarter of 2020 or pending at 31 March 2020 are as follows:
108
Agreement for the acquisition of 50.1% of Ebury
On 4 November 2019, the Group announced a strategic investment in Ebury, one of the best payment and currency platforms for SMEs, worth approximately GBP 350 million (approximately EUR 400 million). In accordance with the conditions of the operation, Santander (through its subsidiary Santander Digital Businesses, S.L.) will acquire 50.1% of Ebury, of which around GBP 70 million correspond to new shares (approximately EUR 80 million) to support the company's plans to enter in new markets in Latin America and Asia.
As of 31 December 2019, the Group had acquired a 6.4% interest in Ebury for a price of GBP 40 million (approximately EUR 45 million), and on 28 April 2020, the rest of the transaction was completed, once certain conditions to which it was subject had been verified. In this way, the Group (through the aforementioned Santander Digital Businesses, S.L.) already owns approximately 50.1% of Ebury.
Reorganization of the banking insurance business, asset management and pension plans in Spain
On 24 June 2019, Banco Santander, S.A. reached an agreement with the Allianz Group to terminate the agreement that Banco Popular Español, S.A.U. (“Banco Popular”) held in Spain with the Allianz Group for the exclusive distribution of certain life insurance products, non-life insurance products, collective investment institutions, and pension plans through the Banco Popular network (the “Agreement”) whereby the Group held a 40% stake in the capital of Allianz Popular, S.L., classified as investments in joint ventures and associated entities for an overall amount of EUR 409 million on 31 December 2019.
The Agreement was executed on 15 January 2020 for the non-life business and on 31 January 2020 for the remaining businesses, once the regulatory authorisations were obtained in the first quarter of 2020. The execution of the Termination Agreement entailed the payment by Banco Santander of a total consideration of EUR 859 million (after deducting the dividends paid until the end of the operation) and the acquisition of the remaining 60% of the capital of Allianz Popular, S.L.
It is expected that, subject to the fulfilment of certain conditions, 51% of the life-risk insurance business held by Banco Santander and 51% of the new General Insurance line of business from Banco Popular's network not transferred to Mapfre (in accordance with the agreement indicated above) will be acquired by Aegon, amounting to approximately EUR 557 million. These transactions are not expected to have a significant impact on the Group's income statement.
The total amount of the life-savings business, collective investment institutions and pension plans is EUR 711 million and has resulted in the recognition of EUR 271 million of goodwill.
3. Shareholder remuneration system and earnings per share
a) | Shareholder remuneration system |
The cash remuneration paid by the Bank to its shareholders in the first three months of 2020 and 2019 was as follows:
31-03-2020 | 31-03-2019 | |||||||||||
% of par value | Euros per share | Amount (Million euros) | % of par value | Euros per share | Amount (Million euros) | |||||||
Ordinary shares | — | — | — | 13.00% | 0.065 | 1,055 | ||||||
Other shares (without vote, redeemable, etc.) | — | — | — | — | — | — | ||||||
Total remuneration paid | — | — | — | 13.00% | 0.065 | 1,055 | ||||||
Dividend paid out of profit | — | — | — | 13.00% | 0.065 | 1,055 | ||||||
Dividend paid with a charge to reserves or share premium | — | — | — | — | — | — | ||||||
Dividend in kind | — | — | — | — | — | — | ||||||
Flexible payment | — | — | — | — | — | — | ||||||
From 2019, the remuneration policy has been modified from four dividends received in previous years to two, consequently the dividend shown in the table above referring to the first quarter of 2019 corresponds to the dividend declared in the last quarter of 2018 and paid in the first quarter of 2019.
b) | Earnings per share from continuing and discontinued operations |
i. Basic earnings per share
Basic earnings per share for the period are calculated by dividing the net profit attributable to the Group for the three-month period adjusted by the after-tax amount relating to the remuneration of contingently convertible preference shares recognised in equity by the weighted average number of ordinary shares outstanding during the period, excluding the average number of treasury shares held in the period.
109
Accordingly:
31-03-2020 | 31-03-2019 | |||
Profit attributable to the Parent (million euros) | 331 | 1,840 | ||
Remuneration of contingently convertible preference shares (million euros) | (140) | (148) | ||
191 | 1,692 | |||
Of which: | ||||
Profit or Loss from discontinued operations (non controlling interest net) (million euros) | — | — | ||
Profit or Loss from continuing operations (PPC net) (million euros) | 191 | 1,692 | ||
Weighted average number of shares outstanding | 16,604,307,679 | 16,229,286,510 | ||
Basic earnings per share (euros) | 0.01 | 0.10 | ||
Of which: from discontinued operations (euros) | — | — | ||
from continuing operations (euros) | 0.01 | 0.10 | ||
ii. Diluted earnings per share
Diluted earnings per share for the period are calculated by dividing the net profit attributable to the Group for the three-month period adjusted by the after-tax amount relating to the remuneration of contingently convertible preference shares recognised in equity and of perpetual liabilities contingently amortisable in their case by the weighted average number of ordinary shares outstanding during the period, excluding the average number of treasury shares and adjusted for all the dilutive effects inherent to potential ordinary shares (share options and convertible debt instruments).
Accordingly, diluted earnings per share were determined as follows:
31-03-2020 | 31-03-2019 | |||
Profit attributable to the Parent (million euros) | 331 | 1,840 | ||
Remuneration of contingently convertible preference shares (million euros) | (140) | (148) | ||
Dilutive effect of changes in profit for the period arising from potential conversion of ordinary shares | — | — | ||
191 | 1,692 | |||
Of which: | ||||
Profit or Loss from discontinued operations (non controlling interest net) (million euros) | — | — | ||
Profit or Loss from continuing operations (PPC net) (million euros) | 191 | 1,692 | ||
Weighted average number of shares outstanding | 16,604,307,679 | 16,229,286,510 | ||
Dilutive effect of options/ receipt of shares | 37,686,106 | 40,726,682 | ||
Adjusted number of shares | 16,641,993,785 | 16,270,013,192 | ||
Diluted earnings per share (euros) | 0.01 | 0.10 | ||
Of which: from discontinued operations (euros) | — | — | ||
from continuing operations (euros) | 0.01 | 0.10 | ||
4. Remuneration and other benefits paid to the Bank's directors and senior managers
Note 5 to the Group's consolidated financial statements for the year ended 31 December 2019 details the remuneration and other benefits to members of the Bank's Board of Directors and senior management in 2019 and 2018.
Following is a summary of the most significant data on the remunerations and benefits for the three months ended 31 March 2020 and 2019:
110
Remuneration of the members of the board of directors (1) (2)
Thousand euros | ||||
31-03-2020 | 31-03-2019 | |||
Members of the board of directors: | ||||
Remuneration concept | ||||
Fixed salary remuneration of executive directors | 1,339 | 1,724 | ||
Variable salary remuneration of executive directors | — | — | ||
Directors fees | 356 | 247 | ||
Bylaw-stipulated emoluments (annual emolument) | 935 | 939 | ||
Other (except insurance premiums) | 1,073 | 1,214 | ||
Sub-total | 3,703 | 4,124 | ||
Transactions with shares and/or other financial instruments | — | — | ||
3,703 | 4,124 | |||
(1) | The notes to the consolidated anual accounts for 2020 will contain detailed and complete information on the remuneration paid to all the directors, including executive directors. |
(2) | Mr. Rodrigo Echenique ceases to be an executive director on 30 April 2019. The chart shows his fixed salary and other remuneration received in the first quarter of 2019. |
Other benefits of the members of the board of directors (1)
Thousand euros | ||||
31-03-2020 | 31-03-2019 | |||
Members of the board of directors: | ||||
Other benefits- | ||||
Advances | — | — | ||
Loans granted | 107 | 128 | ||
Pension funds and plans: Endowments and/or contributions (1) | 505 | 501 | ||
Pension funds and plans: Accumulated rights (2) | 75,348 | 76,242 | ||
Life insurance premiums | 896 | 1,069 | ||
Guarantees provided for directors | — | — | ||
(1) | These correspond to the endowments and/or contributions made during the first three months of 2020 and 2019 in respect of retirement pensions and complementary benefits for widowhood, orphanhood and permanent disability. |
(2) | Corresponds to the rights accrued by the directors in matters of pensions. It also includes for informational purposes the rights accumulated by Mr. Rodrigo Echenique Gordillo, although these rights corresponded to Mr. Echenique before his appointment as executive director. Additionally, former memebers of the board had at 31 March 2020 and 31 March 2019 rights accrued for this concept for EUR 57,804 thousand and EUR 69,503 thousand, respectively. |
111
Remuneration of senior management (1) (2)
The table below includes the corresponding amounts related to remunerations of senior management at 31 March 2020 and 2019, excluding the executive directors:
Thousand euros | ||||
31-03-2020 | 31-03-2019 | |||
Senior management (1): | ||||
Total remuneration of senior management (2) | 8,981 | 9,728 | ||
(1) | No member of senior management had ceased its duties on 31 March 2020. Remunerations regarding to members of senior management who, during the three month period ended 31 March 2019, had ceased their duties amount to EUR 99 thousand. |
(2) | The number of members of the Bank's senior management, excluding executive directors, is 18 as at 31 March 2019 and at 31 March 2020. |
The variable annual remuneration (or bonuses) received for fiscal year 2019, both for directors and the rest of senior management, were included in the information on remuneration included in the annual report for that year. Similarly, the variable remuneration attributable to the 2020 results, which will be submitted for approval by the Board of Directors at the appropriate time, will be included in the financial statements for the current year.
Funds and pension plans for senior management
Thousand euros | ||
31-03-2020 | 31-03-2019 | |
Senior management: | ||
Pension funds: Endowments and/or contributions (1) | 1,591 | 1,594 |
Pension funds: Accumulated rights (2) | 68,729 | 69,836 |
(1) | Corresponds to the allocations and/or contributions made during the first three months of 2020 and 2019 as retirement pensions. |
(2) | Corresponds to the rights accrued by members of senior management in the area of pensions. In addition, former members of senior management had at 31 march 2020 and 31 March 2019 rights accumulated for this same concept for EUR 167,006 thousand and EUR 168,038 thousand, respectively. |
112
5. Financial assets
a) | Breakdown |
The detail, by nature and category for measurement purposes, of the Group's financial assets, other than the balances relating to Cash, cash balances at central banks and other deposits on demand and Hedging derivatives, at 31 March 2020 and 31 December 2019 is as follows, presented by nature and categories for valuation purposes:
Million euros | ||||||||
31-03-2020 | ||||||||
Financial assets held for trading | Non-trading financial assets mandatorily at fair value through profit or loss | Financial assets designated at fair value through profit or loss | Financial assets at fair value through other comprehensive income | Financial assets at amortised cost | ||||
Derivatives | 87,974 | |||||||
Equity instruments | 8,605 | 3,278 | 2,291 | |||||
Debt instruments | 28,969 | 857 | 2,962 | 99,557 | 26,033 | |||
Loans and advances | 298 | 348 | 59,697 | 8,390 | 955,298 | |||
Central Banks | — | — | 6,264 | — | 10,847 | |||
Credit institutions | — | — | 22,511 | — | 49,002 | |||
Customers | 298 | 348 | 30,922 | 8,390 | 895,449 | |||
Total | 125,846 | 4,483 | 62,659 | 110,238 | 981,331 | |||
Million euros | ||||||||
31-12-2019 | ||||||||
Financial assets held for trading | Non-trading financial assets mandatorily at fair value through profit or loss | Financial assets designated at fair value through profit or loss | Financial assets at fair value through other comprehensive income | Financial assets at amortised cost | ||||
Derivatives | 63,397 | |||||||
Equity instruments | 12,437 | 3,350 | 2,863 | |||||
Debt instruments | 32,041 | 1,175 | 3,186 | 118,405 | 29,789 | |||
Loans and advances | 355 | 386 | 58,883 | 4,440 | 965.693 | |||
Central Banks | — | — | 6,473 | — | 18,474 | |||
Credit institutions | — | — | 21,649 | — | 40,943 | |||
Customers | 355 | 386 | 30,761 | 4,440 | 906,276 | |||
Total | 108,230 | 4,911 | 62,069 | 125,708 | 995,482 | |||
113
Following is the gross exposure of financial assets subject to impairment stages at 31 March 2020 and 31 December 2019:
Million euros | ||||||||||||||||
31-03-2020 | 31-12-2019 | |||||||||||||||
Impairment value correction | Impairment value correction | |||||||||||||||
Stage 1 | Stage 2 | Stage 3 | Total | Stage 1 | Stage 2 | Stage 3 | Total | |||||||||
Financial assets at fair value through other comprehensive income | 107,539 | 416 | 6 | 107,961 | 122,469 | 387 | 6 | 122,862 | ||||||||
Debt instruments | 99,143 | 416 | 6 | 99,565 | 118,023 | 387 | 6 | 118,416 | ||||||||
Loans and advances | 8,396 | — | — | 8,396 | 4,446 | — | — | 4,446 | ||||||||
Central Banks | — | — | — | — | — | — | — | — | ||||||||
Credit institutions | — | — | — | — | — | — | — | — | ||||||||
Customers | 8,396 | — | — | 8,396 | 4,446 | — | — | 4,446 | ||||||||
Financial assets at amortised cost | 921,723 | 50,441 | 31,566 | 1,003,730 | 934,475 | 50,535 | 32,479 | 1,017,489 | ||||||||
Debt instruments | 25,786 | 48 | 535 | 26,369 | 29,552 | 59 | 641 | 30,252 | ||||||||
Loans and advances | 895,937 | 50,393 | 31,031 | 977,361 | 904,923 | 50,476 | 31,838 | 987,237 | ||||||||
Central Banks | 10,847 | — | — | 10,847 | 18,474 | — | — | 18,474 | ||||||||
Credit institutions | 49,016 | — | 1 | 49,017 | 40,956 | — | 1 | 40,957 | ||||||||
Customers | 836,074 | 50,393 | 31,030 | 917,497 | 845,493 | 50,476 | 31,837 | 927,806 | ||||||||
Total | 1,029,262 | 50,857 | 31,572 | 1,111,691 | 1,056,944 | 50,922 | 32,485 | 1,140,351 | ||||||||
On 31 March 2020, the Group has EUR 652 million (EUR 706 million on 31 December 2019) of exposure in impaired assets purchased with impairment, which mainly correspond to the business combinations carried out by the Group.
b) | Impairment allowances of financial assets at amortised cost portfolio |
The following is the movement that has taken place, during the three-month periods ended 31 March 2020 and 2019, in the balance of provisions that cover losses due to impairment of assets which comprise the heading balance of the financial assets at amortised cost:
Million euros | ||||
31-03-2020 | 31-03-2019 | |||
Balance as at beginning of period | 22,713 | 23,945 | ||
Impairment losses charged to income for the period | 4,234 | 2,587 | ||
Of which: | ||||
Impairment losses charged to income | 6,873 | 5,204 | ||
Impairment losses reversed with a credit to income | (2,639 | ) | (2,617 | ) |
Write-off of impaired balances against recorded impairment allowance | (2,635 | ) | (2,728 | ) |
Exchange differences and other | (1,262 | ) | 289 | |
Balance as at end of period | 23,050 | 24,093 | ||
Of which, relating to: | ||||
Impaired assets | 13,551 | 15,508 | ||
Other assets | 9,499 | 8,585 | ||
Of which: | ||||
Individually calculated | 3,377 | 5,414 | ||
Collectively calculated | 19,673 | 18,679 | ||
114
Following is the movement of the impairment allowance broken down by impairment stage of loans and advances to customers recognised under "Financial assets at amortised cost" as at 31 March 2020:
Million euros | ||||||||
Stage 1 | Stage 2 | Stage 3 | Total | |||||
Impairment allowance as at beginning of period | 3,835 | 4,474 | 13,933 | 22,242 | ||||
Transfers between stages | (254 | ) | 27 | 1,488 | 1,261 | |||
Net changes of the exposure and modifications in the credit risk | 1,851 | (108 | ) | 1,250 | 2,993 | |||
Write-offs | — | — | (2,635 | ) | (2,635 | ) | ||
Exchange differences and other | (166 | ) | (188 | ) | (807 | ) | (1,161 | ) |
Carrying amount as of 31 March 2020 | 5,266 | 4,205 | 13,229 | 22,700 | ||||
Previously written-off assets recovered during the first three months of 2020 and 2019 amount to EUR 301 million and to EUR 344 million, respectively. Considering these amounts, the recorded impairment of financial assets at amortised cost is EUR 3,933 million and EUR 2,243 million, respectively.
c) | Impaired assets of financial assets at amortised cost portfolio |
The movement produced, during the three-month periods ended 31 March 2020 and 2019, in the balance of financial assets classified at amortised cost and considered doubtful by reason for the credit risk is as follows:
Million euros | ||
31-03-2020 | 31-03-2019 | |
Balance as at beginning of period | 33,184 | 35,091 |
Net additions | 2,722 | 2,131 |
Written-off assets | (2,635) | (2,728) |
Exchange differences and other | (1,054) | 483 |
Balance as at end of period | 32,217 | 34,977 |
This amount, after deducting the related allowances, represents the Group's best estimate of the discounted value of the flows that are expected to be recovered from the impaired assets.
d) | Fair value of financial assets not measured at fair value |
Following is a comparison of the carrying amounts of the Group’s financial assets measured at other than fair value and their respective fair values at 31 March 2020 and 31 December 2019:
Million euros | Million euros | ||||
31-03-2020 | 31-12-2019 | ||||
Carrying amount | Fair value | Carrying amount | Fair value | ||
Loans and advances | 955,298 | 964,710 | Loans and advances | 965,693 | 975,523 |
Debt instruments | 26,033 | 26,263 | Debt instruments | 29,789 | 30,031 |
ASSETS | 981,331 | 990,973 | ASSETS | 995,482 | 1,005,554 |
The main valuation methods and inputs used in the estimation of the fair value of the financial assets of the previous table are detailed in Note 51.c of the consolidated annual accounts for the year 2019.
115
6. Non-current assets held for sale
The detail, by nature, of the Group’s non-current assets held for sale at 31 March 2020 and 31 December 2019 is as follows presented by nature:
Million euros | ||
31-03-2020 | 31-12-2019 | |
Tangible assets | 4,620 | 4,588 |
Of which: | ||
Foreclosed assets | 4,524 | 4,485 |
Of which: Property assets in Spain | 3,750 | 3,667 |
Other tangible assets held for sale | 96 | 103 |
Other assets | 294 | 13 |
4,914 | 4,601 | |
On 31 March 2020, the allowance that covers the value of the property assets represents the 49% (49% on December 31, 2019). The charges recorded in the first three months of 2020 and 2019 amounted to EUR 39 million and EUR 74 million, and the recoveries undergone during those periods amount to EUR 4 million and EUR 19 million, respectively.
7. Tangible assets
a) | Changes in the period |
In the first three months of 2020 and 2019, tangible assets (does not include usage rights) were acquired for EUR 1,707 million and EUR 2,231 million, respectively.
Also, in the first three months of 2020 and 2019 tangible asset items were disposed of with a carrying amount of EUR 433 million and EUR 1,059 million respectively, giving rise to a net gain of EUR 18 million and EUR 12 million, respectively.
b) | Property, plant and equipment purchase commitments |
On 31 March 2020 and 31 December 2019, the Group did not have any significant commitments to purchase property, plant and equipment items.
c) | Operating leasing rights |
As of 31 March 2020, the Group has tangible assets under lease for the amount of EUR 4,688 million (EUR 5,051 million at 31 December 2019).
116
8. Intangible assets
a) | Goodwill |
The detail of Intangible Assets - Goodwill at 31 March 2020 and 31 December 2019, based on the cash-generating units giving rise thereto, is as follows:
Million euros | ||
31-03-2020 | 31-12-2019 | |
Santander UK | 6,860 | 7,147 |
Banco Santander (Brasil) | 3,476 | 4,388 |
Santander Bank Polska | 2,270 | 2,427 |
Santander Consumer USA | 2,197 | 2,143 |
Santander Bank, National Association | 1,874 | 1,828 |
SAM (*) | 1,444 | 1,173 |
Santander Consumer Germany | 1,236 | 1,236 |
Santander Portugal | 1,040 | 1,040 |
Santander España (**) | 1,026 | 1,027 |
Banco Santander - Chile | 533 | 589 |
Santander Consumer Nordics | 463 | 496 |
Grupo Financiero Santander (Mexico) | 416 | 460 |
Other entities | 306 | 292 |
Total Goodwill | 23,141 | 24,246 |
(*) | The increase in 2020 arises from the repurchase of the pension plan and collective investment institution business from Banco Popular Español, S.A. to the Allianz Group (Note 2). |
(**) | Includes mainly goodwill arising from the purchases of Banco Popular Group’s network and WiZink´s card business. |
In the first three months of 2020, goodwill decreased by EUR 1,105 million, of which due to exchange differences EUR 1,442 (Note 11), which pursuant to current regulations, were recognised with a debit to Other accumulated results - items that may be reclassified to profit or loss - Exchange differences in equity through the condensed consolidated statement of recognised income and expense.
Note 17 to the consolidated annual accounts for the year ended 31 December 2019 includes detailed information on the procedures followed by the Group to analyse the potential impairment of the goodwill recognised with respect to its recoverable amount and to recognise the related impairment losses, where appropriate.
Accordingly, based on the analysis performed of the available information on the performance of the various cash-generating units which might evidence the existence of indicators of impairment, the Group's directors concluded that in the first three months of 2020 there were no impairment losses which required recognition (Note 1.c).
117
9. Financial liabilities
a) | Breakdown |
The following is a breakdown of the Group's financial liabilities, other than the balances corresponding to the Derivatives - hedge accounting heading, as of 31 March 2020 and 31 December 2019, presented by nature and categories for valuation purposes:
Million euros | ||||||||||||
31-03-2020 | 31-12-2019 | |||||||||||
Financial liabilities held for trading | Financial liabilities designated at fair value through profit or loss | Financial liabilities at amortised cost | Financial liabilities held for trading | Financial liabilities designated at fair value through profit or loss | Financial liabilities at amortised cost | |||||||
Derivatives | 88,121 | 63,016 | ||||||||||
Short Positions | 11,961 | 14,123 | ||||||||||
Deposits | — | 63,050 | 941,096 | — | 57,111 | 942,417 | ||||||
Central banks | — | 11,447 | 72,738 | — | 12,854 | 62,468 | ||||||
Credit institutions | — | 6,965 | 97,537 | — | 9,340 | 90,501 | ||||||
Customer | — | 44,638 | 770,821 | — | 34,917 | 789,448 | ||||||
Debt instruments | — | 4,287 | 257,606 | — | 3,758 | 258,219 | ||||||
Other financial liabilities | — | — | 26,047 | — | 126 | 30,109 | ||||||
Total | 100,082 | 67,337 | 1,224,749 | 77,139 | 60,995 | 1,230,745 | ||||||
b) | Information on issues, repurchases or redemptions of debt instruments issued |
The detail of the balance of debt securities issued according to their nature is:
Million euros | ||
31-03-2020 | 31-12-2019 | |
Bonds and debentures outstanding | 207,944 | 208.455 |
Subordinated | 20,365 | 20.878 |
Promissory notes and other securities | 33,584 | 32.644 |
Total debt instruments issued | 261,893 | 261.977 |
The detail, at 31 March 2020 and 2019, of the outstanding balance of the debt instruments, excluding promissory notes, which at these dates had been issued by the Bank or any other Group entity is disclosed below. Also included is the detail of the changes in this balance in the first three months of 2020 and 2019:
Million euros | ||||||||||||
31-03-2020 | ||||||||||||
Opening balance at 01-01-2020 | Perimeter | Issues | Repurchases or redemptions | Exchange rate and other adjustments | Closing balance at 31-03-2020 | |||||||
Bonds and debentures outstanding | 208,455 | — | 24,486 | (21,740 | ) | (3,257 | ) | 207,944 | ||||
Subordinated | 20,878 | — | 1,500 | (1,500 | ) | (513 | ) | 20,365 | ||||
Bonds and debentures outstanding and subordinated liabilities issued | 229,333 | — | 25,986 | (23,240 | ) | (3,770 | ) | 228,309 | ||||
Million euros | |||||||
31-03-2019 | |||||||
Opening balance at 01-01-2019 | Perimeter | Issues | Repurchases or redemptions | Exchange rate and other adjustments | Closing balance at 31-03-2019 | ||
Bonds and debentures outstanding | 195,498 | — | 11,830 | (12,644) | 2,667 | 197,351 | |
Subordinated | 23,676 | — | 1,056 | (2,124) | 195 | 22,803 | |
Bonds and debentures outstanding and subordinated liabilities issued | 219,174 | 0 | 12,886 | (14,768) | 2,862 | 220,154 | |
On 12 March 2020, Banco Santander redeemed in advance and on a voluntary basis the total amount of Contingent Convertible Tier 1 Preferred Securities Series I/2014 for a total nominal amount of EUR 1,500 million.
118
In January 2020, Banco Santander issued a number of preferred shares, contingently convertible into newly issued ordinary shares of the Bank (the “CCPP”), excluding the pre-emptive subscription right of its shareholders and for a nominal amount of EUR 1,500 million (the “Issue” and the “CCPP”).
The Issue was at par and the remuneration of the CCPS, whose payment is subject to certain conditions and is also discretionary, was fixed at 4.375% per annum for the firs six years, thereafter being reviewed every five years by applying a margin of 453.4 basis points on the 5-year Mid-Swap Rate.
On 8 February 2019, Banco Santander, S.A. issued USD 1,200 million (EUR 1,056 million) of CCPP. The remuneration of the issuance, whose payment is based on certain conditions and is also discretionary was set at 7.50%per annum, payable on a quearterly basis for the first seven years (thereafter being reviewed by applying a margin of 498.9 basis point on the Mid-Swap Rate).
c) | Other issues guaranteed by the Group |
At 31 March 2020 and 2019, there were no debt instruments issued by associates or non-Group third parties that had been guaranteed by the Bank or any other Group entity.
d) | Fair value of financial liabilities not measured at fair value |
Following is a comparison between the value by which the Group's financial liabilities are recorded that are measured using criteria other than fair value and their corresponding fair value at 31 March 2020 and 31 December 2019:
Million euros | ||||
31-03-2020 | 31-12-2019 | |||
Carrying amount | Fair value | Carrying amount | Fair value | |
Deposits | 941,096 | 941,181 | 942,417 | 942,397 |
Debt instruments | 257,606 | 256,795 | 258,219 | 266,784 |
Liabilities | 1,198,702 | 1,197,976 | 1,200,636 | 1,209,181 |
The main valuation methods and inputs used in the estimation of the fair value of the financial liabilities in the previous table are detailed in Note 51.c of the consolidated annual accounts for 2019, other than those mentioned in these interim financial statements.
10. Provisions
a) | Provisions for Pensions and other post-retirements obligations and Other long term employee benefits |
The variation experienced by the balance of the Pensions and other post-retirements obligations and other long term employee benefits from 31 December 2019 to 31 March 2020, is mainly due to higher actuarial gains as a result of changes in actuarial assumptions (Note 11.c).
b) | Provisions for Taxes and other legal contingencies and Other provisions |
Set forth below is the detail, by type of provision, of the balances at 31 March 2020 and at 31 December 2019 of Provisions for taxes and other legal contingencies and Other provisions. The types of provision were determined by grouping together items of a similar nature:
Million euros | ||
31-03-2020 | 31-12-2019 | |
Provisions for taxes | 615 | 759 |
Provisions for employment-related proceedings (Brazil) | 623 | 776 |
Provisions for other legal proceedings | 1,281 | 1,522 |
Provision for customer remediation | 680 | 725 |
Regulatory framework-related provisions | 40 | 67 |
Provision for restructuring | 582 | 641 |
Other | 1,066 | 1,018 |
4,887 | 5,508 | |
Relevant information is set forth below in relation to each type of provision shown in the preceding table:
The provisions for taxes include provisions for tax-related proceedings.
119
The provisions for employment-related proceedings (Brazil) relate to claims filed by trade unions, associations, the prosecutor's office and ex-employees claiming employment rights to which, in their view, they are entitled, particularly the payment of overtime and other employment rights, including litigation concerning retirement benefits. The number and nature of these proceedings, which are common for banks in Brazil, justify the classification of these provisions in a separate category or as a separate type from the rest. The Group calculates the provisions associated with these claims in accordance with past experience of payments made in relation to claims for similar items. When claims do not fall within these categories, a case-by-case assessment is performed and the amount of the provision is calculated in accordance with the status of each proceeding and the risk assessment carried out by the legal advisers.
The provisions for other legal proceedings include provisions for court, arbitration or administrative proceedings (other than those included in other categories or types of provisions disclosed separately) brought against Santander Group companies.
The provisions for customer remediation include the estimated cost of payments to remedy errors relating to the sale of certain products in the UK and the estimated cost of the Banco Popular floor clauses. To calculate the provision for customer remediation, the best estimate of the provision made by management is used, which is based on the estimated number of claims to be received and, of these, the number that will be accepted, as well as the estimated average payment per case.
The regulatory framework-related provisions include mainly the provisions for the extraordinary contribution to FSCS (Financial Services Compensation Scheme) and the Bank Levy in the UK, and those relating to Banking Tax in Poland.
The provisions for restructuring include only the direct costs arising from restructuring processes carried out by the various Group companies.
Qualitative information on the main litigation is provided in Note 10.c.
Our general policy is to record provisions for tax and legal proceedings in which we assess the chances of loss to be probable and we do not record provisions when the chances of loss are possible or remote. We determine the amounts to be provided for as our best estimate of the expenditure required to settle the corresponding claim based, among other factors, on a case-by-case analysis of the facts and the legal opinion of internal and external counsel or by considering the historical average amount of the loss incurred in claims of the same nature. The definitive date of the outflow of resources embodying economic benefits for the Group depends on each obligation. In certain cases, the obligations do not have a fixed settlement term and, in others, they depend on legal proceedings in progress.
The changes in provisions arising from civil contingencies and legal nature are disclosed in this note.
The main changes in provisions in the first quarter of 2020 are as follows:
Regarding the provisions for labor processes and others of a legal nature, Brazil has charged EUR 58 million and EUR 39 million, respectively, using provisions of EUR 52 million and EUR 34 million, respectively, and the rest of the deviation is due to currency depreciation.
Regarding the provisions arising for customer remediation, EUR 12 million provisions in United Kingdom and EUR 3 million provisions in Puerto Rico. On the other hand, EUR 26 million has been used in the United Kingdom.
Regarding in provisions constituted by regulatory framework, EUR 27 million in the first three-month period in United Kingdom has been used (Bank Levy and FSCS). In addition, EUR 32 million have been charged and paid in the first three-month period in Poland.
In addition, in the provisions for restructuring, the United Kingdom has set aside EUR 31 million and EUR 4 million in Poland and EUR 3 million in Consumer Group. This increase is partially offset in the United Kingdom by the use of EUR 29 million.
c) Litigation and other matters
i. Tax-related litigation
At 31 March 2020 the main tax-related proceedings concerning the Group were as follows:
- Legal actions filed by Banco Santander (Brasil) S.A. and other Group entities to avoid the application of Law 9.718/98, which modifies the basis to calculate PIS and COFINS social contribution, extending it to all the entities income, and not only to the income from the provision of services. In relation of Banco Santander (Brasil) S.A. process, in May 2015 the Federal Supreme Court (FSC) admitted the extraordinary appeal filed by the Federal Union regarding PIS, and dismissed the extraordinary appeal lodged by the Brazilian Public Prosecutor's Office regarding COFINS contribution, confirming the decision of Federal Regional Court favourable to Banco Santander (Brasil) S.A. of August 2017. The appeals filed by the other entities before de Federal Supreme Court, both for PIS and CONFINS, are still pending. These claims are fully provisioned.
- Banco Santander (Brasil) S.A. and other Group companies in Brazil have appealed against the assessments issued by the Brazilian tax authorities questioning the deduction of loan losses in their income tax returns (IRPJ and CSLL) in relation to different administrative processes of various years on the ground that the requirements under the applicable legislation were not met. The appeals are pending decision in CARF. No provision was recognised in connection with the amount considered to be a contingent liability.
- Banco Santander (Brasil) S.A. and other Group companies in Brazil are involved in administrative and legal proceedings against several municipalities that demand payment of the Service Tax on certain items of income from transactions not classified as provisions of services. There are several cases in different judicial instances. A provision was recognised in connection with the amount of the estimated loss.
120
- Banco Santander (Brasil) S.A. and other Group companies in Brazil are involved in administrative and legal proceedings against the tax authorities in connection with the taxation for social security purposes of certain items which are not considered to be employee remuneration. There are several cases in different judicial instances. A provision was recognised in connection with the amount of the estimated loss.
- In May 2003 the Brazilian tax authorities issued separate infringement notices against Santander Distribuidora de Títulos e Valores Mobiliarios Ltda. (DTVM, currently Santander Brasil Tecnologia S.A.) and Banco Santander (Brasil) S.A. in relation to the Provisional Tax on Financial Movements (CPMF) of the years 2000, 2001 and part of 2002. In July 2015, after the unfavourable decision of CARF, both entities appealed at Federal Justice in a single proceeding. In June 2019 this action has been dismissed, and the resolution has been appealed to the higher cort. There is a provision recognised for the estimated loss.
- In December 2010 the Brazilian tax authorities issued an infringement notice against Santander Seguros S.A. (Brazil), currently Zurich Santander Brasil Seguros e Previdência S.A., as the successor by merger to ABN AMRO Brasil dois Participações S.A., in relation to income tax (IRPJ and CSLL) for 2005, questioning the tax treatment applied to a sale of shares of Real Seguros, S.A. Actually it is appealed before the CARF. As the former parent of Santander Seguros S.A. (Brasil), Banco Santander (Brasil) S.A. is liable in the event of any adverse outcome of this proceeding. No provision was recognised in connection with this proceeding as it is considered to be a contingent liability.
- In November 2014 the Brazilian tax authorities issued an infringement notice against Banco Santander (Brasil) S.A. in relation to corporate income tax (IRPJ and CSLL) for 2009 questioning the tax-deductibility of the amortisation of the goodwill of Banco ABN AMRO Real S.A. performed prior to the absorption of this bank by Banco Santander (Brasil) S.A., but accepting the amortisation performed after the merger. Actually it is appealed before the Higher Chamber of CARF. No provision was recognised in connection with this proceeding as it was considered to be a contingent liability.
- Banco Santander (Brasil) S.A. has also appealed against infringement notices issued by the tax authorities questioning the tax deductibility of the amortisation of the goodwill arising on the acquisition of Banco Comercial e de Investimento Sudameris S.A from years 2007 to 2012. No provision was recognised in connection with this matter as it was considered to be a contingent liability.
- Banco Santander (Brazil) S.A. and other companies of the Group in Brazil are undergoing administrative and judicial procedures against Brazilian tax authorities for not admitting tax compensation with credits derived from other tax concepts, not having registered a provision for such amount since it is considered to be a contingent liability.
- Banco Santander (Brasil) S.A. is involved in appeals in relation to infringement notices initiated by tax authorities regarding the offsetting of tax losses in the CSLL (‘Social Contribution on Net Income’) of year 2009. The appeal is pending decision in CARF. No provision was recognised in connection with this matter as it is considered to be a contigent liability.
The total amount for the aforementioned Brazil lawsuits related to tax legal obligations or with probable loss risk is approximately EUR 911 million, fully provisioned, and the total amount for tax litigation with possible loss risk is approximately EUR 3,113 million.
- Legal action brought by Sovereign Bancorp, Inc. (currently Santander Holdings USA, Inc.) claiming its right to take a foreign tax credit for taxes paid outside the United States in fiscal years 2003 to 2005 as well as the related issuance and financing costs. On 17 July 2018, the District Court finally ruled against Santander Holdings USA, Inc. On September 5, 2019 the Federal Districk Court in Massachussests entered a stipulated judgement resolving the Company’s tax liability for fiscal years 2003to 2005, which had no effect on income. The Company has agreed to resolve the treatment of the same transactions for 2006 and 2007, subject to review by the Concgressional Joint Committee on Taxation and final IRS approval, with no effect on income.
- Banco Santander has appealed before European Courts the Decisions 2011/5/CE of 28 October 2009, and 2011/282/UE of 12 January 2011 of the European Commission, ruling that the deduction regulated pursuant to Article 12.5 of the Corporate Income Tax Law constituted illegal State aid. On November 2018 the General Court confirmed these Decisions but these judgements have been appealed at the Court of justice of the European Union. The dismissal of this appeal would not have effect on equity.
At the date of approval of these interim financial statements certain other less significant tax-related proceedings were also in progress.
ii. Non-tax-related proceedings
At 31 March 2020, the main non-tax-related proceedings concerning the Group were as follows:
- Payment Protection Insurance (PPI): claims associated with the sale by Santander UK plc of payment protection insurance or PPI to its customers. As of 31 March 2020, the remaining provision for PPI redress and related costs amounted to GBP 167 million (EUR 188 million) (2019: GBP 189 million (EUR 222 million)). There was no additional provision in the first quarter of 2020.
Given the passing of the Financial Conduct Authority’s deadline of 29 August 2019 for PPI complaints, the level of judgment required by management in determining appropriate assumptions has reduced. At 31 March 2020, the key assumptions in calculating the provision were around the estimated PPI penetration of August complaints.
The uphold rates are informed by historical experience and the average cost of redress can be predicted reasonably accurately given that management is dealing with a high volume and reasonably homogenous population.
Cumulative complaints from the inception of the PPI complaints process to 31 March 2020, regardless of the likelihood of Santander UK incurring a liability, were 4.4m. This includes c.313,000 that were still being reviewed. Future expected complaints were c.8,000. In addition, there are legal claims being made by Claims Management Companies challenging the FCA's industry guidance on the treatment of Plevin/recurring non-disclosure assessments.
121
The provision for conduct remediation recognised represents management’s best estimate of Santander UK’s liability in respect of mis-selling of PPI policies.
- Delforca: dispute arising from equity swaps entered into by Gaesco (now Delforca 2008, S.A.) on shares of Inmobiliaria Colonial, S.A. Banco Santander, S.A. is claiming to Delforca a total of EUR 66 million from the liquidation of the swaps. Mobiliaria Monesa, S.A. (Delforca’s parent company) has commenced a civil proceeding against the Bank claiming damages which, as of date have not been determined. The proceeding has been stayed because the jurisdiction of the Court has been challenged. Within insolvency proceedings before the Commercial Court, both Delforca and Mobiliaria Monesa have instigated a claim against the Bank seeking the recovery of EUR 56.8 million that the Bank received from the liquidation of the swap. The Bank has filed a claim against Delforca seeking the Bank's recognition of its right to receive the credit. At 31 March 2020, the risk is considered remote. The Bank has not recognised any provisions in this connection.
- Former employees of Banco do Estado de São Paulo S.A., Santander Banespa, Cia. de Arrendamiento Mercantil: a claim was filed in 1998 by the association of retired Banespa employees (AFABESP) requesting the payment of a half-yearly bonus contemplated in the by-laws of Banespa in the event that Banespa obtained a profit and that the distribution of this profit were approved by the Board of Directors. The bonus was not paid in 1994 and 1995 since Banespa had not made a profit during those years. Partial payments were made from 1996 to 2000, as approved by the Board of Directors. The relevant clause was eliminated in 2001. The Regional Labor Court and the High Employment Court ordered Santander Brasil, as successor to Banespa, to pay this half-yearly bonus for the period from 1996 to the present. On 20 March 2019, a decision from the Federal Court of Justice (Supremo Tribunal Federal, or “STF”) rejected the extraordinary appeal filed by Santander Brasil. A rescission action was brought to revert the decision in the main proceedings and suspend procedural enforcement. The external legal advisor of the Bank has classified the risk of loss as probable. The current court decision does not define a specific amount to be paid by the defendants (this would only be determined once a final decision is issued and the enforcement process has begun).
- “Planos Económicos”: like the rest of the banking system in Brasil, Santander Brasil has been the target of customer complaints and collective civil suits stemming from legislative changes and its application to bank deposits, fundamentally ('economic plans'). At the end of 2017, there was an agreement between regulatory entities and the Brazilian Federation of Banks (Febraban), already approved by the Supremo Tribunal Federal, with the purpose of closing the lawsuits. Discussions focused on specifying the amount to be paid to each affected client according to the balance in their notebook at the time of the Plan. Finally, the total value of the payments will depend on the number of endorsements they have made and the number of savers who have demonstrated the existence of the account and its balance on the date the indexes were changed. In November 2018, the STF ordered the suspension of all economic plan processes for two years from May 2018.The provisions recorded for the economic plan processes are considered to be sufficient.
- Floor clauses (“cláusulas suelo”): in consequence of the acquisition of Banco Popular Español, S.A.U, the Group has been exposed to a material number of transactions with floor clauses. The so-called "floor clauses" or minimum clauses are those under which the borrower accepts a minimum interest rate to be paid to the lender, regardless of the applicable reference interest rate. Banco Popular Español, S.A.U. included "floor clauses" in certain asset transactions with customers. In relation to this type of clauses, and after several rulings made by the Court of Justice of the European Union and the Spanish Supreme Court, and the extrajudicial process established by the Spanish Royal Decree-Law 1/2017, of 2 January, Banco Popular Español, S.A.U. made extraordinary provisions that were updated in order to cover the effect of the potential return of the excess interest charged for the application of the floor clauses between the contract date of the corresponding mortgage loans and May 2013. The Group considered that the maximum risk associated with the floor clauses applied in its contracts with consumers, in the most severe and not probable scenario, would amount to approximately EUR 900 million, as initially measured and without considering the returns performed. For this matter, after the purchase of Banco Popular Español, S.A.U., EUR 402 million provisions have been used by the Group (EUR 238 million in 2017, EUR 119 million in 2018 and EUR 45 million in 2019) mainly for refunds as a result of the extrajudicial process mentioned above. As of 31 March 2020, the amount of the Group's provisions in relation to this matter amounts to EUR 80 million (31 December 2019: EUR 80 million).
- Banco Popular´s acquisition: considering the declaration setting out the resolution of Banco Popular Español, S.A.U., the redemption and conversion of its capital instruments and the subsequent transfer to Banco Santander, S.A. of the shares resulting from this conversion in exercise of the resolution instrument involving the sale of the institution's business, in the application accordance with the single resolution framework regulation referred to in Note 3 of the 2018 consolidated annual accounts, some investors have filed claims against the EU’s Single Resolution Board decision, the FROB's resolution executed in accordance to the aforementioned decision, and claims have been filed and may be filed in the future against Banco Santander, S.A. or other Santander Group companies deriving from or related to the acquisition of Banco Popular Español, S.A.U.
At this stage, it is not possible to foresee the total number of claims that could be filed by the former holders of shares and capital instruments (arising from the acquisition by investors of such shares and capital instruments of Banco Popular prior to resolution, including in particular, without limitation, the shares acquired in the context of the capital increase with pre-emptive subscription rights carried out in 2016), and their economic implications (especially considering that the decision to resolve in application of the new regulation has no precedent, and that it may be possible that future claims do not specify a specific amount, put forward new legal interpretations or involve a large number of parties).
The estimated cost of any compensation to shareholders and bondholders of Banco Popular recognised in 2017 amounted to EUR 680 million, of which EUR 535 million were applied to the commercial loyalty program. The provisions recorded are considered sufficient to cover the risks associated with the court claims currently being dealt with. However, if additional amounts have to be paid for claims already raised with an undetermined economic interest or for new claims, this could have a significant adverse effect on the Santander Group's results and financial situation.
122
Likewise, the Central Court of Instruction 4 is currently conducting preliminary proceedings 42/2017, in which, amongst other things, is being investigated the following: (i) the accuracy of the prospectus for the capital increase with pre-emptive subscription rights carried out by Banco Popular in 2016; And (ii) the alleged manipulation of the share price of Banco Popular until the resolution of the bank, in June 2017. During the course of these proceedings, on 15 January 2019, the Spanish National Court, applying article 130.2 of the Spanish Criminal Code, declared the Bank the sucessor entity to Banco Popular Español, S.A.U. (following the merger of the Bank and Banco Popular Español, S.A.U. on September 2018), and, as a result, determined that the Bank assumed the role of the party being investigated in the criminal proceeding. The decision was appealed and on 30 April 2019, the Spanish National Court ruled in favor of Banco Santander, S.A. declaring that Banco Santander, S.A. cannot inherit Banco Popular’s potential criminal liability. This ruling was appealed before the Supreme Court who have rejected the appeal. In this procedure, Banco Santander has the status of possible subsidiary civil liability.
- German shares investigation: the Cologne Public Prosecution Office is conducting an investigation against the Bank, and other group entities based in UK - Santander UK plc, Abbey National Treasury Services plc and Cater Allen International Limited -, in relation to a particular type of tax dividend linked transactions known as cum-ex transactions. The Group is cooperating with the German authorities. According to the state of the investigations, the results and the effects for the Group, which may potentially include the imposition of financial penalties, cannot be anticipated. The Bank has not recognised any provisions in relation to the potential imposition of financial penalties.
- Attorneys General Investigation of auto loan securitisation transactions and fair lending practices: in October 2014, May 2015, July 2015 and February 2017, Santander Consumer USA Inc. (SC) received subpoenas and/or Civil Investigative Demands (CIDs) from the Attorneys General of the U.S. states of California, Illinois, Oregon, New Jersey, Maryland and Washington under the authority of each state's consumer protection statutes. These states serve on behalf of a group of 33 state Attorneys General. The subpoenas and CIDs contained broad requests for information and the production of documents related to SC’s underwriting, securitization, the recovery efforts servicing and collection of nonprime vehicle loans. SC responded to these requests within the deadlines specified and has otherwise cooperated with the Attorneys General with respect to this matter. The provisions recorded for this investigation are considered sufficient.
- Financial Industry Regulatory Authority (“FINRA”) Puerto Rico Arbitrations: as of 31 March 2020, Santander Securities LLC (SSLLC) had received 760 FINRA arbitration cases related to Puerto Rico Bonds issued by public and public related entities, as well as Puerto Rico closed-end funds (CEFs). The statements of claims allege, among other things, fraud, negligence, breach of fiduciary duty, breach of contract, unsuitability, over-concentration of the investments and failure to supervise. There were 339 arbitration cases that remained pending as of 31 March 2020.
As a result of various legal, economic and market factors impacting or that could impact of the value Puerto Rico bonds and CEFs, it is possible that additional arbitration claims and/or increased claim amounts may be asserted against SSLLC in future periods. The provisions recorded for these matters are considered sufficient.
- IRPH Index: a portion of our Spanish mortgage loan portfolio bears interest at a rate indexed to the “Índice de Referencia de Préstamos Hipotecarios” known as “IRPH” which, at the time the contracts were entered into, served as reference rate for many mortgage loan agreements in Spain and was published by the Bank of Spain. Consumers in Spain have brought lawsuits against most of the Spanish banking sector alleging that the use and related disclosures of such rate did not comply with the transparency requirements of European regulation. On 14 December 2017, the Supreme Court of Spain ruled that these clauses were valid, as the IRPH is an official rate and therefore non-subject to transparency requirements. The matter was referred to the Court of Justice of the European Union through a preliminary ruling procedure. On 3 March 2020 the CJUE rendered its decision.
The CJUE ruled that, being the IRPH a valid index, national courts are entitled to examine its use on each particular contract in order to verify whether the transparency requirements have been met. When carrying out the transparency control, national courts have to take into account all the circumstances surrounding the conclusion of the particular contract, including whether essential information relating to the calculation of that rate was easily accessible and the provision of data relating to past fluctuations of the index. Finally, with regard to the effects of nullity of an IRPH index clause, the CJUE entitles national courts to substitute it with another statutory index, thus not declaring the nullity of the whole contact.
The uncertainty regarding the effects of the CJUE judgment remain as it will be still for national courts to decide on a case by case basis whether the clause is abusive and the particular effects of such declaration. Therefore, it is not possible still to estimate the potential exposure. Currently, the balance of the relevant mortgage loans held by us equals approximately EUR 3.4 billion.
- Banco Santander, S.A. has been sued in a legal proceeding in which the plaintiff alleges that a contract was concluded whereby he would be entrusted with the functions of CEO of the Bank. In the complaint, the claimant mainly requests a declaratory ruling that affirms the validity and conclusion of such contract and its enforcement together with the payment of certain amounts. If the main request is not granted, the claimant seeks compensation for a total amount of approximately EUR 112 million or, an alternative relief for other minor amounts. Banco Santander, S.A. has answered to the complaint. In this answer, it is stated that the conditions to which the appointment was subject to were not met and that the contract required by law was not concluded. The proceeding is ongoing.
- CHF Polish Mortgage Loans: On 3 October 2019, the Court of Justice of the European Union (CJEU) rendered its decision in relation to a lawsuit against an unrelated bank in Poland, with regards to unfair contractual clauses in consumer agreements, specifically the consequences of potentially unfair contractual clauses in CHF-indexed loan agreements. The CJEU has left to Polish courts the decision on whether the whole contract can be maintained once the abusive terms have been removed, which should in turn decide whether the effects of the annulment of the contract are prejudicial to the consumer. In that case, the court may only integrate the contract with default provisions of national law and decide, in accordance with those provisions, on the applicable rate.
123
As at 31 March 2020, the Group has a portfolio of mortgage loans denominated in, or indexed to, CHF of approximately PLN 10,598 million (EUR 2,355 million).
In 2019 the Group (Santander Bank Polska and Santander Consumer Bank) in Poland created PLN 173 million (EUR 40.9 million) provision for CHF. This provision represents the best estimate to date given the difficulty to predict the financial impact, as, it is for national courts to decide the relevant issues.
The Bank and the other Group companies are subject to claims and, therefore, are party to certain legal proceedings incidental to the normal course of their business including those in connection with lending activities, relationships with employees and other commercial or tax matters.
With the information available to it, the Group considers that, at 31 March 2020, it had reliably estimated the obligations associated with each proceeding and had recognized, where necessary, sufficient provisions to cover reasonably any liabilities that may arise as a result of these tax and legal risks. Subject to the qualifications made, it also believes that any liability arising from such claims and proceedings will not have, overall, a material adverse effect on the Group’s business, financial position or results of operations.
11. Equity
In the three-month periods ended 31 March 2020 and 2019 there were no quantitative or qualitative changes in the Group's equity other than those indicated in the condensed consolidated statements of changes in total equity.
a) | Capital |
As of 31 March 2020 and 31 December 2019, the Bank's capital stock was represented by 16,618,114,582 shares, with a nominal amount of EUR 8, 309 million, in both dates.
b) | Breakdown of Other comprehensive income - Items not reclassified to profit or loss and Items that may be reclassified to profit or loss. |
Million euros | ||||
31-03-2020 | 31-12-2019 (*) | |||
Other comprehensive income accumulated | (27,761 | ) | (24,168 | ) |
Items not reclassified to profit or loss | (3,484 | ) | (4,288 | ) |
Actuarial gains or losses on defined benefit pension plans | (3,181 | ) | (4,764 | ) |
Non-current assets held for sale | — | — | ||
Share in other income and expenses recognised in investments, joint ventures and associates | (6 | ) | 1 | |
Other valuation adjustments | — | — | ||
Changes in the fair value of equity instruments measured at fair value with changes in other comprehensive income | (266 | ) | 514 | |
Inefficacy of fair value hedges of equity instruments measured at fair value with changes in other comprehensive income | — | — | ||
Changes in the fair value of equity instruments measured at fair value with changes in other comprehensive income (hedged item) | 172 | 44 | ||
Changes in the fair value of equity instruments measured at fair value with changes in other comprehensive income (hedging instrument) | (172 | ) | (44 | ) |
Changes in the fair value of financial liabilities measured at fair value through profit or loss attributable to changes in credit risk | (31 | ) | (39 | ) |
Items that may be reclassified to profit or loss | (24,277 | ) | (19,880 | ) |
Hedge of net investments in foreign operations (effective portion) | (3,197 | ) | (5,464 | ) |
Exchange differences | (23,626 | ) | (16,701 | ) |
Hedging derivatives (effective portion) | 997 | 300 | ||
Changes in the fair value of debt instruments measured at fair value with changes in other comprehensive income | 2,004 | 2,321 | ||
Hedging instruments (items not designated) | — | — | ||
Non-current assets held for sale | — | — | ||
Share in other income and expenses recognised in investments, joint ventures and associates | (455 | ) | (336 | ) |
(*) See Note 1.e.
124
c) | Other comprehensive income - Items not reclassified to profit or loss - Actuarial gains or losses on defined benefit pension plans. |
The changes in the balance of Other comprehensive income - Items not reclassified to profit or loss - Actuarial gains or losses on defined benefit pension plans include the actuarial gains or losses generated in the period and the return on plan assets, excluding amounts included in net interest on the net defined benefit liability (asset), less the administrative expenses and taxes inherent to the plan, and any change in the effect of the asset ceiling. Its variation is shown in the condensed consolidated statement of Recognised income and expense.
During the first three months of 2020, the amount of actuarial losses (net of actuarial gains) has decreased by EUR 2,322 million. Their main impacts are:
- A decrease of EUR 1,893 million in the accrued actuarial losses relating to the Group’s businesses in the United Kingdom, mainly due to the change in the discount rate (increase from 2.11% to 2.48%).
- A decrease of EUR 206 million in the accrued actuarial losses relating to the Group’s businesses in Brazil, mainly due to the change in the discount rate (increase from 7.05% to 7.87% for pension plans and from 7.22% to 8.07% for medical plans).
- A decrease of EUR 44 million in the accrued actuarial losses relating to the Group’s businesses in Germany, due to the change in the discount rate (increase from 1.46% to 1.90%).
The remaining variation in the accrued actuarial gains and losses heading represents a decrease of EUR 179 million, as a result of the evolution of exchange rates, mainly in the depreciation of the Brazilian real, and other effects.
d) Other comprehensive income - Items not reclassified to profit or loss - Changes in the fair value of equity instruments measured at fair value with changes in other comprehensive income.
Includes the net amount of unrealised fair value changes in equity instruments at fair value with changes in other comprehensive income.
Below is a breakdown of the composition of the balance as of 31 March 2020 under "Other comprehensive income - Items that cannot be reclassified to profit or loss - Changes in the fair value of debt equity measured at fair value with changes in other comprehensive income depending on the geographical origin of the issuer:
Million euros | ||||||||
31-03-2020 | 31-12-2019 | |||||||
Revaluation gains | Revaluation losses | Net revaluation gains/(losses) | Fair value | Revaluation gains | Revaluation losses | Net revaluation gains/(losses) | Fair value | |
Equity instruments | ||||||||
Domestic | ||||||||
Spain | 20 | (791) | (771) | 144 | 21 | (445) | (424) | 184 |
International | ||||||||
Rest of Europe | 64 | (72) | (8) | 363 | 68 | (72) | (4) | 379 |
United States | 13 | (3) | 10 | 42 | 15 | (3) | 12 | 44 |
Latin America and rest | 547 | (44) | 503 | 1,742 | 934 | (4) | 930 | 2,256 |
644 | (910) | (266) | 2,291 | 1,038 | (524) | 514 | 2,863 | |
Of which: | ||||||||
Listed | 547 | (77) | 470 | 1,747 | 936 | (14) | 922 | 2,283 |
Unlisted | 97 | (833) | (736) | 544 | 102 | (510) | (408) | 580 |
e) | Other comprehensive income - Items that may be reclassified to profit or loss - Hedges of net investments in foreign operations (effective portion) and exchange differences. |
Other comprehensive income - Items that may be reclassified to profit or loss - Hedges of net investments in foreign operations (effective portion) includes the net amount of the changes in value of hedging instruments in hedges of net investments in foreign operations, in respect of the portion of these changes considered to be effective hedges.
Other comprehensive income - Items that may be reclassified to profit or loss - Exchange differences includes the net amount of exchange differences arising on non-monetary items whose fair value is adjusted against equity and the differences arising on the translation to euros of the balances of the consolidated entities whose functional currency is not the euro.
The net variation of both headings recognised during the first quarter of 2020, recorded in the statement of income and expenses recognised as a consolidated summary, reflects the impact of the evolution of currencies in the year, as a consequence of the generalized depreciation of the main currencies except for the appreciation of the US dollar (Note 1.e). From this variation, a loss of EUR 1,442 million corresponds to the valuation at the closing exchange rate of goodwill of the quarter (Note 8).
125
f) | Other comprehensive income - Items that may be reclassified to profit or loss - Changes in the fair value of debt instruments measured at fair value through other comprehensive income. |
Includes the net amount of unrealised fair value changes in debt instruments at fair value through other comprehensive income.
Below is a breakdown of the composition of the balance as of 31 March 2020 and 31 December 2019 under Other comprehensive income - Items that can be reclassified to profit or loss - Changes in the fair value of debt instruments measured at fair value through other comprehensive income depending on the type of instrument and the geographical origin of the issuer:
Million euros | ||||||||
31-03-2020 | 31-12-2019 | |||||||
Revaluation gains | Revaluation losses | Net revaluation gains/(losses) | Fair value | Revaluation gains | Revaluation losses | Net revaluation gains/(losses) | Fair value | |
Debt instruments | ||||||||
Government and central banks debt instruments | ||||||||
Spain | 910 | (1) | 909 | 21,993 | 947 | (2) | 945 | 32,413 |
Rest of Europe | 681 | (63) | 618 | 19,034 | 664 | (38) | 626 | 19,052 |
Latin America and rest of the world | 755 | (172) | 583 | 45,052 | 839 | (121) | 718 | 51,284 |
Private-sector debt instruments | 128 | (234) | (106) | 21,868 | 81 | (49) | 32 | 20,096 |
2,474 | (470) | 2,004 | 107,947 | 2,531 | (210) | 2,321 | 122,845 | |
12. Segment information (primary segment)
For Group management purposes, the primary level of segmentation, which is based on the Group's management structure, comprises five reportable segments: four operating areas plus the Corporate Center. The operating areas, are: Europe, South America, North America and Santander Global Platform.
Following is the breakdown of revenue that is deemed to be recognised under Dividend income, Commission income, Gain or losses on financial assets and liabilities not measured at fair value through profit or loss, net, Gain or losses on financial assets and liabilities held for trading, net, Gain or losses on non-trading financial assets and liabilities mandatorily at fair value through profit or loss, Gain or losses on financial assets and liabilities measured at fair value through profit or loss, net, Gain or losses from hedge accounting, net, Other operating income and Income from assets under insurance and reinsurance contracts in the accompanying consolidated income statements for the three-month period ended 31 March 2020 and 2019.
This financial information (“underlying basis”) is computed by adjusting reported results for the effects of certain gains and losses (e.g.: capital gains, write-downs, etc.). These gains and losses are items that management and investors ordinarily identify and consider separately to understand better the underlying trends in the business.
Following, is the reconciliation between the adjusted profit and the statutory profit corresponding to the three month period ended 31 March, 2020 and 2019:
Segment | Million euros | |||||||||||
Revenue from ordinary activities | Profit | Profit before taxes | ||||||||||
31-03-2020 | 31-03-2019 | 31-03-2020 | 31-03-2019 | 31-03-2020 | 31-03-2019 | |||||||
Europe | 7,422 | 7,964 | 973 | 1,163 | 1,511 | 1,768 | ||||||
North America | 4,407 | 4,307 | 522 | 386 | 824 | 713 | ||||||
South America | 10,223 | 7,053 | 928 | 926 | 1,661 | 1,785 | ||||||
Santander Global Platform | 47 | 29 | (13 | ) | (11 | ) | (27 | ) | (23 | ) | ||
Corporate Centre | 147 | 210 | (433 | ) | (516 | ) | (413 | ) | (559 | ) | ||
Underlying Profit | 22,246 | 19,563 | 1,977 | 1,948 | 3,556 | 3,684 | ||||||
Adjustments | — | — | (1,646 | ) | (108 | ) | (1,666 | ) | (82 | ) | ||
Statutory Profit | 22,246 | 19,563 | 331 | 1,840 | 1,890 | 3,602 | ||||||
Explanation of adjustments:
In the first quarter of 2020, establishment of a provision overlay, for an amount of EUR 1,600 million related to COVID-19 and restructuring costs for a total amount of EUR 46 million, with the following detail: EUR 23 million in the United Kingdom, EUR 12 million in Santander Consumer Finance, EUR 2 million in Poland and EUR 9 million in Other Europe.
In the first quarter of 2019, the capital gains obtained from the sale of 51% of our stake in the Argentine company Prisma Medios de Pago S.A. were accounted for and the revaluation of the remaining 49% (EUR 150 million), capital losses related to the sale of real estate assets in Spain ( EUR -180 million) and restructuring costs in the United Kingdom and Poland (EUR -78 million).
126
13. Related parties
The parties related to the Group are deemed to include, in addition to its subsidiaries, associates and jointly controlled entities, the Bank's key management personnel (the members of its board of directors and the executive vice presidents, together with their close family members) and the entities over which the key management personnel may exercise significant influence or control.
Following is a detail of the transactions performed by the Group with its related parties in the first three months of 2020 and 2019, distinguishing between significant shareholders, members of the Bank's board of directors, the Bank's executive vice presidents, Group entities and other related parties. Related party transactions were made on terms equivalent to those that prevail in arm's-length transactions or, when this was not the case, the related compensation in kind was recognised:
Million euros | ||||||||||
31-03-2020 | ||||||||||
Expenses and income | Significant shareholders | Directors and executives | Group companies or entities | Other related parties | Total | |||||
Expenses: | ||||||||||
Finance costs | — | — | 3 | — | 3 | |||||
Leases | — | — | — | — | — | |||||
Services received | — | — | — | — | — | |||||
Purchases of stocks | — | — | — | — | — | |||||
Other expenses | — | — | 10 | — | 10 | |||||
— | — | 13 | — | 13 | ||||||
Income: | ||||||||||
Finance income | — | — | 38 | — | 38 | |||||
Dividends received | — | — | — | — | — | |||||
Services rendered | — | — | — | — | — | |||||
Sale of stocks | — | — | — | — | — | |||||
Other income | — | — | 292 | — | 292 | |||||
— | — | 330 | — | 330 | ||||||
Million euros | ||||||||||
31-03-2020 | ||||||||||
Other transactions | Significant shareholders | Directors and executives | Group companies or entities | Other related parties | Total | |||||
Financing agreements: loans and capital contributions (lender) | — | — | (419 | ) | (8 | ) | (427 | ) | ||
Financing agreements: loans and capital contributions (borrower) | — | (14 | ) | 454 | 32 | 472 | ||||
Guarantees provided | — | — | 1 | — | 1 | |||||
Guarantees received | — | — | — | — | — | |||||
Commitments acquired | — | (1 | ) | (1 | ) | — | (2 | ) | ||
Dividends and other distributed profit | — | — | — | — | — | |||||
Other transactions | — | — | (548 | ) | — | (548 | ) | |||
127
Million euros | ||||||||||
31-03-2020 | ||||||||||
Balance closing period | Significant shareholders | Directors and executives | Group companies or entities | Other related parties | Total | |||||
Debt balances | ||||||||||
Customers and commercial debtors | — | — | — | — | — | |||||
Loans and credits granted | — | 27 | 7,851 | 96 | 7,974 | |||||
Other collection rights | — | — | 846 | — | 846 | |||||
— | 27 | 8,697 | 96 | 8,820 | ||||||
Credit balances: | ||||||||||
Suppliers and credits granted | — | — | — | — | — | |||||
Loans and credits received | — | 39 | 3,082 | 89 | 3,210 | |||||
Other payment obligations | — | — | 67 | — | 67 | |||||
— | 39 | 3,149 | 89 | 3,277 | ||||||
Million euros | ||||||||||
31-03-2019 | ||||||||||
Expenses and income | Significant shareholders | Directors and executives | Group companies or entities | Other related parties | Total | |||||
Expenses: | ||||||||||
Finance costs | — | — | 1 | — | 1 | |||||
Leases | — | — | — | — | — | |||||
Services received | — | — | — | — | — | |||||
Purchases of stocks | — | — | — | — | — | |||||
Other expenses | — | — | 3 | — | 3 | |||||
— | — | 4 | — | 4 | ||||||
Income: | ||||||||||
Finance income | — | — | 22 | — | 22 | |||||
Dividends received | — | — | — | — | — | |||||
Services rendered | — | — | — | — | — | |||||
Sale of stocks | — | — | — | — | — | |||||
Other income | — | — | 241 | — | 241 | |||||
— | — | 263 | — | 263 | ||||||
Million euros | |||||||||||
31-03-2019 | |||||||||||
Other transactions | Significant shareholders | Directors and executives | Group companies or entities | Other related parties | Total | ||||||
Financing agreements: loans and capital contributions (lender) | — | — | 585 | (3 | ) | 582 | |||||
Financing agreements: loans and capital contributions (borrower) | — | 7 | 118 | 22 | 147 | ||||||
Guarantees provided | — | — | (21 | ) | 4 | (17 | ) | ||||
Guarantees received | — | — | — | — | — | ||||||
Commitments acquired | — | — | 13 | (4 | ) | 9 | |||||
Dividends and other distributed profit | — | 2 | — | 10 | 12 | ||||||
Other transactions | — | — | — | — | — | ||||||
128
Million euros | ||||||||||
31-12-2019 | ||||||||||
Balance closing period | Significant shareholders | Directors and executives | Group companies or entities | Other related parties | Total | |||||
Debt balances: | ||||||||||
Customers and commercial debtors | — | — | — | — | — | |||||
Loans and credits granted | — | 26 | 7,911 | 104 | 8,041 | |||||
Other collection rights | — | — | 1,747 | — | 1,747 | |||||
— | 26 | 9,658 | 104 | 9,788 | ||||||
Credit balances: | ||||||||||
Suppliers and credits granted | — | — | — | — | — | |||||
Loans and credits received | — | 53 | 2,628 | 57 | 2,738 | |||||
Other payment obligations | — | — | 61 | — | 61 | |||||
— | 53 | 2,689 | 57 | 2,799 | ||||||
14. Off-balance-sheet exposures
The off-balance-sheet exposures related to balances representing loans commitments, financial guarantees and other commitments granted (recoverables and non recoverables).
Financial guarantees granted include financial guarantees contracts such as financial bank guarantees, credit derivatives, and risks arising from derivatives granted to third parties; non-financial guarantees include other guarantees and irrevocable documentary credits.
Loan and other commitments granted include all off-balance-sheet exposures, which are not classified as guarantees provided, including loans commitment granted.
Million euros | ||
31-03-2020 | 31-12-2019 | |
Loans commitment granted | 217,767 | 241,179 |
Of which doubtful | 293 | 352 |
Financial guarantees granted | 12,810 | 13,650 |
Of which doubtful | 148 | 154 |
Bank sureties | 12,787 | 13,620 |
Credit derivatives sold | 23 | 30 |
Other commitments granted | 73,128 | 68,895 |
Of which doubtful | 619 | 748 |
Other granted guarantees | 33,206 | 33,890 |
Other | 39,922 | 35,005 |
The breakdown of the off-balance sheet exposure and impairment on 31 March 2020 and 31 December 2019 by impairment stages is EUR 296,245 million and EUR 316,116 million of exposure and EUR 391 million and EUR 417 million of impairment in stage 1, EUR 6,400 million and EUR 6,355 million of exposure and EUR 129 million and EUR 145 million of impairment in stage 2, and EUR 1,060 million and EUR 1,253 million of exposure and EUR 148 million and EUR 177 million of impairment in stage 3, respectively.
15. Average headcount and number of branches
The average number of employees at the Bank and the Group, by gender, in the three-month periods ended 31 March 2020 and 2019 is as follows:
Average headcount | Bank | Group | ||
31-03-2020 | 31-03-2019 | 31-03-2020 | 31-03-2019 | |
Men | 13,995 | 16,312 | 88,788 | 91,966 |
Women | 12,687 | 13,754 | 106,629 | 110,687 |
26,682 | 30,066 | 195,417 | 202,653 | |
129
The number of branches at 31 March 2020 and 31 December 2019 is as follow:
Number of branches | Group | |
31-03-2020 | 31-12-2019 | |
Spain | 3,272 | 3,286 |
Foreign | 8,630 | 8,666 |
11,902 | 11,952 | |
16. Other disclosures
a) | Valuation techniques for financial assets and liabilities |
The following table shows a summary of the fair values, at 31 March 2020 and 31 December 2019, of the financial assets and liabilities indicated below, classified on the basis of the various measurement methods used by the Group to determine their fair value:
Million euros | ||||||||
31-03-2020 | 31-12-2019 | |||||||
Published price quotations in active markets (Level 1) | Internal models (Levels 2 and 3) | Total | Published price quotations in active markets (Level 1) | Internal models (Levels 2 and 3) | Total | |||
Financial assets held for trading | 38,193 | 87,653 | 125,846 | 44,581 | 63,649 | 108,230 | ||
Non-trading financial assets mandatorily at fair value through profit or loss | 1,396 | 3,087 | 4,483 | 1,530 | 3,381 | 4,911 | ||
Financial assets at fair value through profit and loss | 2,468 | 60,191 | 62,659 | 2,572 | 59,497 | 62,069 | ||
Financial assets at fair value through other comprehensive income | 84,281 | 25,957 | 110,238 | 103,089 | 22,619 | 125,708 | ||
Hedging derivatives (assets) | — | 12,755 | 12,755 | — | 7,216 | 7,216 | ||
Financial liabilities held for trading | 9,721 | 90,361 | 100,082 | 9,781 | 67,358 | 77,139 | ||
Financial liabilities designated at fair value through profit or loss | 2,122 | 65,215 | 67,337 | 1,484 | 59,511 | 60,995 | ||
Hedging derivatives (liabilities) | — | 6,673 | 6,673 | — | 6,048 | 6,048 | ||
Liabilities under insurance contracts | — | 2,280 | 2,280 | — | 739 | 739 | ||
Financial instruments at fair value, determined on the basis of published price quotations in active markets (Level 1), include government debt instruments, private-sector debt instruments, derivatives traded in organised markets, securitised assets, shares, short positions and fixed-income securities issued.
In cases where price quotations cannot be observed, management makes its best estimate of the price that the market would set, using its own internal models. In most cases, these internal models use data based on observable market parameters as significant inputs (Level 2) and, in some cases, they use significant inputs not observable in market data (Level 3).
In order to make these estimates, various techniques are employed, including the extrapolation of observable market data. The best evidence of the fair value of a financial instrument on initial recognition is the transaction price, unless the fair value of the instrument can be obtained from other market transactions performed with the same or similar instruments or can be measured by using a valuation technique in which the variables used include only observable market data, mainly interest rates.
The Group did not make any significantl transfers of financial instruments between measurement levels other than the transfers included in level 3 table for the three month period ended on 31 March 2020.
The Group has developed a formal process for the systematic valuation and management of financial instruments, which has been implemented worldwide across all the Group's units. The governance scheme for this process distributes responsibilities between two independent divisions: Treasury (development, marketing and daily management of financial products and market data) and Risk (on a periodic basis, validation of pricing models and market data, computation of risk metrics, new transaction approval policies, management of market risk and implementation of fair value adjustment policies). The approval of new products follows a sequence of steps (request, development, validation, integration in corporate systems and quality assurance) before the product is brought into production. This process ensures that pricing systems have been properly reviewed and are stable before they are used.
130
The most important products and families of derivatives, and the related valuation techniques and inputs, by asset class, are detailed in the consolidated annual accounts as at 31 December 2019.
As of 31 March 2020, the CVA (Credit Valuation Adjustment) accounted for was EUR 572.5 million (an increase of 110.4% compared to 31 December 2019 year end) and adjustments of DVA (Debt Valuation Adjustment) was EUR 257.7 million (an increase of 50.7% compared to 31 December 2019). The increses are mainly due to the fact that credit spreads have risen by 50% in the most liquid periods during the last days of March 2020, as a consequence of the volatility of the markets and the uncertainty regarding the issuers of corporate debt due to the possible impacts of the COVID-19.
Set forth below are the financial instruments at fair value whose measurement is based on internal models (Level 2 and Level 3) at 31 March 2020 and 31 December 2019:
131
Million euros | Million euros | |||||||||
Fair values calculated using internal models at 31-03-2020 (*) | Fair values calculated using internal models at 31-12-2019 (*) | |||||||||
Level 2 | Level 3 | Level 2 | Level 3 | Valuation techniques | Main inputs | |||||
ASSETS | 182,401 | 7,242 | 149,711 | 6,651 | ||||||
Financial assets held for trading | 87,009 | 644 | 63,051 | 598 | ||||||
Credit institutions | — | — | — | — | Present value method | Yield curves, FX market prices | ||||
Customers (**) | 298 | — | 355 | — | Present value method | Yield curves, FX market prices | ||||
Debt instruments and equity instruments | 977 | 50 | 760 | 65 | Present value method | Yield curves, FX market prices | ||||
Derivatives | 85,734 | 594 | 61,936 | 533 | ||||||
Swaps | 67,563 | 172 | 51,594 | 182 | Present value method, Gaussian Copula (***) | Yield curves, FX market prices, HPI, Basis, Liquidity | ||||
Exchange rate options | 1,117 | 11 | 469 | 8 | Black-Scholes Model | Yield curves, Volatility surfaces, FX market prices, Liquidity | ||||
Interest rate options | 3,465 | 232 | 3,073 | 177 | Black's Model, multifactorial advanced models interest rate | Yield curves, Volatility surfaces, FX market prices, Liquidity | ||||
Interest rate futures | 93 | — | 190 | — | Present value method | Yield curves, FX market prices | ||||
Index and securities options | 2,086 | 128 | 1,164 | 95 | Black’s Model, multifactorial advanced models interest rate | Yield curves, Volatility surfaces, FX & EQ market prices, Dividends, Liquidity. | ||||
Other | 11,410 | 51 | 5,446 | 71 | Present value method, Advanced stochastic volatility models and other | Yield curves, Volatility surfaces, FX and EQ market prices, Dividends, Liquidity, Dividends, Correlation, HPI, Credit, Others. | ||||
Hedging derivatives | 12,755 | — | 7,216 | — | ||||||
Swaps | 9,597 | — | 6,485 | — | Present value method | Yield curves, FX market prices, Basis | ||||
Interest rate options | 24 | — | 25 | — | Black-Scholes Model | Yield curves, FX maket prices, Volatility surfaces, Liquidity | ||||
Other | 3,134 | — | 706 | — | Present value method, Advanced stochastic volatility models and other | Yield curves, Volatility surfaces, FX market prices, Credit, Liquidity, Others | ||||
Non-trading financial assets mandatorily at fair value through profit or loss | 1,937 | 1,150 | 1,780 | 1,601 | Yield curves, FX and EQ market prices, Others | |||||
Equity instruments | 1,364 | 518 | 1,272 | 550 | Present value method | Market price, Interest rates curves, Dividends and Others | ||||
Debt instruments | 564 | 293 | 498 | 675 | Present value method | Yield curves | ||||
Loans and receivables (**) | 9 | 339 | 10 | 376 | Present value method, swap asset model & CDS | Yield curves and Credit curves | ||||
Financial assets designated at fair value through profit or loss | 59,677 | 514 | 58,833 | 664 | ||||||
Central banks | 6,264 | — | 6,474 | — | Present value method | Yield curves, FX market prices | ||||
Credit institutions | 22,461 | 50 | 21,598 | 50 | Present value method | Yield curves, FX market prices | ||||
Customers (****) | 30,894 | 28 | 30,729 | 32 | Present value method | Yield curves, FX market prices, HPI | ||||
Debt instruments | 58 | 436 | 32 | 582 | Present value method | Yield curves, FX market prices | ||||
Financial assets at fair value through other comprehensive income | 21,023 | 4,934 | 18,831 | 3,788 | ||||||
Equity instruments | 97 | 375 | 98 | 407 | Present value method | Market price, Interest rates curves, Dividends and Others | ||||
Debt instruments | 16,868 | 228 | 17,486 | 188 | Present value method | Yield curves, FX market prices | ||||
Loans and receivables | 4,058 | 4,331 | 1,247 | 3,193 | Present value method | Yield curves, FX market prices and Credit curves | ||||
LIABILITIES | 163,615 | 914 | 132,582 | 1,074 | ||||||
Financial liabilities held for trading | 90,093 | 268 | 67,068 | 290 | ||||||
Central banks | — | — | — | — | Present value method | Yield curves, FX market prices | ||||
Credit institutions | — | — | — | — | Present value method | Yield curves, FX market prices | ||||
Customers | — | — | — | — | Present value method | Yield curves, FX market prices | ||||
Derivatives | 85,915 | 268 | 61,789 | 290 | ||||||
Swaps | 65,521 | 109 | 49,927 | 115 | Present value method, Gaussian Copula (***) | Yield curves, FX market prices, Basis, Liquidity, HPI | ||||
Exchange rate options | 1,101 | 3 | 658 | 1 | Black-Scholes Model | Yield curves, Volatility surfaces, FX market prices, Liquidity | ||||
Interest rate options | 4,899 | 48 | 4,291 | 34 | Black's Model, multifactorial advanced models interest rate | Yield curves, Volatility surfaces, FX market prices, Liquidity | ||||
Index and securities options | 2,599 | 90 | 1,309 | 88 | Black-Scholes Model | Yield curves, FX market prices | ||||
Interest rate and equity futures | 360 | 4 | 20 | 2 | Present value method | Yield curves, Volatility surfaces, FX & EQ market prices, Dividends, Correlation, Liquidity, HPI, Credit, Others. | ||||
Other | 11,435 | 14 | 5,584 | 50 | Present value method, Advanced stochastic volatility models | Yield curves, Volatility surfaces, FX & EQ market prices, Dividends, Correlation, Liquidity, HPI, Credit, Others | ||||
Short positions | 4,178 | — | 5,279 | — | Present value method | Yield curves ,FX & EQ market prices, Equity | ||||
Hedging derivatives | 6,673 | 0 | 6,048 | — | ||||||
Swaps | 5,846 | — | 4,737 | 0 | Present value method | Yield curves ,FX & EQ market prices, Basis | ||||
Interest rate options | 11 | — | 10 | — | Black's Model | Yield curves , Volatility surfaces, FX market prices, Liquidity | ||||
Other | 816 | — | 1,301 | — | Present value method, Advanced stochastic volatility models and other | Yield curves , Volatility surfaces, FX market prices, Credit, Liquidity, Other | ||||
Financial liabilities designated at fair value through profit or loss | 64,569 | 646 | 58,727 | 784 | Present value method | Yield curves, FX market prices | ||||
Liabilities under insurance contracts | 2,280 | — | 739 | — | Present Value Method with actuarial techniques | Mortality tables and interest rate curves | ||||
(*) | The internal models of Level 2 implement figures based on the parameters observed in the market, while Level 3 internal models uses significant inputs that are not observable in market data. |
(**) Includes mainly short-term loans and reverse repurchase agreements with corporate customers (mainly brokerage and investment companies).
(***) | Includes credit risk derivatives with a net fair value of EUR 7 million recognised in the interim condensed consolidated balance sheet (31 December 2019: net fair value of EUR 6 million). These assets and liabilities are measured using the Standard Gaussian Copula Model. |
(****) | Includes residential mortgages to financial institutions in the United Kingdom (which are regulated and partly financed by the Government). The fair value of these loans has been obtained using observable market variables, including current market transactions of similar amount and guarantees provided by the UK Housing Association. Given that the Government is involved in these entities, credit risk spreads have remained stable and homogeneous in this sector. The results arising from the valuation model are contrasted against current market transactions. |
132
The measurements obtained using the internal models might have been different had other methods or assumptions been used with respect to interest rate risk, to credit risk, market risk and foreign currency risk spreads, or to their related correlations and volatilities. Nevertheless, the Bank’s directors consider that the fair value of the financial assets and liabilities recognised in the consolidated balance sheet and the gains and losses arising from these financial instruments are reasonable.
Level 3 financial instruments
Set forth below are the Group's main financial instruments measured using unobservable market data that constitute significant inputs of the internal models (Level 3):
- | Instruments in Santander UK's portfolio (loans, debt instruments and derivatives) linked to the House Price Index (HPI). Even if the valuation techniques used for these instruments may be the same as those used to value similar products (present value in the case of loans and debt instruments, and the Black-Scholes model for derivatives), the main factors used in the valuation of these instruments are the HPI spot rate, the growth rate of that rate, its volatility and mortality rates, which are not always observable in the market and, accordingly, these instruments are considered illiquid. |
• | The HPI spot rate: for some instruments the NSA HPI spot rate, which is directly observable and published on a monthly basis, is used. For other instruments where regional HPI rates must be used (published quarterly), adjustments are made to reflect the different composition of the rates and adapt them to the regional composition of Santander UK's portfolio. |
• | HPI growth rate: this is not always directly observable in the market, especially for long maturities, and is estimated in accordance with existing quoted prices. To reflect the uncertainty implicit in these estimates, adjustments are made based on an analysis of the historical volatility of the HPI, incorporating reversion to the mean. |
• | HPI volatility: the long-term volatility is not directly observable in the market but is estimated on the basis of more short-term quoted prices and by making an adjustment to reflect the existing uncertainty, based on the standard deviation of historical volatility over various time periods. |
• | Mortality rates: these are based on published official tables and adjusted to reflect the composition of the customer portfolio for this type of product at Santander UK. |
- | Callable interest rate trading derivatives (Bermudan style options) where the main unobservable input is mean reversion of interest rates. |
- | Derivatives of negotiation on interest rates, taking asset securitisations and with the redemption rate (CPR) as the main unobservable input as an underlying asset. |
- | Derivatives from trading on inflation in Spain, where volatility is not observable in the market. |
- | Derivatives on long-term interest rate volatility (more than 30 years) where volatility is not observable in the market at the indicated term. |
- | Equity volatility derivatives, specifically indices and equities, where volatility is not observable in the long term. |
Syndicated loans with the HTC&S business model (Hold to collect and sale) and classified in the fair value category with changes in other accumulated global result, where the cost of liquidity is not directly observable in the market, as well as the prepayment option in favour of the borrower. |
The net amount recorded in the results of the first three months of 2020 resulting from the aforementioned valuation models which main inputs are unobservable market data (Level 3) amounts to EUR 64 million benefit (EUR 185 million benefit in 2019).
The table below shows the effect, at 31 March 2020, on the fair value of the main financial instruments classified as Level 3 of a reasonable change in the assumptions used in the valuation. This effect was determined by applying the probable valuation ranges of the main unobservable inputs detailed in the following table:
133
Portfolio/Instrument | Valuation technique | Main unobservable inputs | Range | Weighted average | Impacts (in million euros) | |
(Level 3) | Unfavourable scenario | Favourable scenario | ||||
Financial assets held for trading | ||||||
Trading derivatives | Present Value Method | Curves on TAB indixes* | (a) | (a) | (0.2) | 0.2 |
Present Value model, modified Black-Scholes | HPI forward growth rate | 0%-5% | 2.54% | (23.8) | 23.0 | |
HPI spot | n/a | 785.87 (**) | (8.5) | 8.5 | ||
Caps/Floors | Black Model | No interest rate curve observable in the market. It is valued with the MXNTIIE28 swap curve and an FVA is calculated based on the differential between the corresponding fixings. | MXNTIIE28 curve + (-25bp,-5bp) | -15bp | 0.344 | 0.076 |
Cross Currency Swaps | Forward Estimation | No interest rate curve observable in the market. It is valued with the MXNTIIE28 swap curve and an FVA is calculated based on the differential between the corresponding fixings. MXN long term fees | MXNTIIE91 curve = MXNTIIE28 curve + (-25bp, -2bp) Bid Offer Spread IRS TIIE 0bp -18bp X-CCY USD/MXN 3bp-10bp; Swaps UDI/MXN 5bp - 20bp | TIIE 91 - 15bp IRS TIIE 8bp X-CCY MXN/USD7bp Swaps UDI/MXN 13 bp | (0.212) | 0.216 |
Quanto options | Local term volatility and reference strike under the partial differential equation method | Non market volatility, a proxy is used | Beta vs Volatility Surface STOXX50E 69%-62% | Beta 65% | — | — |
Interest Rate Swaps | Forward Estimation | This is a Balance Guaranteed Swap, which, as it did not have the appropriate valuation model, was completely covered Back-to.Back (both IRS clauses contain the same conditions for repayments) | 6%-12% | 7.0% | — | — |
Interest Rate Swaps | Forward Estimation | No interest rate curve observable in the market. It is valued with the MXNTIIE28 swap curve and an FVA is calculated based on the differential between the corresponding fixings. MXN long term fees | MXNTIIE91 Curve = MXNTIIE28 Curve + (-25bp, -bp). Bid Offer Spread IRS TIIE 0bp - 18bp X-CCY USD/MXN 3bp-10bp Swaps UDI/MXN 5bp - 20 bp | TIIE91 - 15bp IRS TIIE 6bp X-CCY MXN/USD 7bp Swaps UDI/MXN 13bp | 0.320 | 0.873 |
Financial assets at fair value through other comprehensive income | ||||||
Debt instruments and equity holdings | Present Value Method, others | Contingencies for litigations | 0%-100% | 22% | (26.5) | 7.3 |
Present Value Method, others | Late payment and prepayment rate, capital cost, long-term profit growth rate | (a) | (a) | (21.1) | 21.1 | |
Present Value Method, others | Interest curves, FX Market Prices and Credit Curves | (a) | (a) | (34.4) | 34.4 | |
Loans and advances to customers | Local Volatility | Long term volatility | n/a | 34.0% | 244.9 | (313.8) |
Non-trading financial assets mandatorily at fair value through profit or loss | ||||||
Credit to customers | Weighted average by probability (according to forecast mortality rates) of European HPI options, using the Black-Scholes model | HPI forward growth rate | 0%-5% | 2.67% | (6.6) | 5.8 |
Debt instruments and equity instruments | HPI spot rate | n/a | 785.87 (**) | (7.7) | 7.7 | |
TD Black | Spain Volatility | n/a | 4.7% | 2.2 | (11.5) | |
Asset Swap and CDS Model | Model - Interest Rate Curves and Credit | n/a | 7.7% | (19.8) | 4.4 | |
Cvx. Adj (SLN) | Long term volatility | n/a | 8.0% | (121.2) | 105.1 | |
Preset Value Model, other | Credit Spreads | 0.22%-1.57% | 1.0% | 0.1 | (0.1) | |
Financial liabilities held for trading | ||||||
Trading derivatives | Present Value method, modified Black-Scholes Model | HPI forward growth rate | 0%-5% | 2.41% | (7.3) | 6.8 |
HPI spot | n/a | 765.38 (**) | (4.3) | 4.9 | ||
Equity Linked Deposits | Basis Risk | 1.5%-2% | 0.50% | (6.8) | 0.8 | |
Curves on TAB indixes * | (a) | (a) | — | — | ||
Discounted flows denominated in different currencies | This is a Balance Guaranteed Swap, which as it did not have the appropriate valuation model, was completely covered Back-to-Back (both IRS clauses contain same conditions for repayments) | n/a | n/a | — | — | |
Discounted flows denominated in different currencies | No interest rate curve observable in the market. It is valued with the MXNTIIE28 swap curve and an FVA is calculated* | MXNTIIE28 Curve + (-20bp, 9.5bp) | -5bp | (0.039) | 0.082 | |
Hedging derivatives | ||||||
Hedging derivatives | Advanced models of local and stochastic volatility | Correlation between prices of shares | 55%-75% | 65% | Not applicable | Not applicable |
Advanced multi-factor interest rates models | Mean reversion of interest rates | 0.0001-0.03 | 0.01 (***) | — | — | |
Financial liabilities designated at fair value through profit or loss | — | — | — | — | (b) | (b) |
Customer deposits | Flow Discounting Method | Curve specified by the local regulator | Curve (IGPM + 6%) + 100bps | Curve (IGPM + 6%) + 100bps | (30) | 30 |
(*) | TAB: “Tasa Activa Bancaria” (Active Bank Rate). Average deposit interest rates (over 30, 90, 180 and 360 days) published by the Chilean Association of Banks and Financial Institutions (ABIF) in nominal currency (Chilean peso) and in real terms, adjusted for inflation (Unidad de Fomento - UF). |
(**) | There are national and regional HPI indices. The HPI spot value is the weighted average of the indices that correspond to the positions of each portfolio. The impact reported is a change of 10%. |
(***) | Theoretical average value of the parameter. The change arising on a favourable scenario is from 0.0001 to 0.03 An unfavourable scenario is not considered as there is insufficient margin for an adverse change from the current parameter level. |
134
(a) | The exercise was conducted for the unobservable inputs described in the “main unobservable inputs” column under probable scenarios. The range and weighted average value used are not shown because the aforementioned exercise was conducted jointly for various inputs or variants thereof (e.g. the TAB input comprises vector-time curves, for which there are also nominal yield curves and inflation-indexed yield curves), and it was not possible to break down the results separately by type of input. In the case of the TAB curve the gain or loss is reported for changes of +/-100 b.p. for the total sensitivity to this index in CLP and CLF. The same is applicable to the MXN interest rates. |
(b) | The Group calculates the potential impact on the measurement of each instrument on a joint basis, regardless of whether the individual value is positive (assets) or negative (liabilities), and discloses the joint effect associated with the related instruments classified on the asset side of the consolidated balance sheet. |
* Note: Null impacts in Quanto options arise because the position is completely covered back.to-back.
Null impacts on Interest Rate Swaps (Swaps Lock In) arise because the prepaid risk is fully covered.
Lastly, the changes in the financial instruments classified as Level 3 in the first three months of 2020 were as follows:
01-01-2020 | Changes | 31-03-2020 | ||||||||||||||
Million euros | Fair value calculated using internal models (Level 3) | Purchases/ Settlements | Sales/ Amortisation | Changes in fair value recognised in profit or loss | Changes in fair value recognised in equity | Level reclassifications | Other | Fair value calculated using internal models (Level 3) | ||||||||
Financial assets held for trading | 598 | 10 | (20) | 103 | — | 3 | (50) | 644 | ||||||||
Debt instruments | 65 | 2 | (13) | — | — | — | (4) | 50 | ||||||||
Trading derivatives | 533 | 8 | (7) | 103 | — | 3 | (46) | 594 | ||||||||
Swaps | 182 | — | (7) | 14 | — | (8) | (9) | 172 | ||||||||
Exchange rate options | 8 | — | — | 5 | — | — | (2) | 11 | ||||||||
Interest rate options | 177 | — | 4 | 51 | — | — | — | 232 | ||||||||
Index and securities options | 95 | 8 | (3) | 46 | — | 11 | (29) | 128 | ||||||||
Other | 71 | — | (1) | (13) | — | — | (6) | 51 | ||||||||
Hedging derivatives (Assets) | — | — | — | — | — | — | — | — | ||||||||
Trading financial assets at fair value through profit or loss | 664 | 25 | (6) | (28) | — | (24) | (117) | 514 | ||||||||
Credit institutions | 50 | — | — | — | — | — | — | 50 | ||||||||
Loans and advances to customers | 32 | — | (6) | 2 | — | — | — | 28 | ||||||||
Debt instruments | 582 | 25 | — | (30) | — | (24) | (117) | 436 | ||||||||
Non-trading financial assets mandatorily at fair value through profit or loss | 1,601 | 25 | (64) | (55) | — | — | (357) | 1,150 | ||||||||
Loans and advances to customers | 376 | 23 | (47) | 7 | — | — | (20) | 339 | ||||||||
Debt instruments | 675 | — | (10) | (40) | — | — | (332) | 293 | ||||||||
Equity instruments | 550 | 2 | (7) | (22) | — | — | (5) | 518 | ||||||||
Financial assets at fair value through other comprehensive income | 3,788 | 2,297 | (1,049) | — | (326) | — | 224 | 4,934 | ||||||||
TOTAL ASSETS | 6,651 | 2,357 | (1,139) | 20 | (326) | (21) | (300) | 7,242 | ||||||||
Financial liabilities held for trading | 290 | 4 | (2) | 9 | — | 6 | (39) | 268 | ||||||||
Trading derivatives | 290 | 4 | (2) | 9 | — | 6 | (39) | 268 | ||||||||
Swaps | 115 | — | 5 | (1) | — | (1) | (9) | 109 | ||||||||
Exchange rate options | 1 | — | — | 5 | — | — | (3) | 3 | ||||||||
Interest rate options | 34 | — | 2 | 12 | — | — | — | 48 | ||||||||
Index and securities options | 88 | 2 | (3) | 19 | — | 7 | (23) | 90 | ||||||||
Interest rate and equity futures | 2 | 2 | — | — | — | — | — | 4 | ||||||||
Others | 50 | — | (6) | (26) | — | — | (4) | 14 | ||||||||
Hedging derivatives (Liabilities) | — | — | — | — | — | — | — | — | ||||||||
Financial liabilities designated at fair value through profit or loss | 784 | 2 | — | (53) | — | — | (87) | 646 | ||||||||
TOTAL LIABILITIES | 1,074 | 6 | (2) | (44) | — | 6 | (126) | 914 | ||||||||
135
b) | Sovereign risk with peripheral European countries |
The detail at 31 March 2020 and 31 December 2019, by type of financial instrument, of the Group credit institutions’ sovereign risk exposure to Europe’s peripheral countries and of the short positions exposed to them, taking into consideration the scope established by the European Banking Authority (EBA) in the analyses performed on the capital needs of European credit institutions (Note 54 to the consolidated annual accounts for 2019), is as follows:
Sovereign risk by country of issuer/borrower at 31 March 2020 (*) | ||||||||||||||||
Million euros | ||||||||||||||||
Debt instruments | Loans and advances to customers (**) | Total net direct exposure | MtM Derivatives (***) | |||||||||||||
Financial assets held for trading and Financial assets designated at fair value through profit or loss | Short positions | Financial assets at fair value through other comprehensive income | Non-trading financial assets mandatorily at fair value through profit or loss | Financial assets at amortised cost | Other than CDSs | CDSs | ||||||||||
Spain | 9,485 | (2,653) | 9,035 | — | 217 | 10,315 | 26,399 | 547 | — | |||||||
Portugal | 33 | (243) | 4,770 | — | 579 | 4,022 | 9,161 | — | — | |||||||
Italy | 581 | (450) | — | — | 442 | 19 | 592 | 3 | (3) | |||||||
Ireland | — | — | — | — | — | 29 | 29 | (3) | — | |||||||
(*) Information prepared under EBA standards. Also, there are government debt instruments on insurance companies balance sheets amounting to EUR 15,126 million (of which EUR 13,401 million, EUR 1,324 million, EUR 399 million and EUR 2 million relate to Spain, Portugal, Italy and Ireland, respectively) and off-balance-sheet exposure other than derivatives - contingent liabilities and commitments- amounting to EUR 5,230 million (of which EUR 4,757 million, EUR 196 million and EUR 277 million to Spain, Portugal and Italy, respectively).
(**) | Presented without taking into account the valuation adjustments recognised (EUR 17 million). |
(***) | "Other than CDSs" refers to the exposure to derivatives based on the location of the counterparty, irrespective of the location of the underlying. “CDSs” refers to the exposure to CDSs based on the location of the underlying. |
Sovereign risk by country of issuer/borrower at 31 December 2019 (*) | ||||||||||||||||||
Million euros | ||||||||||||||||||
Debt instruments | Loans and advances to customers (**) | Total net direct exposure | MtM Derivatives (***) | |||||||||||||||
Financial assets held for trading and Financial assets designated at fair value through profit or loss | Short positions | Financial assets at fair value through other comprehensive income | Non-trading financial assets mandatorily at fair value through profit or loss | Financial assets at amortised cost | Other than CDSs | CDSs | ||||||||||||
Spain | 9,090 | (3,886) | 19,961 | — | 208 | 9,993 | 35,366 | 474 | — | |||||||||
Portugal | 31 | (777) | 5,450 | — | 577 | 3,408 | 8,689 | — | — | |||||||||
Italy | 1,095 | (452) | 1,631 | — | 442 | 19 | 2,735 | 5 | (5) | |||||||||
Ireland | — | — | — | — | — | — | — | — | — | |||||||||
(*) Information prepared under EBA standards. Also, there are government debt instruments on insurance companies balance sheets amounting to EUR 14,517 million (of which EUR 12,756 million, EUR 1,306 million, EUR 453 million and EUR 2 million relate to Spain, Portugal, Italy and Ireland, respectively) and off-balance-sheet exposure different to derivatives -contingent liabilities and commitments- amounting to EUR 6,299 million (EUR 5,808 million, EUR 224 million and EUR 267 million to Spain, Portugal and Italy, respectively).
(**) Presented without taking into account the valuation adjustments recognised (EUR 17 million)
(***) | "Other than CDSs" refers to the exposure to derivatives based on the location of the counterparty, irrespective of the location of the underlying. “CDSs” refers to the exposure to CDSs based on the location of the underlying. |
136
The detail of the Group’s other exposure to other counterparties (private sector, central banks and other public entities that are not considered to be sovereign risks) in the aforementioned countries at 31 March 2020 and 31 December 2019 is as follows:
Exposure to other counterparties by country of issuer/borrower at 31 March 2020 (*) | |||||||||||||||||||
Million euros | |||||||||||||||||||
Debt instruments | Loans and advances to customers (**) | Total net direct exposure | Derivatives (***) | ||||||||||||||||
Balances with central banks | Reverse repurchase agreements | Financial assets held for trading and Financial assets designated at FVTPL | Financial assets at fair value through other comprehensive income | Non-trading financial assets mandatorily at fair value through profit or loss | Financial assets at amortised cost | Other than CDSs | CDSs | ||||||||||||
Spain | 24,153 | 6,325 | 653 | 2,000 | 321 | 1,424 | 196,729 | 231,605 | 2,991 | (21) | |||||||||
Portugal | 3,213 | 183 | 147 | 28 | — | 3,151 | 33,644 | 40,366 | 877 | — | |||||||||
Italy | 300 | 7,371 | 670 | 559 | — | 153 | 12,864 | 21,917 | 1,043 | — | |||||||||
Greece | — | — | — | — | — | — | 8 | 8 | — | — | |||||||||
Ireland | — | — | 54 | 1,744 | 544 | 21 | 11,758 | 14,121 | 225 | — | |||||||||
(*) | Also, the Group has off-balance-sheet exposure other than derivatives -contingent liabilities and commitments- amounting to EUR 74,289 million, EUR 7,848 million, EUR 3,761 million, EUR 157 million and EUR 531 million to counterparties in Spain, Portugal, Italy, Greece and Ireland, respectively. |
(**) | Presented without taking into account valuation adjustments or impairment corrections (EUR 7,584 million). |
(***) | “Other than CDSs” refers to the exposure to derivatives based on the location of the counterparty, irrespective of the location of the underlying. “CDSs” refers to the exposure to CDSs based on the location of the underlying. |
Exposure to other counterparties by country of issuer/borrower at 31 December 2019 (*) | |||||||||||||||||||
Million euros | |||||||||||||||||||
Debt instruments | Loans and advances to customers (**) | Total net direct exposure | Derivatives (***) | ||||||||||||||||
Balances with central banks | Reverse repurchase agreements | Financial assets held for trading and Financial assets designated at FVTPL | Financial assets at fair value through other comprehensive income | Non-trading financial assets mandatorily at fair value through profit or loss | Financial assets at amortised cost | Other than CDSs | CDSs | ||||||||||||
Spain | 21,696 | 7,627 | 656 | 1.195 | 321 | 1,501 | 194,817 | 227,813 | 2,417 | 2 | |||||||||
Portugal | 2,814 | 409 | 190 | 32 | — | 2,956 | 33,403 | 39,804 | 931 | — | |||||||||
Italy | 182 | 6,243 | 625 | 606 | — | 153 | 12,284 | 20.093 | 512 | — | |||||||||
Greece | — | — | — | — | — | — | 12 | 12 | — | — | |||||||||
Ireland | — | — | 55 | 1,718 | 592 | 22 | 11,875 | 14,262 | 232 | — | |||||||||
(*) | Also, the Group has off-balance-sheet exposure other than derivatives -contingent liabilities and commitments- amounting to EUR 77,468 million, EUR 7,749 million, EUR 4,948 million, EUR 201 million and EUR 996 million to counterparties in Spain, Portugal, Italy, Greece and Ireland, respectively. |
(**) | They are presented without taking into account valuation adjustments or impairment corrections (EUR 7,322 million). |
(***) | Other than CDSs” refers to the exposure to derivatives based on the location of the counterparty, irrespective of the location of the underlying. “CDSs” refers to the exposure to CDSs based on the location of the underlying. |
Following is certain information on the notional amounts of the CDSs detailed in the foregoing tables at 31 March 2020 and 31 December 2019:
31-03-2020 | |||||||||||||
Million euros | |||||||||||||
Notional amount | Fair value | ||||||||||||
Bought | Sold | Net | Bought | Sold | Net | ||||||||
Spain | Sovereign | — | — | — | — | — | — | ||||||
Other | 103 | 277 | (174) | (1) | (20) | (21) | |||||||
Portugal | Sovereign | — | — | — | — | — | — | ||||||
Other | — | — | — | — | — | — | |||||||
Italy | Sovereign | 314 | 9 | 305 | (3) | — | (3) | ||||||
Other | 109 | 151 | (42) | (1) | 1 | — | |||||||
Greece | Sovereign | — | — | — | — | — | — | ||||||
Other | — | — | — | — | — | — | |||||||
Ireland | Sovereign | — | — | — | — | — | — | ||||||
Other | — | 16 | (16) | — | — | — | |||||||
137
31-12-2019 | |||||||||||||
Million euros | |||||||||||||
Notional amount | Fair value | ||||||||||||
Bought | Sold | Net | Bought | Sold | Net | ||||||||
Spain | Sovereign | — | — | — | — | — | — | ||||||
Other | 127 | 340 | (213) | (2) | 4 | 2 | |||||||
Portugal | Sovereign | 27 | 27 | — | — | — | — | ||||||
Other | — | — | — | — | — | — | |||||||
Italy | Sovereign | 314 | 9 | 305 | (5) | — | (5) | ||||||
Other | 60 | 60 | — | (2) | 2 | — | |||||||
17. Explanation added for translation to English
These interim condensed consolidated financial statements are presented on the basis of the regulatory financial reporting framework applicable to the Group in Spain (see note 1.b).
138
PART 3. RISK FACTORS | |
Simple Personal Fair | |
Risk factors
For a description of risks associated with Banco Santander and the Group, see the section entitled “Risk Factors” in Banco Santander’s Annual Report on Form 20-F for the year ended December 31, 2019 (the "2019 Form 20-F"). Set out below are certain additional risk factors which could have a material adverse effect on Banco Santander’s and the Group’s business, operations, financial condition or prospects and cause future results to be materially different from expected results. Banco Santander’s results could also be affected by competition and other factors. The risks appearing below update and supplement certain risks highlighted in the 2019 Form 20-F. These risks should be read in conjunction with the risks appearing in the 2019 Form 20-F and all of the other information appearing in this report on Form 6-K and should not be regarded as a complete and comprehensive statement of all potential risks and uncertainties that Banco Santander and the Group face. In addition, there may be additional risks that Banco Santander currently considers not to be material or of which they are not currently aware, and any of these risks could have the effects set forth below. All of these factors are contingencies which may or may not occur and Banco Santander is not in a position to express a view on the likelihood of any such contingency occurring.
The current global COVID-19 pandemic has materially impacted our business, and the continuance of this pandemic or any future outbreak of any other highly contagious diseases or other public health emergency, could materially and adversely impact our business, financial condition, liquidity and results of operations.
Since December 2019, a novel strain of coronavirus, or COVID-19, has spread in the People's Republic of China and progressively to the rest of the world, mainly to Europe (including Spain and the UK) and the United States, among others. The outbreak has been declared a public health emergency of international concern and a global pandemic by the World Health Organization.
Countries around the world have responded to the COVID-19 pandemic by taking various measures in an attempt to contain the spread and impact of COVID-19, including imposing mass quarantines or other containment measures, shelter in place orders and medical screenings, restricting travel, limiting public gatherings and suspending most economic activities. These measures have resulted in a severe decrease of global economic activity, falls in production and demand, which has led to sharp declines in the GDP of those countries which are most affected by the pandemic and is expected to have an overall negative impact on global GDP in 2020, increases in unemployment levels, sharp decreases and high volatility in stock markets, disruption of global supply chains, volatility in foreign exchange rates, steady customer draws on lines of credit, and uncertainty in relation to the future impact in regional and global economies in the mid and long term.
Many governments and regulatory authorities, including central banks, have acted to provide relief from the economic and market disruptions resulting from the COVID-19 pandemic, including providing fiscal and monetary stimuli to support the global economy, lowering federal funds rate and interest rates, and granting partial or total deferral (grace period) of principal and/or interest payments due on loans. It is difficult to predict how effective these and other measures taken to mitigate the economic effects of the pandemic will be. These measures have also negatively impacted, and could continue to negatively impact, businesses, market participants, our counterparties and clients, and the global economy for a prolonged period of time.
Should current economic conditions persist or continue to deteriorate, we expect that this macroeconomic environment will have a continued material adverse effect on our business and results of operations, which could include, but is not limited to (i) a continued decreased demand for our products and services; (ii) protracted periods of lower interest rates and resulting pressure on our margins; (iii) further material impairment of our loans and other assets including goodwill; (iv) decline in value of collateral; (v) constraints on our liquidity due to market conditions, exchange rates and customer withdrawal of deposits and continued draws on lines of credit; and (vi) downgrades to our credit ratings. See risk factor “Credit, market and liquidity risk may have an adverse effect on our credit ratings and our cost of funds. Any downgrade in our credit rating would likely increase our cost of funding, require us to post additional collateral or take other actions under some of our derivative and other contracts and adversely affect our interest margins and results of operations” included elsewhere in this report on Form 6-K.
Additionally, our operations will continue to be impacted by risks from remote working arrangements or bans on non-essential activities. For example, some of our branches in affected countries have been closed and others have been functioning with reduced hours for a significant period of time. As of the date of this report on Form 6-K, 112,000 employees, which account for more than half of our total workforce, are telecommuting, which has increased cybersecurity risks given greater use of computer networks outside the corporate environment. If we become unable to successfully operate our business from remote locations including, for example, due to failures of our technology infrastructure, increased cybersecurity risks, or governmental restrictions that affect our operations, this could result in business disruptions that could have a material and adverse effect on our business.
If the COVID-19 pandemic continues to adversely affect the global economy and/or adversely affect our business, financial condition, liquidity or results of operations, it may also increase the likelihood and/or magnitude of other risks described in the section captioned “Risk Factors” in our 2019 Form 20-F or risks described in our other filings with the Securities and Exchange Commission.
Credit, market and liquidity risk may have an adverse effect on our credit ratings and our cost of funds. Any downgrade in our credit rating would likely increase our cost of funding, require us to post additional collateral or take other actions under some of our derivative and other contracts and adversely affect our interest margins and results of operations.
Credit ratings affect the cost and other terms upon which we are able to obtain funding. Rating agencies regularly evaluate us, and their ratings of our debt are based on a number of factors, including our financial strength and conditions affecting the financial services industry. In addition,
140
due to the methodology of the main rating agencies, our credit rating is affected by the rating of Spanish sovereign debt. If Spain’s sovereign debt is downgraded, our credit rating would also likely be downgraded by an equivalent amount.
Any downgrade in our debt credit ratings would likely increase our borrowing costs and require us to post additional collateral or take other actions under some of our derivative and other contracts, and could limit our access to capital markets and adversely affect our commercial business. For example, a ratings downgrade could adversely affect our ability to sell or market some of our products, engage in certain longer-term and derivatives transactions and retain our customers, particularly customers who need a minimum rating threshold in order to invest. In addition, under the terms of certain of our derivative contracts and other financial commitments, we may be required to maintain a minimum credit rating or terminate such contracts or require the posting of collateral. Any of these results of a ratings downgrade could reduce our liquidity and have an adverse effect on us, including our operating results and financial condition.
As of the date of this report on Form 6-K, we have the following ratings by the major rating agencies:
Banco Santander | ||||
Rating agency | Long term | Short term | Last report date | Outlook |
Fitch Ratings | A- | F2 | March 2020 | Negative* |
Moody's | A2 | P-1 | April 2020 | Stable |
Standard & Poor's | A | A-1 | April 2020 | Negative* |
DBRS | A (High) | R-1 (Middle) | Jan 2020 | Stable |
*Outlook changed at last report date from stable to negative.
Santander UK, plc | ||||
Rating agency | Long term | Short term | Last report date | Outlook |
Fitch Ratings | A+ | F1 | April 2020 | Negative* |
Moody's | Aa3 | P-1 | Nov 2019 | Negative |
Standard & Poor's | A | A-1 | April 2020 | Negative* |
*Outlook changed at last report date from stable to negative.
Banco Santander (Brasil) | (Foreign currency) | |||
Rating agency | Long term | Short term | Last report date | Outlook |
Moody's | Ba3 | - | Feb 2020 | Stable |
Standard & Poor's | BB- | B | April 2020 | Stable* |
*Outlook changed at last report date from positive to stable.
We conduct substantially all of our material derivative activities through Banco Santander and Santander UK. We estimate that as of 31 December 2019, if all the rating agencies were to downgrade Banco Santander’s long-term senior debt ratings by one notch we would be required to post up to EUR 90 million in additional collateral pursuant to derivative and other financial contracts. A hypothetical two-notch downgrade would result in a further requirement to post up to EUR 249 million in additional collateral. We estimate that as of 31 December 2019, if all the rating agencies were to downgrade Santander UK’s long-term credit ratings by one notch, and thereby trigger a short-term credit rating downgrade, this could result in contractual outflows from Santander UK’s total liquid assets of £1.5 billion of cash and additional collateral that Santander UK would be required to post under the terms of secured funding and derivatives contracts. A hypothetical two-notch downgrade would result in a further outflow of £1.6 billion of cash and collateral under secured funding and derivatives contracts.
While certain potential impacts of these downgrades are contractual and quantifiable, the full consequences of a credit rating downgrade are inherently uncertain, as they depend upon numerous dynamic, complex and inter-related factors and assumptions, including market conditions at the time of any downgrade, which may continue to be negatively affected by the COVID-19 pandemic, whether any downgrade of our long-term credit rating precipitates downgrades to our short-term credit rating, and assumptions about the potential behaviours of various customers, investors and counterparties. Actual outflows could be higher or lower than the preceding hypothetical examples, depending upon certain factors including which credit rating agency downgrades our credit rating, any management or restructuring actions that could be taken to reduce cash outflows and the potential liquidity impact from loss of unsecured funding (such as from money market funds) or loss of secured
141
funding capacity. Although unsecured and secured funding stresses are included in our stress testing scenarios and a portion of our total liquid assets is held against these risks, a credit rating downgrade could still have a material adverse effect on us.
In addition, if we were required to cancel our derivatives contracts with certain counterparties and were unable to replace such contracts, our market risk profile could be altered.
There can be no assurance that the rating agencies will maintain the current ratings or outlooks. Failure to maintain favourable ratings and outlooks could increase our cost of funding and adversely affect interest margins, which could have a material adverse effect on us.
142
SIGNATURE
Pursuant to the requirements of the Securities Exchange Act of 1934, the registrant has duly caused this report to be signed on its behalf by the undersigned, thereunto duly authorized.
Banco Santander, S.A. | ||
Date: 15 May 2020 | By: | /s/ José García Cantera |
Name: | José García Cantera | |
Title: | Chief Financial Officer | |
143