false2024FY0000891024294iso4217:USDxbrli:sharesiso4217:USDxbrli:sharespdco:Segmentxbrli:purepdco:reportingUnitpdco:contractpdco:investment00008910242023-04-302024-04-2700008910242023-10-2800008910242024-06-1000008910242024-04-2700008910242023-04-2900008910242022-05-012023-04-2900008910242021-04-252022-04-300000891024us-gaap:CommonStockMember2021-04-240000891024us-gaap:AdditionalPaidInCapitalMember2021-04-240000891024us-gaap:AccumulatedOtherComprehensiveIncomeMember2021-04-240000891024us-gaap:RetainedEarningsMember2021-04-240000891024us-gaap:NoncontrollingInterestMember2021-04-2400008910242021-04-240000891024us-gaap:AccumulatedOtherComprehensiveIncomeMember2021-04-252022-04-300000891024us-gaap:RetainedEarningsMember2021-04-252022-04-300000891024us-gaap:NoncontrollingInterestMember2021-04-252022-04-300000891024us-gaap:CommonStockMember2021-04-252022-04-300000891024us-gaap:AdditionalPaidInCapitalMember2021-04-252022-04-300000891024us-gaap:CommonStockMember2022-04-300000891024us-gaap:AdditionalPaidInCapitalMember2022-04-300000891024us-gaap:AccumulatedOtherComprehensiveIncomeMember2022-04-300000891024us-gaap:RetainedEarningsMember2022-04-300000891024us-gaap:NoncontrollingInterestMember2022-04-3000008910242022-04-300000891024us-gaap:AccumulatedOtherComprehensiveIncomeMember2022-05-012023-04-290000891024us-gaap:RetainedEarningsMember2022-05-012023-04-290000891024us-gaap:NoncontrollingInterestMember2022-05-012023-04-290000891024us-gaap:CommonStockMember2022-05-012023-04-290000891024us-gaap:AdditionalPaidInCapitalMember2022-05-012023-04-290000891024us-gaap:CommonStockMember2023-04-290000891024us-gaap:AdditionalPaidInCapitalMember2023-04-290000891024us-gaap:AccumulatedOtherComprehensiveIncomeMember2023-04-290000891024us-gaap:RetainedEarningsMember2023-04-290000891024us-gaap:NoncontrollingInterestMember2023-04-290000891024us-gaap:AccumulatedOtherComprehensiveIncomeMember2023-04-302024-04-270000891024us-gaap:RetainedEarningsMember2023-04-302024-04-270000891024us-gaap:NoncontrollingInterestMember2023-04-302024-04-270000891024us-gaap:CommonStockMember2023-04-302024-04-270000891024us-gaap:AdditionalPaidInCapitalMember2023-04-302024-04-270000891024us-gaap:CommonStockMember2024-04-270000891024us-gaap:AdditionalPaidInCapitalMember2024-04-270000891024us-gaap:AccumulatedOtherComprehensiveIncomeMember2024-04-270000891024us-gaap:RetainedEarningsMember2024-04-270000891024us-gaap:NoncontrollingInterestMember2024-04-270000891024us-gaap:BuildingMember2024-04-270000891024pdco:ComputerHardwareAndSoftwareMembersrt:MinimumMember2024-04-270000891024pdco:ComputerHardwareAndSoftwareMembersrt:MaximumMember2024-04-270000891024pdco:OfficeFurnitureAndEquipmentMembersrt:MinimumMember2024-04-270000891024pdco:OfficeFurnitureAndEquipmentMembersrt:MaximumMember2024-04-270000891024us-gaap:EquityMethodInvesteeMember2023-04-302024-04-270000891024us-gaap:EquityMethodInvesteeMember2022-05-012023-04-290000891024us-gaap:EquityMethodInvesteeMember2021-04-252022-04-300000891024us-gaap:SeriesOfIndividuallyImmaterialBusinessAcquisitionsMember2023-04-302023-07-290000891024us-gaap:SeriesOfIndividuallyImmaterialBusinessAcquisitionsMember2022-10-302023-01-280000891024us-gaap:SeriesOfIndividuallyImmaterialBusinessAcquisitionsMember2023-04-290000891024us-gaap:SeriesOfIndividuallyImmaterialBusinessAcquisitionsMember2023-01-280000891024pdco:UnsettledContractsMember2024-04-270000891024pdco:UnsettledContractsMember2023-04-290000891024pdco:ReceivablesPurchaseAgreementsMember2023-04-302024-04-270000891024pdco:ReceivablesPurchaseAgreementsMember2022-05-012023-04-290000891024pdco:ReceivablesPurchaseAgreementsMember2021-04-252022-04-300000891024pdco:ReceivablesPurchaseAgreementsMember2023-04-290000891024pdco:ReceivablesPurchaseAgreementsMember2022-04-300000891024pdco:ReceivablesPurchaseAgreementsMember2021-04-240000891024pdco:ReceivablesPurchaseAgreementsMember2024-01-282024-04-270000891024pdco:ReceivablesPurchaseAgreementsMember2024-04-270000891024pdco:BankOfTokyoMitsubishiUfjLimitedMember2023-04-302024-04-270000891024pdco:BankOfTokyoMitsubishiUfjLimitedMember2024-04-270000891024pdco:FifthThirdNationalBankMember2023-04-302024-04-270000891024pdco:FifthThirdNationalBankMember2023-04-290000891024pdco:MitsubishiUFJFinancialGroupMember2024-04-270000891024pdco:CustomerFinanceContractsMember2023-04-290000891024pdco:CustomerFinanceContractsMember2022-04-300000891024pdco:CustomerFinanceContractsMember2021-04-240000891024pdco:CustomerFinanceContractsMember2023-04-302024-04-270000891024pdco:CustomerFinanceContractsMember2022-05-012023-04-290000891024pdco:CustomerFinanceContractsMember2021-04-252022-04-300000891024pdco:CustomerFinanceContractsMember2024-04-270000891024us-gaap:InterestRateCapMember2024-04-270000891024pdco:InterestRateSwapAgreementMember2014-01-310000891024pdco:InterestRateSwapAgreementMemberpdco:SeniorNotesSevenMember2015-03-250000891024pdco:InterestRateSwapAgreementMember2015-03-012015-03-310000891024pdco:InterestRateSwapAgreementMember2023-04-290000891024pdco:ForwardInterestRateSwapAgreementMember2024-04-270000891024pdco:InterestRateSwapAgreementMember2024-04-270000891024pdco:InterestRateSwapAgreementMember2023-04-302024-04-270000891024pdco:InterestRateSwapAgreementMember2022-05-012023-04-290000891024us-gaap:PrepaidExpensesAndOtherCurrentAssetsMemberus-gaap:InterestRateContractMember2024-04-270000891024us-gaap:PrepaidExpensesAndOtherCurrentAssetsMemberus-gaap:InterestRateContractMember2023-04-290000891024us-gaap:OtherNoncurrentAssetsMemberus-gaap:InterestRateContractMember2024-04-270000891024us-gaap:OtherNoncurrentAssetsMemberus-gaap:InterestRateContractMember2023-04-290000891024pdco:OtherAccruedLiabilitiesMemberus-gaap:InterestRateContractMember2024-04-270000891024pdco:OtherAccruedLiabilitiesMemberus-gaap:InterestRateContractMember2023-04-290000891024us-gaap:OtherNoncurrentLiabilitiesMemberus-gaap:InterestRateContractMember2024-04-270000891024us-gaap:OtherNoncurrentLiabilitiesMemberus-gaap:InterestRateContractMember2023-04-290000891024us-gaap:InterestRateContractMember2024-04-270000891024us-gaap:InterestRateContractMember2023-04-290000891024us-gaap:InterestExpenseMemberus-gaap:InterestRateContractMember2023-04-302024-04-270000891024us-gaap:InterestExpenseMemberus-gaap:InterestRateContractMember2022-05-012023-04-290000891024us-gaap:InterestExpenseMemberus-gaap:InterestRateContractMember2021-04-252022-04-300000891024us-gaap:OtherNonoperatingIncomeExpenseMemberus-gaap:InterestRateContractMember2023-04-302024-04-270000891024us-gaap:OtherNonoperatingIncomeExpenseMemberus-gaap:InterestRateContractMember2022-05-012023-04-290000891024us-gaap:OtherNonoperatingIncomeExpenseMemberus-gaap:InterestRateContractMember2021-04-252022-04-300000891024us-gaap:FairValueInputsLevel1Member2024-04-270000891024us-gaap:FairValueInputsLevel2Member2024-04-270000891024us-gaap:FairValueInputsLevel3Member2024-04-270000891024us-gaap:FairValueInputsLevel1Member2023-04-290000891024us-gaap:FairValueInputsLevel2Member2023-04-290000891024us-gaap:FairValueInputsLevel3Member2023-04-290000891024pdco:VetsourceMember2021-04-252022-04-300000891024pdco:VetsourceMember2024-04-270000891024pdco:VetsourceMember2023-04-290000891024pdco:VetsourceMember2023-04-302024-04-270000891024pdco:VetsPlusMember2021-04-252022-04-300000891024pdco:VetsPlusMember2024-04-270000891024pdco:VetsPlusMember2023-04-290000891024pdco:DentalSupplyMember2023-04-290000891024pdco:DentalSupplyMember2023-04-302024-04-270000891024pdco:DentalSupplyMember2024-04-270000891024pdco:AnimalHealthSegmentMember2023-04-290000891024pdco:AnimalHealthSegmentMember2023-04-302024-04-270000891024pdco:AnimalHealthSegmentMember2024-04-270000891024us-gaap:CustomerRelationshipsMember2024-04-270000891024us-gaap:CustomerRelationshipsMember2023-04-290000891024us-gaap:TrademarksAndTradeNamesMember2024-04-270000891024us-gaap:TrademarksAndTradeNamesMember2023-04-290000891024pdco:DevelopedTechnologyandOtherIntangibleAssetsMember2024-04-270000891024pdco:DevelopedTechnologyandOtherIntangibleAssetsMember2023-04-290000891024pdco:SeniorNotesThreePointSevenFourMember2024-04-270000891024pdco:SeniorNotesThreePointSevenFourMember2023-04-290000891024pdco:SeniorNotesThreePointFourEightPercentMember2024-04-270000891024pdco:SeniorNotesThreePointFourEightPercentMember2023-04-290000891024pdco:SeniorNotesThreePointSeventyNinePercentMember2024-04-270000891024pdco:SeniorNotesThreePointSeventyNinePercentMember2023-04-290000891024pdco:TermLoanDue2025Through2028Member2024-04-270000891024pdco:TermLoanDue2025Through2028Member2023-04-290000891024pdco:SecuredOvernightFinancingRateSOFRMemberpdco:TermLoanDue2025Through2028Member2023-04-302024-04-270000891024us-gaap:RevolvingCreditFacilityMemberpdco:AmendedCreditAgreementMember2021-04-240000891024pdco:TermLoanDueFebruary2024Memberpdco:AmendedCreditAgreementMember2021-04-240000891024us-gaap:RevolvingCreditFacilityMemberpdco:AmendedCreditAgreementMember2023-04-290000891024pdco:TermLoanDueOctober2027Memberpdco:AmendedCreditAgreementMember2023-04-290000891024pdco:AmendedCreditAgreementMemberpdco:TermLoanDue2024AndOct2027Member2024-04-270000891024us-gaap:RevolvingCreditFacilityMemberpdco:AmendedCreditAgreementMember2024-04-270000891024pdco:AmendedCreditAgreementMemberpdco:TermLoanDue2024AndOct2027Member2023-04-290000891024pdco:ForeignTaxCreditCarryforwardMember2023-04-302024-04-270000891024pdco:TechnologyPartnerInnovationsLLCMember2018-04-292019-04-270000891024pdco:TechnologyPartnerInnovationsLLCMemberpdco:CurePartnersMember2021-04-252022-04-300000891024pdco:TechnologyPartnerInnovationsLLCMember2021-04-252022-04-300000891024pdco:TechnologyPartnerInnovationsLLCMemberpdco:CurePartnersMember2022-05-012023-04-290000891024pdco:TechnologyPartnerInnovationsLLCMember2023-04-302024-04-270000891024pdco:TechnologyPartnerInnovationsLLCMember2022-05-012023-04-290000891024country:US2023-04-302024-04-270000891024country:US2022-05-012023-04-290000891024country:US2021-04-252022-04-300000891024country:GB2023-04-302024-04-270000891024country:GB2022-05-012023-04-290000891024country:GB2021-04-252022-04-300000891024country:CA2023-04-302024-04-270000891024country:CA2022-05-012023-04-290000891024country:CA2021-04-252022-04-300000891024pdco:DentalSupplyMembercountry:US2023-04-302024-04-270000891024pdco:DentalSupplyMembercountry:US2022-05-012023-04-290000891024pdco:DentalSupplyMembercountry:US2021-04-252022-04-300000891024pdco:DentalSupplyMembercountry:CA2023-04-302024-04-270000891024pdco:DentalSupplyMembercountry:CA2022-05-012023-04-290000891024pdco:DentalSupplyMembercountry:CA2021-04-252022-04-300000891024pdco:DentalSupplyMember2023-04-302024-04-270000891024pdco:DentalSupplyMember2022-05-012023-04-290000891024pdco:DentalSupplyMember2021-04-252022-04-300000891024pdco:AnimalHealthSegmentMembercountry:US2023-04-302024-04-270000891024pdco:AnimalHealthSegmentMembercountry:US2022-05-012023-04-290000891024pdco:AnimalHealthSegmentMembercountry:US2021-04-252022-04-300000891024country:GBpdco:AnimalHealthSegmentMember2023-04-302024-04-270000891024country:GBpdco:AnimalHealthSegmentMember2022-05-012023-04-290000891024country:GBpdco:AnimalHealthSegmentMember2021-04-252022-04-300000891024pdco:AnimalHealthSegmentMembercountry:CA2023-04-302024-04-270000891024pdco:AnimalHealthSegmentMembercountry:CA2022-05-012023-04-290000891024pdco:AnimalHealthSegmentMembercountry:CA2021-04-252022-04-300000891024pdco:AnimalHealthSegmentMember2023-04-302024-04-270000891024pdco:AnimalHealthSegmentMember2022-05-012023-04-290000891024pdco:AnimalHealthSegmentMember2021-04-252022-04-300000891024us-gaap:CorporateMember2023-04-302024-04-270000891024us-gaap:CorporateMember2022-05-012023-04-290000891024us-gaap:CorporateMember2021-04-252022-04-300000891024pdco:ConsumableAndPrintedProductsMember2023-04-302024-04-270000891024pdco:ConsumableAndPrintedProductsMember2022-05-012023-04-290000891024pdco:ConsumableAndPrintedProductsMember2021-04-252022-04-300000891024us-gaap:EquipmentMember2023-04-302024-04-270000891024us-gaap:EquipmentMember2022-05-012023-04-290000891024us-gaap:EquipmentMember2021-04-252022-04-300000891024pdco:ValueAddedServicesAndOtherMember2023-04-302024-04-270000891024pdco:ValueAddedServicesAndOtherMember2022-05-012023-04-290000891024pdco:ValueAddedServicesAndOtherMember2021-04-252022-04-300000891024pdco:ConsumableAndPrintedProductsMemberpdco:DentalSupplyMember2023-04-302024-04-270000891024pdco:ConsumableAndPrintedProductsMemberpdco:DentalSupplyMember2022-05-012023-04-290000891024pdco:ConsumableAndPrintedProductsMemberpdco:DentalSupplyMember2021-04-252022-04-300000891024pdco:DentalSupplyMemberus-gaap:EquipmentMember2023-04-302024-04-270000891024pdco:DentalSupplyMemberus-gaap:EquipmentMember2022-05-012023-04-290000891024pdco:DentalSupplyMemberus-gaap:EquipmentMember2021-04-252022-04-300000891024pdco:DentalSupplyMemberpdco:ValueAddedServicesAndOtherMember2023-04-302024-04-270000891024pdco:DentalSupplyMemberpdco:ValueAddedServicesAndOtherMember2022-05-012023-04-290000891024pdco:DentalSupplyMemberpdco:ValueAddedServicesAndOtherMember2021-04-252022-04-300000891024pdco:ConsumableAndPrintedProductsMemberpdco:AnimalHealthSegmentMember2023-04-302024-04-270000891024pdco:ConsumableAndPrintedProductsMemberpdco:AnimalHealthSegmentMember2022-05-012023-04-290000891024pdco:ConsumableAndPrintedProductsMemberpdco:AnimalHealthSegmentMember2021-04-252022-04-300000891024pdco:AnimalHealthSegmentMemberus-gaap:EquipmentMember2023-04-302024-04-270000891024pdco:AnimalHealthSegmentMemberus-gaap:EquipmentMember2022-05-012023-04-290000891024pdco:AnimalHealthSegmentMemberus-gaap:EquipmentMember2021-04-252022-04-300000891024pdco:AnimalHealthSegmentMemberpdco:ValueAddedServicesAndOtherMember2023-04-302024-04-270000891024pdco:AnimalHealthSegmentMemberpdco:ValueAddedServicesAndOtherMember2022-05-012023-04-290000891024pdco:AnimalHealthSegmentMemberpdco:ValueAddedServicesAndOtherMember2021-04-252022-04-300000891024us-gaap:CorporateMemberpdco:ValueAddedServicesAndOtherMember2023-04-302024-04-270000891024us-gaap:CorporateMemberpdco:ValueAddedServicesAndOtherMember2022-05-012023-04-290000891024us-gaap:CorporateMemberpdco:ValueAddedServicesAndOtherMember2021-04-252022-04-300000891024country:US2024-04-270000891024country:US2023-04-290000891024country:GB2024-04-270000891024country:GB2023-04-290000891024country:CA2024-04-270000891024country:CA2023-04-290000891024pdco:DentalSupplyMember2024-04-270000891024pdco:DentalSupplyMember2023-04-290000891024pdco:AnimalHealthSegmentMember2024-04-270000891024pdco:AnimalHealthSegmentMember2023-04-290000891024us-gaap:CorporateMember2024-04-270000891024us-gaap:CorporateMember2023-04-2900008910242023-04-302023-07-2900008910242023-07-302023-10-2800008910242023-10-292024-01-2700008910242024-01-282024-04-2700008910242022-05-012022-07-3000008910242022-07-312022-10-2900008910242022-10-302023-01-2800008910242023-01-292023-04-2900008910242021-04-252021-07-3100008910242021-08-012021-10-3000008910242021-10-312022-01-2900008910242022-01-302022-04-3000008910242024-03-110000891024pdco:A2015OmnibusIncentivePlanMember2015-09-300000891024pdco:EquityIncentivePlanMember2024-04-270000891024pdco:PriorEquityIncentivePlansMember2024-04-270000891024pdco:StockOptionsMember2023-04-302024-04-270000891024pdco:DirectorAndEmployeeStockOptionPlansMember2023-04-302024-04-270000891024pdco:DirectorAndEmployeeStockOptionPlansMember2022-05-012023-04-290000891024pdco:DirectorAndEmployeeStockOptionPlansMember2021-04-252022-04-300000891024pdco:RestrictedStockAndRestrictedStockUnitsMember2023-04-302024-04-270000891024us-gaap:RestrictedStockMember2023-04-302024-04-270000891024pdco:RestrictedStockAndRestrictedStockUnitsMember2022-05-012023-04-290000891024pdco:RestrictedStockAndRestrictedStockUnitsMember2021-04-252022-04-300000891024us-gaap:RestrictedStockMember2023-04-290000891024us-gaap:RestrictedStockMember2024-04-270000891024us-gaap:RestrictedStockUnitsRSUMember2023-04-290000891024us-gaap:RestrictedStockUnitsRSUMember2023-04-302024-04-270000891024us-gaap:RestrictedStockUnitsRSUMember2024-04-270000891024pdco:TotalShareholderReturnMemberus-gaap:PerformanceSharesMember2023-04-302024-04-270000891024pdco:TotalShareholderReturnMemberus-gaap:PerformanceSharesMember2022-05-012023-04-290000891024pdco:TotalShareholderReturnMemberus-gaap:PerformanceSharesMember2021-04-252022-04-300000891024us-gaap:PerformanceSharesMember2023-04-290000891024us-gaap:PerformanceSharesMember2023-04-302024-04-270000891024us-gaap:PerformanceSharesMember2024-04-270000891024pdco:EmployeeStockPurchasePlanMember2024-04-270000891024pdco:EmployeeStockPurchasePlanMember2023-04-302024-04-270000891024pdco:EmployeeStockPurchasePlanMember2022-05-012023-04-290000891024pdco:EmployeeStockPurchasePlanMember2021-04-252022-04-300000891024us-gaap:AccumulatedNetGainLossFromDesignatedOrQualifyingCashFlowHedgesMember2023-04-290000891024us-gaap:AccumulatedTranslationAdjustmentMember2023-04-290000891024us-gaap:AccumulatedNetGainLossFromDesignatedOrQualifyingCashFlowHedgesMember2023-04-302024-04-270000891024us-gaap:AccumulatedTranslationAdjustmentMember2023-04-302024-04-270000891024us-gaap:AccumulatedNetGainLossFromDesignatedOrQualifyingCashFlowHedgesMember2024-04-270000891024us-gaap:AccumulatedTranslationAdjustmentMember2024-04-270000891024pdco:DonaldJ.ZurbayMember2024-01-282024-04-270000891024pdco:DonaldJ.ZurbayPerformanceUnitsVestedApril242021Memberpdco:DonaldJ.ZurbayMember2024-04-270000891024pdco:DonaldJ.ZurbayRestrictedStockUnitsVestedJune292019Memberpdco:DonaldJ.ZurbayMember2024-04-270000891024pdco:DonaldJ.ZurbayRestrictedStockUnitsVestedJune292020Memberpdco:DonaldJ.ZurbayMember2024-04-270000891024pdco:DonaldJ.ZurbayMemberpdco:DonaldJ.ZurbayRestrictedStockUnitsVestedJuly12019Member2024-04-270000891024pdco:SECSchedule1209AllowanceForDoubtfulAccountsCreditLossMember2023-04-290000891024pdco:SECSchedule1209AllowanceForDoubtfulAccountsCreditLossMember2023-04-302024-04-270000891024pdco:SECSchedule1209AllowanceForDoubtfulAccountsCreditLossMember2024-04-270000891024pdco:SECSchedule1209SalesReturnsAndAllowancesCreditLossMember2023-04-290000891024pdco:SECSchedule1209SalesReturnsAndAllowancesCreditLossMember2023-04-302024-04-270000891024pdco:SECSchedule1209SalesReturnsAndAllowancesCreditLossMember2024-04-270000891024us-gaap:AllowanceForCreditLossMember2023-04-290000891024us-gaap:AllowanceForCreditLossMember2023-04-302024-04-270000891024us-gaap:AllowanceForCreditLossMember2024-04-270000891024pdco:LastInFirstOutInventoryAdjustmentMember2023-04-290000891024pdco:LastInFirstOutInventoryAdjustmentMember2023-04-302024-04-270000891024pdco:LastInFirstOutInventoryAdjustmentMember2024-04-270000891024pdco:InventoryObsolescenceReserveMember2023-04-290000891024pdco:InventoryObsolescenceReserveMember2023-04-302024-04-270000891024pdco:InventoryObsolescenceReserveMember2024-04-270000891024us-gaap:InventoryValuationReserveMember2023-04-290000891024us-gaap:InventoryValuationReserveMember2023-04-302024-04-270000891024us-gaap:InventoryValuationReserveMember2024-04-270000891024pdco:SECSchedule1209AllowanceForDoubtfulAccountsCreditLossMember2022-04-300000891024pdco:SECSchedule1209AllowanceForDoubtfulAccountsCreditLossMember2022-05-012023-04-290000891024pdco:SECSchedule1209SalesReturnsAndAllowancesCreditLossMember2022-04-300000891024pdco:SECSchedule1209SalesReturnsAndAllowancesCreditLossMember2022-05-012023-04-290000891024us-gaap:AllowanceForCreditLossMember2022-04-300000891024us-gaap:AllowanceForCreditLossMember2022-05-012023-04-290000891024pdco:LastInFirstOutInventoryAdjustmentMember2022-04-300000891024pdco:LastInFirstOutInventoryAdjustmentMember2022-05-012023-04-290000891024pdco:InventoryObsolescenceReserveMember2022-04-300000891024pdco:InventoryObsolescenceReserveMember2022-05-012023-04-290000891024us-gaap:InventoryValuationReserveMember2022-04-300000891024us-gaap:InventoryValuationReserveMember2022-05-012023-04-290000891024pdco:SECSchedule1209AllowanceForDoubtfulAccountsCreditLossMember2021-04-240000891024pdco:SECSchedule1209AllowanceForDoubtfulAccountsCreditLossMember2021-04-252022-04-300000891024pdco:SECSchedule1209SalesReturnsAndAllowancesCreditLossMember2021-04-240000891024pdco:SECSchedule1209SalesReturnsAndAllowancesCreditLossMember2021-04-252022-04-300000891024us-gaap:AllowanceForCreditLossMember2021-04-240000891024us-gaap:AllowanceForCreditLossMember2021-04-252022-04-300000891024pdco:LastInFirstOutInventoryAdjustmentMember2021-04-240000891024pdco:LastInFirstOutInventoryAdjustmentMember2021-04-252022-04-300000891024pdco:InventoryObsolescenceReserveMember2021-04-240000891024pdco:InventoryObsolescenceReserveMember2021-04-252022-04-300000891024us-gaap:InventoryValuationReserveMember2021-04-240000891024us-gaap:InventoryValuationReserveMember2021-04-252022-04-30
UNITED STATES
SECURITIES AND EXCHANGE COMMISSION
Washington, D.C. 20549
FORM 10-K | | | | | |
| ☒ | ANNUAL REPORT PURSUANT TO SECTION 13 OR 15(d) OF THE SECURITIES EXCHANGE ACT OF 1934 |
For the fiscal year ended April 27, 2024
OR | | | | | |
| ☐ | TRANSITION REPORT PURSUANT TO SECTION 13 OR 15(d) OF THE SECURITIES EXCHANGE ACT OF 1934 |
For the transition period from to
Commission File No. 0-20572
PATTERSON COMPANIES, INC.
(Exact name of registrant as specified in its charter) | | | | | | | | |
| Minnesota | | 41-0886515 |
(State or other jurisdiction of
incorporation or organization) | | (I.R.S. Employer
Identification No.) |
1031 Mendota Heights Road
St. Paul, Minnesota 55120
(Address of principal executive offices including Zip Code)
Registrant’s telephone number, including area code: (651) 686-1600
Securities registered pursuant to Section 12(b) of the Act: | | | | | | | | |
| Title of each class | Trading Symbol(s) | Name of exchange on which registered |
| Common Stock, par value $.01 | PDCO | NASDAQ Global Select Market |
Securities registered pursuant to Section 12(g) of the Act: None
Indicate by check mark if the registrant is a well-known seasoned issuer, as defined in Rule 405 of the Securities Act. Yes x No ¨
Indicate by check mark if the registrant is not required to file reports pursuant to Section 13 or Section 15(d) of the Act. Yes ¨ No x
Indicate by check mark whether the registrant (1) has filed all reports required to be filed by Section 13 or 15(d) of the Securities Exchange Act of 1934 during the preceding 12 months (or for such shorter period that the registrant was required to file such reports), and (2) has been subject to such filing requirements for the past 90 days. Yes x No ¨
Indicate by check mark whether the registrant has submitted electronically every Interactive Data File required to be submitted pursuant to Rule 405 of Regulation S-T (§232.405 of this chapter) during the preceding 12 months (or for such shorter period that the registrant was required to submit such files). Yes x No ¨
Indicate by check mark whether the registrant is a large accelerated filer, an accelerated filer, a non-accelerated filer, a smaller reporting company, or an emerging growth company. See the definitions of “large accelerated filer,” “accelerated filer,” “smaller reporting company,” and “emerging growth company” in Rule 12b-2 of the Exchange Act. | | | | | | | | | | | | | | | | | | | | | | | | | | | | | | | | |
| Large accelerated filer | | x | | Accelerated filer | | ☐ | | Non-accelerated filer | | ☐ |
| Smaller reporting company | | ☐ | | Emerging growth company | | ☐ | | | | |
If an emerging growth company, indicate by check mark if the registrant has elected not to use the extended transition period for complying with any new or revised financial accounting standards provided pursuant to Section 13(a) of the Exchange Act. ¨
Indicate by check mark whether the registrant has filed a report on and attestation to its management's assessment of the effectiveness of its internal control over financial reporting under Section 404(b) of the Sarbanes-Oxley Act (15 U.S.C. 7262(b)) by the registered public accounting firm that prepared or issued its audit report ☒
If securities are registered pursuant to Section 12(b) of the Act, indicate by check mark whether the financial statements of the registrant included in the filing reflect the correction of an error to previously issued financial statements. ☐
Indicate by check mark whether any of those error corrections are restatements that required a recovery analysis of incentive-based compensation received by any of the registrant’s executive officers during the relevant recovery period pursuant to §240.10D-1(b). ☐
Indicate by check mark whether the registrant is a shell company (as defined in Rule 12b-2 of the Exchange Act). Yes ☐ No x
The aggregate market value of voting common equity held by non-affiliates, computed by reference to the price at which the common equity was last sold as of the last business day of the registrant's most recently completed second fiscal quarter (October 28, 2023) was approximately $2,822,000,000 (For purposes of this calculation all of the registrant’s executive officers and directors are deemed affiliates.)
As of June 10, 2024, there were 87,760,000 shares of Common Stock of the registrant issued and outstanding.
Documents Incorporated By Reference
Portions of the registrant’s definitive proxy statement to be filed pursuant to Regulation 14A within 120 days after the registrant’s fiscal year-end of April 27, 2024 are incorporated by reference into Part III.
FORM 10-K INDEX | | | | | | | | | | | |
| | | Page |
| |
Item 1. | | | |
| Item 1A. | | | |
| Item 1B. | | | |
| Item 1C. | | | |
| Item 2. | | | |
| Item 3. | | | |
| Item 4. | | | |
| |
| Item 5. | | | |
| Item 6. | | | |
| Item 7. | | | |
| Item 7A. | | | |
| Item 8. | | | |
| Item 9. | | | |
| Item 9A. | | | |
| Item 9B. | | | |
| Item 9C. | | | |
| |
| Item 10. | | | |
| Item 11. | | | |
| Item 12. | | | |
| Item 13. | | | |
| Item 14. | | | |
| |
| Item 15. | | | |
| Item 16. | | | |
| |
| |
PART I
Item 1. BUSINESS
Forward-Looking Statements
The U.S. Private Securities Litigation Reform Act of 1995 provides a “safe harbor” for forward-looking statements to encourage companies to provide prospective information, so long as those statements are identified as forward-looking and are accompanied by meaningful cautionary statements identifying important factors that could cause actual results to differ materially from those disclosed in the statement. Certain information of a non-historical nature contained in Items 1, 2, 3 and 7 of this Form 10-K includes “forward-looking statements” within the meaning of the safe harbor provisions of the U.S. Private Securities Litigation Reform Act of 1995, including statements regarding future financial performance, and the objectives and expectations of management. Forward-looking statements often include words such as “believes,” “expects,” “anticipates,” “estimates,” “intends,” “plans,” “seeks” or words of similar meaning, or future or conditional verbs, such as “will,” “should,” “could” or “may.” Forward-looking statements are neither historical facts nor assurances of future performance. Instead, such statements, including, but not limited to, our statements regarding business strategy, growth strategy, competitive strengths, productivity and profitability enhancement, competition, new product and service introductions and liquidity and capital resources, are based only on our current beliefs, expectations and assumptions regarding the future of our business, future plans and strategies, projections, anticipated events and trends, the economy and other future conditions, as well as on assumptions made by and information currently available to management, and involve various risks and uncertainties, some of which are beyond our control.
Because forward-looking statements relate to the future, they are subject to inherent uncertainties, risks and changes in circumstances that are difficult to predict and many of which are outside of our control. Our actual results and financial condition may differ materially from those indicated in the forward-looking statements. Therefore, you should not place undue reliance on any of these forward-looking statements. Any number of factors could affect our actual results and cause such results to differ materially from those contemplated by any forward-looking statements. Reference is made to “Risk Factors” in Item 1A and “Management’s Discussion and Analysis of Financial Condition and Results of Operations” in Item 7 of this Form 10-K, for a discussion of certain factors that could cause actual operating results to differ materially from those expressed in any forward-looking statements. In light of these risks and uncertainties, there can be no assurance that the forward-looking information will in fact prove to be accurate. The order in which these factors appear should not be construed to indicate their relative importance or priority. We caution that these factors may not be exhaustive, accordingly, any forward-looking statements contained herein should not be relied upon as a prediction of actual results.
You should carefully consider these and other relevant factors and information which may be contained in this Form 10-K and in our other filings with the U.S. Securities and Exchange Commission, or SEC, when reviewing any forward-looking statement. Investors should understand it is impossible to predict or identify all such factors or risks. As such, you should not consider the risks identified in our SEC filings to be a complete discussion of all potential risks or uncertainties.
Any forward-looking statement made in this Form 10-K is based only on information currently available to us and speaks only as of the date on which it is made. We do not undertake any obligation to release publicly any revisions to any forward-looking statements whether written or oral, that may be made from time to time, whether as a result of new information, future developments or otherwise.
General
Patterson Companies, Inc. is a value-added specialty distributor serving the U.S. and Canadian dental supply markets and the U.S., Canadian and U.K. animal health supply markets. Patterson operates through its two strategic business units, Patterson Dental and Patterson Animal Health, offering similar products and services to different customer bases. Each business has a strong competitive position, serves a highly fragmented market that offers consolidation opportunities and offers relatively low-cost consumable supplies, which makes our value-added business proposition highly attractive to our customers. We believe that we have a strong brand identity as a value-added, full-service distributor with broad product and service offerings, having begun distributing dental supplies in 1877.
Business Overview
The following table sets forth consolidated net sales (in millions) by segment. | | | | | | | | | | | | | | | | | |
| Fiscal Year Ended |
| April 27, 2024 | | April 29, 2023 | | April 30, 2022 |
| Dental | $ | 2,489 | | | $ | 2,492 | | | $ | 2,516 | |
| Animal Health | 4,067 | | | 3,965 | | | 3,983 | |
| Corporate | 12 | | | 14 | | | — | |
| Consolidated net sales | $ | 6,568 | | | $ | 6,471 | | | $ | 6,499 | |
Our strategically located fulfillment centers enable us to better serve our customers and increase our operating efficiency. This infrastructure, together with broad product and service offerings at competitive prices, and a strong commitment to customer service, enables us to be a single source of supply for our customers’ needs. Our infrastructure also allows us to provide convenient ordering and rapid, accurate and complete order fulfillment.
Electronic commerce solutions have become an integral part of dental and animal health supply and distribution relationships. Our distribution business is characterized by rapid technological developments and intense competition. The continuing advancement of online commerce requires us to cost-effectively adapt to changing technologies, to enhance existing services and to develop and introduce a variety of new services to address the changing demands of consumers and our customers on a timely basis, particularly in response to competitive offerings. We believe that our tradition of reliable service, our name recognition and large customer base built on solid customer relationships, position us well to participate in this significant aspect of the distribution business. We continue to explore methods to improve and expand our Internet presence and capabilities, including our online commerce offerings and our use of various social media outlets.
Patterson became publicly traded in 1992 and is a corporation organized under the laws of the state of Minnesota. We are headquartered in St. Paul, Minnesota. Our principal executive offices are located at 1031 Mendota Heights Road, St. Paul, Minnesota 55120, and our telephone number is (651) 686-1600. Unless the context specifically requires otherwise, the terms the “Company,” “Patterson,” “we,” “us” and “our” mean Patterson Companies, Inc., a Minnesota corporation, and its consolidated subsidiaries.
The Specialty Distribution Markets We Serve
We provide manufacturers with cost effective logistics and high-caliber sales professionals to access a geographically diverse customer base, which is critical to the supply chain for the markets we serve. We provide our customers with an array of value-added services, a dedicated and highly skilled sales team, and a broad selection of products through a single channel, thereby helping them efficiently manage their ordering process. Due in part to the inability of our customers to store and manage large quantities of supplies at their locations, the distribution of supplies and small equipment has been characterized by frequent, small-quantity orders, and a need for rapid, reliable and substantially-complete order fulfillment. Supplies and small equipment are generally purchased from more than one distributor, with one generally serving as the primary supplier.
We believe that consolidation within the industry will continue as distributors, particularly those with limited financial, operating and marketing resources, seek to combine with larger companies that can provide growth opportunities. This consolidation also may continue to result in distributors seeking to acquire companies that can enhance their current product and service offerings or provide opportunities to serve a broader customer base.
Dental Supply Market
The dental supply market we serve consists of geographically dispersed and highly fragmented dental practices. Customers range in size from sole practitioners to large group practices, often called Dental Service Organizations ("DSO's"). According to the American Dental Association and the Canadian Dental Association, there are approximately 202,000 dentists practicing in the U.S. and 25,000 dentists practicing in Canada. We believe the average dental practitioner purchases supplies from more than one supplier.
We believe the North American dental supply market continues to experience growth due to an increasing population, an aging population, advances in dentistry, demand for general, preventive and specialty services, increasing demand for new technologies that allow dentists to increase productivity, demand for infection control products, and insurance coverage by dental plans.
We support dental professionals through the many stock keeping units (“SKUs”) that we offer, as well as through important value-added services, including equipment and technology installation and service, practice management software, electronic claims processing, financial services, and continuing education, all designed to help make a dental practice more efficient.
Animal Health Supply Market
The animal health supply market is a mix of production animal supply, which primarily serves food producing animals, consisting of beef and dairy cattle, swine and poultry and other species such as sheep and goats, and companion animal supply, which serves pets, primarily dogs, cats and horses. Similar to the dental supply market, the animal health supply market is highly fragmented and diverse. Our production animal customers include large animal veterinarians, beef producers (cow/calf, stocker and feedlots), dairy producers, poultry producers, swine producers and retail customers. Our companion animal customers are primarily small animal and equine veterinary clinics, including independently owned, corporates and groups. According to the American Veterinary Medical Association, there are more than 70,000 veterinarians in private practice in the U.S. and Canada. Furthermore, there are approximately 20,000 veterinarians in the U.K. practicing in veterinary outlets; however, we believe there has been a shift in the U.K. market toward consolidation of veterinary practices. National Veterinary Services Limited, is the market leader in the U.K. veterinary market, with the highest percentage of buying groups and corporations as customers compared to its competitors, and the highest share position in that country overall.
The global animal health supply market continues to experience growth, and we believe that trend will continue for the foreseeable future. We support our animal health customers through the distribution of biologicals, pharmaceuticals, parasiticides, supplies, including our own private label brands, and equipment. We also supply a full portfolio of technologies, software, services and solutions to all segments and channels of our broad customer base. We actively engage in the development, sale and distribution of inventory, accounting and health management systems to enhance customer operating efficiencies and assist our customers in managing risk. Within the companion animal supply market, we anticipate increasing demand for veterinary services due to the following factors: the increasing number of households with companion animals and increased expenditures on animal health and preventative care, an aging pet population, advancements in animal health products and diagnostic testing, and extensive marketing programs sponsored by companion animal nutrition and pharmaceutical companies.
We anticipate the macroeconomic trend of global population growth and corresponding demand for protein will be favorable to the production animal segment in the future. Likewise, the rise in disposable income, especially in developing countries will be a key driver of future growth. However; product sales in the production animal supply market are more likely to be impacted by volatility in the market such as commodity prices, changes in weather patterns, and trends in the general economy. Many factors can influence how long cattle will graze and consequently the number of days an animal is on feed during a finishing phase. Supply and demand dynamics and economic trends can shift the number of animals treated, the timing of when animals are treated, to what extent they are treated and with which products they are treated. Historically, sales in this market have been largely driven by spending on animal health products to improve productivity, weight gain and disease prevention, as well as a growing focus on health and wellness of the animals, safety, and efficiency in livestock production.
Competition
The distribution industry is highly competitive. It consists principally of national, regional and local full-service distributors. Substantially all of the products we sell are available to customers from a number of suppliers. In addition, our competitors could obtain exclusive rights from manufacturers to market particular products. Some manufacturers also sell directly to end-users, thereby eliminating or reducing our role and that of other distributors.
We compete with other distributors, as well as several manufacturers, of dental and animal health products, on the basis of price, breadth of product line, customer service and value-added products and services. To differentiate ourselves from our competition we deploy a strategy of premium customer service with multiple value-added components, a highly qualified and motivated sales force, highly-trained and experienced service technicians, an extensive breadth and mix of products and services, technology solutions allowing customers to easily access our inventory, accurate and timely delivery of product, strategic location of sales offices and fulfillment centers, and competitive pricing.
In the U.S. and Canadian dental supply market, we compete against Henry Schein, Inc., Benco Dental Supply Company, Burkhart Dental Supply and hundreds of distributors that operate on a regional or local level, or online. Also, as noted above, some manufacturers sell directly to end users. With regard to our dental practice
management software, we compete against numerous offerings, including those from Henry Schein, Inc. and Carestream Dental.
In the U.S. and Canadian animal health supply market, our primary competitors are Cencora/MWI Animal Health and Covetrus, Inc. We also compete against a number of regional and local animal health distributors, some manufacturers that sell direct to end users and several alternative channel market providers that sell through digital platforms to production animal operators, animal health product retailers and veterinarians. Additionally, major U.S. online e-commerce retailers such as Amazon and Chewy.com have become licensed as veterinary mail order pharmacies, which enables them to offer pharmacy products directly to consumers in all 50 U.S. states. In the animal health practice management market, our primary competitors are IDEXX Laboratories, Inc. and Covetrus, Inc. We face significant competition in the animal health supply market in the U.K., where we compete on the basis of price and customer service with several large competitors, including Covetrus, Inc. and Cencora/MWI Animal Health. We also compete directly with pharmaceutical companies who sell certain products or services directly to the customer.
Successful distributors are increasingly providing value-added services in addition to the products they have traditionally provided. We believe that to remain competitive we must continue to add value to the distribution channel, while removing unnecessary costs associated with product movement. Significant price reductions by our competitors could result in competitive harm. Any of these competitive pressures may materially adversely affect our operating results.
Competitive Strengths
We have more than 140 years of experience in distributing products resulting in strong awareness of the Patterson brand. Although further information regarding these competitive strengths is set forth below in the discussion of our two strategic business units, our competitive strengths include:
•Broad product and service offerings at competitive prices. We sell approximately 200,000 SKUs to our customers, including many proprietary branded products. We believe that our proprietary branded products and our competitive pricing strategy have generated a loyal customer base that is confident in our brands. Our product offerings include consumables, equipment, software and various technologies. Our value-added services include practice management software, office design, equipment installation and maintenance, and financing.
•Focus on customer relationships and exceptional customer service. Our sales and marketing efforts are designed to establish and solidify customer relationships through personal visits by field sales representatives, interaction via phone with sales representatives, web-based activities including e-commerce and frequent direct marketing, emphasizing our broad product lines, competitive prices and ease of order placement. We focus on providing our customers with exceptional order fulfillment and a streamlined ordering process.
•Cost-effective purchasing and efficient distribution. We believe that cost-effective purchasing is a key element to maintaining and enhancing our position as a competitive-pricing provider of dental and animal health products. We strive to maintain optimal inventory levels to satisfy customer demand for prompt and complete order fulfillment through our distribution of products from strategically located fulfillment centers.
Business Strategy
Our objective is to continue to expand as a leading value-added distributor of dental and animal health products and services. To accomplish this, we will apply our competitive strengths in executing the following strategies:
•Emphasizing our differentiated, value-added, full-service capabilities. We are positioned to meet virtually all of the needs of dental practitioners, veterinarians, production animal operators and animal health product retailers by providing a broad range of consumable supplies, technology, equipment, software and value-added services. We believe our knowledgeable sales representatives can create customer intimacy and loyalty by providing an informational, consultative approach to our customers, linking them to the industries we serve. Our value-added strategy is further supported by our equipment specialists who offer consultation on design, equipment requirements and financing; our service technicians who perform equipment installation, maintenance and repair services; our business development professionals who provide business tools and educational programs to our customers; and our technology advisors who provide guidance on integrating technology solutions.
•Using technology to enhance customer service. As part of our commitment to providing superior customer service, we offer our customers easy order placement. Although we offer computerized order entry systems that we believe help establish relationships with new customers and increase loyalty among existing customers, predominant platforms for ordering today include www.pattersondental.com, www.pattersonvet.com and www.animalhealthinternational.com. The use of these methods of ordering enables our sales representatives to spend more time with existing and prospective customers. Our Internet environment includes order entry, customer support for digital and our proprietary products, customer-loyalty program reports and services, and access to articles and manufacturers’ product information. We also provide real-time customer and sales information to our sales force, managers and vendors via the Internet. In addition, the Patterson Technology Center (“PTC”) differentiates Patterson from our competition by providing deep and thorough expertise in practice management software and other advanced equipment and technology clinical solutions. In addition to trouble-shooting through the PTC’s support center, customers can access various service capabilities offered by the PTC, including electronic claims and statement processing and system back-up capabilities.
•Continuing to improve operating efficiencies. We continue to implement programs designed to improve our operating efficiencies and allow for continued sales growth. This strategy includes our continuing investment in management information systems and consolidation and leveraging of fulfillment centers and sales branches between our operating segments. In addition, we have established shared sales branch offices in several locations.
•Growing through internal expansion and acquisitions. We intend to continue to grow by hiring sales representatives, hiring and training sales professionals, opening additional locations as needed, and acquiring other companies in order to enter new, or more deeply penetrate existing, markets, gain access to additional product lines, and expand our customer base. We believe both our operating segments are well positioned to take advantage of expected continued consolidation in our markets.
Dental Segment - Products, Services and Sources of Supply
Patterson Dental, one of the two largest distributors of dental products in North America, has operations in the U.S. and Canada. As a full-service, value-added supplier to over 100,000 dental practices, dental laboratories, educational institutions, and community health centers, Patterson Dental provides consumable products (including infection control, restorative materials, and instruments); basic and advanced technology and dental equipment; and innovative practice optimization solutions, including practice management software, e-commerce, revenue cycle management, patient engagement solutions, and clinical and patient education. Patterson Dental sells approximately 100,000 SKUs, of which approximately 3,500 are private-label products sold under the Patterson brand. Patterson Dental also offers customers a range of related services including software and design services, maintenance and repair, and equipment financing. Net sales and operating income were $2.5 billion and $210 million in fiscal 2024, respectively.
The following table sets forth the percentage of total sales by the principal categories of products and services offered to our dental segment customers:
| | | | | | | | | | | | | | | | | |
| Fiscal Year Ended |
| April 27, 2024 | | April 29, 2023 | | April 30, 2022 |
| Consumable | 57 | % | | 55 | % | | 57 | % |
| Equipment | 31 | | | 33 | | | 32 | |
| Value-added services and other | 12 | | | 12 | | | 11 | |
| 100 | % | | 100 | % | | 100 | % |
Patterson Dental obtains products from hundreds of vendors, most of which are non-exclusive. While there is generally more than one source of supply for most of the categories of products we sell, the concentration of business with key suppliers is considerable, as consolidation has increased among manufacturers. In fiscal 2024, 2023 and 2022, Patterson Dental's top ten supply vendors accounted for approximately 60%, 58% and 56% of the total cost of sales, respectively. The top vendor accounted for 22%, 24% and 24% of the total cost of sales in fiscal 2024, 2023 and 2022, respectively.
Animal Health Segment - Products, Services and Sources of Supply
Patterson Animal Health is a leading distributor of animal health products in the U.S., Canada and the U.K. We sell approximately 100,000 SKUs, of which approximately 2,000 are private-label. Products are sourced from over 2,000 manufacturers to over 50,000 customers in the highly fragmented animal health supply market. Products we distribute include pharmaceuticals, vaccines, parasiticides, biologicals, diagnostics, prescription and non-prescription diets, nutritionals, consumable supplies and equipment. We offer a private label portfolio of products to veterinarians, producers, and retailers through our Aspen, First Companion and Patterson Veterinary brands. We also provide a range of value-added services to our customers. Within our companion animal supply market, our principal customers are companion-pet and equine veterinarians, veterinary clinics, public and private institutions, and shelters. In our production animal supply market, our principal customers are large animal veterinarians, production animal operators and animal health product retailers. Consumer demand for alternative means of sourcing product through digital platforms is an evolving dynamic in our industry. We provide home delivery solutions to allow us to evolve with the market. Net sales and operating income were $4.1 billion and $139 million in fiscal 2024, respectively.
The following table sets forth the percentage of total sales by the principal categories of products and services offered to our animal health segment customers:
| | | | | | | | | | | | | | | | | |
| Fiscal Year Ended |
| April 27, 2024 | | April 29, 2023 | | April 30, 2022 |
| Consumable | 95 | % | | 96 | % | | 96 | % |
| Equipment | 3 | | | 3 | | | 3 | |
| Value-added services and other | 2 | | | 1 | | | 1 | |
| 100 | % | | 100 | % | | 100 | % |
Patterson Animal Health obtains products from over 2,000 vendors globally. While Patterson Animal Health makes purchases from many vendors and there is generally more than one source of supply for most of the categories of products, the concentration of business with key vendors is considerable, as consolidation has increased among manufacturers. In fiscal 2024, 2023 and 2022, Patterson Animal Health’s top 10 manufacturers comprised approximately 66%, 66% and 66% of the total cost of sales, respectively, and the single largest supplier comprised approximately 24%, 24% and 23% in of the total cost of sales 2024, 2023 and 2022, respectively.
Sales, Marketing and Distribution
During fiscal 2024, we sold products or services to over 100,000 customers who made one or more purchases during the year. Our customers include dentists, laboratories, institutions, other healthcare professionals, veterinarians, other animal health professionals, production animal operators and animal health product retailers. No single customer accounted for more than 10% of sales during fiscal 2024, and we are not dependent on any single customer or geographic group of customers.
We have offices throughout the U.S. and Canada so that we can provide a presence in the market and decision-making near the customer. Patterson Animal Health also has a central office in the U.K. Our offices, or sales branches, are staffed with a complete complement of our capabilities, including sales, customer service and technical service personnel, as well as a local manager who has decision-making authority with regard to customer-related transactions and issues.
A primary component of our value-added approach is our professional sales and support organization. Due to the highly-fragmented nature of the markets we serve, we believe that our unique combination of field-based and call-center sales and support teams is critical to reaching potential customers and providing a differentiated customer experience. Our sales representatives play an indispensable and critical role in managing a practice’s supply chain and in introducing new products and technologies.
In the U.S. and Canada, customer service representatives in call centers work in tandem with our sales representatives, providing a dual coverage approach for individual customers. In addition to processing orders, customer service representatives are responsible for assisting customers with ordering, informing customers of monthly promotions, and responding to general inquiries. In the U.K., our customer service team is primarily responsible for handling customer inquiries and resolving issues.
To assist our customers with their purchasing decisions, we provide a multi-touchpoint shopping experience. From print to digital, this seamless experience is inclusive of products and services information. Patterson offers online and in-print showcases of our expansive merchandise and equipment offerings, including digital imaging and computer-aided design and computer-aided manufacturing ("CAD/CAM") technologies, hand-held and similar instruments, sundries, office design, e-services, repair and support assistance, as well as financial services. We also promote select products and services through publications, including On Target and Advantage in the U.S. and Patterson Post in Canada in our Dental segment, and Insight in the U.S. and The Cube in the U.K. in our Animal Health segment. Additional direct marketing tools that we utilize include customer loyalty programs, social media, and participation in trade shows.
We believe that responsive delivery of quality supplies and equipment is key to customer satisfaction. We ship consumable supplies from our strategically located fulfillment centers in the U.S. and Canada. In the U.K., orders are accepted in a centralized fulfillment center and shipped nationwide to one of our depots located throughout the country at which pre-packed orders are sorted by route for delivery to customers. Orders for consumable supplies can be placed through our sales representatives, customer service representatives or electronically 24 hours a day, seven days a week. Rapid and accurate order fulfillment is another principal component of our value-added approach.
In order to assure the availability of our broad product lines for prompt delivery to customers, we must maintain sufficient inventories at our fulfillment centers. Purchasing of consumables and standard equipment is centralized, and our purchasing department uses a real-time perpetual inventory system to manage inventory levels. Our inventory consists mostly of consumable supply items and pharmaceutical products.
Impacts of COVID-19
The COVID-19 pandemic had a significant impact on our businesses in fiscal 2021 as we implemented cost reduction measures in response to closures and other steps taken by governmental authorities. In response, management adapted our business practices with respect to employee travel, employee work locations, and cancellation of physical participation in meetings, events and conferences. Management also took proactive steps with respect to our liquidity position. Within our Dental segment, supply chain disruptions and an increased demand for PPE initially resulted in back orders of PPE, causing substantial price increases. We had to prepay suppliers in order to obtain PPE for resale to our customers, and as manufacturing caught up to increased demand for PPE, prices dropped, impacting our margins and requiring us to write down certain inventory.
In our markets of the U.S., Canada, and the UK, restrictive measures have now been lifted and the World Health Organization declared an end to the COVID-19 pandemic. Concerns remain that our markets could see a resurgence of COVID-19 cases or the emergence of new wide-spread public health outbreaks, triggering additional impacts on our businesses. There is continued uncertainty around the duration and ultimate impact of COVID-19 and other global health concerns.
Refer to Part I, Item 1A, “Risk Factors,” and Part II, Item 7, “Management's Discussion and Analysis of Financial Condition and Results of Operations,” within this Annual Report for further information on the impacts to our business and results of operations, our dividends, liquidity and debt arrangements, and associated risks and uncertainties.
Geographic Information
For information on revenues and long-lived assets of our segments by geographic area, see Note 14 to the Consolidated Financial Statements.
Seasonality and Other Factors Affecting Our Business and Quarterly Results
Our business in general is not seasonal; however, there are some products that typically sell more often during the winter or summer season. In any given month, unusual weather patterns (e.g., unusually hot or cold weather) could impact the sales volumes of these products, either positively or negatively. In addition, we experience fluctuations in quarterly earnings. As a result, we may fail to meet or exceed the expectations of securities analysts and investors, which could cause our stock price to decline. Quarterly results may be materially adversely affected by a variety of factors, including:
•timing and amount of sales and marketing expenditures;
•timing of pricing changes offered by our suppliers;
•timing of the introduction of new products and services by our suppliers;
•changes in or availability of supplier contracts or rebate programs;
•supplier rebates based upon attaining certain growth goals;
•changes in the way suppliers introduce or deliver products to market;
•costs of developing new applications and services;
•our ability to correctly identify customer needs and preferences and predict future needs and preferences;
•uncertainties regarding potential significant breaches of data security or disruptions of our information technology systems;
•regulatory actions, or government regulation generally;
•loss of sales representatives;
•costs related to acquisitions and/or integrations of technologies or businesses;
•costs associated with our self-insured insurance programs;
•general market and economic conditions, as discussed in Item 1A: Risk Factors, including macro-economic conditions, increased fuel and energy costs, consumer confidence, as well as conditions specific to the supply and distribution industry and related industries;
•our success in establishing or maintaining business relationships;
•difficulties of manufacturers in developing and manufacturing products;
•product demand and availability, or product recalls by manufacturers;
•exposure to product liability and other claims in the event that the use of the products we sell results in injury;
•increases in shipping costs or service issues with our third-party shippers;
•fluctuations in the value of foreign currencies;
•goodwill impairment;
•changes in interest rates;
•restructuring costs;
•the adoption or repeal of legislation;
•changes in accounting principles; and
•litigation or regulatory judgments, fines, forfeitures, penalties, equitable remedies, expenses or settlements.
Governmental Regulation
We strive to be compliant with the applicable laws, regulations and guidance described below, and believe we have effective compliance programs and other controls in place to ensure substantial compliance. However, compliance is not guaranteed either now or in the future, as certain laws, regulations and guidance may be subject to varying and evolving interpretations that could affect our ability to comply, as well as future changes, additions and enforcement approaches, including political changes. Additionally, our policies and procedures may not always protect us from reckless or criminal acts committed by our employees or our agents. When we discover situations of non-compliance we seek to remedy them and bring the affected area back into compliance.
President Biden’s administration (the “Biden Administration”) has indicated that it will be more aggressive in its pursuit of alleged violations of law, and has revoked certain guidance that would have limited governmental use of informal agency guidance to pursue potential violations, and has stated that it is more prepared to pursue individuals for corporate law violations, including an aggressive approach to anti-corruption activities. Changes to applicable laws, regulations and guidance described below, as well as related administrative or judicial interpretations, may require us to update or revise our operations, services, marketing practices, and compliance programs and controls, and may impose additional and unforeseen costs on us, pose new or previously immaterial risks to us, or may otherwise have a material adverse effect on our business, results of operations and financial condition.
Federal, state and certain foreign governments have also increased enforcement activity in the health care sector, particularly in areas of fraud and abuse, anti-bribery and anti-corruption, controlled substances handling, medical device regulations and data privacy and security standards. Our businesses are generally subject to numerous laws and regulations that could impact our financial performance. Failure to comply with such laws or regulations could be punishable by criminal or civil sanctions, which could materially adversely affect our business.
Operating, Security and Licensure Standards
Our dental and animal health supply businesses involve the distribution, importation, exportation, marketing and sale of, and third party payment for, pharmaceuticals and medical devices, and in this regard, we are subject to extensive local, state, federal and foreign governmental laws and regulations applicable to the distribution of pharmaceuticals and medical devices.
U.S. Federal Agencies
Certain of our businesses are required to register for permits and/or licenses with, and comply with operating and security standards and regulations of, the U.S. Food and Drug Administration (“FDA”), the U.S. Department of Agriculture (“USDA”), the Environmental Protection Agency (“EPA”), the Food Safety Inspection Service (“FSIS”), the U.S. Drug Enforcement Administration (“DEA”), the Federal Trade Commission (“FTC”), the U.S. Department of Justice ("DOJ"), the Occupational Safety and Health Administration ("OSHA"), and various state boards of pharmacy, state health departments and/or comparable state agencies as well as comparable foreign agencies, and certain accrediting bodies depending on the type of operations and location of product distribution, manufacturing or sale. These businesses include those that distribute, manufacture and/or repackage prescription pharmaceuticals and/or medical devices and/or HCT/P products (as defined below), own pharmacy operations, or install, maintain or repair equipment.
FDA – the regulatory body that is responsible for the regulation of animal-health pharmaceuticals in the U.S. is the Center for Veterinary Medicine (“CVM”) housed within the FDA.
•Generally, all animal-health pharmaceuticals are subject to pre-market review and must be shown to be safe, effective, and produced by a consistent method of manufacture as defined under the Federal Food, Drug and Cosmetic Act, as amended (the “FDC Act”).
•If the drug is for food-producing animals, potential consequences for humans are also considered.
•Animal supplements generally are not required to obtain pre-market approval from the CVM, although they may be treated as food. Any substance that is added to, or is expected to become a component of, animal food must be used in accordance with food-additive regulations, unless it is generally recognized as safe, under the conditions of its intended use. Alternatively, the FDA may consider animal supplements to be drugs. The FDA has agreed to exercise enforcement discretion for such supplements if each such supplement meets certain conditions.
•Additionally, dental and medical devices we sell in the U.S. are generally classified by the FDA into a category that renders them subject to the same controls that apply to all medical devices, including regulations regarding alternation, misbranding, notification, record-keeping and good manufacturing practices.
USDA – the regulatory body in the U.S. for veterinary biologics, such as vaccines.
•The USDA’s Center for Veterinary Biologics is responsible for the regulation of animal-health vaccines, including immunotherapeutics. Marketing of imported veterinary biological products in the U.S. requires a U.S. Veterinary Biological Product Permit. Veterinary biologics are subject to pre-market review and must be shown to be pure, safe, potent, and efficacious, as defined under the Virus Serum Toxin Act. The USDA requires post-licensing monitoring of these products.
EPA – the main regulatory body in the U.S. for veterinary pesticides is the EPA.
•The EPA’s Office of Pesticide Programs is responsible for the regulation of pesticide products applied to animals.
•Animal-health pesticides are subject to pre-market review and must not cause “unreasonable adverse effects to man or the environment” as stated in the Federal Insecticide, Fungicide, and Rodenticide Act.
•Within the U.S., pesticide products that are approved by the EPA must also be approved by individual state pesticide authorities before distribution in that state. Post-approval monitoring of products is required, with reports provided to the EPA and some state regulatory agencies.
FSIS - the public health agency within the USDA.
•The FDA is authorized to determine the safety of substances (including “generally recognized as safe” substances, food additives and color additives), as well as prescribe their safe conditions of use. However, although the FDA has the responsibility for determining the safety of substances, the FSIS still retains, under the tenets of the Federal Meat Inspection Act and the Poultry Products Inspection Act and their implementing regulations, the authority to determine whether new substances and new uses of previously approved substances are suitable for use in meat and poultry products.
DEA – under the Controlled Substances Act, distributors of controlled substances are required to obtain, and renew annually, registrations for their facilities from the DEA.
•Distributors are also subject to other statutory and regulatory requirements relating to the storage, sale, marketing, handling, and distribution of such drugs, in accordance with the Controlled Substances Act and its implementing regulations, and these requirements have been subject to heightened enforcement activity in recent times.
•Distributors are subject to inspection by the DEA.
FTC – the FTC regulates advertising pursuant to its authority to prevent “unfair or deceptive acts or practices in or affecting commerce” under the Federal Trade Commission Act.
•Advertising and promotion of animal-health products that are not subject to approval by the CVM may be challenged by the FTC, as well as by state attorneys general and by consumers under state consumer protection laws.
•The FTC will find an advertisement to be deceptive if it contains a representation or omission of fact that is likely to mislead consumers acting reasonably under the circumstances, the representation or omission is material, and if the advertiser does not possess and rely upon a reasonable basis, such as competent and reliable evidence, substantiating the claim.
•The FTC may address unfair or deceptive advertising practices through either an administrative adjudication or judicial enforcement action, including preliminary or permanent injunction.
•The FTC may also seek consumer redress from the advertiser in instances of dishonest or fraudulent conduct.
DOJ – the DOJ is the regulatory body tasked with the enforcement of federal law and administration of justice.
OSHA – OSHA, part of the U.S. Department of Labor, is the U.S. regulatory body responsible for ensuring safe and healthy working conditions for employees.
State Registrations – states may require registration of animal-drug distributors and wholesalers.
•Additional requirements may apply when the product is also a controlled substance. States work closely with the Association of American Feed Control Officials (“AAFCO”) in their regulation of animal food.
•AAFCO’s annual official publication contains model animal and pet-food labeling regulations that states may adopt.
•This publication is treated deferentially by the federal and state government agencies that regulate animal food. Many states require registration or licensing of animal-food distributors.
•States may also review and approve animal-food labels prior to sale of the product in their state.
•Our buildings are also subject to local state, county and city fire codes.
We are also subject to foreign trade controls administered by certain U.S. government agencies, including the Bureau of Industry and Security within the Commerce Department, Customs and Border Protection within the Department of homeland Security and the U.S. Department of the Treasury’s Office of Foreign Assets Control (OFAC).
The DEA, the FDA and state regulatory authorities have broad inspection and enforcement powers, including the ability to suspend or limit the distribution of products by our fulfillment centers, seize or order the recall of products and impose significant criminal, civil and administrative sanctions for violations of these laws and regulations.
Foreign regulations subject us to similar foreign enforcement powers. Furthermore, compliance with legal requirements has required and may in the future require us to delay product release, sale or distribution, or institute voluntary recalls of, or other corrective action with respect to, products we sell, each of which could result in regulatory and enforcement actions, financial losses and potential reputational harm. Our customers are also subject to significant federal, state, local and foreign governmental regulation, which may affect our interactions with customers, including the design and functionality of the products we distribute.
Agencies Outside the U.S.
Since the U.K. formally left the EU on January 31, 2020, the Veterinary Medicines Directorate (“VMD”) became the main regulatory body in the U.K. responsible for regulating and controlling veterinary pharmaceuticals. The U.K. and the EU reached a trade deal in December 2020, which went into effect in May 2021. The agreement includes regulatory and customs cooperation mechanisms, as well as provisions supporting open and fair competition. The Northern Ireland protocol, which is part of the trade deal, requires that VMD follow EU rules in Northern Ireland. Laws applying to the rest of the U.K. could now diverge but currently remain largely aligned.
Health Canada is the Canadian regulatory body responsible for national health policy. Distributors of medical devices are subject to Health Canada’s regulations.
U.S. Laws
Among the U.S. federal laws applicable to us are the Controlled Substances Act, the FDC Act, Section 361 of the Public Health Service Act, as well as laws regulating the billing of and reimbursement from government programs, such as Medicare and Medicaid, and from commercial payers. We are also subject to comparable foreign regulations.
The FDC Act, the Controlled Substances Act, their implementing regulations, and similar foreign laws generally regulate the introduction, manufacture, advertising, marketing and promotion, sampling, pricing and reimbursement, labeling, packaging, procurement, storage, handling, returning or recalling, reporting, and distribution of, and record keeping for, pharmaceuticals and medical devices shipped in interstate commerce, and states may similarly regulate such activities within the state. Furthermore, Section 361 of the Public Health Service Act, which provides authority to prevent the introduction, transmission, or spread of communicable diseases, serves as the legal basis for the FDA’s regulation of human cells, tissues and cellular and tissue-based products, also known as “HCT/P products.”
The federal Drug Quality and Security Act of 2013 brought about significant changes with respect to pharmaceutical supply chain requirements. Title II of this measure, known as the Drug Supply Chain Security Act (“DSCSA”), was enacted in November 2013 and had a planned “phase in” schedule over a period of 10 years, resulting in a national electronic, interoperable system to identify and trace certain prescription drugs as they are distributed in the U.S., that went into effect on November 27, 2023. Those DSCSA requirements that were scheduled to change on November 27, 2023, and include requiring trading partners to provide, receive and maintain documentation about products and ownership only “electronically” (and not via paper) are now subject to a one-year “stabilization period” announced by the FDA through two guidance documents in late August 2023. The FDA is permitting the stabilization period to accommodate an additional year, until November 27, 2024, to allow trading partners to implement, troubleshoot and mature their electronic (versus paper) interoperable systems, during which time the FDA does not intend to take action to enforce the requirements for the interoperable, electronic, package level product tracing. Additionally, the FDA announced that it does not intend to take action to enforce the portion of the FDC Act with respect to drug product that is introduced in a transaction into commerce by the product’s manufacturer or repackager before November 27, 2024, and for subsequent transactions of such product through the product’s expiry. The FDA states this stabilization period is intended to avoid disruption to the supply chain, and ensure continued patient access to drug products as trading partners move towards full implementation of the DSCSA’s enhanced drug security requirements. The law’s track and trace requirements applicable to manufacturers, wholesalers, third-party logistics providers (e.g., trading partners), repackagers and dispensers (e.g., pharmacies) of prescription drugs took effect in January 2015, and, as stated, continues to be implemented. The DSCSA product tracing requirements replace the former FDA drug pedigree requirements and pre-empt certain state requirements that are inconsistent with, more stringent than, or in addition to, the DSCSA requirements.
The DSCSA also establishes certain requirements for the licensing and operation of prescription drug wholesalers and third party logistics providers (“3PLs”), and includes the eventual creation of national wholesaler and 3PL licenses in cases where states do not license such entities. The DSCSA requires that wholesalers and 3PLs distribute drugs in accordance with certain standards regarding the recordkeeping, storage and handling of
prescription drugs. The DSCSA requires wholesalers and 3PLs to submit annual reports to the FDA, which include information regarding each state where the wholesaler or 3PL is licensed, the name and address of each facility and contact information. According to FDA guidance, states are pre-empted from imposing any licensing requirements that are inconsistent with, less stringent than, directly related to, or covered by the standards established by federal law in this area. Current state licensing requirements concerning wholesalers will remain in effect until the FDA issues new regulations as directed by the DSCSA. The FDA issued a proposed rule establishing wholesaler and 3PL national standards for licensing and other requirements in February 2022, but that rule has not yet been finalized.
The Food and Drug Administration Amendments Act of 2007 and the Food and Drug Administration Safety and Innovation Act of 2012 amended the FDC Act to require the FDA to promulgate regulations to implement a unique device identification (“UDI”) system for medical devices. The UDI rule phased in the implementation of the UDI regulations, generally beginning with the highest-risk devices (i.e., Class III medical devices) and ending with the lowest-risk devices. Most compliance dates were reached as of September 24, 2018, with a final set of requirements for low-risk devices being reached on September 24, 2022, which completed the phase in. However, in May 2021, the FDA issued an enforcement policy stating that it does not intend to object to the use of legacy identification numbers on device labels and packages for finished devices manufactured and labeled prior to September 24, 2023. The UDI regulations require “labelers” to include unique device identifiers (“UDIs”), with a content and format prescribed by the FDA and issued under a system operated by an FDA-accredited issuing agency, on the labels and packages of medical devices (including, but not limited to, certain software that qualifies as a medical device under FDA rules), and to directly mark certain devices with UDIs. The UDI regulations also require labelers to submit certain information concerning UDI-labeled devices to the FDA, much of which information is publicly available on an FDA database, the Global Unique Device Identification Database. On July 22, 2022, the FDA posted the final guidance regarding the Global Unique Device Identification Database called Unique Device Identification Policy Regarding Compliance Dates for Class I and Unclassified Devices, Direct Marketing, and Global Unique Device Identification Database Requirements for Certain Devices. The UDI regulations and subsequent FDA guidance regarding the UDI requirements provide for certain exceptions, alternatives and time extensions. For example, the UDI regulations include a general exception for Class I devices exempt from the Quality System Regulation (other than record-keeping and complaint files). Regulated labelers include entities such as device manufacturers, repackagers, reprocessors and relabelers that cause a device’s label to be applied or modified, with the intent that the device will be commercially distributed without any subsequent replacement or modification of the label, and include certain of our businesses. In addition, our animal health business is subject to the Pasteurized Milk Ordinance, which is a set of minimum standards established by the FDA for the regulation of the production, processing, and packaging of Grade A Milk.
As a distributor of controlled substances, we are required, under the Controlled Substances Act, to obtain and renew annually registrations for our facilities from the DEA permitting us to handle controlled substances. We are also subject to other statutory and regulatory requirements relating to the storage, sale, marketing, handling and distribution of such drugs, in accordance with the Controlled Substances Act and its implementing regulations, and these requirements have been subject to heightened enforcement activity in recent times. Non-controlled substances can also become subject to these controls. For example, law enforcement agencies are pressing for xylazine, which is an FDA-approved prescription veterinary tranquilizer found in certain analgesic products we distribute, to be listed as a federal controlled substance and several states have already done so, which measures are likely to increase our cost of distributing such products. There have also been increasing efforts by various levels of government globally to regulate the pharmaceutical distribution system in order to prevent the introduction of counterfeit, adulterated or misbranded pharmaceuticals into the distribution system.
In addition, Section 301 of the National Organ Transplant Act, and a number of comparable state laws, impose civil and/or criminal penalties for the transfer of human organs, as defined in the regulations, for valuable consideration, while generally permitting payments for the reasonable costs incurred in their procurement, processing, storage and distribution. We are also subject to foreign government regulation of such products.
Certain of our businesses are subject to various additional federal, state, local and foreign laws and regulations, including with respect to the sale, transportation, importation, storage, handling and disposal of hazardous or potentially hazardous substances; “forever chemicals” such as per- and polyfluoroalkyl substances; and safe working conditions. In addition, certain of our businesses must operate in compliance with a variety of burdensome and complex billing and record keeping requirements in order to substantiate claims for payment under federal, state and commercial healthcare reimbursement programs. In addition, the Toxic Substances Control Act (TSCA) is a law administered by the EPA through which the EPA evaluates potential risks from new and existing chemicals and acts to address any unreasonable risks chemicals may have on human health and the environment. The TSCA
applies to any business that manufactures, imports, processes, distributes, uses, or disposes of a chemical substance or mixture in commerce.
Proposition 65 (“Prop 65”), also known as the Safe Drinking Water and Toxic Enforcement Act of 1986, protects California’s drinking water sources from contamination by chemicals known to cause cancer, birth defects or other reproductive harm. Prop 65 requires businesses to inform Californians about exposures to such chemicals, which can be found in products purchased, in homes and workplaces, or released into the environment. Prop 65 also prohibits California businesses from knowingly discharging significant amounts of listed chemicals into sources of drinking water.
Certain of our businesses also maintain contracts with governmental agencies and are subject to certain regulatory requirements specific to government contractors.
The Animal Medicinal Drug Use Clarification Act of 1994 (“AMDUCA”) permits veterinarians to prescribe extralabel uses of certain approved new animal drugs and approved human drugs for animals under certain conditions. Extralabel use refers to the use of an approved drug in a manner that is not in accordance with approved label directions. The veterinarians to whom we distribute products generally are subject to the AMDUCA and its implementing regulations.
As disclosed in our prior periodic reports, our subsidiary Animal Health International was the subject of an investigation by the U.S. Attorney’s Office for the Western District of Virginia, which resulted in Animal Health International pleading guilty to a strict-liability misdemeanor offense in connection with its failure to comply with federal law relating to the sales of prescription animal health products, and a total criminal fine and forfeiture of $52.8 million. In addition, Animal Health International and Patterson entered into a non-prosecution agreement for other non-compliant licensing, dispensing, distribution and related sales processes disclosed during the investigation and committed to undertake additional compliance program enhancements and provide compliance certifications through our reporting for fiscal 2023. This matter may continue to divert management's attention and cause us to suffer reputational harm. We also may be subject to other fines or penalties, equitable remedies (including but not limited to the suspension, revocation or non-renewal of licenses) and litigation. The occurrence of any of these events could adversely affect our business, results of operations and financial condition.
Other Regulations
Veterinary compounding pharmacies must comply with state and federal laws that govern the relationship between pharmacies and referral sources. The U.S. Federal Anti-Kickback Statute (“AKS”) imposes criminal penalties against individuals and entities that pay or receive remuneration in return for referring an individual for service paid under a federal health care program. Veterinary compounding pharmacies have historically avoided scrutiny under the AKS because no federal programs are involved in veterinary compounding funding. However, most states have enacted statutes and regulations that mirror the AKS and, in some cases, are even broader than the AKS.
Various states have enacted business and insurance regulations prohibiting referral arrangements that result in the offer or acceptance of any rebate, refund, commission, discount or other consideration as compensation or inducement for referring patients, clients or customers. These regulations often encompass all health-care related professions, including pharmacies and veterinary practices.
Additionally, the promotion of regulated animal health products is controlled by regulations in many countries. These rules generally restrict advertising and promotion to those claims and uses that have been reviewed and endorsed by the applicable agency.
Our buildings are generally subject to the standards established by the National Fire Protection Association, a nonprofit organization established to maintain standards and codes for fire, electrical, and related building safety.
Antitrust and Consumer Protection
The U.S. federal government, most U.S. states and many foreign countries have antitrust laws that prohibit certain types of conduct deemed to be anti-competitive, as well as consumer protection laws that seek to protect consumers from improper business practices. At the U.S. federal level, the Federal Trade Commission oversees enforcement of these types of laws, and states have similar government agencies. Violations of antitrust or consumer protection laws may result in various sanctions, including criminal and civil penalties. Private plaintiffs also may bring, and have brought, civil lawsuits against us in the U.S. for alleged antitrust violations, including claims for treble damages. The Biden Administration has indicated increased antitrust enforcement and has been
more aggressive in enforcement actions, including investigations and challenging restrictive contractual terms that it believes harm workers and competition.
The U.K. Competition and Markets Authority is the principal competition regulator in the U.K. and promotes competitive business markets by addressing unfair competitive behavior.
Health Care Fraud
Certain of our businesses are subject to federal and state (and similar foreign) health care fraud and abuse, referral and reimbursement laws and regulations with respect to their operations. These laws and regulations govern different interactions, including but not limited to, those:
•prohibiting improper influence of or payments to healthcare professionals and government officials;
•setting out rules for when and how to engage healthcare professionals as vendors;
•requiring price reporting;
•requiring marketing of products within regulatory approval (i.e., on label);
•regulating the import and export of products;
•affecting the operation of our facilities and our distribution of products; and
•requiring disclosure of payments to healthcare professionals and entities.
Some of these laws, referred to as “false claims laws,” prohibit the submission or causing the submission of false or fraudulent claims for reimbursement to federal, state and other health care payers and programs. Other laws, referred to as “anti-kickback laws,” prohibit soliciting, offering, receiving or paying remuneration in order to induce the referral of a patient or ordering, purchasing, leasing or arranging for or recommending ordering, purchasing or leasing, of items or services that are paid for by federal, state and other health care payers and programs. Several states apply their false claims and anti-kickback laws to all payers, including goods and services paid for directly by consumers. Certain additional state and federal laws, such as the federal Physician Self-Referral Law, commonly known as the “Stark Law,” prohibit physicians and other health care professionals from referring a patient to an entity with which the physician (or family member) has a financial relationship, for the furnishing of certain designated health services (for example, durable medical equipment and medical supplies), unless an exception applies. Violations of anti-kickback laws or the Stark Law may be enforced as violations of the federal False Claims Act.
The fraud and abuse laws and regulations have been subject to heightened enforcement activity over the past few years, and significant enforcement activity has been the result of “relators,” who serve as whistleblowers by filing complaints in the name of the U.S. (and, if applicable, particular states) under applicable false claim laws. Under the federal False Claims Act, relators can be entitled to receive up to 30% of the total recoveries. Penalties under fraud and abuse laws may be severe, including treble damages and substantial civil penalties under the federal False Claims Act, as well as potential loss of licenses and the ability to participate in federal and state health care programs, criminal penalties, or imposition of a corporate integrity agreement or corporate compliance monitor which could have a material adverse effect on our business. Also, these measures may be interpreted or applied by a prosecutorial, regulatory or judicial authority in a manner that could require us to make changes in our operations or incur substantial defense and settlement expenses. Even unsuccessful challenges by regulatory authorities or private relators could result in reputational harm and the incurring of substantial costs. Most states have adopted similar state false claims laws, and these state laws have their own penalties which may be in addition to federal False Claims Act penalties, as well as other fraud and abuse laws. With respect to measures of this type, the U.S. government (among others) has expressed concerns about financial relationships between suppliers on the one hand and dentists and other healthcare professionals on the other. As a result, we regularly review and revise our marketing practices as necessary to facilitate compliance. While we believe that we are substantially compliant with applicable fraud and abuse laws and regulations, and have adequate compliance programs and controls in place to ensure substantial compliance, we cannot predict whether changes in applicable law, or interpretation of laws, or changes in our services or marketing practices in response to changes in applicable law or interpretation of laws, or failure to comply with applicable law, could have a material adverse effect on our business.
Affordable Care Act and Other Insurance Reform
The U.S. Patient Protection and Affordable Care Act, as amended by the Health Care and Education Reconciliation Act (as amended, the “ACA”) increased federal oversight of private health insurance plans and included a number of provisions designed to reduce Medicare expenditures and the cost of health care generally, to reduce fraud and abuse, and to provide access to increased health coverage. The ACA also materially expanded the number of individuals in the U.S. with health insurance. The ACA has faced frequent legal challenges, including litigation seeking to invalidate and Congressional action seeking to repeal some of or all of the law or the manner in which it has been implemented. In 2012, the U.S. Supreme Court, in upholding the constitutionality of the ACA and its individual mandate provision requiring that people buy health insurance or else face a penalty, simultaneously limited ACA provisions requiring Medicaid expansion, making such expansion a state-by-state decision. In addition, one of the major political parties in the U.S. remains committed to seeking the ACA's legislative repeal, but legislative efforts to do so have previously failed to pass both chambers of Congress. Under President Trump's administration, a number of administrative actions were taken to materially weaken the ACA, including, without limitation, by permitting the use of less robust plans with lower coverage and eliminating "premium support" for insurers providing policies under the ACA. The Tax Cuts and Jobs Act enacted in 2017 (the "Tax Act"), which contains a broad range of tax reform provisions that impact the individual and corporate tax rates, international tax provisions, income tax add back provisions and deductions, also effectively repealed the ACA's individual mandate by zeroing out the penalty for non-compliance. An ACA lawsuit decided by the federal Fifth Circuit Court of Appeals found the individual mandate to be unconstitutional, and returned the case to the District Court for the Northern District of Texas for consideration of whether the remainder of the ACA could survive the excision of the individual mandate. The Fifth Circuit's decision was appealed to the U.S. Supreme Court. The Supreme Court issued a decision on June 17, 2021. Without reaching the merits of the case, the Supreme Court held that the plaintiffs in the case did not have standing to challenge the ACA. Any outcomes of future cases that change the ACA, in addition to future legislation, regulation, guidance and/or executive orders that do the same, could have a significant impact on the U.S. healthcare industry. For instance, the American Rescue Plan Act of 2021 enhanced premium tax credits, which has resulted in an expansion of the number of people covered under the ACA. These changes were time-limited, with some enhancements in place for 2021 only and others available through the end of 2022. The continued uncertain status of the ACA affects our ability to plan.
An ACA provision, generally referred to as the Physician Payments Sunshine Act or Open Payments Program (the “Sunshine Act”), has imposed reporting and disclosure requirements for drug and device manufacturers and distributors with regard to payments or other transfers of value made to certain practitioners (including physicians, dentists and teaching hospitals), and for such manufacturers and distributors and for group purchasing organizations, with regard to certain ownership interests held by covered recipients in the reporting entity. The Centers for Medicare and Medicaid Services (“CMS”) publishes information from these reports on a publicly available website, including amounts transferred and physician, dentist, teaching hospital and non-practitioner identities.
The Sunshine Act pre-empts similar state reporting laws, although we or our subsidiaries may also be required to report under certain state transparency laws that address circumstances not covered by the Sunshine Act, and some of these state laws, as well as the federal law, can be unclear. We are also subject to foreign regulations requiring transparency of certain interactions between suppliers and their customers. In the U.S., government actions to seek to increase health-related price transparency may also affect our business. Our compliance with these rules imposes additional costs on us.
In addition, recently there has been increased scrutiny on drug pricing and concurrent efforts to control or reduce drug costs by Congress, the President, executive branch agencies and various states, including that several related bills have been introduced at the federal level. Such legislation, if enacted, could have the potential to impose additional costs on our business.
Initiatives sponsored by government agencies, legislative bodies, and the private sector to limit the growth of healthcare expenses generally are ongoing in markets where we do business. It is not possible to predict at this time the long-term impact of such cost containment measures on our future business.
Additionally, the regulation of public and private health insurance and benefit programs can affect our business, and scrutiny of the healthcare delivery and reimbursement systems in the U.S., including those related to the importation and reimportation of certain drugs from foreign markets, can be expected to continue at both the state and federal levels. This process may result in additional legislation and/or regulation governing the production, delivery, or pricing of pharmaceutical products and other healthcare services. In addition, changes in the interpretations of existing regulations may result in significant additional compliance costs or the discontinuation of our ability to
continue to operate certain of our distribution centers, which may have a material adverse effect on our business, results of operations and financial condition.
As a result of political, economic and regulatory influences, the health care distribution industry in the U.S. is under intense scrutiny and subject to fundamental changes. We cannot predict what further reform proposals, if any, will be adopted, when they may be adopted, or what impact they may have on us.
Regulated Software; Electronic Health Records
The FDA has become increasingly active in addressing the regulation of computer software and digital health products intended for use in health care settings. The 21st Century Cures Act (the “Cures Act”), signed into law in December 2016, among other things, amended the medical device definition to exclude certain software from FDA regulation, including clinical decision support software that meets certain criteria. In September 2019, the FDA issued a guidance document describing the impact of the Cures Act on existing software policies. Concurrently, the FDA issued draft guidance describing the FDA’s approach to clinical decision support software. On September 28, 2022, the FDA issued final guidance that made several changes to the draft guidance and that provides a more restrictive interpretation of exempt clinical decision support software. Certain of our software and related products support practice management, and it is possible that the FDA or foreign government authorities could determine that one or more of our products is a medical device, which could subject us or one or more of our businesses to substantial additional requirements with respect to these products.
In addition, certain of our practice management products include electronic information technology systems that store and process personal health, clinical, financial and other sensitive information of individuals. These information technology systems may be vulnerable to breakdown, wrongful intrusions, data breaches and malicious attack, which could require us to expend significant resources to eliminate these problems and address related security concerns, and could involve claims against us by private parties and/or governmental agencies. For example, we are directly or indirectly subject to numerous and evolving federal, state, local and foreign laws and regulations that protect the privacy and security of such information, such as the privacy and security provisions of the federal Health Insurance Portability and Accountability Act of 1996, as amended, and implementing regulations (“HIPAA”), the Controlling the Assault of Non-Solicited Pornography and Marketing Act, the Telephone Consumer Protection Act of 1991, Section 5 of the Federal Trade Commission Act, the California Privacy Act (“CCPA”), and the California Privacy Rights Act (“CPRA”) that became effective on January 1, 2023. Additionally, nearly all other states have passed, proposed, or are considering comprehensive privacy legislation, and privacy bills have been proposed at the federal level that may result in additional legal requirements that impact our business. Laws and regulations relating to privacy and data protections are continually evolving and subject to potentially differing interpretations. These requirements may not be harmonized, may be interpreted and applied in a manner that is inconsistent from one jurisdiction to another or may conflict with other rules or our practices. Our businesses’ failure to comply with these laws and regulations could expose us to breach of control claims, substantial fines, penalties and other liabilities and expenses, costs for remediation and harm to our reputation. Also, evolving laws and regulations in this area could restrict the ability of our customers to obtain, use or disseminate patient information, or could require us to incur significant additional costs to re-design our products to reflect these legal requirements, which could have a material adverse effect on our operations.
Other health information standards, such as regulations under HIPAA, establish standards regarding electronic health data transmissions and transaction code set rules for specific electronic transactions, such as transactions involving claims submissions to third party payers. Certain of our electronic practice management products must meet these requirements. Failure to abide by these and other electronic health data transmission standards could expose us to breach of contract claims, substantial fines, penalties and other liabilities and expenses, costs for remediation and harm to our reputation.
The Health Information Technology for Economic and Clinical Health Act (“HITECH Act”) strengthened federal privacy and security provisions governing protected health information. Among other things, the HITECH Act expanded certain aspects of the HIPAA privacy and security rules, imposed new notification requirements related to health data security breaches, broadened the rights of the U.S. Department of Health and Human Services (“HHS”) to enforce HIPAA, and directed HHS to publish more specific security standards. In January 2013, the Office for Civil Rights of HHS published the HIPAA omnibus final rule (“HIPAA Final Rule”), which amended certain aspects of the HIPAA privacy, security, and enforcement rules pursuant to the HITECH Act, extending certain HIPAA obligations to business associates and their subcontractors. Certain components of our business act as “business associates” within the meaning of HIPAA and are subject to these additional obligations under the HIPAA Final Rule.
Also, the European Parliament and the Council of the European Union adopted the pan-European General Data Protection Regulation (“GDPR”), effective from May 2018, which increased privacy rights for individuals (“Data Subjects”), including individuals who are our customers, suppliers, and employees. The GDPR extended the scope of responsibilities for data controllers and data processors, and generally imposes increased requirements and potential penalties on companies that are either established in the EU and process personal data of Data Subjects (regardless the Data Subject location), or that are not established in the EU but that offer goods or services to Data Subjects in the EU or monitor their behavior in the EU. Noncompliance can result in penalties of up to the greater of EUR 20 million, or 4% of global company revenues, and Data Subjects may seek damages. Individual member states may impose additional requirements and penalties regarding certain limited matters such as employee personal data. With respect to the personal data it protects, the GDPR requires, among other things, controller accountability, consents from Data Subjects or another acceptable legal basis to process the personal data, notification within 72 hours of a personal data breach where required, data integrity and security, and fairness and transparency regarding the storage, use or other processing of the personal data. The GDPR also provides rights to Data Subjects relating notably to information, access, rectification and erasure of the personal data and the right to object to the processing.
In the U.S., the CCPA, which increases the privacy protections afforded California residents, became effective in January 2020. The CCPA generally requires companies, such as us, to institute additional protections regarding the collection, use and disclosure of certain personal information of California residents. Compliance with the obligations imposed by the CCPA depends in part on how particular regulators interpret and apply them. Regulations were released in August 2020, there remains some uncertainty about how the CCPA will be interpreted by the courts and enforced by the regulators. If we fail to comply with the CCPA or if regulators assert that we have failed to comply with the CCPA, we may be subject to certain fines or other penalties and litigation, any of which may negatively impact our reputation, require us to expend significant resources, and harm our business. Furthermore, California voters approved the CPRA in November 2020, which amends and expands the CCPA, including by providing consumers with additional rights with respect to their personal information, and creating a new state agency, the California Privacy Protection Agency, to enforce the CCPA and the CPRA. The CPRA came into effect on January 1, 2023, applying to information collected by business on or after January 1, 2022.
As noted above, other states, as well as the federal government, have increasingly considered the adoption of similarly expansive personal privacy laws, backed by significant civil penalties for non-compliance. While we believe we have substantially compliant programs and controls in place to comply with the GDPR, CCPA, CPRA and state law requirements, our compliance with data privacy and cybersecurity laws is likely to impose additional costs on us, and we cannot predict whether the interpretations of the requirements, or changes in our practices in response to new requirements or interpretations of the requirements, could have a material adverse effect on our business.
We also sell products and services that health care providers, such as dentists, use to store and manage patient dental records. These customers, and we, are subject to laws, regulations and industry standards, such as HIPAA and the Payment Card Industry Data Security Standards, which require the protection of the privacy and security of those records, and our products may also be used as part of these customers’ comprehensive data security programs, including in connection with their efforts to comply with applicable privacy and security laws. Perceived or actual security vulnerabilities in our products or services, or the perceived or actual failure by us or our customers who use our products or services to comply with applicable legal or contractual data privacy or security requirements, may not only cause us significant reputational harm, but may also lead to claims against us by our customers and/or governmental agencies and involve substantial fines, penalties and other liabilities and expenses and costs for remediation.
Various federal initiatives involve the adoption and use by health care providers of certain electronic health care records systems and processes. Additionally, effective September 1, 2023, the Office of the Inspector General (“OIG”) for HHS issued a final rule implementing civil money penalties for information blocking as established by the Cures Act. OIG incorporated regulations published by the Office of the National Coordinator for Health Information Technology of HHS as the basis for enforcing information blocking penalties. Each information blocking violation carries up to a $1 million penalty. Moreover, in order to satisfy our customers, and comply with evolving legal requirements, our products may need to incorporate increasingly complex functionality, such as with respect to reporting and information blocking. Although we believe we are positioned to accomplish this, the effort may involve increased costs, and our failure to implement product modifications, or otherwise satisfy applicable standards, could have a material adverse effect on our business.
E-Commerce
Electronic commerce solutions have become an integral part of traditional health care supply and distribution relationships. Our distribution business is characterized by rapid technological developments and intense competition. The continuing advancement of online commerce requires us to cost-effectively adapt to changing technologies, to enhance existing services and to develop and introduce a variety of new services to address the changing demands of consumers and our customers on a timely basis, particularly in response to competitive offerings.
Through our proprietary, technologically based suite of products, we offer customers a variety of competitive alternatives. We believe that our tradition of reliable service, our name recognition and large customer base built on solid customer relationships, position us well to participate in this significant aspect of the distribution business. We continue to explore ways and means to improve and expand our online presence and capabilities, including our online commerce offerings and our use of various social media outlets.
International Transactions
U.S. and foreign import and export laws and regulations require us to abide by certain standards relating to the importation and exportation of products. We also are subject to certain U.S. and foreign laws and regulations concerning the conduct of our foreign operations, including the U.S. Foreign Corrupt Practices Act, the U.K. Bribery Act and other anti-bribery laws and laws pertaining to the accuracy of our internal books and records, as well as other types of foreign requirements similar to those imposed in the U.S. These laws and regulations have been the subject of increasing enforcement activity globally in recent years.
The Harmonized Tariff Schedule of the United States sets out tariff rates and statistical categories for merchandise imported into the United States. The Harmonized Tariff Schedule is based on the international Harmonized System, which is the global system of nomenclature applied to most world trade in goods. Generally, goods that we import are subject to the Harmonized Tariff Schedule.
Canada’s Forced and Child Labour in Supply Chains Act, which became effective in January 2024, seeks to prevent forced and child labor by requiring companies to release board-approved reports detailing efforts to prevent and mitigate forced and child labor. The Forced and Child Labour in Supply Chains Act requires supply chain diligence and imposes reporting obligations on certain of our subsidiaries.
There can be no assurance that laws and regulations that impact our business or laws and regulations as they apply to our customers’ practices will not have a material adverse effect on our business. As a result of political, economic and regulatory influences, the health care distribution industry in the U.S. is under intense scrutiny and subject to fundamental changes. We cannot predict what further reform proposals, if any, will be adopted, when they may be adopted, or what impact they may have on us.
See “Item 1A. Risk Factors” for a discussion of additional burdens, risks and regulatory developments that may affect our business results of operations and financial condition.
Proprietary Rights
We hold trademarks relating to the “Patterson®” name and logo, as well as certain other trademarks. Our U.S. trademark registrations have 10-year terms, and may be renewed for additional 10-year terms. We intend to protect our trademarks to the fullest extent practicable.
Human Capital
People are the foundation of who we are. Only with talented employees can we run our business to the highest standard and fulfill our goals for our customers. Our goal is to attract and retain the right people to work at Patterson. We support our people with meaningful benefits, a great culture and career opportunities with the potential for advancement.
Our culture is driven by our purpose, vision, and values:
As of April 27, 2024, we had approximately 7,600 full-time employees, of which approximately 6,200 were employed in the U.S.
While overall ESG matters are overseen by the Governance and Nominating Committee, the Compensation and Human Capital Committee plays a role in ESG matters related to our human capital practices. Our chief human resources officer leads our talent attraction, diversity and development programs and reports progress – including on opportunities and recruiting metrics – to the Compensation and Human Capital Committee. One recent highlight was the appointment of an inaugural director of diversity, equity and inclusion.
As a people-first organization, the overall well-being of our team is important to us. Our total rewards philosophy is to provide market competitive pay and a range of benefit choices designed to meet our employees’ diverse needs, reward individual and business performance, and drive shareholder value. We support our employees’ health with medical, pharmacy, dental and vision plans, mental health services and wellness programs to encourage healthy lifestyles, and parental leave for new parents. We support our employees’ financial well-being with matching 401(k) contributions, life insurance, company-paid short-term disability insurance, an employee stock purchase plan (ESPP) and personal finance educational tools. In addition, regular employee engagement surveys help us gain insights about how to support talent attraction, engagement and retention.
We believe that a diverse and inclusive workforce strengthens our company in ways that align with our purpose, vision and values. At Patterson, we seek to foster an environment where individuals from all backgrounds feel valued and respected. At a high level, our Code of Conduct expresses our commitment to inclusivity and emphasizes the importance of a workplace that is free of discrimination, harassment, bullying and physical and verbal abuse. We aim to enhance our workplace diversity, equity and inclusion efforts through leadership development programs, employee affinity groups, strategic partnerships, and inclusive policies and processes. Additionally, our talent recruitment program includes seeking to consider candidate pools that include (among other things) individuals from diverse racial and ethnic backgrounds, military personnel (both current and inactive) and early-career employees and students. We also seek to promote equity, inclusion and economic empowerment within our supply chain. By partnering with businesses owned by individuals from diverse racial and ethnic backgrounds, women, veterans, LGBTQ+ individuals and people with disabilities, we believe we can help foster a more diverse and inclusive business ecosystem.
As of April 27, 2024, 41.9% of our U.S. workforce and 41.2% of our management was female. In addition, as of that date, 25.1% of our U.S. workforce and 16.2% of our management was ethnically diverse.
To support the progression and career development of our employees, we offer training and development opportunities to build our employees’ expertise in leadership, inclusive management and creating business solutions. Such opportunities include on-demand courses, facilitator-led programs, mentoring relationships, tuition reimbursement and leadership development programs. We have implemented targeted development programs for senior leadership as well as emerging leaders in the organization. During fiscal year 2024, we achieved approximately 90% participation (representing over 800 individuals) in our enterprise-wide “Inclusive Leader” program. In addition, we conduct performance reviews for employees every year, achieving an over 90% completion rate in fiscal year 2024.
Keeping employees safe and healthy is essential to putting people first, and we strive to continue to improve our efforts. Our Environmental Health and Safety (EHS) system is designed to manage risks and maintain focus on employee health and safety and includes compliance audits, workplace safety communications and training. In particular, our EHS team promotes employee safety and environmental awareness through foundational systems and activities, such as safety training courses.
Environment
We recognize that environmental issues can impact our business operations, employees and communities and strive to continually track and reduce our environmental impact. Our management strategy leverages internal systems, processes, and tools, as well as third-party expertise, to operate our environmental programs in a planned and documented manner, with a focus on continuous improvement. As a distributor, we work closely with our supply chain partners in an effort to reduce our joint impact on the environment by, for example, minimizing materials used to ship product to us, such as by using thinner, right-sized boxes, and maximizing efficiencies in the packaging of products we ship to our customers, which can help minimize our environmental impact.
Available Information
We make available free of charge through our website, www.pattersoncompanies.com, our Annual Report on Form 10-K, Quarterly Reports on Form 10-Q, Current Reports on Form 8-K, statements of beneficial ownership of securities on Forms 3, 4 and 5 and amendments to these reports and statements filed or furnished pursuant to Section 13(a) and Section 16 of the Securities Exchange Act of 1934 as soon as reasonably practicable after such materials are electronically filed with, or furnished to, the U.S. Securities and Exchange Commission, or SEC. This material may be accessed by visiting the Investor Relations section of our website.
In addition, the SEC maintains an Internet website at www.sec.gov, where the above information can be viewed.
Information relating to our corporate governance, including our Code of Conduct, and information concerning executive officers, Board of Directors and Board committees, and transactions in Patterson securities by directors and officers, is available on or through our website, www.pattersoncompanies.com in the Investor Relations section.
Information maintained on the website is not being included as part of this Annual Report on Form 10-K.
Item 1A. RISK FACTORS
We believe that the following risks could have a material adverse impact on our business, reputation, financial results, financial condition and/or the trading price of our common stock. In addition, our business operations could be affected by factors that are not presently known to us or that we currently consider not to be material to our operations, so you should not consider the risks disclosed in this section to necessarily represent a complete statement of all risks and uncertainties. The order in which these factors appear does not necessarily reflect their relative importance or priority.
COMPANY RISKS
We are dependent on our suppliers and exposed to the risks of their businesses, because we generally do not manufacture the products we sell.
We obtain substantially all of the products we distribute from third parties. If a supplier is unable to deliver product in a timely and efficient manner, whether due to financial difficulty, natural disaster, pandemic, the failure to comply with applicable government requirements or other reasons, we could experience lost sales. We have experienced, and may continue to experience, disruptions in the supply chains for third-party manufacturing of certain products we distribute, including delays in obtaining or inability to obtain raw materials, inflated price of product inputs, disruptions in operations of logistics service providers and resulting delays in shipments. Customers may be
unwillingness to accept such delays. The suppliers on which we rely also may be adversely affected by a serious breach of their quality assurance or quality control procedures, deterioration of their quality image, impairment of customer or consumer relationships or failure to adequately protect the relevance of brands, and related litigation, all of which could impair our ability to obtain product in a timely and efficient manner.
Our cost of goods also may be adversely impacted by unanticipated price increases due to factors such as inflation, including wage inflation, or to supply restrictions beyond our control or the control of our suppliers. If current suppliers fail to supply sufficient goods or materials to us on a timely basis, or at all, we could experience inventory shortages and disruptions in our distribution of products.
In addition, there is considerable concentration within our animal health and dental businesses with a few key suppliers. A portion of the products we distribute is sourced, directly or indirectly, from countries outside the U.S. including China. Our ability or the ability of our suppliers to successfully source materials may be adversely affected by changes in U.S. laws, including trade tariffs on the importation of certain products from China as a result trade tensions between the U.S. and China. We may experience a disruption in the flow of imported product from China, or an increase in the cost of those goods attributable to increased tariffs, restrictions on trade, or other changes in laws and policies governing foreign trade. In addition, political or financial instability, currency exchange rates, labor unrest, pandemic or other events could slow distribution activities and adversely affect foreign trade beyond our control.
We generally do not have long-term contracts with our suppliers, so they may be discontinued or changed abruptly. Changes in the structure of purchasing relationships might include changing from a “buy/sell” to an agency relationship (or the reverse), or changing the method in which products are taken to market, including the possibility of manufacturers creating or expanding direct sales forces or otherwise reducing their reliance on third-party distribution channels. We compete with certain manufacturers, including some of our own suppliers, that sell directly to customers as well as to wholesale distributors and online businesses that compete with price transparency. An extended interruption in the supply of products would have an adverse effect on our results of operations, and a reduction in our role as a value-added service provider would result in reduced margins on product sales.
Disruption to our distribution capabilities, including service issues with our third-party shippers, could materially adversely affect our results.
Weather, natural disaster, fire, terrorism, pandemic, strikes, civil unrest, geopolitical events or other reasons could impair our ability to distribute products and conduct our business. If we are unable to manage effectively such events if they occur, there could be an adverse effect on our business, results of operations and financial condition. Similarly, increases in service costs or service issues with our third-party shippers, including strikes or other service interruptions, could cause our operating expenses to rise and adversely affect our ability to deliver products on a timely basis. We ship almost all of our orders through third-party delivery services, and often times bear the cost of shipment. We have recently experienced increases in the cost of shipping, and it is possible that such cost increases could be material in the future. Our ability to provide same-day shipping and next-day delivery is an integral component of our business strategy.
Customer retention and business development depend heavily on our relationships with our sales representatives and service technicians, who interact directly with our customers, and the technological products and services we offer.
The inability to attract or retain qualified employees, particularly sales representatives and service technicians who relate directly with our customers, or our inability to build or maintain relationships with customers in the dental and animal health markets, may have an adverse effect on our business. These individuals develop relationships with our customers that could be damaged if these employees are not retained. We face intense competition for the hiring of these professionals, we have experienced and are likely to continue to experience challenges in recruiting those with technical expertise, and many professionals in the field that may otherwise be attractive candidates for us to hire may be bound by restrictive covenants with our competitors. Any failure on our part to hire, train and retain a sufficient number of qualified professionals would damage our business.
Due to generational and other trends in the dental and animal health industries, our customer base is increasingly interested in having the latest technologies to manage their business. In order to effectively offer solutions that keep pace with rapidly changing technologies and customer expectations, we must acquire, develop or offer new technology products and solutions. If we fail to accurately anticipate and meet our customers’ needs through the acquisition, development or distribution of new products, technologies and service offerings, if we fail to adequately protect our intellectual property rights, if the products we distribute and services we provide are not widely accepted
or if current or future offerings fail to meet applicable regulatory requirements, we could lose customers to our competitors. Unanticipated safety, quality or efficacy concerns can arise with respect to the products we distribute, whether or not scientifically or clinically supported, which can lead to product recalls, withdrawals or suspended or declining sales, as well as product liability and other claims. In addition, if technology investments do not achieve the intended results, we may write-off the investments, and we face the risk of claims from system users that the systems failed to produce the intended result or negatively affected the operation of our customers’ businesses. Any such claims could be expensive and time-consuming to defend, cause us to lose customers and associated revenue, divert management’s attention and resources, or require us to pay damages.
Sales of private label products entail additional risks, including the risk that such sales could adversely affect our relationships with suppliers.
We distribute certain private label products that are manufactured by our suppliers and are available exclusively from us. Beyond the risks that normally accompany the distribution of products, our sourcing, marketing and selling of private label products subject us to incremental risks, including but not limited to potential product liability risks, mandatory or voluntary product recalls, potential supply chain and distribution chain disruptions, and potential intellectual property infringement risks. In addition, an increase in the sales of our private label products may negatively affect our sales of products owned by our suppliers which, consequently, could adversely impact certain of our supplier relationships. Our ability to locate qualified, economically stable suppliers who satisfy our requirements, and to acquire sufficient products in a timely and effective manner, is critical to ensuring, among other things, that customer confidence is not diminished. As a distribution company, any failure to develop sourcing relationships with a broad and deep supplier base could adversely affect our financial performance and erode customer loyalty. In addition, we are exposed to the risk that our competitors or our customers may introduce their own private label, generic, or low-cost products that compete with our products at lower price points. In the animal health industry, sales of generic products are an increasing percentage of overall animal health sales in certain regions, and generic competition may expand further as a result of changes in industry dynamics, such as channel expansion, customer consolidation, increase in the availability and use of pet insurance and the potential for generic competition by established animal health businesses. Such products could capture significant market share or decrease market prices overall, eroding our sales and margins.
Changes in supplier rebates or other purchasing incentives could negatively affect our business.
The terms on which we purchase or sell products from many suppliers may entitle us to receive a rebate or other purchasing incentive based on the attainment of certain growth goals. Suppliers may reduce or eliminate rebates or incentives offered under their programs, or increase the growth goals or other conditions we must meet to earn rebates or incentives to levels that we cannot achieve. Increased competition either from generic or equivalent branded products could result in reduced margins and failure to earn rebates or incentives that are conditioned upon achievement of growth goals. Also, decreases in the market prices of products that we sell could cause customers to demand lower sales prices from us. These price reductions could further reduce our margins and profitability on sales with respect to the lower-priced products. Additionally, factors outside of our control, such as customer preferences, consolidation of suppliers or supply issues, can have a material impact on our ability to achieve the growth goals established by our suppliers, which may reduce the amount of rebates or incentives we receive.
The products we sell are subject to market and technological obsolescence and our customers’ willingness to replace existing equipment depends upon new product introductions by manufacturers, which are out of our control.
The products we distribute are subject to technological obsolescence outside of our control. We depend on suppliers to regularly develop and pour marketing dollars into the launch of new and enhanced products. For example, during fiscal 2023, one of our primary suppliers of dental equipment did not release any significant product introductions and, as a consequence, customers who may have replaced existing equipment with new equipment, did not do so. If our customers discontinue purchasing a given product, we might have to record expense related to the diminution in value of inventories we have in stock, and depending on the magnitude, that expense could adversely impact our operating results.
Our failure to successfully innovate and develop new and enhanced software and e-services products could negatively affect our business.
Our growth depends on our investment in the development of software and e-services products and the market traction achieved by such offerings. If we fail to accurately predict future customer needs and preferences or fail to
produce viable software and e-services products, we may invest heavily in product commercialization that does not lead to significant sales, which would adversely affect our profitability. Even if we successfully innovate and develop new and enhanced software and e-services products, we may incur substantial costs in doing so, and our profitability may suffer. Furthermore, our software and e-services products also may contain undetected errors or bugs when introduced, or as new versions are released. Any such defects may result in increased expenses and could adversely affect our reputation and our relationships with the customers using such products. We do not have any patents on our software or e-services products, and rely upon copyright, trademark and trade secret laws, as well as contractual and common-law protections. We cannot provide assurance that such legal protections will be available, adequate or enforceable in a timely manner to protect our software or e-services products. Our software and e-services products may fail to remain competitive and may fail to anticipate market demands for functionality. In addition, the cost to replace defective products may not generate commensurate benefit.
Patterson’s continued success depends on positive perceptions of Patterson’s reputation.
Customers do business with Patterson and employees choose Patterson as a place of employment due to the reputation that Patterson has built over many years. To be successful in the future, Patterson must continue to preserve, grow and leverage the value of Patterson’s brand. Reputational value is based in large part on perceptions of subjective qualities. Even an isolated incident, or the aggregate effect of individually insignificant incidents, can erode trust and confidence, particularly if they result in adverse publicity, governmental investigations or litigation, and as a result, could tarnish Patterson’s brand. In addition, maintaining consistent product quality, competitive pricing, and availability of our private label products is essential to developing and maintaining customer loyalty and brand awareness. These products often have higher margins than national brand products. If one or more of these brands experience a loss of consumer acceptance or confidence, our sales and gross margin could be adversely affected.
Illicit human use of pharmaceutical products we distribute could adversely affect human health and safety, our reputation and our business.
The pharmaceutical products our animal health business sells are approved for use under specific circumstances in specific species. Such products could, if misused or abused by humans, adversely affect human health and safety, our reputation and our business. For instance, xylazine, which is an FDA-approved prescription veterinary tranquilizer found in certain analgesic products we distribute, has been found to be increasingly and illicitly used, knowingly or unknowingly, by humans – frequently in combination with other drugs. As a result, xylazine has become the subject of regulatory, public health, legal and political focus. Law enforcement agencies are pressing for xylazine to be listed as a federal controlled substance and several states have already done so, which measures are likely to increase the cost of distribution of such products. Illicit use of such products may increase the risk of regulatory enforcement and civil litigation.
Risks inherent in acquisitions and dispositions could offset the anticipated benefits, and we may face difficulty in efficiently and effectively integrating acquired businesses.
As a part of our business strategy, we acquire and dispose of assets and businesses in the ordinary course. Maintaining or improving our price-to-earnings ratio, of which the market price of our common stock is commonly thought to be a function, requires effective execution of our growth strategy, including achieving inorganic earnings per share growth. Acquisitions and dispositions can involve a number of risks and challenges, any of which could cause significant operating inefficiencies and adversely affect our growth and profitability, and may not result in the expected benefits.
Acquisition risks and challenges include underperformance relative to our expectations and the price paid for the acquisition; unanticipated demands on our management and operational resources; difficulty in integrating personnel, operations and systems; retention of customers of the combined businesses; assumption of contingent liabilities; acquisition-related earnings charges; and acquisition-related cybersecurity risks. Our ability to continue to make acquisitions will depend upon our success in identifying suitable targets, which requires substantial judgment in assessing their values, strengths, weaknesses, liabilities and potential profitability, as well as the availability of suitable candidates at acceptable prices, whether restrictions are imposed by anti-trust or other regulations, and compliance with the terms and conditions of our credit agreement. Additionally, when we decide to sell assets or a business, we may encounter difficulty in finding buyers or executing alternative exit strategies on acceptable terms in a timely manner, which could delay the accomplishment of our strategic objectives. Alternatively, we may dispose of assets or a business at a price or on terms that are less than we had anticipated. Dispositions may also involve continued financial involvement in a divested business, such as through continuing equity ownership, transition
service agreements, guarantees, indemnities or other current or contingent financial obligations. Under these arrangements, performance by the acquired or divested business, or other conditions outside our control, could affect our future financial results.
As we operate through two strategic business units, we consolidate the distribution, information technology, human resources, financial and other administrative functions of those business units jointly to meet their needs while addressing distinctions in the individual markets of those segments. We may not be able to do so effectively and efficiently. In addition, if we acquire technology, manufacturing or other businesses ancillary to our core distribution operations, any such newly acquired business may require the investment of additional capital and significant involvement of our senior management to integrate such business with our operations, which could place a strain on our management, other personnel, resources and systems. The acquisition of businesses in which we lack operational and market experience may be more difficult, time-consuming or costly than expected. Further, we may not ultimately strengthen our competitive position or achieve desired synergies as a result of our acquisitions, and they could be viewed negatively by our customers, securities analysts and investors.
Turnover or loss of key personnel or highly skilled employees, including executive officers, could disrupt our operations and any inability to attract and retain personnel could harm our business.
Our future success depends partly on the continued service of our highly qualified and well-trained key personnel, including executive officers. Any unplanned turnover or our failure to develop an adequate succession plan for key positions could reduce our institutional knowledge base and erode our competitive advantage. While our Board of Directors and management actively monitor our succession plans and processes for our executive leadership team, our business could be adversely impacted if we lose key personnel unexpectedly. Competition for senior management is intense and we may not be successful in attracting and retaining key personnel. In addition, reduced employment pools have contributed to increased labor shortages and employee turnover within our organization. These trends have led to, and could in the future lead to, increased costs, such as labor inflation and increased overtime to meet demand.
Risks generally associated with information systems, software products and cybersecurity attacks could adversely affect our results of operations.
We rely on information systems in our business to obtain, rapidly process, analyze and store customer, product, supplier, and employee data to conduct our business, including to, among other things: maintain and manage systems to facilitate the purchase and distribution of inventory items from numerous distribution centers; receive, process and ship orders on a timely basis; manage accurate billing and collections for our customers; process payments to suppliers; provide products and services that maintain certain of our customers’ electronic records; and maintain and manage corporate human resources, compensation and payroll systems. Certain of our information systems store sensitive personal and financial information, such as information related to our employees and our third-party business partners, that is confidential and in some cases subject to privacy laws. Our information systems are vulnerable to natural disasters, power losses, computer viruses, telecommunication failures, cybersecurity threats, and other problems. From time to time, we have had to address non-material security incidents and we expect to experience security incidents in the future. Despite our efforts to ensure the integrity of our systems, as cybersecurity threats evolve and become more difficult to detect and successfully defend against, one or more cybersecurity threats or other events that could impact the security, reliability and availability of our systems might defeat the measures that we or our vendors take to anticipate, detect, avoid or mitigate such threats. In addition, hardware, software or applications developed internally, acquired through acquisitions or procured from third parties may contain defects in design or manufacture or other problems that could unexpectedly compromise information security. We may also incur substantial costs as we update, integrate and enhance our cybersecurity defense systems, and those of acquired entities, to meet evolving challenges.
We take steps designed to detect, mitigate, and remediate vulnerabilities in our information security systems (such as our hardware and/or software, including that of third parties with whom we work), but we may not be able to detect, mitigate, and remediate all such vulnerabilities. For example, we have identified certain vulnerabilities in our information systems, and we are taking steps designed to mitigate the risks associated with known vulnerabilities. Such steps may include increasing monitoring of systems and applying standardized enterprise solutions, controls and process. Despite our efforts, there can be no assurance that these vulnerability mitigation measures will be effective. Moreover, we may also experience delays in developing and deploying remedial measures and patches designed to address any identified vulnerabilities. Vulnerabilities could be exploited and result in a security incident.
Data breaches and any unauthorized access or disclosure of our information could compromise our intellectual property and expose sensitive business information. Cybersecurity attacks or other similar events that could impact the security, reliability and availability of our systems could also cause us to incur significant remediation costs, disrupt key business operations, adversely impact our financial accounting and reporting of results of operations, divert attention of management, and adversely impact our results of operation. For example, in October 2023, a cybersecurity attack on Henry Schein, Inc., one of our key competitors, disrupted its key business operations, adversely impacted its financial results for the fourth quarter and full year 2023, diverted the attention of its management, caused it to incur significant remediation costs, and resulted in litigation.
Further, our suppliers, our customers, including purchasers of our software products, and other market participants are similarly subject to information system and cybersecurity risk, and a material disruption in their business could result in reduced revenue for us. For example, in February 2024, Change Healthcare, a subsidiary of UnitedHealth Group and the largest clearinghouse for medical claims in the U.S., was the subject of a cyberattack that required it to take offline its computer systems that handle electronic payments and insurance claims. This outage negatively impacted our business in the fourth quarter of fiscal 2024, may continue to affect our business, and has generated litigation. Similar cybersecurity events that disrupt the healthcare system upon which our business relies could adversely affect our business if such disruption is widespread and continues for an extended period of time.
In addition, compliance with evolving privacy and information security laws and standards may result in significant additional expense due to increased investment in technology and the development of new operational processes. We could be subject to liability if we fail to comply with these laws and standards, fail to protect information, or fail to respond appropriately to an incident or misuse of information, including use of information for unauthorized marketing purposes. Cybersecurity attacks in particular are becoming more sophisticated and include, but are not limited to, malicious software, attempts to gain unauthorized access to data, and other electronic security breaches that could lead to disruptions in critical systems, disruption of our customers’ operations, loss or damage to our data delivery systems, corruption of data, and increased costs to prevent, respond to or mitigate cybersecurity events. Cybersecurity attacks against our IT systems or third-party providers’ IT systems, such as cloud-based systems, could result in exposure of confidential information, the modification of critical data, and/or the failure of critical operations. Furthermore, due to geopolitical tensions and remote and hybrid working conditions, the risk of cyber-attacks may be elevated. With artificial intelligence (AI) tools, threat actors may have additional tools to automate breaches or persistent attacks, evade detection or generate sophisticated phishing emails. Our use of AI and the use of AI by our business partners may lead to novel cybersecurity risks. In addition, certain cyber incidents, such as advanced persistent threats, may remain undetected for an extended period. Our technologies, systems and networks, and those of our customers, suppliers and business partners, may become the target of cyberattacks or information security breaches.
Our information systems or the software products we sell may fail for extended period of time. Despite any precautions we take, damage from fire, floods, hurricanes, power loss, telecommunications failures, computer viruses, break-ins and similar events at our various computer facilities could result in interruptions in the flow of data to our servers. We may need to expend additional resources in the future to continue to protect against, or to address problems caused by, any business interruptions or data security breaches. A security breach and/or perceived security vulnerabilities in our information systems, products or services could also cause significant loss of business and reputational harm, and actual or perceived vulnerabilities may lead to claims against us by our customers and/or governmental agencies.
Our growing use of AI systems to automate processes and analyze data poses inherent risks.
We have and are continuing to incorporate AI, including machine learning, in certain of our internal operations and may in the future incorporate AI into certain of our products and services, with the intent to enhance their operation and effectiveness. For example, we have incorporated machine-learning into certain of our software to provide AI analysis of dental patient images designed to enhance a dentist’s own analysis. Flaws, biases or malfunctions in these systems could lead to operational disruptions, data loss, or erroneous decision-making, impacting our operations, financial condition and reputation. Ethical and legal challenges may arise, including biases or discrimination in AI outcomes, non-compliance with data protection regulations, and lack of transparency. The legal and regulatory landscape and industry standards surrounding AI technologies is rapidly evolving and uncertain, and compliance may impose significant operational costs and may limit our ability to develop, deploy or use AI technologies. Furthermore, the deployment of AI systems could expose us to increased cybersecurity threats, such as data breaches and unauthorized access leading to financial losses, legal liabilities, and reputational damage. We also face competitive risks if we fail to adopt AI or other machine-learning technologies in a timely manner.
Wide-spread public health concerns have, and may in the future, adversely affect our animal health and dental businesses, as we experienced with the COVID-19 pandemic.
Given our dependence on the willingness of dental patients and veterinary customers to seek elective care, our results of operations and financial condition may be negatively impacted by the effects of disease outbreaks, epidemics, pandemics, and similar wide-spread public health concerns. For example, global health concerns relating to the COVID-19 pandemic adversely impacted consumer spending and business spending habits, interrupted operation of industries that use the products we distribute, caused inventory write-downs of personal protective equipment due to demand fluctuations, reduced consumer willingness to be in public, modified business practices leading to cybersecurity risks, and interrupted the manufacturing and distribution of products we distribute, each of which adversely impacted our financial results and the financial results of our customers, suppliers and business partners. We may again experience adverse impacts as a result of the global economic impact of other wide-spread public health concerns, including any recession that may occur in the future, any prolonged period of economic slowdown, or reluctance of customers to seek care. These factors may also exacerbate the effects of other risks we face.
Our business and operations are subject to risks related to climate change.
The long-term effects of global climate change present both physical risks (such as extreme weather conditions or rising sea levels) and transition risks (such as regulatory or technology changes), which are expected to be widespread and unpredictable. These changes could over time affect, for example, the availability and cost of products, commodities and energy (including utilities), which in turn may impact our ability to procure goods or services required for the operation of our business at the quantities and levels we require. In addition, certain of our operations and facilities are in locations that may be impacted by the physical risks of climate change, and we face the risk of losses incurred as a result of physical damage to distribution or fulfillment centers of our third-party suppliers, loss or spoilage of inventory and business interruption caused by such events. Insurance may not be available or cost effective for the coverage limits needed. In addition, the increased focus of federal, state, and local governments on sustainability may result in new legislation or regulations and customer requirements that could negatively affect us as we may incur additional costs or be required to make changes to our operations in order to comply with any new regulations or customer requirements.
New legal or regulatory requirements have and may in the future be enacted to prevent, mitigate, or adapt to the implications of a changing climate and its effects on the environment. These regulations, which may differ across jurisdictions, could result in our businesses being subject to new or expanded carbon pricing or taxes, increased compliance costs, restrictions on greenhouse gas emissions, investment in new technologies, increased greenhouse gas emission disclosure (including costs resulting from mandatory or voluntary reporting, diligence or disclosure) and transparency, recurring investments in data gathering and reporting systems, upgrades of facilities to meet new building codes, and the redesign of utility systems, which could increase our operating costs, including the cost of electricity and energy. Our supply chain would likely be subject to these same transitional risks and would likely pass along any increased manufacturing costs to us. In addition, we are subject to expanding mandatory and voluntary reporting, diligence and disclosure requirements, including the recently enacted legislation in California requiring reporting of greenhouse gas emissions and climate risk, and potentially the SEC’s proposed climate-related reporting requirements and similar regulatory requirements in other jurisdictions. These evolving regulatory requirements are likely to result in increased costs and complexities of compliance in order to collect, measure and report on the relevant climate-related information.
Our credit agreements contain restrictive covenants and additional limits and our other debt instruments contain cross-default provisions, which limit our business and financing activities.
The covenants under our credit agreements impose restrictions on our business and financing activities, subject to certain exceptions or the consent of our lenders, including, among other things, limits on our ability to incur additional debt, create liens, enter into certain merger, acquisition and divestiture transactions, pay dividends and engage in transactions with affiliates. The credit agreements contain certain customary affirmative covenants, including requirements that we maintain a maximum consolidated leverage ratio and a minimum consolidated interest coverage ratio, pursuant to which we may be affected by changes in interest rates, and customary events of default. The terms of agreements governing debt that we may incur in the future may also contain similar covenants.
Our ability to comply with these covenants may be adversely affected by events beyond our control, including economic, financial and industry conditions. A covenant breach may result in an event of default, which could allow
our lenders to terminate the commitments under the credit agreement, declare all amounts outstanding under the credit agreement, together with accrued interest, to be immediately due and payable, and exercise other rights and remedies, and, through cross-default provisions, would entitle our other lenders to accelerate their loans. If this occurs, we may not be able to refinance the accelerated indebtedness on acceptable terms, or at all, or otherwise repay the accelerated indebtedness.
In addition, borrowings under certain of our debt instruments are made at variable rates of interest and expose us to interest rate volatility. If interest rates increase again in the future, as they did in 2023, our debt service obligations on variable rate indebtedness would again increase.
Our governing documents, other documents to which we are a party, and Minnesota law may discourage takeovers and business combinations that our shareholders might prefer.
Anti-takeover provisions of our articles of incorporation, bylaws, and Minnesota law could diminish the opportunity for shareholders to participate in acquisition proposals at a price above the then-current market price of our common stock. For example, while we have no present plans to issue any preferred stock, our Board of Directors, without further shareholder approval, may issue up to approximately 30 million shares of undesignated preferred stock and fix the powers, preferences, rights and limitations of such class or series, which could adversely affect the voting power of our common stock. Further, as a Minnesota corporation, we are subject to provisions of the Minnesota Business Corporation Act regarding “control share acquisitions” and “business combinations.” We may also, in the future, consider adopting additional anti-takeover measures. In addition, certain equity plans predating our Omnibus Incentive Plan provide for acceleration of awards thereunder upon a change in control or other events of acceleration, as defined in those plans. The foregoing, and any future anti-takeover measures adopted by us, may, in certain circumstances, delay, deter or prevent takeover attempts and other changes in control of our company.
INDUSTRY RISKS
The dental and animal health supply markets are highly competitive, and we may not be able to compete successfully.
Our competitors include national, regional and local full-service distributors, mail-order distributors and Internet-based businesses. Some of our competitors have greater resources than we do, or operate through different sales and distribution models that could allow them to compete more successfully. Our failure to compete effectively and/or pricing pressures resulting from such competition may adversely impact our business, and our expansion into new markets may result in greater-than-expected risks, liabilities and expenses. In addition, most of the products we distribute are available from multiple sources, and our customers tend to have relationships with several different distributors who can fulfill their orders. If any of our competitors are more successful with respect to any key competitive factor such as technological advances or low-cost business models with the ability to operate at high gross margins, our sales and profitability could be adversely affected. Increased competition from any supplier of dental or animal health products or services could adversely impact our financial results. Additional competitive pressure could arise from, among other things, limited demand growth or a significant number of additional competitive products or services being introduced into a particular market, the emergence of new competitors, the unavailability of products, price reductions by competitors, price transparency (which is further promoted by price aggregators), and the ability of competitors to capitalize on their economies of scale. Manufacturers also could increase their efforts to sell directly to end-users and thereby eliminate or reduce the role of distributors. These suppliers could sell their products at lower prices and maintain a higher gross margin on product sales than we can. In addition, our ability to deliver market growth is challenged by an animal health product mix that is weighted toward lower growth, lower margin parts of the value chain.
The dental and animal health supply markets are consolidating, including vertical integration in the production animal market, and we may not be able to compete successfully.
Consolidation has increased among dental and animal health manufacturers and distributors, which could cause the industry to become more competitive as greater economies of scale are achieved by competitors, or as competitors with lower cost business models are able to offer lower prices but retain high gross margin. In addition, the vertical integration we have seen and expect to continue within the production animal business limits the number of purchasing decision-makers we can impact, which could also affect our margins. We also face pricing pressure from branded pharmaceutical manufacturers which could adversely affect our sales and profitability. We may be unable to anticipate and effectively respond to competitive change, and our failure to compete effectively may limit and/or reduce our revenue, profitability and cash flow.
The formation or expansion of GPOs, provider networks and buying groups may place us at a competitive disadvantage.
In recent years there has also been a trend towards consolidation in the industries that buy the products and services we distribute, including dental practices, veterinary practices and animal producers, and the formation of group purchasing organizations (GPOs), provider networks and buying groups, including dental support organizations (DSOs), designed to leverage volume discounts. The formation or expansion of GPOs, provider networks and buying groups including DSOs may shift purchasing decisions to entities or persons with whom we do not have a historical relationship, and may threaten our ability to compete effectively, which could in turn negatively impact our financial results. In addition, such organizations may establish direct relationships with manufacturers, thereby eliminating or reducing the services historically provided by distributors. We expect further expansion of such groups in the future. Further, as a full-service distributor with business service capabilities, we cannot guarantee that we will be able to successfully compete with price-oriented distribution models that more readily enable the pricing typically demanded by those with significant purchasing power.
Our animal health segment is exposed to the risks of the production animal business, including changes in consumer demand, the cyclical livestock market, weather conditions and the availability of natural resources, and other factors outside our control, as well as risks of the companion animal business, including the possibility of disease adversely affecting the pet population.
Demand for our production animal health products can be negatively influenced by factors including: weather conditions (including those that may be related to climate change), varying weather patterns and weather-related pressures from pests; changes in consumer preferences away from food animal products, including increased promotions and publicity for food products containing plant-based protein; supply chain disruptions including due to cyberattack, or actions by animal rights activists; and outbreaks of diseases affecting animals, any of which could reduce herd sizes or affect consumer preferences, and regulations related to food-producing animals. Reductions in herd size would ultimately decrease the demand for the products we distribute, including micro feed ingredients, animal health products, and dairy sanitation solutions, as well as the development and implementation of systems for feed, health, information and production animal management. In recent years, outbreaks of various diseases, including African Swine Fever, avian influenza, foot-and-mouth disease, bovine spongiform encephalopathy (otherwise known as BSE or mad cow disease) and porcine epidemic diarrhea virus (otherwise known as PEDv), have impacted the animal health business. The discovery of additional cases of any of these, or new diseases may result in additional restrictions on animal proteins, reduced herd sizes, or reduced demand for animal protein.
There has been consumer concern and consumer activism with respect to additives (including, without limitation, antibiotics and growth promotants) used in the production of animal products, including growing consumer sentiment for proteins and dairy products produced without the use of antibiotics or other products intended to increase animal production. These concerns have resulted in increased regulation and changing market demand. If there is an increased public perception that consumption of food derived from animals that utilize additives we distribute poses a risk to human health, there may be a further decline in the production of those food products and, in turn, our sales of those products. Furthermore, regulatory restrictions and bans could result in the removal from market of products in these categories, which would adversely affect our sales. In addition, the market for our animal health products could be negatively impacted by the introduction and/or market acceptance of newly-developed or alternative products, which could include products perceived as “healthy” or “holistic.”
Farm animal producers depend on the availability of natural resources, including large supplies of fresh water. Their animals’ health and their ability to operate could be adversely affected if they experience a shortage of fresh water due to human population growth or floods, droughts or other weather conditions. In the event of adverse weather conditions or a shortage of fresh water, veterinarians or farm animal producers may purchase less of our products. Further, heat waves may cause stress in animals and lead to increased vulnerability to disease, reduced fertility rates and reduced milk production. Droughts may threaten pasture and feed supplies by reducing the quality and amount of forage available to grazing livestock, while climate change may increase the prevalence of parasites and diseases that affect farm animals.
Veterinary hospitals and practitioners depend on visits from the animals under their care. Veterinarians’ patient volume and ability to operate could be adversely affected if there is a reduction in the companion animal population, such as due to disease outbreak. Furthermore, the industry is facing a veterinarian and veterinary technician labor shortage and new regulations permitting non-economic and punitive damages for pet owners in case of wrongful death or injury.
Our dental segment is exposed to the risks of the health care industry, including changes in demand due to political, economic and regulatory influences, and other factors outside our control.
Aspects of the dental market are impacted by price competition that is driven in part by the consolidation of dental practices, innovation and product advancements, and the price sensitivity of customers. Many dental participants are consolidating to create larger and more integrated provider systems with greater market power. We expect additional consolidation in the dental industry in the future. As consolidation accelerates, the economies of scale of our customers may grow. If a customer experiences sizable growth following consolidation, it may determine that it no longer needs to rely on us and may reduce its demand for our products and services. Some of these large and growing customers may choose to contract directly with suppliers for certain supply categories. In addition, as customers consolidate, these providers may try to use their market power to negotiate price reductions for our products and services. Finally, consolidation may also result in the acquisition or future development by our customers of products and services that compete with our products and services.
Increased OTC and e-commerce sales of products we sell could adversely affect our business.
Dental and companion animal health products are becoming increasingly available to consumers at competitive prices from sources other than traditional health care supply and distribution sources, including human health product pharmacies, Internet pharmacies, big-box retailers and other online e-commerce solutions, and consumers are increasingly seeking such alternative sources of supply. Dental products are readily available from major U.S. online e-commerce retailers such as Amazon and Chewy.com that are licensed as veterinary mail order pharmacies, which enables them to offer pharmacy products directly to consumers in all 50 U.S. states. If federal regulations were to permit veterinarian-client-patient relationships to be established virtually, which is a focus of lobbyists that appears to be gaining traction, we may face additional competitive pressure. Even where prescriptions must be written by a veterinarian, companion animal owners may shift to these services for home delivery. In addition, companion animal owners may substitute human health products for animal-health products if they deem human health products to be acceptable, lower-cost alternatives. Furthermore, decreased emphasis on veterinary visits, and increased consumer choice through e-commerce retailers could reduce demand for veterinarian-based services. The continued advancement of online e-commerce by third parties will require us to cost-effectively adapt to changing technologies, to enhance existing services and to differentiate our business (including with additional value-added services) to address changing demands of consumers and our customers on a timely basis. We may be unable to anticipate and effectively respond to shifts in consumer traffic patterns and direct-to-consumer buying trends.
LITIGATION AND REGULATORY RISKS
We are subject to a variety of litigation and governmental inquiries and investigations.
We are subject to a variety of litigation incidental to our business, including product liability claims, intellectual property claims, employment claims, commercial disputes, putative class actions under the California Labor Code Private Attorneys General Act, and other matters arising out of the ordinary course of our business, including securities litigation. From time to time we are named as a defendant in cases as a result of our distribution of products. Additionally, purchasers of private-label products may seek recourse directly from us, rather than the ultimate product manufacturer, for product-related claims. Another potential risk we face in the distribution of products is liability resulting from counterfeit or tainted products infiltrating the supply chain. In addition, some of the products that we transport and sell are considered hazardous materials. The improper handling of such materials or accidents involving the transportation of such materials could subject us to liability or legal action that could harm our reputation. From time to time, we also receive and respond to governmental inquiries and investigations, including subpoenas for the production of documents. Defending against such claims, and responding to such governmental inquiries and investigations, may divert our resources and management’s attention over lengthy periods of time, may be expensive, and may require that we pay substantial monetary awards or settlements, pay fines or penalties, or become subject to equitable remedies (including but not limited to the revocation of or non-renewal of licenses). We may be subject to claims in excess of available insurance or not covered by insurance or indemnification agreements, or claims that result in significant adverse publicity. Furthermore, the outcome of litigation is inherently uncertain.
If we fail to comply with laws and regulations relating to health care fraud or other laws and regulations, we could suffer penalties or be required to make significant changes to our operations.
We are subject to federal and state (and similar foreign) health care fraud and abuse, referral and reimbursement laws and regulations, including those referred to as “false claims laws” and “anti-kickback” laws. Health care fraud
measures may implicate, for example, our relationships with pharmaceutical manufacturers, our pricing and incentive programs for physician and dental practices, and our practice management products that offer billing-related functionality. Failure to comply with fraud and abuse laws and regulations could result in significant civil and criminal penalties and costs, including treble damages and substantial civil penalties under the federal False Claims Act as well as potential loss of licenses and the ability to participate in federal and state health care programs, criminal penalties, or imposition of a corporate compliance monitor. Also, these measures may be interpreted or applied by a prosecutorial, regulatory or judicial authority in a manner that could require us to make changes in our operations or incur substantial defense and settlement expenses. Even unsuccessful challenges by regulatory authorities or private regulators could result in reputational harm and the incurring of substantial costs. Most states have adopted similar state false claims laws, and these state laws have their own penalties which may be in addition to federal False Claims Act penalties, as well as other fraud and abuse laws. In addition, many of these laws are vague or indefinite and have not been interpreted by the courts, and have been subject to frequent modification and varied interpretation by prosecutorial and regulatory authorities, increasing the risk of noncompliance.
Change and uncertainty in the health care industry could materially adversely affect our business.
Laws and regulations affecting the health care industry in the U.S., including the ACA, have changed and may continue to change the landscape in which our industry operates. Foreign government authorities may also adopt reforms of their health systems. We cannot predict what further reform proposals, if any, will be adopted, when they may be adopted, or what impact they may have on us. In recent years, there has been increasing scrutiny on drug pricing and concurrent efforts to control or reduce drug costs by Congress, the President, and various states, including several bills that have been introduced on a federal level. Such legislation, if enacted, could have the potential to impose additional costs on our business. One provision of the ACA, the Sunshine Act, requires us to collect and report detailed information regarding certain financial relationships we have with covered recipients, including physicians, dentists, teaching hospitals and certain other non-physician practitioners. We may also be required to report under certain state transparency laws that address circumstances not covered by the Sunshine Act, and some of these state laws, as well as the federal law, can be unclear. We are also subject to foreign regulations requiring transparency of certain interactions between suppliers and their customers. Our compliance with these rules imposes additional costs on us. In the U.S., government actions to seek to increase health-related price transparency may also affect our business.
Failure to comply with existing and future U.S. and foreign laws and regulatory requirements, including those governing the distribution of pharmaceuticals and controlled substances, could subject us to claims or otherwise harm our business.
Our business is subject to requirements under various local, state, federal and international laws and regulations applicable to the sale and distribution of, and third-party payment for, pharmaceuticals and medical devices, and human cells, tissues and cellular and tissue-based products (“HCT/P products”), and animal feed and supplements. Among other things, such laws, and the regulations promulgated thereunder:
•regulate the introduction, manufacture, advertising, marketing and promotion, sampling, pricing and reimbursement, labeling, packaging, procurement, storage, handling, returning or recalling, reporting, and distribution of, and record keeping for drugs, HCT/P products and medical devices, including requirements with respect to unique medical device identifiers and may require reporting of certain pricing data;
•subject us to inspection by the FDA and the DEA and similar state authorities;
•regulate the sale, transportation, importation, storage, handling and disposal of hazardous or potentially hazardous substances;
•regulate the distribution and storage of pharmaceuticals and controlled substances;
•require us to advertise and promote our drugs and devices in accordance with FDA requirements;
•require registration with the FDA and the DEA and various state agencies;
•require record keeping and documentation of transactions involving drug products;
•require us to design and operate a system to identify and report suspicious orders of controlled substances to the DEA;
•require us to manage returns of products that have been recalled and subject us to inspection of our recall procedures and activities;
•impose on us reporting requirements if a pharmaceutical, HCT/P product or medical device causes serious illness, injury or death;
•require manufacturers, wholesalers, repackagers and dispensers of prescription drugs to identify and trace certain prescription drugs as they are distributed;
•require the licensing of prescription drug wholesalers and third-party logistics providers; and
•mandate compliance with standards for the recordkeeping, storage and handling of prescription drugs, and associated reporting requirements.
If we acquire a manufacturing business, we will be subject to new regulatory risks attendant to manufacturing. For example, animal pharmaceuticals and supplements are subject to regulatory approval and ongoing continuous review by the FDA and other regulatory authorities. Gaining approval for new products may require potentially costly post-marketing follow-up studies to monitor the safety and efficacy of the approved product. Noncompliance or failure to receive or maintain, or delays in receiving, such clearance or approvals may hurt our competitiveness and have other material adverse consequences on our business. In addition, animal pharmaceuticals and supplements are subject to extensive and ongoing regulatory requirements by the FDA and other regulatory authorities with regard to labeling, packaging, adverse event reporting, storage, advertising, promotion and recordkeeping.
There also have been increasing efforts by Congress and state and federal agencies, including state boards of pharmacy, departments of health, and the FDA, to regulate the pharmaceutical distribution system. Any failure to comply with any of these laws and regulations, or new interpretations of existing laws and regulations, or the enactment of any new or additional laws and regulations, could materially adversely affect our business. When we discover situations of non-compliance we seek to remedy them and bring the affected area back into compliance. If it is determined that we have not complied with these laws, we are potentially subject to penalties including warning letters, substantial civil and criminal fines and penalties, mandatory recall of product, seizure of product and injunction, consent decrees, and suspension or limitation of product sale and distribution. If we enter into settlement agreements to resolve allegations of non-compliance, we could be required to make settlement payments or be subject to civil and criminal penalties, including fines and the loss of licenses. Non-compliance with government requirements could also adversely affect our ability to participate in federal and state government health care programs, such as Medicare and Medicaid, and damage our reputation.
In the course of our business, we also may be subject to fines or penalties, equitable remedies (including but not limited to the suspension, revocation or non-renewal of licenses) and litigation. For example, in February 2020, Animal Health International pleaded guilty to a strict liability misdemeanor offense in connection with its failure to comply with federal law relating to the sales of prescription animal health products and was subject to a total criminal fine and forfeiture of $52.8 million. The reoccurrence of any such event may divert management's attention, cause us to suffer reputational harm and adversely affect our business, financial condition and results of operations.
If we fail to comply with evolving laws and regulations relating to confidentiality of sensitive personal information or standards in electronic health records or transmissions, we could be required to make significant product changes, or incur substantial liabilities.
Our practice management products and services include electronic information technology systems that store and process personal health, clinical, financial and other sensitive information of individuals. Both we and our customers are subject to numerous and evolving laws, regulations and industry standards, such as HIPAA and the Payment Card Industry Data Security Standards, which require the protection of the privacy and security of those records. The legal environment surrounding data privacy is demanding with the frequent imposition of new and changing regulatory requirements. Furthermore, our products may be used as part of our customers’ comprehensive data security programs, including in connection with their efforts to comply with applicable privacy and security laws. We are also subject to non-healthcare-specific requirements of the countries and states in which we operate which govern the handling, storage, use and protection of personal information, such as the California Consumer Privacy Act, or CCPA, which is a state statute intended to enhance privacy rights and consumer protection for residents of California, the California Privacy Rights Act, or CPRA, that became effective on January 1, 2023, and the pan-European General Data Protection Regulation, or GDPR. Additionally, nearly all other states have passed, proposed, or are considering comprehensive privacy legislation, and privacy bills have been proposed at the federal level that may result in additional legal requirements that impact our business.
In addition, the FDA has become increasingly active in addressing the regulation of computer software intended for use in health care settings, and has developed and continues to develop policies on regulating clinical decision support tools and other types of software as medical devices. Certain of our software and related products support practice management, and it is possible that the FDA or foreign government authorities could determine that one or more of our products is a medical device, which could subject us or one or more of our businesses to substantial additional requirements, costs and potential enforcement actions or liabilities for noncompliance with respect to these products.
Both in the U.S. and abroad, these laws and regulations continue to evolve and remain subject to significant change. In addition, the application and interpretation of these laws and regulations are often uncertain. If we fail to comply with such laws and regulations, we could be required to make significant changes to our products or services, or incur substantial fines, penalties, or other liabilities. The costs of compliance with, and the other burdens imposed by, new or existing laws or regulatory actions may prevent us from selling the products or services we distribute, or increase the costs of doing so, and may affect our decision to distribute such products or services. Also, evolving laws and regulations in this area could restrict the ability of our customers to obtain or use patient information, or could require us to incur significant additional costs to conform to these legal requirements.
In addition, the products and services we distribute may be vulnerable to breakdown, wrongful intrusions, data breaches and malicious attack. Perceived or actual security vulnerabilities in these products or services, or the perceived or actual failure by us or our customers who use these products or services to comply with applicable legal or contractual data privacy or security requirements, may not only cause reputational harm and loss of business, but may also lead to claims against us by our customers and/or governmental agencies and involve substantial damages, fines, penalties and other liabilities and expenses and costs for remediation.
Tax legislation could materially adversely affect our financial results and tax liabilities.
We are subject to the tax laws and regulations of the United States federal, state and local governments, as well as foreign jurisdictions which are extremely complex and subject to varying interpretations. From time to time, various legislative initiatives may be proposed that could materially adversely affect our tax positions. Effective for tax years beginning after December 31, 2022, the Inflation Reduction Act of 2022 established a new 15% corporate alternative minimum tax for corporations whose average adjusted net income for any consecutive three-year period beginning after December 31, 2022, exceeds $1.0 billion and a new a 1% excise tax on “net repurchases” of corporate stock. In addition, the Organization for Economic Cooperation and Development (“OECD”) has published a framework to implement a global minimum income tax rate of 15% through its base erosion and profit shifting pillar two project (“BEPS Pillar Two”). Countries around the world are in various stages of adopting these rules, some having enacted or substantively enacted legislation while others are drafting formal legislative proposals. The OECD guidance offers transition and safe harbor rules around the implementation of the BEPS Pillar Two global minimum tax. We continue to evaluate the impact of this new legislation. At this time, we do not expect the impact of this legislation to be material to our effective tax rate. However, there can be no assurance that our future effective tax rate will not be adversely affected by this legislation or any other legislative initiatives. Although we believe that our historical tax positions are sound and consistent with applicable laws, regulations and existing precedent, there can be no assurance that our tax positions will not be challenged by relevant tax authorities or that we would be successful in any such challenge.
Our international operations are subject to inherent risks that could adversely affect our business.
There are a number of risks inherent in foreign operations, including the U.S. Foreign Corrupt Practices Act and the U.K. Bribery Act, complex regulatory requirements, staffing and management complexities, import and export costs, other economic factors and political considerations, all of which are subject to unanticipated changes. Our foreign operations also expose us to foreign currency fluctuations. Because our financial statements are denominated in U.S. dollars, changes in currency exchange rates between the U.S. dollar and other currencies will have an impact on our income. Currency exchange rate fluctuations may adversely affect our results of operations and financial condition. Furthermore, we generally do not hedge translation exposure with respect to foreign operations.
GENERAL RISKS
Uncertain macro-economic conditions, including inflationary pressure, could materially adversely affect demand for dental and animal health products and services.
We are subject to uncertain macro-economic conditions that affect the economy and the economic outlook of the United States and other parts of the world in which we operate. In particular, recessionary or inflationary conditions
and depressed levels of consumer and commercial spending may cause dental and animal health customers to reduce, modify, delay or cancel plans to purchase the products we distribute and services we provide, may cause dental and animal health professionals to decrease or stop investing in their practices, and may cause suppliers to reduce their output or change their terms of sale. Increased fuel and energy costs (for example, the price of gasoline) and recent and prospective banking failures may adversely affect consumer confidence and, thereby, reduce dental and veterinary office visits. The impacts of efforts by federal, state and local governments to combat inflation are unpredictable and could have an adverse impact on consumer spending. Current interest rates have also created some tightening in the credit markets. Continued tight credit markets or credit market volatility may cause financing difficulties, which in turn may cause dental and animal health customers to reduce, modify, delay or cancel plans to purchase the products we distribute and services we provide. In addition, the average interest rate in our contract portfolio may not increase at the same rate as interest rate markets, resulting in a reduction of gain on contract sales as compared to the gain that would be realized if the average interest rate in our portfolio were to increase at a rate more similar to the interest rate markets. Tension between the U.S. and China, as well as conflicts involving Russia, Ukraine, Israel and Gaza, and other unrest, also are creating increased global and economic uncertainty, which could adversely affect spending on the dental and animal health products and services we distribute. Global political and/or trade issues also could adversely impact the ability of U.S. producers to export finished protein products to other countries in the world. Furthermore, although inflation did not materially impact our results of operations in fiscal 2024, cost inflation during fiscal 2024, including wage inflation, generally increased our operating costs, including our cost of goods, transportation costs, labor costs and other administrative costs. We may face higher and sustained rates of inflation, with subsequent increases in operational costs that we may be unable to pass through to our dental and animal health customers.
Item 1B. UNRESOLVED STAFF COMMENTS
None.
Item 1C. CYBERSECURITY
Risk management and strategy
Our processes for assessing, identifying, and managing material risks from cybersecurity threats are incorporated into our overall enterprise risk management framework. We take a cross-functional approach to cybersecurity risk, which includes input from information security, information technology, legal, compliance, internal audit, finance, and operations, as appropriate. Under the oversight of our Board, including its Audit and Finance Committee, our senior management, information security team, and our Cybersecurity Risk Committee (comprised of key executive and senior leaders from primary corporate functions) devote resources to cybersecurity and implement risk management processes designed to adapt to the changing cybersecurity landscape, respond to emerging threats and proactively coordinate our people, processes and procedures to respond to cybersecurity incidents. We regularly assess the threat landscape and cybersecurity risks. Our internal audit team reviews enterprise risk management-level cybersecurity risks as part of our overall enterprise risk management framework. In addition, our information security team oversees regular monitoring of our information technology and other operating systems that are designed to detect potential security incidents. We have operationalized a written incident response plan designed to assess, identify and coordinate among various functions the response activities to cyber incidents and determine the impact of any such cybersecurity incidents that may jeopardize the confidentiality, integrity or availability of our information systems or adversely affect our business and information systems. In the event of a significant cybersecurity incident, the incident response plan provides guidance on roles, responsibilities, procedures and reporting processes.
Depending on the environment and system, we have implemented a number of measures and policies designed to enhance the security and resiliency of our network, information and data systems, including but not limited to: encryption standards; antivirus protection; remote access; multifactor authentication; treatment of confidential information and the use of the internet, artificial intelligence, social media, email and wireless devices; user access control management; intrusion monitoring systems; information security continuity measures, including redundant systems and information backups; network segmentation; encryption of certain data; event logging; and implementation of an application patching and update cadence. These measures and policies go through an internal review process and are approved by appropriate members of management.
We have performed simulations and tabletop exercises at a management level. Our employees are required to complete cybersecurity training at least once every year and have access to more frequent cybersecurity trainings online. We also require certain employees to complete additional role-based cybersecurity trainings. Our information
security team regularly monitors for potential cybersecurity incidents and we have processes in place designed to escalate within the company more serious incidents, as appropriate.
We use consultants and other third parties to assist us from time to time to identify, assess, and manage material risks from cybersecurity threats, including for example, cybersecurity software providers, managed cybersecurity service providers, professional cybersecurity advisors, and penetration testing firms.
Depending on the nature of the services provided, the sensitivity of the systems and data at issue, and the identity of the service provider, we take various measures designed to help manage cybersecurity risk associated with our use of third-party service providers, which may include due diligence; monitoring of cybersecurity threat risks identified through such diligence in connection with our use of third-party service providers; and imposing certain contractual obligations.
While we face a number of cybersecurity risks in connection with our business and from time to time we have had to address non-material security incidents and expect to experience security incidents in the future, we are not aware of any risks from cybersecurity threats that have materially affected or are reasonably likely to materially affect our business strategy, results of operations, or financial condition. For more information about the cybersecurity risks we face that may materially affect the Company, see the risk factor entitled “Risks generally associated with information systems, software products and cybersecurity attacks could adversely affect our results of operations” in Item 1A - Risk Factors.
Governance
Our Chief Information Security Officer (CISO) is responsible for developing and implementing our cybersecurity risk management and information security program, including regularly reporting on cybersecurity matters to management and the Audit and Finance Committee. He has a Bachelor of Science degree in Information Technology from Saint Mary’s University of Minnesota and over 25 years of experience covering a wide range of enterprise IT and Information Security programs for large, global corporations. He also has multiple industry certifications, including as a Certified Information Systems Security Professional (CISSP), and participates in various security leadership forums and committees. Our CISO has led our cybersecurity program since joining our company in 2018, and was recently promoted to CISO from Senior Director, Information Security.
Our CISO reports to our Chief Information Officer (CIO), who has held that role for 7 years and oversees our broader information technology program. He has over 30 years of information technology experience, including over 20 years in leadership roles.
Among other matters, our Board delegates to our Audit and Finance Committee the oversight of our programs, policies, and procedures related to cybersecurity, information asset security, and network security. Broad oversight is maintained by our full Board, which receives regular reports from the Audit and Finance Committee as well as management, as appropriate. The Audit and Finance Committee and the full Board actively participate in discussions with management and among themselves regarding cybersecurity risk. Our CIO and CISO present to the Audit and Finance Committee at least a bi-annual review of our strategies, policies and internal controls relating to information technology and cybersecurity (including network security, cloud security and physical security), with respect to corporate goals, industry trends and competitive advantages. To aid the Board with its cybersecurity oversight responsibilities, the Board also receives regular presentations on these topics. Our incident response plan is designed to escalate certain cybersecurity incidents, from our information security team and CISO, through our Chief Legal Officer and CIO, to our Audit and Finance Committee, depending on the impact of the incident.
Item 2. PROPERTIES
We own our principal executive offices in St. Paul, Minnesota, and the majority of our distribution facilities. Leases of other distribution and administrative facilities generally are on a long-term basis, expiring at various times, with options to renew for additional periods. Most sales offices are leased for varying and usually shorter periods, with or without renewal options. We believe our properties are in good operating condition and are suitable for the purposes for which they are being used.
Patterson Logistics Services
The majority of assets we use to distribute product are owned and operated by Patterson Logistics Services, Inc. (“PLSI”), a wholly-owned subsidiary, which operates the distribution function for the benefit of our dental and animal health segments in the U.S. PLSI also advises on the operations of our fulfillment centers outside of the U.S., but these properties are not owned by PLSI.
As of April 27, 2024, PLSI operated the following 13 fulfillment centers (seven primary centers) totaling 1.0 million square feet:
•two dental fulfillment centers (Hawaii and Texas);
•four animal health fulfillment centers (Alabama, Colorado and Texas (two)); and
•seven fulfillment centers that distribute dental and animal health products (California, Florida, Indiana, Iowa, Pennsylvania, South Carolina and Washington).
Approximately 90% of the PLSI fulfillment center space is owned.
Dental
The Dental segment is headquartered in our principal executive offices, and maintains sales and administrative offices at approximately 55 locations across 39 states in the U.S. and 10 locations in Canada, the majority of which are leased. Operations in Canada are supported by fulfillment centers located in Quebec and Alberta.
Animal Health
In addition to the locations operated by PLSI, Patterson Animal Health has approximately 100 properties located in the U.S., Canada and the U.K., the majority of which are leased. In the U.S., these properties are in 82 locations across 28 states, and comprise fulfillment centers, storage locations, sales and administrative offices, retail stores and call centers. In Canada, operations are supported by two fulfillment centers located in Alberta and Ontario. The segment’s operations in the U.K. are supported by a primary distribution facility in Stoke-on-Trent and an additional 10 depots used as secondary distribution points and 3 laboratory sites throughout the U.K. The headquarters for this segment are located in a leased office in Colorado.
Item 3. LEGAL PROCEEDINGS
For a discussion of Legal Proceedings, see Note 17 - Litigation of the Notes to the Consolidated Financial Statements included under Item 8.
Item 4. MINE SAFETY DISCLOSURES
Not applicable.
PART II
Item 5. MARKET FOR REGISTRANT’S COMMON EQUITY, RELATED STOCKHOLDER MATTERS AND ISSUER PURCHASES OF EQUITY SECURITIES
Market Information
Patterson’s common stock trades on the NASDAQ Global Select Market® under the symbol “PDCO.”
Holders
On June 10, 2024, the number of holders on record of common stock was 1,570. The transfer agent for Patterson’s common stock is EQ Shareowner Services, 1110 Centre Pointe Curve, Suite 101, Mendota Heights, Minnesota 55120, telephone: (800) 468-9716.
Dividends
In fiscal 2024, a quarterly cash dividend of $0.26 per share was declared throughout the year. In fiscal 2024, dividends were declared each quarter, with payment occurring in the subsequent quarter. We currently expect to declare and pay quarterly cash dividends in the future, but any future dividends will be subject to approval by our Board of Directors, which will depend on our earnings, capital requirements, operating results and financial condition, as well as applicable law, regulatory constraints, industry practice and other business considerations that our Board considers relevant. We are also subject to various financial covenants under our debt agreements including the maintenance of leverage and interest coverage ratios. The terms of agreements governing debt that we may incur in the future may also contain similar covenants. Accordingly, there can be no assurance that we will declare and pay dividends in the future at the same rate or at all.
Purchases of Equity Securities by the Issuer
On March 11, 2024, the Board of Directors authorized a $500 million share repurchase program through March 16, 2027, replacing a prior authorization which was expiring and under which there was $180.0 million remaining. As of April 27, 2024 there was $500.0 million remaining under the current stock repurchase program.
The following table presents activity under the stock repurchase plan during the fourth quarter of fiscal 2024.
| | | | | | | | | | | | | | | | | | | | | | | |
| Total Number of Shares Purchased | | Average Price Paid per Share | | Total Number of Shares Purchased as Part of Publicly Announced Plans or Programs | | Maximum Dollar Value of Shares That May Yet Be Purchased Under the Plan |
| January 28, 2024 to February 24, 2024 | — | | | $ | — | | | — | | | $ | 194,920,532 | |
| February 25, 2024 to March 23, 2024 | 497,859 | | | 29.97 | | | 497,859 | | | 500,000,000 | |
| March 24, 2024 to April 27, 2024 | — | | | — | | | — | | | 500,000,000 | |
| 497,859 | | | $ | 29.97 | | | 497,859 | | | $ | 500,000,000 | |
Performance Graph
The graph below compares the cumulative total shareholder return on $100 invested at the market close on April 26, 2019, through April 27, 2024, with the cumulative return over the same time period on the same amount invested in the S&P Mid-Cap 400 and the Dow Jones U.S. Health Care Index.
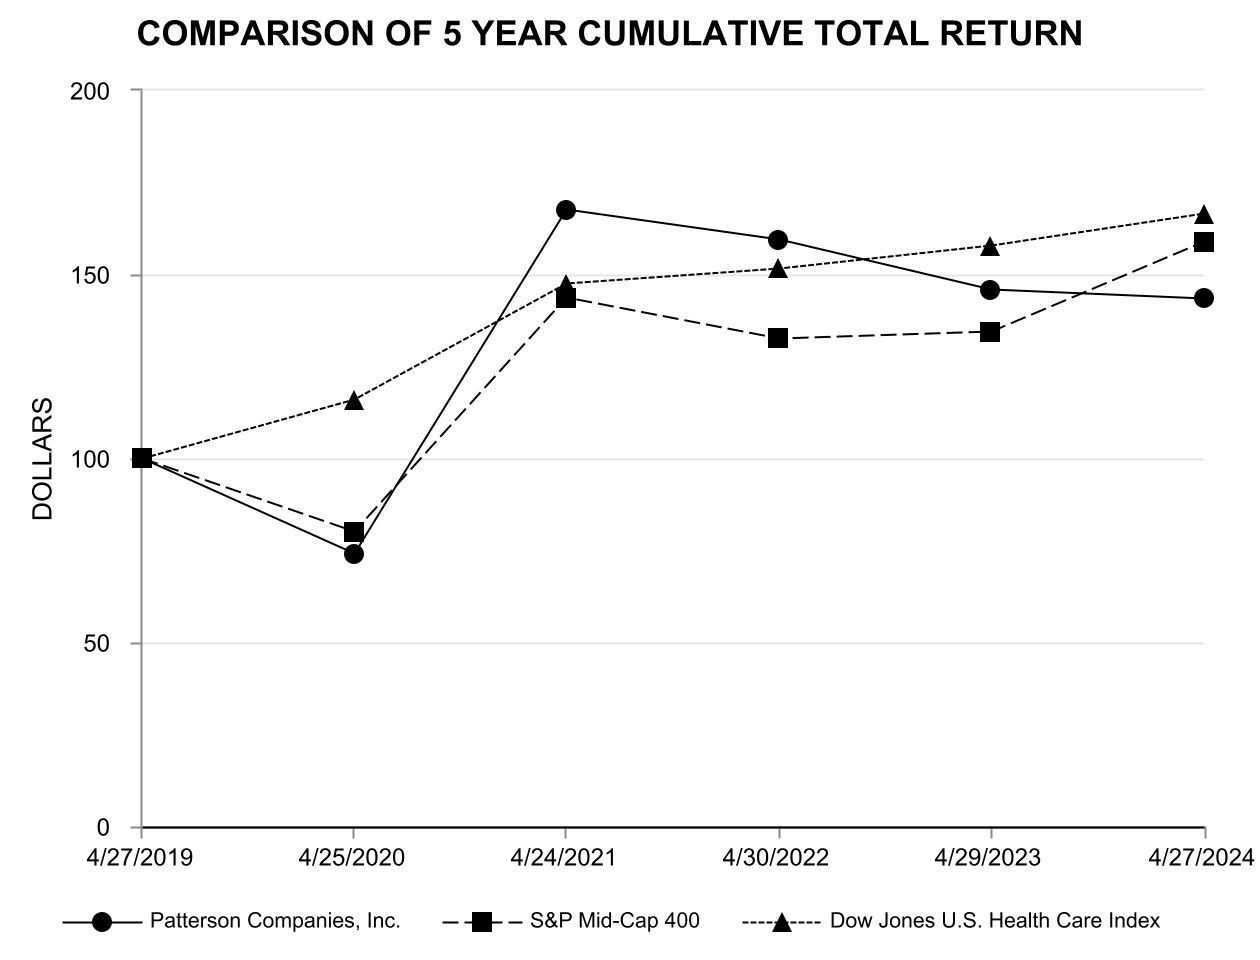
| | | | | | | | | | | | | | | | | | | | | | | | | | | | | | | | | | | |
| Fiscal Year Ending |
| 4/27/2019 | | 4/25/2020 | | 4/24/2021 | | 4/30/2022 | | 4/29/2023 | | 4/27/2024 |
| Patterson Companies, Inc. | 100.00 | | | 73.95 | | | 167.59 | | | 159.40 | | | 145.68 | | | 143.43 | |
| S&P Mid-Cap 400 | 100.00 | | | 79.97 | | | 143.67 | | | 132.60 | | | 134.37 | | | 158.82 | |
| Dow Jones U.S. Health Care Index | 100.00 | | | 115.78 | | | 147.47 | | | 151.61 | | | 157.69 | | | 166.39 | |
Item 6. [RESERVED]
Item 7. MANAGEMENT’S DISCUSSION AND ANALYSIS OF FINANCIAL CONDITION AND RESULTS OF OPERATIONS
Overview
Our financial information for fiscal 2024 is summarized in this Management’s Discussion and Analysis and the Consolidated Financial Statements and related Notes. The following background is provided to readers to assist in the review of our financial information.
We present three reportable segments: Dental, Animal Health and Corporate. Dental and Animal Health are strategic business units that offer similar products and services to different customer bases. Dental provides a virtually complete range of consumable dental products, equipment, turnkey digital solutions and value-added services to dentists and dental laboratories throughout North America. Animal Health is a leading, full-line distributor in North America and the U.K. of animal health products, services and technologies to both the production-animal and companion-pet markets. Our Corporate segment is comprised of general and administrative expenses, including home office support costs in areas such as information technology, finance, legal, human resources and facilities. In addition, customer financing and other miscellaneous sales are reported within Corporate results.
Operating margins of the animal health business are lower than the dental business. While operating expenses run at a lower rate in the animal health business when compared to the dental business, gross margins in the animal health business are lower due generally to the low margins experienced on the sale of pharmaceutical products.
We operate with a 52-53 week accounting convention with our fiscal year ending on the last Saturday in April. Fiscal 2024 ended on April 27, 2024 and consisted of 52 weeks. Fiscal 2023 ended on April 29, 2023 and consisted of 52 weeks. Fiscal 2022 ended on April 30, 2022 and consisted of 53 weeks. Fiscal 2025 will end on April 26, 2025 and will consist of 52 weeks.
We believe there are several important aspects of our business that are useful in analyzing it, including: (1) growth in the various markets in which we operate; (2) internal growth; (3) growth through acquisition; and (4) continued focus on controlling costs and enhancing efficiency. Management defines internal growth as net sales adjusted to exclude the impact of foreign currency, changes in product selling relationships and contributions from recent acquisitions. Foreign currency impact represents the difference in results that is attributable to fluctuations in currency exchange rates the company uses to convert results for all foreign entities where the functional currency is not the U.S. dollar. The company calculates the impact as the difference between the current period results translated using the current period currency exchange rates and using the comparable prior period’s currency exchange rates. The company believes the disclosure of net sales changes in constant currency provides useful supplementary information to investors in light of significant fluctuations in currency rates.
Factors Affecting Our Results
Macro-economic Conditions. We are impacted by various conditions that create uncertainty in our macro-economic environment. Cost inflation and higher interest rates may affect our customer's willingness to invest in capital equipment and could impact our customers' volume of purchases. Interest expense on variable rate indebtedness increased due to higher interest rates. Cost inflation increased certain operating costs, and Patterson has implemented price increases in response; however, cost inflation did not materially impact our net results of operations in fiscal 2024.
Receivables Securitization Program. We are a party to certain receivables purchase agreements with MUFG Bank, Ltd. ("MUFG"), under which MUFG acts as an agent to facilitate the sale of certain Patterson receivables (the “Receivables”) to certain unaffiliated financial institutions (the “Purchasers”). The proceeds from the sale of these Receivables comprise a combination of cash and a deferred purchase price (“DPP”) receivable. The DPP receivable is ultimately realized by Patterson following the collection of the underlying Receivables sold to the Purchasers. The collection of the DPP receivable is recognized as an increase to net cash provided by investing activities within the Consolidated Statements of Cash Flows, with a corresponding reduction to net cash used in operating activities within the Consolidated Statements of Cash Flows.
Fiscal 2022 Legal Reserve. On August 27, 2021, we signed a memorandum of understanding to settle the federal securities class action complaint against Patterson Companies, Inc. and its former CEO and former CFO filed by Plymouth County Retirement System on March 28, 2018. Under the terms of the settlement, Patterson agreed to pay $63.0 million to resolve the case. Although we agreed to settle this matter, we expressly deny the allegations of the complaint and all liability. Our insurers consented to the settlement and contributed an aggregate of $35.0
million to fund the settlement and to reimburse us for certain costs and expenses of the litigation. As a result of the foregoing, we recorded a pre-tax reserve of $63.0 million in other accrued liabilities in the Consolidated Balance Sheets in our Corporate segment during the first quarter of fiscal 2022 related to the probable settlement of this litigation (the "Fiscal 2022 Legal Reserve"). During the first quarter of fiscal 2022, we also recorded a receivable of $27.0 million in prepaid expenses and other current assets in the Consolidated Balance Sheets in our Corporate segment related to probable insurance recoveries, which amount was paid into the litigation settlement escrow as required by the memorandum of understanding. The net expense of $36.0 million was recorded in operating expenses in our Consolidated Statements of Operations and Other Comprehensive Income. We recorded a gain of $8.0 million during the second quarter of fiscal 2022 in our Corporate segment to account for our receipt of carrier reimbursement of previously expended fees and costs. On June 10, 2022, the U.S. District Court for the District of Minnesota entered an order granting final approval to the settlement.
Gains on Vetsource Investment. In fiscal 2022, we sold a portion of our investment in Vetsource, with a carrying value of $25.8 million, for $56.8 million. We recorded a pre-tax gain of $31.0 million in gains on investments in our Consolidated Statements of Operations and Other Comprehensive Income as a result of this sale. The cash received of $56.8 million is reported within investing activities in our Consolidated Statements of Cash Flows. We also recorded a pre-tax non-cash gain of $31.0 million to reflect the increase in the carrying value of the remaining portion of our investment in Vetsource, which was based on the selling price of the portion of the investment we sold for $56.8 million. This gain was recorded in gains on investments in our Consolidated Statements of Operations and Other Comprehensive Income. Concurrent with the sale, we obtained rights that will allow us, under certain circumstances, to require another shareholder of Vetsource to purchase our remaining shares. We recorded a pre-tax non-cash gain of $25.8 million in gains on investments in our Consolidated Statements of Operations and Other Comprehensive Income as a result of this transaction. The aggregate gains on investments of $87.8 million are reported within operating activities in our Consolidated Statements of Cash Flows. Concurrent with obtaining this put option, we also granted rights to the same Vetsource shareholder that would allow such shareholder, under certain circumstances, to require us to sell our remaining shares at fair value.
Gain on Vets Plus Investment. In fiscal 2022, we sold a portion of our investment in Vets Plus with a carrying value of $4.0 million for $17.1 million. We recorded a pre-tax gain of $13.1 million in gains on investments in our Consolidated Statements of Operations and Other Comprehensive Income as a result of this sale. This $13.1 million pre-tax gain is reported within operating activities in our Consolidated Statements of Cash Flows. The cash received of $17.1 million is reported within investing activities in our Consolidated Statements of Cash Flows.
Inventory Donation Charges. In fiscal 2022, we committed to donate certain personal protective equipment to charitable organizations to assist with COVID-19 recovery efforts. We recorded a charge of $49.2 million within cost of sales in our Consolidated Statements of Operations and Other Comprehensive Income as a result ("Inventory Donation Charges") in the first quarter of fiscal 2022. These charges were driven by our intention to not sell these products, but rather to donate them to charitable organizations. Of the $49.2 million expense recorded, $47.2 million and $2.0 million was recorded within our Dental and Animal Health segments, respectively.
Results of Operations
The following table summarizes our results as a percent of net sales: | | | | | | | | | | | | | | | | | |
| | Fiscal Year Ended |
| | April 27, 2024 | | April 29, 2023 | | April 30, 2022 |
| Net sales | 100.0 | % | | 100.0 | % | | 100.0 | % |
| Cost of sales | 79.0 | | | 78.8 | | | 80.2 | |
| Gross profit | 21.0 | | | 21.2 | | | 19.8 | |
| Operating expenses | 17.1 | | | 16.9 | | | 17.4 | |
| | | | | |
| Operating income | 3.9 | | | 4.3 | | | 2.4 | |
| Other income (expense), net | (0.2) | | | (0.1) | | | 1.7 | |
| Income before taxes | 3.7 | | | 4.2 | | | 4.1 | |
| Income tax expense | 0.9 | | | 1.0 | | | 1.0 | |
| | | | | |
| | | | | |
| Net income | 2.8 | | | 3.2 | | | 3.1 | |
| Net loss attributable to noncontrolling interests | — | | | — | | | — | |
| Net income attributable to Patterson Companies, Inc. | 2.8 | % | | 3.2 | % | | 3.1 | % |
Fiscal 2024 Compared to Fiscal 2023
Net sales. Consolidated net sales in fiscal 2024 were $6,568.3 million, an increase of 1.5% from $6,471.5 million in fiscal 2023. Foreign exchange rate changes had a favorable impact of 0.4% on fiscal 2024 sales. The impact of acquisitions for fiscal 2024 contributed a net increase in sales of approximately 0.3%.
Dental segment net sales decreased 0.1% to $2,488.6 million in fiscal 2024 from $2,492.1 million in fiscal 2023. Foreign exchange rate changes had an unfavorable impact of 0.1% on fiscal 2024 net sales. Net sales of consumables increased 4.2%, net sales of equipment decreased 7.0%, and net sales of value-added services and other decreased 0.9% in fiscal 2024. The decrease in equipment net sales was experienced across imaging and digital categories.
Animal Health segment net sales increased 2.6% to $4,067.1 million in fiscal 2024 from $3,964.9 million in fiscal 2023. Foreign exchange rate changes had a favorable impact of 0.8% on fiscal 2024 net sales. Acquisitions contributed 0.5% to Animal Health net sales in fiscal 2024. The net sales growth in fiscal 2024 was primarily due to market share gains within Production Animal categories led by beef, dairy and swine.
Gross profit. Consolidated gross profit margin decreased 20 basis points from the prior year to 21.0%. Approximately 10 basis points of gross margin decline was due to the widely-reported cybersecurity attack on our vendor partner, Change Healthcare, in fiscal 2024, which resulted in many dental practices being unable to process insurance claims. Many of our practice management software solutions incorporated fee-based integration with Change Healthcare for claims management for our customers. During the outage, Patterson suspended charging for that service, which impacted the net sales and gross profit of our Dental segment. The Corporate segment net sales and gross profit included unfavorable impacts of interest rate changes on our customer financing portfolio in both fiscal 2024 and 2023. This interest rate impact was partially offset by a gain on associated interest rate swap agreements, which is reflected in other income, net in our Consolidated Statements of Operations and Other Comprehensive Income.
Operating expenses. Consolidated operating expenses for fiscal 2024 were $1,127.3 million, a 2.8% increase from the prior year of $1,097.0 million. The consolidated operating expense ratio of 17.1% in fiscal 2024 increased 20 basis points from the prior fiscal year. The increase in operating expenses included investment in margin-accretive initiatives, technology, and facility enhancements in fiscal 2024 and was impacted by a $3.6 million gain on sale of an office building in fiscal 2023.
Operating income. Fiscal 2024 operating income was $252.9 million, or 3.9% of net sales, as compared to $276.0 million, or 4.3% of net sales, in fiscal 2023. The change in operating income was primarily driven by an increase in operating expenses, partially offset by the increase in net sales and gross profit, in fiscal 2024 as compared to fiscal 2023.
Dental segment operating income was $209.8 million for fiscal 2024, a decrease of $27.5 million from fiscal 2023. The decrease was primarily driven by investments in our commercial software business, a decrease in equipment net sales and the impact of the Change Healthcare cybersecurity attack in fiscal 2024. The change was also impacted by a $3.6 million gain on sale of an office building in fiscal 2023.
Animal Health segment operating income was $139.1 million for fiscal 2024, an increase of $12.1 million from fiscal 2023. The increase was primarily driven by a growth in net sales and gross profit, partially offset by higher operating expenses, in fiscal 2024.
Corporate segment operating loss was $96.0 million for fiscal 2024, as compared to a loss of $88.3 million for fiscal 2023. The change was primarily attributable to an increase in operating expenses and unfavorable impacts of interest rate changes on our customer financing portfolio in fiscal 2024.
Other income (expense). Net other expense was $9.9 million in fiscal 2024, compared to net other expense of $5.8 million in fiscal 2023. The increase was primarily due to higher interest expense, partially offset by a higher gain on interest rate swaps.
Income tax expense. The effective income tax rate for fiscal 2024 was 23.7%, compared to 23.5% for fiscal 2023.
Net income attributable to Patterson Companies, Inc. and earnings per share. Net income attributable to Patterson Companies Inc. was $185.9 million in fiscal 2024, compared to $207.6 million in fiscal 2023. Earnings per diluted share were $1.98 in fiscal 2024, compared to $2.12 in fiscal 2023. Weighted average diluted shares in fiscal
2024 were 93.7 million, compared to 97.8 million in fiscal 2023. The fiscal 2024 and fiscal 2023 cash dividend declared was $1.04 per common share.
Fiscal 2023 Compared to Fiscal 2022
See Item 7 in our 2023 Annual Report on Form 10-K filed June 21, 2023.
Liquidity and Capital Resources
Net cash used in operating activities was $789.4 million in fiscal 2024, compared to $754.9 million in fiscal 2023 and $981.0 million in fiscal 2022. Net cash used in operating activities in fiscal 2024 and fiscal 2023 was primarily due to the impact of our Receivables Securitization Program. Net cash used in operating activities in fiscal 2022 was primarily due to the impact of our Receivables Securitization Program and a net increase in inventory, inclusive of the impact of the $49.2 million Inventory Donation Charges, partially offset by an increase in accounts payable.
Net cash provided by investing activities was $959.5 million in fiscal 2024, compared to $901.6 million in fiscal 2023 and $1,239.0 million in fiscal 2022. Collections of deferred purchase price receivables were $1,028.3 million, $998.9 million and $1,213.5 million in fiscal 2024, 2023 and 2022, respectively. In fiscal 2024, we used $1.1 million to pay a holdback following the acquisition of substantially all of the assets of Miller Vet Holdings, LLC, which was due on the 24 month anniversary of the closing date. In fiscal 2023, we recorded cash receipts of $15.2 million from a sale of an office building and used cash of $33.3 million for acquisitions and $15.0 million to purchase a Dental investment. In fiscal 2022, we recorded cash receipts of $75.9 million from the sale of investments and used $19.8 million to acquire Miller Vet. Capital expenditures were $67.6 million, $64.2 million and $38.3 million in fiscal 2024, 2023 and 2022, respectively. We expect to use a total of approximately $75 million for capital expenditures in fiscal 2025.
Net cash used in financing activities in fiscal 2024 was $215.9 million, driven by $229.5 million in share repurchases, $98.3 million for dividend payments and $36.0 million for payments on long-term debt, partially offset by $141.0 million draw on our revolving line of credit. Net cash used in financing activities in fiscal 2023 was $126.5 million, driven by $101.3 million for dividend payments, $55.5 million in share repurchases and $1.5 million for payments on long-term debt, partially offset by $16.0 million draw on our revolving line of credit. Net cash used in financing activities in fiscal 2022 was $253.2 million, driven by $101.1 million for dividend payments, $100.8 million for payments on long-term debt, $35.0 million in share repurchases and $24.0 million attributed to payments on our revolving line of credit.
In fiscal 2024, 2023 and 2022, a quarterly cash dividend of $0.26 per share was declared each quarter, with payment occurring in the subsequent quarter. We currently expect to declare and pay quarterly cash dividends in the future, but any future dividends will be subject to approval by our Board of Directors, which will depend on our earnings, capital requirements, operating results and financial condition, as well as applicable law, regulatory constraints, industry practice and other business considerations that our Board considers relevant. We are also subject to various financial covenants under our debt agreements including the maintenance of leverage and interest coverage ratios. The terms of agreements governing debt that we may incur in the future may also contain similar covenants. Accordingly, there can be no assurance that we will declare and pay dividends in the future at the same rate or at all.
In fiscal 2021, we entered into an amendment, restatement and consolidation of certain credit agreements with various lenders, including MUFG Bank, Ltd, as administrative agent. This amended and restated credit agreement (the “Credit Agreement”) consisted of a $700.0 million revolving credit facility and a $300.0 million term loan facility, and was set to mature no later than February 2024.
In fiscal 2023, we amended and restated the Credit Agreement (the “Amended Credit Agreement”). The Amended Credit Agreement consists of a $700.0 million revolving credit facility and a $300.0 million term loan facility, and will mature no later than October 2027. We used the Amended Credit Agreement facilities to refinance and consolidate the Credit Agreement, and pay the fees and expenses incurred therewith. We expect to use the Amended Credit Agreement to finance our ongoing working capital needs and for other general corporate purposes.
As of April 27, 2024, $295.5 million was outstanding under the Amended Credit Agreement term loan at an interest rate of 6.54% and $186.0 million was outstanding under the Amended Credit Agreement revolving credit facility at an interest rate of 6.53%. As of April 29, 2023, $298.5 million was outstanding under the Credit Agreement term loan at an interest rate of 6.08%, and $45.0 million was outstanding under the Credit Agreement revolving credit facility at an interest rate of 5.93%.
On March 11, 2024, the Board of Directors authorized a $500 million share repurchase program through March 16, 2027, replacing a prior authorization which was expiring and under which there was $180.0 million remaining. As of April 27, 2024, $500.0 million remains available under the current repurchase authorization.
We have $114.5 million in cash and cash equivalents as of April 27, 2024, of which $59.3 million is in foreign bank accounts. See Note 12 to the Consolidated Financial Statements for further information regarding our intention to permanently reinvest these funds. Included in cash and cash equivalents as of April 27, 2024 is $33.8 million of cash collected from previously sold customer financing arrangements that have not yet been settled with the third party. See Note 5 to the Consolidated Financial Statements for further information.
We expect the collection of deferred purchase price receivables, existing cash balances and credit availability under existing debt facilities, less our funds used in operations, will be sufficient to meet our working capital needs and to finance our business over the next fiscal year.
We expect to continue to obtain liquidity from the sale of equipment finance contracts. Patterson sells a significant portion of our finance contracts (see below) to a commercial paper funded conduit managed by a third party bank, and as a result, commercial paper is indirectly an important source of liquidity for Patterson. Patterson is allowed to participate in the conduit due to the quality of our finance contracts and our financial strength. Cash flows could be impaired if our financial strength diminishes to a level that precluded us from taking part in this facility or other similar facilities. Also, market conditions outside of our control could adversely affect the ability for us to sell the contracts.
Customer Financing Arrangements
As a convenience to our customers, we offer several different financing alternatives, including a third party program and a Patterson-sponsored program. For the third party program, we act as a facilitator between the customer and the third party financing entity with no on-going involvement in the financing transaction. Under the Patterson-sponsored program, equipment purchased by creditworthy customers may be financed up to a maximum of $2 million. We generally sell our customers’ financing contracts to outside financial institutions in the normal course of our business.
We operate under an agreement to sell a portion of our equipment finance contracts to commercial paper conduits with MUFG Bank, Ltd. ("MUFG") serving as the agent. We utilize PDC Funding to fulfill a requirement of participating in the commercial paper conduit. We receive the proceeds of the contracts upon sale to MUFG. At least 15.0% of the proceeds are held by the conduit as security against eventual performance of the portfolio. This percentage can be greater and is based upon certain ratios defined in the agreement with MUFG. The capacity under the agreement with MUFG at April 27, 2024 was $575,000.
Our financing business is described in further detail in Note 5 to the Consolidated Financial Statements.
Contractual Obligations
A summary of our contractual obligations as of April 27, 2024 was as follows (in thousands): | | | | | | | | | | | | | | | | | | | | | | | | | | | | | |
| | Payments due by year |
| | Total | | Less than
1 year | | 1-3 years | | 3-5 years | | More than
5 years |
| Long-term debt principal | $ | 453,000 | | | $ | 122,750 | | | $ | 26,250 | | | $ | 304,000 | | | $ | — | |
| Long-term debt interest | 79,759 | | | 23,827 | | | 38,136 | | | 17,796 | | | — | |
| Operating leases | 147,926 | | | 38,047 | | | 55,979 | | | 27,833 | | | 26,067 | |
| Total | $ | 680,685 | | | $ | 184,624 | | | $ | 120,365 | | | $ | 349,629 | | | $ | 26,067 | |
As of April 27, 2024, our gross liability for uncertain tax positions, including interest and penalties, was $9.8 million. We are not able to reasonably estimate the amount by which the liability will increase or decrease over an extended period of time or whether a cash settlement of the liability will be required. Therefore, these amounts have been excluded from the schedule of contractual obligations.
For a more complete description of our contractual obligations, see Notes 10 and 11 to the Consolidated Financial Statements.
Working Capital Management
The following table summarizes our average accounts receivable days sales outstanding and average annual inventory turnover for the past three fiscal years:
| | | | | | | | | | | | | | | | | |
| Fiscal Year Ended |
| April 27, 2024 | | April 29, 2023 | | April 30, 2022 |
| Days sales outstanding | 28.6 | | | 25.0 | | | 25.2 | |
| Inventory turnover | 6.2 | | | 6.2 | | | 6.6 | |
Foreign Operations
We derive foreign sales from Dental operations in Canada, and Animal Health operations in Canada and the U.K. Fluctuations in currency exchange rates have not significantly impacted earnings, as these fluctuations impact sales, cost of sales and operating expenses. Changes in exchange rates positively impacted net sales by $27.8 million in fiscal 2024 and adversely affected net sales by $108.5 million in fiscal 2023, while they positively impacted net sales by $41.0 million in fiscal 2022. Changes in currency exchange rates are a risk accompanying foreign operations, but this risk is not considered material with respect to our consolidated operations.
Critical Accounting Policies and Estimates
Patterson has adopted various accounting policies to prepare our Consolidated Financial Statements in accordance with accounting principles generally accepted in the U.S. Management believes that our policies are conservative and our philosophy is to adopt accounting policies that minimize the risk of adverse events having a material impact on recorded assets and liabilities. However, the preparation of financial statements requires the use of estimates and judgments regarding the realization of assets and the settlement of liabilities based on the information available to management at the time. Changes subsequent to the preparation of the financial statements in economic, technological and competitive conditions may materially impact the recorded values of Patterson’s assets and liabilities. Therefore, the users of the financial statements should read all the Notes to the Consolidated Financial Statements and be aware that conditions currently unknown to management may develop in the future. This may require a material adjustment to a recorded asset or liability to consistently apply to our significant accounting principles and policies that are discussed in Note 1 to the Consolidated Financial Statements. The financial performance and condition of Patterson may also be materially impacted by transactions and events that we have not previously experienced and for which we have not been required to establish an accounting policy or adopt a generally accepted accounting principle.
Revenue Recognition – Revenues are generated from the sale of consumable products, equipment and support, software and support, technical service parts and labor, and other sources. Revenues are recognized when or as performance obligations are satisfied. Performance obligations are satisfied when the customer obtains control of the goods or services.
Estimates for returns, damaged goods, rebates, loyalty programs and other revenue allowances are made at the time the revenue is recognized based on the historical experience for such items. The receivables that result from the recognition of revenue are reported net of related allowances. We maintain a valuation allowance based upon the expected collectability of receivables held. Estimates are used to determine the valuation allowance and are based on several factors, including historical collection data, economic trends, and credit worthiness of customers.
Receivables from vendors earned as a result of volume rebates and reimbursements for customer pricing contracts and promotions are recorded as a reduction of cost of sales in the period in which the related revenue is recognized. We estimate the vendor receivables earned but not received based on sales forecasts, transactional data, and historical vendor collection trends.
We offer customer financing contracts on equipment purchases by creditworthy customers. For financing contracts at a below-market interest rate, we record a subsidy as a reduction to net sales in the period the contract is originated. The subsidy on below-market rate contracts is estimated based on analyses of current publicly-available interest rate trends. We do not consider contracts with a term of one year or less to have a significant financing component and do not record a subsidy for these contracts.
We generally sell our customers’ financing contracts to outside financial institutions in the normal course of our business. These financing arrangements are accounted for as a sale of assets under the provisions of ASC 860, Transfers and Servicing. We receive the proceeds of the contracts upon sale to financial institutions, with a portion of the proceeds held by the financial institutions as a deferred purchase price (DPP) as security against eventual
performance of the portfolio. Customer financing net sales include the impact of changes in interest rates on DPP receivables, as the average interest rate in our contract portfolio may not fluctuate at the same rate as interest rate markets, resulting in an increase or reduction of gain on contract sales. We enter into an interest rate swap to hedge a portion of the related interest rate risk. These agreements do not qualify for hedge accounting, and the gains or losses on an interest rate swap are reported in other income and expense in our consolidated statements of operation and other comprehensive income.
Our financing business is described in further detail in Note 5 to the Consolidated Financial Statements.
Inventory and Reserves – Inventory primarily consists of merchandise held for sale and is stated at the lower of cost or market. Cost is determined using the last-in, first-out ("LIFO") method for all inventories, except for foreign inventories, which are valued using the first-in, first-out ("FIFO") method. We continually assess the valuation of inventories and reduce the carrying value of those inventories that are obsolete or in excess of forecasted usage to estimated realizable value. The net realizable value of such inventories is estimated based on analyses and assumptions including, but not limited to, historical usage, future demand and market requirements.
Recoverability of Development Costs of Software to be Sold - We capitalize certain costs incurred for software to be sold, leased or otherwise marketed to our customers. The costs are treated as capital or expense based on the nature of the costs and the project stage in which the costs were incurred. At the end of each fiscal quarter, we compare the unamortized capitalized costs of software to be sold to its net realizable value. The net realizable value of capitalized software assets is the estimated future gross revenues from that product reduced by the estimated future costs of completing and disposing of that product, including the costs of performing maintenance and customer support required to satisfy the entity’s responsibility set forth at the time of sale. If the unamortized amount exceeds the net realizable value, an impairment is recorded. If the unamortized capitalized costs are less than the net realizable value of that asset, then there is no impairment. The net realizable value of capitalized software assets is estimated based on analyses and assumptions including, but not limited to, capitalizable costs, labor expenses, revenue growth projections and weighted-average cost of capital.
No significant impairments were recorded in fiscal 2024, 2023, or 2022 as a result of the assessments performed of the recoverability of development costs to be sold.
Recoverability of Goodwill – Goodwill is not amortized but rather is tested at least annually at the beginning of the fourth quarter for impairment, or more often if events or circumstances indicate the carrying value of the asset may not be recoverable.
We assess the recoverability of goodwill using a qualitative evaluation or a quantitative test to determine whether it is more likely than not that the fair value of a reporting unit is less than its carrying amount, including goodwill. The determination of fair value requires management to make assumptions and to apply judgment to estimate industry and economic factors and the profitability of future business strategies. Patterson conducts impairment testing based on current business strategy in light of present industry and economic conditions, as well as future expectations.
We performed qualitative assessments for our goodwill impairment tests in fiscal 2024. No impairments were recorded in fiscal 2024, 2023, or 2022 as a result of goodwill tests performed.
Recoverability of Long-Lived Assets – Long-lived assets, including definite-lived intangible assets, are evaluated for impairment whenever events or changes in circumstances indicate that the carrying amount of the assets (or asset groups) may not be recoverable through the estimated undiscounted future cash flows derived from such assets. Our definite-lived intangible assets primarily consist of customer relationships, trade names and trademarks. When impairment exists, the related assets (or asset groups) are written down to fair value using financial projections and discount rates based on analyses and assumptions including, but not limited to, financial projections, royalty rates, and weighted-average cost of capital.
No significant impairments were recorded in fiscal 2024, 2023, or 2022 as a result of the assessments performed of the recoverability of long-lived assets.
Income Taxes – We are subject to income taxes in the U.S. and numerous foreign jurisdictions. Significant judgments are required in determining the consolidated provision for income taxes. Changes in tax policy or interpretation of current tax law create potential added uncertainties.
During the ordinary course of business, there are many transactions and calculations for which the ultimate tax determination is uncertain. As a result, we recognize tax liabilities based on estimates of whether additional taxes
and interest will be due. These tax liabilities are recognized when, despite our belief that our tax return position is supportable, we believe that certain positions may not be fully sustained upon review by tax authorities. We believe that our accruals for tax liabilities are adequate for all open audit years based on our assessment of many factors including past experience and interpretations of tax law. This assessment relies on estimates and assumptions and may involve a series of complex judgments about future events. To the extent that the final tax outcome of these matters is different than the amounts recorded, such differences will impact income tax expense in the period in which such determination is made and could materially affect our financial results.
Valuation allowances are established for deferred tax assets if, after assessment of available positive and negative evidence, it is more likely than not that the deferred tax asset will not be fully realized.
Recent Accounting Pronouncements
For information concerning new accounting standards and the impact of the implementation of these standards on our financial statements, see Note 1 to the Consolidated Financial Statements.
Item 7A. QUANTITATIVE AND QUALITATIVE DISCLOSURES ABOUT MARKET RISK
Market Risk
We are exposed to market risk consisting of foreign currency rate fluctuations and changes in interest rates.
We are exposed to foreign currency exchange rate fluctuations in our operating statement due to transactions denominated primarily in Canadian Dollars and British Pounds. Although we do not currently have foreign currency hedge contracts, we continually evaluate our foreign currency exchange rate risk and the different mechanisms for use in managing such risk. A hypothetical 10% change in the value of the U.S. dollar in relation to our most significant foreign currency exposures would have changed net sales by approximately $102.7 million for the fiscal year ended April 27, 2024. This amount is not indicative of the hypothetical net earnings impact due to the partially offsetting impact of the currency exchange movements on cost of sales and operating expenses. We estimate that if foreign currency exchange rates changed by 10%, the impact would have been approximately $2.8 million to income before taxes for the fiscal year ended April 27, 2024.
The Amended Credit Agreement consists of a $300.0 million term loan facility and a $700.0 million revolving credit facility, which will mature no later than October 2027. Interest on borrowings is variable and is determined as a base rate plus a spread. This spread, as well as a commitment fee on the unused portion of the facility, is based on our leverage ratio, as defined in the Amended Credit Agreement. Due to the interest rate being variable, fluctuations in interest rates may impact our earnings. Based on our current level of debt, we estimate that a 100 basis point change in interest rates would have a $4.8 million annual impact on our income before taxes.
Our earnings are also affected by fluctuations in short-term interest rates through the investment of cash balances and the practice of selling fixed rate equipment finance contracts under agreements with both a commercial paper conduit and a bank that provide for pricing based on variable interest rates.
When considering the exposure under the agreements whereby we sell equipment finance contracts to both a commercial paper conduit and bank, the interest rates in our facilities are priced based on SOFR or commercial paper rates plus a defined spread. In addition, the majority of the portfolio of installment contracts generally turns over in less than 48 months, and we can adjust the rate we charge on new customer contracts at any time. Therefore, in times where the interest rate markets are not rapidly increasing or decreasing, the average interest rate in the portfolio generally moves with the interest rate markets and thus would parallel the underlying interest rate movement of the pricing built into the sale agreements. In calculating the gain on the contract sales, we use an interest rate curve that approximates the maturity period of the then-outstanding contracts. If increases in the interest rate markets occur, the average interest rate in our contract portfolio may not increase at the same rate, resulting in a reduction of gain on the contract sales as compared to the gain that would be realized if the average interest rate in our portfolio were to increase at a more similar rate to the interest rate markets. We have forward interest rate swap agreements in order to hedge against interest rate fluctuations that impact the amount of net sales we record related to these contracts. These interest rate swap agreements do not qualify for hedge accounting treatment and, accordingly, we record the fair value of the agreements as an asset or liability and the change as income or expense during the period in which the change occurs. As a result of entering into these interest rate swap agreements, we estimate that a 10% change in interest rates would have less than a $1.0 million annual impact on our income before taxes.
Item 8. FINANCIAL STATEMENTS AND SUPPLEMENTARY DATA
REPORT OF INDEPENDENT REGISTERED PUBLIC ACCOUNTING FIRM
To the Stockholders and the Board of Directors of Patterson Companies, Inc.
Opinion on Internal Control Over Financial Reporting
We have audited Patterson Companies, Inc.’s internal control over financial reporting as of April 27, 2024, based on criteria established in Internal Control—Integrated Framework issued by the Committee of Sponsoring Organizations of the Treadway Commission (2013 framework) (the COSO criteria). In our opinion, Patterson Companies, Inc. (the Company) maintained, in all material respects, effective internal control over financial reporting as of April 27, 2024, based on the COSO criteria.
We also have audited, in accordance with the standards of the Public Company Accounting Oversight Board (United States) (PCAOB), the consolidated balance sheets of the Company as of April 27, 2024 and April 29, 2023, the related consolidated statements of operations and other comprehensive income, changes in stockholders' equity and cash flows for each of the three years in the period ended April 27, 2024, and the related notes and the financial statement schedule listed in the Index at Item 15(a)(2) and our report dated June 18, 2024 expressed an unqualified opinion thereon.
Basis for Opinion
The Company’s management is responsible for maintaining effective internal control over financial reporting and for its assessment of the effectiveness of internal control over financial reporting included in the accompanying Management’s Annual Report on Internal Control Over Financial Reporting. Our responsibility is to express an opinion on the Company’s internal control over financial reporting based on our audit. We are a public accounting firm registered with the PCAOB and are required to be independent with respect to the Company in accordance with the U.S. federal securities laws and the applicable rules and regulations of the Securities and Exchange Commission and the PCAOB.
We conducted our audit in accordance with the standards of the PCAOB. Those standards require that we plan and perform the audit to obtain reasonable assurance about whether effective internal control over financial reporting was maintained in all material respects.
Our audit included obtaining an understanding of internal control over financial reporting, assessing the risk that a material weakness exists, testing and evaluating the design and operating effectiveness of internal control based on the assessed risk, and performing such other procedures as we considered necessary in the circumstances. We believe that our audit provides a reasonable basis for our opinion.
Definition and Limitations of Internal Control Over Financial Reporting
A company’s internal control over financial reporting is a process designed to provide reasonable assurance regarding the reliability of financial reporting and the preparation of financial statements for external purposes in accordance with generally accepted accounting principles. A company’s internal control over financial reporting includes those policies and procedures that (1) pertain to the maintenance of records that, in reasonable detail, accurately and fairly reflect the transactions and dispositions of the assets of the company; (2) provide reasonable assurance that transactions are recorded as necessary to permit preparation of financial statements in accordance with generally accepted accounting principles, and that receipts and expenditures of the company are being made only in accordance with authorizations of management and directors of the company; and (3) provide reasonable assurance regarding prevention or timely detection of unauthorized acquisition, use, or disposition of the company’s assets that could have a material effect on the financial statements.
Because of its inherent limitations, internal control over financial reporting may not prevent or detect misstatements. Also, projections of any evaluation of effectiveness to future periods are subject to the risk that controls may become inadequate because of changes in conditions, or that the degree of compliance with the policies or procedures may deteriorate.
/s/ Ernst & Young LLP
Minneapolis, Minnesota
June 18, 2024
REPORT OF INDEPENDENT REGISTERED PUBLIC ACCOUNTING FIRM
To the Stockholders and the Board of Directors of Patterson Companies, Inc.
Opinion on the Financial Statements
We have audited the accompanying consolidated balance sheets of Patterson Companies, Inc. (the Company) as of April 27, 2024 and April 29, 2023, the related consolidated statements of operations and other comprehensive income, changes in stockholders' equity and cash flows for each of the three years in the period ended April 27, 2024, and the related notes and the financial statement schedule listed in the Index at Item 15(a)(2) (collectively referred to as the “consolidated financial statements”). In our opinion, the consolidated financial statements present fairly, in all material respects, the financial position of the Company at April 27, 2024 and April 29, 2023, and the results of its operations and its cash flows for each of the three years in the period ended April 27, 2024, in conformity with U.S. generally accepted accounting principles.
We also have audited, in accordance with the standards of the Public Company Accounting Oversight Board (United States) (PCAOB), the Company's internal control over financial reporting as of April 27, 2024, based on criteria established in Internal Control-Integrated Framework issued by the Committee of Sponsoring Organizations of the Treadway Commission (2013 framework), and our report dated June 18, 2024 expressed an unqualified opinion thereon.
Basis for Opinion
These financial statements are the responsibility of the Company's management. Our responsibility is to express an opinion on the Company’s financial statements based on our audits. We are a public accounting firm registered with the PCAOB and are required to be independent with respect to the Company in accordance with the U.S. federal securities laws and the applicable rules and regulations of the Securities and Exchange Commission and the PCAOB.
We conducted our audits in accordance with the standards of the PCAOB. Those standards require that we plan and perform the audit to obtain reasonable assurance about whether the financial statements are free of material misstatement, whether due to error or fraud. Our audits included performing procedures to assess the risks of material misstatement of the financial statements, whether due to error or fraud, and performing procedures that respond to those risks. Such procedures included examining, on a test basis, evidence regarding the amounts and disclosures in the financial statements. Our audits also included evaluating the accounting principles used and significant estimates made by management, as well as evaluating the overall presentation of the financial statements. We believe that our audits provide a reasonable basis for our opinion.
Critical Audit Matter
The critical audit matter communicated below is a matter arising from the current period audit of the consolidated financial statements that was communicated or required to be communicated to the audit committee and that: (1) relates to accounts or disclosures that are material to the consolidated financial statements and (2) involved our especially challenging, subjective or complex judgments. The communication of the critical audit matter does not alter in any way our opinion on the consolidated financial statements, taken as a whole, and we are not, by communicating the critical audit matter below, providing a separate opinion on the critical audit matter or on the account or disclosure to which it relates.
Development costs of software to be sold impairment
| | | | | | | | |
| Description of the Matter | | At April 27, 2024, the Company’s capitalized development costs of software to be sold were $73.3 million. As discussed in Note 1 of the consolidated financial statements, at the end of each fiscal quarter these unamortized capitalized costs of software to be sold are compared to the net realizable value. If the unamortized capitalized costs of an asset are less than the net realizable value of that asset, then there is no impairment.
Auditing management’s comparison of unamortized capitalized development costs of software to be sold to the net realizable value was complex and highly judgmental due to the significant estimation required in determining the net realizable value of the asset. For software to be sold, the estimate of the net realizable value was sensitive to significant assumptions, such as forecasted revenue, and labor and contractor costs, which are affected by expected future market or economic conditions. |
| How We Addressed the Matter in Our Audit | | We obtained an understanding, evaluated the design and tested the operating effectiveness of controls over the Company’s process to compare unamortized capitalized costs of software to be sold to the net realizable value, including controls over management’s forecasting processes used to develop the projected future revenue and labor and contractor costs used in the fair value estimates, as well as controls over management’s review of the significant data and assumptions described above.
To test the estimated fair value of the unamortized capitalized development costs of software to be sold, we performed audit procedures that included, among others, assessing the valuation methodologies used by management and testing the significant assumptions discussed above. We compared the significant assumptions used by management to current industry, market and economic trends, historical actuals, as well as other relevant factors. We assessed the reasonableness of forecasted future revenue by comparing the forecasts to historical software sales results and relevant software market industry data. We assessed the reasonableness of future labor and contractor costs by comparing the estimates to historical actuals and presentations of planned enhancements. We also performed sensitivity analyses of significant assumptions to evaluate the significance of changes in the recoverability that would result from changes in assumptions. |
/s/ Ernst & Young LLP
We have served as the Company’s auditor since 1985.
Minneapolis, Minnesota
June 18, 2024
PATTERSON COMPANIES, INC.
CONSOLIDATED BALANCE SHEETS
(In thousands, except per share amounts) | | | | | | | | | | | |
| April 27, 2024 | | April 29, 2023 |
| ASSETS | | | |
| Current assets: | | | |
| Cash and cash equivalents | $ | 114,462 | | | $ | 159,669 | |
| | | |
Receivables, net of allowance for doubtful accounts of $2,731 and $3,667 | 547,287 | | | 477,384 | |
| Inventory, net | 782,898 | | | 795,072 | |
| Prepaid expenses and other current assets | 334,116 | | | 351,011 | |
| Total current assets | 1,778,763 | | | 1,783,136 | |
| Property and equipment, net | 229,081 | | | 212,283 | |
| Operating lease right-of-use assets, net | 122,295 | | | 92,956 | |
| Long-term receivables, net | 129,876 | | | 121,717 | |
| Goodwill | 156,328 | | | 156,420 | |
| Identifiable intangibles, net | 193,261 | | | 231,873 | |
| Investments | 166,320 | | | 160,022 | |
| Other non-current assets, net | 120,808 | | | 120,739 | |
| Total assets | $ | 2,896,732 | | | $ | 2,879,146 | |
| LIABILITIES AND STOCKHOLDERS’ EQUITY | | | |
| Current liabilities: | | | |
| Accounts payable | $ | 745,375 | | | $ | 724,993 | |
| Accrued payroll expense | 78,211 | | | 82,253 | |
| Other accrued liabilities | 167,399 | | | 168,696 | |
| Operating lease liabilities | 32,815 | | | 28,390 | |
| Current maturities of long-term debt | 122,750 | | | 36,000 | |
| Borrowings on revolving credit | 186,000 | | | 45,000 | |
| Total current liabilities | 1,332,550 | | | 1,085,332 | |
| Long-term debt | 328,911 | | | 451,231 | |
| Non-current operating lease liabilities | 92,464 | | | 67,376 | |
| Deferred income taxes | 104,521 | | | 119,143 | |
| Other non-current liabilities | 36,554 | | | 37,529 | |
| Total liabilities | 1,895,000 | | | 1,760,611 | |
| Stockholders’ equity: | | | |
Common stock, $0.01 par value: 600,000 shares authorized; 89,701 and 96,350 shares issued and outstanding | 897 | | | 964 | |
| Additional paid-in capital | 258,679 | | | 233,706 | |
| Accumulated other comprehensive loss | (89,915) | | | (89,262) | |
| Retained earnings | 831,483 | | | 972,127 | |
| | | |
| Total Patterson Companies, Inc. stockholders' equity | 1,001,144 | | | 1,117,535 | |
| Noncontrolling interests | 588 | | | 1,000 | |
| Total stockholders’ equity | 1,001,732 | | | 1,118,535 | |
| Total liabilities and stockholders’ equity | $ | 2,896,732 | | | $ | 2,879,146 | |
See accompanying notes
PATTERSON COMPANIES, INC.
CONSOLIDATED STATEMENTS OF OPERATIONS
AND OTHER COMPREHENSIVE INCOME
(In thousands, except per share amounts) | | | | | | | | | | | | | | | | | |
| Fiscal Year Ended |
| April 27, 2024 | | April 29, 2023 | | April 30, 2022 |
| Net sales | $ | 6,568,272 | | | $ | 6,471,471 | | | $ | 6,499,405 | |
| Cost of sales | 5,188,030 | | | 5,098,526 | | | 5,210,318 | |
| Gross profit | 1,380,242 | | | 1,372,945 | | | 1,289,087 | |
| Operating expenses | 1,127,318 | | | 1,096,974 | | | 1,132,085 | |
| | | | | |
| Operating income | 252,924 | | | 275,971 | | | 157,002 | |
| Other income (expense): | | | | | |
| Gains on investments | — | | | — | | | 101,809 | |
| Other income, net | 35,039 | | | 27,826 | | | 27,731 | |
| Interest expense | (44,910) | | | (33,636) | | | (20,288) | |
| Income before taxes | 243,053 | | | 270,161 | | | 266,254 | |
| Income tax expense | 57,534 | | | 63,563 | | | 64,540 | |
| | | | | |
| | | | | |
| Net income | 185,519 | | | 206,598 | | | 201,714 | |
| Net loss attributable to noncontrolling interests | (412) | | | (959) | | | (1,496) | |
| Net income attributable to Patterson Companies, Inc. | $ | 185,931 | | | $ | 207,557 | | | $ | 203,210 | |
| Earnings per share attributable to Patterson Companies, Inc.: | | | | | |
| | | | | |
| | | | | |
| Basic | $ | 2.00 | | | $ | 2.14 | | | $ | 2.09 | |
| | | | | |
| | | | | |
| | | | | |
| Diluted | $ | 1.98 | | | $ | 2.12 | | | $ | 2.06 | |
| Weighted average shares: | | | | | |
| Basic | 92,969 | | | 97,027 | | | 97,277 | |
| Diluted | 93,679 | | | 97,815 | | | 98,514 | |
| Dividends declared per common share | $ | 1.04 | | | $ | 1.04 | | | $ | 1.04 | |
| Comprehensive income | | | | | |
| Net income | $ | 185,519 | | | $ | 206,598 | | | $ | 201,714 | |
| Foreign currency translation gain (loss) | (1,695) | | | (8,788) | | | (19,966) | |
| Cash flow hedges, net of tax | 1,042 | | | 1,042 | | | 1,042 | |
| Comprehensive income | $ | 184,866 | | | $ | 198,852 | | | $ | 182,790 | |
See accompanying notes
PATTERSON COMPANIES, INC.
CONSOLIDATED STATEMENTS OF CHANGES IN STOCKHOLDERS’ EQUITY
(In thousands) | | | | | | | | | | | | | | | | | | | | | | | | | | | | | | | | | | | | | | | | | | | |
| Common Stock | | Additional
Paid-in
Capital | | Accumulated
Other
Comprehensive
Loss | | Retained
Earnings | | | | Non-controlling interests | | Total |
| Number | | Amount | | | | | | |
| Balance at April 24, 2021 | 96,813 | | | $ | 968 | | | $ | 169,099 | | | $ | (62,592) | | | $ | 855,741 | | | | | $ | 1,455 | | | $ | 964,671 | |
| Foreign currency translation | — | | | — | | | — | | | (19,966) | | | — | | | | | — | | | (19,966) | |
| Cash flow hedges | — | | | — | | | — | | | 1,042 | | | — | | | | | — | | | 1,042 | |
| Net income (loss) | — | | | — | | | — | | | — | | | 203,210 | | | | | (1,496) | | | 201,714 | |
| Dividends declared | — | | | — | | | — | | | — | | | (102,257) | | | | | — | | | (102,257) | |
| Common stock issued | 981 | | | 10 | | | 7,616 | | | — | | | — | | | | | — | | | 7,626 | |
| Repurchases of common stock | (1,032) | | | (10) | | | — | | | — | | | (34,990) | | | | | — | | | (35,000) | |
| Stock based compensation | — | | | — | | | 23,805 | | | — | | | — | | | | | — | | | 23,805 | |
| | | | | | | | | | | | | | | |
| | | | | | | | | | | | | | | |
| | | | | | | | | | | | | | | |
| Contribution from noncontrolling interest | — | | | — | | | — | | | — | | | — | | | | | 1,000 | | | 1,000 | |
| Balance at April 30, 2022 | 96,762 | | | 968 | | | 200,520 | | | (81,516) | | | 921,704 | | | | | 959 | | | 1,042,635 | |
| Foreign currency translation | — | | | — | | | — | | | (8,788) | | | — | | | | | — | | | (8,788) | |
| Cash flow hedges | — | | | — | | | — | | | 1,042 | | | — | | | | | — | | | 1,042 | |
| Net income (loss) | — | | | — | | | — | | | — | | | 207,557 | | | | | (959) | | | 206,598 | |
| Dividends declared | — | | | — | | | — | | | — | | | (101,662) | | | | | — | | | (101,662) | |
| Common stock issued | 1,608 | | | 16 | | | 17,643 | | | — | | | — | | | | | — | | | 17,659 | |
| Repurchases of common stock | (2,020) | | | (20) | | | — | | | — | | | (55,472) | | | | | — | | | (55,492) | |
| Stock based compensation | — | | | — | | | 15,543 | | | — | | | — | | | | | — | | | 15,543 | |
| | | | | | | | | | | | | | | |
| | | | | | | | | | | | | | | |
| | | | | | | | | | | | | | | |
| Contribution from noncontrolling interest | — | | | — | | | — | | | — | | | — | | | | | 1,000 | | | 1,000 | |
| Balance at April 29, 2023 | 96,350 | | | 964 | | | 233,706 | | | (89,262) | | | 972,127 | | | | | 1,000 | | | 1,118,535 | |
| Foreign currency translation | — | | | — | | | — | | | (1,695) | | | — | | | | | — | | | (1,695) | |
| Cash flow hedges | — | | | — | | | — | | | 1,042 | | | — | | | | | — | | | 1,042 | |
| Net income (loss) | — | | | — | | | — | | | — | | | 185,931 | | | | | (412) | | | 185,519 | |
| Dividends declared | — | | | — | | | — | | | — | | | (97,143) | | | | | — | | | (97,143) | |
| Common stock issued | 955 | | | 9 | | | 9,101 | | | — | | | — | | | | | — | | | 9,110 | |
| Repurchases of common stock | (7,604) | | | (76) | | | (1,999) | | | — | | | (229,432) | | | | | | | (231,507) | |
| Stock based compensation | — | | | — | | | 17,871 | | | — | | | — | | | | | — | | | 17,871 | |
| | | | | | | | | | | | | | | |
| | | | | | | | | | | | | | | |
| Balance at April 27, 2024 | 89,701 | | | $ | 897 | | | $ | 258,679 | | | $ | (89,915) | | | $ | 831,483 | | | | | $ | 588 | | | $ | 1,001,732 | |
See accompanying notes
PATTERSON COMPANIES, INC.
CONSOLIDATED STATEMENTS OF CASH FLOWS
(In thousands) | | | | | | | | | | | | | | | | | |
| Fiscal Year Ended |
| April 27, 2024 | | April 29, 2023 | | April 30, 2022 |
| Operating activities: | | | | | |
| Net income | $ | 185,519 | | | $ | 206,598 | | | $ | 201,714 | |
| | | | | |
| | | | | |
| Adjustments to reconcile net income to net cash used in operating activities: | | | | | |
| Depreciation | 49,617 | | | 45,772 | | | 44,180 | |
| Amortization | 38,539 | | | 37,932 | | | 37,812 | |
| Gains on investments | — | | | — | | | (101,809) | |
| | | | | |
| | | | | |
| Bad debt expense | 2,542 | | | 3,450 | | | 2,769 | |
| Stock-based compensation | 17,871 | | | 15,543 | | | 23,805 | |
| | | | | |
| | | | | |
| Deferred income taxes | (13,523) | | | (1,993) | | | (4,718) | |
| | | | | |
| Non-cash losses (gains) and other, net | 204 | | | 654 | | | (1,431) | |
| Change in assets and liabilities: | | | | | |
| Receivables | (1,102,618) | | | (1,047,075) | | | (1,144,833) | |
| Inventory | 11,039 | | | (11,086) | | | (53,871) | |
| Accounts payable | 21,343 | | | 43,095 | | | 80,904 | |
| Accrued liabilities | (2,788) | | | (21,714) | | | (27,630) | |
| | | | | |
| Other changes from operating activities, net | 2,877 | | | (26,028) | | | (37,886) | |
| | | | | |
| | | | | |
| Net cash used in operating activities | (789,378) | | | (754,852) | | | (980,994) | |
| Investing activities: | | | | | |
| Additions to property and equipment and software | (67,626) | | | (64,220) | | | (38,308) | |
| Payments related to acquisitions, net of cash acquired | (1,108) | | | (33,280) | | | (19,793) | |
| Collection of deferred purchase price receivables | 1,028,277 | | | 998,912 | | | 1,213,497 | |
| Sale of investments | — | | | — | | | 75,942 | |
| Payments related to investments | — | | | (15,000) | | | — | |
| Other investing activities | — | | | 15,155 | | | 7,690 | |
| | | | | |
| | | | | |
| Net cash provided by investing activities | 959,543 | | | 901,567 | | | 1,239,028 | |
| Financing activities: | | | | | |
| Dividends paid | (98,333) | | | (101,346) | | | (101,111) | |
| Repurchases of common stock | (229,508) | | | (55,492) | | | (35,000) | |
| | | | | |
| | | | | |
| | | | | |
| Payments on long-term debt | (36,000) | | | (1,500) | | | (100,750) | |
| | | | | |
| Draw (payment) on revolving credit | 141,000 | | | 16,000 | | | (24,000) | |
| | | | | |
| | | | | |
| | | | | |
| Other financing activities | 6,936 | | | 15,854 | | | 7,627 | |
| Net cash used in financing activities | (215,905) | | | (126,484) | | | (253,234) | |
| Effect of exchange rate changes on cash | 533 | | | (2,576) | | | (6,030) | |
| Net change in cash and cash equivalents | (45,207) | | | 17,655 | | | (1,230) | |
| Cash and cash equivalents at beginning of period | 159,669 | | | 142,014 | | | 143,244 | |
| Cash and cash equivalents at end of period | $ | 114,462 | | | $ | 159,669 | | | $ | 142,014 | |
| Supplemental disclosures: | | | | | |
Income taxes paid (includes payments for purchased tax credits of $13,575, $0 and $0, respectively) | $ | 77,979 | | | $ | 62,081 | | | $ | 83,549 | |
| Interest paid | 26,002 | | | 19,623 | | | 14,633 | |
| Supplemental disclosure of non-cash investing activity: | | | | | |
Retained interest in securitization transactions | $ | 1,010,438 | | | $ | 1,008,741 | | | $ | 1,122,627 | |
| | | | | |
See accompanying notes
PATTERSON COMPANIES, INC.
NOTES TO CONSOLIDATED FINANCIAL STATEMENTS
April 27, 2024
(Dollars, except per share amounts, and shares in thousands)
1. Summary of Significant Accounting Policies
Description of Business
Patterson Companies, Inc. (referred to herein as “Patterson” or in the first person notations “we,” “our,” and “us”) is a value-added specialty distributor serving the U.S. and Canadian dental supply and the U.S., Canadian and U.K. animal health supply markets. Patterson has three reportable segments: Dental, Animal Health and Corporate.
Basis of Presentation
The Consolidated Financial Statements include the assets and liabilities of PDC Funding Company, LLC ("PDC Funding"), PDC Funding Company II, LLC ("PDC Funding II"), PDC Funding Company III, LLC ("PDC Funding III") and PDC Funding Company IV, LLC ("PDC Funding IV"), which are our wholly owned subsidiaries and separate legal entities formed under Minnesota law. PDC Funding and PDC Funding II are fully consolidated special purpose entities established to sell customer installment sale contracts to outside financial institutions in the normal course of their business. PDC Funding III and PDC Funding IV are fully consolidated special purpose entities established to sell certain receivables to unaffiliated financial institutions. The assets of PDC Funding, PDC Funding II, PDC Funding III and PDC Funding IV would be available first and foremost to satisfy the claims of its creditors. There are no known creditors of PDC Funding, PDC Funding II, PDC Funding III or PDC Funding IV. The Consolidated Financial Statements also include the assets and liabilities of Technology Partner Innovations, LLC, which is further described in Note 13.
Fiscal Year End
We operate with a 52-53 week accounting convention with our fiscal year ending on the last Saturday in April. Fiscal 2024 ended on April 27, 2024 and consisted of 52 weeks. Fiscal 2023 ended on April 29, 2023 and consisted of 52 weeks. Fiscal 2022 ended on April 30, 2022 and consisted of 53 weeks. Fiscal 2025 will end on April 26, 2025 and will consist of 52 weeks.
Use of Estimates in the Preparation of Financial Statements
The preparation of financial statements in conformity with U.S. generally accepted accounting principles requires management to make estimates and assumptions that affect the reported amounts of assets and liabilities and disclosure of contingent assets and liabilities at the date of the financial statements and the reported amounts of revenues and expenses during the reporting period. Actual results could differ from those estimates.
Cash and Cash Equivalents
Cash equivalents consist primarily of investments in money market funds and government securities. The maturity of these securities at the time of purchase is 90 days or less. All cash and cash equivalents are classified as available-for-sale and carried at cost, which approximates fair value.
Inventory, net
Inventory, net consists of merchandise held for sale and is stated at the lower of cost or market. The cost of our inventory includes the amount we pay to our suppliers to acquire inventory and freight costs incurred in connection with the delivery of product to our distribution centers and our other locations. Cost is determined using the last-in, first-out ("LIFO") method for all inventories, except for foreign inventories, which are valued using the first-in, first-out ("FIFO") method. Inventories valued at LIFO represented 81% and 81% of total inventories at April 27, 2024 and April 29, 2023, respectively.
The accumulated LIFO reserve was $154,055 and $146,915 at April 27, 2024 and April 29, 2023, respectively. We believe that inventory replacement cost exceeds the inventory balance by an amount approximating the LIFO reserve.
Property and Equipment, net
Property and equipment, net are stated at cost. Depreciation is calculated on the straight-line method over estimated useful lives of up to 39 years for buildings or the expected remaining life of purchased buildings, the term of the lease for leasehold improvements, 3 to 10 years for computer hardware and software, and 5 to 10 years for furniture and equipment.
Goodwill and Other Indefinite-Lived Intangible Assets
Goodwill and other indefinite-lived intangible assets are not amortized but rather are tested at least annually at the beginning of the fourth quarter for impairment, or more often if events or circumstances indicate the carrying value of the asset may not be recoverable.
Goodwill impairment testing is done at the reporting unit level, which represents an operating segment or a component of an operating segment. We have two reporting units; Dental and Animal Health. Our Corporate reportable segment's assets and liabilities, and net sales and expenses, are allocated to the two reporting units.
We perform a qualitative evaluation or a quantitative test to assess goodwill for impairment. The qualitative evaluation is an assessment of factors to determine whether it is more likely than not that the fair value of a reporting unit is less than its carrying amount, including goodwill. We may elect not to perform the qualitative assessment for one or both reporting units and perform a quantitative impairment test.
If performed, the quantitative goodwill impairment test compares the fair value of each reporting unit to the reporting unit's carrying value, including goodwill. If the reporting unit's carrying value exceeds its fair value, an impairment loss will be recognized. Any goodwill impairment is measured as the amount by which a reporting unit’s carrying value exceeds its fair value, not to exceed the carrying value of goodwill. The determination of fair value requires management to make assumptions and to apply judgment to estimate industry and economic factors and the profitability of future business strategies. Patterson conducts impairment testing based on current business strategy in light of present industry and economic conditions, as well as future expectations.
Our indefinite-lived intangible asset is a trade name, which is assessed for impairment by comparing the carrying value of the asset with its fair value. If the carrying value exceeds fair value, an impairment loss is recognized in an amount equal to the excess. The determination of fair value involves assumptions, including projected revenues and gross profit levels, as well as consideration of any factors that may indicate potential impairment.
We performed qualitative assessments for our goodwill impairment tests in fiscal 2024. No impairments were recorded in fiscal 2024, 2023, or 2022 as a result of goodwill and other indefinite-lived impairment tests performed.
Recoverability of Long-Lived Assets
Long-lived assets, including definite-lived intangible assets, are evaluated for impairment whenever events or changes in circumstances indicate that the carrying amount of the assets may not be recoverable through the estimated undiscounted future cash flows derived from such assets. Our definite-lived intangible assets primarily consist of customer relationships, trade names and trademarks. When impairment exists, the related assets are written down to fair value using level 3 inputs, as discussed further in Note 7.
Other Non-current Assets, Net
| | | | | | | | | | | |
| April 27, 2024 | | April 29, 2023 |
| | | |
| Development costs of software to be sold, net | $ | 73,259 | | | $ | 71,467 | |
| Other | 47,549 | | | 49,272 | |
| Other non-current assets, net | $ | 120,808 | | | $ | 120,739 | |
During fiscal 2024, 2023 and 2022, we recorded $11,651, $9,068 and $7,267, respectively, of amortization expense related to the development costs of software to be sold in cost of sales within the Consolidated Statements of Operations and Other Comprehensive Income.
Recoverability of Development Costs of Software to be Sold
We capitalize certain costs incurred for software to be sold, leased or otherwise marketed to our customers. The costs are treated as capital or expense based on the nature of the costs and the project stage in which the costs were incurred. At the end of each fiscal quarter, we compare the unamortized capitalized costs of software to be sold to its net realizable value. The net realizable value of capitalized software assets is the estimated future gross revenues from that product reduced by the estimated future costs of completing and disposing of that product, including the costs of performing maintenance and customer support required to satisfy the entity’s responsibility set forth at the time of sale. If the unamortized amount exceeds the net realizable value, an impairment is recorded. If the unamortized capitalized costs are less than the net realizable value of that asset, then there is no impairment.
No significant impairments were recorded in fiscal 2024, 2023, or 2022 as a result of the assessments performed of the recoverability of development costs to be sold.
Financial Instruments
We account for derivative financial instruments under the provisions of Accounting Standards Codification ("ASC") Topic 815, “Derivatives and Hedging.” Our use of derivative financial instruments is generally limited to managing well-defined interest rate risks. We do not use financial instruments or derivatives for any trading purposes.
Revenue Recognition
Revenues are generated from the sale of consumable products, equipment and support, software and support, technical service parts and labor, and other sources. Revenues are recognized when or as performance obligations are satisfied. Performance obligations are satisfied when the customer obtains control of the goods or services.
Consumable product, equipment, software and parts sales are recorded upon delivery, except in those circumstances where terms of the sale are FOB shipping point, in which case sales are recorded upon shipment. Technical service labor is recognized as it is provided. Revenue derived from equipment support and software services is recognized ratably over the period in which the support and services are provided.
In addition to revenues generated from the distribution of consumable products under arrangements (buy/sell agreements) where the full market value of the product is recorded as revenue, we earn commissions for services provided under agency agreements. The agency agreement contrasts to a buy/sell agreement in that we do not have control over the transaction, as we do not have the primary responsibility of fulfilling the promise of the good or service and we do not bill or collect from the customer in an agency relationship. Commissions under agency agreements are recorded when the services are provided.
Estimates for returns, damaged goods, rebates, loyalty programs and other revenue allowances are made at the time the revenue is recognized based on the historical experience for such items. The receivables that result from the recognition of revenue are reported net of related allowances. We maintain a valuation allowance based upon the expected collectability of receivables held. Estimates are used to determine the valuation allowance and are based on several factors, including historical collection data, economic trends and credit worthiness of customers. Receivables are written off when we determine the amounts to be uncollectible, typically upon customer bankruptcy or non-response to continuous collection efforts. The portions of receivable amounts that are not expected to be collected during the next twelve months are classified as long-term.
Receivables from vendors earned as a result of volume rebates and reimbursements for customer pricing contracts and promotions are recorded as a reduction of cost of sales in the period in which the related revenue is recognized. We estimate the vendor receivables earned but not received based on sales forecasts, transactional data, and historical vendor collection trends.
We offer customer financing contracts on equipment purchases by creditworthy customers. For financing contracts at a below-market interest rate, we record a subsidy as a reduction to net sales in the period the contract is originated. The subsidy on below-market rate contracts is estimated based on analyses of current publicly-available interest rate trends. We do not consider contracts with a term of one year or less to have a significant financing component and do not record a subsidy for these contracts.
We generally sell our customers’ financing contracts to outside financial institutions in the normal course of our business. These financing arrangements are accounted for as a sale of assets under the provisions of ASC 860, Transfers and Servicing. We receive the proceeds of the contracts upon sale to financial institutions, with a portion of the proceeds held by the financial institutions as a deferred purchase price (DPP) as security against eventual
performance of the portfolio. Customer financing net sales include the impact of changes in interest rates on DPP receivables, as the average interest rate in our contract portfolio may not fluctuate at the same rate as interest rate markets, resulting in an increase or reduction of gain on contract sales. We enter into an interest rate swap to hedge a portion of the related interest rate risk. These agreements do not qualify for hedge accounting, and the gains or losses on an interest rate swap are reported in other income and expense in our Consolidated Statements of Operation and Other Comprehensive Income.
Our financing business is described in further detail in Note 5 to the Consolidated Financial Statements.
Patterson has a relatively large, dispersed customer base and no single customer accounts for more than 10% of consolidated net sales. In addition, the equipment sold to customers under finance contracts generally serves as collateral for the contract and the customer provides a personal guarantee as well.
Net sales do not include sales tax as we are considered a pass-through conduit for collecting and remitting sales tax.
Contract Balances
Contract balances represent amounts presented in our Consolidated Balance Sheets when either we have transferred goods or services to the customer or the customer has paid consideration to us under the contract. These contract balances include accounts receivable, contract assets and contract liabilities.
Contract asset balances as of April 27, 2024 and April 29, 2023 were $1,373 and $1,338, respectively. Our contract liabilities primarily relate to advance payments from customers, upfront payments for software and support provided over time, and options that provide a material right to customers, such as our customer loyalty programs. At April 27, 2024 and April 29, 2023, contract liabilities of $37,399 and $36,850 were reported in other accrued liabilities, respectively. During the fiscal year ended April 27, 2024, we recognized $33,454 of the amount previously deferred at April 29, 2023.
Patterson Advantage Loyalty Program
The Dental segment provides a point-based awards program to qualifying customers involving the issuance of “Patterson Advantage dollars” which can be used toward equipment and technology purchases. Patterson Advantage dollars earned during a program year expire one year after the end of the program year. Costs of the program and changes in the corresponding liability are recognized as reductions to net sales. As of April 27, 2024, we believe we have sufficient experience with the program to reasonably estimate the amount of Patterson Advantage dollars that will not be redeemed and thus have recorded a liability for 87.0% of the maximum potential amount that could be redeemed. We recognize the expected breakage amount as revenue in proportion to the pattern of rights exercised by the customer, and we recognize the estimated value of unused Patterson Advantage dollars as redemptions occur. Breakage recognized was immaterial to all periods presented.
Freight and Delivery Charges
Freight and delivery charges are included in cost of sales in the Consolidated Statements of Operations and Other Comprehensive Income.
Advertising
We expense all advertising and promotional costs as incurred, except for direct marketing expenses, which are expensed over the shorter of the life of the asset or one year. Total net advertising and promotional expenses were $3,124, $6,888 and $1,532 for fiscal 2024, 2023 and 2022, respectively. There were no deferred direct-marketing expenses included in the Consolidated Balance Sheets as of April 27, 2024 and April 29, 2023.
Related Party Transactions
We have interests in a number of entities that are accounted for using the equity method. During fiscal 2024, 2023 and 2022, we made purchases of $195,048, $198,712 and $193,625 from these entities, respectively. During fiscal 2024, 2023 and 2022, we recorded net sales of $150,892, $123,271 and $117,347 to these entities, respectively.
Income Taxes
The liability method is used to account for income tax expense. Under this method, deferred tax assets and liabilities are determined based on differences between financial reporting and tax basis of assets and liabilities and
are measured using the enacted tax rates and laws that will be in effect when the differences are expected to reverse.
Valuation allowances are established for deferred tax assets if, after assessment of available positive and negative evidence, it is more likely than not that the deferred tax asset will not be fully realized.
Self-insurance
Patterson is self-insured for certain losses related to general liability, product liability, automobile, workers’ compensation and medical claims. We estimate our liabilities based upon an analysis of historical data and actuarial estimates. While current estimates are believed reasonable based on information currently available, actual results could differ and affect financial results due to changes in the amount or frequency of claims, medical cost inflation or other factors. Historically, actual results related to these types of claims have not varied significantly from estimated amounts.
Stock-based Compensation
We recognize stock-based compensation expense based on estimated grant date fair values. The grant date fair value of stock options and stock purchases made through our Employee Stock Purchase Plan are estimated using the Black-Scholes option pricing valuation model. The grant date fair value of performance stock units that vest upon meeting certain market conditions is estimated using the Monte Carlo valuation model. These valuations require estimates to be made including expected stock price volatility which considers historical volatility trends, implied future volatility based on certain traded options and other factors. We estimate the expected life of awards based on several factors, including types of participants, vesting schedules, contractual terms and various factors surrounding exercise behavior of different groups.
The grant date fair value of time-based restricted stock awards and restricted stock units is calculated based on the closing price of our common stock on the date of grant.
Compensation expense for all share-based payment awards is recognized over the requisite service period (or to the date a participant becomes eligible for retirement, if earlier) for awards that are expected to vest.
Retirement Savings Plan
In fiscal 2024, we merged the stand-alone Patterson Companies, Inc. Employee Stock Ownership Plan (the "ESOP") into the Patterson Companies, Inc. 401(k) Plan (the "401(k) Plan"). The ESOP remains a component of the 401(k) Plan with many of the relevant provisions for the ESOP in effect. The ESOP was previously frozen to new participants in fiscal 2021 and the last employer contribution was made to eligible participants effective for the plan year ended December 31, 2020.
The general purpose of the 401(k) plan is to provide additional financial security during retirement by providing employees with an incentive to make regular savings contributions. In addition to the participation of our employees, we make annual matching contributions using an established formula. Employer contribution expense was $20,003, $19,649 and $21,013 for fiscal 2024, 2023 and 2022, respectively, which is included in operating expenses within the Consolidated Statements of Operations and Other Comprehensive Income.
Other Income (Expense), Net | | | | | | | | | | | | | | | | | |
| Fiscal Year Ended |
| April 27, 2024 | | April 29, 2023 | | April 30, 2022 |
| | | | | |
| Gain on interest rate swap agreements | $ | 12,447 | | | $ | 9,968 | | | $ | 15,835 | |
| Investment income and other | 22,592 | | | 17,858 | | | 11,896 | |
| Other income (expense), net | $ | 35,039 | | | $ | 27,826 | | | $ | 27,731 | |
Comprehensive Income
Comprehensive income is computed as net income plus certain other items that are recorded directly to stockholders’ equity. Significant items included in comprehensive income are foreign currency translation adjustments and the effective portion of cash flow hedges, net of tax. Foreign currency translation adjustments do not include a provision for income tax because earnings from foreign operations are considered to be indefinitely
reinvested outside the U.S. The income tax expense related to cash flow hedge losses was $321, $321 and $321 for fiscal 2024, 2023 and 2022, respectively.
Earnings Per Share ("EPS")
The amount of basic EPS is computed by dividing net income attributable to Patterson Companies, Inc. by the weighted average number of outstanding common shares during the period. The amount of diluted EPS is computed by dividing net income by the weighted average number of outstanding common shares and common share equivalents, when dilutive, during the period.
The following table sets forth the denominator for the computation of basic and diluted EPS. There were no material adjustments to the numerator. | | | | | | | | | | | | | | | | | |
| Fiscal Year Ended |
| April 27, 2024 | | April 29, 2023 | | April 30, 2022 |
| Denominator for basic EPS – weighted average shares | 92,969 | | | 97,027 | | | 97,277 | |
| Effect of dilutive securities – stock options, restricted stock and stock purchase plans | 710 | | | 788 | | | 1,237 | |
| Denominator for diluted EPS – weighted average shares | 93,679 | | | 97,815 | | | 98,514 | |
Potentially dilutive securities representing 1,022, 932 and 772 shares for fiscal 2024, 2023 and 2022, respectively, were excluded from the calculation of diluted EPS because their effects were anti-dilutive using the treasury stock method.
Recent Accounting Pronouncements
In December 2023, the Financial Accounting Standards Board ("FASB") issued Accounting Standards Update ("ASU") No. 2023-09, "Income Taxes (Topic 740): Improvements to Income Tax Disclosures". This ASU requires additional disclosures related to rate reconciliation and income taxes paid. The new standard is effective for annual disclosures in fiscal year 2026 and interim disclosures in fiscal year 2027, with early adoption permitted. We currently are evaluating the impact of adopting this pronouncement.
In November 2023, the FASB issued ASU No. 2023-07, "Segment Reporting (Topic 280): Improvements to Reportable Segment Disclosures". This ASU requires disclosures of significant segment expenses and other segment items. Disclosures about a reportable segment's profit or loss and assets will be required for both annual and interim periods. This ASU also requires disclosure of the title and position of Chief Operating Decision Maker ("CODM") and an explanation of how the CODM uses the reported measures of profit or loss in assessing performance and allocating resources. The new standard is effective for annual disclosures in fiscal year 2025 and interim disclosures in fiscal year 2026, with early adoption permitted. We currently are evaluating the impact of adopting this pronouncement.
2. Acquisitions
During the first quarter of fiscal 2024, we used $1,108 to pay a holdback following our acquisition of substantially all of the assets of Miller Vet Holdings, LLC. The payment was due on the 24 month anniversary of the closing date.
During the third quarter of fiscal 2023, we acquired substantially all of the assets of Relief Services for Veterinary Practitioners and Animal Care Technologies (RSVP and ACT), Texas-based companies that provide innovative solutions to veterinary practices through data extraction and conversion, staffing and video-based training services. Also during the third quarter of fiscal 2023, we acquired substantially all of the assets of Dairy Tech, Inc., a Colorado-based company that provides pasteurizing equipment and single-use bags that allow dairy producers to produce, store and feed colostrum for newborn calves, as well as product offerings for beef cattle producers. These acquisitions expand our Companion Animal and Production Animal value-added platforms and add solutions to their suite of offerings.
The total purchase price for these acquisitions is $37,535, which includes holdbacks of $4,255 that will be paid on the 24 month anniversary of the closing dates and working capital adjustments of $23 which were paid in the fourth quarter of fiscal 2023. As of the acquisition date, we have recorded $17,300 of identifiable intangibles, $16,040 of goodwill and net tangible assets of $4,233 in our Consolidated Balance Sheets related to these acquisitions. Goodwill, which is deductible for income tax purposes, was increased by $272 subsequent to acquisition date as a result of working capital adjustments. Goodwill was recorded within the Animal Health segment and represents the
expected benefit of integrating these value-added platforms with our existing operations. We have included their results of operations in our financial statements since the date of acquisition within the Animal Health segment. The accounting for the acquisitions was complete as of October 28, 2023. The acquisitions were not deemed significant and did not materially impact our financial statements, and, therefore, pro forma results are not provided.
3. Cash and Cash Equivalents
Cash and cash equivalents consisted of the following: | | | | | | | | | | | |
| April 27, 2024 | | April 29, 2023 |
| Cash on hand | $ | 109,777 | | | $ | 111,892 | |
| Money market funds | 4,685 | | | 47,777 | |
| Total | $ | 114,462 | | | $ | 159,669 | |
Cash on hand is generally in interest earning accounts. Included in cash and cash equivalents in the Consolidated Balance Sheets are $33,813 and $33,072 as of April 27, 2024 and April 29, 2023, respectively, which represent cash collected from previously sold customer financing contracts that have not yet been settled. See Note 5 for additional information.
4. Receivables Securitization Program
We are party to certain receivables purchase agreements (the “Receivables Purchase Agreements”) with MUFG Bank, Ltd. ("MUFG") (f.k.a. The Bank of Tokyo-Mitsubishi UFJ, Ltd.), under which MUFG acts as an agent to facilitate the sale of certain Patterson receivables (the “Receivables”) to certain unaffiliated financial institutions (the “Purchasers”). The sale of these receivables is accounted for as a sale of assets under the provisions of ASC 860, Transfers and Servicing. We utilize PDC Funding III and PDC Funding IV to facilitate the sale to fulfill requirements within the agreement. We use a daily unit of account for these Receivables.
The proceeds from the sale of these Receivables comprise a combination of cash and a deferred purchase price (“DPP”) receivable. The DPP receivable is ultimately realized by Patterson following the collection of the underlying Receivables sold to the Purchasers. The amount available under the Receivables Purchase Agreements fluctuates over time based on the total amount of eligible Receivables generated during the normal course of business, with maximum availability of $200,000 as of April 27, 2024, of which $200,000 was utilized.
We have no retained interests in the transferred Receivables, other than our right to the DPP receivable and collection and administrative service fees. We consider the fees received adequate compensation for services rendered, and accordingly have recorded no servicing asset or liability. As of April 27, 2024 and April 29, 2023, the fair value of outstanding trade receivables transferred to the Purchasers under the facility and derecognized from the Consolidated Balance Sheets were $400,626 and $429,853, respectively. Sales of trade receivables under this facility were $3,585,194, $3,718,167, and $3,643,700, and cash collections from customers on receivables sold were $3,614,901, $3,684,412 and $3,632,145 during the fiscal years ended 2024, 2023 and 2022, respectively.
The DPP receivable is recorded at fair value within the Consolidated Balance Sheets within prepaid expenses and other current assets. The difference between the carrying amount of the Receivables and the sum of the cash and fair value of the DPP receivable received at time of transfer is recognized as a gain or loss on sale of the related Receivables inclusive of bank fees and allowance for credit losses. In operating expenses in the Consolidated Statements of Operations and Other Comprehensive Income, we recorded losses of $13,850, $11,403 and $3,247 during fiscal 2024, 2023 and 2022, respectively, related to the Receivables.
The following rollforward summarizes the activity related to the DPP receivable:
| | | | | | | | | | | | | | | | | |
| Fiscal Year Ended |
| April 27, 2024 | | April 29, 2023 | | April 30, 2022 |
| Beginning DPP receivable balance | $ | 227,946 | | | $ | 195,764 | | | $ | 183,999 | |
| Non-cash additions to DPP receivable | 949,194 | | | 960,909 | | | 1,052,938 | |
| Cash collections on DPP receivable | (978,313) | | | (928,727) | | | (1,041,173) | |
| Ending DPP receivable balance | $ | 198,827 | | | $ | 227,946 | | | $ | 195,764 | |
5. Customer Financing
As a convenience to our customers, we offer several different financing alternatives, including a third party program and a Patterson-sponsored program. For the third party program, we act as a facilitator between the customer and the third party financing entity with no on-going involvement in the financing transaction. Under the Patterson-sponsored program, equipment purchased by creditworthy customers may be financed up to a maximum of $2,000. We generally sell our customers’ financing contracts to outside financial institutions in the normal course of our business. These financing arrangements are accounted for as a sale of assets under the provisions of ASC 860, Transfers and Servicing. We use a monthly unit of account for these financing contracts.
We operate under an agreement to sell a portion of our equipment finance contracts to commercial paper conduits with MUFG serving as the agent. We utilize PDC Funding to fulfill a requirement of participating in the commercial paper conduit. We receive the proceeds of the contracts upon sale to MUFG. At least 15.0% of the proceeds are held by the conduit as security against eventual performance of the portfolio. This percentage can be greater and is based upon certain ratios defined in the agreement with MUFG. The capacity under the agreement with MUFG at April 27, 2024 was $575,000.
Historically, we maintained two arrangements under which we sell these contracts. We formerly also maintained an agreement with Fifth Third Bank ("Fifth Third") whereby Fifth Third purchased customers’ financing contracts. PDC Funding II sold its financing contracts to Fifth Third. We received the proceeds of the contracts upon sale to Fifth Third. At least 15.0% were held by the conduit as security against eventual performance of the portfolio.
During fiscal 2024, Fifth Third sold and assigned the remaining purchased customer financing contracts to the facility in which MUFG is the agent. We transferred and assigned the related DPP receivable of $15,400 from PDC Funding II to PDC Funding, and the DPP counterparty changed from Fifth Third to MUFG. We amended our agreement with MUFG as agent and expanded capacity under that agreement from $525,000 to $575,000. We thereby ended our agreement with Fifth Third.
We service the financing contracts, for which we are paid a servicing fee. The servicing fees we receive are considered adequate compensation for services rendered. Accordingly, no servicing asset or liability has been recorded.
The portion of the purchase price for the receivables held by the conduits is deemed a DPP receivable, which is paid to the applicable special purpose entity as payments on the customers’ financing contracts are collected by Patterson from customers. The difference between the carrying amount of the receivables sold under these programs and the sum of the cash and fair value of the DPP receivable received at time of transfer is recognized as a gain or loss on sale of the related receivables and recorded in net sales in the Consolidated Statements of Operations and Other Comprehensive Income. Expenses incurred related to customer financing activities are recorded in operating expenses in our Consolidated Statements of Operations and Other Comprehensive Income.
During fiscal 2024, 2023 and 2022, we sold $281,076, $261,853 and $314,732 of contracts under these arrangements, respectively. In net sales in the Consolidated Statements of Operations and Other Comprehensive Income, we recorded losses of $11,010, $4,082 and $18,379 during fiscal 2024, 2023 and 2022, respectively, related to these contracts sold. Cash collections on financed receivables sold were $291,621, $302,851 and $426,188 during the fiscal years ended 2024, 2023 and 2022, respectively. Unamortized discounts of $3,097 and $0 were recorded as of April 27, 2024 and April 29, 2023, respectively, which represent subsidies on contracts with below-market interest rates.
Included in cash and cash equivalents in the Consolidated Balance Sheets are $33,813 and $33,072 as of April 27, 2024 and April 29, 2023, respectively, which represent cash collected from previously sold customer financing contracts that have not yet been settled. Included in current receivables in the Consolidated Balance Sheets are $74,430 and $77,646 as of April 27, 2024 and April 29, 2023, respectively, of finance contracts we have not yet sold. A total of $581,729 of finance contracts receivable sold under the arrangements was outstanding at April 27, 2024. Since the internal financing program began in 1994, bad debt write-offs have amounted to less than 1% of the loans originated.
The following rollforward summarizes the activity related to the DPP receivable:
| | | | | | | | | | | | | | | | | |
| Fiscal Year Ended |
| April 27, 2024 | | April 29, 2023 | | April 30, 2022 |
| Beginning DPP receivable balance | $ | 102,979 | | | $ | 125,332 | | | $ | 227,967 | |
| Non-cash additions to DPP receivable | 61,244 | | | 47,832 | | | 69,689 | |
| Cash collections on DPP receivable | (49,964) | | | (70,185) | | | (172,324) | |
| Ending DPP receivable balance | $ | 114,259 | | | $ | 102,979 | | | $ | 125,332 | |
The arrangements require us to maintain a minimum current ratio and maximum leverage ratio. We were in compliance with those covenants at April 27, 2024.
6. Derivative Financial Instruments
We are a party to certain offsetting and identical interest rate cap agreements entered into to fulfill certain covenants of the equipment finance contract sale agreements. The interest rate cap agreements also provide a credit enhancement feature for the financing contracts sold by PDC Funding and PDC Funding II to the commercial paper conduit.
The interest rate cap agreements are entered into periodically to maintain consistency with the dollar maximum of the sale agreements and the maturity of the underlying financing contracts. As of April 27, 2024, PDC Funding had purchased an interest rate cap from a bank with a notional amount of $575,000 and a maturity date of July 2031. We sold an identical interest rate cap to the same bank.
These interest rate cap agreements do not qualify for hedge accounting treatment and, accordingly, we record the fair value of the agreements as an asset or liability and the change in fair value as income or expense during the period in which the change occurs.
In January 2014, we entered into a forward interest rate swap agreement with a notional amount of $250,000 and accounted for it as a cash flow hedge, in order to hedge interest rate fluctuations in anticipation of refinancing the 5.17% senior notes due March 25, 2015. These notes were repaid on March 25, 2015 and replaced with new $250,000 3.48% senior notes due March 24, 2025. A cash payment of $29,003 was made in March 2015 to settle the interest rate swap. This amount is recorded in other comprehensive income (loss), net of tax, and is recognized as interest expense over the life of the related debt.
We utilize forward interest rate swap agreements to hedge against interest rate fluctuations that impact the amount of net sales we record related to our customer financing contracts. These interest rate swap agreements do not qualify for hedge accounting treatment and, accordingly, we record the fair value of the agreements as an asset or liability and the change in fair value as income or expense during the period in which the change occurs.
As of April 29, 2023, the remaining notional amount for interest rate swap agreements was $551,504, with the latest maturity date in fiscal 2030. During fiscal 2024, we entered into forward interest rate swap agreements with a notional amount of $247,734. As of April 27, 2024, the remaining notional amount for interest rate swap agreements was $565,420, with the latest maturity date in fiscal 2031.
Net cash receipts of $14,413 and $7,626 were received in fiscal 2024 and 2023, respectively, to settle a portion of our assets and liabilities related to interest rate swap agreements. These receipts are reflected as cash flows in the Consolidated Statements of Cash Flows within net cash used in operating activities.
The following presents the fair value of derivative instruments included in the Consolidated Balance Sheets:
| | | | | | | | | | | | | | | | | | | | |
| Derivative type | | Classification | | April 27, 2024 | | April 29, 2023 |
| Assets: | | | | | | |
| Interest rate contracts | | Prepaid expenses and other current assets | | $ | 5,781 | | | $ | 5,875 | |
| Interest rate contracts | | Other non-current assets | | 21,193 | | | 23,210 | |
| Total asset derivatives | | | | $ | 26,974 | | | $ | 29,085 | |
| Liabilities: | | | | | | |
| Interest rate contracts | | Other accrued liabilities | | $ | 259 | | | $ | 267 | |
| Interest rate contracts | | Other non-current liabilities | | 13,198 | | | 12,993 | |
| Total liability derivatives | | | | $ | 13,457 | | | $ | 13,260 | |
The following tables present the pre-tax effect of derivative instruments on the Consolidated Statements of Operations and Other Comprehensive Income: | | | | | | | | | | | | | | | | | | | | | | | |
| | | Amount of Loss Reclassified from Accumulated Other Comprehensive Loss into Income (Effective Portion) |
| | | Fiscal Year Ended |
| Derivatives in cash flow hedging relationships | Statements of operations location | | April 27, 2024 | | April 29, 2023 | | April 30, 2022 |
| | | | | | | |
| Interest rate contracts | Interest expense | | $ | (1,363) | | | $ | (1,363) | | | $ | (1,363) | |
| | | | | | | | | | | | | | | | | | | | | | | |
| | | Amount of Gain (Loss) Recognized in Income on Derivatives |
| | | Fiscal Year Ended |
| Derivatives not designated as hedging instruments | Statements of operations location | | April 27, 2024 | | April 29, 2023 | | April 30, 2022 |
| Interest rate contracts | Other income, net | | $ | 12,447 | | | $ | 9,968 | | | $ | 15,835 | |
There were no gains or losses recognized in other comprehensive income (loss) on cash flow hedging derivatives in fiscal 2024, 2023 or 2022.
We recorded no ineffectiveness during fiscal 2024, 2023 or 2022. As of April 27, 2024, the estimated pre-tax portion of accumulated other comprehensive loss that is expected to be reclassified into earnings over the next twelve months is $1,250, which will be recorded as an increase to interest expense.
7. Fair Value Measurements
Fair value is the price at which an asset could be exchanged in a current transaction between knowledgeable, willing parties. The fair value hierarchy of measurements is categorized into one of three levels based on the lowest level of significant input used:
| | | | | | | | |
| Level 1 – | | Quoted prices in active markets for identical assets and liabilities at the measurement date. |
| |
| Level 2 – | | Observable inputs other than quoted prices included in Level 1, such as quoted prices for similar assets and liabilities in active markets; quoted prices for identical or similar assets and liabilities in markets that are not active; or other inputs that are observable or can be corroborated by observable market data. |
| |
| Level 3 – | | Unobservable inputs for which there is little or no market data available. These inputs reflect
management’s assumptions of what market participants would use in pricing the asset or liability. |
Our hierarchy for assets and liabilities measured at fair value on a recurring basis is as follows: | | | | | | | | | | | | | | | | | | | | | | | |
| April 27, 2024 |
| Total | | Level 1 | | Level 2 | | Level 3 |
| Assets: | | | | | | | |
| Cash equivalents | $ | 4,685 | | | $ | 4,685 | | | $ | — | | | $ | — | |
| DPP receivable - receivables securitization program | 198,827 | | | — | | | — | | | 198,827 | |
| DPP receivable - customer financing | 114,259 | | | — | | | — | | | 114,259 | |
| Derivative instruments | 26,974 | | | — | | | 26,974 | | | — | |
| Total assets | $ | 344,745 | | | $ | 4,685 | | | $ | 26,974 | | | $ | 313,086 | |
| Liabilities: | | | | | | | |
| Derivative instruments | $ | 13,457 | | | $ | — | | | $ | 13,457 | | | $ | — | |
| | | | | | | | | | | | | | | | | | | | | | | |
| April 29, 2023 |
| Total | | Level 1 | | Level 2 | | Level 3 |
| Assets: | | | | | | | |
| Cash equivalents | $ | 47,777 | | | $ | 47,777 | | | $ | — | | | $ | — | |
| DPP receivable - receivables securitization program | 227,946 | | | — | | | — | | | 227,946 | |
| DPP receivable - customer financing | 102,979 | | | — | | | — | | | 102,979 | |
| Derivative instruments | 29,085 | | | — | | | 29,085 | | | — | |
| Total assets | $ | 407,787 | | | $ | 47,777 | | | $ | 29,085 | | | $ | 330,925 | |
| Liabilities: | | | | | | | |
| Derivative instruments | $ | 13,260 | | | $ | — | | | $ | 13,260 | | | $ | — | |
Cash equivalents – We value cash equivalents at their current market rates. The carrying value of cash equivalents approximates fair value and maturities are less than three months.
DPP receivable - receivables securitization program – We value this DPP receivable based on a discounted cash flow analysis using unobservable inputs, which include the estimated timing of payments and the credit quality of the underlying creditor. Significant changes in any of the significant unobservable inputs in isolation would not result in a materially different fair value estimate. The interrelationship between these inputs is insignificant.
DPP receivable - customer financing – We value this DPP receivable based on a discounted cash flow analysis using unobservable inputs, which include a forward yield curve, the estimated timing of payments and the credit quality of the underlying creditor. Significant changes in any of the significant unobservable inputs in isolation would not result in a materially different fair value estimate. The interrelationship between these inputs is insignificant.
Derivative instruments –Our derivative instruments consist of interest rate cap agreements and interest rate swaps. These instruments are valued using inputs such as interest rates and credit spreads.
Certain assets are measured at fair value on a non-recurring basis. These assets are not measured at fair value on an ongoing basis, but are subject to fair value adjustments under certain circumstances. We adjust the carrying value of our non-marketable equity securities to fair value when observable transactions of identical or similar securities occur, or due to an impairment.
We have an investment in Vetsource, a commercial partner and leading home delivery provider for veterinarians. In fiscal 2022, we sold a portion of our investment in Vetsource, with a carrying value of $25,814, for $56,849. We recorded a pre-tax gain of $31,035 in gains on investments in our Consolidated Statements of Operations and Other Comprehensive Income as a result of this sale. The cash received of $56,849 is reported within investing activities in our Consolidated Statements of Cash Flows. In fiscal 2022, we also recorded a pre-tax non-cash gain of $31,035 to reflect the increase in the carrying value of the remaining portion of our investment in Vetsource, which was based on the selling price of the portion of the investment we sold for $56,849. This gain was recorded in gains on investments in our Consolidated Statements of Operations and Other comprehensive income. The carrying value of the investment we owned following this sale was $56,849 and $56,849 as of April 27, 2024 and April 29, 2023,
respectively. Concurrent with the sale completed in fiscal 2022, we obtained rights that will allow us, under certain circumstances, to require another shareholder of Vetsource to purchase our remaining shares. We recorded a pre-tax non-cash gain of $25,757 in gains on investments in our Consolidated Statements of Operations and Other Comprehensive Income as a result of this transaction. The carrying value of this put option as of April 27, 2024 is $25,757, and is reported within investments in our Consolidated Balance Sheets. The aggregate gains on investments of $87,827 are reported within operating activities in our Consolidated Statements of Cash Flows. Concurrent with obtaining this put option, we also granted rights to the same Vetsource shareholder that would allow such shareholder, under certain circumstances, to require us to sell our remaining shares at fair value. There were no fair value adjustments to such assets during the fiscal year ended April 27, 2024.
In fiscal 2022, we sold a portion of our investment in Vets Plus with a carrying value of $4,009 for $17,101. We recorded a pre-tax gain of $13,092 in gains on investments in our Consolidated Statements of Operations and Other Comprehensive Income as a result of this sale. This $13,092 pre-tax gain is reported within operating activities in our Consolidated Statements of Cash Flows. The cash received of $17,101 is reported within investing activities in our Consolidated Statements of Cash Flows. The carrying value of the investment we owned following this sale was $2,299 and $2,299 as of April 27, 2024 and April 29, 2023, respectively.
Our debt is not measured at fair value in the Consolidated Balance Sheets. The estimated fair value of our debt as of April 27, 2024 and April 29, 2023 was $448,287 and $483,139, respectively, as compared to a carrying value of $451,661 and $487,231 at April 27, 2024 and April 29, 2023, respectively. The fair value of debt was measured using a discounted cash flow analysis based on expected market based yields (i.e., level 2 inputs).
The carrying amounts of receivables, net of allowances, accounts payable, and certain accrued and other current liabilities approximated fair value at April 27, 2024 and April 29, 2023.
8. Goodwill and Other Intangible Assets
The changes in the carrying value of goodwill for each of our reporting units for the fiscal year ended April 27, 2024 were as follows: | | | | | | | | | | | | | | | | | | | | | |
| Balance at April 29, 2023 | | | | | | Foreign Currency Translation | | Balance at April 27, 2024 |
| Dental | $ | 139,111 | | | | | | | $ | (92) | | | $ | 139,019 | |
| Animal Health | 17,309 | | | | | | | — | | | 17,309 | |
| | | | | | | | | |
| Total | $ | 156,420 | | | | | | | $ | (92) | | | $ | 156,328 | |
Balances of other intangible assets, excluding goodwill, were as follows:
| | | | | | | | | | | | | | | | | | | | | | | | | | | | | | | | | | | |
| April 27, 2024 | | April 29, 2023 |
| Gross | | Accumulated Amortization | | Net | | Gross | | Accumulated Amortization | | Net |
| Unamortized - indefinite lived: | | | | | | | | | | | |
| Trade name | $ | 12,300 | | | $ | — | | | $ | 12,300 | | | $ | 12,300 | | | $ | — | | | $ | 12,300 | |
| Amortized - definite lived: | | | | | | | | | | | |
| Customer relationships | 380,003 | | | 228,851 | | | 151,152 | | | 380,205 | | | 205,524 | | | 174,681 | |
| Trade names and trademarks | 135,830 | | | 119,326 | | | 16,504 | | | 135,876 | | | 107,519 | | | 28,357 | |
| Developed technology and other | 52,906 | | | 39,601 | | | 13,305 | | | 52,920 | | | 36,385 | | | 16,535 | |
| Total amortized intangible assets | 568,739 | | | 387,778 | | | 180,961 | | | 569,001 | | | 349,428 | | | 219,573 | |
| Total identifiable intangible assets | $ | 581,039 | | | $ | 387,778 | | | $ | 193,261 | | | $ | 581,301 | | | $ | 349,428 | | | $ | 231,873 | |
With respect to the amortized intangible assets, future amortization expense is expected to approximate $38,525, $28,716, $27,324, $26,761 and $23,739 for fiscal 2025, 2026, 2027, 2028 and 2029, respectively. Actual amounts of amortization expense may differ from estimated amounts due to additional intangible asset acquisitions, changes in foreign currency exchange rates, impairment of intangible assets, accelerated amortization of intangible assets and other events.
9. Property and Equipment
Property and equipment consisted of the following: | | | | | | | | | | | |
| April 27, 2024 | | April 29, 2023 |
| Land | $ | 9,680 | | | $ | 9,687 | |
| Buildings | 109,727 | | | 98,174 | |
| Leasehold improvements | 32,338 | | | 31,712 | |
| Furniture and equipment | 213,010 | | | 204,754 | |
| Computer hardware and software | 261,937 | | | 250,805 | |
Construction-in-progress (1) | 35,683 | | | 32,233 | |
| Property and equipment, gross | 662,375 | | | 627,365 | |
| Accumulated depreciation | (433,294) | | | (415,082) | |
| Property and equipment, net | $ | 229,081 | | | $ | 212,283 | |
(1)Includes $20,540 and $10,661 of unamortized development costs of software to be sold as of April 27, 2024 and April 29, 2023, respectively.
10. Leases
We lease certain warehouses, office space, vehicles and equipment. Leases with an initial term of 12 months or less are not recorded on the Consolidated Balance Sheets. We recognize lease expense for these leases on a straight-line basis over the lease term. We do not separate lease and non-lease components, and instead account for each lease and non-lease component associated with that lease as a single lease component. Some leases include one or more options to renew. The exercise of renewal options is at our sole discretion. Our lease agreements do not contain significant residual value guarantees, restrictions or covenants.
Total lease costs for the fiscal year ended April 27, 2024 and April 29, 2023 were $38,497 and $35,640, respectively, which include variable lease costs and short-term lease costs, which were immaterial.
The following table presents future maturities of lease liabilities:
| | | | | |
| 2025 | $ | 38,047 | |
| 2026 | 30,763 | |
| 2027 | 25,216 | |
| 2028 | 18,914 | |
| 2029 | 8,919 | |
| After 2029 | 26,067 | |
| Total lease payments | 147,926 | |
| Less: imputed interest | (22,647) | |
| Present value of lease liabilities | $ | 125,279 | |
The following tables present other supplemental information related to leases: | | | | | | | | | | | | | | |
| | Fiscal Year Ended |
| | April 27, 2024 | | April 29, 2023 |
| Cash paid for amounts included in the measurement of operating lease liabilities | | $ | 39,803 | | $ | 35,779 |
| Lease assets obtained in exchange for new operating lease liabilities | | $ | 83,041 | | $ | 56,603 |
| | | | |
| | April 27, 2024 | | April 29, 2023 |
| Weighted-average remaining lease term - operating leases | | 5.87 years | | 6.50 years |
| Weighted-average discount rate - operating leases | | 5.01 | % | | 4.40 | % |
11. Debt
Our long-term debt consisted of the following: | | | | | | | | | | | | | | | | | |
| | | Carrying Value |
| Interest Rate | | April 27, 2024 | | April 29, 2023 |
| | | | | |
Senior notes due fiscal 2024 (1) | 3.74 | % | | — | | | 33,000 | |
Senior notes due fiscal 2025 (2) | 3.48 | % | | 117,500 | | | 117,500 | |
Senior notes due fiscal 2028 (3) | 3.79 | % | | 40,000 | | | 40,000 | |
| | | | | |
Term loan due fiscal 2025 through 2028 (4) | 6.54 | % | | 295,500 | | | 298,500 | |
| Less: Deferred debt issuance costs | | | (1,339) | | | (1,769) | |
| Total debt | | | 451,661 | | | 487,231 | |
| Less: Current maturities of long-term debt | | | (122,750) | | | (36,000) | |
| Long-term debt | | | $ | 328,911 | | | $ | 451,231 | |
(1)Issued in December 2011.
(2)Issued in March 2015.
(3)Issued in March 2018.
(4)Issued in December 2019, amended in October 2022. Interest rate is 1-month SOFR plus 1.225% as of April 27, 2024.
Future principal payments due, based on stated contractual maturities for our long-term debt, were as follows as of April 27, 2024:
| | | | | |
| Fiscal Year | |
| 2025 | $ | 122,750 | |
| 2026 | 11,250 | |
| 2027 | 15,000 | |
| 2028 | 304,000 | |
| 2029 | — | |
| Thereafter | — | |
| Total | $ | 453,000 | |
In fiscal 2021, we entered into an amendment, restatement and consolidation of certain credit agreements with various lenders, including MUFG Bank, Ltd, as administrative agent. This amended and restated credit agreement (the “Credit Agreement”) consisted of a $700,000 revolving credit facility and a $300,000 term loan facility, and was set to mature no later than February 2024.
In fiscal 2023, we amended and restated the Credit Agreement (the “Amended Credit Agreement”). The Amended Credit Agreement consists of a $700,000 revolving credit facility and a $300,000 term loan facility, and will mature no later than October 2027. We used the Amended Credit Agreement facilities to refinance and consolidate the Credit Agreement, and pay the fees and expenses incurred therewith. We expect to use the Amended Credit Agreement to finance our ongoing working capital needs and for other general corporate purposes.
As of April 27, 2024, $295,500 was outstanding under the Amended Credit Agreement term loan at an interest rate of 6.54% and $186,000 was outstanding under the Amended Credit Agreement revolving credit facility at an interest rate of 6.53%. As of April 29, 2023, $298,500 was outstanding under the Credit Agreement term loan at an interest rate of 6.08%, and $45,000 was outstanding under the Credit Agreement revolving credit facility at an interest rate of 5.93%.
We are subject to various financial covenants under our debt agreements including the maintenance of leverage and interest coverage ratios. In the event of our default, any outstanding obligations may become due and payable immediately. We were in compliance with the covenants under our debt agreements as of April 27, 2024.
12. Income Taxes
The components of income before taxes were as follows:
| | | | | | | | | | | | | | | | | |
| Fiscal Year Ended |
| April 27,
2024 | | April 29,
2023 | | April 30,
2022 |
| Income before taxes | | | | | |
| United States | $ | 211,350 | | | $ | 233,416 | | | $ | 225,195 | |
| International | 31,703 | | | 36,745 | | | 41,059 | |
| Total | $ | 243,053 | | | $ | 270,161 | | | $ | 266,254 | |
Significant components of income tax expense were as follows: | | | | | | | | | | | | | | | | | |
| Fiscal Year Ended |
| April 27,
2024 | | April 29,
2023 | | April 30,
2022 |
| Current: | | | | | |
| Federal | $ | 51,263 | | | $ | 46,982 | | | $ | 46,964 | |
| Foreign | 8,201 | | | 8,280 | | | 11,968 | |
| State | 11,593 | | | 10,294 | | | 10,326 | |
| Total current expense | 71,057 | | | 65,556 | | | 69,258 | |
| Deferred: | | | | | |
| Federal | (13,403) | | | (4,217) | | | (3,918) | |
| Foreign | 2,045 | | | 2,601 | | | (217) | |
| State | (2,165) | | | (377) | | | (583) | |
| Total deferred benefit | (13,523) | | | (1,993) | | | (4,718) | |
| Income tax expense | $ | 57,534 | | | $ | 63,563 | | | $ | 64,540 | |
Deferred tax assets and liabilities are included in other non-current assets and deferred income taxes on the Consolidated Balance Sheets. Significant components of our deferred tax assets (liabilities) were as follows:
| | | | | | | | | | | |
| April 27,
2024 | | April 29,
2023 |
| Deferred tax assets: | | | |
| Employee compensation and benefits | $ | 7,674 | | | $ | 7,519 | |
| Inventory related items | 7,645 | | | 8,228 | |
| Foreign intangibles and goodwill | 11,767 | | | 11,420 | |
| | | |
| | | |
| Foreign tax credit | 7,003 | | | 7,003 | |
| Lease liability | 29,587 | | | 19,808 | |
| Accrued charitable contributions | 427 | | | 902 | |
| Capitalized research and experimentation costs | 12,020 | | | 5,172 | |
| Other accrued liabilities | 6,498 | | | 7,744 | |
| Other | 8,329 | | | 7,270 | |
| Gross deferred tax assets | 90,950 | | | 75,066 | |
| Less: Valuation allowance | (18,620) | | | (18,276) | |
| Total net deferred tax assets | 72,330 | | | 56,790 | |
| Deferred tax liabilities | | | |
| LIFO reserve | (29,593) | | | (26,010) | |
| Amortizable intangibles | (36,923) | | | (45,042) | |
| Goodwill | (18,098) | | | (17,094) | |
| Property, plant, equipment | (32,457) | | | (36,488) | |
| Lease right-of-use assets | (29,048) | | | (19,361) | |
| Investments | (26,662) | | | (26,959) | |
| Other | (4,070) | | | (3,557) | |
| Total deferred tax liabilities | (176,851) | | | (174,511) | |
| Deferred net long-term income tax liability | $ | (104,521) | | | $ | (117,721) | |
At April 27, 2024, we had a U.S. foreign tax credit asset that will expire in two years. In addition, we have foreign deferred tax assets which would give rise to tax capital losses if triggered in the future. These losses can only be used against capital gain income. At this time, we believe that it is more likely than not that the foreign tax credit and potential capital loss carryforward attributes totaling $18,620 will not be fully utilized prior to expiration. As a result, a full valuation allowance has been established against these assets.
With regard to unremitted earnings of foreign subsidiaries generated after December 31, 2017, we do not currently provide for U.S. taxes since we intend to reinvest such undistributed earnings indefinitely outside of the United States.
Income tax expense varies from the amount computed using the U.S. statutory rate. The reasons for this difference and the related tax effects are shown below.
| | | | | | | | | | | | | | | | | |
| Fiscal Year Ended |
| April 27,
2024 | | April 29,
2023 | | April 30,
2022 |
| Tax at U.S. statutory rate | $ | 51,038 | | | $ | 56,732 | | | $ | 55,912 | |
| State tax provision, net of federal benefit | 7,630 | | | 8,416 | | | 9,176 | |
| Effect of foreign taxes | 3,612 | | | 2,853 | | | 3,199 | |
| | | | | |
| | | | | |
| ESOP | (1,895) | | | (2,049) | | | (2,121) | |
| Other permanent differences | 1,308 | | | 2,481 | | | 944 | |
| | | | | |
| | | | | |
| Other | (4,159) | | | (4,870) | | | (2,570) | |
| Income tax expense | $ | 57,534 | | | $ | 63,563 | | | $ | 64,540 | |
We have accounted for the uncertainty in income taxes recognized in the financial statements in accordance with ASC Topic 740. This standard clarifies the separate identification and reporting of estimated amounts that could be assessed upon audit. The potential assessments are considered unrecognized tax benefits, because, if it is ultimately determined they are unnecessary, the reversal of these previously recorded amounts will result in a beneficial impact to our financial statements.
As of April 27, 2024 and April 29, 2023, Patterson’s gross unrecognized tax benefits were $8,049 and $8,291, respectively. If determined to be unnecessary, these amounts (net of deferred tax assets of $1,690 and $1,741, respectively, related to the tax deductibility of the gross liabilities) would decrease our effective tax rate. The gross unrecognized tax benefits are included in other non-current liabilities on the Consolidated Balance Sheets.
A summary of the changes in the gross amounts of unrecognized tax benefits is shown below.
| | | | | | | | | | | |
| April 27,
2024 | | April 29,
2023 |
| Balance at beginning of period | $ | 8,291 | | | $ | 9,898 | |
| Additions for tax positions related to the current year | 1,156 | | | 1,158 | |
| Additions for tax positions of prior years | 128 | | | 142 | |
| Reductions for tax positions of prior years | (12) | | | (1,400) | |
| Statute expirations | (1,514) | | | (1,507) | |
| Settlements | — | | | — | |
| Balance at end of period | $ | 8,049 | | | $ | 8,291 | |
We also recognize both interest and penalties with respect to unrecognized tax benefits as a component of income tax expense. As of April 27, 2024 and April 29, 2023, we had recorded $1,756 and $1,617, respectively, for interest and penalties. These amounts are also included in other non-current liabilities on the Consolidated Balance Sheets. These amounts, net of related deferred tax assets, if determined to be unnecessary, would decrease our effective tax rate. During the year ended April 27, 2024, we recorded as part of tax expense $365 related to an increase in our estimated liability for interest and penalties.
Patterson files income tax returns, including returns for our subsidiaries, with federal, state, local and foreign jurisdictions. The IRS has either examined or waived examination for all periods up to and including our fiscal year ended April 25, 2020. In addition to the IRS, periodically, state, local and foreign income tax returns are examined by various taxing authorities. We do not believe that the outcome of these various examinations will have a material adverse impact on our financial statements.
13. Technology Partner Innovations, LLC ("TPI")
In fiscal 2019, we entered into an agreement with Cure Partners to form TPI, which offers a cloud-based practice management software, NaVetor, to its customers. Patterson and Cure Partners each contributed net assets of $4,000 to form TPI. Patterson and Cure Partners each contributed additional net assets of $1,000 and $1,000 during fiscal 2023 and 2022, respectively, and no additional net assets were contributed during fiscal 2024. We have determined that TPI is a variable interest entity, and we consolidate the results of operations of TPI as we have concluded that we are the primary beneficiary of TPI. Since TPI was formed, there have been no changes in ownership interests. As of April 27, 2024, we had noncontrolling interests of $588 on our Consolidated Balance Sheets.
During fiscal 2024, 2023 and 2022, net loss attributable to the noncontrolling interest was $412, $959 and $1,496, respectively.
14. Segment and Geographic Data
We present three reportable segments: Dental, Animal Health and Corporate. Dental and Animal Health are strategic business units that offer similar products and services to different customer bases. Dental provides a virtually complete range of consumable dental products, equipment, turnkey digital solutions and value-added services to dentists, dental laboratories, institutions, and other healthcare professionals throughout North America. Animal Health is a leading, full-line distributor in North America and the U.K. of animal health products, services and technologies to both the production-animal and companion-pet markets. Our Corporate segment is comprised of general and administrative expenses, including home office support costs in areas such as information technology, finance, legal, human resources and facilities. In addition, customer financing and other miscellaneous sales are
reported within Corporate results. Corporate assets consist primarily of cash and cash equivalents, accounts receivable, property and equipment and long-term receivables. We evaluate segment performance based on operating income. The costs to operate the fulfillment centers are allocated to the business units based on the through-put of the unit.
The following tables present information about our reportable segments and the geographic areas in which we operate: | | | | | | | | | | | | | | | | | |
| Fiscal Year Ended |
| April 27,
2024 | | April 29,
2023 | | April 30,
2022 |
| Consolidated net sales | | | | | |
| United States | $ | 5,438,727 | | | $ | 5,423,931 | | | $ | 5,358,489 | |
| United Kingdom | 759,184 | | | 655,103 | | | 717,481 | |
| Canada | 370,361 | | | 392,437 | | | 423,435 | |
| Total | $ | 6,568,272 | | | $ | 6,471,471 | | | $ | 6,499,405 | |
| Dental net sales | | | | | |
| United States | $ | 2,260,198 | | | $ | 2,256,006 | | | $ | 2,259,579 | |
| Canada | 228,436 | | | 236,136 | | | 256,553 | |
| Total | $ | 2,488,634 | | | $ | 2,492,142 | | | $ | 2,516,132 | |
| Animal Health net sales | | | | | |
| United States | $ | 3,165,960 | | | $ | 3,153,518 | | | $ | 3,098,511 | |
| United Kingdom | 759,184 | | | 655,103 | | | 717,481 | |
| Canada | 141,925 | | | 156,301 | | | 166,882 | |
| Total | $ | 4,067,069 | | | $ | 3,964,922 | | | $ | 3,982,874 | |
| Corporate net sales | | | | | |
| United States | $ | 12,569 | | | $ | 14,407 | | | $ | 399 | |
| Total | $ | 12,569 | | | $ | 14,407 | | | $ | 399 | |
| | | | | | | | | | | | | | | | | |
| Fiscal Year Ended |
| April 27,
2024 | | April 29,
2023 | | April 30,
2022 |
| Consolidated net sales | | | | | |
| Consumable | $ | 5,274,012 | | | $ | 5,147,330 | | | $ | 5,248,040 | |
| Equipment | 888,597 | | | 950,403 | | | 920,424 | |
| Value-added services and other | 405,663 | | | 373,738 | | | 330,941 | |
| Total | $ | 6,568,272 | | | $ | 6,471,471 | | | $ | 6,499,405 | |
| Dental net sales | | | | | |
| Consumable | $ | 1,415,789 | | | $ | 1,358,823 | | | $ | 1,424,677 | |
| Equipment | 766,345 | | | 823,978 | | | 800,144 | |
| Value-added services and other | 306,500 | | | 309,341 | | | 291,311 | |
| Total | $ | 2,488,634 | | | $ | 2,492,142 | | | $ | 2,516,132 | |
| Animal Health net sales | | | | | |
| Consumable | $ | 3,858,223 | | | $ | 3,788,507 | | | $ | 3,823,363 | |
| Equipment | 122,252 | | | 126,425 | | | 120,280 | |
| Value-added services and other | 86,594 | | | 49,990 | | | 39,231 | |
| Total | $ | 4,067,069 | | | $ | 3,964,922 | | | $ | 3,982,874 | |
| Corporate net sales | | | | | |
| | | | | |
| | | | | |
| Value-added services and other | $ | 12,569 | | | $ | 14,407 | | | $ | 399 | |
| Total | $ | 12,569 | | | $ | 14,407 | | | $ | 399 | |
| | | | | | | | | | | | | | | | | |
| Fiscal Year Ended |
| April 27,
2024 | | April 29,
2023 | | April 30,
2022 |
| Operating income | | | | | |
| Dental | $ | 209,807 | | | $ | 237,268 | | | $ | 180,212 | |
| Animal Health | 139,077 | | | 126,994 | | | 114,403 | |
| Corporate | (95,960) | | | (88,291) | | | (137,613) | |
| Consolidated operating income | $ | 252,924 | | | $ | 275,971 | | | $ | 157,002 | |
| | | | | |
| Depreciation and amortization | | | | | |
| Dental | $ | 15,932 | | | $ | 14,051 | | | $ | 13,495 | |
| Animal Health | 46,462 | | | 44,644 | | | 44,561 | |
| Corporate | 25,762 | | | 25,009 | | | 23,936 | |
| Consolidated depreciation and amortization | $ | 88,156 | | | $ | 83,704 | | | $ | 81,992 | |
| | | | | | | | | | | |
| April 27,
2024 | | April 29,
2023 |
| Property and equipment, net | | | |
| United States | $ | 180,835 | | | $ | 177,163 | |
| United Kingdom | 24,671 | | | 21,033 | |
| Canada | 23,575 | | | 14,087 | |
| Total property and equipment, net | $ | 229,081 | | | $ | 212,283 | |
| | | |
| April 27,
2024 | | April 29,
2023 |
| Total assets | | | |
| Dental | $ | 913,478 | | | $ | 853,369 | |
| Animal Health | 1,568,413 | | | 1,570,760 | |
| Corporate | 414,841 | | | 455,017 | |
| Total assets | $ | 2,896,732 | | | $ | 2,879,146 | |
15. Stockholders’ Equity
Dividends
The following table presents our declared cash dividends per share on our common stock for the past three years. In fiscal 2024, 2023 and 2022, dividends were declared in the period presented and paid in the following quarter.
| | | | | | | | | | | | | | | | | | | | | | | |
| Quarter |
| Fiscal year | 1 | | 2 | | 3 | | 4 |
| 2024 | $ | 0.26 | | | $ | 0.26 | | | $ | 0.26 | | | $ | 0.26 | |
| 2023 | 0.26 | | | 0.26 | | | 0.26 | | | 0.26 | |
| 2022 | 0.26 | | | 0.26 | | | 0.26 | | | 0.26 | |
Share Repurchases
During fiscal 2024, we repurchased 7,604 shares of our common stock for $229,508, or an average of $30.18 per share. During fiscal 2023, we repurchased 2,020 shares of our common stock for $55,492, or an average of $27.47 per share. During fiscal 2022, we repurchased 1,032 shares of our common stock for $35,000, or an average of $33.90 per share.
On March 11, 2024, the Board of Directors authorized a $500,000 share repurchase program through March 16, 2027, replacing a prior authorization which was expiring. As of April 27, 2024, $500,000 remains available under the current stock repurchase program.
16. Stock-based Compensation
The Consolidated Statements of Operations and Other Comprehensive Income for fiscal 2024, 2023 and 2022 include pre-tax (after-tax) stock-based compensation expense of $17,871 ($14,060), $15,543 ($12,353) and $23,805 ($18,686), respectively. Pre-tax expense is included in operating expenses within the Consolidated Statements of Operations and Other Comprehensive Income.
As of April 27, 2024, the total unrecognized compensation cost related to non-vested awards was $16,036, and it is expected to be recognized over a weighted average period of approximately 1.2 years.
2015 Omnibus Incentive Plan
In September 2015, our shareholders approved the 2015 Omnibus Incentive Plan ("Incentive Plan"), which was most recently amended and restated in September 2021. The aggregate number of shares of common stock that may be issued is 19,500. The Incentive Plan authorizes various award types to be issued under the plan, including stock options, restricted stock awards, restricted stock units, stock appreciation rights, performance awards, non-employee director awards, cash-based awards and other stock-based awards. We issue new shares for stock option exercises, restricted stock award grants and also for vesting of restricted stock units and performance stock
units. Awards that expire or are canceled without delivery of shares generally become available for reissuance under the plan.
At April 27, 2024, there were 8,502 shares available for awards under the Incentive Plan.
As a result of the approval of the Incentive Plan, awards are no longer granted under any prior equity incentive plan, but all outstanding awards previously granted under such prior plans will remain outstanding and subject to the terms of such prior plans. At April 27, 2024, there were 289 shares outstanding under prior plans.
Stock Option Awards
Stock options granted to employees expire no later than ten years after the date of grant. Awards typically vest over three years.
The fair value of stock options granted was estimated as of the grant date using a Black-Scholes option-pricing model with the following assumptions:
| | | | | | | | | | | | | | | | | |
| Fiscal Year Ended |
| April 27,
2024 | | April 29,
2023 | | April 30,
2022 |
| Expected dividend yield | 3.1 | % | | 3.5 | % | | 3.4 | % |
| Expected stock price volatility | 39.3 | % | | 38.8 | % | | 38.1 | % |
| Risk-free interest rate | 4.1 | % | | 3.2 | % | | 1.1 | % |
| Expected life (years) | 6.0 | | 6.0 | | 6.0 |
| Weighted average grant date fair value per share | $ | 10.69 | | $ | 8.82 | | $ | 7.97 |
The following is a summary of stock option activity:
| | | | | | | | | | | | | | | | | |
| Number
of
Options | | Weighted-
Average
Exercise
Price | | Aggregate Intrinsic
Value |
| Balance as of April 29, 2023 | 2,020 | | | $ | 30.52 | | | |
| Granted | 228 | | | 33.26 | | | |
| Exercised | (233) | | | 22.97 | | | |
| Canceled | (18) | | | 38.05 | | | |
| Balance as of April 27, 2024 | 1,997 | | | $ | 31.65 | | | $ | 2,824 | |
| Vested or expected to vest as of April 27, 2024 | 1,995 | | | $ | 31.65 | | | $ | 2,824 | |
| Exercisable as of April 27, 2024 | 1,548 | | | $ | 31.65 | | | $ | 2,824 | |
The weighted average remaining contractual lives of options outstanding and options exercisable as of April 27, 2024 were 5.4 and 4.5 years, respectively.
Related to stock options exercised, the intrinsic value, cash received and tax benefits realized were $1,906, $5,365 and $332, respectively, in fiscal 2024; $4,289, $15,555 and $948, respectively, in fiscal 2023; and $1,552, 3,975 and $238, respectively, in fiscal 2022.
Restricted Stock
Restricted stock awards and restricted stock units granted to employees generally vest over a three year period. Restricted stock awards are also granted to non-employee directors annually and vest over one year. The grant date fair value of restricted stock awards and restricted stock units is based on the closing stock price on the day of the grant. The total fair value of restricted stock awards and restricted stock units that vested in fiscal 2024, 2023 and 2022 was $13,773, $16,123 and $19,970, respectively.
The following is a summary of restricted stock award activity:
| | | | | | | | | | | |
| Restricted Stock Awards |
| Shares | | Weighted-
Average
Grant Date
Fair Value |
| Outstanding at April 29, 2023 | 37 | | | $ | 27.23 | |
| Granted | 40 | | | 29.19 | |
| Vested | (37) | | | 27.23 | |
| Forfeitures | — | | | — | |
| Outstanding at April 27, 2024 | 40 | | | $ | 29.19 | |
The following is a summary of restricted stock unit activity:
| | | | | | | | | | | |
| Restricted Stock Units |
| Shares | | Weighted-
Average
Grant Date
Fair Value |
| Outstanding at April 29, 2023 | 792 | | | $ | 29.12 | |
| Granted | 438 | | | 33.18 | |
| Vested | (394) | | | 27.86 | |
| Forfeitures | (42) | | | 31.32 | |
| Outstanding at April 27, 2024 | 794 | | | $ | 31.85 | |
Performance Unit Awards
In fiscal 2024, 2023 and 2022, we granted performance unit awards to certain executives which are earned at the end of a three-year period if certain operating goals are met. The number of shares to be received at vesting related to the fiscal 2024, 2023 and 2022 awards will be determined by performance measured over three fiscal year periods and ultimately modified by Patterson's total shareholder return ("TSR") relative to the performance of companies in the S&P Midcap 400 Index measured over a three-year period. We estimate the grant date fair value of the TSR awards using the Monte Carlo valuation model. We recognize expense over the requisite service period based on the outcome that is probable for these awards. The total fair value of performance unit awards that vested in fiscal 2024 and 2023 was $2,438 and $6,220, respectively. No performance unit awards vested in fiscal 2022.
The following is a summary of performance unit award activity at target:
| | | | | | | | | | | |
| Performance Unit Awards |
| Shares | | Weighted-
Average
Grant Date
Fair Value |
| Outstanding at April 29, 2023 | 203 | | | $ | 30.14 | |
| Granted | 164 | | | 33.84 | |
| Vested | (76) | | | 29.88 | |
| Forfeitures and cancellations | — | | | — | |
| Outstanding at April 27, 2024 | 291 | | | $ | 32.30 | |
Employee Stock Purchase Plan ("ESPP")
We sponsor an ESPP under which a total of 9,000 shares have been reserved for purchase by employees. Eligible employees may purchase shares at 85% of the lower of the fair market value of our common stock on the beginning of the annual offering period, or on the end of each quarterly purchase period, which occur on March 31, June 30, September 30 and December 31. The offering periods begin on January 1 of each calendar year and end on December 31 of each calendar year. At April 27, 2024, there were 658 shares available for purchase under the ESPP.
We estimate the grant date fair value of shares purchased under our ESPP using the Black-Scholes option pricing valuation model with the following assumptions:
| | | | | | | | | | | | | | | | | |
| Fiscal Year Ended |
| April 27,
2024 | | April 29,
2023 | | April 30,
2022 |
| Expected dividend yield | 3.6 | % | | 3.7 | % | | 3.6 | % |
| Expected stock price volatility | 38.2 | % | | 31.5 | % | | 28.6 | % |
| Risk-free interest rate | 5.1 | % | | 4.7 | % | | 0.3 | % |
| Expected life (years) | 0.6 | | 0.6 | | 0.6 |
| Weighted average grant date fair value per share | $ | 7.55 | | $ | 6.89 | | $ | 6.79 |
17. Litigation
From time to time, we become involved in lawsuits, administrative proceedings, government subpoenas, and government investigations (which may, in some cases, involve our entering into settlement agreements or consent decrees), relating to antitrust, commercial, environmental, product liability, intellectual property, regulatory, employment discrimination, putative class actions under the California Labor Code Private Attorneys General Act, and other matters, including matters arising out of the ordinary course of business, including securities litigation. The results of any such proceedings cannot be predicted with certainty because such matters are inherently uncertain. Significant damages or penalties may be sought in some matters, and some matters may require years to resolve. We also may be subject to fines or penalties, and equitable remedies (including but not limited to the suspension, revocation or non-renewal of licenses).
We accrue for these matters when it is both probable that a liability has been incurred and the amount of the loss can be reasonably estimated. Adverse outcomes may result in significant monetary damages or injunctive relief against us that could adversely affect our ability to conduct our business. There also exists the possibility of a material adverse effect on our financial statements for the period in which the effect of an unfavorable outcome becomes probable and reasonably estimable.
On May 23, 2024, Plaintiff Monica Mehring and Mehring Family Dentistry (together, “Plaintiffs”) filed a class action complaint against Patterson Companies Inc. “doing business as Patterson Dental,” UnitedHealth Group and its subsidiaries Change Healthcare and Optum Inc. (collectively, the “Defendants”) in a case captioned Dr. Monica Mehring et al. v. Patterson Companies, Inc. et al., Case No. 4:24-cv-3147 (N.D. Cal. May 23, 2024) (the “Class Action Complaint”). The Class Action Complaint alleges that as a result of Defendants’ failure to implement robust cybersecurity controls, “a group of cybercriminals were able to infiltrate Defendants’ computer networks and steal for ransom confidential health data and source code among other things (‘Data Breach’).” Notwithstanding the Class Action Complaint’s generic reference to “Defendants,” Plaintiffs describe the Data Breach as UnitedHealth Group’s February 21, 2024 discovery that a suspected nation-state associated cyber security threat actor had gained access to some of the Change Healthcare information technology systems. Plaintiffs allege that as a direct result of the Data Breach, they were unable to submit claims through Patterson-supplied Eaglesoft software and, to date, have been unable to receive payments for claims submitted on February 20, 2024. While Plaintiffs assert that they use Eaglesoft to access Change Healthcare and Optum software to “integrate processing, prescriptions, billing and insurance,” the Class Action Complaint does not allege that Eaglesoft or any of Patterson’s IT systems or computer networks were accessed by any threat actor or were otherwise the subject of the alleged Data Breach. Notwithstanding the foregoing, Plaintiffs assert the following causes of action against all Defendants: negligence; “negligent interference with prospective economic advantage;” negligence per se; breach of implied contract; “breach of covenant of good faith and fair dealing;” and unjust enrichment. Plaintiffs purport to bring each claim on behalf of a nationwide class defined as: (i) “[a]ll healthcare providers in the United States whose use of Change Healthcare’s and Optum’s services were disrupted by the [D]ata [B]reach occurring in February 2024”; and (ii) “[a]ll healthcare providers in the United States whose use of Patterson Dental’s Eaglesoft’s services were disrupted by the [D]ata [B]reach occurring in February 2024.” Plaintiffs separately seek to certify a Delaware statewide class defined as: (i) “[a]ll healthcare providers in the state of Delaware whose use of Change Healthcare’s and Optum’s services were disrupted by the [D]ata [B]reach occurring in February 2024”; and (ii) “[a]ll healthcare providers in the state of Delaware whose use of Patterson Dental’s Eaglesoft’s services were disrupted by the [D]ata [B]reach occurring in February 2024.” We are vigorously defending ourselves in this litigation. We do not anticipate that this matter will have a material adverse effect on our financial statements.
18. Accumulated Other Comprehensive Loss ("AOCL")
The following table summarizes the changes in AOCL during fiscal 2024: | | | | | | | | | | | | | | | | | |
| Cash Flow
Hedges | | Currency
Translation
Adjustment | | Total |
| AOCL at April 29, 2023 | $ | (2,412) | | | $ | (86,850) | | | $ | (89,262) | |
| Other comprehensive loss before reclassifications | — | | | (1,695) | | | (1,695) | |
| Amounts reclassified from AOCL | 1,042 | | | — | | | 1,042 | |
| AOCL at April 27, 2024 | $ | (1,370) | | | $ | (88,545) | | | $ | (89,915) | |
The amounts reclassified from AOCL during fiscal 2024 include gains and losses on cash flow hedges, net of taxes of $321. The impact to the Consolidated Statements of Operations and Other Comprehensive Income was an increase to interest expense of $1,363 for fiscal 2024.
Item 9. CHANGES IN AND DISAGREEMENTS WITH ACCOUNTANTS ON ACCOUNTING AND FINANCIAL DISCLOSURE
None.
Item 9A. CONTROLS AND PROCEDURES
Evaluation of Disclosure Controls and Procedures
Under the supervision and with the participation of our management, including our Chief Executive Officer and our Chief Financial Officer, we evaluated the effectiveness of the design and operation of our disclosure controls and procedures pursuant to Rules 13a-15 and 15d-15 of the Securities and Exchange Act of 1934 (the “Exchange Act”). Based on that evaluation, the Chief Executive Officer and Chief Financial Officer concluded that our disclosure controls and procedures were effective as of April 27, 2024. Disclosure controls and procedures are defined by Rules 13a-15(e) and 15d-15(e) of the Exchange Act as controls and other procedures that are designed to ensure that information required to be disclosed by Patterson in reports filed with the SEC under the Exchange Act is recorded, processed, summarized and reported within the time periods specified in the SEC’s rules and forms. Disclosure controls and procedures include, without limitation, controls and procedures designed to ensure that information required to be disclosed in reports filed under the Exchange Act is accumulated and communicated to our management, including our principal executive and principal financial officers, or persons performing similar functions, as appropriate to allow timely decisions regarding required disclosure.
Management’s Annual Report on Internal Control Over Financial Reporting
The management of Patterson Companies, Inc. is responsible for establishing and maintaining adequate internal control over financial reporting as defined in Rules 13a-15(f) and 15d-15(f) under the Exchange Act. Our internal control system is designed to provide reasonable assurance to our management and Board of Directors regarding the reliability of financial reporting and the preparation of financial statements for external purposes in accordance with generally accepted accounting principles.
Under the supervision and with the participation of our management, including our principal executive officer and principal financial officer, we assessed the effectiveness of our internal control over financial reporting as of April 27, 2024, using the criteria set forth by the Committee of Sponsoring Organizations of the Treadway Commission (COSO) in Internal Control - Integrated Framework (2013). Based on this assessment, management has concluded that our internal control over financial reporting was effective as of April 27, 2024. Ernst & Young LLP, the independent registered public accounting firm that audited our Consolidated Financial Statements included in Item 8, Financial Statements and Supplementary Data, of this Annual Report on Form 10-K, has issued an unqualified report on our internal control over financial reporting as of April 27, 2024.
| | | | | |
| |
| /s/ Donald J. Zurbay | |
| President and Chief Executive Officer | |
| |
| /s/ Kevin M. Barry | |
| Chief Financial Officer | |
| |
| June 18, 2024 | |
The report of our independent registered public accounting firm on internal control over financial reporting is included in Item 8 of this Annual Report on Form 10-K.
Changes in Internal Control Over Financial Reporting
There were no changes in our internal control over financial reporting (as defined in Rule 13a-15(f) and 15d-15(f) under the Exchange Act) that occurred during the quarter ended April 27, 2024 that have materially affected, or are reasonably likely to materially affect, our internal control over financial reporting.
Item 9B. OTHER INFORMATION
Insider Trading Arrangements
A significant portion of the compensation of our executive officers is delivered in the form of equity awards, including restricted stock units, performance units and non-qualified stock options. All these awards contain vesting requirements related to service, with performance units also requiring satisfaction of certain performance criteria to obtain a payout. This compensation design is intended to align executive compensation with the performance experienced by our shareholders. Following delivery of shares of our common stock under such equity awards, once any applicable service- or performance-based vesting standards have been satisfied, our executive officers from time to time engage in the open-market sale of some of those shares for diversification or other personal reasons. Our executive officers may also engage from time to time in other transactions involving our securities.
Transactions in our securities by our directors and officers are required to be made in accordance with our Securities Trading and Information Disclosure Policy (our “Insider Trading Policy”), which, among other things, requires that the transactions be in accordance with applicable U.S. federal securities laws that prohibit trading while in possession of material nonpublic information. Rule 10b5-1 under the Exchange Act provides an affirmative defense that enables directors and officers to prearrange transactions in the company’s securities in a manner that avoids concerns about initiating transactions while in possession of material nonpublic information. Our Insider Trading Policy permits our directors and officers to enter into trading plans designed to comply with Rule 10b5-1.
In addition, our directors and officers are required to maintain an ownership of the company’s common stock with a value equal to at least a multiple of their annual base salary (5x annual salary for our Chief Executive Officer and 3x annual salary for all direct reports to our Chief Executive Officer) or their annual cash retainer (5x annual cash retainer for non-employee directors).
During the three months ended April 27, 2024, none of the company’s directors or officers (as defined in Rule 16a-1(f) of the Exchange Act) adopted, modified or terminated a Rule 10b5-1 trading arrangement, except as set forth below, and none of the company’s directors or officers (as defined in Rule 16a-1(f) of the Exchange Act) adopted, modified or terminated a non-Rule 10b5-1 trading arrangement (as such terms are defined in Item 408 of Regulation S-K of the Securities Act of 1933, as amended).
On March 12, 2024, Donald J. Zurbay, our President and Chief Executive Officer, modified his written trading plan dated September 25, 2023, which is intended to satisfy the affirmative defense conditions of Rule 10b5-1(c). The plan’s maximum duration of the plan is until December 31, 2024, or such earlier date upon (a) the completion of all trades under the plan, (b) the expiration of the orders relating to such trades without execution, or (c) the occurrence of such other termination event as specified in the plan. As modified, the first trade will not occur until June 11, 2024, at the earliest. The trading plan is intended to permit Mr. Zurbay to sell (i) 1,327 shares of our common stock pursuant to performance units that vested on April 24, 2021, (ii) 3,897 shares of our common stock pursuant to restricted stock units that vested on June 29, 2019, (iii) 1,016 shares of our common stock pursuant to restricted stock units that vested on June 29, 2020, (iv) 976 shares of our common stock pursuant to restricted stock units that vested on July 1, 2019, (v) 25% of the net vested shares of our common stock pursuant to performance units that
will vest on July 1, 2024, (vi) 25% of the net vested shares of our common stock pursuant to restricted stock units that will vest on July 1, 2024, and (vii) 25% of the net vested shares of our common stock pursuant to restricted stock units that will vest on December 5, 2024.
Item 9C. DISCLOSURE REGARDING FOREIGN JURISDICTIONS THAT PREVENT INSPECTIONS
Not applicable.
PART III
Item 10. DIRECTORS, EXECUTIVE OFFICERS AND CORPORATE GOVERNANCE
Information regarding the directors of Patterson is incorporated herein by reference to the descriptions set forth under the caption “Proposal No. 1 Election of Directors” in Patterson’s Proxy Statement for its Annual Meeting of Shareholders to be held on September 16, 2024 (the “2024 Proxy Statement”). Information regarding executive officers of Patterson is incorporated herein by reference to the information set forth under the caption “Executive Officers” in the 2024 Proxy Statement. Information regarding compliance with Section 16(a) of the Securities Exchange Act of 1934 is incorporated herein by reference to the information set forth under the caption “Section 16(a) Reports” in the 2024 Proxy Statement. The information called for by Item 10, as to the Audit and Finance Committee and the audit committee financial expert, is set forth under the captions “Proposal No. 1 Election of Directors” and “Our Board of Directors and Committees” in the 2024 Proxy Statement and such information is incorporated by reference herein. Information regarding our insider trading policy is incorporated herein by reference to the information set forth under the caption “Executive Compensation – Other Executive Compensation Arrangements, Policies and Practices” in the 2024 Proxy Statement.
Code of Ethics
We have adopted and published a Code of Conduct, which provides an overview of the laws, regulations, and company policies that apply to our employees and our directors and is intended to comply with applicable NASDAQ Marketplace Rules. Our Code of Conduct is available on our website (www.pattersoncompanies.com) under the section “Investor Relations – Corporate Governance.” We intend to satisfy the disclosure requirement of Form 8-K regarding an amendment to, or waiver from, a provision of our Code of Conduct that applies to our principal executive officer, principal financial officer, principal accounting officer or controller, or persons performing similar functions and that relates to any element of the code of ethics definition enumerated in Item 406(b) of Regulation S-K by posting such information on our website at the address and location specified above.
Item 11. EXECUTIVE COMPENSATION
Information regarding executive compensation is incorporated herein by reference to the information set forth under the caption “Executive Compensation” in the 2024 Proxy Statement. Information regarding director compensation is incorporated herein by reference to the information set forth under the caption “Non-Employee Director Compensation” in the 2024 Proxy Statement. Information regarding the Compensation and Human Capital Committee and its report is incorporated herein by reference to the information set forth under the caption “Our Board of Directors and Committees" and "Executive Compensation - Compensation and Human Capital Committee Report” in the 2024 Proxy Statement.
Item 12. SECURITY OWNERSHIP OF CERTAIN BENEFICIAL OWNERS AND MANAGEMENT AND RELATED STOCKHOLDER MATTERS
Information regarding securities authorized for issuance under equity compensation plans is incorporated herein by reference to the information set forth under the caption “Equity Compensation Plan Information” in the 2024 Proxy Statement. Information regarding the security ownership of certain beneficial owners and management is incorporated herein by reference to the information set forth under the caption “Security Ownership of Certain Beneficial Owners and Management” in the 2024 Proxy Statement.
Item 13. CERTAIN RELATIONSHIPS AND RELATED TRANSACTIONS, AND DIRECTOR INDEPENDENCE
Information regarding transactions with related persons is incorporated herein by reference to the information set forth under the caption “Certain Relationships and Related Transactions” in the 2024 Proxy Statement. Information regarding director independence is incorporated herein by reference to the information set forth under the caption “Our Board of Directors and Committees” in the 2024 Proxy Statement.
Item 14. PRINCIPAL ACCOUNTANT FEES AND SERVICES
Information relating to principal accounting fees and services and pre-approval policies and procedures is incorporated herein by reference to the information set forth under the caption “Proposal No. 3 Ratification of Selection of Independent Registered Public Accounting Firm – Principal Accountant Fees and Services” in the 2024 Proxy Statement.
PART IV
Item 15. EXHIBITS AND FINANCIAL STATEMENT SCHEDULES
(a)1. Financial Statements.
The following Consolidated Financial Statements and supplementary data of Patterson and its subsidiaries are included in Part II, Item 8:
Reports of Independent Registered Public Accounting Firm (PCAOB ID: 42)
Consolidated Balance Sheets
Consolidated Statements of Operations and Other Comprehensive Income
Consolidated Statement of Changes in Stockholders’ Equity
Consolidated Statements of Cash Flows
Notes to Consolidated Financial Statements
2. Financial Statement Schedules.
The following financial statement schedule is filed herewith: Schedule II – Valuation and Qualifying Accounts
Schedules other than that listed above have been omitted because they are not applicable or the required information is included in the financial statements or notes thereto.
3. Exhibits. | | | | | | | | |
| | |
| Exhibit | | Document Description |
| |
| 3.1 | | |
| |
| 3.2 | | |
| |
| 4.1 | | |
| | |
| 4.2 | | |
| |
| 10.1 | | |
| | |
| 10.2 | | |
| |
| 10.3 | | |
| |
| 10.4 | | |
| | |
| 10.5 | | |
| |
| 10.6 | | |
| |
| | | | | | | | |
| 10.7 | | |
| | |
| 10.8 | | |
| | |
| 10.9 | | |
| | |
| 10.10 | | |
| | |
| 10.11 | | |
| | |
| 10.12 | | |
| | |
| 10.13 | | |
| | |
| 10.14 | | |
| | |
| 10.15 | | |
| | |
| 10.16 | | |
| | |
| 10.17 | | |
| | |
| 10.18 | | |
| 10.19 | | |
| | |
| 10.20 | | Receivables Sale Agreement, dated as May 10, 2002, by and among Patterson Dental Supply, Inc., Webster Veterinary Supply, Inc., and PDC Funding Company, LLC, conformed through Amendment No. 5, dated as of April 3, 2024 (filed herewith). |
| | |
| 10.21 | | |
| | |
| 10.22 | | Note Purchase Agreement, dated December 8, 2011, by and among Patterson Companies, Inc., Patterson Medical Holdings, Inc., Patterson Medical Supply, Inc., Patterson Dental Holdings, Inc., Patterson Dental Supply, Inc., Webster Veterinary Supply, Inc., Webster Management, LP, conformed through Third Amendment, dated April 24, 2020 (incorporated by reference to our Annual Report on Form 10-K, filed June 24, 2020 (File No. 000-20572)). |
| | |
| 10.23 | | Note Purchase Agreement, dated March 23, 2015, by and among Patterson Companies, Inc., Patterson Medical Holdings, Inc., Patterson Medical Supply, Inc., Patterson Dental Holdings, Inc., Patterson Dental Supply, Inc., Patterson Veterinary Supply, Inc., and Patterson Management, LP, conformed through Second Amendment, dated April 24, 2020 (incorporated by reference to our Annual Report on Form 10-K, filed June 24, 2020 (File No. 000-20572)). |
| | |
| | | | | | | | |
| 10.24 | | Third Amended and Restated Credit Agreement dated as of October 28, 2022, by and among Patterson Companies, Inc., as borrower, MUFG Bank, Ltd., as administrative agent, and certain lenders party thereto (incorporated by reference to our Current Report on Form 8-K, filed October 31, 2022 (File No. 000-20572)). |
| | |
| 10.25 | | Note Purchase Agreement, dated as of March 29, 2018, among Patterson Companies, Inc., and certain of its named subsidiaries as borrowers, and various private lenders, conformed through Second Amendment, dated April 24, 2020 (incorporated by reference to our Annual Report on Form 10-K, filed June 24, 2020 (File No. 000-20572)). |
| | |
| 10.26 | | Receivables Sale Agreement, dated as of July 24, 2018, by and between Patterson Dental Supply, Inc., as seller, and PDC Funding Company III, LLC, as buyer (incorporated by reference to our Current Report on Form 8-K, filed July 25, 2018 (File No. 000-20572)). |
| | |
| 10.27 | | |
| | |
| 10.28 | | Receivables Sale Agreement, dated as of January 15, 2020, by and between Patterson Veterinary Supply, Inc., as seller, and PDC Funding Company IV, LLC, as buyer (incorporated by reference to our Current Report on Form 8-K, filed January 17, 2020 (File No. 000-20572). |
| | |
| 10.29 | | Third Amended and Restated Receivables Purchase Agreement dated as of December 3, 2010, among PDC Funding Company, LLC, as seller, Patterson Companies, Inc., as servicer, the conduits party thereto, the financial institutions party thereto, the purchaser agents party thereto, and MUFG Bank, Ltd. (f.k.a. The Bank of Tokyo-Mitsubishi UFJ, Ltd.), as agent, conformed through Amendment 26, dated April 3, 2024 (filed herewith). |
| | |
| 10.30 | | Second Amended and Restated Contract Purchase Agreement dated as of July 20, 2020, among PDC Funding Company II, LLC, as seller, Patterson Companies, Inc., as servicer, the purchasers party thereto, and Fifth Third Bank, as agent, conformed through Second Amendment, dated July 18, 2022 (incorporated by reference to our Quarterly Report on Form 10-Q, filed September 1, 2022 (File No. 000-20572)). |
| | |
| 10.31 | | Receivables Purchase Agreement, dated as of July 24, 2018, by and among Patterson Dental Supply, Inc., as servicer, PDC Funding Company III, LLC, as seller, purchasers from time to time party thereto, and MUFG Bank, Ltd., as agent, conformed through Eighth Amendment, dated August 20, 2021 (incorporated by reference to our Quarterly Report on Form 10-Q, filed September 9, 2021 (File No. 000-20572)). |
| | |
| 10.32 | | Receivables Purchase Agreement, dated as of January 15, 2020, by and among Patterson Veterinary Supply, Inc., as servicer, PDC Funding Company IV, LLC, as seller, purchasers from time to time party thereto, and MUFG Bank, Ltd., as agent, conformed through Sixth Amendment, dated August 20, 2021 (incorporated by reference to our Quarterly Report on Form 10-Q, filed September 9, 2021 (File No. 000-20572)). |
| | |
| 19 | | |
| | |
| 21 | | |
| | |
| 23 | | |
| | |
| 31.1 | | |
| | |
| 31.2 | | |
| | |
| 32.1 | | |
| | |
| | | | | | | | |
| 32.2 | | |
| | |
| 97 | | |
| | |
| 101 | | (Filed Electronically) The following financial information from our Annual Report on Form 10-K for fiscal 2024, formatted in Inline eXtensible Business Reporting Language (iXBRL): (i) the Consolidated Balance Sheets, (ii) the Consolidated Statements of Operations and Other Comprehensive Income, (iii) the Consolidated Statements of Changes in Stockholders’ Equity, (iv) the Consolidated Statements of Cash Flows and (v) the Notes to the Consolidated Financial Statements.(*) |
(*)The iXBRL related information in Exhibit 101 to this Annual Report on Form 10-K shall not be deemed “filed” for purposes of Section 18 of the Securities Exchange Act of 1934, as amended, or otherwise subject to liability of that section and shall not be incorporated by reference into any filing or other document pursuant to the Securities Act of 1933, as amended, except as shall be expressly set forth by specific reference in such filing or document.
** Indicates management contract or compensatory plan or agreement.
(b) See Index to Exhibits.
(c) See Schedule II.
Item 16. Form 10-K Summary.
None.
SCHEDULE II
VALUATION AND QUALIFYING ACCOUNTS
PATTERSON COMPANIES, INC.
(In thousands)
| | | | | | | | | | | | | | | | | | | | | | | | | |
| Balance at
Beginning
of Period | | Charged to
Costs and
Expenses | | | | Deductions | | Balance at
End of
Period |
| Year ended April 27, 2024 | | | | | | | | | |
| Deducted from asset accounts: | | | | | | | | | |
| Allowance for doubtful accounts | $ | 3,667 | | | $ | 2,542 | | | | | $ | 3,478 | | | $ | 2,731 | |
| Sales returns and allowances | 11,079 | | | 50,190 | | | | | 49,145 | | | 12,124 | |
| Total accounts receivable allowances | $ | 14,746 | | | $ | 52,732 | | | | | $ | 52,623 | | | $ | 14,855 | |
| LIFO inventory adjustment | $ | 146,915 | | | $ | 7,140 | | | | | $ | — | | | $ | 154,055 | |
| Inventory obsolescence reserve | 14,611 | | | 15,688 | | | | | 16,589 | | | 13,710 | |
| Total inventory reserve | $ | 161,526 | | | $ | 22,828 | | | | | $ | 16,589 | | | $ | 167,765 | |
| Year ended April 29, 2023 | | | | | | | | | |
| Deducted from asset accounts: | | | | | | | | | |
| Allowance for doubtful accounts | $ | 5,913 | | | $ | 3,450 | | | | | $ | 5,696 | | | $ | 3,667 | |
| Sales returns and allowances | 4,400 | | | 57,920 | | | | | 51,241 | | | 11,079 | |
| Total accounts receivable allowances | $ | 10,313 | | | $ | 61,370 | | | | | $ | 56,937 | | | $ | 14,746 | |
| LIFO inventory adjustment | $ | 130,959 | | | $ | 15,956 | | | | | $ | — | | | $ | 146,915 | |
| Inventory obsolescence reserve | 21,543 | | | 11,223 | | | | | 18,155 | | | 14,611 | |
| Total inventory reserve | $ | 152,502 | | | $ | 27,179 | | | | | $ | 18,155 | | | $ | 161,526 | |
| Year ended April 30, 2022 | | | | | | | | | |
| Deducted from asset accounts: | | | | | | | | | |
| Allowance for doubtful accounts | $ | 6,138 | | | $ | 2,769 | | | | | $ | 2,994 | | | $ | 5,913 | |
| Sales returns and allowances | 5,856 | | | 59,999 | | | | | 61,455 | | | 4,400 | |
| Total accounts receivable allowances | $ | 11,994 | | | $ | 62,768 | | | | | $ | 64,449 | | | $ | 10,313 | |
| LIFO inventory adjustment | $ | 120,775 | | | $ | 10,184 | | | | | $ | — | | | $ | 130,959 | |
| Inventory obsolescence reserve | 29,629 | | | 61,647 | | | | | 69,733 | | | 21,543 | |
| Total inventory reserve | $ | 150,404 | | | $ | 71,831 | | | | | $ | 69,733 | | | $ | 152,502 | |
SIGNATURES
Pursuant to the requirements of section 13 or 15(d) of the Securities Exchange Act of 1934, the registrant has duly caused this report to be signed on its behalf by the undersigned, thereunto duly authorized.
| | | | | | | | | | | | | | |
| | | PATTERSON COMPANIES, INC. |
| Dated: | June 18, 2024 | | By | /s/ Donald J. Zurbay |
| | | | Donald J. Zurbay |
| | | | President and Chief Executive Officer, Director |
Pursuant to the requirements of the Securities Exchange Act of 1934, this report has been signed below by the following persons on behalf of the registrant and in the capacities and on the dates indicated.
| | | | | | | | | | | | | | |
| | | | Date |
| /s/ Donald J. Zurbay | | President and Chief Executive Officer, Director
(Principal Executive Officer) | | June 18, 2024 |
Donald J. Zurbay
| | | |
| | | | |
| /s/ Kevin M. Barry | | Chief Financial Officer
(Principal Financial and Accounting Officer) | | June 18, 2024 |
| Kevin M. Barry | | | |
| | | | |
| /s/ John D. Buck | | Chairman of the Board | | June 18, 2024 |
| John D. Buck | | | |
| | | | |
| /s/ Meenu Agarwal | | Director | | June 18, 2024 |
| Meenu Agarwal | | | |
| | | | |
| /s/ Alex N. Blanco | | Director | | June 18, 2024 |
| Alex N. Blanco | | | |
| | | | |
| /s/ Jody H. Feragen | | Director | | June 18, 2024 |
| Jody H. Feragen | | | |
| | | | |
| /s/ Robert C. Frenzel | | Director | | June 18, 2024 |
| Robert C. Frenzel | | | |
| | | | |
| /s/ Philip G.J. McKoy | | Director | | June 18, 2024 |
| Philip G.J. McKoy | | | |
| | | | |
| /s/ Ellen A. Rudnick | | Director | | June 18, 2024 |
| Ellen A. Rudnick | | | |
| | | | |
| /s/ Neil A. Schrimsher | | Director | | June 18, 2024 |
| Neil A. Schrimsher | | | |
| | | | |
| /s/ Pamela J. Tomczik | | Director | | June 18, 2024 |
| Pamela J. Tomczik | | | |