000008908912/31December 31, 20222022FYFALSE153,048,775http://fasb.org/us-gaap/2022#LongTermDebtAndCapitalLeaseObligationshttp://fasb.org/us-gaap/2022#LongTermDebtAndCapitalLeaseObligationshttp://fasb.org/us-gaap/2022#LongTermDebtAndCapitalLeaseObligationshttp://fasb.org/us-gaap/2022#Revenues00000890892022-01-012022-12-3100000890892022-06-30iso4217:USD00000890892023-02-15xbrli:shares00000890892021-01-012021-12-310000089089us-gaap:ProductMember2022-01-012022-12-310000089089us-gaap:ProductMember2021-01-012021-12-310000089089us-gaap:ProductMember2020-01-012020-12-310000089089us-gaap:ServiceMember2022-01-012022-12-310000089089us-gaap:ServiceMember2021-01-012021-12-310000089089us-gaap:ServiceMember2020-01-012020-12-310000089089us-gaap:ProductAndServiceOtherMember2022-01-012022-12-310000089089us-gaap:ProductAndServiceOtherMember2021-01-012021-12-310000089089us-gaap:ProductAndServiceOtherMember2020-01-012020-12-3100000890892020-01-012020-12-31iso4217:USDxbrli:shares00000890892022-12-3100000890892021-12-3100000890892020-12-3100000890892019-12-310000089089us-gaap:CommonStockMember2019-12-310000089089us-gaap:TreasuryStockMember2019-12-310000089089us-gaap:AdditionalPaidInCapitalMember2019-12-310000089089us-gaap:RetainedEarningsMember2019-12-310000089089us-gaap:AccumulatedOtherComprehensiveIncomeMember2019-12-310000089089us-gaap:NoncontrollingInterestMember2019-12-310000089089us-gaap:CommonStockMember2020-01-012020-12-310000089089us-gaap:TreasuryStockMember2020-01-012020-12-310000089089us-gaap:AdditionalPaidInCapitalMember2020-01-012020-12-310000089089us-gaap:RetainedEarningsMember2020-01-012020-12-310000089089us-gaap:AccumulatedOtherComprehensiveIncomeMember2020-01-012020-12-310000089089us-gaap:NoncontrollingInterestMember2020-01-012020-12-310000089089us-gaap:CommonStockMember2020-12-310000089089us-gaap:TreasuryStockMember2020-12-310000089089us-gaap:AdditionalPaidInCapitalMember2020-12-310000089089us-gaap:RetainedEarningsMember2020-12-310000089089us-gaap:AccumulatedOtherComprehensiveIncomeMember2020-12-310000089089us-gaap:NoncontrollingInterestMember2020-12-310000089089us-gaap:CommonStockMember2021-01-012021-12-310000089089us-gaap:TreasuryStockMember2021-01-012021-12-310000089089us-gaap:AdditionalPaidInCapitalMember2021-01-012021-12-310000089089us-gaap:RetainedEarningsMember2021-01-012021-12-310000089089us-gaap:AccumulatedOtherComprehensiveIncomeMember2021-01-012021-12-310000089089us-gaap:NoncontrollingInterestMember2021-01-012021-12-310000089089us-gaap:CommonStockMember2021-12-310000089089us-gaap:TreasuryStockMember2021-12-310000089089us-gaap:AdditionalPaidInCapitalMember2021-12-310000089089us-gaap:RetainedEarningsMember2021-12-310000089089us-gaap:AccumulatedOtherComprehensiveIncomeMember2021-12-310000089089us-gaap:NoncontrollingInterestMember2021-12-310000089089us-gaap:CommonStockMember2022-01-012022-12-310000089089us-gaap:TreasuryStockMember2022-01-012022-12-310000089089us-gaap:AdditionalPaidInCapitalMember2022-01-012022-12-310000089089us-gaap:RetainedEarningsMember2022-01-012022-12-310000089089us-gaap:AccumulatedOtherComprehensiveIncomeMember2022-01-012022-12-310000089089us-gaap:NoncontrollingInterestMember2022-01-012022-12-310000089089us-gaap:CommonStockMember2022-12-310000089089us-gaap:TreasuryStockMember2022-12-310000089089us-gaap:AdditionalPaidInCapitalMember2022-12-310000089089us-gaap:RetainedEarningsMember2022-12-310000089089us-gaap:AccumulatedOtherComprehensiveIncomeMember2022-12-310000089089us-gaap:NoncontrollingInterestMember2022-12-310000089089sci:FuneralMemberus-gaap:TradeAccountsReceivableMember2022-12-310000089089sci:CemeteryMemberus-gaap:TradeAccountsReceivableMember2022-12-310000089089sci:MiscellaneousAccountsReceivableMember2022-12-310000089089us-gaap:NotesReceivableMember2022-12-310000089089sci:FuneralMemberus-gaap:TradeAccountsReceivableMember2021-12-310000089089sci:CemeteryMemberus-gaap:TradeAccountsReceivableMember2021-12-310000089089sci:MiscellaneousAccountsReceivableMember2021-12-310000089089us-gaap:NotesReceivableMember2021-12-310000089089us-gaap:NotesReceivableMembersci:LongTermMember2022-12-310000089089us-gaap:NotesReceivableMembersci:LongTermMember2021-12-310000089089sci:MiscellaneousAccountsReceivableMembersci:LongTermMember2022-12-310000089089sci:MiscellaneousAccountsReceivableMembersci:LongTermMember2021-12-310000089089sci:FuneralMemberus-gaap:TradeAccountsReceivableMember2022-01-012022-12-310000089089sci:CemeteryMemberus-gaap:TradeAccountsReceivableMember2022-01-012022-12-310000089089us-gaap:TradeAccountsReceivableMember2021-12-310000089089us-gaap:TradeAccountsReceivableMember2022-01-012022-12-310000089089us-gaap:TradeAccountsReceivableMember2022-12-310000089089sci:CurrentMembersci:MiscellaneousAccountsReceivableMember2021-12-310000089089sci:CurrentMembersci:MiscellaneousAccountsReceivableMember2022-01-012022-12-310000089089sci:CurrentMembersci:MiscellaneousAccountsReceivableMember2022-12-310000089089sci:MiscellaneousAccountsReceivableMembersci:LongTermMember2022-01-012022-12-310000089089sci:MiscellaneousAccountsReceivableMember2022-01-012022-12-310000089089us-gaap:NotesReceivableMember2022-01-012022-12-310000089089us-gaap:FinancingReceivables1To29DaysPastDueMembersci:CurrentMembersci:MiscellaneousAccountsReceivableMember2022-12-310000089089us-gaap:Maturity30To90DaysMembersci:CurrentMembersci:MiscellaneousAccountsReceivableMember2022-12-310000089089sci:CurrentMembersci:FinancingReceivables90To180DaysPastDueMembersci:MiscellaneousAccountsReceivableMember2022-12-310000089089sci:CurrentMembersci:FinancingReceivablesEqualToGreaterThan180DaysPastDueMembersci:MiscellaneousAccountsReceivableMember2022-12-310000089089us-gaap:FinancingReceivables1To29DaysPastDueMembersci:MiscellaneousAccountsReceivableMembersci:LongTermMember2022-12-310000089089us-gaap:Maturity30To90DaysMembersci:MiscellaneousAccountsReceivableMembersci:LongTermMember2022-12-310000089089sci:FinancingReceivables90To180DaysPastDueMembersci:MiscellaneousAccountsReceivableMembersci:LongTermMember2022-12-310000089089sci:FinancingReceivablesEqualToGreaterThan180DaysPastDueMembersci:MiscellaneousAccountsReceivableMembersci:LongTermMember2022-12-310000089089us-gaap:FinancingReceivables1To29DaysPastDueMembersci:MiscellaneousAccountsReceivableMember2022-12-310000089089us-gaap:Maturity30To90DaysMembersci:MiscellaneousAccountsReceivableMember2022-12-310000089089sci:FinancingReceivables90To180DaysPastDueMembersci:MiscellaneousAccountsReceivableMember2022-12-310000089089sci:FinancingReceivablesEqualToGreaterThan180DaysPastDueMembersci:MiscellaneousAccountsReceivableMember2022-12-310000089089us-gaap:FinancingReceivables1To29DaysPastDueMemberus-gaap:NotesReceivableMember2022-12-310000089089us-gaap:Maturity30To90DaysMemberus-gaap:NotesReceivableMember2022-12-310000089089us-gaap:NotesReceivableMembersci:FinancingReceivables90To180DaysPastDueMember2022-12-310000089089us-gaap:NotesReceivableMembersci:FinancingReceivablesEqualToGreaterThan180DaysPastDueMember2022-12-310000089089us-gaap:BuildingAndBuildingImprovementsMembersrt:MinimumMember2022-01-012022-12-310000089089srt:MaximumMemberus-gaap:BuildingAndBuildingImprovementsMember2022-01-012022-12-310000089089us-gaap:EquipmentMembersrt:MinimumMember2022-01-012022-12-310000089089srt:MaximumMemberus-gaap:EquipmentMember2022-01-012022-12-310000089089srt:MaximumMemberus-gaap:LeaseholdImprovementsMember2022-01-012022-12-310000089089srt:MinimumMember2022-01-012022-12-310000089089srt:MaximumMember2022-01-012022-12-31xbrli:pure0000089089sci:FuneralMember2022-12-310000089089sci:CemeteryMember2022-12-310000089089sci:FuneralMember2021-12-310000089089sci:CemeteryMember2021-12-310000089089sci:FuneralMembersci:FinancingReceivables30To90DaysPastDueMember2022-12-310000089089sci:FuneralMembersci:FinancingReceivables91To180DaysPastDueMember2022-12-310000089089sci:FuneralMembersci:FinancingReceivablesEqualToGreaterThan180DaysPastDueMember2022-12-310000089089us-gaap:FinancingReceivables1To29DaysPastDueMembersci:CemeteryMember2022-12-310000089089sci:CemeteryMembersci:FinancingReceivables30To90DaysPastDueMember2022-12-310000089089sci:FinancingReceivables91To180DaysPastDueMembersci:CemeteryMember2022-12-310000089089sci:CemeteryMembersci:FinancingReceivablesEqualToGreaterThan180DaysPastDueMember2022-12-310000089089us-gaap:FinancingReceivables1To29DaysPastDueMember2022-12-310000089089sci:FinancingReceivables30To90DaysPastDueMember2022-12-310000089089sci:FinancingReceivables91To180DaysPastDueMember2022-12-310000089089sci:FinancingReceivablesEqualToGreaterThan180DaysPastDueMember2022-12-310000089089sci:FuneralMember2022-01-012022-12-310000089089sci:CemeteryMember2022-01-012022-12-3100000890892020-01-012020-03-310000089089us-gaap:USTreasurySecuritiesMemberus-gaap:FairValueInputsLevel2Member2022-12-310000089089us-gaap:FairValueInputsLevel2Memberus-gaap:ForeignGovernmentDebtSecuritiesMember2022-12-310000089089us-gaap:FairValueInputsLevel2Memberus-gaap:CorporateDebtSecuritiesMember2022-12-310000089089us-gaap:FairValueInputsLevel2Memberus-gaap:ResidentialMortgageBackedSecuritiesMember2022-12-310000089089us-gaap:AssetBackedSecuritiesMemberus-gaap:FairValueInputsLevel2Member2022-12-310000089089sci:PreferredStockSecuritiesMemberus-gaap:FairValueInputsLevel2Member2022-12-310000089089us-gaap:FairValueInputsLevel1Membersci:UsCommonStockSecuritiesMember2022-12-310000089089us-gaap:FairValueInputsLevel1Membersci:CanadaCommonStockSecuritiesMember2022-12-310000089089us-gaap:FairValueInputsLevel1Membersci:OtherInternationalCommonStockSecuritiesMember2022-12-310000089089us-gaap:FairValueInputsLevel1Memberus-gaap:EquityFundsMember2022-12-310000089089us-gaap:FairValueInputsLevel1Memberus-gaap:FixedIncomeFundsMember2022-12-310000089089sci:CommingledfundsFixedincMemberus-gaap:CarryingReportedAmountFairValueDisclosureMember2022-12-310000089089sci:CommingledfundsEquityMemberus-gaap:CarryingReportedAmountFairValueDisclosureMember2022-12-310000089089us-gaap:MoneyMarketFundsMemberus-gaap:CarryingReportedAmountFairValueDisclosureMember2022-12-310000089089us-gaap:PrivateEquityFundsMemberus-gaap:CarryingReportedAmountFairValueDisclosureMember2022-12-310000089089us-gaap:CarryingReportedAmountFairValueDisclosureMember2022-12-310000089089us-gaap:EstimateOfFairValueFairValueDisclosureMember2022-12-310000089089us-gaap:USTreasurySecuritiesMemberus-gaap:FairValueInputsLevel2Member2021-12-310000089089us-gaap:FairValueInputsLevel2Memberus-gaap:ForeignGovernmentDebtSecuritiesMember2021-12-310000089089us-gaap:FairValueInputsLevel2Memberus-gaap:CorporateDebtSecuritiesMember2021-12-310000089089us-gaap:FairValueInputsLevel2Memberus-gaap:ResidentialMortgageBackedSecuritiesMember2021-12-310000089089us-gaap:AssetBackedSecuritiesMemberus-gaap:FairValueInputsLevel2Member2021-12-310000089089sci:PreferredStockSecuritiesMemberus-gaap:FairValueInputsLevel2Member2021-12-310000089089us-gaap:FairValueInputsLevel1Membersci:UsCommonStockSecuritiesMember2021-12-310000089089us-gaap:FairValueInputsLevel1Membersci:CanadaCommonStockSecuritiesMember2021-12-310000089089us-gaap:FairValueInputsLevel1Membersci:OtherInternationalCommonStockSecuritiesMember2021-12-310000089089us-gaap:FairValueInputsLevel1Memberus-gaap:EquityFundsMember2021-12-310000089089us-gaap:FairValueInputsLevel1Memberus-gaap:FixedIncomeFundsMember2021-12-310000089089us-gaap:FairValueInputsLevel3Memberus-gaap:OtherInvestmentsMember2021-12-310000089089us-gaap:EstimateOfFairValueFairValueDisclosureMember2021-12-310000089089sci:CommingledfundsFixedincMemberus-gaap:CarryingReportedAmountFairValueDisclosureMember2021-12-310000089089sci:CommingledfundsEquityMemberus-gaap:CarryingReportedAmountFairValueDisclosureMember2021-12-310000089089us-gaap:MoneyMarketFundsMemberus-gaap:CarryingReportedAmountFairValueDisclosureMember2021-12-310000089089us-gaap:PrivateEquityFundsMemberus-gaap:CarryingReportedAmountFairValueDisclosureMember2021-12-310000089089sci:ReportedAtNetAssetValueMemberus-gaap:CarryingReportedAmountFairValueDisclosureMember2021-12-310000089089us-gaap:EstimateOfFairValueFairValueDisclosureMember2021-12-310000089089sci:FuneralMember2020-12-310000089089sci:CemeteryMember2020-12-310000089089sci:FuneralMember2021-01-012021-12-310000089089sci:CemeteryMember2021-01-012021-12-310000089089us-gaap:NoncompeteAgreementsMembersrt:MinimumMember2022-01-012022-12-310000089089us-gaap:NoncompeteAgreementsMembersrt:MaximumMember2022-01-012022-12-310000089089us-gaap:NoncompeteAgreementsMember2022-12-310000089089us-gaap:NoncompeteAgreementsMember2021-12-310000089089us-gaap:CustomerRelationshipsMembersrt:MinimumMember2022-01-012022-12-310000089089us-gaap:CustomerRelationshipsMembersrt:MaximumMember2022-01-012022-12-310000089089us-gaap:CustomerRelationshipsMember2022-12-310000089089us-gaap:CustomerRelationshipsMember2021-12-310000089089us-gaap:TradeNamesMembersrt:MinimumMember2022-01-012022-12-310000089089us-gaap:TradeNamesMembersrt:MaximumMember2022-01-012022-12-310000089089us-gaap:TradeNamesMember2022-12-310000089089us-gaap:TradeNamesMember2021-12-310000089089us-gaap:OtherIntangibleAssetsMembersrt:MinimumMember2022-01-012022-12-310000089089us-gaap:OtherIntangibleAssetsMembersrt:MaximumMember2022-01-012022-12-310000089089us-gaap:OtherIntangibleAssetsMember2022-12-310000089089us-gaap:OtherIntangibleAssetsMember2021-12-310000089089us-gaap:InternalRevenueServiceIRSMember2022-01-012022-12-310000089089us-gaap:StateAndLocalJurisdictionMember2022-01-012022-12-310000089089us-gaap:ForeignCountryMember2022-01-012022-12-310000089089us-gaap:InternalRevenueServiceIRSMember2022-12-310000089089us-gaap:StateAndLocalJurisdictionMember2022-12-310000089089us-gaap:ForeignCountryMember2022-12-310000089089sci:April2027Memberus-gaap:UnsecuredDebtMember2022-12-310000089089sci:April2027Memberus-gaap:UnsecuredDebtMember2021-12-310000089089us-gaap:UnsecuredDebtMembersci:December2027Member2022-12-310000089089us-gaap:UnsecuredDebtMembersci:December2027Member2021-12-310000089089sci:June2029Memberus-gaap:UnsecuredDebtMember2022-12-310000089089sci:June2029Memberus-gaap:UnsecuredDebtMember2021-12-310000089089sci:August2030Memberus-gaap:UnsecuredDebtMember2022-12-310000089089sci:August2030Memberus-gaap:UnsecuredDebtMember2021-12-310000089089sci:May2031Memberus-gaap:UnsecuredDebtMember2022-12-310000089089sci:May2031Memberus-gaap:UnsecuredDebtMember2021-12-310000089089sci:May2024Member2022-12-310000089089sci:TermLoanDecember2022Member2021-12-310000089089sci:May2024Member2021-12-310000089089us-gaap:SubsequentEventMember2023-02-15utr:Rate0000089089sci:May2024Member2022-01-012022-12-310000089089sci:OtherNotesPayableMember2022-01-012022-12-310000089089sci:May2031Member2022-12-310000089089sci:May2024Member2021-01-012021-12-310000089089sci:April2027Member2022-01-012022-12-310000089089sci:November2021Member2021-01-012021-12-310000089089us-gaap:SubsequentEventMembersci:January2028Member2023-02-150000089089sci:April2027Member2022-12-310000089089sci:April2027Member2021-12-310000089089sci:December2027Member2022-12-310000089089sci:December2027Member2021-12-310000089089sci:June2029Member2022-12-310000089089sci:June2029Member2021-12-310000089089sci:August2030Member2022-12-310000089089sci:August2030Member2021-12-310000089089sci:May2031Member2021-12-3100000890892022-10-012022-12-310000089089sci:LessorMember2022-01-012022-12-310000089089sci:LessorMember2020-01-012020-12-310000089089sci:LessorMember2022-12-310000089089us-gaap:SubsequentEventMember2023-01-012023-02-150000089089sci:LongTermIncentive1996PlanMember2022-12-310000089089sci:LongTermIncentive2016PlanMember2021-12-310000089089us-gaap:EmployeeStockOptionMember2022-01-012022-12-310000089089us-gaap:EmployeeStockOptionMember2021-01-012021-12-310000089089us-gaap:EmployeeStockOptionMember2020-01-012020-12-310000089089us-gaap:EmployeeStockOptionMember2021-12-310000089089us-gaap:EmployeeStockOptionMember2022-12-310000089089sci:StockOptionPlanExerciseRange1Member2022-12-310000089089sci:StockOptionPlanExerciseRange2Member2022-12-310000089089sci:StockOptionPlanExerciseRange3Member2022-12-310000089089sci:StockOptionPlanExerciseRange4Member2022-12-310000089089sci:StockOptionPlanExerciseRange5Member2022-12-310000089089sci:StockOptionPlanExerciseRange6Member2022-12-310000089089us-gaap:RestrictedStockMember2021-12-310000089089us-gaap:RestrictedStockMember2022-01-012022-12-310000089089us-gaap:RestrictedStockMember2022-12-310000089089us-gaap:RestrictedStockMember2021-01-012021-12-310000089089us-gaap:RestrictedStockMember2020-01-012020-12-310000089089us-gaap:RestrictedStockUnitsRSUMember2021-12-310000089089us-gaap:RestrictedStockUnitsRSUMember2022-01-012022-12-310000089089us-gaap:RestrictedStockUnitsRSUMember2022-12-310000089089us-gaap:RestrictedStockUnitsRSUMember2021-01-012021-12-310000089089us-gaap:RestrictedStockUnitsRSUMember2020-01-012020-12-310000089089sci:PerformanceOptionsMember2022-01-012022-12-310000089089sci:PerformanceOptionsMember2021-01-012021-12-310000089089sci:PerformanceOptionsMember2020-01-012020-12-310000089089sci:PerformanceOptionsMember2022-12-310000089089sci:PerformanceOptionsMember2021-12-310000089089sci:FuneralAtneedRevenueMember2022-01-012022-12-310000089089sci:FuneralAtneedRevenueMember2021-01-012021-12-310000089089sci:FuneralAtneedRevenueMember2020-01-012020-12-310000089089sci:FuneralMaturedPreneedRevenueMember2022-01-012022-12-310000089089sci:FuneralMaturedPreneedRevenueMember2021-01-012021-12-310000089089sci:FuneralMaturedPreneedRevenueMember2020-01-012020-12-310000089089sci:FuneralCoreRevenueMember2022-01-012022-12-310000089089sci:FuneralCoreRevenueMember2021-01-012021-12-310000089089sci:FuneralCoreRevenueMember2020-01-012020-12-310000089089sci:NonfuneralHomeRevenueMember2022-01-012022-12-310000089089sci:NonfuneralHomeRevenueMember2021-01-012021-12-310000089089sci:NonfuneralHomeRevenueMember2020-01-012020-12-310000089089sci:FuneralRecognizedPreneedRevenueMember2022-01-012022-12-310000089089sci:FuneralRecognizedPreneedRevenueMember2021-01-012021-12-310000089089sci:FuneralRecognizedPreneedRevenueMember2020-01-012020-12-310000089089sci:FuneralOtherRevenueMember2022-01-012022-12-310000089089sci:FuneralOtherRevenueMember2021-01-012021-12-310000089089sci:FuneralOtherRevenueMember2020-01-012020-12-310000089089sci:FuneralMember2020-01-012020-12-310000089089sci:CemeteryAtneedRevenueMember2022-01-012022-12-310000089089sci:CemeteryAtneedRevenueMember2021-01-012021-12-310000089089sci:CemeteryAtneedRevenueMember2020-01-012020-12-310000089089sci:CemeteryRecognizedPreneedPropertyRevenueMember2022-01-012022-12-310000089089sci:CemeteryRecognizedPreneedPropertyRevenueMember2021-01-012021-12-310000089089sci:CemeteryRecognizedPreneedPropertyRevenueMember2020-01-012020-12-310000089089sci:CemeteryRecognizedPreneedMerchandiseAndServiceRevenueMember2022-01-012022-12-310000089089sci:CemeteryRecognizedPreneedMerchandiseAndServiceRevenueMember2021-01-012021-12-310000089089sci:CemeteryRecognizedPreneedMerchandiseAndServiceRevenueMember2020-01-012020-12-310000089089sci:CemeteryCoreRevenueMember2022-01-012022-12-310000089089sci:CemeteryCoreRevenueMember2021-01-012021-12-310000089089sci:CemeteryCoreRevenueMember2020-01-012020-12-310000089089sci:CemeteryOtherRevenueMember2022-01-012022-12-310000089089sci:CemeteryOtherRevenueMember2021-01-012021-12-310000089089sci:CemeteryOtherRevenueMember2020-01-012020-12-310000089089sci:CemeteryMember2020-01-012020-12-310000089089us-gaap:CorporateAndOtherMember2022-01-012022-12-310000089089us-gaap:CorporateAndOtherMember2022-12-310000089089us-gaap:CorporateAndOtherMember2021-01-012021-12-310000089089us-gaap:CorporateAndOtherMember2021-12-310000089089us-gaap:CorporateAndOtherMember2020-01-012020-12-310000089089country:US2022-01-012022-12-310000089089country:CA2022-01-012022-12-310000089089country:US2022-12-310000089089country:CA2022-12-310000089089country:US2021-01-012021-12-310000089089country:CA2021-01-012021-12-310000089089country:US2021-12-310000089089country:CA2021-12-310000089089country:US2020-01-012020-12-310000089089country:CA2020-01-012020-12-310000089089sci:CurrentYearAcquisitionMember2022-12-310000089089sci:CurrentYearAcquisitionMember2022-01-012022-12-310000089089sci:CurrentYearAcquisitionMember2021-12-310000089089sci:CurrentYearAcquisitionMember2021-01-012021-12-310000089089us-gaap:AllowanceForCreditLossMember2021-12-310000089089us-gaap:AllowanceForCreditLossMember2022-01-012022-12-310000089089us-gaap:AllowanceForCreditLossMember2022-12-310000089089us-gaap:AllowanceForCreditLossMember2020-12-310000089089us-gaap:AllowanceForCreditLossMember2021-01-012021-12-310000089089us-gaap:AllowanceForCreditLossMember2019-12-310000089089us-gaap:AllowanceForCreditLossMember2020-01-012020-12-310000089089sci:AssetAllowanceForCancellationNotesReceivableMember2021-12-310000089089sci:AssetAllowanceForCancellationNotesReceivableMember2022-01-012022-12-310000089089sci:AssetAllowanceForCancellationNotesReceivableMember2022-12-310000089089sci:AssetAllowanceForCancellationNotesReceivableMember2020-12-310000089089sci:AssetAllowanceForCancellationNotesReceivableMember2021-01-012021-12-310000089089sci:AssetAllowanceForCancellationNotesReceivableMember2019-12-310000089089sci:AssetAllowanceForCancellationNotesReceivableMember2020-01-012020-12-310000089089sci:AssetAllowanceForCancellationPreneedFuneralAndCemeteryMember2021-12-310000089089sci:AssetAllowanceForCancellationPreneedFuneralAndCemeteryMember2022-01-012022-12-310000089089sci:AssetAllowanceForCancellationPreneedFuneralAndCemeteryMember2022-12-310000089089sci:AssetAllowanceForCancellationPreneedFuneralAndCemeteryMember2020-12-310000089089sci:AssetAllowanceForCancellationPreneedFuneralAndCemeteryMember2021-01-012021-12-310000089089sci:AssetAllowanceForCancellationPreneedFuneralAndCemeteryMember2019-12-310000089089sci:AssetAllowanceForCancellationPreneedFuneralAndCemeteryMember2020-01-012020-12-310000089089us-gaap:ValuationAllowanceOfDeferredTaxAssetsMember2021-12-310000089089us-gaap:ValuationAllowanceOfDeferredTaxAssetsMember2022-01-012022-12-310000089089us-gaap:ValuationAllowanceOfDeferredTaxAssetsMember2022-12-310000089089us-gaap:ValuationAllowanceOfDeferredTaxAssetsMember2021-01-012021-12-310000089089us-gaap:ValuationAllowanceOfDeferredTaxAssetsMember2020-01-012020-12-310000089089us-gaap:ValuationAllowanceOfDeferredTaxAssetsMember2020-12-31
UNITED STATES SECURITIES AND EXCHANGE COMMISSION
Washington, D.C. 20549
Form 10-K
| | | | | | | | | | | |
| ☒ | | ANNUAL REPORT PURSUANT TO SECTION 13 OR 15(d) OF THE SECURITIES EXCHANGE ACT OF 1934
|
| | For the fiscal year ended | DECEMBER 31, 2022 |
| OR |
| ☐ | | TRANSITION REPORT PURSUANT TO SECTION 13 OR 15(d) OF THE SECURITIES EXCHANGE ACT OF 1934
For the transition period from to |
Commission file number 1-6402-1
SERVICE CORPORATION INTERNATIONAL
(Exact name of registrant as specified in its charter)
| | | | | | | | | | | | | | | | | |
| Texas | | | 74-1488375 |
| (State or other jurisdiction of incorporation or organization) | | (I.R.S. employer identification no.) |
| 1929 Allen Parkway | | | |
| Houston | | | |
| Texas | | 77019 |
| (Address of principal executive offices) | | (Zip code) |
Registrant’s telephone number, including area code: (713) 522-5141 Securities registered pursuant to Section 12(b) of the Act:
| | | | | | | | | | | | | | |
| Title of Each Class | | Trading Symbol (s) | | Name of Each Exchange on Which Registered |
| Common Stock ($1 par value) | | SCI | | New York Stock Exchange |
Securities registered pursuant to Section 12(g) of the Act: None
| | | | | | | | | | | | | | |
| Indicate by check mark if the registrant is a well-known seasoned issuer, as defined in Rule 405 of the Securities Act. | Yes | þ | No | ¨ |
| Indicate by check mark if the registrant is not required to file reports pursuant to Section 13 or Section 15(d) of the Act. | Yes | ¨ | No | þ |
| Indicate by check mark whether the registrant (1) has filed all reports required to be filed by Section 13 or 15(d) of the Securities Exchange Act of 1934 during the preceding 12 months (or for such shorter period that the registrant was required to file such reports), and (2) has been subject to such filing requirements for the past 90 days. | Yes | þ | No | ¨ |
| Indicate by check mark whether the registrant has submitted electronically every Interactive Data File required to be submitted pursuant to Rule 405 of Regulation S-T (§ 232.405 of this chapter) during the preceding 12 months (or for such shorter period that the registrant was required to submit such files). | Yes | þ | No | ¨ |
| | | | | | | | | | | | | | | | | | | | | | | | | | | | | |
| Indicate by check mark whether the registrant is a large accelerated filer, an accelerated filer, a non-accelerated filer, a smaller reporting company, or an emerging growth company. See the definitions of “large accelerated filer,” “accelerated filer,” “smaller reporting company,” and "emerging growth company" in Rule 12b-2 of the Exchange Act. (Check one): |
Large accelerated filer | þ | Accelerated filer | ¨ | Non-accelerated filer | ¨ | Smaller reporting company | ☐ | Emerging growth company | ☐ |
| | | | | | | | | | | | | | |
| If an emerging growth company, indicate by check mark if the registrant has elected not to use the extended transition period for complying with any new or revised financial accounting standards provided pursuant to Section 13(a) of the Exchange Act. | ¨ | | | |
| Indicate by check mark whether the registrant has filed a report on and attestation to its management's assessment of the effectiveness of its internal control over financial reporting under Section 404(b) of the Sarbanes-Oxley Act (15 U.S.C. 7262(b)) by the registered public accounting firm that prepared or issued its audit report. | ☑ | | | |
| If securities are registered pursuant to Section 12(b) of the Act, indicate by check mark whether the financial statements of the registrant included in the filing reflect the correction of an error to previously issued financial statements. | ¨ | | | |
| Indicate by check mark whether any of those error corrections are restatements that required a recovery analysis of incentive-based compensation received by any of the registrant’s executive officers during the relevant recovery period pursuant to §240.10D-1(b). | ¨ | | | |
| Indicate by check mark whether the registrant is a shell company (as defined in Rule 12b-2 of the act). | Yes | ☐ | No | þ |
The aggregate market value of the common stock held by non-affiliates of the registrant (assuming that the registrant’s only affiliates are its executive officers and directors) was $10,609,438,787 based upon a closing market price of $69.12 on June 30, 2022 of a share of common stock as reported on the New York Stock Exchange.
The number of shares outstanding of the registrant’s common stock as of February 13, 2023 was 153,048,775 (net of treasury shares).
DOCUMENTS INCORPORATED BY REFERENCE
Portions of the registrant’s Proxy Statement in connection with its 2023 Annual Meeting of Stockholders (Part III).
2 Service Corporation International
Glossary
The following terms are common to the deathcare industry, are used throughout this report, and have the following meanings:
Atneed — Funeral, including cremation, and cemetery arrangements sold once death has occurred.
Average Revenue per Service — Average revenue per funeral service performed, excluding the impact of funeral recognized preneed revenue, GA revenue, and certain other revenue.
Cancellation — Termination of a preneed contract, which relieves us of the obligation to provide the goods and services included in the contract. Cancellations may be requested by the customer or be initiated by us for failure to comply with the contractual terms of payment. State or provincial laws govern the amount of refund, if any, owed to the customer.
Care Trusts' Corpus — The deposits and net realized capital gains included in the perpetual care trusts that may not be withdrawable. In certain states, some or all of the net realized capital gains can also be distributed. Additionally, some states allow a total return distribution that may contain elements of income, capital appreciation, and principal.
Cemetery Marker — An item used to identify the deceased person in a particular burial space, crypt, niche, or cremation memorialization property. Permanent burial and cremation memorialization cemetery markers are usually made of bronze or stone.
Cemetery Merchandise and Services — Merchandise and services used in connection with a cemetery interment, including stone and bronze memorials, cemetery markers, outer burial containers, floral placement, graveside services, merchandise installations, urns, and interments.
Cemetery Perpetual Care Trust or Endowment Care Fund (ECF) — A trust fund established for the purpose of maintaining cemetery grounds and property into perpetuity. For these trusts, the corpus remains in the trust in perpetuity and the investment earnings or elected distributions are withdrawn regularly and are intended to defray our expenses incurred to maintain the cemetery. In certain states, some or all of the net realized capital gains can also be distributed. Additionally, some states allow a total return distribution that may contain elements of income, capital appreciation, and principal.
Cemetery Property — Developed lots, lawn crypts, mausoleum spaces, niches, and cremation memorialization property items (constructed and ready to accept interments) and undeveloped land we intend to develop for the sale of interment rights. Includes the construction-in-progress balance during the pre-construction and construction phases of projects creating new developed property items.
Cemetery Property Amortization or Amortization of Cemetery Property — The non-cash recognized expenses of cemetery property interment rights, which are recorded by specific identification with the cemetery property revenue for each contract.
Cemetery Property Interment Rights — The exclusive right to determine the human remains that will be interred in a specific cemetery property space. See also Cemetery Property Revenue below.
Cemetery Property Revenue — Recognized sales of interment rights in cemetery property when the receivable is deemed collectible and the property is fully constructed and available for interment.
Combination Location (Combos) — Locations where a funeral service location is physically located within or adjoining a SCI-owned cemetery location.
Cremation — The reduction of human remains to bone fragments by intense heat.
Cremation Memorialization — Products specifically designed to commemorate and honor the life of an individual who has been cremated. These products include cemetery property items that provide for the disposition of cremated remains within our cemeteries such as benches, boulders, statues, niches, etc. They also include memorial walls and books where the name of the individual is inscribed but the remains have been scattered or kept by the family.
Funeral Merchandise and Services — Merchandise such as burial caskets and related accessories, outer burial containers, urns and other cremation receptacles, casket and cremation memorialization products, flowers, and professional services relating to funerals including arranging and directing services, use of funeral facilities and motor vehicles, removal, preparation, embalming, cremations, memorialization, visitations, travel protection, and catering.
Funeral Recognized Preneed Revenue — Funeral merchandise and travel protection, net, sold to a preneed customer and delivered before a death has occurred.
Funeral Services Performed — The number of funeral services, including cremations, provided after the date of death, sometimes referred to as funeral volume.
General Agency (GA) Revenue — Commissions we receive from third-party life insurance companies for life insurance policies sold to preneed customers for the purpose of funding preneed funeral arrangements. The commission rate paid is determined based on the product type sold, the length of payment terms, and the health and age of the insured/annuitant.
Interment — The burial or final placement of human remains in the ground (interment), in mausoleums (entombment), in niches (inurnment), or in cremation memorialization property (inurnment).
Lawn Crypt — Cemetery property in which an underground outer burial receptacle constructed of concrete and reinforced steel has been pre-installed in predetermined designated areas.
Maturity — When the underlying contracted merchandise is delivered or service is performed, typically at death. This is the point at which preneed funeral contracts are converted to atneed contracts (note — delivery of certain merchandise and services can occur prior to death).
Mausoleum — An above ground structure that is designed to house caskets and/or cremation urns.
Merchandise and Service Trust — A trust account established in accordance with state or provincial law into which we deposit the required percentage of customers’ payments for preneed funeral, cremation, or cemetery merchandise and services to be delivered or performed by us in the future. The amounts deposited can be withdrawn only after we have completed our obligations under the preneed contract or upon the cancellation of the contract. Also referred to as a preneed trust.
Outer Burial Container — A reinforced container intended to inhibit the subsidence of the earth and house the casket after it is placed in the ground, also known as a burial vault.
Preneed — Purchase of cemetery property interment rights or any funeral or cemetery merchandise and services prior to death occurring.
Preneed Backlog or Backlog of Preneed Revenue — Future revenue from unfulfilled preneed funeral, cremation, and cemetery contractual arrangements.
Preneed Cemetery Sales Production — Sales of preneed cemetery contracts. These sales are recorded in Deferred revenue, net until the merchandise is delivered, the service is performed, or the property has been constructed and is available for interment.
Preneed Funeral Sales Production — Sales of preneed funeral trust-funded and insurance-funded contracts. Preneed funeral trust-funded contracts are recorded in Deferred revenue, net until the merchandise is delivered or the service is performed. We do not reflect the unfulfilled insurance-funded preneed funeral contract amounts in our Consolidated Balance Sheet. The proceeds of the life insurance policies will be reflected in revenue as these funerals are performed by us in the future.
Preneed Receivables, Net — Amounts due from customers when we have delivered the merchandise, performed the service, or transferred control of the cemetery property interment rights prior to a death occurring and amounts due from customers on irrevocable preneed contracts.
Travel Protection — A service provided by a third-party that provides shipment of remains to the servicing funeral home of choice if the purchaser passes away outside of a certain radius of their residence, without any additional expense to the family.
Trust Fund Income — Recognized investment earnings from our merchandise and service and perpetual care trust investments.
As used herein, “SCI,” “Company,” “we,” “our,” and “us” refer to Service Corporation International and companies owned directly or indirectly by Service Corporation International, unless the context requires otherwise. Management has published a white paper on the corporate website for further understanding of accounting for preneed sales. You can view the white paper at http://investors.sci-corp.com under Featured Documents. Documents and information on our website are not incorporated by reference herein.
4 Service Corporation International
Item 1. Business
General
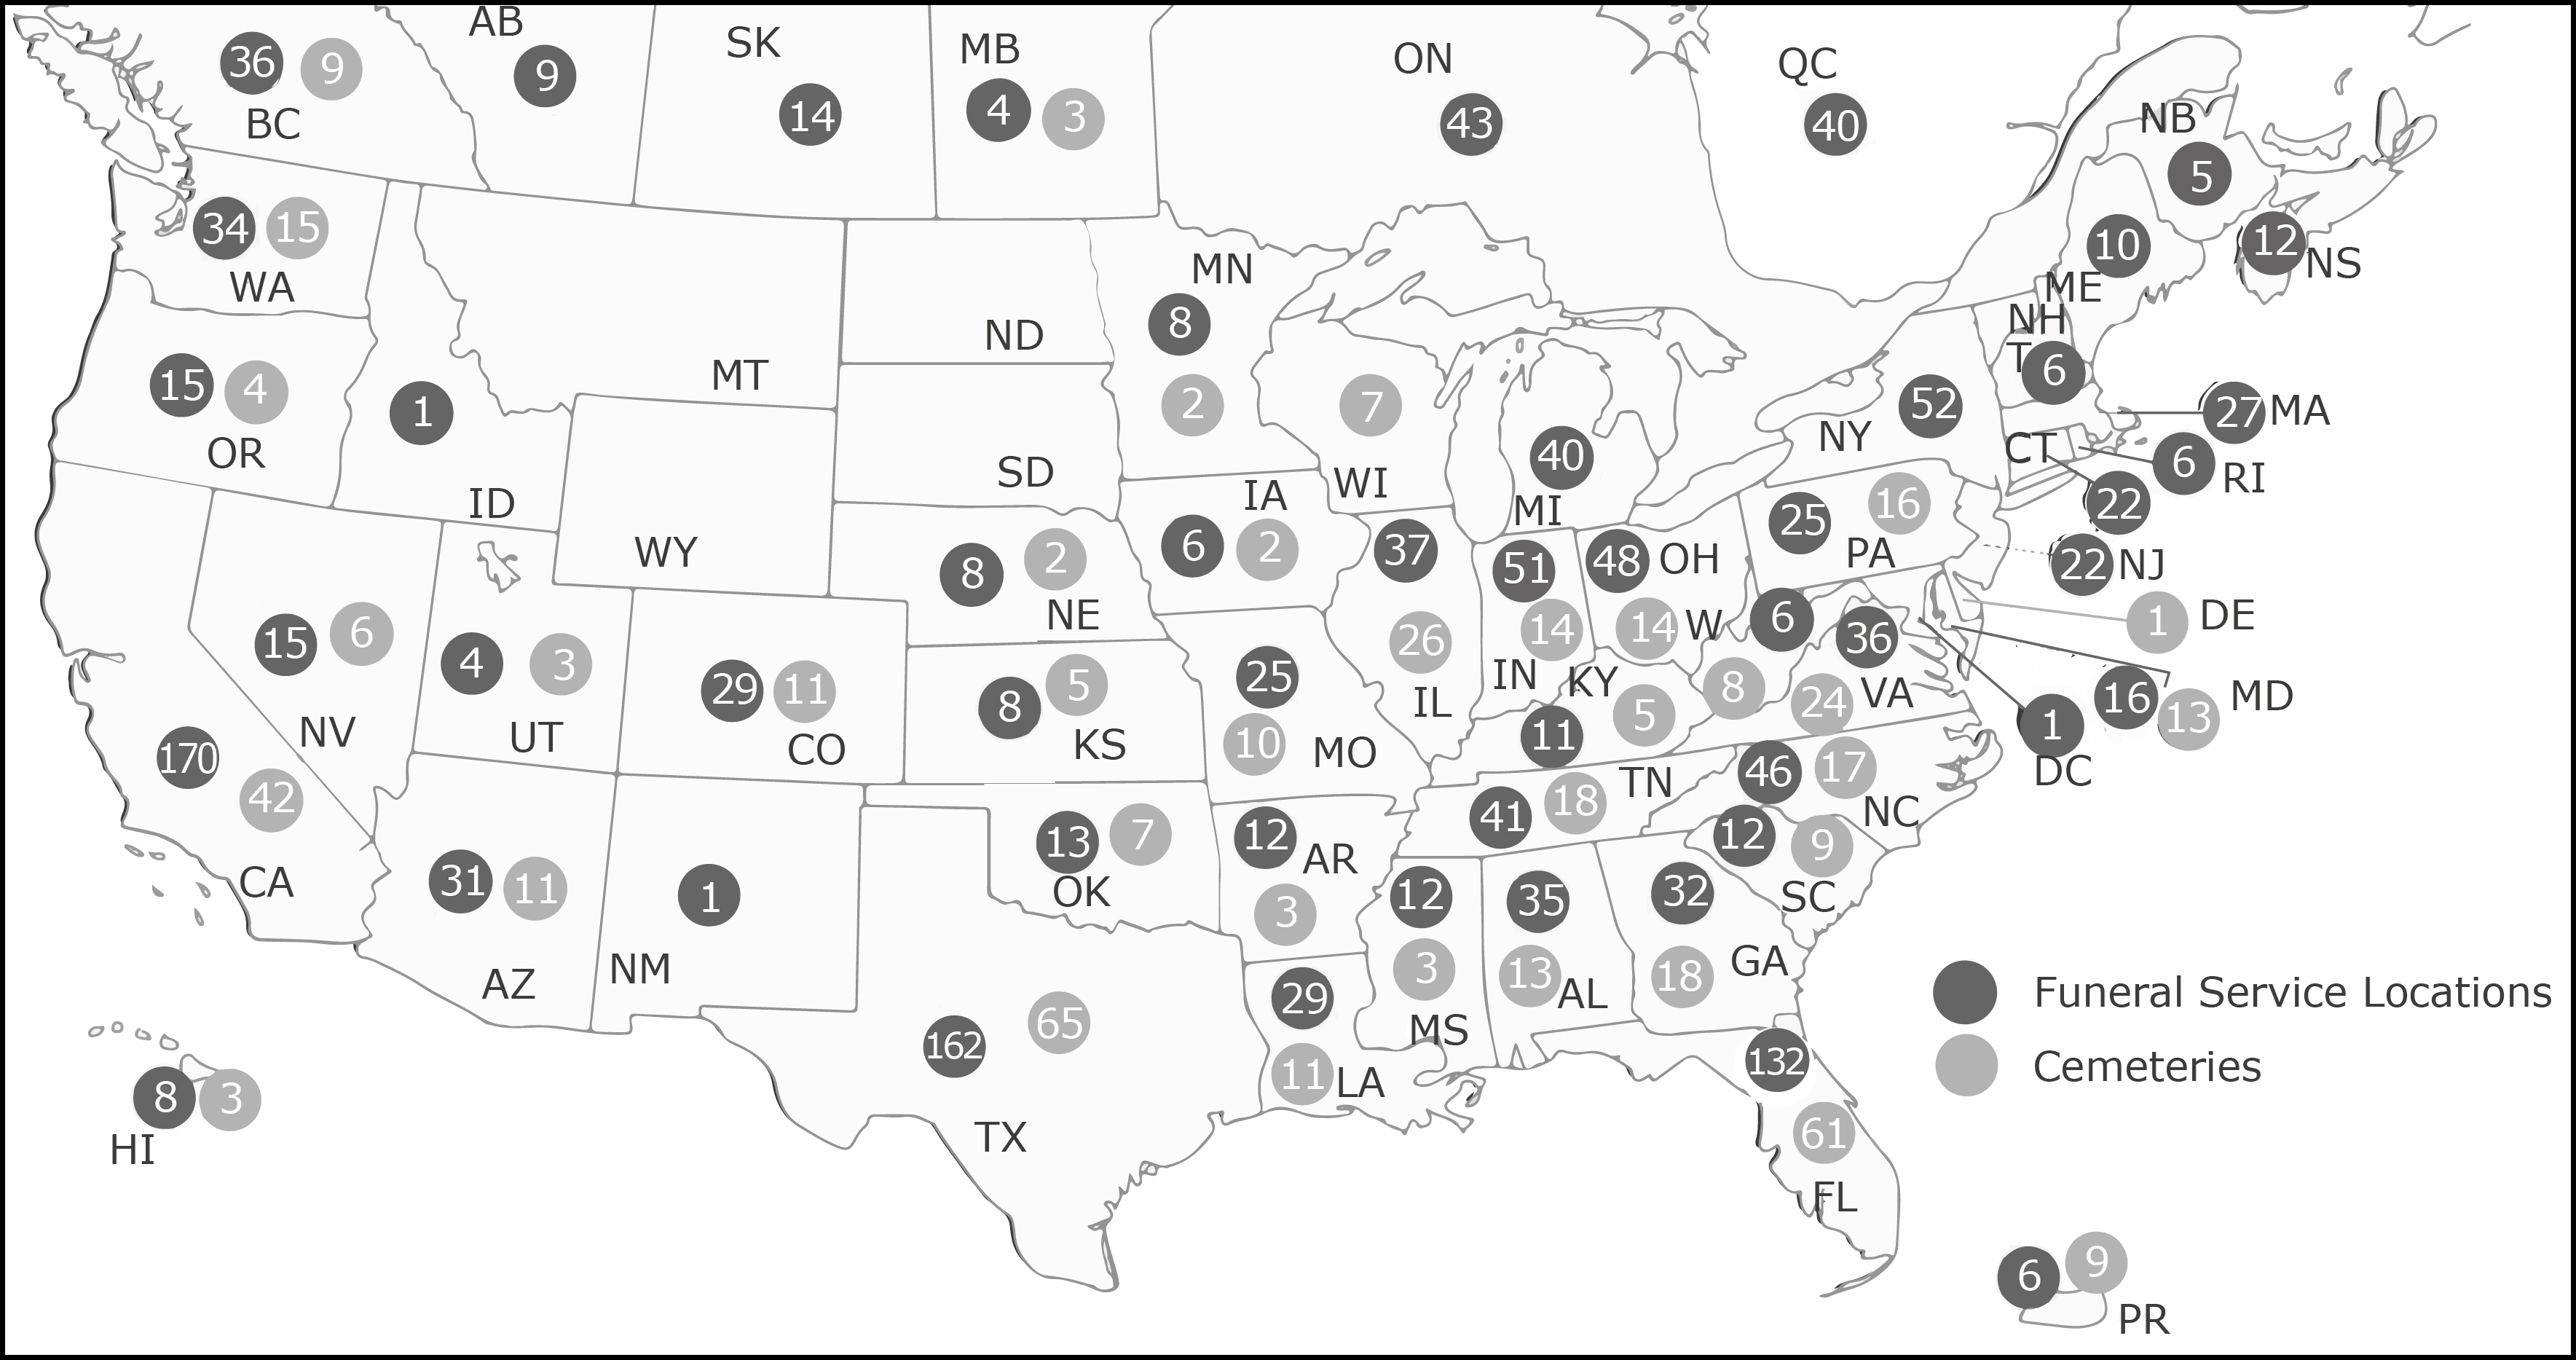
We are North America’s largest provider of deathcare products and services, with a network of funeral service locations and cemeteries unequaled in geographic scale and reach. At December 31, 2022, we operated 1,474 funeral service locations and 490 cemeteries (including 303 funeral service/cemetery combination locations), which are geographically diversified across 44 states, eight Canadian provinces, the District of Columbia, and Puerto Rico.
We are well known for our Dignity Memorial® brand, North America's first transcontinental brand of deathcare products and services. Our other brands include Dignity Planning™, National Cremation Society®, Advantage® Funeral and Cremation Services, Funeraria del Angel™, Making Everlasting Memories®, Neptune Society™ and Trident Society™. Our funeral service and cemetery operations consist of funeral service locations, cemeteries, funeral service/cemetery combination locations, crematoria, and other related businesses, which enable us to serve a wide array of customer needs. We sell cemetery property and funeral and cemetery merchandise and services at the time of need and on a preneed basis.
Human Capital Management
At December 31, 2022, we employed 17,589 full-time individuals and 7,550 part-time individuals. Of the full-time associates, 15,028 were employed in the funeral and cemetery operations and 2,561 were employed in corporate or other overhead areas of our business. Approximately 2.1% of our associates are represented by unions. Although labor disputes occur from time to time, relations with associates are generally considered favorable. We reach out to our associates for feedback throughout their employment at SCI using a variety of voluntary surveys ensuring we are meeting the needs and expectations of our large and diverse workforce.
Associate Benefits
Eligible associates in the United States may elect coverage under our group health and life insurance plans. Associates covered by a collective bargaining agreement are typically covered by union health plans and, therefore, do not participate in our health insurance plan. At December 31, 2022 and 2021, there were 9,478 and 9,685 associates, respectively, who had elected to participate in our group health insurance plans.
Eligible associates in the United States are covered by retirement plans of SCI or various subsidiaries, while international associates are covered by other SCI (or SCI subsidiary) defined contribution or government-mandated benefit plans. We have an employee savings plan that qualifies under Section 401(k) of the Internal Revenue Code for the exclusive benefit of our United States employees. We contribute a matching contribution based on the employee's contribution and years of vesting service. For more information about our retirement plans, see Note 12 of Part II, Item 8. Financial Statements and Supplementary Data. We understand the importance of work-life balance and provide other benefits such as baby bonding time, paid time off for various reasons, and financial planning support for our associates. Additionally, we offer an employee assistance program that offers free and confidential counseling by masters level counselors for associates who may be facing mental health challenges.
Inclusion and Diversity
We believe in the power of inclusion and respecting our fellow associates’ work, ideas, beliefs, and lifestyles. Our Inclusion and Diversity (I&D) Committee, which is a cross-functional team of associates, has been key to the development of programs such as our Women’s Leadership Conference and Associate Resource Communities (ARCs). The ARCs allow colleagues with similar backgrounds or interests to connect for networking, provide opportunities for growth, and support the communities and customers we serve. Our leadership team is committed to advancing inclusion and diversity within the workplace. By embracing the many backgrounds and perspectives that make each of us unique, we are able to remain relevant to the diverse families we serve. We have created an I&D senior management position to support the Company's belief that diversity of talent and people is a key driver of better business outcomes.
Training and Development
We provide opportunities for career growth and supporting the personal and professional goals of our associates is a priority for us. In addition to development programs and a robust online training portal offering thousands of courses, books, audiobooks, and videos, associates can participate in mentoring programs and take advantage of discounts and tuition reimbursement through our many university partnerships. We are also proud to offer scholarship and apprentice programs to those interested in joining our profession.
Regulation
Our funeral operations are regulated by the Federal Trade Commission (the “FTC”) under the FTC’s Trade Regulation Rule on Funeral Industry Practices (the “Funeral Rule”), which went into effect in 1984. The Funeral Rule defines certain acts or practices as unfair or deceptive and contains certain requirements to prevent these acts or practices. The preventive measures require a funeral provider to give consumers accurate, itemized price information and various other disclosures about funeral merchandise and services and prohibit a funeral provider from: 1) misrepresenting legal, crematory, and cemetery requirements; 2) embalming for a fee without permission; 3) requiring the purchase of a casket for direct cremation; and 4) requiring consumers to buy certain funeral merchandise or services as a condition for furnishing other funeral merchandise or services.
Our operations are also subject to regulation, supervision, and licensing under numerous federal, state, and local laws and regulations as well as Canadian provincial laws and regulations. For example, state laws impose licensing requirements for funeral service locations and funeral directors and regulate preneed sales including our preneed trust activities. Our facilities are subject to environmental, health, and safety regulations. We take various measures to comply with the Funeral Rule and all laws and regulations. For example, we have established and maintain policies and procedures around our business practices; we provide training of our personnel; and we perform ongoing reviews of our compliance efforts. We are currently in substantial compliance with the Funeral Rule and all laws and regulations.
Federal, state, and local legislative bodies and regulatory agencies (including Canadian legislative bodies and agencies) frequently propose new laws and regulations, some of which could have a material effect on our operations and on the deathcare industry in general. We cannot accurately predict the outcome of any proposed legislation or regulation or the effect that any such legislation or regulation might have on us.
History
We were incorporated in Texas in July of 1962. Our original business plan was based on efficiencies of scale, specifically reducing overhead costs by sharing resources such as preparation services, back office administration support, transportation, and personnel among funeral service locations in a business “cluster.” After proving the plan’s effectiveness in Houston in the early 1960s, we set out to apply this operating strategy through the acquisition of deathcare businesses in other markets over the next three decades. Beginning in 1993, we expanded beyond North America, acquiring major deathcare companies in Australia, the United Kingdom, and France, plus smaller holdings in other European countries, Asia, and South America.
During the mid to late 1990s, acquisitions of deathcare facilities became extremely competitive, resulting in increased prices for acquisitions and substantially reduced returns on invested capital. In 1999, we significantly reduced our level of acquisition activity and over the next several years implemented various initiatives to pay down debt, increase cash flow, reduce overhead costs, increase efficiency, and leverage our scale. We divested our international businesses and many North American funeral service locations and cemeteries that were either underperforming or did not fit within our long-term strategy. At the same time, we began to capitalize on the strength of our network by introducing to North America the first transcontinental brand of deathcare services and products — Dignity Memorial® (see www.dignitymemorial.com). Information contained on our website is not part of this report.
In late 2006, having arrived at a position of financial stability and improved operating efficiency, we acquired the then second largest company in the North American deathcare industry, Alderwoods Group. In early 2010, we acquired the then fifth largest company in the North American deathcare industry, Keystone North America. In June 2011, we acquired 70% of the outstanding shares of The Neptune Society, Inc. (Neptune), which is the nation's largest direct cremation organization, now known as SCI Direct. Subsequently, in 2013 and 2014, we acquired the remaining 30% of the outstanding shares of Neptune. In December 2013, we purchased Stewart Enterprises, Inc. (Stewart), the then second largest operator of funeral service locations and cemeteries in North America. We continue to pursue strategic acquisitions and complete divestitures of non-strategic funeral homes and cemeteries.
Funeral and Cemetery Operations
Our funeral service and cemetery operations consist of funeral service locations, cemeteries, funeral service/cemetery combination locations, crematoria, and other related businesses. See Note 13 in Part II, Item 8. Financial Statements and Supplementary Data, for financial information about our business segments and geographic areas. We have the largest number of combination locations in North America. Funeral service/cemetery combination locations are businesses in which a funeral service location is physically located within or adjoining a cemetery that we own. Combination locations allow certain facility, personnel, and equipment costs to be shared between the funeral service location and a cemetery location. Combination facilities typically are more cost competitive and have a higher gross margin than funeral and
6 Service Corporation International
cemetery operations that are operated separately. Combination locations also create synergies between funeral and cemetery sales personnel and give families added convenience to purchase both funeral and cemetery merchandise and services at a single location.
Funeral service locations provide all professional services related to funerals and cremations, including the use of funeral home facilities and motor vehicles, arranging and directing services, removal, preparation, embalming, cremations, memorialization, and catering. Funeral merchandise, including burial caskets and related accessories, urns and other cremation receptacles, outer burial containers, flowers, online and video tributes, stationery products, casket and cremation memorialization products, and other ancillary merchandise, is sold at funeral service locations.
Our cemeteries provide cemetery property interment rights, including developed lots, lawn crypts, mausoleum spaces, niches, and other cremation memorialization and interment options. Cemetery merchandise and services, including memorial cemetery markers and bases, outer burial containers, flowers and floral placement, other ancillary merchandise, graveside services, merchandise installation, and interments, are sold at our cemeteries.
We also sell cemetery property interment rights and funeral and cemetery merchandise and services whereby a customer contractually agrees to the terms of certain products and services to be delivered and performed in the future. We define these sales as preneed sales. As a result of such preneed sales, our preneed backlog of unfulfilled funeral and cemetery contracts was $13.7 billion at December 31, 2022 and 2021.
The following table at December 31, 2022 provides the number of our funeral service locations and cemeteries by country, and by state, territory, or province:
| | | | | | | | | | | | | | | | | | | | |
| Country, State/Territory/Province | | Number of Funeral Service Locations | | Number of Cemeteries | | Total |
| United States | | | | | | |
| Alabama | | 35 | | | 13 | | | 48 | |
| Arizona | | 31 | | | 11 | | | 42 | |
| Arkansas | | 12 | | | 3 | | | 15 | |
| California | | 170 | | | 42 | | | 212 | |
| Colorado | | 29 | | | 11 | | | 40 | |
| Connecticut | | 22 | | | — | | | 22 | |
| Delaware | | — | | | 1 | | | 1 | |
| District of Columbia | | 1 | | | — | | | 1 | |
| Florida | | 132 | | | 61 | | | 193 | |
| Georgia | | 32 | | | 18 | | | 50 | |
| Hawaii | | 8 | | | 3 | | | 11 | |
| Idaho | | 1 | | | — | | | 1 | |
| Illinois | | 37 | | | 26 | | | 63 | |
| Indiana | | 51 | | | 14 | | | 65 | |
| Iowa | | 6 | | | 2 | | | 8 | |
| Kansas | | 8 | | | 5 | | | 13 | |
| Kentucky | | 11 | | | 5 | | | 16 | |
| Louisiana | | 29 | | | 11 | | | 40 | |
| Maine | | 10 | | | — | | | 10 | |
| Maryland | | 16 | | | 13 | | | 29 | |
| Massachusetts | | 27 | | | — | | | 27 | |
| Michigan | | 40 | | | — | | | 40 | |
| Minnesota | | 8 | | | 2 | | | 10 | |
| Mississippi | | 12 | | | 3 | | | 15 | |
| Missouri | | 25 | | | 10 | | | 35 | |
| Nebraska | | 8 | | | 2 | | | 10 | |
| Nevada | | 15 | | | 6 | | | 21 | |
| | | | | | | | | | | | | | | | | | | | |
| Country, State/Territory/Province | | Number of Funeral Service Locations | | Number of Cemeteries | | Total |
| New Hampshire | | 6 | | | — | | | 6 | |
| New Jersey | | 22 | | | — | | | 22 | |
| New Mexico | | 1 | | | — | | | 1 | |
| New York | | 52 | | | — | | | 52 | |
| North Carolina | | 46 | | | 17 | | | 63 | |
| Ohio | | 48 | | | 14 | | | 62 | |
| Oklahoma | | 13 | | | 7 | | | 20 | |
| Oregon | | 15 | | | 4 | | | 19 | |
| Pennsylvania | | 25 | | | 16 | | | 41 | |
| Puerto Rico | | 6 | | | 9 | | | 15 | |
| Rhode Island | | 6 | | | — | | | 6 | |
| South Carolina | | 12 | | | 9 | | | 21 | |
| Tennessee | | 41 | | | 18 | | | 59 | |
| Texas | | 162 | | | 65 | | | 227 | |
| Utah | | 4 | | | 3 | | | 7 | |
| | | | | | |
| Virginia | | 36 | | | 24 | | | 60 | |
| Washington | | 34 | | | 15 | | | 49 | |
| West Virginia | | 6 | | | 8 | | | 14 | |
| Wisconsin | | — | | | 7 | | | 7 | |
| Canada | | | | | | |
| Alberta | | 9 | | | — | | | 9 | |
| British Columbia | | 36 | | | 9 | | | 45 | |
| Manitoba | | 4 | | | 3 | | | 7 | |
| New Brunswick | | 5 | | | — | | | 5 | |
| Nova Scotia | | 12 | | | — | | | 12 | |
| Ontario | | 43 | | | — | | | 43 | |
| Quebec | | 40 | | | — | | | 40 | |
| Saskatchewan | | 14 | | | — | | | 14 | |
| Total funeral service locations and cemeteries | | 1,474 | | | 490 | | | 1,964 | |
We believe we have satisfactory title to the properties owned and used in our business, subject to various liens, encumbrances, and easements that are incidental to ownership rights and uses and do not materially detract from the value of the property. At December 31, 2022, we owned approximately 90% of the real estate and buildings used at our facilities, and the remainder of the facilities were leased under both finance and operating leases. At December 31, 2022, our 490 cemeteries contained a total of approximately 35,500 acres, of which approximately 66% was developed. Interment rights for approximately 2,000 acres of the developed acreage are unsold.
Our corporate headquarters are located at 1929 Allen Parkway, Houston, Texas 77019. The property consists of approximately 160,000 square feet of office space and 185,000 square feet of parking space on approximately seven acres. We own a building in Jefferson, Louisiana with approximately 96,200 square feet of office space that we use, in part, for corporate activities.
8 Service Corporation International
A map of our locations in North America is presented below:
COVID-19 Impact
Since the World Health Organization declared the worldwide outbreak of a novel strain of coronavirus (COVID-19) a global pandemic in March 2020, we have worked continuously to meet the challenges it presented. Like many businesses worldwide, COVID-19 is still directly and indirectly impacting various aspects of our business operations.
We continue to maintain a high priority focus on the health, safety, and mental well-being of our associates. We provide an employee assistance program that offers free and confidential counseling by masters level counselors for our associates' overall mental health. We have avoided layoffs, mandatory furloughs, and any widespread reductions in pay as a result of the impact of COVID-19. Over the last several years, we have awarded discretionary bonuses to associates in recognition of their courageous efforts and dedication to serving families throughout the pandemic.
To ensure both associate and customer safety, we quickly implemented technology solutions during the early part of the pandemic to overcome social distancing restrictions. Many of these solutions are still in place today and helped us accelerate the use of technology throughout our organization, particularly within our sales team with the use of our customer relationship management system and digital leads. By capitalizing on our physical and digital presence in our response to the COVID-19 crisis, we were able to further leverage our scale. This accelerated the use of new technology required to successfully meet customer needs during COVID-19 and has provided many advantages which further differentiates us from our competitors. We view the demand for robust services and celebrations of life through the COVID-19 pandemic as evidence that our customers value what our team does best, which is helping our client families gain closure and healing through the process of grieving, remembrance, and celebration.
Competition
Although there are several public companies that own funeral service locations and cemeteries, the majority of deathcare businesses in North America are locally-owned, independent operations. We estimate that our funeral and cemetery market share in North America is approximately 15%-16% based on estimated total industry revenue. The success of a single funeral service location or cemetery in any community is a function of the name, reputation, and location of that funeral service location or cemetery. Competitive pricing, professional service and attention, and well-maintained locations are also important.
We have an unparalleled network of funeral service locations and cemeteries that offers high quality products and services at prices that are competitive with local competing funeral service locations, cemeteries, and retail locations. Within this network, the funeral service locations and cemeteries operate under various names as most operations were acquired as existing businesses. We have co-branded the majority of our operations under the name Dignity Memorial®. Our branding strategy gives us a strategic advantage and identity in the industry. While this branding process is intended to emphasize our seamless national network of funeral service locations and cemeteries, the original names associated with acquired operations, and their inherent goodwill and heritage, generally remain the same. For example, Geo. H. Lewis & Sons Funeral Directors is now Geo. H. Lewis & Sons Funeral Directors, a Dignity Memorial® provider.
Strategies for Growth
We are the largest consolidated deathcare company in North America and are well positioned for long-term profitable growth. Like most businesses world-wide, COVID-19 has impacted various aspects of our business operations, however, our fundamental strategy has not changed. Over the next several years, our industry will be largely shaped by the aging of the Baby Boomer generation in the deathcare space and we are poised to benefit from the aging of the North American population. In each stage of life, Baby Boomers have set new trends, transformed society, and redefined norms, and we anticipate the impact will be the same for our industry. We have already begun to see the impact of the Baby Boomers through the growth in our preneed cemetery sales production. We expect to see a similar impact on our preneed funeral results and ultimately our atneed results as these preneed contracts mature. In every aspect of our business, we are listening and responding to our customer’s changing needs and leveraging our scale to deliver unparalleled experiences - both digitally and in person - to meet those changing needs.
The following strategies remain the core of our foundation: 1) grow revenue, 2) leverage our unparalleled scale, and 3) invest capital. While these strategies remain unchanged, a shift to increased utilization of technology during the COVID-19 pandemic has influenced how we serve our customers and how we invest our capital.
Grow Revenue
We plan to grow revenue by remaining relevant to our customers as their preferences evolve through a combination of price, product, and service differentiation strategies. We also expect that continued growth in our preneed sales will drive future revenue expansion.
Remaining Relevant to the Customer
Remaining relevant to our customer is key to generating revenue growth in a changing customer environment. We are constantly evolving to meet the varying preferences and needs of our customers. Whether choosing burial or cremation, the Baby Boomers are redefining the traditional funeral by transitioning away from solemnly mourning a death to a personalized celebration of life ceremony. In certain markets, we are responding to this trend by spending capital to repurpose traditional casket selection rooms to event rooms that can accommodate a celebration. We are offering a customer friendly digital presentation of options that allow the customer to choose merchandise and services including unique celebration, catering, and celebrant services.
In our funeral business, we focus on memorialization merchandise and services that are meaningful to both our burial and cremation customers. The growing trend of cremation requires more flexibility in providing products and services. We have developed cremation service packages, which may or may not include a celebratory memorialization, depending on the consumers preference.
In our cemetery business, we continue to grow revenue by responding to the customer’s desire for personalized and unique options by expanding our tiered product and cemetery property options. Over the past several years, we have substantially increased our property options to offer many unique choices. From high-end family estates, which capture incredible views, to nicely landscaped hedge estates, we continue to develop property selections that resonate with our customers. For cemetery merchandise and services, we have developed innovative products such as recurring floral placements, customized cemetery property offerings, and specialized graveside service options. We continue to embrace cremation opportunities for customers in our cemetery segment by offering an increased variety of cremation property options, including glass-front niches and scattering gardens.
As we evolve to meet ever-changing customer preferences, we will continue catering to the religious, ethnic, and cultural traditions important to many of our customers. We have remained flexible to meet the varying needs of customers, demonstrating our resolve to remain relevant to changing customer preferences.
10 Service Corporation International
Growing Preneed Sales
Our preneed sales program drives current and future revenue growth. Baby Boomers have been influencing our cemetery preneed sales for several years and are beginning to positively affect the growth of our preneed funeral sales programs. Our highly trained sales force of approximately 3,750 counselors provide customers with informed guidance about various service and merchandise options tailored for today’s consumers. Utilizing our scale, our counselors are reaching out to consumers through multiple lead channels, driving future revenue growth. We sponsor community events and seminars to educate and provide guidance around preplanning both funeral and cemetery services and merchandise. We have adopted a more sophisticated and targeted direct mail approach, and we continue increasing our digital presence through search engine optimization and other marketing channels. We have a unique competitive advantage to continue growing preneed sales benefiting from our size and scale. Our preneed program provides us with an opportunity to develop greater brand awareness, gives consumers peace of mind about their end of life arrangements, and secures future market share. In addition, our increased digital presence has provided significant growth in our digital lead channels over the last several years.
Leverage Our Unparalleled Scale
As the largest deathcare company in North America, we leverage our scale by developing our sales organization and optimizing the use of our network using technology, which benefits our preneed backlog. Our scale enables cost efficiencies through purchasing power and utilizing economies of scale through our supply chain channel. During the COVID-19 pandemic, we were able to continue to operate without any major disruptions to our business, which highlights the strength of our scale.
Developing Our Sales Organization
Over the last several years, we have continued to invest significantly in the development of our sales organization with best in class tools and technologies. These investments include a customer relationship management system, which drives improvements in productivity and sales production by leveraging data analytics, rigorous lead tracking, and effective follow up campaigns. We continue to diversify our sales force to understand and cater to the religious, ethnic, and cultural traditions important to our customers. Our premier combination locations and other large and recognizable cemeteries and funeral homes attract high-quality sales talent. Our scale allows us to operate and expand our sales organization in a manner that would be difficult for our competitors to replicate.
Optimizing Our Network and Deploying Customer-Facing Technology
We continue driving operating discipline and leveraging our scale through standardizing processes and capitalizing on new technologies to improve the customer experience. Our advancements in technology are changing the way we present our product and service offerings to customers. Our atneed point of sale system, HMIS+, uses a digital platform enabled with high resolution video and photographs to create a seamless presentation of our products and service offerings. Our mobile preneed sales system, Beacon, provides customers with a full digital presentation experience in their home or other place of their choosing.
Our Dignity Memorial® location websites feature a modern and user-friendly design. Our location-specific websites are designed for mobile use and optimized for better search engine ranking. In addition to the contemporary and sophisticated design, client families enjoy innovative features such as an interactive obituary experience, social media sharing capabilities, the ability to create and share personalized content in memory of their loved one, and the ability to see venue and catering options for locations.
We have reduced the time it takes to receive customer feedback through digital J.D. Power surveys. Online reviews provide visibility of customer engagement down to the location level and shorten our response time in addressing any customer concerns. We have established a social media presence for a number of our funeral and cemetery businesses, including the ability to livestream services at many of our locations. These digital efforts resulted in favorable customer satisfaction ratings and increased digital sales leads over the last several years.
Although the last several years were difficult in many unexpected ways through the COVID-19 pandemic, we learned valuable lessons around our ability to quickly deploy customer-facing technology. Our associates and client families embraced an increasingly digital world and we utilized various online tools to complete sales and meet families. We are encouraged by the increased digitization and we are making great strides with internal projects leveraging technology and simplifying nearly every facet of service delivery.
Growing Our Preneed Backlog
Our preneed backlog, which includes both insurance and trust-funded merchandise and service products, allows us the opportunity to grow future revenue in a more stable and efficient manner than selling at the time of need. The scale of our multi-billion dollar trust portfolios allows us to leverage access to preeminent money managers with favorable fee structures generating above average returns. Our blended funding approach between insurance and trust-funded merchandise and service products allows us to combine the positive cash flow and predictability of the insurance product with the potential upside of higher returns from our trusted merchandise and service products. This blended approach also helps our ability to grow our preneed backlog in a cash flow neutral manner.
Invest Capital
We maximize capital deployment opportunities in a disciplined and balanced manner to the highest relative return. Our strong liquidity, favorable debt maturity profile, and robust cash flow generation enables us to continue our long-standing commitment to use capital deployment to opportunistically grow our business and enhance shareholder value. Typically, our highest relative return opportunities come from acquisitions and funeral service and cemetery new builds.
Investing in Acquisitions and Building New Funeral Service and Cemetery Locations
We manage our footprint by focusing on strategic acquisitions and building new funeral service and cemetery locations where the expected returns are attractive and meaningfully exceed our weighted average cost of capital. We target businesses with favorable customer dynamics and locations where we can achieve additional economies of scale. Over the last several years, we have increased our growth capital spend on new funeral service locations, enlarging our footprint into new communities as well as expanding existing locations to remain relevant to our customers. For our cemetery businesses, we plan to pursue strategic acquisitions to create more opportunities to serve Baby Boomers through our tiered cemetery options. Additionally, we acquire land for future cemetery development in some of our largest markets. This investment in our future will allow us to continue creating cemetery offerings that appeal to varying preferences in those markets for many years to come. We invested $102.6 million in acquiring 18 funeral service locations and 3 cemeteries, which included 3 combination locations, in 2022.
Managing Debt
We continue to focus on maintaining optimal levels of liquidity and financial flexibility. Our flexible capital strategy allows us to manage our debt maturity profile by making open market debt repurchases when it is opportunistic to do so. We generate a relatively consistent annual cash flow stream that is generally resistant to down economic cycles. This cash flow stream and our significant liquidity allow us to substantially reduce our long-term debt maturities should we choose to do so. In January 2023, we entered into a new bank credit agreement that consists of a $675.0 million Term Loan due January 2028 and an increased Bank Credit Facility due January 2028 providing for borrowings of up to $1.5 billion. Proceeds from this new bank credit agreement were used to settle our existing Term Loan and Bank Credit Facility due May 2024. The new bank credit agreement provides us with flexibility for incremental liquidity, capital investment, working capital, and other general corporate purposes.
Return Excess Cash to Shareholders
Absent any strategic acquisition or new build opportunities, we intend to return excess cash to shareholders. Our quarterly dividend rate has steadily grown from $0.025 per common share in 2005 to $0.27 per common share at the end of 2022. We target a payout ratio of 30% to 40% of after-tax earnings excluding special items and intend to grow our cash dividend commensurate with the growth in our business.
Other
We make available free of charge, on or through our website, our annual, quarterly, and current reports and any amendments to those reports, as soon as reasonably practicable after electronically filing such reports with the Securities and Exchange Commission (SEC). Our website is http://www.sci-corp.com and our telephone number is (713) 522-5141. We also post announcements, updates, events and investor information and presentations on our website in addition to copies of all recent news releases. We may use the Investors section of our website to communicate with investors. It is possible that the financial and other information posted there could be deemed material information. Each of our Board of Directors’ standing committee charters, our Corporate Governance Guidelines, our Code of Ethics for Board Members, and our Code of Conduct for Officers and Employees are available, free of charge, through our website or, upon request, in print. We will post on our internet website all waivers to, or amendments of, our Code of Conduct for Officers and Employees, which are required to be disclosed by applicable law and rules of the New York Stock Exchange listing standards. Information contained on our website is not part of this report. In addition, the SEC also maintains a website that contains reports, proxy and information statements, and other information regarding issuers where you may obtain a copy of all of the material we file publicly with the SEC. The SEC website address is http://www.sec.gov.
12 Service Corporation International
Executive Officers of the Company
The following table sets forth, as of February 15, 2023, the name and age of each executive officer of the Company, the office held, and the year first elected an officer.
| | | | | | | | | | | | | | | | | | | | |
| Officer Name | | Age | | Position | | Year First
Became Officer |
| Thomas L. Ryan | | 57 | | Chairman of the Board, Chief Executive Officer, and President | | 1999 |
| Sumner J. Waring, III | | 54 | | Senior Vice President, Chief Operating Officer | | 2002 |
| Eric D. Tanzberger | | 54 | | Senior Vice President, Chief Financial Officer | | 2000 |
| Gregory T. Sangalis | | 67 | | Senior Vice President, General Counsel and Secretary | | 2007 |
| Elisabeth G. Nash | | 61 | | Senior Vice President, Operations Services | | 2004 |
| John H. Faulk | | 47 | | Senior Vice President, Revenue and Business Development | | 2010 |
| Steven A. Tidwell | | 61 | | Senior Vice President, Sales and Marketing | | 2010 |
| Tammy R. Moore | | 55 | | Vice President and Corporate Controller | | 2010 |
Mr. Ryan was elected Chairman of the Board of SCI effective in January 2016, appointed Chief Executive Officer in February 2005, and President in 2019. He joined the Company in 1996 and served in a variety of financial management roles until November 2000, when he was asked to serve as Chief Executive Officer of European Operations based in Paris, France. In July 2002, Mr. Ryan returned to the United States where he was appointed President and Chief Operating Officer of SCI. Before joining SCI, Mr. Ryan was a certified public accountant with Coopers & Lybrand LLP for eight years. He holds a bachelor's degree in business administration from the University of Texas at Austin. Mr. Ryan serves as a member of the University of Texas McCombs Business School Advisory Council and is a senior member of the University of Texas MD Anderson Cancer Center Board of Visitors.
Mr. Waring, Senior Vice President and Chief Operating Officer, is responsible for North American Operations. He joined SCI in 1996 as Area Vice President of Operations when SCI acquired his family's funeral business. He was appointed President of the Northeast Region in 1999 and President of the Pacific Region in September 2001. In September 2002, Mr. Waring was appointed Vice President, Western Operations, a position he held until May 2004 when he was appointed Vice President, Major Market Operations. He was promoted to Senior Vice President in 2006. In May 2015, Mr. Waring's responsibilities were expanded to include all operations in North America. Mr. Waring holds a bachelor's degree in business administration from Stetson University, a degree in mortuary science from Mount Ida College, and a master's degree in business administration from the University of Massachusetts Dartmouth. Mr. Waring serves on the Board of Directors of BankFive and the Greater Houston Partnership.
Mr. Tanzberger was appointed Senior Vice President and Chief Financial Officer in June 2006 and also served as Treasurer from July 2007 to February 2017. Mr. Tanzberger joined the Company in August 1996 and held various management positions prior to being promoted to Corporate Controller in August 2002. In 2022, his responsibilities were expanded to include information technology. Before joining SCI, Mr. Tanzberger began his financial career at Coopers and Lybrand LLP. Mr. Tanzberger holds a Bachelor of Business Administration degree from the University of Notre Dame. Mr. Tanzberger is currently a member of the Board of Directors and Chair of the Audit Committee of Sanara MedTech Inc. (NASDAQ: SMTI). He is also a current member of the Executive Committee and the Audit Committee Chair of the United Way of Greater Houston. Mr. Tanzberger is a former member of the Board of Trustees of Junior Achievement of Southeast Texas and the National Funeral Directors Association Funeral Service Foundation.
Mr. Sangalis joined the Company in 2007 as Senior Vice President, General Counsel and Secretary. He previously served as Senior Vice President, Law and Administration for Team Inc., a leading provider of specialty industrial maintenance and construction services. Prior to that, Mr. Sangalis served as Managing Director and General Counsel of Main Street Equity Ventures II, a private equity investment firm, and as Senior Vice President, General Counsel and Secretary for Waste Management, Inc., the leading provider of waste management services in North America. Mr. Sangalis holds a bachelor's degree in finance from Indiana University and a master's degree in business administration from the University of Minnesota. He earned his juris doctorate from the University of Minnesota Law School. In 2022, Mr. Sangalis announced his intent to retire in March of 2023.
Ms. Nash was named Senior Vice President of Operations Services in 2010 and is currently responsible for a variety of support functions, including human resources, supply chain, and program management. Prior to that she was Vice President of Process Improvement and Technology, where she led the redefinition of our field and home office processes and systems. Before joining SCI, Ms. Nash served in various senior management accounting and financial positions with Pennzoil Corp. She holds a bachelor's degree in business administration in accounting from Texas A&M University. Ms. Nash serves as Chair of the Board of Directors of Genesys Works Houston.
Mr. Faulk was named Senior Vice President of Revenue and Business Development in 2018. He joined SCI in March 2010 as Vice President, Business Development, to oversee the Company's strategic growth, including mergers and acquisitions, real estate, and construction. His promotion in 2018 expanded his role to include setting direction for the company’s pricing and cemetery development functions. Prior to joining the Company, Mr. Faulk worked for Bain & Company, Inc. where he helped
Fortune 500 Companies and specialty retailers identify profit growth opportunities and achieve strong operating results. He holds a master's degree in business administration from the Darden Graduate School of Business at the University of Virginia and a bachelor's degree in electrical engineering from the University of Virginia.
Mr. Tidwell joined SCI as Vice President, Main Street Market Operations, in March 2010 and was promoted to Senior Vice President of Sales and Merchandising in 2012. As a co-founder of Keystone North America, Inc., Mr. Tidwell served as its President and Chief Executive Officer from May 2007 until it was acquired by SCI in March 2010. In his role, Mr. Tidwell worked closely with Keystone's Senior Leadership Team to develop and implement organic growth strategies as well as external growth and acquisition strategies. He began his career as a licensed funeral director and embalmer in Nashville, Tennessee, and has been actively involved in the funeral and cemetery profession for over forty years. He holds an associate of arts degree from John A. Gupton College and has attended Executive Management and Leadership programs at the Harvard Business School, Vanderbilt University Owen Graduate School of Management, and the Center for Creative Leadership. Mr. Tidwell has served for over three years as the Chairman of the Board of Regents of Commonwealth Institute of Funeral Service.
Mrs. Moore joined the Company in August 2002 as Manager of Financial Reporting. She was promoted to Director of Financial Reporting in 2004 and Managing Director and Assistant Controller in June 2006. In February 2010, she was promoted to Vice President and Corporate Controller and oversees trust accounting and compliance, general accounting, internal and external reporting and customer service. Prior to joining the Company, Mrs. Moore was a certified public accountant with PricewaterhouseCoopers LLP. She holds a bachelor's degree in business administration in accounting from the University of Texas at San Antonio. Since 2019, Mrs. Moore has served on the Board of Regents of Commonwealth Institute of Funeral Service.
Item 1A. Risk Factors
Cautionary Statement on Forward-Looking Statements
The statements in this Form 10-K that are not historical facts are forward-looking statements made in reliance on the safe harbor protections provided under the Private Securities Litigation Reform Act of 1995. These statements may be accompanied by words such as “believe”, “estimate”, “project”, “expect”, “anticipate”, or “predict” that convey the uncertainty of future events or outcomes. These statements are based on assumptions that we believe are reasonable; however, many important factors could cause our actual consolidated results in the future to differ materially from the forward-looking statements made herein and in any other documents or oral presentations made by, or on behalf of, the Company. These factors are discussed below. We assume no obligation and make no undertaking to publicly update or revise any forward-looking statements made herein or any other forward-looking statements made by the Company, whether as a result of new information, future events, or otherwise.
Risks Related to Our Business
Our affiliated trust funds own investments in securities, which are affected by market conditions that are beyond our control.
In connection with our preneed merchandise and service sales and our cemetery property sales, most affiliated trust funds own investments in equity securities, fixed income securities, commingled funds, money market funds, and mutual funds. The fair value of these investments and our earnings and investment gains and losses on these securities and funds are affected by financial market conditions that are beyond our control. Additionally, we may not choose the optimal mix of securities for any particular market condition.
The following table summarizes our investment returns (realized and unrealized), excluding certain fees, on our trust funds:
| | | | | | | | | | | | | | | | | |
| Years Ended December 31, |
| 2022 | | 2021 | | 2020 |
| Preneed funeral merchandise and service trust funds | (11.5) | % | | 14.2 | % | | 16.5 | % |
| Preneed cemetery merchandise and service trust funds | (11.8) | % | | 15.3 | % | | 16.7 | % |
| Cemetery perpetual care trust funds | (11.0) | % | | 13.7 | % | | 13.4 | % |
| Combined trust funds | (11.5) | % | | 14.4 | % | | 15.6 | % |
Generally, earnings or gains and losses on our trust investments are recognized and we withdraw cash when the underlying merchandise is delivered, service is performed, or upon contract cancellation. Our cemetery perpetual care trusts recognize earnings, and in certain states, capital gains and losses or fixed percentage distributions. We withdraw allowable cash when we incur qualifying cemetery maintenance costs.
If the investments in our trust funds experience significant declines in 2023 or subsequent years or in a high inflation environment, there could be insufficient funds in the trusts to cover the costs of delivering merchandise and services or maintaining our cemeteries in the future. We may be required to cover any such shortfall with cash flows from operations,
14 Service Corporation International
which could have a material adverse effect on our financial condition, results of operations, and cash flows. For more information related to our trust investments, see Note 3 in Part II, Item 8. Financial Statements and Supplementary Data. If the fair value of these trusts, plus any other amount due to us upon delivery of the associated contracts, were to decline below the estimated costs to deliver the underlying products and services, we would record a charge to earnings to record a liability for the expected losses on the delivery of the associated contracts. As of December 31, 2022, no such charge was required in any reported period.
We may be required to replenish our affiliated funeral and cemetery trust funds to meet minimum funding requirements, which would have a negative effect on our earnings and cash flow.
In certain states and provinces, we have withdrawn allowable distributable earnings, including unrealized gains, prior to the maturity or cancellation of the related contract. Additionally, some states have laws that either require replenishment of investment losses under certain circumstances or impose various restrictions on withdrawals of future earnings when trust fund values drop below certain prescribed amounts. In the event of market declines that result in a severe decrease in trust fund value, we may be required to replenish amounts in the respective trusts in some future period. As of December 31, 2022, we had unrealized losses of $4.1 million in the various trusts within these states; but no such replenishment is currently necessary.
Our ability to execute our strategic plan depends on many factors, some of which are beyond our control.
Our strategic plan is focused on growing our revenue, leveraging our scale, and investing our capital. Many of the factors that impact our ability to execute our strategic plan, such as the number of deaths and general economic conditions, are beyond our control. Changes in operating conditions, such as supply disruptions and labor disputes, could negatively impact our operations. Our inability to leverage scale to drive cost savings, productivity improvements, preneed production, or earnings growth anticipated by management could affect our financial performance. Our inability to identify acquisition candidates and to complete acquisitions, divestitures, or strategic alliances as planned or to successfully integrate acquired businesses and realize expected synergies and strategic benefits could impact our financial performance. Our inability to deploy capital to maximize shareholder value could impact our financial performance. We cannot give assurance that we will be able to execute any or all of our strategic plan. Failure to execute any or all of our strategic plan could have a material adverse effect on our financial condition, results of operations, and cash flows.
We may be adversely affected by the effects of inflation.
Inflation has the potential to adversely affect our liquidity, business, financial condition and results of operations by increasing our overall cost structure or by reducing the amount of discretionary income consumers have available to spend on our services. The existence of inflation in the economy has resulted in, and may continue to result in, higher interest rates and capital costs, supply shortages, increased costs of labor, components, manufacturing and shipping, as well as weakening exchange rates and other similar effects. As a result of inflation, we have already experienced modest cost increases and surcharges from our vendors and suppliers on merchandise and goods and may continue to experience additional cost increases in the future, which could be of greater magnitude than those experienced to date. In addition, the impacts of inflation are also felt by consumers who face rising prices for a variety of goods and services, which could reduce the amount of discretionary spending that would otherwise be available to our client families and potential client families to spend on our services. Although we may take measures to mitigate the effects of inflation, if these measures are not effective, our business, financial condition, results of operations and liquidity could be materially adversely affected. Even if such measures are effective, there could be a difference between the timing of when these beneficial actions impact our results of operations and when the cost of inflation is incurred.
Our results may be adversely affected by significant weather events, natural disasters, catastrophic events or public health crises.
Three of our largest states by total revenue are California, Texas, and Florida, areas where natural disasters are more prevalent. Significant weather events in these states or other key areas where our operations are concentrated, natural or other disasters, and unforeseen public health crises, such as pandemics and epidemics (including the ongoing COVID-19 pandemic), could disrupt our business through injury or illness to our associates or client families, physical damage, closure or destruction of one or more of our locations, data centers or office facilities, or disrupt the delivery of goods or services by one or more of our vendors, any or all of which could adversely impact our operations or increase our costs, which would adversely affect our financial results.
Our credit agreements contain covenants that may prevent us from engaging in certain transactions.
Our Bank Credit Facilities contain, among other things, various affirmative and negative covenants that may prevent us from engaging in certain transactions that might otherwise be considered beneficial to us. The covenants limit, among other things, our and our subsidiaries’ ability to:
•Incur additional indebtedness (including guarantee obligations);
•Create liens on assets;
•Engage in certain transactions with affiliates;
•Enter into sale-leaseback transactions;
•Engage in mergers, liquidations, and dissolutions;
•Sell assets;
•Pay dividends, distributions, and other payments in respect of our capital stock;
•Purchase our capital stock in the open market;
•Make investments, loans, or advances;
•Repay indebtedness or amend the agreements relating thereto;
•Create restrictions on our ability to receive distributions from subsidiaries; and
•Change our lines of business.
Our Bank Credit Facilities require us to maintain a leverage ratio. This covenant may require us to take actions to reduce our indebtedness or act in a manner contrary to our strategic plan and business objectives. In addition, events beyond our control, including changes in general economic and business conditions, may affect our ability to satisfy this covenant. A breach of this covenant could result in a default of our indebtedness. If we breach certain affirmative covenants or the negative covenant contained in our Bank Credit Facilities, then, immediately upon notice from the applicable administrative agent, an event of default will have occurred and the lenders could elect to declare all amounts outstanding thereunder, together with accrued interest, immediately due and payable. If we breach any of the other affirmative covenants contained in our Bank Credit Facilities, and such breach continues unremedied for 30 days after receipt of notice thereof, then an event of default will have occurred and the lenders party thereto could elect to declare all amounts outstanding thereunder, together with accrued interest, immediately due and payable. Any such declaration would also result in an event of default under our Senior Indenture governing our various senior notes. For additional information, see Financial Condition, Liquidity and Capital Resources in Part II, Item 7. Management’s Discussion and Analysis of Financial Condition and Results of Operations and Note 6 in Part II, Item 8. Financial Statements and Supplementary Data. If we lost the ability to use surety bonding to support our preneed activities, we may be required to make material cash payments to fund certain trust funds.
We have entered into arrangements with certain surety companies whereby such companies agree to issue surety bonds on our behalf as financial assurance or as required by existing state and local regulations. The surety bonds are used for various business purposes; however, the majority of the surety bonds issued and outstanding have been issued to support our preneed funeral and cemetery activities. In the event all of the surety companies canceled or did not renew our surety bonds, which generally have twelve-month renewal periods, we would be required to either obtain replacement coverage or fund approximately $128.8 million into state-mandated trust accounts as of December 31, 2022. There can be no assurance that we would be able to obtain replacement coverage at a similar cost or at all.
Increasing death benefits related to preneed contracts funded through life insurance or annuity contracts may not cover future increases in the cost of providing a price-guaranteed service.
We sell price-guaranteed preneed contracts through various programs providing for future services at prices prevailing when the agreements are signed. For preneed contracts funded through life insurance or annuity contracts, we receive in cash a general agency commission from a third-party insurance company that typically averages approximately 25% of the total sale. Additionally, we receive an increasing death benefit associated with the contract of approximately 1% per year in cash at the time the service is performed. There is no guarantee that the increasing death benefit will cover future increases in the cost of providing a price-guaranteed service and merchandise, and any such excess cost could be materially adverse to our financial condition, results of operations, and cash flows.
The financial condition of third-party insurance companies that fund our preneed contracts may impact our future revenue.
Where permitted by state law, customers may arrange their preneed contract by purchasing a life insurance or annuity policy from third-party insurance companies. The customer/policy holder assigns the policy benefits to us as payment for their preneed contract at the time of need. If the financial condition of the third-party insurance companies were to deteriorate materially because of market conditions, strategic transactions, or otherwise, there could be an adverse effect on our ability to collect all or part of the proceeds of the life insurance policy, including the annual increase in the death benefit, if we fulfill the preneed contract at the time of need. Failure to collect such proceeds could have a material adverse effect on our financial condition, results of operations, and cash flows.
Unfavorable publicity could affect our reputation and business.
Since our operations relate to life events involving emotional stress for our client families, our business is dependent on customer trust and confidence. Unfavorable publicity about our business generally or in relation to any specific location could affect our reputation and customers’ trust and confidence in our products and services, thereby having an adverse impact upon our sales and financial results.
16 Service Corporation International
Our failure to attract and retain qualified sales personnel could have an adverse effect on our business and financial condition.
Our ability to attract and retain a qualified sales force and other personnel is an important factor in achieving future success. Buying cemetery and funeral home products and services, especially at-need products and services, is very emotional for most customers, so our sales force must be particularly sensitive to our customers’ needs. We cannot give assurance that we will be successful in our efforts to attract and retain a skilled sales force. If we are unable to maintain a qualified and productive sales force, our revenues may decline and our cash available for distribution may decrease.
We use a combination of insurance, self-insurance, and large deductibles in managing our exposure to certain inherent risks; therefore, we could be exposed to unexpected costs that could negatively affect our financial performance.
Our insurance coverage is subject to deductibles, self-insured retentions, limits of liability, and similar provisions that we believe are prudent based on our operations. Because we self-insure a significant portion of expected losses under our workers' compensation, auto, and general and professional liability insurance programs, unanticipated changes in any applicable actuarial assumptions, trends and interpretations, or management estimates underlying our recorded liabilities for these losses, including potential increases in costs, could result in materially different amounts of expense than expected under these programs. These unanticipated changes could have a material adverse effect on our financial condition, results of operations, and cash flows.
Declines in overall economic conditions beyond our control could reduce future potential earnings and cash flows and could result in future impairments to goodwill and/or other intangible assets.
In addition to an annual review, we assess the impairment of goodwill and/or other intangible assets whenever events or changes in circumstances indicate that the carrying value may be greater than fair value. Factors that could trigger an interim impairment review include, but are not limited to, a significant decline in our stock price, significant underperformance relative to historical or projected future operating results, and significant negative industry or economic trends. If any of these factors occur, we may have a triggering event, which could result in an impairment of our goodwill and/or other intangible assets. If economic conditions worsen causing deterioration in our operating revenue, operating margins, and cash flows, we may have a triggering event that could result in an impairment of our goodwill and/or other intangible assets. Our cemetery segment, which has a goodwill balance of $342.0 million as of December 31, 2022, is more sensitive to market conditions and goodwill impairments because it is more reliant on preneed sales, which are impacted by customer discretionary spending. For additional information, see Critical Accounting Policies, Recent Accounting Pronouncements, and Accounting Changes in Part II, Item 7. Management’s Discussion and Analysis of Financial Condition and Results of Operations. Any failure to maintain the security of the information relating to our customers, their loved ones, our associates, and our vendors could damage our reputation, could cause us to incur substantial additional costs and to become subject to litigation, and could adversely affect our operating results, financial condition, or cash flow.
In the ordinary course of our business, we and our vendors receive and retain certain personal information, in both physical and electronic formats, about our customers, their loved ones, our associates, and our vendors, and there is an expectation that we will adequately protect that information. In addition, our online operations at our websites depend upon the secure transmission of confidential information over public networks, including information permitting electronic payments. The U.S. regulatory environment surrounding information security and privacy is increasingly demanding. New laws and regulations governing data privacy, security, cybersecurity, and the unauthorized disclosure of confidential information, including recent legislation in California, other states, and Canadian provinces, pose increasingly complex compliance challenges and potentially elevate our costs. Any failure by us to comply with these laws and regulations, including as a result of a security or privacy breach, could result in significant penalties and liabilities for us. A significant theft, loss, or fraudulent use of the personally identifiable information we maintain or failure of our vendors to use or maintain such data in accordance with contractual provisions could result in significant costs, fines, and litigation. Additionally, if we acquire a company that has violated or is not in compliance with applicable data protection laws, we may incur significant liabilities and penalties as a result.
We maintain substantial security measures and data backup systems to protect, store, and prevent unauthorized access to such information. Nevertheless, it is possible that computer hackers and others (through cyberattacks, which are rapidly evolving and becoming increasingly sophisticated, or by other means) might defeat our security measures in the future and obtain the personal information of customers, their loved ones, our associates, and our vendors that we hold. Further, our associates, contractors, or third parties with whom we do business may attempt to circumvent our security measures to misappropriate such information and may purposefully or inadvertently cause a breach, corruption, or data loss involving such information. A breach of our security measures or failure in our backup systems could adversely affect our reputation with our customers and their loved ones, our associates, and our vendors; as well as our operations, results of operations, financial condition, and cash flows; and could result in litigation against us or the imposition of penalties. Moreover, a security breach could require that we expend significant additional resources to upgrade further the security measures that we employ to guard such important personal information against cyberattacks and other attempts to access such information and could result in a disruption of our operations.
Our Canadian business exposes us to operational, economic, and currency risks.
Our Canadian operations represent a significant portion of our revenue. Our ability to successfully conduct operations in Canada is affected by many of the same risks we face in our U.S. operations, as well as unique costs and difficulties of managing Canadian operations. Our Canadian operations may be adversely affected by local laws, customs, and regulations, as well as political and economic conditions. Significant fluctuations in exchange rates between the U.S. dollar and the Canadian dollar may adversely affect our results of operations and cash flows.
Our level of indebtedness could adversely affect our ability to raise additional capital to fund our operations, limit our ability to react to changes in the economy or our industry, and may prevent us from fulfilling our obligations under our indebtedness.
We have a significant amount of indebtedness, which could have important consequences, including the following:
•It may limit our ability to obtain additional debt or equity financing for working capital, capital expenditures, acquisitions, debt service requirements, and general corporate or other purposes.
•A portion of our cash flows from operations will be dedicated to the payment of principal and interest on our indebtedness, including indebtedness we may incur in the future, and may not be available for other purposes, including to finance our working capital, capital expenditures, acquisitions, and general corporate costs or other purposes.
•It could limit our flexibility in planning for, or reacting to, changes in our business and the industry in which we operate and place us at a competitive disadvantage compared to our competitors that have less debt.
•It could make us more vulnerable to downturns in general economic or industry conditions or in our business, or prevent us from carrying out activities that are important to our growth.
•It could increase our interest expense if interest rates in general increase because a portion of our indebtedness, including all of our indebtedness under our Bank Credit Facilities, bears interest at floating rates.
•It could make it more difficult for us to satisfy our obligations with respect to our indebtedness, and any failure to comply with the obligations of any of our debt instruments, including any financial and other restrictive covenants, could result in an event of default under the agreements governing our other indebtedness which, if not cured or waived, could result in the acceleration of our indebtedness.
Any of the above listed factors could materially affect our business, financial condition, results of operations, and cash flows.
In addition to our high level of indebtedness, we also have significant rental and other obligations under our operating and finance leases for funeral service locations, cemetery operating and maintenance equipment, and transportation equipment. These obligations could further increase the risks described above.
A failure of a key information technology system or process could disrupt and adversely affect our business.
We rely extensively on information technology systems, some of which are managed or provided by third-party service providers, to analyze, process, store, manage, and protect transactions and data. In managing our business, we also rely heavily on the integrity of, security of, and consistent access to this data for information such as sales, merchandise ordering, inventory replenishment, and order fulfillment. For these information technology systems and processes to operate effectively, we or our service providers must periodically maintain and update them. Our systems and the third-party systems on which we rely are subject to damage or interruption from a number of causes, including power outages; computer and telecommunications failures; computer viruses; security breaches; cyber-attacks, including the use of ransomware; catastrophic events such as fires, floods, earthquakes, tornadoes, or hurricanes; acts of war or terrorism; and design or usage errors by our associates, contractors, or third-party service providers. Although we and our third-party service providers seek to maintain our respective systems effectively and to successfully address the risk of compromise of the integrity, security, and consistent operations of these systems, such efforts may not be successful. As a result, we or our service providers could experience errors, interruptions, delays, or cessations of service in key portions of our information technology infrastructure, which could significantly disrupt our operations and be costly, time consuming, and resource-intensive to remedy.
Failure to maintain effective internal control over financial reporting could adversely affect our results of operations, investor confidence, and our stock price.
The accuracy of our financial reporting depends on the effectiveness of our internal control over financial reporting. Internal control over financial reporting can provide only reasonable assurance with respect to the preparation and fair presentation of financial statements and may not prevent or detect misstatements because of its inherent limitations. If we do not maintain effective internal control over financial reporting or implement controls sufficient to provide reasonable assurance with respect to the preparation and fair presentation of our financial statements, we could be unable to file accurate financial reports on a timely basis, and our results of operations, investor confidence, and stock price could be materially adversely affected.
18 Service Corporation International
Risks Related to Our Industry
The funeral and cemetery industry is competitive.
In North America, the funeral and cemetery industry is characterized by a large number of locally-owned, independent operations. To compete successfully, our funeral service locations and cemeteries must maintain good reputations and high professional standards, as well as offer attractive products and services at competitive prices. In addition, we must market ourselves in such a manner as to distinguish us from our competitors. We have historically experienced price competition from independent funeral service location and cemetery operators, monument dealers, casket retailers, low-cost funeral providers, and other nontraditional providers of merchandise and services. If we are unable to successfully compete, our financial condition, results of operations, and cash flows could be materially adversely affected.
If the number of deaths in our markets declines, our cash flows and revenue may decrease. Changes in the number of deaths are not predictable from market to market or over the short term.
If the number of deaths in our markets declines, the number of funeral services and interments performed by us could decrease and our financial condition, results of operations, and cash flows could be materially adversely affected. Changes in the number of deaths may vary from quarter to quarter and across local markets, and those variations are not predictable. Variations in the death rate and seasonality of deaths throughout each year may also cause revenue to fluctuate between quarters or years.
If we are not able to respond effectively to changing consumer preferences, our market share, revenue, and/or profitability could decrease.
Future market share, revenue, and profit will depend in part on our ability to anticipate, identify, and respond to changing consumer preferences. We may not correctly anticipate or identify trends in consumer preferences, or we may identify them later than our competitors do. In addition, any strategies we may implement to address these trends may prove incorrect or ineffective.
The continuing upward trend in the number of cremations performed in North America could result in lower revenue, operating profit, and cash flows.
There is a continuing upward trend in the number of cremations performed in North America as an alternative to traditional funeral service dispositions. In our operations during 2022, 61.1% of the comparable services we performed were cremation cases compared to 59.2% and 58.6% performed in 2021 and 2020, respectively. Our average revenue for cremations is lower than that for traditional burials. If we are unable to continue to expand our cremation memorialization products and services, and cremations remain or increase as a significant percentage of our services, our financial condition, results of operations, and cash flows could be materially adversely affected.
Our funeral and cemetery businesses are high fixed-cost businesses.
The majority of our operations are managed in groups we call “markets”. Markets are geographical groups of funeral service locations and cemeteries that share common resources such as operating personnel, preparation services, clerical staff, motor vehicles, and preneed sales personnel. We must incur many of these costs, which may be impacted by many factors, including inflation, regardless of the number of services or interments performed. Because we cannot immediately decrease these costs when we experience lower sales volumes, a sales decline may cause our margin percentages to decline at a greater rate than the decline in revenue.
Risks associated with our supply chain could materially adversely affect our financial performance.
We are dependent on our supply chain to supply merchandise to our funeral home and cemetery locations. If our fulfillment network does not operate properly, if a supplier fails to deliver on its commitments, or if delivery networks have difficulty providing capacity to meet demands for their services, we could experience merchandise delivery delays or increased delivery costs, which could lead to lost sales and decreased customer confidence, and adversely affect our results of operations. Changes in the costs of procuring commodities used in our merchandise or the costs related to our supply chain, due to inflation or other matters, could adversely affect our results of operations.
Regulatory and Legal Risks
Regulation and compliance could have a material adverse impact on our financial results.
Our operations are subject to regulation, supervision, and licensing requirements under numerous foreign, federal, state, and local laws, ordinances, and regulations, including extensive regulations concerning trust funds, preneed sales of funeral and cemetery merchandise and services, and various other aspects of our business. For example, the funeral industry is regulated at the federal level by the FTC, which requires funeral service locations to take actions designed to protect consumers. State law regulates preneed sales and imposes licensing requirements. Accordingly, we are subject to financial and compliance audits of preneed sales practices and state trust funds. Our facilities are also subject to stringent health, safety, and environmental regulations. In particular, cremation and embalming facilities are subject to stringent health and environmental regulations and there are associated risks of investigations from regulatory authorities or incidental non-compliance with such regulations. Our pay practices, including wage and hour overtime pay, are subject to federal and state regulations. Violations of applicable laws could result in fines or sanctions against us.
In addition, from time to time, governments and agencies propose to amend or add regulations or reinterpret existing regulations, which could increase costs and decrease cash flows. For example, foreign, federal, state, local, and other regulatory agencies have considered and may enact additional legislation or regulations that could affect the deathcare industry. These include regulations that require more liberal refund and cancellation policies for preneed sales of products and services, limit or eliminate our ability to use surety bonding, require the escheatment of trust funds, increase trust requirements, require the deposit of funds or collateral to offset unrealized losses of trusts, and/or prohibit the common ownership of funeral service locations and cemeteries in the same market. Similarly, more stringent permitting or other environmental regulations, if adopted, could increase our costs. If adopted by the regulatory authorities of the jurisdictions in which we operate, these and other possible proposals could have a material adverse effect on our financial condition, results of operations, and cash flows.
Compliance with laws, regulations, industry standards, and customs concerning burial procedures and the handling and care of human remains is critical to the continued success of our business and any operations we may acquire. Litigation and regulatory proceedings regarding these issues could have a material adverse effect on our financial condition, results of operations, and cash flows.
Unfavorable results of litigation could have a material adverse impact on our financial statements.
As discussed in Note 9 of Part II, Item 8. Financial Statements and Supplementary Data, we are subject to a variety of claims and lawsuits in the ordinary course of our business. Adverse outcomes in some or all of the pending cases may result in significant monetary damages or injunctive relief against us, as litigation and other claims are subject to inherent uncertainties. Any such adverse outcomes, in pending cases or other lawsuits that may arise in the future, could have a material adverse impact on our financial position, results of operations, and cash flows. Cemetery burial practice claims could have a material adverse impact on our financial results.
Most of our cemeteries have been operating for decades and, therefore, may have used practices and procedures that are outdated in comparison to today's standards. When cemetery disputes occur, we may be subjected to litigation and liability for improper burial practices, including (1) burial practices of a different era that are judged today in hindsight as being outdated and (2) alleged violations of our practices and procedures by one or more of our associates. In addition, since most of our cemeteries were acquired through various acquisitions, we may be subject to litigation and liability based upon actions or events that occurred before we acquired or managed the cemeteries. Claims or litigation based upon our cemetery burial practices could have a material adverse impact on our financial condition, results of operations, and cash flows.
The application of unclaimed property laws by certain states to our preneed funeral and cemetery backlog could have a material adverse impact on our liquidity, cash flows, and financial results.
In the ordinary course, our businesses have sold preneed funeral and cemetery contracts for decades. To the extent these contracts will not be funded with the assignment of the proceeds of life insurance policies, depending on applicable state laws, we could be responsible for escheatment of the portion of the funds paid that relate to contracts which we are unlikely to fulfill. For additional information, see Unclaimed Property Audit in Note 9 in Item 8, Part II of this Form 10-K. The application of unclaimed property laws could have a material adverse effect on our liquidity, cash flows, and financial results. Changes in taxation as well as the inherent difficulty in quantifying potential tax effects of business decisions could have a material adverse effect on the results of our operations, financial condition, or cash flows.
We make judgments regarding the utilization of existing income tax credits and the potential tax effects of various financial transactions and results of operations to estimate our obligations to taxing authorities. Tax obligations include income, franchise, real estate, sales and use, and employment-related taxes. These judgments include reserves for potential adverse outcomes regarding tax positions that have been taken. Changes in federal, state, or local tax laws, adverse tax audit results, or adverse tax rulings on positions taken could have a material adverse effect on the results of our operations, financial condition, or cash flows.
Item 1B. Unresolved Staff Comments
None.
Item 2. Properties
Information regarding properties is set forth in Part I, Item 1. Business.
Item 3. Legal Proceedings
Information regarding legal proceedings is set forth in Note 9 of Part II, Item 8. Financial Statements and Supplementary Data. Item 4. Mine Safety Disclosures
Not applicable.
20 Service Corporation International
Item 5. Market for Registrant's Common Equity, Related Stockholder Matters, and Issuer Purchases of Equity Securities
Our common stock has been traded on the New York Stock Exchange since May 14, 1974. On December 31, 2022, there were 3,214 holders of record of our common stock. In calculating the number of stockholders, we consider clearing agencies and security position listings as one stockholder for each agency or listing. At December 31, 2022, we had 153,940,365 shares outstanding, net of 2,148,073 treasury shares.
Our common stock is traded on the New York Stock Exchange under the symbol SCI.
The following graph assumes the total return on $100 invested on December 31, 2017, in SCI Common Stock, the S&P 500 Index, the S&P MidCap 400 Index, and a peer group selected by the Company (the “Peer Group”). The Peer Group comprises Carriage Services, Inc., Hillenbrand Inc., Matthews International Corp., and Park Lawn Corporation. Total return data assumes reinvestment of dividends.
Total Stockholder Return
Indexed Returns
For equity compensation plan information, see Part III of this Form 10-K.
The following table summarizes our share repurchases during the three months ended December 31, 2022:
| | | | | | | | | | | | | | | | | | | | | | | | | | |
| Period | | Total Number of
Shares Purchased | | Average Price
Paid per Share | | Total Number of Shares Purchased as Part of Publicly Announced Programs (2) | | Approximate Dollar Value of Shares That May Yet be Purchased Under the Program (2) |
| October 1, 2022 — October 31, 2022 | | 858,375 | | | $ | 60.09 | | | 858,375 | | | $ | 256,321,857 | |
| November 1, 2022 — November 30, 2022 | | 121,933 | | | $ | 61.51 | | | 121,933 | | | 599,250,036 | |
December 1, 2022 — December 31, 2022 (1) | | 223,791 | | | $ | 69.19 | | | 216,932 | | | 584,239,887 | |
| | 1,204,099 | | | | | 1,197,240 | | | |
(1) Includes 6,859 shares purchased in December 2022 in connection with the surrender of shares by associates to satisfy certain tax withholding obligations under compensation plans. These repurchases were not part of our publicly announced program and do not affect our share repurchase program.
(2) On November 2, 2022 we announced that our Board of Directors increased our share repurchase authorization to $600.0 million.
Item 6. [Reserved]
Item 7. Management’s Discussion and Analysis of Financial Condition and Results of Operations
The Company
We are North America’s largest provider of deathcare products and services, with a network of funeral service locations and cemeteries unequaled in geographic scale and reach, serving more than 600,000 families each year. At December 31, 2022, we operated 1,474 funeral service locations and 490 cemeteries (including 303 funeral service/cemetery combination locations), which are geographically diversified across 44 states, eight Canadian provinces, the District of Columbia, and Puerto Rico. Our funeral and cemetery operations consist of funeral service locations, cemeteries, funeral service/cemetery combination locations, crematoria, and other related businesses, which enable us to serve a wide array of customer needs. We sell cemetery property and funeral and cemetery merchandise and services at the time of need and on a preneed basis. Our Dignity Memorial® brand is the name families turn to for professionalism, compassion, and attention to detail that is second to none.
Our financial position is enhanced by our $13.7 billion backlog of future revenue from both trust and insurance-funded preneed sales at December 31, 2022. Preneed selling provides us with a strategic opportunity to gain future market share. We also believe it adds to the stability and predictability of our revenue and cash flows. While revenue on the majority of preneed merchandise and service sales is deferred until the time of need, sales of preneed cemetery property provide opportunities for full current revenue recognition to the extent that the property is developed and available for use. We have adequate liquidity and a favorable debt maturity profile, which allow us to return capital to shareholders.
Factors affecting our operating results include: demographic trends in terms of population growth and average age, which impact death rates and number of deaths; establishing and maintaining leading market share positions supported by strong local heritage and relationships; effectively responding to increasing cremation trends by selling complementary services and merchandise; controlling salary and merchandise costs; and exercising pricing leverage related to our atneed revenue. The average revenue per funeral contract is influenced by the mix of traditional and cremation services because our average revenue for cremations is lower than that for traditional burials. To further enhance revenue opportunities, we continue to focus on our cremation customer’s preferences and remaining relevant by developing additional memorialization merchandise and services that specifically appeal to cremation customers. We believe the presentation of these additional merchandise and services through our customer-facing technology enhances our customer’s experience by reducing administrative burdens and allowing them to visualize the product offerings and services, which will help drive increases in the average revenue for a cremation in future periods.
Recent Trends
Like most businesses worldwide, COVID-19 is still directly and indirectly impacting various aspects of our business operations; however, we cannot, with certainty, predict the scope, severity, or duration with which COVID-19 will continue to impact our business, financial condition, results of operations, and cash flows.
In 2022, we continued to experience the impact of COVID-19 variants. However, we have also seen an increase in the number of families who desire memorial services, which has driven significant growth in our preneed sales as well as positively affected our average revenue per funeral service. We view this as further evidence that our customers continue to value what our team does best, which is helping our client families gain closure and healing through the process of grieving, remembrance, and celebration.
22 Service Corporation International
For further discussion of our key operating metrics, see our "Cash Flow" and “Results of Operations” sections below. For a discussion of our results of operations and liquidity and capital resources for the fiscal year ended December 31, 2020, see Management’s Discussion and Analysis of Financial Condition, Liquidity and Capital Resources and Results of Operations in Part II, Item 7 of our Annual Report on Form 10-K for the fiscal year December 31, 2021, filed with the Securities and Exchange Commission on February 15, 2022. Financial Condition, Liquidity, and Capital Resources
Capital Allocation Considerations
We rely on cash flow from operations as a significant source of liquidity. Our cash flow from operating activities provided $825.7 million in 2022. In addition, as of December 31, 2022, we have $396.5 million in borrowing capacity under our revolving credit facility. As of December 31, 2022, we had $90.7 million in current maturities of long-term debt, which primarily consist of the current amounts due on our term loan and finance leases.
At December 31, 2022, our bank credit agreement require us to maintain certain leverage and interest coverage ratios. As of December 31, 2022, we were in compliance with our debt covenants. Our leverage ratio has recently benefited from the strong earnings associated with the increase in funeral services performed throughout the COVID-19 pandemic; however, as these impacts subside in future years, we expect leverage to return to our 3.5 to 4.0x target leverage range.
Our financial covenant requirements and actual ratios as of December 31, 2022 are as follows:
| | | | | | | | | | | |
| | Per Credit Agreement | | Actual |
| Leverage ratio | 4.75 (Max) | | 3.24 | |
| Interest coverage ratio | 3.00 (Min) | | 7.83 | |
Subsequent to December 31, 2022, we entered into a new bank credit agreement, expanding our borrowing capacity to $1.5 billion and removing the requirement for an interest coverage ratio. Additionally, the leverage ratio maximum was increased to 5.0x. For more information see Note 6 in Part II, Item 8. Financial Statements and Supplementary Data. We have the financial strength and flexibility to reward shareholders with dividends while maintaining a prudent capital structure and pursuing new opportunities for profitable growth.
Our unencumbered cash on hand, future operating cash flows, and the available capacity under our Bank Credit Facilities will give us adequate liquidity to meet our short-term needs as well as our long-term financial obligations. Due to cash balances residing in Canada and minimum operating cash requirements, a portion of our cash on hand is encumbered.
We consistently evaluate the best uses of our cash flow that will yield the highest value and return on capital. Our capital investment strategy is prioritized as follows:
Investing in Acquisitions and Building New Funeral Service and Cemetery Locations. We manage our footprint by focusing on strategic acquisitions and building new funeral service locations where the expected returns are attractive and exceed our weighted average cost of capital by a meaningful margin. We target businesses with favorable customer dynamics and/or where we can achieve additional economies of scale. We continue to pursue strategic acquisitions and build new funeral service locations in areas that provide us with the potential for scale. We invested $102.6 million acquiring 18 funeral service locations and 3 cemeteries, which included 3 combination locations, during 2022.
Managing Debt. We may seek to make open market debt repurchases when it is opportunistic to do so relative to other capital deployment opportunities and to manage our near-term debt maturity profile. We have a relatively consistent annual cash flow stream that is generally resistant to down economic cycles. This cash flow stream and our significant liquidity are available to substantially reduce our long-term debt maturities should we choose to do so. In January 2023, we entered into a new bank credit agreement that consists of a $675.0 million term loan due January 2028 and a revolving credit facility due January 2028 providing for borrowings of up to $1.5 billion. Proceeds from this new bank credit agreement were used to settle our existing Term Loan due May 2024 and Bank Credit Facility due May 2024. The new bank credit agreement provides us with flexibility for incremental liquidity, capital investment, working capital, and other general corporate purposes.
Return Excess Cash to Shareholders. Absent strategic acquisition or new opportunities, we intend to return excess cash to shareholders. Our quarterly dividend rate has steadily grown from $0.025 per common share in 2005 to $0.27 per common share at the end of 2022. We target a payout ratio of 30% to 40% of after tax earnings excluding special items and intend to grow our cash dividend commensurate with the growth in our business. While we intend to pay regular quarterly cash dividends for the foreseeable future, all future dividends are subject to limitations in our debt covenants and final determination by our Board of Directors each quarter upon review of our financial performance.
Cash Flow
Our ability to generate strong operating cash flow is one of our fundamental financial strengths and provides us with substantial flexibility in meeting operating and investing needs.
Operating Activities
Net cash provided by operating activities was $825.7 million and $920.6 million for the years ended December 31, 2022, and 2021, respectively. Excluding a $8.3 million cash receipt from a vendor waiver and release agreement in the prior year, cash flow from operations decreased $86.6 million for 2022 versus 2021. This expected decrease in operating cash flow is primarily due to $183.6 million in lower operating income (excluding the impact certain significant items) as the prior year was positively impacted by the more pronounced effects of the COVID-19 pandemic.
The 2022 decrease in operating cash flows over 2021 is primarily due to the following:
•a $140.9 million increase in vendor and other payments,
•a $78.8 million increase in employee compensation payments, and
•a $22.1 million increase in cash interest payments, partially offset by
•a $86.0 million decrease in cash tax payments,
•a $37.2 million increase in cash receipts from customers,
•a $16.1 million increase in net trust withdrawals, and
•a $15.9 million increase in General Agency (GA) commission and other receipts.
Investing Activities
Cash flows from investing activities used $447.9 million, and $414.9 million, in 2022, and 2021, respectively. The $33.0 million increased outflow from 2022 over 2021 is primarily due to the following:
•a $66.0 million increase in capital expenditures:
•a $26.2 million increase in expenditures for capital improvements at existing field locations,
•a $29.2 million increase in expenditures for cemetery property development,
•a $19.0 million increase in expenditures for digital investments and corporate,
•a $8.4 million decrease in expenditures for growth capital expenditures/construction of new funeral service locations; partially offset by
•a $18.8 million decrease in cash spent on business acquisitions,
•a $9.5 million decrease in cash spent on real estate acquisitions,
•a $2.0 million decrease in payments for Company-owned life insurance policies, net of proceeds,
•a $1.4 million increase in cash receipts from divestitures and asset sales, and
•a $1.3 million increase in proceeds from sale of investments and other.
Financing Activities
Financing activities used $448.0 million in 2022 compared to using $465.6 million in 2021. The $17.6 million decreased outflow from 2022 over 2021 is primarily due to:
•a $155.3 million decrease in debt payments, net of proceeds, partially offset by
•a $106.5 million increase in the purchase of Company common stock,
•a $13.1 million increase in payments of dividends,
•a $11.5 million decrease in proceeds from exercises of stock options, and
•a $6.6 million change in bank overdrafts and other.
Material Cash Requirements
Our material cash requirements include the following contractual and other obligations.
Debt & Finance Leases
As of December 31, 2022, we had $4.3 billion in aggregate principal outstanding on our notes, term loan, revolving credit facility, finance leases, mortgages, and other debt (collectively "debt and finance leases"), of which $90.7 million is payable in the next twelve months. The aggregate principal excludes $39.9 million in unamortized non-cash debt issuance costs and
24 Service Corporation International
original issuance discounts and premiums. Future interest payments associated with the debt and finance leases total $1,011.6 million, of which $202.9 million is payable in the next twelve months. For further information on our debt and finance leases see Note 6 and Note 8 of Part II, Item 8. Financial Statements and Supplementary Data. Operating Leases
We have operating lease agreements for funeral service real estate and office equipment for funeral service locations, cemetery locations, and administrative offices. As of December 31, 2022, we had fixed lease payment obligations of $68.8 million, of which $9.0 million is payable in the next twelve months. See Note 8 in Part II, Item 8. Financial Statements and Supplementary Data for additional details related to our leases. Financial Assurances
In support of our operations, we have entered into arrangements with certain surety companies whereby such companies agree to issue surety bonds on our behalf as financial assurance and/or as required by existing state and local regulations. The surety bonds are used for various business purposes; however, the majority of the surety bonds issued and outstanding have been used to support our preneed sales activities. The obligations underlying these surety bonds are recorded on our Consolidated Balance Sheet as Deferred revenue, net. The breakdown of surety bonds between funeral and cemetery preneed arrangements, as well as surety bonds for other activities, is described below.
| | | | | | | | | | | |
| Years Ended December 31, |
| 2022 | | 2021 |
| | (In millions) |
| Preneed funeral | $ | 68.4 | | | $ | 89.2 | |
| Preneed cemetery: | | | |
| Merchandise and services | 141.5 | | | 147.0 | |
| Pre-construction | 42.5 | | | 24.8 | |
| Bonds supporting preneed funeral and cemetery obligations | 252.4 | | | 261.0 | |
| Bonds supporting preneed business permits | 7.1 | | | 7.0 | |
| Other bonds | 23.9 | | | 20.4 | |
| Total surety bonds outstanding | $ | 283.4 | | | $ | 288.4 | |
When selling preneed contracts, we may post surety bonds where allowed by state law. We post the surety bonds in lieu of trusting a certain amount of funds received from the customer. The amount of the bond posted is generally determined by the total amount of the preneed contract that would otherwise be required to be trusted, in accordance with applicable state law.
Surety bond premiums are paid annually and the bonds are automatically renewable until maturity of the underlying preneed contracts, unless we are given prior notice of cancellation.
Except for cemetery pre-construction bonds (which are irrevocable), the surety companies generally have the right to cancel the surety bonds at any time with appropriate notice. In the event a surety company were to cancel the surety bond, we are required to obtain replacement surety assurance from another surety company or fund a trust for an amount generally less than the posted bond amount. Management does not expect that we will be required to fund material future amounts related to these surety bonds due to a lack of surety capacity or surety company non-performance.
Preneed Activities and Backlog of Contracts
In addition to selling our products and services to client families at the time of need, we enter into price-guaranteed preneed contracts, which provide for future funeral or cemetery merchandise and services. Because preneed funeral and cemetery merchandise or services will generally not be provided until sometime in the future, most states and provinces require that all or a portion of the funds collected from customers on preneed contracts be deposited into merchandise and service trusts until the merchandise is delivered or the service is performed. In certain situations, as described above, where permitted by state or provincial laws, we may post a surety bond as financial assurance for a certain amount of the preneed contract in lieu of placing funds into trust accounts. Alternatively, we may sell a life insurance or annuity policy from third-party insurance companies.
Insurance-Funded Preneed Contracts
Where permitted by state or provincial law, we may sell a life insurance or annuity policy from third-party insurance companies, for which we earn a commission as general sales agent for the insurance company. These general agency commissions (GA revenue) are based on a percentage per contract sold and are recognized as funeral revenue when the insurance purchase transaction between the preneed purchaser and third-party insurance provider is completed. All selling costs incurred pursuant to the sale of insurance-funded preneed contracts are expensed as incurred. We do not reflect the unfulfilled insurance-funded preneed contract amounts in our Consolidated Balance Sheet. The proceeds of the life insurance policies or annuity contracts will be reflected in funeral revenue as we perform these funerals.
The table below details our results of insurance-funded preneed production and maturities.
| | | | | | | | | | | |
| Years Ended December 31, |
| 2022 | | 2021 |
| (Dollars in millions) |
| Preneed insurance-funded: | | | |
Sales production(1) | $ | 664.6 | | | $ | 636.9 | |
Sales production (number of contracts) (1) | 107,553 | | | 107,191 | |
| General agency revenue | $ | 164.3 | | | $ | 157.4 | |
| Maturities | $ | 397.8 | | | $ | 392.9 | |
| Maturities (number of contracts) | 64,962 | | | 65,812 | |
(1) Amounts are not included in our Consolidated Balance Sheet.
Trust-Funded Preneed Contracts
The funds collected from customers and required by state or provincial law are deposited into trusts. We retain any funds above the amounts required to be deposited into trust accounts and use them for working capital purposes, generally to offset the selling and administrative costs of our preneed programs. Although this represents cash flow to us, the associated revenues are deferred until the merchandise is delivered or services are performed (typically at maturity). The funds in trust are then invested by professional money managers with oversight by independent trustees in accordance with state and provincial laws.
The tables below detail our results of preneed production and maturities, excluding insurance contracts, for the years ended December 31, 2022 and 2021.
| | | | | | | | | | | |
| Years Ended December 31, |
| | 2022 | | 2021 |
| | (Dollars in millions) |
| Funeral: | | | |
| Preneed trust-funded (including bonded): | | | |
| Sales production | $ | 506.2 | | | $ | 451.0 | |
| Sales production (number of contracts) | 125,457 | | | 116,654 | |
| Maturities | $ | 353.1 | | | $ | 352.4 | |
| Maturities (number of contracts) | 84,392 | | | 83,846 | |
| Cemetery: | | | |
| Sales production: | | | |
| Preneed | $ | 1,376.7 | | | $ | 1,337.2 | |
| Atneed | 451.1 | | | 494.0 | |
| Total sales production | $ | 1,827.8 | | | $ | 1,831.2 | |
| Sales production deferred to backlog: | | | |
| Preneed | $ | 669.0 | | | $ | 575.8 | |
| Atneed | 315.6 | | | 338.3 | |
| Total sales production deferred to backlog | $ | 984.6 | | | $ | 914.1 | |
| Revenue recognized from backlog: | | | |
| Preneed | $ | 444.1 | | | $ | 348.2 | |
| Atneed | 309.8 | | | 317.7 | |
| Total revenue recognized from backlog | $ | 753.9 | | | $ | 665.9 | |
Backlog of Preneed Contracts
The following table reflects our backlog of trust-funded deferred preneed contract revenue, including amounts related to Deferred receipts held in trust at December 31, 2022 and 2021. Additionally, the table reflects our backlog of unfulfilled insurance-funded contracts (which are not included in our Consolidated Balance Sheet) at December 31, 2022 and 2021. The backlog amounts presented include amounts due from customers for undelivered performance obligations on cancelable preneed contracts to arrive at our total backlog of deferred revenue. The table does not include the backlog associated with businesses that are held for sale.
26 Service Corporation International
The table also reflects our preneed receivables and trust investments associated with the backlog of deferred preneed contract revenue including the amounts due from customers for undelivered performance obligations on cancelable preneed contracts. The table below is meaningful because it sets forth the aggregate amount of future revenue we expect to recognize as a result of preneed sales, as well as the amount of funds associated with this revenue. Because the future revenue exceeds the assets, future revenue will exceed the cash distributions actually received from the associated trusts and future collections from the customer.
| | | | | | | | | | | | | | | | | | | | | | | |
| December 31, 2022 | | December 31, 2021 |
| | Fair Value | | Cost | | Fair Value | | Cost |
| | (In billions) |
| Deferred revenue, net | $ | 1.62 | | | $ | 1.62 | | | $ | 1.53 | | | $ | 1.53 | |
| Amounts due from customers for unfulfilled performance obligations on cancelable preneed contracts | 0.85 | | | 0.85 | | | 0.72 | | | 0.72 | |
| Deferred receipts held in trust | 4.16 | | | 4.12 | | | 4.77 | | | 3.93 | |
| Allowance for cancellation on trust investments | (0.24) | | | (0.23) | | | (0.33) | | | (0.27) | |
| Backlog of trust-funded deferred revenue, net of estimated allowance for cancellation | 6.39 | | | 6.36 | | | 6.69 | | | 5.91 | |
Backlog of insurance-funded revenue (1) | 7.35 | | | 7.35 | | | 6.97 | | | 6.97 | |
| Total backlog of deferred revenue | $ | 13.74 | | | $ | 13.71 | | | $ | 13.66 | | | $ | 12.88 | |
| | | | | | | |
| Preneed receivables, net and trust investments | $ | 5.58 | | | $ | 5.54 | | | $ | 6.02 | | | $ | 5.18 | |
| Amounts due from customers for unfulfilled performance obligations on cancelable preneed contracts | 0.85 | | | 0.85 | | | 0.71 | | | 0.71 | |
| Allowance for cancellation on trust investments | (0.24) | | | (0.23) | | | (0.33) | | | (0.27) | |
| Assets associated with backlog of trust-funded deferred revenue, net of estimated allowance for cancellation | 6.19 | | | 6.16 | | | 6.40 | | | 5.62 | |
Insurance policies associated with insurance-funded deferred revenue (1) | 7.35 | | | 7.35 | | | 6.97 | | | 6.97 | |
| Total assets associated with backlog of preneed revenue | $ | 13.54 | | | $ | 13.51 | | | $ | 13.37 | | | $ | 12.59 | |
| | | | | | | |
(1) Amounts are not included in our Consolidated Balance Sheet.
The fair value of our trust investments was based on a combination of quoted market prices, observable inputs such as interest rates or yield curves and appraisals. As of December 31, 2022, the difference between the backlog and asset market amounts represents $0.19 billion related to contracts for which we have posted surety bonds as financial assurance in lieu of trusting, $1.27 billion collected from customers that were not required to be deposited into trusts, and $0.14 billion in allowable cash distributions from trust assets partially offset by $1.40 billion in amounts due on delivered property and merchandise. As of December 31, 2022, the fair value of the total backlog comprised $3.83 billion related to cemetery contracts and $9.91 billion related to funeral contracts. As of December 31, 2022, the fair value of the assets associated with the backlog of trust-funded deferred revenue comprised $3.82 billion related to cemetery contracts and $2.37 billion related to funeral contracts. As of December 31, 2022, the backlog of insurance-funded contracts of $7.35 billion was equal to the proceeds we expect to receive from the associated insurance policies when the corresponding contract is serviced.
Trust Investments
In addition to selling our products and services to client families at the time of need, we enter into price-guaranteed preneed funeral and cemetery contracts, which provide for future funeral or cemetery merchandise and services. Since preneed funeral and cemetery merchandise or services will generally not be provided until sometime in the future, most states and provinces require that all or a portion of the funds collected from customers on preneed funeral and cemetery contracts be paid into trusts and/or escrow accounts until the merchandise is delivered or the service is performed. Investment earnings associated with the trust investments are expected to mitigate the inflationary costs of providing the preneed funeral and cemetery merchandise and services in the future at the prices that were guaranteed at the time of sale. Also, we are required by state and provincial law to pay a portion of the proceeds from the preneed or atneed sale of cemetery property interment rights into perpetual care trusts. For these investments, the original corpus generally remains in the trust in perpetuity and the earnings or elected distributions are withdrawn as allowed to defray the expenses to maintain the cemetery property. While many states require that net capital gains or losses be retained and added to the corpus, certain states allow the net realized capital gains and losses to be included in the earnings that are distributed. Additionally, some states allow a total return distribution that may contain elements of income, capital appreciation, and principal.
Independent trustees manage and invest the majority of the funds deposited into the funeral and cemetery merchandise and service trusts as well as the cemetery perpetual care trusts. The majority of the trustees are selected based on their respective geographic footprint and qualifications per state and provincial regulations. Most of the trustees engage the same independent investment managers. These trustees, with input from SCI's wholly-owned registered investment advisor,
establish an investment policy that serves as an operating document to guide the investment activities of the trusts including asset allocation and manager selection. The investments are also governed by state and provincial guidelines. All of the trusts seek to control risk and volatility through a combination of asset classes, investment styles, and a diverse mix of investment managers.
Asset allocation is based on the liability structure of each funeral, cemetery, and perpetual care trust. Based on the various criteria set forth in the investment policy, the investment advisor recommends investment managers to the trustees. The primary investment objectives for the funeral and cemetery merchandise and service trusts include 1) preserving capital within acceptable levels of volatility and risk and 2) achieving growth of principal over time sufficient to preserve and increase the purchasing power of the assets. Preneed funeral and cemetery contracts generally take several years to mature; therefore, the funds associated with these contracts are often invested through several market cycles.
Where allowed by state and provincial regulations, the cemetery perpetual care trusts’ primary investment objectives are growth-oriented to provide for a fixed distribution rate from the trusts’ assets. Where such distributions are limited to ordinary income, the cemetery perpetual care trusts’ investment objectives emphasize providing a steady stream of current investment income with some capital appreciation. Both types of distributions are used to provide for the current and future maintenance and beautification of the cemetery properties.
As of December 31, 2022, approximately 94% of our trusts were under the control and custody of four large financial institutions. The U.S. trustees primarily use four managed limited liability companies (LLCs), one for each merchandise and service trust type and two for the cemetery perpetual care trust type, each with an independent trustee as custodian. Each financial institution acting as trustee manages its allocation of trust assets in accordance with the investment policy through the purchase of the appropriate LLCs' units. For those accounts not eligible for participation in the LLCs or where a particular state's regulations contain other investment restrictions, the trustee utilizes institutional mutual funds that comply with our investment policy or with such state restrictions. The U.S. trusts include a modest allocation to alternative investments. These alternative investments are held in vehicles structured as LLCs and are managed by certain trustees. The trusts that are eligible to allocate a portion of their investments to alternative investments purchase units of the respective alternative investment LLCs.
Investment Structures
The managed LLCs use the following structures for investments:
Commingled Funds. These funds allow the trusts to access, at a reduced cost, some of the same investment managers and strategies used elsewhere in the portfolios.
Mutual Funds. The trust funds employ institutional share class mutual funds where operationally or economically efficient. These mutual funds are utilized to invest in various asset classes including U.S. equities, non-U.S. equities, corporate bonds, government bonds, high yield bonds, and commodities, all of which are governed by guidelines outlined in their individual prospectuses.
Separately Managed Accounts. To reduce the costs to the investment portfolios, the trusts utilize separately managed accounts where appropriate.
Asset Classes
Equity investments have historically provided long-term capital appreciation in excess of inflation. The trusts have direct investments in individual equity securities primarily in domestic equity portfolios that include large, mid, and small capitalization companies of different investment styles (i.e., growth and value). The majority of the equity allocation is managed by institutional investment managers that specialize in an objective-specific area of expertise. Our equity securities are exposed to market risk; however, we believe these securities are well-diversified. As of December 31, 2022, the largest single equity position represented less than 1% of the total securities portfolio.
Fixed income investments are intended to preserve principal, provide a source of current income, and reduce overall portfolio volatility. The majority of the fixed income allocation for the trusts is invested in institutional share class mutual funds. Where the trusts have direct investments in individual fixed income securities, these are primarily in government and corporate instruments.
Canadian government fixed income securities are investments in Canadian federal and provincial government instruments. In many cases, regulatory restrictions mandate that the funds from the sales of preneed funeral and cemetery contracts sold in certain Canadian jurisdictions must be invested in these instruments.
Alternative investments serve to provide high rates of return with reduced volatility and lower correlation to publicly-traded securities. These investments are typically longer term in duration and are diversified by strategy, sector, manager, geography, and vintage year. The investments consist of numerous limited partnerships invested in private equity, private market real estate, energy and natural resources, infrastructure, transportation, and private debt including both distressed debt and mezzanine financing. The trustees that have oversight of their respective alternative LLCs work closely with the investment advisor in making all investment decisions.
28 Service Corporation International
Trust Performance
During the year ended December 31, 2022, the Standard and Poor’s 500 Index decreased 18.1% and the Barclay’s Aggregate Index decreased 13.0%. This compares to the SCI trusts that decreased 11.5% during the same year-end period, which exceeded our internal custom benchmarks. The SCI trusts have a diversified allocation of approximately 57% equities, 28% fixed income securities, 10% alternative and other investments with the remaining 5% in money market funds.
Recognized trust fund income (realized and unrealized) related to our preneed trust investments was $143.8 million, $179.7 million, and $129.1 million for the years ended December 31, 2022, 2021, and 2020, respectively. Recognized trust fund income (realized and unrealized) related to our cemetery perpetual care trust investments was $85.1 million, $96.1 million, and $77.8 million for the years ended December 31, 2022, 2021, and 2020, respectively. The decline in recognized trust fund income is primarily due to negative market returns in preneed trust investments and lower distributions from our cemetery perpetual care trust investments in the current year.
SCI, the trustees, and the investment advisor monitor the capital markets and the trusts on an on-going basis. The trustees, with input from the investment advisor, take prudent action as needed to achieve the investment goals and objectives of the trusts.
Results of Operations — Years Ended December 31, 2022 and 2021
Management Summary
In 2022, we reported consolidated net income attributable to common stockholders of $565.3 million ($3.53 per diluted share) compared to net income attributable to common stockholders in 2021 of $802.9 million ($4.72 per diluted share). These results were impacted by certain significant items including:
| | | | | | | | | | | | | |
| Years Ended December 31, | | |
| 2022 | | 2021 | | |
| | (In millions) | | |
| Pre-tax gains on divestitures and impairment charges, net | $ | 10.0 | | | $ | 25.2 | | | |
| Pre-tax losses on early extinguishment of debt, net | $ | (1.2) | | | $ | (5.2) | | | |
| Pre-tax foreign currency exchange loss | $ | (1.5) | | | $ | — | | | |
| Pre-tax income from vendor waiver and release agreement cash receipts | $ | — | | | $ | 8.3 | | | |
| | | | | |
Pre-tax estimate of certain legal matters (1) | $ | (64.6) | | | $ | — | | | |
| Tax effect from significant items | $ | 14.0 | | | $ | (7.3) | | | |
Change in uncertain tax reserves and other (2) | $ | 0.7 | | | $ | 4.0 | | | |
(1) Estimate of certain legal matters relates to an estimate charge of $64.6 million for certain legal matters. During the fourth quarter, we reached an immaterial preliminary settlement in a private litigation matter in Florida and subsequently we engaged in settlement discussions with the California Attorney General. Both matters relate to previously disclosed litigation. Approximately two-thirds of the $64.6 million pretax charge relates to estimated preneed contract refunds in California and Florida. The remainder of the charge includes anticipated reimbursement of California governmental investigative costs and other legal expenses.
(2) See Note 5 in Part II, Item 8. Financial Statements and Supplementary Data, for additional information related to change in uncertain tax reserves and other. In addition to the above items, the decrease over the prior year is due to an expected decline in gross profit primarily due to decreases in COVID-19 related activity combined with higher inflationary costs and lower trust fund income. Additionally, fewer shares outstanding more than offset the impact of higher interest expense.
Funeral Results
| | | | | | | | | | | | | |
| Years Ended December 31, |
| 2022 | | 2021 | | |
| | (Dollars in millions, except average revenue per service) |
| Consolidated funeral revenue | $ | 2,332.0 | | | $ | 2,343.2 | | | |
| Less: revenue associated with acquisitions/new construction | 48.0 | | | 4.5 | | | |
| Less: revenue associated with divestitures | 1.6 | | | 6.6 | | | |
Comparable(1) funeral revenue | 2,282.4 | | | 2,332.1 | | | |
| Less: comparable recognized preneed revenue | 163.0 | | | 159.3 | | | |
| Less: comparable general agency and other revenue | 142.0 | | | 140.4 | | | |
| Adjusted comparable funeral revenue | $ | 1,977.4 | | | $ | 2,032.4 | | | |
| Comparable services performed | 362,565 | | | 380,089 | | | |
Comparable average revenue per service(2) | $ | 5,454 | | | $ | 5,347 | | | |
| | | | | |
| Consolidated funeral gross profit | 545.7 | | | 639.8 | | | |
| Less: gross profit associated with acquisitions/new construction | 6.0 | | | 0.2 | | | |
| Less: gross losses associated with divestitures | (2.2) | | | (3.5) | | | |
Comparable(1) funeral gross profit | $ | 541.9 | | | $ | 643.1 | | | |
(1) We define comparable (or same store) operations as those funeral locations owned by us for the entire period beginning January 1, 2021 and ending December 31, 2022.
(2) We calculate comparable average revenue per service by dividing comparable funeral revenue, excluding general agency revenue, recognized preneed revenue, and other revenue to avoid distorting our average of normal funeral services revenue, by the comparable number of funeral services performed during the period. Recognized preneed revenue is preneed sales of merchandise that are delivered at the time of sale, including memorial merchandise and travel protection, net, and excluded from our calculation of comparable average revenue per service because the associated service has not yet been performed.
Funeral Revenue
Consolidated revenue from funeral operations was $2,332.0 million for the year ended December 31, 2022, compared to $2,343.2 million for the same period in 2021. This $11.2 million, or 0.5%, decrease in revenue is primarily attributable to a $49.7 million decrease in comparable funeral revenue, partially offset by a $43.5 million increase in revenue contributed from newly constructed and acquired properties.
Comparable revenue from funeral operations was $2,282.4 million for the year ended December 31, 2022 compared to $2,332.1 million for the same period in 2021. This $49.7 million decrease was primarily attributable to a 4.6% decrease in our comparable funeral services performed as the prior year was impacted by the COVID-19 pandemic. The decrease in funeral services performed was comprised of a 5.6% decrease in funeral services performed by our funeral service locations offset by a 1.8% increase in cremations performed by our non-funeral home channel. Additionally, we experienced a $1.6 million increase in comparable general agency and other revenue and a $3.7 million increase in comparable recognized preneed revenue, as a result of higher comparable preneed funeral sales production.
Average revenue per funeral service increased 2.0% for the year ended December 31, 2022 compared to the same period in 2021. This average revenue growth was primarily attributable to our customers desire for more comprehensive services including items such as catering and flowers. Our total comparable cremation rate increased 190 basis points to 61.1% for the year ended December 31, 2022.
Funeral Gross Profit
Consolidated funeral gross profit decreased $94.1 million, or 14.7%, in 2022 compared to 2021 as the prior year was positively impacted by COVID-19. This decrease is primarily attributable to the decrease in comparable funeral gross profit of $101.2 million, or 15.7%, partially offset by the $5.8 million increase in gross profit contributed by newly constructed and acquired properties. Comparable funeral gross profit decreased $101.2 million to $541.9 million and the comparable gross profit percentage decreased from 27.6% to 23.7%. This decrease in gross profit is due to the expected decline in revenue mentioned above combined with higher energy and employee-related inflationary costs.
30 Service Corporation International
Cemetery Results
| | | | | | | | | | | | | |
| Years Ended December 31, |
| 2022 | | 2021 | | |
| | (In millions) |
| Consolidated cemetery revenue | $ | 1,776.6 | | | $ | 1,800.0 | | | |
| Less: revenue associated with acquisitions/new construction | 16.0 | | | 0.1 | | | |
| Less: revenue associated with divestitures | 0.1 | | | 0.3 | | | |
Comparable(1) cemetery revenue | $ | 1,760.5 | | | $ | 1,799.6 | | | |
| | | | | |
| Consolidated cemetery gross profit | $ | 608.9 | | | $ | 683.3 | | | |
| Less: gross (loss) profit associated with acquisitions/new construction | 8.6 | | | (0.4) | | | |
| Less: gross profit associated with divestitures | — | | | 0.2 | | | |
Comparable(1) cemetery gross profit | $ | 600.3 | | | $ | 683.5 | | | |
(1) We define comparable (or same store) operations as those cemetery locations owned by us for the entire period beginning January 1, 2021 and ending December 31, 2022.
Cemetery Revenue
Consolidated revenue from our cemetery operations decreased $23.4 million, or 1.3%, in 2022 compared to 2021 primarily due to a $39.1 million, or 2.2%, decrease in comparable cemetery revenue, partially offset by a $15.9 million increase in revenue contributed by newly constructed and acquired properties.
The decrease in comparable cemetery revenue was primarily attributable to a $28.6 million decrease in comparable cemetery core revenue, which was driven by a $32.1 million decline in comparable cemetery atneed revenue, and a $20.5 million decline in merchandise and service trust fund income, partially offset by $24.0 million increase in recognized preneed revenue. The decline in comparable cemetery atneed revenue was due to an expected decrease in contract velocity compared to the same period in 2021 that was heavily impacted by the COVID-19 pandemic. Additionally, comparable other revenue declined $10.5 million, or 8.0%, primarily from lower endowment care trust fund income due to the impact of the financial markets.
Cemetery Gross Profit
Consolidated cemetery gross profit decreased $74.4 million, or 10.9%, in 2022 compared to 2021, which is primarily attributable to the decrease in comparable cemetery gross profit of $83.2 million, or 12.2%, partially offset by a $9.0 million increase in gross profit contributed from newly constructed and acquired properties. Comparable cemetery gross profit decreased $83.2 million to $600.3 million, and the gross profit percentage decreased 390 basis points to 34.1%. The decrease in gross profit is due to the decline in comparable cemetery atneed revenue and merchandise and service trust fund income mentioned above combined with higher inflationary employee-related and maintenance costs.
Other Financial Statement Items
Corporate General and Administrative Expenses
Corporate general and administrative expenses were $237.2 million in 2022 compared to $157.6 million in 2021. Excluding an estimated charge for certain legal matters of $64.6 million in 2022, corporate general and administrative expenses increased $15.0 million primarily related to workers compensation and general liability insurance claims as well as expenses related to the timing of incentive compensation.
During the fourth quarter of 2022, we reached an immaterial preliminary settlement in a private litigation matter in Florida and subsequently we engaged in settlement discussions with the California Attorney General. Both matters relate to previously disclosed litigation. Approximately two-thirds of the $64.6 million pretax charge relates to estimated preneed contract refunds in California and Florida. The remainder of the charge includes anticipated reimbursement of California governmental investigative costs and other legal expenses.
Gains on Divestitures and Impairment Charges, Net
We recognized a $10.0 million and a $25.2 million net pre-tax gain on asset divestitures and impairments in 2022 and 2021, respectively, primarily as the result of asset divestitures associated with non-strategic funeral and cemetery locations in the United States and Canada partially offset by impairment losses.
Interest Expense
Interest expense increased $21.5 million to $172.1 million in 2022 primarily due to higher interest on our floating rate debt as well as higher balances. Our floating rate debt carried a weighted average interest rate of 2.95% for the full year 2022, which is 166 basis points higher than the weighted average rate for our floating rate debt for the full year 2021 of 1.29%.
Losses on Early Extinguishment of Debt, Net
During 2022, we made aggregate debt payments of $101.9 million for scheduled and early extinguishment payments. During 2021, we made aggregate debt payments of $736.0 million for scheduled and early extinguishment payments. Certain of these transactions resulted in the recognition of pre-tax losses of $1.2 million and $5.2 million in 2022 and 2021, respectively, recorded in Losses on early extinguishment of debt, net in our Consolidated Statement of Operations.
Other Income, Net
Other income, net decreased $9.0 million to $1.6 million in 2022 primarily due to $8.3 million in income from a vendor waiver and release agreement cash receipt recorded in the prior year.
Provision for Income Taxes
The 2022 consolidated effective tax rate was 25.1%, compared to 23.2% in 2021. The lower effective tax rate in 2021 was primarily due to non-taxable gains on the cash surrender value of certain life insurance policies and the release of a Puerto Rican valuation allowance. The effective tax rate for the year ended December 31, 2022 was higher than the federal statutory tax rate of 21% primarily due to state and foreign income taxes.
Critical Accounting Policies, Recent Accounting Pronouncements, and Accounting Changes
Our consolidated financial statements are impacted by the accounting policies used and the estimates and assumptions made by management during their preparation. See Note 2 in Part II, Item 8. Financial Statements and Supplementary Data, for more information. Estimates and assumptions affect the carrying values of assets and liabilities and disclosures of contingent assets and liabilities at the balance sheet date. Actual results could differ from such estimates due to uncertainties associated with the methods and assumptions underlying our critical accounting measurements. The following is a discussion of our critical accounting policies pertaining to revenue recognition, valuation of goodwill, valuation of intangible assets, fair value measurements, and the use of estimates. Revenue Recognition
Revenue is recognized when control of the merchandise or services is transferred to the customer. Our performance obligations include the delivery of funeral and cemetery merchandise and services and cemetery property interment rights. Control transfers when merchandise is delivered or services are performed. For cemetery property interment rights, control transfers to the customer when the property is developed and the interment right has been sold and can no longer be marketed or sold to another customer.
On our atneed contracts, we generally deliver the merchandise and perform the services at the time of need. Personalized marker merchandise and marker installation services sold on atneed contracts are recognized when control is transferred to the customer, generally when the marker is delivered and installed in the cemetery.
We also sell price-guaranteed preneed contracts through various programs providing for future merchandise and services at prices prevailing when the agreements are signed. Revenue associated with sales of preneed contracts is deferred until control of the merchandise or the services is transferred to the customer, which is upon delivery of the merchandise or as services are performed, generally at the time of need. On certain preneed contracts, we sell memorialization merchandise, which consists of urns and urn-related products, that we deliver to the customer at the time of sale. Revenue is recognized at the time of delivery when control of the memorialization merchandise is transferred.
For personalized marker merchandise sold on a preneed contract, we will:
•purchase the merchandise from vendors,
•personalize such merchandise in accordance with the customer's specific written instructions,
•either store the merchandise at a third-party bonded storage facility or install the merchandise, based on the customer's instructions, and
•transfer title to the customer.
We recognize revenue and record the cost of sales when control is transferred for the merchandise, which occurs upon delivery to the third-party storage facility or installation of the merchandise at the cemetery.
Pursuant to state or provincial law, all or a portion of the proceeds from funeral and cemetery merchandise or services sold on a preneed basis may be required to be paid into trust funds. We defer investment earnings related to these merchandise and service trusts until the associated merchandise is delivered or services are performed. Fees charged by our wholly-owned registered investment advisor are also included in revenue in the period in which they are earned.
A portion of the proceeds from the sale of cemetery property interment rights is required by state or provincial law to be paid by us into perpetual care trust funds to maintain the cemetery. This portion of the proceeds is not recognized as revenue. Investment earnings from these trusts are distributed to us regularly and recognized in current cemetery revenue.
32 Service Corporation International
For more information related to revenue, see Notes 2, 3, and 13 in Part II, Item 8. Financial Statements and Supplementary Data. Valuation of Goodwill
We record the excess of purchase price over the fair value of identifiable net assets acquired in business combinations as goodwill. Goodwill is tested annually during the fourth quarter for impairment by assessing the fair value of each of our reporting units.
Our goodwill impairment test involves certain estimates and management judgment. We perform our goodwill impairment test by comparing the fair value of a reporting unit to its carrying amount, including goodwill. We determine fair value of each reporting unit using both a market and income approach. The income approach, which is a discounted cash flow method, uses projections of future cash flows and includes assumptions concerning future operating performance and economic conditions that may differ from actual future cash flows. We do not record an impairment of goodwill in instances where the fair value of a reporting unit exceeds its carrying amount. If the aggregate fair value is less than the related carrying amount for a reporting unit, we compare the implied fair value of goodwill to the carrying amount of goodwill. If the carrying amount of reporting unit goodwill exceeds the implied fair value of that goodwill, an impairment loss is recognized in an amount equal to that excess.
For more information related to goodwill, see Notes 2 and 4 in Part II, Item 8. Financial Statements and Supplementary Data. Valuation of Intangible Assets
Our intangible assets include covenants-not-to-compete, customer relationships, trademarks and tradenames, and other intangible assets primarily resulting from acquisitions. Certain of our trademark and tradenames and other intangible assets are considered to have an indefinite life and are not subject to amortization. We test for impairment of intangible assets annually during the fourth quarter.
Our intangible asset impairment tests involve estimates and management judgment. For trademark and tradenames, our test uses the relief from royalty method whereby we determine the fair value of the assets by discounting the cash flows that represent a savings over having to pay a royalty fee for use of the trademark and tradenames. The discounted cash flow valuation uses projections of future cash flows and includes assumptions concerning future operating performance and economic conditions that may differ from actual future cash flows.
For more information related to intangible assets, see Notes 2 and 4 in Part II, Item 8. Financial Statements and Supplementary Data. Fair Value Measurements
We measure the securities held by our funeral merchandise and service, cemetery merchandise and service, and cemetery perpetual care trusts at fair value on a recurring basis. Fair value is the price that would be received to sell an asset or paid to transfer a liability in an orderly transaction between market participants at the measurement date. We utilize a three-level valuation hierarchy for disclosure of fair value measurements. The valuation hierarchy is based upon the transparency of inputs to the valuation of an asset or liability as of the measurement date. The three levels are defined as follows:
•Where quoted prices are available in an active market, securities held by the trusts are classified as Level 1 investments.
•Where quoted market prices are not available for the specific security, fair values are estimated by using either quoted prices of securities with similar characteristics or an income approach fair value model with observable inputs that include a combination of interest rates, yield curves, credit risks, prepayment speeds, ratings, and tax-exempt status. These securities are classified as Level 2 investments.
•The valuation of other investments requires management judgment due to the absence of quoted market prices, inherent lack of liquidity, and the long-term nature of such assets. These securities are classified as Level 3 investments.
Categorization within the valuation hierarchy is based upon the lowest level of input that is significant to the fair value measurement. Certain securities held by our funeral merchandise and service, cemetery merchandise and service, and cemetery perpetual care trusts have been classified as Level 3 of the hierarchy due to the significant management judgment required because of the absence of quoted market prices, inherent lack of liquidity, or the long-term nature of the securities. For more information related to our fair value measurements, see Notes 2, 3, and 7 in Part II, Item 8. Financial Statements and Supplementary Data. Use of Estimates
The preparation of financial statements in conformity with Generally Accepted Accounting Principles in the United States (GAAP) requires management to make certain estimates and assumptions. These estimates and assumptions affect the carrying values of assets and liabilities and disclosures of contingent assets and liabilities at the balance sheet date. Actual results could differ from such estimates due to uncertainties associated with the methods and assumptions underlying our critical accounting measurements. Critical estimates used by management include:
Reserves and Allowances
We provide reserves for credit losses on our receivables. These reserves are based on an analysis of historical trends of collection activity adjusted for current conditions and forecasts. We also record an estimate of general agency revenue that may be canceled in its first year and revenue would be charged back by the insurance company. These estimates are impacted by a number of factors, including changes in the economy and demographic or competitive changes in our areas of operation.
Valuation of Trust Investments
When available, we use quoted market prices for specific securities. When quoted market prices are not available for the specific security, fair values are estimated by using either quoted market prices for securities with similar characteristics or a fair value model with observable inputs that include a combination of interest rates, yield curves, credit risks, prepayment terms, rating, and tax exempt status. The valuation of certain investments requires significant management judgment due to the absence of quoted market prices, inherent lack of liquidity, and the long-term nature of such assets.
Legal Liability Reserves
Contingent liabilities, principally for legal matters, are recorded when it is probable that a liability has been incurred and the amount of the loss can be reasonably estimated. Liabilities accrued for legal matters require judgments regarding projected outcomes and a range of loss based on historical experience and recommendations of legal counsel. However, litigation is inherently unpredictable and excessive verdicts do occur. As disclosed in Note 9 in Part II, Item 8. Financial Statements and Supplementary Data, our legal exposures and the ultimate outcome of these legal proceedings could be material to operating results or cash flows in any given quarter or year. Income Taxes
We compute income taxes using the liability method. Our ability to realize the benefit of our deferred tax assets requires us to achieve certain future earnings levels. We have established a valuation allowance against a portion of our deferred tax assets in certain jurisdictions, and we could be required to further adjust that valuation allowance in the near term if market conditions change materially and future earnings are, or are projected to be, significantly different than our current estimates. An increase in the valuation allowance would result in additional income tax expense in such period.
As of December 31, 2022, foreign withholding taxes have not been provided on the estimated $212.6 million of undistributed earnings and profits ("E&P") of our foreign subsidiaries as we intend to permanently reinvest these foreign E&P in those businesses outside the United States. However, if we were to repatriate such foreign E&P, the foreign withholding tax liability is estimated to be $11.0 million. Additionally, if we were to repatriate E&P in excess of our previously taxed income under the Tax Cuts and Jobs Act of 2017, such excess repatriation may cause us to incur an additional U.S. federal income tax of approximately $7.7 million related to the Company’s hybrid debt accounting between Canada and the United States.
We file income tax returns, including tax returns for our subsidiaries, with federal, state, local, and foreign jurisdictions. We consider the United States to be our most significant jurisdiction; however, all tax returns are subject to routine compliance review by the taxing authorities in the jurisdictions in which we file tax returns in the ordinary course of business.
The federal statutes of limitation have expired for all tax years prior to 2019, and we are not currently under audit by the IRS. However, pursuant to the 2017 Tax Cuts and Jobs Act, the statute of limitations on the transition tax for the 2017 tax year does not expire until 2024. Various state jurisdictions are auditing years 2013 through 2020. There are currently no federal or provincial audits in Canada; however, years subsequent to 2016 remain open and could be subject to examination. We believe that it is reasonably possible that the recorded amount of gross unrecognized tax benefits may decrease by $1.3 million within the next twelve months as a result of concluding various state tax matters.
Insurance Loss Reserves
We purchase comprehensive general liability, morticians and cemetery professional liability, automobile liability, and workers’ compensation insurance coverages structured with high deductibles. This high-deductible insurance program means we are primarily self-insured for claims and associated costs and losses covered by these policies. Historical insurance industry experience indicates a high degree of inherent variability in assessing the ultimate amount of losses associated with casualty insurance claims. This is especially true with respect to liability and workers’ compensation exposures due to the extended period of time that transpires between when the claim might occur and the full settlement of such claim, which is often many years. We continually evaluate loss estimates associated with claims and losses related to these insurance coverages falling within the deductible of each coverage. Assumptions based on factors such as claim settlement patterns, claim development trends, claim frequency and severity patterns, inflationary trends, and data reasonableness will generally affect the analysis and determination of the “best estimate” of the projected ultimate claim losses. The results of these evaluations are used to both analyze and adjust our insurance loss reserves. As of December 31, 2022, insurance loss reserves were $99.3 million.
Recent Accounting Pronouncements and Accounting Changes
For discussion of recent accounting pronouncements and accounting changes, see Note 2 in Part II, Item 8. Financial Statements and Supplementary Data. 34 Service Corporation International
Item 7A. Quantitative and Qualitative Disclosures About Market Risk
The market risk inherent in our financial instruments and positions includes the price risk associated with the marketable equity and debt securities included in our portfolio of trust investments, the interest rate risk associated with our floating rate debt, and the currency risk associated with our Canadian operations. Our exposure to market risk as discussed below includes forward-looking statements and represents an estimate of possible changes in fair value or future earnings that might occur, assuming hypothetical changes in equity markets, interest rates, and currencies. Our views on market risk are not necessarily indicative of actual results that may occur, and they do not represent the maximum possible gains or losses that may occur. Actual fair value movements related to changes in equity markets, interest rates, and currencies, along with the timing of such movements, may differ from those estimated.
Marketable Equity and Debt Securities — Price Risk
In connection with our preneed funeral operations and preneed cemetery merchandise and service sales, the related funeral and cemetery trust funds own investments in equity and debt securities and mutual funds, which are sensitive to current market prices.
Cost and market values as of December 31, 2022 are presented in Note 3 in Part II, Item 8, Financial Statements and Supplementary Data. Also see "Trust Investments" in Item 7, Management’s Discussion and Analysis of Financial Condition and Results of Operations, Financial Conditions, Liquidity, and Capital Resources, for discussion of trust investments. Market-Rate Sensitive Instruments — Interest Rate Risk
At December 31, 2022 and 2021, approximately 72% and 79%, respectively, of our total debt consisted of fixed rate debt at a weighted average rate of 4.32% and 4.33%, respectively. A hypothetical increase in interest rates by 10% of the rates associated with our floating rate debt would increase our interest expense by $2.9 million. See Notes 6 and 7 in Part II, Item 8. Financial Statements and Supplementary Data, for additional information. Market-Rate Sensitive Instruments — Currency Risk
At December 31, 2022 and 2021, our foreign currency exposure was primarily associated with the Canadian dollar. A hypothetical 10% adverse change in the strength of the U.S. dollar relative to our foreign currency instruments would have negatively affected our net income on an annual basis by $5.8 million and $5.7 million for the years ended December 31, 2022 and 2021, respectively.
At December 31, 2022, approximately 6% of our stockholders’ equity and debt and 8% of our operating income was denominated in the Canadian dollar. Approximately 6% of our stockholders’ equity and debt and 6% of our operating income was denominated in the Canadian dollar at December 31, 2021. We do not have an investment in foreign operations considered to be in highly inflationary economies.
Item 8. Financial Statements and Supplementary Data
Index to Financial Statements and Related Schedule
| | | | | |
| | Page |
| Financial Statements: | |
| |
| |
| |
| |
| |
| |
| |
| |
| |
| |
| |
| |
| |
| |
| |
| |
| |
| |
| |
| |
| |
| |
| |
| |
| |
| Financial Statement Schedule: | |
| |
All other schedules have been omitted because the required information is not applicable or is not present in amounts sufficient to require submission or because the information required is included in the consolidated financial statements or the related notes thereto.
36 Service Corporation International
Report of Independent Registered Public Accounting Firm
To the Board of Directors and Stockholders of Service Corporation International
Opinions on the Financial Statements and Internal Control over Financial Reporting
We have audited the accompanying consolidated balance sheet of Service Corporation International and its subsidiaries (the “Company”) as of December 31, 2022 and 2021, and the related consolidated statements of operations, of comprehensive income, of equity and of cash flows for each of the three years in the period ended December 31, 2022, including the related notes and financial statement schedule listed in the accompanying index (collectively referred to as the “consolidated financial statements”). We also have audited the Company's internal control over financial reporting as of December 31, 2022, based on criteria established in Internal Control - Integrated Framework (2013) issued by the Committee of Sponsoring Organizations of the Treadway Commission (COSO).
In our opinion, the consolidated financial statements referred to above present fairly, in all material respects, the financial position of the Company as of December 31, 2022 and 2021, and the results of its operations and its cash flows for each of the three years in the period ended December 31, 2022 in conformity with accounting principles generally accepted in the United States of America. Also in our opinion, the Company maintained, in all material respects, effective internal control over financial reporting as of December 31, 2022, based on criteria established in Internal Control - Integrated Framework (2013) issued by the COSO.
Basis for Opinions
The Company's management is responsible for these consolidated financial statements, for maintaining effective internal control over financial reporting, and for its assessment of the effectiveness of internal control over financial reporting, included in Management’s Report on Internal Control over Financial Reporting appearing under Item 9A. Our responsibility is to express opinions on the Company’s consolidated financial statements and on the Company's internal control over financial reporting based on our audits. We are a public accounting firm registered with the Public Company Accounting Oversight Board (United States) (PCAOB) and are required to be independent with respect to the Company in accordance with the U.S. federal securities laws and the applicable rules and regulations of the Securities and Exchange Commission and the PCAOB.
We conducted our audits in accordance with the standards of the PCAOB. Those standards require that we plan and perform the audits to obtain reasonable assurance about whether the consolidated financial statements are free of material misstatement, whether due to error or fraud, and whether effective internal control over financial reporting was maintained in all material respects.
Our audits of the consolidated financial statements included performing procedures to assess the risks of material misstatement of the consolidated financial statements, whether due to error or fraud, and performing procedures that respond to those risks. Such procedures included examining, on a test basis, evidence regarding the amounts and disclosures in the consolidated financial statements. Our audits also included evaluating the accounting principles used and significant estimates made by management, as well as evaluating the overall presentation of the consolidated financial statements. Our audit of internal control over financial reporting included obtaining an understanding of internal control over financial reporting, assessing the risk that a material weakness exists, and testing and evaluating the design and operating effectiveness of internal control based on the assessed risk. Our audits also included performing such other procedures as we considered necessary in the circumstances. We believe that our audits provide a reasonable basis for our opinions.
Definition and Limitations of Internal Control over Financial Reporting
A company’s internal control over financial reporting is a process designed to provide reasonable assurance regarding the reliability of financial reporting and the preparation of financial statements for external purposes in accordance with generally accepted accounting principles. A company’s internal control over financial reporting includes those policies and procedures that (i) pertain to the maintenance of records that, in reasonable detail, accurately and fairly reflect the transactions and dispositions of the assets of the company; (ii) provide reasonable assurance that transactions are recorded as necessary to permit preparation of financial statements in accordance with generally accepted accounting principles, and that receipts and expenditures of the company are being made only in accordance with authorizations of management and directors of the company; and (iii) provide reasonable assurance regarding prevention or timely detection of unauthorized acquisition, use, or disposition of the company’s assets that could have a material effect on the financial statements.
Because of its inherent limitations, internal control over financial reporting may not prevent or detect misstatements. Also, projections of any evaluation of effectiveness to future periods are subject to the risk that controls may become inadequate because of changes in conditions, or that the degree of compliance with the policies or procedures may deteriorate.
Critical Audit Matters
The critical audit matter communicated below is a matter arising from the current period audit of the consolidated financial statements that was communicated or required to be communicated to the audit committee and that (i) relates to accounts or disclosures that are material to the consolidated financial statements and (ii) involved our especially challenging, subjective, or complex judgments. The communication of critical audit matters does not alter in any way our opinion on the consolidated financial statements, taken as a whole, and we are not, by communicating the critical audit matter below, providing a separate opinion on the critical audit matter or on the accounts or disclosures to which it relates.
Goodwill Impairment Assessment - Funeral Reporting Unit
As described in Notes 2 and 4 to the consolidated financial statements, the Company’s consolidated goodwill balance was $1.9 billion as of December 31, 2022, and the goodwill associated with the funeral reporting unit was $1.6 billion. Goodwill is tested annually during the fourth quarter, or whenever certain events or changes in circumstances indicate that the carrying value of goodwill may be greater than fair value. In order to perform the goodwill impairment test, management compares the fair value of a reporting unit to its carrying amount, including goodwill. Management determines fair value of a reporting unit using both a market and income approach. The income approach, which is a discounted cash flow method, uses projections of future cash flows and includes assumptions concerning future operating performance and economic conditions, such as revenue and other growth rates and a discount rate, that may differ from actual future cash flows. The principal considerations for our determination that performing procedures relating to the goodwill impairment assessment of the funeral reporting unit is a critical audit matter are the significant judgment by management when developing the fair value measurement of the reporting unit under the income approach. This in turn led to a high degree of auditor judgment, subjectivity, and effort in performing procedures and in evaluating management’s cash flow projections and significant assumptions related to revenue growth rates (over a seven year period (“discrete years”) and terminal year) and ratio of expenses to revenue. In addition, the audit effort involved the use of professionals with specialized skill and knowledge to assist in performing these procedures and evaluating the audit evidence obtained.
Addressing the matter involved performing procedures and evaluating audit evidence in connection with forming our overall opinion on the consolidated financial statements. These procedures included testing the effectiveness of controls relating to management’s goodwill impairment assessment of the funeral reporting unit, including controls over the valuation assertion. These procedures also included, among others, testing management’s process for developing the fair value estimate; evaluating the appropriateness of the discounted cash flow model; testing the completeness, accuracy, and relevance of underlying data used in the model; and evaluating the reasonableness of significant assumptions used by management related to the revenue growth rates (discrete years and terminal year) and ratio of expenses to revenue. Evaluating management’s assumptions related to the revenue growth rates (discrete years and terminal year) and the ratio of expenses to revenue involved evaluating whether the assumptions used by management were reasonable considering (i) the current and past performance of the reporting unit, (ii) the consistency with forecasts per industry data, and (iii) whether these assumptions were consistent with evidence obtained in other areas of the audit. Professionals with specialized skill and knowledge were used to assist in evaluating the Company’s discounted cash flow model and the terminal year revenue growth rate assumption.
/s/ PricewaterhouseCoopers LLP
Houston, Texas
February 15, 2023
We have served as the Company’s auditor since 1993.
38 Service Corporation International
Service Corporation International
Consolidated Statement of Operations
| | | | | | | | | | | | | | | | | |
| | Years Ended December 31, |
| | 2022 | | 2021 | | 2020 |
| | (In thousands, except per share amounts) |
| Revenue | | | | | |
| Property and merchandise revenue | $ | 2,136,593 | | | $ | 2,139,795 | | | $ | 1,772,778 | |
| Service revenue | 1,707,099 | | | 1,730,860 | | | 1,513,420 | |
| Other revenue | 264,969 | | | 272,488 | | | 225,311 | |
| Total revenue | 4,108,661 | | | 4,143,143 | | | 3,511,509 | |
| Costs of revenue | | | | | |
| Cost of property and merchandise | (1,041,287) | | | (1,007,261) | | | (867,215) | |
| Cost of service | (883,020) | | | (833,183) | | | (749,695) | |
| Overhead and other expenses | (1,029,752) | | | (979,624) | | | (902,160) | |
| Costs of revenue | (2,954,059) | | | (2,820,068) | | | (2,519,070) | |
| Gross profit | 1,154,602 | | | 1,323,075 | | | 992,439 | |
| Corporate general and administrative expenses | (237,248) | | | (157,568) | | | (156,678) | |
| Gains on divestitures and impairment charges, net | 9,962 | | | 25,169 | | | 7,009 | |
| | | | | |
| Operating income | 927,316 | | | 1,190,676 | | | 842,770 | |
| Interest expense | (172,109) | | | (150,610) | | | (163,063) | |
| Losses on early extinguishment of debt, net | (1,225) | | | (5,226) | | | (18,428) | |
| Other income, net | 1,646 | | | 10,660 | | | 781 | |
| Income before income taxes | 755,628 | | | 1,045,500 | | | 662,060 | |
| Provision for income taxes | (189,594) | | | (242,248) | | | (145,923) | |
| | | | | |
| | | | | |
| Net income | 566,034 | | | 803,252 | | | 516,137 | |
| Net income attributable to noncontrolling interests | (696) | | | (313) | | | (230) | |
| Net income attributable to common stockholders | $ | 565,338 | | | $ | 802,939 | | | $ | 515,907 | |
| Basic earnings per share: | | | | | |
| Net income attributable to common stockholders | $ | 3.58 | | | $ | 4.79 | | | $ | 2.92 | |
| Basic weighted average number of shares | 157,713 | | | 167,542 | | | 176,709 | |
| Diluted earnings per share: | | | | | |
| Net income attributable to common stockholders | $ | 3.53 | | | $ | 4.72 | | | $ | 2.88 | |
| Diluted weighted average number of shares | 160,131 | | | 170,114 | | | 178,990 | |
| | | | | |
(See notes to consolidated financial statements)
Service Corporation International
Consolidated Statement of Comprehensive Income
| | | | | | | | | | | | | | | | | |
| Years Ended December 31, |
| 2022 | | 2021 | | 2020 |
| (In thousands) |
| Net income | $ | 566,034 | | | $ | 803,252 | | | $ | 516,137 | |
| Other comprehensive income: | | | | | |
| Foreign currency translation adjustments | (23,681) | | | 846 | | | 9,507 | |
| | | | | |
| Total comprehensive income | 542,353 | | | 804,098 | | | 525,644 | |
| Total comprehensive income attributable to noncontrolling interests | (691) | | | (311) | | | (235) | |
| Total comprehensive income attributable to common stockholders | $ | 541,662 | | | $ | 803,787 | | | $ | 525,409 | |
(See notes to consolidated financial statements)
40 Service Corporation International
Service Corporation International
Consolidated Balance Sheet
| | | | | | | | | | | |
| | December 31, |
| | 2022 | | 2021 |
| | (In thousands, except share amounts) |
| | | |
| ASSETS | | | |
| Current assets: | | | |
| Cash and cash equivalents | $ | 191,938 | | | $ | 268,626 | |
Receivables, net of reserves of $6,186 and $6,338, respectively | 96,681 | | | 106,051 | |
| Inventories | 31,740 | | | 25,935 | |
| Other | 39,487 | | | 40,448 | |
| Total current assets | 359,846 | | | 441,060 | |
Preneed receivables, net of reserves of $27,314 and $20,727, respectively and trust investments | 5,577,499 | | | 6,015,323 | |
| Cemetery property | 1,939,816 | | | 1,900,844 | |
| Property and equipment, net | 2,350,549 | | | 2,252,158 | |
| Goodwill | 1,945,588 | | | 1,915,082 | |
Deferred charges and other assets, net of reserves of $3,602 and $4,577, respectively | 1,190,426 | | | 1,169,813 | |
| Cemetery perpetual care trust investments | 1,702,313 | | | 1,996,898 | |
| Total assets | $ | 15,066,037 | | | $ | 15,691,178 | |
| | | |
| LIABILITIES & EQUITY | | | |
| Current liabilities: | | | |
| Accounts payable and accrued liabilities | $ | 707,488 | | | $ | 659,494 | |
| Current maturities of long-term debt | 90,661 | | | 65,016 | |
| Income taxes payable | 1,131 | | | 3,751 | |
| Total current liabilities | 799,280 | | | 728,261 | |
| Long-term debt | 4,251,083 | | | 3,901,304 | |
| Deferred revenue, net | 1,624,028 | | | 1,532,749 | |
| Deferred tax liability | 445,040 | | | 437,902 | |
| Other liabilities | 411,376 | | | 438,903 | |
| Deferred receipts held in trust | 4,163,520 | | | 4,766,492 | |
| Care trusts’ corpus | 1,698,287 | | | 1,976,118 | |
| Commitments and contingencies (Note 9) | | | |
| Equity: | | | |
Common stock, $1 per share par value, 500,000,000 shares authorized, 156,088,438 and 166,821,502 shares issued, respectively, and 153,940,365 and 163,114,202 shares outstanding, respectively | 153,940 | | | 163,114 | |
| Capital in excess of par value | 958,329 | | | 979,096 | |
| Retained earnings | 544,384 | | | 727,021 | |
| Accumulated other comprehensive income | 16,538 | | | 40,214 | |
| Total common stockholders’ equity | 1,673,191 | | | 1,909,445 | |
| Noncontrolling interests | 232 | | | 4 | |
| Total equity | 1,673,423 | | | 1,909,449 | |
| Total liabilities and equity | $ | 15,066,037 | | | $ | 15,691,178 | |
(See notes to consolidated financial statements)
Service Corporation International
Consolidated Statement of Cash Flows
| | | | | | | | | | | | | | | | | |
| | Years Ended December 31, |
| | 2022 | | 2021 | | 2020 |
| | | (In thousands) | | |
| Cash flows from operating activities: | | | | | |
| Net income | $ | 566,034 | | | $ | 803,252 | | | $ | 516,137 | |
| Adjustments to reconcile net income to net cash provided by operating activities: | | | | | |
| | | | | |
| Losses on early extinguishment of debt, net | 1,225 | | | 5,226 | | | 18,428 | |
| | | | | |
| Depreciation and amortization | 175,330 | | | 159,306 | | | 155,299 | |
| Amortization of intangibles | 18,355 | | | 20,002 | | | 22,444 | |
| Amortization of cemetery property | 94,123 | | | 98,162 | | | 80,403 | |
| Amortization of loan costs | 6,851 | | | 6,367 | | | 5,483 | |
| Provision for expected credit losses | 16,700 | | | 11,362 | | | 13,558 | |
| Provision for (benefit from) deferred income taxes | 3,471 | | | (5,837) | | | 7,884 | |
| Gains on divestitures and impairment charges, net | (9,962) | | | (25,169) | | | (7,009) | |
| Gain on sale of investments | (1,169) | | | — | | | — | |
| Share-based compensation | 14,709 | | | 14,168 | | | 14,103 | |
| | | | | |
| Change in assets and liabilities, net of effects from acquisitions and divestitures: | | | | | |
| Decrease (increase) in receivables | 4,151 | | | (20,215) | | | (14,518) | |
| Increase in other assets | (8,206) | | | (54,883) | | | (35,739) | |
| Increase in payables and other liabilities | 37,029 | | | 53,747 | | | 122,478 | |
| Effect of preneed sales production and maturities: | | | | | |
| Increase in preneed receivables, net and trust investments | (309,055) | | | (308,061) | | | (158,797) | |
| Increase in deferred revenue, net | 195,358 | | | 119,730 | | | 61,807 | |
| Increase in deferred receipts held in trust | 20,781 | | | 43,451 | | | 2,390 | |
| | | | | |
| | | | | |
| | | | | |
| Net cash provided by operating activities | 825,725 | | | 920,608 | | | 804,351 | |
| Cash flows from investing activities: | | | | | |
| Capital expenditures | (369,709) | | | (303,660) | | | (222,211) | |
| Business acquisitions, net of cash acquired | (102,558) | | | (121,382) | | | (64,164) | |
| Real estate acquisitions | (17,127) | | | (26,604) | | | (52,079) | |
| Proceeds from divestitures and sales of property and equipment | 42,093 | | | 40,696 | | | 21,916 | |
| Proceeds from sale of investments and other | 1,330 | | | — | | | — | |
| Payments for Company-owned life insurance policies | (1,910) | | | (3,982) | | | (5,352) | |
| Proceeds from Company-owned life insurance policies and other | — | | | — | | | 3,519 | |
| | | | | |
| | | | | |
| | | | | |
| Net cash used in investing activities | (447,881) | | | (414,932) | | | (318,371) | |
| Cash flows from financing activities: | | | | | |
| Proceeds from issuance of long-term debt | 484,000 | | | 975,000 | | | 1,585,000 | |
| Debt issuance costs | (525) | | | (13,640) | | | (14,503) | |
| Scheduled payments of debt | (36,288) | | | (36,158) | | | (34,489) | |
| Early payments of debt | (65,591) | | | (699,837) | | | (1,371,856) | |
| Principal payments on finance leases | (35,542) | | | (34,617) | | | (43,598) | |
| Proceeds from exercise of stock options | 27,814 | | | 39,354 | | | 26,671 | |
| | | | | |
| Purchase of Company common stock | (660,850) | | | (554,313) | | | (516,870) | |
| Payments of dividends | (160,035) | | | (146,919) | | | (137,392) | |
| | | | | |
| Bank overdrafts and other | (980) | | | 5,510 | | | 14,259 | |
| | | | | |
| Net cash used in financing activities | (447,997) | | | (465,620) | | | (492,778) | |
| | | | | |
| |
| | | | | |
| | | | | |
| | | | | |
| | | | | |
| Effect of foreign currency | (3,878) | | | (111) | | | 2,788 | |
| Net (decrease) increase in cash, cash equivalents, and restricted cash | (74,031) | | | 39,945 | | | (4,010) | |
| Cash, cash equivalents, and restricted cash at beginning of period | 278,555 | | | 238,610 | | | 242,620 | |
| Cash, cash equivalents, and restricted cash at end of period | $ | 204,524 | | | $ | 278,555 | | | $ | 238,610 | |
(See notes to consolidated financial statements)
42 Service Corporation International
Service Corporation International
Consolidated Statement of Equity
| | | | | | | | | | | | | | | | | | | | | | | | | | | | | | | | | | | | | | | | | |
| Common
Stock | | Treasury
Stock,
Par Value | | Capital in
Excess of
Par Value | | Retained Earnings | | Accumulated Other
Comprehensive
Income | | Noncontrolling
Interest | | Total |
| | (In thousands, except per share amounts) |
| Balance at December 31, 2019 | 185,101 | | | (3,916) | | | 1,010,361 | | | 601,903 | | | 29,864 | | | (58) | | | 1,823,255 | |
| Cumulative effect of accounting changes | — | | | — | | | — | | | 16,989 | | | — | | | — | | | 16,989 | |
| Comprehensive income | — | | | — | | | — | | | 515,907 | | | 9,502 | | | 235 | | | 525,644 | |
| Dividends declared on common stock ($.78 per share) | — | | | — | | | — | | | (137,392) | | | — | | | — | | | (137,392) | |
| Stock option exercises | 1,361 | | | — | | | 25,310 | | | — | | | — | | | — | | | 26,671 | |
| Restricted stock awards, net of forfeitures | 170 | | | — | | | (170) | | | — | | | — | | | — | | | — | |
| Employee share-based compensation earned | — | | | — | | | 14,103 | | | — | | | — | | | — | | | 14,103 | |
| Purchase of Company common stock | — | | | (12,043) | | | (68,151) | | | (436,676) | | | — | | | — | | | (516,870) | |
| Noncontrolling interest payments | — | | | — | | | — | | | — | | | — | | | (304) | | | (304) | |
| Retirement of treasury shares | (11,884) | | | 11,884 | | | — | | | — | | | — | | | — | | | — | |
| Other | 44 | | | — | | | 481 | | | — | | | — | | | — | | | 525 | |
| Balance at December 31, 2020 | $ | 174,792 | | | $ | (4,075) | | | $ | 981,934 | | | $ | 560,731 | | | $ | 39,366 | | | $ | (127) | | | $ | 1,752,621 | |
| | | | | | | | | | | | | |
| | | | | | | | | | | | | |
| Comprehensive income | — | | | — | | | — | | | 802,939 | | | 848 | | | 311 | | | 804,098 | |
| Dividends declared on common stock ($.88 per share) | — | | | — | | | — | | | (146,919) | | | — | | | — | | | (146,919) | |
| Stock option exercises | 1,642 | | | — | | | 38,035 | | | — | | | — | | | — | | | 39,677 | |
| Restricted stock awards, net of forfeitures | 163 | | | — | | | (163) | | | — | | | — | | | — | | | — | |
| Employee share-based compensation earned | — | | | — | | | 14,168 | | | — | | | — | | | — | | | 14,168 | |
| Purchase of Company common stock | — | | | (9,438) | | | (55,468) | | | (489,730) | | | — | | | — | | | (554,636) | |
| | | | | | | | | | | | | |
| | | | | | | | | | | | | |
| Noncontrolling interest payments | — | | | — | | | — | | | — | | | — | | | (180) | | | (180) | |
| Retirement of treasury shares | (9,805) | | | 9,805 | | | — | | | — | | | — | | | — | | | — | |
| Other | 30 | | | — | | | 590 | | | — | | | — | | | — | | | 620 | |
| Balance at December 31, 2021 | $ | 166,822 | | | $ | (3,708) | | | $ | 979,096 | | | $ | 727,021 | | | $ | 40,214 | | | $ | 4 | | | $ | 1,909,449 | |
| | | | | | | | | | | | | |
| | | | | | | | | | | | | |
| Comprehensive income | — | | | — | | | — | | | 565,338 | | | (23,676) | | | 691 | | | 542,353 | |
| Dividends declared on common stock ($1.02 per share) | — | | | — | | | — | | | (160,035) | | | — | | | — | | | (160,035) | |
| Stock option exercises | 1,010 | | | — | | | 27,084 | | | — | | | — | | | — | | | 28,094 | |
| Restricted stock awards, net of forfeitures | 149 | | | (1) | | | (148) | | | — | | | — | | | — | | | — | |
| Employee share-based compensation earned | — | | | — | | | 14,709 | | | — | | | — | | | — | | | 14,709 | |
| Purchase of Company common stock | — | | | (10,356) | | | (62,834) | | | (587,940) | | | — | | | — | | | (661,130) | |
| Noncontrolling interest payments | — | | | — | | | — | | | — | | | — | | | (463) | | | (463) | |
| Retirement of treasury shares | (11,916) | | | 11,916 | | | — | | | — | | | — | | | — | | | — | |
| Other | 24 | | | — | | | 422 | | | — | | | — | | | — | | | 446 | |
| Balance at December 31, 2022 | $ | 156,089 | | | $ | (2,149) | | | $ | 958,329 | | | $ | 544,384 | | | $ | 16,538 | | | $ | 232 | | | $ | 1,673,423 | |
(See notes to consolidated financial statements)
Service Corporation International
Notes to Consolidated Financial Statements
1. Nature of Operations
Service Corporation International (SCI) is a holding company and all operations are conducted by its subsidiaries. We are North America’s largest provider of deathcare products and services, with a network of funeral service locations and cemeteries operating in the United States and Canada. Our funeral service and cemetery operations consist of funeral service locations, cemeteries, funeral service/cemetery combination locations, crematoria, and other related businesses, which enable us to serve a wide array of customer needs. We sell cemetery property and funeral and cemetery merchandise and services at the time of need and on a preneed basis. We strive to offer families exceptional service in planning life celebrations and personalized remembrances.
Funeral service locations provide all professional services relating to funerals and cremations, including the use of funeral facilities and motor vehicles, arranging and directing services, removal, preparation, embalming, cremations, memorialization, travel protection, and catering. Funeral merchandise, including burial caskets and related accessories, urns and other cremation receptacles, outer burial containers, flowers, online and video tributes, stationery products, casket and cremation memorialization products, and other ancillary merchandise, is sold at funeral service locations.
Our cemeteries provide cemetery property interment rights, including developed lots, lawn crypts, mausoleum spaces, niches, and other cremation memorialization and interment options. Cemetery merchandise and services, including memorial markers and bases, outer burial containers, flowers and floral placement, other ancillary merchandise, graveside memorial services, merchandise installation, and interments, are sold at our cemeteries.
2. Summary of Significant Accounting Policies
Principles of Consolidation and Basis of Presentation
Our consolidated financial statements include the accounts of Service Corporation International (SCI) and all subsidiaries in which we hold a controlling financial interest. Intercompany balances and transactions have been eliminated in consolidation.
Our consolidated financial statements also include the accounts of the merchandise and service trusts and cemetery perpetual care trusts in which we have a variable interest and are the primary beneficiary. We have retained the specialized industry accounting principles when consolidating the trusts. Our trusts are variable interest entities, for which we have determined that we are the primary beneficiary as we absorb a majority of the losses and returns associated with these trusts. Although we consolidate the trusts, it does not change the legal relationships among the trusts, us, or our customers. The customers are the legal beneficiaries of these trusts; therefore, their interests in these trusts represent a liability to us.
Certain reclassifications have been made to prior period amounts to conform to the current period financial statement presentation with no effect on our consolidated net income or cash flows. As a result, for the years ended December 31, 2021 and 2020, $19.5 million and $15.6 million, respectively, of expenses were reclassified from Costs of revenue to Corporate general and administrative expenses. This reclassification results from strategic changes in how we operate certain centralized functions.
Use of Estimates in the Preparation of Financial Statements
The preparation of the consolidated financial statements in conformity with accounting principles generally accepted in the United States of America requires management to make estimates and assumptions that may affect the reported amounts of assets and liabilities and disclosure of contingent assets and liabilities at the date of the consolidated financial statements and the reported amounts of revenue and expenses during the reporting period. As a result, actual results could differ from these estimates.
Cash, Cash Equivalents, and Restricted Cash
We consider all highly liquid investments with an original maturity of three months or less to be cash equivalents. The carrying amounts of our cash and cash equivalents approximate fair value due to the short-term nature of these instruments.
44 Service Corporation International
The components of cash, cash equivalents, and restricted cash were as follows:
| | | | | | | | | | | |
| Years Ended December 31, |
| 2022 | | 2021 |
| | (In thousands) |
| Cash and cash equivalents | $ | 191,938 | | | $ | 268,626 | |
Restricted cash(1): | | | |
Included in Other current assets | 10,379 | | | 7,847 | |
Included in Deferred charges and other assets | 2,207 | | | 2,082 | |
| Total restricted cash | 12,586 | | | 9,929 | |
| Total cash, cash equivalents, and restricted cash | $ | 204,524 | | | $ | 278,555 | |
(1) Restricted cash in both periods primarily consists of proceeds from divestitures deposited into escrow accounts under IRS code section 1031 and collateralized obligations under certain insurance policies.
Receivables, Net
The components of Receivables, net in our Consolidated Balance Sheet were as follows:
| | | | | | | | | | | | | | | | | | | | | | | | | | | | | |
| December 31, 2022 |
| Atneed Funeral | | Atneed Cemetery | | Miscellaneous | | Current Portion of Notes | | Total |
| | (In thousands) |
| Receivables | $ | 44,417 | | | $ | 19,781 | | | $ | 38,483 | | | $ | 186 | | | $ | 102,867 | |
| Reserve for credit losses | (3,627) | | | (2,076) | | | (344) | | | (139) | | | (6,186) | |
| Receivables, net | $ | 40,790 | | | $ | 17,705 | | | $ | 38,139 | | | $ | 47 | | | $ | 96,681 | |
| | | | | | | | | | | | | | | | | | | | | | | | | | | | | |
| December 31, 2021 |
| Atneed Funeral | | Atneed Cemetery | | Miscellaneous | | Current Portion of Notes | | Total |
| | (In thousands) |
| Receivables | $ | 49,011 | | | $ | 27,461 | | | $ | 35,650 | | | $ | 267 | | | $ | 112,389 | |
| Reserve for credit losses | (3,597) | | | (2,231) | | | (344) | | | (166) | | | (6,338) | |
| Receivables, net | $ | 45,414 | | | $ | 25,230 | | | $ | 35,306 | | | $ | 101 | | | $ | 106,051 | |
Additionally, included in Deferred charges and other assets, net were notes receivable, net and long-term miscellaneous receivables, net as follows:
| | | | | | | | | | | |
| December 31, 2022 | | December 31, 2021 |
| | (In thousands) |
| Notes receivable | $ | 9,367 | | | $ | 8,684 | |
| Reserve for credit losses | (2,546) | | | (3,424) | |
| | | |
| Notes receivable, net | $ | 6,821 | | | $ | 5,260 | |
| | | |
| Long-term miscellaneous receivables | $ | 7,993 | | | $ | 8,146 | |
| Reserve for credit losses | (1,056) | | | (1,153) | |
| Long-term miscellaneous receivables, net | $ | 6,937 | | | $ | 6,993 | |
Our atneed trade receivables primarily consist of amounts due for funeral and cemetery services already performed. We provide reserves for credit losses for our receivables. These reserves are based on an analysis of historical trends of collection activity adjusted for current conditions and forecasts. These estimates are impacted by a number of factors, including changes in the economy and demographic or competitive changes in our areas of operation. Cemetery preneed receivables are collateralized by cemetery property to the extent of the fair value of the property.
Payment on atneed contracts is generally due at the time the merchandise is delivered or the services are performed. We also have preneed receivables, as disclosed in Note 3, for which payment generally occurs prior to our fulfillment of the performance obligations. Our preneed contracts may also have extended payment terms with associated financing charges.
We do not accrue interest on preneed receivables if they are not paid in accordance with the contractual payment terms given the nature of our merchandise and services, the nature of our contracts with customers, and the timing of the delivery of our services. Generally, receivables are considered past due after thirty days. We do not consider preneed funeral receivables to be past due until the contract converts into an atneed contract at which time the preneed receivable is paid or reclassified as a trade receivable with payment terms of less than thirty days. Collections are generally managed by the locations or third party agencies acting on behalf of the locations, until a receivable is one hundred eighty days delinquent, at which time trade receivables are fully reserved.
The following table summarizes the activity in our reserve for credit losses by portfolio segment, excluding preneed receivables which are presented in Note 3, for the year ended December 31, 2022: | | | | | | | | | | | | | | | | | | | | | | | | | | | | | | | | | | | | | | | | | |
| December 31, 2021 | | Provision for Expected Credit Losses | | Acquisitions
(Divestitures), net | | Write
Offs | | Recoveries | | Effect of Foreign Currency | | December 31, 2022 |
| | (In thousands) |
| Trade receivables: | | | | | | | | | | | | | |
| Funeral | $ | (3,597) | | | $ | (5,698) | | | $ | (12) | | | $ | 7,544 | | | $ | (2,190) | | | $ | 326 | | | $ | (3,627) | |
| Cemetery | (2,231) | | | (881) | | | (4) | | | 1,244 | | | (208) | | | 4 | | | (2,076) | |
| Total reserve for credit losses on trade receivables | $ | (5,828) | | | $ | (6,579) | | | $ | (16) | | | $ | 8,788 | | | $ | (2,398) | | | $ | 330 | | | $ | (5,703) | |
| | | | | | | | | | | | | |
| Miscellaneous receivables: | | | | | | | | | | | | | |
| Current | $ | (344) | | | $ | — | | | $ | — | | | $ | — | | | $ | — | | | $ | — | | | $ | (344) | |
| Long-term | (1,153) | | | 97 | | | — | | | — | | | — | | | — | | | (1,056) | |
| Total reserve for credit losses on miscellaneous receivables | $ | (1,497) | | | $ | 97 | | | $ | — | | | $ | — | | | $ | — | | | $ | — | | | $ | (1,400) | |
| | | | | | | | | | | | | |
| Notes receivable | $ | (3,590) | | | $ | 28 | | | $ | — | | | $ | 877 | | | $ | — | | | $ | — | | | $ | (2,685) | |
At December 31, 2022, the amortized cost basis of our miscellaneous and notes receivables by year of origination was as follows:
| | | | | | | | | | | | | | | | | | | | | | | | | | | | | | | | | | | | | | | | | | | | | | | |
| 2022 | | 2021 | | 2020 | | 2019 | | 2018 | | Prior | | Revolving Line of Credit | | Total |
| | (In thousands) |
| Miscellaneous receivables: | | | | | | | | | | | | | | | |
| Current | $ | 37,190 | | | $ | 671 | | | $ | 301 | | | $ | 248 | | | $ | 72 | | | $ | 1 | | | $ | — | | | $ | 38,483 | |
| Long-term | 3,472 | | | 2,395 | | | 959 | | | 1,063 | | | 101 | | | 3 | | | — | | | 7,993 | |
| Total miscellaneous receivables | $ | 40,662 | | | $ | 3,066 | | | $ | 1,260 | | | $ | 1,311 | | | $ | 173 | | | $ | 4 | | | $ | — | | | $ | 46,476 | |
| | | | | | | | | | | | | | | |
| Notes receivable | $ | — | | | $ | — | | | $ | — | | | $ | 26 | | | $ | — | | | $ | 4,673 | | | $ | 4,854 | | | $ | 9,553 | |
46 Service Corporation International
At December 31, 2022, the payment status of our miscellaneous and notes receivables was as follows:
| | | | | | | | | | | | | | | | | | | | | | | | | | | | | | | | | | | | | | | | | |
| Past Due | | | | |
| <30 Days | | 30-90 Days | | 90-180 Days | | >180 Days | | Total | | Current | | Total |
| | (In thousands) |
| Miscellaneous receivables: | | | | | | | | | | | | | |
| Current | $ | — | | | $ | — | | | $ | — | | | $ | 238 | | | $ | 238 | | | $ | 38,245 | | | $ | 38,483 | |
| Long-term | — | | | — | | | — | | | — | | | — | | | 7,993 | | | 7,993 | |
| Total miscellaneous receivables | $ | — | | | $ | — | | | $ | — | | | $ | 238 | | | $ | 238 | | | $ | 46,238 | | | $ | 46,476 | |
| | | | | | | | | | | | | |
| Notes receivable | $ | — | | | $ | — | | | $ | — | | | $ | 1,116 | | | $ | 1,116 | | | $ | 8,437 | | | $ | 9,553 | |
Inventories and Cemetery Property
Funeral and cemetery merchandise are stated at the lower of average cost or net realizable value. Cemetery property is recorded at cost. Inventory costs and cemetery property are relieved using specific identification in fulfillment of performance obligations on our contracts. Cemetery property amortization was $94.1 million, $98.2 million, and $80.4 million for the years ended December 31, 2022, 2021, and 2020, respectively.
Property and Equipment, Net
Property and equipment are recorded at cost. Maintenance and repairs are charged to expense, whereas renewals and major replacements that extend the useful lives of the assets are capitalized. Depreciation is recognized ratably over the estimated useful lives of the various classes of assets. Buildings and improvements are depreciated over a period ranging from ten years to forty years, equipment is depreciated over a period from three years to twelve years, and leasehold improvements are depreciated over the shorter of the lease term or twelve years. Depreciation and amortization expense related to property and equipment was $175.3 million, $159.3 million, and $155.3 million for the years ended December 31, 2022, 2021, and 2020, respectively. When property or equipment is sold or retired, the cost and related accumulated depreciation are removed from the Consolidated Balance Sheet and the resulting gains and losses are included in the Consolidated Statement of Operations in the period of sale or disposal.
Leases
We have operating and finance leases. Our operating leases primarily include funeral service real estate and office equipment for funeral service locations, cemetery locations, and administrative offices. Our finance leases primarily include transportation equipment but also include real estate and office equipment. Lease terms related to real estate generally range from one year to forty years with options to renew at varying terms. Lease terms related to office and transportation equipment generally range from one year to eight years with options to renew at varying terms.
We determine whether an arrangement is or contains a lease at the inception of the arrangement based on the unique facts and circumstances present. Right-of-use (ROU) assets represent our right to use an underlying asset for the lease term, and lease liabilities represent our obligation to make lease payments arising from the lease. Leases with a term greater than one year are recognized on the balance sheet as ROU assets and lease liabilities. We have elected not to recognize on the balance sheet leases with terms of one year or less.
Lease liabilities and their corresponding ROU assets are recorded at commencement date based on the present value of lease payments over the expected lease term. For transportation equipment, we use the rate implicit in each lease to calculate the present value. For real estate and non-transportation equipment leases, the interest rate implicit in lease contracts is typically not readily determinable. Therefore, we use the appropriate collateralized incremental borrowing rate based on the information available at commencement date in determining the present value of future payments for real estate and non-transportation equipment leases. Certain adjustments to the ROU asset may be required for items such as initial direct costs paid or incentives received.
For a lessee, the discount rate for the lease is defined as the rate implicit in the lease unless that rate cannot be readily determined. In that case, the lessee is required to use its incremental borrowing rate, which is the rate of interest that a lessee would have to pay to borrow on a collateralized basis over a similar term with an amount equal to the lease payments in a similar economic environment. We use the rate implicit in each lease for vehicles and other transportation equipment, which represents 61% of our total lease liability as of December 31, 2022 and which are substantially all finance leases. For leases of real estate and non-transportation equipment, which are primarily operating leases, we use our incremental borrowing rate since the rate implicit in these leases cannot be readily determined. To calculate the incremental borrowing rate, we utilize the yield-to-worst of our publicly traded debt securities, adjusted for the appropriate duration on a secured basis. As an accounting policy election, we include reasonably certain renewal periods when determining the rate to use as the incremental borrowing rate for each lease.
We calculate operating lease expense ratably over the lease term. We consider reasonably assured renewal options and fixed escalation provisions in our calculation. Generally, our leases do not include options to terminate the lease prior to the contractual lease expiration date, but future renewal periods are generally cancelable. The majority of our contractually available renewal periods for leases of buildings and land are considered reasonably certain of being exercised. This determination is made by our real estate team based on facts and circumstances surrounding each property. Leases with a term of 12 months or less are not recorded on the balance sheet. The majority of our lease arrangements contain options to (i) purchase the property at fair value on the exercise date, (ii) purchase the property for a value determined at the inception of the lease, or (iii) renew the lease for the fair rental value at the end of the primary lease term. The depreciable life of assets and leasehold improvements are generally limited by the expected lease term.
Certain of our lease agreements include variable rental payments based on a percentage of sales over base contractual levels and others include rental payments adjusted periodically for inflation. Our lease agreements do not contain any material residual value guarantees or material restrictive covenants. We generally do not have sublease arrangements, sale-leaseback arrangements, or leveraged leases.
We have lease agreements with lease and non-lease components, which are generally accounted for separately. For leases commencing before January 1, 2019, we have elected the practical expedient to not separate lease and non-lease components on certain equipment leases, such as copiers where the cost-per-copy maintenance charges are included in the lease charge. On these leases, we have elected to account for the lease and non-lease components as a single component. For leases commencing on or after January 1, 2019, we account for the maintenance charges (non-lease components) separately from the lease components. For more information related to leases, see Note 8. Goodwill
The excess of purchase price over the fair value of identifiable net assets acquired in business combinations is recorded as goodwill. Goodwill is tested annually during the fourth quarter for impairment by assessing the fair value of each of our reporting units.
Our goodwill impairment test involves estimates and management judgment. In order to perform our goodwill impairment test, we compare the fair value of a reporting unit to its carrying amount, including goodwill. We determine fair value of each reporting unit using both a market and income approach. The income approach, which is a discounted cash flow method, uses projections of future cash flows and includes assumptions concerning future operating performance and economic conditions that may differ from actual future cash flows. We do not record an impairment of goodwill in instances where the fair value of a reporting unit exceeds its carrying amount. If the carrying amount exceeds the fair value of a reporting unit, an impairment is recognized in an amount equal to the excess, up to the amount of goodwill in the reporting unit.
For our most recent annual impairment test performed in the fourth quarter, we used a 6.25% discount rate, revenue growth rates ranging from (3.5)% to 6.0% over a seven-year period, plus a terminal value determined using the constant growth method in projecting our future cash flows. Our terminal value was calculated using a long-term revenue growth rate of 1.0% and 2.8% for our funeral and cemetery reporting units, respectively. Additionally, we used a ratio of expenses to revenue ranging from 70.0% to 80.0% and growth rates for other assumptions in our model ranging from (3.5)% to 6.0%. Fair value was calculated as the sum of the projected discounted cash flows of our reporting units over the next seven years plus terminal value at the end of those seven years.
In addition to our annual review, we assess the impairment of goodwill whenever certain events or changes in circumstances indicate that the carrying value may be greater than fair value. Factors that could trigger an interim impairment review include, but are not limited to, significant underperformance relative to historical or projected future operating results and significant negative industry or economic trends. For more information related to goodwill, see Note 4. Other Intangible Assets
Our intangible assets include covenants-not-to-compete, customer relationships, trademarks and tradenames, and other intangible assets primarily resulting from acquisitions. Certain of our trademark and tradenames and other intangible assets are considered to have an indefinite life and are not subject to amortization. We test for impairment of indefinite-lived intangible assets annually during the fourth quarter.
Our intangible asset impairment tests involve estimates and management judgment. For trademarks and tradenames, our test uses the relief from royalty method whereby we determine the fair value of the assets by discounting the cash flows that represent a savings over having to pay a royalty fee for use of the trademarks and tradenames. The discounted cash flow valuation uses projections of future cash flows and includes assumptions concerning future operating performance and economic conditions that may differ from actual future cash flows.
For our most recent annual impairment test performed in the fourth quarter, we estimated that the pre-tax savings would range from 2.0% to 5.0% (4.2% weighted average using carrying value) of the revenue associated with the trademarks and tradenames, based primarily on our research of intellectual property valuation and licensing databases. We also assumed a terminal growth rate of 1.0% and 2.8% for our funeral and cemetery segments (1.7% weighted average using carrying value), respectively, and discounted the cash flows at a 6.45% discount rate based on the relative risk of these assets to our overall business.
48 Service Corporation International
In addition to our annual review, we assess the impairment of intangible assets whenever certain events or changes in circumstances indicate that the carrying value may be greater than the fair value. Factors that could trigger an interim impairment review include, but are not limited to, significant under-performance relative to historical or projected future operating results and significant negative industry or economic trends.
Certain of our intangible assets associated with prior acquisitions are relieved using specific identification in fulfillment of performance obligations on our contracts with customers. We amortize all other finite-lived intangible assets on a straight-line basis over their estimated useful lives, which range from five years to eighty-nine years. For more information related to intangible assets, see Note 4. Fair Value Measurements
We measure the securities held by our funeral merchandise and service, cemetery merchandise and service, and cemetery perpetual care trusts at fair value on a recurring basis. Fair value is the price that would be received to sell an asset or paid to transfer a liability in an orderly transaction between market participants at the measurement date. We utilize a three-level valuation hierarchy for disclosure of fair value measurements. The valuation hierarchy is based upon the transparency of inputs to the valuation of an asset or liability as of the measurement date. The three levels are defined as follows:
•Where quoted prices are available in an active market, securities held by the trusts are classified as Level 1 investments.
•Where quoted market prices are not available for the specific security, fair values are estimated by using either quoted prices of securities with similar characteristics or an income approach fair value model with observable inputs that include a combination of interest rates, yield curves, credit risks, prepayment speeds, ratings, and tax-exempt status. These securities are classified as Level 2 investments.
•The valuation of other investments requires management judgment due to the absence of quoted market prices, inherent lack of liquidity, and the long-term nature of such assets. These securities are classified as Level 3 investments.
Categorization within the valuation hierarchy is based upon the lowest level of input that is significant to the fair value measurement.
Fixed income commingled funds, money market funds, and private equity investments are measured at net asset value. Fixed income commingled funds and money market funds are redeemable for net asset value with two weeks' notice and immediately, respectively. Our private equity investments include several funds that invest in limited partnerships, distressed debt, real estate, and mezzanine financing. These investments can never be redeemed by the funds. Instead, due to the nature of the investments in this category, distributions are received through the liquidation of the underlying assets of the funds.
Valuation policies and procedures are determined by our Trust Services department, which reports to our Chief Financial Officer. Additionally, valuations are reviewed quarterly by the Investment Committee of the Board of Directors.
Treasury Stock
We make treasury stock purchases in the open market or through privately negotiated transactions subject to market conditions and normal trading restrictions. We account for the repurchase of our common stock under the par value method. We canceled 11.9 million, 9.8 million, and 11.9 million shares of our common stock held in our treasury in 2022, 2021, and 2020, respectively. These retired treasury shares were changed to authorized but unissued status.
Foreign Currency Translation
All assets and liabilities of Canadian subsidiaries are translated into U.S. dollars at exchange rates in effect as of the end of the reporting period. Revenue and expense items are translated at the average exchange rates for the reporting period. The resulting translation adjustments are included as a component of Accumulated other comprehensive income in the Consolidated Statement of Equity and Consolidated Balance Sheet.
The functional currency of SCI and its subsidiaries is the respective local currency. The transactional currency gains and losses that arise from transactions denominated in currencies other than the functional currencies of our operations are recorded in Other income, net in the Consolidated Statement of Operations. We do not have any investments in foreign operations considered to be in highly inflationary economies.
Funeral and Cemetery Operations
Revenue is recognized when control of the merchandise or services is transferred to the customer. Our performance obligations include the delivery of funeral and cemetery merchandise and services and cemetery property interment rights. Control transfers when merchandise is delivered or services are performed. For cemetery property interment rights, control transfers to the customer when the property is developed and the interment right has been sold and can no longer be marketed or sold to another customer. Sales taxes collected are recognized on a net basis in our consolidated financial statements.
On our atneed contracts, we generally deliver the merchandise and perform the services at the time of need. Personalized marker merchandise and marker installation services sold on atneed contracts are recognized when control is transferred to the customer, generally when the marker is delivered and installed in the cemetery.
We also sell price-guaranteed preneed contracts through various programs providing for future merchandise and services at prices prevailing when the agreements are signed. Revenue associated with sales of preneed contracts is deferred until control of the merchandise or the services is transferred to the customer, which is upon delivery of the merchandise or as services are performed, generally at the time of need. On certain preneed contracts, we sell memorialization merchandise, which consists of urns and urn-related products, that we deliver to the customer at the time of sale. Revenue is recognized at the time of delivery when control of the memorialization merchandise is transferred.
For personalized marker merchandise sold on a preneed contract, we will:
•purchase the merchandise from vendors,
•personalize such merchandise in accordance with the customer's specific written instructions,
•either store the merchandise at a third-party bonded storage facility or install the merchandise, based on the customer's instructions, and
•transfer title to the customer.
We recognize revenue and record the cost of sales when control is transferred for the merchandise, which occurs upon delivery to the third-party storage facility or installation of the merchandise at the cemetery.
There is no general right of return for delivered items.
We also sell travel protection as an agent of a third party. Travel protection is a service that provides shipment of remains to the servicing funeral home or cemetery of choice if the purchaser passes away outside of a certain radius of their residence, without any additional expense to the family. We do not provide these travel protection services, and we are not primarily obligated to provide such services under these arrangements. Therefore, we record revenues, net of amounts due to the third-party, at the time of sale.
Total consideration received for price-guaranteed preneed and for atneed contracts with customers represents the stated amount of the contract excluding any amounts collected on behalf of third parties, such as sales taxes. Additionally, pursuant to state or provincial law, all or a portion of the proceeds from merchandise or services sold on a preneed basis may be required to be deposited into trust funds. Earnings on these trust funds, which are specifically identifiable for each performance obligation, are also included in total consideration.
The total consideration received for contracts with customers is allocated to each performance obligation based on relative selling price. Relative selling prices are determined by either the amount we sell the performance obligation for on a stand-alone basis or our best estimate of the amount we would sell it for based on an adjusted market assessment approach that is consistent with our historical pricing practices.
Payment on atneed contracts is generally due at the time the merchandise is delivered or the services are performed. For preneed contracts, payment generally occurs prior to our fulfillment of the performance obligations. Our preneed contracts may also have extended payment terms with associated financing charges. We do not accrue interest on preneed receivables if they are not paid in accordance with the contractual payment terms given the nature of our merchandise and services, the nature of our contracts with customers, and the timing of the delivery of our services. We do not consider preneed receivables to be past due until the merchandise or services are required to be delivered at which time the preneed receivable is paid or reclassified as a trade receivable with payment terms of less than thirty days. For unfulfilled performance obligations on cancelable preneed contracts, our Consolidated Balance Sheet reflects the net contract liability, which represents the amount we have collected from customers, in Deferred revenue, net.
Pursuant to state or provincial law, all or a portion of the proceeds from merchandise or services sold on a preneed basis may be required to be deposited into trust funds. When we receive payments from the customer, we deposit the amount required by law into the merchandise and service trusts and reclassify the corresponding amount from Deferred revenue, net into Deferred receipts held in trust. Amounts are withdrawn from the merchandise and service trusts when we fulfill the performance obligations. Fixed income securities held by these trust funds are classified as trading securities. Earnings on these trust funds, which are specifically identifiable for each performance obligation, are also included in total consideration. We defer these investment earnings related to the merchandise and service trusts until the associated merchandise is delivered or services are performed. Fees charged by our wholly-owned registered investment advisor are also included in revenue in the period in which they are earned.
If a preneed contract is canceled prior to delivery, state or provincial law determines the amount of the refund owed to the customer, if any, including the amount of the attributed investment earnings. Upon cancellation, we receive the amount of principal deposited to the trust and previously undistributed net investment earnings and, where required, issue a refund to the customer. In addition, we are entitled to retain, in certain jurisdictions, a portion of collected customer payments when a customer cancels a preneed contract. We recognize these retained funds, if any, and the attributed investment earnings (net of any investment earnings payable to the customer) as revenue in the Consolidated Statement of Operations. In certain jurisdictions, we may be obligated to fund any shortfall if the amount refundable to the customer exceeds the funds in trust.
A portion of the proceeds from the sale of cemetery property interment rights is required by state or provincial law to be paid into perpetual care trust funds by us to maintain the cemetery. This portion of the proceeds is not recognized as revenue. Fixed income securities held by these trust funds are classified as trading securities. Investment earnings from these trusts
50 Service Corporation International
are distributed to us regularly and recognized in current cemetery revenue. These distributions are intended to defray cemetery maintenance costs incurred by us for our cemetery properties, which are expensed as incurred. The principal of such perpetual care trust funds generally cannot be withdrawn; however, in lieu of the distribution of realized income, certain states allow a total return distribution, which may contain elements of income, capital appreciation, and principal.
Costs related to delivery or performance of merchandise and services are charged to expense when merchandise is delivered or services are performed. Costs related to property interment rights include the property and construction costs specifically identified by each project. Property and construction costs are charged to expense when the revenue is recognized by specific identification in the fulfillment of the performance obligation. Incremental direct selling costs are deferred until fulfillment of the performance obligations. These deferred costs are classified as long-term on our Consolidated Balance Sheet because we do not control the timing of the delivery of the merchandise or performance of the services as they are generally provided at the time of need. For the years ended December 31, 2022, 2021, and 2020, we recognized $263.9 million, $259.9 million, and $199.6 million, respectively, of incremental selling costs. All other selling costs are expensed as incurred.
The components of Cost of revenue in our Consolidated Statement of Operations are:
•Cost of property and merchandise, which includes cemetery property amortization, the direct cost of merchandise, labor-related costs for merchandise handling and delivery, cemetery maintenance expenses and depreciation, and selling costs;
•Cost of services, which includes the direct cost of providing the services (including labor-related costs), cemetery maintenance expenses and depreciation, vehicle operating costs and depreciation, and selling costs; and
•Overhead and other expenses, which includes labor-related costs, facility expenses and depreciation, and other general and administrative expenses incurred in our funeral and cemetery operations.
Corporate general and administrative expenses include labor-related costs, corporate asset depreciation and amortization, public company costs, and other general and administrative expenses incurred by our corporate functions.
Insurance-Funded Preneed Contracts
Where permitted by state or provincial law, we may sell a life insurance or annuity policy from third-party insurance companies, for which we earn a commission as general sales agent for the insurance company. These general agency commissions (GA revenue) are based on a percentage per contract sold and are recognized as funeral revenue when the insurance purchase transaction between the preneed purchaser and third-party insurance provider is completed. All selling costs incurred pursuant to the sale of insurance-funded preneed contracts are expensed as incurred. GA revenue recognized in 2022, 2021, and 2020 was $164.3 million, $157.4 million, and $124.5 million, respectively.
We do not reflect the unfulfilled insurance-funded preneed contract amounts in our Consolidated Balance Sheet. The policy amount of the insurance contract between the customer and the third-party insurance company generally equals the amount of the preneed contract. The policyholder has made a revocable commitment to assign the proceeds from the policy to us at the time of need. The proceeds of the life insurance policies or annuity contracts will be reflected in funeral revenue as we perform these funerals.
Income Taxes
We compute income taxes using the liability method. Our ability to realize the benefit of our deferred tax assets requires us to achieve certain future earnings levels. We have established a valuation allowance against a portion of our deferred tax assets. We could be required to further adjust that valuation allowance in the near term if market conditions change materially and future earnings are, or are projected to be, significantly different than our current estimates. An increase in the valuation allowance would result in additional income tax expense in such period. All deferred tax assets and liabilities, along with any related valuation allowances are classified as non-current on our Consolidated Balance Sheet.
On August 16, 2022, the Inflation Reduction Act was enacted into U.S. law. We do not currently expect that the Inflation Reduction Act will have a material impact on our income taxes.
Recently Issued Accounting Standards
Business Combinations
In October 2021, the Financial Accounting Standards Board ("FASB") amended guidance to require that an acquirer recognize and measure contract assets and contract liabilities acquired in a business combination in accordance with Topic 606. Generally, this new guidance will result in the Company recognizing contract assets and contract liabilities consistent with those reported by the acquiree immediately before the acquisition date. We have adopted the new guidance and will apply it to customer contracts acquired in business combinations, if any, after January 1, 2022. The adoption had no impact on our consolidated results of operations, consolidated financial position, and cash flows.
Financial Instruments
In March 2022, the FASB amended guidance to require public companies to disclose the vintage year of receivable write-offs during the reporting period. This new disclosure is required for us beginning with our Form 10-Q for the three months ended March 31, 2023 and we will add the additional disclosures if write-offs during the period are material. The amended guidance is not expected to have any impact on our consolidated results of operations, consolidated financial position, and cash flows.
Fair Value Measurements
In June 2022, the FASB amended guidance to clarify that the fair value of investments in equity instruments with contractual sale restrictions should not be discounted as a result of the contractual restrictions. Additionally, the new guidance mandated disclosure of the fair value of any such securities, a description of the nature and duration of the restrictions, and circumstances that could cause a lapse in the restrictions. The new guidance is effective for us beginning with valuations that occur after January 1, 2024 and is not expected to have any impact on our consolidated results of operations, consolidated financial position, and cash flows.
3. Preneed Activities
Preneed Receivables, Net and Trust Investments
The components of Preneed receivables, net and trust investments in our Consolidated Balance Sheet were as follows:
| | | | | | | | | | | |
| Years Ended December 31, |
| 2022 | | 2021 |
| | (In thousands) |
| Preneed receivables, net | $ | 1,402,209 | | | $ | 1,243,781 | |
| | | |
| Trust investments, at fair value | 5,663,163 | | | 6,536,851 | |
| | | |
| Insurance-backed fixed income securities and other | 214,440 | | | 231,589 | |
| Trust investments | 5,877,603 | | | 6,768,440 | |
| Less: Cemetery perpetual care trust investments | (1,702,313) | | | (1,996,898) | |
| Preneed trust investments | 4,175,290 | | | 4,771,542 | |
| | | |
| Preneed receivables, net and trust investments | $ | 5,577,499 | | | $ | 6,015,323 | |
Preneed receivables, net comprised the following:
| | | | | | | | | | | | | | | | | |
| December 31, 2022 |
| Funeral | | Cemetery | | Total |
| | (In thousands) |
| Preneed receivables | $ | 180,108 | | | $ | 1,267,304 | | | $ | 1,447,412 | |
| Unearned finance charges | (11,129) | | | (6,760) | | | (17,889) | |
| Preneed receivables, at amortized cost | $ | 168,979 | | | $ | 1,260,544 | | | $ | 1,429,523 | |
| Reserve for credit losses | (14,438) | | | (12,876) | | | (27,314) | |
| Preneed receivables, net | $ | 154,541 | | | $ | 1,247,668 | | | $ | 1,402,209 | |
| | | | | | | | | | | | | | | | | |
| December 31, 2021 |
| Funeral | | Cemetery | | Total |
| | (In thousands) |
| Preneed receivables | $ | 162,183 | | | $ | 1,125,539 | | | $ | 1,287,722 | |
| Unearned finance charges | (12,038) | | | (11,176) | | | (23,214) | |
| Preneed receivables, at amortized cost | $ | 150,145 | | | $ | 1,114,363 | | | $ | 1,264,508 | |
| Reserve for credit losses | (12,722) | | | (8,005) | | | (20,727) | |
| Preneed receivables, net | $ | 137,423 | | | $ | 1,106,358 | | | $ | 1,243,781 | |
52 Service Corporation International
At December 31, 2022, the amortized cost basis of our preneed receivables by year of origination was as follows:
| | | | | | | | | | | | | | | | | | | | | | | | | | | | | | | | | | | | | | | | | |
| 2022 | | 2021 | | 2020 | | 2019 | | 2018 | | Prior | | Total |
| | (In thousands) |
| Preneed receivables, at amortized cost: | | | | | | | | | | | | |
| Funeral | $ | 76,430 | | | $ | 43,211 | | | $ | 21,593 | | | $ | 11,546 | | | $ | 4,072 | | | $ | 12,127 | | | $ | 168,979 | |
| Cemetery | 541,067 | | | 362,433 | | | 204,553 | | | 88,270 | | | 39,415 | | | 24,806 | | | 1,260,544 | |
| Total preneed receivables, at amortized cost | $ | 617,497 | | | $ | 405,644 | | | $ | 226,146 | | | $ | 99,816 | | | $ | 43,487 | | | $ | 36,933 | | | $ | 1,429,523 | |
At December 31, 2022, the payment status of our preneed receivables was as follows:
| | | | | | | | | | | | | | | | | | | | | | | | | | | | | | | | | | | | | | | | | |
| Past Due | | | | |
| <30 Days | | 30-90 Days | | 90-180 Days | | >180 Days | | Total | | Current | | Total |
| | (In thousands) |
| Preneed receivables, at amortized cost: | | | | | | | | | | | | |
| Funeral | $ | 3,628 | | | $ | 3,113 | | | $ | 2,181 | | | $ | 21,732 | | | $ | 30,654 | | | $ | 138,325 | | | $ | 168,979 | |
| Cemetery | 41,043 | | | 32,948 | | | 10,126 | | | 5,077 | | | 89,194 | | | 1,171,350 | | | 1,260,544 | |
| Total preneed receivables, at amortized cost | $ | 44,671 | | | $ | 36,061 | | | $ | 12,307 | | | $ | 26,809 | | | $ | 119,848 | | | $ | 1,309,675 | | | $ | 1,429,523 | |
The following table summarizes the activity for the reserve for credit losses on preneed receivables for the twelve months ended December 31, 2022.
| | | | | | | | | | | | | | | | | | | | | | | | | | | | | | | | | | | |
| December 31, 2021 | | Provision for Expected Credit Losses | | Acquisitions (Divestitures), Net | | Write Offs | | Effect of Foreign Currency | | December 31, 2022 |
| | (In thousands) |
| Funeral | $ | (12,722) | | | $ | (4,631) | | | $ | — | | | $ | 2,907 | | | $ | 8 | | | $ | (14,438) | |
| Cemetery | (8,005) | | | (5,615) | | | — | | | 731 | | | 13 | | | (12,876) | |
| Total reserve for credit losses on preneed receivables | $ | (20,727) | | | $ | (10,246) | | | $ | — | | | $ | 3,638 | | | $ | 21 | | | $ | (27,314) | |
The table below sets forth certain investment-related activities associated with our trusts:
| | | | | | | | | | | | | | | | | |
| Years Ended December 31, |
| 2022 | | 2021 | | 2020 |
| | (In thousands) |
| Deposits | $ | 534,586 | | | $ | 519,023 | | | $ | 429,307 | |
| Withdrawals | $ | 507,872 | | | $ | 477,443 | | | $ | 424,986 | |
| Purchases of securities | $ | 1,647,032 | | | $ | 1,823,267 | | | $ | 2,147,935 | |
| Sales of securities | $ | 1,518,779 | | | $ | 1,744,618 | | | $ | 1,994,684 | |
Realized gains from sales of securities(1) | $ | 332,738 | | | $ | 584,863 | | | $ | 418,851 | |
Realized losses from sales of securities(1) | $ | (201,173) | | | $ | (91,715) | | | $ | (262,974) | |
(1)All realized gains and losses are recognized in Other income, net for our trust investments and are offset by a corresponding reclassification in Other income, net to Deferred receipts held in trust and Care trusts’ corpus.
The activity in Preneed receivables, net and trust investments was as follows:
| | | | | | | | | | | | | | | | | |
| Years Ended December 31, |
| 2022 | | 2021 | | 2020 |
| | (In thousands) |
Beginning balance - Preneed receivables, net and trust investments | $ | 6,015,323 | | | $ | 5,345,720 | | | $ | 4,789,562 | |
| Cumulative effect of accounting changes | — | | | — | | | 26,394 | |
| Net preneed contract sales | 1,978,266 | | | 1,870,972 | | | 1,494,557 | |
| Cash receipts from customers, net of refunds | (1,639,291) | | | (1,550,735) | | | (1,279,295) | |
| Deposits to trust | 468,482 | | | 452,554 | | | 373,663 | |
| Acquisitions of businesses, net | 15,860 | | | 4,912 | | | 19,299 | |
Net undistributed investment (losses) earnings (1) | (611,057) | | | 448,469 | | | 407,770 | |
| Maturities and distributed earnings | (500,216) | | | (464,247) | | | (430,608) | |
| Change in cancellation allowance | (6,609) | | | (1,523) | | | (4,468) | |
| Change in amounts due on unfulfilled performance obligations | (123,385) | | | (87,207) | | | (55,269) | |
| Effect of foreign currency and other | (19,874) | | | (3,592) | | | 4,115 | |
Ending balance - Preneed receivables, net and trust investments | $ | 5,577,499 | | | $ | 6,015,323 | | | $ | 5,345,720 | |
(1) Includes both realized and unrealized investment earnings.
54 Service Corporation International
The cost and fair values associated with trust investments recorded at fair value at December 31, 2022 and 2021 are detailed below. Cost reflects the investment (net of redemptions) of control holders in the trusts. Fair value represents the value of the underlying securities held by the trusts.
| | | | | | | | | | | | | | | | | | | | | | | | | | |
| | | December 31, 2022 |
| Fair Value Hierarchy Level | Cost | | Unrealized
Gains | | Unrealized
Losses | | Value |
| | | | | (In thousands) | | |
| Fixed income securities: | | | | | | | | |
| U.S. Treasury | 2 | $ | 45,084 | | | $ | 22 | | | $ | (2,033) | | | $ | 43,073 | |
| Canadian government | 2 | 30,200 | | | — | | | — | | | 30,200 | |
| Corporate | 2 | 175 | | | — | | | (18) | | | 157 | |
| Residential mortgage-backed | 2 | 1,420 | | | — | | | (101) | | | 1,319 | |
| Asset-backed | 2 | 294 | | | — | | | (52) | | | 242 | |
| Equity securities: | | | | | | | | |
| Preferred stock | 2 | 4,144 | | | — | | | (2,340) | | | 1,804 | |
| Common stock: | | | | | | | | |
| United States | 1 | 1,707,240 | | | 283,423 | | | (208,523) | | | 1,782,140 | |
| Canada | 1 | 47,821 | | | 11,765 | | | (11,117) | | | 48,469 | |
| Other international | 1 | 123,440 | | | 10,561 | | | (19,009) | | | 114,992 | |
| Mutual funds: | | | | | | | | |
| Equity | 1 | 917,686 | | | 64,895 | | | (112,374) | | | 870,207 | |
| Fixed income | 1 | 1,135,815 | | | 1,231 | | | (166,286) | | | 970,760 | |
| | | | | | | | |
| Trust investments, at fair value | | 4,013,319 | | | 371,897 | | | (521,853) | | | 3,863,363 | |
| Commingled funds | | | | | | | | |
| Fixed income | | 730,940 | | | 2 | | | (89,246) | | | 641,696 | |
| Equity | | 309,893 | | | 40,820 | | | (3,846) | | | 346,867 | |
| Money market funds | | 325,562 | | | — | | | — | | | 325,562 | |
| Alternative investments | | 307,275 | | | 179,491 | | | (1,091) | | | 485,675 | |
| Trust investments, at net asset value | | 1,673,670 | | | 220,313 | | | (94,183) | | | 1,799,800 | |
| Trust investments, at market | | $ | 5,686,989 | | | $ | 592,210 | | | $ | (616,036) | | | $ | 5,663,163 | |
As of December 31, 2022, our unfunded commitment for our private equity investments was $292.3 million which, if called, would be funded by the assets of the trusts.
| | | | | | | | | | | | | | | | | | | | | | | | | | |
| | | December 31, 2021 |
| Fair Value Hierarchy Level | Cost | | Unrealized
Gains | | Unrealized
Losses | | Value |
| | | | | (In thousands) | | |
| Fixed income securities: | | | | | | | | |
| U.S. Treasury | 2 | $ | 51,002 | | | $ | 795 | | | $ | (283) | | | $ | 51,514 | |
| Canadian government | 2 | 29,881 | | | 28 | | | — | | | 29,909 | |
| Corporate | 2 | 170 | | | 6 | | | (2) | | | 174 | |
| Residential mortgage-backed | 2 | 1,407 | | | 58 | | | (15) | | | 1,450 | |
| Asset-backed | 2 | 274 | | | 2 | | | (10) | | | 266 | |
| Equity securities: | | | | | | | | |
| Preferred stock | 2 | 4,843 | | | 4 | | | (1,024) | | | 3,823 | |
| Common stock: | | | | | | | | |
| United States | 1 | 1,648,785 | | | 624,349 | | | (56,092) | | | 2,217,042 | |
| Canada | 1 | 34,787 | | | 19,617 | | | (898) | | | 53,506 | |
| Other international | 1 | 129,486 | | | 42,171 | | | (9,819) | | | 161,838 | |
| Mutual funds: | | | | | | | | |
| Equity | 1 | 875,828 | | | 140,893 | | | (10,116) | | | 1,006,605 | |
| Fixed income | 1 | 1,025,327 | | | 12,560 | | | (18,675) | | | 1,019,212 | |
| Other | 3 | 187 | | | 1 | | | — | | | 188 | |
| Trust investments, at fair value | | 3,801,977 | | | 840,484 | | | (96,934) | | | 4,545,527 | |
| Commingled funds | | | | | | | | |
| Fixed income | | 662,125 | | | 115,939 | | | (3,171) | | | 774,893 | |
| Equity | | 230,926 | | | 161,125 | | | (114) | | | 391,937 | |
| Money market funds | | 408,762 | | | — | | | — | | | 408,762 | |
| Alternative investments | | 292,888 | | | 128,197 | | | (5,353) | | | 415,732 | |
| Trust investments, at net asset value | | 1,594,701 | | | 405,261 | | | (8,638) | | | 1,991,324 | |
| Trust investments, at market | | $ | 5,396,678 | | | $ | 1,245,745 | | | $ | (105,572) | | | $ | 6,536,851 | |
Our alternative investments include funds invested in limited partnerships with interests in private equity, private market real estate, energy and natural resources, infrastructure, transportation, and private debt including both distressed debt and mezzanine financing. These investments can never be redeemed by the funds. Instead, due to the nature of the investments in this category, distributions are received through the liquidation of the underlying assets of the funds. The funds' managers have not communicated the timing of any liquidations.
Maturity dates of our fixed income securities range from 2023 to 2040. Maturities of fixed income securities (excluding mutual funds) at December 31, 2022 are estimated as follows:
| | | | | |
| | Fair Value |
| | (In thousands) |
| Due in one year or less | $ | 51,365 | |
| Due in one to five years | 19,763 | |
| Due in five to ten years | 3,726 | |
| Thereafter | 137 | |
| Total estimated maturities of fixed income securities | $ | 74,991 | |
Recognized trust fund income (realized and unrealized) related to our preneed trust investments was $143.8 million, $179.7 million, and $129.1 million for the years ended December 31, 2022, 2021, and 2020, respectively. Recognized trust fund income (realized and unrealized) related to our cemetery perpetual care trust investments was $85.1 million, $96.1 million, and $77.8 million for the years ended December 31, 2022, 2021, and 2020, respectively.
56 Service Corporation International
Deferred Revenue, Net
Deferred revenue, net represents future revenue, including distributed trust investment earnings associated with unperformed trust-funded preneed contracts that are not held in trust accounts. Future revenue and net trust investment earnings that are held in trust accounts are included in Deferred receipts held in trust.
The components of Deferred revenue, net in our Consolidated Balance Sheet were as follows:
| | | | | | | | | | | | | |
| Years Ended December 31, |
| 2022 | | 2021 | | |
| | (In thousands) |
| Deferred revenue | $ | 2,472,693 | | | $ | 2,259,364 | | | |
| Amounts due from customers for unfulfilled performance obligations on cancelable preneed contracts | (848,665) | | | (726,615) | | | |
| Deferred revenue, net | $ | 1,624,028 | | | $ | 1,532,749 | | | |
The following table summarizes the activity for our contract liabilities, which are reflected in Deferred revenue, net and Deferred receipts held in trust:
| | | | | | | | | | | | | | | | | |
| Years Ended December 31, |
| 2022 | | 2021 | | 2020 |
| | (In thousands) |
Beginning balance — Deferred revenue, net and Deferred receipts held in trust | $ | 6,299,241 | | | $ | 5,761,291 | | | $ | 5,306,479 | |
| | | | | |
| Net preneed contract sales | 1,448,371 | | | 1,314,001 | | | 1,089,060 | |
| Acquisitions (dispositions) of businesses, net | 10,824 | | | 4,707 | | | 19,664 | |
Net investment (losses) gains (1) | (618,760) | | | 443,088 | | | 402,048 | |
Recognized revenue from backlog(2) | (498,242) | | | (471,160) | | | (412,127) | |
| Recognized revenue from current period sales | (726,584) | | | (669,025) | | | (598,768) | |
| Change in amounts due on unfulfilled performance obligations | (123,337) | | | (87,207) | | | (55,087) | |
| Change in cancellation reserve | 8,351 | | | (459) | | | 1,070 | |
| Effect of foreign currency and other | (12,316) | | | 4,005 | | | 8,952 | |
Ending balance — Deferred revenue, net and Deferred receipts held in trust | $ | 5,787,548 | | | $ | 6,299,241 | | | $ | 5,761,291 | |
(1)Includes both realized and unrealized investment gains (losses).
(2)Includes current year trust fund income through the date of performance.
4. Goodwill and Intangible Assets
The changes in the carrying amounts of goodwill for our funeral and cemetery reporting units are as follows:
| | | | | | | | | | | | | | | | | | | | | | | | | | | | | | | | | | | |
| Years Ended December 31, |
| 2022 | | 2021 |
| Funeral | | Cemetery | | Total | | Funeral | | Cemetery | | Total |
| (In thousands) |
Beginning balance — Goodwill | $ | 1,584,175 | | | $ | 330,907 | | | $ | 1,915,082 | | | $ | 1,551,062 | | | $ | 328,945 | | | $ | 1,880,007 | |
Increase in goodwill related to
acquisitions | 26,143 | | | 11,081 | | | 37,224 | | | 34,703 | | | 1,990 | | | 36,693 | |
Reduction of goodwill related to divestitures (1) | — | | | — | | | — | | | (2,080) | | | (28) | | | (2,108) | |
| | | | | | | | | | | |
| Effect of foreign currency | (6,718) | | | — | | | (6,718) | | | 490 | | | — | | | 490 | |
| Total activity | 19,425 | | | 11,081 | | | 30,506 | | | 33,113 | | | 1,962 | | | 35,075 | |
Ending balance — Goodwill | $ | 1,603,600 | | | $ | 341,988 | | | $ | 1,945,588 | | | $ | 1,584,175 | | | $ | 330,907 | | | $ | 1,915,082 | |
(1) Also includes reductions for businesses held for sale.
The components of intangible assets at December 31 were as follows:
| | | | | | | | | | | | | | | | | | | | | | | |
| | Useful Life | | | | |
| | Minimum | | Maximum | | 2022 | | 2021 |
| (Years) | | (In thousands) |
| Amortizing intangibles: | | | | | | | |
| Covenants-not-to-compete | 9 | - | 20 | | $ | 222,461 | | | $ | 223,854 | |
| Customer relationships | 10 | - | 20 | | 155,767 | | | 153,927 | |
| Tradenames | 5 | - | 89 | | 7,000 | | | 7,000 | |
| Other | 5 | - | 89 | | 26,927 | | | 26,927 | |
| | | | | 412,155 | | | 411,708 | |
| Less accumulated amortization: | | | | | | | |
| Covenants-not-to-compete | | | | | 205,450 | | | 203,935 | |
| Customer relationships | | | | | 101,954 | | | 96,294 | |
| Tradenames | | | | | 359 | | | 280 | |
| Other | | | | | 10,285 | | | 9,546 | |
| | | | | 318,048 | | | 310,055 | |
| | | | | | | |
| Amortizing intangibles, net | | | | | 94,107 | | | 101,653 | |
| | | | | | | |
| Non-amortizing intangibles: | | | | | | | |
| Tradenames | | | Indefinite | | 376,138 | | | 359,297 | |
| Other | | | Indefinite | | 10,765 | | | 10,765 | |
| Non-amortizing intangibles | | | | | 386,903 | | | 370,062 | |
| | | | | | | |
Intangible assets, net — included in Deferred charges and other assets, net | | $ | 481,010 | | | $ | 471,715 | |
Amortization expense for intangible assets was $18.4 million, $20.0 million, and $22.4 million for the years ended December 31, 2022, 2021, and 2020, respectively. The following is estimated amortization expense, excluding certain intangibles for which we are unable to provide an estimate because they are amortized based on specific identification in the fulfillment of performance obligations on our preneed contracts, for the five years subsequent to December 31, 2022 (in thousands):
| | | | | |
| 2023 | $ | 6,508 | |
| 2024 | 6,240 | |
| 2025 | 6,170 | |
| 2026 | 4,170 | |
| 2027 | 2,695 | |
| Total estimated amortization expense | $ | 25,783 | |
5. Income Taxes
The provision or benefit for income taxes includes U.S. federal income taxes (determined on a consolidated return basis), foreign income taxes, and state income taxes.
On August 16, 2022, the Inflation Reduction Act was enacted into U.S. law. We do not currently expect that the Inflation Reduction Act will have a material impact on our income taxes.
Income before income taxes was composed of the following components:
| | | | | | | | | | | | | | | | | |
| Years Ended December 31, |
| 2022 | | 2021 | | 2020 |
| | (In thousands) |
| United States | $ | 703,131 | | | $ | 994,632 | | | $ | 633,608 | |
| Foreign | $ | 52,497 | | | 50,868 | | | 28,452 | |
Total income before income taxes | $ | 755,628 | | | $ | 1,045,500 | | | $ | 662,060 | |
58 Service Corporation International
Income tax provision consisted of the following:
| | | | | | | | | | | | | | | | | |
| Years Ended December 31, |
| 2022 | | 2021 | | 2020 |
| (In thousands) |
| Current: | | | | | |
| United States | $ | 139,132 | | | $ | 194,545 | | | $ | 106,632 | |
| Foreign | 14,486 | | | 14,088 | | | 7,968 | |
| State | 32,505 | | | 39,452 | | | 23,439 | |
| Total current income taxes | 186,123 | | | 248,085 | | | 138,039 | |
| Deferred: | | | | | |
| United States | $ | (59) | | | $ | (3,543) | | | $ | 6,339 | |
| Foreign | 780 | | | (5,492) | | | (64) | |
| State | 2,750 | | | 3,198 | | | 1,609 | |
| Total deferred income taxes | 3,471 | | | (5,837) | | | 7,884 | |
| Total income taxes | $ | 189,594 | | | $ | 242,248 | | | $ | 145,923 | |
We made income tax payments of $183.7 million, $270.2 million, and $138.0 million in 2022, 2021, and 2020, respectively, and received refunds of $4.2 million, $4.7 million, and $5.2 million, respectively.
The differences between the U.S. federal statutory income tax rate and our effective tax rate were as follows:
| | | | | | | | | | | | | | | | | | | |
| Years Ended December 31, | | |
| 2022 | | 2021 | | 2020 | | |
| | (In thousands) | | |
| Computed tax provision at the applicable federal statutory income tax rate | $ | 158,682 | | | $ | 219,555 | | | $ | 139,031 | | | |
| State and local taxes, net of federal income tax benefits | 28,817 | | | 35,045 | | | 20,711 | | | |
| Foreign jurisdiction differences | 3,976 | | | 3,041 | | | 2,496 | | | |
| Permanent differences associated with divestitures | 200 | | | 400 | | | 73 | | | |
| Changes in uncertain tax positions and audit settlements | 53 | | | 51 | | | 100 | | | |
| Foreign valuation allowance, net of federal income tax benefits | — | | | (4,155) | | | (566) | | | |
| Excess tax benefit from share-based compensation | (8,918) | | | (12,476) | | | (9,093) | | | |
| Other | 6,784 | | | 787 | | | (6,829) | | | |
| Provision for income taxes | $ | 189,594 | | | $ | 242,248 | | | $ | 145,923 | | | |
| Total consolidated effective tax rate | 25.1 | % | | 23.2 | % | | 22.0 | % | | |
The 2022 consolidated effective tax rate was 25.1%, compared to 23.2% in 2021. The lower effective tax rate in 2021 was primarily due to non-taxable gains on the cash surrender value of certain life insurance policies and the release of a Puerto Rican valuation allowance.
Deferred taxes are determined based on differences between the financial reporting and tax bases of assets and liabilities and are measured using the enacted tax rates. The tax effects of temporary differences and carryforwards that give rise to significant portions of deferred tax assets and liabilities consisted of the following:
| | | | | | | | | | | |
| Years Ended December 31, |
| 2022 | | 2021 |
| | (In thousands) |
| Inventories and cemetery property | $ | (201,795) | | | $ | (205,660) | |
| Deferred incremental direct selling costs | (99,377) | | | (90,691) | |
| Property and equipment | (181,029) | | | (170,198) | |
| Intangibles | (204,010) | | | (203,229) | |
| Other | (5,313) | | | (3,728) | |
| Deferred tax liabilities | (691,524) | | | (673,506) | |
| Loss and tax credit carryforwards | 137,785 | | | 148,069 | |
| Deferred revenue on preneed funeral and cemetery contracts | 153,479 | | | 135,112 | |
| Accrued liabilities | 80,069 | | | 79,333 | |
| Deferred tax assets | 371,333 | | | 362,514 | |
| Less: valuation allowance | (118,939) | | | (120,739) | |
| Net deferred income tax liability | $ | (439,130) | | | $ | (431,731) | |
Deferred tax assets and deferred income tax liabilities are recognized in our Consolidated Balance Sheet as follows:
| | | | | | | | | | | |
| Years Ended December 31, |
| 2022 | | 2021 |
| (In thousands) |
Non-current deferred tax assets - included in Deferred charges and other assets, net | $ | 5,910 | | | $ | 6,171 | |
Non-current deferred tax liabilities - included in Deferred tax liability | (445,040) | | | (437,902) | |
| Net deferred income tax liability | $ | (439,130) | | | $ | (431,731) | |
As of December 31, 2022, foreign withholding taxes have not been provided on the estimated $212.6 million of undistributed earnings and profits (E&P) of our foreign subsidiaries as we intend to permanently reinvest these foreign E&P in those businesses outside the U.S. However, if we were to repatriate such foreign E&P, the foreign withholding tax liability is estimated to be $11.0 million. Additionally, if we were to repatriate E&P in excess of our previously taxed income under the Tax Cuts and Jobs Act of 2017, such excess repatriation may cause us to incur an additional U.S. federal income tax of approximately $7.7 million related to the Company’s hybrid debt accounting between Canada and the United States.
The following table summarizes the activity related to our gross unrecognized tax benefits from January 1, 2020 to December 31, 2022 (in thousands):
| | | | | |
| | Federal, State, and Foreign Tax |
| | (In thousands) |
| Balance at December 31, 2019 | $ | 1,348 | |
| Reduction to tax positions related to prior years | — | |
| Balance at December 31, 2020 | $ | 1,348 | |
| Reductions to tax positions related to prior years | — | |
| Balance at December 31, 2021 | $ | 1,348 | |
| Reductions to tax positions related to prior years | — | |
| Balance at December 31, 2022 | $ | 1,348 | |
Our total unrecognized tax benefits that, if recognized, would affect our effective tax rates were $1.3 million as of December 31, 2022, 2021 and 2020.
We include potential accrued interest and penalties related to unrecognized tax benefits within our income tax provision account. We have accrued $0.9 million, $0.8 million, and $0.7 million for the payment of interest, net of tax benefits, and penalties as of December 31, 2022, 2021 and 2020, respectively. We recorded an increase of interest and penalties of $0.1 million for each of the years ended December 31, 2022, 2021 and 2020, respectively. To the extent interest and penalties are
60 Service Corporation International
not assessed with respect to uncertain tax positions or the uncertainty of deductions in the future, amounts accrued will be reduced and reflected as a reduction of the overall income tax provision.
We file income tax returns, including tax returns for our subsidiaries, with federal, state, local, and foreign jurisdictions. We consider the United States to be our most significant jurisdiction; however, all tax returns are subject to routine compliance review by the taxing authorities in the jurisdictions in which we file tax returns in the ordinary course of business.
The federal statutes of limitations have expired for all tax years prior to 2019, and we are not currently under audit by the IRS. However, pursuant to the 2017 Tax Cuts and Jobs Act, the statute of limitations on the transition tax for the 2017 tax year does not expire until 2024. Various state jurisdictions are auditing years 2013 through 2020. There are currently no federal or provincial audits in Canada; however, years subsequent to 2016 remain open and could be subject to examination. We believe that it is reasonably possible that the recorded amount of gross unrecognized tax benefits may decrease by $1.3 million within the next twelve months as a result of concluding various state tax matters.
Various subsidiaries have federal, state, and foreign loss carryforwards in the aggregate of $2.6 billion with expiration dates through 2040. Such loss carryforwards will expire as follows:
| | | | | | | | | | | | | | | | | | | | | | | |
| Federal | | State | | Foreign | | Total |
| | (In thousands) |
| 2023 | $ | — | | | $ | 218,295 | | | $ | — | | | $ | 218,295 | |
| 2024 | — | | | 160,423 | | | 346 | | | 160,769 | |
| 2025 | — | | | 330,389 | | | 1,434 | | | 331,823 | |
| 2026 | — | | | 368,207 | | | 957 | | | 369,164 | |
| Thereafter | — | | | 1,495,467 | | | 6,598 | | | 1,502,065 | |
| Total loss carryforwards | $ | — | | | $ | 2,572,781 | | | $ | 9,335 | | | $ | 2,582,116 | |
In addition to the above loss carryforwards, we have $2.5 million of foreign alternative minimum tax credits that can be carried forward indefinitely.
In assessing the usefulness of deferred tax assets, we consider whether it is more likely than not that some portion or all of the net deferred tax assets will not be realized. The future realization of net deferred tax assets is dependent upon the generation of future taxable income during the periods in which those temporary differences become deductible. During 2022, we recorded a net $1.8 million decrease in our valuation allowance primarily due to state legislative changes. The valuation allowances can be affected in future periods by changes to tax laws, changes to statutory tax rates, and changes in estimates of future taxable income.
At December 31, 2022, our loss and tax credit carryforward deferred tax assets and related valuation allowances by jurisdiction are as follows (presented net of federal benefit).
| | | | | | | | | | | | | | | | | | | | | | | |
| Federal | | State | | Foreign | | Total |
| | | | (In thousands) | | |
| Loss and tax credit carryforwards | $ | — | | | $ | 131,805 | | | $ | 5,980 | | | $ | 137,785 | |
| Valuation allowance | $ | — | | | $ | 104,019 | | | $ | 14,920 | | | $ | 118,939 | |
6. Debt
The components of Debt are:
| | | | | | | | | | | |
| Years Ended December 31, |
| 2022 | | 2021 |
| | (In thousands) |
| 7.500% Senior Notes due April 2027 | $ | 138,274 | | | $ | 152,710 | |
| 4.625% Senior Notes due December 2027 | 550,000 | | | 550,000 | |
| 5.125% Senior Notes due June 2029 | 750,000 | | | 750,000 | |
| 3.375% Senior Notes due August 2030 | 850,000 | | | 850,000 | |
| 4.000% Senior Notes due May 2031 | 800,000 | | | 800,000 | |
| Term Loan due May 2024 | 536,250 | | | 568,750 | |
| Bank Credit Facility due May 2024 | 570,000 | | | 155,000 | |
| Obligations under finance leases | 120,837 | | | 136,847 | |
| Mortgage notes and other debt, maturities through 2050 | 66,248 | | | 48,113 | |
| Unamortized debt issuance costs | (39,865) | | | (45,100) | |
| Total debt | $ | 4,341,744 | | | $ | 3,966,320 | |
| Less: Current maturities of long-term debt | (90,661) | | | (65,016) | |
| Total long-term debt | $ | 4,251,083 | | | $ | 3,901,304 | |
Current maturities of debt at December 31, 2022 include amounts due under our term loan, mortgage notes and other debt, and finance leases within the next year as well as the portion of unamortized debt issuance costs expected to be recognized in the next twelve months.
Approximately 72% and 79% of our total debt had a fixed interest rate at December 31, 2022 and 2021, respectively.
The components of our weighted average interest rate are as follows:
| | | | | | | | | | | |
| Years Ended December 31, |
| 2022 | | 2021 |
| Fixed Debt | 4.32 | % | | 4.33 | % |
| Floating Debt | 2.95 | % | | 1.29 | % |
| Total Debt | 4.00 | % | | 3.70 | % |
The following table summarizes the aggregate maturities of our debt for the five years subsequent to December 31, 2022 and thereafter, excluding unamortized premiums and debt issuance costs (in thousands):
| | | | | |
| 2023 | $ | 90,661 | |
| 2024 | 1,094,558 | |
| 2025 | 49,570 | |
| 2026 | 10,004 | |
| 2027 | 693,481 | |
| 2028 and thereafter | 2,403,470 | |
| Total debt maturities | $ | 4,341,744 | |
Bank Credit Agreement
The bank credit agreement provides us with flexibility for working capital, if needed, and is guaranteed by a majority of our domestic subsidiaries. The subsidiary guaranty is a guaranty of payment of the outstanding amount of the total lending commitment, including letters of credit. The bank credit agreement contains certain financial covenants, including a minimum interest coverage ratio, a maximum leverage ratio, and certain dividend and share repurchase restrictions. As of December 31, 2022, we are in compliance with all of our debt covenants. At December 31, 2022, we issued $33.5 million of letters of credit and pay a quarterly fee on the unused commitment, which was 0.15%. As of December 31, 2022, we have $396.5 million in borrowing capacity under the facility.
As of December 31, 2021, we issued $34.0 million of letters of credit.
62 Service Corporation International
Debt Issuances and Additions
During the year ended December 31, 2022, we issued or added $484.0 million of debt including:
•$465.0 million on our Bank Credit Facility due May 2024; and
•$19.0 million in other debt.
The debt proceeds were used primarily for general corporate purposes.
During the year ended December 31, 2021, we issued or added $975.0 million of debt including:
•$800.0 million unsecured 4.0% Senior Notes due May 2031; and
•$175.0 million on our Bank Credit Facility due May 2024.
Newly issued debt was used to pay down our Bank Credit Facility due May 2024, to redeem our 8.0% Senior Notes due November 2021, and for general corporate purposes. These transactions resulted in additional debt issuance costs of $13.6 million.
Debt Extinguishments and Reductions
During the year ended December 31, 2022, we made aggregate debt payments of $101.9 million for scheduled and early extinguishment payments including:
•$50.0 million in aggregate principal of our Bank Credit Facility due May 2024;
•$32.5 million in aggregate principal of our Term Loan due May 2024;
•$14.4 million in aggregate principal of 7.5% Senior Notes due April 2027 repurchased on the open market;
•$1.2 million of premiums paid on early extinguishment; and
•$3.8 million in other debt.
Certain of the above transactions resulted in the recognition of a loss of $1.2 million recorded in Losses on early extinguishment of debt, net in our Consolidated Statement of Operations for the year ended December 31, 2022.
During the year ended December 31, 2021, we made aggregate debt payments of $736.0 million for scheduled and early extinguishment payments including:
•$545.0 million in aggregate principal of our Bank Credit Facility due May 2024;
•$32.5 million in aggregate principal of our Term Loan due May 2024;
•$150.0 million in aggregate principal of 8.0% Senior Notes due November 2021;
•$4.8 million of premiums paid on early extinguishment; and
•$3.7 million in other debt.
Certain of the above transactions resulted in the recognition of a loss of $5.2 million recorded in Losses on early extinguishment of debt, net in our Consolidated Statement of Operations for the year ended December 31, 2021.
Additional Debt Disclosures
At December 31, 2022 and 2021, we had deposits of $0.5 million and $0.4 million, respectively, in restricted, interest-bearing accounts that were pledged as collateral for various credit instruments and commercial commitments. These deposits are included in Other current assets and Deferred charges and other assets, net in our Consolidated Balance Sheet.
We had assets of approximately $59.8 million and $44.1 million pledged as collateral for the mortgage notes and other debt at December 31, 2022 and 2021, respectively.
Cash interest payments for the three years ended December 31 were as follows (in thousands):
| | | | | |
Payments in 2022 | $ | 164,222 | |
Payments in 2021 | $ | 142,145 | |
Payments in 2020 | $ | 152,524 | |
Expected cash interest payments on our existing long-term debt for the five years subsequent to December 31, 2022 and thereafter are as follows (in thousands):
| | | | | |
Payments in 2023 | $ | 202,876 | |
Payments in 2024 | 164,919 | |
Payments in 2025 | 137,757 | |
Payments in 2026 | 136,897 | |
Payments in 2027 | 127,562 | |
Payments in 2028 and thereafter | 241,597 | |
| Total expected cash interest payments | $ | 1,011,608 | |
Subsequent Event
In January 2023, we entered into a new bank credit agreement that consists of a $675.0 million Term Loan due January 2028 and a Bank Credit Facility due January 2028 providing for borrowings of up to $1.5 billion. Proceeds from this new bank credit agreement were used to settle our existing Term Loan due May 2024 and Bank Credit Facility due May 2024. The new bank credit agreement provides us with flexibility for working capital and other general corporate purposes, if needed, and is guaranteed by a majority of our domestic subsidiaries. The subsidiary guaranty is a guaranty of payment of the outstanding amount of the total lending commitment, including letters of credit. The bank credit agreement contains certain financial covenants, including a maximum leverage ratio and certain dividend and share repurchase restrictions. Currently, we have issued $33.5 million of letters of credit on the Bank Credit Facility due January 2028 and we have $1.0 billion in borrowing capacity under the facility.
7. Credit Risk and Fair Value of Financial Instruments
Fair Value Estimates
The fair value estimates of the following financial instruments have been determined using available market information and appropriate valuation methodologies. The carrying values of cash and cash equivalents, trade receivables, and trade payables approximate the fair values of those instruments due to the short-term nature of the instruments. The carrying values of receivables on preneed funeral and cemetery contracts approximate fair value due to the diverse number of individual contracts with varying terms.
The fair value of our debt instruments was as follows:
| | | | | | | | | | | |
| Years Ended December 31, |
| 2022 | | 2021 |
| | (In thousands) |
| 7.500% Notes due April 2027 | $ | 141,499 | | | $ | 181,511 | |
| 4.625% Senior Notes due December 2027 | 513,909 | | | 575,443 | |
| 5.125% Senior Notes due June 2029 | 709,125 | | | 809,737 | |
| 3.375% Senior Notes due August 2030 | 702,202 | | | 836,825 | |
| 4.000% Senior Notes due May 2031 | 685,680 | | | 813,552 | |
| Term Loan due May 2024 | 536,250 | | | 568,750 | |
| Bank Credit Facility due May 2024 | 570,000 | | | 155,000 | |
| Mortgage notes and other debt, maturities through 2050 | 63,168 | | | 46,878 | |
| Total fair value of debt instruments | $ | 3,921,833 | | | $ | 3,987,696 | |
The fair values of our long-term, fixed rate loans were estimated using market prices for those loans, and therefore they are classified within Level 2 of the fair value measurements hierarchy. The Term Loan, the revolving credit facility agreement, and the mortgage and other debt are classified within Level 3 of the fair value measurements hierarchy. The fair values of these instruments have been estimated using discounted cash flow analysis based on our incremental borrowing rate for similar borrowing arrangements. An increase (decrease) in the inputs results in a directionally opposite change in the fair value of the instruments.
64 Service Corporation International
Credit Risk Exposure
Our cash deposits, some of which exceed insured limits, are distributed among various market and national banks in the jurisdictions in which we operate. In addition, we regularly invest excess cash in financial instruments that are not insured, such as commercial paper that is offered by corporations with quality credit ratings and money market funds and Eurodollar time deposits that are offered by a variety of reputable financial institutions. We believe that the credit risk associated with such instruments is minimal.
We grant credit to customers in the normal course of business. The credit risk associated with our funeral, cemetery, and preneed funeral and preneed cemetery receivables due from customers is generally considered minimal because of the diversification of the customers served. Furthermore, bad debts have not been significant relative to the volume of deferred revenue. Customer payments on preneed funeral or preneed cemetery contracts that are either placed into state-regulated trusts or used to pay premiums on life insurance contracts generally do not subject us to collection risk. Insurance-funded contracts are subject to supervision by state insurance departments and are protected in the majority of states by insurance guaranty acts.
8. Leases
Our leases principally relate to office, maintenance, and transportation equipment and funeral service real estate. The majority of our lease arrangements contain options to (i) purchase the property at fair value on the exercise date, (ii) purchase the property for a value determined at the inception of the lease, or (iii) renew the lease for the fair rental value at the end of the primary lease term.
Future lease payments for non-cancelable operating and finance leases as of December 31, 2022 were as follows:
| | | | | | | | | | | | | | | | | |
| Operating | | Finance | | Total |
| (In thousands) |
| | | | | |
| 2023 | $ | 9,049 | | | $ | 46,055 | | | $ | 55,104 | |
| 2024 | 8,504 | | | 36,964 | | | 45,468 | |
| 2025 | 7,152 | | | 17,531 | | | 24,683 | |
| 2026 | 5,968 | | | 11,187 | | | 17,155 | |
| 2027 | 5,211 | | | 5,889 | | | 11,100 | |
| 2028 and thereafter | 32,940 | | | 15,159 | | | 48,099 | |
| Total lease payments | $ | 68,824 | | | $ | 132,785 | | | $ | 201,609 | |
| Less: Interest | (16,427) | | | (11,948) | | | (28,375) | |
| Present value of lease liabilities | $ | 52,397 | | | $ | 120,837 | | | $ | 173,234 | |
The components of lease cost were as follows:
| | | | | | | | | | | | | | | | | | | |
| |
| | | | | | | |
| Years Ended December 31, |
| 2022 | | 2021 | | 2020 | | |
| (In thousands) | | |
| Amortization of leased assets | $ | 35,321 | | | $ | 37,569 | | | $ | 41,938 | | | |
| Interest on lease liabilities | 3,990 | | | 4,642 | | | 5,955 | | | |
| Total finance lease cost | 39,311 | | | 42,211 | | | 47,893 | | | |
| Operating lease cost | 11,021 | | | 11,586 | | | 12,196 | | | |
| Variable lease cost | 437 | | | 178 | | | 29 | | | |
| Total lease cost | $ | 50,769 | | | $ | 53,975 | | | $ | 60,118 | | | |
Supplemental balance sheet information related to leases was as follows:
| | | | | | | | | | | | | | | | | |
| Lease Type | | Balance Sheet Classification | | December 31, 2022 | December 31, 2021 |
| | (In thousands) |
Operating lease right-of-use assets (1) | | Deferred charges and other assets | | $ | 49,741 | | $ | 53,685 | |
Finance lease right-of-use assets (1) | | Property and equipment, net | | 115,813 | | 131,420 | |
Total right-of-use assets (1) | | | | $ | 165,554 | | $ | 185,105 | |
| | | | | |
| | | | | |
| Operating | | Accounts payable and accrued liabilities | | $ | 7,083 | | $ | 8,049 | |
| Finance | | Current maturities of long-term debt | | 42,469 | | 34,222 | |
| Total current lease liabilities | | | | 49,552 | | 42,271 | |
| | | | | |
| Operating | | Other liabilities | | 45,314 | | 48,178 | |
| Finance | | Long-term debt | | 78,368 | | 102,625 | |
| Total non-current lease liabilities | | | | 123,682 | | 150,803 | |
| Total lease liabilities | | | | $ | 173,234 | | $ | 193,074 | |
| | | | | |
(1) Right-of-use assets are presented net of accumulated amortization.
The weighted-average life remaining and discount rates of our leases were as follows:
| | | | | | | | | | | | | | | | | | | | | | | |
| December 31, 2022 | | December 31, 2021 |
| Operating | | Finance | | Operating | | Finance |
| Weighted-average remaining lease term (years) | 11.8 | | 4.5 | | 12.1 | | 4.9 |
| Weighted-average discount rate | 4.0% | | 3.3% | | 3.9% | | 3.1% |
Supplemental cash flow information related to leases was as follows:
| | | | | | | | | | | | | | |
| | | | | | |
| | | Years Ended December 31, | |
| | | 2022 | 2021 | 2020 | |
| | | (In thousands) | |
| Cash paid for amounts in the measurement of lease liabilities: | | | | | | |
| Operating cash flows for operating leases | | | $ | 10,994 | | $ | 11,693 | | $ | 12,190 | | |
| Operating cash flows for finance leases | | | 3,838 | | 4,207 | | 5,446 | | |
| Financing cash flows for finance leases | | | 35,542 | | 34,617 | | 43,598 | | |
| Total cash paid for amounts included in the measurement of lease liabilities | | | $ | 50,374 | | $ | 50,517 | | $ | 61,234 | | |
| | | | | | |
| New finance leases | | | 21,148 | | 21,097 | | 23,523 | | |
| Finance lease renewals and extensions | | | (264) | | 1,095 | | — | | |
| Right-of-use assets obtained in exchange for finance lease liabilities | | | $ | 20,884 | | $ | 22,192 | | $ | 23,523 | | |
| | | | | | |
| New operating leases | | | 2,704 | | 3,268 | | 4,684 | | |
| Operating lease renewals and extensions | | | 2,324 | | 4,554 | | 4,128 | | |
| Right-of-use assets obtained in exchange for operating lease liabilities | | | $ | 5,028 | | $ | 7,822 | | $ | 8,812 | | |
During the years ended December 31, 2022 and 2021, we acquired buildings and land previously leased for our funeral service locations. These real estate acquisitions, excluded from the table above, reduced right-of-use assets by $0.1 million and $1.0 million for the years ended December 31, 2022 and 2021, respectively.
We have 59 operating leases where we are the lessor and the non-cancelable term is greater than one year, resulting in $4.3 million and $4.4 million in lease income for the years ended December 31, 2022 and 2021, respectively. We determine whether an arrangement is or contains a lease at the inception of the arrangement based on the terms of the arrangement. We lease retail space, office space, and land, and we are party to cellular agreements and land easements. The underlying assets of these lease agreements are buildings and land. We generally do not have sales-type leases, direct financing leases, or lease receivables. Certain of our agreements include variable rental income based on a percentage of sales over base
66 Service Corporation International
contractual levels. Renewal options that can be cancelled by the lessees are not included in our disclosure of future lease income, which includes only the non-cancelable terms and fixed escalation provisions. Certain lease arrangements contain options to purchase the property at fair value at the conclusion of the lease term. Non-lease components are excluded from rental income disclosures.
Future undiscounted lease income from operating leases where we are the lessor were as follows as of December 31, 2022 (in thousands):
| | | | | |
| 2023 | $ | 3,510 | |
| 2024 | 3,304 | |
| 2025 | 3,046 | |
| 2026 | 2,510 | |
| 2027 | 2,160 | |
| 2028 and thereafter | 14,864 | |
| Total expected cash receipts | $ | 29,394 | |
We own certain land, buildings, and improvements for the sole purpose of generating lease income. Property is recorded at cost, and depreciation is recognized ratably over the estimated useful lives of the various classes of assets. Buildings and improvements are depreciated over a period ranging from ten years to forty years. For these properties, we recorded depreciation expense of $0.7 million for each of the years ended December 31, 2022 and 2021 and $0.5 million for the year ended December 31, 2020. As of December 31, 2022, our Consolidated Balance Sheet includes Land of $23.8 million, and Buildings and improvements of $19.7 million, net of $2.4 million accumulated depreciation, related to these properties.
9. Commitments and Contingencies
Insurance Loss Reserves
We purchase comprehensive general liability, morticians and cemetery professional liability, automobile liability, and workers’ compensation insurance coverage structured with high deductibles. The high-deductible insurance program means we are primarily self-insured for claims and associated costs and losses covered by these policies. As of December 31, 2022 and 2021, we have self-insurance reserves of $99.3 million and $94.3 million, respectively.
Litigation and Regulatory Matters
We are a party to various litigation and regulatory matters, investigations, and proceedings. Some of the more frequent routine litigations incidental to our business are based on burial practices claims and employment-related matters, including discrimination, harassment, and wage and hour laws and regulations. For each of our outstanding legal matters, we evaluate the merits of the case, our exposure to the matter, possible legal or settlement strategies, and the likelihood of an unfavorable outcome. We intend to vigorously defend ourselves in the matters described herein; however, if we determine that an unfavorable outcome is probable and can be reasonably estimated, or if we determine an amount for which we would be willing to settle the matter to avoid further costs and risk, we establish the necessary accruals. We hold certain insurance policies that may reduce cash outflows with respect to an adverse outcome of certain of these matters. We accrue such insurance recoveries when they become probable of being paid and can be reasonably estimated.
Wage and Hour Claims. We are named as a defendant in various lawsuits alleging violations of federal and state laws regulating wage and hour pay, including but not limited to the Fredeen lawsuit described below.
Lisa Fredeen, an aggrieved employee and on behalf of other aggrieved employees v. California Cemetery and Funeral Services, LLC, et al; Case No. BC706930; in the Superior Court of the State of California for the County of Los Angeles. This lawsuit was filed against SCI subsidiaries on May 18, 2018 and purports to be brought on behalf of the defendants' current and former non-exempt California employees during the four years preceding the filing of the complaint. This lawsuit asserts numerous claims for alleged wage and hour pay violations under the California Labor Code and the California Private Attorneys General Act. The plaintiff seeks unpaid wages, compensatory and punitive damages, civil penalties, attorneys’ fees and costs, and interest. Given the nature of this lawsuit, we are unable to reasonably estimate the possible loss or ranges of loss, if any.
Operational Claims. We are named a defendant in various lawsuits alleging operational claims, including but not limited to the State of California and Taylor lawsuits described below.
The People of the State of California v. Service Corporation International, a Texas corporation, SCI Direct, Inc. a Florida Corporation, S.E. Acquisition of California, Inc., a California corporation dba Neptune Society of Northern California, Neptune Management Corp., a California corporation, Trident Society, Inc. a California corporation, and Does 1 through 100, inclusive, Case No. RG 19045103; in the Superior Court of the State of California in and for the County of Alameda. In July 2019, we received a letter from the Attorney General, State of California, Department of Justice (“CAAG") alleging that the allocation of prices among certain of our cremation service contracts and cremation merchandise contracts, and the related preneed trust funding, violates section 7735 of the California Business and Professions Code and that provisions of these same contracts constitute false advertising and deceptive sales practices in violation of California consumer protection laws. On November 21, 2019, we filed a complaint, S.E. Combined Services of California, Inc., a California Corporation dba Neptune Society of Northern California, Neptune Management Corp. a California Corporation, and Trident Society, Inc. v. Xavier Becerra, Attorney
General of the State of California, and Does 1-50, Case No. 34-2019-00269617; in the Sacramento County Superior Court seeking declaratory relief holding, in general, that our practices, methods, and documentation utilized in the sale of preneed funeral goods and services are in all respects compliant with California law. On December 2, 2019, the CAAG filed the complaint, referenced above, seeking permanent injunction from making false statements and engaging in unfair competition, a placement of funds into preneed trusts, civil penalties, customer refunds, attorneys’ fees, and costs. While we believe our contracts comply with applicable laws, the parties have engaged in settlement discussions in an effort to resolve this dispute, which may or may not be successful. We anticipate any settlement in connection with this matter may include preneed contract refunds, governmental investigative costs and other legal expenses.
Nancy Taylor, on behalf of herself and others similarly situated v. Service Corporation International and others, Case No. 20-cv-60709; in the United States District Court Southern District of Florida Fort Lauderdale Division. This case was filed in April 2020 as a Florida class action alleging that the allocation of prices among certain of our cremation service contracts and cremation merchandise contracts, and the related preneed trust funding, and the failure to disclose commissions paid and sales practices associated with the sale of third-party travel protection plans, violate the Florida Deceptive and Unfair Trade Practices Act and constitute unjust enrichment. Plaintiff seeks refunds, general, actual, compensatory and exemplary damages, civil penalties, interest, and attorney fees. The parties have reached a tentative settlement of the lawsuit that would include an immaterial payment of attorney fees and provide consumers enhanced cancellation rights for a period of sixty days. The impact of these enhanced cancellation rights is not expected to be material. The court conditionally certified the class and granted preliminary approval of the settlement.
Unclaimed Property Audit
We have received notices from auditors representing the unclaimed property departments of thirty-nine states regarding certain preneed funeral and cemetery contracts. The states claim that such contracts are subject to the states’ unclaimed property or escheatment laws and generally assert that all or a portion of the trusted preneed funds are escheatable if the beneficiary and/or purchaser is deceased or presumed deceased and no services or merchandise have been provided. We received notice that no additional property is due to be reported for the states of Alabama, Kentucky, Nebraska, New Mexico, Oklahoma, Oregon, South Carolina, South Dakota, Texas, and West Virginia. We consider the unclaimed property audits resolved in those ten states. We have reserved all of our rights, claims, and defenses. Given the nature of this matter, we are unable to reasonably estimate the possible loss or ranges of loss, if any.
We intend to vigorously defend all of the above matters; however, an adverse decision in one or more of such matters could have a material effect on us, our financial condition, results of operations, and cash flows.
10. Equity
(All shares reported in whole numbers)
Share Authorization
We are authorized to issue 1,000,000 shares of preferred stock, $1 per share par value. No preferred shares were issued as of December 31, 2022 or 2021. At December 31, 2022 and 2021, 500,000,000 common shares of $1 par value were authorized. We had 156,088,438 and 166,821,502 shares issued and 153,940,365 and 163,114,202 outstanding at par at December 31, 2022 and 2021, respectively.
Accumulated Other Comprehensive Income
The assets and liabilities of foreign operations are translated into U.S. dollars using the current exchange rate. The U.S. dollar amount that arises from such translation, as well as exchange gains and losses on intercompany balances of a long-term investment nature, are included in the cumulative currency translation adjustments in Accumulated other comprehensive income.
Share Repurchase Program
Subject to market conditions, normal trading restrictions, and limitations in our debt covenants, we may make purchases in the open market or through privately negotiated transactions under our share repurchase program. In 2022, we repurchased 10,356,250 shares of our common stock at an aggregate cost of $661.1 million, which is an average cost per share of $63.84. In 2021, we repurchased 9,437,446 shares of our common stock at an aggregate cost of $554.6 million, which is an average cost per share of $58.77. Additionally, in November 2022, our Board of Directors increased our share repurchase authorization to $600.0 million. After these repurchases and the increase in authorization, the remaining dollar value of shares authorized to be purchased under the share repurchase program was $584.2 million at December 31, 2022.
Subsequent to December 31, 2022, we repurchased 914,022 shares for $64.4 million at an average cost per share of $70.46.
68 Service Corporation International
11. Share-Based Compensation
Stock Benefit Plans
We maintain benefit plans whereby shares of our common stock may be issued pursuant to the exercise of stock options or restricted stock granted to officers and key associates. Our Amended and Restated Incentive Plan ("the 1996 Plan") reserved 44,000,000 shares of our common stock for outstanding and future awards of stock options, restricted stock, and other share-based awards to officers and key associates. In May 2017, our shareholders approved the amended 2016 Equity Incentive Plan ("the 2016 Plan"), which reserved 13,404,404 shares of common stock for outstanding and future awards of stock options, restricted stock, and other awards to officers and key associates.
Our benefit plans allow for options to be granted as either non-qualified or incentive stock options. The options historically have been granted annually, or upon hire, as approved by the Compensation Committee of the Board of Directors. The options are granted with an exercise price equal to the market price of our common stock on the date of the grant, as approved by the Compensation Committee of the Board of Directors. The options are generally exercisable at a rate of 331/3% each year unless alternative vesting methods are approved by the Compensation Committee of the Board of Directors. Outstanding options will expire, if not exercised or forfeited, within eight years from the date of grant. Restricted shares are generally expensed ratably over the period during which the restrictions lapse, which is typically 331/3% each year. At December 31, 2022 and 2021, 4,090,978 and 4,912,904 shares, respectively, were reserved for future option and restricted share grants under our stock benefit plans.
We utilize the Black-Scholes option valuation model for estimating the fair value of our stock options. This model allows the use of a range of assumptions related to volatility, risk-free interest rate, expected holding period, and dividend yield. The expected volatility utilized in the valuation model is based on the historical volatility of our stock price. The dividend yield and expected holding period are based on historical experience and management’s estimate of future events. The risk-free interest rate is derived from the U.S. Treasury yield curve based on the expected life of the option in effect at the time of grant. The fair values of our stock options are calculated using the following weighted average assumptions, based on the methods described above:
| | | | | | | | | | | | | | | | | | | | |
| | Years Ended December 31, |
| Assumptions | | 2022 | | 2021 | | 2020 |
| Dividend yield | | 1.5% | | 1.8% | | 1.7% |
| Expected volatility | | 23.9% | | 23.5% | | 18.0% |
| Risk-free interest rate | | 1.8% | | 0.4% | | 1.4% |
| Expected holding period (years) | | 4.0 | | 4.0 | | 3.7 |
The following table summarizes certain information with respect to stock option and restricted share compensation included in our Consolidated Statement of Operations:
| | | | | | | | | | | | | | | | | |
| Years Ended December 31, |
| | 2022 | | 2021 | | 2020 |
| | (In thousands) |
| Total pretax employee share-based compensation expense included in net income | $ | 14,709 | | | $ | 14,168 | | | $ | 14,103 | |
| Income tax benefit related to share-based compensation included in net income | $ | 3,877 | | | $ | 3,537 | | | $ | 3,417 | |
Stock Options
The following table sets forth stock option activity for the year ended December 31, 2022 (shares reported in whole numbers):
| | | | | | | | | | | |
| Options | | Weighted-Average
Exercise Price |
Outstanding at December 31, 2021 | 5,922,692 | | | $ | 36.50 | |
| Granted | 561,200 | | | $ | 59.76 | |
| Exercised | (1,010,366) | | | $ | 27.81 | |
| | | |
| Cancelled | (12,421) | | | $ | 50.80 | |
Outstanding at December 31, 2022 | 5,461,105 | | | $ | 40.47 | |
Exercisable at December 31, 2022 | 4,164,190 | | | $ | 36.17 | |
The aggregate intrinsic value for stock options outstanding and exercisable was $156.6 million and $137.3 million, respectively, at December 31, 2022.
Set forth below is certain information related to stock options outstanding and exercisable at December 31, 2022 (shares reported in whole numbers):
| | | | | | | | | | | | | | | | | | | | | | | | | | | | | | | | |
| | | Options Outstanding | | Options Exercisable |
| Range of Exercise Price | | Number Outstanding at December 31, 2022 | | Weighted-Average Remaining Contractual Life
(in years) | | Weighted-
Average Exercise Price | | Number Exercisable at December 31, 2022 | | Weighted-
Average Exercise Price |
| $0.00 — 25.00 | | 773,962 | | | 1.1 | | $ | 22.28 | | | 773,962 | | | $ | 22.28 | |
| $25.01 — 35.00 | | 966,250 | | | 2.1 | | $ | 29.25 | | | 966,250 | | | $ | 29.25 | |
| $35.01 — 45.00 | | 1,600,987 | | | 3.6 | | $ | 39.68 | | | 1,600,987 | | | $ | 39.68 | |
| $45.01 — 55.00 | | 1,560,676 | | | 5.5 | | $ | 50.32 | | | 822,991 | | | $ | 50.51 | |
| $55.01 — 65.00 | | 559,230 | | | 7.1 | | $ | 59.76 | | | — | | | $ | — | |
$0.00 — 65.00
| | 5,461,105 | | | 3.9 | | $ | 40.47 | | | 4,164,190 | | | $ | 36.17 | |
Other information pertaining to stock options was as follows (in thousands, except weighted-average grant date fair value):
| | | | | | | | | | | | | | | | | |
| Years Ended December 31, |
| 2022 | | 2021 | | 2020 |
| Weighted average grant-date fair value of stock options granted | $ | 11.02 | | | $ | 7.50 | | | $ | 6.44 | |
| Total fair value of stock options vested | $ | 5,538 | | | $ | 5,708 | | | $ | 5,535 | |
| Total intrinsic value of stock options exercised | $ | 42,700 | | | $ | 59,180 | | | $ | 41,995 | |
Cash received from the exercise of stock options | $ | 27,814 | | | $ | 39,354 | | | $ | 26,671 | |
Recognized compensation expense | $ | 5,738 | | | $ | 5,514 | | | $ | 5,668 | |
As of December 31, 2022, the unrecognized compensation expense related to stock options of $6.4 million is expected to be recognized over a weighted average period of 1.8 years.
Restricted Shares
The fair value of our restricted share awards and units, as determined on the grant date, is being amortized and charged to income (with an offsetting credit to Capital in excess of par value) generally over the average period during which the restrictions lapse.
Restricted share award activity was as follows (share awards reported in whole numbers):
| | | | | | | | | | | |
| Restricted
Share Awards | | Weighted-Average
Grant-Date
Fair Value |
Nonvested restricted share awards at December 31, 2021 | 229,910 | | | $ | 48.76 | |
| Granted | 101,543 | | | $ | 59.76 | |
| Vested | (116,561) | | | $ | 36.15 | |
| Forfeited and other | (2,777) | | | $ | 53.97 | |
Nonvested restricted share awards at December 31, 2022 | 212,115 | | | $ | 54.66 | |
Other information pertaining to restricted share awards was as follows (in thousands, except weighted-average grant date fair value):
| | | | | | | | | | | | | | | | | |
| Years Ended December 31, |
| 2022 | | 2021 | | 2020 |
Recognized compensation expense related to restricted share awards | $ | 5,739 | | | $ | 5,647 | | | $ | 5,568 | |
Weighted-average grant date fair value for nonvested restricted stock granted | $ | 59.76 | | | $ | 49.59 | | | $ | 50.82 | |
Total fair market value of restricted share awards vested | $ | 5,639 | | | $ | 5,496 | | | $ | 5,674 | |
Aggregate intrinsic value of restricted share awards vested | $ | 2,552 | | | $ | 3,513 | | | $ | 2,100 | |
At December 31, 2022, unrecognized compensation expense of $6.8 million related to restricted share awards is expected to be recognized over a weighted average period of 1.7 years.
70 Service Corporation International
Restricted share units activity was as follows (share units reported in whole numbers):
| | | | | | | | | | | |
| Restricted
Share Units | | Weighted-Average
Grant-Date
Fair Value |
Nonvested restricted share units at December 31, 2021 | 128,171 | | | $ | 47.87 | |
| Granted | 58,012 | | | $ | 59.76 | |
| Vested | (61,877) | | | $ | 46.55 | |
| Forfeited and other | (5,370) | | | $ | 54.07 | |
Nonvested restricted share units at December 31, 2022 | 118,936 | | | $ | 54.31 | |
Other information pertaining to restricted share units was as follows (in thousands, except weighted-average grant date fair value):
| | | | | | | | | | | | | | | | | |
| Years Ended December 31, |
| 2022 | | 2021 | | 2020 |
Recognized compensation expense related to restricted share units | $ | 3,232 | | | $ | 3,007 | | | $ | 2,867 | |
Weighted-average grant date fair value for nonvested restricted share units granted | $ | 59.76 | | | $ | 49.59 | | | $ | 48.89 | |
Total fair market value of restricted share units vested | $ | 3,143 | | | $ | 2,883 | | | $ | 2,722 | |
Aggregate intrinsic value of restricted share units vested | $ | 1,447 | | | $ | 1,911 | | | $ | 1,004 | |
At December 31, 2022, the unrecognized compensation expense related to restricted share units of $3.7 million is expected to be recognized over a weighted average period of 1.7 years.
Performance Units
During 2022, 2021, and 2020 we granted 99,923, 111,449 and 112,762 performance units, respectively. At December 31, 2022, there were 333,379 performance units outstanding. Total compensation expense for performance units was $14.6 million, $19.5 million, and $8.6 million for the years ended December 31, 2022, 2021, and 2020, respectively. For the year ended December 31, 2022 and 2021, cash paid to settle performance units was $10.9 million and $12.4 million, respectively. The fair value of the liability for these awards is calculated using a Monte Carlo simulation. The weighted average key assumptions as of December 31, 2022 were as follows:
| | | | | |
| |
Share price at beginning of performance period | $ | 54.78 | |
Risk-free interest rate | 4.58 | % |
Expected volatility | 29.3 | % |
Fair value of share-based performance units outstanding | $ | 69.14 | |
At December 31, 2022, the unrecognized compensation expense related to performance units of $11.7 million is expected to be recognized over a weighted average period of 1.6 years.
12. Retirement Plans
We currently have a supplemental retirement plan for certain current and former key employees (SERP), a supplemental retirement plan for officers and certain key employees (Senior SERP), and a Stewart Supplemental Retirement Plan (collectively, the “Plans”). All of our Plans are unfunded and have a measurement date of December 31.
The Plans are frozen; therefore, the participants do not earn incremental benefits from additional years of service, and we do not incur any additional service cost.
Retirement benefits under the SERP are based on years of service and average monthly compensation, reduced by benefits under Social Security. The Senior SERP provides retirement benefits based on years of service and position.
In October 2022, we terminated our retirement plan for certain non-employee directors and paid out, in a discounted lump sum, all benefits to the participants or their heirs in the amount of $0.8 million. In December 2022, we amended the Senior SERP to terminate the participation of all our active employees and those participants were paid their benefits, in a discounted lump sum, in the amount of $0.7 million.
We recognize pension related gains and losses in Other income, net on our Consolidated Statement of Operations in the year such gains and losses are incurred. The components of the Plans’ net periodic benefit cost were as follows:
| | | | | | | | | | | | | | | | | |
| Years Ended December 31, |
| 2022 | | 2021 | | 2020 |
| | (In thousands) |
| Interest cost on projected benefit obligation | $ | 535 | | | $ | 482 | | | $ | 698 | |
| Recognized net actuarial (gains) losses | (3,254) | | | (353) | | | 1,641 | |
| Total net periodic benefit cost | $ | (2,719) | | | $ | 129 | | | $ | 2,339 | |
The Plans’ funded status were as follows:
| | | | | | | | | | | |
| Years Ended December 31, |
| 2022 | | 2021 |
| | (In thousands) |
| Change in Benefit Obligation: | | | |
| Benefit obligation at beginning of year | $ | 22,381 | | | $ | 24,635 | |
| Interest cost | 535 | | | 482 | |
| Actuarial gain | (3,254) | | | (353) | |
Benefits paid (1) | (3,756) | | | (2,383) | |
| Benefit obligation at end of year | $ | 15,906 | | | $ | 22,381 | |
| Change in Plan Assets: | | | |
| Fair value of plan assets at beginning of year | $ | — | | | $ | — | |
| Employer contributions | 3,756 | | | 2,383 | |
Benefits paid, including expenses (1) | (3,756) | | | (2,383) | |
| Fair value of plan assets at end of year | $ | — | | | $ | — | |
| Funded status of plan | $ | (15,906) | | | $ | (22,381) | |
| | | |
| Funding Summary: | | | |
| Projected benefit obligation | $ | 15,906 | | | $ | 22,381 | |
| Accumulated benefit obligation | $ | 15,906 | | | $ | 22,381 | |
| Amounts Recognized in the Consolidated Balance Sheet: | | | |
Included in Accounts payable and accrued liabilities | $ | (2,236) | | | $ | (2,431) | |
Included in Other liabilities | (13,670) | | | (19,950) | |
| Total accrued liability | $ | (15,906) | | | $ | (22,381) | |
(1) In 2022, we terminated our Directors' Plan and amended Senior SERP to terminate the participation of all our active employees and paid out, in a discounted lump sum, all benefits to the participants or their heirs in the amount of $1.5 million.
The retirement benefits under the Plans are unfunded obligations of the Company. We have purchased various life insurance policies on the participants in the Plans with the intent to use the proceeds or any cash value buildup from these policies to assist in meeting, at least to the extent of such assets, the Plans' funding requirements. The face value of these insurance policies at December 31, 2022 and 2021 was $49.8 million and $49.4 million, respectively, and the cash surrender value was $40.7 million and $39.9 million, respectively. The outstanding loans against the policies are minimal and there are no restrictions in the policies regarding loans.
The Plans’ weighted-average assumptions used to determine the benefit obligation and net periodic benefit cost are as follows:
| | | | | | | | | | | | | | | | | |
| Years Ended December 31, |
| 2022 | | 2021 | | 2020 |
| Weighted-average discount rate used to determine obligations | 5.34 | % | | 2.52 | % | | 2.06 | % |
| Weighted-average discount rate used to determine net periodic benefit cost | 2.52 | % | | 2.42 | % | | 2.98 | % |
We determine our discount rate used to compute future benefit obligations using an analysis of expected future benefit payments. The reasonableness of our discount rate is verified by comparing the rate to the rate earned on high-quality fixed income investments, such as the Moody’s Aa index, plus 50 basis points. The assumed rate of return on plan assets was not applicable as we pay plan benefits as they come due. As all Plans are frozen, the assumed rate of compensation increase is zero.
72 Service Corporation International
The following benefit payments are expected to be paid over the next ten years related to our Plans (in thousands):
| | | | | |
| 2023 | $ | 1,990 | |
| 2024 | 1,796 | |
| 2025 | 1,696 | |
| 2026 | 1,649 | |
| 2027 | 1,571 | |
| Years 2028 through 2032 | 6,595 | |
| Total expected benefit payments | $ | 15,297 | |
We also have an employee savings plan that qualifies under Section 401(k) of the Internal Revenue Code for the exclusive benefit of our United States employees. Under the plan, participating employees may contribute a portion of their pretax and/or after-tax income in accordance with specified guidelines up to a maximum of 50%.
During 2022, 2021, and 2020, we matched a percentage of the employee contributions through contributions of cash. For these years, our matching contribution was based upon the following:
| | | | | | | | |
| Years of Vesting Service | | Percentage of Deferred Compensation |
| 0 — 5 years | | 75% of the first 6% of deferred compensation |
| 6 — 10 years | | 100% of the first 6% of deferred compensation |
| 11 or more years | | 125% of the first 6% of deferred compensation |
The amount of our matched contributions in 2022, 2021, and 2020 was $49.6 million, $46.0 million, and $39.8 million, respectively.
13. Segment Reporting
Our operations are both product-based and geography-based, and the reportable operating segments presented below include our funeral and cemetery operations. Our geographic areas include the United States and Canada, where we conduct both funeral and cemetery operations.
Our reportable segment information, including disaggregated revenue, was as follows and includes a reconciliation of gross profit to our consolidated income before income taxes.
| | | | | | | | | | | | | | | | | | | |
| Years Ended December 31, | | |
| 2022 | | 2021 | | 2020 | | |
| | (In thousands) | | |
| Revenue from customers: | | | | | | | |
| Funeral revenue: | | | | | | | |
| Atneed revenue | $ | 1,242,269 | | | $ | 1,268,111 | | | $ | 1,092,016 | | | |
| Matured preneed revenue | 705,273 | | | 700,473 | | | 662,675 | | | |
| Core funeral revenue | 1,947,542 | | | 1,968,584 | | | 1,754,691 | | | |
| Non-funeral home revenue | 76,311 | | | 74,099 | | | 61,198 | | | |
| Recognized preneed revenue | 164,493 | | | 159,595 | | | 124,645 | | | |
| Other revenue | 143,699 | | | 140,898 | | | 111,767 | | | |
| Total funeral revenue | 2,332,045 | | | 2,343,176 | | | 2,052,301 | | | |
| Cemetery revenue: | | | | | | | |
| Atneed revenue | 448,143 | | | 477,950 | | | 386,850 | | | |
| Recognized preneed property revenue | 868,740 | | | 846,528 | | | 659,950 | | | |
| | | | | | | |
| | | | | | | |
| | | | | | | |
| Recognized preneed merchandise and services revenue | 338,463 | | | 343,899 | | | 298,864 | | | |
| Core cemetery revenue | 1,655,346 | | | 1,668,377 | | | 1,345,664 | | | |
| Other revenue | 121,270 | | | 131,590 | | | 113,544 | | | |
| Total cemetery revenue | 1,776,616 | | | 1,799,967 | | | 1,459,208 | | | |
| Total revenue from customers | $ | 4,108,661 | | | $ | 4,143,143 | | | $ | 3,511,509 | | | |
| Gross profit: | | | | | | | |
| Funeral gross profit | $ | 545,693 | | | $ | 639,775 | | | $ | 506,535 | | | |
| Cemetery gross profit | 608,909 | | | 683,300 | | | 485,904 | | | |
| Gross profit from reportable segments | 1,154,602 | | | 1,323,075 | | | 992,439 | | | |
| Corporate general and administrative expenses | (237,248) | | | (157,568) | | | (156,678) | | | |
| Gains on divestitures and impairment charges, net | 9,962 | | | 25,169 | | | 7,009 | | | |
| | | | | | | |
| Operating income | 927,316 | | | 1,190,676 | | | 842,770 | | | |
| Interest expense | (172,109) | | | (150,610) | | | (163,063) | | | |
| Losses on early extinguishment of debt, net | (1,225) | | | (5,226) | | | (18,428) | | | |
| Other income, net | 1,646 | | | 10,660 | | | 781 | | | |
| Income before income taxes | $ | 755,628 | | | $ | 1,045,500 | | | $ | 662,060 | | | |
74 Service Corporation International
Other reportable segment information as of and for the year ended December 31 were as follows:
| | | | | | | | | | | | | | | | | | | | | | | |
| Reportable Segments | | | | |
| Funeral | | Cemetery | | Corporate | | Consolidated |
| | (In thousands) |
| 2022 | | | | | | | |
| | | | | | | |
| Interest expense | $ | 1,734 | | | $ | 493 | | | $ | 169,882 | | | $ | 172,109 | |
| Depreciation and amortization | $ | 123,165 | | | $ | 41,502 | | | $ | 10,663 | | | $ | 175,330 | |
| Amortization of intangibles | $ | 11,735 | | | $ | 6,620 | | | $ | — | | | $ | 18,355 | |
| | | | | | | |
| Amortization of cemetery property | $ | — | | | $ | 94,123 | | | $ | — | | | $ | 94,123 | |
| Capital expenditures | $ | 153,224 | | | $ | 196,371 | | | $ | 20,114 | | | $ | 369,709 | |
| Total assets | $ | 6,236,270 | | | $ | 8,404,900 | | | $ | 424,867 | | | $ | 15,066,037 | |
| 2021 | | | | | | | |
| | | | | | | |
| Interest expense | $ | 2,864 | | | $ | 681 | | | $ | 147,065 | | | $ | 150,610 | |
| Depreciation and amortization | $ | 111,687 | | | $ | 37,373 | | | $ | 10,246 | | | $ | 159,306 | |
| Amortization of intangibles | $ | 12,980 | | | $ | 7,016 | | | $ | 6 | | | $ | 20,002 | |
| | | | | | | |
| Amortization of cemetery property | $ | — | | | $ | 98,162 | | | $ | — | | | $ | 98,162 | |
| Capital expenditures | $ | 139,420 | | | $ | 148,737 | | | $ | 15,503 | | | $ | 303,660 | |
| Total assets | $ | 6,381,280 | | | $ | 8,788,833 | | | $ | 521,065 | | | $ | 15,691,178 | |
| 2020 | | | | | | | |
| | | | | | | |
| Interest expense | $ | 3,896 | | | $ | 514 | | | $ | 158,653 | | | $ | 163,063 | |
| Depreciation and amortization | $ | 106,661 | | | $ | 34,117 | | | $ | 14,521 | | | $ | 155,299 | |
| Amortization of intangibles | $ | 13,593 | | | $ | 8,841 | | | $ | 10 | | | $ | 22,444 | |
| | | | | | | |
| Amortization of cemetery property | $ | — | | | $ | 80,403 | | | $ | — | | | $ | 80,403 | |
| Capital expenditures | $ | 86,518 | | | $ | 132,214 | | | $ | 3,479 | | | $ | 222,211 | |
Our geographic area information as of and for the year ended December 31 were as follows:
| | | | | | | | | | | | | | | | | |
| United States | | Canada | | Total |
| | (In thousands) |
| 2022 | | | | | |
| Revenue from external customers | $ | 3,876,689 | | | $ | 231,972 | | | $ | 4,108,661 | |
| Interest expense | $ | 171,912 | | | $ | 197 | | | $ | 172,109 | |
| Depreciation and amortization | $ | 165,004 | | | $ | 10,326 | | | $ | 175,330 | |
| Amortization of intangibles | $ | 18,080 | | | $ | 275 | | | $ | 18,355 | |
| Amortization of cemetery property | $ | 89,545 | | | $ | 4,578 | | | $ | 94,123 | |
| Operating income | $ | 856,277 | | | $ | 71,039 | | | $ | 927,316 | |
| Gains on divestitures and impairment charges, net | $ | 7,220 | | | $ | 2,742 | | | $ | 9,962 | |
| Long-lived assets | $ | 7,094,859 | | | $ | 331,520 | | | $ | 7,426,379 | |
| 2021 | | | | | |
| Revenue from external customers | $ | 3,918,777 | | | $ | 224,366 | | | $ | 4,143,143 | |
| Interest expense | $ | 150,385 | | | $ | 225 | | | $ | 150,610 | |
| Depreciation and amortization | $ | 149,351 | | | $ | 9,955 | | | $ | 159,306 | |
| Amortization of intangibles | $ | 19,721 | | | $ | 281 | | | $ | 20,002 | |
| Amortization of cemetery property | $ | 92,128 | | | $ | 6,034 | | | $ | 98,162 | |
| Operating income | $ | 1,120,154 | | | $ | 70,522 | | | $ | 1,190,676 | |
| Gains on divestitures and impairment charges, net | $ | 19,837 | | | $ | 5,332 | | | $ | 25,169 | |
| Long-lived assets | $ | 6,895,439 | | | $ | 342,458 | | | $ | 7,237,897 | |
| 2020 | | | | | |
| Revenue from external customers | $ | 3,328,381 | | | $ | 183,128 | | | $ | 3,511,509 | |
| Interest expense | $ | 162,804 | | | $ | 259 | | | $ | 163,063 | |
| Depreciation and amortization | $ | 146,378 | | | $ | 8,921 | | | $ | 155,299 | |
| Amortization of intangibles | $ | 22,132 | | | $ | 312 | | | $ | 22,444 | |
| Amortization of cemetery property | $ | 76,275 | | | $ | 4,128 | | | $ | 80,403 | |
| Operating income | $ | 795,461 | | | $ | 47,309 | | | $ | 842,770 | |
| Gains on divestitures and impairment charges, net | $ | 6,935 | | | $ | 74 | | | $ | 7,009 | |
14. Supplementary Information
The detail of certain balance sheet accounts is as follows:
| | | | | | | | | | | |
| | Years Ended December 31, |
| | 2022 | | 2021 |
| | (In thousands) |
| Cash and cash equivalents: | | | |
| Cash | $ | 147,408 | | | $ | 260,750 | |
| Commercial paper and temporary investments | 44,530 | | | 7,876 | |
| | $ | 191,938 | | | $ | 268,626 | |
| Other current assets: | | | |
| Income tax receivable | $ | 7,018 | | | $ | 13,635 | |
| Prepaid insurance | 5,035 | | | 4,583 | |
| | | |
| Restricted cash | 10,379 | | | 7,847 | |
| Other | 17,055 | | | 14,383 | |
| | $ | 39,487 | | | $ | 40,448 | |
| Cemetery property: | | | |
| Undeveloped land | $ | 1,304,514 | | | $ | 1,297,453 | |
| Developed lots, lawn crypts, mausoleum spaces, cremation niches, and cremation memorialization property | 635,302 | | | 603,391 | |
| | $ | 1,939,816 | | | $ | 1,900,844 | |
| Property and equipment, net: | | | |
| Land | $ | 711,672 | | | $ | 701,337 | |
| Buildings and improvements | 2,581,695 | | | 2,445,913 | |
| Operating equipment | 702,028 | | | 661,486 | |
| Leasehold improvements | 44,044 | | | 42,387 | |
| Finance leases | 332,301 | | | 325,823 | |
| | 4,371,740 | | | 4,176,946 | |
| Less: Accumulated depreciation | (1,804,703) | | | (1,730,385) | |
| Less: Accumulated amortization of finance leases | (216,488) | | | (194,403) | |
| | $ | 2,350,549 | | | $ | 2,252,158 | |
| Deferred charges and other assets: | | | |
| Intangible assets, net | $ | 481,010 | | | $ | 471,715 | |
| Restricted cash | 2,207 | | | 2,082 | |
| Deferred tax assets | 5,910 | | | 6,171 | |
Notes receivable, net of reserves of $2,546 and $3,424, respectively | 6,821 | | | 5,260 | |
| Cash surrender value of insurance policies | 199,516 | | | 225,857 | |
| Deferred incremental direct selling costs | 384,108 | | | 347,448 | |
| Operating leases | 49,741 | | | 53,685 | |
| Other | 61,113 | | | 57,595 | |
| | $ | 1,190,426 | | | $ | 1,169,813 | |
76 Service Corporation International
| | | | | | | | | | | |
| | Years Ended December 31, |
| | 2022 | | 2021 |
| | (In thousands) |
| Accounts payable and accrued liabilities: | | | |
| Accounts payable | $ | 177,970 | | | $ | 204,094 | |
| Accrued benefits | 198,260 | | | 184,007 | |
| Accrued interest | 23,602 | | | 22,565 | |
| Accrued property taxes | 15,151 | | | 14,980 | |
| Self-insurance reserves | 99,252 | | | 94,268 | |
| Legal reserves | 76,866 | | | 10,315 | |
| Bank overdrafts | 39,695 | | | 39,043 | |
| Operating leases | 7,083 | | | 8,049 | |
| Other accrued liabilities | 69,609 | | | 82,173 | |
| | $ | 707,488 | | | $ | 659,494 | |
| Other liabilities: | | | |
| Accrued benefit costs | $ | 13,670 | | | $ | 19,950 | |
| Deferred compensation | 174,035 | | | 201,401 | |
| Customer refund obligation reserve | 37,805 | | | 46,241 | |
| Tax liability | 2,208 | | | 2,156 | |
| Payable to perpetual care trust | 127,662 | | | 110,279 | |
| Operating leases | 45,314 | | | 48,178 | |
| Other | 10,682 | | | 10,698 | |
| | $ | 411,376 | | | $ | 438,903 | |
Certain Non-Cash Investing and Financing Transactions
| | | | | | | | | | | | | | | | | |
| | Years Ended December 31, |
| | 2022 | | 2021 | | 2020 |
| | (In thousands) |
| Net change in capital expenditure accrual | $ | 3,817 | | | $ | 3,201 | | | $ | (6,417) | |
| Options exercised by attestation | $ | 280 | | | $ | 323 | | | $ | — | |
| Shares repurchased | $ | (280) | | | $ | (323) | | | $ | — | |
| | | | | |
15. Earnings Per Share
Basic earnings per common share (EPS) excludes dilution and is computed by dividing Net income attributable to common stockholders by the weighted average number of common shares outstanding for the period. Diluted EPS reflects the potential dilution that could occur if securities or other obligations to issue common stock were exercised or converted into common stock or resulted in the issuance of common stock that shared in our earnings.
A reconciliation of the numerators and denominators of basic and diluted EPS is presented below:
| | | | | | | | | | | | | | | | | |
| Years Ended December 31, |
| 2022 | | 2021 | | 2020 |
| | (In thousands, except per share amounts) |
| Amounts attributable to common stockholders: | | | | | |
| | | | | |
| | | | | |
| | | | | |
| | | | | |
| | | | | |
| | | | | |
| Net income — basic and diluted | 565,338 | | | 802,939 | | | 515,907 | |
| | | | | |
| | | | | |
| Weighted average shares: | | | | | |
| Weighted average shares — basic | 157,713 | | | 167,542 | | | 176,709 | |
| Stock options | 2,343 | | | 2,501 | | | 2,234 | |
| Restricted share units | 75 | | | 71 | | | 47 | |
| | | | | |
| Weighted average shares — diluted | 160,131 | | | 170,114 | | | 178,990 | |
| Amounts attributable to common stockholders: | | | | | |
| Income from continuing operations per share: | | | | | |
| | | | | |
| | | | | |
| | | | | |
| | | | | |
| | | | | |
| Net income per share: | | | | | |
| Basic | $ | 3.58 | | | $ | 4.79 | | | $ | 2.92 | |
| Diluted | $ | 3.53 | | | $ | 4.72 | | | $ | 2.88 | |
The computation of diluted earnings per share excludes outstanding stock options in certain periods in which the inclusion of such options would be antidilutive to the periods presented. Total antidilutive options not currently included in the computation of dilutive EPS are as follows (in shares):
| | | | | | | | | | | | | | | | | |
| Years Ended December 31, |
| | 2022 | | 2021 | | 2020 |
| (In thousands) |
| Antidilutive options | 490 | | | — | | | 1,614 | |
| | | | | |
| | | | | |
| | | | | |
78 Service Corporation International
16. Acquisitions and Divestiture-Related Activities
Acquisitions
In the fourth quarter of 2022, we acquired ten funeral homes and three cemeteries in California as part of two acquisitions (the "2022 California Businesses") for $71.2 million in cash. This amount includes the use of $13.2 million in IRS Section 1031 exchange funds.
The primary reasons for the acquisitions and the principal factors that contributed to the recognition of goodwill in these acquisitions were:
•the acquisitions enhance our network footprint, enabling us to serve a number of new, complementary areas; and
•the acquisitions of the preneed backlog of deferred revenues enhance our long-term stability.
The following table summarizes the fair values of the assets acquired and liabilities assumed in the acquisitions (in thousands):
| | | | | | | | |
| | | | |
| | |
| Other current assets | $ | 241 | | | | |
| Cemetery property | 5,840 | | | | |
| Property and equipment, net | 19,194 | | | | |
| Preneed receivables, net and trust investments | 8,099 | | | | |
| | | | |
| Indefinite-lived intangible assets | 17,149 | | | | |
| Deferred charges and other assets | 158 | | | | |
| Cemetery perpetual care trust investments | 6,461 | | | | |
| Goodwill | 26,098 | | | | |
| Total assets acquired | 83,240 | | | | |
| | | | |
| Current liabilities | 439 | | | | |
| Deferred revenue and deferred receipts held in trust | 3,183 | | | | |
| Care trusts' corpus | 6,461 | | | | |
| Other liabilities | 1,937 | | | | |
| Total liabilities assumed | 12,020 | | | | |
| | | | |
| Net assets acquired | $ | 71,220 | | | | |
| | | | |
Purchase accounting is preliminary because we have not finalized our assessment of the fair value because there has been insufficient time between the acquisition date and the issuance of these financial statements to complete our review and final determination of fair value.
Goodwill, land, and certain identifiable intangible assets recorded in the acquisitions are not subject to amortization; however, the goodwill and intangible assets will be tested periodically for impairment. Of the $26.1 million in goodwill recognized, all of which is deductible for tax purposes, $11.3 million was allocated to our cemetery segment and $14.8 million was allocated to our funeral segment. The identified intangible assets are indefinite lived tradenames with a fair value of $17.1 million.
We incurred acquisition costs of $0.2 million, which is included in Corporate general and administrative expenses in our Consolidated Statement of Operations for the year ended December 31, 2022. The 2022 California Businesses contributed revenue of $1.9 million and net income of $0.5 million from acquisition through December 31, 2022.
In December 2021, we acquired twenty-one funeral homes and one cemetery in two states as part of two acquisitions (the "Ohio and California Businesses") for $94.8 million in cash. This amount includes the use of $6.1 million in IRS Section 1031 exchange funds.
The primary reasons for the acquisitions and the principal factors that contributed to the recognition of goodwill in these acquisitions were:
•the acquisitions enhance our network footprint, enabling us to serve a number of new, complementary areas; and
•the acquisitions of the preneed backlog of deferred revenues enhance our long-term stability.
The following table summarizes the fair values of the assets acquired and liabilities assumed in the acquisitions (in thousands):
| | | | | | | | |
| | | | |
| | |
| Other current assets | $ | 140 | | | | |
| Cemetery property | 2,918 | | | | |
| Property and equipment, net | 36,768 | | | | |
| Preneed receivables, net and trust investments | 7,732 | | | | |
| Finite-lived intangible assets | 3,900 | | | | |
| Indefinite-lived intangible assets | 24,734 | | | | |
| Deferred charges and other assets | 128 | | | | |
| Cemetery perpetual care trust investments | 1,484 | | | | |
| Goodwill | 29,683 | | | | |
| Total assets acquired | 107,487 | | | | |
| | | | |
| Current liabilities | 660 | | | | |
| Deferred revenue and deferred receipts held in trust | 7,204 | | | | |
| Care trusts' corpus | 1,484 | | | | |
| Other liabilities | 3,336 | | | | |
| Total liabilities assumed | 12,684 | | | | |
| | | | |
| Net assets acquired | $ | 94,803 | | | | |
| | | | |
Goodwill, land, and certain identifiable intangible assets recorded in the acquisitions are not subject to amortization; however, the goodwill and intangible assets will be tested periodically for impairment. Of the $29.7 million in goodwill recognized, all of which is deductible for tax purposes, $1.5 million was allocated to our cemetery segment and $28.2 million was allocated to our funeral segment. The identified intangible assets comprise the following:
| | | | | | | | |
| Useful Life | Fair Value |
| (Years) | (In thousands) |
| Preneed customer relationships to insurance claims | 10 | $ | 3,900 | |
| Tradenames | Indefinite | 24,734 | |
| Total intangible assets | | $ | 28,634 | |
We incurred acquisition costs of $0.3 million, which is included in Corporate general and administrative expenses in our Consolidated Statement of Operations for the year ended December 31, 2021. The Ohio and California Businesses contributed revenue of $1.1 million and net income of $0.3 million from acquisition through December 31, 2021.
Excluding the acquisitions described above, we spent $31.2 million, $26.3 million, and $64.2 million, net of cash acquired, for several business acquisitions, and $17.1 million, $26.6 million, and $52.1 million, net of cash acquired, for several real estate acquisitions for the three years ended December 31, 2022, 2021, and 2020, respectively. These amounts include the use of $21.7 million, $10.9 million, and $55.1 million in IRS Section 1031 exchange funds for the three years ended December 31, 2022, 2021, and 2020, respectively.
Divestiture-Related Activities
As divestitures occur in the normal course of business, gains or losses on the sale of such locations are recognized in the Consolidated Statement of Operations line item Gains on divestitures and impairment charges, net, which consist of the following:
| | | | | | | | | | | | | | | | | |
| Years Ended December 31, |
| 2022 | | 2021 | | 2020 |
| | (In thousands) |
| Gains on divestitures, net | $ | 10,923 | | | $ | 28,573 | | | $ | 11,962 | |
| Impairment losses | (961) | | | (3,404) | | | (4,953) | |
| Gains on divestitures and impairment charges, net | $ | 9,962 | | | $ | 25,169 | | | $ | 7,009 | |
80 Service Corporation International
Service Corporation International
Schedule II - Valuation and Qualifying Accounts
Three Years Ended December 31, 2022
| | | | | | | | | | | | | | | | | | | | | | | | | | |
| Description | | Balance at
Beginning
of Period | | Charged
(Credited) to
Costs and
Expenses | | Charged
(Credited) to
Write-offs & Other
Accounts | | Balance at
End of
Period |
| | | (In thousands) |
| Current Provision: | | | | | | | | |
| Reserve for credit losses: | | | | | | | | |
| Year Ended December 31, 2022 | | $ | 6,338 | | | $ | 6,579 | | | $ | (6,731) | | | $ | 6,186 | |
| Year Ended December 31, 2021 | | $ | 6,031 | | | $ | 6,393 | | | $ | (6,086) | | | $ | 6,338 | |
| Year Ended December 31, 2020 | | $ | — | | | $ | 5,756 | | | $ | 275 | | | $ | 6,031 | |
| | | | | | | | |
| | | | | | | | |
| | | | | | | | |
| | | | | | | | |
| Due After One Year: | | | | | | | | |
| Reserve for credit losses: | | | | | | | | |
| Year Ended December 31, 2022 | | $ | 4,577 | | | $ | (125) | | | $ | (850) | | | $ | 3,602 | |
| Year Ended December 31, 2021 | | $ | 6,902 | | | $ | (117) | | | $ | (2,208) | | | $ | 4,577 | |
| Year Ended December 31, 2020 | | $ | — | | | $ | 88 | | | $ | 6,814 | | | $ | 6,902 | |
| | | | | | | | |
| | | | | | | | |
| | | | | | | | |
| | | | | | | | |
| Preneed Receivables, Net: | | | | | | | | |
| Reserve for credit losses: | | | | | | | | |
| Year Ended December 31, 2022 | | $ | 20,727 | | $ | 10,246 | | $ | (3,659) | | $ | 27,314 |
| Year Ended December 31, 2021 | | $ | 19,204 | | $ | 5,086 | | $ | (3,563) | | $ | 20,727 |
| Year Ended December 31, 2020 | | $ | — | | $ | 7,739 | | $ | 11,465 | | $ | 19,204 |
| | | | | | | | |
| | | | | | | | |
| | | | | | | | |
| | | | | | | | |
| Deferred Tax Valuation Allowance: | | | | | | | | |
| Year Ended December 31, 2022 | | $ | 120,739 | | | $ | (1,800) | | | $ | — | | | $ | 118,939 | |
| Year Ended December 31, 2021 | | $ | 108,090 | | | $ | 12,649 | | | $ | — | | | $ | 120,739 | |
| Year Ended December 31, 2020 | | $ | 114,331 | | | $ | (6,492) | | | $ | 251 | | | $ | 108,090 | |
| | | | | | | | |
Item 9. Changes In and Disagreements with Accountants on Accounting and Financial Disclosure
None.
Item 9A. Controls and Procedures
Evaluation of Disclosure Controls and Procedures
We have established disclosure controls and procedures that are designed to ensure that the information required to be disclosed by the Company in the reports that it files or submits under the Securities Exchange Act of 1934, as amended (the “Exchange Act”) is recorded, processed, summarized, and reported within the time periods specified in SEC rules and forms and that such information is accumulated and communicated to management, including our principal executive officer and principal financial officer (who are our Chief Executive Officer and Chief Financial Officer, respectively) as appropriate to allow timely decisions regarding required disclosure. In designing and evaluating our disclosure controls and procedures, management recognized that disclosure controls and procedures can provide only reasonable, not absolute, assurance that the objectives of the disclosure controls and procedures are met.
In connection with the preparation of this Annual Report on Form 10-K for the year ended December 31, 2022, an evaluation was performed under the supervision and with the participation of management, including the Chief Executive Officer and Chief Financial Officer, of the effectiveness of the Company's disclosure controls and procedures. Based on that evaluation, the Chief Executive Officer and Chief Financial Officer have concluded that the Company's disclosure controls and procedures as defined in Rules 13a-15(c) and 15d-15(e) were effective as of December 31, 2022 to provide reasonable assurance that information required to be disclosed by the Company in reports that it files or submits under the Exchange Act is (i) recorded, processed, summarized and reported within the time periods specified in the SEC rules and forms and (ii) accumulated and communicated to the Company’s management, including its principal executive officer and principal financial officer, as appropriate to allow timely decisions regarding required disclosure.
Management’s Report on Internal Control Over Financial Reporting
Management is responsible for establishing and maintaining adequate internal control over financial reporting, as such term is defined in Exchange Act Rules 13a-15(f) and 15d-15(f). The Company's internal control over financial reporting includes those policies and procedures that (i) pertain to the maintenance of records that, in reasonable detail, accurately and fairly reflect the transactions and dispositions of assets of the Company; (ii) provide reasonable assurance that transactions are recorded as necessary to permit preparation of financial statements in accordance with generally accepted accounting principles, and that receipts and expenditures of the Company are being made only in accordance with authorizations of management and directors of the Company; and (iii) provide reasonable assurance regarding prevention or timely detection of unauthorized acquisition, use, or disposition of the Company’s assets that could have a material effect on the financial statements.
Internal control over financial reporting is designed to provide reasonable assurance regarding the reliability of financial reporting and the preparation of financial statements prepared for external purposes in accordance with generally accepted accounting principles. Because of its inherent limitations, internal control over financial reporting may not prevent or detect misstatements. Also, projections of any evaluation of effectiveness to future periods are subject to the risk that controls may become inadequate because of changes in conditions or that the degree of compliance with the policies or procedures may deteriorate.
Our management, with the participation of our Chief Executive Officer and Chief Financial Officer, assessed the effectiveness of our internal control over financial reporting as of December 31, 2022 using the criteria established in Internal Control - Integrated Framework (2013) issued by the Committee of Sponsoring Organizations of the Treadway Commission (COSO). Based on this assessment and those criteria, management concluded that our internal control over financial reporting was effective as of December 31, 2022.
The effectiveness of the Company's internal control over financial reporting as of December 31, 2022, has been audited by PricewaterhouseCoopers LLP, an independent registered public accounting firm, as stated in their report, which is included in Item 8, "Financial Statements and Supplementary Data" of this Annual Report on Form 10-K.
Changes in Internal Control Over Financial Reporting
No changes in our internal control over financial reporting occurred during the quarter ended December 31, 2022 that have materially affected, or are reasonably likely to materially affect, our internal control over financial reporting.
82 Service Corporation International
Item 9B. Other Information
No other information.
Item 9C. Disclosure Regarding Foreign Jurisdictions that Prevent Inspections
Not applicable.
Item 10. Directors, Executive Officers, and Corporate Governance
Item 11. Executive Compensation
Item 12. Security Ownership of Certain Beneficial Owners and Management and Related Stockholder Matters
Item 13. Certain Relationships and Related Transactions and Director Independence
Item 14. Principal Accountant Fees and Services
The information required by each of Items 10, 11, 12, 13, and 14, except as included below, is incorporated herein by reference to the Service Corporation International Proxy Statement for our 2023 Annual Meeting of shareholders.
The information regarding our executive officers called for by Item 401 of Regulation S-K and the information regarding our code of ethics called for by Item 406 of Regulation S-K has been included in PART I of this report. The information regarding our equity compensation plan information called for by Item 201(d) of Regulation S-K is set forth below.
Equity Compensation Plan Information at December 31, 2022:
| | | | | | | | | | | | | | | | | | | | |
| Plan Category | | Number of Securities to be Issued upon Exercise of Outstanding Options,
Warrants, and Rights | | Weighted-Average
Exercise Price of
Outstanding Options,
Warrants, and Rights | | Number of Securities Remaining Available for Future Issuance Under Equity Compensation Plans (Excluding Securities Reflected in Column (a)) |
| (a) | | (b) | | (c) |
| Equity compensation plans approved by security holders | | 5,461,105 | | | $ | 40.47 | | | 4,090,978 | |
84 Service Corporation International
Item 15. Exhibits and Financial Statement Schedule
(a)(1)-(2) Financial Statements and Schedule:
The financial statements and schedule are listed in the accompanying Index to Financial Statements and Related Schedule on page 36 of this report. (3) Exhibits:
Exhibit Index
Pursuant to Item 601 of Reg. S-K
| | | | | | | | | | | |
| Exhibit Number | | | Description |
| | — | |
| | — | |
| | — | |
| | — | |
| | — | |
| | — | |
| | — | |
| | — | |
| | — | |
| | — | |
| | — | |
| | | |
| | — | |
| | — | |
| | — | |
| | — | |
| | | | | | | | | | | |
| Exhibit Number | | | Description |
| | — | |
| | — | |
| | — | |
| | — | |
| | — | |
| | — | |
| | — | |
| | — | |
| | | |
| | — | |
| | — | |
| | — | |
| | — | |
| | — | |
| | — | |
| | — | |
| | — | |
| | — | |
| | — | |
| | — | |
| | — | |
| | — | |
| | — | |
| | — | |
| | — | |
86 Service Corporation International
| | | | | | | | | | | |
| Exhibit Number | | | Description |
| | — |
|
| | — | |
| | — | |
| | | |
| | — | |
| | — | |
| | — | |
| | — | |
| 101 | | — | Interactive data file formatted Inline XBRL. |
| 104 | | — | Cover Page Interactive Data File (formatted as Inline XBRL and contained in Exhibit 101). |
In the above list, the management contracts or compensatory plans or arrangements are set forth in Exhibits 10.1 through 10.34.
Pursuant to Item 601(b)(4) of Regulation S-K, certain instruments on a consolidated basis are not filed as exhibits to this report with respect to long-term debt under which the total amount of securities authorized thereunder does not exceed 10 percent of the total assets of Registrant and its subsidiaries. Registrant agrees to furnish a copy of any such instrument to the Commission upon request.
(b) Included in (a) above.
(c) Included in (a) above.
Item 16. Form 10-K Summary
None.
Signatures
Pursuant to the requirements of Section 13 or 15(d) of the Securities Exchange Act of 1934, the Registrant, Service Corporation International, has duly caused this report to be signed on its behalf by the undersigned, thereunto duly authorized.
| | | | | | | | |
| | SERVICE CORPORATION INTERNATIONAL |
| | By: | /s/ GREGORY T. SANGALIS |
| | (Gregory T. Sangalis, Senior Vice President, General Counsel, and Secretary) |
Dated: February 15, 2023
Pursuant to the requirements of the Securities Exchange Act of 1934, this report has been signed below by the following persons on behalf of the Registrant and in the capacities and on the date indicated.
| | | | | | | | | | | | | | | | | | | | |
| Signature | | Title | | Date |
| /s/ THOMAS L. RYAN | | President, Chief Executive Officer, and Chairman of the Board (Principal Executive Officer) | | February 15, 2023 |
| (Thomas L. Ryan) | | | |
| /s/ ERIC D. TANZBERGER | | Senior Vice President, Chief Financial Officer (Principal Financial Officer) | | February 15, 2023 |
| (Eric D. Tanzberger) | | | |
| /s/ TAMMY R. MOORE | | Vice President and Corporate Controller (Principal Accounting Officer) | | February 15, 2023 |
| (Tammy R. Moore) | | | |
| | | | |
| | | | |
| | | |
| /s/ ANTHONY L. COELHO | | Lead Independent Director | | February 15, 2023 |
| (Anthony L. Coelho) | | | | |
| /s/ ALAN R. BUCKWALTER, III | | Director | | February 15, 2023 |
| (Alan R. Buckwalter, III) | | | | |
| /s/ JAKKI L. HAUSSLER | | Director | | February 15, 2023 |
| (Jakki L. Haussler) | | | | |
| /s/ VICTOR L. LUND | | Director | | February 15, 2023 |
| (Victor L. Lund) | | | | |
| | | | |
| | | | |
| /s/ ELLEN OCHOA | | Director | | February 15, 2023 |
| (Ellen Ochoa) | | | | |
| /s/ C. PARK SHAPER | | Director | | February 15, 2023 |
| (C. Park Shaper) | | | | |
| /s/ SARA MARTINEZ TUCKER | | Director | | February 15, 2023 |
| (Sara Martinez Tucker) | | | | |
| /s/ W. BLAIR WALTRIP | | Director | | February 15, 2023 |
| (W. Blair Waltrip) | | | | |
| /s/ MARCUS A. WATTS | | Director | | February 15, 2023 |
| (Marcus A. Watts) | | | | |
| | | | |
| | | | | | |
| | | | |
| | | | | |
| | | | | |
88 Service Corporation International