Exhibit 99.2
Second Quarter 2024 Results Summary Presentation August 2024
DISCLAIMER Forward - looking statements 2 Forward - Looking Statements Certain of the matters discussed in this presentation which are not statements of historical fact constitute forward - looking sta tements within the meaning of the securities laws, including the Private Securities Litigation Reform Act of 1995, that invol ve a number of risks and uncertainties. Words such as “strategy,” “expects,” “continues,” “plans,” “anticipates,” “believes,” “would,” “will,” “estimates,” “intends,” “projects,” “goals,” “targets” and other words of similar me aning are intended to identify forward - looking statements, but are not the exclusive means of identifying these statements. Any statements made in this presentation other than those of historical fact, about an action, event or development, are forward - looking statements. The important factors that may cause actual results and outcomes to differ material ly from those contained in such forward - looking statements include, without limitation, the Company’s projected Outlook for the third quarter of 2024, the costs associated with, and outcome of the Company’s plans to optimize conventional fuel and renewable diesel production moving forward; statements concerning: the Company’s engagement of BofA Securities, Inc., as previously disclosed; the review and evaluation of potential joint ventures, divestitures, acquisitions, m ergers, business combinations, or other strategic transactions, the outcome of such review, and the impact on any such transactions, or the review thereof, and their impact on shareholder value; the process by which t he Company engages in evaluation of strategic transactions; the Company’s ability to identify potential partners; the outcome of po tential future strategic transactions and the terms thereof; potential restructuring of the Company, its operations, financials, debts and assets; the future production of the Company’s Mobile Refinery; anticipated an d u nforeseen events which could reduce future production at the refinery or delay future capital projects, and changes in commod ity and credit values; throughput volumes, production rates, yields, operating expenses and capital expenditures at the Mobile Refinery; the ability of the Company to obtain low carbon fuel standard (LCFS) credits, an d t he amounts thereof; the need for additional capital in the future, including, but not limited to, in order to complete capita l p rojects and satisfy liabilities, including to pay amounts owed under the Company’s outstanding term loan, the Company’s ability to raise such capital in the future, and the terms of such funding, including dilution caused the reb y, and steps the Company may be required to take in the future if the Company is unable to raise additional capital, includin g p otentially seeking bankruptcy protection; the timing of capital projects at the Company’s refinery located in Mobile, Alabama (the “Mobile Refinery”) and the outcome of such projects; the future production of the Mobile Refi ner y, including but not limited to, renewable diesel and conventional production and the breakdown between the two; estimated an d a ctual production and costs associated with the renewable diesel capital project; estimated revenues, margins and expenses, over the course of the agreement with Idemitsu Kosan (“ Idemitsu ”); anticipated and unforeseen events which could reduce future production at the Mobile Refinery or delay planned and future ca pital projects; changes in commodity and credits values; certain early termination rights associated with third party agreements and conditions precedent to such agreements; certain mandatory redemption provisions of the outstanding senior con ver tible notes, the conversion rights associated therewith, and dilution caused by conversions and/or the exchanges of convertib le notes; the Company’s ability to comply with required covenants under outstanding intermediation facilities, senior notes and a term loan and to pay amounts due under such senior notes and term loan, includi ng interest and other amounts due thereunder; the ability of the Company to retain and hire key personnel; the level of competit ion in the Company’s industry and its ability to compete; the Company’s ability to respond to changes in its industry; the loss of key personnel or failure to attract, integrate and retain additional personnel; the Comp any ’s ability to protect intellectual property and not infringe on others’ intellectual property; the Company’s ability to scale it s business; the Company’s ability to maintain supplier relationships and obtain adequate supplies of feedstocks; the Company’s ability to obtain and retain customers; the Company’s ability to produce products at competitive ra tes ; the Company’s ability to execute its business strategy in a very competitive environment; trends in, and the market for, th e p rice of oil and gas and alternative energy sources; the impact of inflation and interest rates on margins and costs; the volatile nature of the prices for oil and gas caused by supply and demand, including volatility caused by the ongoing Ukraine/Russia conflict and/or the Israel/Hamas conflict, changes in interest rates and inflation, and potential re cessions; the Company’s ability to maintain relationships with partners; the outcome of pending and potential future litigation, judgments and settlements; rules and regulations making the Company’s operations more costly or res trictive; volatility in the market price of compliance credits (primarily Renewable Identification Numbers (RINs) needed to c omp ly with the Renewable Fuel Standard (“RFS”)) under renewable and low - carbon fuel programs and emission credits needed under other environmental emissions programs, the requirement for the Company to purchase RINs in th e secondary market to the extent it does not generate sufficient RINs internally, liabilities associated therewith and the ti min g, funding and costs of such required purchases, if any; changes in environmental and other laws and regulations and risks associated with such laws and regulations; economic downturns both in the United States and gl oba lly, changes in inflation and interest rates, increased costs of borrowing associated therewith and potential declines in the av ailability of such funding; risk of increased regulation of the Company’s operations and products; disruptions in the infrastructure that the Company and its partners rely on; interruptions at the Company’s facilities; unexp ect ed and expected changes in the Company’s anticipated capital expenditures resulting from unforeseen and expected required mai nte nance, repairs, or upgrades; the Company’s ability to acquire and construct new facilities; the Company’s ability to effectively manage growth; decreases in global demand for, and the price of, oil, due to inflation, rece ssi ons or other reasons, including declines in economic activity or global conflicts; expected and unexpected downtime at the Co mpa ny’s facilities; the Company’s level of indebtedness, which could affect its ability to fulfill its obligations, impede the implementation of its strategy, and expose the Company’s interest rate risk; dependence on third part y t ransportation services and pipelines; risks related to obtaining required crude oil supplies, and the costs of such supplies; co unterparty credit and performance risk; unanticipated problems at, or downtime effecting, the Company’s facilities and those operated by third parties; risks relating to the Company’s hedging activities or lack of hedgi ng activities; and risks relating to planned and future divestitures, asset sales, joint ventures and acquisitions. Other important factors that may cause actual results and outcomes to differ materially from those contained in the forward - look ing statements included in this communication are described in the Company’s publicly filed reports, including, but not limit ed to, the Company’s Annual Report on Form 10 - K for the year ended December 31, 2023, and the Company’s Quarterly Report on Form 10 - Q for the quarter ended June 30, 2024, and future Annual Reports on Form 10 - K and Quarterl y Reports on Form 10 - Q. These reports are available at www.sec.gov. The Company cautions that the foregoing list of important fa ctors is not complete. All subsequent written and oral forward - looking statements attributable to the Company or any person acting on behalf of the Company are expressly qualified in their entirety by the ca uti onary statements referenced above. Other unknown or unpredictable factors also could have material adverse effects on Vertex’ s f uture results. The forward - looking statements included in this presentation are made only as of the date hereof. Vertex cannot guarantee future results, levels of activity, performance or achievements. Accordingly, you sh ould not place undue reliance on these forward - looking statements. Finally, Vertex undertakes no obligation to update these stat ements after the date of this presentation, except as required by law, and takes no obligation to update or correct information prepared by third parties that are not paid for by Vertex. If we update one or more forward - lookin g statements, no inference should be drawn that we will make additional updates with respect to those or other forward - looking s tatements. Date of Information in Presentation All information in this presentation is as of August 7, 2024 (unless otherwise stated). The Company undertakes no duty to upd ate any forward - looking statement to conform the statement to actual results or changes in the Company’s expectations. Industry Information In this presentation, we may rely on and refer to information regarding the refining, re - refining, used oil and oil and gas indu stries in general from market research reports, analyst reports and other publicly available information. Although we believe th at this information is reliable, we have not commissioned any of such information, we cannot guarantee the accuracy and completeness of this information, and we have not independently verified any of it. Projections The financial projections (the “Projections”) included herein were prepared by Vertex in good faith using assumptions believe d t o be reasonable. A significant number of assumptions about the operations of the business of Vertex were based, in part, on e con omic, competitive, and general business conditions prevailing at the time the Projections were developed. Any future changes in these conditions, may materially impact the ability of Vertex to achieve the financial resul ts set forth in the Projections. The Projections are based on numerous assumptions, including realization of the operating strat egy of Vertex; industry performance; no material adverse changes in applicable legislation or regulations, or the administration thereof, or generally accepted accounting principles; general business and economic condit ion s; competition; retention of key management and other key employees; absence of material contingent or unliquidated litigatio n, indemnity, or other claims; minimal changes in current pricing; static material and equipment pricing; no significant increases in interest rates or inflation; and other matters, many of which will be beyond the control of Vertex, and some or all of which may not materialize . The Projections also assume the continued uptime of the Company’s faci li ties at historical levels and the successful funding of, timely completion of, and successful outcome of, planned capital projects. Additionally, to the extent that the assumptions inherent in the Projections are based upon fut ure business decisions and objectives, they are subject to change. Although the Projections are presented with numerical specific it y and are based on reasonable expectations developed by Vertex’s management, the assumptions and estimates underlying the Projections are subject to significant business, economic, and competitive uncertainties and con tin gencies, many of which will be beyond the control of Vertex. Accordingly, the Projections are only estimates and are necessar ily speculative in nature. It is expected that some or all of the assumptions in the Projections will not be realized and that actual results will vary from the Projections. Such variations may be material and may increase over ti me. In light of the foregoing, readers are cautioned not to place undue reliance on the Projections. The projected financial inf ormation contained herein should not be regarded as a representation or warranty by Vertex, its management, advisors, or any other person that the Projections can or will be achieved. Vertex cautions that the Projections are speculative in nature and based upon subjective decisions and assumptions. As a result, the Projections should not be relied on as necessarily predictive of actual future events.
DISCLAIMER Non - GAAP Financial Measures 3 Non - GAAP Financial Measures and Key Performance Measures In addition to our results calculated under generally accepted accounting principles in the United States (“GAAP”), in this p res entation we also present certain non - U.S. GAAP financial measures and key performance indicators. Non - U.S. GAAP financial measur es include Adjusted Gross Margin, Fuel Gross Margin and Adjusted EBITDA, for the Company’s Legacy Refining and Marketing segment, and the total Refining and Marketing segment, as a whole, and Net Long - Term Debt and Net Leverage(collectively, the “Non - U.S. GAAP Financial Measures”). Key performance indicators include Adjusted Gross Margin, Fuel Gross Margin and Adjusted EBITDA for Conventional, Renewable and the Mobile Refinery as a whole, and Fuel Gross Margin Per Barrel of Throughput and Adjusted Gross Margin Per Ba rre l of Throughput for Conventional, Renewable and the Mobile Refinery as a whole (collectively, the “KPIs”). EBITDA represents net income before interest, taxes, depreciation and amortization, for continued and discontinued operations. Adjusted EBITDA represents EBITDA from operations plus or minus unrealized gain or los ses on hedging activities, Renewable Fuel Standard (RFS) costs (mainly related to Renewable Identification Numbers (RINs), and in ve ntory adjustments, acquisition costs, gain on change in value of derivative warrant liability, environmental clean - up, stock - based compensation, (gain) loss on sale of assets, and certain other unusual or non - recurring charges included in selling, general, and administrative expenses. Adjusted Gross Margin is defined as gross prof it (loss) plus or minus unrealized gain or losses on hedging activities and inventory valuation adjustments. Fuel Gross Margin is defined as Adjusted Gross Margin, plus production costs, operating expenses and d epr eciation attributable to cost of revenues and other non - fuel items included in costs of revenues including realized and unrealiz ed gain or losses on hedging activities, RFS costs (mainly related to RINs), fuel financing costs and other revenues and cost of sales items. Fuel Gross Margin Per Barrel of Throughput is calculated as fuel gro ss margin divided by total throughput barrels for the period presented. Operating Expenses Per Barrel of Throughput is define d a s total operating expenses divided by total barrels of throughput. RIN Adjusted Fuel Gross Margin is defined as Fuel Gross Margin minus RIN expense divided by total barrels of throughput. RIN Adjusted Fuel Gros s M argin Per Barrel of Throughput is calculated as RIN Adjusted Fuel Gross Margin divided by total throughput barrels for the pe rio d presented. Net Long - Term Debt is long - term debt and lease obligations, adjusted for unamortized discount and deferred financing costs, insurance premiums financed, less cash and cash equivalents a nd restricted cash, and various short - term notes including insurance premium financing. Net leverage is defined as Long - Term Debt d ivided by trailing twelve month Adjusted EBITDA. Each of the Non - U.S. GAAP Financial Measures and KPIs are discussed in greater detail below. The (a) Non - U.S. GAAP Financial Mea sures are “non - U.S. GAAP financial measures”, and (b) the KPIs are, presented as supplemental measures of the Company’s performa nce. They are not presented in accordance with U.S. GAAP. We use the Non - U.S. GAAP Financial Measures and KPIs as supplements to U.S. GAAP measures of performance to evaluate the effectiveness of o ur business strategies, to make budgeting decisions, to allocate resources and to compare our performance relative to our pee rs. Additionally, these measures, when used in conjunction with related U.S. GAAP financial measures, provide investors with an additional financial analytical framework which management uses, in additi on to historical operating results, as the basis for financial, operational and planning decisions and present measurements that th ird parties have indicated are useful in assessing the Company and its results of operations. The Non - U.S. GAAP Financial Measures and KPIs are presented because we believe they provide additional useful inform ation to investors due to the various noncash items during the period. Non - U.S. GAAP financial information and KPIs similar to t he Non - U.S. GAAP Financial Measures and KPIs are also frequently used by analysts, investors and other interested parties to evaluate companies in our industry. The Non - U.S. GAAP Financial Measures and KPIs are unaudited, and have limitations as analytical tools, and you should not consider them in isolation, or as a substitu te for analysis of our operating results as reported under U.S. GAAP. Some of these limitations are: the Non - U.S. GAAP Financial Measures and KPIs do not reflect cash expenditures, or future requirements for capi tal expenditures, or contractual commitments; the Non - GAAP Financial Measures and KPIs do not reflect changes in, or cash requir ements for, working capital needs; the Non - GAAP Financial Measures and KPIs do not reflect the significant interest expense, or the cash requirements necessary to service interest or principal payments , o n debt or cash income tax payments; although depreciation and amortization are noncash charges, the assets being depreciated and amortized will often have to be replaced in the future, the Non - U.S. GAAP Financial Measures and KPIs do not reflect any cash requirements for such replacements; the Non - U.S. GAAP Financial Measures and KPIs represent only a portion of our total operating results; and other companies in this industry may calculate the Non - U.S. G AAP Financial Measures and KPIs differently than we do, limiting their usefulness as a comparative measure. You should not consider the Non - U.S. GAAP Financial Measures and KPIs in isolation, or as s ubstitutes for analysis of the Company’s results as reported under U.S. GAAP. The Company’s presentation of these measures sh oul d not be construed as an inference that future results will be unaffected by unusual or nonrecurring items. We compensate for these limitations by providing a reconciliation of each of these non - U.S. GAAP Financial Measures and KPIs to the most comparable U.S. GAAP measure below. We encourage investors and others to review our b usi ness, results of operations, and financial information in their entirety, not to rely on any single financial measure, and to view these non - U.S. GAAP Financial Measures and KPIs in conjunction with the mos t directly comparable U.S. GAAP financial measure. For more information on these non - GAAP financial measures and KPIs, please see the sections titled “Unaudited Reconciliation of Gross Profit (Loss) From Continued and Discontinued Operations to Adjusted Gross Margin, Fuel Gross Margin, Fuel Gross Margin Pe r Barrel of Throughput and Operating Expenses Per Barrel of Throughput”, “Unaudited Reconciliation of Adjusted EBITDA to Net loss from Continued and Discontinued Operations”, and “Unaudited Reconcil iat ion of Long - Term Debt to Net Long - Term Debt and Net Leverage”, at the end of this presentation.
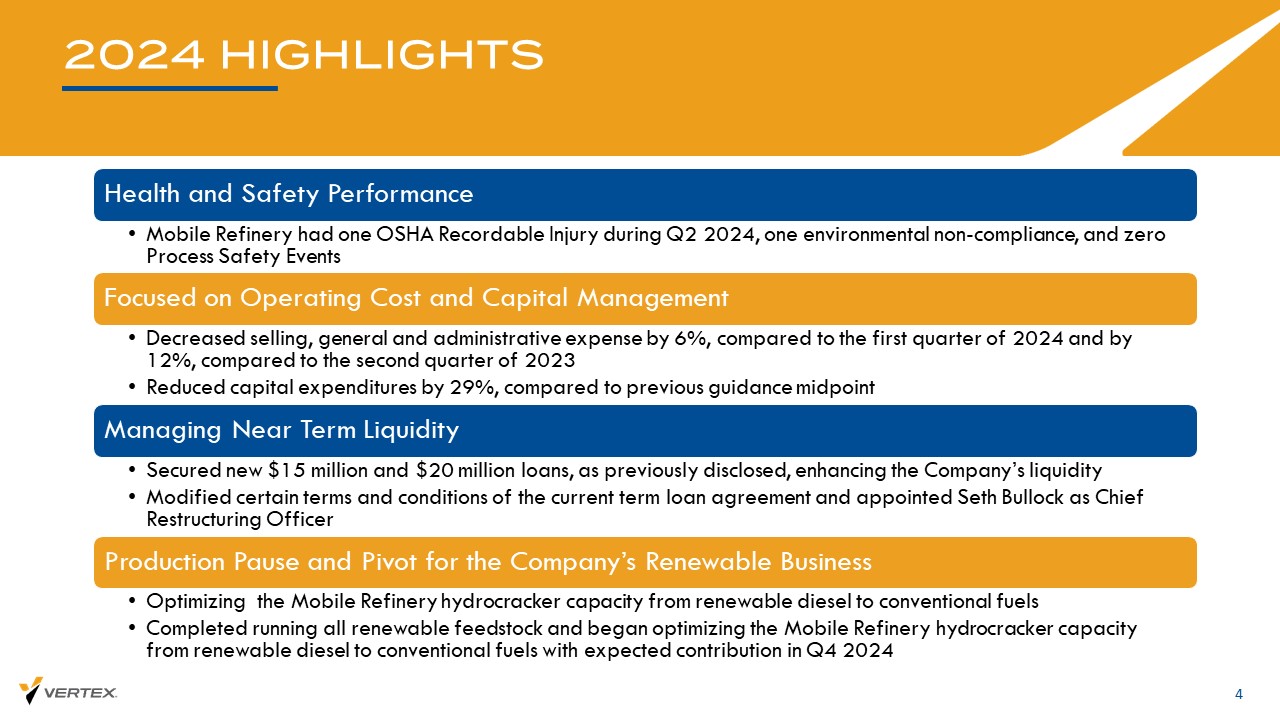
2024 HIGHLIGHTS 4 Health and Safety Performance • Mobile Refinery had one OSHA Recordable Injury during Q2 2024, one environmental non - compliance, and zero Process Safety Events Focused on Operating Cost and Capital Management • Decreased selling, general and administrative expense by 6%, compared to the first quarter of 2024 and by 12%, compared to the second quarter of 2023 • Reduced capital expenditures by 29%, compared to previous guidance midpoint Managing Near Term Liquidity • Secured new $15 million and $20 million loans, as previously disclosed, enhancing the Company’s liquidity • Modified certain terms and conditions of the current term loan agreement and appointed Seth Bullock as Chief Restructuring Officer Production Pause and Pivot for the Company’s Renewable Business • Optimizing the Mobile Refinery hydrocracker capacity from renewable diesel to conventional fuels • Completed running all renewable feedstock and began optimizing the Mobile Refinery hydrocracker capacity from renewable diesel to conventional fuels with expected contribution in Q4 2024
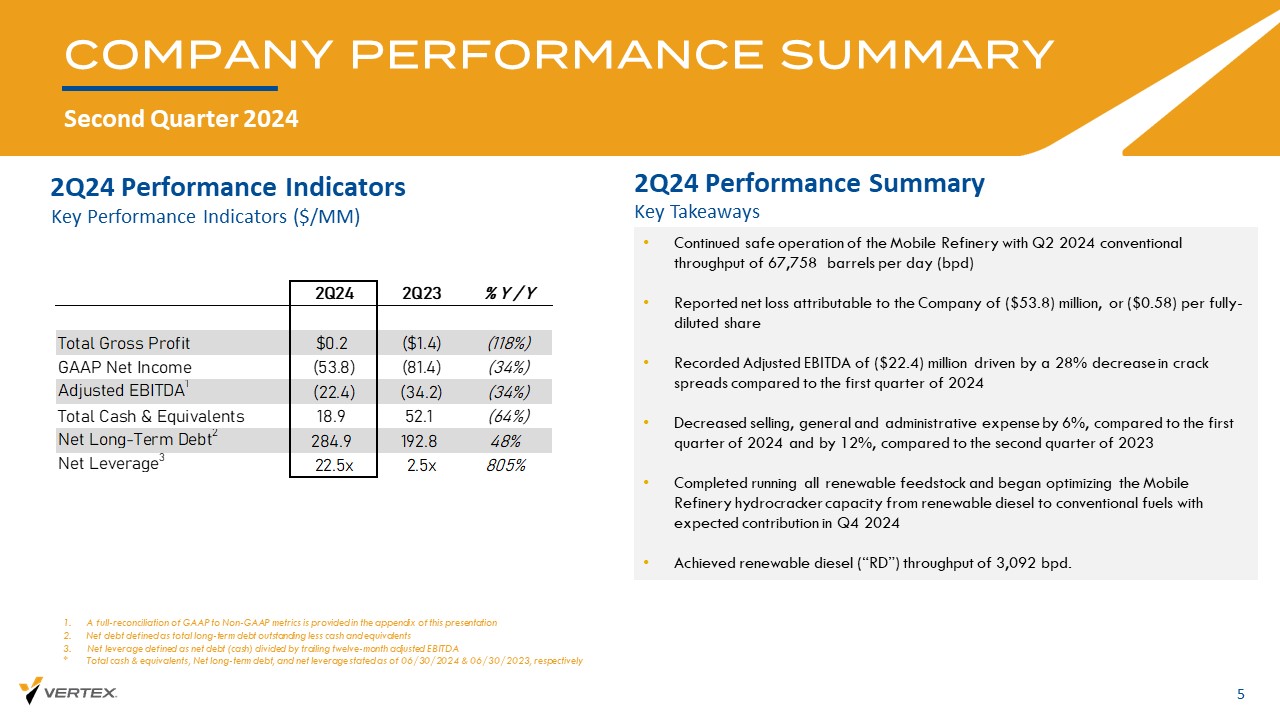
2Q24 Performance Indicators COMPANY PERFORMANCE SUMMARY Second Quarter 2024 5 1. A full - reconciliation of GAAP to Non - GAAP metrics is provided in the appendix of this presentation 2. Net debt defined as total long - term debt outstanding less cash and equivalents 3. Net leverage defined as net debt (cash) divided by trailing twelve - month adjusted EBITDA * Total cash & equivalents, Net long - term debt, and net leverage stated as of 06/30/2024 & 06/30/2023, respectively Key Performance Indicators ($/MM) Key Takeaways 2Q24 Performance Summary • Continued safe operation of the Mobile Refinery with Q2 2024 conventional throughput of 67,758 barrels per day (bpd) • Reported net loss attributable to the Company of ($53.8) million, or ($0.58) per fully - diluted share • Recorded Adjusted EBITDA of ($22.4) million driven by a 28% decrease in crack spreads compared to the first quarter of 2024 • Decreased selling, general and administrative expense by 6%, compared to the first quarter of 2024 and by 12%, compared to the second quarter of 2023 • Completed running all renewable feedstock and began optimizing the Mobile Refinery hydrocracker capacity from renewable diesel to conventional fuels with expected contribution in Q4 2024 • Achieved renewable diesel (“RD”) throughput of 3,092 bpd. 2Q24 2Q23 % Y / Y Total Gross Profit $0.2 ($1.4) (118%) GAAP Net Income (53.8) (81.4) (34%) Adjusted EBITDA 1 (22.4) (34.2) (34%) Total Cash & Equivalents 18.9 52.1 (64%) Net Long-Term Debt 2 284.9 192.8 48% Net Leverage 3 22.5x 2.5x 805%
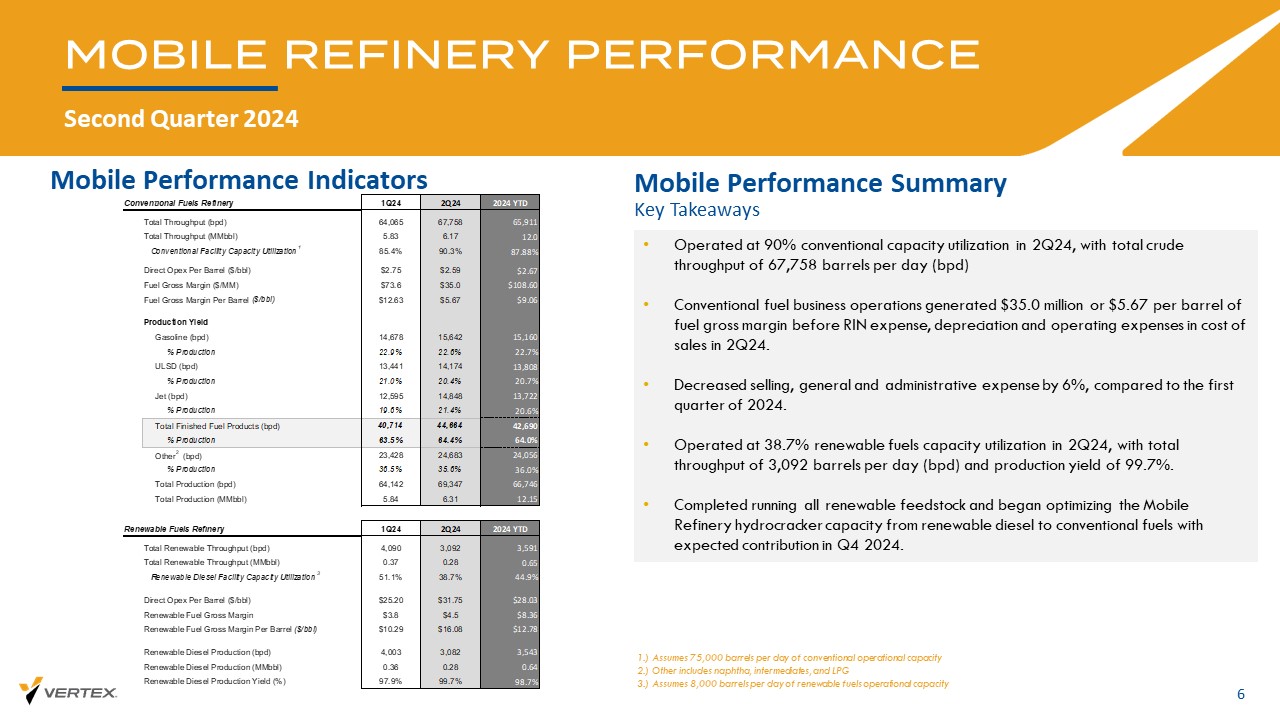
Mobile Performance Indicators MOBILE REFINERY PERFORMANCE Second Quarter 2024 6 • Operated at 90% conventional capacity utilization in 2Q24, with total crude throughput of 67,758 barrels per day (bpd) • Conventional fuel business operations generated $35.0 million or $5.67 per barrel of fuel gross margin before RIN expense, depreciation and operating expenses in cost of sales in 2Q24. • Decreased selling, general and administrative expense by 6%, compared to the first quarter of 2024. • Operated at 38.7% renewable fuels capacity utilization in 2Q24, with total throughput of 3,092 barrels per day (bpd) and production yield of 99.7%. • Completed running all renewable feedstock and began optimizing the Mobile Refinery hydrocracker capacity from renewable diesel to conventional fuels with expected contribution in Q4 2024. 1.) Assumes 75,000 barrels per day of conventional operational capacity 2.) Other includes naphtha, intermediates, and LPG 3.) Assumes 8,000 barrels per day of renewable fuels operational capacity Mobile Performance Summary Key Takeaways Conventional Fuels Refinery 1Q24 2Q24 2024 YTD Total Throughput (bpd) 64,065 67,758 65,911 Total Throughput (MMbbl) 5.83 6.17 12.0 Conventional Facility Capacity Utilization 1 85.4% 90.3% 87.88% Direct Opex Per Barrel ($/bbl) $2.75 $2.59 $2.67 Fuel Gross Margin ($/MM) $73.6 $35.0 $108.60 Fuel Gross Margin Per Barrel ($/bbl) $12.63 $5.67 $9.06 Production Yield Gasoline (bpd) 14,678 15,642 15,160 % Production 22.9% 22.6% 22.7% ULSD (bpd) 13,441 14,174 13,808 % Production 21.0% 20.4% 20.7% Jet (bpd) 12,595 14,848 13,722 % Production 19.6% 21.4% 20.6% Total Finished Fuel Products (bpd) 40,714 44,664 42,690 % Production 63.5% 64.4% 64.0% Other 2 (bpd) 23,428 24,683 24,056 % Production 36.5% 35.6% 36.0% Total Production (bpd) 64,142 69,347 66,746 Total Production (MMbbl) 5.84 6.31 12.15 Renewable Fuels Refinery 1Q24 2Q24 2024 YTD Total Renewable Throughput (bpd) 4,090 3,092 3,591 Total Renewable Throughput (MMbbl) 0.37 0.28 0.65 Renewable Diesel Facility Capacity Utilization 3 51.1% 38.7% 44.9% Direct Opex Per Barrel ($/bbl) $25.20 $31.75 $28.03 Renewable Fuel Gross Margin $3.8 $4.5 $8.36 Renewable Fuel Gross Margin Per Barrel ($/bbl) $10.29 $16.08 $12.78 Renewable Diesel Production (bpd) 4,003 3,082 3,543 Renewable Diesel Production (MMbbl) 0.36 0.28 0.64 Renewable Diesel Production Yield (%) 97.9% 99.7% 98.7%
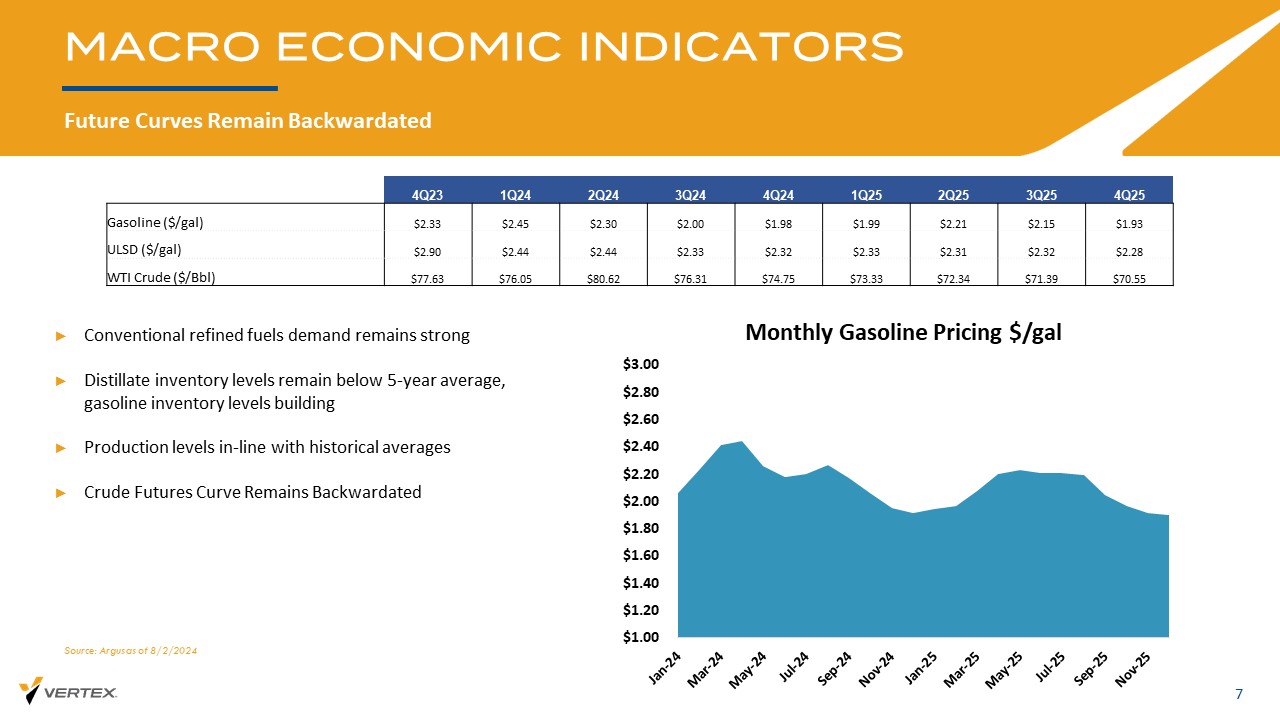
Future Curves Remain Backwardated 7 MACRO ECONOMIC INDICATORS Source: Argus as of 8/2/2024 ► Conventional refined fuels demand remains strong ► Distillate inventory levels remain below 5 - year average, gasoline inventory levels building ► Production levels in - line with historical averages ► Crude Futures Curve Remains Backwardated $1.00 $1.20 $1.40 $1.60 $1.80 $2.00 $2.20 $2.40 $2.60 $2.80 $3.00 Monthly Gasoline Pricing $/gal 4Q25 3Q25 2Q25 1Q25 4Q24 3Q24 2Q24 1Q24 4Q23 $1.93 $2.15 $2.21 $1.99 $1.98 $2.00 $2.30 $2.45 $2.33 Gasoline ($/gal) $2.28 $2.32 $2.31 $2.33 $2.32 $2.33 $2.44 $2.44 $2.90 ULSD ($/gal) $70.55 $71.39 $72.34 $73.33 $74.75 $76.31 $80.62 $76.05 $77.63 WTI Crude ($/ Bbl )
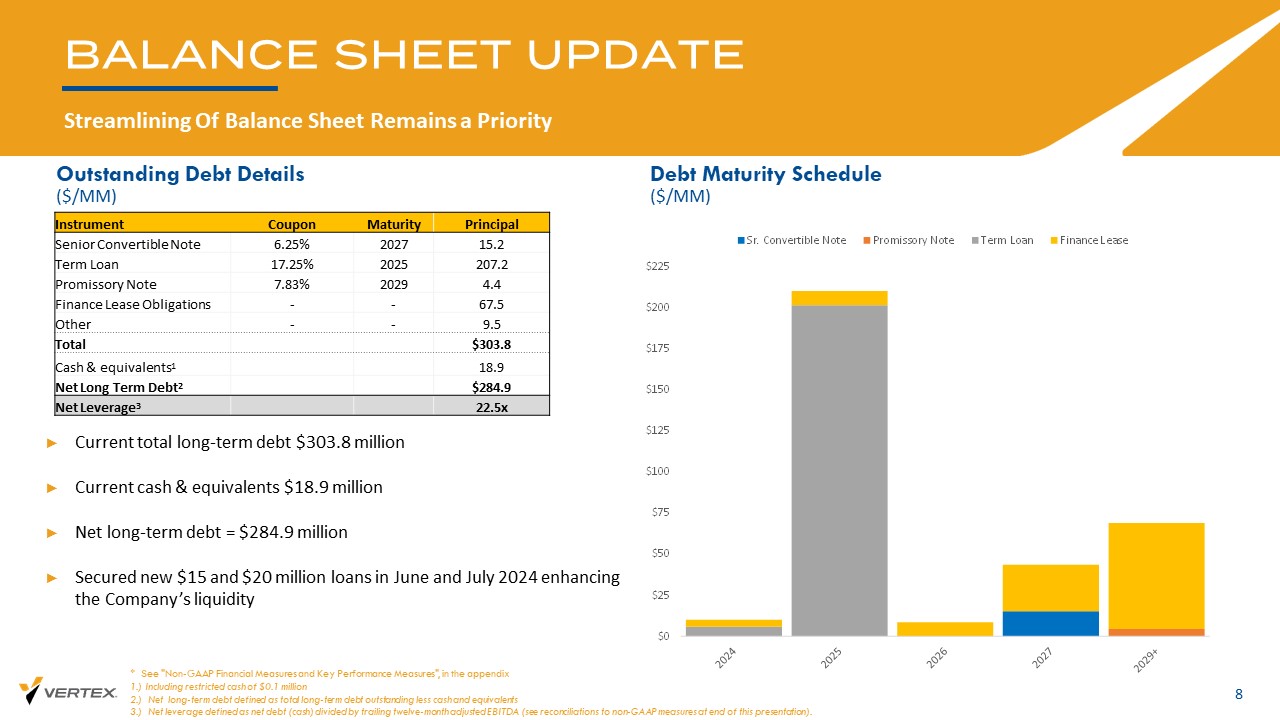
BALANCE SHEET UPDATE Streamlining Of Balance Sheet Remains a Priority 8 Outstanding Debt Details ($/MM) Debt Maturity Schedule ($/MM) ► Current total long - term debt $303.8 million ► Current cash & equivalents $18.9 million ► Net long - term debt = $284.9 million ► Secured new $15 and $20 million loans in June and July 2024 enhancing the Company’s liquidity * See "Non - GAAP Financial Measures and Key Performance Measures", in the appendix 1.) Including restricted cash of $0.1 million 2.) Net long - term debt defined as total long - term debt outstanding less cash and equivalents 3.) Net leverage defined as net debt (cash) divided by trailing twelve - month adjusted EBITDA (see reconciliations to non - GAAP m easures at end of this presentation). Principal Maturity Coupon Instrument 15.2 2027 6.25% Senior Convertible Note 207.2 2025 17.25% Term Loan 4.4 2029 7.83% Promissory Note 67.5 - - Finance Lease Obligations 9.5 - - Other $303.8 Total 18.9 Cash & equivalents 1 $284.9 Net Long Term Debt 2 22.5x Net Leverage 3 $0 $25 $50 $75 $100 $125 $150 $175 $200 $225 Sr. Convertible Note Promissory Note Term Loan Finance Lease
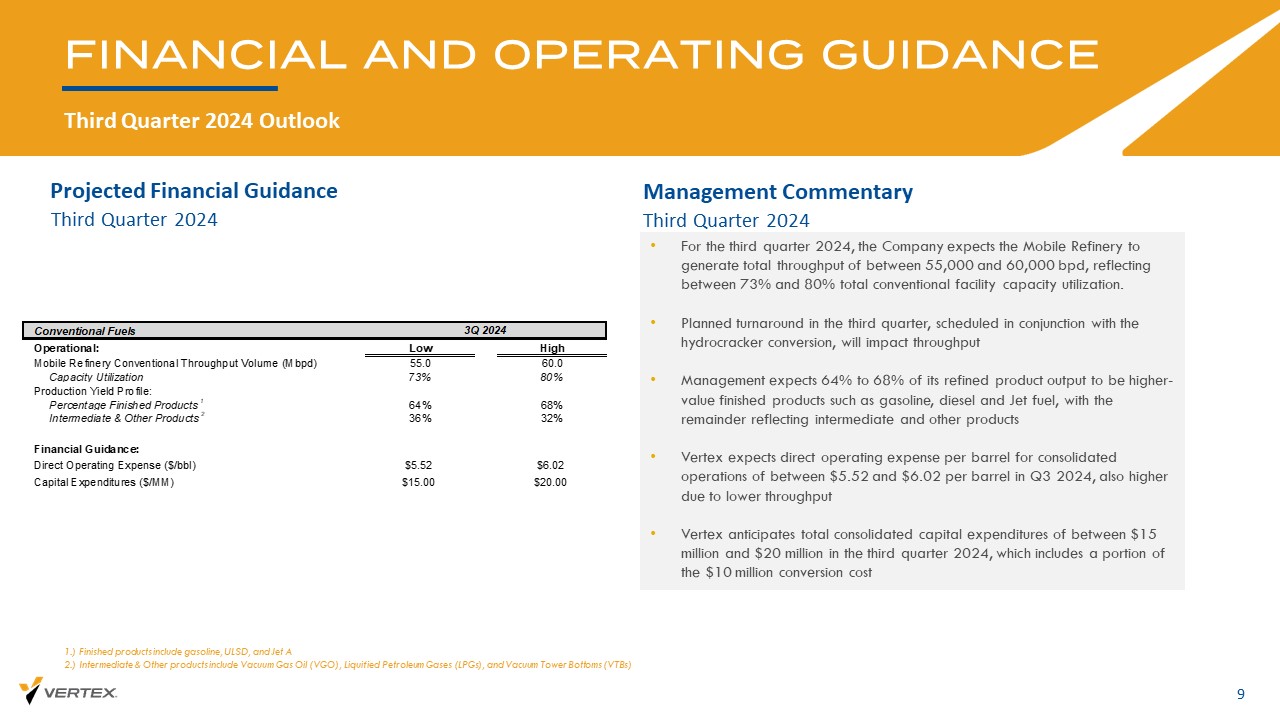
Projected Financial Guidance FINANCIAL AND OPERATING GUIDANCE Third Quarter 2024 Outlook 9 Management Commentary • For the third quarter 2024, the Company expects the Mobile Refinery to generate total throughput of between 55,000 and 60,000 bpd, reflecting between 73% and 80% total conventional facility capacity utilization. • Planned turnaround in the third quarter, scheduled in conjunction with the hydrocracker conversion, will impact throughput • Management expects 64% to 68% of its refined product output to be higher - value finished products such as gasoline, diesel and Jet fuel, with the remainder reflecting intermediate and other products • Vertex expects direct operating expense per barrel for consolidated operations of between $5.52 and $6.02 per barrel in Q3 2024, also higher due to lower throughput • Vertex anticipates total consolidated capital expenditures of between $15 million and $20 million in the third quarter 2024, which includes a portion of the $10 million conversion cost Third Quarter 2024 Third Quarter 2024 1.) Finished products include gasoline, ULSD, and Jet A 2.) Intermediate & Other products include Vacuum Gas Oil (VGO), Liquified Petroleum Gases (LPGs), and Vacuum Tower Bottoms (V TBs ) Conventional Fuels Operational: Low High Mobile Refinery Conventional Throughput Volume (Mbpd) 55.0 60.0 Capacity Utilization 73% 80% Production Yield Profile: Percentage Finished Products1 64% 68% Intermediate & Other Products2 36% 32% Financial Guidance: Direct Operating Expense ($/bbl) $5.52 $6.02 Capital Expenditures ($/MM) $15.00 $20.00 3Q 2024
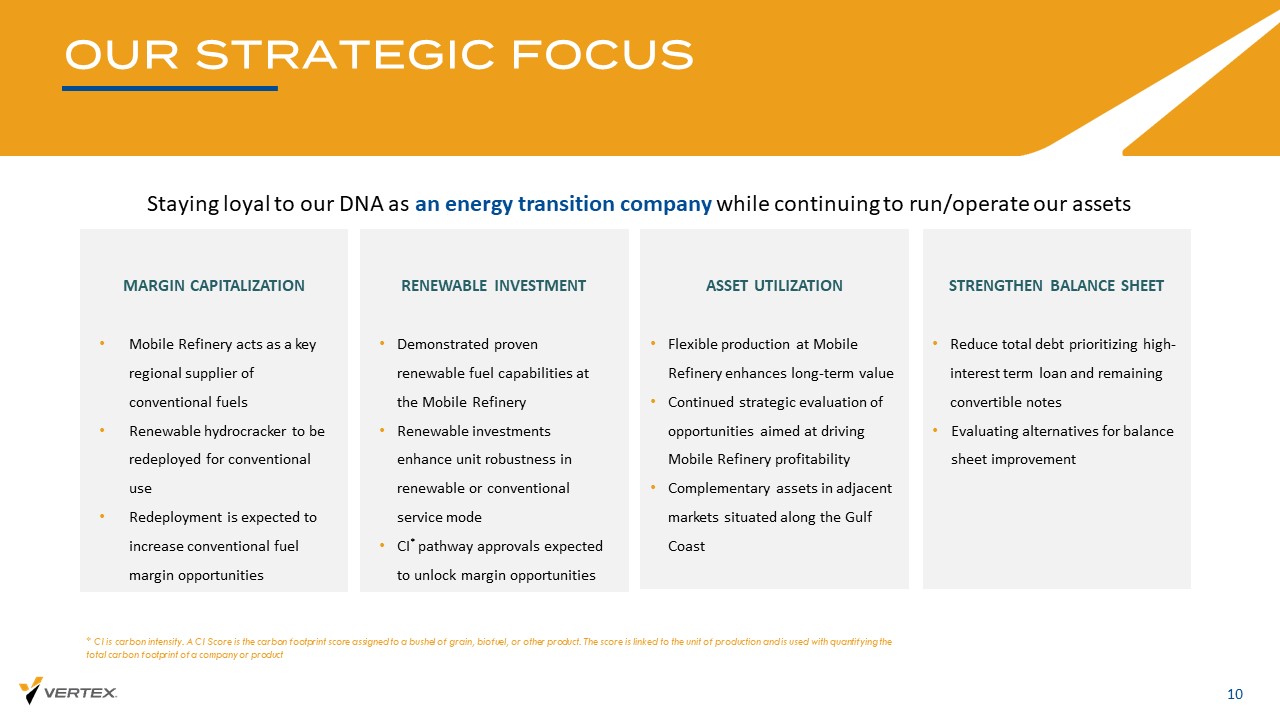
OUR STRATEGIC FOCUS 10 ASSET UTILIZATION • Flexible production at Mobile Refinery enhances long - term value • Continued strategic evaluation of opportunities aimed at driving Mobile Refinery profitability • Complementary assets in adjacent markets situated along the Gulf Coast MARGIN CAPITALIZATION • Mobile Refinery acts as a key regional supplier of conventional fuels • Renewable hydrocracker to be redeployed for conventional use • Redeployment is expected to increase conventional fuel margin opportunities RENEWABLE INVESTMENT • Demonstrated proven renewable fuel capabilities at the Mobile Refinery • Renewable investments enhance unit robustness in renewable or conventional service mode • CI * pathway approvals expected to unlock margin opportunities STRENGTHEN BALANCE SHEET • Reduce total debt prioritizing high - interest term loan and remaining convertible notes • Evaluating alternatives for balance sheet improvement Staying loyal to our DNA as an energy transition company while continuing to run/operate our assets * CI is carbon intensity. A CI Score is the carbon footprint score assigned to a bushel of grain, biofuel, or other product. The score is linked to the unit of production and is used with quantifying the total carbon footprint of a company or product
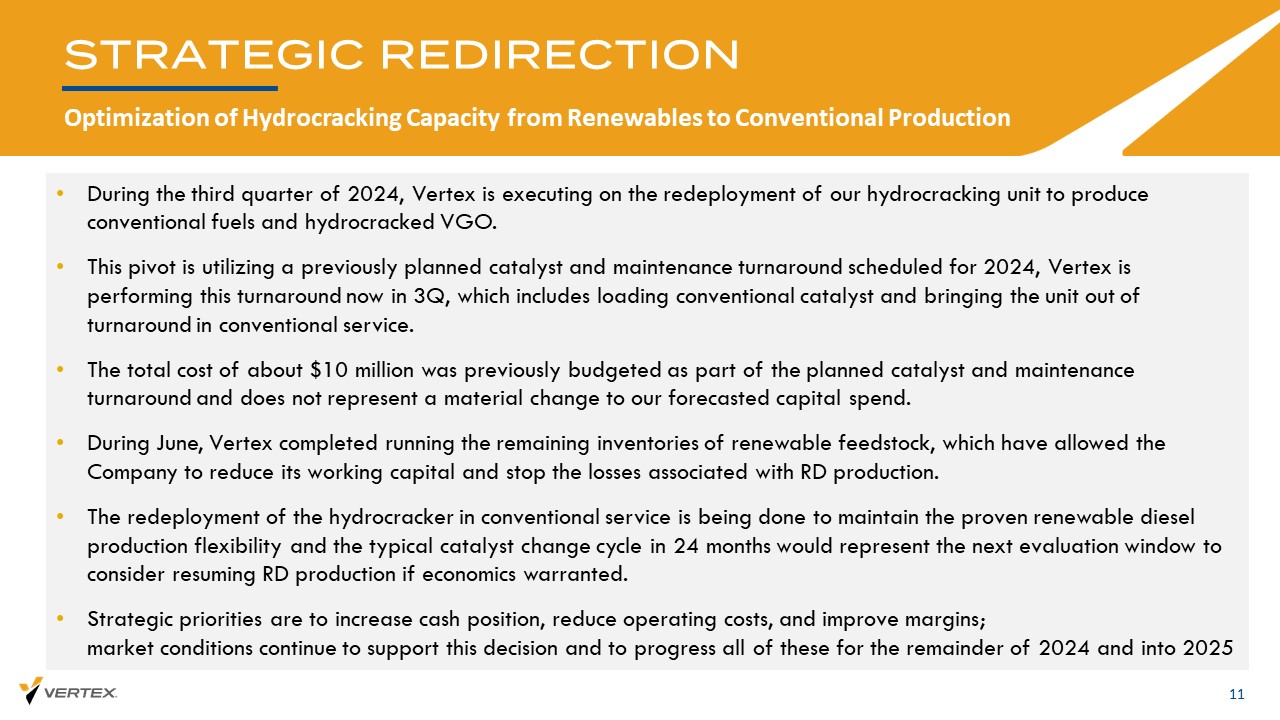
STRATEGIC REDIRECTION Optimization of Hydrocracking Capacity from Renewables to Conventional Production 11 • During the third quarter of 2024, Vertex is executing on the redeployment of our hydrocracking unit to produce conventional fuels and hydrocracked VGO. • This pivot is utilizing a previously planned catalyst and maintenance turnaround scheduled for 2024, Vertex is performing this turnaround now in 3Q, which includes loading conventional catalyst and bringing the unit out of turnaround in conventional service. • The total cost of about $10 million was previously budgeted as part of the planned catalyst and maintenance turnaround and does not represent a material change to our forecasted capital spend. • During June, Vertex completed running the remaining inventories of renewable feedstock, which have allowed the Company to reduce its working capital and stop the losses associated with RD production. • The redeployment of the hydrocracker in conventional service is being done to maintain the proven renewable diesel production flexibility and the typical catalyst change cycle in 24 months would represent the next evaluation window to consider resuming RD production if economics warranted. • Strategic priorities are to increase cash position, reduce operating costs, and improve margins; market conditions continue to support this decision and to progress all of these for the remainder of 2024 and into 2025

APPENDIX

NON - GAAP RECONCILIATION 13 Unaudited Reconciliation of Gross Profit (Loss) From Continued and Discontinued Operations to Adjusted Gross Margin, Fuel Gross Margin, Fuel Gross Margin Per Barrel of Throughput and Operating Expenses Per Barrel of Throughput. In thousands Conventional Renewable Mobile Refinery Total Gross profit 6,407$ (11,847)$ (5,440)$ Unrealized (gain) loss on hedging activities 353 (302) 51 Inventory valuation adjustments 3,233 2,524 5,757 Adjusted gross margin 9,993$ (9,625)$ 368$ Variable production costs attributable to cost of revenues 19,671 12,182 31,853 Depreciation and amortization attributable to cost of revenues 2,960 3,933 6,893 RINs 9,099 - 9,099 Realized (gain) loss on hedging activities (56) 158 102 Financing costs (4,397) 85 (4,312) Other revenues (2,296) (2,208) (4,504) Fuel gross margin 34,974$ 4,525$ 39,499$ Throughput (bpd) 67,758 3,092 70,850 Fuel gross margin per barrel of throughput $5.67 16.08$ $6.13 Total OPEX 15,942$ 8,934$ 24,876$ Operating expenses per barrel of throughput $2.59 31.75$ $3.86 Three Months Ended June 30, 2024

NON - GAAP RECONCILIATION 14 Unaudited Reconciliation of Gross Profit (Loss) From Continued and Discontinued Operations to Adjusted Gross Margin, Fuel Gross Margin, Fuel Gross Margin Per Barrel of Throughput and Operating Expenses Per Barrel of Throughput. In thousands Conventional Renewable Mobile Refinery Total Gross profit 43,917$ (22,310)$ 21,607$ Unrealized (gain) loss on hedging activities (202) 632 430 Inventory valuation adjustments 12,890 7,117 20,007 Adjusted gross margin 56,605$ (14,561)$ 42,044$ Variable production costs attributable to cost of revenues 45,322 19,029 64,351 Depreciation and amortization attributable to cost of revenues 5,518 7,865 13,383 RINs 8,242 - 8,242 Realized (gain) loss on hedging activities 2,521 (1,625) 896 Financing costs (4,569) 217 (4,352) Other revenues (5,015) (2,570) (7,585) Fuel gross margin 108,624$ 8,355$ 116,979$ Throughput (bpd) 65,911 3,591 69,502 Fuel gross margin per barrel of throughput $9.06 12.78$ $9.25 Total OPEX 32,002$ 18,316$ 50,319$ Operating expenses per barrel of throughput $2.67 28.03$ $3.98 Six Months Ended June 30, 2024
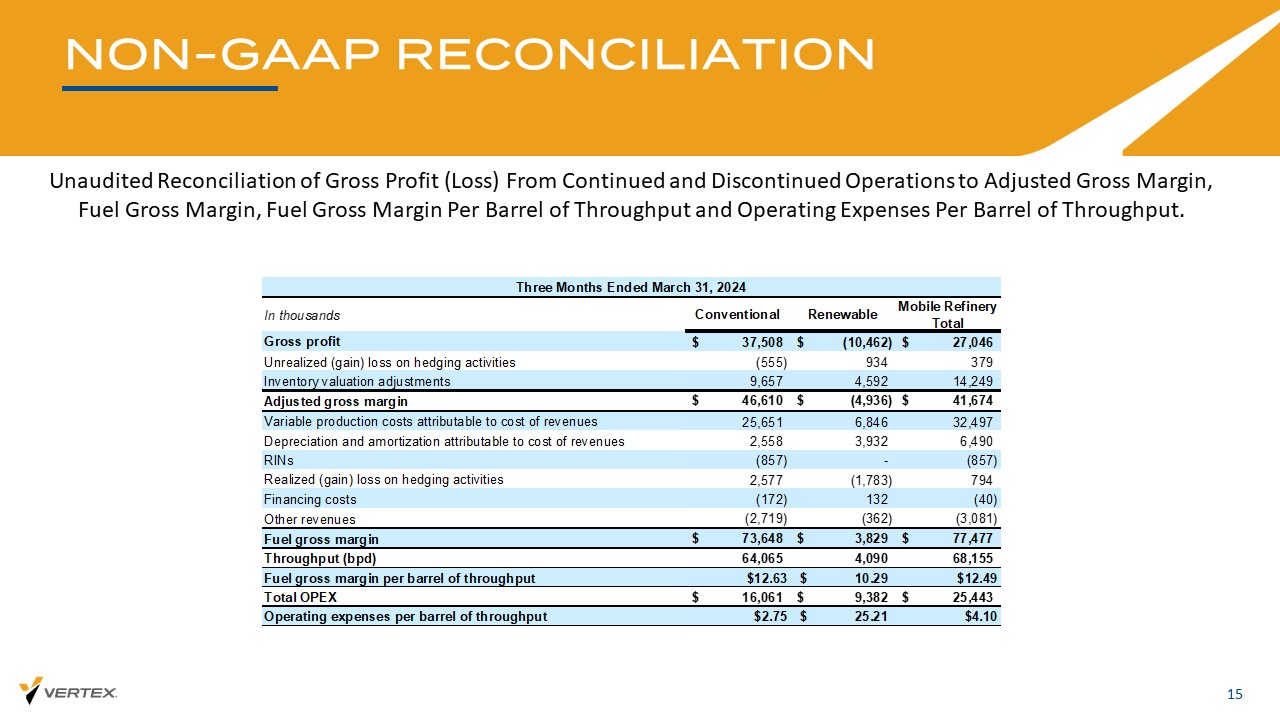
NON - GAAP RECONCILIATION 15 Unaudited Reconciliation of Gross Profit (Loss) From Continued and Discontinued Operations to Adjusted Gross Margin, Fuel Gross Margin, Fuel Gross Margin Per Barrel of Throughput and Operating Expenses Per Barrel of Throughput. In thousands Conventional Renewable Mobile Refinery Total Gross profit 37,508$ (10,462)$ 27,046$ Unrealized (gain) loss on hedging activities (555) 934 379 Inventory valuation adjustments 9,657 4,592 14,249 Adjusted gross margin 46,610$ (4,936)$ 41,674$ Variable production costs attributable to cost of revenues 25,651 6,846 32,497 Depreciation and amortization attributable to cost of revenues 2,558 3,932 6,490 RINs (857) - (857) Realized (gain) loss on hedging activities 2,577 (1,783) 794 Financing costs (172) 132 (40) Other revenues (2,719) (362) (3,081) Fuel gross margin 73,648$ 3,829$ 77,477$ Throughput (bpd) 64,065 4,090 68,155 Fuel gross margin per barrel of throughput $12.63 10.29$ $12.49 Total OPEX 16,061$ 9,382$ 25,443$ Operating expenses per barrel of throughput $2.75 25.21$ $4.10 Three Months Ended March 31, 2024
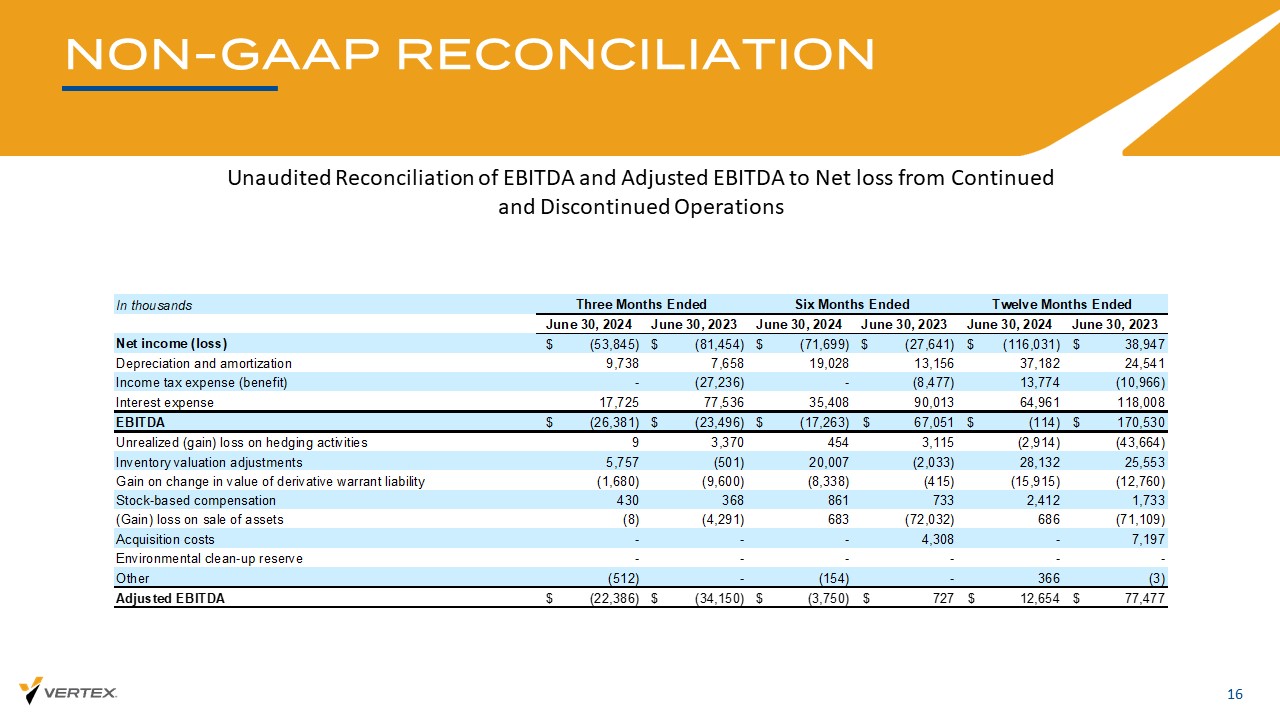
NON - GAAP RECONCILIATION 16 Unaudited Reconciliation of EBITDA and Adjusted EBITDA to Net loss from Continued and Discontinued Operations In thousands June 30, 2024 June 30, 2023 June 30, 2024 June 30, 2023 June 30, 2024 June 30, 2023 Net income (loss) $ (53,845) $ (81,454) $ (71,699) $ (27,641) $ (116,031) $ 38,947 Depreciation and amortization 9,738 7,658 19,028 13,156 37,182 24,541 Income tax expense (benefit) - (27,236) - (8,477) 13,774 (10,966) Interest expense 17,725 77,536 35,408 90,013 64,961 118,008 EBITDA $ (26,381) $ (23,496) $ (17,263) $ 67,051 $ (114) $ 170,530 Unrealized (gain) loss on hedging activities 9 3,370 454 3,115 (2,914) (43,664) Inventory valuation adjustments 5,757 (501) 20,007 (2,033) 28,132 25,553 Gain on change in value of derivative warrant liability (1,680) (9,600) (8,338) (415) (15,915) (12,760) Stock-based compensation 430 368 861 733 2,412 1,733 (Gain) loss on sale of assets (8) (4,291) 683 (72,032) 686 (71,109) Acquisition costs - - - 4,308 - 7,197 Environmental clean-up reserve - - - - - - Other (512) - (154) - 366 (3) Adjusted EBITDA $ (22,386) $ (34,150) $ (3,750) $ 727 $ 12,654 $ 77,477 Three Months Ended Twelve Months EndedSix Months Ended

NON - GAAP RECONCILIATION 17 Unaudited Reconciliation of EBITDA and Adjusted EBITDA to Net loss from Continued and Discontinued Operations In thousands Conventional Renewable Net income (loss) $ (13,046) $ (23,438) $ 914 $ (35,570) $ (1,405) $ (16,870) $ (53,845) Depreciation and amortization 3,754 3,954 52 7,760 1,740 238 9,738 Income tax expense (benefit) - - - - - - - Interest expense 2,717 2,636 - 5,353 141 12,231 17,725 EBITDA $ (6,575) $ (16,848) $ 966 $ (22,457) $ 476 $ (4,401) $ (26,382) Unrealized (gain) loss on hedging activities 353 (302) - 51 (42) - 9 Inventory valuation adjustments 3,233 2,524 - 5,757 - - 5,757 Gain on change in value of derivative warrant liability - - - - - (1,680) (1,680) Stock-based compensation - - - - - 430 430 (Gain) loss on sale of assets - - - - - (8) (8) Other - - - - 56 (568) (512) Adjusted EBITDA $ (2,988) $ (14,626) $ 966 $ (16,649) $ 490 $ (6,227) $ (22,386) Three Months Ended June 30, 2024 Mobile Refinery Legacy Refining & Marketing Total Refining & Marketing Black Oil and Recovery Corporate Consolidated

NON - GAAP RECONCILIATION 18 Unaudited Reconciliation of EBITDA and Adjusted EBITDA to Net loss from Continued and Discontinued Operations In thousands Mobile Refinery Legacy Refining and Marketing Total Refining & Marketing Black Oil and Recovery Corporate Consolidated Net income (loss) $ (42,116) $ (1,312) $ (43,428) $ (3,667) $ (34,359) $ (81,454) Depreciation and amortization 6,119 272 6,391 1,100 167 7,658 Income tax expense (benefit) - - - - (27,236) (27,236) Interest expense 4,529 - 4,529 28 72,979 77,536 EBITDA $ (31,468) $ (1,040) $ (32,508) $ (2,539) $ 11,551 $ (23,496) Unrealized (gain) loss on hedging activities 3,762 25 3,787 (417) - 3,370 Inventory valuation adjustments (501) - (501) - - (501) Gain on change in value of derivative warrant liability - - - - (9,600) (9,600) Stock-based compensation - - - - 368 368 (Gain) loss on sale of assets - - - 499 (4,790) (4,291) Adjusted EBITDA $ (28,207) $ (1,015) $ (29,222) $ (2,457) $ (2,471) $ (34,150) Three Months Ended June 30, 2023
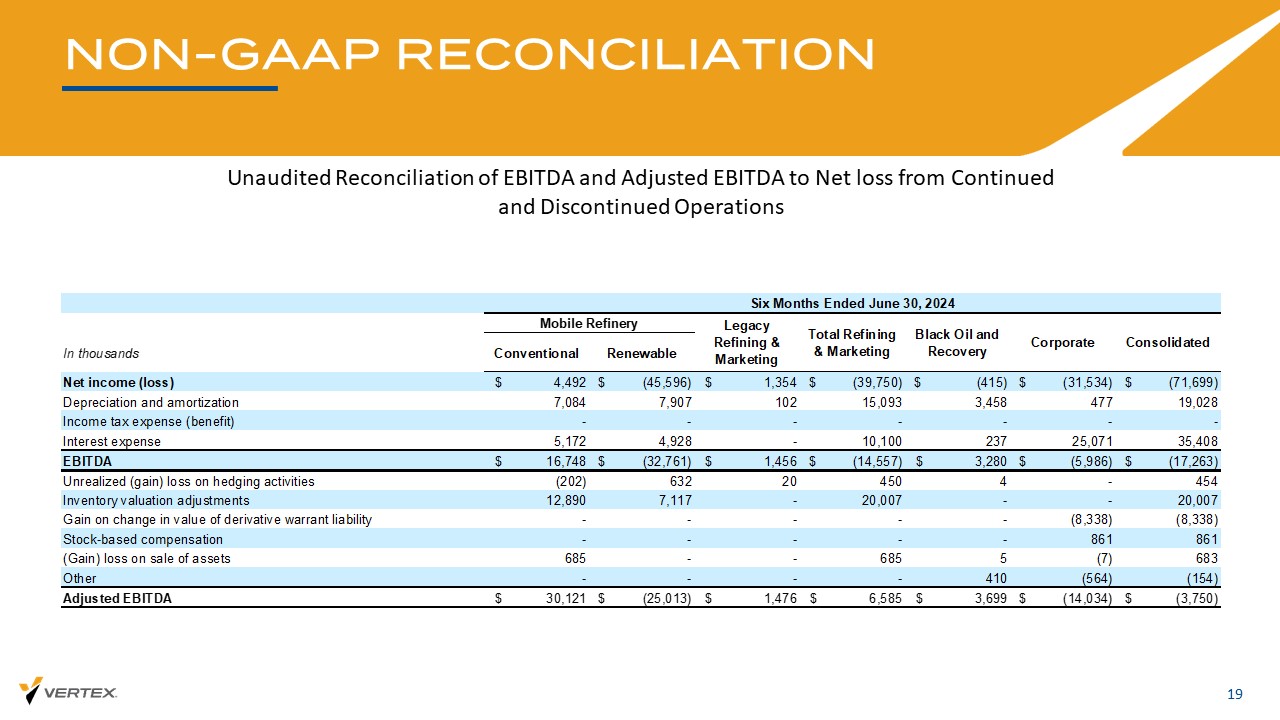
NON - GAAP RECONCILIATION 19 Unaudited Reconciliation of EBITDA and Adjusted EBITDA to Net loss from Continued and Discontinued Operations In thousands Conventional Renewable Net income (loss) $ 4,492 $ (45,596) $ 1,354 $ (39,750) $ (415) $ (31,534) $ (71,699) Depreciation and amortization 7,084 7,907 102 15,093 3,458 477 19,028 Income tax expense (benefit) - - - - - - - Interest expense 5,172 4,928 - 10,100 237 25,071 35,408 EBITDA $ 16,748 $ (32,761) $ 1,456 $ (14,557) $ 3,280 $ (5,986) $ (17,263) Unrealized (gain) loss on hedging activities (202) 632 20 450 4 - 454 Inventory valuation adjustments 12,890 7,117 - 20,007 - - 20,007 Gain on change in value of derivative warrant liability - - - - - (8,338) (8,338) Stock-based compensation - - - - - 861 861 (Gain) loss on sale of assets 685 - - 685 5 (7) 683 Other - - - - 410 (564) (154) Adjusted EBITDA $ 30,121 $ (25,013) $ 1,476 $ 6,585 $ 3,699 $ (14,034) $ (3,750) Six Months Ended June 30, 2024 Mobile Refinery Legacy Refining & Marketing Total Refining & Marketing Black Oil and Recovery Corporate Consolidated
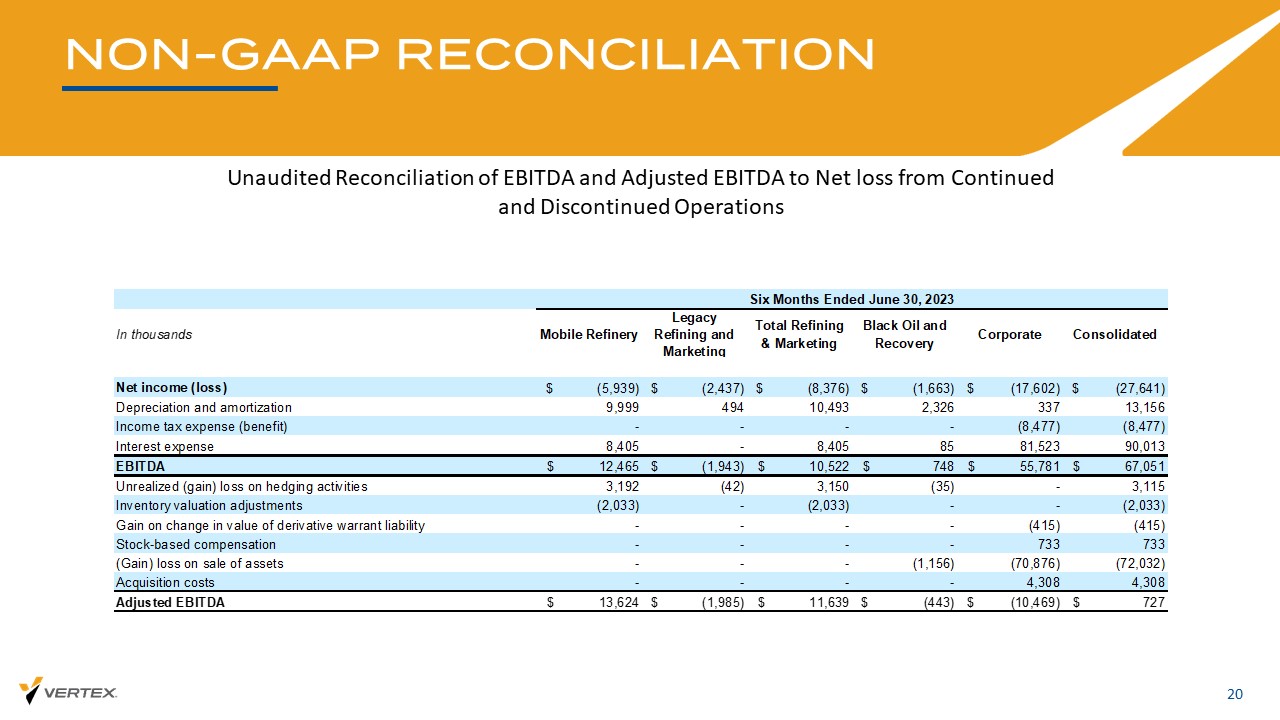
NON - GAAP RECONCILIATION 20 Unaudited Reconciliation of EBITDA and Adjusted EBITDA to Net loss from Continued and Discontinued Operations In thousands Mobile Refinery Legacy Refining and Marketing Total Refining & Marketing Black Oil and Recovery Corporate Consolidated Net income (loss) $ (5,939) $ (2,437) $ (8,376) $ (1,663) $ (17,602) $ (27,641) Depreciation and amortization 9,999 494 10,493 2,326 337 13,156 Income tax expense (benefit) - - - - (8,477) (8,477) Interest expense 8,405 - 8,405 85 81,523 90,013 EBITDA $ 12,465 $ (1,943) $ 10,522 $ 748 $ 55,781 $ 67,051 Unrealized (gain) loss on hedging activities 3,192 (42) 3,150 (35) - 3,115 Inventory valuation adjustments (2,033) - (2,033) - - (2,033) Gain on change in value of derivative warrant liability - - - - (415) (415) Stock-based compensation - - - - 733 733 (Gain) loss on sale of assets - - - (1,156) (70,876) (72,032) Acquisition costs - - - - 4,308 4,308 Adjusted EBITDA $ 13,624 $ (1,985) $ 11,639 $ (443) $ (10,469) $ 727 Six Months Ended June 30, 2023
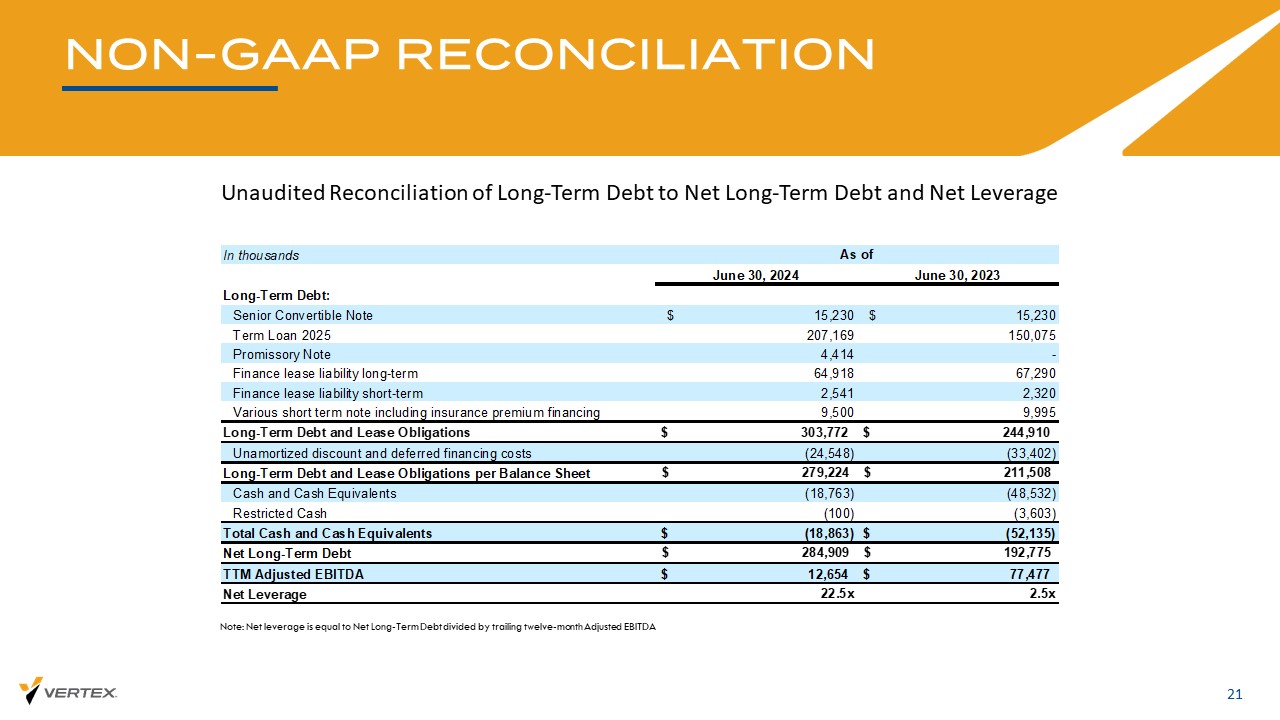
NON - GAAP RECONCILIATION 21 Unaudited Reconciliation of Long - Term Debt to Net Long - Term Debt and Net Leverage Note: Net leverage is equal to Net Long - Term Debt divided by trailing twelve - month Adjusted EBITDA In thousands June 30, 2024 June 30, 2023 Long-Term Debt: Senior Convertible Note $ 15,230 $ 15,230 Term Loan 2025 207,169 150,075 Promissory Note 4,414 - Finance lease liability long-term 64,918 67,290 Finance lease liability short-term 2,541 2,320 Various short term note including insurance premium financing 9,500 9,995 Long-Term Debt and Lease Obligations $ 303,772 $ 244,910 Unamortized discount and deferred financing costs (24,548) (33,402) Long-Term Debt and Lease Obligations per Balance Sheet 279,224$ 211,508$ Cash and Cash Equivalents (18,763) (48,532) Restricted Cash (100) (3,603) Total Cash and Cash Equivalents $ (18,863) $ (52,135) Net Long-Term Debt 284,909$ 192,775$ TTM Adjusted EBITDA $ 12,654 $ 77,477 Net Leverage 22.5x 2.5x As of