Exhibit 99.1
VERTEX ENERGY REPORTS FOURTH QUARTER AND FULL-YEAR 2020 RESULTS
HOUSTON, TX., March 9, 2021 -- Vertex Energy, Inc. (NASDAQ: VTNR, “Vertex Energy” or the “Company”), a leading specialty refiner and marketer of high-quality hydrocarbon products, today announced its financial results for the fourth quarter and full-year ended December 31, 2020.
FOURTH QUARTER 2020 RESULTS
| ▪ | Ongoing recovery in refined product margins at Marrero and Heartland refineries |
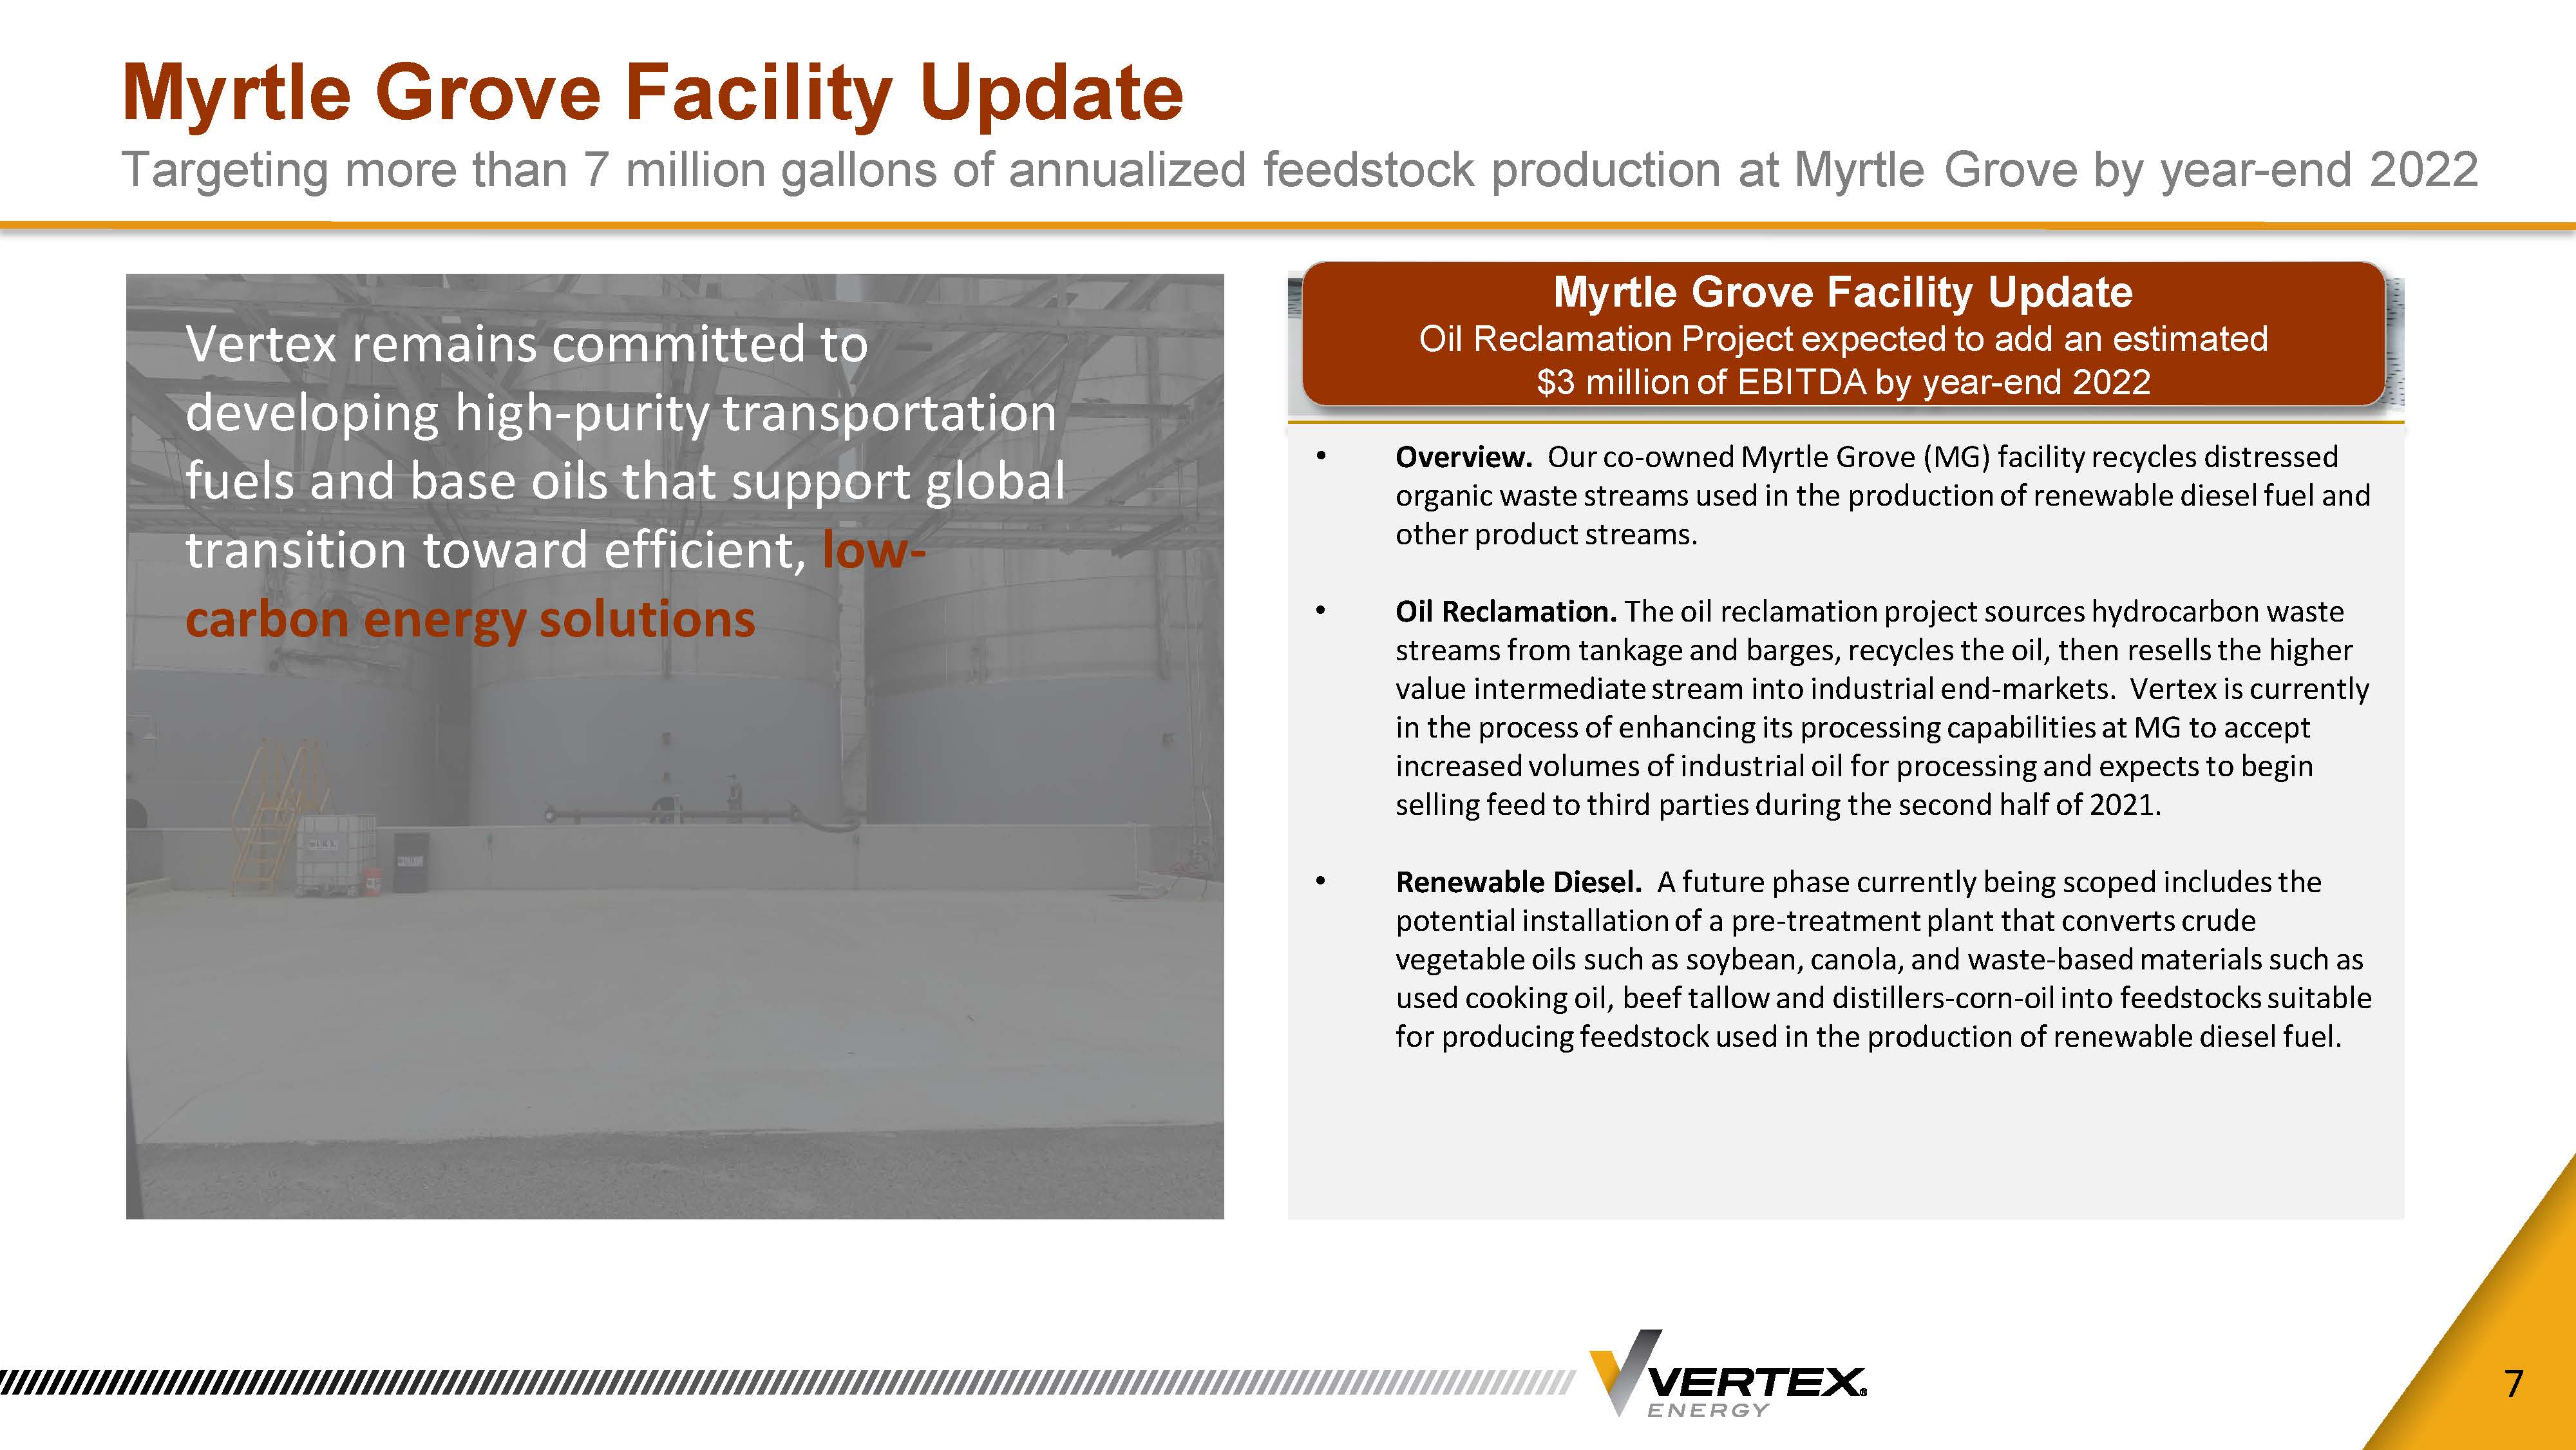
| ▪ | Myrtle Grove Phase-One start-up completed; Phase-Two of the project has commenced |
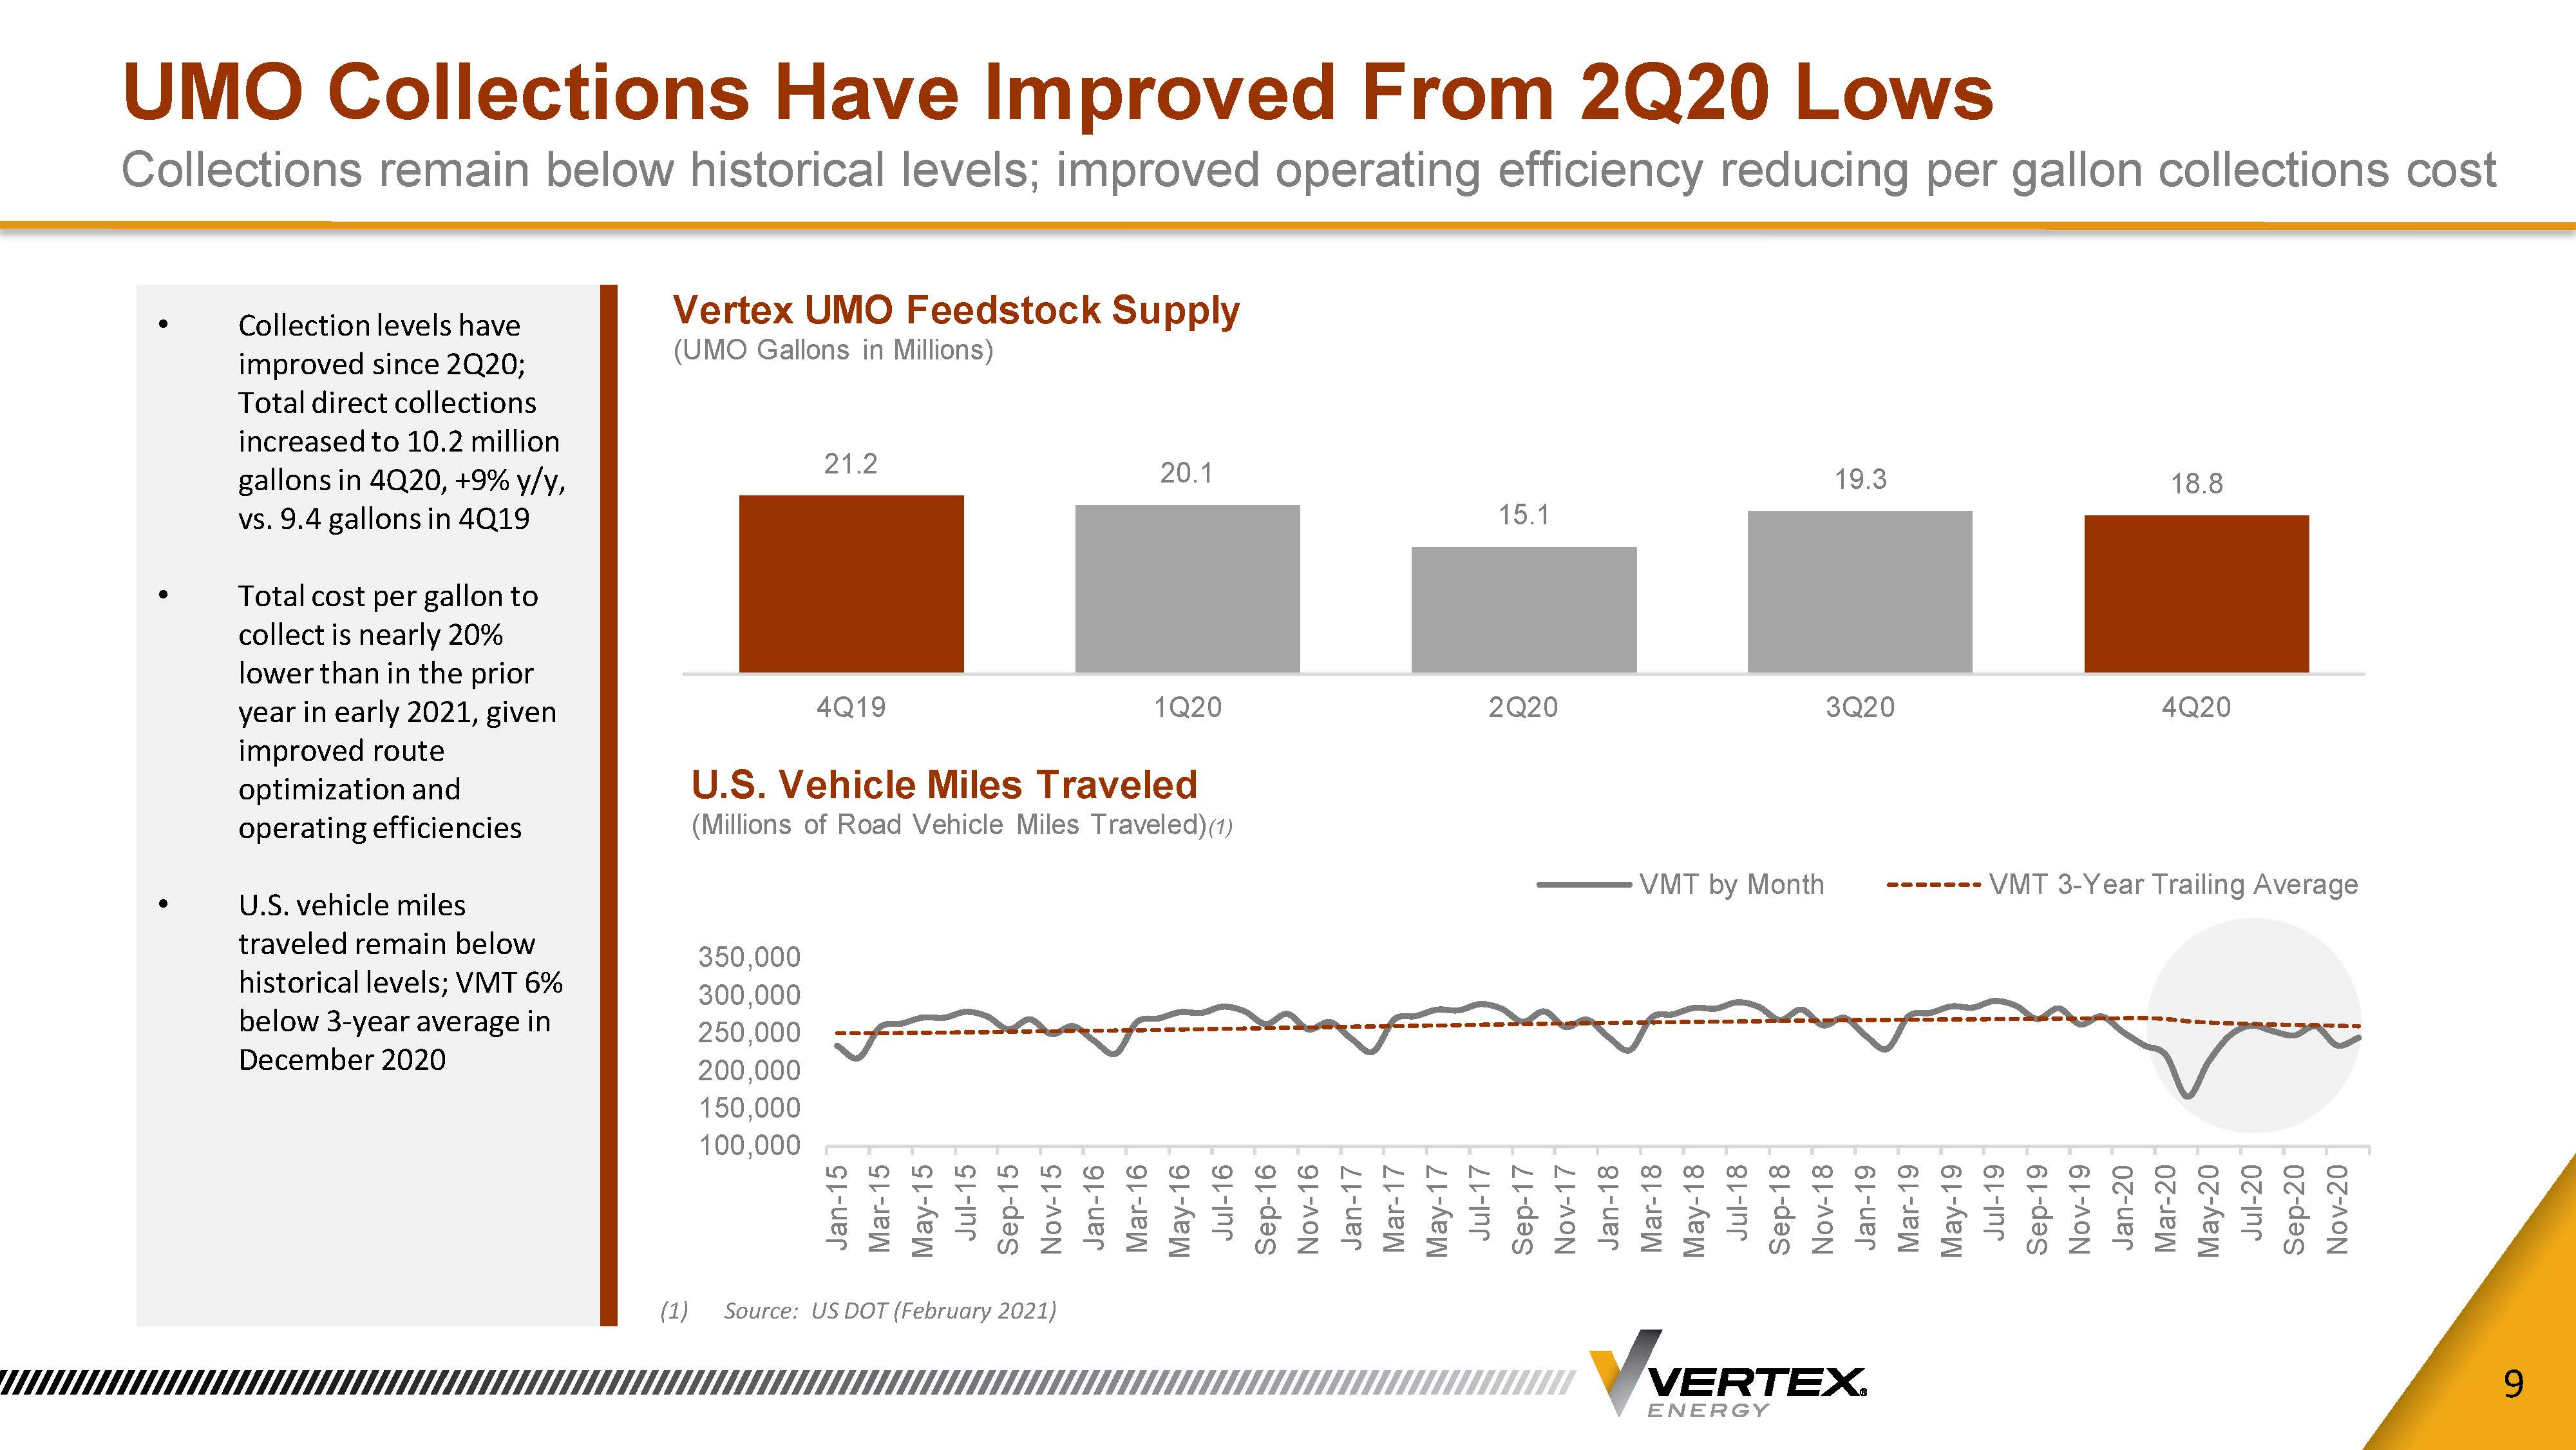
| ▪ | 9% y/y organic growth in direct UMO collections driven by customer account growth |
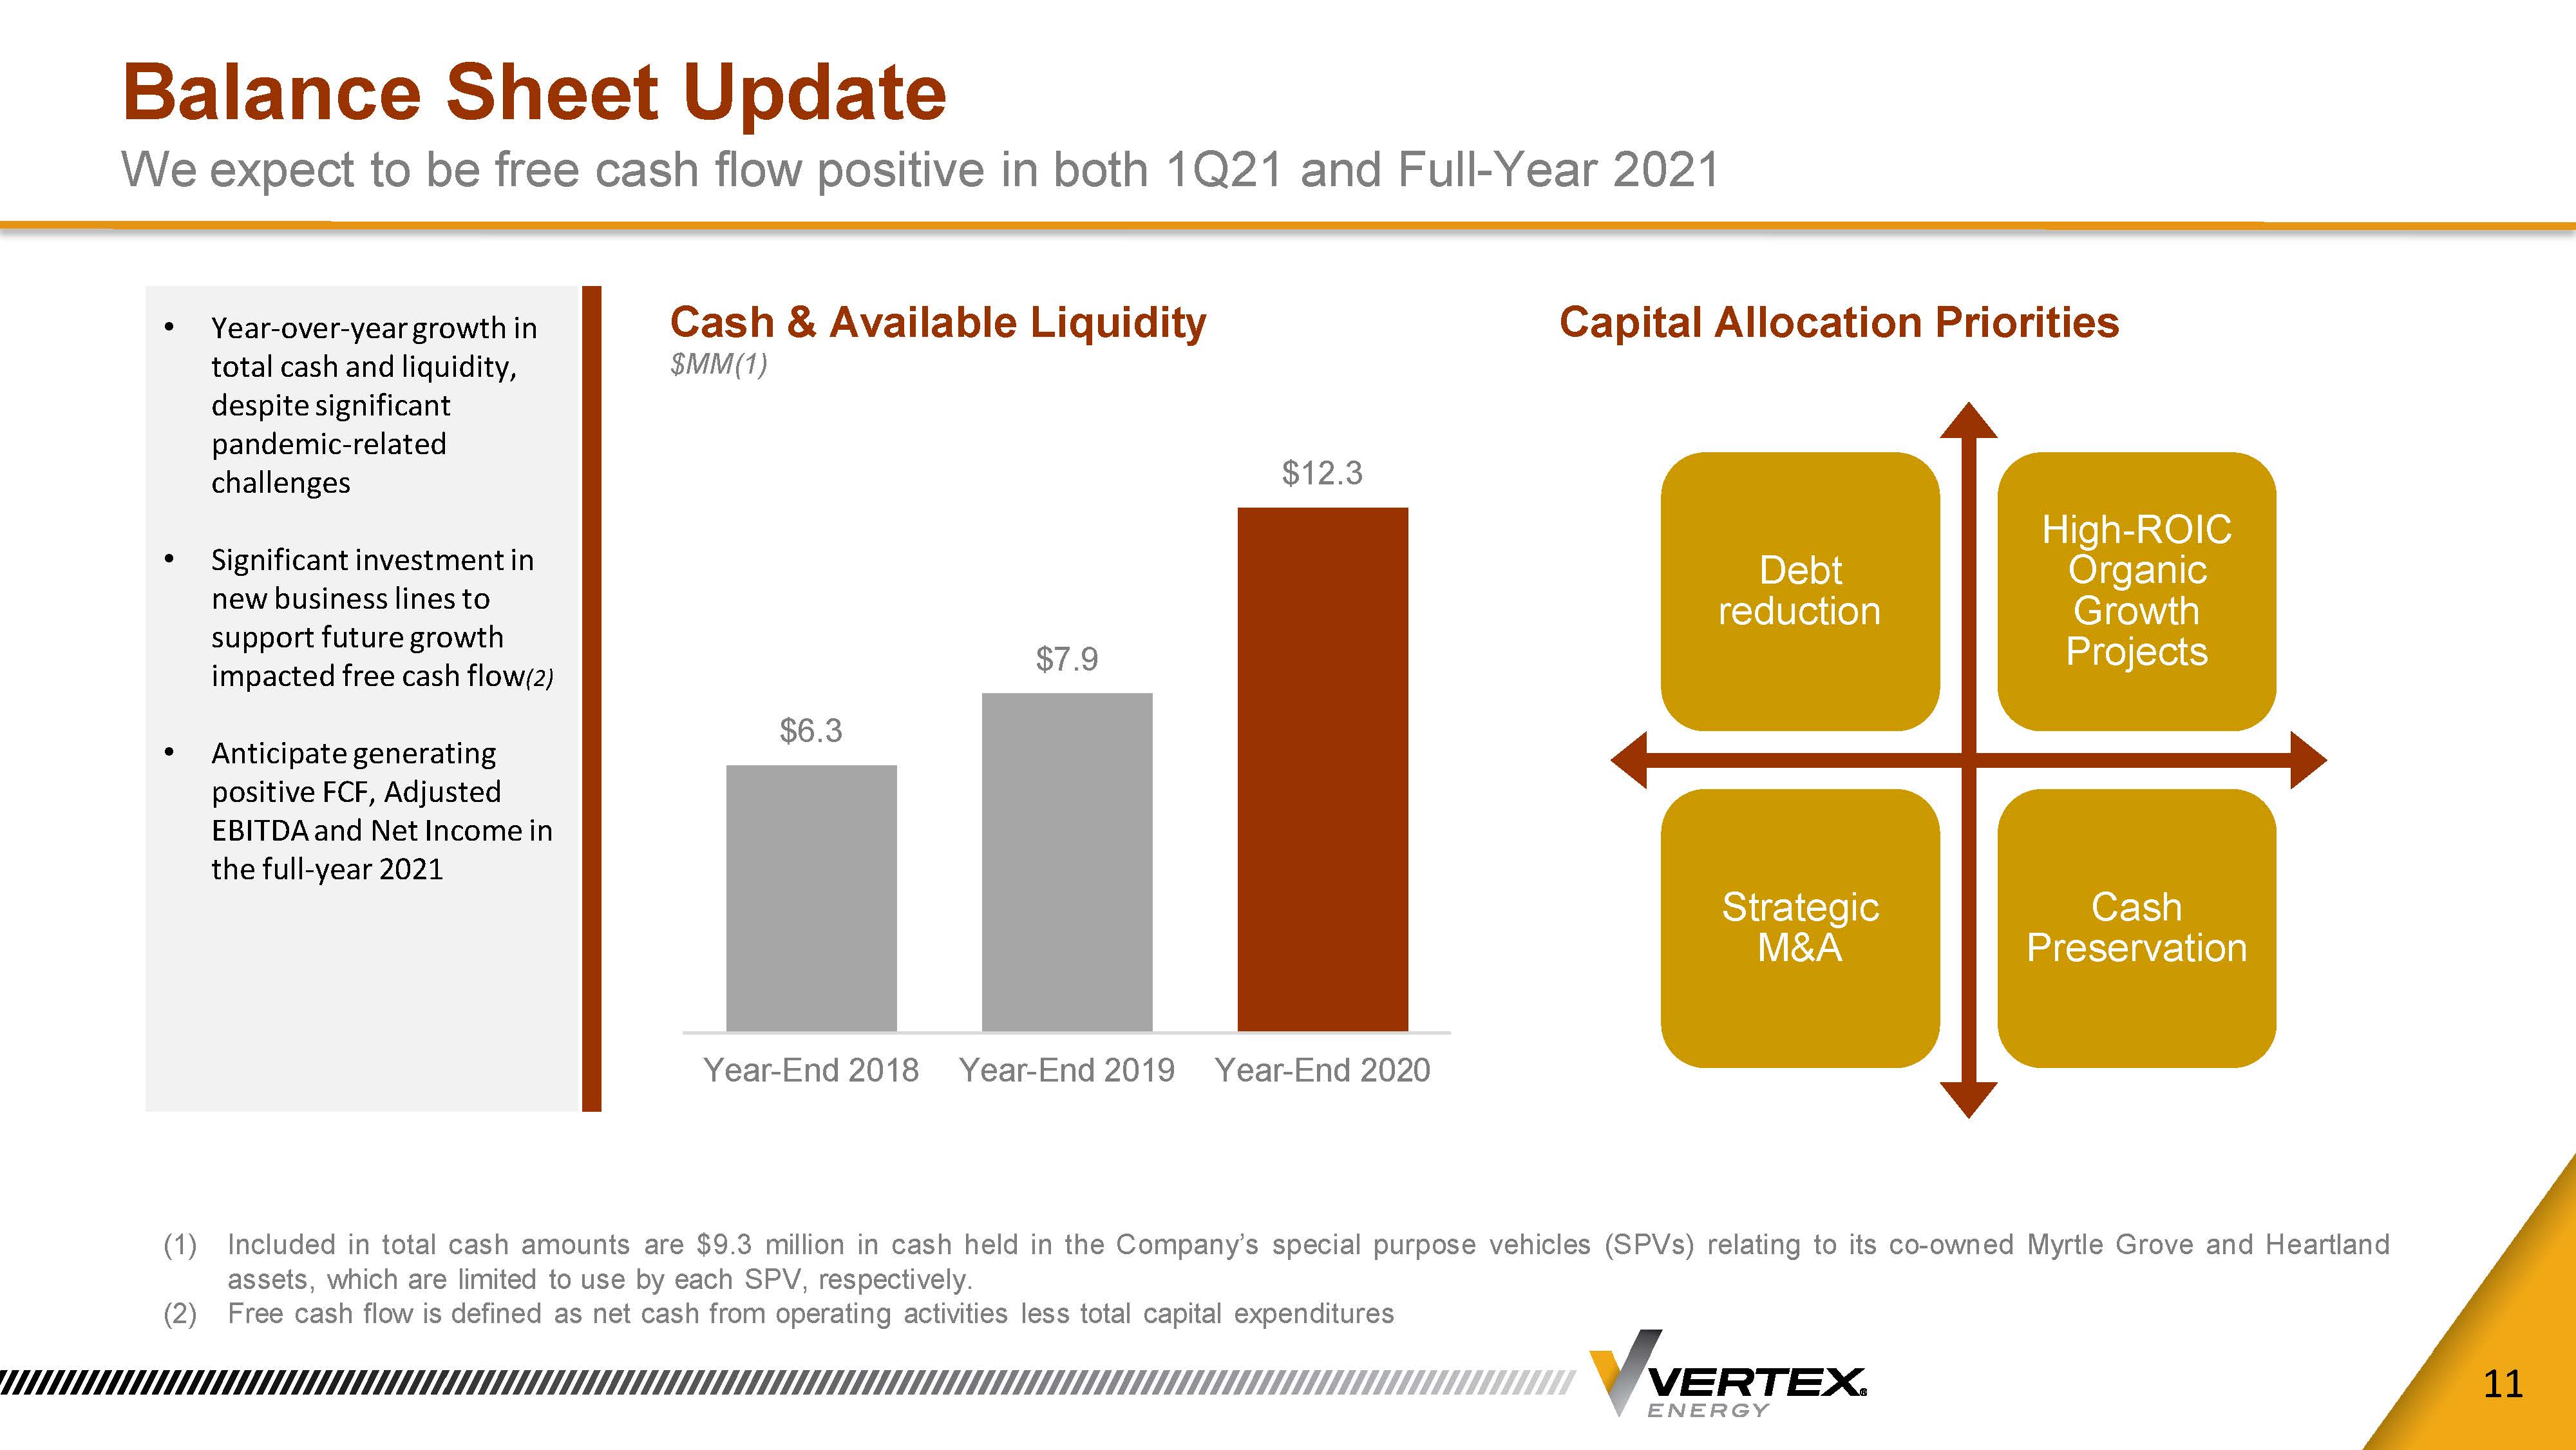
| ▪ | Total cash and available liquidity of $12.3 million as of December 31, 2020 |
MANAGEMENT OUTLOOK
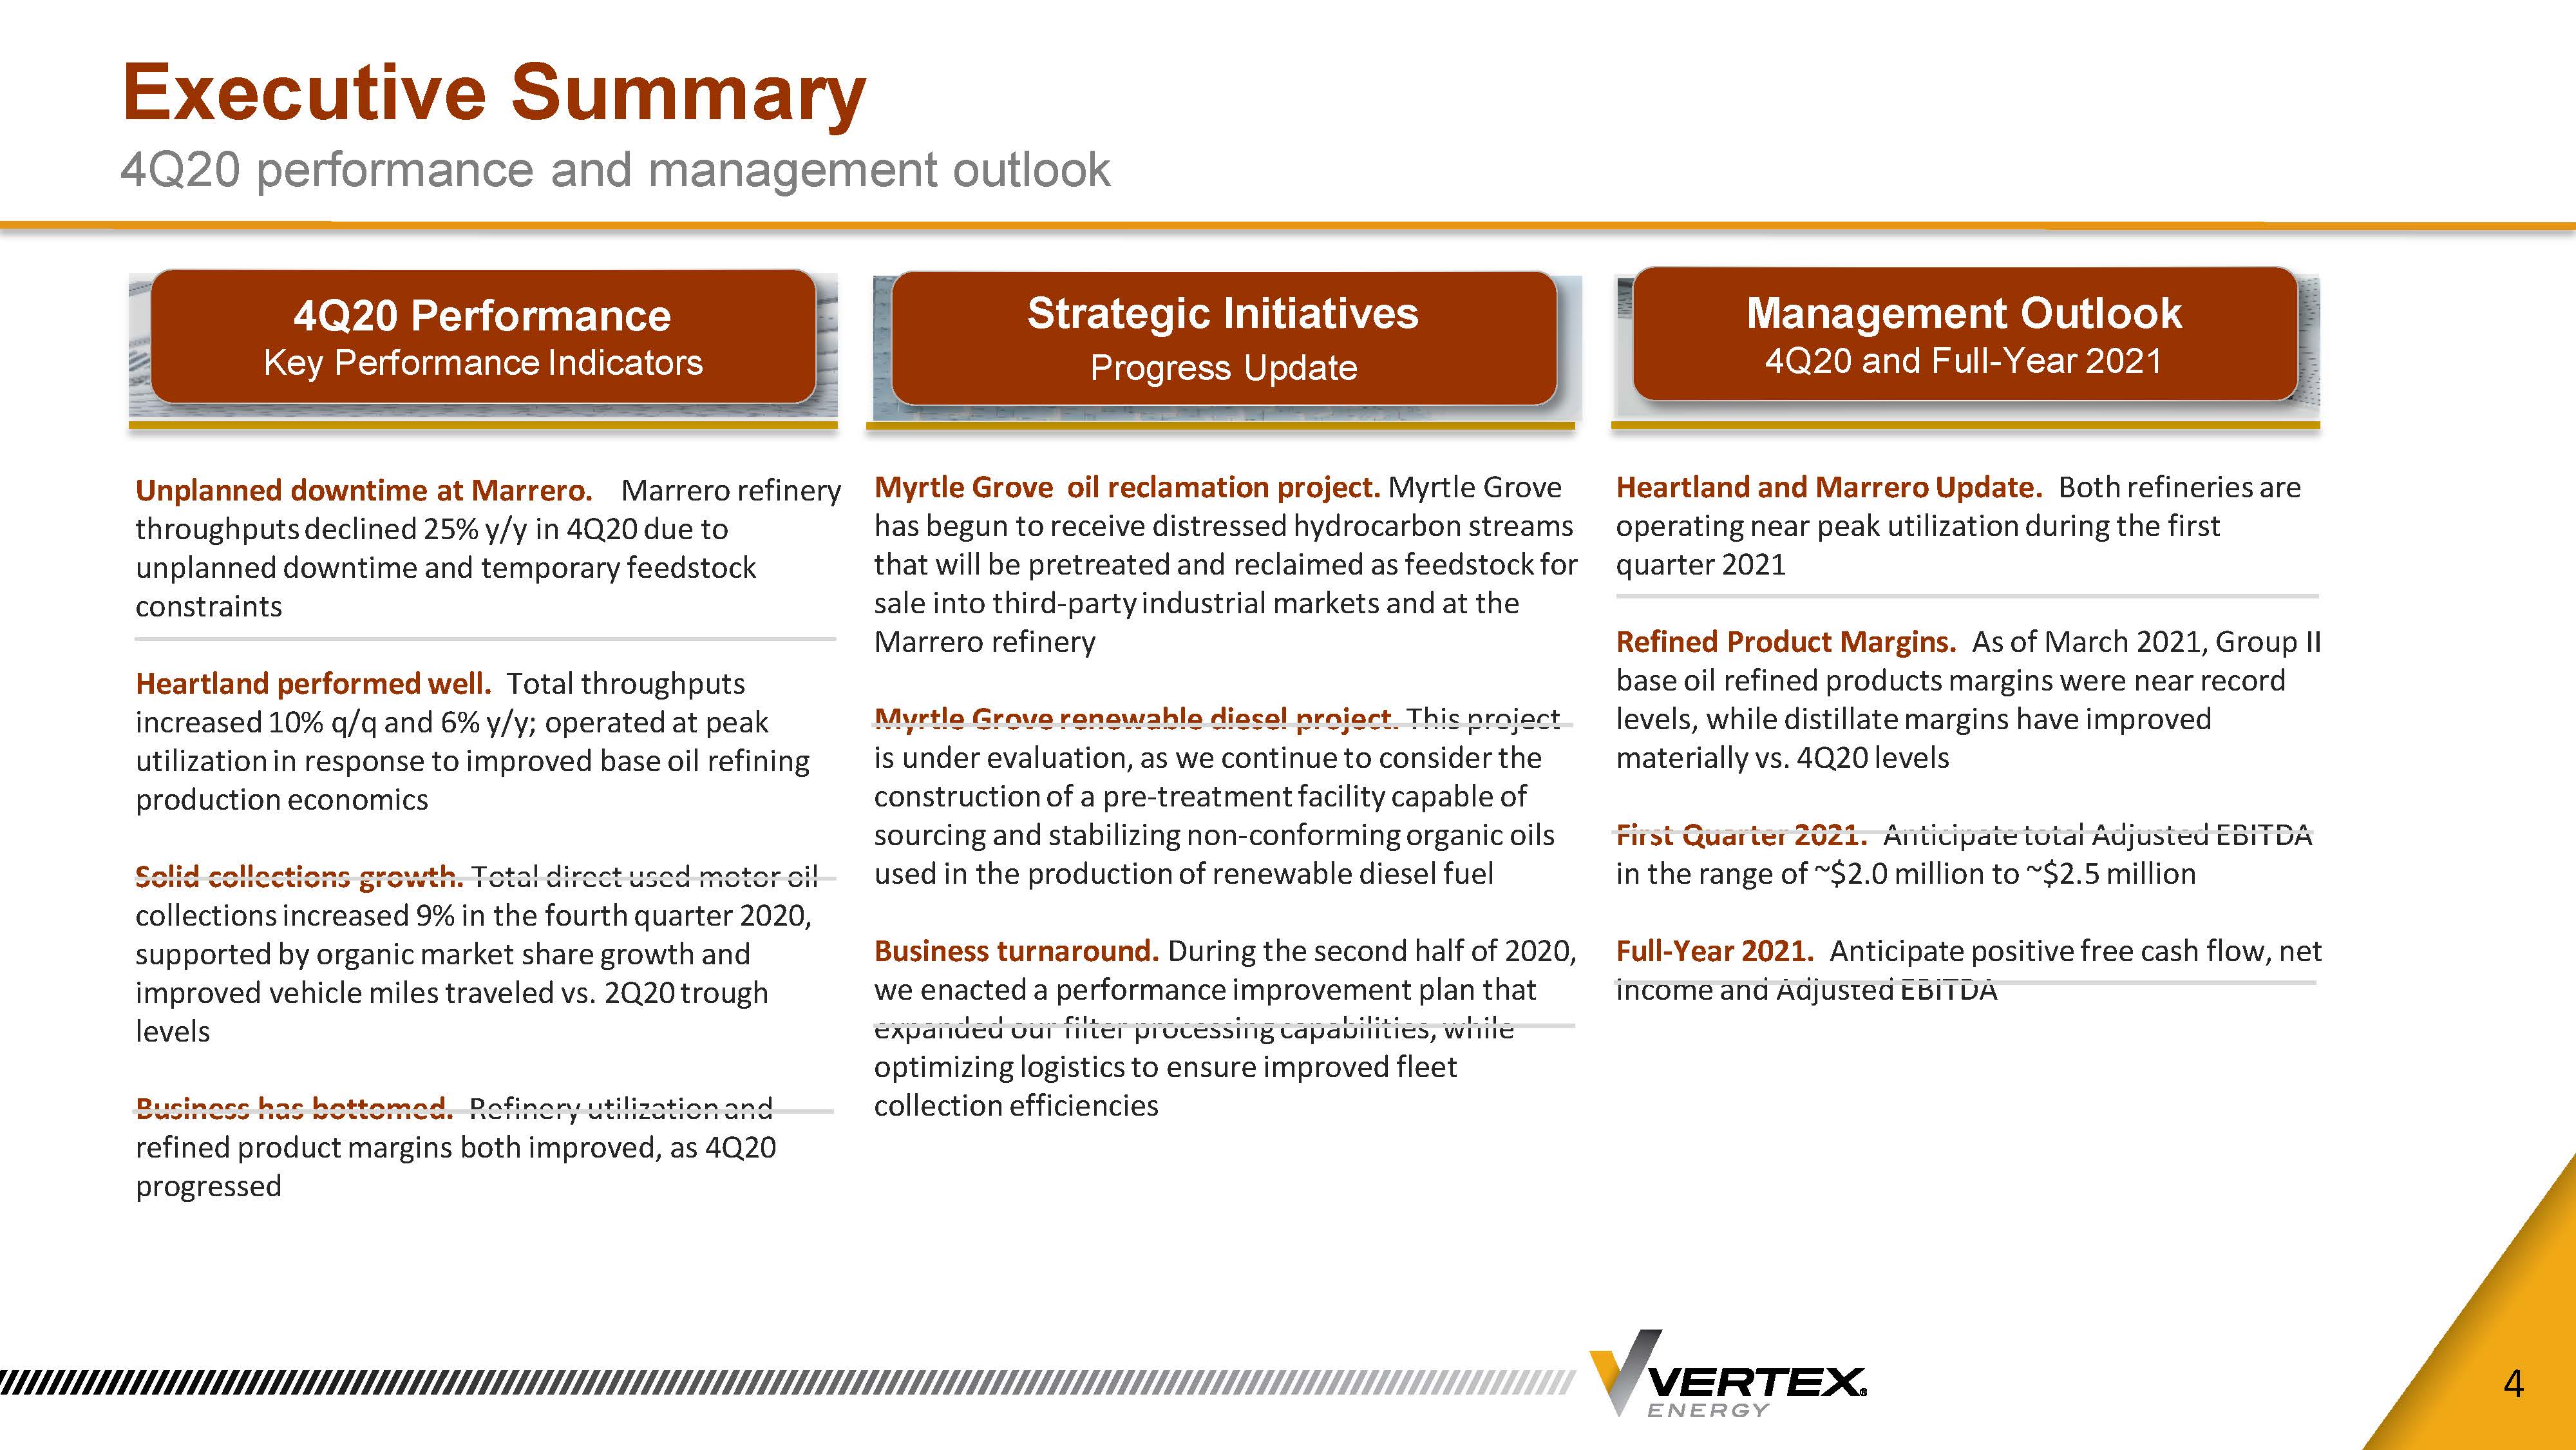
| ▪ | Anticipate positive free cash flow, net income and Adjusted EBITDA for the full-year 2021 |
| ▪ | Anticipate Adjusted EBITDA in the range of $2.0 million to $2.5 million in the first quarter 2021 |
For the three months ended December 31, 2020, the Company reported a net loss attributable to Vertex Energy of ($3.4) million,
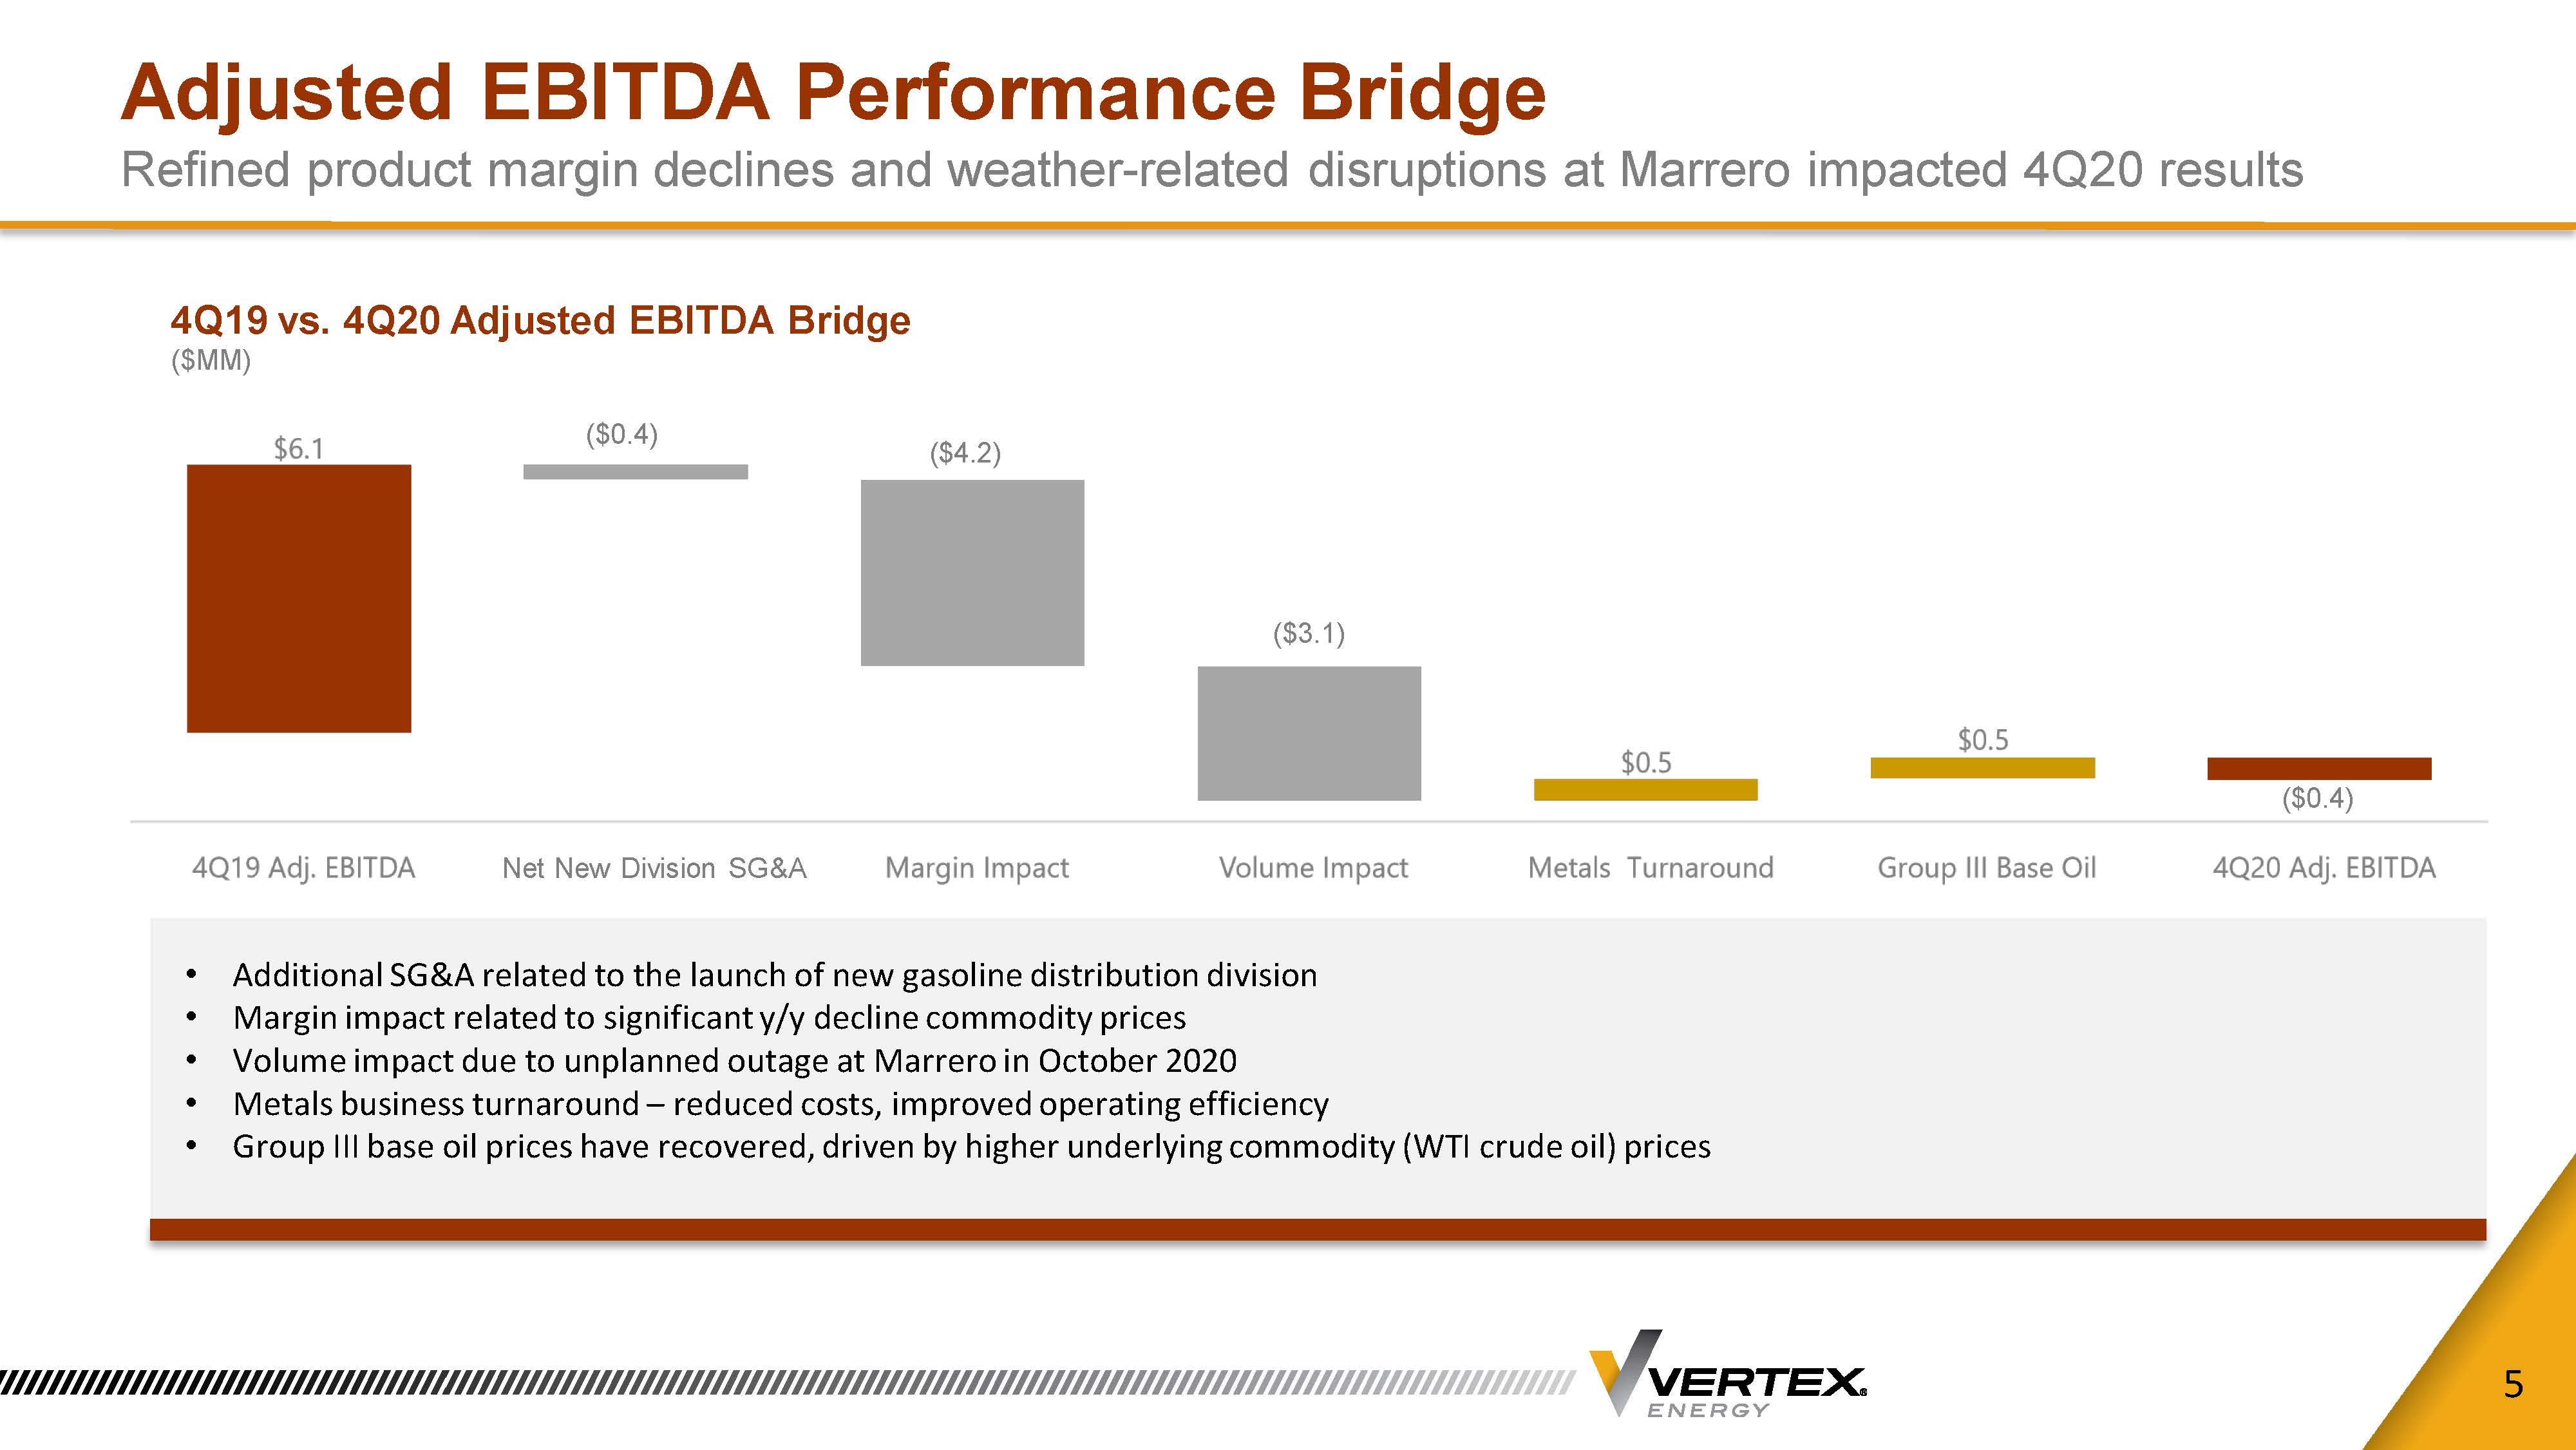
versus net income of $1.4 million in the fourth quarter 2019. Vertex reported Adjusted EBITDA of ($0.4) million for the fourth
quarter 2020, versus $6.1 million in the prior-year period. A schedule reconciling the Company’s GAAP and non-GAAP financial
results, including Free Cash Flow, EBITDA, Adjusted EBITDA, is included later in this release (see also “Non-GAAP Financial
Measures”, below).
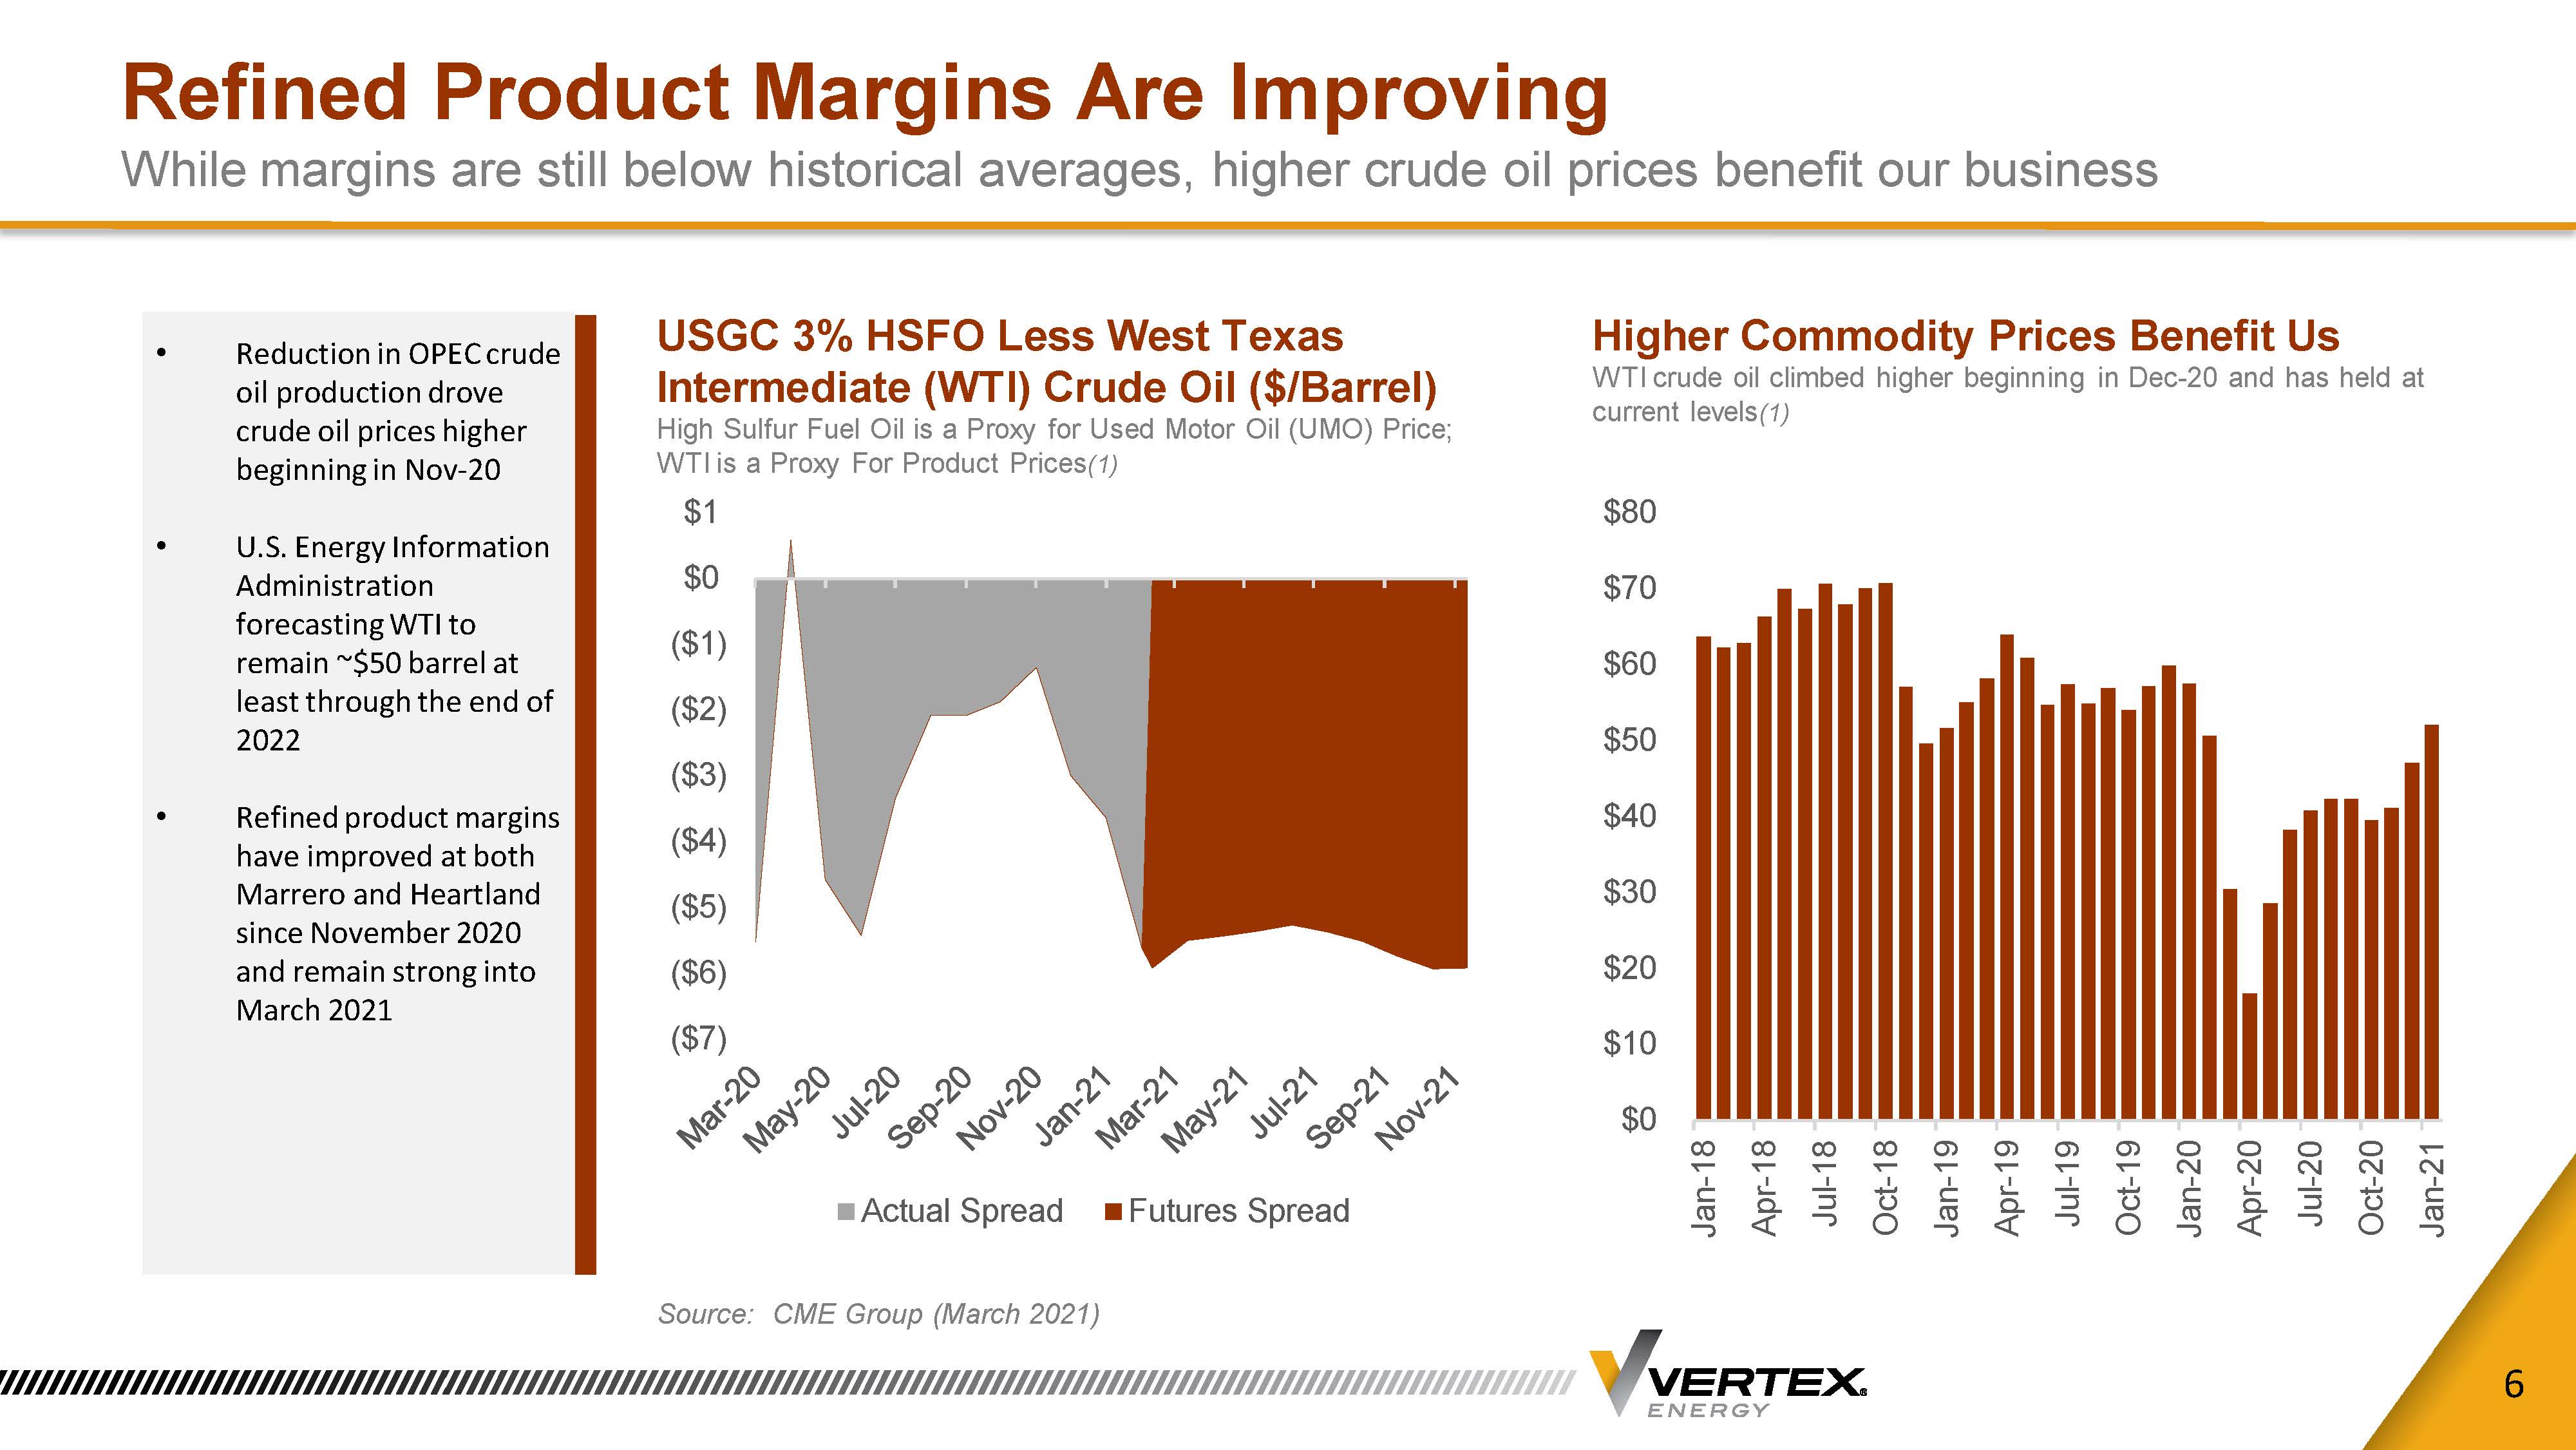
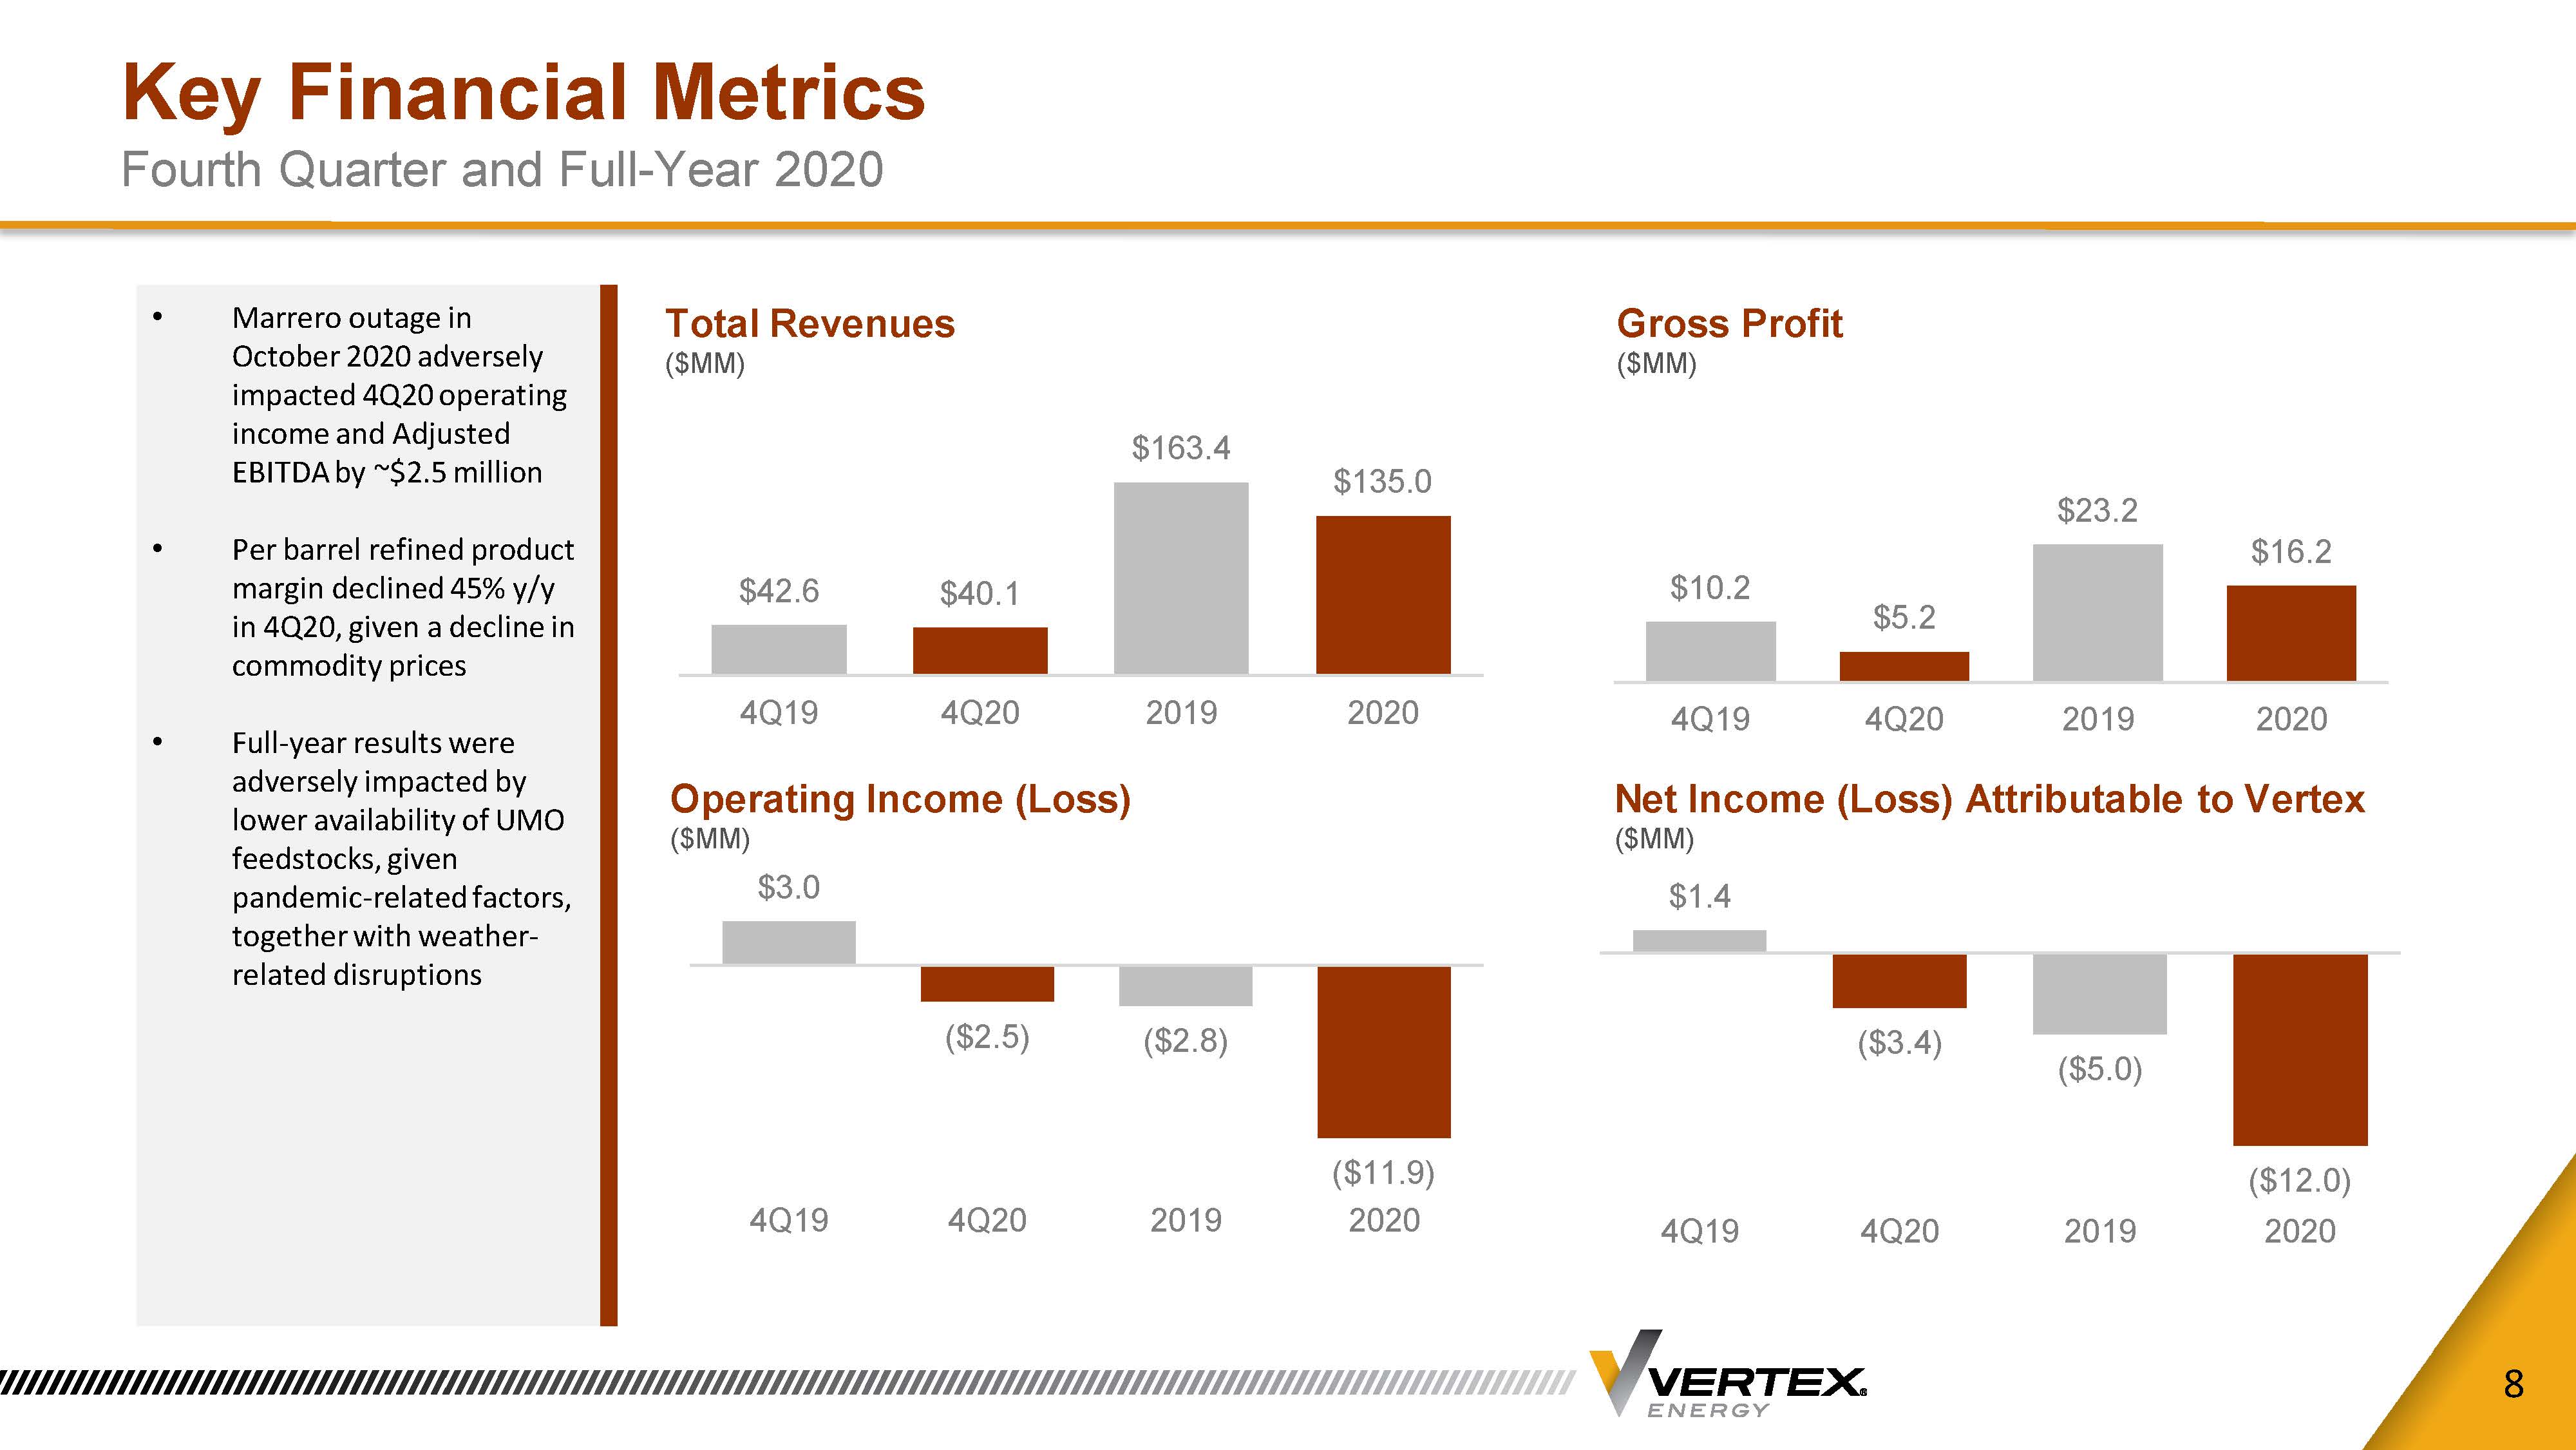
During the fourth quarter 2020, a combination of lower throughputs at the Company’s Marrero, Louisiana refinery and less favorable refined product margins contributed to a year-over-year decline in profitability. Throughput volumes at the Marrero refinery declined 25% on a year-over-year basis in the fourth quarter, resulting in a $2.5 million negative impact to operating income and EBITDA at Marrero. As of November 2020, Marrero returned to full rates with adequate feedstock supply, together with improving product margins. The Company’s Heartland refinery in Columbus, Ohio operated at peak capacity during the fourth quarter, as total throughputs increased 6% on a year-over-year basis. At Heartland, base oil prices increased 15% sequentially in the fourth quarter, when compared to the third quarter 2020. The Company currently anticipates that its base oil prices will increase at a rate in excess of the fourth quarter levels during the first half of 2021.
For the twelve months ended December 31, 2020, the Company reported a net loss attributable to Vertex Energy of ($12.0) million, versus a net loss of ($5.0) million in 2019. Vertex reported Adjusted EBITDA of ($4.6) million in 2020, versus $3.9 million in 2019.
STRATEGIC UPDATE
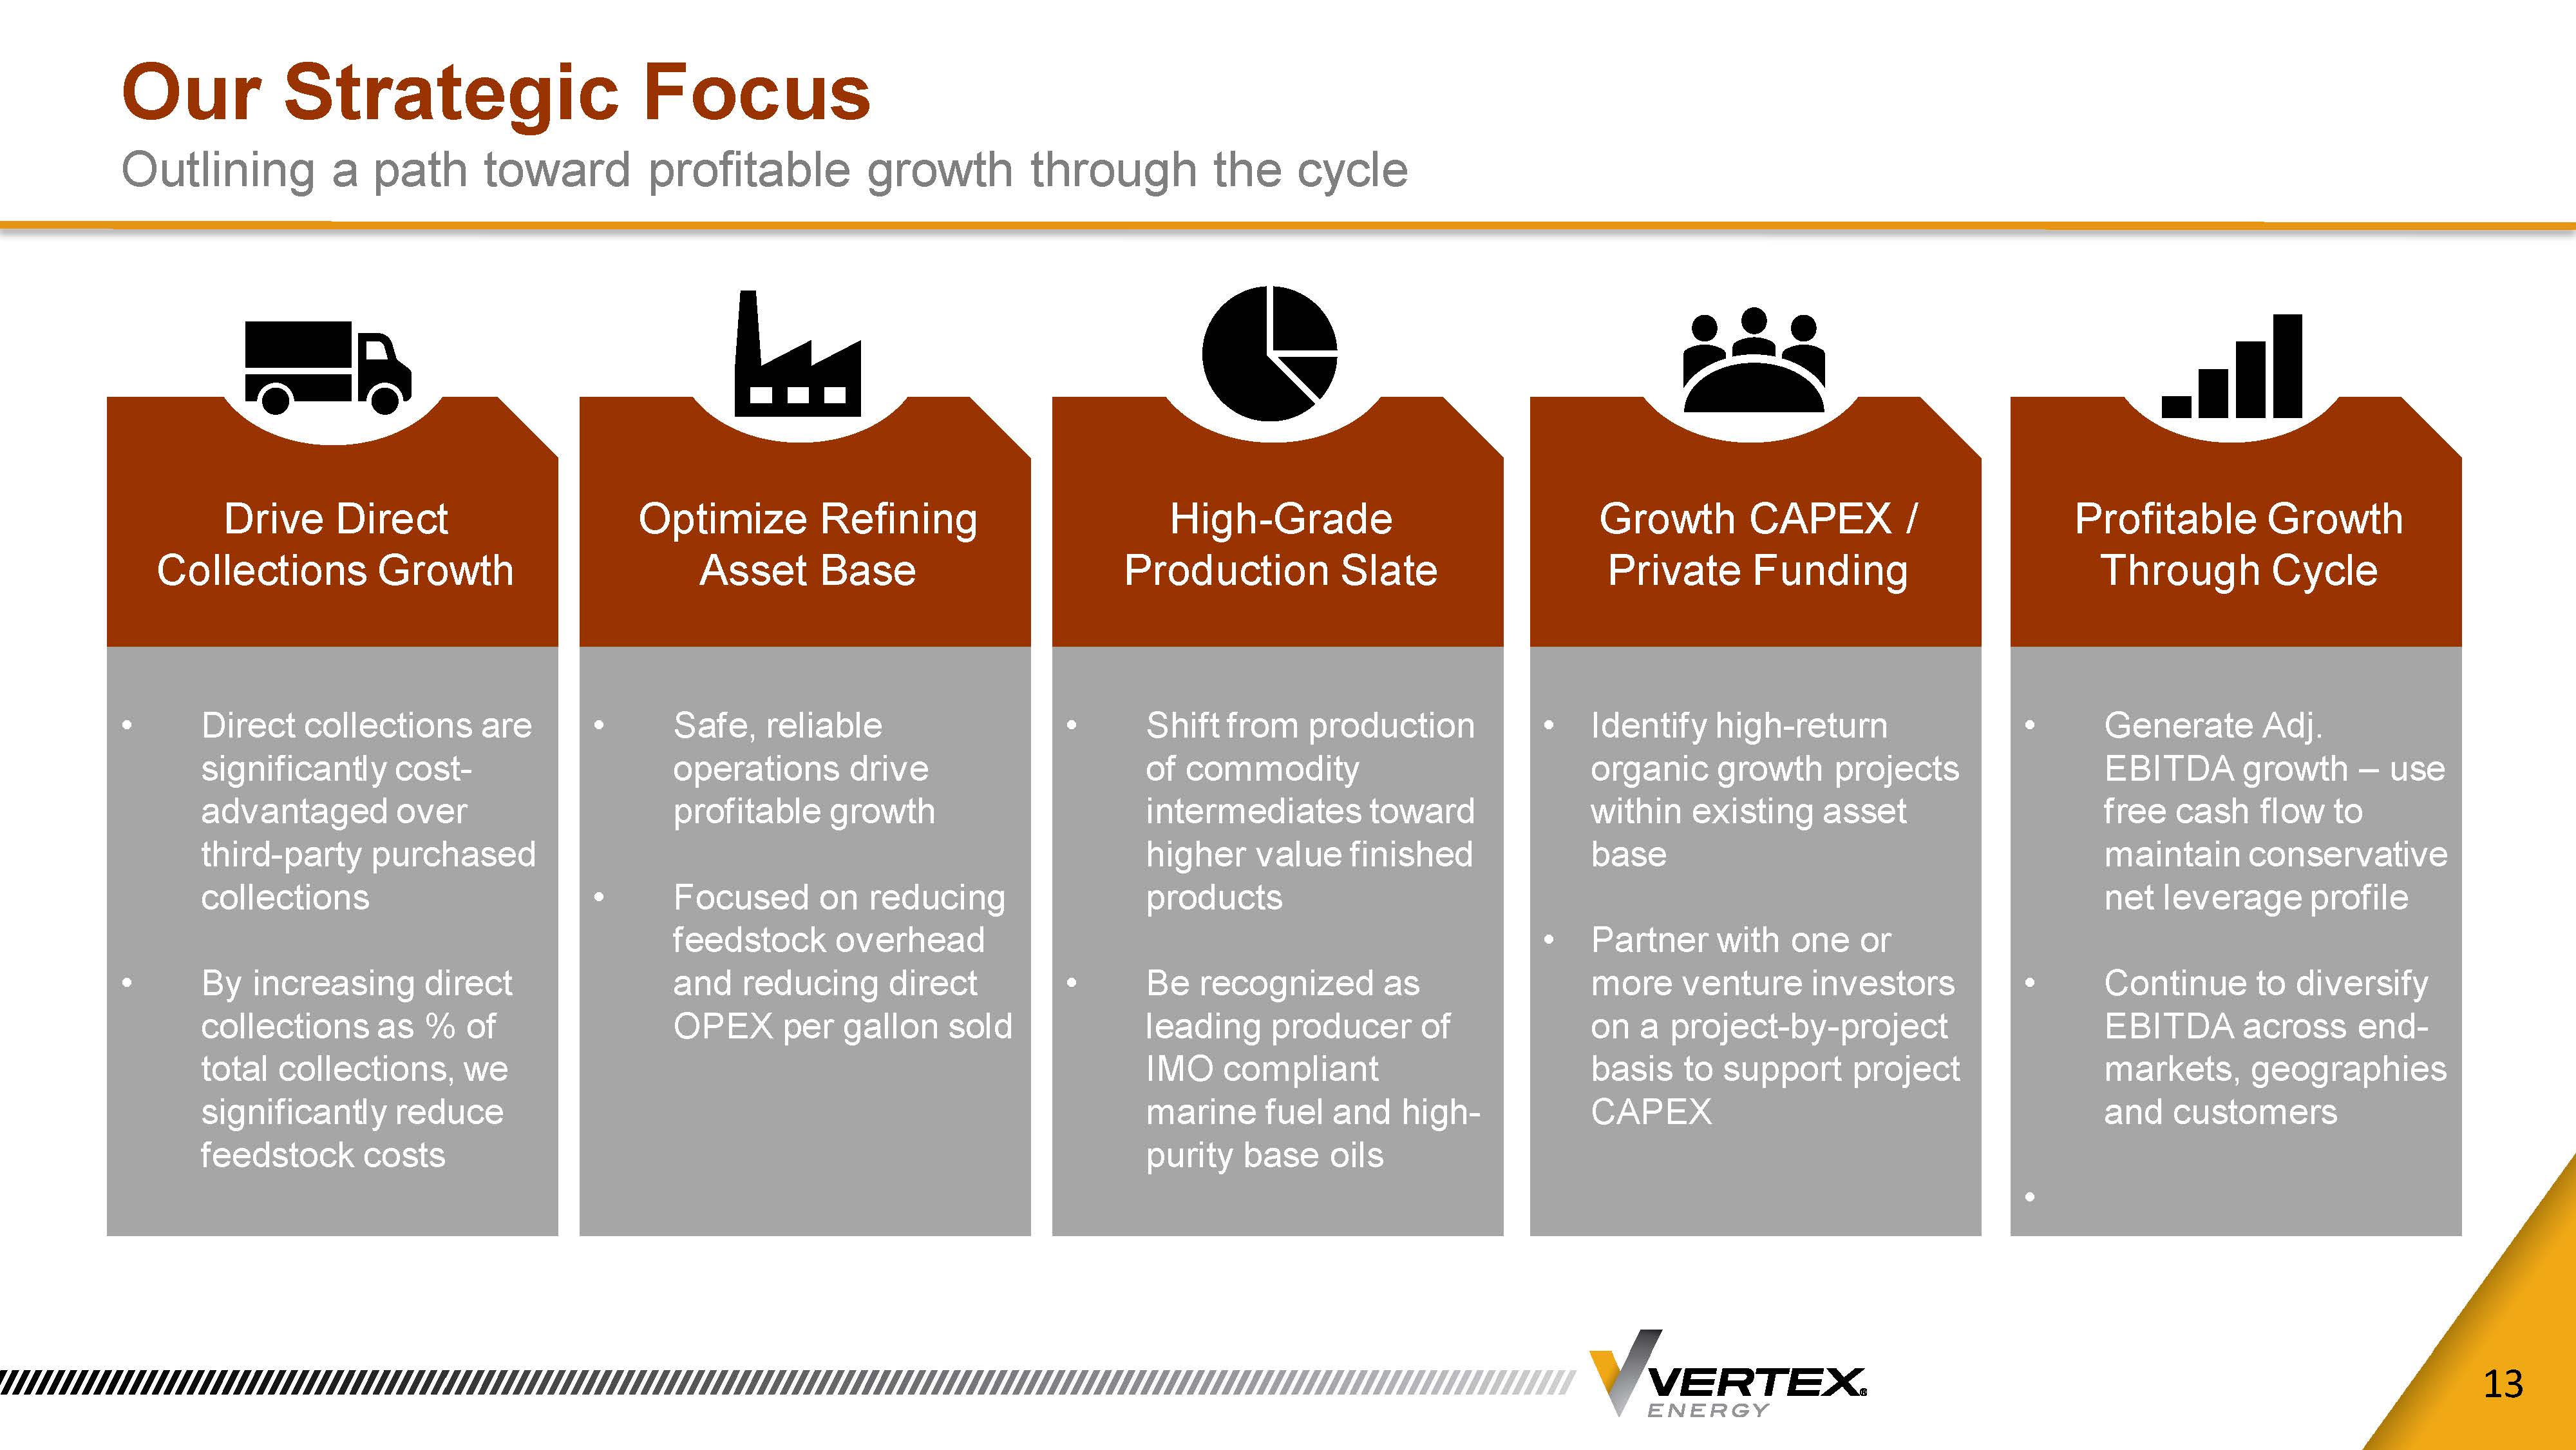
Vertex continued to advance a multi-year business transformation plan during the fourth quarter, positioning the organization to support long-term organic growth in UMO collections, optimize asset utilization and maintain capital discipline.
| • | Myrtle Grove facility. Vertex has completed the initial start-up of its co-owned Myrtle Grove (“MG”) re-refining complex in Belle Chase, Louisiana. MG is currently engaged in two organic growth projects: (1) industrial oil reclamation and recycling; and (2) the processing of non-conforming organic oils, such as vegetable oil or animal tallow, into feedstock used by renewable diesel fuel producers. The oil reclamation project sources hydrocarbon waste streams from tankage and barges, recycles the oil, then resells the higher value intermediate stream as supplemental feed to Marrero and other end-markets. The renewable diesel fuel project is under evaluation, as the Company continues to consider the construction of a pre-treatment facility capable of sourcing and stabilizing non-conforming organic oils used in the production of renewable diesel fuel, subject to both business and market considerations. Vertex has hired an experienced development team to operate the facility and lead the oil reclamation and renewables initiatives. |
| ▪ | Organic collections growth. Total direct used motor oil collections increased 9% in the fourth quarter 2020. Total UMO collections costs declined during the fourth quarter due to a combination of improved route efficiency and economies of scale, as more gallons were collected on a per truck basis, contributing to improved gross margin contribution. Further, U.S. vehicle miles traveled continued to recover during the fourth quarter, improving from second quarter 2020 multi-year pandemic-related lows. |
| ▪ | Maintain capital discipline. The Company remains focused on preserving cash and liquidity to support growth. As of December 31, 2020, the Company had total cash and available liquidity of $12.3 million, versus $16.9 million as of September 30, 2020. At December 31, 2020 and September 30, 2020, total cash and available liquidity included $9.3 million and $10.1 million, respectively, of cash held in the Company’s special purpose vehicles (SPVs) relating to its Myrtle Grove and Heartland assets, which are limited to use by each SPV. |
MANAGEMENT COMMENTARY
“While our full-year 2020 performance was below our initial expectations due to the pandemic, we are excited by the opportunities for growth entering 2021, supported by an ongoing recovery in refined product margins, improved asset utilization and contributions from new business lines,” stated Benjamin P. Cowart, President and CEO of Vertex.
“At the Heartland refinery, base oil refined product margins are currently near record levels, while at our Marrero refinery, distillate margins have improved materially as crude oil prices have increased, when compared to fourth quarter levels,” continued Cowart. “For the full-year 2021, we expect to generate positive free cash flow, net income and Adjusted EBITDA. The first quarter is off to a good start, positioning us for our strongest single-quarter performance since the fourth quarter 2019.”
“Total direct collections increased 9% on a year-over-year basis in 2020, driven by growth in new customer accounts,” continued Cowart. “As we grow our collections fleet and expand market share in the regions we serve, we continue to realize improved economies of scale, spreading operating costs across a larger volume of collected gallons.”
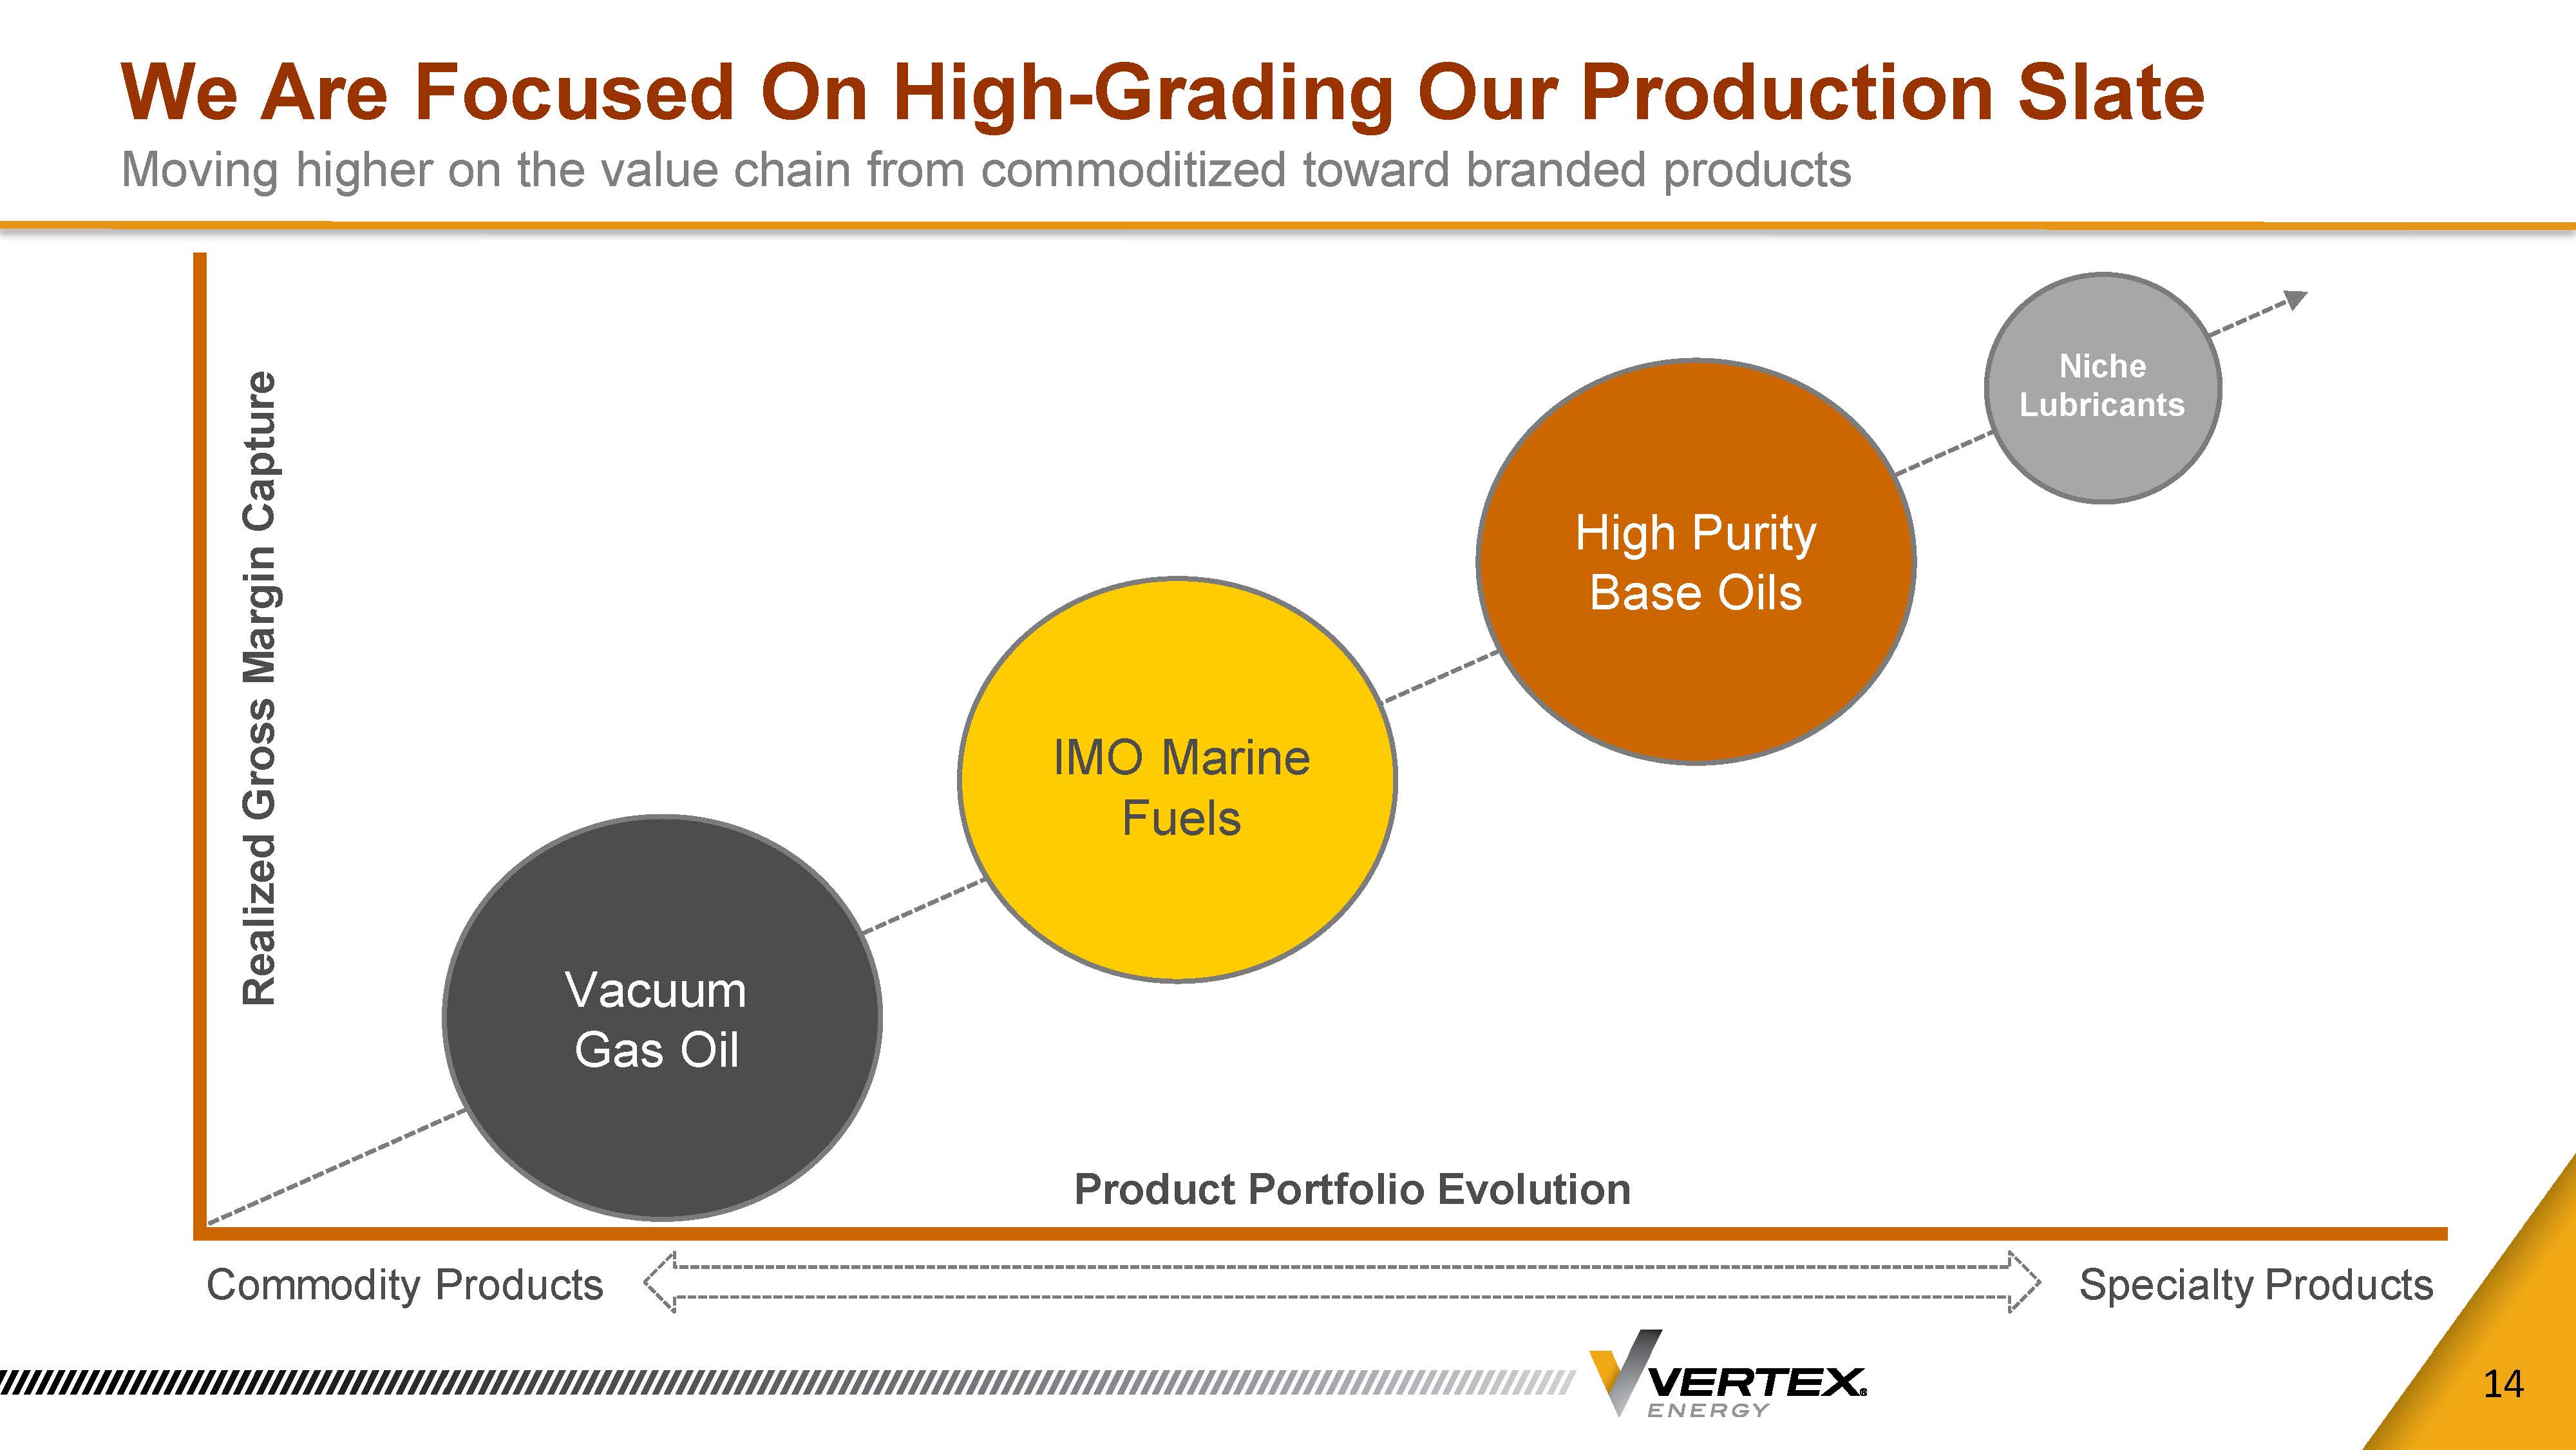
“Vertex remains committed to developing high-purity products from alternative feedstocks that support the global transition toward low-carbon energy solutions,” continued Cowart. “By year-end 2022, we expect our oil reclamation and recycling operation at Myrtle Grove will be able to process more than 7 million gallons of residual oil annually, resulting in more than $3 million of annualized incremental EBITDA improvement by year-end 2022.”
BALANCE SHEET
As of December 31, 2020, the Company had total cash and availability on its lending facility of $11.0 million and $1.3 million, respectively. Total cash and availability as of December 31, 2020 included $10.1 million of total cash limited to use by the two SPVs.
Vertex had total term debt outstanding of $11.1 million as of December 31, 2020, which included $4.2 million related to funds received under the Paycheck Protection Program (the "PPP") which is part of the recently enacted Coronavirus Aid, Relief, and Economic Security Act ("CARES Act"). Under the terms of the PPP, the entire balance of the loan may be forgiven to the extent that cash proceeds are used for qualifying expenses. As of the date of this release, the Company believes it has allocated the entirety of PPP funds received toward qualifying expenses. Vertex applied for loan forgiveness during the fourth quarter and is awaiting approval on its application.
CONFERENCE CALL AND WEBCAST
A conference call will be held today at 9:00 A.M. ET to review the Company’s financial results, discuss recent events and conduct a question-and-answer session.
A webcast of the conference call and accompanying presentation materials will be available in the Investor Relations section of Vertex’s website at www.vertexenergy.com. To listen to a live broadcast, go to the site at least 15 minutes prior to the scheduled start time in order to register, download, and install any necessary audio software. To participate in the live teleconference:
Domestic Live: 888-506-0062
To listen to a replay of the teleconference, which will be available through March 16, 2021:
Domestic
Replay: 877-481-4010
Conference ID: 39821
ABOUT VERTEX ENERGY
Houston-based Vertex Energy, Inc. (NASDAQ: VTNR) is a specialty refiner of alternative feedstocks and marketer of high-purity petroleum products. Vertex is one of the largest processors of used motor oil in the U.S., with operations located in Houston and Port Arthur (TX), Marrero (LA) and Heartland (OH). Vertex also co-owns a facility, Myrtle Grove, located on a 41-acre industrial complex along the Gulf Coast in Belle Chasse, LA, with existing hydro-processing and plant infrastructure assets, that include nine million gallons of storage. The Company has built a reputation as a key supplier of Group II+ and Group III Base Oils to the lubricant manufacturing industry throughout North America.
FORWARD-LOOKING STATEMENTS
This press release may contain forward-looking statements, including information about management's view of Vertex Energy's future expectations, plans and prospects, within the safe harbor provisions under The Private Securities Litigation Reform Act of 1995 (the "Act"). In particular, when used in the preceding discussion, the words "believes," "hopes," "expects," "intends," "plans," "anticipates," or "may," and similar conditional expressions are intended to identify forward-looking statements within the meaning of the Act, and are subject to the safe harbor created by the Act. Any statements made in this news release other than those of historical fact, about an action, event or development, are forward-looking statements. These statements involve known and unknown risks, uncertainties and other factors, which may cause the results of Vertex Energy, its divisions and concepts to be materially different than those expressed or implied in such statements. These risk factors include, but are not limited to, risks associated with our outstanding credit facilities, including amounts owed, restrictive covenants, security interests thereon and our ability to repay such facilities and amounts due thereon when due; risks associated with our outstanding preferred stock, including redemption obligations in connection therewith, restrictive covenants and our ability to redeem such securities when required pursuant to the terms of such securities and applicable law; the level of competition in our industry and our ability to compete; our ability to respond to changes in our industry; the loss of key personnel or failure to attract, integrate and retain additional personnel; our ability to protect our intellectual property and not infringe on others’ intellectual property; our ability to scale our business; our ability to maintain supplier relationships and obtain adequate supplies of feedstocks; our ability to obtain and retain customers; our ability to produce our products at competitive rates; our ability to execute our business strategy in a very competitive environment; trends in, and the market for, the price of oil and gas and alternative energy sources; our ability to maintain our relationships with KMTEX and Bunker One (USA), Inc.; the impact of competitive services and products; our ability to integrate acquisitions; our ability to complete future acquisitions; our ability to maintain insurance; the outcome of pending and potential future litigation, judgments and settlements; rules and regulations making our operations more costly or restrictive, including IMO 2020; changes in environmental and other laws and regulations and risks associated with such laws and regulations; economic downturns both in the United States and globally; risk of increased regulation of our operations and products; negative publicity and public opposition to our operations; disruptions in the infrastructure that we and our partners rely on; an inability to identify attractive acquisition opportunities and successfully negotiate acquisition terms; our ability to effectively integrate acquired assets, companies, employees or businesses; liabilities associated with acquired companies, assets or businesses; interruptions at our facilities; unexpected changes in our anticipated capital expenditures resulting from unforeseen required maintenance, repairs, or upgrades; our ability to acquire and construct new facilities; certain events of default which have occurred under our debt facilities and previously been waived; prohibitions on borrowing and other covenants of our debt facilities; our ability to effectively manage our growth; decreases in global demand for, and the price of, oil, due to COVID-19, state, federal and foreign responses thereto; our ability to acquire sufficient amounts of used oil feedstock through our collection routes, to produce finished products, and in the absence of such internally collected feedstocks, our ability to acquire third-party feedstocks on commercially reasonable terms; risks associated with COVID-19, the global efforts to stop the spread of COVID-19, potential downturns in the U.S. and global economies due to COVID-19 and the efforts to stop the spread of the virus, and COVID-19 in general; the lack of capital available on acceptable terms to finance our continued growth; and other risk factors included from time to time in documents Vertex Energy files with the Securities and Exchange Commission, including, but not limited to, its Form 10-Ks, Form 10-Qs and Form 8-Ks. These reports are available at www.sec.gov. Other unknown or unpredictable factors also could have material adverse effects on Vertex Energy’s future results. The forward-looking statements included in this press release are made only as of the date hereof. Vertex Energy cannot guarantee future results, levels of activity, performance or achievements. Accordingly, you should not place undue reliance on these forward-looking statements. Finally, Vertex Energy undertakes no obligation to update these statements after the date of this release, except as required by law, and takes no obligation to update or correct information prepared by third parties that are not paid for by Vertex Energy. If we update one or more forward-looking statements, no inference should be drawn that we will make additional updates with respect to those or other forward-looking statements.
NON-GAAP FINANCIAL MEASURES
Free Cash Flow, EBITDA and Adjusted EBITDA are “non-GAAP financial measures” presented as supplemental measures of the Company’s performance. They are not presented in accordance with accounting principles generally accepted in the United States, or GAAP. Free cash flow represents net cash provided by (used in) operating activities, less capital expenditures. EBITDA represents net income before interest, taxes, depreciation and amortization. Adjusted EBITDA is defined as EBITDA before stock-based compensation expense and gain (loss) on change in value of derivative warrant liability and unrealized gains and losses on derivative instruments for hedging activities. Free Cash Flow, EBITDA and Adjusted EBITDA are presented because we believe they provide additional useful information to investors due to the various noncash items during the period. Free Cash Flow, EBITDA and Adjusted EBITDA are not recognized in accordance with GAAP, are unaudited, and have limitations as analytical tools, and you should not consider them in isolation, or as substitutes for analysis of the Company’s results as reported under GAAP. Some of these limitations are: Free Cash Flow, EBITDA and Adjusted EBITDA do not reflect cash expenditures, or future requirements for capital expenditures, or contractual commitments; Free Cash Flow, EBITDA and Adjusted EBITDA do not reflect changes in, or cash requirements for, working capital needs; Free Cash Flow, EBITDA and Adjusted EBITDA do not reflect the significant interest expense, or the cash requirements necessary to service interest or principal payments, on debt or cash income tax payments; although depreciation and amortization are noncash charges, the assets being depreciated and amortized will often have to be replaced in the future, and Free Cash Flow, EBITDA and Adjusted EBITDA do not reflect any cash requirements for such replacements; and other companies in this industry may calculate Free Cash Flow, EBITDA and Adjusted EBITDA differently than Vertex Energy does, limiting its usefulness as a comparative measure. The Company’s presentation of these measures should not be construed as an inference that future results will be unaffected by unusual or nonrecurring items. For more information on these non-GAAP financial measures, please see the section titled “Reconciliations of Free Cash Flow and Net Loss attributable to Vertex Energy, Inc., to Earnings before Interest, Taxes, Depreciation and Amortization (EBITDA) and Adjusted EBITDA” included at the end of this release.
CONTACT
Investor Relations
720.778.2415
IR@vertexenergy.com
| VERTEX ENERGY, INC. |
| CONSOLIDATED BALANCE SHEETS |
| December 31, 2020 | December 31, 2019 | |||||||
| ASSETS | ||||||||
| Current assets | ||||||||
| Cash and cash equivalents | $ | 10,895,044 | $ | 4,099,655 | ||||
| Restricted cash | 100,125 | 100,170 | ||||||
| Accounts receivable, net | 11,138,933 | 12,138,078 | ||||||
| Federal income tax receivable | — | 68,606 | ||||||
| Inventory | 4,439,839 | 6,547,479 | ||||||
| Prepaid expenses and other current assets | 3,211,448 | 4,452,920 | ||||||
| Total current assets | 29,785,389 | 27,406,908 | ||||||
| Fixed assets, at cost | 75,777,552 | 69,469,548 | ||||||
| Less accumulated depreciation | (29,337,036 | ) | (24,708,151 | ) | ||||
| Fixed assets, net | 46,440,516 | 44,761,397 | ||||||
| Finance lease right-of-use assets | 1,536,711 | 851,570 | ||||||
| Operating lease right-of-use assets | 33,315,876 | 35,586,885 | ||||||
| Intangible assets, net | 9,397,441 | 11,243,800 | ||||||
| Deferred income taxes | — | 68,605 | ||||||
| Other assets | 1,624,025 | 840,754 | ||||||
| TOTAL ASSETS | $ | 122,099,958 | $ | 120,759,919 | ||||
| LIABILITIES, TEMPORARY EQUITY AND EQUITY | ||||||||
| Current liabilities | ||||||||
| Accounts payable | $ | 10,484,911 | $ | 7,620,098 | ||||
| Accrued expenses | 2,053,106 | 5,016,132 | ||||||
| Dividends payable | 606,550 | 389,176 | ||||||
| Finance lease-current | 496,231 | 217,164 | ||||||
| Operating lease-current | 5,614,785 | 5,885,304 | ||||||
| Current portion of long-term debt, net of unamortized finance costs | 4,367,169 | 2,017,345 | ||||||
| Revolving note | 133,446 | 3,276,230 | ||||||
| Derivative commodity liability | 94,214 | 375,850 | ||||||
| Total current liabilities | 23,850,412 | 24,797,299 | ||||||
| Long-term debt | 7,981,496 | 12,433,000 | ||||||
| Finance lease-non-current | 945,612 | 610,450 | ||||||
| Operating lease-non-current | 27,701,091 | 29,701,581 | ||||||
| Derivative warrant liability | 330,412 | 1,969,216 | ||||||
| Total liabilities | 60,809,023 | 69,511,546 | ||||||
| VERTEX ENERGY, INC. |
| CONSOLIDATED BALANCE SHEETS |
| December 31, 2020 | December 31, 2019 | |||||||
| COMMITMENTS AND CONTINGENCIES (Note 4) | — | — | ||||||
| TEMPORARY EQUITY | ||||||||
| Series B Preferred Stock, $0.001 par value per share; 10,000,000 shares authorized, 4,102,690 and 3,826,055 shares issued and outstanding at December 31, 2020 and 2019, respectively with liquidation preference of $12,718,339 and $11,860,771 at December 31, 2020 and 2019, respectively. | 12,718,339 | 11,006,406 | ||||||
| Series B1 Preferred Stock, $0.001 par value per share; 17,000,000 shares authorized, 7,399,649 and 9,028,085 shares issued and outstanding at December 31, 2020 and 2019, respectively with liquidation preference of $11,543,452 and $14,083,813 at December 31, 2020 and 2019, respectively. | 11,036,173 | 12,743,047 | ||||||
| Redeemable non-controlling interest | 31,611,674 | 4,396,894 | ||||||
| Total Temporary Equity | 55,366,186 | 28,146,347 | ||||||
| EQUITY | ||||||||
| Series A Convertible Preferred stock, $0.001 par value; 5,000,000 shares authorized and 419,859 and 419,859 shares issued and outstanding at December 31, 2020 and 2019, respectively, with a liquidation preference of $625,590 and $625,590 at December 31, 2020 and December 31, 2019, respectively. | 420 | 420 | ||||||
| Series C Convertible Preferred stock, $0.001 par value per share; 44,000 shares designated; zero and zero issued and outstanding at December 31, 2020 and 2019, respectively with a liquidation preference of zero and zero at December 31, 2020 and December 31, 2019, respectively. | — | — | ||||||
| Common stock, $0.001 par value per share; 750,000,000 shares authorized; 45,554,841 and 43,395,563 issued and outstanding at December 31, 2020 and 2019, respectively. | 45,555 | 43,396 | ||||||
| Additional paid-in capital | 94,569,674 | 81,527,351 | ||||||
| Accumulated deficit | (90,008,778 | ) | (59,246,514 | ) | ||||
| Total Vertex Energy, Inc. stockholders' equity | 4,606,871 | 22,324,653 | ||||||
| Non-controlling interest | 1,317,878 | 777,373 | ||||||
| Total Equity | 5,924,749 | 23,102,026 | ||||||
| TOTAL LIABILITIES, TEMPORARY EQUITY AND EQUITY | $ | 122,099,958 | $ | 120,759,919 | ||||
| VERTEX ENERGY, INC. |
| CONSOLIDATED STATEMENTS OF OPERATIONS |
| FOR THE YEARS ENDED DECEMBER 31, 2020 and 2019 |
| 2020 | 2019 | |||||||
| Revenues | $ | 135,028,488 | $ | 163,365,565 | ||||
| Cost of revenues (exclusive of depreciation and amortization shown separately below) | 113,766,009 | 134,777,113 | ||||||
| Depreciation and amortization attributable to costs of revenues | 5,090,352 | 5,356,277 | ||||||
| Gross profit | 16,172,127 | 23,232,175 | ||||||
| Operating expenses: | ||||||||
| Selling, general and administrative expenses | 26,144,264 | 24,182,407 | ||||||
| Depreciation and amortization attributable to operating expenses | 1,895,588 | 1,823,812 | ||||||
| Total operating expenses | 28,039,852 | 26,006,219 | ||||||
| Loss from operations | (11,867,725 | ) | (2,774,044 | ) | ||||
| Other income (expense): | ||||||||
| Other income | 101 | 920,197 | ||||||
| Loss on sale of assets | (124,515 | ) | (74,111 | ) | ||||
| Gain (loss) on change in value of derivative warrant liability | 1,638,804 | (487,524 | ) | |||||
| Interest expense | (1,042,840 | ) | (3,070,071 | ) | ||||
| Total other income (expense) | 471,550 | (2,711,509 | ) | |||||
| Loss before income taxes | (11,396,175 | ) | (5,485,553 | ) | ||||
| Income tax benefit | — | — | ||||||
| Net loss | (11,396,175 | ) | (5,485,553 | ) | ||||
| Net income (loss) attributable to non-controlling interest and redeemable non-controlling interest | 639,940 | (436,974 | ) | |||||
| Net loss attributable to Vertex Energy, Inc. | (12,036,115 | ) | (5,048,579 | ) | ||||
| Accretion of redeemable noncontrolling interest to redemption value | (15,135,242 | ) | (2,279,371 | ) | ||||
| Accretion of discount on Series B and B-1 Preferred Stock | (1,687,850 | ) | (2,489,722 | ) | ||||
| Dividends on Series B and B-1 Preferred Stock | (1,903,057 | ) | (1,627,956 | ) | ||||
| Net loss available to common stockholders | $ | (30,762,264 | ) | $ | (11,445,628 | ) | ||
| Loss per common share | ||||||||
| Basic | $ | (0.68 | ) | $ | (0.28 | ) | ||
| Diluted | $ | (0.68 | ) | $ | (0.28 | ) | ||
| Shares used in computing loss per share | ||||||||
| Basic | 45,509,470 | 40,988,946 | ||||||
| Diluted | 45,509,470 | 40,988,946 | ||||||
| VERTEX ENERGY, INC. |
| CONSOLIDATED STATEMENTS OF EQUITY |
| FOR THE YEARS ENDING DECEMBER 31, 2020 AND 2019 |
| Common Stock | Series A Preferred | Series C Preferred | ||||||||||||||||||||||||||||||||||||||
| Shares | $0.001 Par | Shares | $0.001 Par | Shares | $0.001 Par | Additional Paid-in Capital | Accumulated Deficit | Non-controlling Interest | Total Equity | |||||||||||||||||||||||||||||||
| Balance on December 31, 2018 | 40,174,821 | $ | 40,175 | 419,859 | $ | 420 | — | $ | — | $ | 75,131,122 | $ | (47,800,886 | ) | $ | 1,438,213 | $ | 28,809,044 | ||||||||||||||||||||||
| Distribution to noncontrolling | — | — | — | — | — | — | — | — | (285,534 | ) | (285,534 | ) | ||||||||||||||||||||||||||||
Dividends on Series B and B1 Preferred Stock | — | — | — | — | — | — | — | (1,627,956 | ) | — | (1,627,956 | ) | ||||||||||||||||||||||||||||
Accretion of discount on Series B and B1 Preferred Stock | — | — | — | — | — | — | — | (2,489,722 | ) | — | (2,489,722 | ) | ||||||||||||||||||||||||||||
| Share based compensation expense | — | — | — | — | — | — | 642,840 | — | — | 642,840 | ||||||||||||||||||||||||||||||
| Exercise of options to common | 78,425 | 79 | — | — | — | — | 6,996 | — | — | 7,075 | ||||||||||||||||||||||||||||||
Adjustment of carrying amount of noncontrolling interest | — | — | — | — | — | — | 970,809 | — | — | 970,809 | ||||||||||||||||||||||||||||||
| Conversion of Series B1 Preferred stock to common | 1,642,317 | 1,642 | — | — | — | — | 2,560,373 | — | — | 2,562,015 | ||||||||||||||||||||||||||||||
Adjustment of redeemable noncontrolling interest to redemption value | — | — | — | — | — | — | — | (2,279,371 | ) | — | (2,279,371 | ) | ||||||||||||||||||||||||||||
| Issue of common stock and warrants | 1,500,000 | 1,500 | — | — | — | — | 2,215,211 | — | — | 2,216,711 | ||||||||||||||||||||||||||||||
| Net loss | — | — | — | — | — | — | — | (5,048,579 | ) | (436,974 | ) | (5,485,553 | ) | |||||||||||||||||||||||||||
Less: amount attributable to redeemable non-controlling interest | — | — | — | — | — | — | — | — | 61,668 | 61,668 | ||||||||||||||||||||||||||||||
| Balance on December 31, 2019 | 43,395,563 | 43,396 | 419,859 | 420 | — | — | 81,527,351 | (59,246,514 | ) | 777,373 | 23,102,026 | |||||||||||||||||||||||||||||
| Dividends on Series B and B1 Preferred Stock | — | — | — | — | — | — | — | (1,903,057 | ) | — | (1,903,057 | ) | ||||||||||||||||||||||||||||
Accretion of discount on Series B and B1 Preferred Stock | — | — | — | — | — | — | — | (1,687,850 | ) | — | (1,687,850 | ) | ||||||||||||||||||||||||||||
| Conversion of B1 Preferred Stock to common | 2,159,278 | 2,159 | — | — | — | — | 3,366,315 | — | — | 3,368,474 | ||||||||||||||||||||||||||||||
| Share based compensation expense | — | — | — | — | — | — | 656,111 | — | — | 656,111 | ||||||||||||||||||||||||||||||
| Purchase of shares of consolidated subsidiary | — | — | — | — | — | — | (71,171 | ) | — | — | (71,171 | ) | ||||||||||||||||||||||||||||
Adjustment of redeemable noncontrolling interest to redemption value | — | — | — | — | — | — | — | (15,135,242 | ) | — | (15,135,242 | ) | ||||||||||||||||||||||||||||
Adjustment of carrying amount of noncontrolling interest | — | — | — | — | — | — | 9,091,068 | — | — | 9,091,068 | ||||||||||||||||||||||||||||||
| Net loss | — | — | — | — | — | — | — | (12,036,115 | ) | 639,940 | (11,396,175 | ) | ||||||||||||||||||||||||||||
Less: amount attributable to redeemable non-controlling interest | — | — | — | — | — | — | — | — | (99,435 | ) | (99,435 | ) | ||||||||||||||||||||||||||||
| Balance on December 31, 2020 | 45,554,841 | $ | 45,555 | 419,859 | $ | 420 | — | $ | — | $ | 94,569,674 | $ | (90,008,778 | ) | $ | 1,317,878 | $ | 5,924,749 | ||||||||||||||||||||||
| VERTEX ENERGY, INC. |
| CONSOLIDATED STATEMENTS OF CASH FLOWS |
| FOR THE YEARS ENDING DECEMBER 31, 2020 AND 2019 |
| 2020 | 2019 | |||||||
| Cash flows from operating activities | ||||||||
| Net loss | $ | (11,396,175 | ) | $ | (5,485,553 | ) | ||
| Adjustments to reconcile net loss to cash (used in) provided by operating activities: | ||||||||
| Stock-based compensation expense | 656,111 | 642,840 | ||||||
| Depreciation and amortization | 6,985,940 | 7,180,089 | ||||||
| Provision (recovery) for bad debt | 297,289 | (320,013 | ) | |||||
| (Gain) loss on commodity derivative contracts | (3,456,487 | ) | 2,458,359 | |||||
| Net cash settlement on commodity derivatives | 4,233,092 | (2,841,052 | ) | |||||
| Loss on sale of assets | 124,515 | 74,111 | ||||||
| Amortization of debt discount and deferred costs | 47,826 | 573,908 | ||||||
| (Gain) loss on change in value of derivative warrant liability | (1,638,804 | ) | 487,524 | |||||
| Reduction in contingent consideration | — | (15,564 | ) | |||||
| Changes in operating assets and liabilities: | ||||||||
| Accounts receivable | 2,641,220 | (2,652,864 | ) | |||||
| Inventory | 3,084,152 | 1,543,918 | ||||||
| Prepaid expenses | 197,715 | (257,894 | ) | |||||
| Accounts payable | 1,840,874 | (1,171,433 | ) | |||||
| Accrued expenses | (3,047,606 | ) | 2,480,786 | |||||
| Other assets | (646,059 | ) | (223,995 | ) | ||||
| Net cash (used in) provided by operating activities | (76,397 | ) | 2,473,167 | |||||
| Cash flows from investing activities | ||||||||
| Internally developed software | (49,229 | ) | (489,093 | ) | ||||
| Proceeds from the sale of assets | 74,965 | 232,020 | ||||||
| Acquisition of Crystal Energy, LLC | (1,822,690 | ) | — | |||||
| Purchase of fixed assets | (6,636,455 | ) | (3,369,367 | ) | ||||
| Net cash used in investing activities | (8,433,409 | ) | (3,626,440 | ) | ||||
| Cash flows from financing activities | ||||||||
| Line of credit payments, net | (3,142,784 | ) | (568,406 | ) | ||||
| Proceeds received from issuance of common stock and warrants | — | 2,216,711 | ||||||
| Proceeds from exercise of stock options | — | 7,075 | ||||||
| Distribution VRM LA | — | (285,534 | ) | |||||
| Contribution received from redeemable noncontrolling interest | 21,000,000 | 3,150,000 | ||||||
| Payments on finance leases | (402,560 | ) | (165,598 | ) | ||||
| Proceeds from notes payable | 8,217,195 | 2,809,139 | ||||||
| Payments made on notes payable | (10,366,701 | ) | (4,660,120 | ) | ||||
| Net cash provided by financing activities | 15,305,150 | 2,503,267 | ||||||
| Net change in cash and cash equivalents and restricted cash | 6,795,344 | 1,349,994 | ||||||
| Cash and cash equivalents and restricted cash at beginning of the year | 4,199,825 | 2,849,831 | ||||||
| Cash and cash equivalents and restricted cash at end of year | $ | 10,995,169 | $ | 4,199,825 | ||||
| SUPPLEMENTAL INFORMATION | ||||||||
| Cash paid for interest | $ | 1,050,741 | $ | 2,505,852 | ||||
| Cash paid for income taxes | $ | — | $ | — | ||||
| NON-CASH INVESTING AND FINANCING TRANSACTIONS | ||||||||
| Conversion of Series B and B1 Preferred Stock into common stock | $ | 3,368,474 | $ | 2,562,015 | ||||
| Dividends on Series B and B-1 Preferred Stock | $ | 1,903,057 | $ | 1,627,956 | ||||
| Initial adjustment of carrying amount of redeemable noncontrolling interest | $ | 9,091,068 | $ | 970,809 | ||||
| Accretion of discount on Series B and B-1 Preferred Stock | $ | 1,687,850 | $ | 2,489,722 | ||||
| Accretion of redeemable noncontrolling interest to redemption value | $ | 15,135,242 | $ | 2,279,371 | ||||
| Equipment acquired under capital leases | $ | 1,017,638 | $ | 621,000 | ||||
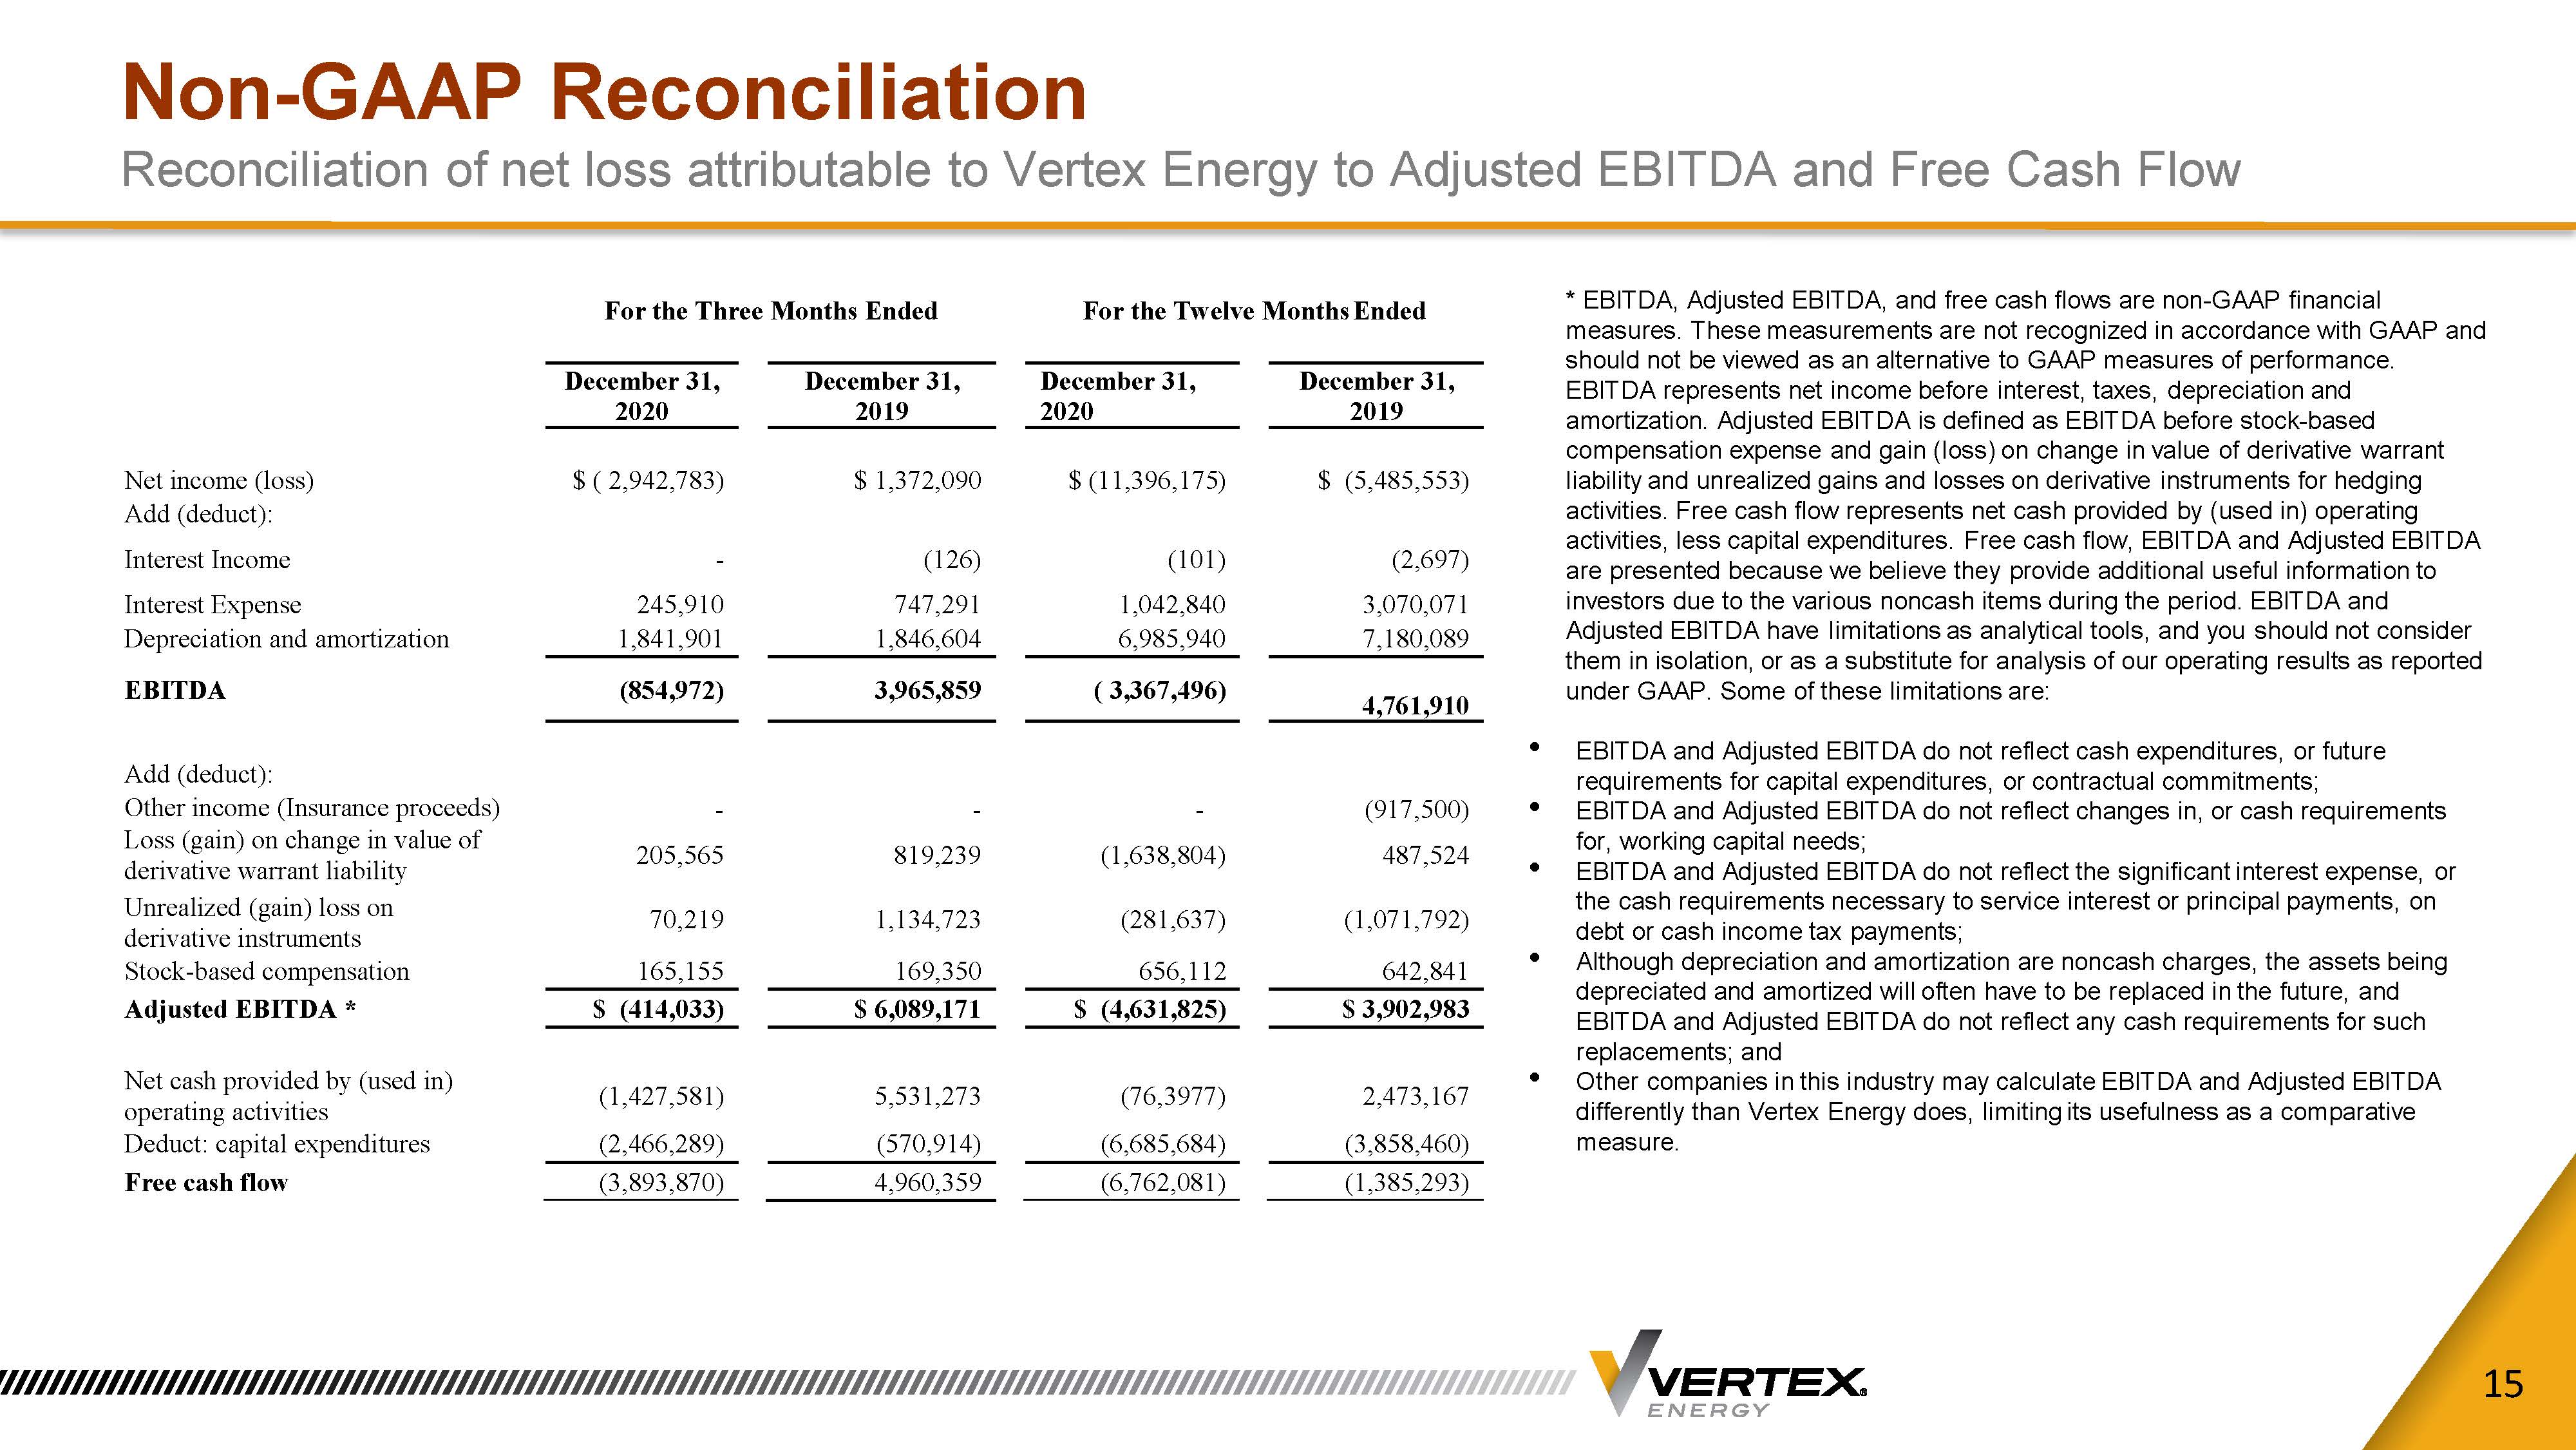
Reconciliation of Net Loss attributable to Vertex Energy, Inc., to Earnings before Interest, Taxes, Depreciation and Amortization (EBITDA) and Adjusted EBITDA*
| For the Three Months Ended | For the Twelve Months | |||||||||||||||
| December 31, 2020 | December 31, 2019 | December 31, 2020 | December 31, 2019 | |||||||||||||
| Net income (loss) | $ | (2,942,783 | ) | $ | 1,372,090 | $ | (11,396,175 | ) | $ | (5,485,553 | ) | |||||
| Add (deduct): | ||||||||||||||||
| Interest Income | — | (126 | ) | (101 | ) | (2,697 | ) | |||||||||
| Interest Expense | 245,910 | 747,291 | 1,042,840 | 3,070,071 | ||||||||||||
| Depreciation and amortization | 1,841,901 | 1,846,604 | 6,985,940 | 7,180,089 | ||||||||||||
| EBITDA | (854,972 | ) | 3,965,859 | (3,367,496 | ) | 4,761,910 | ||||||||||
| Add (deduct): | ||||||||||||||||
| Other income (Insurance proceeds) | — | — | — | (917,500 | ) | |||||||||||
| Loss (gain) on change in value of derivative warrant liability | 205,565 | 819,239 | (1,638,804 | ) | 487,524 | |||||||||||
| Unrealized (gain) loss on derivative instruments | 70,220 | 1,134,723 | (281,636 | ) | (1,071,792 | ) | ||||||||||
| Stock-based compensation | 165,154 | 169,350 | 656,111 | 642,840 | ||||||||||||
| Adjusted EBITDA * | $ | (414,033 | ) | $ | 6,089,171 | $ | (4,631,825 | ) | $ | 3,902,982 | ||||||
| Net cash provided by (used in) operating activities | $ | (1,427,581 | ) | $ | 5,531,273 | $ | (76,3977 | ) | $ | 2,473,167 | ||||||
| Deduct: capital expenditures | (2,466,289 | ) | (570,914 | ) | (6,685,684 | ) | (3,858,460 | ) | ||||||||
| Free cash flow | $ | (3,893,870 | ) | $ | 4,960,359 | $ | (6,762,081 | ) | $ | (1,385,293 | ) | |||||
* EBITDA, Adjusted EBITDA, and free cash flows are non-GAAP financial measures. These measurements are not recognized in accordance with GAAP and should not be viewed as an alternative to GAAP measures of performance.
EBITDA represents net income before interest, taxes, depreciation and amortization. Adjusted EBITDA is defined as EBITDA before stock-based compensation expense and gain (loss) on change in value of derivative warrant liability and unrealized gains and losses on derivative instruments for hedging activities. EBITDA and Adjusted EBITDA are presented because we believe they provide additional useful information to investors due to the various noncash items during the period. EBITDA and Adjusted EBITDA have limitations as analytical tools, and you should not consider them in isolation, or as a substitute for analysis of our operating results as reported under GAAP. Some of these limitations are:
| • | EBITDA and Adjusted EBITDA do not reflect cash expenditures, or future requirements for capital expenditures, or contractual commitments; |
| • | EBITDA and Adjusted EBITDA do not reflect changes in, or cash requirements for, working capital needs; |
| • | EBITDA and Adjusted EBITDA do not reflect the significant interest expense, or the cash requirements necessary to service interest or principal payments, on debt or cash income tax payments; |
| • | Although depreciation and amortization are noncash charges, the assets being depreciated and amortized will often have to be replaced in the future, and EBITDA and Adjusted EBITDA do not reflect any cash requirements for such replacements; and |
| • | Other companies in this industry may calculate EBITDA and Adjusted EBITDA differently than Vertex Energy does, limiting its usefulness as a comparative measure. |
Free cash flow represents net cash provided by (used in) operating activities, less capital expenditures.