Total | ||||||||||||||||||||
|---|---|---|---|---|---|---|---|---|---|---|---|---|---|---|---|---|---|---|---|---|
| SEQUOIA FUND INC | ||||||||||||||||||||
| SEQUOIA FUND, INC. | ||||||||||||||||||||
| Investment Objective | ||||||||||||||||||||
The Fund’s investment objective is long-term growth of capital.
| ||||||||||||||||||||
| Fees and Expenses of the Fund | ||||||||||||||||||||
This table describes the fees and expenses that you may pay if you buy, hold and sell shares of the Fund. You may pay other fees, such as brokerage commissions and other fees to financial intermediaries, which are not reflected in the table and example below.
| ||||||||||||||||||||
| Shareholder Fees (fees paid directly from your investment) The Fund does not impose any sales charges, exchange fees or redemption fees. | ||||||||||||||||||||
| Annual Fund Operating Expenses (expenses that you pay each year as a percentage of the value of your investment) | ||||||||||||||||||||
| ||||||||||||||||||||
| Example | ||||||||||||||||||||
This Example is intended to help you compare the cost of investing in the Fund with the cost of investing in other mutual funds. The Example assumes that you invest $10,000 in the Fund for the time periods indicated and then redeem all of your shares at the end of those periods. The Example also assumes that your investment has a 5% return each year and that the Fund’s operating expenses remain the same. Although your actual costs may be higher or lower, based on these assumptions your costs would be:
| ||||||||||||||||||||
| ||||||||||||||||||||
| Portfolio Turnover | ||||||||||||||||||||
|
The Fund pays transaction costs, such as commissions, when it buys and sells securities (or “turns over” its portfolio). A higher portfolio turnover rate may indicate higher transaction costs and may result in higher taxes when Fund shares are held in a taxable account. These costs, which are not reflected in Annual Fund Operating Expenses or in the Example, affect the Fund’s performance. During the most recent fiscal year, the Fund’s portfolio turnover rate was 16% of the average value of its portfolio.
| ||||||||||||||||||||
| Principal Investment Strategies | ||||||||||||||||||||
The Fund’s investment objective is long-term growth of capital. In pursuing this objective, the Fund focuses on investing in equity securities that it believes are undervalued at the time of purchase and have the potential for growth. A guiding principle is the consideration of equity securities, such as common stock, as units of ownership of a business and the purchase of them when the price appears low in relation to the value of the total enterprise.
No weight is given to technical stock market studies. The balance sheet and earnings history and prospects of each company are extensively studied to appraise fundamental intrinsic value. The Fund normally invests in equity securities of U.S. and non-U.S. companies. The Fund may invest in securities of issuers with any market capitalization. The Fund may sell the security of an issuer for a variety of reasons, including when the issuer shows deteriorating fundamentals, its earnings progress falls short of the Adviser’s expectations or its valuation appears excessive relative to its expected future earnings. Ordinarily, the Fund’s portfolio is invested in equity securities of U.S. and non-U.S. companies. The Fund is not required, however, to be fully invested in equity securities and, in fact, usually maintains a portion of its total assets in cash or securities generally considered to be cash equivalents, including, but not limited to, short-term U.S. Government securities. Depending upon market conditions, cash reserves may be a significant percentage of the Fund’s net assets. The Fund is classified as non-diversified.
| ||||||||||||||||||||
| Principal Risks | ||||||||||||||||||||
| Bar Chart and Performance Information | ||||||||||||||||||||
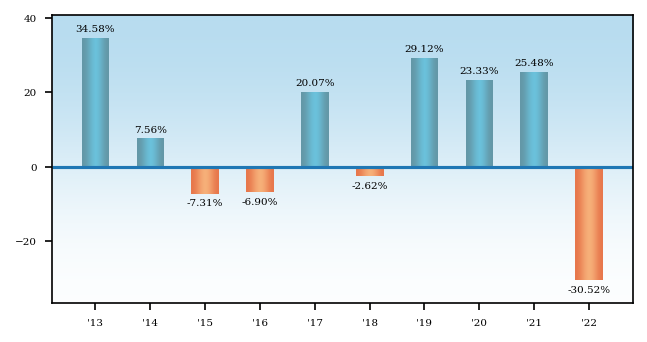
The bar chart and the table shown below provide an indication of the historical risk of an investment in the Fund by showing changes in the Fund’s performance from year-to-year over a 10-year period and by showing how the Fund’s average annual returns for one, five, and ten years compare to the Standard & Poor’s 500 Index (“S&P 500 Index”), a broad-based securities market index. The Fund’s past performance, of course, does not necessarily indicate how it will perform in the future.
| ||||||||||||||||||||

| ||||||||||||||||||||
During the period shown in the bar chart, the highest return for a quarter was 27.21% (2nd quarter 2020) and the lowest return for a quarter was -22.17% (1st quarter 2020).
| ||||||||||||||||||||
| Average Annual Total Returns (for the periods ended December 31, 2022) | ||||||||||||||||||||
| ||||||||||||||||||||
After-tax returns are estimates, which are calculated using the highest historical individual federal marginal income tax rates, and do not reflect the impact of state and local taxes. In some instances, the “Return After Taxes on Distributions and Sale of Fund Shares” may be greater than “Return Before Taxes” because the investor is assumed to be able to use the capital loss of the sale of Fund shares to offset other taxable gains. Actual after-tax returns depend on an individual investor’s tax situation and may differ from those shown. After-tax returns shown are not relevant to investors who hold their Fund shares through tax-deferred arrangements, such as 401(k) plans or individual retirement accounts.
| ||||||||||||||||||||