UNITED STATES
SECURITIES AND EXCHANGE COMMISSION
Washington, D.C. 20549
FORM N-CSR
CERTIFIED SHAREHOLDER REPORT OF REGISTERED
MANAGEMENT INVESTMENT COMPANIES
|
Investment Company Act file number |
811-07062 | |||||||
|
| ||||||||
|
PACIFIC GLOBAL FUND INC. D/B/A PACIFIC ADVISORS FUND INC. | ||||||||
|
(Exact name of registrant as specified in charter) | ||||||||
|
| ||||||||
|
101 NORTH BRAND BLVD., SUITE 1950 GLENDALE, CALIFORNIA |
|
91203 | ||||||
|
(Address of principal executive offices) |
|
(Zip code) | ||||||
|
| ||||||||
|
GEORGE A. HENNING 101 NORTH BRAND BLVD., SUITE 1950 GLENDALE, CA 91203 | ||||||||
|
(Name and address of agent for service) | ||||||||
|
| ||||||||
|
Registrant’s telephone number, including area code: |
818-242-6693 |
| ||||||
|
| ||||||||
|
Date of fiscal year end: |
December 31 |
| ||||||
|
| ||||||||
|
Date of reporting period: |
June 30, 2016 |
| ||||||
Item 1. Report to Shareholders
Filed herewith.

semi-annual report
june 30, 2016
income and equity fund
balanced fund
large cap value fund
mid cap value fund
small cap value fund


Pacific Advisors
table of contents
|
Message from the Chairman |
1 |
||||||
|
Income and Equity Fund |
4 |
||||||
|
Balanced Fund |
8 |
||||||
|
Large Cap Value Fund |
12 |
||||||
|
Mid Cap Value Fund |
16 |
||||||
|
Small Cap Value Fund |
20 |
||||||
|
Schedule of Investments |
25 |
||||||
|
Statement of Assets and Liabilities |
46 |
||||||
|
Statement of Operations |
48 |
||||||
|
Statement of Changes in Net Assets |
50 |
||||||
|
Financial Highlights |
54 |
||||||
|
Notes to Financial Statements |
60 |
||||||
|
Directors and Officers |
72 |
||||||
This Report is submitted for the general information of the shareholders of Pacific Advisors Funds. It is not authorized for distribution to prospective investors unless accompanied or preceded by the Funds' current prospectus, which contains information concerning the investment policies of the Funds as well as other pertinent information.
This Report is for informational purposes only and is not a solicitation or recommendation that any particular investor should purchase or sell any particular security. The statements in the Chairman's Letter and the discussions of the Funds' performance are the opinions and beliefs expressed at the time of this commentary and are not intended to represent opinions and beliefs at any other time. These opinions are subject to change at any time based on market or other conditions and are not meant as a market forecast. All economic and performance information referenced is historical. Past performance does not guarantee future results.
For more information on the Pacific Advisors Funds, including information on charges, expenses and other classes offered, please obtain a copy of the prospectus by calling (800) 989-6693. Please read the prospectus and consider carefully the investment risks, objectives, charges and expenses before you invest or send money. Shares of the Pacific Advisors Funds are not deposits or obligations of any bank, are not guaranteed by any bank, are not insured by the FDIC or any other agency, and involve investment risks, including the possible loss of the principal amount invested. The investment return and principal value of an investment will fluctuate so that an investor's shares, when redeemed, may be worth more or less than their original cost.


Message
from the chairman
Dear Shareholders,
Following the market's extreme volatility and resilience in the first quarter, volatility continued in the second quarter. After falling to lows in mid-February, stocks recovered with strong performance through April. In early May, however, investors became concerned that rising oil prices and improving economic conditions would cause the Federal Reserve to raise interest rates at its June meeting; consequently, stocks in sectors that are most responsive to economic growth retreated over fears that a rate hike would negatively impact growth and strengthen the dollar. These issues continued to cloud market sentiment even after June's weak jobs report and the decision by the Fed to delay a second rate increase.
During the second quarter, signs of better-than-expected economic growth emerged. Most notably, oil prices recovered from February lows as the combination of lower production and higher demand finally began to ease the two-year supply-demand imbalance. Unlike prior quarters, though, equity markets seemed less responsive to changes in oil prices as the recent high correlation began to ease; instead, investors focused on other uncertainties, such as the timing of the Fed's much-anticipated interest rate increase and the United Kingdom's pending referendum on leaving the European Union ("EU"), the so-called Brexit vote. Normally, as markets advance, investors tend to favor areas, such as specialty retail, apparel, transportation, and manufacturing, which respond well to economic growth. This year, however, investors have favored investments in sectors known for steady dividends and stability during various phases of the business cycle.
In late June, the Brexit vote stunned the world markets. Betting odds and the economic benefits supported the widely-held assumption that the Remain vote would win. The Leave result triggered a worldwide market selloff while pundits predicted disastrous consequences for the UK with the potential for causing the EU's disintegration. This development, following a two-year bear market in oil, actions by China to migrate to a more consumer-driven economy, and speculation on interest rate increases, was yet another unwelcome disruption as the equity markets struggled during the recent period of moderate economic growth.
Immediately following the vote, investors retreated from growth-oriented sectors to "safe haven" assets such as cash, U.S. Treasuries and stocks that are less dependent on the economic cycle. By the end of the second quarter, many safe haven stocks traded at or above fair value, while many growth-oriented investments continued to trade at significant discounts.
Equity and Fixed Income Investment Review
During the second quarter, after notable brick-and-mortar retailers reported disappointing earnings, luxury goods and specialty retailers came under pressure. Then, better-than-expected retail sales reports in May and June, with particular strength in apparel, allayed fears of a broad weakness in consumer spending; and, consumer confidence remains strong.
Meanwhile, and even as oil prices recovered during the period, small capitalization Energy and energy-related Industrials stocks experienced significant volatility. The wide price swings largely reflected global growth concerns resulting from central bank monetary policies and the Brexit vote rather than individual company developments. The dramatic price volatility belies the improving fundamental outlook for the Energy sector as analyses suggest that an overall upward trend in oil prices may continue for the next several years.
1


Message
from the chairman continued
The major indices ended the period near all-time highs as many stocks, especially the more conservative large cap blue-chip stocks, and less volatile consumer product and food & beverage companies, quickly rebounded from the post-Brexit selloff. The rebound was not universal; sectors such as Industrials, Media and Specialty Retail recovered more slowly but by mid-July, these areas too had largely returned to pre-Brexit levels.
Interest rates fluctuated as investors reacted to economic data, Fed commentary, and international events. In April, following the positive employment report, interest rates began to rise amid expectations that the Fed would increase rates. Interest rates then fell briefly when the Fed decided to leave rates unchanged for the third consecutive meeting. Rates became somewhat volatile in anticipation of the Brexit vote; when the Leave vote won, rates tumbled to a level not seen since July 2012. The yield on the 10-year Treasury Note, which ended 2015 at 2.27%, fell to 1.46% before rising slightly by the end of June.
Looking Ahead
In the U.S., improving economic data included increased manufacturing activity, a decline in unemployment, increased housing starts, and strong automotive sales. In early July, encouraging economic data, including the strong jobs report, and company commentaries suggest that the second half of the year should favor growth-oriented stocks. We anticipate that the rotation from "safe havens" will continue as investors gain more confidence in the outlook for global growth.
The UK's departure from the EU will be prolonged; the markets and economies will be able to adapt as the process develops. And, the timeline for negotiations and formal actions remains unclear. Despite of the initial rhetoric, though, the discussions will likely be measured as both sides weigh each party's interests in negotiating a new relationship. The economic relationship between the UK and the EU will remain important; harsh positioning by the EU could have serious economic ramifications as the UK is an important consumer of EU goods and services.
Some analysts suggest that the seven-year bull market in stocks may be nearing an end; many point to relatively low earnings estimates in comparison to stock prices for companies in the S&P 500® Index. These views, though, overlook the contrast amongst market sectors: the market's more stable, and in-demand sectors outperformed and propelled prices higher; Utilities and Household Products, for example, pay dividends that are particularly attractive during periods of record low interest rates. At the same time, market sectors which typically perform well during periods of economic growth, including Auto Components, Specialty Retail, Energy, and Industrials, remain significantly discounted. We believe that the economy, led by a recovery in manufacturing and energy-related activities, will accelerate in the second half of the year. As the economy improves, investors are likely to favor these undervalued areas. As a result, we expect that the sectors which led the market in recent years may underperform while sectors which have lagged may well outperform.
Since the Great Recession, we have anticipated a steady but moderate pace of economic growth; this expectation envisions an extended growth cycle which would delay a recession for some time. The recent pattern of economic growth has been consistent with this assumption even though various global factors have overshadowed the operating results for many companies. Unexpected events over the past year have led investors to favor safe haven investments to protect
Market Review • June 30, 2016
|
Index1 |
Close |
YTD Price Return |
|||||||||
|
Dow Jones Industrial Avg |
17,929.99 |
2.90 |
% |
||||||||
|
S&P 500® |
2,098.86 |
2.69 |
% |
||||||||
|
NASDAQ |
4,842.67 |
–3.29 |
% |
||||||||
|
Russell Midcap® |
1,668.34 |
4.52 |
% |
||||||||
|
Russell 2000® (small cap) |
1,151.92 |
1.41 |
% |
||||||||
|
06/30/16 |
06/30/15 |
||||||||||
| 10-Year T-Note Yield |
1.49 |
% |
2.35 |
% |
|||||||
Data: Bloomberg; Federal Reserve.
2


Message
from the chairman continued
against the unknown consequences of political and economic events. We anticipate that, as investors gain confidence in the ability of the major economies to navigate these challenges, the focus will shift towards stocks that offer greater appreciation potential; the market's post-Brexit recovery seems to confirm this expectation. Investors often believe that the markets run on inertia; that is, both downward and upward market momentum seems unstoppable. Over the past two years, many stocks have experienced double-digit losses due to a series of seemingly unrelenting events; and yet, during this period, companies have positioned their businesses for recovery by cutting costs, investing in new products and services, and completing strategic acquisitions. In short, the bull market has endured considerable volatility over the last year; some stocks have recovered while those that remain deeply undervalued provide significant upside opportunities.
Sincerely,

George A. Henning
1 The Dow Jones Industrial Average is an unmanaged, price weighted measure of 30 U.S. stocks selected by the Averages Committee to represent the performance of all U.S. stocks outside the Transportation and Utilities sectors. The S&P 500® Index is an unmanaged, market capitalization weighted index which measures the performance of the large cap segment of the U.S. equities market, covering approximately 75% of the U.S. equities market. The Index includes 500 leading companies in leading industries of the U.S. economy. The NASDAQ Composite Index is an unmanaged, market capitalization weighted measure of all domestic and international common stocks (currently over 3,000 stocks) listed on The Nasdaq Stock Market. The Russell 2000® Index is an unmanaged, market-weighted measure of the 2,000 smallest publicly traded companies of the Russell 3000® Index. The Russell Midcap® Index is an unmanaged, weighted measure of the 800 smallest companies within the Russell 1000® Index based on a combination of their market cap and current index membership. The Russell 3000® Index measures the performance of the largest 3,000 U.S. companies representing approximately 98% of the investable U.S. equity market. These indices are not available for direct investment. Index returns assume the reinvestment of dividends.
Economic and performance information referenced is historical and past performance does not guarantee future results. The principal value and return of an investment will fluctuate so that an investor's shares may be worth less than the original cost when redeemed. For more information on the Pacific Advisors Funds, including information on charges, expenses and other classes offered, please obtain a copy of the prospectus by calling (800) 989-6693. Please read the prospectus and consider carefully the investment risks, objectives, charges and expenses before you invest or send money.
Shares of the Funds are not deposits or obligations of any bank, are not guaranteed by any bank, are not insured by the FDIC or any other agency, and involve investment risks, including the possible loss of the principal amount invested. The views expressed represent the opinions and beliefs at the time of this commentary and are not meant as a market forecast. These views are subject to change at any time based on market or other conditions. This information may not be relied on as investment advice or as an indication of trading.
3
Pacific Advisors
Income and Equity Fund
Fund Objective: Current income and, secondarily, long-term capital appreciation.
Investment Invests primarily in investment grade U.S. corporate bonds and in dividend-paying
Strategy: stocks.
Investor Profile: Conservative. Some current income required; capital preservation aim.
Please see the Chairman's Letter for a detailed market and economic review
as well as the Manager's general market outlook.
Portfolio Holdings (As of 06/30/16 based on total investments)
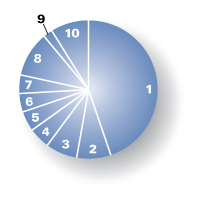
| 1. |
Corporate Bonds |
44.72 |
% | ||||||||
|
Equities |
44.30 |
% | |||||||||
| 2. |
Consumer Staples |
7.97 |
% |
||||||||
| 3. |
Industrials |
7.46 |
% |
||||||||
| 4. |
Consumer Discretionary |
4.96 |
% |
||||||||
| 5. |
Health Care |
4.70 |
% |
||||||||
| 6. |
Utilities |
4.34 |
% |
||||||||
| 7. |
Information Technology |
4.28 |
% |
||||||||
| 8. |
Others |
10.59 |
% |
||||||||
| 9. |
Preferred Stock |
2.17 |
% | ||||||||
| 10. |
Cash and Cash Equivalents |
8.81 |
% |
||||||||
| Total Returns (For the six months ended 06/30/16) | |||||||
|
Class A |
5.01 |
% |
|||||
|
Class C |
4.66 |
% |
|||||
|
|
|||||||
|
Barclays Capital U.S. Int Corp Bond Index1 |
5.06 |
% |
|||||
|
S&P 500® Index1 |
3.84 |
% |
|||||
Current expense ratio: net 2.97% (A), 3.72% (C); gross 3.72% (A), 4.47% (C). Prospectus expense ratio: net 2.06% (A), 2.81% (C); gross 2.81% (A); 3.56% (C).2
Performance quoted is past performance which does not guarantee future results. Current performance may be higher or lower than the performance quoted. Call (800) 989-6693 for performance current to the most recent month-end. The investment return and principal value of an investment will fluctuate so that an investor's shares, when redeemed, may be worth more or less than their original cost. Returns represent the change in value over the stated period assuming reinvestment of dividends and capital gains at net asset value. Returns do not take into account the maximum 4.75% sales charge on Class A shares or the 1% Contingent Deferred Sales Charge (CDSC) for Class C shares sold within one year of purchase. Returns would be lower if the applicable sales charge and CDSC were included. Returns do not take into account individual taxes which may reduce actual returns when shares are sold.
The Fund's investment adviser is waiving a portion of its management fees pursuant to an Expense Limitation Agreement. The waiver may be discontinued at any time with ninety days written notice in consultation with the Fund's board, but is expected to continue at current levels. Please see the Notes to Financial Statements in this report for details. Performance shown reflects the waiver, without which the results would have been lower.
1 The S&P 500® Index is an unmanaged, market capitalization weighted index which measures the performance of the large cap segment of the U.S. equities market, covering approximately 75% of the U.S. equities market. The Index includes 500 leading companies in leading industries of the U.S. economy. Index returns assume the reinvestment of dividends, but, unlike the Fund's returns, do not reflect the effects of management fees or expenses. The Barclays Capital U.S. Intermediate Corporate Bond Index is an unmanaged index of publicly issued investment grade U.S. corporate bonds with one to ten years to maturity. It is not possible to invest directly in either Index.
2 "Current" expense ratio is annualized for the year-to-date as of 06/30/16. "Prospectus" expense ratio is for the fiscal year ended 12/31/15.
4
Discussion with Portfolio Managers August 22, 2016
Charles Suh, CFA and Jingjing Yan, CFA
Fund Strategy
The Fund actively manages the allocation between fixed income and equity holdings to create risk-appropriate opportunities for both income and capital appreciation. The Fund seeks investment-quality bonds that provide current income and principal protection. The Fund also invests in a focused selection of 30-40 dividend-paying, blue-chip stocks with stable growth patterns and low volatility. This equity approach has significantly contributed to Fund performance during the long period of low interest rates; that is, the dividend yields for portfolio stocks were often greater than the yields on corporate bonds issued by those same companies. We anticipate that the Fund's allocation to equities may decline as interest rates rise and we reinvest capital in intermediate and longer-term bonds at prevailing higher yields.
Fund Performance
Class A shares rose 5.01%; in comparison, the Fund's fixed income benchmark, the Barclays Capital U.S. Intermediate Corporate Bond Index, gained 5.06% while the Fund's equity benchmark, the S&P 500® Index, rose 3.84%. The composition of the Fund's fixed income holdings, and the Fund's equity holdings, differ from their respective benchmarks; nevertheless, overall Fund performance is best compared to a blended return based on the two benchmarks. Through June, the blended return1 for Class A shares was 4.49%. And, importantly, the Fund maintained substantially lower volatility than the overall market as demonstrated by the Fund's one-year beta of 0.392, as of June 30th, versus the S&P 500® Index. At the beginning of the year, interest rates fell sharply with the equity markets. From February through May, rates fluctuated in response to investor expectations of further rate increases by the Federal Reserve. In June, though, rates declined as the United Kingdom unexpectedly voted to leave the European Union (the "Brexit vote"). The yield on the 10-year U.S. Treasury Note dropped to 1.46%, the lowest level in nearly four years, before ending the first half of the year at 1.49%. Investors also favored stable blue-chip food retailers and utilities whose shares rose to or above fair value.
What Helped/Hurt Performance3
The Fund's top equity contributors to returns were AT&T, Verizon, and Sysco. AT&T and Verizon gained 29% and 24%, respectively, as investors continued to prefer relatively safe, high-dividend-paying stocks. Historically low interest rates have contributed to heightened demand for "bond-like" equities, including telecommunications companies and utilities. Still, we believe AT&T and Verizon enjoy attractive long-term appreciation potential linked to the growing use of connected devices and the emerging "Internet of Things." Food products distributor Sysco rose 26% to reach an all-time high as the company produced better-than-expected earnings results on strong shipment volumes and effective expense management.
The Fund's most significant detractors to returns were MetLife, Kroger, and Wells Fargo. MetLife and Wells Fargo fell 16% and 12%, respectively, as declining interest rates pressured revenues from lending and investment activities. MetLife's plans to separate and spin off its U.S. retail business are designed to reduce regulatory expenses, repositioning the company for growth and contribute to improved financial performance. Wells Fargo remains a best-in-class lender with stable credit performance and a strong capital position. Food retailer Kroger fell 11% despite increasing profitability and market share gains as concerns of heightened competition and food price deflation weighed on shares.
1 Blended return calculated from the benchmark index returns based on ratio of stocks to fixed-income securities in the Fund's portfolio as of the end of the period.
2 "Beta" measures volatility relative to the stock market or an alternative benchmark. A beta less than 1.0 indicates lower risk than the market or the benchmark; a beta greater than 1.0 indicates higher risk than the market or the benchmark.
3 For detailed information on Fund holdings, please see the Fund's Schedule of Investments in this Report.
5
Pacific Advisors
Income and Equity Fund continued
Several of the Fund's corporate bonds were called in as their issuers retired debt or refinanced bonds at lower rates. The Fund reinvested capital from these transactions in similar investment-grade bonds of high-quality companies including Agro, an agricultural equipment manufacturer, yielding 4.2% and maturing in December 2021; and GATX, a railcar leasing company, yielding 3.2% and maturing in March 2020.
During the period, longer-term bonds performed relatively well as interest rates fell; the Fund, however, remained invested primarily in short-to-intermediate-term bonds which will help preserve principal and lower price volatility. During the period, the Fund maintained an average duration of 2.3 years; in contrast, the average duration of the benchmark (the Barclays Capital U.S. Intermediate Corporate Bond Index, an unmanaged bond portfolio) was 4.5 years. Duration measures a portfolio's sensitivity to interest rate movements; when rates increase by 1%, the value of a portfolio with a 4-year duration would decrease by approximately 4%.
Looking Ahead
For the remainder of the year, we anticipate that investors will pay close attention to the pace of U.S. economic growth and indications of interest rate increases. In June, Fed Chair Yellen reiterated that a cautious approach to raising rates remains appropriate since economic data continue to be mixed. The Fund's focus on shorter-term bonds may result in periods of underperformance as the interest rate environment shifts; however, the Fund should benefit from the flexibility of holding shorter-term bonds. The Fund anticipates that, as its shorter-term bonds mature or are called, the proceeds will be invested at higher yields. And, the Fund expects to gradually lengthen the average duration of its bond portfolio as rates trend higher. The Fund will continue to identify stocks which present opportunities for price appreciation as well as dividend increases; though, as rates rise, the Fund may decrease equity holdings to increase its fixed income allocation and take advantage of higher prevailing yields.
6
Expense Examples
As a shareholder of the Fund you incur two types of costs: (1) transaction costs, including sales charges (loads) on purchase payments, reinvested dividends, or other distributions; redemption fees; and exchange fees; and (2) ongoing costs, including management fees; distribution (12b-1) fees; and other Fund expenses. This Example is intended to help you understand your ongoing costs (in dollars) of investing in the Fund and to compare these costs with the ongoing costs of investing in other mutual funds.
The Example is based on an investment of $1,000 invested at the beginning of the period and held for the entire period from January 1, 2016 through June 30, 2016.
Actual Expenses
The first line of the table below provides information about actual account values and actual expenses. You may use the information in this line, together with the amount you invested, to estimate the expenses that you paid over the period. Simply divide your account value by $1,000 (for example, an $8,600 account value divided by $1,000 = 8.6), then multiply the result by the number in the first line under the heading entitled "Expenses Paid During the Period" to estimate the expenses you paid on your account during the period.
The following transaction costs are not included in the expenses shown in the table and, if applicable, would increase the expenses that you paid over the period: (1) a front-end sales charge (load) of 4.75% on Class A shares; (2) a 2% redemption fee if you sell or exchange shares within 30 days of purchase, with certain exceptions. The redemption fee does not apply to: (a) redemptions under an automatic withdrawal program or periodic asset reallocation plan, required minimum distributions (RMD), employer mandated distributions from a qualified plan, or redemptions under a qualified domestic relations order (QDRO); (b) redemptions to pay for expenses related to terminal illness, extended hospital or nursing home care, or other serious medical conditions, including death; (c) redemptions of shares acquired through dividend or capital gains reinvestments; (d) loans from a qualified plan account; and (e) redemptions initiated by the Fund; and (3) a $10 service fee on each exchange after the first five exchanges in each calendar year.
The following ongoing costs are not included in the expenses shown in the table and, if applicable, would increase the expenses that you paid over the period: (1) a $12 low balance fee on accounts with balances of less than $250 as of September 30th of each calendar year and no investment activity (excluding reinvestment of dividends and/or capital gains) during the prior calendar year or the first nine months of the current calendar year. This fee does not apply to IRAs, qualified plan accounts, or Coverdell Education Savings Accounts; (2) a $15 annual custodial fee on IRAs, SEPs, SIMPLE IRAs, and Coverdell Education Savings Accounts; and (3) a $20 annual custodial fee on 403(b) accounts.
Hypothetical Example for Comparison Purposes
The second line of the table below provides information about hypothetical account values and hypothetical expenses based on the Fund's actual expense ratio and an assumed rate of return of 5% per year before expenses, which in not the Fund's actual return. The hypothetical account values and expenses may not be used to estimate the actual ending account balance or expenses you paid for the period. You may use this information to compare the ongoing costs of investing in the Fund and other funds. To do so, compare this 5% hypothetical example with the 5% hypothetical examples that appear in the shareholder reports of the other funds.
The following transaction costs are not included in the expenses shown in the table and, if applicable, would increase the expenses that you paid over the period: (1) a front-end sales charge (load) of 4.75% on Class A shares; (2) a 2% redemption fee if you sell or exchange shares within 30 days of purchase, with certain exceptions. The redemption fee does not apply to: (a) redemptions under an automatic withdrawal program or periodic asset reallocation plan, required minimum distributions (RMD), employer mandated distributions from a qualified plan, or redemptions under a qualified domestic relations order (QDRO); (b) redemptions to pay for expenses related to terminal illness, extended hospital or nursing home care, or other serious medical conditions, including death; (c) redemptions of shares acquired through dividend or capital gains reinvestments; (d) loans from a qualified plan account; and (e) redemptions initiated by the Fund; and (3) a $10 service fee on each exchange after the first five exchanges in each calendar year.
The following ongoing costs are not included in the expenses shown in the table and, if applicable, would increase the expenses that you paid over the period: (1) a $12 low balance fee on accounts with balances of less than $250 as of September 30th of each calendar year and no investment activity (excluding reinvestment of dividends and/or capital gains) during the prior calendar year or the first nine months of the current calendar year. This fee does not apply to IRAs, qualified plan accounts, or Coverdell Education Savings Accounts; (2) a $15 annual custodial fee on IRAs, SEPs, SIMPLE IRAs, and Coverdell Education Savings Accounts; and (3) a $20 annual custodial fee on 403(b) accounts.
Please note that the expenses shown in the table are meant to highlight your ongoing costs only and do not reflect any transactional costs, such as sales charges (loads), redemption fees, or exchange fees. Therefore, the second line of the table is useful in comparing ongoing costs only, and will not help you determine the relative total costs of owning different funds. In addition, if these transactional costs were included, your costs would have been higher.
|
Beginning Account Value 01/01/16 |
Ending Account Value 06/30/16 |
Expense Paid During Period 01/01/16 – 06/30/16 |
|||||||||||||
|
Income & Equity Fund Class A |
|||||||||||||||
|
Actual |
$ |
1,000.00 |
$ |
1,050.10 |
$ |
15.14 |
|||||||||
|
Hypothetical (5% return before expense) |
$ |
1,000.00 |
$ |
1,010.09 |
$ |
14.84 |
|||||||||
|
Income & Equity Fund Class C |
|||||||||||||||
|
Actual |
$ |
1,000.00 |
$ |
1,046.60 |
$ |
18.93 |
|||||||||
|
Hypothetical (5% return before expense) |
$ |
1,000.00 |
$ |
1,006.37 |
$ |
18.56 |
|||||||||
4 Expenses are equal to the Fund's annualized expense ratio, net of expense waivers, of 2.97% for Class A shares and 3.72% for Class C shares, multiplied by the average account value over the period, multiplied by 182/366 days to reflect the one-half year period.
7
Pacific Advisors
Balanced Fund
Fund Objective: Long-term capital appreciation and income consistent with reduced risk.
Investment Invests primarily in large cap common stocks and investment grade U.S. corporate
Strategy: bonds. Invests at least 25% of its assets in fixed income securities and preferred stocks and at least 25% in equities.
Investor Profile: Moderately conservative. Seeks combination of long-term growth, income, liquidity and reduced risk of price fluctuations.
Please see the Chairman's Letter for a detailed market and economic review
as well as the Manager's general market outlook.
Portfolio Holdings (As of 06/30/16 based on total investments)
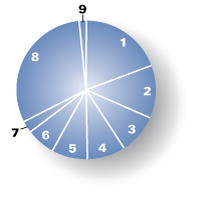
| Equities |
67.43 |
% | |||||||||
| 1. |
Industrials |
19.31 |
% |
||||||||
| 2. |
Consumer Discretionary |
12.27 |
% |
||||||||
| 3. |
Information Technology |
9.24 |
% |
||||||||
| 4. |
Health Care |
8.86 |
% |
||||||||
| 5. |
Financials |
8.28 |
% |
||||||||
| 6. |
Energy |
6.68 |
% |
||||||||
| 7. |
Consumer Staples |
2.79 |
% |
||||||||
| 8. |
Corporate Bonds |
31.03 |
% | ||||||||
| 9. |
Preferred Stock |
1.54 |
% |
||||||||
| Total Returns (For the six months ended 06/30/16) | |||||||
|
Class A |
–3.57 |
% |
|||||
|
Class C |
–4.00 |
% |
|||||
|
|
|||||||
|
S&P 500® Index1 |
3.84 |
% |
|||||
|
Barclays Capital U.S. Int Corp Bond Index1 |
5.06 |
% |
|||||
Current expense ratio: 4.65% (A); 5.35% (C). Prospectus expense ratio: 3.27% (A); 4.05% (C).2
Performance quoted is past performance which does not guarantee future results. Current performance may be higher or lower than the performance quoted. Call (800) 989-6693 for performance current to the most recent month-end. The investment return and principal value of an investment will fluctuate so that an investor's shares, when redeemed, may be worth more or less than their original cost. Returns represent the change in value over the stated period assuming reinvestment of dividends and capital gains at net asset value. Returns do not take into account the maximum 5.75% sales charge on Class A shares or the 1% Contingent Deferred Sales Charge (CDSC) for Class C shares sold within one year of purchase. Returns would be lower if the applicable sales charge and CDSC were included. Returns do not take into account individual taxes which may reduce actual returns when shares are sold.
1 The S&P 500® Index is an unmanaged, market capitalization weighted index which measures the performance of the large cap segment of the U.S. equities market, covering approximately 75% of the U.S. equities market. The Index includes 500 leading companies in leading industries of the U.S. economy. Index returns assume the reinvestment of dividends, but, unlike the Fund's returns, do not reflect the effects of management fees or expenses. The Barclays Capital U.S. Intermediate Corporate Bond Index is an unmanaged index of publicly issued investment grade U.S. corporate bonds with one to ten years to maturity. It is not possible to invest directly in either Index.
2 "Current" expense ratio is annualized for the year-to-date as of 06/30/16. "Prospectus" expense ratio is for the fiscal year ended 12/31/15.
8
Discussion with Portfolio Managers August 22, 2016
Charles Suh, CFA, Vi Chan, CFA and Jingjing Yan, CFA
Fund Strategy
The Fund is designed for investors seeking to participate in the equity markets with reduced volatility. The Fund's strategy combines high-quality stocks across all market capitalizations with investment-grade corporate bonds. We identify leading, well-managed companies that generate high returns on capital and consistent earnings over a full economic cycle. We look to purchase stocks at a discount to our internal price targets with the expectation that, as the companies' growth strategies unfold, the stocks will appreciate over the medium-to-long-term. The Fund may experience periods of underperformance when short-term market trends overshadow long-term outlooks; yet, over time, performance should reflect the strength of these companies as they demonstrate the ability to grow through various economic and business cycles.
We manage the Fund's asset allocation based on our assessment of risk-appropriate investments in the context of the overall economic, market, and interest rate outlook. This balanced approach enables the Fund to take advantage of specific growth opportunities while reducing overall risk.
Fund Performance
Class A shares fell 3.57%; in comparison, the Fund's equity benchmark, the S&P 500® Index, gained 3.84% while the Fund's fixed income benchmark, the Barclays Capital U.S. Intermediate Corporate Bond Index, gained 5.06%. Continuing market volatility in the first half of the year contributed to elevated demand for "safe haven" assets such as U.S. Treasuries and blue-chip, dividend-paying stocks. Most of the market indices ended June near all-time highs; the strong performance was not universal, though, as investors favored conservative stocks such as food and beverage retailers and utilities. During the period, as interest rates unexpectedly fell toward record low yields, corporate bonds performed well. And, even though many now expect rates to remain low for an extended period, we believe that interest rate risk remains a primary concern. Accordingly, the Fund's fixed income holdings focus on investment-grade bonds maturing in 3-5 years that were selected to minimize the effects of interest rate volatility.
What Helped/Hurt Performance1
The Fund's top contributors to returns were Kirby, Cummins, and PVH. Kirby, the nation's largest tank barge operator, gained 32% as oil prices started to recover from February lows. The company maintains a market leading position in the face of challenging conditions as oversupply of barges and the continuing slowdown in petrochemical products pressured shipping rates and utilization levels. Diesel engine manufacturer Cummins rose over 30% even though year-over-year revenues declined 10%. Lower production costs and product improvements are positioning the company for better performance when the global economy improves. PVH, which owns the Calvin Klein and Tommy Hilfiger brands, rose over 28% following better-than-expected earnings and improved 2016 guidance. E-commerce initiatives now represent the company's fastest-growing distribution channel.
The Fund's most significant detractors to returns were Conn's, Perrigo, and Gentherm. Specialty retailer Conn's fell 68% due to persistent concerns over slowing sales growth as the company transitions to tighter credit standards. Yet, higher credit quality should lead to improved overall corporate profitability; the company's upcoming debt securitization could overcome the market's pessimism. Perrigo, the world's largest manufacturer of store-brand and generic pharmaceuticals, declined 37% following the disappointing results from an acquired business, drug pricing pressures, and the unexpected departure of its longtime CEO. Management depth, the company's extensive product development and distribution network, and
1 For detailed information on Fund holdings, please see the Fund's Schedule of Investments in this Report.
9
Pacific Advisors
Balanced Fund continued
focus on affordable healthcare products provide a solid foundation for recovery. Auto parts supplier Gentherm fell 28% on concerns of slowing global economic growth. The company has recently diversified into healthcare and industrial testing services; also, its new battery thermal management products for hybrid-electric vehicles should begin generating revenue in the fourth quarter.
During the period, the Fund began adjusting the equity portfolio to add diversification and contribute to reduced price volatility. New holdings included several stocks in the Health Care, Financials and Information Technology sectors. For example, we purchased Henry Schein and Accenture. Henry Schein is a global distributor of dental, veterinary, and medical products and services. The dental and veterinary markets, in particular, are predominantly "cash pay" businesses that avoid issues related to insurance reimbursements. Accenture provides specialized consulting, technology and outsourcing services in over 40 industries with clients in over 120 countries; many executives view Accenture as an indispensable partner to advance technology throughout their organizations. We sold out of several holdings including Cummins, Kirby and General Electric as these stocks reached our price targets. The Fund's repositioning will likely continue through the remainder of 2016.
Looking Ahead
This year, investors have predominantly favored relatively stable, dividend-paying stocks as economic growth remained sluggish and as interest rates around the globe fell. These trends, though, will not persist indefinitely; and, when investors gain confidence as economic activity increases, these "safe havens" will likely underperform. Similarly, longer-term corporate bonds, which have recently benefitted from the current "lower for longer" interest rate outlook, offer little protection when rates rise. For the remainder of 2016, we anticipate continued moderate economic growth. Increased infrastructure spending may provide a much-needed economic boost, while stable-to-rising oil prices could improve overall market sentiment. Across many sectors, leading, well-financed companies should continue to grow through strategic acquisitions, product introductions, and business expansion.
10
Expense Examples
As a shareholder of the Fund you incur two types of costs: (1) transaction costs, including sales charges (loads) on purchase payments, reinvested dividends, or other distributions; redemption fees; and exchange fees; and (2) ongoing costs, including management fees; distribution (12b-1) fees; and other Fund expenses. This Example is intended to help you understand your ongoing costs (in dollars) of investing in the Fund and to compare these costs with the ongoing costs of investing in other mutual funds.
The Example is based on an investment of $1,000 invested at the beginning of the period and held for the entire period from January 1, 2016 through June 30, 2016.
Actual Expenses
The first line of the table below provides information about actual account values and actual expenses. You may use the information in this line, together with the amount you invested, to estimate the expenses that you paid over the period. Simply divide your account value by $1,000 (for example, an $8,600 account value divided by $1,000 = 8.6), then multiply the result by the number in the first line under the heading entitled "Expenses Paid During the Period" to estimate the expenses you paid on your account during the period.
The following transaction costs are not included in the expenses shown in the table and, if applicable, would increase the expenses that you paid over the period: (1) a front-end sales charge (load) of 5.75% on Class A shares; (2) a 2% redemption fee if you sell or exchange shares within 180 days of purchase, with certain exceptions. The redemption fee does not apply to: (a) redemptions under an automatic withdrawal program or periodic asset reallocation plan, required minimum distributions (RMD), employer mandated distributions from a qualified plan, or redemptions under a qualified domestic relations order (QDRO); (b) redemptions to pay for expenses related to terminal illness, extended hospital or nursing home care, or other serious medical conditions, including death; (c) redemptions of shares acquired through dividend or capital gains reinvestments; (d) loans from a qualified plan account, and (e) redemptions initiated by the Fund; and (3) a $10 service fee on each exchange after the first five exchanges in each calendar year.
The following ongoing costs are not included in the expenses shown in the table and, if applicable, would increase the expenses that you paid over the period: (1) a $12 low balance fee on accounts with balances of less than $250 as of September 30th of each calendar year and no investment activity (excluding reinvestment of dividends and/or capital gains) during the prior calendar year or the first nine months of the current calendar year. This fee does not apply to IRAs, qualified plan accounts, or Coverdell Education Savings Accounts; (2) a $15 annual custodial fee on IRAs, SEPs, SIMPLE IRAs, and Coverdell Education Savings Accounts; and (3) a $20 annual custodial fee on 403(b) accounts.
Hypothetical Example for Comparison Purposes
The second line of the table below provides information about hypothetical account values and hypothetical expenses based on the Fund's actual expense ratio and an assumed rate of return of 5% per year before expenses, which in not the Fund's actual return. The hypothetical account values and expenses may not be used to estimate the actual ending account balance or expenses you paid for the period. You may use this information to compare the ongoing costs of investing in the Fund and other funds. To do so, compare this 5% hypothetical example with the 5% hypothetical examples that appear in the shareholder reports of the other funds.
The following transaction costs are not included in the expenses shown in the table and, if applicable, would increase the expenses that you paid over the period: (1) a front-end sales charge (load) of 5.75% on Class A shares; (2) a 2% redemption fee if you sell or exchange shares within 180 days of purchase, with certain exceptions. The redemption fee does not apply to: (a) redemptions under an automatic withdrawal program or periodic asset reallocation plan, required minimum distributions (RMD), employer mandated distributions from a qualified plan, or redemptions under a qualified domestic relations order (QDRO); (b) redemptions to pay for expenses related to terminal illness, extended hospital or nursing home care, or other serious medical conditions, including death; (c) redemptions of shares acquired through dividend or capital gains reinvestments; (d) loans from a qualified plan account, and (e) redemptions initiated by the Fund; and (3) a $10 service fee on each exchange after the first five exchanges in each calendar year.
The following ongoing costs are not included in the expenses shown in the table and, if applicable, would increase the expenses that you paid over the period: (1) a $12 low balance fee on accounts with balances of less than $250 as of September 30th of each calendar year and no investment activity (excluding reinvestment of dividends and/or capital gains) during the prior calendar year or the first nine months of the current calendar year. This fee does not apply to IRAs, qualified plan accounts, or Coverdell Education Savings Accounts; (2) a $15 annual custodial fee on IRAs, SEPs, SIMPLE IRAs, and Coverdell Education Savings Accounts; and (3) a $20 annual custodial fee on 403(b) accounts.
Please note that the expenses shown in the table are meant to highlight your ongoing costs only and do not reflect any transactional costs, such as sales charges (loads), redemption fees, or exchange fees. Therefore, the second line of the table is useful in comparing ongoing costs only, and will not help you determine the relative total costs of owning different funds. In addition, if these transactional costs were included, your costs would have been higher.
|
Beginning Account Value 01/01/16 |
Ending Account Value 06/30/16 |
Expense Paid During Period 01/01/16 – 06/30/16 |
|||||||||||||
|
Balanced Fund Class A |
|||||||||||||||
|
Actual |
$ |
1,000.00 |
$ |
964.30 |
$ |
22.71 |
|||||||||
|
Hypothetical (5% return before expense) |
$ |
1,000.00 |
$ |
1,001.74 |
$ |
23.14 |
|||||||||
|
Balanced Fund Class C |
|||||||||||||||
|
Actual |
$ |
1,000.00 |
$ |
960.00 |
$ |
26.07 |
|||||||||
|
Hypothetical (5% return before expense) |
$ |
1,000.00 |
$ |
998.26 |
$ |
26.58 |
|||||||||
4 Expenses are equal to the Fund's annualized expense ratio of 4.65% for Class A shares and 5.35% for Class C shares, multiplied by the average account value over the period, multiplied by 182/366 days to reflect the one-half year period.
11
Pacific Advisors
Large Cap Value Fund
Fund Objective: Long-term capital appreciation.
Investment Invests at least 80% of its assets in large cap companies that are, at the time of
Strategy: purchase, within the market cap range of companies in the S&P 500® Index1.
Investor Profile: Conservative equity. Growth-oriented with a long-term investment horizon.
Please see the Chairman's Letter for a detailed market and economic review
as well as the Manager's general market outlook.
Portfolio Holdings (As of 06/30/16 based on total investments)
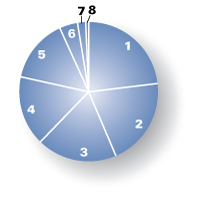
| Equities |
99.29 |
% | |||||||||
| 1. |
Information Technology |
22.35 |
% |
||||||||
| 2. |
Consumer Discretionary |
20.70 |
% |
||||||||
| 3. |
Consumer Staples |
18.79 |
% |
||||||||
| 4. |
Industrials |
16.42 |
% |
||||||||
| 5. |
Financials |
14.90 |
% |
||||||||
| 6. |
Health Care |
4.24 |
% |
||||||||
| 7. |
Energy |
1.89 |
% |
||||||||
| 8. |
Cash and Cash Equivalents |
0.71 |
% |
||||||||
| Total Returns (For the six months ended 06/30/16) | |||||||
|
Class A |
0.22 |
% |
|||||
|
Class C |
–0.17 |
% |
|||||
|
|
|||||||
|
S&P 500® Index |
3.84 |
% |
|||||
Current expense ratio: net 3.88% (A), 4.61% (C); gross 4.63% (A), 5.36% (C). Prospectus expense ratio: net 2.72% (A), 3.50% (C); gross 3.47% (A); 4.25% (C).2
Performance quoted is past performance which does not guarantee future results. Current performance may be higher or lower than the performance quoted. Call (800) 989-6693 for performance current to the most recent month-end. The investment return and principal value of an investment will fluctuate so that an investor's shares, when redeemed, may be worth more or less than their original cost. Returns represent the change in value over the stated period assuming reinvestment of dividends and capital gains at net asset value. Returns do not take into account the maximum 5.75% sales charge on Class A shares or the 1% Contingent Deferred Sales Charge (CDSC) for Class C shares sold within one year of purchase. Returns would be lower if the applicable sales charge and CDSC were included. Returns do not take into account individual taxes which may reduce actual returns when shares are sold.
The Fund's investment adviser is waiving a portion of its management fees pursuant to an Expense Limitation Agreement. The waiver may be discontinued at any time with ninety days written notice in consultation with the Fund's board, but is expected to continue at current levels. Please see the Notes to Financial Statements in this report for details. Performance shown reflects the waiver, without which the results would have been lower.
1 The Standard & Poor's 500® Index is an unmanaged, market capitalization weighted index which measures the performance of the large cap segment of the U.S. equities market, covering approximately 75% of the U.S. equities market. The Index includes 500 leading companies in leading industries of the U.S. economy. Index returns assume the reinvestment of dividends, but, unlike the Fund's returns, do not reflect the effects of management fees or expenses. It is not possible to invest directly in the Index.
2 "Current" expense ratio is annualized for the year-to-date as of 06/30/16. "Prospectus" expense ratio is for the fiscal year ended 12/31/15.
12
Discussion with Portfolio Manager August 22, 2016
Samuel C. Coquillard
Fund Strategy
The Fund uses a value-oriented, focused portfolio strategy (34 holdings as of 06/30/16) to invest in more conservative, less volatile U.S. stocks that pay attractive dividends. The Fund seeks to achieve long-term capital appreciation with reduced volatility. Holdings concentrate on mega-cap stocks of well-managed companies with dominant market positions, strong financials, and track records of steady growth. The weighted average market capitalization of Fund holdings ($179 billion as of 06/30/16) is almost five times larger than the average of the benchmark S&P 500® Index. The mega-cap emphasis helps achieve stable total returns with less volatility than the broader market; as of June 30th, the Fund's one-year beta1 of 0.98 remains consistently below the Index. The weighted average dividend yield was 2.25%; several holdings, including Proctor & Gamble, ExxonMobil, MetLife, Wells Fargo, General Electric and International Business Machines, paid dividends in excess of 3.00%.
Fund Performance
Class A shares gained 0.22% compared to the S&P 500® Index's gain of 3.84%. Market volatility continued in the first half of 2016 as investor concerns clouded market sentiment and drove a flight to safety. Even as the equity markets ended June near all-time highs, performance was mainly driven by investor demand for conservative investments. The Fund's allocation to Consumer Staples (including Household Products, Food, and Beverages) companies helped performance while the Fund's underallocation to the period's best performing areas (including Utilities and Telecommunication Services) hurt performance. Also, Financials stocks underperformed as uncertainty over the timing of the Federal Reserve's interest rate increases weighed on earnings outlooks.
What Helped/Hurt Performance2
The Fund's top three contributors to returns during the first half were Sysco, Johnson & Johnson, and Kraft Heinz Company. Sysco, the largest foodservice distributor in North America, gained over 26% during the period; the company's recently announced three-year agenda to increase sales while improving operating efficiencies appears to be bearing fruit. Johnson & Johnson gained almost 20%; sales in the pharmaceutical division increased with the introduction of new products. The company is focused on strategic acquisitions and product innovation to expand its leadership position in key medical and pharmaceutical categories. The Kraft Heinz Company rose over 23% as sales growth improved. The ongoing integration to create one of the world's largest food and beverage companies, with products offerings, including Oscar MayerTM meats, Maxwell House coffee, Jell-O and Planters® nuts, in addition to namesake Kraft and Heinz products, is yielding significantly higher-than-planned cost savings.
The Fund's bottom three detractors to returns were MetLife, American International Group, and Houghton Mifflin Harcourt. MetLife, the nation's largest life insurance provider, fell over 15% on lackluster results; also, the company has adjusted reserves related to its plans to separate much of its U.S. retail business. Similarly, American International Group, a leading global underwriter of commercial, institutional and individual insurance products, declined over 13% as unfavorable business trends continued. The company is in the process of improving profitability by reducing risk, leverage, and asset volatility and increasing technology investments. Houghton Mifflin Harcourt, a global provider of Pre-K-12 education content and one of the longest-established publishing houses, fell over 28% due lower-than-expected billings. Also, delays in adoption of a major curriculum program (the California English Language Arts)
1 "Beta" measures volatility relative to the stock market or an alternative benchmark. A beta less than 1.0 indicates lower risk than the market or the benchmark; a beta greater than 1.0 indicates higher risk than the market or the benchmark.
2 For detailed information on Fund holdings, please see the Fund's Schedule of Investments in this Report.
13
Pacific Advisors
Large Cap Value Fund continued
impacted revenues. Longer term, the company is well-positioned to benefit as education spending transitions from print to digital content.
During the period, the Fund sold positions in Johnson Controls and Legg Mason and trimmed positions in Disney, Home Depot, Microsoft, and Oracle.
Looking Ahead
We expect U.S. economic growth to continue at a modest pace. Encouraging data on job creations, wage growth and increased consumer spending are improving investor confidence. And, recent company commentaries support a positive outlook for the second half of the year. Meanwhile, the Fed, in closely monitoring domestic and global economic threats, and monetary policies of the major central banks, appears to leave open the door to a potential interest rate increase later this year. Together, these factors bolster the appeal of conservative stocks as investors rotate from "safe havens." The Fund, with considerable holdings in well-known market leaders, would likely benefit as these investors favor companies with strong international operations that are positioned to participate in the global economic expansion.
14
Expense Examples
As a shareholder of the Fund you incur two types of costs: (1) transaction costs, including sales charges (loads) on purchase payments, reinvested dividends, or other distributions; redemption fees; and exchange fees; and (2) ongoing costs, including management fees; distribution (12b-1) fees; and other Fund expenses. This Example is intended to help you understand your ongoing costs (in dollars) of investing in the Fund and to compare these costs with the ongoing costs of investing in other mutual funds.
The Example is based on an investment of $1,000 invested at the beginning of the period and held for the entire period from January 1, 2016 through June 30, 2016.
Actual Expenses
The first line of the table below provides information about actual account values and actual expenses. You may use the information in this line, together with the amount you invested, to estimate the expenses that you paid over the period. Simply divide your account value by $1,000 (for example, an $8,600 account value divided by $1,000 = 8.6), then multiply the result by the number in the first line under the heading entitled "Expenses Paid During the Period" to estimate the expenses you paid on your account during the period.
The following transaction costs are not included in the expenses shown in the table and, if applicable, would increase the expenses that you paid over the period: (1) a front-end sales charge (load) of 5.75% on Class A shares; (2) a 2% redemption fee if you sell or exchange shares within 180 days of purchase, with certain exceptions. The redemption fee does not apply to: (a) redemptions under an automatic withdrawal program or periodic asset reallocation plan, required minimum distributions (RMD), employer mandated distributions from a qualified plan, or redemptions under a qualified domestic relations order (QDRO); (b) redemptions to pay for expenses related to terminal illness, extended hospital or nursing home care, or other serious medical conditions, including death; (c) redemptions of shares acquired through dividend or capital gains reinvestments; (d) loans from a qualified plan account, and (e) redemptions initiated by the Fund; and (3) a $10 service fee on each exchange after the first five exchanges in each calendar year.
The following ongoing costs are not included in the expenses shown in the table and, if applicable, would increase the expenses that you paid over the period: (1) a $12 low balance fee on accounts with balances of less than $250 as of September 30th of each calendar year and no investment activity (excluding reinvestment of dividends and/or capital gains) during the prior calendar year or the first nine months of the current calendar year. This fee does not apply to IRAs, qualified plan accounts, or Coverdell Education Savings Accounts; (2) a $15 annual custodial fee on IRAs, SEPs, SIMPLE IRAs, and Coverdell Education Savings Accounts; and (3) a $20 annual custodial fee on 403(b) accounts.
Hypothetical Example for Comparison Purposes
The second line of the table below provides information about hypothetical account values and hypothetical expenses based on the Fund's actual expense ratio and an assumed rate of return of 5% per year before expenses, which in not the Fund's actual return. The hypothetical account values and expenses may not be used to estimate the actual ending account balance or expenses you paid for the period. You may use this information to compare the ongoing costs of investing in the Fund and other funds. To do so, compare this 5% hypothetical example with the 5% hypothetical examples that appear in the shareholder reports of the other funds.
The following transaction costs are not included in the expenses shown in the table and, if applicable, would increase the expenses that you paid over the period: (1) a front-end sales charge (load) of 5.75% on Class A shares; (2) a 2% redemption fee if you sell or exchange shares within 180 days of purchase, with certain exceptions. The redemption fee does not apply to: (a) redemptions under an automatic withdrawal program or periodic asset reallocation plan, required minimum distributions (RMD), employer mandated distributions from a qualified plan, or redemptions under a qualified domestic relations order (QDRO); (b) redemptions to pay for expenses related to terminal illness, extended hospital or nursing home care, or other serious medical conditions, including death; (c) redemptions of shares acquired through dividend or capital gains reinvestments; (d) loans from a qualified plan account, and (e) redemptions initiated by the Fund; and (3) a $10 service fee on each exchange after the first five exchanges in each calendar year.
The following ongoing costs are not included in the expenses shown in the table and, if applicable, would increase the expenses that you paid over the period: (1) a $12 low balance fee on accounts with balances of less than $250 as of September 30th of each calendar year and no investment activity (excluding reinvestment of dividends and/or capital gains) during the prior calendar year or the first nine months of the current calendar year. This fee does not apply to IRAs, qualified plan accounts, or Coverdell Education Savings Accounts; (2) a $15 annual custodial fee on IRAs, SEPs, SIMPLE IRAs, and Coverdell Education Savings Accounts; and (3) a $20 annual custodial fee on 403(b) accounts.
Please note that the expenses shown in the table are meant to highlight your ongoing costs only and do not reflect any transactional costs, such as sales charges (loads), redemption fees, or exchange fees. Therefore, the second line of the table is useful in comparing ongoing costs only, and will not help you determine the relative total costs of owning different funds. In addition, if these transactional costs were included, your costs would have been higher.
|
Beginning Account Value 01/01/16 |
Ending Account Value 06/30/16 |
Expense Paid During Period 01/01/16 – 06/30/16 |
|||||||||||||
|
Large Cap Value Fund Class A |
|||||||||||||||
|
Actual |
$ |
1,000.00 |
$ |
1,002.20 |
$ |
19.32 |
|||||||||
|
Hypothetical (5% return before expense) |
$ |
1,000.00 |
$ |
1,005.57 |
$ |
19.35 |
|||||||||
|
Large Cap Value Fund Class C |
|||||||||||||||
|
Actual |
$ |
1,000.00 |
$ |
998.30 |
$ |
22.90 |
|||||||||
|
Hypothetical (5% return before expense) |
$ |
1,000.00 |
$ |
1,001.94 |
$ |
22.95 |
|||||||||
5 Expenses are equal to the Fund's annualized expense ratio, net of expense waivers, of 3.88% for Class A shares and 4.61% for Class C shares, multiplied by the average account value over the period, multiplied by 182/366 days to reflect the one-half year period.
15
Pacific Advisors
Mid Cap Value Fund
Fund Objective: Long-term capital appreciation.
Investment Invests at least 80% of its assets in mid-cap companies that are, at the time of
Strategy: purchase, within the market cap range of companies in the Russell Midcap® Index.1
Investor Profile: Moderately aggressive. Growth-oriented with a long-term investment horizon.
Please see the Chairman's Letter for a detailed market and economic review
as well as the Manager's general market outlook.
Portfolio Holdings (As of 06/30/16 based on total investments)

|
Equities |
100.00 |
% |
|||||||||
| 1. |
Industrials |
43.44 |
% |
||||||||
| 2. |
Consumer Discretionary |
30.42 |
% |
||||||||
| 3. |
Energy |
7.31 |
% |
||||||||
| 4. |
Financials |
5.64 |
% |
||||||||
| 5. |
Information Technology |
4.34 |
% |
||||||||
| 6. |
Consumer Staples |
3.13 |
% |
||||||||
| 7. |
Health Care |
2.95 |
% |
||||||||
| 8. |
Materials |
2.77 |
% |
||||||||
| Total Returns (For the six months ended 06/30/16) | |||||||
|
Class A |
–1.65 |
% |
|||||
|
Class C |
–1.97 |
% |
|||||
|
|
|||||||
|
Russell Midcap® Index |
5.50 |
% |
|||||
Current expense ratio: 4.95% (A); 5.68% (C). Prospectus expense ratio: 3.68% (A); 4.46% (C).2
Performance quoted is past performance which does not guarantee future results. Current performance may be higher or lower than the performance quoted. Call (800) 989-6693 for performance current to the most recent month-end. The investment return and principal value of an investment will fluctuate so that an investor's shares, when redeemed, may be worth more or less than their original cost. Returns represent the change in value over the stated period assuming reinvestment of dividends and capital gains at net asset value. Returns do not take into account the maximum 5.75% sales charge on Class A shares or the 1% Contingent Deferred Sales Charge (CDSC) for Class C shares sold within one year of purchase. Returns would be lower if the applicable sales charge and CDSC were included. Returns do not take into account individual taxes which may reduce actual returns when shares are sold.
1 The Russell Midcap® Index is an unmanaged, weighted measure of the 800 smallest companies within the Russell 1000® Index based on a combination of their market cap and current index membership. Index returns assume the reinvestment of dividends, but, unlike the Fund's returns, do not reflect management fees or expenses. It is not possible to invest directly in the Index.
2 "Current" expense ratio is annualized for the year-to-date as of 06/30/16. "Prospectus" expense ratio is for the fiscal year ended 12/31/15.
16
Discussion with Portfolio Manager August 22, 2016
George A. Henning
Fund Strategy
Mid-cap companies provide distinctive advantages for long-term investors by combining the strategic flexibility of smaller businesses with the economies of scale typically enjoyed by large corporations. The Fund uses a fundamental, bottom-up strategy to identify leading mid-cap companies with attractive opportunities for long-term appreciation. Our focused, value-oriented approach selects approximately 30 to 40 stocks; we expect to hold each investment for 3 to 5 years, or longer. Our long-term investment horizon typically reduces turnover and contributes to tax efficiency by minimizing the realization of short-term gains. As of the period end, the Fund's annualized turnover rate of 17% was consistent with its five-year average annual turnover rate of 19.6%1.
Fund Performance
The Fund, which invests primarily in areas that respond well to economic growth, such as Industrials, Specialty Retailers and Energy, underperformed during the first half of the year. Class A shares fell 1.65% while the benchmark gained 5.50%. During the period, investors favored stocks known for steady dividends and relative price stability due to concerns about global economic issues, including oil prices, uncertainties relating to the timing of further Federal Reserve rate increases, and the United Kingdom's referendum to leave the European Union. Specifically, losses due to the Fund's overweight allocation to specialty retail, automotive, and energy stocks more than offset gains in other areas. And, a lack of exposure to the period's best performing Utilities sector hurt performance.
What Helped/Hurt Performance2
The Fund's top three contributors to returns were PVH Corporation, Kansas City Southern, and Kirby Corporation. Apparel company PVH, which owns Calvin Klein, Tommy Hilfiger, and other brands, rallied over 28% as product sales growth remains strong even as earnings have been negatively impacted by currency fluctuations. The company entered into a multi-year license agreement for the design, production, and distribution of Tommy Hilfiger womenswear collection in the U.S. and Canada, and, following a recent acquisition, PVH now directly operates the Tommy Hilfiger business in China. Rail company Kansas City Southern gained over 21% as the company's technology upgrades and consistent year-over-year shipping volumes generated better-than-expected results. Kirby Corporation, which operates barges and towing vessels throughout the U.S. inland waterway system, gained over 18% as crude oil prices rallied over 30% during the period. Business conditions remain weak, however, as management noted that continuing decline in petroleum-based product shipments may further pressure barge utilization and pricing. Still, the industry downturn has provided acquisition opportunities; the company recently expanded its leadership position on the Mississippi River System and Gulf Intracoastal Waterway with the acquisition of a competitor's tank barges.
The Fund's bottom three detractors to returns were Conn's, Penske Automotive Group, and Noble Corporation. Conn's underperformed as weak quarterly earnings reflected the company's transition to tighter credit underwriting standards. The specialty retailer is focused on stabilizing, then improving, the quality of its loan portfolio which will lower financing costs and provide greater profitability even with somewhat lower sales. Penske Automotive Group, the second largest U.S. automotive retailer in the U.S., declined over 24% on concerns about the company's U.K. exposure (34% of sales) in light of Brexit. The company's focus on the high-end luxury import market and diversification into commercial truck business
1 Annual turnover: 25% (2015); 22% (2014); 15% (2013); 24% (2012); and 12% (2011).
2 For detailed information on Fund holdings, please see the Fund's Schedule of Investments in this Report.
17
Pacific Advisors
Mid Cap Value Fund continued
positions the company for longer-term growth. Offshore oil and gas drilling contractor Noble Corporation fell over 20% despite a rally in crude oil prices; the downturn for offshore drilling appears to be more protracted given ample supply of rigs and limited demand for incremental work.
During the period, the Fund sold its position in NOW, Inc., the second largest distributor of pipes, values, and fittings to the energy industry. The Fund also trimmed several holdings to lock in profits, adjust allocations and rebalance the portfolio. These included Dr Pepper Snapple Group, Pool Corporation, Swift Transportation, and Tractor Supply Company.
The Fund purchased Cerner Corporation, a healthcare information technology company, which provides software and services to about 20% of hospitals in the U.S. We believe the company, as the highest-quality operator in the industry, is well-positioned to gain market share as IT spending across healthcare increases.
We also added to the Fund's positions in Chicago Bridge & Iron, Conn's, East West Bancorp, Helix Energy Solutions Group, Genesee & Wyoming, and Penske Automotive; we determined that the deeply discounted prices offered attractive opportunities to acquire shares for long-term appreciation.
Looking Ahead
Encouraging economic data, including the job creations, housing starts and consumer spending, as well as company commentaries suggest that the second half of the year should favor growth-oriented stocks. Meanwhile, the Federal Reserve, in noting that labor markets had strengthened since June and that near-term risks to the economic outlook have diminished, appears to leave open the door to a potential interest rate increase later this year. Conditions should support the rotation from "safe havens" to some of the recently underperforming areas as investors gain more confidence in the outlook for global growth. For example, we anticipate that the global recovery should increase demand for consumer products, automobiles, energy and other materials. The Fund is strongly oriented toward these areas and is, therefore, well positioned as economic conditions around the world improve.
18
Expense Examples
As a shareholder of the Fund you incur two types of costs: (1) transaction costs, including sales charges (loads) on purchase payments, reinvested dividends, or other distributions; redemption fees; and exchange fees; and (2) ongoing costs, including management fees; distribution (12b-1) fees; and other Fund expenses. This Example is intended to help you understand your ongoing costs (in dollars) of investing in the Fund and to compare these costs with the ongoing costs of investing in other mutual funds.
The Example is based on an investment of $1,000 invested at the beginning of the period and held for the entire period from January 1, 2016 through June 30, 2016.
Actual Expenses
The first line of the table below provides information about actual account values and actual expenses. You may use the information in this line, together with the amount you invested, to estimate the expenses that you paid over the period. Simply divide your account value by $1,000 (for example, an $8,600 account value divided by $1,000 = 8.6), then multiply the result by the number in the first line under the heading entitled "Expenses Paid During the Period" to estimate the expenses you paid on your account during the period.
The following transaction costs are not included in the expenses shown in the table and, if applicable, would increase the expenses that you paid over the period: (1) a front-end sales charge (load) of 5.75% on Class A shares; (2) a 2% redemption fee if you sell or exchange shares within 180 days of purchase, with certain exceptions. The redemption fee does not apply to: (a) redemptions under an automatic withdrawal program or periodic asset reallocation plan, required minimum distributions (RMD), employer mandated distributions from a qualified plan, or redemptions under a qualified domestic relations order (QDRO); (b) redemptions to pay for expenses related to terminal illness, extended hospital or nursing home care, or other serious medical conditions, including death; (c) redemptions of shares acquired through dividend or capital gains reinvestments; (d) loans from a qualified plan account, and (e) redemptions initiated by the Fund; and (3) a $10 service fee on each exchange after the first five exchanges in each calendar year.
The following ongoing costs are not included in the expenses shown in the table and, if applicable, would increase the expenses that you paid over the period: (1) a $12 low balance fee on accounts with balances of less than $250 as of September 30th of each calendar year and no investment activity (excluding reinvestment of dividends and/or capital gains) during the prior calendar year or the first nine months of the current calendar year. This fee does not apply to IRAs, qualified plan accounts, or Coverdell Education Savings Accounts; (2) a $15 annual custodial fee on IRAs, SEPs, SIMPLE IRAs, and Coverdell Education Savings Accounts; and (3) a $20 annual custodial fee on 403(b) accounts.
Hypothetical Example for Comparison Purposes
The second line of the table below provides information about hypothetical account values and hypothetical expenses based on the Fund's actual expense ratio and an assumed rate of return of 5% per year before expenses, which in not the Fund's actual return. The hypothetical account values and expenses may not be used to estimate the actual ending account balance or expenses you paid for the period. You may use this information to compare the ongoing costs of investing in the Fund and other funds. To do so, compare this 5% hypothetical example with the 5% hypothetical examples that appear in the shareholder reports of the other funds.
The following transaction costs are not included in the expenses shown in the table and, if applicable, would increase the expenses that you paid over the period: (1) a front-end sales charge (load) of 5.75% on Class A shares; (2) a 2% redemption fee if you sell or exchange shares within 180 days of purchase, with certain exceptions. The redemption fee does not apply to: (a) redemptions under an automatic withdrawal program or periodic asset reallocation plan, required minimum distributions (RMD), employer mandated distributions from a qualified plan, or redemptions under a qualified domestic relations order (QDRO); (b) redemptions to pay for expenses related to terminal illness, extended hospital or nursing home care, or other serious medical conditions, including death; (c) redemptions of shares acquired through dividend or capital gains reinvestments; (d) loans from a qualified plan account, and (e) redemptions initiated by the Fund; and (3) a $10 service fee on each exchange after the first five exchanges in each calendar year.
The following ongoing costs are not included in the expenses shown in the table and, if applicable, would increase the expenses that you paid over the period: (1) a $12 low balance fee on accounts with balances of less than $250 as of September 30th of each calendar year and no investment activity (excluding reinvestment of dividends and/or capital gains) during the prior calendar year or the first nine months of the current calendar year. This fee does not apply to IRAs, qualified plan accounts, or Coverdell Education Savings Accounts; (2) a $15 annual custodial fee on IRAs, SEPs, SIMPLE IRAs, and Coverdell Education Savings Accounts; and (3) a $20 annual custodial fee on 403(b) accounts.
Please note that the expenses shown in the table are meant to highlight your ongoing costs only and do not reflect any transactional costs, such as sales charges (loads), redemption fees, or exchange fees. Therefore, the second line of the table is useful in comparing ongoing costs only, and will not help you determine the relative total costs of owning different funds. In addition, if these transactional costs were included, your costs would have been higher.
|
Beginning Account Value 01/01/16 |
Ending Account Value 06/30/16 |
Expense Paid During Period 01/01/16 – 06/30/16 |
|||||||||||||
|
Mid Cap Value Fund Class A |
|||||||||||||||
|
Actual |
$ |
1,000.00 |
$ |
983.50 |
$ |
24.41 |
|||||||||
|
Hypothetical (5% return before expense) |
$ |
1,000.00 |
$ |
1,000.25 |
$ |
24.62 |
|||||||||
|
Mid Cap Value Fund Class C |
|||||||||||||||
|
Actual |
$ |
1,000.00 |
$ |
980.30 |
$ |
27.97 |
|||||||||
|
Hypothetical (5% return before expense) |
$ |
1,000.00 |
$ |
996.62 |
$ |
28.20 |
|||||||||
3 Expenses are equal to the Fund's annualized expense ratio of 4.95% for Class A shares and 5.68% for Class C shares, multiplied by the average account value over the period, multiplied by 182/366 days to reflect the one-half year period.
19
Pacific Advisors
Small Cap Value Fund
Fund Objective: Capital appreciation through investment in small cap companies.
Investment Invests at least 80% of its assets in small cap companies which are, at the time of
Strategy: purchase, not greater than the highest market capitalization of companies within the Russell 2000® Index1. Generally invests a significant proportion of its assets in companies with market capitalizations that are, at the time of purchase, not greater than the highest market capitalization of companies in the Russell Microcap® Index1 (which are often referred to as "micro-cap" stocks).
Investor Profile: Aggressive. Opportunity-oriented with a long-term investment horizon.
Please see the Chairman's Letter for a detailed market and economic review
as well as the Manager's general market outlook.
Portfolio Holdings (As of 06/30/16 based on total investments)

|
Equities |
100.00 |
% |
|||||||||
| 1. |
Industrials |
48.12 |
% |
||||||||
| 2. |
Energy |
19.92 |
% |
||||||||
| 3. |
Consumer Discretionary |
17.06 |
% |
||||||||
| 4. |
Financials |
7.71 |
% |
||||||||
| 5. |
Consumer Staples |
7.19 |
% |
||||||||
| Total Returns (For the six months ended 06/30/16) | |||||||
|
Class A |
–5.22 |
% |
|||||
|
Class C |
–5.58 |
% |
|||||
|
Class I |
–5.15 |
% |
|||||
|
|
|||||||
|
Russell 2000® Index |
2.22 |
% |
|||||
Current expense ratio: 4.26% (A); 5.03% (C); 4.06% (I). Prospectus expense ratio: 3.03% (A); 3.88% (C); 2.86% (I).2
Performance quoted is past performance which does not guarantee future results. Current performance may be higher or lower than the performance quoted. Call (800) 989-6693 for performance current to the most recent month-end. The investment return and principal value of an investment will fluctuate so that an investor's shares, when redeemed, may be worth more or less than their original cost. Returns represent the change in value over the stated period assuming reinvestment of dividends and capital gains at net asset value. Rankings shown are for Class A shares; rankings for other share classes may be different. Returns and rankings do not take into account the maximum 5.75% sales charge on Class A shares or the 1% Contingent Deferred Sales Charge (CDSC) for Class C shares sold within one year of purchase. Returns would be lower if the applicable sales charge and CDSC were included. Returns do not take into account individual taxes which may reduce actual returns when shares are sold. Small cap companies typically have fewer financial resources and may carry higher investment risks and experience greater stock price volatility than larger stocks.
1 The Russell 2000® Index is an unmanaged, market-weighted measure of the 2,000 smallest companies of the Russell 3000® Index which represents approximately 98% of the investable U.S. equity market. Index returns assume the reinvestment of dividends, but, unlike the Fund's returns, do not reflect management fees or expenses. The Russell Microcap® Index is an unmanaged, market capitalization weighted measure of the 1,000 smallest publicly traded companies within the Russell 2000® Index, plus the next smallest 1,000 U.S. based listed stocksIt is not possible to invest directly in either Index.
2 "Current" expense ratio is annualized for the year-to-date as of 06/30/16. "Prospectus" expense ratio is for the fiscal year ended 12/31/15.
20
Discussion with Portfolio Manager August 22, 2016
George A. Henning
Fund Strategy
The Fund employs a value-oriented approach to identify when high-quality, well-managed companies with attractive growth outlooks become undervalued. Periods of heightened market volatility often create opportunities to strategically invest in these companies for long-term appreciation. The Fund takes a business ownership view in seeking to identify stocks that are undervalued or temporarily out-of-favor and have a catalyst for multi-year growth. The Fund focuses on a limited number of small cap stocks (typically 30 to 50 holdings), including a significant number of micro-cap stocks which tend to attract limited analyst attention. Investing in small and micro-cap stocks may contribute to above-average volatility; yet, smaller, well-positioned companies can provide superior long-term results. Partly due to the strategic allocation to undervalued micro-cap stocks, the Fund's one-year beta1 was 1.29, as of June 30th, in comparison to the Russell 2000® Index.
Fund Performance
Fund holdings are heavily weighted towards areas associated with economic growth; over 80% of holdings are in industrial, specialty retail, automotive and energy companies. In contrast, over 65% of the benchmark is represented by financial, health care, utilities and other, typically more conservative stocks.
Class A shares fell 5.22%; in comparison, the Fund's benchmark, the Russell 2000® Index, gained 2.22%. Small cap stocks were unusually volatile during the first half of 2016 as global economic headlines dominated investor sentiment. Early in the year, fears of slowing growth in China, the prospect of further Federal Reserve rate hikes, and falling oil prices contributed to a sharp selloff. Through the first six weeks of the year, the Fund declined more than 23%. Then, as oil prices began to rise, the Fund gained more than 42% during the impressive relief rally over the next two and a half months. Confidence faded, though, as concerns about interest rate hikes and the uncertainties over the pending Brexit vote prompted a retreat to "safe haven" assets. The Fund declined 10.40% over the period's final two months. The extraordinary moves underscore the market's focus on global events rather than on the often-overlooked operating results of individual companies.
What Helped/Hurt Performance2
The Fund's top contributors to returns were North American Energy Partners, Insteel Industries, and Darling Ingredients. Mining contractor North American Energy Partners surged 65% as earnings results significantly exceeded analysts' expectations. Activities in support of the Canadian oil sands continue to face steep challenges; yet, the company's debt restructuring and cost reductions led to significantly increased profits. Insteel Industries, a manufacturer of steel wire reinforcing products, gained 37% as favorable construction condition, and low raw materials costs, led to significantly higher year-over-year earnings. Also, its improved financial condition (no borrowings as of quarter-end) positions the company to "pursue additional growth opportunities." Shares of Darling Ingredients, which produces sustainable natural ingredients for pharmaceutical, animal feed, pet food and bioenergy industries, among others, rose 42% on positive earnings and higher commodity prices. Also, the company's biodiesel plant, a joint-venture with Valero Energy Corporation, should deliver significant profits even at current oil prices.
The Fund's most significant detractors to returns were Conn's, DXP Enterprises, and Gentherm. Specialty retailer Conn's underperformed due to persistent concerns over slowing sales growth while the company transitions to tighter credit standards. Yet, higher credit quality should lead to improved overall
1 "Beta" measures volatility relative to the stock market or an alternative benchmark. A beta less than 1.0 indicates lower risk than the market or the benchmark and a beta greater than 1.0 indicates higher risk than the market or the benchmark.
2 For detailed information on Fund holdings, please see the Fund's Schedule of Investments in this Report.
21
Pacific Advisors
Small Cap Value Fund continued
corporate profitability; the upcoming debt securitization could confirm the trend and overcome the market's pessimism. Parts and services distributor DXP Enterprises fell as disappointing earnings results underscored the ongoing challenges facing its energy and industrial customers. The company's aggressive efforts to cut costs and increased market share, though, set the stage for better profitability; following the quarter-end, the stock soared after the company reported per share earnings of $0.34 to reverse losses of $0.35 the prior quarter. Auto parts supplier Gentherm fell 28% on concerns of slowing global economic growth. The company has recently diversified into healthcare and industrial testing services; revenues from its new battery thermal management products for hybrid-electric vehicles should begin in the fourth quarter.
The Fund's Energy and energy-related Industrials holdings experienced significant volatility even though the outlook improved as oil prices rose to near $50 per barrel. The dramatic price changes of energy-related companies belie the sector's improving fundamental outlook. In June, the International Energy Agency, citing increased manufacturing activity in emerging economies and higher consumption in developed countries, raised its forecast for oil demand growth in 2016 and 2017. Supply, on the other hand, has fallen due to disruptions in Venezuela, Canada, Libya, and Nigeria. Other factors, including the natural depletion rates of existing wells and the significant curtailment of new projects, point to growing supply constraints. For these reasons, we believe that oil prices will likely increase over the next several years. And yet, several of the Fund's energy-related holdings continue to trade at prices far below tangible book value, a conservative estimate of a company's net assets; therefore, at current prices, we believe that Fund holdings remain significantly undervalued.
During the period, the Fund trimmed holdings in Darling Ingredients, Insteel Industries, and Saia as these stocks approached our internal targets. Also, following the merger of Fund holdings Team and Furmanite, we trimmed the resulting position in line with our allocation target.
Looking Ahead
Improving economic data, including strong jobs reports and evidence of improving supply/demand balance in oil prices, suggest that the second half of the year should favor growth-oriented stocks. For example, pent-up demand for industrial maintenance and support services should improve the outlook for energy-related companies. And, higher crude prices would also provide a much-needed boost to global economic growth. U.S. producers have begun to reactivate shale projects while major oil companies may soon restart drilling programs in order to replenish depleting reserves. These activities will extend beyond the Energy industry to areas including transportation, manufacturing, and construction. We anticipate that investors will increasingly recognize the opportunities, as the economy gains momentum, to rotate out of "safe haven" investments to undervalued stocks that offer significant appreciation potential. This outlook supports the Fund's significant appreciation potential as the global outlook improves.
22
Expense Examples
As a shareholder of the Fund you incur two types of costs: (1) transaction costs, including sales charges (loads) on purchase payments, reinvested dividends, or other distributions; redemption fees; and exchange fees; and (2) ongoing costs, including management fees; distribution (12b-1) fees; and other Fund expenses. This Example is intended to help you understand your ongoing costs (in dollars) of investing in the Fund and to compare these costs with the ongoing costs of investing in other mutual funds.
The Example is based on an investment of $1,000 invested at the beginning of the period and held for the entire period from January 1, 2016 through June 30, 2016.
Actual Expenses
The first line of the table below provides information about actual account values and actual expenses. You may use the information in this line, together with the amount you invested, to estimate the expenses that you paid over the period. Simply divide your account value by $1,000 (for example, an $8,600 account value divided by $1,000 = 8.6), then multiply the result by the number in the first line under the heading entitled "Expenses Paid During the Period" to estimate the expenses you paid on your account during the period.
The following transaction costs are not included in the expenses shown in the table and, if applicable, would increase the expenses that you paid over the period: (1) a front-end sales charge (load) of 5.75% on Class A shares; (2) a 2% redemption fee if you sell or exchange shares within 180 days of purchase, with certain exceptions. The redemption fee does not apply to: (a) redemptions under an automatic withdrawal program or periodic asset reallocation plan, required minimum distributions (RMD), employer mandated distributions from a qualified plan, or redemptions under a qualified domestic relations order (QDRO); (b) redemptions to pay for expenses related to terminal illness, extended hospital or nursing home care, or other serious medical conditions, including death; (c) redemptions of shares acquired through dividend or capital gains reinvestments; (d) loans from a qualified plan account, and (e) redemptions initiated by the Fund; and (3) a $10 service fee on each exchange after the first five exchanges in each calendar year.
The following ongoing costs are not included in the expenses shown in the table and, if applicable, would increase the expenses that you paid over the period: (1) a $12 low balance fee on accounts with balances of less than $250 as of September 30th of each calendar year and no investment activity (excluding reinvestment of dividends and/or capital gains) during the prior calendar year or the first nine months of the current calendar year. This fee does not apply to IRAs, qualified plan accounts, or Coverdell Education Savings Accounts; (2) a $15 annual custodial fee on IRAs, SEPs, SIMPLE IRAs, and Coverdell Education Savings Accounts; and (3) a $20 annual custodial fee on 403(b) accounts.
Hypothetical Example for Comparison Purposes
The second line of the table below provides information about hypothetical account values and hypothetical expenses based on the Fund's actual expense ratio and an assumed rate of return of 5% per year before expenses, which in not the Fund's actual return. The hypothetical account values and expenses may not be used to estimate the actual ending account balance or expenses you paid for the period. You may use this information to compare the ongoing costs of investing in the Fund and other funds. To do so, compare this 5% hypothetical example with the 5% hypothetical examples that appear in the shareholder reports of the other funds.
The following transaction costs are not included in the expenses shown in the table and, if applicable, would increase the expenses that you paid over the period: (1) a front-end sales charge (load) of 5.75% on Class A shares; (2) a 2% redemption fee if you sell or exchange shares within 180 days of purchase, with certain exceptions. The redemption fee does not apply to: (a) redemptions under an automatic withdrawal program or periodic asset reallocation plan, required minimum distributions (RMD), employer mandated distributions from a qualified plan, or redemptions under a qualified domestic relations order (QDRO); (b) redemptions to pay for expenses related to terminal illness, death, extended hospital or nursing home care, or other serious medical conditions; (c) redemptions of shares acquired through dividend or capital gains reinvestments; (d) loans from a qualified plan account; and (e) redemptions initiated by the Fund; and (3) a $10 service fee on each exchange after the first five exchanges in each calendar year.
The following ongoing costs are not included in the expenses shown in the table and, if applicable, would increase the expenses that you paid over the period: (1) a $12 low balance fee on accounts with balances of less than $250 as of September 30th of each calendar year and no investment activity (excluding reinvestment of dividends and/or capital gains) during the prior calendar year or the first nine months of the current calendar year. This fee does not apply to IRAs, qualified plan accounts, or Coverdell Education Savings Accounts; (2) a $15 annual custodial fee on IRAs, SEPs, SIMPLE IRAs, and Coverdell Education Savings Accounts; and (3) a $20 annual custodial fee on 403(b) accounts.
Please note that the expenses shown in the table are meant to highlight your ongoing costs only and do not reflect any transactional costs, such as sales charges (loads), redemption fees, or exchange fees. Therefore, the second line of the table is useful in comparing ongoing costs only, and will not help you determine the relative total costs of owning different funds. In addition, if these transactional costs were included, your costs would have been higher.
|
Beginning Account Value 01/01/16 |
Ending Account Value 06/30/16 |
Expense Paid During Period 01/01/16 – 06/30/16 |
|||||||||||||
|
Small Cap Value Class A |
|||||||||||||||
|
Actual |
$ |
1,000.00 |
$ |
947.80 |
$ |
20.63 |
|||||||||
|
Hypothetical (5% return before expense) |
$ |
1,000.00 |
$ |
1,003.68 |
$ |
21.22 |
|||||||||
|
Small Cap Value Class C |
|||||||||||||||
|
Actual |
$ |
1,000.00 |
$ |
944.20 |
$ |
24.31 |
|||||||||
|
Hypothetical (5% return before expense) |
$ |
1,000.00 |
$ |
999.85 |
$ |
25.01 |
|||||||||
|
Small Cap Value Class I |
|||||||||||||||
|
Actual |
$ |
1,000.00 |
$ |
948.50 |
$ |
19.67 |
|||||||||
|
Hypothetical (5% return before expense) |
$ |
1,000.00 |
$ |
1,004.67 |
$ |
20.24 |
|||||||||
3 Expenses are equal to the Fund's annualized expense ratio of 4.26% for Class A shares, 5.03% for Class C shares and 4.06% for Class I shares, multiplied by the average account value over the period, multiplied by 182/366 days to reflect the one-half year period.
23

Pacific Advisors Fund Inc.
Financial Statements
24
Pacific Advisors Income & Equity Fund
Schedule of Investments (Unaudited)
as of June 30, 2016
|
Quantity or Principal** |
Description |
Current $ Value** |
% of Total Net Assets |
||||||||||||
|
COMMON STOCK |
|||||||||||||||
|
CONSUMER DISCRETIONARY |
4.99 | ||||||||||||||
|
DISTRIBUTORS |
|||||||||||||||
|
1,750 |
GENUINE PARTS CO. |
177,187 |
|||||||||||||
|
177,187 |
1.08 |
||||||||||||||
|
LEISURE PRODUCTS |
|||||||||||||||
|
7,000 |
MATTEL INC. |
219,030 |
|||||||||||||
|
219,030 |
1.34 |
||||||||||||||
|
MEDIA |
|||||||||||||||
|
3,000 |
OMNICOM GROUP INC. |
244,470 |
|||||||||||||
|
244,470 |
1.50 |
||||||||||||||
|
MULTILINE RETAIL |
|||||||||||||||
|
2,500 |
TARGET CORP. |
174,550 |
|||||||||||||
|
174,550 |
1.07 |
||||||||||||||
|
CONSUMER STAPLES |
8.02 | ||||||||||||||
|
BEVERAGES |
|||||||||||||||
|
4,500 |
COCA-COLA CO. |
203,985 |
|||||||||||||
|
203,985 |
1.25 |
||||||||||||||
|
FOOD & STAPLES RETAILING |
|||||||||||||||
|
2,400 |
CVS HEALTH CORP. |
229,776 |
|||||||||||||
|
5,000 |
SYSCO CORP. |
253,700 |
|||||||||||||
|
5,600 |
THE KROGER CO. |
206,024 |
|||||||||||||
|
3,500 |
WAL-MART STORES INC. |
255,570 |
|||||||||||||
|
945,070 |
5.78 |
||||||||||||||
|
HOUSEHOLD PRODUCTS |
|||||||||||||||
|
1,900 |
PROCTER & GAMBLE CO. |
160,873 |
|||||||||||||
|
160,873 |
0.98 |
||||||||||||||
|
ENERGY |
2.25 | ||||||||||||||
|
ENERGY EQUIPMENT & SERVICES |
|||||||||||||||
|
3,000 |
SCHLUMBERGER LTD |
237,240 |
|||||||||||||
|
237,240 |
1.45 |
||||||||||||||
|
OIL, GAS & CONSUMABLE FUELS |
|||||||||||||||
|
3,000 |
CONOCOPHILLIPS |
130,800 |
|||||||||||||
|
130,800 |
0.80 |
||||||||||||||
See Accompanying Notes to Financial Statements which are an integral part of these financial statements.
25
Pacific Advisors Income & Equity Fund
Schedule of Investments (Unaudited)
as of June 30, 2016
|
Quantity or Principal** |
Description |
Current $ Value** |
% of Total Net Assets |
||||||||||||
|
COMMON STOCK continued |
|||||||||||||||
|
FINANCIALS |
2.55 | ||||||||||||||
|
BANKS |
|||||||||||||||
|
5,000 |
WELLS FARGO & CO. |
236,650 |
|||||||||||||
|
236,650 |
1.45 |
||||||||||||||
|
INSURANCE |
|||||||||||||||
|
4,500 |
METLIFE INC. |
179,235 |
|||||||||||||
|
179,235 |
1.10 |
||||||||||||||
|
HEALTH CARE |
4.73 | ||||||||||||||
|
BIOTECHNOLOGY |
|||||||||||||||
|
4,000 |
ABBVIE INC. |
247,640 |
|||||||||||||
|
247,640 |
1.52 |
||||||||||||||
|
PHARMACEUTICALS |
|||||||||||||||
|
2,000 |
JOHNSON & JOHNSON |
242,600 |
|||||||||||||
|
8,000 |
PFIZER INC. |
281,680 |
|||||||||||||
|
524,280 |
3.21 |
||||||||||||||
|
INDUSTRIALS |
7.50 | ||||||||||||||
|
AEROSPACE & DEFENSE |
|||||||||||||||
|
2,000 |
HONEYWELL INT'L INC. |
232,640 |
|||||||||||||
|
232,640 |
1.42 |
||||||||||||||
|
AIR FREIGHT & LOGISTICS |
|||||||||||||||
|
2,250 |
UNITED PARCEL SERVICE INC. B |
242,370 |
|||||||||||||
|
242,370 |
1.48 |
||||||||||||||
|
COMMERCIAL SERVICES & SUPPLIES |
|||||||||||||||
|
3,500 |
WASTE MANAGEMENT INC. |
231,945 |
|||||||||||||
|
231,945 |
1.42 |
||||||||||||||
|
INDUSTRIAL CONGLOMERATES |
|||||||||||||||
|
8,000 |
GENERAL ELECTRIC CO. |
251,840 |
|||||||||||||
|
251,840 |
1.54 |
||||||||||||||
|
TRADING COMPANIES & DISTRIBUTORS |
|||||||||||||||
|
6,000 |
FASTENAL COMPANY |
266,340 |
|||||||||||||
|
266,340 |
1.63 |
||||||||||||||
|
INFORMATION TECHNOLOGY |
4.30 | ||||||||||||||
|
COMMUNICATIONS EQUIPMENT |
|||||||||||||||
|
8,000 |
CISCO SYSTEMS INC. |
229,520 |
|||||||||||||
|
229,520 |
1.40 |
||||||||||||||
See Accompanying Notes to Financial Statements which are an integral part of these financial statements.
26
Pacific Advisors Income & Equity Fund
Schedule of Investments (Unaudited)
as of June 30, 2016
|
Quantity or Principal** |
Description |
Current $ Value** |
% of Total Net Assets |
||||||||||||
|
COMMON STOCK continued |
|||||||||||||||
|
SEMICONDUCTORS & SEMICONDUCTOR EQUIPMENT |
|||||||||||||||
|
7,000 |
INTEL CORP. |
229,600 |
|||||||||||||
|
229,600 |
1.41 |
||||||||||||||
|
SOFTWARE |
|||||||||||||||
|
4,750 |
MICROSOFT CORP. |
243,058 |
|||||||||||||
|
243,058 |
1.49 |
||||||||||||||
|
MATERIALS |
2.62 | ||||||||||||||
|
CHEMICALS |
|||||||||||||||
|
3,000 |
DUPONT DE NEMOURS & CO. |
194,400 |
|||||||||||||
|
194,400 |
1.19 |
||||||||||||||
|
PAPER PACKAGE |
|||||||||||||||
|
5,500 |
INTERNATIONAL PAPER COMPANY |
233,090 |
|||||||||||||
|
233,090 |
1.43 |
||||||||||||||
|
TELECOMMUNICATION SERVICES |
3.23 | ||||||||||||||
|
DIVERSIFIED TELECOMMUNICATION SERVICES |
|||||||||||||||
|
6,000 |
AT&T INC. |
259,260 |
|||||||||||||
|
4,815 |
VERIZON COMMUNICATIONS INC. |
268,870 |
|||||||||||||
|
528,130 |
3.23 |
||||||||||||||
|
UTILITIES |
4.37 | ||||||||||||||
|
ELECTRIC UTILITIES |
|||||||||||||||
|
2,500 |
DUKE ENERGY CORP. |
214,475 |
|||||||||||||
|
3,500 |
XCEL ENERGY INC. |
156,730 |
|||||||||||||
|
371,205 |
2.27 |
||||||||||||||
|
MULTI-UTILITIES |
|||||||||||||||
|
2,000 |
DOMINION RESOURCES INC. |
155,860 |
|||||||||||||
|
4,000 |
PUBLIC SERVICE ENTERPRISE GROUP INC. |
186,440 |
|||||||||||||
|
342,300 |
2.10 |
||||||||||||||
|
TOTAL COMMON STOCK (Cost: $5,272,197) |
7,277,448 |
44.55 |
|||||||||||||
|
CORPORATE BOND |
|||||||||||||||
|
CONSUMER DISCRETIONARY |
6.05 | ||||||||||||||
|
AUTOMOBILES |
|||||||||||||||
|
130,000 |
GENERAL MOTORS FINL CO. 4.75% 08/15/17 |
134,139 |
|||||||||||||
|
134,139 |
0.82 |
||||||||||||||
|
DIVERSIFIED CONSUMER SERVICES |
|||||||||||||||
|
150,000 |
BLOCK FINANCIAL LLC 4.125% 10/01/20 |
154,510 |
|||||||||||||
|
154,510 |
0.95 |
||||||||||||||
See Accompanying Notes to Financial Statements which are an integral part of these financial statements.
27
Pacific Advisors Income & Equity Fund
Schedule of Investments (Unaudited)
as of June 30, 2016
|
Quantity or Principal** |
Description |
Current $ Value** |
% of Total Net Assets |
||||||||||||
|
CORPORATE BOND continued |
|||||||||||||||
|
HOTELS, RESTAURANTS & LEISURE |
|||||||||||||||
|
100,000 |
INTL GAME TECHNOLOGY 7.50% 06/15/19 |
110,750 |
|||||||||||||
|
100,000 |
WYNDHAM WORLDWIDE 2.95% 03/01/17 |
100,837 |
|||||||||||||
|
150,000 |
YUM! BRANDS INC. 5.30% 09/15/19 |
159,000 |
|||||||||||||
|
370,587 |
2.27 |
||||||||||||||
|
HOUSEHOLD DURABLES |
|||||||||||||||
|
150,000 |
TUPPERWARE BRANDS CORP. 4.75% 06/01/21 |
161,345 |
|||||||||||||
|
161,345 |
0.99 |
||||||||||||||
|
INTERNET & CATALOG RETAIL |
|||||||||||||||
|
150,000 |
EXPEDIA INC. 5.95% 08/15/20 |
167,785 |
|||||||||||||
|
167,785 |
1.03 |
||||||||||||||
|
CONSUMER STAPLES |
0.97 | ||||||||||||||
|
FOOD & STAPLES RETAILING |
|||||||||||||||
|
150,000 |
DELHAIZE GROUP SA 4.125% 04/10/19 |
158,628 |
|||||||||||||
|
158,628 |
0.97 |
||||||||||||||
|
ENERGY |
4.69 | ||||||||||||||
|
ENERGY EQUIPMENT & SERVICES |
|||||||||||||||
|
100,000 |
PRIDE INTERNATIONAL INC. 6.875% 08/15/20 |
95,440 |
|||||||||||||
|
150,000 |
ROWAN COMPANY INC. 7.875% 08/01/19 |
154,500 |
|||||||||||||
|
150,000 |
SESI LLC 6.375% 05/01/19 |
144,375 |
|||||||||||||
|
100,000 |
WEATHERFORD BERMUDA 6.00% 03/15/18 |
105,000 |
|||||||||||||
|
499,315 |
3.06 |
||||||||||||||
|
OIL, GAS & CONSUMABLE FUELS |
|||||||||||||||
|
150,000 |
CONTINENTAL RESOURCES 7.375% 10/01/20 |
154,500 |
|||||||||||||
|
100,000 |
ENERGY TRANSFER PARTNERS 9.00% 04/15/19 |
111,785 |
|||||||||||||
|
266,285 |
1.63 |
||||||||||||||
|
FINANCIALS |
13.52 | ||||||||||||||
|
BANKS |
|||||||||||||||
|
100,000 |
BANK OF AMERICA CORP. 3.353% 03/19/20 FLOAT |
96,500 |
|||||||||||||
|
100,000 |
BANK OF AMERICA CORP. 2.384% 09/28/20 FLOAT |
100,299 |
|||||||||||||
|
125,000 |
JPMORGAN CHASE & CO. 3.125% 02/25/21 FLOAT |
128,538 |
|||||||||||||
|
150,000 |
SUNTRUST BANKS INC. 1.654% 11/22/16 FLOAT |
150,566 |
|||||||||||||
|
475,903 |
2.91 |
||||||||||||||
See Accompanying Notes to Financial Statements which are an integral part of these financial statements.
28
Pacific Advisors Income & Equity Fund
Schedule of Investments (Unaudited)
as of June 30, 2016
|
Quantity or Principal** |
Description |
Current $ Value** |
% of Total Net Assets |
||||||||||||
|
CORPORATE BOND continued |
|||||||||||||||
|
CAPITAL MARKETS |
|||||||||||||||
|
150,000 |
ARES CAPITAL CORP. 4.875% 11/30/18 |
156,945 |
|||||||||||||
|
100,000 |
FIFTH STREET FINANCE CORP. 4.875% 03/01/19 |
98,737 |
|||||||||||||
|
100,000 |
GOLDMAN SACHS GROUP INC. 2.065% 08/26/20 FLOAT |
99,925 |
|||||||||||||
|
100,000 |
JEFFERIES GROUP INC. 5.125% 04/13/18 |
104,595 |
|||||||||||||
|
100,000 |
MORGAN STANLEY 2.853% 04/25/23 FLOAT |
98,250 |
|||||||||||||
|
100,000 |
MORGAN STANLEY 3.50% 09/30/17 FLOAT |
101,437 |
|||||||||||||
|
100,000 |
MORGAN STANLEY 4.50% 10/27/18 FLOAT |
106,500 |
|||||||||||||
|
100,000 |
PROSPECT CAPITAL CORP. 5.00% 07/15/19 |
99,286 |
|||||||||||||
|
150,000 |
STIFEL FINANCIAL CORP. 3.50% 12/01/20 |
152,040 |
|||||||||||||
|
1,017,714 |
6.23 |
||||||||||||||
|
DIVERSIFIED FINANCIAL SERVICES |
|||||||||||||||
|
100,000 |
ICAHN ENTERPRISES 6.00% 08/01/20 |
98,750 |
|||||||||||||
|
100,000 |
NASDAQ OMX GROUP 5.55% 01/15/20 |
110,612 |
|||||||||||||
|
209,362 |
1.28 |
||||||||||||||
|
INSURANCE |
|||||||||||||||
|
100,000 |
PRUDENTIAL FINANCIAL INC. 2.853% 11/02/20 FLOAT |
99,000 |
|||||||||||||
|
99,000 |
0.61 |
||||||||||||||
|
REAL ESTATE INVESTMENT TRUSTS |
|||||||||||||||
|
105,000 |
HOSPITALITY PROP TRUST 6.70% 01/15/18 |
109,963 |
|||||||||||||
|
125,000 |
MACK-CALI REALTY LP 7.75% 08/15/19 |
141,094 |
|||||||||||||
|
251,057 |
1.54 |
||||||||||||||
|
REAL ESTATE MGMT. & DEVELOPMENT |
|||||||||||||||
|
150,000 |
CBRE SERVICES INC. 5.00% 03/15/23 |
155,292 |
|||||||||||||
|
155,292 |
0.95 |
||||||||||||||
|
HEALTH CARE |
1.52 | ||||||||||||||
|
PHARMACEUTICALS |
|||||||||||||||
|
110,000 |
PFIZER INC. 6.05% 03/30/17 |
114,216 |
|||||||||||||
|
130,000 |
ZOETIS INC. 3.45% 11/13/20 |
134,209 |
|||||||||||||
|
248,425 |
1.52 |
||||||||||||||
|
INDUSTRIALS |
6.89 | ||||||||||||||
|
AEROSPACE & DEFENSE |
|||||||||||||||
|
150,000 |
L-3 COMMUNICATIONS CORP. 5.20% 10/15/19 |
163,313 |
|||||||||||||
|
163,313 |
1.00 |
||||||||||||||
|
BUILDING PRODUCTS |
|||||||||||||||
|
115,000 |
OWENS CORNING INC. 9.00% 06/15/19 |
133,208 |
|||||||||||||
|
133,208 |
0.82 |
||||||||||||||
See Accompanying Notes to Financial Statements which are an integral part of these financial statements.
29
Pacific Advisors Income & Equity Fund
Schedule of Investments (Unaudited)
as of June 30, 2016
|
Quantity or Principal** |
Description |
Current $ Value** |
% of Total Net Assets |
||||||||||||
|
CORPORATE BOND continued |
|||||||||||||||
|
MACHINERY |
|||||||||||||||
|
150,000 |
AGCO CORP. 5.875% 12/01/21 |
162,794 |
|||||||||||||
|
100,000 |
HARSCO CORP. 5.75% 05/15/18 |
94,250 |
|||||||||||||
|
150,000 |
HILLENBRAND INC. 5.50% 07/15/20 |
165,604 |
|||||||||||||
|
422,648 |
2.59 |
||||||||||||||
|
PROFESSIONAL SERVICES |
|||||||||||||||
|
150,000 |
DUN & BRADSTREET CORP. 4.00% 06/15/20 |
155,771 |
|||||||||||||
|
155,771 |
0.95 |
||||||||||||||
|
TRADING COMPANIES & DISTRIBUTORS |
|||||||||||||||
|
100,000 |
AIR LEASE CORP. 5.625% 04/01/17 |
102,125 |
|||||||||||||
|
150,000 |
GATX CORP 2.60% 03/30/20 |
149,083 |
|||||||||||||
|
251,208 |
1.54 |
||||||||||||||
|
INFORMATION TECHNOLOGY |
5.73 | ||||||||||||||
|
SEMICONDUCTORS |
|||||||||||||||
|
150,000 |
QUALCOMM INC. 3.00% 05/20/22 |
158,296 |
|||||||||||||
|
158,296 |
0.97 |
||||||||||||||
|
ELECTRONIC EQUIPMENT, INSTRUMENTS & COMPONENTS |
|||||||||||||||
|
102,000 |
ARROW ELECTRONICS INC. 6.875% 06/01/18 |
110,022 |
|||||||||||||
|
100,000 |
INGRAM MICRO INC. 5.25% 09/01/17 |
102,775 |
|||||||||||||
|
100,000 |
JABIL CIRCUIT INC. 7.75% 07/15/16 |
100,100 |
|||||||||||||
|
150,000 |
KEYSIGHT TECHNOLOGIES 3.30% 10/30/19 |
152,324 |
|||||||||||||
|
465,221 |
2.85 |
||||||||||||||
|
IT SERVICES |
|||||||||||||||
|
150,000 |
FIDELITY NATIONAL INFORMATION 3.625% 10/15/20 |
158,568 |
|||||||||||||
|
158,568 |
0.97 |
||||||||||||||
|
TECHNOLOGY HARDWARE, STORAGE & PERIPHERALS |
|||||||||||||||
|
145,000 |
LEXMARK INT'L INC. 6.65% 06/01/18 |
154,313 |
|||||||||||||
|
154,313 |
0.94 |
||||||||||||||
|
MATERIALS |
3.89 | ||||||||||||||
|
CHEMICALS |
|||||||||||||||
|
112,000 |
CF INDUSTRIES INC. 6.875% 05/01/18 |
121,686 |
|||||||||||||
|
121,686 |
0.74 |
||||||||||||||
See Accompanying Notes to Financial Statements which are an integral part of these financial statements.
30
Pacific Advisors Income & Equity Fund
Schedule of Investments (Unaudited)
as of June 30, 2016
|
Quantity or Principal** |
Description |
Current $ Value** |
% of Total Net Assets |
||||||||||||
|
CORPORATE BOND continued |
|||||||||||||||
|
METALS & MINING |
|||||||||||||||
|
100,000 |
ALCOA INC. 5.55% 02/01/17 |
102,000 |
|||||||||||||
|
100,000 |
COMMERCIAL METALS CO. 7.35% 08/15/18 |
105,750 |
|||||||||||||
|
150,000 |
RELIANCE STEEL & ALUMINUM 6.20% 11/15/16 |
152,261 |
|||||||||||||
|
150,000 |
VALE OVERSEAS LIMITED 6.25% 01/23/17 |
153,435 |
|||||||||||||
|
513,446 |
3.14 |
||||||||||||||
|
TELECOMMUNICATION SERVICES |
0.79 | ||||||||||||||
|
DIVERSIFIED TELECOMMUNICATION SERVICES |
|||||||||||||||
|
125,000 |
QWEST CORP. 6.50% 06/01/17 |
129,531 |
|||||||||||||
|
129,531 |
0.79 |
||||||||||||||
|
UTILITIES |
0.92 | ||||||||||||||
|
ELECTRIC UTILITIES |
|||||||||||||||
|
49,000 |
CLEVELAND ELECTRIC ILLUMINATING 5.70% 04/01/17 |
50,513 |
|||||||||||||
|
100,000 |
PPL ENERGY SUPPLY LLC 6.50% 05/01/18 |
100,500 |
|||||||||||||
|
151,013 |
0.92 |
||||||||||||||
|
TOTAL CORPORATE BOND (Cost: $7,321,472) |
7,347,569 |
44.97 |
|||||||||||||
|
PREFERRED STOCK |
|||||||||||||||
|
FINANCIALS |
2.18 | ||||||||||||||
|
BANKS |
|||||||||||||||
|
100,000 |
JPMORGAN CHASE & CO. 5.30% PFD FIX-FLOAT |
99,625 |
|||||||||||||
|
150,000 |
WELLS FARGO & CO. 7.98% PFD FIX-FLOAT |
156,938 |
|||||||||||||
|
256,563 |
1.57 |
||||||||||||||
|
INSURANCE |
|||||||||||||||
|
100,000 |
METLIFE INC. 5.25% PFD FIX-FLOAT |
99,250 |
|||||||||||||
|
99,250 |
0.61 |
||||||||||||||
|
TOTAL PREFERRED STOCK (Cost: $357,736) |
355,813 |
2.18 |
|||||||||||||
|
TOTAL INVESTMENT IN SECURITIES (Cost: $12,951,405) |
14,980,830 |
91.70 |
|||||||||||||
|
CASH OR CASH EQUIVALENT |
1,448,050 |
8.86 |
|||||||||||||
|
OTHER ASSETS LESS LIABILITIES |
(92,034 |
) |
(0.56 |
) |
|||||||||||
|
TOTAL NET ASSETS |
16,336,846 |
100.00 |
|||||||||||||
* Non-income producing
** The principal amount is stated in U.S. dollars unless otherwise indicated.
See Accompanying Notes to Financial Statements which are an integral part of these financial statements.
31
Pacific Advisors Balanced Fund
Schedule of Investments (Unaudited)
as of June 30, 2016
|
Quantity or Principal** |
Description |
Current $ Value** |
% of Total Net Assets |
||||||||||||
|
COMMON STOCK |
|||||||||||||||
|
CONSUMER DISCRETIONARY |
12.23 | ||||||||||||||
|
AUTO COMPONENTS |
|||||||||||||||
|
4,400 |
GENTHERM INC.* |
150,700 |
|||||||||||||
|
150,700 |
2.41 |
||||||||||||||
|
MEDIA |
|||||||||||||||
|
1,400 |
WALT DISNEY CO. |
136,948 |
|||||||||||||
|
136,948 |
2.19 |
||||||||||||||
|
SPECIALTY RETAIL |
|||||||||||||||
|
7,000 |
CONN'S INC.* |
52,640 |
|||||||||||||
|
500 |
O'REILLY AUTOMOTIVE INC.* |
135,550 |
|||||||||||||
|
188,190 |
3.01 |
||||||||||||||
|
TEXTILES, APPAREL & LUXURY GOODS |
|||||||||||||||
|
2,500 |
NIKE INC. |
138,000 |
|||||||||||||
|
1,600 |
PVH CORP. |
150,768 |
|||||||||||||
|
288,768 |
4.62 |
||||||||||||||
|
CONSUMER STAPLES |
2.78 | ||||||||||||||
|
FOOD & STAPLES RETAILING |
|||||||||||||||
|
5,000 |
CHEFS' WAREHOUSE INC.* |
80,000 |
|||||||||||||
|
1,000 |
PRICESMART, INC. |
93,570 |
|||||||||||||
|
173,570 |
2.78 |
||||||||||||||
|
ENERGY |
6.66 | ||||||||||||||
|
ENERGY EQUIPMENT & SERVICES |
|||||||||||||||
|
1,000 |
CORE LABORATORIES N.V. |
123,890 |
|||||||||||||
|
11,000 |
HORNBECK OFFSHORE SERVICES INC.* |
91,740 |
|||||||||||||
|
4,000 |
NATIONAL OILWELL VARCO INC. |
134,600 |
|||||||||||||
|
8,000 |
NOBLE CORPORATION |
65,920 |
|||||||||||||
|
416,150 |
6.66 |
||||||||||||||
|
FINANCIALS |
8.25 | ||||||||||||||
|
BANKS |
|||||||||||||||
|
4,800 |
EAST WEST BANCORP INC. |
164,064 |
|||||||||||||
|
164,064 |
2.62 |
||||||||||||||
|
CAPITAL MARKETS |
|||||||||||||||
|
3,000 |
SEI INVESTMENTS COMPANY |
144,330 |
|||||||||||||
|
144,330 |
2.31 |
||||||||||||||
See Accompanying Notes to Financial Statements which are an integral part of these financial statements.
32
Pacific Advisors Balanced Fund
Schedule of Investments (Unaudited)
as of June 30, 2016
|
Quantity or Principal** |
Description |
Current $ Value** |
% of Total Net Assets |
||||||||||||
|
COMMON STOCK continued |
|||||||||||||||
|
DIVERSIFIED FINANCIAL SERVICES |
|||||||||||||||
|
700 |
FACTSET RESEARCH SYSTEMS INC. |
112,994 |
|||||||||||||
|
650 |
MARKETAXESS HOLDINGS INC. |
94,510 |
|||||||||||||
|
207,504 |
3.32 |
||||||||||||||
|
HEALTH CARE |
8.83 | ||||||||||||||
|
HEALTH CARE TECHNOLOGY |
|||||||||||||||
|
3,000 |
CERNER CORPORATION* |
175,800 |
|||||||||||||
|
700 |
HENRY SCHEIN INC.* |
123,760 |
|||||||||||||
|
1,500 |
IDEXX LABORATORIES, INC.* |
139,290 |
|||||||||||||
|
438,850 |
7.02 |
||||||||||||||
|
PHARMACEUTICALS |
|||||||||||||||
|
1,250 |
PERRIGO COMPANY PLC |
113,337 |
|||||||||||||
|
113,337 |
1.81 |
||||||||||||||
|
INDUSTRIALS |
19.25 | ||||||||||||||
|
AIRLINES |
|||||||||||||||
|
4,000 |
SPIRIT AIRLINES INC.* |
179,480 |
|||||||||||||
|
179,480 |
2.87 |
||||||||||||||
|
COMMERCIAL SERVICES & SUPPLIES |
|||||||||||||||
|
1,600 |
STERICYCLE, INC.* |
166,592 |
|||||||||||||
|
6,000 |
TEAM INC.* |
148,980 |
|||||||||||||
|
315,572 |
5.05 |
||||||||||||||
|
CONSTRUCTION & ENGINEERING |
|||||||||||||||
|
4,800 |
CHICAGO BRIDGE & IRON CO. N.V. |
166,224 |
|||||||||||||
|
166,224 |
2.66 |
||||||||||||||
|
MACHINERY |
|||||||||||||||
|
2,100 |
WABTEC CORP. |
147,483 |
|||||||||||||
|
147,483 |
2.36 |
||||||||||||||
|
PROFESSIONAL SERVICES |
|||||||||||||||
|
800 |
EQUIFAX INC. |
102,720 |
|||||||||||||
|
102,720 |
1.64 |
||||||||||||||
|
ROAD & RAIL |
|||||||||||||||
|
2,700 |
GENESEE & WYOMING INC.* |
159,165 |
|||||||||||||
|
159,165 |
2.55 |
||||||||||||||
See Accompanying Notes to Financial Statements which are an integral part of these financial statements.
33
Pacific Advisors Balanced Fund
Schedule of Investments (Unaudited)
as of June 30, 2016
|
Quantity or Principal** |
Description |
Current $ Value** |
% of Total Net Assets |
||||||||||||
|
COMMON STOCK continued |
|||||||||||||||
|
TRADING COMPANIES & DISTRIBUTORS |
|||||||||||||||
|
3,500 |
DXP ENTERPRISES INC.* |
52,255 |
|||||||||||||
|
6,000 |
TAL INT'L GROUP INC. |
80,460 |
|||||||||||||
|
132,715 |
2.12 |
||||||||||||||
|
INFORMATION TECHNOLOGY |
9.21 | ||||||||||||||
|
SEMICONDUCTORS |
|||||||||||||||
|
2,250 |
QUALCOMM INC. |
120,533 |
|||||||||||||
|
120,533 |
1.93 |
||||||||||||||
|
INTERNET SOFTWARE & SERVICES |
|||||||||||||||
|
250 |
ALPHABET INC.* |
175,883 |
|||||||||||||
|
2,000 |
SHUTTERSTOCK, INC.* |
91,600 |
|||||||||||||
|
267,483 |
4.28 |
||||||||||||||
|
IT SERVICES |
|||||||||||||||
|
1,000 |
ACCENTURE PLC |
113,290 |
|||||||||||||
|
1,000 |
VISA INC. |
74,170 |
|||||||||||||
|
187,460 |
3.00 |
||||||||||||||
|
TOTAL COMMON STOCK (Cost: $4,476,736) |
4,201,245 |
67.21 |
|||||||||||||
|
CORPORATE BOND |
|||||||||||||||
|
CONSUMER DISCRETIONARY |
1.73 | ||||||||||||||
|
DIVERSIFIED CONSUMER SERVICES |
|||||||||||||||
|
100,000 |
WASHINGTON POST CO. 7.25% 02/01/19 |
108,000 |
|||||||||||||
|
108,000 |
1.73 |
||||||||||||||
|
ENERGY |
9.81 | ||||||||||||||
|
ENERGY EQUIPMENT & SERVICES |
|||||||||||||||
|
100,000 |
PRIDE INTERNATIONAL INC. 8.50% 06/15/19 |
101,750 |
|||||||||||||
|
100,000 |
ROWAN COMPANY INC. 7.875% 08/01/19 |
103,000 |
|||||||||||||
|
100,000 |
SEACOR HOLDING 7.375% 10/01/19 |
97,500 |
|||||||||||||
|
100,000 |
SESI LLC 6.375% 05/01/19 |
96,250 |
|||||||||||||
|
398,500 |
6.38 |
||||||||||||||
|
OIL, GAS & CONSUMABLE FUELS |
|||||||||||||||
|
100,000 |
CONTINENTAL RESOURCES 7.375% 10/01/20 |
103,000 |
|||||||||||||
|
100,000 |
ENERGY TRANSFER PARTNERS 9.00% 04/15/19 |
111,786 |
|||||||||||||
|
214,786 |
3.44 |
||||||||||||||
|
FINANCIALS |
7.95 | ||||||||||||||
|
BANKS |
|||||||||||||||
|
100,000 |
BANK OF AMERICA CORP. 2.384% 07/28/17 FLOAT |
100,128 |
|||||||||||||
|
100,128 |
1.60 |
||||||||||||||
See Accompanying Notes to Financial Statements which are an integral part of these financial statements.
34
Pacific Advisors Balanced Fund
Schedule of Investments (Unaudited)
as of June 30, 2016
|
Quantity or Principal** |
Description |
Current $ Value** |
% of Total Net Assets |
||||||||||||
|
CORPORATE BOND continued |
|||||||||||||||
|
DIVERSIFIED FINANCIAL SERVICES |
|||||||||||||||
|
100,000 |
ICAHN ENTERPRISES 6.00% 08/01/20 |
98,750 |
|||||||||||||
|
50,000 |
NASDAQ OMX GROUP 5.25% 01/16/18 |
52,783 |
|||||||||||||
|
151,533 |
2.42 |
||||||||||||||
|
REAL ESTATE INVESTMENT TRUSTS |
|||||||||||||||
|
125,000 |
CORRECTIONS CORP. OF AMERICA 4.125% 04/01/20 |
128,594 |
|||||||||||||
|
100,000 |
EPR PROPERTIES 7.75% 07/15/20 |
116,590 |
|||||||||||||
|
245,184 |
3.92 |
||||||||||||||
|
HEALTH CARE |
1.67 | ||||||||||||||
|
HEALTH CARE PROVIDERS & SERVICES |
|||||||||||||||
|
100,000 |
FRESENIUS MED CARE US 6.875% 07/15/17 |
104,250 |
|||||||||||||
|
104,250 |
1.67 |
||||||||||||||
|
INDUSTRIALS |
4.95 | ||||||||||||||
|
MACHINERY |
|||||||||||||||
|
100,000 |
CASE NEW HOLLAND INC. 7.875% 12/01/17 |
107,500 |
|||||||||||||
|
107,500 |
1.72 |
||||||||||||||
|
TRADING COMPANIES & DISTRIBUTORS |
|||||||||||||||
|
100,000 |
AIRCASTLE 6.75% 04/15/17 |
103,000 |
|||||||||||||
|
95,000 |
INTL LEASE FINANCE CORP. 8.75% 03/15/17 |
99,180 |
|||||||||||||
|
202,180 |
3.23 |
||||||||||||||
|
INFORMATION TECHNOLOGY |
3.14 | ||||||||||||||
|
ELECTRONIC EQUIPMENT, INSTRUMENTS & COMPONENTS |
|||||||||||||||
|
100,000 |
JABIL CIRCUIT INC. 7.75% 07/15/16 |
100,100 |
|||||||||||||
|
100,100 |
1.60 |
||||||||||||||
|
INTERNET SOFTWARE & SERVICES |
|||||||||||||||
|
94,000 |
IAC/INTERACTIVECORP 4.875% 11/30/18 |
95,998 |
|||||||||||||
|
95,998 |
1.54 |
||||||||||||||
|
MATERIALS |
1.69 | ||||||||||||||
|
METALS & MINING |
|||||||||||||||
|
100,000 |
COMMERCIAL METALS CO. 7.35% 08/15/18 |
105,750 |
|||||||||||||
|
105,750 |
1.69 |
||||||||||||||
|
TOTAL CORPORATE BOND (Cost: $1,958,082) |
1,933,908 |
30.94 |
|||||||||||||
See Accompanying Notes to Financial Statements which are an integral part of these financial statements.
35
Pacific Advisors Balanced Fund
Schedule of Investments (Unaudited)
as of June 30, 2016
|
Quantity or Principal** |
Description |
Current $ Value** |
% of Total Net Assets |
||||||||||||
|
PREFERRED STOCK |
|||||||||||||||
|
FINANCIALS |
1.54 | ||||||||||||||
|
CAPITAL MARKETS |
|||||||||||||||
|
100,000 |
MORGAN STANLEY 5.45% PFD FIX-FLOAT |
96,000 |
|||||||||||||
|
96,000 |
1.54 |
||||||||||||||
|
TOTAL PREFERRED STOCK (Cost: $99,875) |
96,000 |
1.54 |
|||||||||||||
|
TOTAL INVESTMENT IN SECURITIES (Cost: $6,534,693) |
6,231,153 |
99.69 |
|||||||||||||
|
OTHER ASSETS LESS LIABILITIES |
19,468 |
0.31 |
|||||||||||||
|
TOTAL NET ASSETS |
6,250,621 |
100.00 |
|||||||||||||
* Non-income producing
** The principal amount is stated in U.S. dollars unless otherwise indicated.
See Accompanying Notes to Financial Statements which are an integral part of these financial statements.
36
Pacific Advisors Large Cap Value Fund
Schedule of Investments (Unaudited)
as of June 30, 2016
|
Quantity or Principal** |
Description |
Current $ Value** |
% of Total Net Assets |
||||||||||||
|
COMMON STOCK |
|||||||||||||||
|
CONSUMER DISCRETIONARY |
20.73 | ||||||||||||||
|
DIVERSIFIED CONSUMER SERVICES |
|||||||||||||||
|
5,000 |
HOUGHTON MIFFLIN HARCOURT COMPANY* |
78,150 |
|||||||||||||
|
78,150 |
1.05 |
||||||||||||||
|
HOTELS, RESTAURANTS & LEISURE |
|||||||||||||||
|
2,000 |
MCDONALD'S CORP. |
240,680 |
|||||||||||||
|
240,680 |
3.22 |
||||||||||||||
|
MEDIA |
|||||||||||||||
|
3,650 |
TIME WARNER INC. |
268,421 |
|||||||||||||
|
3,270 |
WALT DISNEY CO. |
319,871 |
|||||||||||||
|
588,292 |
7.88 |
||||||||||||||
|
SPECIALTY RETAIL |
|||||||||||||||
|
3,750 |
LOWE'S COMPANIES INC. |
296,888 |
|||||||||||||
|
2,690 |
THE HOME DEPOT, INC. |
343,486 |
|||||||||||||
|
640,374 |
8.58 |
||||||||||||||
|
CONSUMER STAPLES |
18.82 | ||||||||||||||
|
BEVERAGES |
|||||||||||||||
|
5,120 |
COCA-COLA CO. |
232,090 |
|||||||||||||
|
975 |
PEPSICO, INC. |
103,292 |
|||||||||||||
|
335,381 |
4.49 |
||||||||||||||
|
FOOD & STAPLES RETAILING |
|||||||||||||||
|
5,000 |
SYSCO CORP. |
253,700 |
|||||||||||||
|
2,950 |
WAL-MART STORES INC. |
215,409 |
|||||||||||||
|
469,109 |
6.29 |
||||||||||||||
|
FOOD PRODUCTS |
|||||||||||||||
|
2,700 |
MONDELEZ INT'L INC. |
122,877 |
|||||||||||||
|
3,000 |
THE KRAFT HEINZ COMPANY |
265,440 |
|||||||||||||
|
388,317 |
5.20 |
||||||||||||||
|
HOUSEHOLD PRODUCTS |
|||||||||||||||
|
2,500 |
PROCTER & GAMBLE CO. |
211,675 |
|||||||||||||
|
211,675 |
2.84 |
||||||||||||||
|
ENERGY |
1.88 | ||||||||||||||
|
OIL, GAS & CONSUMABLE FUELS |
|||||||||||||||
|
1,500 |
EXXON MOBIL CORP. |
140,610 |
|||||||||||||
|
140,610 |
1.88 |
||||||||||||||
See Accompanying Notes to Financial Statements which are an integral part of these financial statements.
37
Pacific Advisors Large Cap Value Fund
Schedule of Investments (Unaudited)
as of June 30, 2016
|
Quantity or Principal** |
Description |
Current $ Value** |
% of Total Net Assets |
||||||||||||
|
COMMON STOCK continued |
|||||||||||||||
|
FINANCIALS |
14.92 | ||||||||||||||
|
BANKS |
|||||||||||||||
|
7,000 |
BANK OF AMERICA CORP. |
92,890 |
|||||||||||||
|
2,850 |
CITIGROUP INC. |
120,812 |
|||||||||||||
|
4,225 |
WELLS FARGO & CO. |
199,969 |
|||||||||||||
|
413,671 |
5.54 |
||||||||||||||
|
DIVERSIFIED FINANCIAL SERVICES |
|||||||||||||||
|
2,000 |
BERKSHIRE HATHAWAY INC. B* |
289,580 |
|||||||||||||
|
289,580 |
3.88 |
||||||||||||||
|
INSURANCE |
|||||||||||||||
|
4,000 |
AMERICAN INT'L GROUP INC. |
211,560 |
|||||||||||||
|
5,000 |
METLIFE INC. |
199,150 |
|||||||||||||
|
410,710 |
5.50 |
||||||||||||||
|
HEALTH CARE |
4.25 | ||||||||||||||
|
PHARMACEUTICALS |
|||||||||||||||
|
2,615 |
JOHNSON & JOHNSON |
317,200 |
|||||||||||||
|
317,200 |
4.25 |
||||||||||||||
|
INDUSTRIALS |
16.44 | ||||||||||||||
|
AEROSPACE & DEFENSE |
|||||||||||||||
|
2,000 |
HONEYWELL INT'L INC. |
232,640 |
|||||||||||||
|
232,640 |
3.12 |
||||||||||||||
|
AIR FREIGHT & LOGISTICS |
|||||||||||||||
|
1,000 |
FEDEX CORP. |
151,780 |
|||||||||||||
|
1,200 |
UNITED PARCEL SERVICE INC. B |
129,264 |
|||||||||||||
|
281,044 |
3.76 |
||||||||||||||
|
INDUSTRIAL CONGLOMERATES |
|||||||||||||||
|
9,750 |
GENERAL ELECTRIC CO. |
306,930 |
|||||||||||||
|
306,930 |
4.11 |
||||||||||||||
|
MACHINERY |
|||||||||||||||
|
2,000 |
DEERE & CO. |
162,080 |
|||||||||||||
|
2,350 |
ILLINOIS TOOL WORKS INC. |
244,776 |
|||||||||||||
|
406,856 |
5.45 |
||||||||||||||
|
INFORMATION TECHNOLOGY |
22.38 | ||||||||||||||
|
INTERNET SOFTWARE & SERVICES |
|||||||||||||||
|
300 |
ALPHABET INC. CLASS C* |
207,630 |
|||||||||||||
|
207,630 |
2.78 |
||||||||||||||
See Accompanying Notes to Financial Statements which are an integral part of these financial statements.
38
Pacific Advisors Large Cap Value Fund
Schedule of Investments (Unaudited)
as of June 30, 2016
|
Quantity or Principal** |
Description |
Current $ Value** |
% of Total Net Assets |
||||||||||||
|
COMMON STOCK continued |
|||||||||||||||
|
IT SERVICES |
|||||||||||||||
|
1,350 |
INT'L BUSINESS MACHINES CORP. |
204,903 |
|||||||||||||
|
2,200 |
MASTERCARD INC. |
193,732 |
|||||||||||||
|
398,635 |
5.34 |
||||||||||||||
|
SEMICONDUCTORS & SEMICONDUCTOR EQUIPMENT |
|||||||||||||||
|
5,600 |
INTEL CORP. |
183,680 |
|||||||||||||
|
183,680 |
2.46 |
||||||||||||||
|
SOFTWARE |
|||||||||||||||
|
6,500 |
MICROSOFT CORP. |
332,605 |
|||||||||||||
|
5,710 |
ORACLE CORPORATION |
233,710 |
|||||||||||||
|
566,315 |
7.59 |
||||||||||||||
|
TECHNOLOGY HARDWARE, STORAGE & PERIPHERALS |
|||||||||||||||
|
3,290 |
APPLE INC. |
314,524 |
|||||||||||||
|
314,524 |
4.21 |
||||||||||||||
|
TOTAL COMMON STOCK (Cost: $4,845,165) |
7,422,003 |
99.42 |
|||||||||||||
|
TOTAL INVESTMENT IN SECURITIES (Cost: $4,845,165) |
7,422,003 |
99.42 |
|||||||||||||
|
CASH OR CASH EQUIVALENT |
52,662 |
0.71 |
|||||||||||||
|
OTHER ASSETS LESS LIABILITIES |
(9,519.00 |
) |
(0.13 |
) |
|||||||||||
|
TOTAL NET ASSETS |
7,465,146 |
100.00 |
|||||||||||||
* Non-income producing
** The principal amount is stated in U.S. dollars unless otherwise indicated.
See Accompanying Notes to Financial Statements which are an integral part of these financial statements.
39
Pacific Advisors Mid Cap Value Fund
Schedule of Investments (Unaudited)
as of June 30, 2016
|
Quantity or Principal** |
Description |
Current $ Value** |
% of Total Net Assets |
||||||||||||
|
COMMON STOCK |
|||||||||||||||
|
CONSUMER DISCRETIONARY |
31.03 | ||||||||||||||
|
AUTO COMPONENTS |
|||||||||||||||
|
2,100 |
LEAR CORP. |
213,696 |
|||||||||||||
|
213,696 |
3.92 |
||||||||||||||
|
DISTRIBUTORS |
|||||||||||||||
|
2,500 |
POOL CORPORATION |
235,075 |
|||||||||||||
|
235,075 |
4.31 |
||||||||||||||
|
SPECIALTY RETAIL |
|||||||||||||||
|
18,000 |
CONN'S INC.* |
135,360 |
|||||||||||||
|
4,500 |
GAMESTOP CORP. A |
119,610 |
|||||||||||||
|
1,000 |
O'REILLY AUTOMOTIVE INC.* |
271,100 |
|||||||||||||
|
6,600 |
PENSKE AUTOMOTIVE GROUP INC. |
207,636 |
|||||||||||||
|
2,800 |
TRACTOR SUPPLY COMPANY |
255,304 |
|||||||||||||
|
989,010 |
18.14 |
||||||||||||||
|
TEXTILES, APPAREL & LUXURY GOODS |
|||||||||||||||
|
2,700 |
PVH CORP. |
254,421 |
|||||||||||||
|
254,421 |
4.67 |
||||||||||||||
|
CONSUMER STAPLES |
3.19 | ||||||||||||||
|
BEVERAGES |
|||||||||||||||
|
1,800 |
DR PEPPER SNAPPLE GROUP INC. |
173,934 |
|||||||||||||
|
173,934 |
3.19 |
||||||||||||||
|
ENERGY |
7.45 | ||||||||||||||
|
ENERGY EQUIPMENT & SERVICES |
|||||||||||||||
|
26,000 |
HELIX ENERGY SOLUTIONS GROUP INC.* |
175,760 |
|||||||||||||
|
28,000 |
NOBLE CORPORATION |
230,720 |
|||||||||||||
|
406,480 |
7.45 |
||||||||||||||
|
FINANCIALS |
5.76 | ||||||||||||||
|
BANKS |
|||||||||||||||
|
3,300 |
CIT GROUP INC. |
105,303 |
|||||||||||||
|
6,100 |
EAST WEST BANCORP INC. |
208,498 |
|||||||||||||
|
313,801 |
5.76 |
||||||||||||||
See Accompanying Notes to Financial Statements which are an integral part of these financial statements.
40
Pacific Advisors Mid Cap Value Fund
Schedule of Investments (Unaudited)
as of June 30, 2016
|
Quantity or Principal** |
Description |
Current $ Value** |
% of Total Net Assets |
||||||||||||
|
COMMON STOCK continued |
|||||||||||||||
|
HEALTH CARE |
3.01 | ||||||||||||||
|
HEALTH CARE TECHNOLOGY |
|||||||||||||||
|
2,800 |
CERNER CORPORATION* |
164,080 |
|||||||||||||
|
164,080 |
3.01 |
||||||||||||||
|
INDUSTRIALS |
44.31 | ||||||||||||||
|
AIRLINES |
|||||||||||||||
|
5,700 |
SPIRIT AIRLINES INC.* |
255,759 |
|||||||||||||
|
255,759 |
4.69 |
||||||||||||||
|
COMMERCIAL SERVICES & SUPPLIES |
|||||||||||||||
|
1,500 |
STERICYCLE, INC.* |
156,180 |
|||||||||||||
|
156,180 |
2.86 |
||||||||||||||
|
CONSTRUCTION & ENGINEERING |
|||||||||||||||
|
6,000 |
CHICAGO BRIDGE & IRON CO. N.V. |
207,780 |
|||||||||||||
|
207,780 |
3.81 |
||||||||||||||
|
MACHINERY |
|||||||||||||||
|
2,600 |
GRACO INC. |
205,374 |
|||||||||||||
|
15,000 |
NAVISTAR INT'L CORP.* |
175,350 |
|||||||||||||
|
3,100 |
WABTEC CORP. |
217,713 |
|||||||||||||
|
598,437 |
10.98 |
||||||||||||||
|
MARINE |
|||||||||||||||
|
3,800 |
KIRBY CORP.* |
237,082 |
|||||||||||||
|
237,082 |
4.35 |
||||||||||||||
|
ROAD & RAIL |
|||||||||||||||
|
4,000 |
GENESEE & WYOMING INC.* |
235,800 |
|||||||||||||
|
2,700 |
KANSAS CITY SOUTHERN |
243,243 |
|||||||||||||
|
2,000 |
LANDSTAR SYSTEM INC. |
137,320 |
|||||||||||||
|
13,500 |
SWIFT TRANSPORTATION CO.* |
208,035 |
|||||||||||||
|
824,398 |
15.12 |
||||||||||||||
|
TRADING COMPANIES & DISTRIBUTORS |
|||||||||||||||
|
600 |
W.W. GRAINGER, INC. |
136,350 |
|||||||||||||
|
136,350 |
2.50 |
||||||||||||||
See Accompanying Notes to Financial Statements which are an integral part of these financial statements.
41
Pacific Advisors Mid Cap Value Fund
Schedule of Investments (Unaudited)
as of June 30, 2016
|
Quantity or Principal** |
Description |
Current $ Value** |
% of Total Net Assets |
||||||||||||
|
COMMON STOCK continued |
|||||||||||||||
|
INFORMATION TECHNOLOGY |
4.43 | ||||||||||||||
|
SOFTWARE |
|||||||||||||||
|
6,000 |
ASPEN TECHNOLOGY, INC.* |
241,440 |
|||||||||||||
|
241,440 |
4.43 |
||||||||||||||
|
MATERIALS |
2.82 | ||||||||||||||
|
CHEMICALS |
|||||||||||||||
|
3,500 |
H.B. FULLER CO. |
153,965 |
|||||||||||||
|
153,965 |
2.82 |
||||||||||||||
|
TOTAL COMMON STOCK (Cost: $5,253,269) |
5,561,888 |
102.00 |
|||||||||||||
|
TOTAL INVESTMENT IN SECURITIES (Cost: $5,253,269) |
5,561,888 |
102.00 |
|||||||||||||
|
OTHER ASSETS LESS LIABILITIES |
(109,252 |
) |
(2.00 |
) |
|||||||||||
|
TOTAL NET ASSETS |
5,452,636 |
100.00 |
|||||||||||||
* Non-income producing
** The principal amount is stated in U.S. dollars unless otherwise indicated.
See Accompanying Notes to Financial Statements which are an integral part of these financial statements.
42
Pacific Advisors Small Cap Value Fund
Schedule of Investments (Unaudited)
as of June 30, 2016
|
Quantity or Principal** |
Description |
Current $ Value** |
% of Total Net Assets |
||||||||||||
|
COMMON STOCK |
|||||||||||||||
|
CONSUMER DISCRETIONARY |
17.38 | ||||||||||||||
|
AUTO COMPONENTS |
|||||||||||||||
|
35,000 |
GENTHERM INC.* |
1,198,750 |
|||||||||||||
|
1,198,750 |
4.08 |
||||||||||||||
|
HOTELS, RESTAURANTS & LEISURE |
|||||||||||||||
|
75,000 |
BRAVO BRIO RESTAURANT GROUP INC.* |
614,250 |
|||||||||||||
|
614,250 |
2.09 |
||||||||||||||
|
SPECIALTY RETAIL |
|||||||||||||||
|
115,000 |
CONN'S INC.* |
864,800 |
|||||||||||||
|
38,000 |
HIBBETT SPORTS INC.* |
1,322,020 |
|||||||||||||
|
65,000 |
SONIC AUTOMOTIVE INC. |
1,112,150 |
|||||||||||||
|
3,298,970 |
11.22 |
||||||||||||||
|
CONSUMER STAPLES |
7.33 | ||||||||||||||
|
FOOD & STAPLES RETAILING |
|||||||||||||||
|
65,812 |
CHEFS' WAREHOUSE INC.* |
1,052,992 |
|||||||||||||
|
1,052,992 |
3.58 |
||||||||||||||
|
FOOD PRODUCTS |
|||||||||||||||
|
74,000 |
DARLING INGREDIENTS INC.* |
1,102,600 |
|||||||||||||
|
1,102,600 |
3.75 |
||||||||||||||
|
ENERGY |
20.30 | ||||||||||||||
|
ENERGY EQUIPMENT & SERVICES |
|||||||||||||||
|
130,000 |
HORNBECK OFFSHORE SERVICES INC.* |
1,084,200 |
|||||||||||||
|
75,000 |
MATRIX SERVICE CO.* |
1,236,750 |
|||||||||||||
|
46,000 |
NATURAL GAS SERVICES GROUP, INC.* |
1,053,400 |
|||||||||||||
|
584,800 |
NORTH AMERICAN ENERGY PARTNERS INC. |
1,649,136 |
|||||||||||||
|
410,000 |
PARKER DRILLING CO.* |
938,900 |
|||||||||||||
|
5,962,386 |
20.28 |
||||||||||||||
|
OIL, GAS & CONSUMABLE FUELS |
|||||||||||||||
|
100,000 |
INFINITY ENERGY RESOURCES INC.* |
7,000 |
|||||||||||||
|
7,000 |
0.02 |
||||||||||||||
|
FINANCIALS |
7.86 | ||||||||||||||
|
BANKS |
|||||||||||||||
|
32,000 |
EAST WEST BANCORP INC. |
1,093,760 |
|||||||||||||
|
1,093,760 |
3.72 |
||||||||||||||
See Accompanying Notes to Financial Statements which are an integral part of these financial statements.
43
Pacific Advisors Small Cap Value Fund
Schedule of Investments (Unaudited)
as of June 30, 2016
|
Quantity or Principal** |
Description |
Current $ Value** |
% of Total Net Assets |
||||||||||||
|
COMMON STOCK continued |
|||||||||||||||
|
CONSUMER FINANCE |
|||||||||||||||
|
83,000 |
REGIONAL MANAGEMENT CORP.* |
1,216,780 |
|||||||||||||
|
1,216,780 |
4.14 |
||||||||||||||
|
INDUSTRIALS |
49.05 | ||||||||||||||
|
BUILDING PRODUCTS |
|||||||||||||||
|
40,195 |
INSTEEL INDUSTRIES INC. |
1,149,175 |
|||||||||||||
|
40,000 |
NCI BUILDING SYSTEMS INC.* |
639,600 |
|||||||||||||
|
1,788,775 |
6.08 |
||||||||||||||
|
COMMERCIAL SERVICES & SUPPLIES |
|||||||||||||||
|
37,000 |
MOBILE MINI INC. |
1,281,680 |
|||||||||||||
|
60,000 |
TEAM INC.* |
1,489,800 |
|||||||||||||
|
2,771,480 |
9.42 |
||||||||||||||
|
CONSTRUCTION & ENGINEERING |
|||||||||||||||
|
150,000 |
ORION GROUP HOLDINGS, INC.* |
796,500 |
|||||||||||||
|
796,500 |
2.71 |
||||||||||||||
|
MACHINERY |
|||||||||||||||
|
105,000 |
NAVISTAR INT'L CORP.* |
1,227,450 |
|||||||||||||
|
1,227,450 |
4.17 |
||||||||||||||
|
MARINE |
|||||||||||||||
|
22,000 |
KIRBY CORP.* |
1,372,580 |
|||||||||||||
|
1,372,580 |
4.67 |
||||||||||||||
|
ROAD & RAIL |
|||||||||||||||
|
22,000 |
GENESEE & WYOMING INC.* |
1,296,900 |
|||||||||||||
|
45,000 |
SAIA INC.* |
1,131,300 |
|||||||||||||
|
2,428,200 |
8.26 |
||||||||||||||
|
TRADING COMPANIES & DISTRIBUTORS |
|||||||||||||||
|
61,000 |
DXP ENTERPRISES INC.* |
910,730 |
|||||||||||||
|
58,000 |
RUSH ENTERPRISES INC.* |
1,249,900 |
|||||||||||||
|
140,000 |
TAL INT'L GROUP INC. |
1,877,400 |
|||||||||||||
|
4,038,030 |
13.73 |
||||||||||||||
|
TOTAL COMMON STOCK (Cost: $32,935,286) |
29,970,503 |
101.92 |
|||||||||||||
|
TOTAL INVESTMENT IN SECURITIES (Cost: $32,935,286) |
29,970,503 |
101.92 |
|||||||||||||
|
OTHER ASSETS LESS LIABILITIES |
(564,664 |
) |
(1.92 |
) |
|||||||||||
|
TOTAL NET ASSETS |
29,405,839 |
100.00 |
|||||||||||||
* Non-income producing
** The principal amount is stated in U.S. dollars unless otherwise indicated.
See Accompanying Notes to Financial Statements which are an integral part of these financial statements.
44
(This page has been left blank intentionally.)
45
Pacific Advisors Fund Inc.
Statement of Assets and Liabilities (Unaudited)
June 30, 2016
|
Income and Equity Fund |
Balanced Fund |
Large Cap Value Fund |
|||||||||||||
|
Assets |
|||||||||||||||
|
Investment securities |
|||||||||||||||
|
At cost |
$ |
12,951,405 |
$ |
6,534,693 |
$ |
4,845,165 |
|||||||||
|
At fair value |
$ |
14,980,830 |
$ |
6,231,153 |
$ |
7,422,003 |
|||||||||
|
Cash or cash equivalent, at fair value |
1,448,050 |
- |
52,662 |
||||||||||||
|
Accrued income receivable |
102,182 |
39,657 |
10,661 |
||||||||||||
|
Receivable for investments sold |
- |
79,118 |
- |
||||||||||||
|
Total assets |
16,531,062 |
6,349,928 |
7,485,326 |
||||||||||||
|
Liabilities |
|||||||||||||||
|
Bank borrowings (Note 7) |
- |
81,095 |
- |
||||||||||||
|
Payable for investments purchased |
158,629 |
- |
- |
||||||||||||
|
Payable for fund shares redeemed |
220 |
220 |
220 |
||||||||||||
|
Accounts payable |
31,767 |
14,392 |
16,360 |
||||||||||||
|
Accounts payable to related parties (Note 3) |
3,600 |
3,600 |
3,600 |
||||||||||||
|
Total liabilities |
194,216 |
99,307 |
20,180 |
||||||||||||
|
Net Assets |
$ |
16,336,846 |
$ |
6,250,621 |
$ |
7,465,146 |
|||||||||
|
Summary of Shareholders' Equity |
|||||||||||||||
|
Paid in capital |
14,689,886 |
6,030,155 |
4,937,655 |
||||||||||||
|
Accumulated undistributed net investment income |
1,111 |
- |
- |
||||||||||||
|
Accumulated undistributed net realized gain (loss) on security transactions |
(383,576 |
) |
524,006 |
(49,347 |
) |
||||||||||
|
Net unrealized appreciation (depreciation) of investments |
2,029,425 |
(303,540 |
) |
2,576,838 |
|||||||||||
|
Net assets at June 30, 2016 |
$ |
16,336,846 |
$ |
6,250,621 |
$ |
7,465,146 |
|||||||||
|
Class A: |
|||||||||||||||
|
Net assets |
$ |
13,546,340 |
$ |
4,211,763 |
$ |
6,407,983 |
|||||||||
|
Shares authorized ($0.01 par value) |
50,000,000 |
50,000,000 |
50,000,000 |
||||||||||||
|
Shares outstanding |
1,111,916 |
371,888 |
459,272 |
||||||||||||
|
Net asset value (and redemption price) per share |
$ |
12.18 |
$ |
11.33 |
$ |
13.95 |
|||||||||
|
Maximum offering price per share |
$ |
12.79 |
$ |
12.02 |
$ |
14.80 |
|||||||||
|
Sales load |
4.75 |
% |
5.75 |
% |
5.75 |
% |
|||||||||
|
Class C: |
|||||||||||||||
|
Net assets |
$ |
2,790,506 |
$ |
2,038,858 |
$ |
1,057,163 |
|||||||||
|
Shares authorized ($0.01 par value) |
50,000,000 |
50,000,000 |
50,000,000 |
||||||||||||
|
Shares outstanding |
238,995 |
202,352 |
87,782 |
||||||||||||
|
Net asset value (and offering and redemption price) per share |
$ |
11.68 |
$ |
10.08 |
$ |
12.04 |
|||||||||
|
Class I: |
|||||||||||||||
|
Net assets |
N/A |
N/A |
N/A |
||||||||||||
|
Shares authorized ($0.01 par value) |
|||||||||||||||
|
Shares outstanding |
|||||||||||||||
|
Net asset value (and offering and redemption price) per share |
N/A |
N/A |
N/A |
||||||||||||
See Accompanying Notes to Financial Statements which are an integral part of these financial statements.
46
|
Mid Cap Value Fund |
Small Cap Value Fund |
||||||||||
|
Assets |
|||||||||||
|
Investment securities |
|||||||||||
|
At cost |
$ |
5,253,269 |
$ |
32,935,286 |
|||||||
|
At fair value |
$ |
5,561,888 |
$ |
29,970,503 |
|||||||
|
Cash or cash equivalent, at fair value |
- |
- |
|||||||||
|
Accrued income receivable |
1,951 |
11,669 |
|||||||||
|
Receivable for investments sold |
18,688 |
675,630 |
|||||||||
|
Total assets |
5,582,527 |
30,657,802 |
|||||||||
|
Liabilities |
|||||||||||
|
Bank borrowings (Note 7) |
95,406 |
1,168,118 |
|||||||||
|
Payable for investments purchased |
22,609 |
- |
|||||||||
|
Payable for fund shares redeemed |
220 |
14,892 |
|||||||||
|
Accounts payable |
8,056 |
56,479 |
|||||||||
|
Accounts payable to related parties (Note 3) |
3,600 |
12,474 |
|||||||||
|
Total liabilities |
129,891 |
1,251,963 |
|||||||||
|
Net Assets |
$ |
5,452,636 |
$ |
29,405,839 |
|||||||
|
Summary of Shareholders' Equity |
|||||||||||
|
Paid in capital |
6,389,234 |
26,899,229 |
|||||||||
|
Accumulated undistributed net investment income |
- |
- |
|||||||||
|
Accumulated undistributed net realized gain (loss) on security transactions |
(1,245,217 |
) |
5,471,393 |
||||||||
|
Net unrealized appreciation (depreciation) of investments |
308,619 |
(2,964,783 |
) |
||||||||
|
Net assets at June 30, 2016 |
$ |
5,452,636 |
$ |
29,405,839 |
|||||||
|
Class A: |
|||||||||||
|
Net assets |
$ |
4,923,339 |
$ |
24,923,179 |
|||||||
|
Shares authorized ($0.01 par value) |
50,000,000 |
50,000,000 |
|||||||||
|
Shares outstanding |
486,796 |
1,063,862 |
|||||||||
|
Net asset value (and redemption price) per share |
$ |
10.11 |
$ |
23.43 |
|||||||
|
Maximum offering price per share |
$ |
10.73 |
$ |
24.86 |
|||||||
|
Sales load |
5.75 |
% |
5.75 |
% |
|||||||
|
Class C: |
|||||||||||
|
Net assets |
$ |
529,297 |
$ |
4,335,577 |
|||||||
|
Shares authorized ($0.01 par value) |
50,000,000 |
50,000,000 |
|||||||||
|
Shares outstanding |
58,916 |
241,597 |
|||||||||
|
Net asset value (and offering and redemption price) per share |
$ |
8.98 |
$ |
17.95 |
|||||||
|
Class I: |
|||||||||||
|
Net assets |
N/A |
$ |
147,083 |
||||||||
|
Shares authorized ($0.01 par value) |
50,000,000 |
||||||||||
|
Shares outstanding |
5,022 |
||||||||||
|
Net asset value (and offering and redemption price) per share |
N/A |
$ |
29.29 |
||||||||
47
Pacific Advisors Fund Inc.
Statement of Operations (Unaudited)
For the six months ended June 30, 2016
|
Income and Equity Fund |
Balanced Fund |
Large Cap Value Fund |
|||||||||||||
|
Investment Income |
|||||||||||||||
|
Dividends |
$ |
116,412 |
$ |
24,549 |
$ |
82,488 |
|||||||||
|
Interest |
118,311 |
41,464 |
2 |
||||||||||||
|
Total investment income |
234,723 |
66,013 |
82,490 |
||||||||||||
|
Expenses |
|||||||||||||||
|
Investment management fees (Note 3) |
53,705 |
23,767 |
27,461 |
||||||||||||
|
Transfer agent fees (Note 3) |
52,835 |
38,079 |
50,892 |
||||||||||||
|
Fund accounting fees (Note 3) |
54,421 |
25,084 |
28,127 |
||||||||||||
|
Legal fees |
15,037 |
6,655 |
7,689 |
||||||||||||
|
Audit fees |
11,457 |
5,070 |
5,858 |
||||||||||||
|
Registration fees |
14,889 |
16,676 |
13,984 |
||||||||||||
|
Printing |
9,309 |
4,120 |
4,760 |
||||||||||||
|
Custody fees |
4,296 |
3,944 |
3,505 |
||||||||||||
|
Interest on borrowings |
1 |
176 |
590 |
||||||||||||
|
Director fees/meetings |
8,994 |
4,053 |
4,694 |
||||||||||||
|
Distribution and service (12b-1) fees (Note 3) |
28,067 |
16,923 |
13,227 |
||||||||||||
|
Administration fees (Note 3) |
3,580 |
1,584 |
1,831 |
||||||||||||
|
Compliance fees (Note 3) |
20,314 |
9,555 |
10,757 |
||||||||||||
|
Total expenses, before fees waived |
276,905 |
155,686 |
173,375 |
||||||||||||
|
Less fees waived (Note 3) |
53,705 |
- |
27,461 |
||||||||||||
|
Net expenses |
223,200 |
155,686 |
145,914 |
||||||||||||
|
Net Investment Income (Loss) |
11,523 |
(89,673 |
) |
(63,424 |
) |
||||||||||
|
Net Realized and Unrealized Gain (Loss) on Investments |
|||||||||||||||
|
Net realized gain on investments |
28,550 |
475,282 |
15,261 |
||||||||||||
|
Change in net unrealized appreciation (depreciation) on investments |
667,630 |
(637,403 |
) |
44,316 |
|||||||||||
|
Net realized and unrealized gain (loss) on investments |
696,180 |
(162,121 |
) |
59,577 |
|||||||||||
|
Net Increase (Decrease) in Net Assets Resulting from Operations |
$ |
707,703 |
$ |
(251,794 |
) |
$ |
(3,847 |
) |
|||||||
See Accompanying Notes to Financial Statements which are an integral part of these financial statements.
48
|
Mid Cap Value Fund |
Small Cap Value Fund |
||||||||||
|
Investment Income |
|||||||||||
|
Dividends |
$ |
29,458 |
$ |
60,664 |
|||||||
|
Interest |
- |
- |
|||||||||
|
Total investment income |
29,458 |
60,664 |
|||||||||
|
Expenses |
|||||||||||
|
Investment management fees (Note 3) |
27,866 |
123,862 |
|||||||||
|
Transfer agent fees (Note 3) |
35,090 |
177,533 |
|||||||||
|
Fund accounting fees (Note 3) |
21,183 |
147,524 |
|||||||||
|
Legal fees |
5,852 |
29,681 |
|||||||||
|
Audit fees |
4,459 |
26,424 |
|||||||||
|
Registration fees |
16,540 |
34,681 |
|||||||||
|
Printing |
3,623 |
21,470 |
|||||||||
|
Custody fees |
3,359 |
4,445 |
|||||||||
|
Interest on borrowings |
264 |
7,373 |
|||||||||
|
Director fees/meetings |
3,544 |
22,128 |
|||||||||
|
Distribution and service (12b-1) fees (Note 3) |
9,334 |
58,073 |
|||||||||
|
Administration fees (Note 3) |
1,393 |
8,258 |
|||||||||
|
Compliance fees (Note 3) |
7,766 |
59,287 |
|||||||||
|
Total expenses, before fees waived |
140,273 |
720,739 |
|||||||||
|
Less fees waived (Note 3) |
- |
- |
|||||||||
|
Net expenses |
140,273 |
720,739 |
|||||||||
|
Net Investment Income (Loss) |
(110,815 |
) |
(660,075 |
) |
|||||||
|
Net Realized and Unrealized Gain (Loss) on Investments |
|||||||||||
|
Net realized gain on investments |
47,609 |
1,428,743 |
|||||||||
|
Change in net unrealized appreciation (depreciation) on investments |
(14,375 |
) |
(2,889,338 |
) |
|||||||
|
Net realized and unrealized gain (loss) on investments |
33,234 |
(1,460,595 |
) |
||||||||
|
Net Increase (Decrease) in Net Assets Resulting from Operations |
$ |
(77,581 |
) |
$ |
(2,120,670 |
) |
|||||
49
Pacific Advisors Fund Inc.
Statements of Changes in Net Assets (Unaudited)
|
Income and Equity Fund |
Balanced Fund |
||||||||||||||||||
|
Six months ended June 30, 2016 |
Year ended December 31, 2015 |
Six months ended June 30, 2016 |
Year ended December 31, 2015 |
||||||||||||||||
|
Increase (Decrease) in Net Assets |
|||||||||||||||||||
|
From Operations |
|||||||||||||||||||
|
Net investment income (loss) |
$ |
11,523 |
$ |
151,422 |
$ |
(89,673 |
) |
$ |
(116,856 |
) |
|||||||||
|
Net realized gain (loss) on investments |
28,550 |
85,639 |
475,282 |
123,988 |
|||||||||||||||
|
Change in net unrealized appreciation (depreciation) on investments |
667,630 |
(614,621 |
) |
(637,403 |
) |
(1,417,116 |
) |
||||||||||||
|
Increase (decrease) in net assets resulting from operations |
707,703 |
(377,560 |
) |
(251,794 |
) |
(1,409,984 |
) |
||||||||||||
|
From Distributions to Shareholders |
|||||||||||||||||||
|
Class A: |
|||||||||||||||||||
|
Net investment income |
(12,565 |
) |
(135,748 |
) |
- |
- |
|||||||||||||
|
Net capital gains |
- |
- |
- |
(82,968 |
) |
||||||||||||||
|
Class C: |
|||||||||||||||||||
|
Net investment income |
- |
(14,183 |
) |
- |
- |
||||||||||||||
|
Net capital gains |
- |
- |
- |
(63,042 |
) |
||||||||||||||
|
Class I: |
|||||||||||||||||||
|
Net capital gains |
N/A |
N/A |
N/A |
N/A |
|||||||||||||||
|
Decrease in net assets resulting from distributions |
(12,565 |
) |
(149,931 |
) |
- |
(146,010 |
) |
||||||||||||
|
From Capital Share Transactions (Note 6) |
|||||||||||||||||||
|
Proceeds from shares sold |
2,673,220 |
2,752,000 |
478,204 |
696,319 |
|||||||||||||||
|
Proceeds from shares purchased by reinvestment of dividends |
11,140 |
133,740 |
- |
132,222 |
|||||||||||||||
|
Cost of shares repurchased |
(1,350,421 |
) |
(1,845,187 |
) |
(700,910 |
) |
(1,767,846 |
) |
|||||||||||
|
Increase (decrease) in net assets resulting from capital share transactions |
1,333,939 |
1,040,553 |
(222,706 |
) |
(939,305 |
) |
|||||||||||||
|
Increase (decrease) in net assets |
2,029,077 |
513,062 |
(474,500 |
) |
(2,495,299 |
) |
|||||||||||||
|
Net Assets |
|||||||||||||||||||
|
Beginning of year |
14,307,769 |
13,794,707 |
6,725,121 |
9,220,420 |
|||||||||||||||
|
End of year |
$ |
16,336,846 |
$ |
14,307,769 |
$ |
6,250,621 |
$ |
6,725,121 |
|||||||||||
|
Including undistributed net investment income |
$ |
1,111 |
$ |
2,153 |
$ |
- |
$ |
- |
|||||||||||
See Accompanying Notes to Financial Statements which are an integral part of these financial statements.
50
|
Large Cap Value Fund |
|||||||||||
|
Six months ended June 30, 2016 |
Year ended December 31, 2015 |
||||||||||
|
Increase (Decrease) in Net Assets |
|||||||||||
|
From Operations |
|||||||||||
|
Net investment income (loss) |
$ |
(63,424 |
) |
$ |
(59,487 |
) |
|||||
|
Net realized gain (loss) on investments |
15,261 |
(63,724 |
) |
||||||||
|
Change in net unrealized appreciation (depreciation) on investments |
44,316 |
(19,216 |
) |
||||||||
|
Increase (decrease) in net assets resulting from operations |
(3,847 |
) |
(142,427 |
) |
|||||||
|
From Distributions to Shareholders |
|||||||||||
|
Class A: |
|||||||||||
|
Net investment income |
- |
- |
|||||||||
|
Net capital gains |
- |
(10,259 |
) |
||||||||
|
Class C: |
|||||||||||
|
Net investment income |
- |
- |
|||||||||
|
Net capital gains |
- |
(2,098 |
) |
||||||||
|
Class I: |
|||||||||||
|
Net capital gains |
N/A |
N/A |
|||||||||
|
Decrease in net assets resulting from distributions |
- |
(12,357 |
) |
||||||||
|
From Capital Share Transactions (Note 6) |
|||||||||||
|
Proceeds from shares sold |
285,792 |
686,897 |
|||||||||
|
Proceeds from shares purchased by reinvestment of dividends |
- |
11,071 |
|||||||||
|
Cost of shares repurchased |
(564,579 |
) |
(854,981 |
) |
|||||||
|
Increase (decrease) in net assets resulting from capital share transactions |
(278,787 |
) |
(157,013 |
) |
|||||||
|
Increase (decrease) in net assets |
(282,634 |
) |
(311,797 |
) |
|||||||
|
Net Assets |
|||||||||||
|
Beginning of year |
7,747,780 |
8,059,577 |
|||||||||
|
End of year |
$ |
7,465,146 |
$ |
7,747,780 |
|||||||
|
Including undistributed net investment income |
$ |
- |
$ |
- |
|||||||
51
Pacific Advisors Fund Inc.
Statements of Changes in Net Assets (Unaudited)
|
Mid Cap Value Fund |
|||||||||||
|
Six months ended June 30, 2016 |
Year ended December 31, 2015 |
||||||||||
|
Increase (Decrease) in Net Assets |
|||||||||||
|
From Operations |
|||||||||||
|
Net investment income (loss) |
$ |
(110,815 |
) |
$ |
(168,992 |
) |
|||||
|
Net realized gain (loss) on investments |
47,609 |
(88,212 |
) |
||||||||
|
Change in net unrealized appreciation (depreciation) on investments |
(14,375 |
) |
(1,427,491 |
) |
|||||||
|
Increase (decrease) in net assets resulting from operations |
(77,581 |
) |
(1,684,695 |
) |
|||||||
|
From Distributions to Shareholders |
|||||||||||
|
Class A: |
|||||||||||
|
Net investment income |
- |
- |
|||||||||
|
Net capital gains |
- |
- |
|||||||||
|
Class C: |
|||||||||||
|
Net investment income |
- |
- |
|||||||||
|
Net capital gains |
- |
- |
|||||||||
|
Class I: |
|||||||||||
|
Net capital gains |
N/A |
N/A |
|||||||||
|
Decrease in net assets resulting from distributions |
- |
- |
|||||||||
|
From Capital Share Transactions (Note 6) |
|||||||||||
|
Proceeds from shares sold |
328,676 |
697,270 |
|||||||||
|
Proceeds from shares purchased by reinvestment of dividends |
- |
- |
|||||||||
|
Cost of shares repurchased |
(335,056 |
) |
(347,630 |
) |
|||||||
|
Increase (decrease) in net assets resulting from capital share transactions |
(6,380 |
) |
349,640 |
||||||||
|
Increase (decrease) in net assets |
(83,961 |
) |
(1,335,055 |
) |
|||||||
|
Net Assets |
|||||||||||
|
Beginning of year |
5,536,597 |
6,871,652 |
|||||||||
|
End of year |
$ |
5,452,636 |
$ |
5,536,597 |
|||||||
|
Including undistributed net investment income |
$ |
- |
$ |
- |
|||||||
See Accompanying Notes to Financial Statements which are an integral part of these financial statements.
52
|
Small Cap Value Fund |
|||||||||||
|
Six months ended June 30, 2016 |
Year ended December 31, 2015 |
||||||||||
|
Increase (Decrease) in Net Assets |
|||||||||||
|
From Operations |
|||||||||||
|
Net investment income (loss) |
$ |
(660,075 |
) |
$ |
(2,228,870 |
) |
|||||
|
Net realized gain (loss) on investments |
1,428,743 |
7,754,982 |
|||||||||
|
Change in net unrealized appreciation (depreciation) on investments |
(2,889,338 |
) |
(32,263,584 |
) |
|||||||
|
Increase (decrease) in net assets resulting from operations |
(2,120,670 |
) |
(26,737,472 |
) |
|||||||
|
From Distributions to Shareholders |
|||||||||||
|
Class A: |
|||||||||||
|
Net investment income |
- |
- |
|||||||||
|
Net capital gains |
- |
(7,431,577 |
) |
||||||||
|
Class C: |
|||||||||||
|
Net investment income |
- |
- |
|||||||||
|
Net capital gains |
- |
(1,365,654 |
) |
||||||||
|
Class I: |
|||||||||||
|
Net capital gains |
- |
(32,425 |
) |
||||||||
|
Decrease in net assets resulting from distributions |
- |
(8,829,656 |
) |
||||||||
|
From Capital Share Transactions (Note 6) |
|||||||||||
|
Proceeds from shares sold |
902,035 |
14,004,821 |
|||||||||
|
Proceeds from shares purchased by reinvestment of dividends |
- |
7,967,113 |
|||||||||
|
Cost of shares repurchased |
(8,652,899 |
) |
(81,669,459 |
) |
|||||||
|
Increase (decrease) in net assets resulting from capital share transactions |
(7,750,864 |
) |
(59,697,525 |
) |
|||||||
|
Increase (decrease) in net assets |
(9,871,534 |
) |
(95,264,653 |
) |
|||||||
|
Net Assets |
|||||||||||
|
Beginning of year |
39,277,373 |
134,542,026 |
|||||||||
|
End of year |
$ |
29,405,839 |
$ |
39,277,373 |
|||||||
|
Including undistributed net investment income |
$ |
- |
$ |
- |
|||||||
53
Pacific Advisors Fund Inc.
Financial Highlights (Unaudited)
(For a share outstanding throughout the period)
|
Income and Equity Fund |
|||||||||||||||||||||||||||
|
Class A |
|||||||||||||||||||||||||||
|
For the six months ended |
For the year ended December 31, |
||||||||||||||||||||||||||
|
June 30, 2016 |
2015 |
2014 |
2013 |
2012 |
2011 |
||||||||||||||||||||||
|
Per Share Operating Performance |
|||||||||||||||||||||||||||
|
Net asset value, beginning of period |
$ |
11.61 |
$ |
12.06 |
$ |
11.55 |
$ |
10.30 |
$ |
9.84 |
$ |
9.87 |
|||||||||||||||
|
Income from investing operations |
|||||||||||||||||||||||||||
|
Net investment income (c) |
0.02 |
0.14 |
0.22 |
(d) |
0.14 |
(d) |
0.15 |
(d) |
0.22 |
(d) |
|||||||||||||||||
|
Net realized and unrealized gain (loss) on securities |
0.55 |
(0.45 |
) |
0.51 |
(d) |
1.24 |
(d) |
0.48 |
(d) |
- |
(d) |
||||||||||||||||
|
Total from investment operations |
0.57 |
(0.31 |
) |
0.73 |
1.38 |
0.63 |
0.22 |
||||||||||||||||||||
|
Less distributions |
|||||||||||||||||||||||||||
|
From net investment income |
(0.01 |
) |
(0.14 |
) |
(0.22 |
) |
(0.13 |
) |
(0.17 |
) |
(0.25 |
) |
|||||||||||||||
|
From net capital gain |
- |
- |
- |
- |
- |
- |
|||||||||||||||||||||
|
Total distributions |
(0.01 |
) |
(0.14 |
) |
(0.22 |
) |
(0.13 |
) |
(0.17 |
) |
(0.25 |
) |
|||||||||||||||
|
Redemption fees (c) |
0.01 |
- |
(b) |
- |
(b,d) |
- |
(b,d) |
- |
(b,d) |
- |
(b,d) |
||||||||||||||||
|
Net asset value, end of period |
$ |
12.18 |
$ |
11.61 |
$ |
12.06 |
$ |
11.55 |
$ |
10.30 |
$ |
9.84 |
|||||||||||||||
|
Total Investment Return (a) |
5.01 |
%(e) |
(2.57 |
)% |
6.41 |
% |
13.40 |
% |
6.46 |
% |
2.24 |
% |
|||||||||||||||
|
Ratios/Supplemental Data |
|||||||||||||||||||||||||||
|
Net assets, end of period (000's) |
$ |
13,546 |
$ |
11,541 |
$ |
11,324 |
$ |
9,247 |
$ |
4,659 |
$ |
4,235 |
|||||||||||||||
|
Ratio of net investment income (loss) to average net assets |
|||||||||||||||||||||||||||
|
With expense reductions |
0.30 |
%(f) |
1.23 |
% |
1.88 |
% |
1.27 |
% |
1.56 |
% |
2.27 |
% |
|||||||||||||||
|
Without expense reductions |
(0.45 |
)%(f) |
0.48 |
% |
1.13 |
% |
0.52 |
% |
0.81 |
% |
1.52 |
% |
|||||||||||||||
|
Ratio of expenses to average net assets |
|||||||||||||||||||||||||||
|
With expense reductions |
2.97 |
%(f) |
2.06 |
% |
1.91 |
% |
2.23 |
% |
2.68 |
% |
2.59 |
% |
|||||||||||||||
|
Without expense reductions |
3.72 |
%(f) |
2.81 |
% |
2.66 |
% |
2.98 |
% |
3.42 |
% |
3.34 |
% |
|||||||||||||||
|
Fund portfolio turnover rate |
8 |
%(f) |
22 |
% |
13 |
% |
20 |
% |
29 |
% |
16 |
% |
|||||||||||||||
|
Class C |
|||||||||||||||||||||||||||
|
For the six months ended |
For the year ended December 31, |
||||||||||||||||||||||||||
|
June 30, 2016 |
2015 |
2014 |
2013 |
2012 |
2011 |
||||||||||||||||||||||
|
Per Share Operating Performance |
|||||||||||||||||||||||||||
|
Net asset value, beginning of period |
$ |
11.16 |
$ |
11.59 |
$ |
11.11 |
$ |
9.91 |
$ |
9.42 |
$ |
9.40 |
|||||||||||||||
|
Income from investing operations |
|||||||||||||||||||||||||||
|
Net investment income (loss) (c) |
(0.02 |
) |
0.05 |
0.13 |
(d) |
0.05 |
(d) |
0.08 |
(d) |
0.15 |
(d) |
||||||||||||||||
|
Net realized and unrealized gain (loss) on securities |
0.53 |
(0.42 |
) |
0.48 |
(d) |
1.19 |
(d) |
0.46 |
(d) |
(0.01 |
)(d) |
||||||||||||||||
|
Total from investment operations |
0.51 |
(0.37 |
) |
0.61 |
1.24 |
0.54 |
0.14 |
||||||||||||||||||||
|
Less distributions |
|||||||||||||||||||||||||||
|
From net investment income |
- |
(0.06 |
) |
(0.13 |
) |
(0.04 |
) |
(0.05 |
) |
(0.12 |
) |
||||||||||||||||
|
From net capital gain |
- |
- |
- |
- |
- |
- |
|||||||||||||||||||||
|
Total distributions |
- |
(0.06 |
) |
(0.13 |
) |
(0.04 |
) |
(0.05 |
) |
(0.12 |
) |
||||||||||||||||
|
Redemption fees (c) |
0.01 |
- |
(b) |
- |
(b,d) |
- |
(b,d) |
- |
(b,d) |
- |
(b,d) |
||||||||||||||||
|
Net asset value, end of period |
$ |
11.68 |
$ |
11.16 |
$ |
11.59 |
$ |
11.11 |
$ |
9.91 |
$ |
9.42 |
|||||||||||||||
|
Total Investment Return |
4.66 |
%(e) |
(3.21 |
)% |
5.51 |
% |
12.55 |
% |
5.74 |
% |
1.54 |
% |
|||||||||||||||
|
Ratios/Supplemental Data |
|||||||||||||||||||||||||||
|
Net assets, end of period (000's) |
$ |
2,791 |
$ |
2,766 |
$ |
2,471 |
$ |
2,234 |
$ |
1,906 |
$ |
3,049 |
|||||||||||||||
|
Ratio of net investment income to average net assets |
|||||||||||||||||||||||||||
|
With expense reductions |
(0.45 |
)%(f) |
0.48 |
% |
1.14 |
% |
0.49 |
% |
0.80 |
% |
1.52 |
% |
|||||||||||||||
|
Without expense reductions |
(1.19 |
)%(f) |
(0.27 |
)% |
0.39 |
% |
(0.26 |
)% |
0.05 |
% |
0.77 |
% |
|||||||||||||||
|
Ratio of expenses to average net assets |
|||||||||||||||||||||||||||
|
With expense reductions |
3.72 |
%(f) |
2.81 |
% |
2.66 |
% |
3.03 |
% |
3.45 |
% |
3.33 |
% |
|||||||||||||||
|
Without expense reductions |
4.47 |
%(f) |
3.56 |
% |
3.41 |
% |
3.78 |
% |
4.20 |
% |
4.08 |
% |
|||||||||||||||
|
Fund portfolio turnover rate |
8 |
%(f) |
22 |
% |
13 |
% |
20 |
% |
29 |
% |
16 |
% |
|||||||||||||||
(a) The Fund's maximum sales charge is not included in the total return computation.
(b) The amount is less than $0.005 and rounded to zero.
(c) Based on average shares outstanding.
(d) Net investment income, net realized and unrealized gain (loss) on securities and redemptions fees for Class A and Class C for the years ended December 31, 2011 to December 31, 2014 were restated during the year ended December 31, 2015. See Note 2(H).
(e) Not annualized
(f) Annualized
See Accompanying Notes to Financial Statements which are an integral part of these financial statements.
54
Pacific Advisors Fund Inc.
Financial Highlights (Unaudited)
(For a share outstanding throughout the period)
|
Balanced Fund |
|||||||||||||||||||||||||||
|
Class A |
|||||||||||||||||||||||||||
|
For the six months ended |
For the year ended December 31, |
||||||||||||||||||||||||||
|
June 30, 2016 |
2015 |
2014 |
2013 |
2012 |
2011 |
||||||||||||||||||||||
|
Per Share Operating Performance |
|||||||||||||||||||||||||||
|
Net asset value, beginning of year |
$ |
11.75 |
$ |
14.40 |
$ |
16.59 |
$ |
14.13 |
$ |
13.47 |
$ |
14.56 |
|||||||||||||||
|
Income from investing operations |
|||||||||||||||||||||||||||
|
Net investment income (loss) (c) |
(0.14 |
) |
(0.15 |
) |
(0.14 |
)(d) |
(0.15 |
)(d) |
(0.04 |
)(d) |
0.04 |
(d) |
|||||||||||||||
|
Net realized and unrealized gain (loss) on securities |
(0.28 |
) |
(2.25 |
) |
(1.17 |
)(d) |
4.17 |
(d) |
1.35 |
(d) |
(0.20 |
)(d) |
|||||||||||||||
|
Total from investment operations |
(0.42 |
) |
(2.40 |
) |
(1.31 |
) |
4.02 |
1.31 |
(0.16 |
) |
|||||||||||||||||
|
Less distributions |
|||||||||||||||||||||||||||
|
From net investment income |
- |
- |
- |
- |
- |
- |
|||||||||||||||||||||
|
From net capital gain |
- |
(0.25 |
) |
(0.88 |
) |
(1.57 |
) |
(0.65 |
) |
(0.93 |
) |
||||||||||||||||
|
Total distributions |
- |
(0.25 |
) |
(0.88 |
) |
(1.57 |
) |
(0.65 |
) |
(0.93 |
) |
||||||||||||||||
|
Redemption fees (c) |
- |
(b) |
- |
(b) |
- |
(b,d) |
0.01 |
(d) |
- |
(b,d) |
- |
(b,d) |
|||||||||||||||
|
Net asset value, end of year |
$ |
11.33 |
$ |
11.75 |
$ |
14.40 |
$ |
16.59 |
$ |
14.13 |
$ |
13.47 |
|||||||||||||||
|
Total Investment Return (a) |
(3.57 |
)%(e) |
(16.73 |
)% |
(7.94 |
)% |
28.68 |
% |
9.69 |
% |
(1.14 |
)% |
|||||||||||||||
|
Ratios/Supplemental Data |
|||||||||||||||||||||||||||
|
Net assets, end of year (000's) |
$ |
4,212 |
$ |
4,046 |
$ |
5,017 |
$ |
5,144 |
$ |
3,919 |
$ |
3,801 |
|||||||||||||||
|
Ratio of net investment income (loss) to average net assets |
(2.57 |
)%(f) |
(1.08 |
)% |
(0.90 |
)% |
(0.93 |
)% |
(0.27 |
)% |
0.29 |
% |
|||||||||||||||
|
Ratio of expenses to average net assets |
4.65 |
%(f) |
3.27 |
% |
2.84 |
% |
3.07 |
% |
3.30 |
% |
3.13 |
% |
|||||||||||||||
|
Fund portfolio turnover rate |
50 |
%(f) |
28 |
% |
22 |
% |
23 |
% |
34 |
% |
14 |
% |
|||||||||||||||
|
Class C |
|||||||||||||||||||||||||||
|
For the six months ended |
For the year ended December 31, |
||||||||||||||||||||||||||
|
June 30, 2016 |
2015 |
2014 |
2013 |
2012 |
2011 |
||||||||||||||||||||||
|
Per Share Operating Performance |
|||||||||||||||||||||||||||
|
Net asset value, beginning of year |
$ |
10.50 |
$ |
12.99 |
$ |
15.18 |
$ |
13.13 |
$ |
12.66 |
$ |
13.84 |
|||||||||||||||
|
Income from investing operations |
|||||||||||||||||||||||||||
|
Net investment loss (c) |
(0.16 |
) |
(0.23 |
) |
(0.24 |
)(d) |
(0.25 |
)(d) |
(0.13 |
)(d) |
(0.06 |
)(d) |
|||||||||||||||
|
Net realized and unrealized gain (loss) on securities |
(0.26 |
) |
(2.01 |
) |
(1.07 |
)(d) |
3.87 |
(d) |
1.25 |
(d) |
(0.19 |
)(d) |
|||||||||||||||
|
Total from investment operations |
(0.42 |
) |
(2.24 |
) |
(1.31 |
) |
3.62 |
1.12 |
(0.25 |
) |
|||||||||||||||||
|
Less distributions |
|||||||||||||||||||||||||||
|
From net investment income |
- |
- |
- |
- |
- |
- |
|||||||||||||||||||||
|
From net capital gain |
- |
(0.25 |
) |
(0.88 |
) |
(1.57 |
) |
(0.65 |
) |
(0.93 |
) |
||||||||||||||||
|
Total distributions |
- |
(0.25 |
) |
(0.88 |
) |
(1.57 |
) |
(0.65 |
) |
(0.93 |
) |
||||||||||||||||
|
Redemption fees (b)(c) |
- |
- |
- |
(d) |
- |
(d) |
- |
(d) |
- |
(d) |
|||||||||||||||||
|
Net asset value, end of year |
$ |
10.08 |
$ |
10.50 |
$ |
12.99 |
$ |
15.18 |
$ |
13.13 |
$ |
12.66 |
|||||||||||||||
|
Total Investment Return |
(4.00 |
)%(e) |
(17.31 |
)% |
(8.68 |
)% |
27.75 |
% |
8.81 |
% |
(1.86 |
)% |
|||||||||||||||
|
Ratios/Supplemental Data |
|||||||||||||||||||||||||||
|
Net assets, end of year (000's) |
$ |
2,039 |
$ |
2,679 |
$ |
4,203 |
$ |
5,471 |
$ |
6,647 |
$ |
10,768 |
|||||||||||||||
|
Ratio of net investment loss to average net assets |
(3.25 |
)%(f) |
(1.85 |
)% |
(1.64 |
)% |
(1.70 |
)% |
(0.97 |
)% |
(0.42 |
)% |
|||||||||||||||
|
Ratio of expenses to average net assets |
5.35 |
%(f) |
4.05 |
% |
3.58 |
% |
3.86 |
% |
4.02 |
% |
3.83 |
% |
|||||||||||||||
|
Fund portfolio turnover rate |
50 |
%(f) |
28 |
% |
22 |
% |
23 |
% |
34 |
% |
14 |
% |
|||||||||||||||
(a) The Fund's maximum sales charge is not included in the total return computation.
(b) The amount is less than $0.005 and rounded to zero.
(c) Based on average shares outstanding.
(d) Net investment income, net realized and unrealized gain (loss) on securities and redemptions fees for Class A and Class C for the years ended December 31, 2011 to December 31, 2014 were restated during the year ended December 31, 2015. See Note 2(H).
(e) Not annualized
(f) Annualized
See Accompanying Notes to Financial Statements which are an integral part of these financial statements.
55
Pacific Advisors Fund Inc.
Financial Highlights (Unaudited)
(For a share outstanding throughout the period)
|
Large Cap Value Fund |
|||||||||||||||||||||||||||
|
Class A |
|||||||||||||||||||||||||||
|
For the six months ended |
For the year ended December 31, |
||||||||||||||||||||||||||
|
June 30, 2016 |
2015 |
2014 |
2013 |
2012 |
2011 |
||||||||||||||||||||||
|
Per Share Operating Performance |
|||||||||||||||||||||||||||
|
Net asset value, beginning of year |
$ |
13.92 |
$ |
14.18 |
$ |
13.05 |
$ |
10.34 |
$ |
9.30 |
$ |
8.98 |
|||||||||||||||
|
Income from investing operations |
|||||||||||||||||||||||||||
|
Net investment loss (c) |
(0.11 |
) |
(0.09 |
) |
(0.07 |
)(d) |
(0.02 |
)(d) |
(0.02 |
)(d) |
(0.06 |
)(d) |
|||||||||||||||
|
Net realized and unrealized gain (loss) on securities |
0.14 |
(0.15 |
) |
1.37 |
(d) |
2.99 |
(d) |
1.06 |
(d) |
0.38 |
(d) |
||||||||||||||||
|
Total from investment operations |
0.03 |
(0.24 |
) |
1.30 |
2.97 |
1.04 |
0.32 |
||||||||||||||||||||
|
Less distributions |
|||||||||||||||||||||||||||
|
From net investment income |
- |
- |
- |
- |
- |
- |
|||||||||||||||||||||
|
From net capital gain |
- |
(0.02 |
) |
(0.17 |
) |
(0.26 |
) |
- |
- |
||||||||||||||||||
|
Total distributions |
- |
(0.02 |
) |
(0.17 |
) |
(0.26 |
) |
- |
- |
||||||||||||||||||
|
Redemption fees (b)(c) |
- |
- |
- |
(d) |
- |
(d) |
- |
(d) |
- |
(d) |
|||||||||||||||||
|
Net asset value, end of year |
$ |
13.95 |
$ |
13.92 |
$ |
14.18 |
$ |
13.05 |
$ |
10.34 |
$ |
9.30 |
|||||||||||||||
|
Total Investment Return (a) |
0.22 |
%(e) |
(1.68 |
)% |
9.94 |
% |
28.72 |
% |
11.18 |
% |
3.56 |
% |
|||||||||||||||
|
Ratios/Supplemental Data |
|||||||||||||||||||||||||||
|
Net assets, end of year (000's) |
$ |
6,408 |
$ |
6,587 |
$ |
6,892 |
$ |
5,453 |
$ |
3,973 |
$ |
3,278 |
|||||||||||||||
|
Ratio of net investment loss to average net assets |
|||||||||||||||||||||||||||
|
With expense reductions |
(1.62 |
)%(f) |
(0.64 |
)% |
(0.55 |
)% |
(0.17 |
)% |
(0.18 |
)% |
(0.66 |
)% |
|||||||||||||||
|
Without expense reductions |
(2.37 |
)%(f) |
(1.39 |
)% |
(1.30 |
)% |
(1.72 |
)% |
(1.91 |
)% |
(2.61 |
)% |
|||||||||||||||
|
Ratio of expenses to average net assets |
|||||||||||||||||||||||||||
|
With expense reductions |
3.88 |
%(f) |
2.72 |
% |
2.64 |
% |
2.47 |
% |
2.61 |
% |
3.05 |
% |
|||||||||||||||
|
Without expense reductions |
4.63 |
%(f) |
3.47 |
% |
3.39 |
% |
4.02 |
% |
4.34 |
% |
4.99 |
% |
|||||||||||||||
|
Fund portfolio turnover rate |
0 |
%(f) |
7 |
% |
3 |
% |
24 |
% |
9 |
% |
7 |
% |
|||||||||||||||
|
Class C |
|||||||||||||||||||||||||||
|
For the six months ended |
For the year ended December 31, |
||||||||||||||||||||||||||
|
June 30, 2016 |
2015 |
2014 |
2013 |
2012 |
2011 |
||||||||||||||||||||||
|
Per Share Operating Performance |
|||||||||||||||||||||||||||
|
Net asset value, beginning of year |
$ |
12.06 |
$ |
12.39 |
$ |
11.50 |
$ |
9.20 |
$ |
8.34 |
$ |
8.12 |
|||||||||||||||
|
Income from investing operations |
|||||||||||||||||||||||||||
|
Net investment loss (c) |
(0.14 |
) |
(0.17 |
) |
(0.15 |
)(d) |
(0.10 |
)(d) |
(0.09 |
)(d) |
(0.12 |
)(d) |
|||||||||||||||
|
Net realized and unrealized gain (loss) on securities |
0.12 |
(0.14 |
) |
1.21 |
(d) |
2.66 |
(d) |
0.95 |
(d) |
0.34 |
(d) |
||||||||||||||||
|
Total from investment operations |
(0.02 |
) |
(0.31 |
) |
1.06 |
2.56 |
0.86 |
0.22 |
|||||||||||||||||||
|
Less distributions |
|||||||||||||||||||||||||||
|
From net investment income |
- |
- |
- |
- |
- |
- |
|||||||||||||||||||||
|
From net capital gain |
- |
(0.02 |
) |
(0.17 |
) |
(0.26 |
) |
- |
- |
||||||||||||||||||
|
Total distributions |
- |
(0.02 |
) |
(0.17 |
) |
(0.26 |
) |
- |
- |
||||||||||||||||||
|
Redemption fees (c) |
- |
(b) |
- |
(b) |
- |
(b,d) |
- |
(d) |
- |
(b,d) |
- |
(b,d) |
|||||||||||||||
|
Net asset value, end of year |
$ |
12.04 |
$ |
12.06 |
$ |
12.39 |
$ |
11.50 |
$ |
9.20 |
$ |
8.34 |
|||||||||||||||
|
Total Investment Return |
(0.17 |
)%(e) |
(2.48 |
)% |
9.18 |
% |
27.83 |
% |
10.31 |
% |
2.71 |
% |
|||||||||||||||
|
Ratios/Supplemental Data |
|||||||||||||||||||||||||||
|
Net assets, end of year (000's) |
$ |
1,057 |
$ |
1,160 |
$ |
1,167 |
$ |
816 |
$ |
578 |
$ |
630 |
|||||||||||||||
|
Ratio of net investment loss to average net assets |
|||||||||||||||||||||||||||
|
With expense reductions |
(2.35 |
)%(f) |
(1.41 |
)% |
(1.29 |
)% |
(0.92 |
)% |
(1.01 |
)% |
(1.53 |
)% |
|||||||||||||||
|
Without expense reductions |
(3.10 |
)%(f) |
(2.16 |
)% |
(2.03 |
)% |
(2.47 |
)% |
(2.74 |
)% |
(3.46 |
)% |
|||||||||||||||
|
Ratio of expenses to average net assets |
|||||||||||||||||||||||||||
|
With expense reductions |
4.61 |
%(f) |
3.50 |
% |
3.38 |
% |
3.22 |
% |
3.43 |
% |
3.89 |
% |
|||||||||||||||
|
Without expense reductions |
5.36 |
%(f) |
4.25 |
% |
4.13 |
% |
4.77 |
% |
5.15 |
% |
5.82 |
% |
|||||||||||||||
|
Fund portfolio turnover rate |
0 |
%(f) |
7 |
% |
3 |
% |
24 |
% |
9 |
% |
7 |
% |
|||||||||||||||
(a) The Fund's maximum sales charge is not included in the total return computation.
(b) The amount is less than $0.005 and rounded to zero.
(c) Based on average shares outstanding.
(d) Net investment income, net realized and unrealized gain (loss) on securities and redemptions fees for Class A and Class C for the years ended December 31, 2011 to December 31, 2014 were restated during the year ended December 31, 2015. See Note 2(H).
(e) Not annualized
(f) Annualized
See Accompanying Notes to Financial Statements which are an integral part of these financial statements.
56
Pacific Advisors Fund Inc.
Financial Highlights (Unaudited)
(For a share outstanding throughout the period)
|
Mid Cap Value Fund |
|||||||||||||||||||||||||||
|
Class A |
|||||||||||||||||||||||||||
|
For the six months ended |
For the year ended December 31, |
||||||||||||||||||||||||||
|
June 30, 2016 |
2015 |
2014 |
2013 |
2012 |
2011 |
||||||||||||||||||||||
|
Per Share Operating Performance |
|||||||||||||||||||||||||||
|
Net asset value, beginning of year |
$ |
10.28 |
$ |
13.46 |
$ |
15.25 |
$ |
11.47 |
$ |
10.88 |
$ |
11.57 |
|||||||||||||||
|
Income from investing operations |
|||||||||||||||||||||||||||
|
Net investment loss (c) |
(0.20 |
) |
(0.31 |
) |
(0.35 |
)(d) |
(0.39 |
)(d) |
(0.33 |
)(d) |
(0.36 |
)(d) |
|||||||||||||||
|
Net realized and unrealized gain (loss) on securities |
0.03 |
(2.87 |
) |
(1.44 |
)(d) |
4.17 |
(d) |
0.92 |
(d) |
(0.35 |
)(d) |
||||||||||||||||
|
Total from investment operations |
(0.17 |
) |
(3.18 |
) |
(1.79 |
) |
3.78 |
0.59 |
(0.71 |
) |
|||||||||||||||||
|
Less distributions |
|||||||||||||||||||||||||||
|
From net investment income |
- |
- |
- |
- |
- |
- |
|||||||||||||||||||||
|
From net capital gain |
- |
- |
- |
- |
- |
- |
|||||||||||||||||||||
|
Total distributions |
- |
- |
- |
- |
- |
- |
|||||||||||||||||||||
|
Redemption fees (c) |
- |
(b) |
- |
(b) |
- |
(b,d) |
- |
(d) |
- |
(b,d) |
0.02 |
(d) |
|||||||||||||||
|
Net asset value, end of year |
$ |
10.11 |
$ |
10.28 |
$ |
13.46 |
$ |
15.25 |
$ |
11.47 |
$ |
10.88 |
|||||||||||||||
|
Total Investment Return (a) |
(1.65 |
)%(e) |
(23.63 |
)% |
(11.74 |
)% |
32.96 |
% |
5.42 |
% |
(5.96 |
)% |
|||||||||||||||
|
Ratios/Supplemental Data |
|||||||||||||||||||||||||||
|
Net assets, end of year (000's) |
$ |
4,923 |
$ |
4,875 |
$ |
5,981 |
$ |
6,058 |
$ |
4,500 |
$ |
4,052 |
|||||||||||||||
|
Ratio of net investment loss to average net assets |
(3.90 |
)%(f) |
(2.48 |
)% |
(2.46 |
)% |
(2.88 |
)% |
(3.01 |
)% |
(3.11 |
)% |
|||||||||||||||
|
Ratio of expenses to average net assets |
4.95 |
%(f) |
3.68 |
% |
3.42 |
% |
3.69 |
% |
4.19 |
% |
4.16 |
% |
|||||||||||||||
|
Fund portfolio turnover rate |
17 |
%(f) |
25 |
% |
22 |
% |
15 |
% |
24 |
% |
12 |
% |
|||||||||||||||
|
Class C |
|||||||||||||||||||||||||||
|
For the six months ended |
For the year ended December 31, |
||||||||||||||||||||||||||
|
June 30, 2016 |
2015 |
2014 |
2013 |
2012 |
2011 |
||||||||||||||||||||||
|
Per Share Operating Performance |
|||||||||||||||||||||||||||
|
Net asset value, beginning of year |
$ |
9.16 |
$ |
12.09 |
$ |
13.80 |
$ |
10.46 |
$ |
10.00 |
$ |
10.72 |
|||||||||||||||
|
Income from investing operations |
|||||||||||||||||||||||||||
|
Net investment loss (c) |
(0.21 |
) |
(0.37 |
) |
(0.42 |
)(d) |
(0.45 |
)(d) |
(0.38 |
)(d) |
(0.42 |
)(d) |
|||||||||||||||
|
Net realized and unrealized gain (loss) on securities |
0.03 |
(2.56 |
) |
(1.29 |
)(d) |
3.79 |
(d) |
0.84 |
(d) |
(0.30 |
)(d) |
||||||||||||||||
|
Total from investment operations |
(0.18 |
) |
(2.93 |
) |
(1.71 |
) |
3.34 |
0.46 |
(0.72 |
) |
|||||||||||||||||
|
Less distributions |
|||||||||||||||||||||||||||
|
From net investment income |
- |
- |
- |
- |
- |
- |
|||||||||||||||||||||
|
From net capital gain |
- |
- |
- |
- |
- |
- |
|||||||||||||||||||||
|
Total distributions |
- |
- |
- |
- |
- |
- |
|||||||||||||||||||||
|
Redemption fees (c) |
- |
(b) |
- |
(b) |
- |
(b,d) |
- |
(d) |
- |
(b,d) |
- |
(b,d) |
|||||||||||||||
|
Net asset value, end of year |
$ |
8.98 |
$ |
9.16 |
$ |
12.09 |
$ |
13.80 |
$ |
10.46 |
$ |
10.00 |
|||||||||||||||
|
Total Investment Return |
(1.97 |
)%(e) |
(24.23 |
)% |
(12.39 |
)% |
31.93 |
% |
4.60 |
% |
(6.72 |
)% |
|||||||||||||||
|
Ratios/Supplemental Data |
|||||||||||||||||||||||||||
|
Net assets, end of year (000's) |
$ |
529 |
$ |
661 |
$ |
891 |
$ |
1,204 |
$ |
854 |
$ |
1,044 |
|||||||||||||||
|
Ratio of net investment loss to average net assets |
(4.61 |
)%(f) |
(3.26 |
)% |
(3.22 |
)% |
(3.61 |
)% |
(3.77 |
)% |
(3.92 |
)% |
|||||||||||||||
|
Ratio of expenses to average net assets |
5.68 |
%(f) |
4.46 |
% |
4.17 |
% |
4.42 |
% |
4.95 |
% |
4.91 |
% |
|||||||||||||||
|
Fund portfolio turnover rate |
17 |
%(f) |
25 |
% |
22 |
% |
15 |
% |
24 |
% |
12 |
% |
|||||||||||||||
(a) The Fund's maximum sales charge is not included in the total return computation.
(b) The amount is less than $0.005 and rounded to zero.
(c) Based on average shares outstanding.
(d) Net investment income, net realized and unrealized gain (loss) on securities and redemptions fees for Class A and Class C for the years ended December 31, 2011 to December 31, 2014 were restated during the year ended December 31, 2015. See Note 2(H).
(e) Not annualized
(f) Annualized
See Accompanying Notes to Financial Statements which are an integral part of these financial statements.
57
Pacific Advisors Fund Inc.
Financial Highlights (Unaudited)
(For a share outstanding throughout the period)
|
Small Cap Value Fund |
|||||||||||||||||||||||||||
|
Class A |
|||||||||||||||||||||||||||
|
For the six months ended |
For the year ended December 31, |
||||||||||||||||||||||||||
|
June 30, 2016 |
2015 |
2014 |
2013 |
2012 |
2011 |
||||||||||||||||||||||
|
Per Share Operating Performance |
|||||||||||||||||||||||||||
|
Net asset value, beginning of year |
$ |
24.72 |
$ |
44.51 |
$ |
61.41 |
$ |
38.50 |
$ |
34.42 |
$ |
31.68 |
|||||||||||||||
|
Income from investing operations |
|||||||||||||||||||||||||||
|
Net investment loss (c) |
(0.45 |
) |
(1.06 |
) |
(1.11 |
)(d) |
(0.99 |
)(d) |
(0.76 |
)(d) |
(0.77 |
)(d) |
|||||||||||||||
|
Net realized and unrealized gain (loss) on securities |
(0.84 |
) |
(12.25 |
) |
(12.20 |
)(d) |
23.87 |
(d) |
4.79 |
(d) |
3.50 |
(d) |
|||||||||||||||
|
Total from investment operations |
(1.29 |
) |
(13.31 |
) |
(13.31 |
) |
22.88 |
4.03 |
2.73 |
||||||||||||||||||
|
Less distributions |
|||||||||||||||||||||||||||
|
From net investment income |
- |
- |
- |
- |
- |
- |
|||||||||||||||||||||
|
From net capital gain |
- |
(6.50 |
) |
(3.62 |
) |
- |
- |
- |
|||||||||||||||||||
|
Total distributions |
- |
(6.50 |
) |
(3.62 |
) |
- |
- |
- |
|||||||||||||||||||
|
Redemption fees (c) |
- |
(b) |
0.02 |
0.03 |
(d) |
0.03 |
(d) |
0.05 |
(d) |
0.01 |
(d) |
||||||||||||||||
|
Net asset value, end of year |
$ |
23.43 |
$ |
24.72 |
$ |
44.51 |
$ |
61.41 |
$ |
38.50 |
$ |
34.42 |
|||||||||||||||
|
Total Investment Return (a) |
(5.22 |
)%(e) |
(30.31 |
)% |
(21.60 |
)% |
59.51 |
% |
11.85 |
% |
8.65 |
% |
|||||||||||||||
|
Ratios/Supplemental Data |
|||||||||||||||||||||||||||
|
Net assets, end of year (000's) |
$ |
24,923 |
$ |
33,942 |
$ |
122,642 |
$ |
199,163 |
$ |
85,607 |
$ |
88,323 |
|||||||||||||||
|
Ratio of net investment loss to average net assets |
(3.90 |
)%(f) |
(2.64 |
)% |
(1.72 |
)% |
(1.93 |
)% |
(2.06 |
)% |
(2.31 |
)% |
|||||||||||||||
|
Ratio of expenses to average net assets |
4.26 |
%(f) |
3.03 |
% |
2.19 |
% |
2.31 |
% |
2.71 |
% |
2.88 |
% |
|||||||||||||||
|
Fund portfolio turnover rate |
1 |
%(f) |
7 |
% |
16 |
% |
9 |
% |
12 |
% |
9 |
% |
|||||||||||||||
|
Class C |
|||||||||||||||||||||||||||
|
For the six months ended |
For the year ended December 31, |
||||||||||||||||||||||||||
|
June 30, 2016 |
2015 |
2014 |
2013 |
2012 |
2011 |
||||||||||||||||||||||
|
Per Share Operating Performance |
|||||||||||||||||||||||||||
|
Net asset value, beginning of year |
$ |
19.01 |
$ |
36.59 |
$ |
51.70 |
$ |
32.65 |
$ |
29.41 |
$ |
27.26 |
|||||||||||||||
|
Income from investing operations |
|||||||||||||||||||||||||||
|
Net investment loss (c) |
(0.41 |
) |
(1.11 |
) |
(1.29 |
)(d) |
(1.16 |
)(d) |
(0.88 |
)(d) |
(0.87 |
)(d) |
|||||||||||||||
|
Net realized and unrealized gain (loss) on securities |
(0.65 |
) |
(9.99 |
) |
(10.23 |
)(d) |
20.19 |
(d) |
4.08 |
(d) |
2.99 |
(d) |
|||||||||||||||
|
Total from investment operations |
(1.06 |
) |
(11.10 |
) |
(11.52 |
) |
19.03 |
3.20 |
2.12 |
||||||||||||||||||
|
Less distributions |
|||||||||||||||||||||||||||
|
From net investment income |
- |
- |
- |
- |
- |
- |
|||||||||||||||||||||
|
From net capital gain |
- |
(6.50 |
) |
(3.62 |
) |
- |
- |
- |
|||||||||||||||||||
|
Total distributions |
- |
(6.50 |
) |
(3.62 |
) |
- |
- |
- |
|||||||||||||||||||
|
Redemption fees (c) |
- |
(b) |
0.02 |
0.03 |
(d) |
0.02 |
(d) |
0.04 |
(d) |
0.03 |
(d) |
||||||||||||||||
|
Net asset value, end of year |
$ |
17.95 |
$ |
19.01 |
$ |
36.59 |
$ |
51.70 |
$ |
32.65 |
$ |
29.41 |
|||||||||||||||
|
Total Investment Return |
(5.58 |
)%(e) |
(30.83 |
)% |
(22.19 |
)% |
58.35 |
% |
11.02 |
% |
7.89 |
% |
|||||||||||||||
|
Ratios/Supplemental Data |
|||||||||||||||||||||||||||
|
Net assets, end of year (000's) |
$ |
4,336 |
$ |
5,180 |
$ |
10,498 |
$ |
14,646 |
$ |
6,912 |
$ |
6,949 |
|||||||||||||||
|
Ratio of net investment loss to average net assets |
(4.66 |
)%(f) |
(3.45 |
)% |
(2.47 |
)% |
(2.69 |
)% |
(2.80 |
)% |
(3.05 |
)% |
|||||||||||||||
|
Ratio of expenses to average net assets |
5.03 |
%(f) |
3.88 |
% |
2.95 |
% |
3.08 |
% |
3.45 |
% |
3.62 |
% |
|||||||||||||||
|
Fund portfolio turnover rate |
1 |
%(f) |
7 |
% |
16 |
% |
9 |
% |
12 |
% |
9 |
% |
|||||||||||||||
(a) The Fund's maximum sales charge is not included in the total return computation.
(b) The amount is less than $0.005 and rounded to zero.
(c) Based on average shares outstanding.
(d) Net investment loss, net realized and unrealized gain (loss) on securities and redemptions fees for Class A and Class C for the years ended December 31, 2011 to December 31, 2014 were restated during the year ended December 31, 2015. See Note 2(H).
(e) Not annualized
(f) Annualized
See Accompanying Notes to Financial Statements which are an integral part of these financial statements.
58
Pacific Advisors Fund Inc.
Financial Highlights (Unaudited)
(For a share outstanding throughout the period)
|
Small Cap Value Fund |
|||||||||||||||||||||||||||
|
Class I |
|||||||||||||||||||||||||||
|
For the six months ended |
For the year ended December 31, |
||||||||||||||||||||||||||
|
June 30, 2016 |
2015 |
2014 |
2013 |
2012 |
2011 |
||||||||||||||||||||||
|
Per Share Operating Performance |
|||||||||||||||||||||||||||
|
Net asset value, beginning of year |
$ |
30.87 |
$ |
53.06 |
$ |
72.10 |
$ |
45.13 |
$ |
39.15 |
$ |
35.95 |
|||||||||||||||
|
Income from investing operations |
|||||||||||||||||||||||||||
|
Net investment loss (c) |
(0.53 |
) |
(1.20 |
) |
(1.15 |
)(d) |
(1.32 |
)(d) |
(0.85 |
)(d) |
(0.77 |
)(d) |
|||||||||||||||
|
Net realized and unrealized gain (loss) on securities |
(1.06 |
) |
(14.52 |
) |
(14.30 |
)(d) |
28.27 |
(d) |
6.76 |
(d) |
3.97 |
(d) |
|||||||||||||||
|
Total from investment operations |
(1.59 |
) |
(15.72 |
) |
(15.45 |
) |
26.95 |
5.91 |
3.20 |
||||||||||||||||||
|
Less distributions |
|||||||||||||||||||||||||||
|
From net investment income |
- |
- |
- |
- |
- |
- |
|||||||||||||||||||||
|
From net capital gain |
- |
(6.50 |
) |
(3.62 |
) |
- |
- |
- |
|||||||||||||||||||
|
Total distributions |
- |
(6.50 |
) |
(3.62 |
) |
- |
- |
- |
|||||||||||||||||||
|
Redemption fees (c) |
- |
(b) |
0.03 |
0.03 |
(d) |
0.02 |
(d) |
0.07 |
(d) |
- |
(b,d) |
||||||||||||||||
|
Net asset value, end of year |
$ |
29.28 |
$ |
30.87 |
$ |
53.06 |
$ |
72.10 |
$ |
45.13 |
$ |
39.15 |
|||||||||||||||
|
Total Investment Return |
(5.15 |
)%(e) |
(29.94 |
)% |
(21.36 |
)% |
59.76 |
% |
15.27 |
% |
8.90 |
% |
|||||||||||||||
|
Ratios/Supplemental Data |
|||||||||||||||||||||||||||
|
Net assets, end of year (000's) |
$ |
147 |
$ |
155 |
$ |
1,402 |
$ |
380 |
$ |
7 |
$ |
6 |
|||||||||||||||
|
Ratio of net investment loss to average net assets |
(3.69 |
)%(f) |
(2.55 |
)% |
(1.54 |
)% |
(1.93 |
)% |
(2.02 |
)% |
(2.08 |
)% |
|||||||||||||||
|
Ratio of expenses to average net assets |
4.06 |
%(f) |
2.86 |
% |
2.03 |
% |
2.06 |
% |
2.63 |
% |
2.65 |
% |
|||||||||||||||
|
Fund portfolio turnover rate |
1 |
%(f) |
7 |
% |
16 |
% |
9 |
% |
12 |
% |
9 |
% |
|||||||||||||||
(a) The Fund's maximum sales charge is not included in the total return computation.
(b) The amount is less than $0.005 and rounded to zero.
(c) Based on average shares outstanding.
(d) Net investment income, net realized and unrealized gain (loss) on securities and redemptions fees for Class A and Class C for the years ended December 31, 2011 to December 31, 2014 were restated during the year ended December 31, 2015. See Note 2(H).
(e) Not annualized
(f) Annualized
See Accompanying Notes to Financial Statements which are an integral part of these financial statements.
59
Pacific Advisors Fund Inc.
Notes to Financial Statements (Unaudited)
June 30, 2016
Note 1. Organization
Pacific Advisors Fund Inc. (the "Company") is an open-end diversified investment management company registered under the Investment Company Act of 1940 ("the 40 Act"), as amended. The Company currently offers five Funds: Income and Equity Fund, Balanced Fund, Large Cap Value Fund, Mid Cap Value Fund and Small Cap Value Fund (individually, a "Fund," or collectively, the "Funds"). Each Fund is a separate investment portfolio of the Company with a distinct investment objective, investment program, policies and restrictions. One series of the Company, the Government Securities Fund, was liquidated on June 24, 2016.
The Income and Equity Fund seeks to provide current income and, secondarily, long-term capital appreciation. The Balanced Fund seeks to achieve long-term capital appreciation and income consistent with reduced risk. The Large Cap Value Fund seeks to achieve long-term capital appreciation. The Mid Cap Value Fund seeks to achieve long-term capital appreciation. The Small Cap Value Fund seeks to provide capital appreciation through investment in small capitalization companies.
The Funds offer Class A and Class C shares. In addition to Class A and Class C shares, the Small Cap Value Fund also offers Class I shares. Each Class has equal rights as to assets and voting privileges except that Class A and Class C each has exclusive voting rights with respect to its distribution plan. Investment income, realized and unrealized capital gains and losses, and the common expenses of each Fund are allocated on a pro rata basis to each Class based on the relative net assets of each Class to the total net assets of the Fund. Each Class of shares differs in its respective service and distribution expenses and may differ in its transfer agent, registration, and certain other Class-specific fees and expenses.
The Company enters into contracts that contain a variety of indemnifications. The Company's maximum exposure under these arrangements is unknown. However, the Company has not had prior claims or losses pursuant to these contracts and expects the risk of loss to be remote.
Note 2. Significant Accounting Policies
A. Security Valuation and Fair Value Measurement. Securities, including American Depository Receipts (ADRs), listed on a national securities exchange and certain over-the-counter ("OTC") issues traded on the NASDAQ national market system are valued at the last quoted sale price at the close of the New York Stock Exchange. OTC issues not quoted on the NASDAQ system, and other equity securities for which no sale price is available, are valued at the last bid price as obtained from published sources or real time quote services, where available, and otherwise from brokers who are market makers for such securities. For securities that mature in 60 days or less, the Funds may utilize the amortized cost method of valuation if it is reasonable to conclude it approximates fair value. In determining the fair value of other debt securities, Pacific Global Investment Management Company, Inc. (the "Investment Manager") utilizes independent pricing services approved by the Board of Directors using one or more of the following valuation techniques:
(1) a matrix pricing approach that considers market inputs including, in approximate order of priority, the following: benchmark yields, reported trades, broker/dealer quotes, issuer spreads, two-sided markets, benchmark securities, bids, offers and reference data including market research publications; market indicators, industry and economic events. Evaluators may prioritize inputs differently on any given day for any security based on market conditions, and not all inputs listed are available for use in the evaluation process for each security evaluation on any given day; (2) a comparison of the value of the borrower's outstanding equity and debt to that of comparable public companies; (3) a discounted cash flow analysis. Fair value determinations are made by the Investment Manager based on the Company's Fair Value Procedure, as adopted by the Board of Directors. In conducting its assessment and analysis for purpose of determining fair value, the Investment Manager uses its discretion and judgment in considering and appraising the relevant factors, including examining the source and nature of the quotations, to validate that the quotations and prices are representative of fair value.
Various inputs are used to determine the fair value of each Fund's investments. For financial statements, these inputs are summarized in the three broad levels listed below. Level 1 inputs are based on quoted prices in active markets for identical securities. Level 2 inputs are based on significant observable market inputs, such as quoted prices for similar securities and quoted prices in inactive markets. Level 3 inputs are significant unobservable inputs that reflect the Fund's own assumptions in determining the fair value of investments. The valuation levels are not necessarily an indication of the risk associated with investing in those securities.
60
Pacific Advisors Fund Inc.
Notes to Financial Statements (Unaudited)
June 30, 2016
The following is a summary of the inputs used to value each Fund's investment securities as of June 30, 2016.
|
Income and Equity Fund |
Balanced Fund |
Large Cap Value Fund |
Mid Cap Value Fund |
Small Cap Value Fund |
|||||||||||||||||||
|
Level 1 - Quoted Prices |
|||||||||||||||||||||||
|
Common Stock |
|||||||||||||||||||||||
|
Consumer Discretionary |
$ |
815,237 |
$ |
764,606 |
$ |
1,547,496 |
$ |
1,692,202 |
$ |
5,111,970 |
|||||||||||||
|
Consumer Staples |
1,309,928 |
173,570 |
1,404,482 |
173,934 |
2,155,592 |
||||||||||||||||||
|
Energy |
368,040 |
416,150 |
140,610 |
406,480 |
5,969,386 |
||||||||||||||||||
|
Financials |
415,885 |
515,898 |
1,113,961 |
313,801 |
2,310,540 |
||||||||||||||||||
|
Health Care |
771,920 |
552,187 |
317,200 |
164,080 |
- |
||||||||||||||||||
|
Industrials |
1,225,135 |
1,203,359 |
1,227,470 |
2,415,986 |
14,423,015 |
||||||||||||||||||
|
Information Technology |
702,178 |
575,475 |
1,670,784 |
241,440 |
- |
||||||||||||||||||
|
Materials |
427,490 |
- |
- |
153,965 |
- |
||||||||||||||||||
|
Telecommunication Services |
528,130 |
- |
- |
- |
- |
||||||||||||||||||
|
Utilities |
713,505 |
- |
- |
- |
- |
||||||||||||||||||
|
Preferred Stock |
|||||||||||||||||||||||
|
Financials |
355,813 |
96,000 |
- |
- |
- |
||||||||||||||||||
|
Level 1 Total |
7,633,261 |
4,297,245 |
7,422,003 |
5,561,888 |
29,970,503 |
||||||||||||||||||
|
Level 2 - Other significant observable inputs |
|||||||||||||||||||||||
|
Corporate Bond |
|||||||||||||||||||||||
|
Consumer Discretionary |
988,366 |
108,000 |
- |
- |
- |
||||||||||||||||||
|
Consumer Staples |
158,628 |
- |
- |
- |
- |
||||||||||||||||||
|
Energy |
765,600 |
613,285 |
- |
- |
- |
||||||||||||||||||
|
Financials |
2,208,327 |
496,845 |
- |
- |
- |
||||||||||||||||||
|
Health Care |
248,425 |
104,250 |
- |
- |
- |
||||||||||||||||||
|
Industrials |
1,126,148 |
309,680 |
- |
- |
- |
||||||||||||||||||
|
Information Technology |
936,398 |
196,098 |
- |
- |
- |
||||||||||||||||||
|
Materials |
635,133 |
105,750 |
- |
- |
- |
||||||||||||||||||
|
Telecommunication Services |
129,531 |
- |
- |
- |
- |
||||||||||||||||||
|
Utilities |
151,013 |
- |
- |
- |
- |
||||||||||||||||||
|
Level 2 Total |
7,347,569 |
1,933,908 |
- |
- |
- |
||||||||||||||||||
|
Level 3 - Significant unobservable inputs |
- |
- |
- |
- |
- |
||||||||||||||||||
|
Total Investments |
$ |
14,980,830 |
$ |
6,231,153 |
$ |
7,422,003 |
$ |
5,561,888 |
$ |
29,970,503 |
|||||||||||||
Equity securities (common and preferred stock) that are actively traded and market priced are classified as Level 1 securities. All fixed income securities are classified as Level 2 securities. The Funds had no Level 3 holdings during the period ended June 30, 2016. In addition, the Funds are required to disclose the amounts of significant transfers between Level 1 and Level 2 of the fair value hierarchy and the reasons for these transfers. The Investment Manager has evaluated the Funds' positions for the period ended June 30, 2016, and determined that, for purposes of fair value pricing measurement, there were no transfers between Level 1 and Level 2.
B. Cash and Cash Equivalents. The Company considers all highly liquid financial instruments with maturities of less than three months when acquired to be cash equivalents. For cash management purposes, each Fund may concentrate cash with the Fund's custodian, United Missouri Bank, n.a. ("UMB"). This typically results in cash balances exceeding the Federal Deposit Insurance Corporation ("FDIC") insurance limits. As of June 30, 2016, Income and Equity Fund held $1,448,050 as reserves at UMB Bank, n.a. that exceeded the FDIC insurance limits.
C. Security Transactions and Investment Income. Security transactions are accounted for on the trade date. The cost of investments sold is determined by use of the specific identification method for both financial reporting and federal income tax purposes. Dividends are recorded on the ex-dividend date. Interest income is recorded on an accrual basis. Premium or discount on debt securities are amortized or accreted using the effective interest method.
D. Dividends and Distributions to Shareholders. The Income and Equity Fund declare and distribute dividends of its net investment income, if any, quarterly. The Balanced Fund, Large Cap Value Fund, Mid Cap Value Fund and Small Cap Value Fund declare and distribute dividends of their net investment income, if any, annually. In addition, each Fund declares and distributes a capital gain dividend, if any, annually. The Board of Directors determines the amount and timing of such payments.
61
Pacific Advisors Fund Inc.
Notes to Financial Statements (Unaudited)
June 30, 2016
E. Federal Income Tax. The Company intends to comply with the requirements of Subchapter M of the Internal Revenue Code applicable to regulated investment companies and to distribute substantially all of their taxable income to their shareholders. Therefore, no federal income tax provision is required.
Management has analyzed the Funds' tax positions taken on federal income tax returns for all open tax years and for the year ended December 31, 2015 and has concluded that no provision for income tax is required in the Funds' financial statements. Tax years 2012, 2013, 2014 and 2015 are still subject to examination by major federal jurisdictions. Tax years 2011, 2012, 2013, 2014 and 2015 are still subject to examination by major state jurisdictions.
The Funds recognize interest and penalties, if any, related to unrecognized tax benefits as income tax expense in the Statement of Operations. During the year, the Funds did not incur any interest or penalties.
At December 31, 2015, components of distributable earnings (accumulated deficits) on a tax basis were as follows:
|
Income and Equity Fund |
Balanced Fund |
Large Cap Value Fund |
Mid Cap Value Fund |
Small Cap Value Fund |
|||||||||||||||||||
|
Undistributed ordinary income |
$ |
2,153 |
$ |
- |
$ |
- |
$ |
- |
$ |
- |
|||||||||||||
|
Undistributed long-term gains |
- |
48,724 |
- |
- |
4,266,367 |
||||||||||||||||||
|
Capital loss carry forward* |
(412,126 |
) |
- |
(63,724 |
) |
(1,292,826 |
) |
- |
|||||||||||||||
|
Net unrealized appreciation (depreciation) on investments |
1,361,795 |
333,863 |
2,531,637 |
322,994 |
(299,162 |
) |
|||||||||||||||||
|
Accumulated earnings |
$ |
951,822 |
$ |
382,587 |
$ |
2,467,913 |
$ |
(969,832 |
) |
$ |
3,967,205 |
||||||||||||
The difference between book basis and tax basis unrealized appreciation (depreciation) is attributable primarily to the tax deferral of losses on wash sales and characterization of certain income items. The Funds intend to treat post October losses (net capital losses incurred for the period subsequent to October 31, 2015 through the year end December 31, 2015) as having been incurred in the next fiscal year.
The Funds intend to utilize provisions of the federal income tax laws which allow them to carry a capital loss realized prior to 2011 forward for eight years following the year of the loss and offset such losses against any future realized capital gains. During the most recent fiscal year, the following capital losses carried forward have been utilized:
|
Income and Equity Fund |
Balanced Fund |
Large Cap Value Fund |
Mid Cap Value Fund |
Small Cap Value Fund |
|||||||||||||||||||
|
Capital loss carryforward utilized |
$ |
78,113 |
$ |
- |
$ |
- |
$ |
- |
$ |
- |
|||||||||||||
* As of December 31, 2015, the following Funds had accumulated net realized losses on investment transactions that represent capital loss carryforwards for federal income tax purposes, which expire as follows:
|
Capital losses expiring in: |
|||||||||||||||
|
2016 |
2017 |
Total |
|||||||||||||
|
Income and Equity Fund |
$ |
24,060 |
$ |
388,066 |
$ |
412,126 |
|||||||||
|
Balanced Fund |
- |
- |
- |
||||||||||||
|
Large Cap Value Fund |
- |
- |
- |
||||||||||||
|
Mid Cap Value Fund |
542,664 |
640,167 |
1,182,831 |
||||||||||||
|
Small Cap Value Fund |
- |
- |
- |
||||||||||||
The Regulated Investment Company Modernization Act of 2010 (the "Act") changed various technical rules governing the tax treatment of regulated investment companies ("RICs") including the Funds. Under the Act, each Fund is permitted to carry forward capital losses incurred in taxable years beginning in 2011 for an unlimited period. However, any losses incurred during those future taxable years will be required to be utilized prior to the losses incurred in pre-enactment taxable years, which carry an expiration date. As a result of this ordering rule, pre-enactment capital loss carryforwards may be more likely to expire unused. Additionally, post-enactment capital loss carryforwards will retain their character as either short-term or long-term capital losses rather than being considered all short-term as permitted under previous regulation.
Finally, the Act contains several provisions aimed at preserving the character of distributions made by a fiscal year RIC during the portion of its taxable year ending after October 31 or December 31, reducing the circumstances under which a RIC might be required to file amended Forms 1099 to restate previously reported distributions.
62
Pacific Advisors Fund Inc.
Notes to Financial Statements (Unaudited)
June 30, 2016
During the most recent fiscal year, the following capital losses carried forward under the provisions of the Act were utilized:
|
Loss Carryforward Utilized |
|||||||||||
|
Short Term |
Long Term |
||||||||||
|
Income and Equity Fund |
$ |
7,526 |
$ |
- |
|||||||
Losses that will be carried forward under the provisions of the Act are as follows:
|
Loss Carryforward Character |
|||||||||||
|
Short Term |
Long Term |
||||||||||
|
Large Cap Value Fund |
$ |
63,724 |
$ |
- |
|||||||
|
Mid Cap Value Fund |
63,496 |
46,499 |
|||||||||
F. Reclassification of Capital Accounts. Distributions of net investment income and realized gains are determined in accordance with income tax regulations which may differ from GAAP. These differences are due to differing treatments for items such as net operating losses, reclassification of dividends and return of capital. To the extent that these differences are permanent in nature, reclassifications are made among the net asset accounts on the Statement of Assets and Liabilities. Net assets and net asset value per share are not affected by these reclassifications.
For the year ended December 31, 2015, reclassifications among the components of net assets are as follows:
|
Accumulated Undistributed Net Investment Income |
Paid in Capital |
Accumulated Undistributed Net Realized Gain (Loss) on Security Transactions |
|||||||||||||
|
Income and Equity Fund |
$ |
- |
$ |
- |
$ |
- |
|||||||||
|
Balanced Fund |
116,856 |
(116,856 |
) |
- |
|||||||||||
|
Large Cap Value Fund |
59,487 |
(59,485 |
) |
(2 |
) |
||||||||||
|
Mid Cap Value Fund |
168,992 |
(168,992 |
) |
- |
|||||||||||
|
Small Cap Value Fund |
2,228,870 |
(2,228,870 |
) |
- |
|||||||||||
The reclassifications were due to net investment losses incurred by the Funds, which are not permitted to be carried forward for tax purposes and differing book and tax treatment of certain securities.
G. Use of Estimates. The preparation of financial statements in conformity with U.S. GAAP requires management to make estimates and assumptions that affect the reported amounts in the financial statements and footnotes. Actual results could differ from those estimates.
H. Accounting Method Change. On December 31, 2015, the Funds elected to change their method of determining net investment income (loss) per share to the average shares method, which determines the net investment income (loss) per share by dividing the net investment income (loss) by the average number of shares outstanding during the year. In prior years the net investment income (loss) per share was determined using the SEC method, which compares ending undistributed income (loss) per share to the beginning undistributed income (loss) per share, adjusted for distributions paid per share. The new method of accounting was adopted as a result of management's determination that the average shares method produced a result that was more reflective of the actual net investment income (loss) on a per share basis during each of the years. The financial highlights for each of the years presented have been adjusted to apply this new method retrospectively. The following financial statement line items for the years 2011-2014 were affected by this change in accounting principle.
|
Financial Highlights |
|||||||||||||||||||
| Income and Equity Fund (Class A) |
2014 |
2013 |
2012 |
2011 |
|||||||||||||||
|
As Computed Under SEC Method |
|||||||||||||||||||
|
Net investment income |
0.21 |
0.10 |
0.15 |
0.21 |
|||||||||||||||
|
Net realized and unrealized gain |
0.52 |
1.28 |
0.48 |
0.01 |
|||||||||||||||
|
Redemption Fees |
0.00 |
0.00 |
0.00 |
0.00 |
|||||||||||||||
63
Pacific Advisors Fund Inc.
Notes to Financial Statements (Unaudited)
June 30, 2016
|
2014 |
2013 |
2012 |
2011 |
||||||||||||||||
|
As Computed Under Average Shares Method |
|||||||||||||||||||
|
Net investment income |
0.22 |
0.14 |
0.15 |
0.22 |
|||||||||||||||
|
Net realized and unrealized gain |
0.51 |
1.24 |
0.48 |
0.00 |
|||||||||||||||
|
Redemption Fees |
0.00 |
0.00 |
0.00 |
0.00 |
|||||||||||||||
|
Effect of Change |
|||||||||||||||||||
|
Net investment income |
0.01 |
0.04 |
0.00 |
0.01 |
|||||||||||||||
|
Net realized and unrealized gain (loss) |
(0.01 |
) |
(0.04 |
) |
0.00 |
(0.01 |
) |
||||||||||||
|
Redemption Fees |
0.00 |
0.00 |
0.00 |
0.00 |
|||||||||||||||
| Income and Equity Fund (Class C) | |||||||||||||||||||
|
As Computed Under SEC Method |
|||||||||||||||||||
|
Net investment income (loss) |
0.14 |
0.06 |
(0.01 |
) |
0.09 |
||||||||||||||
|
Net realized and unrealized gain |
0.47 |
1.18 |
0.55 |
0.05 |
|||||||||||||||
|
Redemption Fees |
0.00 |
0.00 |
0.00 |
0.00 |
|||||||||||||||
|
As Computed Under Average Shares Method |
|||||||||||||||||||
|
Net investment income |
0.13 |
0.05 |
0.08 |
0.15 |
|||||||||||||||
|
Net realized and unrealized gain (loss) |
0.48 |
1.19 |
0.46 |
(0.01 |
) |
||||||||||||||
|
Redemption Fees |
0.00 |
0.00 |
0.00 |
0.00 |
|||||||||||||||
|
Effect of Change |
|||||||||||||||||||
|
Net investment income (loss) |
(0.01 |
) |
(0.01 |
) |
0.09 |
0.06 |
|||||||||||||
|
Net realized and unrealized gain (loss) |
0.01 |
0.01 |
(0.09 |
) |
(0.06 |
) |
|||||||||||||
|
Redemption Fees |
0.00 |
0.00 |
0.00 |
0.00 |
|||||||||||||||
| Balanced Fund (Class A) | |||||||||||||||||||
|
As Computed Under SEC Method |
|||||||||||||||||||
|
Net investment income (loss) |
(0.16 |
) |
(0.18 |
) |
(0.03 |
) |
0.00 |
||||||||||||
|
Net realized and unrealized gain (loss) |
(1.15 |
) |
4.21 |
1.34 |
(0.16 |
) |
|||||||||||||
|
Redemption Fees |
0.00 |
0.00 |
0.00 |
0.00 |
|||||||||||||||
|
As Computed Under Average Shares Method |
|||||||||||||||||||
|
Net investment income (loss) |
(0.14 |
) |
(0.15 |
) |
(0.04 |
) |
0.04 |
||||||||||||
|
Net realized and unrealized gain (loss) |
(1.17 |
) |
4.17 |
1.35 |
(0.20 |
) |
|||||||||||||
|
Redemption Fees |
0.00 |
0.01 |
0.00 |
0.00 |
|||||||||||||||
|
Effect of Change |
|||||||||||||||||||
|
Net investment income (loss) |
0.02 |
0.03 |
(0.01 |
) |
0.04 |
||||||||||||||
|
Net realized and unrealized gain (loss) |
(0.02 |
) |
(0.04 |
) |
0.01 |
(0.04 |
) |
||||||||||||
|
Redemption Fees |
0.00 |
0.01 |
0.00 |
0.00 |
|||||||||||||||
| Balanced Fund (Class C) | |||||||||||||||||||
|
As Computed Under SEC Method |
|||||||||||||||||||
|
Net investment loss |
(0.40 |
) |
(0.54 |
) |
(0.39 |
) |
(0.15 |
) |
|||||||||||
|
Net realized and unrealized gain (loss) |
(0.91 |
) |
4.16 |
1.51 |
(0.10 |
) |
|||||||||||||
|
Redemption Fees |
0.00 |
0.00 |
0.00 |
0.00 |
|||||||||||||||
|
As Computed Under Average Shares Method |
|||||||||||||||||||
|
Net investment loss |
(0.24 |
) |
(0.25 |
) |
(0.13 |
) |
(0.06 |
) |
|||||||||||
|
Net realized and unrealized gain (loss) |
(1.07 |
) |
3.87 |
1.25 |
(0.19 |
) |
|||||||||||||
|
Redemption Fees |
0.00 |
0.00 |
0.00 |
0.00 |
|||||||||||||||
|
Effect of Change |
|||||||||||||||||||
|
Net investment income |
0.16 |
0.29 |
0.26 |
0.09 |
|||||||||||||||
|
Net realized and unrealized loss |
(0.16 |
) |
(0.29 |
) |
(0.26 |
) |
(0.09 |
) |
|||||||||||
|
Redemption Fees |
0.00 |
0.00 |
0.00 |
0.00 |
|||||||||||||||
| Large Cap Value Fund (Class A) | |||||||||||||||||||
|
As Computed Under SEC Method |
|||||||||||||||||||
|
Net investment income |
0.02 |
0.03 |
0.04 |
0.11 |
|||||||||||||||
|
Net realized and unrealized gain |
1.28 |
2.94 |
1.00 |
0.21 |
|||||||||||||||
|
Redemption Fees |
0.00 |
0.00 |
0.00 |
0.00 |
|||||||||||||||
|
As Computed Under Average Shares Method |
|||||||||||||||||||
|
Net investment loss |
(0.07 |
) |
(0.02 |
) |
(0.02 |
) |
(0.06 |
) |
|||||||||||
|
Net realized and unrealized gain |
1.37 |
2.99 |
1.06 |
0.38 |
|||||||||||||||
|
Redemption Fees |
0.00 |
0.00 |
0.00 |
0.00 |
|||||||||||||||
64
Pacific Advisors Fund Inc.
Notes to Financial Statements (Unaudited)
June 30, 2016
|
2014 |
2013 |
2012 |
2011 |
||||||||||||||||
|
Effect of Change |
|||||||||||||||||||
|
Net investment loss |
(0.09 |
) |
(0.05 |
) |
(0.06 |
) |
(0.17 |
) |
|||||||||||
|
Net realized and unrealized gain |
0.09 |
0.05 |
0.06 |
0.17 |
|||||||||||||||
|
Redemption Fees |
0.00 |
0.00 |
0.00 |
0.00 |
|||||||||||||||
| Large Cap Value Fund (Class C) | |||||||||||||||||||
|
As Computed Under SEC Method |
|||||||||||||||||||
|
Net investment income (loss) |
0.68 |
0.32 |
(0.69 |
) |
(0.42 |
) |
|||||||||||||
|
Net realized and unrealized gain |
0.38 |
2.24 |
1.55 |
0.64 |
|||||||||||||||
|
Redemption Fees |
0.00 |
0.00 |
0.00 |
0.00 |
|||||||||||||||
|
As Computed Under Average Shares Method |
|||||||||||||||||||
|
Net investment loss |
(0.15 |
) |
(0.10 |
) |
(0.09 |
) |
(0.12 |
) |
|||||||||||
|
Net realized and unrealized gain |
1.21 |
2.66 |
0.95 |
0.34 |
|||||||||||||||
|
Redemption Fees |
0.00 |
0.00 |
0.00 |
0.00 |
|||||||||||||||
|
Effect of Change |
|||||||||||||||||||
|
Net investment income (loss) |
(0.83 |
) |
(0.42 |
) |
0.60 |
0.30 |
|||||||||||||
|
Net realized and unrealized gain (loss) |
0.83 |
0.42 |
(0.60 |
) |
(0.30 |
) |
|||||||||||||
|
Redemption Fees |
0.00 |
0.00 |
0.00 |
0.00 |
|||||||||||||||
| Mid Cap Value Fund (Class A) | |||||||||||||||||||
|
As Computed Under SEC Method |
|||||||||||||||||||
|
Net investment loss |
(0.11 |
) |
(0.36 |
) |
(0.25 |
) |
(0.13 |
) |
|||||||||||
|
Net realized and unrealized gain (loss) |
(1.68 |
) |
4.14 |
0.84 |
(0.56 |
) |
|||||||||||||
|
Redemption Fees |
0.00 |
0.00 |
0.00 |
0.00 |
|||||||||||||||
|
As Computed Under Average Shares Method |
|||||||||||||||||||
|
Net investment loss |
(0.35 |
) |
(0.39 |
) |
(0.33 |
) |
(0.36 |
) |
|||||||||||
|
Net realized and unrealized gain (loss) |
(1.44 |
) |
4.17 |
0.92 |
(0.35 |
) |
|||||||||||||
|
Redemption Fees |
0.00 |
0.00 |
0.00 |
0.02 |
|||||||||||||||
|
Effect of Change |
|||||||||||||||||||
|
Net investment loss |
(0.24 |
) |
(0.03 |
) |
(0.08 |
) |
(0.23 |
) |
|||||||||||
|
Net realized and unrealized gain |
0.24 |
0.03 |
0.08 |
0.21 |
|||||||||||||||
|
Redemption Fees |
0.00 |
0.00 |
0.00 |
0.02 |
|||||||||||||||
| Mid Cap Value Fund (Class C) | |||||||||||||||||||
|
As Computed Under SEC Method |
|||||||||||||||||||
|
Net investment income (loss) |
(2.95 |
) |
0.48 |
(3.40 |
) |
(4.28 |
) |
||||||||||||
|
Net realized and unrealized gain |
1.24 |
2.86 |
3.86 |
3.56 |
|||||||||||||||
|
Redemption Fees |
0.00 |
0.00 |
0.00 |
0.00 |
|||||||||||||||
|
As Computed Under Average Shares Method |
|||||||||||||||||||
|
Net investment loss |
(0.42 |
) |
(0.45 |
) |
(0.38 |
) |
(0.42 |
) |
|||||||||||
|
Net realized and unrealized gain (loss) |
(1.29 |
) |
3.79 |
0.84 |
(0.30 |
) |
|||||||||||||
|
Redemption Fees |
0.00 |
0.00 |
0.00 |
0.00 |
|||||||||||||||
|
Effect of Change |
|||||||||||||||||||
|
Net investment income (loss) |
2.53 |
(0.93 |
) |
3.02 |
3.86 |
||||||||||||||
|
Net realized and unrealized gain (loss) |
(2.53 |
) |
0.93 |
(3.02 |
) |
(3.86 |
) |
||||||||||||
|
Redemption Fees |
0.00 |
0.00 |
0.00 |
0.00 |
|||||||||||||||
| Small Cap Value Fund (Class A) | |||||||||||||||||||
|
As Computed Under SEC Method |
|||||||||||||||||||
|
Net investment income (loss) |
(2.29 |
) |
1.44 |
(1.70 |
) |
(1.35 |
) |
||||||||||||
|
Net realized and unrealized gain (loss) |
(10.99 |
) |
21.47 |
5.78 |
4.09 |
||||||||||||||
|
Redemption Fees |
0.00 |
0.00 |
0.00 |
0.00 |
|||||||||||||||
|
As Computed Under Average Shares Method |
|||||||||||||||||||
|
Net investment loss |
(1.11 |
) |
(0.99 |
) |
(0.76 |
) |
(0.77 |
) |
|||||||||||
|
Net realized and unrealized gain (loss) |
(12.20 |
) |
23.87 |
4.79 |
3.50 |
||||||||||||||
|
Redemption Fees |
0.03 |
0.03 |
0.05 |
0.01 |
|||||||||||||||
|
Effect of Change |
|||||||||||||||||||
|
Net investment income (loss) |
1.18 |
(2.43 |
) |
0.94 |
0.58 |
||||||||||||||
|
Net realized and unrealized gain (loss) |
(1.21 |
) |
2.40 |
(0.99 |
) |
(0.59 |
) |
||||||||||||
|
Redemption Fees |
0.03 |
0.03 |
0.05 |
0.01 |
|||||||||||||||
65
Pacific Advisors Fund Inc.
Notes to Financial Statements (Unaudited)
June 30, 2016
|
2014 |
2013 |
2012 |
2011 |
||||||||||||||||
| Small Cap Value Fund (Class C) | |||||||||||||||||||
|
As Computed Under SEC Method |
|||||||||||||||||||
|
Net investment income (loss) |
(1.15 |
) |
3.10 |
(2.53 |
) |
(6.46 |
) |
||||||||||||
|
Net realized and unrealized gain (loss) |
(10.34 |
) |
15.95 |
5.77 |
8.61 |
||||||||||||||
|
Redemption Fees |
0.00 |
0.00 |
0.00 |
0.00 |
|||||||||||||||
|
As Computed Under Average Shares Method |
|||||||||||||||||||
|
Net investment loss |
(1.29 |
) |
(1.16 |
) |
(0.88 |
) |
(0.87 |
) |
|||||||||||
|
Net realized and unrealized gain (loss) |
(10.23 |
) |
20.19 |
4.08 |
2.99 |
||||||||||||||
|
Redemption Fees |
0.03 |
0.02 |
0.04 |
0.03 |
|||||||||||||||
|
Effect of Change |
|||||||||||||||||||
|
Net investment income (loss) |
(0.14 |
) |
(4.26 |
) |
1.65 |
5.59 |
|||||||||||||
|
Net realized and unrealized gain (loss) |
0.11 |
4.24 |
(1.69 |
) |
(5.62 |
) |
|||||||||||||
|
Redemption Fees |
0.03 |
0.02 |
0.04 |
0.03 |
|||||||||||||||
| Small Cap Value Fund (Class I) | |||||||||||||||||||
|
As Computed Under SEC Method |
|||||||||||||||||||
|
Net investment income (loss) |
9.85 |
431.95 |
(120.29 |
) |
(0.77 |
) |
|||||||||||||
|
Net realized and unrealized gain (loss) |
(25.27 |
) |
(404.98 |
) |
126.27 |
3.97 |
|||||||||||||
|
Redemption Fees |
0.00 |
0.00 |
0.00 |
0.00 |
|||||||||||||||
|
As Computed Under Average Shares Method |
|||||||||||||||||||
|
Net investment loss |
(1.15 |
) |
(1.32 |
) |
(0.85 |
) |
(0.77 |
) |
|||||||||||
|
Net realized and unrealized gain (loss) |
(14.30 |
) |
28.27 |
6.76 |
3.97 |
||||||||||||||
|
Redemption Fees |
0.03 |
0.02 |
0.07 |
0.00 |
|||||||||||||||
|
Effect of Change |
|||||||||||||||||||
|
Net investment income (loss) |
(11.00 |
) |
(433.27 |
) |
119.44 |
0.00 |
|||||||||||||
|
Net realized and unrealized gain (loss) |
10.97 |
433.25 |
(119.51 |
) |
0.00 |
||||||||||||||
|
Redemption Fees |
0.03 |
0.02 |
0.07 |
0.00 |
|||||||||||||||
Note 3. Investment Management, Distributor and Other Related Party Transactions
The Company and the Funds have entered into investment management agreements ("Management Agreements") with the Investment Manager.
The Management Agreements provide for investment management fees, payable monthly, and calculated at the maximum annual rate of 0.75% of average net assets for the Income and Equity, Balanced, Large Cap Value and Small Cap Value Funds and 1.00% of average net assets for the Mid Cap Value Fund.
In accordance with Expense Limitation Agreements with the Company, the Investment Manager waives its respective management fees to the extent that the actual operating expenses of the following Funds exceed the following thresholds:
|
Class A |
Class C |
||||||||||
|
Income and Equity Fund |
1.95 |
% |
2.70 |
% |
|||||||
|
Large Cap Value Fund |
2.65 |
% |
3.40 |
% |
|||||||
Pursuant to the Expense Limitation Agreements, providing for the voluntary waiver of fees and the assumption of expenses by the Investment Manager, the following amounts were waived for the period ended June 30, 2016.
|
Management Fees Waived |
|||||||
|
Income and Equity Fund |
$ |
53,705 |
|||||
|
Large Cap Value Fund |
27,461 |
||||||
The Investment Manager does not have any rights to recover fees it waives or expenses it may reimburse, with respect to any of the Funds.
66
Pacific Advisors Fund Inc.
Notes to Financial Statements (Unaudited)
June 30, 2016
For the period ended June 30, 2016, Pacific Global Fund Distributors, Inc. ("PGFD"), the principal underwriter for the Company and a wholly-owned subsidiary of the Investment Manager, received commissions on sales of capital stock, after deducting amounts allowed to authorized distributors as commissions. In addition, PGFD, as a registered broker-dealer, may act as broker for the Funds, in conformity with Rule 17e-1 under the Investment Company Act of 1940. The Company's Board of Directors has approved procedures for evaluating the reasonableness of commissions paid to PGFD and periodically reviews these procedures. PGFD will not act as principal in effecting any portfolio transactions for the Funds. The amounts of commissions are as follows:
|
Underwriting Fees Retained |
Commissions Retained |
Brokerage Commissions Received |
|||||||||||||
|
Income and Equity Fund |
$ |
68 |
$ |
6 |
$ |
32 |
|||||||||
|
Balanced Fund |
242 |
232 |
533 |
||||||||||||
|
Large Cap Value Fund |
1,106 |
1,452 |
110 |
||||||||||||
|
Mid Cap Value Fund |
752 |
161 |
47 |
||||||||||||
|
Small Cap Value Fund |
1,158 |
315 |
2,212 |
||||||||||||
The Company has also entered into separate agreements with PGIS that provide for transfer agent fees at a rate of $21 per year per open account and $3.50 per year per closed account, with a minimum charge of $1,800 per month per class for each Fund; fund accounting fees equal to the greater of $1,500 or three basis points for the first hundred million in net assets and one basis point on the balance of net assets for each Fund per month; and annual administrative agent fees of five basis points of average daily net assets of each Fund subject to a maximum annual fee of $50,000 per Fund. The fee is computed and payable monthly. The Company reimburses the Investment Manager for monthly expenses related to the Company's Compliance Program.
On the Statement of Assets and Liabilities, "Accounts payable to related parties" consists of transfer agent fees payable to PGIS.
The Company has adopted a plan of distribution whereby the Funds may pay a service fee to qualified recipients in an amount up to 0.25% per annum of each Fund's average daily net assets for Class A shares. The Company has also adopted a plan of distribution whereby the Funds may pay a service fee to qualified recipients in an amount up to 0.25% per annum of each Fund's average daily net assets for Class C shares and a distribution fee in an amount up to 0.75% per annum of each Fund's average daily net assets for Class C shares. The Company has not adopted a plan of distribution for Class I Shares.
For the period ended June 30, 2016, total distribution and/or service (12b-1) fees were:
|
Class A |
Class C |
Total |
|||||||||||||
|
Income and Equity Fund |
$ |
14,525 |
$ |
13,542 |
$ |
28,067 |
|||||||||
|
Balanced Fund |
4,840 |
12,083 |
16,923 |
||||||||||||
|
Large Cap Value Fund |
7,794 |
5,433 |
13,227 |
||||||||||||
|
Mid Cap Value Fund |
6,174 |
3,160 |
9,334 |
||||||||||||
|
Small Cap Value Fund |
34,970 |
23,103 |
58,073 |
||||||||||||
Note 4. Purchase and Sales of Securities
The following summarizes purchases and sales of investment securities, other than short-term investments, and aggregate gross unrealized appreciation and depreciation on a tax basis by each Fund for the year ended and as of June 30, 2016. The difference between book basis and tax basis unrealized appreciation is attributable primarily to the tax deferral of losses on wash sales.
|
Period ended June 30, 2016 |
As of June 30, 2016 |
||||||||||||||||||||||||||
|
Cost of Purchases |
Proceeds From Sales |
Tax Cost of Securities |
Gross Unrealized Appreciation |
Gross Unrealized Depreciation |
Net Unrealized Appreciation (Depreciation) |
||||||||||||||||||||||
|
Income and Equity Fund |
$ |
942,312 |
$ |
571,568 |
$ |
12,951,405 |
$ |
2,264,253 |
$ |
234,828 |
$ |
2,029,425 |
|||||||||||||||
|
Balanced Fund |
1,583,747 |
1,843,249 |
6,534,693 |
538,388 |
841,928 |
(303,540 |
) |
||||||||||||||||||||
|
Large Cap Value Fund |
- |
356,394 |
4,846,049 |
2,666,739 |
90,785 |
2,575,954 |
|||||||||||||||||||||
|
Mid Cap Value Fund |
490,419 |
524,464 |
5,253,269 |
1,539,135 |
1,230,516 |
308,619 |
|||||||||||||||||||||
|
Small Cap Value Fund |
242,694 |
9,973,001 |
33,159,004 |
9,455,115 |
12,643,616 |
(3,188,501 |
) |
||||||||||||||||||||
67
Pacific Advisors Fund Inc.
Notes to Financial Statements (Unaudited)
June 30, 2016
Note 5. Distributions to Shareholders
The tax character of distributions paid during 2016 and 2015 was as follows:
|
Income and Equity Fund |
Balanced Fund |
Large Cap Value Fund |
Mid Cap Value Fund |
Small Cap Value Fund |
|||||||||||||||||||
|
Period ended June 30, 2016 |
|||||||||||||||||||||||
|
Distributions paid from: |
|||||||||||||||||||||||
|
Ordinary Income |
$ |
12,565 |
$ |
- |
$ |
- |
$ |
- |
$ |
- |
|||||||||||||
|
Long-Term Capital Gain |
- |
- |
- |
- |
- |
||||||||||||||||||
|
Total Distributions |
$ |
12,565 |
$ |
- |
$ |
- |
$ |
- |
$ |
- |
|||||||||||||
|
Year ended December 31, 2015 |
|||||||||||||||||||||||
|
Distributions paid from: |
|||||||||||||||||||||||
|
Ordinary Income |
$ |
149,931 |
$ |
- |
$ |
- |
$ |
- |
$ |
- |
|||||||||||||
|
Long-Term Capital Gain |
- |
146,010 |
12,357 |
- |
8,829,656 |
||||||||||||||||||
|
Total Distributions |
$ |
149,931 |
$ |
146,010 |
$ |
12,357 |
$ |
- |
$ |
8,829,656 |
|||||||||||||
Note 6. Capital Share Transactions
A 2% redemption fee is assessed on shares of the Income and Equity Fund sold or exchanged within 30 days of purchase or shares of the Balanced Fund, Large Cap Value Fund, Mid Cap Value Fund or Small Cap Value Fund sold or exchanged within 180 days of purchase and is retained in each Fund. The redemption fees collected through June 30, 2016 are included in the dollar amount of shares sold in the table below. The amount of the increase is as follows:
|
Class A |
Class C |
Class I |
|||||||||||||
|
Income and Equity Fund |
$ |
6,703 |
$ |
1,472 |
N/A |
||||||||||
|
Balanced Fund |
184 |
112 |
N/A |
||||||||||||
|
Large Cap Value Fund |
150 |
25 |
N/A |
||||||||||||
|
Mid Cap Value Fund |
195 |
23 |
N/A |
||||||||||||
|
Small Cap Value Fund |
4,486 |
725 |
$ |
23 |
|||||||||||
|
Six months ended June 30, 2016 |
Year ended December 31, 2015 |
||||||||||||||||||
|
Shares |
Amount |
Shares |
Amount |
||||||||||||||||
|
Income and Equity Fund |
|||||||||||||||||||
|
Class A |
|||||||||||||||||||
|
Shares sold |
214,094 |
$ |
2,568,816 |
181,771 |
$ |
2,142,787 |
|||||||||||||
|
Reinvestment of distributions |
932 |
11,140 |
10,262 |
119,557 |
|||||||||||||||
|
215,026 |
2,579,956 |
192,033 |
2,262,344 |
||||||||||||||||
|
Shares repurchased |
(97,340 |
) |
(1,148,182 |
) |
(137,000 |
) |
(1,620,088 |
) |
|||||||||||
|
Net increase |
117,686 |
$ |
1,431,774 |
55,033 |
$ |
642,256 |
|||||||||||||
|
Class C |
|||||||||||||||||||
|
Shares sold |
8,867 |
$ |
104,404 |
53,339 |
$ |
609,213 |
|||||||||||||
|
Reinvestment of distributions |
- |
- |
1,267 |
14,183 |
|||||||||||||||
|
8,867 |
104,404 |
54,606 |
623,396 |
||||||||||||||||
|
Shares repurchased |
(17,848 |
) |
(202,239 |
) |
(19,772 |
) |
(225,099 |
) |
|||||||||||
|
Net increase (decrease) |
(8,981 |
) |
$ |
(97,835 |
) |
34,834 |
$ |
398,297 |
|||||||||||
68
Pacific Advisors Fund Inc.
Notes to Financial Statements (Unaudited)
June 30, 2016
|
Six months ended June 30, 2016 |
Year ended December 31, 2015 |
||||||||||||||||||
|
Shares |
Amount |
Shares |
Amount |
||||||||||||||||
|
Balanced Fund |
|||||||||||||||||||
|
Class A |
|||||||||||||||||||
|
Shares sold |
38,162 |
$ |
435,826 |
44,611 |
$ |
712,675 |
|||||||||||||
|
Reinvestment of distributions |
- |
- |
17,557 |
253,878 |
|||||||||||||||
|
38,162 |
435,826 |
62,168 |
966,553 |
||||||||||||||||
|
Shares repurchased |
(10,543 |
) |
(118,088 |
) |
(23,763 |
) |
(378,167 |
) |
|||||||||||
|
Net increase |
27,619 |
$ |
317,738 |
38,405 |
$ |
588,386 |
|||||||||||||
|
Class C |
|||||||||||||||||||
|
Shares sold |
4,159 |
$ |
42,378 |
54,268 |
$ |
791,039 |
|||||||||||||
|
Reinvestment of distributions |
- |
- |
19,422 |
253,459 |
|||||||||||||||
|
4,159 |
42,378 |
73,690 |
1,044,498 |
||||||||||||||||
|
Shares repurchased |
(57,067 |
) |
(582,822 |
) |
(110,595 |
) |
(1,615,738 |
) |
|||||||||||
|
Net decrease |
(52,908 |
) |
$ |
(540,444 |
) |
(36,905 |
) |
$ |
(571,240 |
) |
|||||||||
|
Six months ended June 30, 2016 |
Year ended December 31, 2015 |
||||||||||||||||||
|
Shares |
Amount |
Shares |
Amount |
||||||||||||||||
|
Large Cap Value Fund |
|||||||||||||||||||
|
Class A |
|||||||||||||||||||
|
Shares sold |
19,801 |
$ |
274,267 |
45,174 |
$ |
633,380 |
|||||||||||||
|
Reinvestment of distributions |
- |
- |
677 |
9,509 |
|||||||||||||||
|
19,801 |
274,267 |
45,851 |
642,889 |
||||||||||||||||
|
Shares repurchased |
(33,838 |
) |
(449,573 |
) |
(58,456 |
) |
(824,362 |
) |
|||||||||||
|
Net decrease |
(14,037 |
) |
$ |
(175,306 |
) |
(12,605 |
) |
$ |
(181,473 |
) |
|||||||||
|
Class C |
|||||||||||||||||||
|
Shares sold |
1,003 |
$ |
11,525 |
4,317 |
$ |
53,517 |
|||||||||||||
|
Reinvestment of distributions |
- |
- |
128 |
1,562 |
|||||||||||||||
|
1,003 |
11,525 |
4,445 |
55,079 |
||||||||||||||||
|
Shares repurchased |
(9,460 |
) |
(115,006 |
) |
(2,458 |
) |
(30,619 |
) |
|||||||||||
|
Net increase (decrease) |
(8,457 |
) |
$ |
(103,481 |
) |
1,987 |
$ |
24,460 |
|||||||||||
69
Pacific Advisors Fund Inc.
Notes to Financial Statements (Unaudited)
June 30, 2016
|
Six months ended June 30, 2016 |
Year ended December 31, 2015 |
||||||||||||||||||
|
Shares |
Amount |
Shares |
Amount |
||||||||||||||||
|
Mid Cap Value Fund |
|||||||||||||||||||
|
Class A |
|||||||||||||||||||
|
Shares sold |
32,086 |
$ |
318,340 |
54,544 |
$ |
679,122 |
|||||||||||||
|
Reinvestment of distributions |
- |
- |
- |
- |
|||||||||||||||
|
32,086 |
318,340 |
54,544 |
679,122 |
||||||||||||||||
|
Shares repurchased |
(19,622 |
) |
(202,402 |
) |
(24,651 |
) |
(310,594 |
) |
|||||||||||
|
Net increase |
12,464 |
$ |
115,938 |
29,893 |
$ |
368,528 |
|||||||||||||
|
Class C |
|||||||||||||||||||
|
Shares sold |
1,112 |
$ |
10,336 |
1,601 |
$ |
18,148 |
|||||||||||||
|
Reinvestment of distributions |
- |
- |
- |
- |
|||||||||||||||
|
1,112 |
10,336 |
1,601 |
18,148 |
||||||||||||||||
|
Shares repurchased |
(14,373 |
) |
(132,654 |
) |
(3,099 |
) |
(37,035 |
) |
|||||||||||
|
Net decrease |
(13,261 |
) |
$ |
(122,318 |
) |
(1,498 |
) |
$ |
(18,887 |
) |
|||||||||
|
Six months ended June 30, 2016 |
Year ended December 31, 2015 |
||||||||||||||||||
|
Shares |
Amount |
Shares |
Amount |
||||||||||||||||
|
Small Cap Value Fund |
|||||||||||||||||||
|
Class A |
|||||||||||||||||||
|
Shares sold |
39,741 |
$ |
891,705 |
320,308 |
$ |
13,021,787 |
|||||||||||||
|
Reinvestment of distributions |
- |
- |
263,570 |
6,721,040 |
|||||||||||||||
|
39,741 |
891,705 |
583,878 |
19,742,827 |
||||||||||||||||
|
Shares repurchased |
(348,709 |
) |
(8,085,058 |
) |
(1,966,404 |
) |
(77,129,551 |
) |
|||||||||||
|
Net decrease |
(308,968 |
) |
$ |
(7,193,353 |
) |
(1,382,526 |
) |
$ |
(57,386,724 |
) |
|||||||||
|
Class C |
|||||||||||||||||||
|
Shares sold |
539 |
$ |
10,307 |
22,817 |
$ |
732,848 |
|||||||||||||
|
Reinvestment of distributions |
- |
- |
63,488 |
1,245,004 |
|||||||||||||||
|
539 |
10,307 |
86,305 |
1,977,852 |
||||||||||||||||
|
Shares repurchased |
(31,446 |
) |
(567,841 |
) |
(100,726 |
) |
(3,263,601 |
) |
|||||||||||
|
Net decrease |
(30,907 |
) |
$ |
(557,534 |
) |
(14,421 |
) |
$ |
(1,285,749 |
) |
|||||||||
|
Class I |
|||||||||||||||||||
|
Shares sold |
- |
$ |
23 |
4,824 |
$ |
250,185 |
|||||||||||||
|
Reinvestment of distributions |
- |
- |
34 |
1,069 |
|||||||||||||||
|
- |
23 |
4,858 |
251,254 |
||||||||||||||||
|
Shares repurchased |
- |
- |
(26,256 |
) |
(1,276,307 |
) |
|||||||||||||
|
Net increase (decrease) |
- |
$ |
23 |
(21,398 |
) |
$ |
(1,025,053 |
) |
|||||||||||
70
Pacific Advisors Fund Inc.
Notes to Financial Statements (Unaudited)
June 30, 2016
Note 7. Bank Borrowings
Each Fund may borrow money to the extent permitted by the 1940 Act, as amended, or any rules, exemptions or interpretations thereunder that may be adopted, granted or issued by the Securities and Exchange Commission. Under the 1940 Act, a mutual fund may borrow up to one-third of its total assets (including the amount borrowed) from banks for any purpose, and may borrow up to 5% of its total assets from banks or other lenders for temporary purposes. Each Fund may borrow to facilitate portfolio transactions or meet redemptions. The Large Cap Value Fund, Mid Cap Value Fund, and Small Cap Value Fund also may borrow money to invest in portfolio securities. Each Fund has the ability to borrow, from UMB, on an unsecured basis, at 1.50% over the Federal Funds rate. As of June 30, 2016, the Balanced Fund, Mid Cap Value Fund and Small Cap Value Fund had borrowings from UMB with amounts of $81,095, $95,406 and $1,168,118, respectively, and were paying interest at 2.95% per annum on their outstanding borrowings. No compensating balances were required.
Note 8. Subsequent Events
Subsequent events occurring after the date of this report through the date these financial statements were issued have been evaluated for potential impact and the Fund has had no such events.
Note 9. Results of the Special Meeting of Shareholders
A special meeting of the shareholders of the Government Securities Fund (the "Fund") was held on June 20, 2016. The matters voted on by the shareholders of the Fund and the results of the votes at the shareholder meeting were as follows:
Proposal 1: To approve the liquidation and dissolution of the Fund pursuant to a Plan of Liquidation and Dissolution; and
| Votes "For" |
% of Shares Voting "For" |
Votes "Against" |
% of Shares Voting "Against" |
Votes Abstaining |
% of Shares Abstaining |
||||||||||||||||||
| 134,439.67 |
79.47 |
% |
0 |
0 |
0 |
0 |
|||||||||||||||||
Proposal Passed
Proposal 2: To approve any adjournments of the Meeting from time to time to solicit additional proxies if there are insufficient votes at the time of the Meeting to constitute a quorum or to approve Proposal 1.
71
Pacific Advisors Fund Inc.
Directors and Officers
"Independent" Directors
|
Name (Age) |
Position with the Company1 |
Year elected Director of the Company |
Principal occupation(s) during past 5 years |
Other Directorships held by Director |
|||||||||||||||
| L. Michael Haller, III (72) |
Director |
1992 |
Consultant, d/b/a Asahi Broadcasting Enterprises (software development); Chairman and President, Gammaker Pte. Ltd. (mobile game developer); Chairman and CEO, AdLib Mediation, Inc. (mobile advertising); and formerly Executive Vice President, MGT Capital Investments (mobile game developer) (2013); CEO, Digital Angel, Inc. (communications equipment distributor) (2012-2013); Chairman, Kapitall, Inc. (online introducing brokerage) (2011-2012); President, Bionic Games, Inc. (game software development company) (2008-2011); and Vice President and General Manager, Kapitall Studio (division of Kapitall, Inc.) (2010-2011) |
Digital Angel, Inc. |
|||||||||||||||
| Peter C. Hoffman (65) |
Director |
2010 |
President, Sierra Autocars, Inc. (auto dealership), Sierra Vehicles, Inc. (auto dealership), Sierra Automotive Enterprises, Inc. (auto dealership) and Sierra Pursuits, Inc. (management company) |
None |
|||||||||||||||
| Gerald E. Miller (86) |
Director |
1992 |
Retired in 1992; and formerly worked for Merrill Lynch for over 30 years and was a Senior Resident Vice President at retirement in 1992 |
None |
|||||||||||||||
| Louise K. Taylor, PhD (69) |
Director |
1992 |
Assistant Executive Director, Employers Association of California; and formerly Superintendent, Monrovia Unified School District (1991-2009) |
None |
|||||||||||||||
"Interested" Directors2
|
Name (Age) |
Positions with the Company1 |
Year elected a Director and officer of the Company |
Principal occupations during past 5 years |
Other Directorships held by Director |
|||||||||||||||
| Victoria L. Breen (65)* |
Director Assistant Secretary |
1992 2002 |
President, Derby & Derby, Inc. (financial services company); Registered Principal, Foothill Securities, Inc.; and Assistant Secretary and Director, Pacific Global Investment Management Company; and formerly Agent, Transamerica Life Companies (1994-2015); Registered Principal, Transamerica Financial Advisors, Inc. (1994-2015) |
None |
|||||||||||||||
| George A. Henning (69)** |
President and Chairman |
1992 |
Chairman, President and Director, Pacific Global Investment Management Company; and Chairman and Director, Pacific Global Fund Distributors, Inc. and Pacific Global Investor Services, Inc. |
None |
|||||||||||||||
Each Director oversees all 6 Pacific Advisors Fund portfolios.
The Fund's Statement of Additional Information contains additional information about the Fund's Directors and Officers and is available without charge upon request by calling (800) 989-6693. The business address for all Directors and officers of the Company is 101 N. Brand Blvd., Suite 1950, Glendale, CA 91203, Attn: Secretary.
72
Pacific Advisors Fund Inc.
Directors and Officers
Other Officers
|
Name (Age) |
Position(s) with the Company |
Year elected an officer of the Company |
Principal occupations during past 5 years |
||||||||||||
| Catherine L. Henning (38) |
Vice President Secretary |
2010 2006 |
Senior Vice President, Secretary, Director of Client Services and Director, Pacific Global Investment Management Company; President, Secretary, Chief Compliance Officer and Director, Pacific Global Fund Distributors, Inc.; and Vice President, Secretary and Director, Pacific Global Investor Services, Inc. |
||||||||||||
| Barbara A. Kelley (63) |
Vice President and Chief Compliance Officer |
2001 |
Executive Vice President, Chief Compliance Officer and Director, Pacific Global Investment Management Company; Director, Pacific Global Fund Distributors, Inc.; President and Director, Pacific Global Investor Services, Inc.; and formerly Treasurer (2001-2014). | ||||||||||||
| Araceli Olea (43) |
Assistant Secretary |
2008 |
Shareholder Services Manager, Pacific Global Investor Services, Inc.; and Assistant Secretary, Pacific Global Investment Management Company and Pacific Global Investor Services, Inc. |
||||||||||||
| Jingjing Yan (42) |
Treasurer |
2014 |
Vice President and Treasurer, Pacific Global Investment Management Company; Treasurer, Pacific Global Fund Distributors, Inc. and Pacific Global Investor Services, Inc.; and formerly Assistant Treasurer (2005-2014). | ||||||||||||
1 Each director is elected to serve until the next annual shareholders meeting and until his or her successor is elected or appointed. The Company does not hold regular annual shareholders meetings to elect Directors. Vacancies on the Board can be filled by the action of a majority of the Directors, provided that at least two-thirds of the Directors have been elected by the shareholders.
2 "Interested persons" as defined in the 1940 Act, as amended, based on their affiliation with the Funds' investment manager and its affiliates (including the Funds' principal underwriter).
* Ms. Breen is considered an interested director because (a) she is a registered principal of a registered broker/dealer that engages in sales of Company shares under a selling agreement with the Distributor, and in that capacity she has received commissions on the sale of the Funds' shares; (b) she is an officer of the Company; and (c) she is a shareholder of the Manager and a member of the Manager's Board of Directors.
** Mr. Henning is considered an interested director because (a) he holds the positions described above with the Company, the Manager and its affiliates; (b) by virtue of his ownership of the Manager's shares he may be deemed a "control person" of the Manager; and (c) he is Ms. Henning's father.
73
Pacific Advisors Fund Inc.
notes
74
Pacific Advisors Fund Inc.
notes
75
Pacific Advisors Fund Inc.
notes
76

Pacific Advisors Fund Inc.
Directors
George A. Henning, Chairman
Victoria L. Breen
L. Michael Haller, III
Peter C. Hoffman
Gerald E. Miller
Louise K. Taylor, Ph.D.
Officers
George A. Henning, President
Barbara A. Kelley, Vice President
Catherine L. Henning, Vice President and Secretary
Victoria L. Breen, Assistant Secretary
Araceli Olea, Assistant Secretary
Jingjing Yan, Treasurer
Investment Manager
Pacific Global Investment Management Company
101 North Brand Blvd., Suite 1950
Glendale, California 91203
Transfer Agent and Administrator
Pacific Global Investor Services, Inc.
101 North Brand Blvd., Suite 1950
Glendale, California 91203
Distributor
Pacific Global Fund Distributors, Inc.
101 North Brand Blvd., Suite 1950
Glendale, California 91203
(800) 989-6693
Availability of Quarterly Portfolio Schedule
The Fund files its complete schedule of portfolio holdings with the SEC for the first and third quarters of each fiscal year on Form N-Q. The Fund's Forms N-Q are available on the SEC's Web site at http://www.sec.gov. The Fund's Forms N-Q may be reviewed and copied at the SEC's Public Reference Room in Washington, DC. Information about the operation of the Public Reference Room may be obtained by calling the SEC at (800) SEC-0330.
The Fund's complete schedule of portfolio holdings for each fiscal quarter is posted on the Fund's Web site at www.PacificAdvisorsFund.com and is available without charge, upon request by calling (800) 989-6693. Documents will be sent within 3 business days of receipt of your request.
Availability of Proxy Voting Policies and Procedures and Proxy Voting Record
A description of the policies and procedures that the Fund uses to determine how to vote proxies relating to portfolio securities and information regarding how the Fund voted proxies relating to portfolio securities during the most recent 12-month period ended June 30 is available without charge, upon request by calling (800) 989-6693. Documents will be sent within 3 business days of receipt of your request. This information is also available on the SEC's Web site at http://www.sec.gov.

Pacific Global Fund Distributors, Inc.
101 North Brand Blvd., Suite 1950
Glendale, California 91203

Item 2. Code of Ethics
Not applicable for semi-annual reports.
Item 3. Audit Committee Financial Expert
Not applicable for semi-annual reports.
Item 4. Principal Accountant Fees and Services
Not applicable for semi-annual reports.
Item 5. Audit Committee of Listed Registrants
Not applicable as Registrant is not a listed issuer as defined in Rule 10A-3 under the Securities Exchange Act of 1934.
Item 6. Schedule of Investments
Schedule of Investments is included as part of the report to shareholders filed under Item 1 of this form.
Item 7. Disclosure of Proxy Voting Policies and Procedures for Closed-End Management Investment Companies
Not applicable to open-end investment companies.
Item 8. Portfolio Managers of Closed-End Management Investment Companies
Not applicable to open-end investment companies.
Item 9. Purchases of Equity Securities by Managers of Closed-End Management Investment Company and Affiliated Purchasers.
Not applicable to open-end investment companies.
Item 10. Submission of Matters to a Vote of Security Holders
No material changes have been made.
Item 11. Controls and Procedures.
(a) Based upon their evaluation of Registrant’s disclosure controls and procedures (as defined in Rule 30a-3(c) under the Investment Company Act of 1940) as conducted within 90 days of the filing date of this Form N-CSR, Registrant’s principal executive officer and principal financial officer have concluded that those disclosure controls and procedures provide reasonable assurance that the material information required to be disclosed by Registrant on this report is recorded, processed, summarized and reported within the time periods specified in the Securities and Exchange Commission’s rules and forms.
(b) There were no changes in Registrant’s internal control over financial reporting (as defined in Rule 30a-3(d) under the Investment Company Act of 1940) that occurred during the second fiscal quarter of the period covered by this report that have materially affected, or are reasonably likely to materially affect, Registrant’s internal control over financial reporting.
Item 12. Exhibits
(a)(1) Not applicable.
(a)(2) Certifications required by Item 12(a) of Form N-CSR and Section 302 of the Sarbanes-Oxley Act of 2002 (filed herewith).
(a)(3) Not applicable.
(b) Certification required by Section 906 of the Sarbanes-Oxley Act of 2002 (filed herewith).
SIGNATURES
Pursuant to the requirements of the Securities Exchange Act of 1934 and the Investment Company Act of 1940, Registrant has duly caused this report to be signed on its behalf by the undersigned, thereunto duly authorized.
Pacific Global Fund Inc. d/b/a Pacific Advisors Fund Inc.
|
By: |
/s/ George A. Henning |
|
|
|
George A. Henning |
|
|
|
Chairman, Pacific Advisors Fund Inc. |
|
|
|
|
|
|
Date: |
September 1, 2016 |
|
Pursuant to the requirements of the Securities Exchange Act of 1934 and the Investment Company Act of 1940, this report has been signed below by the following persons on behalf of Registrant and in the capacities and on the dates indicated.
|
By: |
/s/ George A. Henning |
|
|
|
George A. Henning |
|
|
|
Chief Executive Officer |
|
|
|
|
|
|
Date: |
September 1, 2016 |
|
|
|
|
|
|
By: |
/s/ Jingjing Yan |
|
|
|
Jingjing Yan |
|
|
|
Chief Financial Officer |
|
|
|
|
|
|
Date: |
September 1, 2016 |
|