UNITED STATES
SECURITIES AND EXCHANGE COMMISSION
Washington, D.C. 20549
FORM N-CSR
CERTIFIED SHAREHOLDER REPORT OF REGISTERED MANAGEMENT
INVESTMENT COMPANIES
Investment Company Act file number: 811-06660
Name of Fund: BlackRock MuniYield Quality Fund, Inc. (MQY)
Fund Address: 100 Bellevue Parkway, Wilmington, DE 19809
Name and address of agent for service: John M. Perlowski, Chief Executive Officer, BlackRock MuniYield Quality Fund, Inc., 55 East 52nd Street, New York, NY 10055
Registrant’s telephone number, including area code: (800) 882-0052, Option 4
Date of fiscal year end: 04/30/2017
Date of reporting period: 04/30/2017
Item 1 – Report to Stockholders
APRIL 30, 2017
|
ANNUAL REPORT
|

|
BlackRock MuniYield Fund, Inc. (MYD)
BlackRock MuniYield Quality Fund, Inc. (MQY)
BlackRock MuniYield Quality Fund II, Inc. (MQT)
| Not FDIC Insured • May Lose Value • No Bank Guarantee |
| The Markets in Review |
Dear Shareholder,
In the 12 months ended April 30, 2017, risk assets, such as stocks and high-yield bonds, delivered strong performance. These markets showed great resilience during a period with big surprises, including the United Kingdom’s vote to leave the European Union and the outcome of the U.S. presidential election, which brought only brief spikes in equity market volatility. However, high-quality assets with more interest rate sensitivity struggled. U.S. Treasuries posted negative returns as rising energy prices, modest wage increases and steady job growth led to expectations of higher inflation and anticipation of interest rate increases by the U.S. Federal Reserve (the “Fed”).
The global reflationary theme — rising nominal growth, wages and inflation — was the dominant driver of asset returns during the period, outweighing significant political upheavals and uncertainty. Reflationary expectations accelerated after the U.S. election and continued into the beginning of 2017, stoked by expectations that the new presidential administration’s policies would provide an extra boost to U.S. growth. More recently, however, growing skepticism about the likelihood of significant near-term U.S. tax reform and infrastructure spending has tempered enthusiasm around the reflation trade. Nonetheless, markets have remained generally positive thus far in 2017 and continue to exhibit low levels of volatility by historical standards. Although political uncertainty persisted, benign credit conditions and expectations for economic growth have kept markets fairly tranquil. The period ended with a global risk asset rally following centrist Emmanuel Macron’s win in the first round of the French presidential election and better-than-expected U.S. and European corporate earnings.
Although economic momentum is gaining traction, the capacity for rapid global growth is restrained by structural factors, including an aging population, low productivity growth and excess savings, as well as cyclical factors, like the Fed moving toward the normalization of monetary policy and the length of the current expansion. Tempered economic growth and high valuations across most assets have set the stage for muted returns going forward.
Equity markets still present opportunities, although the disparity between winners and losers is widening — a dynamic that increases both the risk and return potential of active investing. Fixed income investors are also facing challenges as many sectors are exhibiting higher valuations while rates remain at historically low levels.
In this environment, investors need to think globally, extend their scope across a broad array of asset classes, and be nimble as market conditions change. We encourage you to talk with your financial advisor and visit blackrock.com for further insight about investing in today’s markets.
Sincerely,

Rob Kapito
President, BlackRock Advisors, LLC

Rob Kapito
President, BlackRock Advisors, LLC
| Total Returns as of April 30, 2017 | ||||||||
| 6-month | 12-month | |||||||
| U.S. large cap equities |
13.32 | % | 17.92 | % | ||||
| U.S. small cap equities |
18.37 | 25.63 | ||||||
| International equities |
11.47 | 11.29 | ||||||
| Emerging market equities |
8.88 | 19.13 | ||||||
| 3-month Treasury bills |
0.23 | 0.40 | ||||||
| U.S. Treasury securities |
(3.13 | ) | (2.68 | ) | ||||
| U.S. investment grade bonds |
(0.67 | ) | 0.83 | |||||
| Tax-exempt municipal |
(0.41 | ) | 0.57 | |||||
| U.S. high yield bonds |
5.30 | 13.29 | ||||||
| Past performance is no guarantee of future results. Index performance is shown for illustrative purposes only. You cannot invest directly in an index. | ||||||||
| 2 | THIS PAGE NOT PART OF YOUR FUND REPORT |
| Table of Contents |
| Page | ||||
| 2 | ||||
| Annual Report: |
||||
| 4 | ||||
| 5 | ||||
| 5 | ||||
| 6 | ||||
| Financial Statements: | ||||
| 12 | ||||
| 36 | ||||
| 37 | ||||
| 38 | ||||
| 39 | ||||
| 40 | ||||
| 43 | ||||
| 54 | ||||
| 55 | ||||
| 56 | ||||
| 59 | ||||
| ANNUAL REPORT | APRIL 30, 2017 | 3 |
| Municipal Market Overview |
| For the Reporting Period Ended April 30, 2017 |
Municipal Market Conditions
Municipal bonds generated modestly positive performance for the period, in spite of vastly rising interest rates as a result of generally stronger economic data, signs of inflation pressures, Federal Reserve (“Fed”) monetary policy normalization, and market expectations for pro-growth fiscal policy. However, ongoing reassurance from the Fed that rates would be increased gradually and would likely remain low overall resulted in strong demand for fixed income investments. Investors favored the income, relative yield, and stability of municipal bonds amid bouts of interest rate volatility (bond prices rise as rates fall) resulting from the United Kingdom’s decision to leave the European Union, the contentious U.S. election, and widening central bank divergence — i.e., policy easing outside the United States while the Fed slowly commences policy tightening. During the 12 months ended April 30, 2017, municipal bond funds garnered net inflows of approximately $14 billion (based on data from the Investment Company Institute).
A Closer Look at Yields
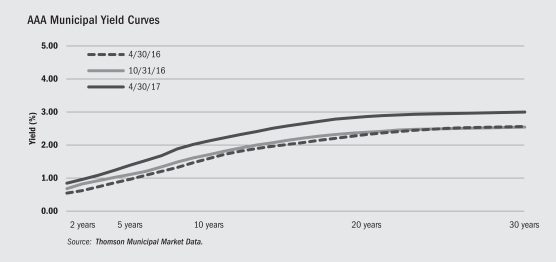
From April 30, 2016 to April 30, 2017, yields on AAA-rated 30-year municipal bonds increased by 44 basis points (“bps”) from 2.58% to 3.02%, while 10-year rates rose by 53 bps from 1.61% to 2.14% and 5-year rates increased 43 bps from 0.98% to 1.41% (as measured by Thomson Municipal Market Data). The municipal yield curve modestly steepened over the 12-month period with the spread between 2- and 30-year maturities steepening by 10 bps and the spread between 2- and 10-year maturities steepening by 19 bps.
During the same time period, on a relative basis, tax-exempt municipal bonds broadly outperformed U.S. Treasuries with the greatest outperformance experienced in the front-end of the yield curve. In absolute terms, the positive performance of municipal bonds was driven largely by a supply/demand imbalance within the municipal market as investors sought income and incremental yield in an environment where opportunities became increasingly scarce. More broadly, municipal bonds came under pressure post the November U.S. election as a result of uncertainty surrounding potential U.S. tax-reform. The index has now recovered nearly 86% of performance lost post-election, which is quite impressive given that fund flows have only rebounded by about 31%. The asset class is known for its lower relative volatility and preservation of principal with an emphasis on income as tax rates rise.
Financial Conditions of Municipal Issuers
The majority of municipal credits remain strong, despite well-publicized distress among a few issuers. Four of the five states with the largest amount of debt outstanding—California, New York, Texas and Florida—have exhibited markedly improved credit fundamentals during the slow national recovery. However, several states with the largest unfunded pension liabilities have seen their bond prices decline noticeably and remain vulnerable to additional price deterioration. On the local level, Chicago’s credit quality downgrade is an outlier relative to other cities due to its larger pension liability and inadequate funding remedies. BlackRock maintains the view that municipal bond defaults will remain minimal and in the periphery while the overall market is fundamentally sound. We continue to advocate careful credit research and believe that a thoughtful approach to structure and security selection remains imperative amid uncertainty in a modestly improving economic environment.
The opinions expressed are those of BlackRock as of April 30, 2017, and are subject to change at any time due to changes in market or economic conditions. The comments should not be construed as a recommendation of any individual holdings or market sectors. Investing involves risk including loss of principal. Bond values fluctuate in price so the value of your investment can go down depending on market conditions. Fixed income risks include interest-rate and credit risk. Typically, when interest rates rise, there is a corresponding decline in bond values. Credit risk refers to the possibility that the bond issuer will not be able to make principal and interest payments. There may be less information on the financial condition of municipal issuers than for public corporations. The market for municipal bonds may be less liquid than for taxable bonds. Some investors may be subject to Alternative Minimum Tax (AMT). Capital gains distributions, if any, are taxable.
The Standard & Poor’s Municipal Bond Index, a broad, market value-weighted index, seeks to measure the performance of the U.S. municipal bond market. All bonds in the index are exempt from U.S. federal income taxes or subject to the alternative minimum tax. Past performance is no guarantee of future results. Index performance is shown for illustrative purposes only. It is not possible to invest directly in an index.
| 4 | ANNUAL REPORT | APRIL 30, 2017 |
| The Benefits and Risks of Leveraging |
| Derivative Financial Instruments |
| ANNUAL REPORT | APRIL 30, 2017 | 5 |
| Fund Summary as of April 30, 2017 | BlackRock MuniYield Fund, Inc. |
| Fund Overview |
BlackRock MuniYield Fund, Inc.’s (MYD) (the “Fund”) investment objective is to provide shareholders with as high a level of current income exempt from U.S. federal income taxes as is consistent with its investment policies and prudent investment management. The Fund seeks to achieve its investment objective by investing at least 80% of its assets in municipal bonds exempt from U.S. federal income taxes (except that the interest may be subject to the federal alternative minimum tax). The Fund invests, under normal market conditions, at least 75% of its total assets in municipal bonds rated investment grade, or, if unrated, are deemed to be of comparable quality by the investment adviser, at the time of investment and invests primarily in long-term municipal bonds with a maturity of more than ten years at the time of investment. The Fund may invest directly in such securities or synthetically through the use of derivatives.
No assurance can be given that the Fund’s investment objective will be achieved.
| Fund Information | ||
| Symbol on New York Stock Exchange (“NYSE”) |
MYD | |
| Initial Offering Date |
November 29, 1991 | |
| Yield on Closing Market Price as of April 30, 2017 ($14.75)1 |
5.86% | |
| Tax Equivalent Yield2 |
10.35% | |
| Current Monthly Distribution per Common Share3 |
$0.0720 | |
| Current Annualized Distribution per Common Share3 |
$0.8640 | |
| Economic Leverage as of April 30, 20174 |
38% |
| 1 | Yield on closing market price is calculated by dividing the current annualized distribution per share by the closing market price. Past performance does not guarantee future results. |
| 2 | Tax equivalent yield assumes the maximum marginal federal tax rate of 43.4%, which includes the 3.8% Medicare tax. Actual tax rates will vary based on income, exemptions and deductions. Lower taxes will result in lower tax equivalent yields. |
| 3 | The distribution rate is not constant and is subject to change. |
| 4 | Represents VRDP Shares and TOB Trusts as a percentage of total managed assets, which is the total assets of the Fund, including any assets attributable to VRDP Shares and TOB Trusts, minus the sum of its accrued liabilities. For a discussion of leveraging techniques utilized by the Fund, please see The Benefits and Risks of Leveraging on page 5. |
| Performance |
Returns for the 12 months ended April 30, 2017 were as follows:
| Returns Based On | ||||||||
| Market Price | NAV | |||||||
| MYD1, 2 |
(0.65 | )% | (0.16 | )% | ||||
| Lipper General & Insured Municipal Debt Funds (Leveraged)3 |
(2.05 | )% | (0.40 | )% | ||||
| 1 | All returns reflect reinvestment of dividends and/or distributions at actual reinvestment prices. |
| 2 | The Fund’s premium to NAV narrowed during the period, which accounts for the difference between performance based on price and performance based on NAV. |
| 3 | Average return. Returns reflect reinvestment of dividends and/or distributions at NAV on the ex-dividend date as calculated by Lipper. |
| Performance results may include adjustments made for financial reporting purposes in accordance with U.S. generally accepted accounting principles. |
The following discussion relates to the Fund’s absolute performance based on NAV:
| • | Municipal bonds registered a small, positive total return in the 12 months ended April 30, 2017. After moving modestly higher early in the period, municipal bonds began to lose ground in September and October due to a pick-up in new tax-exempt issuance and rising yields in the U.S. Treasury market. (Prices and yields move in opposite directions.) Municipal issues subsequently plunged in November once Donald Trump’s election victory caused investors to adjust their expectations in favor of stronger growth and tighter Fed policy. However, municipal bonds retraced much of their November downturn in the final five months of the period. The favorable combination of lower new issuance and recovering investor demand fueled a recovery in the market, which enabled it to finish with a return slightly above the break-even mark. |
| • | Consistent with the broader market environment, Fund holdings with maturities of 15 years and above were hardest hit by the underperformance of longer-term bonds relative to short-term issues. |
| • | Lower-quality investments typically outperformed their higher-rated counterparts during the period. The Fund’s holdings in non-investment grade and unrated securities therefore generated healthy relative performance, as did its positions in the lower-quality corporate and tobacco sectors. While the Fund’s positions in higher-quality issues generally lagged non-investment grade bonds, its performance was helped by an allocation to higher-quality pre-refunded securities. The higher level of income in this segment translated to lower sensitivity to the market downturn of late 2016, aiding its return over the full 12 months. |
| • | The Fund sought to manage interest rate risk using U.S. Treasury futures. Given that Treasury yields rose, as prices fell, this aspect of the Fund’s positioning had a positive impact on returns. |
| • | The Fund continued to employ leverage, which helped augment income. However, since leverage also amplifies the effect of market movements, it was a net detractor from overall performance. |
The views expressed reflect the opinions of BlackRock as of the date of this report and are subject to change based on changes in market, economic or other conditions. These views are not intended to be a forecast of future events and are no guarantee of future results.
| 6 | ANNUAL REPORT | APRIL 30, 2017 |
| BlackRock MuniYield Fund, Inc. |
| Market Price and Net Asset Value Per Share Summary |
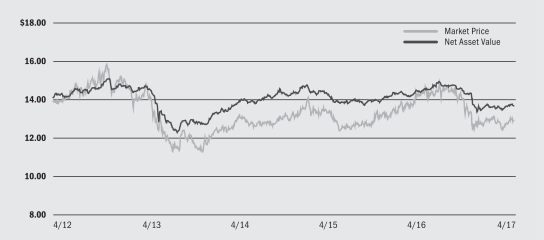
| 4/30/17 | 4/30/16 | Change | High | Low | ||||||||||||||||
| Market Price |
$ | 14.75 | $ | 15.73 | (6.23 | )% | $ | 16.43 | $ | 13.61 | ||||||||||
| Net Asset Value |
$ | 14.71 | $ | 15.62 | 1 | (5.83 | )% | $ | 16.10 | $ | 14.31 | |||||||||
| 1 | The net asset value does not reflect adjustments made for financial reporting purposes in accordance with U.S. generally accepted accounting principles and therefore differs from amount reported in the Financial Highlights. |
| Market Price and Net Asset Value History For the Past Five Years |

| Overview of the Fund’s Total Investments* |
| ANNUAL REPORT | APRIL 30, 2017 | 7 |
| Fund Summary as of April 30, 2017 | BlackRock MuniYield Quality Fund, Inc. |
| Fund Overview |
BlackRock MuniYield Quality Fund, Inc.’s (MQY) (the “Fund”) investment objective is to provide shareholders with as high a level of current income exempt from U.S. federal income taxes as is consistent with its investment policies and prudent investment management. The Fund seeks to achieve its investment objective by investing at least 80% of its assets in municipal bonds exempt from U.S. federal income taxes (except that the interest may be subject to the federal alternative minimum tax). The Fund invests in municipal bonds which are rated in the three highest quality rating categories (A or better), or, if unrated, are deemed to be of comparable quality by the adviser, at the time of investment. The Fund invests primarily in long-term municipal bonds with maturities of more than ten years at the time of investment. The Fund may invest directly in such securities or synthetically through the use of derivatives.
No assurance can be given that the Fund’s investment objective will be achieved.
| Fund Information | ||
| Symbol on NYSE |
MQY | |
| Initial Offering Date |
June 26, 1992 | |
| Yield on Closing Market Price as of April 30, 2017 ($15.14)1 |
5.75% | |
| Tax Equivalent Yield2 |
10.16% | |
| Current Monthly Distribution per Common Share3 |
$0.0725 | |
| Current Annualized Distribution per Common Share3 |
$0.8700 | |
| Economic Leverage as of April 30, 20174 |
38% | |
| 1 | Yield on closing market price is calculated by dividing the current annualized distribution per share by the closing market price. Past performance does not guarantee future results. |
| 2 | Tax equivalent yield assumes the maximum marginal federal tax rate of 43.4%, which includes the 3.8% Medicare tax. Actual tax rates will vary based on income, exemptions and deductions. Lower taxes will result in lower tax equivalent yields. |
| 3 | The distribution rate is not constant and is subject to change. |
| 4 | Represents VRDP Shares and TOB Trusts as a percentage of total managed assets, which is the total assets of the Fund, including any assets attributable to VRDP Shares and TOB Trusts, minus the sum of its accrued liabilities. For a discussion of leveraging techniques utilized by the Fund, please see The Benefits and Risks of Leveraging on page 5. |
| Performance |
Returns for the 12 months ended April 30, 2017 were as follows:
| Returns Based On | ||||||||
| Market Price | NAV | |||||||
| MQY1, 2 |
(3.34 | )% | (0.12 | )% | ||||
| Lipper General & Insured Municipal Debt Funds (Leveraged)3 |
(2.05 | )% | (0.40 | )% | ||||
| 1 | All returns reflect reinvestment of dividends and/or distributions at actual reinvestment prices. |
| 2 | The Fund moved from a premium to NAV to a discount during the period, which accounts for the difference between performance based on price and performance based on NAV. |
| 3 | Average return. Returns reflect reinvestment of dividends and/or distributions at NAV on the ex-dividend date as calculated by Lipper. |
| Performance results may include adjustments made for financial reporting purposes in accordance with U.S. generally accepted accounting principles. |
The following discussion relates to the Fund’s absolute performance based on NAV:
| • | Municipal bonds registered a small, positive total return in the 12 months ended April 30, 2017. After moving modestly higher early in the period, municipal bonds began to lose ground in September and October due to a pick-up in new tax-exempt issuance and rising yields in the U.S. Treasury market. (Prices and yields move in opposite directions.) Municipal issues subsequently plunged in November once Donald Trump’s election victory caused investors to adjust their expectations in favor of stronger growth and tighter Fed policy. However, municipal bonds retraced much of their November downturn in the final five months of the period. The favorable combination of lower new issuance and recovering investor demand fueled a recovery in the market, which enabled it to finish with a return slightly above the break-even mark. |
| • | The positive contribution from the Fund’s income largely offset the impact of negative price performance caused by rising yields. |
| • | Positions in the transportation and tax-backed (local) sectors contributed to results. However, holdings in the utilities sector underperformed. In addition, the health care sector experienced uncertainty surrounding the future of the Affordable Care Act in the wake of the November 2016 elections. |
| • | The Fund sought to manage interest rate risk using U.S. Treasury futures. Given that Treasury yields rose, as prices fell, this aspect of the Fund’s positioning had a positive impact on returns. |
| • | The Fund continued to employ leverage, which helped augment income. However, since leverage also amplifies the effect of market movements, it was a net detractor from overall performance. |
| • | The Fund lowered its dividend during the period, as older, higher-yielding bonds matured or were called and the proceeds were reinvested at much lower yields. (A call is when an issuer redeems a bond prior to its maturity date.) At the same time, the benefit of leverage was reduced as short-term borrowing rates increased due to the Fed’s decision to raise the federal funds rate. However, the positively sloped municipal yield curve still created the latitude for the Fund to generate additional income through the use of leverage. |
The views expressed reflect the opinions of BlackRock as of the date of this report and are subject to change based on changes in market, economic or other conditions. These views are not intended to be a forecast of future events and are no guarantee of future results.
| 8 | ANNUAL REPORT | APRIL 30, 2017 |
| BlackRock MuniYield Quality Fund, Inc. |
| Market Price and Net Asset Value Per Share Summary |
| 4/30/17 | 4/30/16 | Change | High | Low | ||||||||||||||||
| Market Price |
$ | 15.14 | $ | 16.56 | (8.57 | )% | $ | 17.20 | $ | 14.21 | ||||||||||
| Net Asset Value |
$ | 15.56 | $ | 16.48 | 1 | (5.58 | )% | $ | 17.01 | $ | 15.19 | |||||||||
| 1 | The net asset value does not reflect adjustments made for financial reporting purposes in accordance with U.S. generally accepted accounting principles and therefore differs from amount reported in the Financial Highlights. |
| Market Price and Net Asset Value History For the Past Five Years |

| Overview of the Fund’s Total Investments* |
| ANNUAL REPORT | APRIL 30, 2017 | 9 |
| Fund Summary as of April 30, 2017 | BlackRock MuniYield Quality Fund II, Inc. |
| Fund Overview |
BlackRock MuniYield Quality Fund II, Inc.’s (MQT) (the “Fund”) investment objective is to provide shareholders with as high a level of current income exempt from U.S. federal income taxes as is consistent with its investment policies and prudent investment management. The Fund seeks to achieve its investment objective by investing at least 80% of its assets in municipal bonds exempt from U.S. federal income taxes (except that the interest may be subject to the federal alternative minimum tax). The Fund invests in municipal bonds which are in the three highest quality rating categories (A or better), or, if unrated, are deemed to be of comparable quality by the investment adviser at the time of investment. The Fund invests primarily in long-term municipal bonds with maturities of more than ten years at the time of investment. The Fund may invest directly in such securities or synthetically through the use of derivatives.
No assurance can be given that the Fund’s investment objective will be achieved.
| Fund Information | ||
| Symbol on NYSE |
MQT | |
| Initial Offering Date |
August 28, 1992 | |
| Yield on Closing Market Price as of April 30, 2017($12.94)1 |
5.75% | |
| Tax Equivalent Yield2 |
10.16% | |
| Current Monthly Distribution per Common Share3 |
$0.0620 | |
| Current Annualized Distribution per Common Share3 |
$0.7440 | |
| Economic Leverage as of April 30, 20174 |
38% |
| 1 | Yield on closing market price is calculated by dividing the current annualized distribution per share by the closing market price. Past performance does not guarantee future results. |
| 2 | Tax equivalent yield assumes the maximum marginal federal tax rate of 43.4%, which includes the 3.8% Medicare tax. Actual tax rates will vary based on income, exemptions and deductions. Lower taxes will result in lower tax equivalent yields. |
| 3 | The distribution rate is not constant and is subject to change. |
| 4 | Represents VMTP Shares and TOB Trusts as a percentage of total managed assets, which is the total assets of the Fund, including any assets attributable to VMTP Shares and TOB Trusts, minus the sum of its accrued liabilities. For a discussion of leveraging techniques utilized by the Fund, please see The Benefits and Risks of Leveraging on page 5. |
| Performance |
Returns for the 12 months ended April 30, 2017 were as follows:
| Returns Based On | ||||||||
| Market Price | NAV | |||||||
| MQT1, 2 |
(4.57 | )% | 0.12 | % | ||||
| Lipper General & Insured Municipal Debt Funds (Leveraged)3 |
(2.05 | )% | (0.40 | )% | ||||
| 1 | All returns reflect reinvestment of dividends and/or distributions at actual reinvestment prices. |
| 2 | The Fund’s discount to NAV widened during the period, which accounts for the difference between performance based on price and performance based on NAV. |
| 3 | Average return. Returns reflect reinvestment of dividends and/or distributions at NAV on the ex-dividend date as calculated by Lipper. |
| Performance results may include adjustments made for financial reporting purposes in accordance with U.S. generally accepted accounting principles. |
The following discussion relates to the Fund’s absolute performance based on NAV:
| • | Municipal bonds registered a small, positive total return in the 12 months ended April 30, 2017. After moving modestly higher early in the period, municipal bonds began to lose ground in September and October due to a pick-up in new tax-exempt issuance and rising yields in the U.S. Treasury market. (Prices and yields move in opposite directions.) Municipal issues subsequently plunged in November once Donald Trump’s election victory caused investors to adjust their expectations in favor of stronger growth and tighter Fed policy. However, municipal bonds retraced much of their November downturn in the final five months of the period. The favorable combination of lower new issuance and recovering investor demand fueled a recovery in the market, which enabled it to finish with a return slightly above the break-even mark. |
| • | The positive contribution from the Fund’s income offset the impact of negative price performance caused by rising yields. |
| • | Positions in the transportation and tax-backed (local) sectors contributed to results. However, holdings in the utilities sector underperformed. In addition, the health care sector experienced uncertainty surrounding the future of the Affordable Care Act in the wake of the November 2016 elections. |
| • | The Fund sought to manage interest rate risk using U.S. Treasury futures. Given that Treasury yields rose, as prices fell, this aspect of the Fund’s positioning had a positive impact on returns. |
| • | The Fund continued to employ leverage, which helped augment income. However, since leverage also amplifies the effect of market movements, it was a net detractor from overall performance. |
| • | The Fund lowered its dividend during the period, as older, higher-yielding bonds matured or were called and the proceeds were reinvested at much lower yields. (A call is when an issuer redeems a bond prior to its maturity date.) At the same time, the benefit of leverage was reduced as short-term borrowing rates increased due to the Fed’s decision to raise the federal funds rate. However, the positively sloped municipal yield curve still created the latitude for the Fund to generate additional income through the use of leverage. |
The views expressed reflect the opinions of BlackRock as of the date of this report and are subject to change based on changes in market, economic or other conditions. These views are not intended to be a forecast of future events and are no guarantee of future results.
| 10 | ANNUAL REPORT | APRIL 30, 2017 |
| BlackRock MuniYield Quality Fund II, Inc. |
| Market Price and Net Asset Value Per Share Summary |
| 4/30/17 |
4/30/16 | Change | High | Low | ||||||||||||||||
| Market Price |
$ | 12.94 | $ | 14.33 | (9.70 | )% | $ | 15.06 | $ | 12.31 | ||||||||||
| Net Asset Value |
$ | 13.69 | $ | 14.46 | 1 | (5.33 | )% | $ | 14.95 | $ | 13.37 | |||||||||
| 1 | The net asset value does not reflect adjustments made for financial reporting purposes in accordance with U.S. generally accepted accounting principles and therefore differs from amount reported in the Financial Highlights. |
| Market Price and Net Asset Value History For the Past Five Years |
| Overview of the Fund’s Total Investments* |
| ANNUAL REPORT | APRIL 30, 2017 | 11 |
|
BlackRock MuniYield Fund, Inc. (MYD) (Percentages shown are based on Net Assets) |
| Portfolio Abbreviations |
| AGC | Assured Guarantee Corp. | COP | Certificates of Participation | IDA | Industrial Development Authority | |||||
| AGM | Assured Guaranty Municipal Corp. | EDA | Economic Development Authority | ISD | Independent School District | |||||
| AMBAC | American Municipal Bond Assurance Corp. | EDC | Economic Development Corp. | LRB | Lease Revenue Bonds | |||||
| AMT | Alternative Minimum Tax (subject to) | ERB | Education Revenue Bonds | M/F | Multi-Family | |||||
| ARB | Airport Revenue Bonds | GAB | Grant Anticipation Bonds | NPFGC | National Public Finance Guarantee Corp. | |||||
| BAM | Build America Mutual Assurance Co. | GARB | General Airport Revenue Bonds | RB | Revenue Bonds | |||||
| BARB | Building Aid Revenue Bonds | GO | General Obligation Bonds | S/F | Single-Family | |||||
| BHAC | Berkshire Hathaway Assurance Corp. | HDA | Housing Development Authority | |||||||
| CAB | Capital Appreciation Bonds | HFA | Housing Finance Agency |
See Notes to Financial Statements.
| 12 | ANNUAL REPORT | APRIL 30, 2017 |
| Schedule of Investments (continued) |
BlackRock MuniYield Fund, Inc. (MYD) |
See Notes to Financial Statements.
| ANNUAL REPORT | APRIL 30, 2017 | 13 |
| Schedule of Investments (continued) |
BlackRock MuniYield Fund, Inc. (MYD) |
See Notes to Financial Statements.
| 14 | ANNUAL REPORT | APRIL 30, 2017 |
| Schedule of Investments (continued) |
BlackRock MuniYield Fund, Inc. (MYD) |
See Notes to Financial Statements.
| ANNUAL REPORT | APRIL 30, 2017 | 15 |
| Schedule of Investments (continued) |
BlackRock MuniYield Fund, Inc. (MYD) |
See Notes to Financial Statements.
| 16 | ANNUAL REPORT | APRIL 30, 2017 |
| Schedule of Investments (continued) |
BlackRock MuniYield Fund, Inc. (MYD) |
See Notes to Financial Statements.
| ANNUAL REPORT | APRIL 30, 2017 | 17 |
| Schedule of Investments (continued) |
BlackRock MuniYield Fund, Inc. (MYD) |
| Notes to Schedule of Investments |
| (a) | Security exempt from registration pursuant to Rule 144A under the Securities Act of 1933, as amended. These securities may be resold in transactions exempt from registration to qualified institutional investors. |
| (b) | U.S. Government securities, held in escrow, are used to pay interest on this security, as well as to retire the bond in full at the date indicated, typically at a premium to par. |
| (c) | Zero-coupon bond. |
| (d) | Issuer filed for bankruptcy and/or is in default. |
| (e) | Non-income producing security. |
| (f) | Step-up bond that pays an initial coupon rate for the first period and then a higher coupon rate for the following periods. Rate as of period end. |
| (g) | Represent bonds transferred to a TOB Trust in exchange of cash and residual certificates received by the Fund. These bonds serve as collateral in a secured borrowing. See Note 4 of the Notes to Financial Statements for details. |
| (h) | All or a portion of security is subject to a recourse agreement. The aggregate maximum potential amount the Fund could ultimately be required to pay under the agreements, which expire between June 1, 2017 to November 15, 2019, is $23,445,917. See Note 4 of the Notes to Financial Statements for details. |
| (i) | During the year ended April 30, 2017, investments in issuers considered to be affiliates of the Fund for purposes of Section 2(a)(3) of the Investment Company Act of 1940, as amended, were as follows: |
| Affiliate | Shares Held at April 30, 2016 |
Net Activity |
Shares Held at April 30, 2017 |
Value at April 30, 2017 |
Income | Net Realized Gain (Loss)1 |
Change in Unrealized Appreciation (Depreciation) |
|||||||||||||||||||||
| BlackRock Liquidity Funds, MuniCash, Institutional Class |
6,922,502 | (5,255,668 | ) | 1,666,834 | $ | 1,667,167 | $ | 25,390 | $ | 5,983 | $ | 167 | ||||||||||||||||
| 1 Includes net capital gain distributions. |
| |||||||||||||||||||||||||||
| (j) | Current yield as of period end. |
| Derivative Financial Instruments Outstanding as of Period End | ||||||||
| Futures Contracts | ||||||||||||||||||
| Contracts Short |
Issue | Expiration | Notional Value |
Unrealized Depreciation |
||||||||||||||
| (118 | ) | 5-Year U.S. Treasury Note | June 2017 | $13,971,937 | $ | (60,251 | ) | |||||||||||
| (192 | ) | 10-Year U.S. Treasury Note | June 2017 | $24,138,000 | (196,421 | ) | ||||||||||||
| (169 | ) | Long U.S. Treasury Bond | June 2017 | $25,851,719 | (327,798 | ) | ||||||||||||
| (64 | ) | Ultra U.S. Treasury Bond | June 2017 | $10,428,000 | (90,670 | ) | ||||||||||||
| Total | $ | (675,140 | ) | |||||||||||||||
|
|
|
|||||||||||||||||
| Derivative Financial Instruments Categorized by Risk Exposure |
As of period end, the fair values of derivative financial instruments located in the Statements of Assets and Liabilities were as follows:
| Liabilities — Derivative Financial Instruments | Commodity Contracts |
Credit Contracts |
Equity Contracts |
Foreign Currency Exchange Contracts |
Interest Rate Contracts |
Other Contracts |
Total | |||||||||||||||||||||||
| Futures contracts |
Net unrealized depreciation1 | — | — | — | — | $ | 675,140 | — | $ | 675,140 | ||||||||||||||||||||
| 1 Includes cumulative appreciation (depreciation) on futures contracts, if any, as reported in the Schedule of Investments. Only current day’s variation margin is reported within the Statements of Assets and Liabilities. |
| |||||||||||||||||||||||||||||
For the year ended April 30, 2017, the effect of derivative financial instruments in the Statements of Operations was as follows:
| Net Realized Gain (Loss) from: | Commodity Contracts |
Credit Contracts |
Equity Contracts |
Foreign Currency Exchange Contracts |
Interest Rate Contracts |
Other Contracts |
Total | |||||||||||||||||||||||||
| Futures contracts |
— | — | — | — | $ | 3,034,716 | — | $ | 3,034,716 | |||||||||||||||||||||||
| Net Change in Unrealized Appreciation (Depreciation) on: | Commodity Contracts |
Credit Contracts |
Equity Contracts |
Foreign Currency Exchange Contracts |
Interest Rate Contracts |
Other Contracts |
Total | |||||||||||||||||||||||||
| Futures contracts |
— | — | — | — | $ | (1,037,533 | ) | — | $ | (1,037,533 | ) | |||||||||||||||||||||
See Notes to Financial Statements.
| 18 | ANNUAL REPORT | APRIL 30, 2017 |
| Schedule of Investments (concluded) |
BlackRock MuniYield Fund, Inc. (MYD) |
| Average Quarterly Balances of Outstanding Derivative Financial Instruments |
| Futures contracts: | ||||
| Average notional value of contracts — short |
$ | 52,606,850 |
For more information about the Fund’s investment risks regarding derivative financial instruments, refer to the Notes to Financial Statements.
| Fair Value Hierarchy as of Period End |
Various inputs are used in determining the fair value of investments and derivative financial instruments. For information about the Fund’s policy regarding valuation of investments and derivative financial instruments, refer to the Notes to Financial Statements.
The following tables summarize the Fund’s investments and derivative financial instruments categorized in the disclosure hierarchy:
| Level 1 | Level 2 | Level 3 | Total | |||||||||||||
| Assets: |
||||||||||||||||
| Investments: | ||||||||||||||||
| Long-Term Investments 1 |
— | $ | 1,092,209,878 | — | $ | 1,092,209,878 | ||||||||||
| Short-Term Securities |
$ | 1,667,167 | — | — | 1,667,167 | |||||||||||
|
|
|
|||||||||||||||
| Total |
$ | 1,667,167 | $ | 1,092,209,878 | — | $ | 1,093,877,045 | |||||||||
|
|
|
|||||||||||||||
| Derivative Financial Instruments 2 | ||||||||||||||||
| Liabilities: |
||||||||||||||||
| Interest rate contracts |
$ | (675,140 | ) | — | — | $ | (675,140 | ) | ||||||||
| 1 See above Schedule of Investments for values in each state or political subdivision. |
| |||||||||||||||
| 2 Derivative financial instruments are futures contracts which are valued at the unrealized appreciation (depreciation) on the instrument. |
| |||||||||||||||
The Fund may hold assets and/or liabilities in which the fair value approximates the carrying amount for financial statement purposes. As of period end, such assets and/or liabilities are categorized within the disclosure hierarchy as follows:
| Level 1 | Level 2 | Level 3 | Total | |||||||||||||
| Liabilities: |
||||||||||||||||
| TOB Trust Certificates |
— | $ | (168,316,467 | ) | — | $ | (168,316,467 | ) | ||||||||
| VRDP Shares at Liquidation Value |
— | (251,400,000 | ) | — | (251,400,000 | ) | ||||||||||
|
|
|
|||||||||||||||
| Total |
— | $ | (419,716,467 | ) | — | $ | (419,716,467 | ) | ||||||||
|
|
|
|||||||||||||||
During the year ended April 30, 2017, there were no transfers between levels.
See Notes to Financial Statements.
| ANNUAL REPORT | APRIL 30, 2017 | 19 |
| Schedule of Investments April 30, 2017 |
BlackRock MuniYield Quality Fund, Inc. (MQY) (Percentages shown are based on Net Assets) |
See Notes to Financial Statements.
| 20 | ANNUAL REPORT | APRIL 30, 2017 |
| Schedule of Investments (continued) |
BlackRock MuniYield Quality Fund, Inc. (MQY) |
See Notes to Financial Statements.
| ANNUAL REPORT | APRIL 30, 2017 | 21 |
| Schedule of Investments (continued) |
BlackRock MuniYield Quality Fund, Inc. (MQY) |
See Notes to Financial Statements.
| 22 | ANNUAL REPORT | APRIL 30, 2017 |
| Schedule of Investments (continued) |
BlackRock MuniYield Quality Fund, Inc. (MQY) |
See Notes to Financial Statements.
| ANNUAL REPORT | APRIL 30, 2017 | 23 |
| Schedule of Investments (continued) |
BlackRock MuniYield Quality Fund, Inc. (MQY) |
See Notes to Financial Statements.
| 24 | ANNUAL REPORT | APRIL 30, 2017 |
| Schedule of Investments (continued) |
BlackRock MuniYield Quality Fund, Inc. (MQY) |
| Notes to Schedule of Investments |
| (a) | U.S. Government securities, held in escrow, are used to pay interest on this security, as well as to retire the bond in full at the date indicated, typically at a premium to par. |
| (b) | Zero-coupon bond. |
| (c) | Step-up bond that pays an initial coupon rate for the first period and then a higher coupon rate for the following periods. Rate as of period end. |
| (d) | When-issued security. |
| (e) | Security is collateralized by municipal bonds or U.S. Treasury obligations. |
| (f) | Represent bonds transferred to a TOB Trust in exchange of cash and residual certificates received by the Fund. These bonds serve as collateral in a secured borrowing. See Note 4 of the Notes to Financial Statements for details. |
| (g) | All or a portion of security is subject to a recourse agreement. The aggregate maximum potential amount the Fund could ultimately be required to pay under the agreements, which expire between June 1, 2017 to December 1, 2029, is $18,768,624. See Note 4 of the Notes to Financial Statements for details. |
See Notes to Financial Statements.
| ANNUAL REPORT | APRIL 30, 2017 | 25 |
| Schedule of Investments (continued) |
BlackRock MuniYield Quality Fund, Inc. (MQY) |
| (i) | During the year ended April 30, 2017, investments in issuers considered to be affiliates of the Fund for purposes of Section 2(a)(3) of the Investment Company Act of 1940, as amended, were as follows: |
| Affiliate | Shares Held at April 30, 2016 |
Net Activity |
Shares Held at April 30, 2017 |
Value at April 30, 2017 |
Income | Net Realized Gain (Loss)1 |
Change in Unrealized Appreciation (Depreciation) |
|||||||||||||||||||||
| BlackRock Liquidity Funds, MuniCash, Institutional Class |
2,644,850 | (1,601,700 | ) | 1,043,150 | $ | 1,043,358 | $ | 20,055 | $ | 2,113 | $ | 207 | ||||||||||||||||
| 1 | Includes net capital gain distributions. |
| (j) | Current yield as of period end. |
| Derivative Financial Instruments Outstanding as of Period End |
| Futures Contracts | ||||||||||||||||
| Contracts Short |
Issue | Expiration | Notional Value |
Unrealized Depreciation |
||||||||||||
| (63) | 5-Year U.S. Treasury Note | June 2017 | $ | 7,459,594 | $ | (34,949 | ) | |||||||||
| (186) | 10-Year U.S. Treasury Note | June 2017 | $ | 23,383,687 | (204,150 | ) | ||||||||||
| (169) | Long U.S. Treasury Bond | June 2017 | $ | 25,851,719 | (335,023 | ) | ||||||||||
| (24) | Ultra U.S. Treasury Bond | June 2017 | $ | 3,910,500 | (75,481 | ) | ||||||||||
| Total |
$ | (649,603 | ) | |||||||||||||
|
|
|
|
|
|||||||||||||
| Derivative Financial Instruments Categorized by Risk Exposure |
As of period end, the fair values of derivative financial instruments located in the Statements of Assets and Liabilities were as follows:
| Liabilities — Derivative Financial Instruments | Commodity Contracts |
Credit Contracts |
Equity Contracts |
Foreign Currency Exchange Contracts |
Interest Rate Contracts |
Other Contracts |
Total | |||||||||||||||||||||||
| Futures contracts |
Net unrealized depreciation1 | — | — | — | — | $ | 649,603 | — | $ | 649,603 | ||||||||||||||||||||
| 1 Includes cumulative appreciation (depreciation) on futures contracts, if any, as reported in the Schedule of Investments. Only current day’s variation margin is reported within the Statements of Assets and Liabilities. |
| |||||||||||||||||||||||||||||
| For the year ended April 30, 2017, the effect of derivative financial instruments in the Statements of Operations was as follows: | ||||||||||||||||||||||||||||||
| Net Realized Gain (Loss) from: | Commodity Contracts |
Credit Contracts |
Equity Contracts |
Foreign Currency Exchange Contracts |
Interest Rate Contracts |
Other Contracts |
Total | |||||||||||||||||||||
| Futures contracts |
— | — | — | — | $ | 2,160,475 | — | $ | 2,160,475 | |||||||||||||||||||
| Net Change in Unrealized Appreciation (Depreciation) on: | Commodity Contracts |
Credit Contracts |
Equity Contracts |
Foreign Currency Exchange Contracts |
Interest Rate Contracts |
Other Contracts |
Total | |||||||||||||||||||||
| Futures contracts |
— | — | — | — | $ | (796,202 | ) | — | $ | (796,202 | ) | |||||||||||||||||
| Average Quarterly Balances of Outstanding Derivative Financial Instruments |
| Futures contracts: | ||||
| Average notional value of contracts — long |
$ | 241,484 | 1 | |
| Average notional value of contracts — short |
$ | 43,513,064 | ||
| 1 Actual amounts for the period are shown due to limited outstanding derivative financial instruments as of each quarter end. |
| |||
For more information about the Fund’s investment risks regarding derivative financial instruments, refer to the Notes to Financial Statements.
See Notes to Financial Statements.
| 26 | ANNUAL REPORT | APRIL 30, 2017 |
| Schedule of Investments (concluded) |
BlackRock MuniYield Quality Fund, Inc. (MQY) |
| Fair Value Hierarchy as of Period End |
Various inputs are used in determining the fair value of investments and derivative financial instruments. For information about the Fund’s policy regarding valuation of investments and derivative financial instruments, refer to the Notes to Financial Statements.
The following tables summarize the Fund’s investments and derivative financial instruments categorized in the disclosure hierarchy:
| Level 1 | Level 2 | Level 3 | Total | |||||||||||||
| Assets: |
| |||||||||||||||
| Investments: | ||||||||||||||||
| Long-Term Investments1 |
— | $ | 769,521,051 | — | $ | 769,521,051 | ||||||||||
| Short-Term Securities |
$ | 1,043,358 | — | — | 1,043,358 | |||||||||||
|
|
|
|||||||||||||||
| Total |
$ | 1,043,358 | $ | 769,521,051 | — | $ | 770,564,409 | |||||||||
|
|
|
|||||||||||||||
| Derivative Financial InstrumeDnts 2 | ||||||||||||||||
| Liabilities: |
| |||||||||||||||
| Interest rate contracts |
$ | (649,603 | ) | — | — | $ | (649,603 | ) | ||||||||
| 1 See above Schedule of Investments for values in each state or political subdivision. |
| |||||||||||||||
|
2 Derivative financial instruments are futures contracts which are valued at the unrealized appreciation (depreciation) on the instrument.
The Fund may hold assets and/or liabilities in which the fair value approximates the carrying amount for financial statement purposes. As of period end, such assets and/or liabilities are categorized within the disclosure hierarchy as follows:
|
| |||||||||||||||
| Level 1 | Level 2 | Level 3 | Total | |||||||||||||
| Liabilities: |
| |||||||||||||||
| TOB Trust Certificates |
— | $ | (119,144,362 | ) | — | $ | (119,144,362 | ) | ||||||||
| VRDP Shares at Liquidation Value |
— | (176,600,000 | ) | — | (176,600,000 | ) | ||||||||||
|
|
|
|||||||||||||||
| Total |
— | $ | (295,744,362 | ) | — | $ | (295,744,362 | ) | ||||||||
|
|
|
|||||||||||||||
During the year ended April 30, 2017, there were no transfers between levels.
See Notes to Financial Statements.
| ANNUAL REPORT | APRIL 30, 2017 | 27 |
| Schedule of Investments April 30, 2017 |
BlackRock MuniYield Quality Fund II, Inc. (MQT) (Percentages shown are based on Net Assets) |
See Notes to Financial Statements.
| 28 | ANNUAL REPORT | APRIL 30, 2017 |
| Schedule of Investments (continued) |
BlackRock MuniYield Quality Fund II, Inc. (MQT) |
See Notes to Financial Statements.
| ANNUAL REPORT | APRIL 30, 2017 | 29 |
| Schedule of Investments (continued) |
BlackRock MuniYield Quality Fund II, Inc. (MQT) |
See Notes to Financial Statements.
| 30 | ANNUAL REPORT | APRIL 30, 2017 |
| Schedule of Investments (continued) |
BlackRock MuniYield Quality Fund II, Inc. (MQT) |
See Notes to Financial Statements.
| ANNUAL REPORT | APRIL 30, 2017 | 31 |
| Schedule of Investments (continued) |
BlackRock MuniYield Quality Fund II, Inc. (MQT) |
See Notes to Financial Statements.
| 32 | ANNUAL REPORT | APRIL 30, 2017 |
| Schedule of Investments (continued) |
BlackRock MuniYield Quality Fund II, Inc. (MQT) |
| Notes to Schedule of Investments |
| (a) | Step-up bond that pays an initial coupon rate for the first period and then a higher coupon rate for the following periods. Rate as of period end. |
| (b) | U.S. Government securities, held in escrow, are used to pay interest on this security, as well as to retire the bond in full at the date indicated, typically at a premium to par. |
| (c) | Zero-coupon bond. |
| (d) | When-issued security. |
| (e) | Represent bonds transferred to a TOB Trust in exchange of cash and residual certificates received by the Fund. These bonds serve as collateral in a secured borrowing. See Note 4 of the Notes to Financial Statements for details. |
| (f) | All or a portion of security is subject to a recourse agreement. The aggregate maximum potential amount the Fund could ultimately be required to pay under the agreements, which expire between June 1, 2017 to December 1, 2029, is $10,434,440. See Note 4 of the Notes to Financial Statements for details. |
| (g) | During the year ended April 30, 2017, investments in issuers considered to be affiliates of the Fund for purposes of Section 2(a)(3) of the Investment Company Act of 1940, as amended, were as follows: |
| Affiliate | Shares Held at April 30, 2016 |
Net Activity |
Shares Held at April 30, 2017 |
Value at April 30, 2017 |
Income | Net Realized Gain (Loss)1 |
Change in Unrealized Appreciation (Depreciation) |
|||||||||||||||||||||
| BlackRock Liquidity Funds, MuniCash, Institutional Class |
1,841,543 | 3,005,352 | 4,846,895 | $ | 4,847,864 | $ | 13,144 | $ | 1,105 | $ | 310 | |||||||||||||||||
| 1 Includes net capital gain distributions. |
| |||||||||||||||||||||||||||
| (h) | Current yield as of period end. |
See Notes to Financial Statements.
| ANNUAL REPORT | APRIL 30, 2017 | 33 |
| Schedule of Investments (continued) |
BlackRock MuniYield Quality Fund II, Inc. (MQT) |
| Derivative Financial Instruments Outstanding as of Period End |
Futures Contracts
| Contracts Short |
Issue | Expiration | Notional Value |
Unrealized Depreciation |
||||||||||||||||
| (36 | ) | 5-Year U.S. Treasury Note | June 2017 | $ 4,262,625 | $ | (18,833 | ) | |||||||||||||
| (120 | ) | 10-Year U.S. Treasury Note | June 2017 | $15,086,250 | (131,456 | ) | ||||||||||||||
| (108 | ) | Long U.S. Treasury Bond | June 2017 | $16,520,625 | (213,052 | ) | ||||||||||||||
| (18 | ) | Ultra U.S. Treasury Bond | June 2017 | $ 2,932,875 | (51,949 | ) | ||||||||||||||
| Total | $ | (415,290 | ) | |||||||||||||||||
|
|
|
|
|
|||||||||||||||||
| Derivative Financial Instruments Categorized by Risk Exposure |
As of period end, the fair values of derivative financial instruments located in the Statements of Assets and Liabilities were as follows:
| Liabilities — Derivative Financial Instruments | Commodity Contracts |
Credit Contracts |
Equity Contracts |
Foreign Currency Exchange Contracts |
Interest Rate Contracts |
Other Contracts |
Total | |||||||||||||||||||||||||||
| Futures contracts |
Net unrealized depreciation1 | — | — | — | — | $ | 415,290 | — | $ | 415,290 | ||||||||||||||||||||||||
| 1 Includes cumulative appreciation (depreciation) on futures contracts, if any, as reported in the Schedule of Investments. Only current day’s variation margin is reported within the Statements of Assets and Liabilities. |
|
|||||||||||||||||||||||||||||||||
For the year ended April 30, 2017, the effect of derivative financial instruments in the Statements of Operations was as follows:
| Net Realized Gain (Loss) from: | Commodity Contracts |
Credit Contracts |
Equity Contracts |
Foreign Currency Exchange Contracts |
Interest Rate Contracts |
Other Contracts |
Total | |||||||||||||||||||||
| Futures contracts |
— | — | — | — | $ | 1,529,832 | — | $ | 1,529,832 | |||||||||||||||||||
| Net Change in Unrealized Appreciation (Depreciation) on: | Commodity Contracts |
Credit Contracts |
Equity Contracts |
Foreign Currency Exchange Contracts |
Interest Rate Contracts |
Other Contracts |
Total | |||||||||||||||||||||
| Futures contracts |
— | — | — | — | $ | (509,786 | ) | — | $ | (509,786 | ) | |||||||||||||||||
| Average Quarterly Balances of Outstanding Derivative Financial Instruments |
| Futures contracts: | ||||
| Average notional value of contracts — long |
$ | 120,938 | 1 | |
| Average notional value of contracts — short |
$ | 28,558,643 | ||
| 1 Actual amounts for the period are shown due to limited outstanding derivative financial instruments as of each quarter end. |
| |||
For more information about the Fund’s investment risks regarding derivative financial instruments, refer to the Notes to Financial Statements.
| Fair Value Hierarchy as of Period End |
Various inputs are used in determining the fair value of investments and derivative financial instruments. For information about the Fund’s policy regarding valuation of investments and derivative financial instruments, refer to the Notes to Financial Statements.
The following tables summarize the Fund’s investments and derivative financial instruments categorized in the disclosure hierarchy:
| Level 1 | Level 2 | Level 3 | Total | |||||||||||||
| Assets: |
||||||||||||||||
| Investments: | ||||||||||||||||
| Long-Term Investments 1 |
— | $ | 491,343,581 | — | $ | 491,343,581 | ||||||||||
| Short-Term Securities |
$ | 4,847,864 | — | — | 4,847,864 | |||||||||||
|
|
|
|||||||||||||||
| Total |
$ | 4,847,864 | $ | 491,343,581 | — | $ | 496,191,445 | |||||||||
|
|
|
|||||||||||||||
| Derivative Financial Instruments 2 | ||||||||||||||||
| Liabilities: |
||||||||||||||||
| Interest rate contracts |
$ | (415,290 | ) | — | — | $ | (415,290 | ) | ||||||||
| 1 See above Schedule of Investments for values in each state or political subdivision. |
| |||||||||||||||
| 2 Derivative financial instruments are futures contracts which are valued at the unrealized appreciation (depreciation) on the instrument. |
| |||||||||||||||
See Notes to Financial Statements.
| 34 | ANNUAL REPORT | APRIL 30, 2017 |
| Schedule of Investments (concluded) |
BlackRock MuniYield Quality Fund II, Inc. (MQT) |
| The Fund may hold assets and/or liabilities in which the fair value approximates the carrying amount for financial statement purposes. As of period end, such assets and/or liabilities are categorized within the disclosure hierarchy as follows:
|
| |||||||||||||||
| Level 1 | Level 2 | Level 3 | Total | |||||||||||||
| Liabilities: |
||||||||||||||||
| TOB Trust Certificates |
— | $ | (72,633,898 | ) | — | $ | (72,633,898 | ) | ||||||||
| VMTP Shares at Liquidation Value |
— | (116,500,000 | ) | — | (116,500,000 | ) | ||||||||||
|
|
|
|||||||||||||||
| Total |
— | $ | (189,133,898 | ) | — | $ | (189,133,898 | ) | ||||||||
|
|
|
|||||||||||||||
During the year ended April 30, 2017, there were no transfers between levels.
See Notes to Financial Statements.
| ANNUAL REPORT | APRIL 30, 2017 | 35 |
| Statements of Assets and Liabilities |
| April 30, 2017 | BlackRock MuniYield Fund, Inc. (MYD) |
BlackRock MuniYield Quality Fund, Inc. (MQY) |
BlackRock MuniYield Quality Fund II, Inc. (MQT) |
|||||||||
| Assets | ||||||||||||
| Investments at value — unaffiliated1 |
$ | 1,092,209,878 | $ | 769,521,051 | $ | 491,343,581 | ||||||
| Investments at value — affiliated2 |
1,667,167 | 1,043,358 | 4,847,864 | |||||||||
| Cash pledged for futures contracts |
1,463,850 | 1,201,650 | 779,550 | |||||||||
| Receivables: | ||||||||||||
| Interest — unaffiliated |
17,137,569 | 10,009,900 | 6,203,097 | |||||||||
| Dividends — affiliated |
2,884 | 4,579 | 3,328 | |||||||||
| Investments sold |
— | 20,350 | — | |||||||||
| Prepaid expenses |
31,066 | 21,914 | 16,808 | |||||||||
|
|
|
|||||||||||
| Total assets |
1,112,512,414 | 781,822,802 | 503,194,228 | |||||||||
|
|
|
|||||||||||
| Accrued Liabilities | ||||||||||||
| Bank overdraft |
343,006 | 243,660 | 181,868 | |||||||||
| Payables: | ||||||||||||
| Income dividends — Common Shares |
3,367,104 | 2,225,767 | 1,398,597 | |||||||||
| Investment advisory fees |
456,399 | 318,126 | 204,341 | |||||||||
| Interest expense and fees |
407,438 | 288,084 | 154,253 | |||||||||
| Officer’s and Directors’ fees |
341,779 | 242,017 | 3,113 | |||||||||
| Other accrued expenses |
306,690 | 239,630 | 188,367 | |||||||||
| Variation margin on futures contracts |
85,092 | 67,514 | 44,249 | |||||||||
| Investments purchased |
2,833 | 4,941,625 | 3,178,664 | |||||||||
|
|
|
|||||||||||
| Total accrued liabilities |
5,310,341 | 8,566,423 | 5,353,452 | |||||||||
|
|
|
|||||||||||
| Other Liabilities | ||||||||||||
| TOB Trust Certificates |
168,316,467 | 119,144,362 | 72,633,898 | |||||||||
| VRDP Shares, at liquidation value of $100,000 per share, net of deferred offering costs3,4 |
251,016,520 | 176,354,282 | — | |||||||||
| VMTP Shares, at liquidation value of $100,000 per share3,4 |
— | — | 116,500,000 | |||||||||
|
|
|
|||||||||||
| Total other liabilities |
419,332,987 | 295,498,644 | 189,133,898 | |||||||||
|
|
|
|||||||||||
| Total liabilities |
424,643,328 | 304,065,067 | 194,487,350 | |||||||||
|
|
|
|||||||||||
| Net Assets |
$ | 687,869,086 | $ | 477,757,735 | $ | 308,706,878 | ||||||
|
|
|
|||||||||||
| Net Assets Applicable to Common Shareholders Consist of | ||||||||||||
| Paid-in capital5,6,7 |
$ | 625,949,763 | $ | 430,403,613 | $ | 280,879,428 | ||||||
| Undistributed net investment income |
4,082,795 | 3,885,496 | 3,369,798 | |||||||||
| Accumulated net realized loss |
(12,652,567 | ) | (3,669,641 | ) | (5,847,172 | ) | ||||||
| Net unrealized appreciation (depreciation) |
70,489,095 | 47,138,267 | 30,304,824 | |||||||||
|
|
|
|||||||||||
| Net Assets |
$ | 687,869,086 | $ | 477,757,735 | $ | 308,706,878 | ||||||
|
|
|
|||||||||||
| Net asset value, per Common Share |
$ | 14.71 | $ | 15.56 | $ | 13.69 | ||||||
|
|
|
|||||||||||
| 1 Investments at cost — unaffiliated |
$ | 1,021,045,810 | $ | 721,733,388 | $ | 460,623,777 | ||||||
| 2 Investments at cost — affiliated |
$ | 1,667,000 | $ | 1,043,151 | $ | 4,847,554 | ||||||
| 3 Preferred Shares outstanding, par value $0.10 per share |
2,514 | 1,766 | 1,165 | |||||||||
| 4 Preferred Shares authorized, including Auction Market Preferred Shares (“AMPS”) |
16,234 | 11,766 | 7,565 | |||||||||
| 5 Par value per Common Share |
$ | 0.10 | $ | 0.10 | $ | 0.10 | ||||||
| 6 Common Shares outstanding |
46,765,332 | 30,700,229 | 22,558,009 | |||||||||
| 7 Common Shares authorized |
199,983,766 | 199,988,234 | 199,992,435 | |||||||||
| See Notes to Financial Statements. | ||||||
| 36 | ANNUAL REPORT | APRIL 30, 2017 | ||||
| Statements of Operations |
| Year Ended April 30, 2017 | BlackRock MuniYield Fund, Inc. (MYD) |
BlackRock MuniYield Quality Fund, Inc. (MQY) |
BlackRock MuniYield Quality Fund II, Inc. (MQT) |
|||||||||
| Investment Income | ||||||||||||
| Interest — unaffiliated |
$ | 51,677,680 | $ | 34,664,965 | $ | 22,067,820 | ||||||
| Dividends — affiliated |
25,390 | 20,055 | 13,144 | |||||||||
|
|
|
|||||||||||
| Total Investment Income |
51,703,070 | 34,685,020 | 22,080,964 | |||||||||
|
|
|
|||||||||||
| Expenses | ||||||||||||
| Investment advisory |
5,712,949 | 3,929,179 | 2,542,298 | |||||||||
| Accounting services |
133,826 | 101,672 | 74,566 | |||||||||
| Professional |
131,430 | 121,696 | 82,931 | |||||||||
| Officer and Directors |
119,367 | 83,532 | 34,336 | |||||||||
| Transfer agent |
56,898 | 45,186 | 30,037 | |||||||||
| Custodian |
45,982 | 34,196 | 24,571 | |||||||||
| Liquidity fees |
25,605 | — | — | |||||||||
| Remarketing fees on Preferred Shares |
25,141 | — | — | |||||||||
| Registration |
19,392 | 12,683 | 10,099 | |||||||||
| Printing |
15,625 | 13,461 | 11,669 | |||||||||
| Rating agency |
38,252 | 37,411 | 38,044 | |||||||||
| Miscellaneous |
41,318 | 27,568 | 23,705 | |||||||||
|
|
|
|||||||||||
| Total expenses excluding interest expense, fees and amortization of offering costs |
6,365,785 | 4,406,584 | 2,872,256 | |||||||||
| Interest expense, fees and amortization of offering costs1 |
6,070,589 | 4,211,039 | 2,832,690 | |||||||||
|
|
|
|||||||||||
| Total expenses |
12,436,374 | 8,617,623 | 5,704,946 | |||||||||
| Less: | ||||||||||||
| Fees waived by the Manager |
(5,358 | ) | (3,824 | ) | (2,523 | ) | ||||||
| Fees paid indirectly |
(107 | ) | (16 | ) | (17 | ) | ||||||
|
|
|
|||||||||||
| Total expenses after fees waived and paid indirectly |
12,430,909 | 8,613,783 | 5,702,406 | |||||||||
|
|
|
|||||||||||
| Net investment income |
39,272,161 | 26,071,237 | 16,378,558 | |||||||||
|
|
|
|||||||||||
| Realized and Unrealized Gain (Loss) | ||||||||||||
| Net realized gain (loss) from: | ||||||||||||
| Investments — unaffiliated |
1,649,916 | 823,236 | 46,737 | |||||||||
| Investments — affiliated |
5 | 796 | 224 | |||||||||
| Futures contracts |
3,034,716 | 2,160,475 | 1,529,832 | |||||||||
| Capital gain distributions from investment companies — affiliated |
5,978 | 1,317 | 881 | |||||||||
|
|
|
|||||||||||
| 4,690,615 | 2,985,824 | 1,577,674 | ||||||||||
|
|
|
|||||||||||
| Net change in unrealized appreciation (depreciation) on: | ||||||||||||
| Investments — unaffiliated |
(44,575,991 | ) | (29,408,534 | ) | (17,890,076 | ) | ||||||
| Investments — affiliated |
167 | 207 | 310 | |||||||||
| Futures contracts |
(1,037,533 | ) | (796,202 | ) | (509,786 | ) | ||||||
|
|
|
|||||||||||
| (45,613,357 | ) | (30,204,529 | ) | (18,399,552 | ) | |||||||
|
|
|
|||||||||||
| Net realized and unrealized loss |
(40,922,742 | ) | (27,218,705 | ) | (16,821,878 | ) | ||||||
|
|
|
|||||||||||
| Net Decrease in Net Assets Applicable to Common Shareholders Resulting from Operations |
$ | (1,650,581 | ) | $ | (1,147,468 | ) | $ | (443,320 | ) | |||
|
|
|
|||||||||||
| 1 Related to TOB Trusts, VRDP Shares and/or VMTP Shares. |
||||||||||||
| See Notes to Financial Statements. | ||||||
| ANNUAL REPORT | APRIL 30, 2017 | 37 | ||||
| Statements of Changes in Net Assets |
| BlackRock MuniYield Fund, Inc. (MYD) |
BlackRock MuniYield Quality Fund, Inc. (MQY) |
|||||||||||||||||||
| Year Ended April 30, | Year Ended April 30, | |||||||||||||||||||
| Increase (Decrease) in Net Assets Applicable to Common Shareholders: | 2017 | 2016 | 2017 | 2016 | ||||||||||||||||
| Operations | ||||||||||||||||||||
| Net investment income |
$ | 39,272,161 | $ | 41,878,621 | $ | 26,071,237 | $ | 27,650,939 | ||||||||||||
| Net realized gain (loss) |
4,690,615 | 84,563 | 2,985,824 | (729,808 | ) | |||||||||||||||
| Net change in unrealized appreciation (depreciation) |
(45,613,357 | ) | 16,468,786 | (30,204,529 | ) | 13,206,288 | ||||||||||||||
|
|
|
|
|
|||||||||||||||||
| Net increase (decrease) in net assets applicable to Common Shareholders resulting from operations |
(1,650,581 | ) | 58,431,970 | (1,147,468 | ) | 40,127,419 | ||||||||||||||
|
|
|
|
|
|||||||||||||||||
| Distributions to Common Shareholders1 | ||||||||||||||||||||
| From net investment income |
(40,693,560 | ) | (43,465,516 | ) | (26,849,853 | ) | (29,235,074 | ) | ||||||||||||
|
|
|
|
|
|||||||||||||||||
| Capital Share Transactions | ||||||||||||||||||||
| Reinvestment of common distributions |
1,591,944 | 417,367 | 388,165 | — | ||||||||||||||||
|
|
|
|
|
|||||||||||||||||
| Net Assets Applicable to Common Shareholders | ||||||||||||||||||||
| Total increase (decrease) in net assets applicable to Common Shareholders |
(40,752,197 | ) | 15,383,821 | (27,609,156 | ) | 10,892,345 | ||||||||||||||
| Beginning of year |
728,621,283 | 713,237,462 | 505,366,891 | 494,474,546 | ||||||||||||||||
|
|
|
|
|
|||||||||||||||||
| End of year |
$ | 687,869,086 | $ | 728,621,283 | $ | 477,757,735 | $ | 505,366,891 | ||||||||||||
|
|
|
|
|
|||||||||||||||||
| Undistributed net investment income, end of year |
$ | 4,082,795 | $ | 4,872,517 | $ | 3,885,496 | $ | 4,911,708 | ||||||||||||
|
|
|
|
|
|||||||||||||||||
| 1 Distributions for annual periods determined in accordance with U.S. federal income tax regulations. |
|
|||||||||||||||||||
| BlackRock MuniYield Quality Fund II, Inc. (MQT) |
||||||||
| Year Ended April 30, | ||||||||
| Increase (Decrease) in Net Assets Applicable to Common Shareholders: | 2017 | 2016 | ||||||
| Operations | ||||||||
| Net investment income |
$ | 16,378,558 | $ | 17,791,691 | ||||
| Net realized gain (loss) |
1,577,674 | (37,651 | ) | |||||
| Net change in unrealized appreciation (depreciation) |
(18,399,552 | ) | 7,001,207 | |||||
|
|
|
|||||||
| Net increase (decrease) in net assets applicable to Common Shareholders resulting from operations |
(443,320 | ) | 24,755,247 | |||||
|
|
|
|||||||
| Distributions to Common Shareholders1 | ||||||||
| From net investment income |
(16,921,597 | ) | (18,531,404 | ) | ||||
|
|
|
|||||||
| Net Assets Applicable to Common Shareholders | ||||||||
| Total increase (decrease) in net assets applicable to Common Shareholders |
(17,364,917 | ) | 6,223,843 | |||||
| Beginning of year |
326,071,795 | 319,847,952 | ||||||
|
|
|
|||||||
| End of year |
$ | 308,706,878 | $ | 326,071,795 | ||||
|
|
|
|||||||
| Undistributed net investment income, end of year |
$ | 3,369,798 | $ | 4,306,248 | ||||
|
|
|
|||||||
| 1 Distributions for annual periods determined in accordance with U.S. federal income tax regulations. |
||||||||
| See Notes to Financial Statements. | ||||||
| 38 | ANNUAL REPORT | APRIL 30, 2017 | ||||
| Statements of Cash Flows |
| Year Ended April 30, 2017 | BlackRock MuniYield Fund, Inc. (MYD) |
BlackRock MuniYield Quality Fund, Inc. (MQY) |
BlackRock MuniYield Quality Fund II, Inc. (MQT) |
|||||||||
| Cash Provided by (Used for) Operating Activities | ||||||||||||
| Net decrease in net assets resulting from operations |
$ | (1,650,581 | ) | $ | (1,147,468 | ) | $ | (443,320 | ) | |||
| Adjustments to reconcile net decrease in net assets resulting from operations to net cash provided by operating activities: |
| |||||||||||
| Proceeds from sales of long-term investments |
116,891,005 | 102,365,170 | 72,035,592 | |||||||||
| Purchases of long-term investments |
(119,303,980 | ) | (110,351,132 | ) | (65,794,781 | ) | ||||||
| Net proceeds from sales (purchases) of short-term securities |
5,255,502 | 1,601,699 | (3,005,787 | ) | ||||||||
| Amortization of premium and accretion of discount on investments and other fees |
1,157,236 | (1,051,701 | ) | (565,294 | ) | |||||||
| Net realized gain on investments |
(1,488,005 | ) | (762,438 | ) | (7,182 | ) | ||||||
| Net unrealized loss on investments |
44,575,824 | 29,408,327 | 17,889,766 | |||||||||
| (Increase) Decrease in Assets: |
| |||||||||||
| Cash pledged for futures contracts |
(921,000 | ) | (939,000 | ) | (608,000 | ) | ||||||
| Receivables: |
| |||||||||||
| Interest — unaffiliated |
(251,538 | ) | 42,032 | 116,909 | ||||||||
| Dividends — affiliated |
(2,070 | ) | (4,361 | ) | (3,180 | ) | ||||||
| Prepaid expenses |
22,649 | 14,393 | 15,197 | |||||||||
| Increase (Decrease) in Liabilities: |
| |||||||||||
| Payables: |
| |||||||||||
| Investment advisory fees |
(15,582 | ) | (6,951 | ) | (7,610 | ) | ||||||
| Interest expense and fees |
324,855 | 215,137 | 110,157 | |||||||||
| Officer’s and Directors’ fees |
53,266 | 37,382 | (647 | ) | ||||||||
| Variation margin on futures contracts |
9,343 | 31,749 | 21,202 | |||||||||
| Other accrued expenses |
44,576 | 37,902 | 19,909 | |||||||||
|
|
|
|||||||||||
| Net cash provided by operating activities |
44,701,500 | 19,490,740 | 19,772,931 | |||||||||
|
|
|
|||||||||||
| Cash Provided by (Used for) Financing Activities | ||||||||||||
| Proceeds from TOB Trust Certificates |
29,726,038 | 28,284,434 | 11,965,847 | |||||||||
| Repayments of TOB Trust Certificates |
(35,185,936 | ) | (21,251,555 | ) | (14,605,113 | ) | ||||||
| Proceeds from Loan for TOB Trust Certificates |
59,779 | 6,865,954 | 2,625,890 | |||||||||
| Repayments of Loan for TOB Trust Certificates |
(59,779 | ) | (6,865,954 | ) | (2,625,890 | ) | ||||||
| Cash dividends paid to Common Shareholders |
(39,327,636 | ) | (26,582,703 | ) | (17,034,387 | ) | ||||||
| Increase (decrease) in bank overdraft |
70,175 | 49,014 | (99,278 | ) | ||||||||
| Amortization of deferred offering costs |
15,859 | 10,070 | — | |||||||||
|
|
|
|||||||||||
| Net cash used for financing activities |
(44,701,500 | ) | (19,490,740 | ) | (19,772,931 | ) | ||||||
|
|
|
|||||||||||
| Cash | ||||||||||||
| Net increase in cash |
— | — | — | |||||||||
| Cash at beginning of year |
— | — | — | |||||||||
|
|
|
|||||||||||
| Cash at end of year |
— | — | — | |||||||||
|
|
|
|||||||||||
| Supplemental Disclosure of Cash Flow Information | ||||||||||||
| Cash paid during the year for interest expense |
$ | 5,729,875 | $ | 3,985,832 | $ | 2,722,533 | ||||||
|
|
|
|||||||||||
| Non-Cash Financing Activities | ||||||||||||
| Capital shares issued in reinvestment of distributions paid to Common Shareholders |
$ | 1,591,944 | $ | 388,165 | — | |||||||
|
|
|
|||||||||||
| See Notes to Financial Statements. | ||||||
| ANNUAL REPORT | APRIL 30, 2017 | 39 | ||||
| Financial Highlights | BlackRock MuniYield Fund, Inc. (MYD) |
| Year Ended April 30, | ||||||||||||||||||||
| 2017 | 2016 | 2015 | 2014 | 2013 | ||||||||||||||||
| Per Share Operating Performance | ||||||||||||||||||||
| Net asset value, beginning of year |
$ | 15.61 | $ | 15.29 | $ | 14.71 | $ | 16.01 | $ | 15.19 | ||||||||||
|
|
|
|||||||||||||||||||
| Net investment income1 |
0.84 | 0.90 | 0.91 | 0.94 | 0.95 | |||||||||||||||
| Net realized and unrealized gain (loss) |
(0.87 | ) | 0.35 | 0.62 | (1.25 | ) | 0.89 | |||||||||||||
|
|
|
|||||||||||||||||||
| Net increase (decrease) from investment operations |
(0.03 | ) | 1.25 | 1.53 | (0.31 | ) | 1.84 | |||||||||||||
|
|
|
|||||||||||||||||||
| Distributions to Common Shareholders from net investment income2 |
(0.87 | ) | (0.93 | ) | (0.95 | ) | (0.99 | ) | (1.02 | ) | ||||||||||
|
|
|
|||||||||||||||||||
| Net asset value, end of year |
$ | 14.71 | $ | 15.61 | $ | 15.29 | $ | 14.71 | $ | 16.01 | ||||||||||
|
|
|
|||||||||||||||||||
| Market price, end of year |
$ | 14.75 | $ | 15.73 | $ | 14.91 | $ | 14.14 | $ | 16.24 | ||||||||||
|
|
|
|||||||||||||||||||
| Total Return Applicable to Common Shareholders3 | ||||||||||||||||||||
| Based on net asset value |
(0.16)% | 8.81% | 10.91% | (1.21)% | 12.32% | |||||||||||||||
|
|
|
|||||||||||||||||||
| Based on market price |
(0.65)% | 12.36% | 12.51% | (6.38)% | 11.73% | |||||||||||||||
|
|
|
|||||||||||||||||||
| Ratios to Average Net Assets Applicable to Common Shareholders | ||||||||||||||||||||
| Total expenses |
1.75% | 1.39% | 1.37% | 1.49% | 1.52% | |||||||||||||||
|
|
|
|||||||||||||||||||
| Total expenses after fees waived and paid indirectly |
1.75% | 1.39% | 1.36% | 1.49% | 1.52% | |||||||||||||||
|
|
|
|||||||||||||||||||
| Total expenses after fees waived and paid indirectly and excluding interest expense, fees and amortization of offering costs4,5 |
0.89% | 0.88% | 0.89% | 1.20% | 1.17% | |||||||||||||||
|
|
|
|||||||||||||||||||
| Net investment income to Common Shareholders |
5.52% | 5.91% | 5.94% | 6.70% | 6.02% | |||||||||||||||
|
|
|
|||||||||||||||||||
| Supplemental Data | ||||||||||||||||||||
| Net assets applicable to Common Shareholders, end of year (000) |
$ | 687,869 | $ | 728,621 | $ | 713,237 | $ | 686,213 | $ | 745,575 | ||||||||||
|
|
|
|||||||||||||||||||
| VRDP Shares outstanding at $100,000 liquidation value, end of year (000) |
$ | 251,400 | $ | 251,400 | $ | 251,400 | $ | 251,400 | $ | 251,400 | ||||||||||
|
|
|
|||||||||||||||||||
| Asset coverage per VRDP Shares at $100,000 liquidation value, end of year |
$ | 373,615 | $ | 389,825 | $ | 383,706 | $ | 372,956 | $ | 396,569 | ||||||||||
|
|
|
|||||||||||||||||||
| Borrowings outstanding, end of year (000) |
$ | 168,316 | $ | 173,776 | $ | 163,621 | $ | 169,241 | $ | 207,943 | ||||||||||
|
|
|
|||||||||||||||||||
| Portfolio turnover rate |
10% | 9% | 11% | 17% | 16% | |||||||||||||||
|
|
|
|||||||||||||||||||
| 1 | Based on average Common Shares outstanding. |
| 2 | Distributions for annual periods determined in accordance with U.S. federal income tax regulations. |
| 3 | Total returns based on market price, which can be significantly greater or less than the net asset value, may result in substantially different returns. Where applicable, excludes the effects of any sales charges and assumes the reinvestment of distributions at actual reinvestment prices. |
| 4 | Interest expense, fees and amortization of offering costs related to TOBs and/or VRDP Shares. See Note 4 and Note 10 of the Notes to Financial Statements for details. |
| 5 | For the year ended April 30, 2017, the total expense ratio after fees waived and paid indirectly and excluding interest expense, fees, amortization of offering costs, liquidity and remarketing fees were as follows: |
| Year Ended April 30, | ||||||||
| 2017 | 2016 | 2015 | 2014 | 2013 | ||||
| 0.89% | 0.88% | 0.88% | 0.92% | 0.90% | ||||
|
| ||||||||
| See Notes to Financial Statements. | ||||||
| 40 | ANNUAL REPORT | APRIL 30, 2017 | ||||
| Financial Highlights | BlackRock MuniYield Quality Fund, Inc. (MQY) |
| Year Ended April 30, | ||||||||||||||||||||
| 2017 | 2016 | 2015 | 2014 | 2013 | ||||||||||||||||
| Per Share Operating Performance | ||||||||||||||||||||
| Net asset value, beginning of year |
$ | 16.47 | $ | 16.12 | $ | 15.73 | $ | 16.83 | $ | 16.22 | ||||||||||
|
|
|
|||||||||||||||||||
| Net investment income1 |
0.85 | 0.90 | 0.92 | 0.95 | 0.93 | |||||||||||||||
| Net realized and unrealized gain (loss) |
(0.89 | ) | 0.40 | 0.43 | (1.07 | ) | 0.64 | |||||||||||||
|
|
|
|||||||||||||||||||
| Net increase (decrease) from investment operations |
(0.04 | ) | 1.30 | 1.35 | (0.12 | ) | 1.57 | |||||||||||||
|
|
|
|||||||||||||||||||
| Distributions to Common Shareholders:2 | ||||||||||||||||||||
| From net investment income |
(0.87 | ) | (0.95 | ) | (0.96 | ) | (0.96 | ) | (0.96 | ) | ||||||||||
| From net realized gain |
— | — | — | (0.02 | ) | — | ||||||||||||||
|
|
|
|||||||||||||||||||
| Total distributions |
(0.87 | ) | (0.95 | ) | (0.96 | ) | (0.98 | ) | (0.96 | ) | ||||||||||
|
|
|
|||||||||||||||||||
| Net asset value, end of year |
$ | 15.56 | $ | 16.47 | $ | 16.12 | $ | 15.73 | $ | 16.83 | ||||||||||
|
|
|
|||||||||||||||||||
| Market price, end of year |
$ | 15.14 | $ | 16.56 | $ | 15.52 | $ | 14.84 | $ | 16.94 | ||||||||||
|
|
|
|||||||||||||||||||
| Total Return Applicable to Common Shareholders3 | ||||||||||||||||||||
| Based on net asset value |
(0.12)% | 8.61% | 9.09% | 0.04% | 9.86% | |||||||||||||||
|
|
|
|||||||||||||||||||
| Based on market price |
(3.34)% | 13.35% | 11.32% | (6.23)% | 11.75% | |||||||||||||||
|
|
|
|||||||||||||||||||
| Ratios to Average Net Assets Applicable to Common Shareholders | ||||||||||||||||||||
| Total expenses |
1.74% | 1.47% | 1.46% | 1.58% | 1.53% | |||||||||||||||
|
|
|
|||||||||||||||||||
| Total expenses after fees waived and paid indirectly |
1.74% | 1.47% | 1.46% | 1.58% | 1.53% | |||||||||||||||
|
|
|
|||||||||||||||||||
| Total expenses after fees waived and paid indirectly and excluding interest expense, fees and amortization of offering costs4,5 |
0.89% | 1.09% | 1.25% | 1.32% | 1.23% | |||||||||||||||
|
|
|
|||||||||||||||||||
| Net investment income to Common Shareholders |
5.28% | 5.62% | 5.65% | 6.28% | 5.57% | |||||||||||||||
|
|
|
|||||||||||||||||||
| Supplemental Data | ||||||||||||||||||||
| Net assets applicable to Common Shareholders, end of year (000) |
$ | 477,758 | $ | 505,367 | $ | 494,475 | $ | 482,666 | $ | 515,995 | ||||||||||
|
|
|
|||||||||||||||||||
| VRDP Shares outstanding at $100,000 liquidation value, end of year (000) |
$ | 176,600 | $ | 176,600 | $ | 176,600 | $ | 176,600 | $ | 176,600 | ||||||||||
|
|
|
|||||||||||||||||||
| Asset coverage per VRDP Shares at $100,000 liquidation value, end of year |
$ | 370,531 | $ | 386,165 | $ | 379,997 | $ | 373,310 | $ | 392,183 | ||||||||||
|
|
|
|||||||||||||||||||
| Borrowings outstanding, end of year (000) |
$ | 119,144 | $ | 112,111 | $ | 114,962 | $ | 121,321 | $ | 129,431 | ||||||||||
|
|
|
|||||||||||||||||||
| Portfolio turnover rate |
13% | 10% | 14% | 12% | 15% | |||||||||||||||
|
|
|
|||||||||||||||||||
| 1 | Based on average Common Shares outstanding. |
| 2 | Distributions for annual periods determined in accordance with U.S. federal income tax regulations. |
| 3 | Total returns based on market price, which can be significantly greater or less than the net asset value, may result in substantially different returns. Where applicable, excludes the effects of any sales charges and assumes the reinvestment of distributions at actual reinvestment prices. |
| 4 | Interest expense, fees and amortization of offering costs related to TOBs and/or VRDP Shares. See Note 4 and Note 10 of the Notes to Financial Statements for details. |
| 5 | For the year ended April 30, 2017, the total expense ratio after fees waived and paid indirectly and excluding interest expense, fees, amortization of offering costs, liquidity and remarketing fees were as follows: |
| Year Ended April 30, | ||||||||
| 2017 | 2016 | 2015 | 2014 | 2013 | ||||
| 0.89% | 0.92% | 0.89% | 0.93% | 0.90% | ||||
|
| ||||||||
| See Notes to Financial Statements. | ||||||
| ANNUAL REPORT | APRIL 30, 2017 | 41 | ||||
| Financial Highlights | BlackRock MuniYield Quality Fund II, Inc. (MQT) |
| Year Ended April 30, | ||||||||||||||||||||
| 2017 | 2016 | 2015 | 2014 | 2013 | ||||||||||||||||
| Per Share Operating Performance | ||||||||||||||||||||
| Net asset value, beginning of year |
$ | 14.45 | $ | 14.18 | $ | 13.78 | $ | 14.68 | $ | 14.11 | ||||||||||
|
|
|
|||||||||||||||||||
| Net investment income1 |
0.73 | 0.79 | 0.80 | 0.83 | 0.82 | |||||||||||||||
| Net realized and unrealized gain (loss) |
(0.74 | ) | 0.30 | 0.45 | (0.88 | ) | 0.58 | |||||||||||||
|
|
|
|||||||||||||||||||
| Net increase (decrease) from investment operations |
(0.01 | ) | 1.09 | 1.25 | (0.05 | ) | 1.40 | |||||||||||||
|
|
|
|||||||||||||||||||
| Distributions to Common Shareholders from net investment income2 |
(0.75 | ) | (0.82 | ) | (0.85 | ) | (0.85 | ) | (0.83 | ) | ||||||||||
|
|
|
|||||||||||||||||||
| Net asset value, end of year |
$ | 13.69 | $ | 14.45 | $ | 14.18 | $ | 13.78 | $ | 14.68 | ||||||||||
|
|
|
|||||||||||||||||||
| Market price, end of year |
$ | 12.94 | $ | 14.33 | $ | 13.44 | $ | 12.91 | $ | 14.41 | ||||||||||
|
|
|
|||||||||||||||||||
| Total Return Applicable to Common Shareholders3 | ||||||||||||||||||||
| Based on net asset value |
0.12% | 8.48% | 9.70% | 0.55% | 10.17% | |||||||||||||||
|
|
|
|||||||||||||||||||
| Based on market price |
(4.57)% | 13.42% | 10.98% | (4.04)% | 9.55% | |||||||||||||||
|
|
|
|||||||||||||||||||
| Ratios to Average Net Assets Applicable to Common Shareholders | ||||||||||||||||||||
| Total expenses |
1.79% | 1.48% | 1.47% | 1.56% | 1.49% | |||||||||||||||
|
|
|
|||||||||||||||||||
| Total expenses after fees waived and paid indirectly |
1.79% | 1.48% | 1.47% | 1.56% | 1.49% | |||||||||||||||
|
|
|
|||||||||||||||||||
| Total expenses after fees waived and paid indirectly and excluding interest expense, fees and amortization of offering costs4 |
0.90% | 0.91% | 0.92% | 0.95% | 0.90% | |||||||||||||||
|
|
|
|||||||||||||||||||
| Net investment income to Common Shareholders |
5.13% | 5.60% | 5.65% | 6.32% | 5.62% | |||||||||||||||
|
|
|
|||||||||||||||||||
| Supplemental Data | ||||||||||||||||||||
| Net assets applicable to Common Shareholders, end of year (000) |
$ | 308,707 | $ | 326,072 | $ | 319,848 | $ | 310,886 | $ | 331,171 | ||||||||||
|
|
|
|||||||||||||||||||
| VMTP Shares outstanding at $100,000 liquidation value, end of year (000) |
$ | 116,500 | $ | 116,500 | $ | 116,500 | $ | 116,500 | $ | 116,500 | ||||||||||
|
|
|
|||||||||||||||||||
| Asset coverage per VMTP Shares at $100,000 liquidation value, end of year |
$ | 364,984 | $ | 379,890 | $ | 374,548 | $ | 366,855 | $ | 384,267 | ||||||||||
|
|
|
|||||||||||||||||||
| Borrowings outstanding, end of year (000) |
$ | 72,634 | $ | 75,273 | $ | 78,851 | $ | 75,189 | $ | 82,257 | ||||||||||
|
|
|
|||||||||||||||||||
| Portfolio turnover rate |
13% | 10% | 13% | 16% | 15% | |||||||||||||||
|
|
|
|||||||||||||||||||
| 1 | Based on average Common Shares outstanding. |
| 2 | Distributions for annual periods determined in accordance with U.S. federal income tax regulations. |
| 3 | Total returns based on market price, which can be significantly greater or less than the net asset value, may result in substantially different returns. Where applicable, excludes the effects of any sales charges and assumes the reinvestment of distributions at actual reinvestment prices. |
| 4 | Interest expense, fees and amortization of offering costs related to TOBs and/or VMTP Shares. See Note 4 and Note 10 of the Notes to Financial Statements for details. |
| See Notes to Financial Statements. | ||||||
| 42 | ANNUAL REPORT | APRIL 30, 2017 | ||||
| Notes to Financial Statements | ||||
1. Organization:
The following are registered under the Investment Company Act of 1940, as amended (the “1940 Act”), as closed-end management investment companies and are referred to herein collectively as the “Funds”, or individually, a “Fund”:
| Fund Name | Herein Referred to As | Organized | Diversification Classification |
|||||||||
| BlackRock MuniYield Fund, Inc. |
MYD | Maryland | Diversified | |||||||||
| BlackRock MuniYield Quality Fund, Inc. |
MQY | Maryland | Diversified | |||||||||
| BlackRock MuniYield Quality Fund II, Inc. |
MQT | Maryland | Diversified | |||||||||
The Boards of Directors of the Funds are collectively referred to throughout this report as the “Board of Directors” or the “Board,” and the directors thereof are collectively referred to throughout this report as “Directors.” The Funds determine and make available for publication the NAVs of their Common Shares on a daily basis.
The Funds, together with certain other registered investment companies advised by BlackRock Advisors, LLC (the “Manager”) or its affiliates, are included in a complex of closed-end funds referred to as the Closed-End Complex.
2. Significant Accounting Policies:
The financial statements are prepared in conformity with accounting principles generally accepted in the United States of America (“U.S. GAAP”), which may require management to make estimates and assumptions that affect the reported amounts of assets and liabilities in the financial statements, disclosure of contingent assets and liabilities at the date of the financial statements and the reported amounts of increases and decreases in net assets from operations during the reporting period. Actual results could differ from those estimates. Each Fund is considered an investment company under U.S. GAAP and follows the accounting and reporting guidance applicable to investment companies. Below is a summary of significant accounting policies:
Investment Transactions and Investment Income: For financial reporting purposes, investment transactions are recorded on the dates the transactions are entered into (the trade dates). Realized gains and losses on investment transactions are determined on the identified cost basis. Interest income, including amortization and accretion of premiums and discounts on debt securities, is recognized on the accrual basis.
Segregation and Collateralization: In cases where a Fund enters into certain investments (e.g., futures contracts) or certain borrowings (e.g., TOB Trust transactions) that would be treated as “senior securities” for 1940 Act purposes, a Fund may segregate or designate on its books and records cash or liquid assets having a market value at least equal to the amount of its future obligations under such investments [or borrowings. Doing so allows the investment or borrowing to be excluded from treatment as a “senior security.” Furthermore, if required by an exchange or counterparty agreement, the Funds may be required to deliver/deposit cash and/or securities to/with an exchange, or broker-dealer or custodian as collateral for certain investments or obligations.
Distributions: Distributions from net investment income are declared and paid monthly. Distributions of capital gains are recorded on the ex-dividend date and made at least annually. The character and timing of distributions are determined in accordance with U.S. federal income tax regulations, which may differ from U.S. GAAP.
Distributions to Preferred Shareholders are accrued and determined as described in Note 10.
Deferred Compensation Plan: Under the Deferred Compensation Plan (the “Plan”) approved by each Fund’s Board, the independent Directors (“Independent Directors”) may defer a portion of their annual complex-wide compensation. Deferred amounts earn an approximate return as though equivalent dollar amounts had been invested in common shares of certain other BlackRock Closed-End Funds selected by the Independent Directors. This has the same economic effect for the Independent Directors as if the Independent Directors had invested the deferred amounts directly in certain other BlackRock Closed-End Funds.
The Plan is not funded and obligations thereunder represent general unsecured claims against the general assets of each Fund, if applicable. Deferred compensation liabilities are included in officer’s and directors’ fees payable in the Statements of Assets and Liabilities and will remain as a liability of the Funds until such amounts are distributed in accordance with the Plan.
Recent Accounting Standards: In November 2016, the Financial Accounting Standards Board issued Accounting Standards Update “Restricted Cash” which will require entities to include the total of cash, cash equivalents, restricted cash, and restricted cash equivalents in the beginning and ending cash balances in the Statements of Cash Flows. The guidance will be applied retrospectively and is effective for fiscal years beginning after December 15, 2017, and interim periods within those years. Management is evaluating the impact, if any, of this guidance on the Funds’ presentation in the Statements of Cash Flows.
In March 2017, the Financial Accounting Standards Board issued Accounting Standards Update “Premium Amortization of Purchased Callable Debt Securities” which amends the amortization period for certain purchased callable debt securities. Under the new guidance, premium amortization of purchased
| ANNUAL REPORT | APRIL 30, 2017 | 43 |
| Notes to Financial Statements (continued) |
callable debt securities that have explicit, non-contingent call features and are callable at fixed prices will be amortized to the earliest call date. The guidance will be applied on a modified retrospective basis and is effective for fiscal years, and their interim periods, beginning after December 15, 2018. Management is currently evaluating the impact of this guidance to the Funds.
SEC Reporting Modernization: The Securities and Exchange Commission (“SEC”) adopted new rules and forms and amended other rules to enhance the reporting and disclosure of information by registered investment companies. As part of these changes, the SEC amended Regulation S-X to standardize and enhance disclosures in investment company financial statements. The compliance date for implementing the new or amended rules is August 1, 2017.
Indemnifications: In the normal course of business, a Fund enters into contracts that contain a variety of representations that provide general indemnification. A Fund’s maximum exposure under these arrangements is unknown because it involves future potential claims against a Fund, which cannot be predicted with any certainty.
Other: Expenses directly related to a Fund are charged to the Fund. Other operating expenses shared by several funds, including other funds managed by the Manager, are prorated among those funds on the basis of relative net assets or other appropriate methods.
Through May 31, 2016, the Funds had an arrangement with their custodian whereby credits were earned on uninvested cash balances, which could be used to reduce custody fees and/or overdraft charges. Credits previously earned have been utilized until December 31, 2016. Under current arrangements effective June 1, 2016, the Funds no longer earn credits on uninvested cash, and may incur charges on uninvested cash balances and overdrafts, subject to certain conditions.
3. Investment Valuation and Fair Value Measurements:
Investment Valuation Policies: The Funds’ investments are valued at fair value (also referred to as “market value” within the financial statements) as of the close of trading on the New York Stock Exchange (“NYSE”) ( generally 4:00 p.m., Eastern time) (or if the reporting date falls on a day the NYSE is closed, investments are valued at fair value as of the period end). U.S. GAAP defines fair value as the price the Funds would receive to sell an asset or pay to transfer a liability in an orderly transaction between market participants at the measurement date. The Funds determine the fair values of their financial instruments using various independent dealers or pricing services under policies approved by the Board of Directors of each Fund (the “Board”). The BlackRock Global Valuation Methodologies Committee (the “Global Valuation Committee”) is the committee formed by management to develop global pricing policies and procedures and to oversee the pricing function for all financial instruments.
Fair Value Inputs and Methodologies: The following methods and inputs are used to establish the fair value of each Fund’s assets and liabilities:
| • | Municipal investments (including commitments to purchase such investments on a “when-issued” basis) are valued on the basis of prices provided by dealers or pricing services. In determining the value of a particular investment, pricing services may use certain information with respect to transactions in such investments, quotations from dealers, pricing matrixes, market transactions in comparable investments and information with respect to various relationships between investments. |
| • | Investments in open-end U.S. mutual funds are valued at NAV each business day. |
| • | Futures contracts traded on exchanges are valued at their last sale price. |
If events (e.g., a company announcement, market volatility or a natural disaster) occur that are expected to materially affect the value of such investments, or in the event that the application of these methods of valuation results in a price for an investment that is deemed not to be representative of the market value of such investment, or if a price is not available, the investment will be valued by the Global Valuation Committee, or its delegate, in accordance with a policy approved by the Board as reflecting fair value (“Fair Valued Investments”). The fair valuation approaches that may be used by the Global Valuation Committee will include Market approach, Income approach and Cost approach. Valuation techniques such as discounted cash flow, use of market comparables and matrix pricing are types of valuation approaches and typically used in determining fair value. When determining the price for Fair Valued Investments, the Global Valuation Committee, or its delegate, seeks to determine the price that each Fund might reasonably expect to receive or pay from the current sale or purchase of that asset or liability in an arm’s-length transaction. Fair value determinations shall be based upon all available factors that the Global Valuation Committee, or its delegate, deems relevant and consistent with the principles of fair value measurement. The pricing of all Fair Valued Investments is subsequently reported to the Board or a committee thereof on a quarterly basis.
Fair Value Hierarchy: Various inputs are used in determining the fair value of investments and derivative financial instruments. These inputs to valuation techniques are categorized into a fair value hierarchy consisting of three broad levels for financial statement purposes as follows:
| • | Level 1 — unadjusted price quotations in active markets/exchanges for identical assets or liabilities that each Fund has the ability to access |
| • | Level 2 — other observable inputs (including, but not limited to, quoted prices for similar assets or liabilities in markets that are active, quoted prices for identical or similar assets or liabilities in markets that are not active, inputs other than quoted prices that are observable for the assets or liabilities (such as interest rates, yield curves, volatilities, prepayment speeds, loss severities, credit risks and default rates) or other market–corroborated inputs) |
| 44 | ANNUAL REPORT | APRIL 30, 2017 |
| Notes to Financial Statements (continued) | ||||
| • | Level 3 — unobservable inputs based on the best information available in the circumstances, to the extent observable inputs are not available (including each Fund’s own assumptions used in determining the fair value of investments and derivative financial instruments) |
The hierarchy gives the highest priority to unadjusted quoted prices in active markets for identical assets or liabilities (Level 1 measurements) and the lowest priority to unobservable inputs (Level 3 measurements). Accordingly, the degree of judgment exercised in determining fair value is greatest for instruments categorized in Level 3. The inputs used to measure fair value may fall into different levels of the fair value hierarchy. In such cases, for disclosure purposes, the fair value hierarchy classification is determined based on the lowest level input that is significant to the fair value measurement in its entirety. Investments classified within Level 3 have significant unobservable inputs used by the Global Valuation Committee in determining the price for Fair Valued Investments. Level 3 investments include equity or debt issued by privately held companies or funds. There may not be a secondary market, and/or there are a limited number of investors. Level 3 investments may also be adjusted to reflect illiquidity and/or non-transferability, with the amount of such discount estimated by the Global Valuation Committee in the absence of market information.
Changes in valuation techniques may result in transfers into or out of an assigned level within the hierarchy. In accordance with each Fund’s policy, transfers between different levels of the fair value hierarchy are deemed to have occurred as of the beginning of the reporting period. The categorization of a value determined for investments and derivative financial instruments is based on the pricing transparency of the investments and derivative financial instruments and is not necessarily an indication of the risks associated with investing in those securities.
4. Securities and Other Investments:
Zero-Coupon Bonds: Zero-coupon bonds, are normally issued at a significant discount from face value and do not provide for periodic interest payments. These bonds may experience greater volatility in market value than other debt obligations of similar maturity which provide for regular interest payments.
Forward Commitments and When-Issued Delayed Delivery Securities: Certain Funds may purchase securities on a when-issued basis and may purchase or sell securities on a forward commitment basis. Settlement of such transactions normally occurs within a month or more after the purchase or sale commitment is made. A Fund may purchase securities under such conditions with the intention of actually acquiring them, but may enter into a separate agreement to sell the securities before the settlement date. Since the value of securities purchased may fluctuate prior to settlement, a Fund may be required to pay more at settlement than the security is worth. In addition, a Fund is not entitled to any of the interest earned prior to settlement. When purchasing a security on a delayed delivery basis, a Fund assumes the rights and risks of ownership of the security, including the risk of price and yield fluctuations. In the event of default by the counterparty, a Fund’s maximum amount of loss is the unrealized appreciation of unsettled when-issued transactions.
Municipal Bonds Transferred to TOB Trusts: Certain Funds leverage their assets through the use of “TOB Trust” transactions. The Funds transfer municipal bonds into a special purpose trust (a “TOB Trust”). A TOB Trust generally issues two classes of beneficial interests: short-term floating rate interests (“TOB Trust Certificates”), which are sold to third party investors, and residual inverse floating rate interests (“TOB Residuals”), which are generally issued to the participating Funds that contributed the municipal bonds to the TOB Trust. The TOB Trust Certificates have interest rates that generally reset weekly and their holders have the option to tender such certificates to the TOB Trust for redemption at par and any accrued interest at each reset date. The TOB Residuals held by a Fund generally provide the Fund with the right to cause the holders of a proportional share of the TOB Trust Certificates to tender their certificates to the TOB Trust at par plus accrued interest. The Funds may withdraw a corresponding share of the municipal bonds from the TOB Trust. Other funds managed by the investment adviser may also contribute municipal bonds to a TOB Trust into which a Fund has contributed bonds. If multiple BlackRock advised funds participate in the same TOB Trust, the economic rights and obligations under the TOB Residuals will be shared among the funds ratably in proportion to their participation in the TOB Trust.
TOB Trusts are generally supported by a liquidity facility provided by a third party bank or other financial institution (the “Liquidity Provider”) that allows the holders of the TOB Trust Certificates to tender their certificates in exchange for payment of par plus accrued interest on any business day. The tendered TOB Trust Certificates may be purchased by the Liquidity Provider and are usually remarketed by a Remarketing Agent, which is typically an affiliated entity of the Liquidity Provider. The Remarketing Agent may also purchase the tendered TOB Trust Certificates for its own account in the event of a failed remarketing.
The TOB Trust may be collapsed without the consent of a Fund, upon the occurrence of tender option termination events (“TOTEs”) or mandatory termination events (“MTEs”), as defined in the TOB Trust agreements. TOTEs include the bankruptcy or default of the issuer of the municipal bonds held in the TOB Trust, a substantial downgrade in the credit quality of the issuer of the municipal bonds held in the TOB Trust, failure of any scheduled payment of principal or interest on the municipal bonds, and/or a judgment or ruling that interest on the municipal bond is subject to U.S. federal income taxation. MTEs may include, among other things, a failed remarketing of the TOB Trust Certificates, the inability of the TOB Trust to obtain renewal of the liquidity support agreement and a substantial decline in the market value of the municipal bonds held in the TOB Trust. Upon the occurrence of a TOTE or an MTE, the TOB Trust would be liquidated with the proceeds applied first to any accrued fees owed to the trustee of the TOB Trust, the Remarketing Agent and the Liquidity Provider. In the case of an MTE, after the payment of fees, the TOB Trust Certificates holders would be paid before the TOB Residuals holders (i.e., the Funds). In contrast, in the case of a TOTE, after payment of fees, the TOB Trust Certificates holders and the TOB Residuals holders would be paid pro
| ANNUAL REPORT | APRIL 30, 2017 | 45 |
| Notes to Financial Statements (continued) |
rata in proportion to the respective face values of their certificates. During the year ended April 30, 2017, no TOB Trusts in which a Fund participated were terminated without the consent of a Fund.
While a Fund’s investment policies and restrictions expressly permit investments in inverse floating rate securities, such as TOB Residuals, they generally restrict the ability of a Fund to borrow money for purposes of making investments. The Funds’ management believes that a Fund’s restrictions on borrowings do not apply to the Funds’ TOB Trust transactions. Each Fund’s transfer of the municipal bonds to a TOB Trust is considered a secured borrowing for financial reporting purposes. The cash received by the TOB Trust from the sale of the TOB Trust Certificates, less certain transaction expenses, is paid to a Fund. A Fund typically invests the cash received in additional municipal bonds. The municipal bonds deposited into a TOB Trust are presented in a Fund’s Schedules of Investments and the TOB Trust Certificates are shown in Other Liabilities in the Statements of Assets and Liabilities. Any loans drawn by the TOB Trust pursuant to the liquidity facility to purchase tendered TOB Trust Certificates would be shown as Loan for TOB Trust Certificates.
Volcker Rule Impact: On December 10, 2013, regulators published final rules implementing section 619 of the Dodd-Frank Wall Street Reform and Consumer Protection Act (the “Volcker Rule”), which precludes banking entities and their affiliates from sponsoring and investing in TOB Trusts. Banking entities subject to the Volcker Rule were required to fully comply by July 21, 2015, with respect to investments in and relationships with TOB Trusts established after December 31, 2013 (“Non-Legacy TOB Trusts”), and by July 21, 2017, with respect to investments in and relationships with TOB Trusts established prior to December 31, 2013 (“Legacy TOB Trusts”).
As a result, a new structure for TOB Trusts has been designed in which no banking entity would sponsor the TOB Trust. Specifically, a Fund establishes, structures and “sponsors” the TOB Trusts in which it holds TOB Residuals. In such a structure, certain responsibilities that previously belonged to a third party bank are performed by, or on behalf of, the Funds. The Funds have restructured any Non-Legacy TOB Trusts and are in the process of restructuring Legacy TOB Trusts in conformity with regulatory guidelines. Until all restructurings are completed, a Fund may, for a period of time, hold TOB Residuals in both Legacy TOB Trusts and new or restructured non-bank sponsored TOB Trusts.
Under the new TOB Trust structure, the Liquidity Provider or Remarketing Agent will no longer purchase the tendered TOB Trust Certificates even in the event of failed remarketing. This may increase the likelihood that a TOB Trust will need to be collapsed and liquidated in order to purchase the tendered TOB Trust Certificates. The TOB Trust may draw upon a loan from the Liquidity Provider to purchase the tendered TOB Trust Certificates. Any loans made by the Liquidity Provider will be secured by the purchased TOB Trust Certificates held by the TOB Trust and will be subject to an increased interest rate based on the number of days the loan is outstanding.
Accounting for TOB Trusts: The municipal bonds deposited into a TOB Trust are presented in a Fund’s Schedules of Investments and the TOB Trust Certificates are shown in Other Liabilities in the Statements of Assets and Liabilities. Any loans drawn by the TOB Trust pursuant to the liquidity facility to purchase tendered TOB Trust Certificates are shown as Loan for TOB Trust Certificates. The carrying amount of a Fund’s payable to the holder of the TOB Trust Certificates, as reported in the Statements of Assets and Liabilities as TOB Trust Certificates, approximates its fair value.
Interest income, including amortization and accretion of premiums and discounts, from the underlying municipal bonds is recorded by a Fund on an accrual basis. Interest expense incurred on the TOB Trust transaction and other expenses related to remarketing, administration, trustee, liquidity and other services to a TOB Trust are shown as interest expense, fees and amortization of offering costs in the Statements of Operations. Fees paid upon creation of the TOB Trust are recorded as debt issuance costs and are amortized to interest expense, fees and amortization of offering costs in the Statements of Operations to the expected maturity of the TOB Trust. In connection with the restructurings of the TOB Trusts to non-bank sponsored TOB Trusts, a Fund incurred non-recurring, legal and restructuring fees, which are recorded as interest expense, fees and amortization of deferred offering costs in the Statements of Operations.
For the year ended April 30, 2017, the following table is a summary of each Fund’s TOB Trusts:
|
Underlying Bonds Transferred to TOB Trusts1 |
Liability for TOB Trust Certificates2 |
Range of Interest Rates |
Average TOB Trust Certificates Outstanding |
Daily Weighted Average Rate of Interest |
||||||||||||||||
| MYD |
$ | 301,181,598 | $ | 168,316,467 | 0.91% - 1.50% | $ | 179,369,586 | 1.27% | ||||||||||||
| MQY |
$ | 219,073,968 | $ | 119,144,362 | 0.92% - 1.50% | $ | 114,370,071 | 1.29% | ||||||||||||
| MQT |
$ | 131,218,575 | $ | 72,633,898 | 0.92% - 1.50% | $ | 72,478,259 | 1.28% | ||||||||||||
| 1 | The municipal bonds transferred to a TOB Trust are generally high grade municipal bonds. In certain cases, when municipal bonds transferred are lower grade municipal bonds, the TOB Trust transaction may include a credit enhancement feature that provides for the timely payment of principal and interest on the bonds to the TOB Trust by a credit enhancement provider in the event of default of the municipal bond. The TOB Trust would be responsible for the payment of the credit enhancement fee and the Funds, as TOB Residuals holders, would be responsible for reimbursement of any payments of principal and interest made by the credit enhancement provider. The maximum potential amounts owed by the Funds, for such reimbursements, as applicable, are included in the maximum potential amounts disclosed for recourse TOB Trusts. |
| 2 | The Funds may invest in TOB Trusts that are structured on a non-recourse or recourse basis. When a Fund invests in TOB Trusts on a non-recourse basis, the Liquidity Provider may be required to make a payment under the liquidity facility. In such an event, the Liquidity Provider will typically either (i) fund the full amount owed under the liquidity facility and be subsequently reimbursed from only the proceeds of the liquidation of all or a portion of the municipal bonds held in the TOB Trust or the remarketing of the TOB Trust Certificates, or |
| 46 | ANNUAL REPORT | APRIL 30, 2017 |
| Notes to Financial Statements (continued) | ||||
| (ii) liquidate all or a portion of the municipal bonds held in the TOB Trust and then fund the balance, if any, of the amount owed under the liquidity facility over the liquidation proceeds (the “Liquidation Shortfall”). If a Fund invests in a TOB Trust on a recourse basis, a Fund will usually enter into a reimbursement agreement with the Liquidity Provider where a Fund is required to reimburse the Liquidity Provider the amount of any Liquidation Shortfall. As a result, if a Fund invests in a recourse TOB Trust, a Fund will bear the risk of loss with respect to any Liquidation Shortfall. If multiple funds participate in any such TOB Trust, these losses will be shared ratably, including the maximum potential amounts owed by a Fund at April 30, 2017, in proportion to their participation in the TOB Trust. The recourse TOB Trusts are identified in the Schedules of Investments including the maximum potential amounts owed by a Fund at April 30, 2017. |
For the year ended April 30, 2017, the following table is a summary of each Fund’s Loan for TOB Trust Certificates:
| Loans Outstanding at |
Range of Interest Rates on Loans at Period End |
Average Loans Outstanding |
Daily Weighted Average Rate of Interest and Other Expenses on Loans |
|||||||||||||
| MYD |
— | — | $ | 8,844 | 0.78% | |||||||||||
| MQY |
— | — | $ | 739,024 | 0.80% | |||||||||||
| MQT |
— | — | $ | 54,444 | 0.78% | |||||||||||
5. Derivative Financial Instruments:
The Funds engage in various portfolio investment strategies using derivative contracts both to increase the returns of the Funds and/or to manage their exposure to certain risks such as credit risk, equity risk, interest rate risk, foreign currency exchange rate risk, commodity price risk or other risks (e.g., inflation risk). Derivative financial instruments categorized by risk exposure are included in the Schedules of Investments. These contracts may be transacted on an exchange over-the-counter (“OTC”).
Futures Contracts: Certain Funds invest in long and/or short positions in futures and options on futures contracts to gain exposure to, or manage exposure to, changes in interest rates (interest rate risk), changes in the value of equity securities (equity risk) or foreign currencies (foreign currency exchange rate risk).
Futures contracts are agreements between the Funds and a counterparty to buy or sell a specific quantity of an underlying instrument at a specified price and on a specified date. Depending on the terms of a contract, it is settled either through physical delivery of the underlying instrument on the settlement date or by payment of a cash amount on the settlement date. Upon entering into a futures contract, the Funds are required to deposit initial margin with the broker in the form of cash or securities in an amount that varies depending on a contract’s size and risk profile. The initial margin deposit must then be maintained at an established level over the life of the contract.
Securities deposited as initial margin are designated in the Schedules of Investments and cash deposited, if any, is shown as cash pledged for futures contracts in the Statements of Assets and Liabilities. Pursuant to the contract, the Funds agree to receive from or pay to the broker an amount of cash equal to the daily fluctuation in market value of the contract (“variation margin”). Variation margin is recorded as unrealized appreciation (depreciation) and, if any, shown as variation margin receivable (or payable) on futures contracts in the Statements of Assets and Liabilities. When the contract is closed, a realized gain or loss is recorded in the Statements of Operations equal to the difference between the value of the contract at the time it was opened and the value at the time it was closed. The use of futures contracts involves the risk of an imperfect correlation in the movements in the price of futures contracts and interest, foreign currency exchange rates or underlying assets.
6. Investment Advisory Agreement and Other Transactions with Affiliates:
The PNC Financial Services Group, Inc. is the largest stockholder and an affiliate of BlackRock, Inc. (“BlackRock”) for 1940 Act purposes.
Investment Advisory: Each Fund, entered into an Investment Advisory Agreement with the Manager, the Funds’ investment adviser, an indirect, wholly-owned subsidiary of BlackRock, to provide investment advisory and administration services. The Manager is responsible for the management of each Fund’s portfolio and provides the personnel, facilities, equipment and certain other services necessary to the operations of each Fund.
For such services, each Fund pays the Manager a monthly fee at an annual rate equal to a percentage of the average daily value of each Fund’s net assets.
| MYD | MQY | MQT | ||||||||||
| Investment advisory fee |
0.50% | 0.50% | 0.50% | |||||||||
For purposes of calculating these fees, “net assets” means the total assets of the Fund minus the sum of its accrued liabilities (which does not include liabilities represented by TOB Trusts and the liquidation preference of preferred shares). It is understood that the liquidation preference of any outstanding preferred stock (other than accumulated dividends) and TOB Trusts is not considered a liability in determining a Fund’s net asset value.
Waivers: With respect to each Fund, the Manager voluntarily agreed to waive its investment advisory fees by the amount of investment advisory fees each Fund pays to the Manager indirectly through its investment in affiliated money market funds (the “affiliated money market fund waiver”). This amount is included in fees waived by the Manager in the Statements of Operations. The amount of waivers and/or reimbursements of fees and expenses made
| ANNUAL REPORT | APRIL 30, 2017 | 47 |
| Notes to Financial Statements (continued) |
pursuant to the expense limitation caps, as applicable, will be reduced by the amount of the affiliated money market fund waiver. For the year ended April 30, 2017, the amounts waived were as follows:
| MYD | MQY | MQT | ||||||||||
| Amounts waived |
$ | 5,358 | $ | 3,824 | $ | 2,523 | ||||||
Effective September 1, 2016, the Manager voluntarily agreed to waive its investment advisory fee with respect to any portion of the Funds’ assets invested in affiliated equity and fixed-income mutual funds and affiliated exchange-traded funds that have a contractual management fee. Prior to September 1, 2016, the Manager did not waive such fees. Effective December 2, 2016, the waiver became contractual through June 30, 2018. The Agreement can be renewed for annual periods thereafter, and may be terminated on 90 days’ notice, each subject to approval by a majority of the Funds’ Independent Directors.
Officers and Directors: Certain officers and/or Directors of the Funds are officers and/or directors of BlackRock or its affiliates. The Funds reimburse the Manager for a portion of the compensation paid to the Funds’ Chief Compliance Officer, which is included in Officer and Directors in the Statements of Operations.
7. Purchases and Sales:
For the year ended April 30, 2017, purchases and sales of investments excluding short-term securities, were as follows:
| MYD | MQY | MQT | ||||||||||
| Purchases |
$ | 112,799,390 | $ | 112,060,349 | $ | 66,865,355 | ||||||
| Sales |
$ | 115,812,840 | $ | 102,385,520 | $ | 71,888,229 | ||||||
8. Income Tax Information:
It is the Funds’ policy to comply with the requirements of the Internal Revenue Code of 1986, as amended, applicable to regulated investment companies, and to distribute substantially all of their taxable income to their shareholders. Therefore, no U.S. federal income tax provision is required.
Each Fund files U.S. federal and various state and local tax returns. No income tax returns are currently under examination. The statute of limitations on each Fund’s U.S. federal tax returns generally remains open for each of the four years ended April 30, 2017. The statutes of limitations on each Fund’s state and local tax returns may remain open for an additional year depending upon the jurisdiction.
Management has analyzed tax laws and regulations and their application to the Funds as of April 30, 2017, inclusive of the open tax return years, and does not believe that there are any uncertain tax positions that require recognition of a tax liability in the Funds’ financial statements.
U.S. GAAP requires that certain components of net assets be adjusted to reflect permanent differences between financial and tax reporting. These reclassifications have no effect on net assets or net asset values per share. As of period end, the following permanent differences attributable to amortization and accretion methods on fixed-income securities, the characterization of expenses, non-deductible expenses, the expiration of capital loss carryforwards, and the sale of bonds received from TOB Trusts were reclassified to the following accounts:
| MYD | MQY | MQT | ||||||||||
| Paid-in capital |
$ | (4,081,614 | ) | $ | (10,070 | ) | $ | (2,624,082 | ) | |||
| Undistributed (distributions in excess of) net investment income |
$ | 631,677 | $ | (247,596 | ) | $ | (393,411 | ) | ||||
| Accumulated net realized gain (loss) |
$ | 3,449,937 | $ | 257,666 | $ | 3,017,493 | ||||||
The tax character of distributions paid was as follows:
| MYD | MQY | MQT | ||||||||||||||
| Tax-exempt income1 |
4/30/2017 | $ | 44,348,446 | $ | 29,485,924 | $ | 18,761,524 | |||||||||
| 4/30/2016 | $ | 45,476,704 | $ | 30,269,448 | $ | 19,780,167 | ||||||||||
| Ordinary income2 |
4/30/2017 | $ | 80,031 | $ | 21,878 | $ | 30,285 | |||||||||
| 4/30/2016 | 389,796 | 5,182 | 2 | |||||||||||||
|
|
|
|
|
|
|
|
|
|||||||||
| Total |
4/30/2017 | $ | 44,428,477 | $ | 29,507,802 | $ | 18,791,809 | |||||||||
|
|
|
|
|
|
|
|
|
|||||||||
| 4/30/2016 | $ | 45,866,500 | $ | 30,274,630 | $ | 19,780,169 | ||||||||||
|
|
|
|
|
|
|
|
|
|||||||||
| 1 | The Funds designate these amounts paid during the fiscal year ended April 30, 2017, as exempt-interest dividends. |
| 2 | Ordinary income consists primarily of taxable income recognized from market discount. Additionally, all ordinary income distributions are comprised of interest related dividends for non-U.S. residents and are eligible for exemption from U.S. withholding tax for nonresident aliens and foreign corporations. |
| 48 | ANNUAL REPORT | APRIL 30, 2017 |
| Notes to Financial Statements (continued) | ||||
As of period end, the tax components of accumulated net earnings (losses) were as follows:
| MYD | MQY | MQT | ||||||||||
| Undistributed tax-exempt income |
$ | 1,723,134 | $ | 2,502,167 | $ | 1,312,530 | ||||||
| Undistributed ordinary income |
3,364 | 1,552 | — | |||||||||
| Capital loss carryforwards |
(9,970,721 | ) | (2,118,488 | ) | (3,015,657 | ) | ||||||
| Net unrealized gains (losses)1 |
70,163,546 | 46,968,891 | 29,530,577 | |||||||||
|
|
|
|
|
|
|
|||||||
| Total |
$ | 61,919,323 | $ | 47,354,122 | $ | 27,827,450 | ||||||
|
|
|
|
|
|
|
|||||||
| 1 | The differences between book-basis and tax-basis net unrealized gains were attributable primarily to the tax deferral of losses on wash sales and straddles, amortization and accretion methods of premiums and discounts on fixed income securities, the realization for tax purposes of unrealized losses on certain futures contracts, the deferral of compensation to directors and the treatment of residual interests in TOB Trusts. |
As of April 30, 2017, the Funds had capital loss carryforwards available to offset future realized capital gains through the indicated expiration dates as follows:
| Expires April 30, | MYD | MQY | MQT | |||||||||
| No expiration date1 |
$ | 8,294,584 | $ | 2,118,488 | $ | 1,174,204 | ||||||
| 2018 |
1,196,450 | — | 66,689 | |||||||||
| 2019 |
479,687 | — | 1,774,764 | |||||||||
|
|
|
|
|
|
|
|||||||
| Total |
$ | 9,970,721 | $ | 2,118,488 | $ | 3,015,657 | ||||||
|
|
|
|
|
|
|
|||||||
| 1 | Must be utilized prior to losses subject to expiration. |
During the year ended April 30, 2017, the Funds listed below utilized the following amounts of their respective capital loss carryforward:
| MYD | MQY | MQT | ||||||||||
| Amount utilized |
$ | 3,736,275 | $ | 2,183,069 | $ | 1,041,085 | ||||||
As of April 30, 2017, gross unrealized appreciation and depreciation based on cost for U.S. federal income tax purposes were as follows:
| MYD | MQY | MQT | ||||||||||
| Tax cost |
$ | 854,731,438 | $ | 604,212,165 | $ | 394,026,969 | ||||||
|
|
|
|
|
|
|
|||||||
| Gross unrealized appreciation |
79,653,575 | 49,569,022 | 32,093,822 | |||||||||
| Gross unrealized depreciation |
(8,824,435 | ) | (2,361,140 | ) | (2,563,244 | ) | ||||||
|
|
|
|
|
|
|
|||||||
| Net unrealized appreciation (depreciation) |
$ | 70,829,140 | $ | 47,207,882 | $ | 29,530,578 | ||||||
|
|
|
|
|
|
|
|||||||
9. Principal Risks:
Many municipalities insure repayment of their bonds, which may reduce the potential for loss due to credit risk. The market value of these bonds may fluctuate for other reasons, including market perception of the value of such insurance, and there is no guarantee that the insurer will meet its obligation.
Inventories of municipal bonds held by brokers and dealers may decrease, which would lessen their ability to make a market in these securities. Such a reduction in market making capacity could potentially decrease a Fund’s ability to buy or sell bonds. As a result, a Fund may sell a security at a lower price, sell other securities to raise cash, or give up an investment opportunity, any of which could have a negative impact on performance. If a Fund needed to sell large blocks of bonds, those sales could further reduce the bonds’ prices and impact performance.
In the normal course of business, certain Funds invest in securities and enter into transactions where risks exist due to fluctuations in the market (market risk) or failure of the issuer to meet all its obligations, including the ability to pay principal and interest when due (issuer credit risk). The value of securities held by the Funds may decline in response to certain events, including those directly involving the issuers of securities owned by the Funds. Changes arising from the general economy, the overall market and local, regional or global political and/or social instability, as well as currency, interest rate and price fluctuations, may also affect the securities’ value.
Each Fund may be exposed to prepayment risk, which is the risk that borrowers may exercise their option to prepay principal earlier than scheduled during periods of declining interest rates, which would force each Fund to reinvest in lower yielding securities. Each Fund may also be exposed to reinvestment risk, which is the risk that income from each Fund’s portfolio will decline if each Fund invests the proceeds from matured, traded or called fixed-income securities at market interest rates that are below each Fund portfolio’s current earnings rate.
The Funds may hold a significant amount of bonds subject to calls by the issuers at defined dates and prices. When bonds are called by issuers and the Funds reinvest the proceeds received, such investments may be in securities with lower yields than the bonds originally held, and correspondingly, could adversely impact the yield and total return performance of a fund.
It is possible that regulators could take positions that could limit the market for non-bank sponsored TOB Trust transactions or the Funds’ ability to hold TOB Residuals. Under the new TOB Trust structure, the Funds will have certain additional duties and responsibilities, which may give rise to certain additional risks including, but not limited to, compliance, securities law and operational risks.
| ANNUAL REPORT | APRIL 30, 2017 | 49 |
| Notes to Financial Statements (continued) |
There can be no assurance that the Funds can successfully enter into restructured TOB Trust transactions in order to refinance their existing TOB Residuals holdings prior to the compliance date for the Volcker Rule, which may require that the Funds unwind existing TOB Trusts. There can be no assurance that alternative forms of leverage will be available to the Funds and any alternative forms of leverage may be more or less advantageous to the Funds than existing TOB leverage.
Should short-term interest rates rise, the Funds’ investments in TOB Trust transactions may adversely affect the Funds’ net investment income and dividends to Common Shareholders. Also, fluctuations in the market value of municipal bonds deposited into the TOB Trust may adversely affect the Funds’ NAVs per share.
The SEC and various federal banking and housing agencies have adopted credit risk retention rules for securitizations (the “Risk Retention Rules”), which took effect in December 2016. The Risk Retention Rules would require the sponsor of a TOB Trust to retain at least 5% of the credit risk of the underlying assets supporting the TOB Trust’s municipal bonds. The Risk Retention Rules may adversely affect the Funds’ ability to engage in TOB Trust transactions or increase the costs of such transactions in certain circumstances.
TOB Trust transactions constitute an important component of the municipal bond market. Accordingly, implementation of the Volcker Rule and Risk Retention Rules may adversely impact the municipal market, including through reduced demand for and liquidity of municipal bonds and increased financing costs for municipal issuers. Any such developments could adversely affect the Funds. The ultimate impact of these rules on the TOB Trust market and the overall municipal market is not yet certain.
Counterparty Credit Risk: Similar to issuer credit risk, the Funds may be exposed to counterparty credit risk, or the risk that an entity may fail to or be unable to perform on its commitments related to unsettled or open transactions. The Funds manage counterparty credit risk by entering into transactions only with counterparties that the Manager believes have the financial resources to honor their obligations and by monitoring the financial stability of those counterparties. Financial assets, which potentially expose the Funds to market, issuer and counterparty credit risks, consist principally of financial instruments and receivables due from counterparties. The extent of the Funds’ exposure to market, issuer and counterparty credit risks with respect to these financial assets is approximately their value recorded in the Statements of Assets and Liabilities, less any collateral held by the Funds.
A derivative contract may suffer a mark-to-market loss if the value of the contract decreases due to an unfavorable change in the market rates or values of the underlying instrument. Losses can also occur if the counterparty does not perform under the contract.
With exchange-traded futures, there is less counterparty credit risk to the Funds since the exchange or clearinghouse, as counterparty to such instruments, guarantees against a possible default. The clearinghouse stands between the buyer and the seller of the contract; therefore, credit risk is limited to failure of the clearinghouse. While offset rights may exist under applicable law, a Fund does not have a contractual right of offset against a clearing broker or clearinghouse in the event of a default (including the bankruptcy or insolvency). Additionally, credit risk exists in exchange-traded futures with respect to initial and variation margin that is held in a clearing broker’s customer accounts. While clearing brokers are required to segregate customer margin from their own assets, in the event that a clearing broker becomes insolvent or goes into bankruptcy and at that time there is a shortfall in the aggregate amount of margin held by the clearing broker for all its clients, typically the shortfall would be allocated on a pro rata basis across all the clearing broker’s customers, potentially resulting in losses to the Funds.
Concentration Risk: As of period end, MYD and MQT invested a significant portion of its assets in securities in the transportation sector. Changes in economic conditions affecting such sector would have a greater impact on the Funds and could affect the value, income and/or liquidity of positions in such securities.
Certain Funds invest a significant portion of their assets in fixed-income securities and/or use derivatives tied to the fixed-income markets. Changes in market interest rates or economic conditions may affect the value and/or liquidity of such investments. Interest rate risk is the risk that prices of bonds and other fixed-income securities will increase as interest rates fall and decrease as interest rates rise. The Funds may be subject to a greater risk of rising interest rates due to the current period of historically low rates.
10. Capital Share Transactions:
Each Fund is authorized to issue 200 million shares, all of which were initially classified as Common Shares. The par value for each Fund’s Common Shares is $0.10. The par value for each Fund’s Preferred Shares outstanding is $0.10. The Board is authorized, however, to reclassify any unissued Common Shares to Preferred Shares without approval of Common Shareholders.
Common Shares
For the years shown, shares issued and outstanding increased by the following amounts as a result of dividend reinvestment:
| MYD | MQY | |||||||
| Year Ended April 30, 2017 |
101,379 | 23,341 | ||||||
| Year Ended April 30, 2016 |
26,999 | — | ||||||
| 50 | ANNUAL REPORT | APRIL 30, 2017 |
| Notes to Financial Statements (continued) | ||||
For the years ended April 30, 2017 and April 30, 2016 for MQT, shares issued and outstanding remained constant.
Preferred Shares
Each Fund’s Preferred Shares rank prior to the Fund’s Common Shares as to the payment of dividends by the Fund and distribution of assets upon dissolution or liquidation of a Fund. The 1940 Act prohibits the declaration of any dividend on a Fund’s Common Shares or the repurchase of a Fund’s Common Shares if a Fund fails to maintain asset coverage of at least 200% of the liquidation preference of the Fund’s outstanding Preferred Shares. In addition, pursuant to the Preferred Shares’ governing instruments, a Fund is restricted from declaring and paying dividends on classes of shares ranking junior to or on parity with the Fund’s Preferred Shares or repurchasing such shares if a Fund fails to declare and pay dividends on the Preferred Shares, redeem any Preferred Shares required to be redeemed under the Preferred Shares’ governing instruments or comply with the basic maintenance amount requirement of the ratings agencies rating the Preferred Shares.
The holders of Preferred Shares have voting rights equal to the voting rights of the holders of Common Shares (one vote per share) and will vote together with holders of Common Shares (one vote per share) as a single class on certain matters. However, the holders of Preferred Shares, voting as a separate class, are also entitled to elect two Directors to the Board of each Fund. The holders of Preferred Shares are also entitled to elect the full Board of Directors if dividends on the Preferred Shares are not paid for a period of two years. The holders of Preferred Shares are also generally entitled to a separate class vote to amend the Preferred Share governing documents. In addition, the 1940 Act requires the approval of the holders of a majority of any outstanding Preferred Shares, voting as a separate class, to (a) adopt any plan of reorganization that would adversely affect the Preferred Shares, (b) change a Fund’s sub-classification as a closed-end investment company or change its fundamental investment restrictions or (c) change its business so as to cease to be an investment company.
VRDP Shares
MYD and MQY (collectively, the “VRDP Funds”), have issued Series W-7 VRDP Shares, $100,000 liquidation preference per share, in privately negotiated offerings. The VRDP Shares were offered to qualified institutional buyers as defined pursuant to Rule 144A under the Securities Act of 1933, as amended, (the “Securities Act”). The VRDP Shares include a liquidity feature and are currently in a special rate period, each as described below.
As of period end, the VRDP Shares outstanding were as follows:
| Issue Date | Shares Issued | Aggregate Principal | Maturity Date | |||||||||||||
| MYD |
6/30/11 | 2,514 | $ | 251,400,000 | 7/01/41 | |||||||||||
| MQY |
9/15/11 | 1,766 | $ | 176,600,000 | 10/01/41 | |||||||||||
Redemption Terms: Each VRDP Fund is required to redeem its VRDP Shares on the maturity date, unless earlier redeemed or repurchased. Six months prior to the maturity date, each VRDP Fund is required to begin to segregate liquid assets with the Funds’ custodian to fund the redemption. In addition, VRDP Funds are required to redeem certain of their outstanding VRDP Shares if they fail to comply with certain asset coverage, basic maintenance amount or leverage requirements.
Subject to certain conditions, the VRDP Shares may also be redeemed, in whole or in part, at any time at the option of VRDP Funds. The redemption price per VRDP Share is equal to the liquidation preference per share plus any outstanding unpaid dividends.
Liquidity Feature: The VRDP Funds entered into a fee agreement with the liquidity provider that requires an upfront commitment and a per annum liquidity fee payable to the liquidity provider. These fees, if applicable, are shown as liquidity fees in the Statements of Operations.
The fee agreement between MYD and the liquidity provider is for a 364 day term which was scheduled to expire on April 19, 2017. MYD renewed the fee agreement for an additional 364 day term which is scheduled to expire on April 15, 2020 unless renewed or terminated in advance. The fee agreement between MQY and the liquidity provider is scheduled to expire on October 22, 2018 unless renewed or terminated in advance.
In the event the fee agreement is not renewed or is terminated in advance, and the VRDP Funds do not enter into a fee agreement with an alternate liquidity provider, the VRDP Shares will be subject to mandatory purchase by the liquidity provider prior to the termination of the fee agreement. In the event of such mandatory purchase, VRDP Funds are required to redeem the VRDP Shares six months after the purchase date. Immediately after such mandatory purchase, VRDP Funds are required to begin to segregate liquid assets with its/their custodian to fund the redemption. There is no assurance the VRDP Funds will replace such redeemed VRDP Shares with any other preferred shares or other form of leverage.
Remarketing: The VRDP Funds may incur remarketing fees of 0.10% on the aggregate principal amount of all the Fund’s VRDP Shares, which, if any, are included in remarketing fees on Preferred Shares in the Statements of Operations. During any special rate period (as described below), MQY incurs no remarketing fees and MYD incurs nominal remarketing fees.
Dividends: Dividends on the VRDP Shares are payable monthly at a variable rate set weekly by the remarketing agent. Such dividend rates are generally based upon a spread over a base rate and cannot exceed a maximum rate. In the event of a failed remarketing, the dividend rate of the VRDP Shares will be reset to a maximum rate. The maximum rate is determined based on, among other things, the long-term preferred share rating assigned to the VRDP
| ANNUAL REPORT | APRIL 30, 2017 | 51 |
| Notes to Financial Statements (continued) |
Shares and the length of time that the VRDP Shares fail to be remarketed. At the date of issuance, the VRDP Shares were assigned long-term ratings of Aaa from Moody’s and AAA from Fitch. Subsequent to the issuance of the VRDP Shares, Moody’s completed a review of its methodology for rating securities issued by registered closed-end funds. As of period end, the VRDP Shares were assigned a long-term rating of Aa1 from Moody’s under its new ratings methodology. The VRDP Shares continue to be assigned a long-term rating of AAA from Fitch.
For the year ended April 30, 2017, the annualized dividend rates for the VRDP Shares were as follows:
| MYD | MQY | |||||||
| Rate |
1.49% | 1.51% | ||||||
Special Rate Period: Upon issuance of the VRDP Shares on April 17, 2014, MYD commenced an approximate three-year term ending April 19, 2017 (“special rate period”) with respect to their VRDP Shares. On April 5, 2017, the special rate period for MYD was extended to April 15, 2020, during which the VRDP Shares will not be subject to any remarketing and the dividend rate will be based on a predetermined methodology. Prior to April 15, 2020, the holder of the VRDP Shares and MYD may mutually agree to extend the special rate period. If the special rate period is not extended, the VRDP Shares will revert to remarketable securities upon the termination of the special rate period and will be remarketed and available for purchase by qualified institutional investors.
On October 22, 2015, MQY commenced an approximate three-year term scheduled to expire on April 18, 2018 with respect to its VRDP Shares, during which the VRDP Shares will not be subject to any remarketing and the dividend rate will be based on a predetermined methodology. The implementation of the special rate period resulted in a mandatory tender of the VRDP Shares prior to the commencement of the special rate period. The mandatory tender event was not the result of a failed remarketing. The short-term ratings on the VRDP Shares of MQY were withdrawn by Moody’s, Fitch and/or S&P at the commencement of the special rate period. Prior to April 18, 2018, the holder of the VRDP Shares and MQY may mutually agree to extend the special rate period. If the special rate period is not extended, the VRDP Shares will revert to remarketable securities upon the termination of the special rate period and will be remarketed and available for purchase by qualified institutional investors.
During the special rate period, the liquidity and fee agreements remain in effect and the VRDP Shares remain subject to mandatory redemption by the VRDP Funds on the maturity date. The VRDP Shares will not be remarketed or subject to optional or mandatory tender events during the special rate period. During the special rate period, the VRDP Funds are required to comply with the same asset coverage, basic maintenance amount and leverage requirements for the VRDP Shares as is required when the VRDP Shares are not in a special rate period. MYD pays a nominal fee at the annual rate of 0.01% to the liquidity provider and the remarketing agent during the special rate period. MQY does not pay any fees to the liquidity provider and remarketing agent during the special rate period. The VRDP Funds also pay dividends monthly based on the sum of the Securities Industry and Financial Markets Association (“SIFMA”) Municipal Swap Index rate and a percentage per annum based on the long-term ratings assigned to the VRDP Shares.
If a VRDP Fund redeems the VRDP Shares prior to end of the special rate period and the VRDP Shares have long-term ratings above A1/A+ and its equivalent by all ratings agencies then rating the VRDP Shares, then such redemption may be subject to a redemption premium payable to the holder of the VRDP Shares based on the time remaining in the special rate period, subject to certain exceptions for redemptions that are required to comply with minimum asset coverage requirements.
For the year ended April 30, 2017, VRDP Shares issued and outstanding of each Fund remained constant.
VMTP Shares
MQT has issued Series W-7 VMTP Shares, $100,000 liquidation preference per share, in a privately negotiated offering and sale of VMTP Shares exempt from registration under the Securities Act. The VMTP Shares are subject to certain restrictions on transfer, and MQT may also be required to register the VMTP Shares for sale under the Securities Act under certain circumstances. In addition, amendments to the VMTP governing documents generally require the consent of the holders of VMTP Shares.
As of period end, the VMTP Shares outstanding were as follows:
| Issue Date | Shares Issued | Aggregate Principal | Term Redemption Date | |||||||||||||
| MQT |
12/16/11 | 1,165 | $ | 116,500,000 | 1/02/19 | |||||||||||
Redemption Terms: MQT is required to redeem its VMTP Shares on the term redemption date, unless earlier redeemed or repurchased or unless extended. In June 2015, the term redemption date for the VMTP Shares was extended until January 2, 2019. There is no assurance that the term of MQT’s VMTP Shares will be extended further or that MQT’s VMTP Shares will be replaced with any other preferred shares or other form of leverage upon the redemption or repurchase of the VMTP Shares. Six months prior to the term redemption date, MQT is required to begin to segregate liquid assets with the Fund’s custodian to fund the redemption. In addition, MQT is required to redeem certain of its outstanding VMTP Shares if it fails to comply with certain asset coverage, basic maintenance amount or leverage requirements.
| 52 | ANNUAL REPORT | APRIL 30, 2017 |
| Notes to Financial Statements (concluded) | ||||
Subject to certain conditions, MQT’s VMTP Shares may be redeemed, in whole or in part, at any time at the option of MQT. The redemption price per VMTP Share is equal to the liquidation preference per share plus any outstanding unpaid dividends and applicable redemption premium. If MQT redeems the VMTP Shares prior to the term redemption date and the VMTP Shares have long-term ratings above A1/A+ or its equivalent by the ratings agencies then rating the VMTP Shares, then such redemption may be subject to a prescribed redemption premium (up to 3% of the liquidation preference) payable to the holder of the VMTP Shares based on the time remaining until the term redemption date, subject to certain exceptions for redemptions that are required to comply with minimum asset coverage requirements.
Dividends: Dividends on the VMTP Shares are declared daily and payable monthly at a variable rate set weekly at a fixed rate spread to the Securities Industry and Financial Markets Association (“SIFMA”) Municipal Swap Index. The fixed spread is determined based on the long-term preferred share rating assigned to the VMTP Shares by the ratings agencies then rating the VMTP Shares. At the date of issuance, the VMTP Shares were assigned long-term ratings of Aaa from Moody’s and AAA from Fitch. Subsequent to the issuance of the VMTP Shares, Moody’s completed a review of its methodology for rating securities issued by registered closed-end funds. As of period end, the VMTP Shares were assigned a long-term rating of Aa1 from Moody’s under its new rating methodology. The VMTP Shares continue to be assigned a long-term rating of AAA from Fitch. The dividend rate on the VMTP Shares is subject to a step-up spread if the Funds fail to comply with certain provisions, including, among other things, the timely payment of dividends, redemptions or gross-up payments, and complying with certain asset coverage and leverage requirements.
For the year ended April 30, 2017, the average annualized dividend rate for the VMTP Shares was 1.61%.
For the year ended April 30, 2017, VMTP Shares issued and outstanding of MQT remained constant.
Offering Costs: The Funds incurred costs in connection with the issuance of VRDP Shares, which were recorded as a direct deduction from the carrying value of the related debt liability and will be amortized over the life of the VRDP Shares with the exception of upfront fees paid to the liquidity provider which were amortized over the life of the liquidity agreement. Amortization of these costs is included in interest expense, fees and amortization of offering costs in the Statements of Operations.
Financial Reporting: The VRDP and VMTP Shares are considered debt of the issuer; therefore, the liquidation preference, which approximates fair value of the VRDP and VMTP Shares, is recorded as a liability in the Statements of Assets and Liabilities net of deferred offering costs. Unpaid dividends are included in interest expense and fees payable in the Statements of Assets and Liabilities, and the dividends accrued and paid on the VRDP and VMTP Shares are included as a component of interest expense, fees and amortization of offering costs in the Statements of Operations. The VRDP and VMTP Shares are treated as equity for tax purposes. Dividends paid to holders of the VRDP and VMTP Shares are generally classified as tax-exempt income for tax-reporting purposes.
11. Subsequent Events:
Management’s evaluation of the impact of all subsequent events on the Funds’ financial statements was completed through the date the financial statements were issued and the following items were noted:
| Common Dividend Per Share | Preferred Shares3 | |||||||||||||||||||||||
| Paid1 | Declared2 | Shares | Series | Declared | ||||||||||||||||||||
| MYD |
$ | 0.0720 | $ | 0.0720 | VRDP | W-7 | $ | 360,776 | ||||||||||||||||
| MQY |
$ | 0.0725 | $ | 0.0725 | VRDP | W-7 | $ | 256,433 | ||||||||||||||||
| MQT |
$ | 0.0620 | $ | 0.0620 | VMTP | W-7 | $ | 179,059 | ||||||||||||||||
| 1 | Net investment income dividend paid on June 1, 2017 to Common Shareholders of record on May 15, 2017. |
| 2 | Net investment income dividend declared on June 1, 2017 payable to Common Shareholders of record on June 15, 2017. |
| 3 | Dividends declared for period May 1, 2017 to May 31, 2017. |
| ANNUAL REPORT | APRIL 30, 2017 | 53 |
| Report of Independent Registered Public Accounting Firm | ||||
To the Board of Directors and Shareholders of BlackRock MuniYield Fund, Inc., BlackRock MuniYield Quality Fund, Inc., and BlackRock MuniYield Quality Fund II, Inc.:
We have audited the accompanying statements of assets and liabilities, including the schedules of investments, of BlackRock MuniYield Fund, Inc., BlackRock MuniYield Quality Fund, Inc., and BlackRock MuniYield Quality Fund II, Inc. (collectively, the “Funds”), as of April 30, 2017, and the related statements of operations and cash flows for the year then ended, the statements of changes in net assets for each of the two years in the period then ended, and the financial highlights for each of the five years in the period then ended. These financial statements and financial highlights are the responsibility of the Funds’ management. Our responsibility is to express an opinion on these financial statements and financial highlights based on our audits.
We conducted our audits in accordance with the standards of the Public Company Accounting Oversight Board (United States). Those standards require that we plan and perform the audit to obtain reasonable assurance about whether the financial statements and financial highlights are free of material misstatement. The Funds are not required to have, nor were we engaged to perform, an audit of their internal control over financial reporting. Our audits included consideration of internal control over financial reporting as a basis for designing audit procedures that are appropriate in the circumstances, but not for the purpose of expressing an opinion on the effectiveness of the Funds’ internal control over financial reporting. Accordingly, we express no such opinion. An audit also includes examining, on a test basis, evidence supporting the amounts and disclosures in the financial statements, assessing the accounting principles used and significant estimates made by management, as well as evaluating the overall financial statement presentation. Our procedures included confirmation of securities owned as of April 30, 2017, by correspondence with the custodian and brokers; when replies were not received from brokers, we performed other auditing procedures. We believe that our audits provide a reasonable basis for our opinion.
In our opinion, the financial statements and financial highlights referred to above present fairly, in all material respects, the financial position of BlackRock MuniYield Fund, Inc., BlackRock MuniYield Quality Fund, Inc., and BlackRock MuniYield Quality Fund II, Inc. as of April 30, 2017, the results of their operations and their cash flows for the year then ended, the changes in their net assets for each of the two years in the period then ended, and the financial highlights for each of the five years in the period then ended, in conformity with accounting principles generally accepted in the United States of America.
Deloitte & Touche LLP
Boston, Massachusetts
June 22, 2017
| 54 | ANNUAL REPORT | APRIL 30, 2017 |
| Automatic Dividend Reinvestment Plan |
Pursuant to each Fund’s Dividend Reinvestment Plan (the “Reinvestment Plan”), Common Shareholders are automatically enrolled to have all distributions of dividends and capital gains and other distributions reinvested by Computershare Trust Company, N.A. (the “Reinvestment Plan Agent”) in the respective Fund’s Common Shares pursuant to the Reinvestment Plan. Shareholders who do not participate in the Reinvestment Plan will receive all distributions in cash paid by check and mailed directly to the shareholders of record (or if the shares are held in street name or other nominee name, then to the nominee) by the Reinvestment Plan Agent, which serves as agent for the shareholders in administering the Reinvestment Plan.
After MYD, MQY and MQT declare a dividend or determine to make a capital gain or other distribution, the Reinvestment Plan Agent will acquire shares for the participants’ accounts, depending upon the following circumstances, either (i) through receipt of unissued but authorized shares from the Funds (“newly issued shares”) or (ii) by purchase of outstanding shares on the open market or on the Fund’s primary exchange (“open-market purchases”). If, on the dividend payment date, the net asset value per share (“NAV”) is equal to or less than the market price per share plus estimated brokerage commissions (such condition often referred to as a “market premium”), the Reinvestment Plan Agent will invest the dividend amount in newly issued shares acquired on behalf of the participants. The number of newly issued shares to be credited to each participant’s account will be determined by dividing the dollar amount of the dividend by the NAV on the date the shares are issued. However, if the NAV is less than 95% of the market price on the dividend payment date, the dollar amount of the dividend will be divided by 95% of the market price on the dividend payment date. If, on the dividend payment date, the NAV is greater than the market price per share plus estimated brokerage commissions (such condition often referred to as a “market discount”), the Reinvestment Plan Agent will invest the dividend amount in shares acquired on behalf of the participants in open-market purchases. If the Reinvestment Plan Agent is unable to invest the full dividend amount in open-market purchases, or if the market discount shifts to a market premium during the purchase period, the Reinvestment Plan Agent will invest any un-invested portion in newly issued shares. Investments in newly issued shares made in this manner would be made pursuant to the same process described above and the date of issue for such newly issued shares will substitute for the dividend payment date.
You may elect not to participate in the Reinvestment Plan and to receive all dividends in cash by contacting the Reinvestment Plan Agent, at the address set forth below.
Participation in the Reinvestment Plan is completely voluntary and may be terminated or resumed at any time without penalty by notice if received and processed by the Reinvestment Plan Agent prior to the dividend record date. Additionally, the Reinvestment Plan Agent seeks to process notices received after the record date but prior to the payable date and such notices often will become effective by the payable date. Where late notices are not processed by the applicable payable date, such termination or resumption will be effective with respect to any subsequently declared dividend or other distribution.
The Reinvestment Plan Agent’s fees for the handling of the reinvestment of distributions will be paid by each Fund. However, each participant will pay a pro rata share of brokerage commissions incurred with respect to the Reinvestment Plan Agent’s open market purchases in connection with the reinvestment of all distributions. The automatic reinvestment of all distributions will not relieve participants of any U.S. federal, state or local income tax that may be payable on such dividends or distributions.
Each Fund reserves the right to amend or terminate the Reinvestment Plan. There is no direct service charge to participants in the Reinvestment Plan; however, each Fund reserves the right to amend the Reinvestment Plan to include a service charge payable by the participants. Participants in MQY that request a sale of shares are subject to a $2.50 sales fee and a $0.15 per share fee. Per share fees include any applicable brokerage commissions the Reinvestment Plan Agent is required to pay. Participants in MYD and MQT that request a sale of shares are subject to a $0.02 per share sold brokerage commission. All correspondence concerning the Reinvestment Plan should be directed to Computershare Trust Company, N.A. through the internet at http://www.computershare.com/blackrock, or in writing to Computershare, P.O. Box 505000, Louisville, KY 40233, Telephone: (800) 699-1236. Overnight correspondence should be directed to the Reinvestment Plan Agent at Computershare, 462 South 4th Street, Suite 1600, Louisville, KY 40202.
| ANNUAL REPORT | APRIL 30, 2017 | 55 |
| Officers and Directors | ||||
| Name, Address1 and Year of Birth |
Position(s) Held with the Funds |
Length of Time Served³ |
Principal Occupation(s) During Past Five Years | Number of BlackRock- Advised Registered Investment Companies (“RICs”) Consisting of Investment Portfolios (“Portfolios”) Overseen4 |
Public Company and Other Investment Company Directorships Held During Past Five Years | |||||
| Independent Directors2 | ||||||||||
| Richard E. Cavanagh
1946 |
Chair of the Board and Director | Since 2007 |
Director, The Guardian Life Insurance Company of America since 1998; Director, Arch Chemical (chemical and allied products) from 1999 to 2011; Trustee, Educational Testing Service from 1997 to 2009 and Chairman thereof from 2005 to 2009; Senior Advisor, The Fremont Group since 2008 and Director thereof since 1996; Faculty Member/Adjunct Lecturer, Harvard University since 2007; President and Chief Executive Officer, The Conference Board, Inc. (global business research organization) from 1995 to 2007. | 75 RICs consisting of 75 Portfolios | None | |||||
| Karen P. Robards
1950 |
Vice Chair of the Board and Director | Since 2007 |
Principal of Robards & Company, LLC (consulting and private investing) since 1987; Co-founder and Director of the Cooke Center for Learning and Development (a not-for-profit organization) since 1987; Investment Banker at Morgan Stanley from 1976 to 1987. | 75 RICs consisting of 75 Portfolios | AtriCure, Inc. (medical devices); Greenhill & Co., Inc. | |||||
| Michael J. Castellano
1946 |
Director | Since 2011 |
Chief Financial Officer of Lazard Group LLC from 2001 to 2011; Chief Financial Officer of Lazard Ltd from 2004 to 2011; Director, Support Our Aging Religious (non-profit) from 2009 to June 2015 and since 2017; Director, National Advisory Board of Church Management at Villanova University since 2010; Trustee, Domestic Church Media Foundation since 2012; Director, CircleBlack Inc. (financial technology company) since 2015. | 75 RICs consisting of 75 Portfolios | None | |||||
| Cynthia L. Egan
1955 |
Director | Since 2016 |
Advisor, U.S. Department of the Treasury from 2014 to 2015; President, Retirement Plan Services for T. Rowe Price Group, Inc. from 2007 to 2012; executive positions within Fidelity Investments from 1989 to 2007. | 75 RICs consisting of 75 Portfolios | Unum (insurance); The Hanover Insurance Group (insurance); Envestnet (investment platform) from 2013 until 2016 | |||||
| Frank J. Fabozzi
1948 |
Director | Since 2007 |
Editor of and Consultant for The Journal of Portfolio Management since 2006; Professor of Finance, EDHEC Business School since 2011; Visiting Professor, Princeton University from 2013 to 2014 and since 2016; Professor in the Practice of Finance and Becton Fellow, Yale University School of Management from 2006 to 2011. | 75 RICs consisting of 75 Portfolios | None | |||||
| Jerrold B. Harris
1942 |
Director | Since 2007 |
Trustee, Ursinus College from 2000 to 2012; Director, Ducks Unlimited — Canada (conservation) since 2015; Director, Waterfowl Chesapeake (conservation) since 2014; Director, Ducks Unlimited, Inc. since 2013; Director, Troemner LLC (scientific equipment) from 2000 to 2016; Director of Delta Waterfowl Foundation from 2010 to 2012; President and Chief Executive Officer, VWR Scientific Products Corporation from 1990 to 1999. | 75 RICs consisting of 75 Portfolios | BlackRock Capital Investment Corp. (business development company) | |||||
| R. Glenn Hubbard
1958 |
Director | Since 2007 |
Dean, Columbia Business School since 2004; Faculty member, Columbia Business School since 1988. | 75 RICs consisting of 75 Portfolios | ADP (data and information services); Metropolitan Life Insurance Company (insurance) | |||||
| W. Carl Kester
1951 |
Director | Since 2007 |
George Fisher Baker Jr. Professor of Business Administration, Harvard Business School since 2008, Deputy Dean for Academic Affairs from 2006 to 2010, Chairman of the Finance Unit, from 2005 to 2006, Senior Associate Dean and Chairman of the MBA Program from 1999 to 2005; Member of the faculty of Harvard Business School since 1981. | 75 RICs consisting of 75 Portfolios | None | |||||
| Catherine A. Lynch
1961 |
Director | Since 2016 |
Chief Executive Officer, Chief Investment Officer and various other positions, National Railroad Retirement Investment Trust from 2003 to 2016; Associate Vice President for Treasury Management, The George Washington University from 1999 to 2003; Assistant Treasurer, Episcopal Church of America from 1995 to 1999. | 75 RICs consisting of 75 Portfolios | None | |||||
| 56 | ANNUAL REPORT | APRIL 30, 2017 |
| Officers and Directors (continued) |
| Name, Address1 and Year of Birth |
Position(s) Held with the Funds |
Length of Time Served³ |
Principal Occupation(s) During Past Five Years | Number of BlackRock- Advised Registered Investment Companies (“RICs”) Consisting of Investment Portfolios (“Portfolios”) Overseen4 |
Public Company and Other Investment Company Directorships Held During Past Five Years | |||||
| Interested Directors5 | ||||||||||
| Barbara G. Novick
1960 |
Director | Since 2014 |
Vice Chairman of BlackRock, Inc. since 2006; Chair of BlackRock’s Government Relations Steering Committee since 2009; Head of the Global Client Group of BlackRock, Inc. from 1988 to 2008. | 101 RICs consisting of 220 Portfolios | None | |||||
| John M. Perlowski
1964 |
Director, President and Chief Executive Officer | Since 2014 (Director); Since 2011 (President and Chief Executive Officer) |
Managing Director of BlackRock, Inc. since 2009; Head of BlackRock Global Fund & Accounting Services since 2009; Managing Director and Chief Operating Officer of the Global Product Group at Goldman Sachs Asset Management, L.P. from 2003 to 2009; Treasurer of Goldman Sachs Mutual Funds from 2003 to 2009 and Senior Vice President thereof from 2007 to 2009; Director of Goldman Sachs Offshore Funds from 2002 to 2009; Advisory Director of Family Resource Network (charitable foundation) since 2009. | 129 RICs consisting of 318 Portfolios | None | |||||
| 1 The address of each Director is c/o BlackRock, Inc., 55 East 52nd Street, New York, NY 10055. | ||||||||||
| 2 Each Independent Director will serve until his or her successor is elected and qualifies, or until his or her earlier death, resignation, retirement or removal, or until December 31 of the year in which he or she turns 75. The maximum age limitation may be waived as to any Director by action of a majority of the Directors upon finding of good cause therefor. | ||||||||||
| 3 Following the combination of Merrill Lynch Investment Managers, L.P. (“MLIM”) and BlackRock, Inc. (“BlackRock”) in September 2006, the various legacy MLIM and legacy BlackRock fund boards were realigned and consolidated into three new fund boards in 2007. As a result, although the chart shows certain Independent Directors as joining the Board in 2007, each Director first became a member of the boards of other legacy MLIM or legacy BlackRock funds as follows: Richard E. Cavanagh, 1994; Frank J. Fabozzi, 1988; Jerrold B. Harris, 1999; R. Glenn Hubbard, 2004; W. Carl Kester, 1995 and Karen P. Robards, 1998. | ||||||||||
| 4 For purposes of this chart, “RICs” refers to investment companies registered under the 1940 Act and “Portfolios” refers to the investment programs of the BlackRock-advised funds. The Closed-End Complex is comprised of 75 RICs. Mr. Perlowski and Ms. Novick are also board members of certain complexes of BlackRock registered open-end funds. Mr. Perlowski is also a board member of the BlackRock Equity-Bond Complex and the BlackRock Equity-Liquidity Complex, and Ms. Novick is also a board member of the BlackRock Equity-Liquidity Complex. | ||||||||||
| 5 Mr. Perlowski and Ms. Novick are both “interested persons,” as defined in the 1940 Act, of the Fund based on their positions with BlackRock and its affiliates. Mr. Perlowski and Ms. Novick are also board members of certain complexes of BlackRock registered open-end funds. Mr. Perlowski is also a board member of the BlackRock Equity-Bond Complex and the BlackRock Equity-Liquidity Complex, and Ms. Novick is also a board member of the BlackRock Equity-Liquidity Complex. Interested Directors serve until their resignation, removal or death, or until December 31 of the year in which they turn 72. The maximum age limitation may be waived as to any Director by action of a majority of the Directors upon a finding of good cause therefor. | ||||||||||
| ANNUAL REPORT | APRIL 30, 2017 | 57 |
| Officers and Directors (concluded) | ||||
| Name, Address1 and Year of Birth |
Position(s) Held with the Funds |
Length of Time Served as an Officer |
Principal Occupation(s) During Past Five Years | |||
| Officers Who Are Not Directors2 | ||||||
| Jonathan Diorio
1980 |
Vice President | Since 2015 |
Managing Director of BlackRock, Inc. since 2015; Director of BlackRock, Inc. from 2011 to 2015; Director of Deutsche Asset & Wealth Management from 2009 to 2011. | |||
| Neal J. Andrews
1966 |
Chief Financial Officer | Since 2007 |
Managing Director of BlackRock, Inc. since 2006; Senior Vice President and Line of Business Head of Fund Accounting and Administration at PNC Global Investment Servicing (U.S.) Inc. from 1992 to 2006. | |||
| Jay M. Fife
1970 |
Treasurer | Since 2007 |
Managing Director of BlackRock, Inc. since 2007; Director of BlackRock, Inc. in 2006; Assistant Treasurer of the MLIM and Fund Asset Management, L.P. advised funds from 2005 to 2006; Director of MLIM Fund Services Group from 2001 to 2006. | |||
| Charles Park
1967 |
Chief Compliance Officer | Since 2014 |
Anti-Money Laundering Compliance Officer for the BlackRock-advised Funds in the Equity-Bond Complex, the Equity-Liquidity Complex and the Closed-End Complex from 2014 to 2015; Chief Compliance Officer of BlackRock Advisors, LLC and the BlackRock-advised Funds in the Equity-Bond Complex, the Equity-Liquidity Complex and the Closed-End Complex since 2014; Principal of and Chief Compliance Officer for iShares® Delaware Trust Sponsor LLC since 2012 and BlackRock Fund Advisors (“BFA”) since 2006; Chief Compliance Officer for the BFA-advised iShares® exchange traded funds since 2006; Chief Compliance Officer for BlackRock Asset Management International Inc. since 2012. | |||
| Janey Ahn
1975 |
Secretary | Since 2012 |
Director of BlackRock, Inc. since 2009; Assistant Secretary of the funds in the Closed-End Complex from 2008 to 2012. | |||
| 1 The address of each Officer is c/o BlackRock, Inc., 55 East 52nd Street, New York, NY 10055. | ||||||
|
2 Officers of the Fund serve at the pleasure of the Board. | ||||||
As of the date of this report:
| • | The portfolio managers of MQT and MQY are Michael Kalinoski and Christian Romaglino. |
|
Investment Adviser BlackRock Advisors, LLC Wilmington, DE 19809 |
Transfer Agent Computershare Trust Company, N.A. Canton, MA 02021 |
VRDP Remarketing Agents Merrill Lynch, Pierce, Fenner & Smith Incorporated1 New York, NY 10036
Barclays Capital Inc.2 New York, NY 10019 |
Accounting Agent and Custodian State Street Bank and Trust Company Boston, MA 02111 |
Address of the Funds 100 Bellevue Parkway Wilmington, DE 19809 | ||||
| VRDP Tender and Paying Agent and VMTP Redemption and Paying Agent The Bank of New York Mellon New York, NY 10289 |
VRDP Liquidity Providers Bank of America, N.A.1 New York, NY 10036
Barclays Bank PLC2 New York, NY 10019 |
Independent Registered Public Accounting Firm Deloitte & Touche LLP Boston, MA 02116 |
Legal Counsel Skadden, Arps, Slate, Meagher & Flom LLP Boston, MA 02116 |
|||||
| 1 | For MYD. |
| 2 | For MQY. |
| 58 | ANNUAL REPORT | APRIL 30, 2017 |
| Additional Information |
| Fund Certification |
Certain Funds are listed for trading on the NYSE and have filed with the NYSE their annual chief executive officer certification regarding compliance with the NYSE’s listing standards. The Funds filed with the SEC the certification of its chief executive officer and chief financial officer required by section 302 of the Sarbanes-Oxley Act.
| Dividend Policy |
Each Fund’s dividend policy is to distribute all or a portion of its net investment income to its shareholders on a monthly basis. In order to provide shareholders with a more stable level of distributions, the Funds may at times pay out less than the entire amount of net investment income earned in any particular month and may at times in any particular month pay out such accumulated but undistributed income in addition to net investment income earned in that month. As a result, the distributions paid by the Funds for any particular month may be more or less than the amount of net investment income earned by the Funds during such month. The Funds’ current accumulated but undistributed net investment income, if any, is disclosed in the Statements of Assets and Liabilities, which comprises part of the financial information included in this report.
| General Information |
The Funds do not make available copies of their Statements of Additional Information because the Funds’ shares are not continuously offered, which means that the Statement of Additional Information of each Fund has not been updated after completion of the respective Fund’s offerings and the information contained in each Fund’s Statement of Additional Information may have become outdated.
During the period, there were no material changes in the Funds’ investment objectives or policies or to the Funds’ charters or by-laws that would delay or prevent a change of control of the Funds that were not approved by the shareholders or in the principal risk factors associated with investment in the Funds. Other than as noted on page 58, there have been no changes in the persons who are primarily responsible for the day-to-day management of the Funds’ portfolio.
Effective September 26, 2016, BlackRock implemented a new methodology for calculating “effective duration” for BlackRock’s municipal bond portfolios. The new methodology replaces the model previously used by BlackRock to evaluate municipal bond duration and is a common indicator of an investment’s sensitivity to interest rate movements. The new methodology will be applied to each Fund’s duration reported for periods after September 26, 2016.
Quarterly performance, semi-annual and annual reports, current net asset value and other information regarding the Funds may be found on BlackRock’s website, which can be accessed at http://www.blackrock.com. Any reference to BlackRock’s website in this report is intended to allow investors public access to information regarding the Funds and does not, and is not intended to, incorporate BlackRock’s website in this report.
Electronic Delivery
Shareholders can sign up for e-mail notifications of quarterly statements, annual and semi-annual shareholder reports by enrolling in the electronic delivery program. Electronic copies of shareholder reports are available on BlackRock’s website.
To enroll in electronic delivery:
Shareholders Who Hold Accounts with Investment Advisers, Banks or Brokerages:
Please contact your financial advisor. Please note that not all investment advisers, banks or brokerages may offer this service.
| ANNUAL REPORT | APRIL 30, 2017 | 59 |
| Additional Information (concluded) | ||||
| General Information (concluded) |
Householding
The Funds will mail only one copy of shareholder documents, annual and semi-annual reports and proxy statements, to shareholders with multiple accounts at the same address. This practice is commonly called “householding” and is intended to reduce expenses and eliminate duplicate mailings of shareholder documents. Mailings of your shareholder documents may be householded indefinitely unless you instruct us otherwise. If you do not want the mailing of these documents to be combined with those for other members of your household, please call the Funds at (800) 882-0052.
Availability of Quarterly Schedule of Investments
The Funds file their complete schedule of portfolio holdings with the SEC for the first and third quarters of each fiscal year on Form N-Q. The Funds’ Forms N-Q are available on the SEC’s website at http://www.sec.gov and may also be reviewed and copied at the SEC’s Public Reference Room in Washington, D.C. Information on the operation of the Public Reference Room or how to access documents on the SEC’s website without charge may be obtained by calling (800) SEC-0330. The Funds’ Forms N-Q may also be obtained upon request and without charge by calling (800) 882-0052.
Availability of Proxy Voting Policies and Procedures
A description of the policies and procedures that the Funds use to determine how to vote proxies relating to portfolio securities is available upon request and without charge (1) by calling (800) 882-0052; (2) at http://www.blackrock.com; and (3) on the SEC’s website at http://www.sec.gov.
Availability of Proxy Voting Record
Information about how the Funds voted proxies relating to securities held in the Funds’ portfolios during the most recent 12-month period ended June 30 is available upon request and without charge (1) at http://www.blackrock.com; or by calling (800) 882-0052; and (2) on the SEC’s website at http://www.sec.gov.
Availability of Fund Updates
BlackRock will update performance and certain other data for the Funds on a monthly basis on its website in the “Closed-end Funds” section of http://www.blackrock.com as well as certain other material information as necessary from time to time. Investors and others are advised to check the website for updated performance information and the release of other material information about the Funds. This reference to BlackRock’s website is intended to allow investors public access to information regarding the Funds and does not, and is not intended to, incorporate BlackRock’s website in this report.
| BlackRock Privacy Principles |
BlackRock is committed to maintaining the privacy of its current and former fund investors and individual clients (collectively, “Clients”) and to safeguarding their non-public personal information. The following information is provided to help you understand what personal information BlackRock collects, how we protect that information and why in certain cases we share such information with select parties.
If you are located in a jurisdiction where specific laws, rules or regulations require BlackRock to provide you with additional or different privacy-related rights beyond what is set forth below, then BlackRock will comply with those specific laws, rules or regulations.
BlackRock obtains or verifies personal non-public information from and about you from different sources, including the following: (i) information we receive from you or, if applicable, your financial intermediary, on applications, forms or other documents; (ii) information about your transactions with us, our affiliates, or others; (iii) information we receive from a consumer reporting agency; and (iv) from visits to our websites.
BlackRock does not sell or disclose to non-affiliated third parties any non public personal information about its Clients, except as permitted by law or as is necessary to respond to regulatory requests or to service Client accounts. These non-affiliated third parties are required to protect the confidentiality and security of this information and to use it only for its intended purpose.
We may share information with our affiliates to service your account or to provide you with information about other BlackRock products or services that may be of interest to you. In addition, BlackRock restricts access to non-public personal information about its Clients to those BlackRock employees with a legitimate business need for the information. BlackRock maintains physical, electronic and procedural safeguards that are designed to protect the non-public personal information of its Clients, including procedures relating to the proper storage and disposal of such information.
| 60 | ANNUAL REPORT | APRIL 30, 2017 |
This report is intended for current holders. It is not a prospectus. Past performance results shown in this report should not be considered a representation of future performance. The Funds have leveraged their Common Shares, which creates risks for Common Shareholders, including the likelihood of greater volatility of net asset value and market price of the Common Shares, and the risk that fluctuations in short-term interest rates may reduce the Common Shares’ yield. Statements and other information herein are as dated and are subject to change.

| MYQII-4/17-AR |

|
| Item 2 – | Code of Ethics – The registrant (or the “Fund”) has adopted a code of ethics, as of the end of the period covered by this report, applicable to the registrant’s principal executive officer, principal financial officer, principal accounting officer or controller, or persons performing similar functions. During the period covered by this report, the code of ethics was amended to update certain information and to make other non-material changes. During the period covered by this report, there have been no waivers granted under the code of ethics. The registrant undertakes to provide a copy of the code of ethics to any person upon request, without charge, by calling 1-800-882-0052, option 4. |
| Item 3 – | Audit Committee Financial Expert – The registrant’s board of directors (the “board of directors”), has determined that (i) the registrant has the following audit committee financial experts serving on its audit committee and (ii) each audit committee financial expert is independent: |
Michael Castellano
Frank J. Fabozzi
W. Carl Kester
Catherine A. Lynch
Karen P. Robards
The registrant’s board of directors has determined that W. Carl Kester and Karen P. Robards qualify as financial experts pursuant to Item 3(c)(4) of Form N-CSR.
Prof. Kester has a thorough understanding of generally accepted accounting principles, financial statements and internal control over financial reporting as well as audit committee functions. Prof. Kester has been involved in providing valuation and other financial consulting services to corporate clients since 1978. Prof. Kester’s financial consulting services present a breadth and level of complexity of accounting issues that are generally comparable to the breadth and complexity of issues that can reasonably be expected to be raised by the registrant’s financial statements.
Ms. Robards has a thorough understanding of generally accepted accounting principles, financial statements and internal control over financial reporting as well as audit committee functions. Ms. Robards has been a principal of Robards & Company, a financial advisory firm, since 1987. Ms. Robards was formerly an investment banker for more than 10 years where she was responsible for evaluating and assessing the performance of companies based on their financial results. Ms. Robards has over 30 years of experience analyzing financial statements. She also is a member of the audit committee of one publicly held company and a non-profit organization.
Under applicable securities laws, a person determined to be an audit committee financial expert will not be deemed an “expert” for any purpose, including without limitation for the purposes of Section 11 of the Securities Act of 1933, as a result of being designated or identified as an audit committee financial expert. The designation or identification as an audit committee financial expert does not impose on such person any duties, obligations, or liabilities greater than the duties, obligations, and liabilities imposed on such person as a member of the audit committee and board of directors in the absence of such designation or identification. The designation or identification of a person as an audit committee financial expert does not affect the duties, obligations, or liability of any other member of the audit committee or board of directors.
2
| Item 4 – | Principal Accountant Fees and Services |
The following table presents fees billed by Deloitte & Touche LLP (“D&T”) in each of the last two fiscal years for the services rendered to the Fund:
| (a) Audit Fees | (b) Audit-Related Fees1 | (c) Tax Fees2 | (d) All Other Fees | |||||||||||||
| Entity Name | Current Fiscal Year End |
Previous Fiscal Year End |
Current Fiscal Year End |
Previous Fiscal Year End |
Current Fiscal Year End |
Previous Fiscal Year End |
Current Fiscal Year End |
Previous Fiscal Year End | ||||||||
| BlackRock MuniYield Quality Fund, Inc. | $40,150 | $40,150 | $0 | $0 | $17,442 | $17,442 | $0 | $0 | ||||||||
The following table presents fees billed by D&T that were required to be approved by the registrant’s audit committee (the “Committee”) for services that relate directly to the operations or financial reporting of the Fund and that are rendered on behalf of BlackRock Advisors, LLC (“Investment Adviser” or “BlackRock”) and entities controlling, controlled by, or under common control with BlackRock (not including any sub-adviser whose role is primarily portfolio management and is subcontracted with or overseen by another investment adviser) that provide ongoing services to the Fund (“Affiliated Service Providers”):
| Current Fiscal Year End | Previous Fiscal Year End | |||
|
(b) Audit-Related Fees1 |
$0 | $0 | ||
|
(c) Tax Fees2 |
$0 | $0 | ||
|
(d) All Other Fees3 |
$2,129,000 | $2,154,000 |
1 The nature of the services includes assurance and related services reasonably related to the performance of the audit or review of financial statements not included in Audit Fees, including accounting consultations, agreed-upon procedure reports, attestation reports, comfort letters, out-of-pocket expenses and internal control reviews not required by regulators.
2 The nature of the services includes tax compliance and/or tax preparation, including services relating to the filing or amendment of federal, state or local income tax returns, regulated investment company qualification reviews, taxable income and tax distribution calculations.
3 Non-audit fees of $2,129,000 and $2,154,000 for the current fiscal year and previous fiscal year, respectively, were paid to the Fund’s principal accountant in their entirety by BlackRock, in connection with services provided to the Affiliated Service Providers of the Fund and of certain other funds sponsored and advised by BlackRock or its affiliates for a service organization review and an accounting research tool subscription. These amounts represent aggregate fees paid by BlackRock and were not allocated on a per fund basis.
(e)(1) Audit Committee Pre-Approval Policies and Procedures:
The Committee has adopted policies and procedures with regard to the pre-approval of services. Audit, audit-related and tax compliance services provided to the registrant on an annual basis require specific pre-approval by the Committee. The Committee also must approve other non-audit services provided to the registrant and those non-audit services provided to the Investment Adviser and Affiliated Service Providers that relate directly to the operations and the financial reporting of the registrant. Certain of these non-audit services that the Committee believes are (a) consistent with the SEC’s auditor independence rules and (b) routine and recurring services that will not impair the independence of the independent accountants may be approved by the Committee without consideration on a specific case-by-case basis (“general pre-approval”). The term of any general pre-approval is 12 months from the date of the pre-approval, unless the Committee provides for a different period. Tax or other non-audit services provided to the registrant which have a direct impact on the operations or financial reporting of the registrant will only be deemed pre-approved provided that any individual project does not exceed $10,000 attributable to the registrant or $50,000 per project. For this purpose, multiple projects will be aggregated to determine if they exceed the previously mentioned cost levels.
3
Any proposed services exceeding the pre-approved cost levels will require specific pre-approval by the Committee, as will any other services not subject to general pre-approval (e.g., unanticipated but permissible services). The Committee is informed of each service approved subject to general pre-approval at the next regularly scheduled in-person board meeting. At this meeting, an analysis of such services is presented to the Committee for ratification. The Committee may delegate to the Committee Chairman the authority to approve the provision of and fees for any specific engagement of permitted non-audit services, including services exceeding pre-approved cost levels.
(e)(2) None of the services described in each of Items 4(b) through (d) were approved by the Committee pursuant to the de minimis exception in paragraph (c)(7)(i)(C) of Rule 2-01 of Regulation S-X.
(f) Not Applicable
(g) The aggregate non-audit fees, defined as the sum of the fees shown under “Audit-Related Fees,” “Tax Fees” and “All Other Fees,” paid to the accountant for services rendered by the accountant to the registrant, the Investment Adviser and the Affiliated Service Providers were:
| Entity Name | Current Fiscal Year End |
Previous Fiscal Year End | ||||
| BlackRock MuniYield Quality Fund, Inc. | $17,442 | $17,442 |
Additionally, the amounts billed by D&T in connection with services provided to the Affiliated Service Providers of the Fund and of other funds sponsored or advised by BlackRock or its affiliates during the current and previous fiscal years for a service organization review and an accounting research tool subscription were:
| Current Fiscal Year End |
Previous Fiscal Year End | |||
| $2,129,000 | $2,154,000 |
These amounts represent aggregate fees paid by BlackRock and were not allocated on a per fund basis.
(h) The Committee has considered and determined that the provision of non-audit services that were rendered to the Investment Adviser, and the Affiliated Service Providers that were not pre-approved pursuant to paragraph (c)(7)(ii) of Rule 2-01 of Regulation S-X is compatible with maintaining the principal accountant’s independence.
| Item 5 – | Audit Committee of Listed Registrants |
| (a) | The following individuals are members of the registrant’s separately-designated standing audit committee established in accordance with Section 3(a)(58)(A) of the Securities Exchange Act of 1934 (15 U.S.C. 78c(a)(58)(A)): |
4
Michael Castellano
Frank J. Fabozzi
W. Carl Kester
Catherine A. Lynch
Karen P. Robards
| (b) | Not Applicable |
| Item 6 – | Investments |
(a) The registrant’s Schedule of Investments is included as part of the Report to Stockholders filed under Item 1 of this Form.
(b) Not Applicable due to no such divestments during the semi-annual period covered since the previous Form N-CSR filing.
| Item 7 – | Disclosure of Proxy Voting Policies and Procedures for Closed-End Management Investment Companies – The board of directors has delegated the voting of proxies for the Fund’s portfolio securities to the Investment Adviser pursuant to the Investment Adviser’s proxy voting guidelines. Under these guidelines, the Investment Adviser will vote proxies related to Fund securities in the best interests of the Fund and its stockholders. From time to time, a vote may present a conflict between the interests of the Fund’s stockholders, on the one hand, and those of the Investment Adviser, or any affiliated person of the Fund or the Investment Adviser, on the other. In such event, provided that the Investment Adviser’s Equity Investment Policy Oversight Committee, or a sub-committee thereof (the “Oversight Committee”) is aware of the real or potential conflict or material non-routine matter and if the Oversight Committee does not reasonably believe it is able to follow its general voting guidelines (or if the particular proxy matter is not addressed in the guidelines) and vote impartially, the Oversight Committee may retain an independent fiduciary to advise the Oversight Committee on how to vote or to cast votes on behalf of the Investment Adviser’s clients. If the Investment Adviser determines not to retain an independent fiduciary, or does not desire to follow the advice of such independent fiduciary, the Oversight Committee shall determine how to vote the proxy after consulting with the Investment Adviser’s Portfolio Management Group and/or the Investment Adviser’s Legal and Compliance Department and concluding that the vote cast is in its client’s best interest notwithstanding the conflict. A copy of the Fund’s Proxy Voting Policy and Procedures are attached as Exhibit 99.PROXYPOL. Information on how the Fund voted proxies relating to portfolio securities during the most recent 12-month period ended June 30 is available without charge, (i) at www.blackrock.com and (ii) on the SEC’s website at http://www.sec.gov. |
| Item 8 – | Portfolio Managers of Closed-End Management Investment Companies |
(a)(1) As of the date of filing this Report:
The registrant is managed by a team of investment professionals comprised of Michael Kalinoski, Director at BlackRock, and Christian Romaglino, Director at BlackRock. Each is a member of BlackRock’s municipal tax-exempt management group. Each is jointly responsible for the day-to-day management of the registrant’s portfolio, which includes setting the registrant’s overall investment strategy, overseeing the management of the
5
registrant and the selection of its investments. Messrs. Kalinoski and Romaglino have been members of the registrant’s portfolio management team since 2000 and 2017, respectively.
| Portfolio Manager | Biography | |
| Michael Kalinoski | Director of BlackRock since 2006; Director of Merrill Lynch Investment Managers, L.P. (“MLIM”) from 1999 to 2006. | |
| Christian Romaglino | Director of BlackRock since 2017; Portfolio Manager for the Municipal Mutual Fund Desk within BlackRock’s Global Fixed Income Group since 2017; Portfolio Manager at Brown Brothers Harriman from 2007 to 2017. |
| (a)(2) | As of April 30, 2017: |
|
(ii) Number of Other Accounts Managed and Assets by Account Type |
(iii) Number of Other Accounts and Assets for Which Advisory Fee is Performance-Based | |||||||||||
| (i) Name of Portfolio Manager |
Other Registered Investment Companies |
Other Pooled Investment Vehicles |
Other Accounts |
Other Registered Investment Companies |
Other Pooled Investment Vehicles |
Other Accounts | ||||||
| Michael Kalinoski |
12 | 0 | 0 | 0 | 0 | 0 | ||||||
| $19.54 Billion | $0 | $0 | $0 | $0 | $0 | |||||||
| Christian Romaglino1 |
1 | 13 | 8 | 0 | 0 | 0 | ||||||
| $360.1 Million | $12.91 Billion | $1.47 Billion | $0 | $0 | $0 | |||||||
1 Mr. Romaglino became a portfolio manager of the Fund on June 19, 2017.
| (iv) | Potential Material Conflicts of Interest |
BlackRock has built a professional working environment, firm-wide compliance culture and compliance procedures and systems designed to protect against potential incentives that may favor one account over another. BlackRock has adopted policies and procedures that address the allocation of investment opportunities, execution of portfolio transactions, personal trading by employees and other potential conflicts of interest that are designed to ensure that all client accounts are treated equitably over time. Nevertheless, BlackRock furnishes investment management and advisory services to numerous clients in addition to the Fund, and BlackRock may, consistent with applicable law, make investment recommendations to other clients or accounts (including accounts which are hedge funds or have performance or higher fees paid to BlackRock, or in which portfolio managers have a personal interest in the receipt of such fees), which may be the same as or different from those made to the Fund. In addition, BlackRock, Inc., its affiliates and significant shareholders and any officer, director, shareholder or employee may or may not have an interest in the securities whose purchase and sale BlackRock recommends to the Fund. BlackRock, Inc. or any of its affiliates or significant shareholders, or any officer, director, shareholder, employee or any member of their families may take different actions than those recommended to the Fund by BlackRock with respect to the same securities. Moreover, BlackRock may refrain from rendering any advice or services concerning securities of companies of which any of BlackRock, Inc.’s (or its affiliates’ or significant shareholders’) officers, directors or employees are directors or officers, or companies as
6
to which BlackRock, Inc. or any of its affiliates or significant shareholders or the officers, directors and employees of any of them has any substantial economic interest or possesses material non-public information. Certain portfolio managers also may manage accounts whose investment strategies may at times be opposed to the strategy utilized for a fund. It should also be noted that a portfolio manager may be managing certain hedge fund and/or long only accounts, or may be part of a team managing certain hedge fund and/or long only accounts, subject to incentive fees. Such portfolio managers may therefore be entitled to receive a portion of any incentive fees earned on such accounts. Currently, the portfolio managers of this fund are not entitled to receive a portion of incentive fees of other accounts.
As a fiduciary, BlackRock owes a duty of loyalty to its clients and must treat each client fairly. When BlackRock purchases or sells securities for more than one account, the trades must be allocated in a manner consistent with its fiduciary duties. BlackRock attempts to allocate investments in a fair and equitable manner among client accounts, with no account receiving preferential treatment. To this end, BlackRock, Inc. has adopted policies that are intended to ensure reasonable efficiency in client transactions and provide BlackRock with sufficient flexibility to allocate investments in a manner that is consistent with the particular investment discipline and client base, as appropriate.
(a)(3) As of April 30, 2017:
Portfolio Manager Compensation Overview
The discussion below describes the portfolio managers’ compensation as of April 30, 2017.
BlackRock’s financial arrangements with its portfolio managers, its competitive compensation and its career path emphasis at all levels reflect the value senior management places on key resources. Compensation may include a variety of components and may vary from year to year based on a number of factors. The principal components of compensation include a base salary, a performance-based discretionary bonus, participation in various benefits programs and one or more of the incentive compensation programs established by BlackRock.
Base compensation. Generally, portfolio managers receive base compensation based on their position with the firm.
Discretionary Incentive Compensation
Discretionary incentive compensation is a function of several components: the performance of BlackRock, Inc., the performance of the portfolio manager’s group within BlackRock, the investment performance, including risk-adjusted returns, of the firm’s assets under management or supervision by that portfolio manager relative to predetermined benchmarks, and the individual’s performance and contribution to the overall performance of these portfolios and BlackRock. In most cases, these benchmarks are the same as the benchmark or benchmarks against which the performance of the Fund or other accounts managed by the portfolio managers are measured. Among other things, BlackRock’s Chief Investment Officers make a subjective determination with respect to each portfolio manager’s compensation based on the performance of the Fund and other accounts managed by each portfolio manager relative to the various benchmarks. Performance of
7
fixed income funds is measured on a pre-tax and/or after-tax basis over various time periods including 1-, 3- and 5- year periods, as applicable. With respect to these portfolio managers, such benchmarks for the Fund and other accounts are: a combination of market-based indices (e.g., Standard & Poor’s Municipal Bond Index), certain customized indices and certain fund industry peer groups.
Distribution of Discretionary Incentive Compensation.
Discretionary incentive compensation is distributed to portfolio managers in a combination of cash, deferred BlackRock, Inc. stock awards, and/or deferred cash awards that notionally track the return of certain BlackRock investment products.
Typically, the cash portion of the discretionary incentive compensation, when combined with base salary, represents more than 60% of total compensation for the portfolio managers.
Portfolio managers generally receive deferred BlackRock, Inc. stock awards as part of their discretionary incentive compensation. Paying a portion of discretionary incentive compensation in the form of deferred BlackRock, Inc. stock puts compensation earned by a portfolio manager for a given year “at risk” based on BlackRock’s ability to sustain and improve its performance over future periods. Deferred BlackRock, Inc. stock awards are generally granted in the form of BlackRock, Inc. restricted stock units that vest ratably over a number of years and, once vested, settle in BlackRock, Inc. common stock. In some cases, additional deferred BlackRock, Inc. stock may be granted to certain key employees as part of a long-term incentive award to aid in retention, align their interests with long-term shareholder interests and motivate performance. Such equity awards are generally granted in the form of BlackRock, Inc. restricted stock units that vest pursuant to the terms of the applicable plan and, once vested, settle in BlackRock, Inc. common stock. The portfolio managers of this Fund have deferred BlackRock, Inc. stock awards.
For some portfolio managers, discretionary incentive compensation is also distributed in the form of deferred cash awards that notionally track the returns of select BlackRock investment products they manage. Providing a portion of discretionary incentive compensation in deferred cash awards that notionally track the BlackRock investment products they manage provides direct alignment with investment product results. Deferred cash awards vest ratably over a number of years and, once vested, settle in the form of cash. Any portfolio manager who is either a managing director or director at BlackRock with compensation above a specified threshold is eligible to participate in the deferred compensation program.
Other Compensation Benefits. In addition to base salary and discretionary incentive compensation, portfolio managers may be eligible to receive or participate in one or more of the following:
Incentive Savings Plans — BlackRock, Inc. has created a variety of incentive savings plans in which BlackRock, Inc. employees are eligible to participate, including a 401(k) plan, the BlackRock Retirement Savings Plan (RSP), and the BlackRock Employee Stock Purchase Plan (ESPP). The employer contribution components of the RSP include a company match equal to 50% of the first 8% of eligible pay contributed to the plan capped at $5,000 per year, and a company retirement contribution equal to 3-5% of eligible compensation up to the Internal Revenue Service
8
limit ($270,000 for 2017). The RSP offers a range of investment options, including registered investment companies and collective investment funds managed by the firm. BlackRock, Inc. contributions follow the investment direction set by participants for their own contributions or, absent participant investment direction, are invested into a target date fund that corresponds to, or is closest to, the year in which the participant attains age 65. The ESPP allows for investment in BlackRock, Inc. common stock at a 5% discount on the fair market value of the stock on the purchase date. Annual participation in the ESPP is limited to the purchase of 1,000 shares of common stock or a dollar value of $25,000 based on its fair market value on the purchase date. All of the eligible portfolio managers are eligible to participate in these plans.
(a)(4) Beneficial Ownership of Securities – As of April 30, 2017:
| Portfolio Manager |
Dollar Range of Equity Securities of the Fund Beneficially Owned | |
|
Michael Kalinoski |
None | |
|
Christian Romaglino1 |
None |
| 1 Mr. Romaglino became a portfolio manager of the Fund on June 19, 2017. |
(b) Not Applicable
| Item 9 – | Purchases of Equity Securities by Closed-End Management Investment Company and Affiliated Purchasers – Not Applicable due to no such purchases during the period covered by this report. |
| Item 10 – Submission | of Matters to a Vote of Security Holders – There have been no material changes to these procedures. |
| Item 11 – | Controls and Procedures |
(a) – The registrant’s principal executive and principal financial officers, or persons performing similar functions, have concluded that the registrant’s disclosure controls and procedures (as defined in Rule 30a-3(c) under the Investment Company Act of 1940, as amended (the “1940 Act”)) are effective as of a date within 90 days of the filing of this report based on the evaluation of these controls and procedures required by Rule 30a-3(b) under the 1940 Act and Rule 13a-15(b) under the Securities Exchange Act of 1934, as amended.
(b) – There were no changes in the registrant’s internal control over financial reporting (as defined in Rule 30a-3(d) under the 1940 Act) that occurred during the second fiscal quarter of the period covered by this report that have materially affected, or are reasonably likely to materially affect, the registrant’s internal control over financial reporting.
| Item 12 – Exhibits | attached hereto |
(a)(1) – Code of Ethics – See Item 2
(a)(2) – Certifications – Attached hereto
(a)(3) – Not Applicable
(b) – Certifications – Attached hereto
9
Pursuant to the requirements of the Securities Exchange Act of 1934 and the Investment Company Act of 1940, the registrant has duly caused this report to be signed on its behalf by the undersigned, thereunto duly authorized.
| BlackRock MuniYield Quality Fund, Inc. | ||||||
| By: | /s/ John M. Perlowski | |||||
| John M. Perlowski | ||||||
| Chief Executive Officer (principal executive officer) of | ||||||
| BlackRock MuniYield Quality Fund, Inc. | ||||||
| Date: July 5, 2017 | ||||||
| Pursuant to the requirements of the Securities Exchange Act of 1934 and the Investment Company Act of 1940, this report has been signed below by the following persons on behalf of the registrant and in the capacities and on the dates indicated. | ||||||
| By: | /s/ John M. Perlowski | |||||
| John M. Perlowski | ||||||
| Chief Executive Officer (principal executive officer) of | ||||||
| BlackRock MuniYield Quality Fund, Inc. | ||||||
| Date: July 5, 2017 | ||||||
| By: | /s/ Neal J. Andrews | |||||
| Neal J. Andrews | ||||||
| Chief Financial Officer (principal financial officer) of | ||||||
| BlackRock MuniYield Quality Fund, Inc. | ||||||
| Date: July 5, 2017 | ||||||
10