|
Summary of Operations and Financial Condition
|
||||||||||||||||||||
|
(In thousands of dollars, except per share data and ratios)
|
||||||||||||||||||||
|
Years ended March 31,
|
2014
|
2013(a)
|
2012
|
2011(b)
|
2010
|
|||||||||||||||
|
Net sales
|
$ | 1,340,208 | $ | 1,276,297 | $ | 1,257,805 | $ | 1,189,585 | $ | 1,273,004 | ||||||||||
|
Operating income before interest (c)
|
$ | 23,604 | $ | 70,934 | $ | 25,623 | $ | 32,294 | $ | 84,998 | ||||||||||
|
Interest expense, net
|
6,262 | 7,486 | 8,102 | 8,827 | 9,638 | |||||||||||||||
|
Net earnings (c)
|
13,779 | 41,413 | 11,256 | 17,671 | 48,411 | |||||||||||||||
|
Basic earnings per common share (c)
|
$ | 1.24 | $ | 3.59 | $ | 0.93 | $ | 1.45 | $ | 3.98 | ||||||||||
|
Diluted earnings per common share (c)
|
1.23 | 3.57 | 0.92 | 1.45 | 3.96 | |||||||||||||||
|
Working capital
|
$ | 452,771 | $ | 446,899 | $ | 425,082 | $ | 294,712 | $ | 404,610 | ||||||||||
|
Inventories
|
451,250 | 479,730 | 432,433 | 455,236 | 446,464 | |||||||||||||||
|
Goodwill
|
- | - | - | - | - | |||||||||||||||
|
Net property, plant, and equipment
|
183,917 | 188,407 | 192,825 | 188,012 | 178,113 | |||||||||||||||
|
Total assets
|
768,853 | 798,456 | 738,036 | 744,708 | 719,333 | |||||||||||||||
|
Long-term debt and capital lease
|
||||||||||||||||||||
|
obligations, less current portion
|
216,239 | 230,016 | 226,873 | 90,060 | 207,924 | |||||||||||||||
|
Stockholders’ equity
|
393,632 | 367,166 | 354,673 | 353,832 | 335,010 | |||||||||||||||
|
Additions to property, plant, and equipment
|
$ | 19,448 | $ | 16,371 | $ | 27,425 | $ | 19,473 | $ | 20,783 | ||||||||||
|
Net earnings/average equity
|
3.6 | % | 11.5 | % | 3.2 | % | 5.1 | % | 15.7 | % | ||||||||||
|
Earnings before taxes/sales
|
1.3 | % | 5.0 | % | 1.4 | % | 2.0 | % | 5.9 | % | ||||||||||
|
Net earnings/sales
|
1.0 | % | 3.2 | % | 0.9 | % | 1.5 | % | 3.8 | % | ||||||||||
|
Long-term debt/equity (d)
|
54.9 | % | 62.6 | % | 64.0 | % | 25.5 | % | 62.1 | % | ||||||||||
|
Total debt/equity ratio
|
1.0:1
|
1.2:1
|
1.1:1
|
1.1:1
|
1.2:1
|
|||||||||||||||
|
Current ratio
|
4.5:1
|
3.8:1
|
4.6:1
|
2.1:1
|
4.0:1
|
|||||||||||||||
|
Total stockholders’ equity per equivalent common share (e)
|
$ | 35.25 | $ | 32.83 | $ | 29.15 | $ | 28.96 | $ | 27.43 | ||||||||||
|
Stockholders’ equity per common share
|
36.12 | 33.62 | 29.81 | 29.61 | 28.37 | |||||||||||||||
|
Class A Global Market System
|
||||||||||||||||||||
|
closing price range
|
36.07-27.80 | 33.63-21.42 | 29.73-18.34 | 32.68-22.02 | 33.49-21.44 | |||||||||||||||
|
Class B Global Market System
|
||||||||||||||||||||
|
closing price range
|
36.29-27.42 | 33.40-21.41 | 29.70-19.20 | 32.99-22.30 | 33.17-20.86 | |||||||||||||||
|
Common cash dividends declared per share
|
- | - | - | - | - | |||||||||||||||
|
Price earnings ratio
|
25.8 | 9.2 | 28.7 | 20.5 | 7.4 | |||||||||||||||
|
(a) The fiscal 2013 financial results include two and one-half months of operating activity related to the Sunnyside acquisition.
|
||||||||||||||||||||
|
(b) The fiscal 2011 financial results include eight months of operating activity related to the Lebanon acquisition.
|
||||||||||||||||||||
|
(c) The effect of using the LIFO inventory valuation method in fiscal 2014 was to reduce operating earnings by $20.4 million and
|
||||||||||||||||||||
|
net earnings by $13.2 million or $1.19 per share ($1.19 diluted). The effect of using the LIFO inventory valuation method in
|
||||||||||||||||||||
|
fiscal 2013 was to increase operating earnings by $4.5 million and net earnings by $2.7 million or $0.24 per share ($0.24 diluted).
|
||||||||||||||||||||
|
The effect of using the LIFO inventory valuation method in fiscal 2012 was to reduce operating earnings by $47.3 million and
|
||||||||||||||||||||
|
net earnings by $30.8 million or $2.53 per share ($2.52 diluted). The effect of using the LIFO inventory valuation method in
|
||||||||||||||||||||
|
fiscal 2011 was to increase operating earnings by $7.9 million and net earnings by $5.1 million or $0.42 per share ($0.42 diluted).
|
||||||||||||||||||||
|
The effect of using the LIFO inventory valuation method in fiscal 2010 was to reduce operating earnings by $11.2 million and net
|
||||||||||||||||||||
|
earnings by $7.3 million or $0.61 per share ($0.60 diluted).
|
||||||||||||||||||||
|
(d) The long-term debt to equity percentage for fiscal 2014, 2013, 2012, and 2010 includes the Revolving Credit Facility as discussed
|
||||||||||||||||||||
|
in Note 5, Long-Term Debt. For the year 2011, the Revolving Credit Facility was included in current liabilities. If calculated on a
|
||||||||||||||||||||
|
comparable basis to fiscal 2014, 2013, 2012, and 2010, the 2011 percentage would be 63.8%.
|
||||||||||||||||||||
|
(e) Equivalent common shares are either common shares or, for convertible preferred shares, the number of common shares that the
|
||||||||||||||||||||
|
preferred shares are convertible into. See Note 8 of the Notes to Consolidated Financial Statements for conversion details.
|
||||||||||||||||||||
1
Management’s Discussion and Analysis of
Financial Condition and Results of Operations
OVERVIEW
Our Business
Seneca Foods is North America’s leading provider of packaged fruits and vegetables, with facilities located throughout the United States. Its high quality products are primarily sourced from over 2,000 American farms.
Seneca holds the largest share of the retail private label, food service, and export canned vegetable markets, distributing to over 90 countries. Products are also sold under the highly regarded brands of Libby’s®, Aunt Nellie’s®, READ®, Seneca Farms® and Seneca labels, including Seneca snack chips. In addition, Seneca provides vegetable products under an alliance with General Mills Operations, LLC, a subsidiary of General Mills, Inc., under the Green Giant label.
During 2013, the Company acquired 100% of the membership interest in Independent Foods, LLC. which is a provider of canned fruit products. In 2013, canned fruit products represented 20% of the Company’s sales.
The Company’s business strategies are designed to grow the Company’s market share and enhance the Company’s sales and margins and include: 1) expand the Company’s leadership in the packaged fruit and vegetable industry; 2) provide low cost, high quality fruit and vegetable products to consumers through the elimination of costs from the Company’s supply chain and investment in state-of-the-art production and logistical technology; 3) focus on growth opportunities to capitalize on higher expected returns; and 4) pursue strategic acquisitions that leverage the Company’s core competencies.
All references to years are fiscal years ended March 31 unless otherwise indicated.
Restructuring
During 2013, the Company implemented a product rationalization program and recorded a restructuring charge of $3.5 million for related equipment costs (contra fixed assets), lease impairment costs (net of realizable value), and certain inventory costs. During 2014, the Company adjusted the costs of the product rationalization program, started in 2013, by $0.5 million, mostly related to equipment costs. These charges are included under Plant Restructuring in the Consolidated Statements of Net Earnings.
During 2012, there were no material adjustments to Plant Restructuring.
Divestitures, Other Charges and Credits
Other operating income in 2014 included a gain of $2.9 million from a break-up fee earned as a result of the Company being named the stalking horse bidder in an attempt to acquire substantially all the operating assets of Allens, Inc. in a bankruptcy court supervised auction, a gain of $0.7 million from the sale of two aircraft and a gain of $0.1 million as a result of adjustments related to the purchase of Sunnyside (see Note 2, Acquisitions). The Company also recorded a loss of $0.5 million on the disposal of a warehouse located in Sunnyside, Washington and a net gain of $0.2 million from the sale of other fixed assets.
Other operating income in 2013 included a gain of $2.0 million as a result of the estimated fair market value of the net assets acquired exceeding the purchase price of Sunnyside (see Note 2, Acquisitions). The Company also recorded a gain of $0.3 million from the sale of property located in Cambria, Wisconsin and a net loss of $0.3 million on the disposal of certain other fixed assets.
Other operating income in 2012 included a gain of $0.7 million from the sale of property located in LeSueur, MN and a gain of $0.1 million from the sale of other property.
Liquidity and Capital Resources
The Company’s primary cash requirements are to make payments on the Company’s debt, finance seasonal working capital needs and to make capital expenditures. Internally generated funds and amounts available under the revolving credit facility are the Company’s primary sources of liquidity, although the Company believes it has the ability to raise additional capital by issuing additional stock, if it desires.
2
Management’s Discussion and Analysis of
Financial Condition and Results of Operations
Revolving Credit Facility
The Company completed the closing of a new five year revolving credit facility (“Revolver”) on July 20, 2011. During 2013, the Company executed $50.0 million of the $200.0 million accordion feature of the Revolver to expand available borrowings under the Revolver from $250.0 million to $300.0 million from April through July and $350.0 million to $400.0 million from August through March of each year under the Revolver. The Revolver balance as of March 31, 2014 was $175.0 million and is included in Long-Term Debt in the accompanying Consolidated Balance Sheet. In order to maintain availability of funds under the facility, the Company pays a commitment fee on the unused portion of the Revolver. The Revolver is secured by the Company’s accounts receivable and inventories and contains a financial covenant and borrowing base requirements. The Company utilizes its Revolver for general corporate purposes, including seasonal working capital needs, to pay debt principal and interest obligations, and to fund capital expenditures and acquisitions. Seasonal working capital needs are affected by the growing cycles of the vegetables and fruits the Company packages. The majority of vegetable and fruit inventories are produced during the months of June through November and are then sold over the following year. Payment terms for vegetable and fruit produce are generally three months but can vary from a few days to seven months. Accordingly, the Company’s need to draw on the Revolver may fluctuate significantly throughout the year.
The Company believes that cash flows from operations and availability under its Revolver will provide adequate funds for the Company’s working capital needs, planned capital expenditures and debt service obligations for at least the next 12 months.
Seasonality
The Company’s revenues typically are higher in the second and third fiscal quarters. This is due, in part, because the Company sells, on a bill and hold basis, Green Giant canned and frozen vegetables to GMOL at the end of each pack cycle, which typically occurs during these quarters. GMOL buys the product from the Company at cost plus an equivalent case tolling fee. See the Critical Accounting Policies section for further details. The Company’s non-Green Giant sales also exhibit seasonality with the third fiscal quarter generating the highest sales due to increased retail sales during the holiday season.
The seasonality of the Company’s business is illustrated by the following table:
|
First Quarter
|
Second Quarter
|
Third Quarter
|
Fourth Quarter
|
|||||||||||||
|
(In thousands)
|
||||||||||||||||
|
Year ended March 31, 2014:
|
||||||||||||||||
|
Net sales
|
$ | 232,127 | $ | 336,628 | $ | 477,694 | $ | 293,759 | ||||||||
|
Gross margin
|
19,680 | 22,379 | 31,178 | 17,726 | ||||||||||||
|
Net earnings (loss)
|
1,347 | 6,603 | 6,846 | (1,017 | ) | |||||||||||
|
Inventories (at quarter end)
|
484,694 | 758,654 | 550,723 | 451,250 | ||||||||||||
|
Revolver outstanding (at quarter end)
|
151,026 | 282,000 | 226,000 | 175,000 | ||||||||||||
|
Year ended March 31, 2013:
|
||||||||||||||||
|
Net sales
|
$ | 231,051 | $ | 317,593 | $ | 452,731 | $ | 274,922 | ||||||||
|
Gross margin
|
29,075 | 40,905 | 44,991 | 26,341 | ||||||||||||
|
Net earnings
|
8,191 | 14,521 | 14,790 | 3,911 | ||||||||||||
|
Inventories (at quarter end)
|
458,368 | 726,898 | 527,606 | 479,730 | ||||||||||||
|
Revolver outstanding (at quarter end)
|
100,000 | 233,000 | 185,860 | 188,000 | ||||||||||||
3
Management’s Discussion and Analysis of
Financial Condition and Results of Operations
Short-Term Borrowings
The Company utilizes its Revolver for general corporate purposes, including seasonal working capital needs, to pay debt principal and interest obligations, and to fund capital expenditures and acquisitions. Seasonal working capital needs are affected by the growing cycles of the vegetables and fruits the Company packages. The majority of vegetable and fruit inventories are produced during the months of June through November and are then sold over the following year. Payment terms for vegetable and fruit produce are generally three months but can vary from a few days to seven months. Accordingly, the Company’s need to draw on the Revolver may fluctuate significantly through the year.
During 2014, the Company entered into some interim lease notes which financed down payments for various equipment orders at market rates. As of March 31, 2014, these interim notes had not been converted into operating leases since the equipment was not yet delivered. These notes, which total $12.3 million as of March 31, 2014, are included in notes payable in the accompanying Consolidated Balance Sheets. These notes are expected to be converted into operating leases within the next twelve months. Until then, they bear interest at an annual rate of 1.65%.
During 2014, the maximum level of short-term borrowings was affected by the payoff of a $36.7 million loan to a third party lender, which took place in August 2013. The maximum level of short-term borrowings during 2013 was affected by the Hancock stock buyback of $25.9 million, the acquisition of Independent Foods, LLC, which took place in January 2013 and the receipt of the $10.0 million related to a loan repayment from a third party borrower. Details of this acquisition are outlined in Note 2 of the Notes to Consolidated Financial Statements. Details of the loan are outlined in Note 3 of the Notes to Consolidated Financial Statements.
General terms of the Revolver include payment of interest at LIBOR plus an agreed upon spread.
The following table documents the quantitative data for Short-Term Borrowings during 2014 and 2013:
|
Fourth Quarter
|
Year Ended
|
|||||||||||||||
|
2014
|
2013
|
2014
|
2013
|
|||||||||||||
|
(In thousands)
|
||||||||||||||||
|
Reported end of period:
|
||||||||||||||||
|
Revolver outstanding
|
$ | 175,000 | $ | 188,000 | $ | 175,000 | $ | 188,000 | ||||||||
|
Weighted average interest rate
|
1.65 | % | 1.70 | % | 1.65 | % | 1.70 | % | ||||||||
|
Reported during period:
|
||||||||||||||||
|
Maximum Revolver
|
$ | 239,482 | $ | 236,000 | $ | 318,601 | $ | 258,000 | ||||||||
|
Average Revolver outstanding
|
$ | 213,487 | $ | 211,970 | $ | 214,528 | $ | 166,198 | ||||||||
|
Weighted average interest rate
|
1.49 | % | 1.54 | % | 1.60 | % | 1.54 | % | ||||||||
Long-Term Debt
On August 1, 2013, the Company paid a final $36.7 million principal payment due on a secured note payable to John Hancock Life Insurance Company. At March 31, 2014, the Company has two mortgages outstanding totaling $19.0 million, and four industrial revenue bonds ("IRBs"), totaling $22.6 million. As discussed in Note 5, Long-Term Debt, the Company classified its Revolver balance as long-term debt at March 31, 2014. The Company issued a $1.5 million new economic development note during 2014. The Company did not issue any significant long-term debt in 2013, other than the Revolver. In 2013, the Company reached an agreement to extend the term of its $5.1 million Wayne County Industrial Revenue Development Bonds, included in the IRBs, from June 1, 2012 to June 1, 2017.
4
Management’s Discussion and Analysis of
Financial Condition and Results of Operations
As of March 31, 2014, scheduled maturities of long-term debt in each of the five succeeding fiscal years and thereafter are presented below. The March 31, 2014 Revolver balance of $175.0 million is presented as being due in fiscal 2017, based upon the Revolver’s July 20, 2016 maturity date (in thousands):
.
|
2015
|
$
|
2,277
|
||
|
2016
|
2,530
|
|||
|
2017
|
177,667
|
|||
|
2018
|
7,904
|
|||
|
2019
|
3,034
|
|||
|
Thereafter
|
25,104
|
|||
|
Total
|
$
|
218,516
|
||
Restrictive Covenants
The Company’s debt agreements, including the Revolver, contain covenants that restrict the Company’s ability to incur additional indebtedness, pay dividends on the Company’s capital stock, make other restricted payments, including investments, sell the Company’s assets, incur liens, transfer all or substantially all of the Company’s assets and enter into consolidations or mergers. The Company’s debt agreements also require the Company to meet a minimum fixed charge coverage ratio. The Revolver also contains borrowing base requirements related to accounts receivable and inventories. These financial requirements and ratios generally become more restrictive over time and are subject to allowances for seasonal fluctuations. The most restrictive financial covenant in the debt agreements is the fixed charge coverage ratio within the Master Reimbursement Agreement with General Electric Commercial Finance, which relates to the Secured Industrial Revenue Development Bonds. In connection with the Company’s decision to adopt the LIFO method of inventory accounting, effective December 30, 2007, the Company executed amendments to its debt agreements, which enable the Company to compute its financial covenants as if the Company were on the FIFO method of inventory accounting. The Company was in compliance with all such financial covenants as of March 31, 2014.
Capital Expenditures
Capital expenditures in 2014 totaled $19.4 million and included $7.6 million towards the completion of a pouch building project in Janesville, Wisconsin, and $3.6 million for the start of a warehouse project in Sunnyside, Washington, equipment replacements and other improvements, and cost saving projects. Capital expenditures in 2013 totaled $16.4 million and included $3.3 million to complete a warehouse expansion in Ripon, Wisconsin started in 2012 and $0.5 million to complete a dock expansion project in Lebanon, Pennsylvania started in 2012, equipment replacements and other improvements, and cost saving projects. Capital expenditures in 2012 totaled $27.4 million and included $4.0 million towards the completion of a warehouse project in Ripon, Wisconsin, $2.2 million to complete a warehouse expansion in Cumberland, Wisconsin, $1.7 million towards a dock expansion in Lebanon, Pennsylvania, equipment replacements and other improvements, and cost saving projects.
Accounts Receivable
In 2014, accounts receivable decreased by $1.3 million or 1.6% versus 2013, due to the impact on cash receipts due to the timing of year end, partially offset by higher sales volume in the fourth quarter of 2014 compared to the 2013. In 2013, accounts receivable increased by $1.1 million or 1.5% versus 2012, due to the Sunnyside acquisition, partially offset by decreased sales volume in the fourth quarter of 2013 compared to 2012 excluding Sunnyside.
Loan Receivable
During 2012, the Company signed a letter of intent to acquire one of its competitors in the canned and frozen vegetable industry. During the due diligence process, the Company invested $10.0 million in the selling company's revolving loan facility, in order to facilitate the exit of several existing lenders. Although the Company ultimately decided not to proceed with the transaction, the Company continued to have this investment, which was recorded as a loan receivable on its balance sheet at March 31, 2012. The loan receivable was paid off, including interest, during 2013.
Inventories
In 2014, inventories decreased by $28.5 million primarily reflecting a $46.3 million decrease in finished goods due to the increase in the LIFO reserve balance and the short 2013 pack (fiscal 2014) of certain commodities, partially offset by the effect of higher raw material quantities. The LIFO reserve balance was $153.4 million at March 31, 2014 versus $133.0 million at the prior year end.
In 2013, inventories increased by $47.3 million primarily reflecting the effect of higher finished goods quantities, the Sunnyside acquisition and higher work in process quantities. The LIFO reserve balance was $133.0 million at March 31, 2013 versus $137.2 million at the prior year end.
The Company believes that the use of the LIFO method better matches current costs with current revenues.
5
Critical Accounting Policies
During the year ended March 31, 2014, the Company sold for cash, on a bill and hold basis, $150.3 million of Green Giant finished goods inventory to GMOL. As of March 31, 2014, $71.9 million of this product, included in 2014 sales, remained unshipped. At the time of the sale of the Green Giant vegetables to GMOL, title of the specified inventory transferred to GMOL. The Company believes it has met the criteria required by the accounting standards for bill and hold treatment.
Trade promotions are an important component of the sales and marketing of the Company’s branded products and are critical to the support of the business. Trade promotion costs, which are recorded as a reduction of net sales, include amounts paid to encourage retailers to offer temporary price reductions for the sale of the Company’s products to consumers, amounts paid to obtain favorable display positions in retail stores, and amounts paid to retailers for shelf space in retail stores. Accruals for trade promotions are recorded primarily at the time of sale of product to the retailer based on expected levels of performance. Settlement of these liabilities typically occurs in subsequent periods primarily through an authorized process for deductions taken by a retailer from amounts otherwise due to the Company. As a result, the ultimate cost of a trade promotion program is dependent on the relative success of the events and the actions and level of deductions taken by retailers for amounts they consider due to them. Final determination of the permissible deductions may take extended periods of time.
The Company assesses its long-lived assets for impairment whenever there is an indicator of impairment. Property, plant, and equipment are depreciated over their assigned lives. The assigned lives and the projected cash flows used to test impairment are subjective. If actual lives are shorter than anticipated or if future cash flows are less than anticipated, a future impairment charge or a loss on disposal of the assets could be incurred. Impairment losses are evaluated if the estimated undiscounted value of the cash flows is less than the carrying value. If such is the case, a loss is recognized when the carrying value of an asset exceeds its fair value.
Obligations and Commitments
As of March 31, 2014, the Company was obligated to make cash payments in connection with its debt, operating leases, and purchase commitments. The effect of these obligations and commitments on the Company’s liquidity and cash flows in future periods are listed below. All of these arrangements require cash payments over varying periods of time. Certain of these arrangements are cancelable on short notice and others require additional payments as part of any early termination.
|
Contractual Obligations
|
||||||||||||||||||||
|
March 31, 2014
|
||||||||||||||||||||
|
2020
|
||||||||||||||||||||
|
2015
|
2016-17 | 2018-19 |
and beyond
|
Total
|
||||||||||||||||
|
(In thousands)
|
||||||||||||||||||||
|
Long-term debt
|
$ | 2,277 | $ | 180,197 | $ | 10,938 | $ | 25,104 | $ | 218,516 | ||||||||||
|
Interest
|
5,121 | 7,426 | 1,899 | 2,831 | 17,277 | |||||||||||||||
|
Operating lease obligations
|
36,759 | 61,232 | 43,536 | 33,647 | 175,174 | |||||||||||||||
|
Purchase commitments
|
225,361 | — | — | — | 225,361 | |||||||||||||||
|
Total
|
$ | 269,518 | $ | 248,855 | $ | 56,373 | $ | 61,582 | $ | 636,328 | ||||||||||
In addition, the Company's defined benefit plan has an unfunded pension liability of $15.8 million which is subject to certain actuarial assumptions. The unfunded status decreased by $12.7 million during 2014 reflecting the actual fair value of plan assets as of March 31, 2014 and the current unfunded liability based on the projected benefit obligation, which increased from $163.5 million to $170.5 million. This unfunded status decrease was recognized via the actual gain on plan assets and the decrease in accumulated other comprehensive income of $11.3 million after the income tax benefit of $7.2 million. Plan assets increased from $135.0 million as of March 31, 2013 to $154.7 million as of March 31, 2014 due to a continued recovery in market conditions and the $2.0 million contribution by the Company. The Company made this contribution to maintain our funding status at an acceptable level. The unfunded liability is reflected in other liabilities in the Consolidated Balance Sheets.
During 2014, the Company entered into new operating leases of approximately $62.6 million, based on the if-purchased value, which was primarily agricultural and packaging equipment.
6
Purchase commitments represent estimated payments to growers for crops that will be grown during the calendar 2014 season.
Due to uncertainties related to FASB Accounting Standards Codification (“ASC”) 740, Income Taxes, the Company is not able to reasonably estimate the cash settlements required in future periods.
The Company has no off-balance sheet debt or other unrecorded obligations other than operating lease obligations and purchase commitments noted above.
Standby Letters of Credit
The Company has standby letters of credit for certain insurance-related requirements. The majority of the Company’s standby letters of credit are automatically renewed annually, unless the issuer gives cancellation notice in advance. On March 31, 2014, the Company had $10.6 million in outstanding standby letters of credit. These standby letters of credit are supported by the Company’s Revolver and reduce borrowings available under the Revolver.
Cash Flows
In 2014, the Company’s cash and cash equivalents decreased by $0.3 million, which is due to the net impact of $58.0 million provided by operating activities, $18.4 million used in investing activities, and $39.9 million used in financing activities.
Operating Activities
Cash provided by operating activities increased to $58.0 million in 2014 from $29.7 million in 2013. The increase is primarily attributable to a lower increase in other current assets (mostly lease deposits) and decreased inventories, exclusive of LIFO, partially offset by an decrease in net earnings in 2014 versus 2013. The 2014 LIFO charge of $20.4 million resulted in an increase in the tax payment deferral of $7.1 million.
Cash provided by operating activities decreased to $29.7 million in 2013 from $41.9 million in 2012. The decrease is primarily attributable to increased other current assets (primarily lease deposits) and increased inventories, exclusive of LIFO, primarily offset by an increase in net earnings in 2013 versus 2012. The 2012 LIFO credit of $4.2 million resulted in a reduction in the tax payment deferral of $1.5 million.
The cash requirements of the business fluctuate significantly throughout the year to coincide with the seasonal growing cycles of vegetables and fruits. The majority of the inventories are produced during the packing months, from June through November, and are then sold over the following year. Cash flow from operating activities is one of the Company’s main sources of liquidity.
Investing Activities
Cash used in investing activities was $18.5 million for 2014, principally reflecting capital expenditures. Capital expenditures aggregated $19.4 million in 2014 versus $16.4 million in 2013. The increase was primarily attributable to more large projects in 2014. There were two major projects in 2014 as follows: 1) $7.6 million towards the completion of pouch building project in Janesville, Wisconsin, and 2) $3.6 million for the start of a warehouse project in Sunnyside, Washington.
Cash used in investing activities was $11.0 million for 2013, principally reflecting capital expenditures and the Sunnyside acquisition partially offset by the collection of the loan receivable. Capital expenditures aggregated $16.4 million in 2013 versus $27.4 million in 2012. The decrease was primarily attributable to fewer large projects in 2013. There were two major projects in 2013 as follows: 1) $3.3 million to complete a warehouse expansion in Ripon, Wisconsin started in 2012, and 2) $0.5 million to complete a dock expansion project in Lebanon, Pennsylvania started in 2012.
Financing Activities
Cash used by financing activities was $39.9 million in 2014 representing a net pay down on the Revolver of $51.7 million partially offset by interim funding of $12.3 million. The Company purchased $0.7 million of treasury stock during 2014 versus $28.4 million purchased in 2013.
7
Cash used by financing activities was $14.0 million in 2013. The Company purchased $28.4 million of treasury stock during 2013 versus $1.2 million purchased in 2012. This was offset by net proceeds on the Revolver of $14.2 million.
RESULTS OF OPERATIONS
|
Classes of similar products/services:
|
2014
|
2013
|
2012
|
|||||||||
|
(In thousands)
|
||||||||||||
|
Net Sales:
|
||||||||||||
|
GMOL *
|
$ | 177,881 | $ | 165,684 | $ | 166,231 | ||||||
|
Canned vegetables
|
753,318 | 746,892 | 743,123 | |||||||||
|
Frozen *
|
107,109 | 84,935 | 96,870 | |||||||||
|
Fruit
|
264,549 | 245,596 | 220,184 | |||||||||
|
Snack
|
11,496 | 11,357 | 11,730 | |||||||||
|
Other
|
25,855 | 21,833 | 19,667 | |||||||||
|
Total
|
$ | 1,340,208 | $ | 1,276,297 | $ | 1,257,805 | ||||||
|
* GMOL includes frozen vegetable sales exclusively for GMOL.
|
||||||||||||
Fiscal 2014 versus Fiscal 2013
Net sales for 2014 increased $63.9 million, from $1,276.3 million to $1,340.2 million. The increase primarily reflects a $22.2 million increase in frozen sales, a $19.0 million increase in fruit sales in part due to the January 2013 Sunnyside acquisition, a $12.2 million increase in GMOL sales, a $6.4 million increase in canned vegetables sales and a $4.0 million increase in other sales. The increase in sales is attributable to increased sales volume of $79.1 million partially offset by lower selling prices/less favorable sales mix of $15.2 million. The decreased selling prices/less favorable sales mix is primarily due to canned and frozen vegetables.
Cost of product sold as a percentage of sales increased from 88.9% in 2013 to 93.2% in 2014 primarily as a result of a $24.6 million LIFO charge increase in 2014 versus 2013, due to higher commodity costs, and somewhat lower selling prices in 2014 versus 2013.
Selling, general and administrative expense was 5.2% of sales in 2014 and 5.4% of sales from 2013.
Plant restructuring costs, which are described in detail in the Restructuring section of Management’s Discussion and Analysis of Financial Condition and Results of Operations, decreased from $3.5 million in 2013 to $0.5 million in 2014. This was due to the product rationalization costs incurred in 2013 and adjusted in 2014.
Interest expense, net, decreased from $7.5 million in 2013 to $6.2 million in 2014 due to the continuing pay down of higher cost debt in 2014 partially offset by higher average Revolver borrowings in 2014 versus 2013.
Other operating income in 2014 included a gain of $2.9 million from a break-up fee earned as a result of the Company being named the stalking horse bidder in an attempt to acquire substantially all the operating assets of Allens, Inc. in a bankruptcy court supervised auction, a gain of $0.7 million from the sale of two aircraft and a gain of $0.1 million as a result of adjustments related to the purchase of Sunnyside. The Company also recorded a loss of $0.5 million on the disposal of a warehouse located in Sunnyside, Washington and a net gain of $0.2 million from the sale of other fixed assets.
As a result of the aforementioned factors, pre-tax earnings decreased from $63.4 million in 2013 to $17.3 million in 2014. The effective tax rate was 20.5% in 2014 and 34.7% in 2013. Of the 14.2 percentage point decrease in the effective tax rate for the year, the major contributors to this decrease are the following items, 1) with lower pre-tax earnings due to part to a large LIFO charge versus a credit in the prior year, the permanent items have a larger impact on the effective rate, 2) the manufacturers deduction is a higher percentage of current year earnings than the prior year, 3) the reversal of certain tax reserves related to New York State investment tax credit and 4) work opportunity credit, research and experimentation credit and fuel tax credit and miscellaneous permanent items.
Fiscal 2013 versus Fiscal 2012
Net sales for 2013 increased $18.5 million, from $1,257.8 million to $1,276.3 million. The increase primarily reflects a $25.4 million increase in fruit sales in part due to the Sunnyside acquisition, a $3.8 million increase in canned vegetables sales, and a $2.2 million increase in other sales, partially offset by a $11.9 million decrease in frozen sales and a $0.5 million decrease in GMOL sales. The increase in sales is attributable to increased selling prices/improved sales mix of $34.3 million partially offset by a sales volume reduction of $15.8 million. The increased selling prices/improved sales mix is primarily due to canned vegetable and canned fruit.
8
Cost of product sold as a percentage of sales decreased from 92.6% in 2012 to 88.9% in 2013 primarily as a result of a $51.6 million LIFO charge decrease in 2013 versus 2012, due to lower commodity costs, partially offset by somewhat lower selling prices in 2013 versus 2012.
Selling, general and administrative expense was unchanged in 2013 at 5.4% of sales from 2012.
Plant restructuring costs, which are described in detail in the Restructuring section of Management’s Discussion and Analysis of Financial Condition and Results of Operations, increased from near zero in 2012 to $3.5 million in 2013. This was due to the product rationalization costs incurred in 2013.
Interest expense, net, decreased from $8.1 million in 2012 to $7.5 million in 2013 due to the continuing pay down of higher cost debt in 2013 and lower average Revolver borrowings in 2013 versus 2012.
Other operating income in 2013 consisted of a gain of $2.0 million as a result of the estimated fair market value of the assets acquired exceeding the purchase price of Sunnyside.
As a result of the aforementioned factors, pre-tax earnings increased from $17.5 million in 2012 to $63.4 million in 2013. The effective tax rate was 34.7% in 2013 and 35.8% in 2012.
Recently Issued Accounting Standards
In July 2013, the Financial Accounting Standards Board ("FASB") issued Account Standards Update ("ASU") 2013-11, "Presentation of an Unrecognized Tax Benefit When a Net Operating Loss Carryforward, a Similar Tax Loss, or a Tax Credit Carryforward Exists." The amendments in ASU 2013-11 provide guidance on the financial statement presentation of unrecognized tax benefit when a net operating loss carryforward, a similar tax loss, or a tax credit carryforward exists. ASU 2013-11 is effective for fiscal years beginning after December 15, 2013. The Company will reflect the impact of these amendments beginning in the first quarter of Fiscal 2015. The Company does not anticipate a material impact on the Company's financial position, results of operations or cash flows as a result of this change.
9
Management’s Discussion and Analysis of
Financial Condition and Results of Operations
QUANTITATIVE AND QUALITATIVE DISCLOSURES ABOUT MARKET RISK
Interest Rate Risk
The Company maintained $13.8 million in cash equivalents as of March 31, 2014. As a result of its regular borrowing activities, the Company’s operating results are exposed to fluctuations in interest rates, which it manages primarily through its regular financing activities. The Company uses a revolving credit facility with variable interest rates to finance capital expenditures, acquisitions, seasonal working capital requirements and to pay debt principal and interest obligations. In addition, long-term debt includes secured notes payable. Long-term debt bears interest at fixed and variable rates. With $237.2 million in average variable-rate debt during fiscal 2014, a 1% change in interest rates would have had a $2.4 million effect on interest expense. The following table provides information about the Company’s financial instruments that are sensitive to changes in interest rates. The table presents principal cash flows and related weighted average interest rates by expected maturity date. Weighted average interest rates on long-term variable-rate debt are based on rates as of March 31, 2014.
|
Interest Rate Sensitivity of Long-Term Debt and Short-Term Investments
|
||||||||||||||||||||||||||||||||
|
March 31, 2014
|
||||||||||||||||||||||||||||||||
|
(In thousands)
|
||||||||||||||||||||||||||||||||
|
P A Y M E N T S B Y Y E A R
|
||||||||||||||||||||||||||||||||
|
Total/
|
Estimated
|
|||||||||||||||||||||||||||||||
|
Weighted
|
Fair
|
|||||||||||||||||||||||||||||||
|
2015
|
2016
|
2017
|
2018
|
2019
|
Thereafter
|
Average
|
Value
|
|||||||||||||||||||||||||
|
Fixed-rate L/T debt:
|
||||||||||||||||||||||||||||||||
|
Principal cash flows
|
$ | 2,277 | $ | 2,530 | $ | 2,667 | $ | 2,844 | $ | 3,034 | $ | 7,534 | $ | 20,886 | $ | 22,351 | ||||||||||||||||
|
Average interest rate
|
6.58 | % | 6.59 | % | 6.62 | % | 6.66 | % | 6.72 | % | 6.76 | % | 6.72 | % | ||||||||||||||||||
|
Variable-rate L/T debt:
|
||||||||||||||||||||||||||||||||
|
Principal cash flows
|
$ | - | $ | - | $ | 175,000 | $ | 5,060 | $ | - | $ | 17,570 | $ | 197,630 | $ | 197,630 | ||||||||||||||||
|
Average interest rate
|
- | % | - | % | 1.65 | % | 3.23 | % | - | % | 3.23 | % | 1.83 | % | ||||||||||||||||||
|
Average Revolver debt:
|
||||||||||||||||||||||||||||||||
|
Principal cash flows
|
$ | 214,528 | $ | 214,528 | ||||||||||||||||||||||||||||
|
Average interest rate
|
1.60 | % | ||||||||||||||||||||||||||||||
|
Short-term investments:
|
||||||||||||||||||||||||||||||||
|
Average balance
|
$ | 3,828 | $ | 3,828 | ||||||||||||||||||||||||||||
|
Average interest rate
|
0.07 | % | ||||||||||||||||||||||||||||||
Commodity Risk
The materials that the Company uses, such as vegetables, fruits, steel, ingredients, and packaging materials, as well as the electricity and natural gas used in the Company’s business, are commodities that may experience price volatility caused by external factors including market fluctuations, availability, weather, currency fluctuations, and changes in governmental regulations and agricultural programs. These events may result in reduced supplies of these materials, higher supply costs, or interruptions in the Company’s production schedules. If prices of these raw materials increase and the Company is not able to effectively pass such price increases along to its customers, operating income will decrease. With $225.0 million in produce costs expected during 2015, a 1% change would have a $2.3 million effect on inventory costs. A 1% change in steel unit costs would equate to a $1.2 million cost impact.
The Company does not currently hedge or otherwise use derivative instruments to manage interest rate or commodity risks.
10
Consolidated Statements of Net Earnings
|
Seneca Foods Corporation and Subsidiaries
|
||||||||||||
|
(In thousands, except per share amounts)
|
||||||||||||
|
Years ended March 31,
|
2014
|
2013
|
2012
|
|||||||||
|
Net sales
|
$ | 1,340,208 | $ | 1,276,297 | $ | 1,257,805 | ||||||
|
Costs and expenses:
|
||||||||||||
|
Cost of products sold
|
1,249,245 | 1,134,985 | 1,164,986 | |||||||||
|
Selling, general, and administrative expense
|
70,129 | 68,852 | 67,971 | |||||||||
|
Other operating (income) expense, net
|
(3,271 | ) | (1,971 | ) | (814 | ) | ||||||
|
Plant restructuring
|
501 | 3,497 | 39 | |||||||||
|
Total costs and expenses
|
1,316,604 | 1,205,363 | 1,232,182 | |||||||||
|
Operating income
|
23,604 | 70,934 | 25,623 | |||||||||
|
Interest expense, net of interest income of
|
||||||||||||
|
$4, $179, and $707, respectively
|
6,262 | 7,486 | 8,102 | |||||||||
|
Earnings before income taxes
|
17,342 | 63,448 | 17,521 | |||||||||
|
Income tax expense
|
3,563 | 22,035 | 6,265 | |||||||||
|
Net earnings
|
$ | 13,779 | $ | 41,413 | $ | 11,256 | ||||||
|
Basic earnings per common share
|
$ | 1.24 | $ | 3.59 | $ | 0.93 | ||||||
|
Diluted earnings per common share
|
$ | 1.23 | $ | 3.57 | $ | 0.92 | ||||||
|
See notes to consolidated financial statements.
|
||||||||||||
|
Consolidated Statements of Comprehensive Income
|
||||||||||||
|
Seneca Foods Corporation and Subsidiaries
|
||||||||||||
|
(In thousands)
|
||||||||||||
|
Years ended March 31,
|
2014
|
2013
|
2012
|
|||||||||
|
Comprehensive income (loss):
|
||||||||||||
|
Net earnings
|
$ | 13,779 | $ | 41,413 | $ | 11,256 | ||||||
|
Change in pension and postretirement benefits
|
||||||||||||
|
(net of income tax of $7,222, $493, and $5,970, respectively)
|
11,296 | 771 | (9,338 | ) | ||||||||
|
Total
|
$ | 25,075 | $ | 42,184 | $ | 1,918 | ||||||
|
See notes to consolidated financial statements.
|
||||||||||||
11
Consolidated Balance Sheets
|
Seneca Foods Corporation and Subsidiaries
|
||||||||
|
(In thousands)
|
||||||||
|
March 31,
|
2014
|
2013
|
||||||
|
Assets
|
||||||||
|
Current Assets:
|
||||||||
|
Cash and cash equivalents
|
$ | 13,839 | $ | 14,104 | ||||
|
Accounts receivable, less allowance for doubtful accounts
|
||||||||
|
of $160 and $201, respectively
|
76,964 | 78,240 | ||||||
|
Inventories:
|
||||||||
|
Finished products
|
304,955 | 351,231 | ||||||
|
In process
|
12,353 | 10,032 | ||||||
|
Raw materials and supplies
|
133,942 | 118,467 | ||||||
| 451,250 | 479,730 | |||||||
|
Deferred income taxes, net
|
8,412 | 9,400 | ||||||
|
Other current assets
|
33,594 | 25,299 | ||||||
|
Total Current Assets
|
584,059 | 606,773 | ||||||
|
Deferred income tax asset, net
|
- | 2,097 | ||||||
|
Other assets
|
877 | 1,179 | ||||||
|
Property, plant, and equipment:
|
||||||||
|
Land
|
19,639 | 19,639 | ||||||
|
Buildings & improvements
|
180,202 | 178,847 | ||||||
|
Equipment
|
347,935 | 337,365 | ||||||
| 547,776 | 535,851 | |||||||
|
Less accumulated depreciation and amortization
|
363,859 | 347,444 | ||||||
|
Net property, plant, and equipment
|
183,917 | 188,407 | ||||||
|
Total Assets
|
$ | 768,853 | $ | 798,456 | ||||
|
Liabilities and Stockholders’ Equity
|
||||||||
|
Current Liabilities:
|
||||||||
|
Notes payable
|
$ | 12,255 | $ | - | ||||
|
Accounts payable
|
71,219 | 72,128 | ||||||
|
Accrued vacation
|
10,997 | 10,877 | ||||||
|
Accrued payroll
|
7,516 | 7,537 | ||||||
|
Other accrued expenses
|
26,111 | 25,062 | ||||||
|
Current portion of long-term debt
|
2,277 | 40,170 | ||||||
|
Income taxes payable
|
913 | 4,100 | ||||||
|
Total Current Liabilities
|
131,288 | 159,874 | ||||||
|
Long-term debt, less current portion
|
216,239 | 230,016 | ||||||
|
Other liabilities
|
27,355 | 41,400 | ||||||
|
Deferred income taxes, net
|
339 | - | ||||||
|
Total Liabilities
|
375,221 | 431,290 | ||||||
|
Commitments and contingencies
|
||||||||
|
Stockholders’ Equity:
|
||||||||
|
Preferred stock
|
5,332 | 5,422 | ||||||
|
Common stock
|
2,958 | 2,955 | ||||||
|
Additional paid-in capital
|
93,260 | 93,069 | ||||||
|
Treasury stock, at cost
|
(29,894 | ) | (31,204 | ) | ||||
|
Accumulated other comprehensive loss
|
(11,252 | ) | (22,548 | ) | ||||
|
Retained earnings
|
333,228 | 319,472 | ||||||
|
Total Stockholders’ Equity
|
393,632 | 367,166 | ||||||
|
Total Liabilities and Stockholders’ Equity
|
$ | 768,853 | $ | 798,456 | ||||
|
See notes to consolidated financial statements.
|
||||||||
12
Consolidated Statements of Cash Flows
|
Seneca Foods Corporation and Subsidiaries
|
||||||||||||
|
(In thousands)
|
||||||||||||
|
Years ended March 31,
|
2014
|
2013
|
2012
|
|||||||||
|
Cash flows from operating activities:
|
||||||||||||
|
Net earnings
|
$ | 13,779 | $ | 41,413 | $ | 11,256 | ||||||
|
Adjustments to reconcile net earnings to
|
||||||||||||
|
net cash provided by operations:
|
||||||||||||
|
Depreciation and amortization
|
23,281 | 23,251 | 22,691 | |||||||||
|
Deferred income tax (benefit) expense
|
(3,798 | ) | (2,950 | ) | 1,368 | |||||||
|
Gain on the sale of assets
|
(325 | ) | - | (814 | ) | |||||||
|
Impairment provision
|
501 | 1,216 | - | |||||||||
|
Changes in operating assets and liabilities (net of acquisitions):
|
||||||||||||
|
Accounts receivable
|
1,276 | 4,485 | 1,431 | |||||||||
|
Inventories
|
28,320 | (20,134 | ) | 22,803 | ||||||||
|
Other current assets
|
(8,295 | ) | (16,238 | ) | 4,929 | |||||||
|
Accounts payable, accrued expenses,
|
||||||||||||
|
and other liabilities
|
6,497 | (5,805 | ) | (20,977 | ) | |||||||
|
Income taxes
|
(3,187 | ) | 4,416 | (805 | ) | |||||||
|
Net cash provided by operating activities
|
58,049 | 29,654 | 41,882 | |||||||||
|
Cash flows from investing activities:
|
||||||||||||
|
Additions to property, plant, and equipment
|
(19,448 | ) | (16,371 | ) | (27,425 | ) | ||||||
|
Collection (issuance) of loan receivable
|
- | 10,000 | (10,000 | ) | ||||||||
|
Cash paid for acquisition (net of cash acquired)
|
- | (5,016 | ) | - | ||||||||
|
Proceeds from the sale of assets
|
998 | 370 | 1,042 | |||||||||
|
Net cash used in investing activities
|
(18,450 | ) | (11,017 | ) | (36,383 | ) | ||||||
|
Cash flows from financing activities:
|
||||||||||||
|
Proceeds from issuance of long-term debt
|
393,972 | 558,288 | 417,356 | |||||||||
|
Payments of long-term debt
|
(445,642 | ) | (544,047 | ) | (415,766 | ) | ||||||
|
Borrowings on notes payable
|
12,255 | - | - | |||||||||
|
Change in other assets
|
248 | 276 | (1,230 | ) | ||||||||
|
Purchase treasury stock
|
(674 | ) | (28,447 | ) | (1,178 | ) | ||||||
|
Preferred dividends paid
|
(23 | ) | (23 | ) | (23 | ) | ||||||
|
Net cash used in financing activities
|
(39,864 | ) | (13,953 | ) | (841 | ) | ||||||
|
Net increase (decrease) in cash and cash equivalents
|
(265 | ) | 4,684 | 4,658 | ||||||||
|
Cash and cash equivalents, beginning of year
|
14,104 | 9,420 | 4,762 | |||||||||
|
Cash and cash equivalents, end of year
|
$ | 13,839 | $ | 14,104 | $ | 9,420 | ||||||
|
Supplemental disclosures of cash flow information:
|
||||||||||||
|
Cash paid during the year for:
|
||||||||||||
|
Interest
|
$ | 6,586 | $ | 7,305 | $ | 7,570 | ||||||
|
Income taxes
|
10,695 | 20,352 | 5,455 | |||||||||
|
See notes to consolidated financial statements.
|
||||||||||||
13
Consolidated Statements of Stockholders' Equity
|
Seneca Foods Corporation and Subsidiaries
|
||||||||||||||||||||||||
|
(In thousands, except share amounts)
|
||||||||||||||||||||||||
|
Accumulated
|
||||||||||||||||||||||||
|
Additional
|
Other
|
|||||||||||||||||||||||
|
Preferred
|
Common
|
Paid-In
|
Treasury
|
Comprehensive
|
Retained
|
|||||||||||||||||||
|
Stock
|
Stock
|
Capital
|
Stock
|
Loss
|
Earnings
|
|||||||||||||||||||
|
Balance March 31, 2011
|
$ | 6,325 | $ | 4,118 | $ | 90,778 | $ | (257 | ) | $ | (13,981 | ) | $ | 266,849 | ||||||||||
|
Net earnings
|
- | - | - | - | - | 11,256 | ||||||||||||||||||
|
Cash dividends paid
|
||||||||||||||||||||||||
|
on preferred stock
|
- | - | - | - | - | (23 | ) | |||||||||||||||||
|
Equity incentive program
|
- | - | 124 | - | - | - | ||||||||||||||||||
|
Common stock stated value adjustment
|
- | (1,181 | ) | 1,181 | - | - | - | |||||||||||||||||
|
Purchase treasury stock
|
- | - | - | (1,178 | ) | - | - | |||||||||||||||||
|
Preferred stock conversion
|
(57 | ) | 1 | 56 | - | - | - | |||||||||||||||||
|
Change in pension and postretirement
|
||||||||||||||||||||||||
|
benefits adjustment (net of tax $5,970)
|
- | - | - | - | (9,338 | ) | - | |||||||||||||||||
|
Balance March 31, 2012
|
6,268 | 2,938 | 92,139 | (1,435 | ) | (23,319 | ) | 278,082 | ||||||||||||||||
|
Net earnings
|
- | - | - | - | - | 41,413 | ||||||||||||||||||
|
Cash dividends paid
|
||||||||||||||||||||||||
|
on preferred stock
|
- | - | - | - | - | (23 | ) | |||||||||||||||||
|
Equity incentive program
|
- | - | 72 | - | - | - | ||||||||||||||||||
|
Stock issued for profit sharing plan
|
- | - | 29 | - | - | - | ||||||||||||||||||
|
Purchase treasury stock
|
- | - | - | (29,769 | ) | - | - | |||||||||||||||||
|
Preferred stock conversion
|
(846 | ) | 17 | 829 | - | - | - | |||||||||||||||||
|
Change in pension and postretirement
|
||||||||||||||||||||||||
|
benefits adjustment (net of tax $493)
|
- | - | - | - | 771 | - | ||||||||||||||||||
|
Balance March 31, 2013
|
5,422 | 2,955 | 93,069 | (31,204 | ) | (22,548 | ) | 319,472 | ||||||||||||||||
|
Net earnings
|
- | - | - | - | - | 13,779 | ||||||||||||||||||
|
Cash dividends paid
|
||||||||||||||||||||||||
|
on preferred stock
|
- | - | - | - | - | (23 | ) | |||||||||||||||||
|
Equity incentive program
|
- | - | 100 | - | - | - | ||||||||||||||||||
|
Stock issued for profit sharing plan
|
- | - | 4 | - | - | - | ||||||||||||||||||
|
Contribution of 401(k) match
|
- | - | - | 1,984 | - | - | ||||||||||||||||||
|
Purchase treasury stock
|
- | - | - | (674 | ) | - | - | |||||||||||||||||
|
Preferred stock conversion
|
(90 | ) | 3 | 87 | - | - | - | |||||||||||||||||
|
Change in pension and postretirement
|
||||||||||||||||||||||||
|
benefits adjustment (net of tax $7,222)
|
- | - | - | - | 11,296 | - | ||||||||||||||||||
|
Balance March 31, 2014
|
$ | 5,332 | $ | 2,958 | $ | 93,260 | $ | (29,894 | ) | $ | (11,252 | ) | $ | 333,228 | ||||||||||
|
Preferred Stock
|
Common Stock
|
||||||||||||
|
6
|
%
|
10
|
%
|
||||||||||
|
Cumulative Par
|
Cumulative Par
|
2003 Series
|
|||||||||||
|
Value $.25
|
Value $.025
|
Participating
|
Participating
|
Class A
|
Class B
|
||||||||
|
Callable at Par
|
Convertible
|
Convertible Par
|
Convertible Par
|
Common Stock
|
Common Stock
|
||||||||
|
Voting
|
Voting
|
Value $.025
|
Value $.025
|
Par Value $.25
|
Par Value $.25
|
||||||||
|
Shares authorized and designated:
|
|||||||||||||
|
March 31, 2014
|
200,000
|
1,400,000
|
90,901
|
257,790
|
20,000,000
|
10,000,000
|
|||||||
|
Shares outstanding:
|
|||||||||||||
|
March 31, 2012
|
200,000
|
807,240
|
97,870
|
312,790
|
9,591,677
|
2,097,312
|
|||||||
|
March 31, 2013
|
200,000
|
807,240
|
91,962
|
262,790
|
8,705,243
|
2,055,424
|
|||||||
|
March 31, 2014
|
200,000
|
807,240
|
90,901
|
257,790
|
8,735,714
|
2,013,953
|
|||||||
|
Stock amount
|
$
|
50
|
$
|
202
|
$
|
1,085
|
$
|
3,995
|
$
|
2,454
|
$
|
504
|
|
|
See notes to consolidated financial statements.
|
|||||||||||||
14
Notes to Consolidated Financial Statements
Seneca Foods Corporation and Subsidiaries
1. Summary of Significant Accounting Policies
Nature of Operations — Seneca Foods Corporation and subsidiaries (the “Company”) conducts its business almost entirely in food packaging, operating 24 plants and 30 warehouses in eight states. The Company markets private label and branded packaged foods to retailers and institutional food distributors.
Principles of Consolidation — The consolidated financial statements include the accounts for the parent company and all of its wholly-owned subsidiaries after elimination of intercompany transactions, profits, and balances.
Revenue Recognition — Sales and related cost of product sold are recognized when legal title passes to the purchaser, which is primarily upon shipment of products. When customers, under the terms of specific orders, request that the Company invoice but hold the goods (“Bill and Hold”) for future shipment, the Company recognizes revenue when legal title to the finished goods inventory passes to the purchaser. Generally, the Company receives cash from the purchaser when legal title passes. During the years ended March 31, 2014 and 2013, the Company sold for cash, on a bill and hold basis, $150.3 million and $151.2 million, respectively, of Green Giant finished goods inventory to General Mills Operations, LLC (“GMOL”). At the time of the sale of the Green Giant vegetables to GMOL, title of the specified inventory transferred to GMOL. The Company believes it has met the criteria required by the accounting standards for Bill and Hold treatment. As of March 31, 2014, $71.9 million of 2014 product remained unshipped.
Trade promotions are an important component of the sales and marketing of the Company’s branded products, and are critical to the support of the business. Trade promotion costs, which are recorded as a reduction of sales, include amounts paid to retailers for shelf space, to obtain favorable display positions and to offer temporary price reductions for the sale of our products to consumers. Accruals for trade promotions are recorded primarily at the time of sale to the retailer based on expected levels of performance. Settlement of these liabilities typically occurs in subsequent periods primarily through an authorized process for deductions taken by a retailer from amounts otherwise due to the Company. As a result, the ultimate cost of a trade promotion program is dependent on the relative success of the events and the actions and level of deductions taken by retailers. Final determination of the permissible deductions may take extended periods of time.
Concentration of Credit Risk — Financial instruments that potentially subject the Company to credit risk consist of trade receivables and interest-bearing investments. Wholesale and retail food distributors comprise a significant portion of the trade receivables; collateral is generally not required. A relatively limited number of customers account for a large percentage of the Company’s total sales. GMOL sales represented 13% of net sales in each of 2014, 2013 and 2012. The top ten customers represented approximately 50%, 47% and 49% of net sales for 2014, 2013 and 2012, respectively. The Company closely monitors the credit risk associated with its customers. The Company places substantially all of its interest-bearing investments with financial institutions and monitors credit exposure. Cash and short-term investments in certain accounts exceed the federal insured limit; however, the Company has not experienced any losses in such accounts.
Cash Equivalents — The Company considers all highly liquid instruments purchased with an original maturity of three months or less as cash equivalents.
Fair Value of Financial Instruments — The fair values of cash and cash equivalents (Level 1), accounts receivable, loan receivable, short-term debt (Level 2) and accounts payable approximate cost because of the immediate or short-term maturity of these financial instruments. See Note 10, Fair Value of Financial Instruments, for a discussion of the fair value of long-term debt.
The three-tier value hierarchy is utilized to prioritize the inputs used in measuring fair value. The hierarchy gives the highest priority to quoted prices in active markets (Level 1) and the lowest priority to unobserved inputs (Level 3). The three levels are defined as follows:
|
·
|
Level 1- Quoted prices for identical instruments in active markets.
|
|
·
|
Level 2- Quoted prices for similar instruments; quoted prices for identical or similar instruments in markets that are not active; and model-derived valuations in which all significant inputs or significant value-drivers are observable.
|
|
·
|
Level 3- Model-derived valuations in which one or more inputs or value-drivers are both significant to the fair value measurement and unobservable.
|
15
Deferred Financing Costs — Deferred financing costs incurred in obtaining debt are amortized on a straight-line basis over the term of the debt, which is not materially different than using the effective interest rate method. As of March 31, 2014, there were $0.8 million of deferred financing costs included in other assets on the Consolidated Balance Sheets.
Inventories — Substantially all inventories are stated at the lower of cost; determined under the last-in, first-out (“LIFO”) method; or market.
Income Taxes — The provision for income taxes includes federal and state income taxes currently payable and those deferred because of temporary differences between the financial statement and tax basis of assets and liabilities and tax credit carryforwards. The Company uses the flow-through method to account for its investment tax credits.
The Company evaluates the likelihood of realization of its net deferred income tax assets by assessing its valuation allowance and by adjusting the amount of such allowance, if necessary. The factors used to assess the likelihood of realization are the Company’s forecast of future taxable income, the projected reversal of temporary differences and available tax planning strategies that could be implemented to realize the net deferred income tax assets.
Shipping and Handling Costs — The Company includes all shipping and handling costs billed to customers in net sales and the corresponding costs in cost of products sold.
Advertising Costs — Advertising costs are expensed as incurred. Advertising costs charged to operations were $1.5 million and $1.4 million in 2014 and 2013, respectively.
Accounts Receivable and Doubtful Accounts — Accounts receivable is stated at invoice value, which is net of any off invoice promotions. A provision for doubtful accounts is recorded based upon an assessment of credit risk within the accounts receivable portfolio, experience of delinquencies (accounts over 15 days past due) and charge-offs (accounts removed from accounts receivable for expectation of non-payment), and current market conditions. Management believes these provisions are adequate based upon the relevant information presently available.
Earnings per Common Share — The Company has three series of convertible preferred stock, which are deemed to be participating securities that are entitled to participate in any dividend on Class A common stock as if the preferred stock had been converted into common stock immediately prior to the record date for such dividend. Basic earnings per share for common stock is calculated using the “two-class” method by dividing the earnings attributable to common stockholders by the weighted average of common shares outstanding during the period. Restricted stock is included in all earnings per share calculations.
Diluted earnings per share is calculated by dividing earnings attributable to common stockholders by the sum of the weighted average common shares outstanding plus the dilutive effect of convertible preferred stock using the “if-converted” method, which treats the contingently-issuable shares of convertible preferred stock as common stock.
16
Notes to Consolidated Financial Statements
|
Years ended March 31,
|
2014
|
2013
|
2012
|
|||||||||
|
(In thousands, except per share amounts)
|
||||||||||||
|
Basic
|
||||||||||||
|
Net earnings
|
$ | 13,779 | $ | 41,413 | $ | 11,256 | ||||||
|
Deduct preferred stock dividends
|
23 | 23 | 23 | |||||||||
|
Undistributed earnings
|
13,756 | 41,390 | 11,233 | |||||||||
|
Earnings attributable to participating
|
||||||||||||
|
preferred
|
438 | 1,406 | 382 | |||||||||
|
Earnings attributable to common
|
||||||||||||
|
shareholders
|
$ | 13,318 | $ | 39,984 | $ | 10,851 | ||||||
|
Weighted average common shares
|
||||||||||||
|
outstanding
|
10,747 | 11,147 | 11,727 | |||||||||
|
Basic earnings per common share
|
$ | 1.24 | $ | 3.59 | $ | 0.93 | ||||||
|
Diluted
|
||||||||||||
|
Earnings attributable to common
|
||||||||||||
|
shareholders
|
$ | 13,318 | $ | 39,984 | $ | 10,851 | ||||||
|
Add dividends on convertible
|
||||||||||||
|
preferred stock
|
20 | 20 | 20 | |||||||||
|
Earnings attributable to common
|
||||||||||||
|
stock on a diluted basis
|
$ | 13,338 | $ | 40,004 | $ | 10,871 | ||||||
|
Weighted average common shares
|
||||||||||||
|
outstanding-basic
|
10,747 | 11,147 | 11,727 | |||||||||
|
Additional shares to be issued related to
|
||||||||||||
|
the equity compensation plan
|
5 | 5 | 5 | |||||||||
|
Additional shares to be issued under
|
||||||||||||
|
full conversion of preferred stock
|
67 | 67 | 67 | |||||||||
|
Total shares for diluted
|
10,819 | 11,219 | 11,799 | |||||||||
|
Diluted earnings per share
|
$ | 1.23 | $ | 3.57 | $ | 0.92 | ||||||
Depreciation and Valuation — Property, plant, and equipment are stated at cost. Interest incurred during the construction of major projects is capitalized. For financial reporting, the Company provides for depreciation on the straight-line method at rates based upon the estimated useful lives of the various assets. Depreciation was $22.9 million, $22.8 million, and $22.2 million in 2014, 2013, and 2012, respectively. The estimated useful lives are as follows: buildings and improvements — 30 years; machinery and equipment — 10-15 years; computer software — 3-5 years; vehicles — 3-7 years; and land improvements — 10-20 years. The Company assesses its long-lived assets for impairment whenever there is an indicator of impairment. Impairment losses are evaluated if the estimated undiscounted cash flows from using the assets are less than carrying value. A loss is recognized when the carrying value of an asset exceeds its fair value. There were $1.2 million of impairment losses in 2013 included in Plant Restructuring (see Plant Restructuring, note 15). There were no significant impairment losses in 2014 or 2012.
Use of Estimates in the Preparation of Financial Statements — The preparation of financial statements in conformity with accounting principles generally accepted in the United States ("GAAP") requires management to make estimates and assumptions that affect the reported amount of assets and liabilities and the disclosure of contingent assets and liabilities at the date of the financial statements, as well as the related revenues and expenses during the reporting period. Actual amounts could differ from those estimated.
Recently Issued Accounting Standards — In July 2013, the Financial Accounting Standards Board ("FASB") issued Account Standards Update ("ASU") 2013-11, "Presentation of an Unrecognized Tax Benefit When a Net Operating Loss Carryforward, a Similar Tax Loss, or a Tax Credit Carryforward Exists." The amendments in ASU 2013-11 provide guidance on the financial statement presentation of unrecognized tax benefit when a net operating loss carryforward, a similar tax loss, or a tax credit carryforward exists. ASU 2013-11 is effective for fiscal years beginning after December 15, 2013. The Company will reflect the impact of these amendments beginning in the first quarter of Fiscal 2015. The Company does not anticipate a material impact on the Company's financial position, results of operations or cash flows as a result of this change.
Reclassifications — Certain previously reported amounts have been reclassified to conform to the current period classification.
17
Notes to Consolidated Financial Statements
2. Acquisition
On January 15, 2013, the Company completed its acquisition of 100% of the membership interest in Independent Foods, LLC ("Sunnyside"). The business, based in Sunnyside, Washington, packages canned pears, apples and cherries in the United States. The rationale for the acquisition was twofold: (1) the business is a complementary fit with the Company's existing business and (2) it provides an extension of the Company's product offerings. The purchase price totaled $5.0 million plus the assumption of certain liabilities. In conjunction with the closing, the Company paid $19.5 million of liabilities acquired. This acquisition was financed with proceeds from the Company's revolving credit facility. The purchase price to acquire Sunnyside was allocated based on the internally developed fair value of the assets acquired and liabilities assumed and the independent valuation of property, plant, and equipment. The purchase price of $5.0 million has been allocated as follows (in millions):
|
Purchase Price (net of cash received)
|
$ | 5.0 | ||
|
Allocated as follows:
|
||||
|
Current assets
|
$ | 32.7 | ||
|
Property, plant and equipment
|
7.5 | |||
|
Bargain purchase gain
|
(2.0 | ) | ||
|
Current liabilities
|
(33.2 | ) | ||
|
Total
|
$ | 5.0 |
In 2013, the Company recorded a $1.9 million gain as a result of the estimated fair market value of the net assets acquired exceeding the purchase price for Sunnyside. In 2014, the Company determined an adjustment to the net assets acquired was required and, as a result, recorded an increase in the gain on the bargain purchase of $0.1 million to $2.0 million. This gain and subsequent increase is included in other operating income on the Consolidated Statements of Net Earnings.
|
|
3. Loan Receivable
|
The Company acquired $10.0 million of the lending commitments (the "Loan Commitment") made by various lenders under the Third Amended and Restated Credit Agreement dated July 29, 2011 by and among the Borrower ("Borrower"), Bank of America, N.A. as administrative agent and letter of credit issuer, and various other lenders (the "Borrower Credit Facility"), and thus became a co-lender under the Borrower Credit Facility. Upon the closing of such transaction, the Company advanced a total of $10.0 million to fund (i) the Company's then current portion of total advances made to Borrower under the Borrower Credit Facility and (ii) the balance of the Company's $10.0 million Loan Commitment. The Company acquired the Loan Commitment in connection with negotiations between the Company and Borrower concerning the Company's possible acquisition of Borrower through a merger transaction. The Company and the Borrower are no longer pursuing such potential acquisition. All of the Borrower's obligations under the Borrower Credit Facility, including those owing to the Company, were due to mature on March 30, 2012. In April 2012, the Company received a partial repayment or $3.7 million. In June 2012, the Company received the remaining $6.3 million due plus interest accrued and the Company has no further obligations with respect to the Loan Commitment. Interest income was recognized in the period in which it was earned.
18
4. Short-Term Borrowings
The Company completed the closing of a new five year revolving credit facility (“Revolver”) on July 20, 2011. During 2013, the Company executed $50.0 million of the $200.0 million accordion feature of the Revolver to expand available borrowings under the Revolver from $250.0 million to $300.0 million from April through July and $350.0 million to $400.0 million from August through March of each year under the Revolver. The maturity date for the Revolver is July 20, 2016. As of March 31, 2014, the outstanding balance of the Revolver was $175.0 million, with a weighted average interest rate of 1.65%, and is included in the Long-Term Debt on the Consolidated Balance Sheet. The Revolver is secured by accounts receivable and inventories with a carrying value of $528.4 million. The Company had $10.6 million of outstanding standby letters of credit as of March 31, 2014 and 2013, which reduces borrowing availability under the Revolver. See Note 5, Long-Term Debt, for additional comments related to the Revolver.
During 2014, the Company entered into some interim lease notes which financed down payments for various equipment orders at market rates. As of March 31, 2014, these interim notes had not been converted into operating leases since the equipment was not yet delivered. These notes, which total $12.3 million as of March 31, 2014, are included in notes payable in the accompanying Consolidated Balance Sheets. These notes are expected to be converted into operating leases within the next twelve months. Until then, they bear interest at an annual rate of 1.65%.
|
5. Long-Term Debt
|
||||||||
|
2014
|
2013
|
|||||||
|
(In thousands)
|
||||||||
|
Revolving credit facility,
|
||||||||
|
1.65% and 1.70%, due through 2017
|
$ | 175,000 | $ | 188,000 | ||||
|
Secured note payable to insurance company,
|
||||||||
|
8.03%, paid off in 2014
|
- | 38,138 | ||||||
|
Secured Industrial Revenue Development Bonds,
|
||||||||
|
3.23%, and 3.29%, due through 2029
|
22,630 | 22,630 | ||||||
|
Secured promissory note,
|
||||||||
|
6.98%, due through 2022
|
15,313 | 16,753 | ||||||
|
Secured promissory note,
|
||||||||
|
6.35%, due through 2020
|
3,731 | 4,303 | ||||||
|
Economic development note,
|
||||||||
|
2.00%, due through 2021
|
1,500 | - | ||||||
|
Other
|
342 | 362 | ||||||
| 218,516 | 270,186 | |||||||
|
Less current portion
|
2,277 | 40,170 | ||||||
| $ | 216,239 | $ | 230,016 | |||||
See Note 4, Short-Term Borrowings, for discussion of the Revolver.
The Company’s debt agreements, including the Revolver, contain covenants that restrict the Company’s ability to incur additional indebtedness, pay dividends on the Company’s capital stock, make other restricted payments, including investments, sell the Company’s assets, incur liens, transfer all or substantially all of the Company’s assets and enter into consolidations or mergers. The Company’s debt agreements also require the Company to meet certain financial covenants, including a minimum fixed charge coverage ratio. The Revolver also contains borrowing base requirements related to accounts receivable and inventories. These financial requirements and ratios generally become more restrictive over time and are subject to allowances for seasonal fluctuations. The most restrictive financial covenant in the debt agreements is the fixed charge coverage ratio within the Master Reimbursement Agreement with General Electric Commercial Finance, which relates to the Secured Industrial Revenue Development Bonds. In connection with the Company’s decision to adopt the LIFO method of inventory accounting, effective December 30, 2007, the Company executed amendments to its debt agreements, which enable the Company to compute its financial covenants as if the Company were on the FIFO method of inventory accounting. The Company was in compliance with all such financial covenants as of March 31, 2014.
The Company's debt agreements limit the payment of dividends and other distributions. There is an annual total distribution limitation of $50,000, less aggregate annual dividend payments totaling $23,000 that the Company presently pays on two outstanding classes of preferred stock.
The Company has four outstanding Industrial Revenue Development Bonds (“IRBs”), totaling $22.6 million that are secured by direct pay letters of credit. The interest rates shown for these IRBs in the table above reflect the costs of the direct pay letters of credit and amortization of other related costs of those IRBs. A Master Reimbursement Agreement with General Electric Commercial Finance, which provides for the direct pay letters of credit, expires in July 2016. In 2013, the Company reached an agreement to extend the term of its $5.1 million Wayne County Industrial Revenue Development Bonds included in the IRBs from June 1, 2012 to June 1, 2017.
The carrying value of assets pledged for secured debt, including the Revolver, is $650.2 million.
19
Notes to Consolidated Financial Statements
Debt repayment requirements for the next five fiscal years are (in thousands):
|
Years ending March 31:
|
||||
|
2015
|
$
|
2,277
|
||
|
2016
|
2,530
|
|||
|
2017
|
177,667
|
|||
|
2018
|
7,904
|
|||
|
2019
|
3,034
|
|||
|
Thereafter
|
25,104
|
|||
|
Total
|
$
|
218,516
|
||
6. Leases
The Company had no capital leases as of March 31, 2014 and 2013. The Company has operating leases expiring at various dates through 2025. Operating leases generally provide for early purchase options one year prior to expiration.
The following is a schedule, by year, of minimum operating lease payments due as of March 31, 2014 (in thousands):
|
Years ending March 31:
|
||
|
2015
|
$
|
36,759
|
|
2016
|
32,801
|
|
|
2017
|
28,431
|
|
|
2018
|
24,221
|
|
|
2019
|
19,315
|
|
|
2020-2025
|
33,647
|
|
|
Total minimum payment required
|
$
|
175,174
|
Lease expense in fiscal 2014, 2013 and 2012 was $43.9 million, $38.1 million and $38.3 million, respectively.
20
Notes to Consolidated Financial Statements
|
7. Income Taxes
|
||||||||||||
|
The Company files a consolidated federal and various state income tax returns. The provision for income taxes is as follows:
|
||||||||||||
|
2014
|
2013
|
2012
|
||||||||||
|
(In thousands)
|
||||||||||||
|
Current:
|
||||||||||||
|
Federal
|
$ | 7,238 | $ | 21,356 | $ | 4,193 | ||||||
|
State
|
123 | 3,629 | 704 | |||||||||
| 7,361 | 24,985 | 4,897 | ||||||||||
|
Deferred:
|
||||||||||||
|
Federal
|
(3,231 | ) | (2,770 | ) | 1,430 | |||||||
|
State
|
(567 | ) | (180 | ) | (62 | ) | ||||||
| (3,798 | ) | (2,950 | ) | 1,368 | ||||||||
|
Total income taxes
|
$ | 3,563 | $ | 22,035 | $ | 6,265 | ||||||
|
A reconciliation of the expected U.S. statutory rate to the effective rate follows:
|
||||||||||||
| 2014 | 2013 | 2012 | ||||||||||
|
Computed (expected tax rate)
|
35.0 |
%
|
35.0 |
%
|
35.0 | % | ||||||
|
State income taxes (net of federal tax benefit)
|
3.4 | 3.8 | 4.5 | |||||||||
|
State tax credits
|
(1.6 | ) | (0.8 | ) | (2.8 | ) | ||||||
|
Federal credits
|
(3.6 | ) | (0.2 | ) | (0.6 | ) | ||||||
|
Manufacturer’s deduction
|
(4.6 | ) | (3.4 | ) | (5.1 | ) | ||||||
|
(Reversal of) addition to uncertain tax positions
|
(0.8 | ) | 0.2 | 0.4 | ||||||||
|
State VDA/Nexus Changes
|
(1.7 | ) | - | - | ||||||||
|
Other permanent differences not deductible
|
0.5 | 0.1 | 0.7 | |||||||||
|
Change in valuation allowance
|
(2.1 | ) | - | - | ||||||||
|
Tax effect of pension contribution
|
0.4 | - | 2.2 | |||||||||
|
Other
|
(4.4 | ) | - | 1.5 | ||||||||
|
Effective income tax rate
|
20.5 |
%
|
34.7 |
%
|
35.8 | % | ||||||
The effective tax rate was 20.5% in 2014 and 34.7% in 2013. Of the 14.2 percentage point decrease in the effective tax rate for the year, the major contributors to this decrease are the following items, 1) with lower pre-tax earnings due in part to a large LIFO charge versus a credit in the prior year, the permanent items have a larger impact on the effective rate, 2) the manufacturers deduction is a higher percentage of current year earnings than the prior year, 3) the reversal of certain tax reserves related to New York State investment tax credit and 4) work opportunity credit, research and experimentation credit and fuel tax credit and miscellaneous permanent items.
21
Notes to Consolidated Financial Statements
The following is a summary of the significant components of the Company's deferred income tax assets and liabilities as of March 31:
|
2014
|
2013
|
|||||||
|
(In thousands)
|
||||||||
|
Deferred income tax assets:
|
||||||||
|
Future tax credits
|
$ | 3,042 | $ | 2,808 | ||||
|
Inventory valuation
|
3,353 | 2,893 | ||||||
|
Employee benefits
|
2,884 | 2,742 | ||||||
|
Insurance
|
1,244 | 3,422 | ||||||
|
Other comprehensive loss
|
7,194 | 14,416 | ||||||
|
Interest
|
138 | 118 | ||||||
|
Deferred gain on sale/leaseback
|
26 | 54 | ||||||
|
Prepaid revenue
|
1,118 | 1,619 | ||||||
|
Other
|
859 | 232 | ||||||
|
Severance
|
87 | 237 | ||||||
|
|
19,945 | 28,541 | ||||||
|
Deferred income tax liabilities:
|
||||||||
|
Property basis and depreciation difference
|
10,757 | 13,274 | ||||||
|
Pension
|
725 | 3,012 | ||||||
| 11,482 | 16,286 | |||||||
|
Valuation allowance - non-current
|
390 | 758 | ||||||
|
Net deferred income tax asset
|
$ | 8,073 | $ | 11,497 | ||||
Net current deferred income tax assets of $8.4 million and $9.4 million as of March 31, 2014 and 2013, respectively, are recognized in the Consolidated Balance Sheets. Also recognized are net non-current deferred income tax liabilities of $0.3 million as of March 31, 2014 and net non-current deferred income tax assets of $2.1 million as of March 31, 2013.
The Company has State tax credit carryforwards amounting to $1.4 million (California, net of Federal impact), $0.8 million (New York, net of Federal impact), and $0.8 million (Wisconsin, net of Federal impact), which are available to reduce future taxes payable in each respective state through 2022 (Wisconsin), through 2029 (New York), and through 2024 (California). The Company has performed the required assessment regarding the realization of deferred tax assets and at March 31, 2014, the Company has recorded a valuation allowance amounting to $0.4 million, which relates primarily to tax credit carryforwards which management has concluded it is more likely than not will not be realized in the ordinary course of operations. Although realization is not assured, management has concluded that it is more likely than not that the deferred tax assets for which a valuation allowance was determined to be unnecessary will be realized in the ordinary course of operations. The amount of net deferred tax assets considered realizable, however, could be reduced if actual future income or income taxes rates are lower than estimated or if there are differences in the timing or amount of future reversals of existing taxable or deductible temporary differences.
Current rules on the accounting for uncertainty on income taxes prescribe a minimum recognition threshold for a tax position taken or expected to be taken in a tax return that is required to be met before being recognized in the financial statements. Those rules also provide guidance on derecognition, measurement, classification, interest and penalties, accounting in interim periods, disclosure and transition. The Company classifies the liability for uncertain tax positions in other accrued expenses or other long-term liabilities depending on their expected settlement. The change in the liability for the years ended March 31, 2014 and 2013 consists of the following:
22
Notes to Consolidated Financial Statements
|
2014
|
2013
|
|||||||
|
(In thousands)
|
||||||||
|
Beginning balance
|
$ | 2,470 | $ | 2,350 | ||||
|
Tax positions related to current year:
|
||||||||
|
Additions
|
46 | 176 | ||||||
|
Tax positions related to prior years:
|
||||||||
|
Additions
|
- | 70 | ||||||
|
Reductions
|
(181 | ) | (45 | ) | ||||
|
Settlements
|
- | (81 | ) | |||||
|
Lapses in statues of limitations
|
(62 | ) | - | |||||
|
Balance as of March 31,
|
$ | 2,273 | $ | 2,470 | ||||
Included in the balances at March 31, 2014 and 2013 are $1.9 million and $1.9 million, respectively, of tax positions that are highly certain but for which there is uncertainty about the timing. Because of the impact of deferred tax accounting, other than interest and penalties, the disallowance of these positions would not impact the annual effective tax rate but would accelerate the payment of cash to the tax authority to an earlier period.
The Company recognizes interest and penalties accrued on unrecognized tax benefits as well as interest received from favorable settlements within income tax expense. During the years ended March 31, 2014 and 2013, the Company recognized approximately $0.0 million increase and $0.1 million decrease, respectively, in interest and penalties. As of March 31, 2014 and 2013, the Company had approximately $0.2 million and $0.2 million, respectively, of interest and penalties accrued associated with unrecognized tax benefits.
Although management believes that an adequate provision has been made for uncertain tax positions, there is the possibility that the ultimate resolution could have an adverse effect on the earnings of the Company. Conversely, if resolved favorably in the future, the related provisions would be reduced, thus having a positive impact on earnings. It is anticipated that audit settlements will be reached during 2015 with a state taxing authority that could have an impact on earnings. Due to the uncertainty of amounts and in accordance with its accounting policies, the Company has not recorded any potential impact of these settlements.
The federal income tax returns for years after March 31, 2010 are subject to examination.
23
Notes to Consolidated Financial Statements
8. Stockholders’ Equity
Preferred Stock — The Company has authorized three classes of preferred stock consisting of 200,000 shares of Six Percent (6%) Voting Cumulative Preferred Stock, par value $0.25 (“6% Preferred”); 30,000 shares of Preferred Stock Without Par Value to be issued in series by the Board of Directors, none of which are currently designated or outstanding; and 8,200,000 shares of Preferred Stock with $.025 par value, Class A, to be issued in series by the Board of Directors (“Class A Preferred”). The Board of Directors has designated four series of Class A Preferred including 10% Cumulative Convertible Voting Preferred Stock—Series A (“Series A Preferred”); 10% Cumulative Convertible Voting Preferred Stock—Series B (“Series B Preferred”); Convertible Participating Preferred Stock; and Convertible Participating Preferred Stock, Series 2003. A fifth series of Class A Preferred designated Convertible Participating Preferred Stock, Series 2006, was issued as part of consideration of the purchase price in the Signature Fruit acquisition and was converted to Class A Common Stock in May 2010.
The Convertible Participating Preferred Stock and Convertible Participating Preferred Stock, Series 2003 are convertible at the holders’ option on a one-for-one basis into shares of Class A Common Stock, subject to antidilution adjustments. These series of preferred stock have the right to receive dividends and distributions at a rate equal to the amount of any dividends and distributions declared or made on the Class A Common Stock. No dividends were declared or paid on this preferred stock in fiscal 2014, 2013 or 2012. In addition, these series of preferred stock have certain distribution rights upon liquidation. Upon conversion, shares of these series of preferred stock become authorized but unissued shares of Class A Preferred and may be reissued as part of another series of Class A Preferred. As of March 31, 2014, the Company has an aggregate of 6,451,309 shares of non-designated Class A Preferred authorized for issuance.
The Convertible Participating Preferred Stock has a liquidation preference of $12 per share and a stated value of $11.931 per share. There were 90,901 shares outstanding as of March 31, 2014 after conversions of 1,061 shares into Class A common Stock during the year. The Convertible Participating Preferred Stock, Series 2003 was issued as partial consideration of the purchase price in the Chiquita Processed Foods acquisition. The 967,742 shares issued in that 2003 acquisition were valued at $16.60 per share which represented the then market value of the Class A Common Stock into which the preferred shares were immediately convertible. This series has a liquidation preference of $15.50 per share and has 257,790 shares outstanding as of March 31, 2014 after conversion of 5,000 shares into Class A common Stock during the year. The Convertible Participating Preferred Stock, Series 2006 was issued as partial consideration of the purchase price in the Signature Fruit acquisition. The 1,025,220 shares issued in that acquisition were valued at $24.385 per share which represented the then market value of the Class A Common Stock into which the preferred shares were immediately convertible. All 1,025,220 shares were converted into Class A Common Stock in May 2010.
There are 407,240 shares of Series A Preferred outstanding as of March 31, 2014 which are convertible into one share of Class A Common Stock and one share of Class B Common stock for every 20 shares of Series A Preferred. There are 400,000 shares of Series B Preferred outstanding as of March 31, 2014 which are convertible into one share of Class A Common Stock and one share of Class B Common Stock for every 30 shares of Series B preferred. There are 200,000 shares of 6% Preferred outstanding as of March 31, 2014 which are callable at their par value at any time at the option of the Company. The Company paid dividends of $20,000 on the Series A and Series B Preferred and $3,000 on the 6% Preferred during each of fiscal 2014, 2013 and 2012.
Common Stock — The Class A Common Stock and the Class B Common Stock have substantially identical rights with respect to any dividends or distributions of cash or property declared on shares of common stock, and rank equally as to the right to receive proceeds on liquidation or dissolution of the Company after payment of the Company’s indebtedness and liquidation right to the holders of preferred shares. However, holders of Class B Common Stock retain a full vote per share, whereas the holders of Class A Common Stock have voting rights of 1/20th of one vote per share on all matters as to which shareholders of the Company are entitled to vote. During 2014, there were 108 shares, or $4,000 of Class B Common Stock issued in lieu of cash compensation under the Company's Profit Sharing Bonus Plan.
Unissued shares of common stock reserved for conversion privileges of designated non-participating preferred stock were 33,695 of both Class A and Class B as of March 31, 2014 and 2013. Additionally, there were 348,691 and 354,752 shares of Class A reserved for conversion of the Participating Preferred Stock as of March 31, 2014 and 2013, respectively.
Treasury Stock — During 2014, the Company repurchased $0.7 million or 20,186 shares of its Class A Common Stock. As of March 31, 2014, there is a total of $4.0 million or 150,710 shares of repurchased stock. These shares are not considered outstanding. The Company contributed $2.0 million or 66,756 treasury shares for the 401 (k) match described in Note 9 Retirement Plans. In addition, on August 30, 2012 the Company repurchased 864,334 shares of Class A Common Stock in a Board approved transaction outside of the Company's share repurchase program for $25.9 million. All shares were repurchased as Treasury Stock and are not considered outstanding.
24
9. Retirement Plans
The Company has a noncontributory defined benefit pension plan (the “Plan”) covering all employees who meet certain age-entry requirements and work a stated minimum number of hours per year. Annual contributions are made to the Plan sufficient to satisfy legal funding requirements.
The following tables provide a reconciliation of the changes in the Plan’s benefit obligation and fair value of plan assets over the two-year period ended March 31, 2014 and a statement of the unfunded status as of March 31, 2014 and 2013:
|
2014
|
2013
|
|||||||
|
(In thousands)
|
||||||||
|
Change in Benefit Obligation
|
||||||||
|
Benefit obligation at beginning of year
|
$ | 163,531 | $ | 140,570 | ||||
|
Service cost
|
7,752 | 6,988 | ||||||
|
Interest cost
|
7,592 | 7,265 | ||||||
|
Actuarial (gain) loss
|
(3,109 | ) | 13,828 | |||||
|
Benefit payments and expenses
|
(5,288 | ) | (5,120 | ) | ||||
|
Benefit obligation at end of year
|
$ | 170,478 | $ | 163,531 | ||||
|
Change in Plan Assets
|
||||||||
|
Fair value of plan assets at beginning of year
|
$ | 135,016 | $ | 116,798 | ||||
|
Actual gain on plan assets
|
22,922 | 20,338 | ||||||
|
Employer contributions
|
2,000 | 3,000 | ||||||
|
Benefit payments and expenses
|
(5,288 | ) | (5,120 | ) | ||||
|
Fair value of plan assets at end of year
|
$ | 154,650 | $ | 135,016 | ||||
|
Unfunded Status
|
$ | (15,828 | ) | $ | (28,515 | ) | ||
The unfunded status decreased by $12.7 million during 2014 reflecting the actual fair value of plan assets as of March 31, 2014 and the current unfunded liability based on the projected benefit obligation, which increased from $163.5 million to $170.5 million. This unfunded status decrease was recognized via the actual gain on plan assets and the decrease in accumulated other comprehensive income of $11.3 million after the income tax benefit of $7.2 million. Plan assets increased from $135.0 million as of March 31, 2013 to $154.7 million as of March 31, 2014 due to a continued recovery in market conditions and the $2.0 million contribution by the Company. The Company made this contribution to maintain our funding status at an acceptable level. The unfunded liability is reflected in other liabilities in the Consolidated Balance Sheets.
|
2014
|
2013
|
|||||||
|
(In thousands)
|
||||||||
|
Amounts Recognized in Accumulated Other
|
||||||||
|
Comprehensive Pre-Tax Loss
|
||||||||
|
Net loss
|
$ | (18,094 | ) | $ | (36,622 | ) | ||
|
Accumulated other comprehensive pre-tax loss
|
$ | (18,094 | ) | $ | (36,622 | ) | ||
|
Pension and
|
||||
|
post retirement plan
|
||||
|
adjustments, net
|
||||
|
of tax
|
||||
|
(In thousands)
|
||||
|
Accumulated Other Comprehensive Loss
|
||||
|
Balance at March 31, 2013
|
$ | (22,548 | ) | |
|
Other comprehensive gain before reclassifications
|
11,296 | |||
|
Reclassified from accumulated other comprehensive loss
|
- | |||
|
Net current period other comprehensive gain
|
11,296 | |||
|
Balance at March 31, 2014
|
$ | (11,252 | ) | |
25
Notes to Consolidated Financial Statements
|
The following table provides the components of net periodic benefit cost for the Plan for fiscal years 2014, 2013, and 2012:
|
||||||||||||
|
2014
|
2013
|
2012
|
||||||||||
|
(In thousands)
|
||||||||||||
|
Service cost
|
$ | 7,752 | $ | 6,988 | $ | 5,424 | ||||||
|
Interest cost
|
7,592 | 7,265 | 6,837 | |||||||||
|
Expected return on plan assets
|
(9,938 | ) | (8,603 | ) | (8,140 | ) | ||||||
|
Amortization of net loss
|
2,434 | 3,190 | 1,350 | |||||||||
|
Amortization of transition asset
|
- | - | (227 | ) | ||||||||
|
Net periodic benefit cost
|
$ | 7,840 | $ | 8,840 | $ | 5,244 | ||||||
The Plan’s accumulated benefit obligation was $152.2 million at March 31, 2014, and $146.2 million at March 31, 2013.
Prior service costs are amortized on a straight-line basis over the average remaining service period of active participants. Gains and losses in excess of 10% of the greater of the benefit obligation and the market-related value of assets are amortized over the average remaining service period of active participants.
The assumptions used to measure the Company’s benefit obligation and pension expense are shown in the following table:
|
2014
|
2013
|
|||||||
|
Discount rate - benefit obligation
|
4.85 | % | 4.70 | % | ||||
|
Discount rate - pension expense
|
4.70 | % | 5.10 | % | ||||
|
Expected return on plan assets
|
7.50 | % | 7.50 | % | ||||
|
Rate of compensation increase
|
3.00 | % | 3.00 | % | ||||
|
The Company's plan assets consist of the following:
|
||||||||||||
|
Target
|
Percentage of Plan
|
|||||||||||
|
Allocation
|
Assets at March 31,
|
|||||||||||
|
2015
|
2014
|
2013
|
||||||||||
|
Plan Assets
|
||||||||||||
|
Equity securities
|
99 | % | 99 | % | 99 | % | ||||||
|
Debt securities
|
- | - | - | |||||||||
|
Real estate
|
- | - | - | |||||||||
|
Cash
|
1 | 1 | 1 | |||||||||
|
Total
|
100 | % | 100 | % | 100 | % | ||||||
All securities, which are valued at fair market value, are considered to be level 1 due to their public active market.
Expected Return on Plan Assets
The expected long-term rate of return on Plan assets is 7.50%. The Company expects 7.50% to fall within the 40-to-50 percentile range of returns on investment portfolios with asset diversification similar to that of the Plan’s target asset allocation.
Investment Policy and Strategy
The Company maintains an investment policy designed to achieve a long-term rate of return, including investment income through dividends and equity appreciation, sufficient to meet the actuarial requirements of the Plan. The Company seeks to accomplish its return objectives by prudently investing in a diversified portfolio of public company equities with broad industry representation seeking to provide long-term growth consistent with the performance of relevant market indices, as well as maintain an adequate level of liquidity for pension distributions as they fall due. The strategy of being fully invested in equities has historically provided greater rates of return over extended periods of time. The Company’s gain on plan assets during 2014 was 17.0% as compared to the S&P 500 unaudited gain (including dividends) of 22.8%. Plan assets include Company common stock with a fair market value of $11.6 million as of March 31, 2014 and $11.6 million as of March 31, 2013.
26
Cash Flows
Expected contributions for fiscal year ending March 31, 2015 (in thousands):
|
Expected Employer Contributions
|
$
|
-
|
||
|
Expected Employee Contributions
|
-
|
|
Estimated future benefit payments reflecting expected future
|
||||
|
service for the fiscal years ending March 31 (in thousands):
|
||||
|
2015
|
$
|
5,860
|
||
|
2016
|
6,145
|
|||
|
2017
|
6,644
|
|||
|
2018
|
7,255
|
|||
|
2019
|
7,936
|
|||
|
2020-2023
|
50,277
|
|||
The Company also has employees’ savings 401(k) plans covering all employees who meet certain age-entry requirements and work a stated minimum number of hours per year. Participants may make contributions up to the legal limit. The Company’s matching contributions are discretionary. Costs charged to operations for the Company’s matching contributions amounted to $2.3 million, $1.7 million, and $1.4 million, in fiscal 2014, 2013, and 2012, respectively. In fiscal 2014, the matching contribution included $2.0 million of treasury stock and $0.1 million of cash match. The stock portion of the matching contribution is valued at current market value while the treasury stock is valued at cost.
Multi-employer Plan
The Company contributes to the Teamsters California State Council of Cannery and Food Processing Unions, International Brotherhood of Teamsters Pension Fund (Western Conference of Teamsters Pension Plan# 91-6145047/001) ("Teamsters Plan") under the terms of a collective-bargaining agreement with some of its Modesto, California employees. The term of the current collective bargaining agreement is June 1, 2012 through June 30, 2015.
For the fiscal years ended March 31, 2014 and March 31, 2013 contributions to the Teamsters Plan were $2.4 million and $2.4 million, respectively. The contributions to this plan are paid monthly based upon the number of hours worked by covered employees. They represent less than 5% of the total contributions received by this plan during the most recent plan year.
The risks of participating in multi-employer plans are different from single-employer plans in the following aspects: (a) assets contributed to a multi-employer plan by one employer may be used to provide benefits to employees of other participating employers, (b) if a participating employer stops contributing to the multi-employer plan, the unfunded obligations of the plan may be borne by the remaining participating employers and (c) if the Company chooses to stop participating in the plan, the Company may be required to pay a withdrawal liability based on the underfunded status of the plan.
The Teamsters Plan received a Pension Protection Act “green” zone status for the plan year ended January 1, 2014. The zone status is based on information the Company received from the plan and is certified by the plan’s actuary. Among other factors, plans in the green zone are at least 80 percent funded.
27
Notes to Consolidated Financial Statements
|
10. Fair Value of Financial Instruments
|
|||||||
|
The carrying amount and estimated fair values of the Company's debt are summarized as follows:
|
|||||||
|
2014
|
2013
|
||||||
|
Carrying
|
Estimated
|
Carrying
|
Estimated
|
||||
|
Amount
|
Fair Value
|
Amount
|
Fair Value
|
||||
|
(In thousands)
|
|||||||
|
Long-term debt, including
|
|||||||
|
current portion
|
$218,516 | $219,981 | $270,186 | $273,567 | |||
The estimated fair value for long-term debt is determined by the quoted market prices for similar debt (comparable to the Company’s financial strength) or current rates offered to the Company for debt with the same maturities which is Level 2 from the fair value hierarchy. Since quoted prices for identical instruments in active markets are not available (Level 1), the Company makes use of observable market based inputs to calculate fair value, which is Level 2.
11. Inventories
Effective December 30, 2007 (beginning of 4th quarter of Fiscal Year 2008), the Company changed its inventory valuation method from the lower of cost, determined under the FIFO method, or market to the lower of cost, determined under the LIFO method, or market. In the high inflation environment that the Company was experiencing, the Company believed that the LIFO inventory method was preferable over the FIFO method because it better compares the cost of current production to current revenue. The effect of LIFO was to reduce net earnings by $13.2 million in 2014, increase net earnings by $2.7 million in 2013 and reduce net earnings by $30.8 million in 2012, compared to what would have been reported using the FIFO inventory method. The reduction in earnings per share was $1.19 ($1.19 diluted) in 2014, increase in earnings per share was $0.24 ($0.24 diluted) in 2013, and the reduction in earnings per share was $2.53 ($2.52 diluted) in 2012. During 2014 and 2012, certain inventory quantities accounted for on the LIFO method were reduced, resulting in the liquidation of certain quantities carried at costs prevailing in prior years. The impact on net earnings of these liquidations was an increase of $4.8 million and $2.9 million during 2014 and 2012, respectively. The inventories by category and the impact of using the LIFO method are shown in the following table:
|
2014
|
2013
|
2012
|
||||||||||
|
(In thousands)
|
||||||||||||
|
Finished products
|
$ | 418,368 | $ | 445,278 | $ | 406,164 | ||||||
|
In process
|
16,056 | 18,107 | 24,451 | |||||||||
|
Raw materials and supplies
|
170,210 | 149,359 | 139,045 | |||||||||
| 604,634 | 612,744 | 569,660 | ||||||||||
|
Less excess of FIFO cost over LIFO cost
|
153,384 | 133,014 | 137,227 | |||||||||
|
Total inventories
|
$ | 451,250 | $ | 479,730 | $ | 432,433 | ||||||
12. Other Operating Income and Expense
Other operating income in 2014 included a gain of $2.9 million from a break-up fee earned as a result of the Company being named the stalking horse bidder in an attempt to acquire substantially all the operating assets of Allens, Inc. in a bankruptcy court supervised auction, a gain of $0.7 million from the sale of two aircraft and a gain of $0.1 million as a result of adjustments related to the purchase of the Sunnyside facility. The company also recorded a loss of $0.5 million on the disposal of a warehouse located in Sunnyside, Washington and a net gain of $0.2 million from the sale of other fixed assets.
Other operating income in 2013 included a gain of $1.9 million as a result of the estimated fair market value of the net assets acquired exceeding the purchase price of Sunnyside (see Note 2, Acquisitions). The Company also recorded a gain of $0.3 million from the sale of property located in Cambria, Wisconsin and a net loss of $0.3 million on the disposal of certain other fixed assets.
Other operating income in 2012 included a gain of $0.7 million from the sale of property located in LeSueur, MN and a gain of $0.1 million from the sale of other property.
28
13. Segment Information
The Company manages its business on the basis of two reportable segments — the primary segment is the packaging and sale of fruits and vegetables and secondarily, the packaging and sale of snack products. The Company markets its product almost entirely in the United States. Export sales represented 9.2%, 9.8%, and 9.4% of total sales in 2014, 2013, and 2012, respectively. In 2014, 2013, and 2012, the sale of Green Giant vegetables accounted for 13%, 13%, and 13% of net sales, respectively. “Other” in the table below represents activity related to can sales, trucking, seed sales, and flight operations.
|
Fruit and
|
||||||||||||||||
|
Vegetable
|
Snack
|
Other
|
Total
|
|||||||||||||
|
(In thousands)
|
||||||||||||||||
|
2014:
|
||||||||||||||||
|
Net sales
|
$ | 1,302,857 | $ | 11,496 | $ | 25,855 | $ | 1,340,208 | ||||||||
|
Operating income
|
21,063 | 872 | 1,669 | 23,604 | ||||||||||||
|
Interest expense, net
|
6,113 | 27 | 122 | 6,262 | ||||||||||||
|
Income tax expense
|
3,118 | 189 | 256 | 3,563 | ||||||||||||
|
Identifiable assets
|
761,078 | 3,770 | 4,005 | 768,853 | ||||||||||||
|
Capital expenditures
|
17,339 | - | 2,109 | 19,448 | ||||||||||||
|
Depreciation and amortization
|
21,842 | 394 | 1,045 | 23,281 | ||||||||||||
|
2013:
|
||||||||||||||||
|
Net sales
|
$ | 1,243,107 | $ | 11,357 | $ | 21,833 | $ | 1,276,297 | ||||||||
|
Operating income
|
70,313 | 174 | 447 | 70,934 | ||||||||||||
|
Interest expense, net
|
7,319 | 35 | 132 | 7,486 | ||||||||||||
|
Income tax expense
|
21,831 | 53 | 151 | 22,035 | ||||||||||||
|
Identifiable assets
|
791,643 | 4,038 | 2,775 | 798,456 | ||||||||||||
|
Capital expenditures
|
16,125 | - | 246 | 16,371 | ||||||||||||
|
Depreciation and amortization
|
22,146 | 404 | 701 | 23,251 | ||||||||||||
|
2012:
|
||||||||||||||||
|
Net sales
|
$ | 1,226,408 | $ | 11,730 | $ | 19,667 | $ | 1,257,805 | ||||||||
|
Operating income (loss)
|
25,955 | (714 | ) | 382 | 25,623 | |||||||||||
|
Interest expense, net
|
7,929 | 47 | 126 | 8,102 | ||||||||||||
|
Income tax expense (benefit)
|
6,398 | (247 | ) | 114 | 6,265 | |||||||||||
|
Identifiable assets
|
730,147 | 4,739 | 3,150 | 738,036 | ||||||||||||
|
Capital expenditures
|
25,636 | 22 | 1,767 | 27,425 | ||||||||||||
|
Depreciation and amortization
|
21,780 | 475 | 436 | 22,691 | ||||||||||||
The fruit and vegetable segment, consisting of GMOL, canned fruit and vegetables and frozen products, represented 99%, 99% and 99% of assets and 93%, 101% and 107% of pre-tax earnings in 2014, 2013 and 2012, respectively.
|
Classes of similar products/services:
|
2014
|
2013
|
2012
|
|||||||||
|
(In thousands)
|
||||||||||||
|
Net Sales:
|
||||||||||||
|
GMOL *
|
$ | 177,881 | $ | 165,684 | $ | 166,231 | ||||||
|
Canned vegetables
|
753,318 | 746,892 | 743,123 | |||||||||
|
Frozen *
|
107,109 | 84,935 | 96,870 | |||||||||
|
Fruit
|
264,549 | 245,596 | 220,184 | |||||||||
|
Snack
|
11,496 | 11,357 | 11,730 | |||||||||
|
Other
|
25,855 | 21,833 | 19,667 | |||||||||
|
Total
|
$ | 1,340,208 | $ | 1,276,297 | $ | 1,257,805 | ||||||
|
* GMOL includes frozen vegetables exclusively for GMOL.
|
||||||||||||
29
Notes to Consolidated Financial Statements
14. Legal Proceedings and Other Contingencies
In the ordinary course of its business, the Company is made a party to certain legal proceedings seeking monetary damages, including proceedings involving product liability claims, workers’ compensation along with other employee claims, tort and other general liability claims, for which it carries insurance, as well as patent infringement and related litigation. The Company is in a highly regulated industry and is also periodically involved in government actions for regulatory violations and other matters surrounding the manufacturing of its products, including, but not limited to, environmental, employee, and product safety issues. While it is not feasible to predict or determine the ultimate outcome of these matters, the Company does not believe that an adverse decision in any of these legal proceedings would have a material adverse impact on its financial position, results of operations, or cash flows.
In June 2010, the Company received a Notice of Violation of the California Safe Drinking Water and Toxic Enforcement Act of 1986, commonly known as Proposition 65, from the Environmental Law Foundation ("ELF"). This notice was made to the California Attorney General and various other government officials, and to 49 companies including Seneca Foods Corporation whom ELF alleges manufactured, distributed or sold packaged peaches, pears, fruit cocktail and fruit juice that contain lead without providing a clear and reasonable warning to consumers. Under California law, proper notice must be made to the State and involved firms at least 60 days before any suit under Proposition 65 may be filed by private litigants like ELF. That 60-day period has expired and to date neither the California Attorney General nor any appropriate district attorney or city attorney has initiated an action against the Company. However, private litigant ELF filed an action against the Company and 27 other named companies on September 28, 2011, in Superior Court of Alameda County, California, alleging violations of Proposition 65 and seeking various measures of relief, including injunctive and declaratory relief and civil penalties. The Company, along with the other named companies, vigorously defended the claim. A responsive answer was filed, the discovery process was completed and a trial on liability was held beginning in April of 2013 in accordance with court schedules. The trial was completed on May 16, 2013 and, on July 15, 2013 the judge issued a tentative and proposed statement of decision agreeing with the Company, and the other defendants, that the “safe harbor” defense had been met under the regulations relating to Proposition 65 and the Company will not be required to place a Proposition 65 warning label on the products at issue in the case. The trial decision was finalized and the decision was appealed by ELF with a filing dated October 3, 2013. The appeal is progressing in accordance with the schedule set by the California Court of Appeal, First Appellate District, Division One. The Company is unable to determine the scope or the likelihood of success of the appeal. The Company, along with other defendants are planning on vigorously defending the appeal filed by ELF. With the successful defense of the case, the remedies portion of the case was not litigated. So far, our portion of legal fees in defense of this action have been sizable, as would be expected with litigation resulting in trial, and the appeal, but have not had a material adverse impact on the Company’s financial position, results of operations, or cash flows. Additionally, in the ordinary course of its business, the Company is made party to certain legal proceedings seeking monetary damages, including proceedings invoking product liability claims, either directly or through indemnification obligations, and we are not able to predict the probability of the outcome or estimate of loss, if any, related to any such matter.
30
Notes to Consolidated Financial Statements
15. Plant Restructuring
During 2013, the Company implemented a product rationalization program and recorded a restructuring charge of $3.5 million for related equipment costs (contra fixed assets), lease impairment costs (net of realizable value), and certain inventory costs. During 2014, the Company adjusted the costs of the product rationalization program, started in 2013, by $0.5 million, mostly related to equipment costs. These charges are included under Plant Restructuring in the Consolidated Statements of Net Earnings.
During 2012, there were no material adjustments to Plant Restructuring.
The following table summarizes the restructuring and related asset impairment charges recorded and the accruals established during 2012, 2013 and 2014:
|
Long-Lived
|
||||||||
|
Asset
|
Other
|
|||||||
|
Severance
|
Charges
|
Costs
|
Total
|
|||||
|
(In thousands)
|
||||||||
|
Balance March 31, 2011
|
$
|
456
|
$
|
-
|
$
|
520
|
$
|
976
|
|
First-quarter charge to expense
|
54
|
-
|
-
|
54
|
||||
|
Second-quarter (credit) charge to expense
|
(19)
|
-
|
4
|
(15)
|
||||
|
Cash payments/write offs
|
(454)
|
-
|
(524)
|
(978)
|
||||
|
Balance March 31, 2012
|
37
|
-
|
-
|
37
|
||||
|
Third-quarter charge to expense
|
-
|
1,107
|
1,403
|
2,510
|
||||
|
Fourth-quarter charge to expense
|
-
|
109
|
878
|
987
|
||||
|
Cash payments/write offs
|
(17)
|
(42)
|
(1,974)
|
(2,033)
|
||||
|
Balance March 31, 2013
|
20
|
1,174
|
307
|
1,501
|
||||
|
First-quarter charge to expense
|
-
|
-
|
154
|
154
|
||||
|
Second-quarter charge to expense
|
-
|
341
|
6
|
347
|
||||
|
Cash payments/write offs
|
(10)
|
(1,515)
|
(467)
|
(1,992)
|
||||
|
Balance March 31, 2014
|
$
|
10
|
$
|
-
|
$
|
-
|
$
|
10
|
16. Certain Transactions
A small percentage (less than 1% in fiscal 2014, 2013 and 2012) of vegetables supplied to the Company’s New York packaging plants are grown by a director of Seneca Foods Corporation, which supplied the Company approximately $1.1 million, $1.2 million, and $0.8 million pursuant to a raw vegetable grower contract in fiscal 2014, 2013 and 2012, respectively. The Chairman of the Audit Committee reviewed the relationship and determined that the contract was negotiated at arm's length and on no more favorable terms than to other growers in the marketplace.
17. Subsequent Event
Subsequent to March 31, 2014, the Company purchased a 50% equity interest in Truitt Bros. Inc. ("Truitt"). The purchase agreement grants the Company the right to acquire the remaining 50% ownership of Truitt in the future under certain conditions. Truitt is known for its industry innovation related to packing shelf stable foods in trays, pouches and bowls. Truitt has two state-of-the-art plants located in Oregon and Kentucky.
31
Report of Independent Registered Public Accounting Firm
Board of Directors and Stockholders
Seneca Foods Corporation
Marion, New York
We have audited the accompanying consolidated balance sheets of Seneca Foods Corporation as of March 31, 2014 and 2013 and the related consolidated statements of net earnings, comprehensive income, stockholders’ equity, and cash flows for each of the three years in the period ended March 31, 2014. These financial statements are the responsibility of the Company’s management. Our responsibility is to express an opinion on these financial statements based on our audits.
We conducted our audits in accordance with the standards of the Public Company Accounting Oversight Board (United States). Those standards require that we plan and perform the audit to obtain reasonable assurance about whether the financial statements are free of material misstatement. An audit includes examining, on a test basis, evidence supporting the amounts and disclosures in the financial statements, assessing the accounting principles used and significant estimates made by management, as well as evaluating the overall financial statement presentation. We believe that our audits provide a reasonable basis for our opinion.
In our opinion, the consolidated financial statements referred to above present fairly, in all material respects, the financial position of Seneca Foods Corporation at March 31, 2014 and 2013, and the results of its operations and its cash flows for each of the three years in the period ended March 31, 2014 in conformity with accounting principles generally accepted in the United States of America.
We also have audited, in accordance with the standards of the Public Company Accounting Oversight Board (United States), Seneca Foods Corporation’s internal control over financial reporting as of March 31, 2014, based on criteria established in Internal Control — Integrated Framework (1992) issued by the Committee of Sponsoring Organizations of the Treadway Commission (COSO) and our report dated May 22, 2014 expressed an unqualified opinion thereon.
/s/BDO USA, LLP
Milwaukee, Wisconsin
May 22, 2014
32
Management's Annual Report on Internal Control
Over Financial Reporting
Our management is responsible for establishing and maintaining adequate internal control over the Company’s financial reporting (as defined in Rules 13a-15(f) and 15d-15(f) under the Exchange Act). Because of its inherent limitations, internal control over financial reporting may not prevent or detect all misstatements. Projections of any evaluation of effectiveness to future periods are subject to the risk that controls may become inadequate because of changes in conditions, or that the degree of compliance with the policies or procedures may deteriorate.
Our management assessed the effectiveness of the Company’s internal control over financial reporting as of March 31, 2014. In making this assessment, our management used the criteria set forth by the Committee of Sponsoring Organizations of the Treadway Commission (COSO) in Internal Control-Integrated Framework (1992). Based on our assessment, management believes that, as of March 31, 2014, our internal control over financial reporting is effective based on those criteria.
The Company’s independent registered public accountant has issued its report on the effectiveness of the Company’s internal control over financial reporting. The report appears on the next page.
33
Report of Independent Registered Public Accounting Firm on
Internal Control Over Financial Reporting
Board of Directors and Stockholders
Seneca Foods Corporation
Marion, New York
We have audited Seneca Foods Corporation’s internal control over financial reporting as of March 31, 2014, based on criteria established in Internal Control-Integrated Framework (1992) issued by the Committee of Sponsoring Organizations of the Treadway Commission (the COSO criteria). The Company’s management is responsible for maintaining effective internal control over financial reporting and for its assessment of the effectiveness of internal control over financial reporting, included in the Form 10-K, Management’s Annual Report on Internal Control Over Financial Reporting. Our responsibility is to express an opinion on the Company’s internal control over financial reporting based on our audit.
We conducted our audit in accordance with the standards of the Public Company Accounting Oversight Board (United States). Those standards require that we plan and perform the audit to obtain reasonable assurance about whether effective internal control over financial reporting was maintained in all material respects. Our audit included obtaining an understanding of internal control over financial reporting, assessing the risk that a material weakness exists, and testing and evaluating the design and operating effectiveness of internal control based on the assessed risk. Our audit also included performing such other procedures as we considered necessary in the circumstances. We believe that our audit provides a reasonable basis for our opinion.
A company’s internal control over financial reporting is a process designed to provide reasonable assurance regarding the reliability of financial reporting and the preparation of financial statements for external purposes in accordance with generally accepted accounting principles. A company’s internal control over financial reporting includes those policies and procedures that (1) pertain to the maintenance of records that, in reasonable detail, accurately and fairly reflect the transactions and dispositions of the assets of the company; (2) provide reasonable assurance that transactions are recorded as necessary to permit preparation of financial statements in accordance with generally accepted accounting principles, and that receipts and expenditures of the company are being made only in accordance with authorizations of management and directors of the company; and (3) provide reasonable assurance regarding prevention or timely detection of unauthorized acquisition, use, or disposition of the company’s assets that could have a material effect on the financial statements.
Because of its inherent limitations, internal control over financial reporting may not prevent or detect misstatements. Also, projections of any evaluation of effectiveness to future periods are subject to the risk that controls may become inadequate because of changes in conditions, or that the degree of compliance with the policies or procedures may deteriorate.
In our opinion, the Company maintained, in all material respects, effective internal control over financial reporting as of March 31, 2014, based on the COSO criteria.
We have also audited, in accordance with the standards of the Public Company Accounting Standards Board (United States), the consolidated balance sheets of Seneca Foods Corporation as of March 31, 2014 and 2013, and the related consolidated statements of net earnings, comprehensive income, stockholders’ equity and cash flows for each of the three years in the period ended March 31, 2014 and our report dated May 22, 2014 expressed an unqualified opinion thereon.
/s/ BDO USA, LLP
Milwaukee, Wisconsin
May 22, 2014
35
Shareholder Information and Quarterly Results
The Company’s common stock is traded on The NASDAQ Global Stock Market. The 8.7 million Class A outstanding shares and 2.0 million Class B outstanding shares are owned by 263 and 229 shareholders of record, respectively. The high and low closing prices of the Company’s common stock during each quarter of the past two years are shown below:
|
Class A:
|
2014
|
2013
|
||||||
|
Quarter
|
High
|
Low
|
High
|
Low
|
||||
|
First
|
$
|
35.80
|
$
|
29.81
|
$
|
26.90
|
$
|
21.42
|
|
Second
|
36.07
|
27.80
|
30.53
|
22.35
|
||||
|
Third
|
33.67
|
28.13
|
32.65
|
27.46
|
||||
|
Fourth
|
32.30
|
29.01
|
33.63
|
29.65
|
||||
|
Class B:
|
2014
|
2013
|
||||||
|
Quarter
|
High
|
Low
|
High
|
Low
|
||||
|
First
|
$
|
35.41
|
$
|
30.13
|
$
|
27.10
|
$
|
21.41
|
|
Second
|
36.29
|
27.42
|
30.60
|
24.46
|
||||
|
Third
|
33.33
|
29.30
|
32.50
|
27.40
|
||||
|
Fourth
|
32.08
|
29.68
|
33.40
|
28.90
|
||||
Common Stock Performance Graph
The graph below shows the cumulative, five year total return for the Company’s Common Stock compared with the NASDAQ Market Total U.S. Return Index (which includes the Company) and a peer group of companies (described below).
Performance data assumes that $100.00 was invested on March 31, 2009, in the Company’s Class A Common Stock, the NASDAQ Market, and the peer group. The data assumes the reinvestment of all cash dividends and the cash value of other distributions. Stock price performance shown in the graph is not necessarily indicative of future stock price performance. The companies in the former peer group are Hanover Foods Corporation, John B. Sanfilippo & Son Inc., Treehouse Foods, Inc. and Hain Celestial Group, Inc. The new peer group adds Fresh Del Monte and keeps all the members of the former peer group. The peer group members are in related food businesses, but not direct competitors in canning.
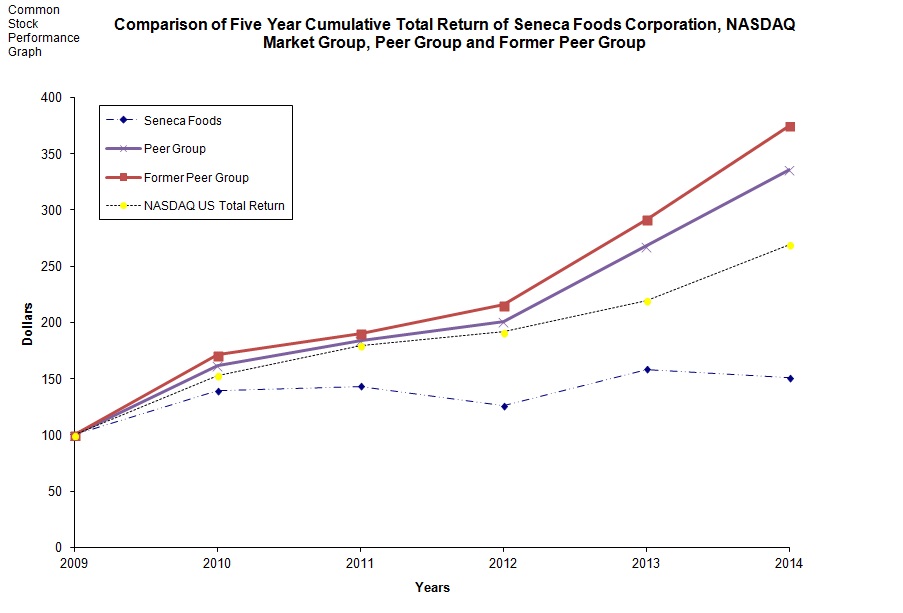
36
Shareholder Information and Quarterly Results
As of March 31, 2014, the most restrictive credit agreement limitation on the Company’s payment of dividends, to holders of Class A or Class B Common Stock is an annual total limitation of $50,000, reduced by aggregate annual dividend payments totaling $23,000 that the Company presently pays on two outstanding classes of preferred stock. Payment of dividends to common stockholders is made at the discretion of the Company’s Board of Directors and depends, among other factors, on earnings; capital requirements; and the operating and financial condition of the Company. The Company has not declared or paid a common dividend in many years.
Quarterly Results
The following is a summary of the unaudited interim results of operations by quarter:
|
First
|
Second
|
Third
|
Fourth
|
|||||||||||||
|
(In thousands, except per share data)
|
||||||||||||||||
|
Year ended March 31, 2014:
|
||||||||||||||||
|
Net sales
|
$ | 232,127 | $ | 336,628 | $ | 477,694 | $ | 293,759 | ||||||||
|
Gross margin
|
19,680 | 22,379 | 31,178 | 17,726 | ||||||||||||
|
Net earnings (loss)
|
1,347 | 6,603 | 6,846 | (1,017 | ) | |||||||||||
|
Basic earnings (loss) per common share
|
0.12 | 0.59 | 0.62 | (0.09 | ) | |||||||||||
|
Diluted earnings (loss) per common share
|
0.12 | 0.59 | 0.61 | (0.09 | ) | |||||||||||
|
Year ended March 31, 2013:
|
||||||||||||||||
|
Net sales
|
$ | 231,051 | $ | 317,593 | $ | 452,731 | $ | 274,922 | ||||||||
|
Gross margin
|
29,075 | 40,905 | 44,991 | 26,341 | ||||||||||||
|
Net earnings
|
8,191 | 14,521 | 14,790 | 3,911 | ||||||||||||
|
Basic earnings per common share
|
0.68 | 1.23 | 1.32 | 0.35 | ||||||||||||
|
Diluted earnings per common share
|
0.67 | 1.22 | 1.32 | 0.35 | ||||||||||||
Earnings for the fourth quarter have historically reflected adjustments of previously estimated raw material cost and production levels. Due to the dependence on the fruit and vegetable yields of the Company's food packaging, interim costing must be estimated.