Exhibit 99.1
|
|
FOR IMMEDIATE RELEASE
For more information contact: |

LTC REPORTS FOURTH QUARTER 2013 RESULTS
WESTLAKE VILLAGE, CALIFORNIA, February 20, 2014 — LTC Properties, Inc. (NYSE: LTC) (“LTC” or the “Company”) announces today operating results for the quarter ended December 31, 2013. The Company reported an increase of 13.8% in Funds from Operations (“FFO”) to $20.0 million in the quarter ended December 31, 2013, from $17.5 million in the comparable 2012 period. FFO per diluted common share was $0.57 for the quarters ended December 31, 2013 and 2012. Normalized FFO increased by 24.3% to $21.9 million in the fourth quarter of 2013 from $17.7 million in the fourth quarter of 2012. Normalized FFO per diluted common share was $0.62 and $0.57 for the quarters ended December 31, 2013 and 2012, respectively. The increase in FFO and normalized FFO was due to higher revenues from mortgage loan originations, acquisitions and completed property developments.
Net income available to common stockholders for the quarter ended December 31, 2013 was $13.7 million or $0.40 per diluted share as compared to $11.9 million or $0.39 per diluted share for the same period in 2012. The increase in net income available to common stockholders for the quarter ended December 31, 2013 was primarily due to mortgage loan originations, acquisitions and completed property developments offset by non-cash provisions for loan loss reserves related to a mortgage loan origination and the write-off of straight-line rent in accordance with Generally Accepted Accounting Principles.
Conference Call Information
The Company will conduct a conference call on Friday, February 21, 2014, at 8:00 a.m. Pacific Time, to provide commentary on the Company’s performance and operating results for the quarter ended December 31, 2013. The conference call is accessible by dialing 888-317-6016 (domestically) or 412-317-6016 (internationally). An audio replay of the conference call will be available from February 21 through March 7, 2014 and may be accessed by dialing 877-344-7529 (domestically) or 412-317-0088 (internationally) and entering conference number 10040227. The Company’s earnings release and supplemental information package for the current period will be available on the Company’s website at www.LTCProperties.com in the “Press Releases” and “Presentations” sections, respectively, of the “Investor Information” tab.
About LTC
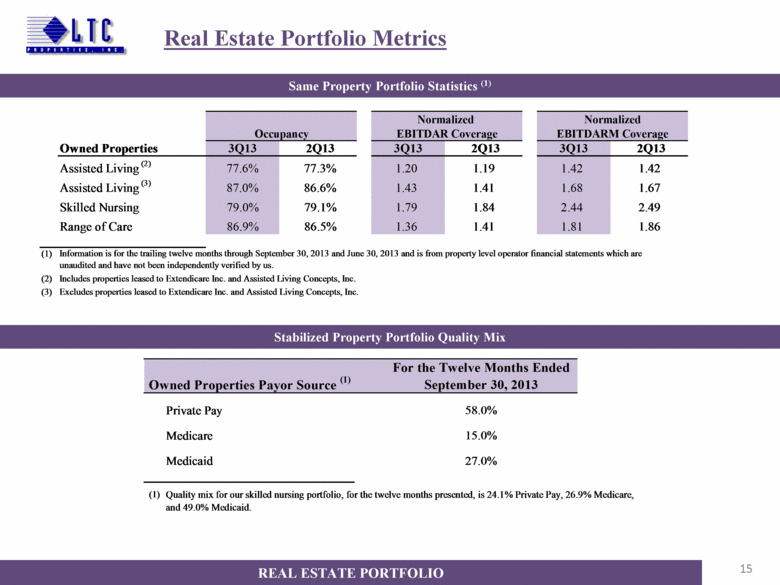
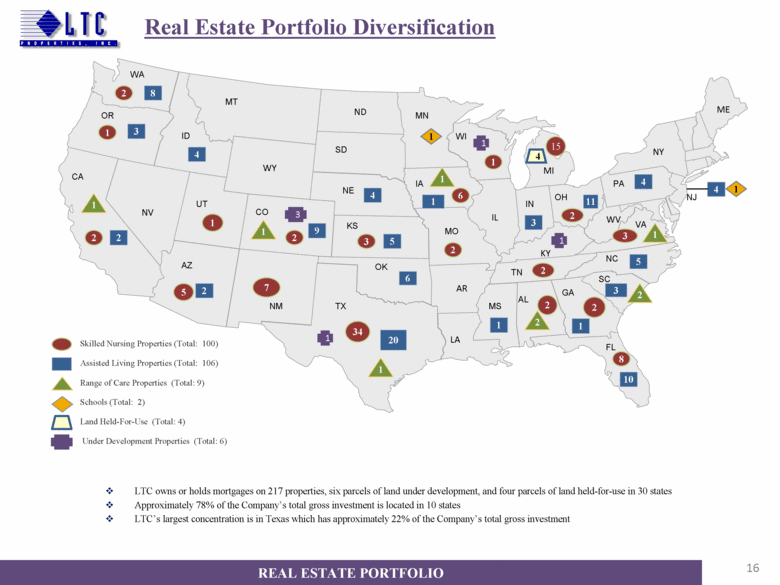
At December 31, 2013, LTC had 227 investments located in 30 states comprising of 100 skilled nursing properties, 106 assisted living properties, 9 range of care properties, two schools, six parcels of land under development and four parcels of land held-for-use. These properties are located in 30 states. Assisted living properties, independent living properties, memory care properties and combinations thereof are included in the assisted living property type. Range of care properties consist of properties providing skilled nursing and any combination of assisted living, independent living and/or memory care services. The Company is a self-administered real estate investment trust that primarily invests in senior housing and long-term care facilities through facility lease transactions, mortgage loans and other investments. For more information on LTC Properties, Inc., visit the Company’s website at www.LTCProperties.com.
Forward Looking Statements
This press release includes statements that are not purely historical and are “forward looking statements” within the meaning of Section 27A of the Securities Act of 1933, as amended, and Section 21E of the Securities Exchange Act of 1934, as amended, including statements regarding the Company’s expectations, beliefs, intentions or strategies regarding the future. All statements other than historical facts contained in this press release are forward looking statements. These forward looking statements involve a number of risks and uncertainties. Please see our most recent Annual Report on Form 10-K, our subsequent Quarterly Reports on Form 10-Q, and our other publicly available filings with the Securities and Exchange Commission for a discussion of these and other risks and uncertainties. All forward looking statements included in this press release are based on information available to the Company on the date hereof, and the Company assumes no obligation to update such forward looking statements. Although the Company’s management believes that the assumptions and expectations reflected in such forward looking statements are reasonable, no assurance can be given that such expectations will prove to have been correct. The actual results achieved by the Company may differ materially from any forward looking statements due to the risks and uncertainties of such statements.
LTC PROPERTIES, INC.
CONSOLIDATED STATEMENTS OF INCOME
(amounts in thousands, except per share amounts)
|
|
|
Three Months Ended |
|
Twelve Months Ended |
| ||||||||
|
|
|
2013 |
|
2012 |
|
2013 |
|
2012 |
| ||||
|
|
|
(unaudited) |
|
(audited) |
| ||||||||
|
Revenues: |
|
|
|
|
|
|
|
|
| ||||
|
Rental income |
|
$ |
25,259 |
|
$ |
22,844 |
|
$ |
98,166 |
|
$ |
86,022 |
|
|
Interest income from mortgage loans |
|
3,103 |
|
1,135 |
|
6,298 |
|
5,496 |
| ||||
|
Interest and other income |
|
231 |
|
146 |
|
510 |
|
964 |
| ||||
|
Total revenues |
|
28,593 |
|
24,125 |
|
104,974 |
|
92,482 |
| ||||
|
|
|
|
|
|
|
|
|
|
| ||||
|
Expenses: |
|
|
|
|
|
|
|
|
| ||||
|
Interest expense |
|
2,852 |
|
2,907 |
|
11,364 |
|
9,932 |
| ||||
|
Depreciation and amortization |
|
6,237 |
|
5,560 |
|
24,389 |
|
21,613 |
| ||||
|
Provisions (recovery) for doubtful accounts |
|
2,139 |
|
(78 |
) |
2,180 |
|
(101 |
) | ||||
|
General and administrative expenses |
|
2,715 |
|
3,212 |
|
11,636 |
|
10,732 |
| ||||
|
Total expenses |
|
13,943 |
|
11,601 |
|
49,569 |
|
42,176 |
| ||||
|
|
|
|
|
|
|
|
|
|
| ||||
|
Income from continuing operations |
|
14,650 |
|
12,524 |
|
55,405 |
|
50,306 |
| ||||
|
|
|
|
|
|
|
|
|
|
| ||||
|
Discontinued operations: |
|
|
|
|
|
|
|
|
| ||||
|
Net income from discontinued operations |
|
— |
|
254 |
|
805 |
|
1,005 |
| ||||
|
Gain on real estate assets, net |
|
— |
|
— |
|
1,605 |
|
16 |
| ||||
|
Net income from discontinued operations |
|
— |
|
254 |
|
2,410 |
|
1,021 |
| ||||
|
|
|
|
|
|
|
|
|
|
| ||||
|
Net income |
|
14,650 |
|
12,778 |
|
57,815 |
|
51,327 |
| ||||
|
Income allocated to non-controlling interests |
|
— |
|
(7 |
) |
— |
|
(37 |
) | ||||
|
Net income attributable to LTC Properties, Inc. |
|
14,650 |
|
12,771 |
|
57,815 |
|
51,290 |
| ||||
|
|
|
|
|
|
|
|
|
|
| ||||
|
Income allocated to participating securities |
|
(99 |
) |
(98 |
) |
(383 |
) |
(377 |
) | ||||
|
Income allocated to preferred stockholders |
|
(819 |
) |
(819 |
) |
(3,273 |
) |
(3,273 |
) | ||||
|
Net income available to common stockholders |
|
$ |
13,732 |
|
$ |
11,854 |
|
$ |
54,159 |
|
$ |
47,640 |
|
|
|
|
|
|
|
|
|
|
|
| ||||
|
Basic earnings per common share: |
|
|
|
|
|
|
|
|
| ||||
|
Continuing operations |
|
$ |
0.40 |
|
$ |
0.38 |
|
$ |
1.56 |
|
$ |
1.54 |
|
|
Discontinued operations |
|
$ |
0.00 |
|
$ |
0.01 |
|
$ |
0.07 |
|
$ |
0.03 |
|
|
Net income available to common stockholders |
|
$ |
0.40 |
|
$ |
0.39 |
|
$ |
1.64 |
|
$ |
1.58 |
|
|
|
|
|
|
|
|
|
|
|
| ||||
|
Diluted earnings per common share: |
|
|
|
|
|
|
|
|
| ||||
|
Continuing operations |
|
$ |
0.40 |
|
$ |
0.38 |
|
$ |
1.56 |
|
$ |
1.54 |
|
|
Discontinued operations |
|
$ |
0.00 |
|
$ |
0.01 |
|
$ |
0.07 |
|
$ |
0.03 |
|
|
Net income available to common stockholders |
|
$ |
0.40 |
|
$ |
0.39 |
|
$ |
1.63 |
|
$ |
1.57 |
|
|
|
|
|
|
|
|
|
|
|
| ||||
|
Weighted average shares used to calculate earnings per common share: |
|
|
|
|
|
|
|
|
| ||||
|
Basic |
|
34,555 |
|
30,297 |
|
33,111 |
|
30,238 |
| ||||
|
Diluted |
|
34,582 |
|
30,341 |
|
33,142 |
|
30,278 |
| ||||
NOTE: Computations of per share amounts from continuing operations, discontinued operations and net income are made independently. Therefore, the sum of per share amounts from continuing operations and discontinued operations may not agree with the per share amounts from net income allocable to common stockholders.
Supplemental Reporting Measures
FFO, adjusted FFO (“AFFO”), and Funds Available for Distribution (“FAD”) are supplemental measures of a real estate investment trust’s (“REIT”) financial performance that are not defined by U.S. generally accepted accounting principles (“GAAP”). Investors, analysts and the Company use FFO, AFFO and FAD as supplemental measures of operating performance. The Company believes FFO, AFFO and FAD are helpful in evaluating the operating performance of a REIT. Real estate values historically rise and fall with market conditions, but cost accounting for real estate assets in accordance with U.S. GAAP assumes that the value of real estate assets diminishes predictably over time. We believe that by excluding the effect of historical cost depreciation, which may be of limited relevance in evaluating current performance, FFO, AFFO and FAD facilitate like comparisons of operating performance between periods. Additionally the Company believes that normalized FFO, normalized AFFO and normalized FAD provide useful information because they allow investors, analysts and our management to compare the Company’s operating performance on a consistent basis without having to account for differences caused by unanticipated items.
FFO, as defined by the National Association of Real Estate Investment Trusts (“NAREIT”), means net income available to common stockholders (computed in accordance with U.S. GAAP) excluding gains or losses on the sale of real estate and impairment write-downs of depreciable real estate plus real estate depreciation and amortization, and after adjustments for unconsolidated partnerships and joint ventures. Normalized FFO represents FFO adjusted for certain items detailed in the reconciliations. The Company’s computation of FFO may not be comparable to FFO reported by other REITs that do not define the term in accordance with the current NAREIT definition or have a different interpretation of the current NAREIT definition from that of the Company; therefore, caution should be exercised when comparing our Company’s FFO to that of other REITs.
We define AFFO as FFO excluding the effects of straight-line rent and amortization of lease inducement. U.S. GAAP requires rental revenues related to non-contingent leases that contain specified rental increases over the life of the lease to be recognized evenly over the life of the lease. This method results in rental income in the early years of a lease that is higher than actual cash received, creating a straight-line rent receivable asset included in our consolidated balance sheet. At some point during the lease, depending on its terms, cash rent payments exceed the straight-line rent which results in the straight-line rent receivable asset decreasing to zero over the remainder of the lease term. By excluding the non-cash portion of straight-line rental revenue and amortization of lease inducement, investors, analysts and our management can compare AFFO between periods. Normalized AFFO represents AFFO adjusted for certain items detailed in the reconciliations.
We define FAD as AFFO excluding the effects of non-cash compensation charges. FAD is useful in analyzing the portion of cash flow that is available for distribution to stockholders. Investors, analysts and the Company utilize FAD as an indicator of common dividend potential. The FAD payout ratio, which represents annual distributions to common shareholders expressed as a percentage of FAD, facilitates the comparison of dividend coverage between REITs. Normalized FAD represents FAD adjusted for certain items detailed in the reconciliations.
While the Company uses FFO, normalized FFO, normalized AFFO and normalized FAD as supplemental performance measures of our cash flow generated by operations and cash available for distribution to stockholders, such measures are not representative of cash generated from operating activities in accordance with U.S. GAAP, and are not necessarily indicative of cash available to fund cash needs and should not be considered an alternative to net income available to common stockholders.
Reconciliation of FFO, Normalized FFO, Normalized AFFO and Normalized FAD
The following table reconciles each of net income, FFO and normalized FFO available to common stockholders, as well as normalized AFFO and normalized FAD (unaudited, amounts in thousands, except per share amounts):
|
|
|
Three Months Ended |
|
Twelve Months Ended |
| ||||||||
|
|
|
2013 |
|
2012 |
|
2013 |
|
2012 |
| ||||
|
|
|
|
|
|
|
|
|
|
| ||||
|
Net income available to common stockholders |
|
$ |
13,732 |
|
$ |
11,854 |
|
$ |
54,159 |
|
$ |
47,640 |
|
|
Add: Depreciation and amortization (continuing and discontinued operations) |
|
6,237 |
|
5,692 |
|
24,706 |
|
22,153 |
| ||||
|
Less: Gain on sale of real estate, net |
|
— |
|
— |
|
(1,605 |
) |
(16 |
) | ||||
|
FFO available to common stockholders |
|
19,969 |
|
17,546 |
|
77,260 |
|
69,777 |
| ||||
|
|
|
|
|
|
|
|
|
|
| ||||
|
Add: Non-cash interest related to earn-out liabilities |
|
— |
|
109 |
|
256 |
|
439 |
| ||||
|
Less: Non-recurring one-time items |
|
1,980 |
(1) |
— |
|
2,687 |
(2) |
(347 |
)(3) | ||||
|
Normalized FFO available to common stockholders |
|
21,949 |
|
17,655 |
|
80,203 |
|
69,869 |
| ||||
|
|
|
|
|
|
|
|
|
|
| ||||
|
Add (less): Non-cash rental income |
|
(790 |
) |
(900 |
) |
(3,295 |
) |
(2,604 |
) | ||||
|
Normalized adjusted FFO (AFFO) |
|
21,159 |
|
16,755 |
|
76,908 |
|
67,265 |
| ||||
|
|
|
|
|
|
|
|
|
|
| ||||
|
Add: Non-cash compensation charges |
|
541 |
|
464 |
|
2,134 |
|
1,819 |
| ||||
|
Normalized funds available for distribution (FAD) |
|
$ |
21,700 |
|
$ |
17,219 |
|
$ |
79,042 |
|
$ |
69,084 |
|
|
|
|
|
|
|
|
|
|
|
| ||||
| | |||||||||||||
|
(1) Comprised of a $1,244 provision for loan loss reserve on a $124,387 mortgage loan origination and an $869 non-cash write-off of straight-line rent offset by revenue from the Sunwest bankruptcy settlement distribution of $133. (2) Represents a one-time severance and accelerated restricted stock vesting charge of $707 related to the retirement of the Company’s former Senior Vice President, Marketing and Strategic Planning and (1) above. (3) Represents revenue from the Sunwest bankruptcy settlement distribution. | |||||||||||||
|
|
|
|
|
|
|
|
|
|
| ||||
|
Basic FFO available to common stockholders per share |
|
$ |
0.58 |
|
$ |
0.58 |
|
$ |
2.33 |
|
$ |
2.31 |
|
|
Diluted FFO available to common stockholders per share |
|
$ |
0.57 |
|
$ |
0.57 |
|
$ |
2.29 |
|
$ |
2.26 |
|
|
|
|
|
|
|
|
|
|
|
| ||||
|
Diluted FFO available to common stockholders |
|
$ |
20,788 |
|
$ |
18,470 |
|
$ |
80,916 |
|
$ |
73,464 |
|
|
Weighted average shares used to calculate diluted FFO per share available to common stockholders |
|
36,582 |
|
32,548 |
|
35,342 |
|
32,508 |
| ||||
|
|
|
|
|
|
|
|
|
|
| ||||
|
Basic normalized FFO available to common stockholders per share |
|
$ |
0.64 |
|
$ |
0.58 |
|
$ |
2.42 |
|
$ |
2.31 |
|
|
Diluted normalized FFO available to common stockholders per share |
|
$ |
0.62 |
|
$ |
0.57 |
|
$ |
2.37 |
|
$ |
2.26 |
|
|
|
|
|
|
|
|
|
|
|
| ||||
|
Diluted normalized FFO available to common stockholders |
|
$ |
22,867 |
|
$ |
18,579 |
|
$ |
83,859 |
|
$ |
73,556 |
|
|
Weighted average shares used to calculate diluted normalized FFO per share available to common stockholders |
|
36,778 |
|
32,548 |
|
35,342 |
|
32,508 |
| ||||
|
|
|
|
|
|
|
|
|
|
| ||||
|
Basic normalized AFFO per share |
|
$ |
0.61 |
|
$ |
0.55 |
|
$ |
2.32 |
|
$ |
2.22 |
|
|
Diluted normalized AFFO per share |
|
$ |
0.60 |
|
$ |
0.54 |
|
$ |
2.28 |
|
$ |
2.18 |
|
|
|
|
|
|
|
|
|
|
|
| ||||
|
Diluted normalized AFFO |
|
$ |
21,978 |
|
$ |
17,679 |
|
$ |
80,564 |
|
$ |
70,952 |
|
|
Weighted average shares used to calculate diluted normalized AFFO per share |
|
36,582 |
|
32,548 |
|
35,342 |
|
32,508 |
| ||||
|
|
|
|
|
|
|
|
|
|
| ||||
|
Basic normalized FAD per share |
|
$ |
0.63 |
|
$ |
0.57 |
|
$ |
2.39 |
|
$ |
2.28 |
|
|
Diluted normalized FAD per share |
|
$ |
0.61 |
|
$ |
0.56 |
|
$ |
2.34 |
|
$ |
2.24 |
|
|
|
|
|
|
|
|
|
|
|
| ||||
|
Diluted normalized FAD |
|
$ |
22,618 |
|
$ |
18,143 |
|
$ |
82,698 |
|
$ |
72,771 |
|
|
Weighted average shares used to calculate diluted normalized FAD per share |
|
36,778 |
|
32,548 |
|
35,342 |
|
32,508 |
| ||||
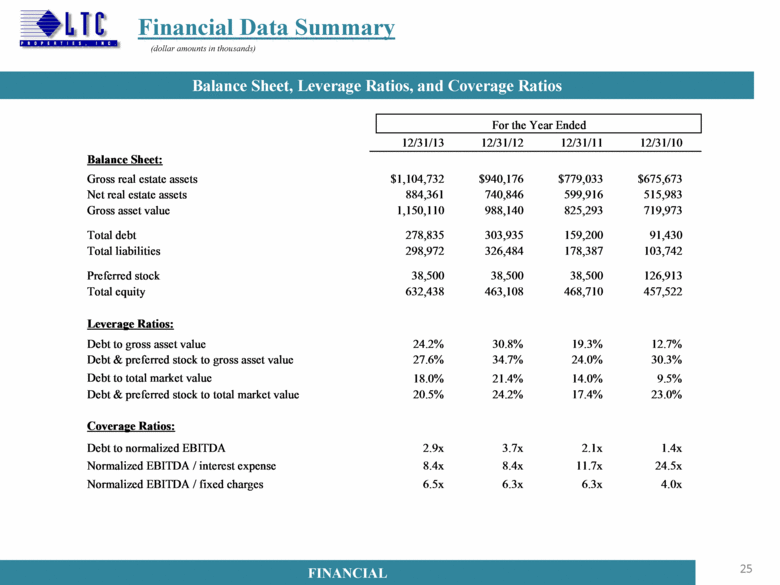
LTC PROPERTIES, INC.
CONSOLIDATED BALANCE SHEETS
(amounts in thousands, audited)
|
|
|
December 31, 2013 |
|
December 31, 2012 |
| ||
|
ASSETS |
|
|
|
|
| ||
|
Real estate investments: |
|
|
|
|
| ||
|
Land |
|
$ |
80,993 |
|
$ |
74,702 |
|
|
Buildings and improvements |
|
856,624 |
|
811,867 |
| ||
|
Accumulated depreciation and amortization |
|
(218,700 |
) |
(194,448 |
) | ||
|
Net real estate property |
|
718,917 |
|
692,121 |
| ||
|
Properties held-for-sale, net of accumulated depreciation and amortization: 2013 — $0; 2012 — $4,100 |
|
— |
|
9,426 |
| ||
|
Net real estate property |
|
718,917 |
|
701,547 |
| ||
|
Mortgage loans receivable, net of allowance for doubtful accounts: 2013 — $1,671; 2012 — $782 |
|
165,444 |
|
39,299 |
| ||
|
Real estate investments, net |
|
884,361 |
|
740,846 |
| ||
|
Other assets: |
|
|
|
|
| ||
|
Cash and cash equivalents |
|
6,778 |
|
7,191 |
| ||
|
Debt issue costs, net |
|
2,458 |
|
3,040 |
| ||
|
Interest receivable |
|
702 |
|
789 |
| ||
|
Straight-line rent receivable, net of allowance for doubtful accounts: 2013 — $1,541; 2012 — $1,513 |
|
29,760 |
|
26,766 |
| ||
|
Prepaid expenses and other assets |
|
6,756 |
|
7,542 |
| ||
|
Notes receivable |
|
595 |
|
3,180 |
| ||
|
Straight-line rent receivable and other assets related to properties held-for-sale, net of allowance for doubtful accounts: 2013 — $0; 2012 — $44 |
|
— |
|
238 |
| ||
|
Total assets |
|
$ |
931,410 |
|
$ |
789,592 |
|
|
|
|
|
|
|
| ||
|
LIABILITIES |
|
|
|
|
| ||
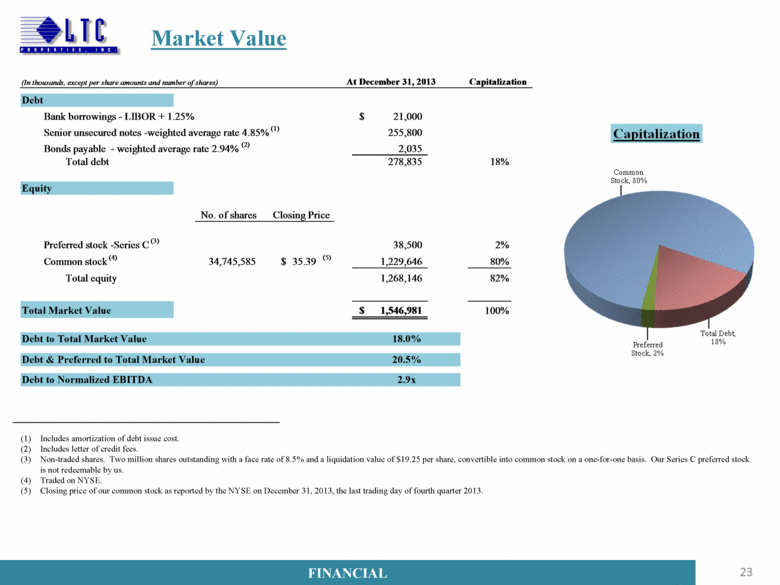
|
Bank borrowings |
|
$ |
21,000 |
|
$ |
115,500 |
|
|
Senior unsecured notes |
|
255,800 |
|
185,800 |
| ||
|
Bonds payable |
|
2,035 |
|
2,635 |
| ||
|
Accrued interest |
|
3,424 |
|
3,279 |
| ||
|
Earn-out liabilities |
|
— |
|
6,744 |
| ||
|
Accrued expenses and other liabilities |
|
16,713 |
|
12,165 |
| ||
|
Accrued expenses and other liabilities related to properties held-for-sale |
|
— |
|
361 |
| ||
|
Total liabilities |
|
298,972 |
|
326,484 |
| ||
|
|
|
|
|
|
| ||
|
EQUITY |
|
|
|
|
| ||
|
Stockholders’ equity: |
|
|
|
|
| ||
|
Preferred stock $0.01 par value; 15,000 shares authorized; shares issued and outstanding: 2013 — 2,000; 2012 — 2,000 |
|
38,500 |
|
38,500 |
| ||
|
Common stock: $0.01 par value; 60,000 shares authorized; shares issued and outstanding: 2013 — 34,746; 2012 — 30,544 |
|
347 |
|
305 |
| ||
|
Capital in excess of par value |
|
688,654 |
|
510,236 |
| ||
|
Cumulative net income |
|
781,848 |
|
724,033 |
| ||
|
Accumulated other comprehensive income |
|
117 |
|
152 |
| ||
|
Cumulative distributions |
|
(877,028 |
) |
(810,125 |
) | ||
|
Total LTC Properties, Inc. stockholders’ equity |
|
632,438 |
|
463,101 |
| ||
|
|
|
|
|
|
| ||
|
Non-controlling interests |
|
— |
|
7 |
| ||
|
Total equity |
|
632,438 |
|
463,108 |
| ||
|
Total liabilities and equity |
|
$ |
931,410 |
|
$ |
789,592 |
|