Exhibit 99.1
|
|
One World. One KEMET UBS Global Technology and Services Conference Presenter: William M. Lowe – EVP and Chief Financial Officer November 17, 2011 |
|
|
Cautionary Statement 2 Certain statements included herein contain forward-looking statements within the meaning of federal securities laws about KEMET Corporation's (the "Company") financial condition and results of operations that are based on management's current expectations, estimates and projections about the markets in which the Company operates, as well as management's beliefs and assumptions. Words such as "expects," "anticipates," "believes," "estimates," variations of such words and other similar expressions are intended to identify such forward-looking statements. These statements are not guarantees of future performance and involve certain risks, uncertainties and assumptions, which are difficult to predict. Therefore, actual outcomes and results may differ materially from what is expressed or forecasted in, or implied by, such forward-looking statements. Readers are cautioned not to place undue reliance on these forward-looking statements, which reflect management's judgment only as of the date hereof. The Company undertakes no obligation to update publicly any of these forward-looking statements to reflect new information, future events or otherwise. Factors that may cause actual outcome and results to differ materially from those expressed in, or implied by, these forward-looking statements include, but are not necessarily limited to, the following: (i) adverse economic conditions could impact our ability to realize operating plans if the demand for our products declines, and such conditions could adversely affect our liquidity and ability to continue to operate; (ii) adverse economic conditions could cause the write down of long-lived assets; (iii) an increase in the cost or a decrease in the availability of our principal raw materials; (iv) changes in the competitive environment; (v) uncertainty of the timing of customer product qualifications in heavily regulated industries; (vi) economic, political, or regulatory changes in the countries in which we operate; (vii) difficulties, delays or unexpected costs in completing the restructuring plan; (viii) inability to attract, train and retain effective employees and management; (ix) inability to develop innovative products to maintain customer relationships and offset potential price erosion in older products; (x) exposure to claims alleging product defects; (xi) the impact of laws and regulations that apply to our business, including those relating to environmental matters; (xii) volatility of financial and credit markets affecting our access to capital; (xiii) needing to reduce the total costs of our products to remain competitive; (xiv) potential limitation on the use of net operating losses to offset possible future taxable income; (xv) restrictions in our debt agreements that limit our flexibility in operating our business; and (xvi) additional exercise of the warrant by K Equity which could potentially result in the existence of a significant stockholder who could seek to influence our corporate decisions. |
|
|
Company Overview 3 KEMET Laboratories was founded by Union Carbide in 1919 U.S. listed company since 1992 Global manufacturer of tantalum, ceramic, film, aluminum, electrolytic & paper capacitors Offers 95% of dielectric solutions 23 manufacturing locations in 10 countries Manufacturing facilities in Mexico, China, Indonesia, Europe and the United States 10,400 employees worldwide (September 30, 2011) USA: 675 – Mexico: 5,070 Asia: 2,520 – Europe: 2,135 Global sales force covering the Americas, EMEA and Asia Recognized as the “Easy-to-Buy-From” company |

|
|
Capacitors: Industry Background Essential passive electronic components that store, filter, and regulate electrical energy Required in anything that has an electric current (from iPods to giant windmills) Come in various shapes and sizes with a myriad of technical specifications May be numerous in some devices (e.g., 3,000+ in some flat panel TVs, 700+ in some smartphones) 4 |

|
|
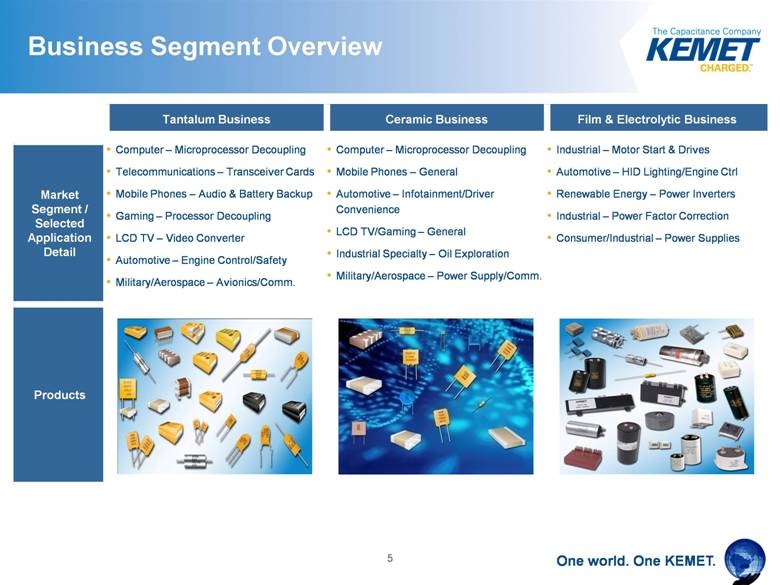
Business Segment Overview 5 Tantalum Business Ceramic Business Film & Electrolytic Business Market Segment / Selected Application Detail Products Computer – Microprocessor Decoupling Telecommunications – Transceiver Cards Mobile Phones – Audio & Battery Backup Gaming – Processor Decoupling LCD TV – Video Converter Automotive – Engine Control/Safety Military/Aerospace – Avionics/Comm. Computer – Microprocessor Decoupling Mobile Phones – General Automotive – Infotainment/Driver Convenience LCD TV/Gaming – General Industrial Specialty – Oil Exploration Military/Aerospace – Power Supply/Comm. Industrial – Motor Start & Drives Automotive – HID Lighting/Engine Ctrl Renewable Energy – Power Inverters Industrial – Power Factor Correction Consumer/Industrial – Power Supplies Products |
|
|
Global Reach and Low Cost Production Base KEMET’s facilities in Mexico, China and other international locations are among the most cost efficient in the world The Company’s manufacturing facilities also provide proximity to large and growing end markets Customers continue the trend of relocating production facilities to Asia 6 Major Sales Locations Production Base Includes two manufacturing facilities Includes three manufacturing facilities Headquarters and Manufacturing (1) Manufacturing (22) 75253.wor Sasso Marconi, Italy (3) Sasso Marconi, Italy (3) Sasso Marconi, Italy (3) Sasso Marconi, Italy (3) Sasso Marconi, Italy (3) Sasso Marconi, Italy (3) Sasso Marconi, Italy (3) Sasso Marconi, Italy (3) Sasso Marconi, Italy Kyustendil, Bulgaria Kyustendil, Bulgaria Kyustendil, Bulgaria Kyustendil, Bulgaria Kyustendil, Bulgaria Kyustendil, Bulgaria Kyustendil, Bulgaria Kyustendil, Bulgaria Kyustendil, Bulgaria Suzhou, China (2) Suzhou, China (2) Suzhou, China (2) Suzhou, China (2) Suzhou, China (2) Suzhou, China (2) Suzhou, China (2) Suzhou, China (2) Suzhou, China (2) Landsberg, Germany Landsberg, Germany Landsberg, Germany Landsberg, Germany Landsberg, Germany Landsberg, Germany Landsberg, Germany Landsberg, Germany Landsberg, Germany Farjestaden, Sweden Farjestaden, Sweden Farjestaden, Sweden Farjestaden, Sweden Farjestaden, Sweden Farjestaden, Sweden Farjestaden, Sweden Farjestaden, Sweden Farjestaden, Sweden Granna, Sweden Granna, Sweden Granna, Sweden Granna, Sweden Granna, Sweden Granna, Sweden Granna, Sweden Granna, Sweden Granna, Sweden Anting, China Anting, China Anting, China Anting, China Anting, China Anting, China Anting, China Anting, China Anting, China Nantong, China Nantong, China Nantong, China Nantong, China Nantong, China Nantong, China Nantong, China Nantong, China Nantong, China Northampton, England Northampton, England Northampton, England Northampton, England Northampton, England Northampton, England Northampton, England Northampton, England Northhampton, England Weymouth, United Kingdom Weymouth, United Kingdom Weymouth, United Kingdom Weymouth, United Kingdom Weymouth, United Kingdom Weymouth, United Kingdom Weymouth, United Kingdom Weymouth, United Kingdom Weymouth, United Kingdom Vergato, Italy (3) Vergato, Italy (3) Vergato, Italy (3) Vergato, Italy (3) Vergato, Italy (3) Vergato, Italy (3) Vergato, Italy (3) Vergato, Italy (3) Vergato, Italy Monghidoro, Italy (3) Monghidoro, Italy (3) Monghidoro, Italy (3) Monghidoro, Italy (3) Monghidoro, Italy (3) Monghidoro, Italy (3) Monghidoro, Italy (3) Monghidoro, Italy (3) Monghidoro, Italy Evora, Portugal Evora, Portugal Evora, Portugal Evora, Portugal Evora, Portugal Evora, Portugal Evora, Portugal Evora, Portugal Evora, Portugal Matamoros, Mexico (1) Matamoros, Mexico (1) Matamoros, Mexico (1) Matamoros, Mexico (1) Matamoros, Mexico (1) Matamoros, Mexico (1) Matamoros, Mexico (1) Matamoros, Mexico (1) Matamoros, Mexico Greenville, South Carolina Greenville, South Carolina Greenville, South Carolina Greenville, South Carolina Greenville, South Carolina Greenville, South Carolina Greenville, South Carolina Greenville, South Carolina Greenville, South Carolina Suomussalmi, Finland Suomussalmi, Finland Suomussalmi, Finland Suomussalmi, Finland Suomussalmi, Finland Suomussalmi, Finland Suomussalmi, Finland Suomussalmi, Finland Suomussalmi, Finland Ciudad Victoria, Mexico Ciudad Victoria, Mexico Ciudad Victoria, Mexico Ciudad Victoria, Mexico Ciudad Victoria, Mexico Ciudad Victoria, Mexico Ciudad Victoria, Mexico Ciudad Victoria, Mexico Ciudad Victoria, Mexico Monterrey, Mexico (1) Monterrey, Mexico (2) Monterrey, Mexico (2) Monterrey, Mexico (2) Monterrey, Mexico (2) Monterrey, Mexico (2) Monterrey, Mexico (2) Monterrey, Mexico (2) Monterrey, Mexico (1) Batam, Indonesia Batam, Indonesia Batam, Indonesia Batam, Indonesia Batam, Indonesia Batam, Indonesia Batam, Indonesia Batam, Indonesia Batam, Indonesia America's Asia Wilmington, MA Beijing, China West Chester, PA Shanghai, China Carmel, IN Shenzhen, China Shaumburg, IL Taipei, Taiwan Lake Mary, FL Hong Kong Ft Lauderdale, FL Bangalore, India Milpitas, CA Singapore Guadalajara, Mexico Penang, Malaysia EMEA Landsberg, Germany Rome, Italy Geneva, Switzerland Madrid, Spain Paris, France Rainhill, UK Coatbridge, UK Bishop's Stortford, UK Dortmund, Germany Espoo, Finland Knoxville, TN |

|
|
Market Overview |

|
|
Q2 FY12 Revenue 8 Dist 43% OEM 45% EMS 12% Channel Q2 FY12 |

|
|
Strong Customer Relationships 9 KEMET’s emphasis on quality, diversified customer base and established industry presence spanning over ninety years creates advantages in meeting the needs of the OEM, EMS and Distribution channels Customer base includes nearly all of the world’s major electronics OEMs, EMS companies and ODMs Won multiple awards, including 2011 Supplier of the Year Award” (TTI, Inc. and Arrow Electronics), “Exceptional Sales Performance Award” for 2010 (Digi-Key), “Outstanding Performance Award” (Sanmina-SCI), and 2009 Innovision Award for Technology Development Extensive network of global Distribution partners Distribution EMS OEM |

|
|
Robust and Growing Presence in Specialty Products 10 Specialty products represent higher margin business which generally require longer product design cycles but which also benefit from longer product lifecycles and greater servicing needs In recent years, KEMET has put more focus on growing market share in the specialty markets, including: alternative energy, extreme environments, medical, and military/aerospace In August 2009, KEMET was selected as one of thirty companies to receive a grant from the Department of Energy Alternative Energy Extreme Environment (e.g., High Temp, Vibration) Energy Exploration (e.g., Gas, Oil, Geothermal) Specialty Automotive (e.g., Under-Hood, Safety, Electric Drive Vehicle – “EDV”) Lighting Medical Military/Aerospace Telecom Infrastructure Power Supplies High Reliability (Long-life) Low ESR/ESL (Lower Energy Consumption and Higher Efficiency) Resistant to Environmental Stimuli (Heat, Vibration, Fluids) Non-Standard Configurations (Array, Low Profile, Case Size/Footprint) High Voltage High Temperature (>125°C) High Frequency (>1 Ghz) Specialty Products Attributes Targeted Specialty Markets KEMET is focusing on specialty markets as its primary areas of growth given the higher margin profile, recurring revenue potential and increased end market visibility |

|
|
Alternative Energy Products & Facilities |

|
|
GREEN ENERGY Potential Markets Electric Drive Vehicles Wind Solar Thermal Tidal Storage Smart Grid Efficiency |

|
|
GREEN ENERGY Customer Examples |

|
|
Simpsonville, South Carolina – New Manufacturing Facility 14 |

|
|
15 |

|
|
Walking the Talk “Greening of Greenville” 16 |

|
|
Acquisition and Restructuring Initiatives |

|
|
KFM Foil Facility – Knoxville, TN 18 |
|
|
KEMET Foil Manufacturing Acquisition in June 2011 Foil Plant now fully integrated with KEMET Secured long-term supply of quality formed aluminum foil to support sustainable business growth Vertically integrated to assure long-term cost control and profitability 19 |
|
|
Site grading was completed in August, 2011 Foundations in place, structural steel starts in November Building to be “dried-in” by Jan 1, 2012 Manufacturing equipment installation starts in May, 2012 Skopje Macedonia- In Progress |
|
|
Making Africa Work |
|
|
Mechanized Mine Operations 22 |

|
|
Making Africa Work 23 First ore shipped from the DRC in September All activities consistent with current SEC Dodd-Frank Section 1502 KEMET publically commits to OECD Due Diligence Guidance pilot to improve guidance protocols for Conflict Minerals KEMET among leading companies to assure continuous improvements of quality of life in the DRC SEC Roundtable on 10/18 discusses Dodd-Frank Section 1502 in support of finalizing rule in the near future KEMET represented at meeting Industry concerns regarding construction of rule discussed |
|
|
Financial Overview |

|
|
Financial Profile 25 Commentary Total Debt (1) and Total Cash (2) LTM Adjusted EBITDA LTM Revenue Note: Dollars in millions. Fiscal year ends March 31. Debt amounts represent face value of debt. Cash excludes long term restricted cash Total debt has decreased by $143 million (~35%) from FYE 2008 through FQ2’12 Continued cash build to manage debt maturities and to provide operational flexibility (100% increase from FYE’08 to FQ2’12) $146 $177 $196 $207 $196 $0 $50 $100 $150 $200 $250 FQ2'11 FQ3'11 FQ4'11 FQ1'12 FQ2'12 $413 $333 $284 $278 $270 $81 $39 $79 $152 $164 $0 $100 $200 $300 $400 $500 FYE'08 FYE'09 FYE'10 FYE'11 FQ2'12 Debt (1) Cash $905 $970 $1,018 $1,065 $1,082 $0 $200 $400 $600 $800 $1,000 $1,200 FQ2'11 FQ3'11 FQ4'11 FQ1'12 FQ2'12 Tantalum Ceramic Film & Elect. |

|
|
Cash Position 26 $59.8 $68.8 $81.4 $68.0 $119.7 $130.0 $154.4 $136.4 $165.9 $0 $20 $40 $60 $80 $100 $120 $140 $160 $180 $200 FQ2'10 FQ3'10 FQ4'10 FQ1'11 FQ2'11 FQ3'11 FQ4'11 FQ1'12 FQ2'12 Quarterly Cash Position ( in millions ) Unrestricted Restricted |
|
|
Robust Operating Trends 27 Quarterly Adjusted EBITDA Revenue and Adjusted Gross Margin Adj. Gross Margin % 20.4% 25.0% 28.1% 27.4% 25.1% 27.5% 23.5% Adj. EBITDA - % of sales 12.0% 18.5% 21.5% 20.1% 17.0% 19.4% 15.9% FQ2'11 FQ3'11 FQ4'11 FQ1'12 FQ2’12 Basic 27,092 28,295 37,127 39,452 44,370 Diluted 51,194 51,960 52,293 52,338 52,230 Weighted-average shares outstanding (in thousands) $213.0 $243.8 $248.6 $264.7 $261.5 $289.9 $265.5 $43.4 $60.9 $69.8 $72.6 $65.6 $79.4 $62.4 $0 $10 $20 $30 $40 $50 $60 $70 $80 $90 $100 $0 $50 $100 $150 $200 $250 $300 FQ4'10 FQ1'11 FQ2'11 FQ3'11 FQ4'11 FQ1'12 FQ2'12 Revenue Adjusted Gross Margin |

|
|
Balance Sheet 28 Notes: Includes long term restricted cash of $2.2M which is reported in Other assets in the FQ2’12 10-Q. Days sales outstanding defined as latest period Trade AR balance divided by annualized latest quarter sales times 365. Inventory turns defined as annualized latest quarter Cost of sales divided by latest period inventory balance. Days payable outstanding defined as latest period AP balance divided by annualized latest quarter Cost of sales times 365. Defined as Trade AR + Inventory – AP, calculated using annualized FQ2’12 sales of $265.5 million. LTM Adjusted EBITDA of $196 million calculated for the twelve months ended September 2011. Total debt equals face value of total debt of $270 million. $38 million represents face value of convertible notes, which are puttable in November 2011 at 100% of the principal amount. $50.0 million revolving credit facility represented by dotted line since it is currently undrawn. $230 million represents face value of 10.5% senior notes. ($ in millions) 9/30/2011 9/30/2011 Assets Liabilities & Stockholders' Equity Cash & Cash Equivalents 127.2 $ Current portion of long-term debt 37.7 $ Acounts receivable, net 114.5 Accounts payable 74.4 Inventories, net 224.6 Accrued expenses and other payables 80.1 Restricted cash (1) 38.7 Total current liabilities 192.2 Prepaid expenses & other current assets 34.6 Total current assets 539.6 Long-term debt 229.6 PP&E 310.0 Other non-current obligations 51.8 Intangible assets 21.3 Deferred income taxes 8.5 Other assets 10.8 Total stockholders' equity 399.5 Total assets 881.7 $ Total liabilities and stockholders' equity 881.7 $ Metrics DSO (2) 39 Inventory turns (3) 3.6 DPO (4) 34 Working capital as a % of sales (5) 24.9% Total debt/LTM adjusted EBITDA (6) 1.4x $38 $50 $230 $0 $100 $200 $300 2011 2012 2013 2014 2015 2016 2017 2018 Debt Maturity Profile (7) 2.25% Convertible Notes Revolver 10.5% Senior Notes |

|
|
Final Comments |

|
|
Looking Ahead 30 Still expect a growing total overall market 2011-2015 Both short & long-term impact on the industry from the Thailand floods unknown at this time U.S. and European Automotive markets remain strong driven by electronic content Military continues to require smart systems even during times of cutbacks Smart grid will continue to grow Device portability and mobile monitoring growing in developing countries Alternative energy and Green technologies provide growth opportunities in many areas Inorganic growth possibilities in addition to organic growth- Fragmented industry Vertical integration possible |

|
|
One world. One KEMET. 31 |

|
|
Questions One World One Brand One Strategy One Focus One Team One KEMET 32 |
|
|
Appendix GAAP to Non-GAAP Reconciliations |

|
|
Adjusted EBITDA Reconciliation to Net Income (Loss) 34 (Amounts in thousands) LTM FQ2'11 LTM FQ3'11 LTM FQ4'11 LTM FQ1'12 LTM FQ2'12 Net income (loss) 13,350 $ 42,296 $ 63,044 $ 114,992 $ 94,399 $ Adjustments: Income tax expense 4,162 4,880 2,704 3,160 4,614 Interest expense, net 28,330 28,638 29,957 29,877 29,878 Depreciation and amortization expense 55,796 54,756 52,932 49,581 47,301 Loss on early extinguishment of debt 38,248 38,248 38,248 - - Increase in value of warrant - - - - - Restructuring charges 12,026 11,806 7,171 6,404 5,706 Plant startup costs - - - - 718 Write down of long lived assets 656 - - - - Foreign exchange transaction (gain) loss (2,938) (1,715) (2,888) (4,283) (213) Stock-based compensation 727 988 1,783 2,825 3,476 Gain on sales and disposals of assets (2,696) (2,907) (1,261) (1,473) 257 Acquisitions integration costs - - - - - ERP integration costs 655 1,257 1,915 2,840 4,383 Gain on licensing of patents (2,000) (2,000) (2,000) (2,000) - Acquisition related fees - - - 610 610 Inventory write-down - - 2,991 2,991 2,991 Debt and stock registration related fees - 950 1,531 1,735 1,812 Total adjustments 132,966 134,901 133,083 92,267 101,533 Adjusted EBITDA 146,316 $ 177,197 $ 196,127 $ 207,259 $ 195,932 $ |

|
|
Adjusted Gross Margin Reconciliation to Gross Margin 35 ($ in thousands) Mar-10 Jun-10 Sep-10 Dec-10 Mar-11 Jun-11 Sep-11 Net sales 212,980 $ 243,794 $ 248,588 $ 264,654 $ 261,452 $ 289,856 $ 265,514 $ Gross margin $ 43,424 $ 60,908 $ 69,718 $ 72,522 $ 62,494 $ 79,352 $ 62,195 Adjustments: Stock-based compensation 20 38 32 56 90 249 206 Inventory write downs - - - - 2,991 - - Adjusted gross margin 43,444 $ 60,946 $ 69,750 $ 72,578 $ 65,575 $ 79,601 $ 62,401 $ Adjusted gross margin % 20.4% 25.0% 28.1% 27.4% 25.1% 27.5% 23.5% For the Quarters Ended |
|
|
Adjusted EBITDA Reconciliation to Net Income (Loss) 36 (Amounts in thousands) FQ3'10 FQ4'10 FQ1'11 FQ2'11 FQ3'11 FQ4'11 FQ1'12 FQ2'12 Net income (loss) (1,779) $ 317 $ (20,099) $ 34,911 $ 27,167 $ 21,065 $ 31,849 $ 14,318 $ Adjustments: Income tax expense (benefit) (93) 2,387 1,275 593 625 211 1,731 2,047 Interest expense, net 7,420 6,223 7,437 7,250 7,728 7,542 7,357 7,251 Depreciation and amortization expense 13,701 13,453 14,510 14,132 12,661 11,629 11,159 11,852 (Gain) loss on early extinguishment of debt - - 38,248 - - - - - Net foreign exchange (gain) loss 562 (2,093) 1,272 (2,679) 1,785 (3,266) (123) 1,391 Stock-based compensation 168 77 149 333 429 872 1,191 984 (Gain) loss on sales and disposals of assets 240 (1,501) 335 (1,770) 29 145 123 (40) Increase in value of warrant - - - - - - - - Restructuring charges 1,322 6,609 1,792 2,303 1,102 1,974 1,025 1,605 Plant startup costs - - - - - - - 718 Write down of long lived assets 656 - - - - - - - ERP integration costs - - 280 375 602 658 1,205 1,918 Gain on licensing of patents - - - (2,000) - - - - Acquisition related fees - - - - - - 610 - Inventory write-downs - - - - - 2,991 - - Debt and stock registration related fees - - - - 950 581 204 77 Total adjustments 23,976 25,155 65,298 18,537 25,911 23,337 24,482 27,803 Adjusted EBITDA 22,197 $ 25,472 $ 45,199 $ 53,448 $ 53,078 $ 44,402 $ 56,331 $ 42,121 $ |
|
|
Adjusted Net Income Reconciliation to Net Income (Loss) 37 (Amounts in thousands, except per share data) FQ4'10 FQ1'11 FQ2'11 FQ3'11 FQ4'11 FQ1'12 FQ2'12 Net income (loss) 317 $ (20,099) $ 34,911 $ 27,167 $ 21,065 $ 31,849 $ 14,318 $ Adjustments: Foreign exchange transaction (gain) loss (2,093) 1,272 (2,679) 1,785 (3,266) (123) 1,391 Stock-based compensation 77 149 333 429 872 1,191 984 Restructuring charges 6,609 1,792 2,303 1,102 1,974 1,025 1,605 Plant startup costs - - - - - 718 Amortization included in interest expense 3,806 1,924 830 1,210 966 1,044 1,012 (Gain) loss on sales and disposals of assets (1,501) 335 (1,770) 29 145 123 (40) Loss on early extinguishment of debt - 38,248 - - - - - ERP integration costs - 280 375 602 658 1,205 1,918 Gain on licensing of patents - - (2,000) - - - - Debt and stock registration related fees - - - 950 581 204 77 Inventory write-downs - - - - 2,991 - - Acquisition related fees - - - - - 610 - Income tax impact of adjustments (463) (268) (364) (196) (428) (159) 406 Total adjustments 6,435 43,732 (2,972) 5,911 4,493 5,120 8,071 Adjusted net income 6,752 $ 23,633 $ 31,939 $ 33,078 $ 25,558 $ 36,969 $ 22,389 $ Adjusted net income per share: Basic 0.25 $ 0.87 $ 1.18 $ 1.17 $ 0.69 $ 0.94 $ 0.50 $ Diluted 0.14 $ 0.48 $ 0.62 $ 0.64 $ 0.49 $ 0.71 $ 0.43 $ Weighted average shares outstanding: Basic 27,017 27,045 27,092 28,295 37,127 39,452 44,370 Diluted 47,679 49,457 51,194 51,960 52,293 52,338 52,230 |

|
|
Non-GAAP Financial Measures Non-GAAP Financial Measures Included in this presentation are certain non-GAAP financial measures designed to complement the financial information presented in accordance with generally accepted accounting principles in the United States of America because management believes such measures are useful to investors. Adjusted gross margin Adjusted gross margin represents net sales less cost of sales excluding adjustments which are outlined in the quantitative reconciliation provided earlier in this presentation. Management uses Adjusted gross margin to facilitate our analysis and understanding of our business operations and believes that Adjusted gross margin is useful to investors because it provides a supplemental way to understand the underlying operating performance of the Company. Adjusted gross margin should not be considered as an alternative to gross margin or any other performance measure derived in accordance with GAAP. Adjusted operating income Adjusted operating income represents operating income, excluding adjustments which are outlined in the quantitative reconciliation provided earlier in this presentation. Management uses Adjusted operating income to facilitate our analysis and understanding of our business operations and believes that Adjusted operating income is useful to investors because it provides a supplemental way to understand the underlying operating performance of the Company. Adjusted operating income should not be considered as an alternative to operating income or any other performance measure derived in accordance with GAAP. 38 |

|
|
Non-GAAP Financial Measures (Cont’d) Adjusted net income (loss) and Adjusted EPS Adjusted net income and Adjusted EPS represent net income and EPS, excluding adjustments which are more specifically outlined in the quantitative reconciliation provided earlier in this presentation. Management uses Adjusted net income and Adjusted EPS to evaluate the Company's operating performance and believes that Adjusted net income and Adjusted EPS are useful to investors because they provide a supplemental way to possibly better understand the underlying operating performance of the Company. Adjusted net income and Adjusted EPS should not be considered as alternatives to net income, operating income or any other performance measures derived in accordance with GAAP. Adjusted EBITDA Adjusted EBITDA represents net income before income tax expense, interest expense, and depreciation and amortization expense, adjusted to exclude the following: restructuring charges, stock-based compensation expense, net gain/loss on disposals of assets, plant start-up costs, registration related fees, ERP integration costs, net foreign exchange gain/loss, acquisition related fees and gain on licensing of patents. We present Adjusted EBITDA as a supplemental measure of our performance and ability to service debt. We also present Adjusted EBITDA because we believe such measure is frequently used by securities analysts, investors and other interested parties in the evaluation of companies in our industry. We believe Adjusted EBITDA is an appropriate supplemental measure of debt service capacity, because cash expenditures on interest are, by definition, available to pay interest, and tax expense is inversely correlated to interest expense because tax expense goes down as deductible interest expense goes up; depreciation and amortization are non-cash charges. The other items excluded from Adjusted EBITDA are excluded in order to better reflect our continuing operations. In evaluating Adjusted EBITDA, you should be aware that in the future we may incur expenses similar to the adjustments in this presentation. Our presentation of Adjusted EBITDA should not be construed as an inference that our future results will be unaffected by these types of adjustments. Adjusted EBITDA is not a measurement of our financial performance under GAAP and should not be considered as an alternative to net income, operating income or any other performance measures derived in accordance with GAAP or as an alternative to cash flow from operating activities as a measure of our liquidity. 39 |

|
|
Non-GAAP Financial Measures (Cont’d) Our Adjusted EBITDA measure has limitations as an analytical tool, and you should not consider it in isolation or as a substitute for analysis of our results as reported under GAAP. Some of these limitations are: it does not reflect our cash expenditures, future requirements for capital expenditures or contractual commitments; it does not reflect changes in, or cash requirements for, our working capital needs; it does not reflect the significant interest expense or the cash requirements necessary to service interest or principal payment on our debt; although depreciation and amortization are non-cash charges, the assets being depreciated and amortized will often have to be replaced in the future, and our Adjusted EBITDA measure does not reflect any cash requirements for such replacements; it is not adjusted for all non-cash income or expense items that are reflected in our statements of cash flows; it does not reflect the impact of earnings or charges resulting from matters we consider not be indicative of our ongoing operations; it does not reflect limitations on or costs related to transferring earnings from our subsidiaries to us; and other companies in our industry may calculate this measure differently than we do, limiting its usefulness as a comparative measure. Because of these limitations, Adjusted EBITDA should not be considered as a measure of discretionary cash available to us to invest in the growth of our business or as a measure of cash that will be available to us to meet our obligations. You should compensate for these limitations by relying primarily on our GAAP results and using Adjusted EBITDA only supplementally. 40 |
