Exhibit 99.1
| FOR IMMEDIATE RELEASE | Contact: Etienne Marcus |
| (818) 871-3000 | |
| investorrelations@thecheesecakefactory.com |
THE CHEESECAKE FACTORY REPORTS RESULTS FOR
FIRST QUARTER OF FISCAL 2024
CALABASAS HILLS, Calif. – May 8, 2024 – The Cheesecake Factory Incorporated (NASDAQ: CAKE) today reported financial results for the first quarter of fiscal 2024, which ended on April 2, 2024.
Total revenues were $891.2 million in the first quarter of fiscal 2024 compared to $866.1 million in the first quarter of fiscal 2023. Net income and diluted net income per share were $33.2 million and $0.68, respectively, in the first quarter of fiscal 2024.
The Company recorded a pre-tax net expense of $3.2 million related to impairment of assets and lease termination expenses and Fox Restaurant Concepts (“FRC”) acquisition-related items. Excluding the after-tax impact of these items, adjusted net income and adjusted net income per share for the first quarter of fiscal 2024 were $35.6 million and $0.73, respectively. Please see the Company’s reconciliation of non-GAAP financial measures at the end of this press release.
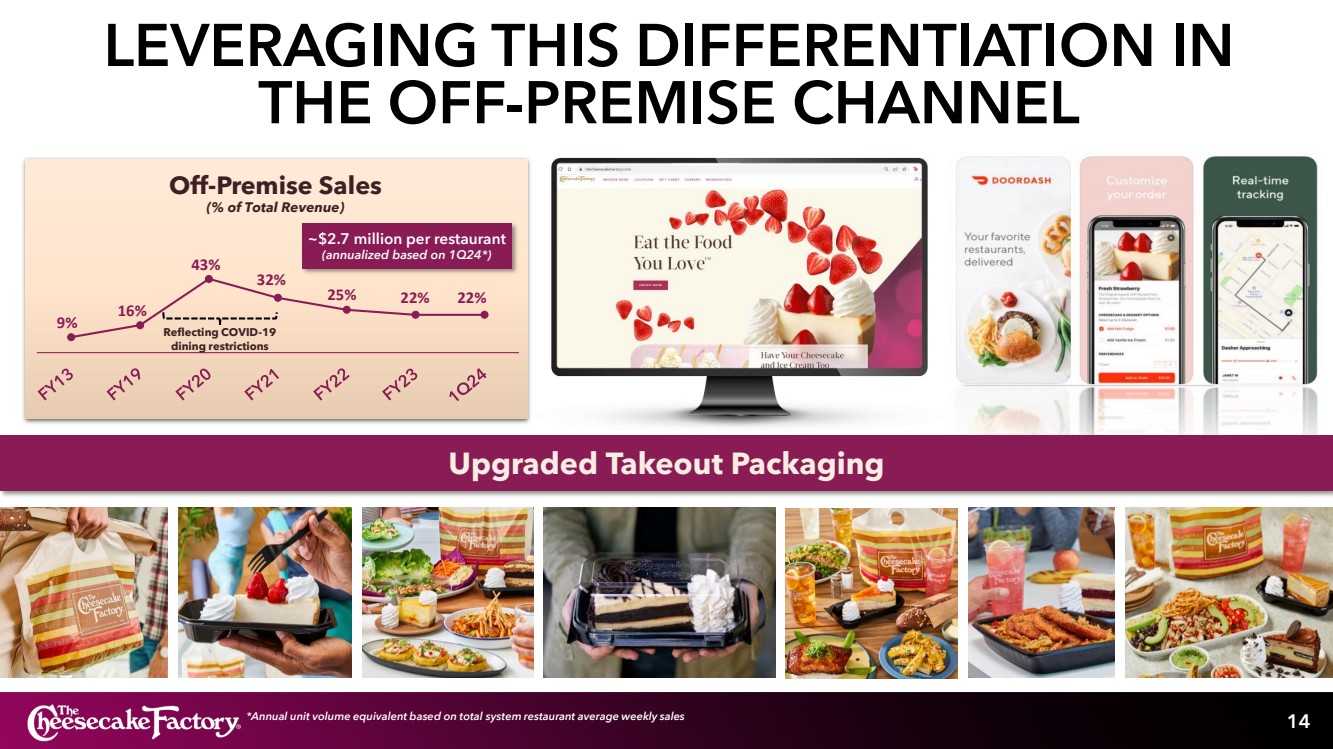
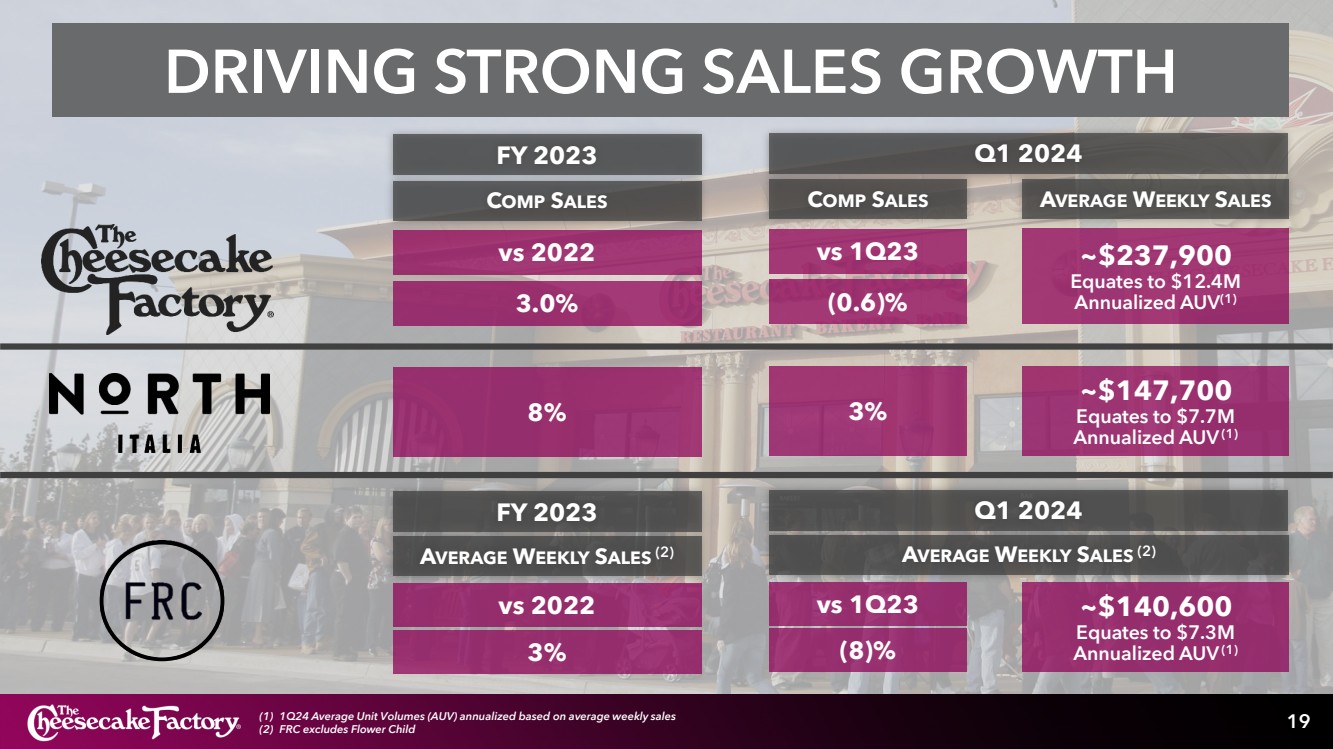
Comparable restaurant sales at The Cheesecake Factory restaurants declined 0.6% year-over-year in the first quarter of fiscal 2024.
“The Cheesecake Factory restaurants comparable sales and traffic once again meaningfully outperformed the industry,” said David Overton, Chairman and Chief Executive Officer. “Our first quarter sales improved throughout the quarter culminating at the high-end of our expectations. Our operators continued to deliver improvements in labor productivity, food efficiency, and hourly staff and manager retention, all of which contributed to significant growth in profitability.”
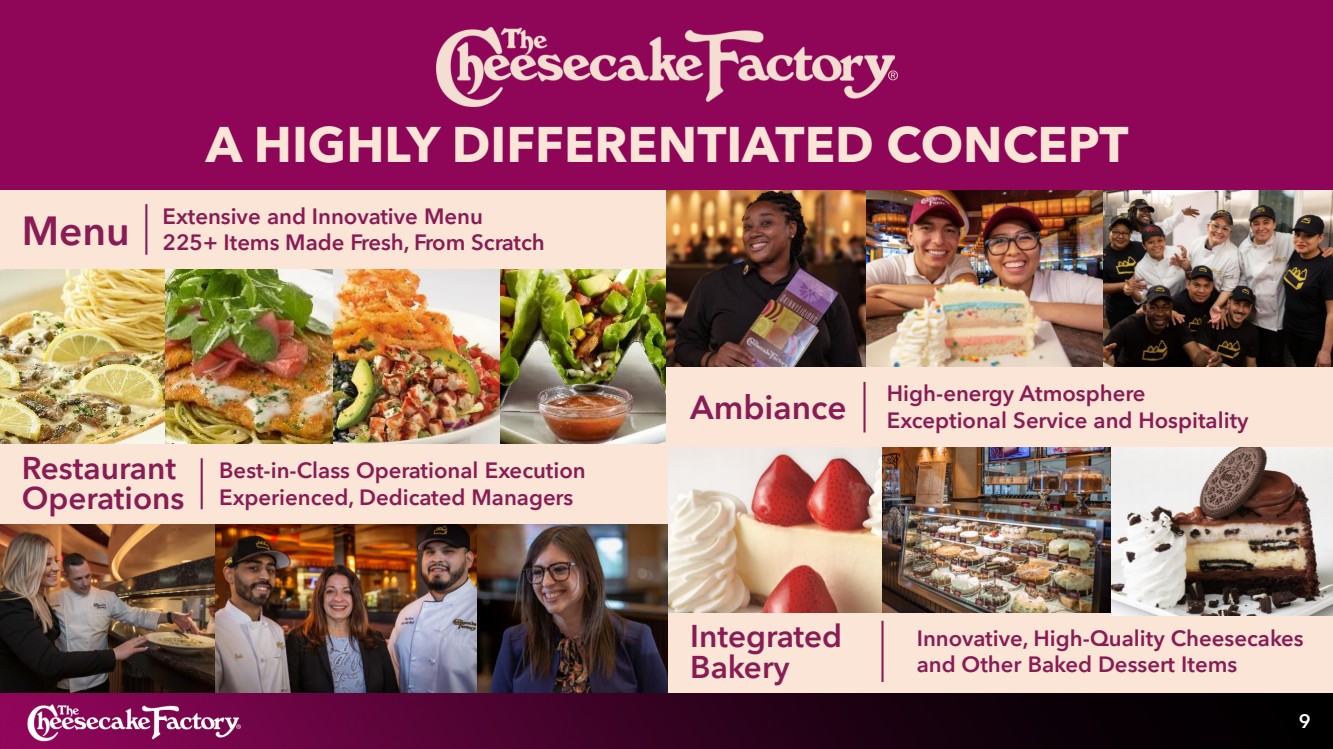
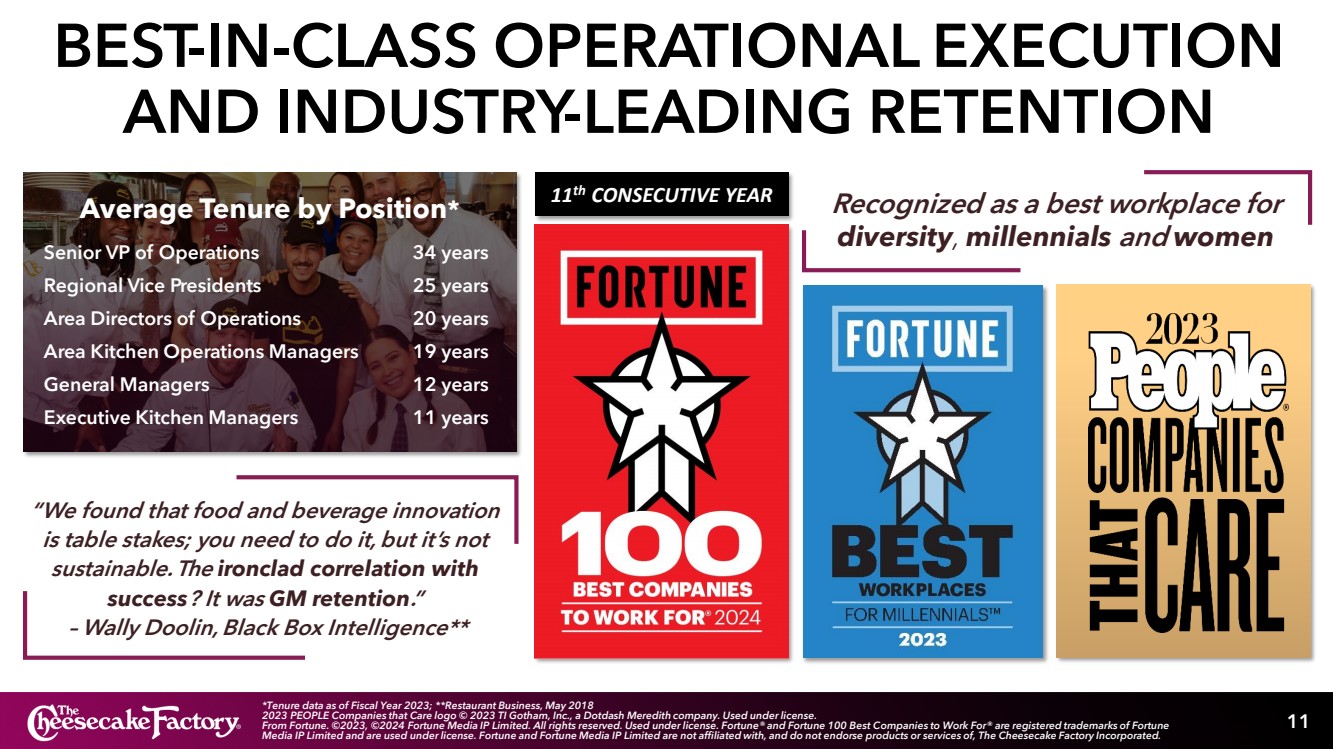
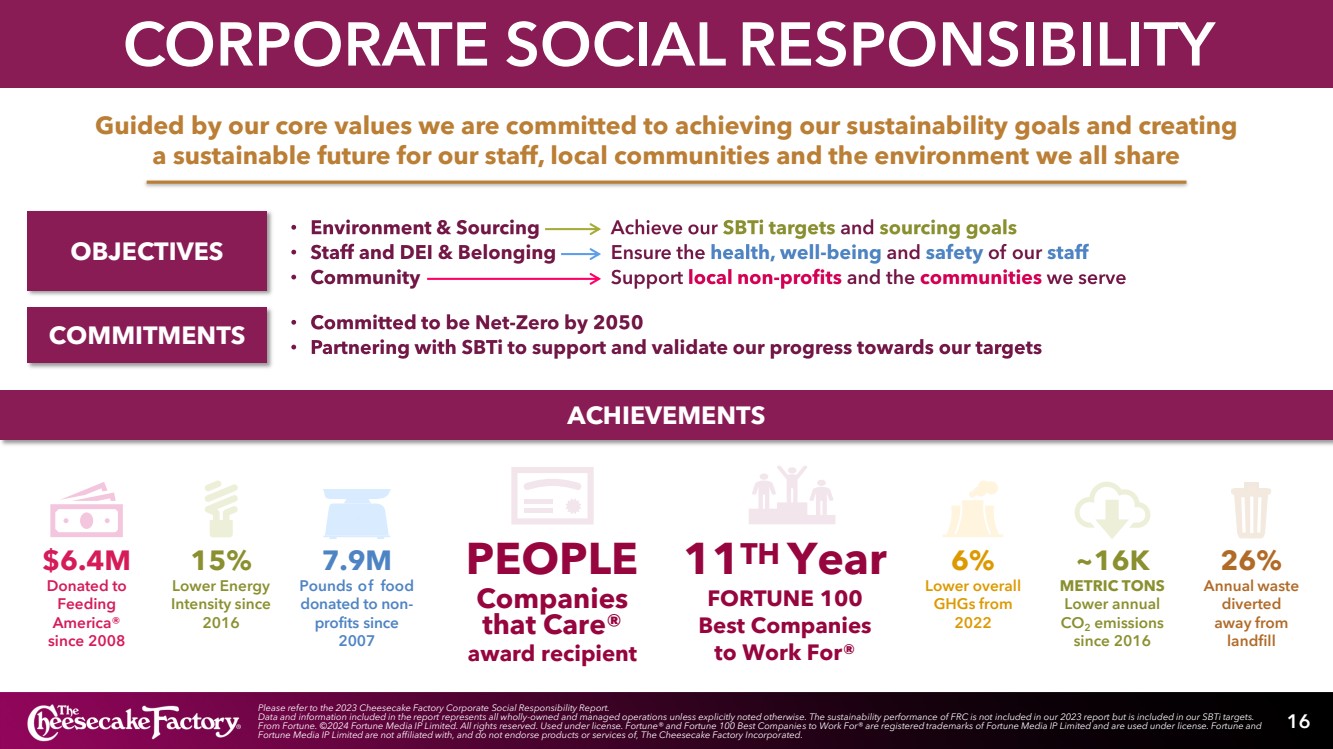
“Our success is undeniably linked to the hard work and dedication of our experienced restaurant teams who enable us to deliver the distinct, high quality dining experiences that have distinguished The Cheesecake Factory as one of the most differentiated restaurant concepts in the casual dining industry for over 45 years. We are honored to have been named to the Fortune magazine '100 Best Companies to Work For' list for the 11th consecutive year, reinforcing our belief that we are an employer of choice.”
26901 Malibu Hills Road, Calabasas Hills, CA 91301 · Telephone (818) 871-3000
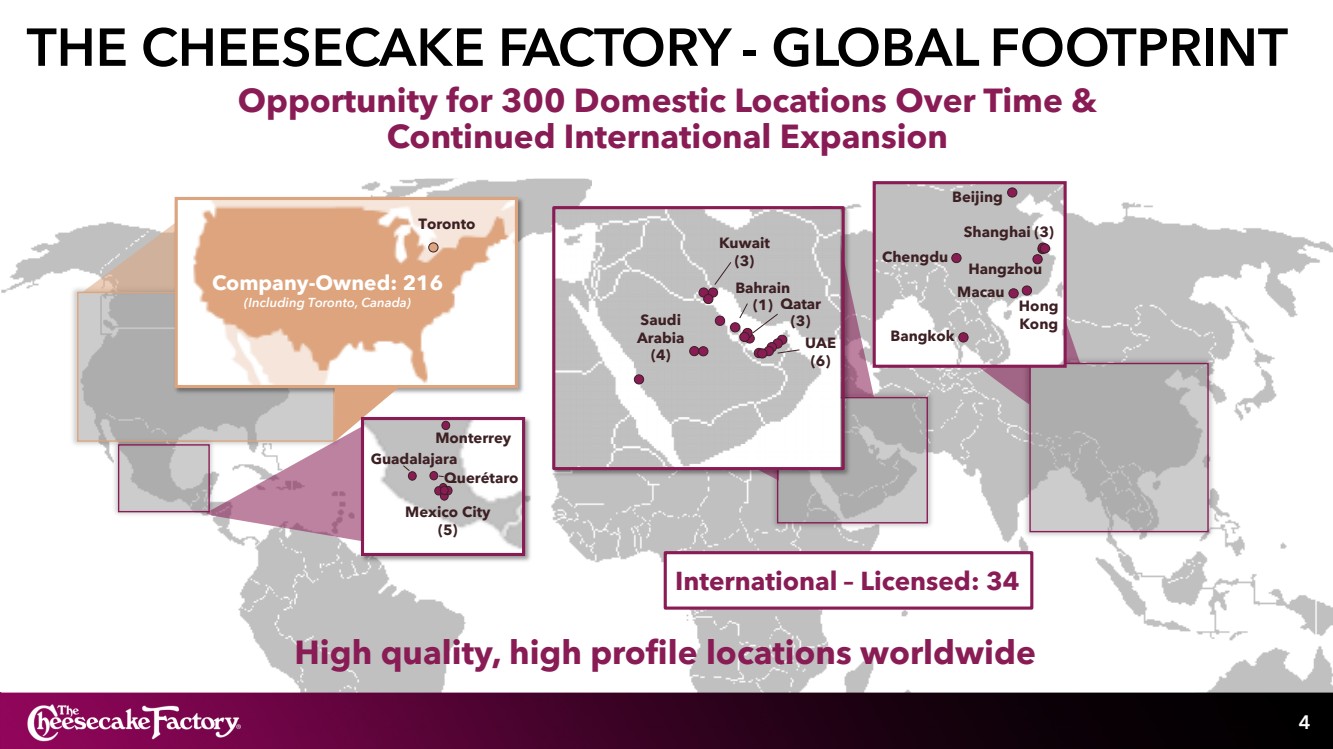
Development
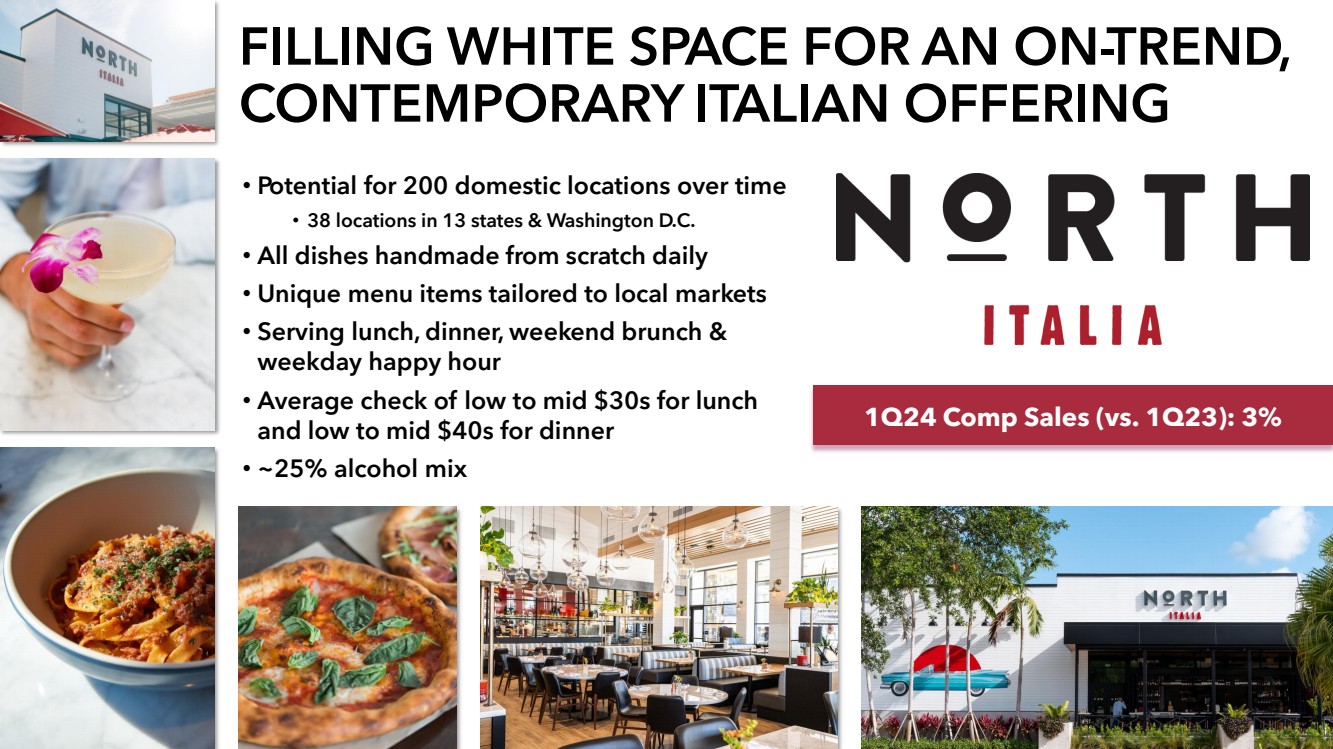
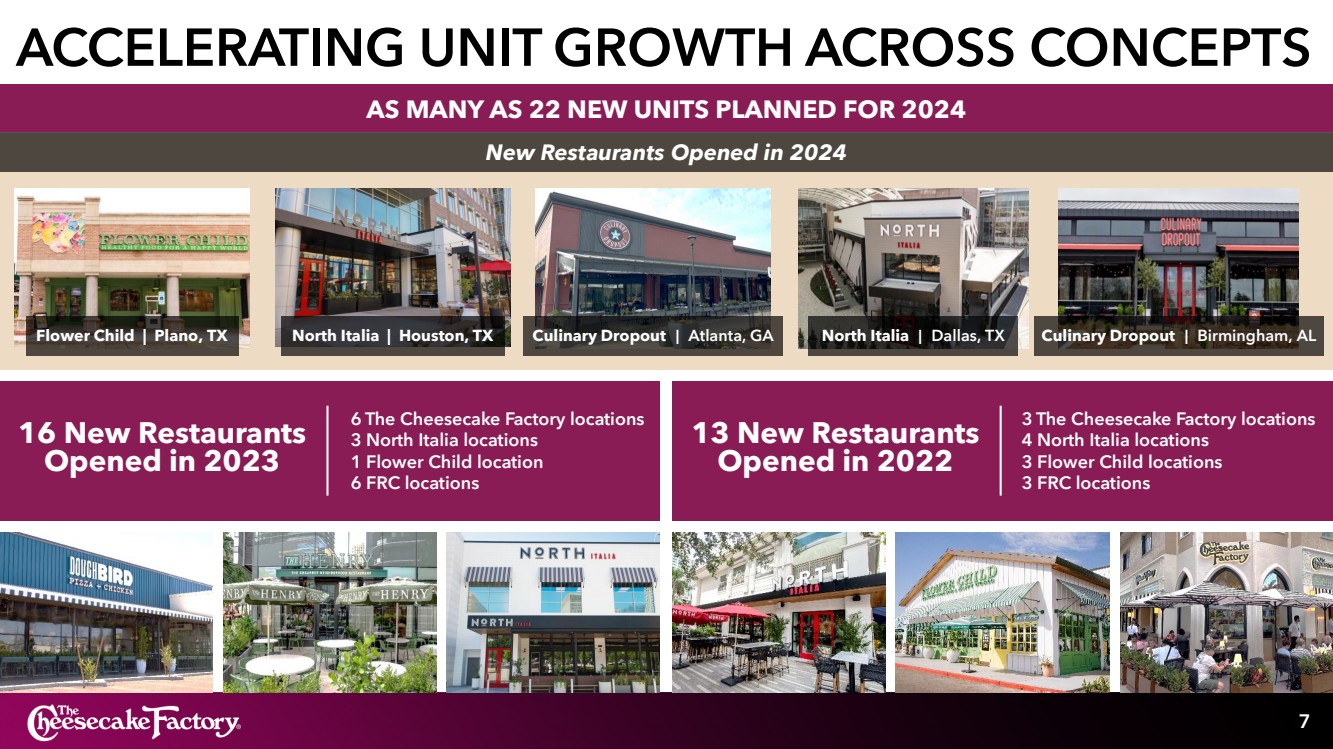
During the first quarter of fiscal 2024, the Company opened five new restaurants, including two North Italia restaurants, two FRC restaurants, and one Flower Child location. In addition, one Cheesecake Factory restaurant opened internationally under a licensing agreement in Mexico. Subsequent to quarter-end, one Cheesecake Factory restaurant opened internationally under a licensing agreement in Asia.
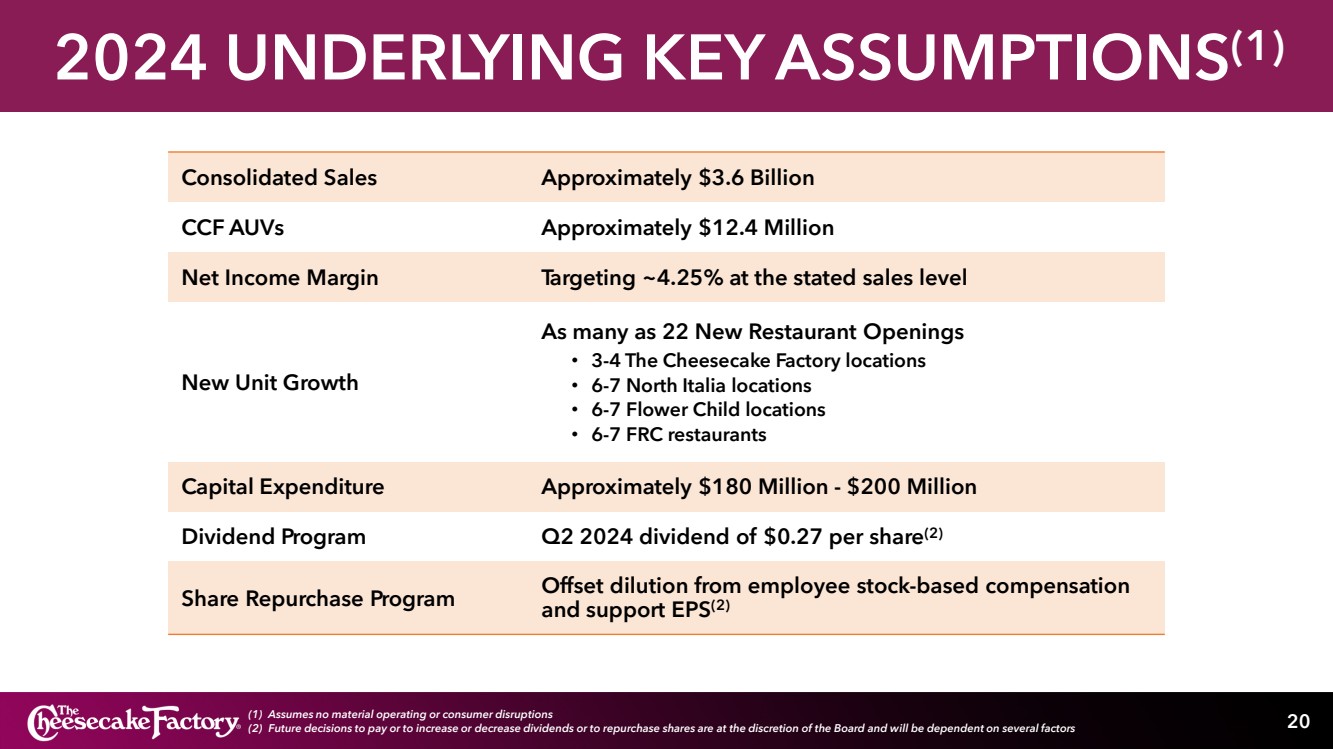
The Company continues to expect to open as many as 22 new restaurants in fiscal 2024, including as many as three to four The Cheesecake Factory restaurants, six to seven North Italia restaurants, six to seven Flower Child locations, and six to seven FRC restaurants.
Liquidity and Capital Allocation
As of April 2, 2024, the Company had total available liquidity of $296.7 million, including a cash balance of $60.2 million and availability on its revolving credit facility of $236.5 million. Total principal amount of debt outstanding was $475 million, including $345 million in principal amount of 0.375% convertible senior notes due 2026 and $130 million in principal amount drawn on the Company’s revolving credit facility.
The Company repurchased approximately 359,400 shares of its stock at a cost of $12.5 million in the first quarter of fiscal 2024. In addition, the Company’s Board of Directors has declared a quarterly dividend of $0.27 per share to be paid on June 4, 2024 to shareholders of record at the close of business on May 22, 2024.
Conference Call and Webcast
The Company will hold a conference call to review its results for the first quarter of fiscal 2024 today at 2:00 p.m. Pacific Time. The conference call will be webcast live on the Company’s website at investors.thecheesecakefactory.com and a replay of the webcast will be available through June 7, 2024.
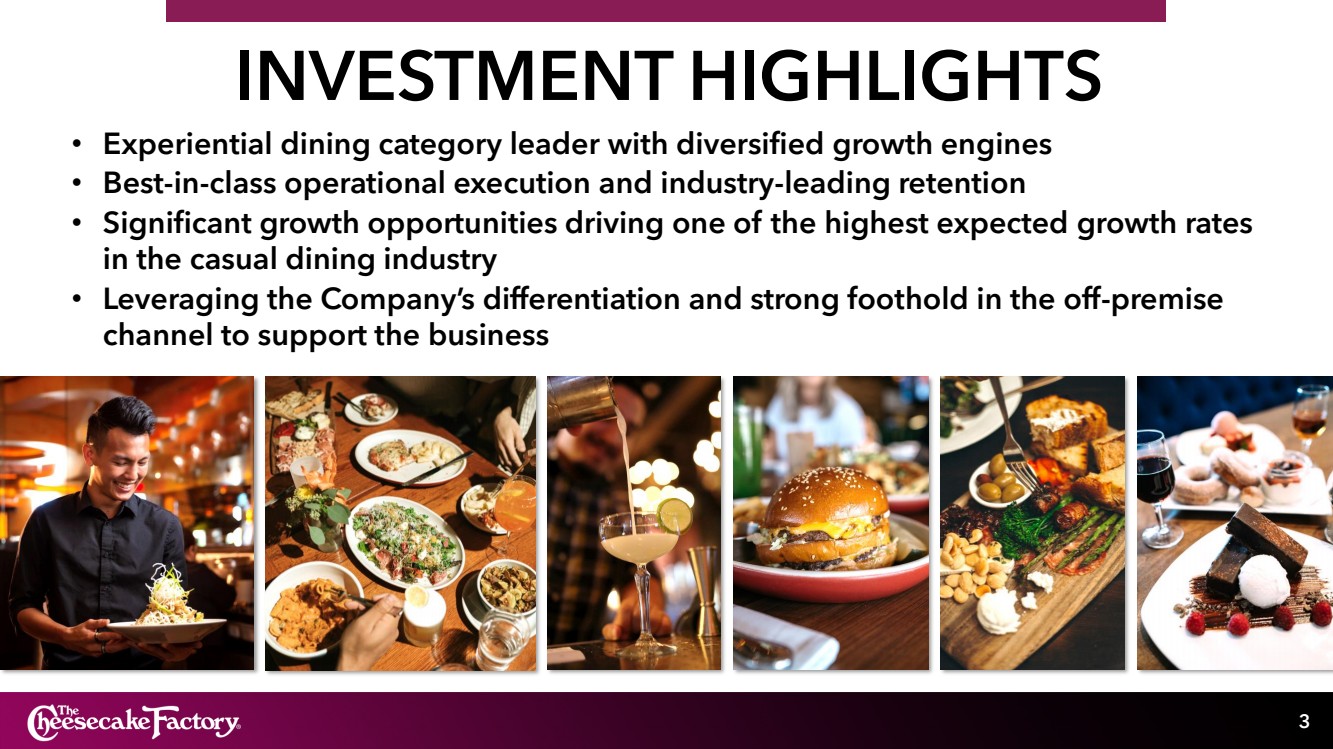
About The Cheesecake Factory Incorporated
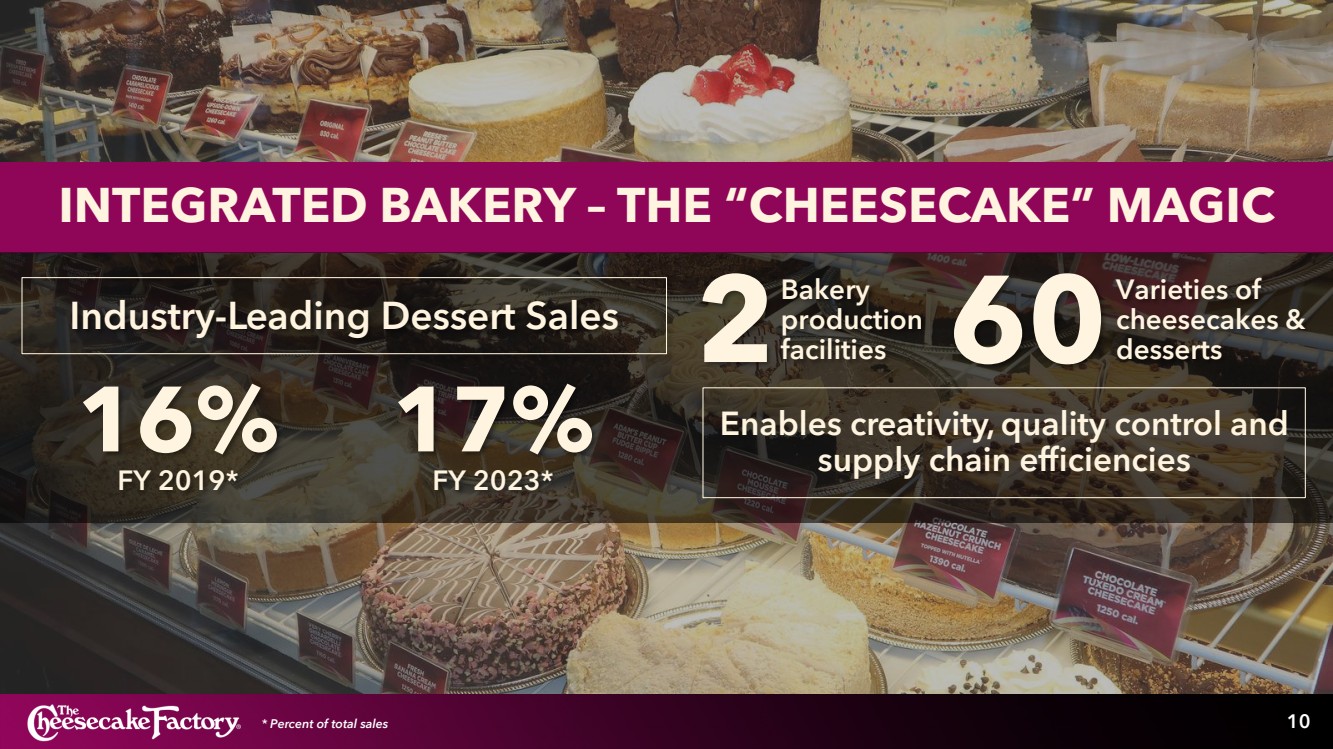
The Cheesecake Factory Incorporated is a leader in experiential dining. We are culinary forward and relentlessly focused on hospitality. Delicious, memorable experiences created by passionate people – this defines who we are and where we are going. We currently own and operate 335 restaurants throughout the United States and Canada under brands including The Cheesecake Factory®, North Italia®, Flower Child® and a collection of other FRC brands. Internationally, 34 The Cheesecake Factory® restaurants operate under licensing agreements. Our bakery division operates two facilities that produce quality cheesecakes and other baked products for our restaurants, international licensees and third-party bakery customers. In 2024, we were named to the FORTUNE Magazine “100 Best Companies to Work For®” list for the eleventh consecutive year. To learn more, visit www.thecheesecakefactory.com, www.northitalia.com, www.iamaflowerchild.com and www.foxrc.com.
From Fortune. ©2024 Fortune Media IP Limited. All rights reserved. Used under license. Fortune® and Fortune 100 Best Companies to Work For® are registered trademarks of Fortune Media IP Limited and are used under license. Fortune and Fortune Media IP Limited are not affiliated with, and do not endorse products or services of, The Cheesecake Factory Incorporated.
26901 Malibu Hills Road, Calabasas Hills, CA 91301 · Telephone (818) 871-3000
Safe Harbor Statement
This press release contains forward-looking statements within the meaning of the Private Securities Litigation Reform Act of 1995, as codified in Section 27A of the Securities Act of 1933, as amended, and Section 21E of the Securities Exchange Act of 1934, as amended. These statements include, without limitation, statements regarding restaurant development. Such forward-looking statements include all other statements that are not historical facts, as well as statements that are preceded by, followed by or that include words or phrases such as “believe,” “plan,” “will likely result,” “expect,” “intend,” “will continue,” “is anticipated,” “estimate,” “project,” “may,” “could,” “would,” “should” and similar expressions. These statements are based on current expectations and involve risks and uncertainties which may cause results to differ materially from those set forth in such statements. Investors are cautioned that forward-looking statements are not guarantees of future performance and that undue reliance should not be placed on such statements. These forward-looking statements may be affected by various factors including: economic, public health and political conditions that impact consumer confidence and spending, including increased interest rates, periods of heightened inflation and market instability, and armed conflicts; supply chain disruptions; demonstrations, political unrest, potential damage to or closure of the Company’s restaurants and potential reputational damage to the Company or any of its brands; pandemics and related containment measures, including the potential for quarantines or restriction on in-person dining; acceptance and success of The Cheesecake Factory in international markets; acceptance and success of North Italia, Flower Child and Other Fox Restaurant Concepts restaurants; the risks of doing business abroad through Company-owned restaurants and/or licensees; foreign exchange rates, tariffs and cross border taxation; changes in unemployment rates; increases in minimum wages and benefit costs; the economic health of the Company’s landlords and other tenants in retail centers in which its restaurants are located, and the Company’s ability to successfully manage its lease arrangements with landlords; the economic health of suppliers, licensees, vendors and other third parties providing goods or services to the Company; the timing of new unit development and related permitting; compliance with debt covenants; strategic capital allocation decisions including with respect to share repurchases or dividends; the ability to achieve projected financial results; the resolution of uncertain tax positions with the Internal Revenue Service and the impact of tax reform legislation; changes in laws impacting the Company’s business; adverse weather conditions in regions in which the Company’s restaurants are located; factors that are under the control of government agencies, landlords and other third parties; the risks, costs and uncertainties associated with opening new restaurants; and other risks and uncertainties detailed from time to time in the Company’s filings with the Securities and Exchange Commission (“SEC”). Forward-looking statements speak only as of the dates on which they are made, and the Company undertakes no obligation to publicly update or revise any forward-looking statements or to make any other forward-looking statements, whether as a result of new information, future events or otherwise, unless required to do so by law. Investors are referred to the full discussion of risks and uncertainties associated with forward-looking statements and the discussion of risk factors contained in the Company’s latest Annual Report on Form 10-K, Quarterly Reports on Form 10-Q and Current Reports on Form 8-K as filed with the SEC, which are available at www.sec.gov.
26901 Malibu Hills Road, Calabasas Hills, CA 91301 · Telephone (818) 871-3000
The Cheesecake Factory Incorporated
Condensed Consolidated Financial Statements
(unaudited; in thousands, except per share and statistical data)
| 13 Weeks Ended | 13 Weeks Ended | |||||||||||||||
| Consolidated Statements of Income | April 2, 2024 | April 4, 2023 | ||||||||||||||
| Amount | Percent of Revenues | Amount | Percent of Revenues | |||||||||||||
| Revenues | $ | 891,223 | 100.0 | % | $ | 866,114 | 100.0 | % | ||||||||
| Costs and expenses: | ||||||||||||||||
| Food and beverage costs | 203,253 | 22.8 | % | 206,224 | 23.8 | % | ||||||||||
| Labor expenses | 320,930 | 36.0 | % | 311,528 | 36.0 | % | ||||||||||
| Other operating costs and expenses | 233,541 | 26.3 | % | 230,929 | 26.7 | % | ||||||||||
| General and administrative expenses | 60,366 | 6.8 | % | 54,069 | 6.2 | % | ||||||||||
| Depreciation and amortization expenses | 24,756 | 2.8 | % | 22,955 | 2.7 | % | ||||||||||
| Impairment of assets and lease termination expenses | 2,083 | 0.2 | % | 2,242 | 0.3 | % | ||||||||||
| Acquisition-related contingent consideration, compensation and amortization expenses | 1,121 | 0.1 | % | 1,189 | 0.1 | % | ||||||||||
| Preopening costs | 5,880 | 0.6 | % | 3,052 | 0.3 | % | ||||||||||
| Total costs and expenses | 851,930 | 95.6 | % | 832,188 | 96.1 | % | ||||||||||
| Income from operations | 39,293 | 4.4 | % | 33,926 | 3.9 | % | ||||||||||
| Interest and other expense, net | (1,761 | ) | (0.2 | )% | (1,880 | ) | (0.2 | )% | ||||||||
| Income before income taxes | 37,532 | 4.2 | % | 32,046 | 3.7 | % | ||||||||||
| Income tax provision | 4,341 | 0.5 | % | 3,996 | 0.5 | % | ||||||||||
| Net income | $ | 33,191 | 3.7 | % | $ | 28,050 | 3.2 | % | ||||||||
| Basic net income per share | $ | 0.70 | $ | 0.58 | ||||||||||||
| Basic weighted average shares outstanding | 47,749 | 48,694 | ||||||||||||||
| Diluted net income per share | $ | 0.68 | $ | 0.56 | ||||||||||||
| Diluted weighted average shares outstanding | 48,662 | 49,778 | ||||||||||||||
26901 Malibu Hills Road, Calabasas Hills, CA 91301 · Telephone (818) 871-3000
| 13 Weeks Ended | 13 Weeks Ended | |||||||
| Selected Segment Information | April 2, 2024 | April 4, 2023 | ||||||
| Revenues: | ||||||||
| The Cheesecake Factory restaurants | $ | 667,794 | $ | 656,000 | ||||
| North Italia | 70,874 | 63,303 | ||||||
| Other FRC | 74,229 | 68,640 | ||||||
| Other | 78,326 | 78,171 | ||||||
| Total | $ | 891,223 | $ | 866,114 | ||||
| Income/(loss) from operations: | ||||||||
| The Cheesecake Factory restaurants | $ | 86,071 | $ | 78,386 | ||||
| North Italia | 3,170 | 4,606 | ||||||
| Other FRC | 6,292 | 8,711 | ||||||
| Other | (56,240 | ) | (57,777 | ) | ||||
| Total | $ | 39,293 | $ | 33,926 | ||||
| Depreciation and amortization expenses: | ||||||||
| The Cheesecake Factory restaurants | $ | 16,843 | $ | 16,018 | ||||
| North Italia | 1,971 | 1,467 | ||||||
| Other FRC | 2,425 | 1,927 | ||||||
| Other | 3,517 | 3,543 | ||||||
| Total | $ | 24,756 | $ | 22,955 | ||||
| Impairment of assets and lease termination expenses: | ||||||||
| The Cheesecake Factory restaurants | $ | 1,859 | $ | 93 | ||||
| North Italia | - | - | ||||||
| Other FRC | - | 55 | ||||||
| Other | 224 | 2,094 | ||||||
| Total | $ | 2,083 | $ | 2,242 | ||||
| Preopening costs: | ||||||||
| The Cheesecake Factory restaurants | $ | 1,758 | $ | 1,448 | ||||
| North Italia | 2,002 | 446 | ||||||
| Other FRC | 1,724 | 721 | ||||||
| Other | 396 | 437 | ||||||
| Total | $ | 5,880 | $ | 3,052 | ||||
| 13 Weeks Ended | 13 Weeks Ended | |||||||
| April 2, 2024 | April 4, 2023 | |||||||
| The Cheesecake Factory restaurants operating information: | ||||||||
| Comparable restaurant sales vs. prior year | (0.6 | )% | 5.7 | % | ||||
| Restaurants opened during period | - | - | ||||||
| Restaurants open at period-end | 216 | 210 | ||||||
| Restaurant operating weeks | 2,807 | 2,737 | ||||||
| North Italia operating information: | ||||||||
| Comparable restaurant sales vs. prior year | 3 | % | 9 | % | ||||
| Restaurants opened during period | 2 | - | ||||||
| Restaurants open at period-end | 38 | 33 | ||||||
| Restaurant operating weeks | 480 | 429 | ||||||
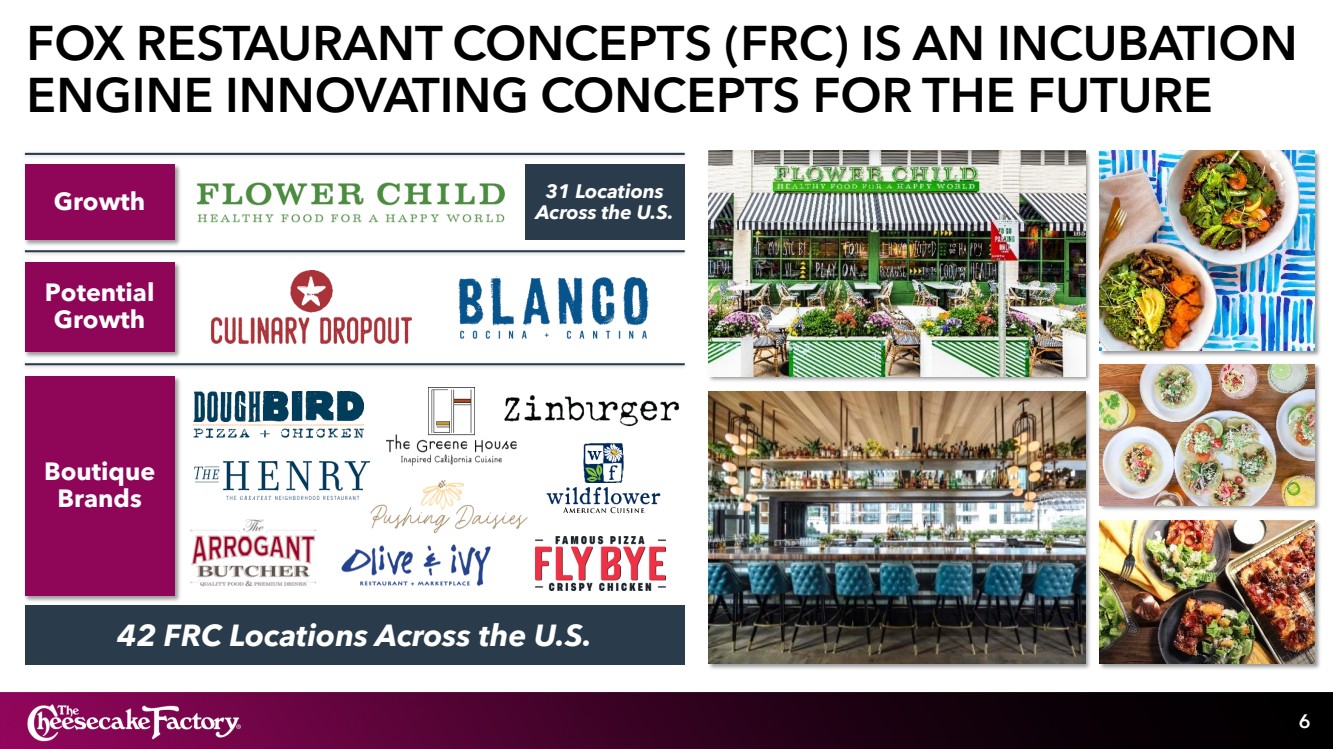
| Other Fox Restaurant Concepts (FRC) operating information:(1) | ||||||||
| Restaurants opened during period | 2 | 1 | ||||||
| Restaurants open at period-end | 42 | 35 | ||||||
| Restaurant operating weeks | 528 | 451 | ||||||
| Other operating information:(2) | ||||||||
| Restaurants opened during period | 1 | 1 | ||||||
| Restaurants open at period-end | 40 | 40 | ||||||
| Restaurant operating weeks | 516 | 515 | ||||||
| Number of company-owned restaurants: | ||||||||
| The Cheesecake Factory | 216 | |||||||
| North Italia | 38 | |||||||
| Other FRC | 42 | |||||||
| Other | 40 | |||||||
| Total | 336 | |||||||
| Number of international-licensed restaurants: | ||||||||
| The Cheesecake Factory | 33 | |||||||
(1) The Other FRC segment includes all FRC brands except Flower Child.
(2) The Other segment includes the Flower Child, Grand Lux Cafe and Social Monk Asian Kitchen concepts, as well as the Company's third-party bakery, international and consumer packaged goods businesses, unallocated corporate expenses and gift card costs.
| Selected Consolidated Balance Sheet Information | April 2, 2024 | January 2, 2024 | ||||||
| Cash and cash equivalents | $ | 60,220 | $ | 56,290 | ||||
| Long-term debt, net of issuance costs (1) | 470,551 | 470,047 | ||||||
(1) Includes $340.0 million net balance of 0.375% convertible senior notes due 2026 (principal amount of $345 million less $4.4 million in unamortized issuance costs) and $130 million drawn on the Company's revolving credit facility. The unamortized issuance costs were recorded as a contra-liability and netted with long-term debt on the Condensed Consolidated Balance Sheet and are being amortized as interest expense.
26901 Malibu Hills Road, Calabasas Hills, CA 91301 · Telephone (818) 871-3000
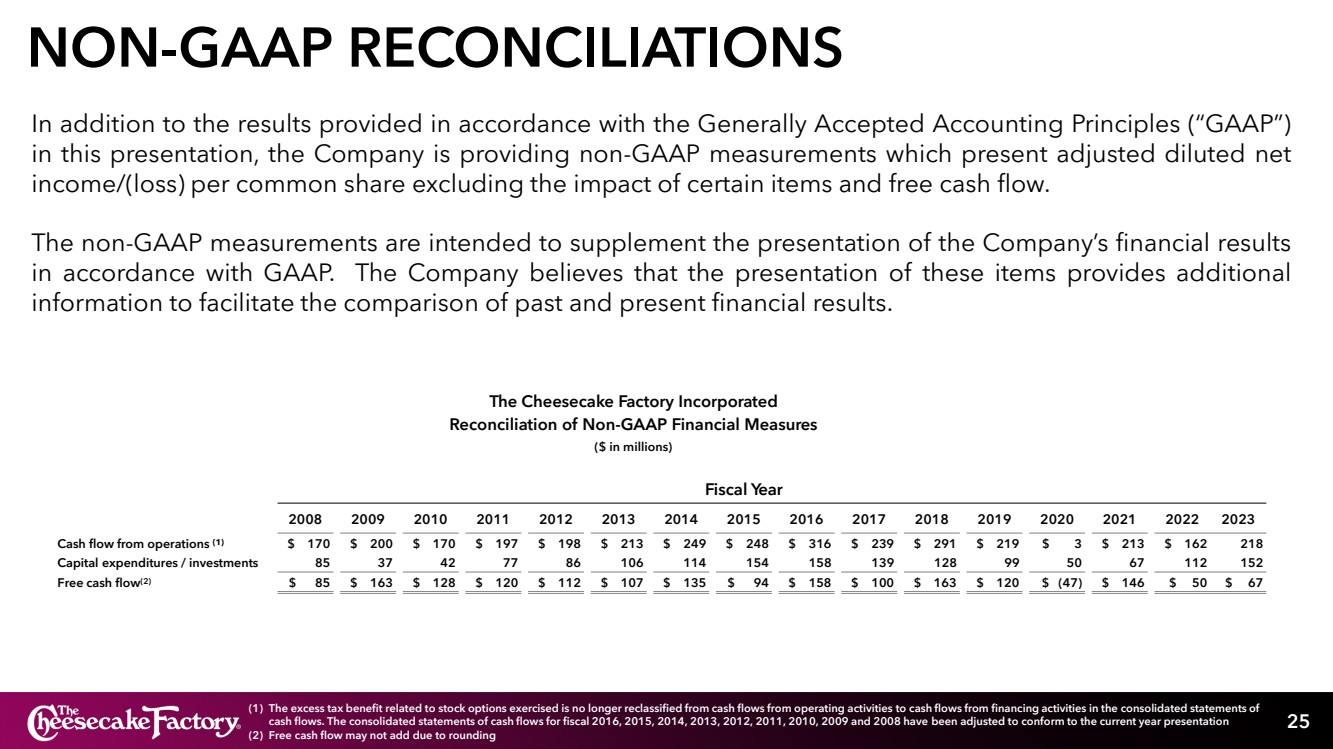
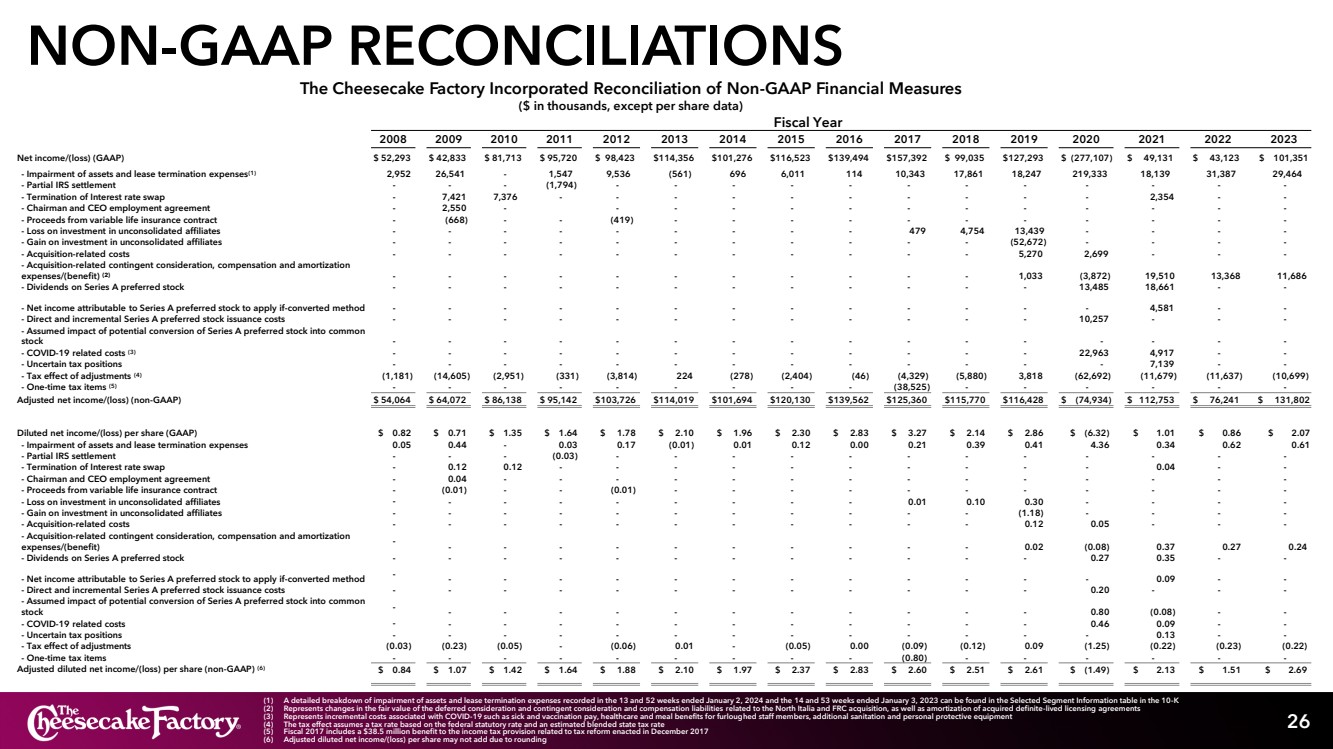
Reconciliation of Non-GAAP Results to GAAP Results
In addition to the results provided in accordance with accounting principles generally accepted in the United States of America (“GAAP”) in this press release, the Company is providing non-GAAP measurements which present net income and net income per share excluding the impact of certain items. The non-GAAP measurements are intended to supplement the presentation of the Company’s financial results in accordance with GAAP. These non-GAAP measures are calculated by eliminating from net income and diluted net income per share the impact of items the Company does not consider indicative of its ongoing operations. The Company uses these non-GAAP financial measures for financial and operational decision-making and as a means to evaluate period-to-period comparisons.
The Cheesecake Factory Incorporated
Reconciliation of Non-GAAP Financial Measures
(unaudited; in thousands, except per share data)
| 13 Weeks Ended | 13 Weeks Ended | |||||||
| April 2, 2024 | April 4, 2023 | |||||||
| Net income (GAAP) | $ | 33,191 | $ | 28,050 | ||||
| Impairment of assets and lease termination expenses(1) | 2,083 | 2,242 | ||||||
| Acquisition-related contingent consideration, compensation and amortization expenses(2) | 1,121 | 1,189 | ||||||
| Tax effect of adjustments(3) | (833 | ) | (892 | ) | ||||
| Adjusted net income (non-GAAP) | $ | 35,562 | $ | 30,589 | ||||
| Diluted net income per share (GAAP) | $ | 0.68 | $ | 0.56 | ||||
| Impairment of assets and lease termination expenses | 0.04 | 0.05 | ||||||
| Acquisition-related contingent consideration, compensation and amortization expenses | 0.02 | 0.02 | ||||||
| Tax effect of adjustments | (0.02 | ) | (0.02 | ) | ||||
| Adjusted net income per share (non-GAAP)(4) | $ | 0.73 | $ | 0.61 | ||||
(1) A detailed breakdown of impairment of assets and lease termination expenses recorded in the thirteen weeks ended April 2, 2024 and April 4, 2023 can be found in the Selected Segment Information table.
(2) Represents changes in the fair value of the deferred consideration and contingent consideration and compensation liabilities related to the North Italia and FRC acquisition, as well as amortization of acquired definite-lived licensing agreements.
(3) Based on the federal statutory rate and an estimated blended state tax rate, the tax effect on all adjustments assumes a 26% tax rate for the fiscal 2024 and 2023 periods.
(4) Adjusted net income per share may not add due to rounding.
26901 Malibu Hills Road, Calabasas Hills, CA 91301 · Telephone (818) 871-3000