UNITED STATES
SECURITIES AND EXCHANGE COMMISSION
Washington, D.C. 20549
FORM 40-F
☐ | Registration statement pursuant to section 12 of the Securities Exchange Act of 1934 |
or
☒ | Annual report pursuant to section 13(a) or 15(d) of the Securities Exchange Act of 1934 |
For the fiscal year ended December 31, 2018
Commission File Number 001-13184
TECK RESOURCES LIMITED
(Exact name of Registrant as specified in its charter)
(Translation of Registrants name into English (if applicable))
CANADA
(Province or other jurisdiction of incorporation or organization)
1400
(Primary Standard Industrial Classification Code Number (if applicable))
NOT APPLICABLE
(I.R.S. Employer Identification Number (if applicable))
Suite 3300 550 Burrard Street, Vancouver, B.C. V6C 0B3 CANADA
(604) 699-4000
(Address and telephone number of Registrants principal executive offices)
CT Corporation System, 28 Liberty St., New York, New York, 10005 (212) 894-8940
(Name, address (including zip code) and telephone number (including area code)
of agent for service in the United States)
Securities registered or to be registered pursuant to Section 12(b) of the Act.
Title of each class |
Name of each exchange on which registered | |
Class B subordinate voting shares | New York Stock Exchange |
Securities registered or to be registered pursuant to Section 12(g) of the Act.
None
Securities for which there is a reporting obligation pursuant to Section 15(d) of the Act.
4.500% Notes due 2021
4.75% Notes due 2022
3.750% Notes due 2023
6.125% Notes due 2035
6.000% Notes due 2040
6.25% Notes due 2041
5.200% Notes due 2042
5.400% Notes due 2043
(Title of Class)
For annual reports, indicate by check mark the information filed with this Form:
☒ Annual information form | ☒ Audited annual financial statements |
Indicate the number of outstanding shares of each of the issuers classes of capital or common stock as of the close of the period covered by the annual report.
7,768,304 Class A Common Shares and 562,925,342 Class B Subordinate Voting Shares outstanding as of December 31, 2018.
Indicate by check mark whether the Registrant by filing the information contained in this Form is also thereby furnishing the information to the Commission pursuant to Rule 12g3-2(b) under the Securities Exchange Act of 1934 (the Exchange Act). If Yes is marked, indicate the filing number assigned to the Registrant in connection with such Rule.
Yes ☐ 82- No ☒
Indicate by check mark whether the Registrant (1) has filed all reports required to be filed by Section 13 or 15(d) of the Exchange Act during the preceding 12 months (or for such shorter period that the Registrant was required to file such reports) and (2) has been subject to such filing requirements for the past 90 days.
Yes ☒ No ☐
Indicate by check mark whether the registrant has submitted electronically every Interactive Data File required to be submitted pursuant to Rule 405 of Regulation S-T (§232.405 of this chapter) during the preceding 12 months (or for such shorter period that the Registrant was required to submit such files).
Yes ☒ No ☐
Indicate by check mark whether the registrant is an emerging growth company as defined in Rule 12b-2 of the Exchange Act.
Emerging growth company ☐
If an emerging growth company that prepares its financial statements in accordance with U.S. GAAP, indicate by check mark if the registrant has elected not to use the extended transition period for complying with any new or revised financial accounting standards provided pursuant to Section 13(a) of the Exchange Act. ☐
Principal Documents
The following documents have been filed as part of this Annual Report on Form 40-F:
1. | Annual Information Form of Teck Resources Limited for the year ended December 31, 2018. |
2. | Audited Consolidated Financial Statements of Teck Resources Limited for the year ended December 31, 2018, including the auditors report with respect thereto. |
3. | Managements Discussion and Analysis for the year ended December 31, 2018. |
Certifications and Disclosure Regarding Controls and Procedures
(a) | Certifications. See Exhibits 31.1, 31.2, 32.1 and 32.2 to this Annual Report on Form 40-F. |
(b) | Disclosure Controls and Procedures. As of the end of the Registrants fiscal year ended December 31, 2018, an evaluation of the effectiveness of the Registrants disclosure controls and procedures (as such term is defined in Rules 13a-15(e) and 15d-15(e) of the Securities Exchange Act of 1934, as amended (the Exchange Act)) was carried out by the Registrants management with the participation of the Registrants principal executive officer and principal financial officer. Based upon that evaluation, the Registrants principal executive officer and principal financial officer have concluded that as of the end of that fiscal year, the Registrants disclosure controls and procedures are effective to ensure that information required to be disclosed by the Registrant in reports that it files or submits under the Exchange Act is (i) recorded, processed, summarized and reported within the time periods specified in Securities and Exchange Commission rules and forms and (ii) accumulated and communicated to the Registrants management, including its principal executive officer and principal financial officer, to allow timely decisions regarding required disclosure. |
It should be noted that while the Registrants principal executive officer and principal financial officer believe that the Registrants disclosure controls and procedures provide a reasonable level of assurance that they are effective, they do not expect that the Registrants disclosure controls and procedures or internal control over financial reporting will prevent all errors and fraud. A control system, no matter how well conceived or operated, can provide only reasonable, not absolute, assurance that the objectives of the control system are met.
(c) | Managements Annual Report on Internal Control Over Financial Reporting. The required disclosure is included in the section entitled Managements Report on Internal Control Over Financial Reporting in the Registrants Managements Discussion and Analysis for the fiscal year ended December 31, 2018, filed as part of this Annual Report on Form 40-F. |
(d) | Attestation Report of the Registered Public Accounting Firm. The required disclosure is included in the Report of Independent Registered Public Accounting Firm that accompanies the Registrants Consolidated Financial Statements for the fiscal year ended December 31, 2018, filed as part of this Annual Report on Form 40-F. |
Notices Pursuant to Regulation BTR
Not applicable.
Audit Committee Financial Expert and Identification of Audit Committee
We have an Audit Committee established by the Board of Directors in accordance with Section 3(a)(58)(A) of the Exchange Act. The members of the Audit Committee are Laura L. Dottori-Attanasio, Tracey L. McVicar, Una M. Power, and Timothy R. Snider. The Board has designated Ms. McVicar as the audit committee financial expert as that term is defined in the Form 40-F. Ms. McVicar is independent as that term is defined by Rule 10A-3 of the Exchange Act and according to the New York Stock Exchange listing standards applicable to both foreign private issuers and domestic U.S. issuers.
Code of Ethics
We have adopted a code of ethics, amended on June 23, 2006, November 18, 2008 and April 23, 2009, that applies to our principal executive officer, principal financial officer and principal accounting officer or controller and persons performing similar functions. Our code of ethics is posted on our website, www.teck.com.
There have not been any amendments or waivers, including implicit waivers, from any provision of the code of ethics that occurred during the Registrants most recently completed fiscal year.
Principal Accountant Fees and Services
The required disclosure is included in the section entitled Directors and Officers Audit Committee Information Auditors Fees in the Registrants Annual Information Form for the fiscal year ended December 31, 2018, filed as part of this Annual Report on Form 40-F.
The audit committees pre-approval policies and procedures are described in the section entitled Directors and Officers Audit Committee Information Pre-Approval Policies and Procedures in the Registrants Annual Information Form for the fiscal year ended December 31, 2018, filed as part of this Annual Report on Form 40-F.
In 2017 and 2018, the Registrants audit committee did not approve any audit-related, tax or other services pursuant to paragraph (c)(7)(i)(C) of Rule 2-01 of Regulation S-X.
Off-Balance Sheet Arrangements
We have no off-balance sheet arrangements required to be disclosed in this Annual Report on Form 40-F.
Tabular Disclosure of Contractual Obligations
The required disclosure is included in the section entitled Contractual and Other Obligations in the Registrants Managements Discussion and Analysis for the fiscal year ended December 31, 2018, filed as part of this Annual Report Form 40-F.
Undertaking and Consent to Service of Process
A. | Undertaking |
The Registrant undertakes to make available, in person or by telephone, representatives to respond to inquiries made by the Commission staff, and to furnish promptly, when requested to do so by the Commission staff, information relating to: the securities registered pursuant to Form 40-F; the securities in relation to which the obligation to file an annual report on Form 40-F arises; or transactions in said securities.
B. | Consent to Service of Process |
The Registrant has previously filed Forms F-X in connection with the classes of securities in relation to which the obligation to file this report arises.
Dodd-Frank Act Mine Safety and Health Administration Safety Disclosure
Pursuant to Section 1503(a) of the Dodd-Frank Wall Street Reform and Consumer Protection Act, issuers that are required to file reports under the United States Securities Exchange Act of 1934 and that is an operator, or that has a subsidiary that is an operator, of a coal or other mine are required to include in their periodic reports filed with the United States Securities and Exchange Commission certain information regarding specified health and safety violations, orders and citations, related assessments and legal actions, and mining-related fatalities. The Registrant has reportable information under Section 1503(a) that is presented in Exhibit 95.1 to this report, which is incorporated herein by reference.
LIST OF EXHIBITS
SIGNATURES
Pursuant to the requirements of the Exchange Act, the Registrant certifies that it meets all of the requirements for filing on Form 40-F and has duly caused this annual report to be signed on its behalf by the undersigned, thereto duly authorized.
Registrant: |
TECK RESOURCES LIMITED | |
By (Signature and Title): |
/s/ Amanda Robinson | |
Name: Amanda Robinson | ||
Title: Corporate Secretary |
Date: February 27, 2019
Exhibit 23.1
CONSENT OF INDEPENDENT REGISTERED PUBLIC ACCOUNTING FIRM
We hereby consent to the incorporation by reference in this Annual Report on Form 40-F for the year ended December 31, 2018 of Teck Resources Limited of our report dated February 12, 2019, relating to the consolidated financial statements, and the effectiveness of internal control over financial reporting, which appears in the Exhibit incorporated by reference in this Annual Report.
We also consent to the incorporation by reference in the Registration Statements on Form S-8 (Nos. 333-205514, 333-170840, and 333-140184) of Teck Resources Limited of our report dated February 12, 2019 referred to above. We also consent to reference to us under the heading Interests of Experts, which appears in the Annual Information Form included in the Exhibit incorporated by reference in this Annual Report on Form 40-F, which is incorporated by reference in such Registration Statements.
/s/ PricewaterhouseCoopers LLP
PriceWaterhousecoopers LLP
Chartered Professional Accountants
Vancouver, Canada
February 27, 2019
Exhibit 23.2
CONSENT OF GEOLOGIST
I hereby consent to references to my name under the heading Description of the Business Mineral Reserves and Resources and all other references to my name included or incorporated by reference in: (i) Teck Resources Limiteds Annual Report on Form 40-F for the year ended December 31, 2018; (ii) Teck Resources Limiteds registration statements on Form S-8 (File Nos. 333-140184, 333-170840 and 333-205514), filed with the United States Securities and Exchange Commission pursuant to the Securities Exchange Act of 1934, as amended, or the Securities Act of 1933, as amended as applicable.
Sincerely, |
/s/ Rodrigo Marinho |
Name: Rodrigo Marinho |
Title: P. Geo. |
Vancouver, British Columbia, Canada |
Date: February 27, 2019 |
Exhibit 23.3
CONSENT OF ENGINEER
I hereby consent to references to my name under the heading Description of the Business Mineral Reserves and Resources and all other references to my name included or incorporated by reference in: (i) Teck Resources Limiteds Annual Report on Form 40-F for the year ended December 31, 2018; (ii) Teck Resources Limiteds registration statements on Form S-8 (File Nos. 333-140184, 333-170840 and 333-205514), filed with the United States Securities and Exchange Commission pursuant to the Securities Exchange Act of 1934, as amended, or the Securities Act of 1933, as amended as applicable.
Sincerely, |
/s/ Luis Mamani |
Name: Luis Mamani |
Title: SME Registered Member (4118952RM) |
Lima, Peru |
Date: February 27, 2019 |
Exhibit 23.4
CONSENT OF GEOLOGIST
I hereby consent to references to my name under the heading Description of the Business Mineral Reserves and Resources and all other references to my name included or incorporated by reference in: (i) Teck Resources Limiteds Annual Report on Form 40-F for the year ended December 31, 2018; (ii) Teck Resources Limiteds registration statements on Form S-8 (File Nos. 333-140184, 333-170840 and 333-205514), filed with the United States Securities and Exchange Commission pursuant to the Securities Exchange Act of 1934, as amended, or the Securities Act of 1933, as amended as applicable.
Sincerely, | ||
/s/ Lucio Canchis | ||
Name: | Lucio Canchis | |
Title: | SME Registered Member | |
Lima, Peru | ||
Date: | February 27, 2019 |
Exhibit 23.5
CONSENT OF GEOLOGIST
I hereby consent to references to my name under the heading Description of the Business Mineral Reserves and Resources and all other references to my name included or incorporated by reference in: (i) Teck Resources Limiteds Annual Report on Form 40-F for the year ended December 31, 2018; (ii) Teck Resources Limiteds registration statements on Form S-8 (File Nos. 333-140184, 333-170840 and 333-205514), filed with the United States Securities and Exchange Commission pursuant to the Securities Exchange Act of 1934, as amended, or the Securities Act of 1933, as amended as applicable.
Sincerely, | ||
/s/ Don Mills | ||
Name: | Don Mills | |
Title: | P. Geo. | |
Calgary, Canada | ||
Date: February 27, 2019 |
Exhibit 23.6
CONSENT OF ENGINEER
I hereby consent to references to my name under the heading Description of the Business Mineral Reserves and Resources and all other references to my name included or incorporated by reference in: (i) Teck Resources Limiteds Annual Report on Form 40-F for the year ended December 31, 2018; and (ii) Teck Resources Limiteds registration statements on Form S-8 (File Nos. 333-140184, 333-170840 and 333-205514), filed with the United States Securities and Exchange Commission pursuant to the Securities Exchange Act of 1934, as amended, or the Securities Act of 1933, as amended as applicable.
Sincerely, |
/s/ Robin Gold |
Name: Robin Gold |
Title: P.Eng. |
Sparwood, British Columbia |
Date: February 27, 2019 |
Exhibit 23.7
CONSENT
Reference is made to the Annual Report on Form 40-F for the year ended December 31, 2018 (the Annual Report) of Teck Resources Limited (the Company) to be filed with the United States Securities and Exchange Commission pursuant to the Securities Exchange Act of 1934, as amended.
We hereby consent to references to our firms name and all references to our name included or incorporated by reference in: (i) the Annual Report of the Company; and (ii) the Companys registration statements on Form S-8 (File Nos. 333-140184, 333-170840 and 333-205514), filed with the United States Securities and Exchange Commission pursuant to the Securities Exchange Act of 1934, as amended, or the Securities Act of 1933, as amended, as applicable.
Sincerely, |
SPROULE ASSOCIATES LIMITED |
/s/ Cameron P. Six |
Name: Cameron P. Six, P. Eng |
Title: President and CEO |
Date: February 27, 2019
Calgary, Alberta, Canada
Exhibit 23.8
CONSENT OF ENGINEER
Reference is made to the Annual Report on Form 40-F for the year ended December 31, 2018 (the Annual Report) of Teck Resources Limited (the Company) to be filed with the United States Securities and Exchange Commission pursuant to the Securities Exchange Act of 1934, as amended.
We hereby consent to references to our firms name and use of our report under the heading Description of the BusinessEnergy Fort Hills Oil Sands Mining and Processing Operation, Description of the Business Oil and Gas Reserves, Interests of Experts, and for Schedule C Report on Reserves Data by Independent Qualified Reserves Evaluator or Auditor and all other references to our name included or incorporated by reference in: (i) the Annual Report of the Company; and (ii) the Companys registration statements on Form S-8 (File Nos. 333-140184, 333-170840 and 333-205514), filed with the United States Securities and Exchange Commission pursuant to the Securities Exchange Act of 1934, as amended, or the Securities Act of 1933, as amended, as applicable.
Yours truly, |
GLJ Petroleum Consultants Ltd. |
/s/ Tim R. Freeborn |
Name: Tim R. Freeborn, P. Eng. |
Title: Vice President |
Calgary, Alberta
Date: February 27, 2019
Exhibit 31.1
CERTIFICATIONS
I, Donald R. Lindsay, certify that:
1. | I have reviewed this annual report on Form 40-F of Teck Resources Limited; |
2. | Based on my knowledge, this report does not contain any untrue statement of a material fact or omit to state a material fact necessary to make the statements made, in light of the circumstances under which such statements were made, not misleading with respect to the period covered by this report; |
3. | Based on my knowledge, the financial statements, and other financial information included in this report, fairly present in all material respects the financial condition, results of operations and cash flows of the issuer as of, and for, the periods presented in this report; |
4. | The issuers other certifying officer(s) and I are responsible for establishing and maintaining disclosure controls and procedures (as defined in Exchange Act Rules 13a-15(e) and 15d-15(e)) and internal control over financial reporting (as defined in Exchange Act Rules 13a-15(f) and 15d-15(f)) for the issuer and have: |
(a) | Designed such disclosure controls and procedures, or caused such disclosure controls and procedures to be designed under our supervision, to ensure that material information relating to the issuer, including its consolidated subsidiaries, is made known to us by others within those entities, particularly during the period in which this report is being prepared; |
(b) | Designed such internal control over financial reporting, or caused such internal control over financial reporting to be designed under our supervision, to provide reasonable assurance regarding the reliability of financial reporting and the preparation of financial statements for external purposes in accordance with generally accepted accounting principles; |
(c) | Evaluated the effectiveness of the issuers disclosure controls and procedures and presented in this report our conclusions about the effectiveness of the disclosure controls and procedures, as of the end of the period covered by this report based on such evaluation; and |
(d) | Disclosed in this report any change in the issuers internal control over financial reporting that occurred during the period covered by the annual report that has materially affected, or is reasonably likely to materially affect, the issuers internal control over financial reporting; and |
5. | The issuers other certifying officer(s) and I have disclosed, based on our most recent evaluation of internal control over financial reporting, to the issuers auditors and the audit committee of the issuers board of directors (or persons performing the equivalent functions): |
(a) | All significant deficiencies and material weaknesses in the design or operation of internal control over financial reporting which are reasonably likely to adversely affect the issuers ability to record, process, summarize and report financial information; and |
(b) | Any fraud, whether or not material, that involves management or other employees who have a significant role in the issuers internal control over financial reporting. |
Date: February 27, 2019 |
/s/ Donald R. Lindsay |
Donald R. Lindsay |
Chief Executive Officer |
Exhibit 31.2
CERTIFICATIONS
I, Ronald A. Millos, certify that:
1. | I have reviewed this annual report on Form 40-F of Teck Resources Limited; |
2. | Based on my knowledge, this report does not contain any untrue statement of a material fact or omit to state a material fact necessary to make the statements made, in light of the circumstances under which such statements were made, not misleading with respect to the period covered by this report; |
3. | Based on my knowledge, the financial statements, and other financial information included in this report, fairly present in all material respects the financial condition, results of operations and cash flows of the issuer as of, and for, the periods presented in this report; |
4. | The issuers other certifying officer(s) and I are responsible for establishing and maintaining disclosure controls and procedures (as defined in Exchange Act Rules 13a-15(e) and 15d-15(e)) and internal control over financial reporting (as defined in Exchange Act Rules 13a-15(f) and 15d-15(f)) for the issuer and have: |
(a) | Designed such disclosure controls and procedures, or caused such disclosure controls and procedures to be designed under our supervision, to ensure that material information relating to the issuer, including its consolidated subsidiaries, is made known to us by others within those entities, particularly during the period in which this report is being prepared; |
(b) | Designed such internal control over financial reporting, or caused such internal control over financial reporting to be designed under our supervision, to provide reasonable assurance regarding the reliability of financial reporting and the preparation of financial statements for external purposes in accordance with generally accepted accounting principles; |
(c) | Evaluated the effectiveness of the issuers disclosure controls and procedures and presented in this report our conclusions about the effectiveness of the disclosure controls and procedures, as of the end of the period covered by this report based on such evaluation; and |
(d) | Disclosed in this report any change in the issuers internal control over financial reporting that occurred during the period covered by the annual report that has materially affected, or is reasonably likely to materially affect, the issuers internal control over financial reporting; and |
5. | The issuers other certifying officer(s) and I have disclosed, based on our most recent evaluation of internal control over financial reporting, to the issuers auditors and the audit committee of the issuers board of directors (or persons performing the equivalent functions): |
(a) | All significant deficiencies and material weaknesses in the design or operation of internal control over financial reporting which are reasonably likely to adversely affect the issuers ability to record, process, summarize and report financial information; and |
(b) | Any fraud, whether or not material, that involves management or other employees who have a significant role in the issuers internal control over financial reporting. |
Date: February 27, 2019 |
/s/ Ronald A. Millos |
Ronald A. Millos |
Chief Financial Officer |
Exhibit 32.1
Certification Pursuant to 18 U.S.C. 1350,
As Adopted Pursuant to
Section 906 of the Sarbanes-Oxley Act of 2002
Teck Resources Limited
In connection with the annual report of Teck Resources Limited (the Company) on Form 40-F for the fiscal year ended December 31, 2018 (the Report) to which this certification is an exhibit, I, Donald R. Lindsay, Chief Executive Officer of the Company, hereby certify, pursuant to 18 U.S.C. 1350, as adopted pursuant to Section 906 of the Sarbanes-Oxley Act of 2002, that to the best of my knowledge:
1. | The Report fully complies with the requirements of Section 13(a) or 15(d) of the Securities Exchange Act of 1934; and |
2. | The information contained in the Report fairly presents, in all material respects, the financial condition and results of operations of the Company. |
Date: February 27, 2019 |
/s/ Donald R. Lindsay |
Donald R. Lindsay |
Chief Executive Officer |
Exhibit 32.2
Certification Pursuant to 18 U.S.C. 1350,
As Adopted Pursuant to
Section 906 of the Sarbanes-Oxley Act of 2002
Teck Resources Limited
In connection with the annual report of Teck Resources Limited (the Company) on Form 40-F for the fiscal year ended December 31, 2018 (the Report) to which this certification is an exhibit, I, Ronald A. Millos, Chief Financial Officer of the Company, hereby certify, pursuant to 18 U.S.C. 1350, as adopted pursuant to Section 906 of the Sarbanes-Oxley Act of 2002, that to the best of my knowledge:
1. | The Report fully complies with the requirements of Section 13(a) or 15(d) of the Securities Exchange Act of 1934; and |
2. | The information contained in the Report fairly presents, in all material respects, the financial condition and results of operations of the Company. |
Date: February 27, 2019 |
/s/ Ronald A. Millos |
Ronald A. Millos |
Chief Financial Officer |
Exhibit 95.1
Certain of the Registrants operations located in the United States are subject to the U.S. Federal Mine Safety and Health Act (the Mine Act) and are subject to regulation by the U.S. Mine Safety and Health Administration (MSHA). MSHA inspects these facilities on a regular basis and issues various citations and orders when it believes a violation has occurred under the Mine Act. Whenever MSHA issues a citation or order, it also generally proposes a civil penalty, or fine, related to the alleged violation. Citations or orders can be contested and appealed.
The following table and other data present the mine safety information related to our U.S. operations as required by section 1503(a) of the Dodd-Frank Wall Street Reform and Consumer Protection Act for the twelve months ended December 31, 2018.
Mine or Operation |
Section 104 S&S Citations(1) |
Section 104(b) Orders(2) |
Section 104(d) Citations and Orders(3) |
Section 110(b)(2) Violations(4) |
Section 107(a) Imminent Danger Orders(5) |
Total Value of MSHA Assessments Proposed(6) |
Mining- related Fatalities |
Legal Actions Pending as of Last Day of 2018 |
Legal actions instituted during 2018 |
Legal actions resolved during 2018 |
||||||||||||||||||||||||||||||
Red Dog |
10 | 0 | 0 | 0 | 0 | $ | 60,101 | 0 | 0 | 0 | 2 | |||||||||||||||||||||||||||||
Pend Oreille |
3 | 0 | 0 | 0 | 0 | $ | 10,334 | 0 | 0 | 0 | 0 |
(1) | Total number of violations of mandatory health or safety standards that could significantly and substantially contribute to the cause and effect of a coal or other mine safety or health hazard under section 104 of the Mine Act for which the operator received a citation from MSHA. This total includes any citations or orders listed under the column headed Section 104(d) Citations and Orders. |
(2) | Total number of orders under section 104(b) of the Mine Act. |
(3) | Total number of citations and orders for unwarrantable failure of the mine operator to comply with mandatory health or safety standards under section 104(d) of the Mine Act. |
(4) | Flagrant violations identified by MSHA under section 110(b)(2) of the Mine Act. |
(5) | Orders issued by MSHA under section 107(a) of the Mine Act for situations in which MSHA determined an imminent danger (as defined by MSHA) existed. |
(6) | Represents the total dollar value of the proposed assessments from MSHA against Teck Alaska Incorporated (for Red Dog) or Teck Washington Incorporated (for Pend Oreille) under the Mine Act during the twelve months ended December 31, 2018 relating to any type of violation during the period covered by this report, regardless of whether the Registrant has challenged or appealed the assessment. There may be violations which have not been assessed as at the time of this report. |
During the year ended December 31, 2018, none of the mines operated by us received written notice from MSHA of (a) a pattern of violations of mandatory health or safety standards that are of such nature as could have significantly and substantially contributed to the cause and effect of mine health or safety hazards under section 104(e) of the Mine Act or (b) the potential to have such a pattern.
Exhibit 99.1
Annual Information Form
February 25, 2019
2018 Annual Information Form
Table of Contents
Nomenclature |
1 | |||
Cautionary Statement on Forward-Looking Information |
1 | |||
Glossary of Technical Terms |
7 | |||
Corporate Structure |
9 | |||
Name, Address and Incorporation |
9 | |||
Intercorporate Relationships |
10 | |||
General Development of the Business |
12 | |||
Three-Year History |
12 | |||
2016 |
12 | |||
2017 |
12 | |||
2018 |
14 | |||
Description of the Business |
16 | |||
General |
16 | |||
Product Summary |
17 | |||
Steelmaking Coal |
17 | |||
Copper |
18 | |||
Zinc |
19 | |||
Energy |
20 | |||
Individual Operations |
21 | |||
Steelmaking Coal |
21 | |||
Copper |
30 | |||
Zinc |
45 | |||
Energy |
50 | |||
Exploration |
53 | |||
Corporate |
53 | |||
Mineral Reserves and Resources |
54 | |||
Definitions for Mineral Reserves and Mineral Resources |
61 | |||
Comments on Individual Operations |
63 | |||
Risks and Uncertainties |
67 | |||
Qualified Persons |
68 | |||
Oil and Gas Reserves |
68 | |||
Health and Safety and Environmental Protection |
77 | |||
Social and Environmental Policies |
80 | |||
Human Resources |
81 | |||
Technology |
81 | |||
Foreign Operations |
82 | |||
Competitive Conditions |
82 | |||
Risk Factors |
83 | |||
Dividends |
101 | |||
Description of Capital Structure |
101 | |||
General Description of Capital Structure |
101 |
Teck Resources Limited |
Page i |
2018 Annual Information Form
Ratings |
106 | |||
Market for Securities |
108 | |||
Trading Price and Volume |
108 | |||
Directors and Officers |
109 | |||
Directors |
109 | |||
Officers |
110 | |||
Audit Committee Information |
113 | |||
Composition of the Audit Committee |
113 | |||
Pre-Approval Policies and Procedures |
114 | |||
Auditors Fees |
114 | |||
Ownership by Directors and Officers and Interests in Material Transactions |
115 | |||
Legal Proceedings and Regulatory Actions |
115 | |||
Transfer Agents and Registrars |
118 | |||
Material Contracts |
118 | |||
Interests of Experts |
118 | |||
Disclosure Pursuant to the Requirements of the New York Stock Exchange |
120 | |||
Non-GAAP Measures |
120 | |||
Additional Information |
121 | |||
Schedule A Audit Committee Charter |
A-1 | |||
Schedule B Report of Management and Directors on Reserves Data and Other Information |
B-1 | |||
Schedule C Report on Reserves Data by Independent Qualified Reserves Evaluator or Auditor |
C-1 | |||
Schedule D List of Technical Reports |
D-1 |
Teck Resources Limited |
Page ii |
2018 Annual Information Form
Nomenclature
In this Annual Information Form, unless the context otherwise dictates, we, Teck or the Company refers to Teck Resources Limited and its subsidiaries.
Cautionary Statement on Forward-Looking Information
This Annual Information Form contains certain forward-looking information and forward-looking statements as defined in applicable securities laws (collectively referred to as forward-looking statements). These statements relate to future events or our future performance. All statements other than statements of historical fact are forward-looking statements. The use of any of the words anticipate, plan, continue, estimate, expect, may, will, project, predict, potential, should, believe and similar expressions is intended to identify forward-looking statements. These statements involve known and unknown risks, uncertainties and other factors that may cause actual results or events to differ materially from those anticipated in such forward-looking statements. These statements speak only as of the date of this Annual Information Form. These forward-looking statements include, but are not limited to, statements concerning:
∎ | forecast production; |
∎ | forecast operating costs and capital costs; |
∎ | sales forecasts; |
∎ | our strategies and objectives; |
∎ | future prices and price volatility for steelmaking coal, copper, zinc, blended bitumen and other products and commodities that we produce and sell, as well as oil, natural gas and petroleum products; |
∎ | the demand for and supply of steelmaking coal, copper, zinc, blended bitumen and other products and commodities that we produce and sell; |
∎ | expected receipt of regulatory approvals, and the expected timing thereof; |
∎ | expected receipt or completion of prefeasibility studies, feasibility studies and other studies and the expected timing thereof; |
∎ | proposed or expected changes in regulatory frameworks; |
∎ | our interest and other expenses; |
∎ | our tax position and the tax rates applicable to us; |
∎ | the adequacy of our logistics arrangements related to Fort Hills; |
∎ | curtailment measures imposed by the Government of Alberta and their impact on Fort Hills; |
∎ | the timing and costs of construction and production with respect to, and the issuance of the necessary permits and other authorizations required for, certain of our development and expansion projects, including, among others, the Quebrada Blanca Phase 2 (QB2) project, the NuevaUnión copper project, the Frontier project and our Project Satellite projects; |
Teck Resources Limited |
Page 1 |
2018 Annual Information Form
∎ | expected mine lives and the possibility of extending mine lives; |
∎ | the closure of our Coal Mountain operations, including our expectation to continue to capture latent processing capacity by hauling a portion of the raw coal from Elkview to Coal Mountain for processing; |
∎ | our estimates of the quantity and quality of our mineral and oil reserves and resources; |
∎ | the production capacity, planned production levels and future production of our operations; |
∎ | availability of transportation for our products from our operations to our customers, including our participation in the crude-by-rail initiative; |
∎ | availability of any of our credit facilities; |
∎ | financial assurance requirements related to our projects and related agreements; |
∎ | potential impact of transportation, port, pipeline and other potential production disruptions; |
∎ | our planned capital expenditures and capital spending and timing for completion of our capital projects; |
∎ | our estimates of reclamation and other costs related to environmental protection; |
∎ | our future capital and mine production costs, including the costs and potential impact of complying with existing and proposed environmental laws and regulations in the operation and closure of various operations; |
∎ | the costs, steps and potential impact of managing water quality at our coal operations, including but not limited to the statements under Description of the Business Individual Operations Steelmaking Coal Elk Valley Water Management including our expectations regarding timing and costs of active water treatment, capital spending guidance, the potential for saturated rock fills to reduce capital and operating costs associated with active water treatment, the regulatory process relating to active water treatment and estimates of our long-term costs of water management; |
∎ | our expectations regarding the increase in the royalty paid by POSCAN in respect of our Greenhills property; |
∎ | our expectation that we can upgrade Neptune Bulk Terminals operational capacity; |
∎ | our expectations regarding the regulatory application for Frontier and timelines for productions at Frontier; |
∎ | anticipated benefits, timing and cost of our ball mill project at Highland Valley; |
∎ | timing of the closing of the QB2 transaction and our expectation that the transaction will close; |
∎ | expectations regarding the QB 2 project, including expectations regarding financing, capacity, mine life, regulatory approvals, projected expenditures and timing of any development decision in respect thereof; |
∎ | expected spending and activities at our Project Satellite properties; |
Teck Resources Limited |
Page 2 |
2018 Annual Information Form
∎ | anticipated benefits, timing and costs of the Red Dog mill upgrade projects; |
∎ | our financial and operating objectives; |
∎ | our exploration, environmental, community, health and safety initiatives; |
∎ | the outcome of legal and regulatory proceedings and other disputes in which we are involved; |
∎ | the outcome of our coal sales negotiations and negotiations with metals and concentrate customers concerning treatment charges, price adjustments and premiums; |
∎ | our dividend policy; and |
∎ | general business and economic conditions. |
Canadian disclosure rules require us to present projected capital and projected operating costs for each of our material mining operations. The amounts presented for each operation are estimates, based on current mine plans and assumptions believed to be reasonable, including assumptions with respect to energy and labour costs and the Canadian/U.S. dollar exchange rate. Future capital expenditures are based on managements best estimate of expected future capital requirements for the extraction and processing of existing reserves and resources. Cash operating costs are not a measure recognized under International Financial Reporting Standards in Canada or generally accepted accounting principles in the United States. Various factors will cause actual results to vary from the projected operating and capital costs set out below. Our disclosed cash operating costs do not include transportation costs or royalties, and may not be comparable to similar measures reported by other issuers.
Inherent in forward-looking statements are risks and uncertainties beyond our ability to predict or control, including risks that may affect our operating or capital plans; risks generally encountered in the permitting and development of mineral and oil and gas properties such as unusual or unexpected geological formations, unanticipated metallurgical difficulties, delays associated with permit appeals or other regulatory processes, ground control problems, adverse weather conditions, process upsets and equipment malfunctions; risks associated with the Canadian Corruption of Foreign Public Officials Act and similar worldwide bribery laws; risks associated with labour disturbances and availability of skilled labour; risks associated with fluctuations in the market prices of our principal commodities, which are cyclical and subject to substantial price fluctuations; risks associated with changes to the tax and royalty regimes in which we operate; risks created through competition for mining and oil and gas properties; risks associated with lack of access to markets; risks associated with mineral and oil and gas reserve estimates; risks posed by fluctuations in exchange rates and interest rates, as well as general economic conditions; risks associated with access to capital; risks associated with changes to our credit ratings; risks associated with our material financing arrangements and our covenants thereunder; risks associated with climate change, environmental compliance, changes in environmental legislation and regulation and changes to our reclamation obligations; risks associated with our dependence on third parties for the provision of transportation, port, pipeline. and other critical services; risks associated with non-performance by contractual counterparties; risks associated with potential disputes with partners and co-owners; risks associated with Aboriginal title claims and other title risks; social and political risks associated with operations in foreign countries; risks associated with the preparation of our financial statements; risks related to trade barriers or
Teck Resources Limited |
Page 3 |
2018 Annual Information Form
import restrictions; risks of changes in tax laws or their interpretation; and risks associated with tax reassessments and legal proceedings. The amount and timing of actual capital expenditures is dependent upon, among other matters, being able to secure permits, equipment, supplies, materials and labour on a timely basis and at expected costs to enable the related capital project to be completed as currently anticipated. Fort Hills is not controlled by us and production schedules may be adjusted by our partners. Certain of our other operations and projects are operated through joint arrangements where we may not have control over all decisions, which may cause outcomes to differ from current expectations. Further factors associated with our Elk Valley Water Quality Plan are discussed under the heading Description of the Business Individual Operations Steelmaking Coal Elk Valley Water Management. Declaration and payment of dividends is at the discretion of the Board, and our dividend policy will be reviewed regularly and may change. Closing of the QB2 transaction depends on certain regulatory approvals; if all required approvals are not received in a timely manner, the timing and ability to close will be jeopardized.
Actual results and developments are likely to differ, and may differ materially, from those expressed or implied by the forward-looking statements contained in this Annual Information Form. Such statements are based on a number of assumptions that may prove to be incorrect, including, but not limited to, assumptions about:
∎ | general business and economic conditions; |
∎ | interest rates; |
∎ | commodity and power prices; |
∎ | acts of foreign or domestic governments and the outcome of legal proceedings; |
∎ | the supply and demand for, deliveries of, and the level and volatility of prices of copper, coal, zinc and blended bitumen and our other metals and minerals, as well as oil, natural gas and other petroleum products; |
∎ | the timing of the receipt of permits and other regulatory and governmental approvals for our development projects and other operations, including mine extensions; |
∎ | our costs of production and our production and productivity levels, as well as those of our competitors; |
∎ | our ability to secure adequate transportation, pipeline and port services for our products; |
∎ | changes in credit market conditions and conditions in financial markets generally; |
∎ | the availability of funding to refinance our borrowings as they become due or to finance our development projects on reasonable terms; |
∎ | our ability to procure equipment and operating supplies in sufficient quantities and on a timely basis; |
∎ | the availability of qualified employees and contractors for our operations, including our new developments; |
∎ | our ability to attract and retain skilled staff; |
∎ | the satisfactory negotiation of collective agreements with unionized employees; |
Teck Resources Limited |
Page 4 |
2018 Annual Information Form
∎ | the impact of changes in Canadian-U.S. dollar and other foreign exchange rates on our costs and results; |
∎ | engineering and construction timetables and capital costs for our development and expansion projects; |
∎ | costs of closure, and environmental compliance costs generally, of operations; |
∎ | market competition; |
∎ | the accuracy of our reserve and resource estimates (including, with respect to size, grade and recoverability) and the geological, operational and price assumptions on which these are based; |
∎ | tax benefits and tax rates; |
∎ | the outcome of our coal price and volume negotiations with customers; |
∎ | the outcome of our copper, zinc and lead concentrate treatment and refining charge negotiations with customers; |
∎ | the market price for our blended bitumen; |
∎ | curtailment measures on oil production taken by the Government of Alberta; |
∎ | the resolution of environmental and other proceedings or disputes; |
∎ | the future supply of low-cost power to the Trail smelting and refining complex; |
∎ | our ability to obtain, comply with and renew permits in a timely manner; and |
∎ | our ongoing relations with our employees and with our business and joint venture partners. |
In addition, assumptions regarding the Elk Valley Water Quality Plan include assumptions that additional treatment will be effective at scale, and that the technology and facilities operate as expected, as well as additional assumptions discussed under the heading Description of the Business Individual Operations Steelmaking Coal Elk Valley Water Management. Expectations regarding QB2 are based on current project assumptions and the final feasibility study. Expectations regarding Fort Hills are based on assumptions regarding the performance of the plant and other facilities at Fort Hills, and the operation of the project. Statements regarding the availability of our credit facilities are based on assumptions that we will be able to satisfy the conditions for borrowing at the time of a borrowing request and that the credit facilities are not otherwise terminated or accelerated due to an event of default. Assumptions relating to our expectations for the closing of the QB2 transaction, include that all regulatory approvals will be obtained in a timely manner.
We caution you that the foregoing list of important factors and assumptions is not exhaustive. Other events or circumstances could cause our actual results to differ materially from those estimated or projected and expressed in, or implied by, our forward-looking statements. You should also carefully consider the matters discussed under Risk Factors in this Annual Information Form and in our Cautionary Statement on Forward-Looking Information section of our Managements Discussion and Analysis for the year ended December 31, 2018, and subsequent filings, that can be found under our profile on SEDAR (www.sedar.com) and on
Teck Resources Limited |
Page 5 |
2018 Annual Information Form
EDGAR (www.sec.gov). Except as required by law, we undertake no obligation to update publicly or otherwise revise any forward-looking statements or the foregoing list of factors, whether as a result of new information or future events or otherwise.
Cautionary Note to U.S. Investors Concerning Estimates of Measured, Indicated and Inferred Mineral Resources and Oil and Gas Reserves
This Annual Information Form has been prepared in accordance with the requirements of the securities laws in effect in Canada, which differ from the requirements of U.S. securities laws.
In this Annual Information Form we use the term mineral resources and its subcategories measured, indicated, and inferred mineral resources. Readers are advised that, while such terms are required by Canadian regulations, the U.S. Securities and Exchange Commission (SEC) does not currently require U.S. mining companies in their filings with the SEC to disclose estimates of mineral resources. Investors are cautioned not to assume that any part or all of the mineral resources in these categories will ever be converted into reserves. Inferred mineral resources have a great amount of uncertainty as to their existence, and great uncertainty as to their economic and legal feasibility. Under Canadian rules, issuers must not make any disclosure of results of an economic evaluation that includes inferred mineral resources, except in very limited cases. Investors are cautioned not to assume that part or all of an inferred mineral resource exists, or is, or will be, economically or legally mineable.
Canadian standards of oil and gas disclosure also differ significantly from the requirements of the SEC, and oil and gas reserve and resource information contained in this Annual Information Form may not be comparable to similar information disclosed by U.S. companies. The oil and gas reserves estimates in this Annual Information Form have been prepared in accordance with National Instrument 51-101 Standards of Disclosure for Oil and Gas Activities, which has been adopted by securities regulatory authorities in Canada and imposes oil and gas disclosure standards for Canadian public issuers engaged in oil and gas activities and differs from the oil and gas disclosure standards of the SEC under Subpart 1200 of Regulation S-K. The SEC definitions of proved and probable reserves are different than the definitions contained in National Instrument 51-101. Therefore, proved and probable reserves disclosed in, or in the documents incorporated by reference into, this Annual Information Form in compliance with National Instrument 51-101 may not be comparable to those disclosed by U.S. companies.
Teck Resources Limited |
Page 6 |
2018 Annual Information Form
Glossary of Technical Terms
bitumen: a naturally occurring heavy viscous crude oil.
blended bitumen: bitumen blended with diluent to reduce its viscosity, such that the combined product can be easily pumped through a pipeline and placed in storage facilities.
cathode: an electrode in an electrolytic cell where electrons enter and which represents the final product of an electrolytic metal refining process.
clean coal: coal that has been processed to separate impurities and is in a form suitable for sale.
coking coal: coal possessing physical and chemical characteristics that facilitate the conversion into coke, which is used in the steelmaking process. Coking coal may also be referred to as metallurgical coal.
concentrate: a product containing valuable minerals from which most of the waste rock in the ore has been eliminated in a mill or concentrator.
crude oil: unrefined liquid hydrocarbons, excluding natural gas liquids.
dump leach: a process that involves dissolving and recovering minerals from typically lower-grade uncrushed ore from a mine dump.
flotation: a method of mineral separation in which a variety of reagents facilitate the attachment of certain minerals on to the surface of a froth while other minerals sink, thus effecting the separation of valuable minerals from non-valuable minerals.
grade: the classification of an ore according to its content of economically valuable material, expressed as grams per tonne for precious metals and as a percentage for most other metals.
hard coking coal: a type of coking coal used primarily for making high-strength coke for use in integrated steel mills.
heap leach: a process whereby metals are leached from a heap of crushed ore by leaching solutions seeping through the heap into a container or liner beneath the heap.
hypogene: primary sulphide ore located beneath shallow zones of ore affected by weathering processes.
LME: London Metals Exchange.
mill: a plant in which ore is ground to reduce particle size and physically liberating valuable from non-valuable minerals.
MMbbl: million barrels.
oil sands: sand and rock material that contains bitumen.
ore: naturally occurring material from which minerals of economic value can be extracted at a reasonable profit.
Teck Resources Limited |
Page 7 |
2018 Annual Information Form
orebody: a contiguous, well-defined mass of material of sufficient ore content to make extraction economically feasible.
pulverized coal injection (PCI) coal: coal that is pulverized and injected into a blast furnace. Those grades of coal used in the PCI process are generally non-coking. PCI grade coal is used primarily as a heat source in the steelmaking process in partial replacement for high-quality coking coals, which are typically more expensive.
semi-autogenous grinding (SAG): a method of grinding rock in which particle size reduction is achieved through tumbling action of a rotating grinding mill that primarily utilizes the contact of rock-on-rock supplemented with steel grinding balls to breakdown particles.
slag: a substance formed by way of chemical action and fusion at furnace operating temperatures; a by-product of the smelting process.
smelter: a plant in which concentrates are processed into an upgraded product by application of heat.
steelmaking coal: the various grades of coal that are used in the steelmaking process, including both coals to produce coke and coals that are pulverized for injection into the blast furnace as a fuel.
sulphide: a mineral compound containing sulphur but no oxygen.
supergene: near-surface ore that has been subject to secondary enrichment by weathering.
SX-EW: an abbreviation for solvent extraction-electrowinning, a hydrometallurgical process to produce cathode copper from leached copper ores.
tailings: the slurry that remains after selected minerals have been removed from the ore during processing.
thermal coal: coal that is used primarily for its heating value. Thermal coals tend not to have the carbonization properties possessed by coking coals. Most thermal coal is used to produce electricity in thermal power plants.
treatment and refining charges: the charge a mine pays to a smelter as a fee for conversion of concentrates into refined metal.
Teck Resources Limited |
Page 8 |
2018 Annual Information Form
Corporate Structure
Name, Address and Incorporation
Teck Resources Limited was continued under the Canada Business Corporations Act in 1978. It is the continuing company resulting from the merger in 1963 of the interests of The Teck-Hughes Gold Mines Ltd., Lamaque Gold Mines Limited and Canadian Devonian Petroleum Ltd., companies incorporated in 1913, 1937 and 1951, respectively. Over the years, several other reorganizations have been undertaken. These include our merger with Brameda Resources Limited and The Yukon Consolidated Gold Corporation in 1979, the merger with Highmont Mining Corporation and Iso Mines Limited in 1979, the consolidation with Afton Mines Ltd. in 1981, the merger with Copperfields Mining Corporation in 1983, and the acquisition of 100% of Cominco Ltd. in 2001. On July 23, 2001, Cominco Ltd. changed its name to Teck Cominco Metals Ltd. and on September 12, 2001, we changed our name to Teck Cominco Limited. On January 1, 2008, we amalgamated with our wholly owned subsidiary, Aur Resources Inc., by way of vertical short-form amalgamation under the name Teck Cominco Limited. On April 23, 2009, we changed our name to Teck Resources Limited from Teck Cominco Limited. On June 1, 2009 Teck Cominco Metals Ltd. changed its name to Teck Metals Ltd.
Since 1978, the Articles of Teck have been amended on several occasions to provide for various series of preferred shares and for other corporate purposes. On January 19, 1988, our Articles were amended to provide for the subdivision of our Class A common shares and Class B subordinate voting shares on a two-for-one basis. On September 12, 2001, the Articles were amended to effect the name change to Teck Cominco Limited and to convert each outstanding Class A common share into one new Class A common share and 0.2 Class B subordinate voting shares and to enact coattail provisions for the benefit of the Class B subordinate voting shares. Effective May 7, 2007, our Articles were amended to subdivide our Class A common shares and Class B subordinate voting shares on a two-for-one basis. See Description of Capital Structure below for a description of the attributes of the Class A common shares and Class B subordinate voting shares. On April 23, 2009, our Articles were amended to effect the name change to Teck Resources Limited as described above.
The registered and principal offices of Teck are located at Suite 3300, 550 Burrard Street, Vancouver, British Columbia, V6C 0B3.
Teck Resources Limited |
Page 9 |
2018 Annual Information Form
Intercorporate Relationships
Our financial statements consolidate the accounts of all of our subsidiaries. Our material subsidiaries as at December 31, 2018 are listed below. Unless otherwise indicated, all subsidiaries listed below are wholly owned by Teck. Indentation indicates that the majority of the voting securities of the relevant subsidiary are held by the subsidiary listed immediately above.
Company Name |
Jurisdiction of Organization or Formation
| |
Teck South American Holdings Ltd. |
Canada | |
Teck Chilean Holdings Ltd. |
Canada | |
Teck Resources Chile Limitada |
Chile | |
Teck Base Metals Ltd. |
Canada | |
Teck Metals Ltd. | Canada | |
Teck Resources Coal Partnership |
British Columbia | |
Fording Partnership |
Alberta | |
Teck Coal Partnership |
Alberta | |
Elkview Mine Limited Partnership(1) |
Alberta | |
Teck Highland Valley Copper Partnership |
British Columbia | |
TCL U.S. Holdings Ltd. |
Canada | |
TCAI Incorporated |
Washington, U.S.A. | |
Teck American Incorporated |
Washington, U.S.A. | |
Teck Alaska Incorporated |
Alaska, U.S.A. |
(1) 95% held, directly or indirectly, by Teck
In addition to the above, we own, directly or indirectly:
· | a 21.3% limited partnership interest in Fort Hills Energy Limited Partnership; |
· | a 90% indirect share interest in Compañía Minera Teck Quebrada Blanca S.A. This is expected to decrease to 60% upon closing of the transaction with Sumitomo Metal Mining Co., Ltd. and Sumitomo Corporation See Description of the Business Copper Quebrada Blanca Mine, Chile (Copper) for further information; |
· | a 90% share interest in Compañía Minera Teck Carmen de Andacollo S.A.; and |
· | a 22.5% indirect share interest in Compañía Minera Antamina S.A., which owns the Antamina copper and zinc mine in Peru. |
Teck Resources Limited |
Page 10 |
2018 Annual Information Form
The following chart sets out the relationships among our material subsidiaries as at December 31, 2018. Certain aspects of the ownership structure have been simplified.
Teck Resources Limited |
Page 11 |
2018 Annual Information Form
General Development of the Business
Three-Year History
2016
In 2016, average annual prices for our principal products increased compared to 2015, except for copper. Annual average prices in 2016 for copper and zinc were US$2.21 and US$0.95 per pound, respectively, compared with US$2.49 and US$0.87 per pound in 2015. Average realized coal prices increased from US$93 per tonne in 2015 to US$115 per tonne in 2016, due primarily to dramatic price increases in the second half of the year.
Work advanced on a number of projects through 2016. Construction of our Fort Hills oils sands project advanced through the year and was approximately 76% complete by year-end. See Description of the Business Energy for a discussion of the project. We submitted a Social and Environmental Impact Assessment for our Quebrada Blanca Phase 2 Project in September 2016 and the updated feasibility study for the project was completed in the first quarter of 2017. We also announced an agreement to increase our interest in the Zafranal project in November, through the public acquisition of AQM Copper Inc., one of our partners on the project. This acquisition was completed in January 2017.
During the year we undertook a number of transactions that supported our liquidity and strengthened our financial position. In June, we issued US$1.25 billion in aggregate principal amount of senior unsecured notes maturing in 2021 and 2024, and used the proceeds to repurchase, under a tender offer, notes maturing in 2017, 2018 and 2019, reducing near-term maturities. In September and early October we repurchased an additional US$759 million face value of debt in market transactions. We also extended the maturity of US$1.14 billion of our US$1.2 billion revolving credit facility from June 2017 to June 2019. See General Description of Capital Structure Credit Facilities and Debt Securities for further details of our credit facilities and debt securities.
Notwithstanding improving commodity prices, we continued to implement our cost reduction program through 2016 and were generally able to maintain or increase production and achieve significant reductions of cash unit costs across our operations during the year. Our cash and cash equivalents as at December 31, 2016 were $1.4 billion against total debt of $8.3 billion, with the decrease in our reported total debt mainly resulting from the repurchases described above.
2017
In 2017, average annual prices for our principal products increased compared to 2016. Annual average prices in 2017 for steelmaking coal, copper and zinc were US$174 per tonne, US$2.80 and US$1.31 per pound, respectively, compared with US$115 per tonne, and US$2.21 and US$0.95 per pound in 2016.
During the year we announced a new dividend policy, completed and announced a number of dispositions of non-core assets, acquired further interests in a number of our projects and advanced various initiatives and projects intended to strengthen our financial position and our core business.
Teck Resources Limited |
Page 12 |
2018 Annual Information Form
In April we announced a new dividend policy and the doubling of our annualized base dividend to $0.20 per share, which was declared at $0.05 per quarter. See Dividends below for a further discussion of our dividend policy. We also announced a normal course issuer bid, which allowed us to purchase up to 20 million Class B subordinate voting shares through to September 2018. In December, we paid a dividend of $0.45 per share consisting of a supplemental dividend of $0.40 per share and our regular base quarterly dividend of $0.05 per share, which totalled approximately $260 million. In addition, taking into account our strong cash position, we also announced our intention to apply an additional $230 million to the repurchase of shares through March 31, 2018, of which 5.9 million Class B subordinate voting shares for $175 million were repurchased in the fourth quarter.
In May we announced the sale of our two-thirds interest in the Waneta Dam and related transmission assets to Fortis Inc. for $1.2 billion cash. BC Hydro subsequently exercised its right of first offer over the assets, and the sale of the Waneta Dam and associated assets to BC Hydro closed in July 2018. We also completed the sale of our 49% interest in the Wintering Hills wind power facility in 2017, for proceeds of $59 million.
Acquisitions during the year included the closing of our purchase of AQM Copper Inc., which held an indirect 30% interest in our Zafranal copper-gold project located in Peru, and the acquisition of the minority 21% interest in our San Nicolás copper-zinc project located in Mexico. Zafranal and San Nicolás are part of our Project Satellite initiative launched in 2017, which is focused on surfacing value from substantial base metal assets in Tecks portfolio. See Description of the Business Copper for a further discussion of Project Satellite. In addition, we increased our interest in the Fort Hills oil sands mining and processing operations from 20% to 20.89% in 2017, and our interest ultimately increased to approximately 21.3% in 2018.
Work advanced on a number of projects through 2017. At our Fort Hills oil sands mining and processing operation, the mine, primary extraction, utilities and froth assets were commissioned. An intermediate product, bitumen froth, was produced in September 2017, and first oil was achieved on January 27, 2018. See Description of the Business Energy for a discussion of the project. We commenced a $72 million project to install an additional ball mill at our Highland Valley Copper Operations and a US$110 million upgrade project at our Red Dog zinc operations, and continued to advance through the regulatory process for our Quebrada Blanca Phase 2 project. We also commenced and advanced studies and expansion work at in respect of other projects.
We also continued to strengthen our liquidity and financial position in 2017. Over the course of the year we retired US$1.3 billion of debt through open market repurchases, tender offers and retirement at maturity. In October, we extended the maturity of our US$3.0 billion revolving credit facility to October 2022 (from July 2020) and US$1.2 billion revolving credit facility to October 2020 (from June 2019).
Our cash and cash equivalents as at December 31, 2017 were $952 million against total debt of $6.4 billion.
Teck Resources Limited |
Page 13 |
2018 Annual Information Form
2018
In 2018, average annual prices for our principal products increased compared to 2017. Average realized annual prices in 2018 for steelmaking coal, copper and zinc were US$187 per tonne, US$2.96 per pound and US$1.33 per pound, respectively, compared with US$174 per tonne, US$2.80 per pound and US$1.31 per pound, respectively, in 2017. The average realized annual price for our blended bitumen in 2018 was US$35 per barrel.
During the year we achieved first oil at Fort Hills; completed the sale of our interest in the Waneta Dam; acquired an additional 13.5% interest in Compania Minera Teck Quebrada Blanca, S.A. (QBSA), our majority owned subsidiary that holds the Quebrada Blanca Phase 2 project (QB2) and subsequently announced a transaction through which a new partner will subscribe for a 30% interest in QBSA; received regulatory approval for, and approved the construction of, our QB2 project; announced the retirement of our long-time Chairman and the appointment of his replacement; and advanced various initiatives and projects intended to strengthen our financial position and our core business.
In January, first oil was produced at Fort Hills, which has now been running at full capacity for much of the fourth quarter. Start-up has exceeded our expectations with respect to both production volumes and product quality.
In April, we acquired an additional 13.5% interest in QBSA, our majority owned subsidiary that holds the QB2 project, bringing our interest to 90%, and in August we received regulatory approval to develop the QB2 project.
In July, we completed the sale of our two-thirds interest in the Waneta Dam and related transmission assets to BC Hydro for $1.2 billion cash. In connection with the sale, we entered into a 20-year arrangement with BC Hydro, with an option to extend for an additional 10 years, to purchase power for our Trail Operations.
Work advanced on a number of projects through 2018. Our project to install an additional ball mill at our Highland Valley Copper Operations progressed, targeting commissioning in 2019, and installation of our new acid plant at our Trail Operations advanced towards commissioning in mid-2019. Work also continued on an upgrade project at our Red Dog zinc operations with planned start-up in the first quarter of 2020.
In December our Board approved the QB2 project for full construction, with first production targeted for late 2021. Concurrently, we announced a transaction through which Sumitomo Metal Mining Co. Ltd. and Sumitomo Corporation will subscribe for a 30% indirect interest in QBSA, which holds the QB2 project, by contributing US$1.2 billion to the project with additional contingent consideration payable in certain circumstances. Following closing of the transaction, Teck will hold a 60% interest in QBSA; Sumitomo Metal Mining Co., Ltd. and Sumitomo Corporation will collectively hold a 30% interest and Empresa Nacional de Minería will continue to hold a 10% carried interest.
In September, Dominic S. Barton joined our Board of Directors and in October Mr. Barton became Chair of the Board, replacing our long-standing Chairman of the Board, Dr. Norman B. Keevil, who retired, along with Mr. Warren S. R. Seyffert, Q.C., at the end of the year.
Teck Resources Limited |
Page 14 |
2018 Annual Information Form
In October, we announced a normal course issuer bid, which allows us to purchase up to 40 million Class B subordinate voting shares through to October 2019. In December, we paid a dividend of $0.15 per share consisting of a supplemental dividend of $0.10 per share and our regular base quarterly dividend of $0.05 per share, which totalled approximately $86 million. In addition, taking into account our strong cash position, we also announced that the Board has directed management to apply an additional $400 million to the repurchase of shares, of which 4.7 million Class B subordinate voting shares were repurchased in the fourth quarter for $131 million.
We also continued to strengthen our liquidity and financial position in 2018. Over the course of the year we retired US$1.0 billion of debt through open market repurchases, tender offers and retirement at maturity. In light of our strong financial position, we were able to terminate the subsidiary guarantees of our various credit facilities and public notes that were introduced during the commodity downturn in 2016.
Our cash and cash equivalents as at December 31, 2018 were $1.7 billion against total debt of $5.5 billion.
Teck Resources Limited |
Page 15 |
2018 Annual Information Form
Description of the Business
General
Tecks business is exploring for, acquiring, developing and producing natural resources. Our activities are organized into business units focused on copper, steelmaking coal, zinc and energy. These are supported by Tecks corporate offices, which manage corporate growth initiatives and provide marketing, administrative, technical, financial and other services.
We have interests in the following operations:
Type of Operation
|
Jurisdiction
| |||
Elkview
|
Steelmaking Coal Mine
|
British Columbia, Canada
| ||
Fording River
|
Steelmaking Coal Mine
|
British Columbia, Canada
| ||
Greenhills
|
Steelmaking Coal Mine
|
British Columbia, Canada
| ||
Line Creek
|
Steelmaking Coal Mine
|
British Columbia, Canada
| ||
Coal Mountain
|
Steelmaking Coal Mine
|
British Columbia, Canada
| ||
Cardinal River
|
Steelmaking Coal Mine
|
Alberta, Canada
| ||
Highland Valley
|
Copper/Molybdenum Mine
|
British Columbia, Canada
| ||
Antamina
|
Copper/Zinc Mine
|
Ancash, Peru
| ||
Quebrada Blanca
|
Copper Mine
|
Region I, Chile
| ||
Carmen de Andacollo
|
Copper/Gold Mine
|
Region IV, Chile
| ||
Trail Operations
|
Zinc/Lead Refinery
|
British Columbia, Canada
| ||
Red Dog
|
Zinc/Lead Mine
|
Alaska, U.S.A.
| ||
Pend Oreille
|
Zinc/Lead Mine
|
Washington, U.S.A.
| ||
Fort Hills
|
Oil Sands Mining and Processing Operation
|
Alberta, Canada
|
Our principal products are steelmaking coal, copper, zinc and blended bitumen. In addition we produce lead, silver, molybdenum, and various specialty and other metals, chemicals and fertilizers. We also actively explore for copper, zinc and gold.
Teck Resources Limited |
Page 16 |
2018 Annual Information Form
The following table sets out our revenue by product for each of our last two financial years:
2018
|
%
|
2017(1)
|
%
| |||||||||
Copper(2)
|
|
2.242
|
|
18
|
|
2.022
|
|
17
| ||||
Coal
|
|
6.349
|
|
50
|
|
6.014
|
|
50
| ||||
Zinc(3)
|
|
2.391
|
|
19
|
|
2.364
|
|
20
| ||||
Bitumen
|
|
0.407
|
|
3
|
|
-
|
|
-
| ||||
Other(4)
|
|
1.175
|
|
10
|
|
1.510
|
|
13
| ||||
Total
|
|
12.564
|
|
100
|
|
11.910
|
|
100
| ||||
|
(1) | Certain 2017 comparative figures have been restated for new IFRS pronouncements. Please refer to Note 32 to our audited annual consolidated financial statements for the year ended December 31, 2018. |
(2) | Copper revenues include sales of copper contained in concentrates and cathode copper. |
(3) | Zinc revenues include sales of refined zinc and zinc concentrate. |
(4) | Other revenues include sales of silver, lead, gold, molybdenum, various specialty metals, chemicals, energy and fertilizer. |
Product Summary
Steelmaking Coal
Teck is the second-largest seaborne exporter of steelmaking coal in the world. Our hard coking coal, a type of steelmaking coal, is used primarily for making coke by integrated steel mills in Asia, Europe and the Americas. In 2018, sales to Asia accounted for approximately 75% of our annual coal sales volume, higher than in 2017 due to increased sales volumes to areas with the greatest demand growth, such as India and South East Asia. Approximately 75% of all coal we produce is high-quality hard coking coal, although the percentages can vary from period to period. We also produce lesser quality semi-hard coking coal, semi-soft coking coal, PCI and thermal coal products, which in aggregate accounted for a little over 25% of our annual sales volume in 2018.
Coal is processed at our mine sites. Processed coal is primarily shipped westbound from our mines by rail to terminals along the coast of British Columbia and from there by vessel to overseas customers. In 2018, approximately 5% of our processed coal was shipped eastbound directly by rail, or by rail and by ship via Thunder Bay, to customers in North America.
Globally, we compete in the steelmaking coal market primarily with producers based in Australia and the United States. For sales to China, we also compete with Mongolian and Chinese domestic coal producers. Coal pricing is generally established in U.S. dollars and the competitive positioning among producers can be significantly affected by exchange rates. Our competitive position in the coal market continues to be determined primarily by the quality of our various coal products and our reputation as a reliable supplier, as well as by our production and transportation costs compared to other producers throughout the world.
The high-quality seaborne steelmaking coal markets are cyclical, being driven by a combination of demand, production and export capacity. Strong steel market fundamentals support demand
Teck Resources Limited |
Page 17 |
2018 Annual Information Form
and pricing for high-quality seaborne steelmaking coal. Conversely, in difficult steel markets, steelmakers can use a higher proportion of semi-soft and PCI coal products in their production process, which can result in reduced pricing premiums for higher quality hard coking coals.
Global steel production and demand for seaborne steelmaking coal remained strong in 2018. The World Steel Association reported strong steel production across all regions due to resilient steel pricing and demand supported by the recovery in investment activities in developed economies and the improved performance of emerging economies. Depletion and reduced production of some Eastern European coal mines continued to increase demand for seaborne steelmaking coal from European steel mills. A robust steelmaking coal market is supported by concerns regarding supply from Australia and the U.S, as well as demand impact of continued capacity growth in India and the relocation of steel production to coastal areas in China. While demand for steelmaking coal remains strong, pricing corrected from the beginning of 2019 reflecting shorter vessel queues in Australia and the relaxation of import restrictions in China in November 2018. We continue to monitor the effects that government policy and trade uncertainty might have on potential price volatility.
In the past few years, a number of our customers reduced the proportion of coal purchased through quarterly priced agreements and requested pricing for a portion of contract volumes on a spot basis in an effort to control costs in an environment of low steel prices. Coincident with the cyclone-induced price spike in April 2017, the pricing methodology for our quarterly contract sales changed from a negotiated quarterly benchmark to an index-linked pricing mechanism based on the average of key premium steelmaking coal price assessments. Quarterly priced sales represent approximately 40% of our sales, with the balance of our sales priced at levels reflecting market conditions when sales are concluded. Lower-grade semi-soft coals and PCI pricing continues to be negotiated on a quarterly benchmark basis.
Substantially all of our revenues from sales of coal products were derived from sales to third-party end users, most of which are steelmakers.
Copper
We produce both copper concentrates and copper cathode. Our principal market for copper concentrates is Asia, with a lesser amount sold in Europe. Copper concentrates produced at the Highland Valley Copper mine are distributed to customers in Asia by rail to a port in Vancouver, British Columbia, and from there by ship. Copper concentrates produced at Antamina are transported by a slurry pipeline to a port at Huarmey, Peru, and from there go by ship to customers in Asia and Europe. Copper concentrates produced at Carmen de Andacollo are trucked to the port of Coquimbo, Chile, and from there go by ship to customers in Asia and Europe. Copper concentrates are sold primarily under long-term contracts, with treatment and refining charges negotiated on an annual basis. Copper cathode from our Quebrada Blanca and Carmen de Andacollo mines is trucked from the mines and sold primarily under annual contracts to customers in Asia, Europe and North America.
The copper business is cyclical. Copper concentrate treatment charges rise and fall depending upon the supply of copper concentrates in the market and the demand for custom copper concentrates by the copper smelting and refining industry. Prices for copper cathode also rise and fall as a result of changes in demand for, and supply of, refined copper metal. The major use
Teck Resources Limited |
Page 18 |
2018 Annual Information Form
of refined copper is in electrical wiring and electronic applications, with prices and premiums highly dependent on the demand for electrical wire in construction, communications and automotive applications. We compete with other producers of copper concentrates and cathodes, as well as copper sourced through scrap sources.
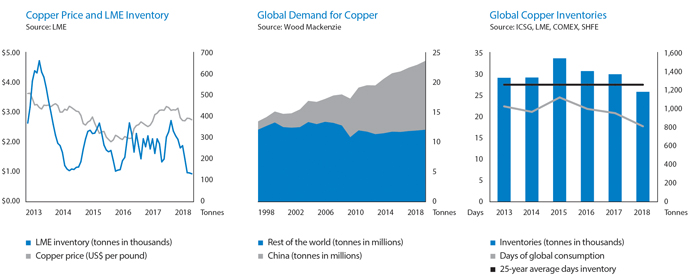
Global demand for copper metal is estimated by Wood Mackenzie to have grown by 3.0% in 2018 to reach an estimated 23.7 million tonnes. Demand improved in Asia with Chinese copper cathode demand growth estimated at 5.0% over 2017, much higher than initial projections at the beginning of the year. Demand growth in Europe was relatively flat, while demand in North America was up 3.3% with better semi-fabricated copper demand in Mexico, Canada and the US. Copper demand in South East Asia was stronger on improved export demand in several countries to meet increasing Indian demand, which was up 9.2% to 0.54 million tonnes. India was left undersupplied when one of the two domestic Indian smelters was shut during 2018, increasing export demand in South East Asia. Copper scrap availability decreased in 2018 as global trade patterns were disrupted by environmental restrictions on certain types of scrap imports into China. Scrap and unrefined copper imports into China, including blister and anode, were down 15% year-over-year to September 2018.
All of our revenues from sales of copper concentrates and cathode copper were derived from sales to third parties.
Zinc
We produce refined zinc through our metallurgical operations at Trail and zinc concentrates through our mining operations. Our principal markets for refined zinc are North America and Asia. Refined zinc produced at our metallurgical operations at Trail, British Columbia, is distributed to customers in North America by rail and/or truck and to customers in Asia by ship.
Our principal markets for zinc concentrates are Asia and Europe. In addition, in 2018 approximately 34% of zinc concentrate produced at Red Dog was sold to our metallurgical operations at Trail for treatment and refining. All of the production from our Pend Oreille zinc mine is sold to Trail.
All of our 2018 revenues from sales of refined zinc and zinc concentrates (other than zinc concentrates produced at Red Dog or Pend Oreille that are sold to Trail) were derived from sales to third parties. We strive to differentiate our refined metal products by producing the alloys, sizes and shapes best suited to our customers needs. We have substantial long-term frame contracts for the sale of zinc concentrates from the Red Dog mine to customers in Asia and Europe.
Trails supply of zinc and lead concentrates, other than those sourced from Red Dog or Pend Oreille, is provided primarily through long-term contracts with mine producers in North America, South America and Australia.
The zinc business is cyclical. Treatment and refining charges rise and fall depending upon the supply of zinc concentrates in the market and the demand for custom zinc concentrates by the zinc smelting and refining industry. Refined zinc is used primarily for galvanizing steel, and prices and premiums are highly dependent on the demand for steel products.
Teck Resources Limited |
Page 19 |
2018 Annual Information Form
Energy
In January 2018 the Fort Hills mine in Alberta, which is operated by an affiliate of Suncor Energy Inc., produced first bitumen. As required by pipelines to meet shipping viscosity requirements, we purchase diluent to blend with our bitumen production and sell a blended bitumen product known as Fort Hills Reduced Carbon Lifecycle Dilbit Blend, or FRB.
Tecks principal markets for the blended bitumen are refinery operators in Alberta, Ontario, the U.S. Midwest and the U.S. Gulf Coast. Bitumen production from Fort Hills is transported on the Northern Courier Pipeline to the East Tank Farm in Alberta, which is owned by the Thebacha Limited Partnership and operated by an affiliate of Suncor. At the East Tank Farm, the Fort Hills bitumen is blended with diluent that has been sourced and delivered from Edmonton on the Norlite Pipeline. The blended bitumen is subsequently transported from the East Tank Farm on the Wood Buffalo Pipeline to Hardisty, Alberta, where Teck has contracted storage capacity for blended bitumen.
Our tankage at Hardisty is connected to major export pipelines, including the Enbridge common carrier pipeline, the existing Keystone pipeline and the Express crude oil pipeline; it is also connected to a large unit train loading facility. We sell our share of FRB to variety of customers at the Hardisty market hub and on the U.S. Gulf Coast. Approximately 80% of our blended bitumen sales are at Hardisty, with the remainder at the U.S. Gulf Coast. We have entered into a long-term take-or-pay transportation agreement on the existing Keystone pipeline to ship 10,000 barrels per day (bpd) of blended bitumen to customers on the U.S. Gulf Coast. The balance of our production will be either sold at Hardisty or shipped to customers via the Enbridge common carrier pipeline, or transported by rail if required.
Export pipeline capacity for Canadian crude oil versus overall supply was in deficit through 2018 and is expected to remain so through 2019 and beyond, until new export capacity is developed. Exacerbating the imbalance was a slower than expected ramp-up of crude-by-rail takeaway capacity.
In support of future export pipeline expansions, we have entered into long-term transportation contracts on the proposed Kinder Morgan TransMountain and TransCanada Keystone XL pipeline expansions that, if built, will deliver to Burnaby, British Columbia and the US Gulf Coast, respectively.
Prices for our blended bitumen are market based, and determined through a combination of global and Canadian benchmark indices. Like our other commodities, the oil industry is cyclical and is highly competitive. Blended bitumen prices are influenced by a combination of North American crude oil benchmark prices, including the New York Mercantile Exchange (NYMEX) light sweet crude oil (WTI). Canadian heavy crude oil of the kind we produce trades at a differential to WTI, and is known as Western Canadian Select or WCS. WCS is a widely-marketed crude grade with transparent market price references quoted at the Hardisty market hub in Canada and the U.S. Gulf Coast. The WCS discount to WTI varies over time depending on the supply and demand for heavy crude production and the markets available to producers of those products, which are in turn influenced by available pipelines and other transportation options.
Teck Resources Limited |
Page 20 |
2018 Annual Information Form
WCS at Hardisty values were highly volatile throughout 2018 with differentials widening significantly in the third and fourth quarter. The widening was the result of overall increased Canadian crude production competing for limited export capacity and markets, exacerbated by planned maintenance turnarounds at refineries in the U.S. Midwest and Gulf Coast. The impact of these wider differentials at Hardisty to our sales values are somewhat mitigated by our sales into the U.S. Gulf Coast market.
WCS at Hardisty differentials have since materially improved, and are now reflective of the long-term average. Supply was reduced due to the announced 325,000 barrels per day production curtailment mandated by the Government of Alberta for the first quarter of 2019. The government subsequently revised the first quarter curtailment level to 250,000 barrels per day for the production months of February and March. In addition, Canadian crude-by-rail shipments sharply increased throughout 2018 and are now forecast to exceed 400,000 bpd in 2019. Throughout 2019, we will participate in the crude-by-rail initiative through an agreement to load 10,000 bpd of FRB blend onto customers railcars at Hardisty.
Individual Operations
Steelmaking Coal
Our coal mineral holdings consist of a mix of fee simple lands owned by us and Crown leases and licences, which are subject to licensing and leasing fees. In the past, renewals of these licences and leases have generally been granted, although there can be no assurance that this will continue in the future.
Five of Tecks six operating coal mines are in British Columbia and are therefore subject to the B.C. Mineral Tax which is a two-tier tax with a minimum rate of 2% and a maximum rate of 13%. A minimum tax of 2% applies to operating cash flows, as defined by the regulations. A maximum tax rate of 13% applies to cash flows after taking available deductions for capital expenditures and other permitted deductions. The Alberta Coal Royalty, which is assessed on a similar basis, at rates of 1% and 13%, apply to the Cardinal River mine in Alberta.
All of Tecks coal mines are conventional open pit operations and are designed to operate on a continuous basis, 24 hours per day, 365 days per year. Operating schedules can be varied depending on market conditions and are subject to shutdowns for maintenance activities. Capacity may be restricted for a variety of reasons and actual production will depend on sales volumes. All of the mines are accessed by two-lane all-weather roads that connect to public highways. All the mines operate under permits granted by provincial and/or federal regulatory authorities. Each of the mines will require additional permits as they progress through their long-term mine plans. The issuance of certain permits for mine life extensions may depend on a number of factors including our ability to meet the water quality targets set out in the Elk Valley Water Quality Plan, as discussed below. All permits necessary for the current operations of the mines are in hand and in good standing. Annual infill drilling programs are conducted to confirm and update the geological models used to develop the yearly mine plans.
Following mining, the coal is washed in coal preparation plants using a variety of conventional techniques and conveyed to coal or gas-fired dryers for drying. Processed coal is conveyed to clean coal silos or other storage facilities for intermediate storage and load-out to railcars.
Teck Resources Limited |
Page 21 |
2018 Annual Information Form
Our 2018 production of 26.2 million tonnes was a slight decline of 400,000 thousand tonnes from 2017, primarily due to declining production at Coal Mountain Operations as it reached the end of its life. The pressure event in the coal dryer at Elkview Operations that impacted production in the first quarter was fully offset in subsequent quarters by hauling a portion of raw coal from Elkview Operations to Coal Mountain Operations for processing.
Steelmaking coal production in 2019 is expected to be between 26.0 and 26.5 million tonnes. The business unit will continue to evaluate 2019 raw coal processing opportunities through the latent production capacity of Elk Valley processing plants. As in prior years, annual production volumes can be adjusted to reflect market demand for our products, subject to adequate rail and port service. Assuming that current market conditions persist, annual production from 2020 to 2022 is expected to be higher than in 2019.
Elk Valley Water Management
We continue to implement the water quality management measures required by the Elk Valley Water Quality Plan (the Plan), an area-based management plan that was approved in 2014 by the British Columbia Minister of Environment. The Plan establishes short-, medium- and long-term water quality targets for selenium, nitrate, sulphate and cadmium to protect the environment and human health, as well as a plan to manage calcite formation. In accordance with the Plan, we have constructed and are operating the first active water treatment facility (AWTF) at West Line Creek. In the fourth quarter of 2018, we commissioned an additional treatment step to address an issue regarding selenium compounds in effluent from the West Line Creek AWTF. The facility is operating as designed. We have commenced construction on our next AWTF at Fording River Operations, which will use the same treatment process as the modified West Line Creek AWTF.
In 2018, we successfully operated our first saturated rock fill (SRF) project at Elkview Operations. The SRF has been in operation for the past 12 months and is demonstrating near-complete removal of nitrate and selenium from the feed water. Results to date from the full-scale trial show that the technology has the potential to replace future AWTFs, as well as to reduce capital and operating costs for water treatment. We are working to increase the capacity of the Elkview SRF to potentially reduce reliance on active water treatment. This approach has not yet received necessary approvals and we continue to progress the construction of additional AWTFs to comply with the Plan.
Capital spending on water treatment in 2019 is expected to be approximately $235 million, including advancing a clean water diversion at Fording River, application of SRF technology at Elkview, construction of Fording River South AWTF, and advancing management of calcite and the early development of water treatment for Fording River North. This compares to approximately $57 million of capital spending on water treatment in 2018.
In our previous guidance, we estimated total capital spending for water treatment between 2018 and 2022 of $850 to $900 million. We intend to complete construction of the Fording River South AWTF, currently under construction. If we are successful in permitting SRF projects to replace the Elkview AWTF and the Fording River North AWTF, we estimate that total capital spending on water treatment during this period would reduce to $600 to $650 million. If no reduction in AWTF capacity is permitted, overall capital in the same period would increase by approximately $250 million over our previous guidance as a result of engineering scope changes at the Elkview
Teck Resources Limited |
Page 22 |
2018 Annual Information Form
AWTF and an increased volume of water treated at the Fording River North AWTF. We have presented regulators with evidence that SRFs are a viable technical alternative to active water treatment and are working through a review process. We expect that this process will result in a decision in the first half of 2019.
We continue to advance research and development, including the SRF technology. We estimate that over the longer term, SRFs will have capital and operating costs that are 20% and 50%, respectively, of AWTFs of similar capacity. If we are successful in replacing a substantial portion of active water treatment capacity with SRFs, we believe that our long-term operating costs associated with water treatment could be reduced substantially.
All of the foregoing estimates are uncertain. Final costs of implementing the Plan will depend in part on the technologies applied and on the results of ongoing environmental monitoring and modelling. The timing of expenditures will depend on resolution of technical issues, permitting timelines and other factors. We expect that, in order to maintain water quality, some form of water treatment will continue for an indefinite period after mining operations end. The Plan contemplates ongoing monitoring to ensure that the water quality targets set out in the Plan are in fact protective of the environment and human health, and provides for adjustments if warranted by monitoring results. This ongoing monitoring, as well as our continued research into treatment technologies, could reveal unexpected environmental impacts, technical issues or advances associated with potential treatment technologies that could substantially increase or decrease both capital and operating costs associated with water quality management.
Inability to meet targets in the Plan or new information regarding environment inputs could adversely affect our ability to extend mining operations into new areas. See Risk Factors We face risks associated with the issuance and renewal of environmental permits, Risk Factors - Failure to comply with environmental, health and safety laws may have a material adverse effect on our operations and projects and Risk Factors Changes in environmental, health and safety laws may have a material adverse effect on our operations for a further discussion of permitting and water quality management.
During the third quarter of 2018, Teck received notice from Canadian federal prosecutors of potential charges under the Fisheries Act in connection with discharges of selenium and calcite from coal mines in the Elk Valley. Since 2014, compliance limits and site performance objectives for selenium and other constituents, as well as requirements to address calcite, in surface water throughout the Elk Valley and in the Koocanusa Reservoir have been established under a regional permit issued by the Provincial government, which references the Plan. If Federal charges are laid, potential penalties may include fines as well as orders with respect to operational matters. We expect that discussions with respect to the draft charges will continue at least into the third quarter of 2019. It is not possible at this time to fully assess the viability of our potential defences to any charges, or to estimate the potential financial impact on us of any conviction. Nonetheless, that impact may be material. See Risk Factors Litigation for a further discussion of risks associated with this issue.
Teck Resources Limited |
Page 23 |
2018 Annual Information Form
Coal Transportation
Most of the coal produced at the mines in the Elk Valley region of British Columbia and at the Cardinal River mine in west-central Alberta is shipped to west coast ports in British Columbia.
Westbound rail service from the mines located in the Elk Valley is provided by Canadian Pacific Railway Company (CPR) pursuant to a 10-year agreement that expires in 2021. CPR transports a portion of these westbound shipments to Kamloops, B.C., and interchanges the trains with Canadian National Railway Company (CN) for further transportation to the west coast. CN also provides rail service from the Cardinal River mine to the west coast. Both CNs Cardinal River services and Kamloops interchange services are provided to Teck Coal under a two-year agreement that expired on December 31, 2017. We are in discussions with CN in regard to a new contract and currently operate under Tariff for each segment.
A small portion of the coal produced at the mines in the Elk Valley is transported by rail and ship via Thunder Bay Terminals in Thunder Bay, Ontario, to customers in the Great Lakes region of Canada and by direct rail to the United States. CPR transports the United States shipments via CPR directly or via the Burlington Northern Santa Fe railway, in which case CPR transports the coal from Elk Valley to Coutts, Alberta, and then interchanges the trains with the Burlington Northern Santa Fe for further transport to the United States. Rail shipments destined for Thunder Bay and the United States are transported under rail tariff and related agreements.
Teck exports its seaborne coal primarily through three west coast terminals (Westshore, Neptune and Ridley). Westshore Terminals provides ship-loading services at Roberts Bank, British Columbia, and in 2018 provided services for approximately 66% of Tecks coal shipments. Our contract with Westshore Terminals provides us with 19 million tonnes of annual capacity through to March 2021, and we have contracted capacity at Ridley Terminals near Prince Rupert to provide for steelmaking coal shipments from our Cardinal River Operations in Alberta and surge capacity to manage interruptions throughout the supply chain.
Neptune Bulk Terminals, in which we have a 46% ownership interest, has a current annual capacity for steelmaking coal shipments of 12.5 million tonnes and provides ship-loading services for steelmaking coal shipments loaded on a cost-of-service basis. Construction work to upgrade Neptunes operational capacity commenced in 2018 and is expected to be completed in the third quarter of 2020.
Property Description
The following sections cover details for each of the operating mines and potential projects. For the operating mines, the remaining reserve life is shown, calculated by dividing remaining reserves by current annual production rates. As mine plans and capacities change, these reserve lives will also change. Because each mine covers a substantial lease area, the development required for accessing the reserves can be substantial, and can involve a range of expenditures in terms of pit access and development and infrastructure to support the development. The reserve lives also assume that the required permits for life extensions will be obtained in a timely fashion to maintain production continuity, as has been the case in previous years.
Teck Resources Limited |
Page 24 |
2018 Annual Information Form
Geology of the Elk Valley Mines (B.C., Canada)
In the mines in the Elk Valley Region of British Columbia, coal is contained within the sedimentary Mist Mountain Formation of the lower Cretaceous Kootenay Group. The Mist Mountain sediments were involved in the mountain-building movements of the late Cretaceous to early Tertiary Laramide orogeny and are approximately 500 metres thick, with the depth of burial ranging from zero to 1,500 metres. The major structural features are north-south trending synclines with near horizontal to steep westerly dipping thrust faults and a few high-angle normal faults. This faulting has allowed for the Mist Mountain sequence to be repeated throughout the Elk Valley.
Fording River Mine, B.C., Canada
The Fording River mine is located 29 kilometres northeast of the community of Elkford, in southeastern British Columbia. The mine site consists of approximately 23,000 hectares of coal lands, including four operating surface coal pits along with several areas planned for surface mine development held under multiple contiguous coal leases and licences. The leases and licences relating to Fording River are held by Teck Coal. Teck Coal also controls the surface and subsurface rights to the properties that are in operation and those that are planned for development.
Coal mined at Fording River is primarily steelmaking coal, although a small amount of thermal coal is also produced. The current annual production capacities of the mine and preparation plant are approximately 9.0 million and 9.5 million tonnes of clean coal, respectively.
Approximately half of the current production is derived from the Eagle Mountain pit area with the other half produced from the Swift pit area. Proven and probable reserves at Fording River are projected to support mining at planned production rates for a further 43 years. Fording Rivers reserve areas include Eagle Mountain, Swift, Turnbull, and Castle Mountain.
2019 projected capital costs for Fording River are approximately $171 million. The major components of the projected capital costs are:
Component
|
Approximate projected cost ($/million)
| |
Sustaining |
102 | |
Major Enhancement |
69 |
Teck Resources Limited |
Page 25 |
2018 Annual Information Form
2019 projected cash operating costs for Fording River are approximately $575 million. The major components of the projected cash operating costs are:
Component
|
Approximate projected cost ($/million)
| |
Labour |
251 | |
Supplies |
235 | |
Energy |
124 | |
Other (including general & administrative, inventory changes) |
44 | |
Less amounts associated with projected capitalized stripping |
(79) | |
Total |
575 |
The cash operating costs presented above do not include transportation or royalties.
Elkview Mine, B.C., Canada
Teck Coal has a 95% partnership interest in the Elkview Mine. The remaining 5% is indirectly held equally by Nippon Steel & Sumitomo Metal Corporation, a Japanese steel producer, and POSCO, a Korean steel producer, each of which acquired a 2.5% interest in 2005. The Elkview mine is an open pit coal mine located approximately 3 kilometres east of Sparwood in southeastern British Columbia. The mine site consists of approximately 27,100 hectares of coal lands.
The coal produced is a high-quality mid-volatile hard coking coal. Lesser quantities of lower-grade hard coking coal are also produced. The current annual production capacities of the mine and preparation plant (on a 100% basis) are approximately 7.0 million and 7.0 million tonnes of clean coal, respectively.
Proven and probable reserves at Elkview are projected to support mining at planned production rates for a further 38 years.
2019 projected capital costs for Elkview are approximately $127 million. The major components of the projected capital costs are:
Component
|
Approximate projected cost ($/million)
| |
Sustaining |
37 | |
Major Enhancement |
90 |
Teck Resources Limited |
Page 26 |
2018 Annual Information Form
2019 projected cash operating costs for Elkview are approximately $345 million. The major components of the projected cash operating costs are:
Component
|
Approximate projected cost ($/million)
| |
Labour |
201 | |
Supplies |
185 | |
Energy |
104 | |
Other (including general & administrative, inventory changes) |
62 | |
Less amounts associated with projected capitalized stripping |
(207) | |
Total
|
345
|
The cash operating costs presented above do not include transportation or royalties.
Greenhills Mine, B.C., Canada
Greenhills is operated under a joint venture agreement among Teck Coal, POSCO Canada Limited (POSCAN) and POSCANs parent, POSCO. Pursuant to the joint venture agreement, Teck Coal has an 80% interest in the joint venture while POSCAN has a 20% interest. Teck Coal and POSCAN own the mine equipment and preparation plant in proportion to their respective joint venture interests. Under the joint venture agreement, Teck Coal is the manager and operator of Greenhills and takes 80% of all coal produced at Greenhills. POSCAN takes the remaining 20% and pays a quarterly royalty based on the price achieved for Greenhills coal sales.
Teck Coal and POSCAN bear all costs and expenses incurred in operating Greenhills in proportion to their respective joint venture interests. POSCAN, pursuant to a property rights grant, has a right to 20% of all coal mined from certain defined lands at Greenhills until the end of the operational phase of the joint venture; POSCAN pays Teck a royalty for access to other coal reserves owned by Teck that are processed by Greenhills equipment and facilities. The joint venture agreement provides for a review of the terms of the agreement in 2018 and 2022 and, in the event the parties disagree on the continuation of the terms of the agreement, the operational phase will come to an end. Pursuant to this review, on February 11, 2019, we agreed with POSCAN to substantially increase the royalty paid by POSCAN in respect of its 20% share of production. At current coal prices of approximately US$200 per tonne, the increase in the royalty will amount to approximately $90 million annually. The new royalty remains in effect until December 31, 2022.
The Greenhills mine is located 8 kilometres northeast of the community of Elkford, in southeastern British Columbia. The mine site consists of approximately 11,800 hectares of coal lands. Coal mined at Greenhills is primarily steelmaking coal, although a small amount of thermal coal is also produced. The current annual production capacities of the mine and preparation plant (on a 100% basis) are 5.9 million and 5.4 million tonnes of clean coal, respectively.
Production is derived primarily from the Cougar pit area. Proven and probable reserves at Greenhills are projected to support mining at planned production rates for a further 28 years.
Teck Resources Limited |
Page 27 |
2018 Annual Information Form
Our 80% share of 2019 projected capital costs for Greenhills is approximately $64 million. The major components of our share of projected capital costs are:
Component
|
Approximate projected cost ($/million)
| |
Sustaining |
46 | |
Major Enhancement
|
18
|
Our 80% share of 2019 projected cash operating costs for Greenhills is approximately $269 million. The major components of our share of projected cash operating costs are:
Component
|
Approximate projected cost ($/million)
| |
Labour |
105 | |
Supplies |
111 | |
Energy |
60 | |
Other (including general & administrative, inventory changes) |
35 | |
Less amounts associated with projected capitalized stripping |
(42) | |
Total
|
269
|
The cash operating costs presented above do not include transportation or royalties.
Coal Mountain Mine, B.C., Canada
The Coal Mountain mine is located 30 kilometres southeast of Sparwood in southeastern British Columbia. The mine site consists of approximately 3,000 hectares of coal lands
In 2018 Coal Mountain Operations experienced declining production as it reached the end of its mine reserve. Favourable geology at Coal Mountain provided an opportunity to mine and process a small amount of coal in the first quarter 2019. In 2018, we captured the latent processing capacity and hauled a portion of raw coal from the Elkview Operations to Coal Mountain Operations for processing and we anticipate this practice to continue through the first quarter of 2019.
Line Creek Mine, B.C., Canada
The Line Creek mine is located approximately 25 kilometres north of Sparwood in southeastern British Columbia. Line Creek supplies steelmaking and thermal coal to a variety of international and domestic customers. The Line Creek property consists of approximately 8,200 hectares of coal lands.
The current annual production capacities of the mine and preparation plant are approximately 4.0 million and 4.0 million tonnes of clean coal, respectively. Proven and probable reserves at Line Creek are projected to support mining at planned production rates for a further 18 years.
Teck Resources Limited |
Page 28 |
2018 Annual Information Form
Cardinal River Mine, Alberta, Canada
The Cardinal River mine is located approximately 42 kilometres south of Hinton, Alberta. Prior to 2003 the mine was owned by Luscar and CONSOL, each of which retained a net revenue royalty of 2.5% based on any coal mined from the Cheviot pit and certain other former Luscar properties. The Cardinal River mine property consists of approximately 15,300 hectares of coal lands.
In 2005, Teck Coal completed the development of the Cheviot Creek pit located approximately 20 kilometres south of the Cardinal River coal plant. Coal mined at Cardinal River is primarily steelmaking coal, although a small amount of thermal coal is also produced. The current annual production capacities of the mine and preparation plant are approximately 2.0 million and 3.5 million tonnes of clean coal, respectively.
We invested approximately $7.5 million in 2018 to continue to evaluate the MacKenzie Redcap detailed design study and will be continuing this evaluation in 2019. The MacKenzie Redcap development, if it advances, is expected to supply approximately 1.8 million tonnes of steelmaking coal production per year and has the potential to extend production at Cardinal River Operations to approximately 2027, beyond the planned closure in 2020. Beyond 2020, that additional tonnage would add to the current longer-term planned production capacity of 27 million tonnes in the Elk Valley.
Quintette Coal Project, B.C., Canada
Our Quintette mine in northeastern British Columbia has been closed since 2000. In the third quarter of 2012 we completed the feasibility study for reopening the Quintette mine. The feasibility study estimates the capital cost to reopen Quintette at $858 million, not including escalation or interest during construction. The study contemplates an average clean coal production rate of 3.5 million tonnes per year over the estimated 12-year life of Quintette. We received a Mines Act Permit Amendment for Quintette in June 2013. Quintette has been placed on care and maintenance, and the potential restart has been deferred until it is determined the market conditions would support the economics and the incremental production on a sustained basis.
Other Coal Projects, B.C., Canada
Other coal properties include Mt. Duke (92.6% interest) south of Tumbler Ridge, B.C., Elco (75% interest) at the north end of the Elk Valley, and the Coal Mountain Phase II Property (100% interest) situated between Elkview and the current Coal Mountain Operation.
Teck Resources Limited |
Page 29 |
2018 Annual Information Form
Copper
Copper Operations
Highland Valley Copper Mine, Canada (Copper)
We hold a 100% interest in the Highland Valley Copper mine located near Kamloops, British Columbia through our wholly owned subsidiary Teck Highland Valley Copper Partnership (HVC).
Highland Valleys primary product is copper concentrate; it also produces molybdenum in concentrate. The property comprising the Highland Valley Copper mine consists of mineral leases, mineral claims and Crown grants. The mine property covers a surface area of approximately 34,000 hectares and HVC holds the mineral rights to that area pursuant to various leases, claims and licences.
The Highland Valley mine is located adjacent to Highway 97C connecting Merritt, Logan Lake and Ashcroft, British Columbia. Access to the mine is from a 1-kilometre access road from Highway 97C. The mine is approximately 50 kilometres southwest of Kamloops, and approximately 200 kilometres northeast of Vancouver. The mine operates throughout the year. Power is supplied by BC Hydro through a 138-kilovolt line which terminates at the Trans-Canada Highway west of Spuzzum in the Thompson Valley. Mine personnel live in nearby areas, primarily Logan Lake, Kamloops, Ashcroft, Cache Creek and Merritt.
The mine is an open pit operation. The processing plant, which uses autogenous and semi-autogenous grinding and flotation to produce metal in concentrate from the ore, has the capacity to process up to 145,000 tonnes of ore per day, depending on ore hardness. Water from mill operations is collected and contained in a tailings impoundment area. Mill process water is reclaimed from the tailings pond. The operation is subject to water and air permits issued by the Province of British Columbia and is in material compliance with those permits. The operation holds all of the permits that are material to its current operations.
An autonomous haulage pilot project was successfully started during the second half of 2018 in the Lornex pit, with six autonomous haulage trucks now fully operational. A $73 million project to install an additional ball mill to increase grinding circuit capacity is progressing, with start-up anticipated in the third quarter of 2019. The project is anticipated to increase overall mill throughput by 5% and copper recovery by over 2% in comparison to levels that would otherwise be achieved.
Concentrates from the operation are transported first by truck to Ashcroft and then by rail to a port in Vancouver for export overseas, with the majority being sold under long-term sales contracts to smelters in Asia. The price of copper concentrate under these long-term sales agreements is based on LME prices during quotation periods determined with reference to the time of delivery, with treatment and refining charges negotiated annually. The balance is sold on the spot market. Molybdenum concentrates are sold to third-party roasters on market terms.
Ore is currently mined from the Valley and Lornex pits. The pits are located in the Guichon batholith, which hosts all of the orebodies located in the area. The host rocks of the Valley deposit are mainly porphyritic quartz monzonites and granodiorites of the Bethsaida phase of the batholith. These rocks are medium-to-coarse-grained with large phenocrysts of quartz and biotite.
Teck Resources Limited |
Page 30 |
2018 Annual Information Form
The rocks of the deposit were subjected to hydrothermal alteration followed by extensive quartz veining, quartz-sericite veining, and silicification. Bornite, chalcopyrite and molybdenum were introduced with the quartz and quartz-sericite veins and typically fill angular openings in them. Accessory minerals consist of hornblende, magnetite, hematite, sphene, apatite and zircon. Pre-mineral porphyry and aplite dykes intrude the host rocks of the deposit.
The Lornex orebody occurs in skeena quartz diorite host rock, intruded by younger pre-mineral quartz porphyry and aplite dykes. The skeena quartz diorite is an intermediate phase of the Guichon batholith and is generally a medium-to-coarse grained equigranular rock distinguished by interstitial quartz and moderate ferromagnesian minerals. The sulphide ore is primarily fracture fillings of chalcopyrite, bornite and molybdenite with minor pyrite, magnetite, sphalerite and galena.
In 2015, additional drilling and engineering studies were conducted to define resources near the existing Valley, Lornex and Highmont pits, and to examine other options to optimize and extend production past the current mine life. Additional drilling and studies were conducted in 2016 and 2017 focused on evaluating the viability of a substantial expansion of the Valley and Highmont pits.
In 2018, 77 diamond drillholes, totalling approximately 16,800 metres, were drilled in the Valley, Lornex and Highmont pit areas. In addition, 13 holes, totalling 3,500 metres, were drilled near the pits and in the surrounding district. Quick logs of these holes indicate no material impacts on the quantity or grade of reserves and resources. Diamond drill core is split in halves using core saws and sampled in two-metre intervals (HQ diameter core). One half is sent to an independent, off-site laboratory for analysis and the other is retained for future reference. Field duplicates and external umpire checks of approximately 5% of pulp samples are elements of the Highland Valley quality assurance/quality control program procedures.
Highland Valley Coppers 2018 copper production was 100,800 tonnes, compared to 92,800 tonnes in 2017 and 119,300 tonnes in 2016. The increase in 2018 was primarily due to significantly higher copper grades and higher recoveries in the first half of 2018 compared to 2017. Copper and molybdenum ore grades declined as expected in the second half of 2018 as we mined ore from lower-grade sections of the Lornex and Valley pits. Grades are expected to increase further in 2019 in accordance with the current life of mine plan. Molybdenum production was slightly lower in 2018 at 8.7 million pounds, compared to 9.3 million pounds in 2017.
Copper production in 2019 is anticipated to be between 115,000 and 120,000 tonnes, with a relatively even distribution throughout the year. We expect annual copper production from 2020 to 2022 to be between 135,000 and 155,000 tonnes per year, increasing from the low end to the high end of the range during the three-year period. Copper production is anticipated to average about 150,000 tonnes per year after 2022, through to the end of the current mine plan in 2028. Molybdenum production in 2019 is expected to be approximately 6.0 million pounds contained in concentrate, with annual production expected to decline to between 4.0 and 5.0 million pounds per year afterwards. We have commenced studies to assess the potential economic viability of extending the Highland Valley Copper mine life to 2040.
See Mineral Reserves and Resources for information about the mineral reserve and resource estimates for Highland Valley, including metal price and exchange rate assumptions.
Teck Resources Limited |
Page 31 |
2018 Annual Information Form
The Highland Valley copper mine is subject to the B.C. Mineral Tax which is a two-tier tax with a minimum rate of 2% and a maximum rate of 13%. A minimum tax of 2% applies to operating cash flows, as defined by the regulations. A maximum tax rate of 13% applies to cash flows after taking available deductions for capital expenditures and other permitted deductions.
2019 projected capital costs for Highland Valley are approximately $120 million. The major components of the projected capital costs are:
Component
|
Approximate projected cost ($/million)
| |
Sustaining | 64 | |
Major enhancement | 56 |
2019 projected aggregate cash operating costs for Highland Valley are approximately $557 million. The major components of the projected cash operating costs are:
Component
|
Approximate projected cost ($/million)
| |
Labour | 259 | |
Supplies | 216 | |
Energy | 112 | |
Other (including general & administrative, inventory changes) | 56 | |
Less amounts associated with projected capitalized stripping | (86) | |
Total | 557 |
The cash operating costs presented above do not include transportation or royalties.
Antamina Mine, Peru (Copper, Zinc)
We own indirectly 22.5% of the Antamina copper/zinc mine in Peru, with the balance held indirectly by BHP Billiton plc (33.75%), Glencore plc (33.75%) and Mitsubishi Corporation (10%). The participants interests are represented by shares of Compañía Minera Antamina S.A. (CMA), the Peruvian company that owns and operates the project. Our interest is subject to a net profits royalty of 1.667% on CMAs free cash flow.
The Antamina property consists of numerous mining concessions and mining claims covering an area of approximately 82,200 hectares and an area of approximately 15,000 hectares of surface rights. These rights concessions and claims can be held indefinitely, contingent upon the payment of annual licence fees and provision of certain production and investment information. CMA also owns a port facility located at Huarmey and an electrical substation located at Huallanca. In addition, CMA holds title to all easements and rights of way for the 302-kilometre concentrate pipeline from the mine to CMAs port at Huarmey.
The deposit is located at an average elevation of 4,200 metres, 385 kilometres by road and 270 kilometres by air north of Lima, Peru. Antamina lies on the eastern side of the Western
Teck Resources Limited |
Page 32 |
2018 Annual Information Form
Cordillera in the upper part of the Rio Marañon basin. Mine personnel live in a camp facility while at work and commute from both local communities and larger population centres, including Lima.
The mine is an open pit, truck-and-shovel operation. The ore is crushed within the pit and conveyed through a 2.7-kilometre tunnel to a coarse ore stockpile at the mill. It is then processed utilizing two SAG mills, followed by ball mill grinding and flotation to produce separate copper, zinc, molybdenum and lead/bismuth concentrates. The mill has the capacity to process approximately 145,000 tonnes per day, depending on ore hardness. A 302-kilometre-long slurry concentrate pipeline, approximately 22 centimetres in diameter with a single pump station at the mine site, transports copper and zinc concentrates to the port where they are dewatered and stored prior to loading onto vessels for shipment to smelters and refineries worldwide.
The mine is accessible via an access road maintained by CMA. Power for the mine is taken from the Peru national energy grid through an electrical substation constructed at Huallanca. Fresh water requirements are sourced from a dam-created reservoir upstream from the tailings impoundment facility. The tailings impoundment facility is located next to the mill. Water reclaimed from the tailings impoundment is used as process water in the mill operation. The operation is subject to water and air permits issued by the Government of Peru and is in material compliance with those permits. The operation holds all of the permits that are material to its current operations.
The Antamina polymetallic deposit is skarn-hosted. It is unusual in its persistent mineralization and predictable zonation, and has a SW-NE strike length of more than 2,500 metres and a width of up to 1,000 metres. The skarn is well-zoned symmetrically on either side of the central intrusion with the zoning used as the basis for four major subdivisions being a brown garnet skarn, green garnet skarn, wollastonite/diopside/green garnet skarn and a marbleized limestone with veins or mantos of wollastonite. Other types of skarn, including the massive sulphides, massive magnetite, and chlorite skarn, represent the remainder of the skarn and are randomly distributed throughout the deposit. The variability of ore types can result in significant changes in the relative proportions of copper and zinc produced in any given year.
In 2018, 15 primary and 43 branch infill drillholes, as well as five primary and nine branch deep drillholes were completed within the Antamina pit, for a total of approximately 41,200 metres. For diamond core, three-metre samples of half core (HQ or NQ) are collected and prepared for assay at an external laboratory. The remaining half of the core is retained for future reference. The assay program includes approximately 15% of quality-control samples, comprising reference materials, duplicates and blanks. The reference materials consist of matrix-matched material from Antamina, homogenized and certified in accordance with industry practice.
Antaminas copper production (100% basis) in 2018 was 446,100 tonnes, compared to 422,500 tonnes in 2017, with the increase primarily as a result of higher copper grades and recovery, partially offset by processing less copper-only ore. Zinc production was 409,300 tonnes in 2018, an increase from 372,100 tonnes produced in 2017, primarily due to processing more copper-zinc ore. In 2018, molybdenum production was 10.2 million pounds, which was 17% higher than 2017.
Our 22.5% share of Antaminas 2019 production is expected to be in the range of 95,000 to 100,000 tonnes of copper, 65,000 to 70,000 tonnes of zinc and approximately 2.0 million pounds of molybdenum in concentrate. The lower zinc production in 2019 is a result of mine sequencing,
Teck Resources Limited |
Page 33 |
2018 Annual Information Form
and is expected to return to higher production levels after 2019 with higher grades and a higher proportion of copper-zinc ore to process. Our share of copper production is expected to be between 90,000 and 95,000 tonnes per year from 2020 to 2022. Our share of zinc production is expected to average between 100,000 and 110,000 tonnes per year from 2020 to 2022, although annual production will fluctuate due to feed grades and the amount of copper-zinc ore processed. Our share of annual molybdenum production is expected to be between 2.0 and 3.0 million pounds per year between 2020 and 2022.
Antamina has entered into long-term off-take agreements with affiliates of the Antamina shareholders on market terms for copper, zinc and molybdenum concentrates.
In Peru, the mining tax regime includes the Special Mining Tax and the Modified Mining Royalty, which apply to CMAs operating margin based on a progressive sliding scale ranging from 3% to 20.4%. CMA is also subject to Peruvian income tax.
Based on current designed tailings storage capacity, the mine life is expected to continue until 2028. CMA is currently conducting engineering studies for additional tailings storage options and alternative mine plans that could result in significant mine life extensions.
Our 22.5% share of 2019 projected capital costs for Antamina is approximately US$77 million. The major components of the projected capital costs are:
Component | Approximate projected cost (US$/million)
| |
Sustaining | 67 | |
Major Enhancement | 10 |
Our 22.5% share of 2019 projected cash operating costs for Antamina is approximately US$179 million. The major components of the projected cash operating costs are:
Component | Approximate projected cost (US$/million)
| |
Labour | 91 | |
Supplies | 94 | |
Energy | 45 | |
Other (including general & administrative, inventory changes) | 11 | |
Less amounts associated with projected capitalized stripping | (62) | |
Total | 179 |
The cash operating costs presented above do not include transportation or royalties.
Under a long-term streaming agreement with FN Holdings ULC (FNH), a subsidiary of Franco-Nevada Corporation, Teck has agreed to deliver silver to FNH equivalent to 22.5% of the payable silver sold by Compañía Minera Antamina S.A. FNH made a payment of US$610 million on
Teck Resources Limited |
Page 34 |
2018 Annual Information Form
closing of the arrangement in 2015 and will pay 5% of the spot price at the time of delivery for each ounce of silver delivered under the agreement, in addition to an upfront acquisition price paid in a previous year. After 86 million ounces of silver have been delivered under the agreement, the stream will be reduced by one-third. The streaming agreement restricts distributions from Teck Base Metals, our subsidiary that holds our 22.5% interest in CMA, to the extent of unpaid amounts under the agreement if there is an event of default under the streaming agreement or an insolvency of Teck. Compañía Minera Antamina S.A., which owns and operates Antamina, is not a party to the agreement and operations will not be affected by it.
The labour agreement at Antamina expired in the third quarter of 2018; negotiations for a new agreement are ongoing.
Quebrada Blanca Mine, Chile (Copper)
The Quebrada Blanca mine is owned by a Chilean private company, Compañía Minera Teck Quebrada Blanca S.A. (QBSA). In April 2018, we acquired an additional 13.5% indirect interest in QBSA and as of December 31, 2018 we own 100% of the Series A shares of QBSA and 100% of the Series C shares of QBSA. Empresa Nacional de Minería (ENAMI), a Chilean government entity, owns 100% of the Series B shares of QBSA. When combined with the Series B shares of QBSA, our 100% interest in the Series A and Series C shares equates to a 90% interest in QBSAs total share equity. ENAMIs 10% interest is a carried interest and, as a result, ENAMI is generally not required to contribute further funding to QBSA and is entitled to a minimum dividend in certain circumstances.
In December, we announced a transaction through which Sumitomo Metal Mining Co. Ltd. and Sumitomo Corporation will subscribe for a 30% indirect interest in QBSA by contributing US$1.2 billion to the project with additional contingent consideration due in certain circumstances. The transaction is expected to close at the end of March. Following the transaction, Teck will hold a 60% interest in QBSA; Sumitomo Metal and Sumitomo Corporation will collectively hold a 30% interest in QBSA and ENAMI will continue to hold a 10% carried interest.
QBSA owns the exploitation and/or exploration rights in the immediate area of the Quebrada Blanca deposit pursuant to various mining concessions and other rights. There are currently 119,587 ha of mining rights incorporating exploitation and exploration mining concessions held in the name of QBSA. The exploitation mining concessions have no expiry date. In addition, QBSA holds surface rights covering the mine site and other areas aggregating approximately 3,150 hectares as well as certain other exploration rights in the surrounding area and certain water rights.
The Quebrada Blanca property is located in the Tarapacá Region of northern Chile approximately 240 kilometres southeast of the port city of Iquique and 1,500 kilometres north of the city of Santiago, the capital of Chile. The Quebrada Blanca property is located approximately 4,400 metres above sea level. The local topography is represented by rounded hills disrupted by steep gulches. Vegetation cover consists of sparse tufts of grass and small shrubs. Access to the mine site is via road from Iquique. Mine personnel are based in a camp facility, and the majority commute from large population centres, including Iquique and Santiago.
Teck Resources Limited |
Page 35 |
2018 Annual Information Form
Previously mined for its surficial supergene mineralization, the Quebrada Blanca Cu-Mo sulfide deposit is characterized by a series of Eocene-Oligocene aged intrusions, hydrothermal breccias and vein-related mineralization over an area of ~5 x 3 km and controlled primarily by a north-east oriented structures. Alteration associated with the emplacement of the porphyritic and related intrusions includes chalcopyrite- and bornite-related veins, disseminations, and cement fill associated with potassic alteration. A large, vertically zoned hydrothermal breccia developed in associated with the potassic event. This breccia has biotite, biotite-magnetite, chalcopyrite and locally bornite preserved at depth, whilst at shallower levels it transitions to a tourmaline-rich breccia with pyrite and chalcopyrite. A series of quartz-molybdenite veins are commonly associated with the biotite-magnetite breccia on the east side of the deposit. A subsequent chalcopyrite and molybdenite event cuts across the system and is characterized by grey-green sericite and quartz veins. This type of transitional alteration is best-preserved in the western part of the deposit. A late quartz-sericite-pyrite assemblage cuts the copper-bearing stages, and is strongly controlled by northwest-oriented structures. This phyllic event also occurs along northeast-oriented structures, which were a key control in the location of the supergene mineralization at surface.
The Quebrada Blanca orebody occurs within a 2-kilometre by 5-kilometre quartz monzonite intrusive stock. Supergene enrichment processes have dissolved and redeposited primary (hypogene) chalcopyrite as a blanket of supergene copper sulphides, the most important being chalcocite and covellite, with lesser copper oxides/silicates such as chrysocolla in the oxide zone. Irregular transition zones, with (locally) faulted contacts separate the higher and lower-grade supergene/dump leach ores from the leached cap and hypogene zones.
Quebrada Blanca is an open pit mine that produces ore that, since the first quarter of 2017, has been sent directly to the dump leach circuit. Prior to the first quarter of 2017, ore was sent for both heap leach and dump leach production. Copper-bearing solutions are collected from the heap and dump leach pads for processing in an SX-EW plant that produces copper cathode. Mining operations in the open pit were suspended in the fourth quarter of 2018 as the supergene ore was exhausted. Copper cathode production is expected to continue through early 2020. Copper cathode is trucked to Iquique for shipment to purchasers.
The majority of copper cathode produced at Quebrada Blanca is sold under annual contracts to metal consumers and metal trading companies. The remaining copper cathode is sold on the spot market. The price of copper cathodes is based on LME prices plus a premium based on market conditions.
Quebrada Blanca produced 25,500 tonnes of copper cathode in 2018, compared to 23,400 tonnes in 2017. We expect production of approximately 20,000 to 23,000 tonnes of copper cathode in 2019.
Quebrada Blanca Phase 2
As previously outlined, Quebrada Blanca Phase 2 (QB2) is expected to extend the life of the existing mine as a large-scale concentrate-producing operation. As part of the regulatory process for Quebrada Blanca Phase 2, we submitted a Social and Environmental Impact Assessment (SEIA) to the Region of Tarapacá Environmental Authority in the third quarter of 2016, which was approved in August 2018. As expected, various administrative and legal appeals have been filed
Teck Resources Limited |
Page 36 |
2018 Annual Information Form
in respect of the SEIA approval, and QBSA and the relevant Chilean authorities are responding in the ordinary course.
The project was approved for full construction in December 2018. Teck, SMM and SC are in discussions with export credit agencies and commercial banks with respect to a proposed limited recourse project finance facility of up to US$2.5 billion. The combination of proceeds from the transaction with SMM and SC and the proposed project financing will reduce Tecks share of equity contributions toward the un-escalated US$4.739 billion estimated capital cost of the QB2 project to approximately US$700 million with Tecks first contributions post-closing not required until late 2020. The target date for project completion and the start of commissioning and ramp up is the fourth quarter of 2021. Full production is expected in the middle of 2022.
In early 2017, we completed an updated feasibility study on the QB2 project, which incorporates recent project optimization and certain scope changes, including a different tailings facility located closer to the mine. The 2017 feasibility study estimated a capital cost for the development of the project on a 100% basis of US$4.7 billion (in first quarter 2016 dollars, not including working capital or interest during construction). The study is based on an initial mine life of 25 years, consistent with the capacity of the new tailings facility. Various aspects of the QB2 project have been optimized and updated based on additional technical and engineering work completed since the 2017 feasibility study, in anticipation of the decision to sanction the project. Capital and operating costs have been re-estimated. The capital cost for development of the project is now estimated at US$4.739 billion as of January 1, 2019 (in constant Q2 2017 dollars, not including working capital, escalation or interest during construction, and assuming a CLP/USD exchange rate of 625). Detailed engineering for the project is nearly 80% complete, and procurement is well advanced, increasing confidence in the capital cost estimate and construction schedule.
Mining operations will continue to use open pit methods, and conventional truck-and-shovel operations. From an operational standpoint, QB2 represents a continuation of the existing supergene mining activities; however, there are significant differences between the two mining operations, such as the significant increase in the ultimate pit depth, the change in mineralization type from enriched supergene to hypogene, and the proposed increase to the mining extraction rate.
The project scope includes the construction of a 143,000 tonne per day concentrator and related facilities, which will be connected to a new port and desalination plant by 165 kilometre concentrate and desalinated water pipelines. An additional access road, known as the A-97 bypass, will be constructed from the A-97B highway to the mine. In addition, there will be construction of a new overhead high voltage electric power transmission line. The primary crushing facility will contain a single primary crusher with a double-sided dump pocket for dumping ore from the mine haulage trucks. The coarse ore conveyor facility will consist of two overland conveyors to transport the crushed ore from the primary crusher to the coarse ore stockpile. The coarse ore stockpile will have a live capacity of 80,000 tonnes, and an overall 270,000 tonne capacity. The concentrator facility will contain two semi-autogenous grinding mills and four ball mills, cyclone feed pumps, and cyclone clusters.
On a 100% basis, average annual production capacity is expected to be 316,000 tonnes of copper equivalent per year for the first full five years of mine life.
Teck Resources Limited |
Page 37 |
2018 Annual Information Form
QBSA has signed a number of power purchase agreements for electric power supply for QB2. There are three primary power purchase agreements for QB2 with staggered supply dates. Each of these agreements imposes a take-or-pay obligation on QBSA, under which QBSA is required to pay for the contracted power regardless of whether it is required in the operations. Supply from the first contract commenced in the fourth quarter of 2016 and the other supply dates commenced in early 2018.
QBSAs obligations under the power purchase agreements are guaranteed by Teck until QB2 enters production. So long as Tecks unsecured unsubordinated debt does not carry an investment grade credit rating from Moodys, Standard & Poors or Fitch ratings agencies (or any two of these agencies, if Teck is rated by more than one of them), we are required to deliver letters of credit to support these guarantees. As of December 31, 2018, there were US$672 million of letters of credit outstanding to support the guarantees. On February 21, 2019, Teck received its second investment grade credit rating and requested termination of all of the letters of credit relating to the QB2 power purchase agreements. Teck has delivered parent guarantees in replacement of the letters of credit.
The aggregate fixed commitment of the three primary power supply agreements is approximately US$6.8 million per month, determined as of December 31, 2018. QBSA is taking steps to manage its exposure, and may sell power at spot market rates or under contract to offset its exposure under these take-or-pay contracts until power is required for the QB2 project. Based on current spot market rates, current mitigation efforts and QBSAs projected power consumption, its net estimated aggregate monthly exposure under its power arrangements is anticipated to be in the range of US$5.5 to US$6.6 million in 2019. Teck has agreed to cover Sumitomos share of the cost of power under these existing power purchase agreements in excess of QBSAs actual needs until the earlier of the start-up of the first grinding line in the mill or September 30, 2022.
In 2018, 39 diamond drillholes were completed within the Quebrada Blanca deposit for a total of approximately 18 kilometers. For diamond core, 3-metre samples of half core are taken and crushed for assay at an external laboratory. The remaining half of the core is retained for future reference. The assay program includes approximately 15% of quality-assurance/quality-control samples, comprising reference materials, duplicates and blanks. The reference materials consist of matrix-matched material from Quebrada Blanca, homogenized and certified in accordance with industry practice.
2019 projected capital costs for QB2 are approximately US$1,460 million. Assuming completion of the transaction with Sumitomo at the end of March, as expected, our share of the 2019 projected capital costs will be limited to approximately US$285 million. The major components of the projected capital costs are:
Component | Approximate projected cost (US$/million)
| |
New Mine Development | 1,460 |
Teck Resources Limited |
Page 38 |
2018 Annual Information Form
QB2 has a 28 year mine life and the Sanction Case (described below) includes 199 million tonnes of inferred resources within the life of mine plan. The majority of this inferred material is not scheduled to be mined until late in the mine life and is displacing lower grade economic material within the pit. Teck refers to the planned development of the QB2 project that includes these inferred resources as the Sanction Case. Inferred resources are considered too speculative geologically to have the economic considerations applied to them that would enable them to be categorized as mineral reserve. Inferred resources are subject to greater uncertainty than measured or indicated resources and it cannot be assumed that they will be successfully upgraded to measured and indicated through further drilling. Based on Tecks understanding of the deposit and history of resource to reserve conversion, the Sanction Case is regarded as a realistic and financeable development plan; however, key information regarding the reserve-only case is included in the table below for reference.
The table below summarizes the financial projections of the planned operation of QB2 for both the reserve case and the Sanction Case:
100% Project Basis(1)(2)
|
Units | Reserve Case | Sanction case | |||
IRR |
% | 13.5% | 14.1% | |||
NPV |
US$ M | $2,030 | $2,426 | |||
Average Annual Cash Flow 1st Five Years(3) |
US$ M | $935 | $956 | |||
Average Annual Cash Flow After 1st Five Years(4) |
US$ M | $496 | $585 | |||
Payback Period |
years | 5.7 | 5.6 |
(1) | Assumes US$3.00 per pound of copper; US$10.00 per pound of molybdenum and US$18.00 per ounce of silver |
(2) | As at January 1, 2019 on an unlevered, after-tax bases for a Chilean domiciled entity assuming an optimized funding structure |
(3) | Excludes the first partial year of operation |
(4) | Excludes the last partial year of operation |
Taxes payable in Chile that affect the operation include the Chilean Specific Mining Tax which applies to operating margin based on a progressive sliding scale from 5% to 14%. QBSA is also subject to federal income tax in Chile.
Carmen de Andacollo Mine, Chile (Copper)
The Carmen de Andacollo property is owned by a Chilean private company, Compañía Minera Teck Carmen de Andacollo (CDA). We own 100% of the Series A shares of CDA while ENAMI owns 100% of the Series B shares of CDA. Our Series A shares of CDA equate to 90% of CDAs total share equity and ENAMIs Series B shares comprise the remaining 10% of total share equity. ENAMIs interest is a carried interest and, as a result, ENAMI is not required to contribute further funding to CDA.
CDA owns the exploitation and/or exploration rights over an area of approximately 206 square kilometres in the area of the Carmen de Andacollo supergene and hypogene deposits pursuant to
Teck Resources Limited |
Page 39 |
2018 Annual Information Form
various mining concessions and other rights. In addition, CDA owns the surface rights covering the mine site and other areas aggregating approximately 21 square kilometres as well as certain water rights. Since 1996, CDA has been conducting mining operations on the supergene deposit on the Carmen de Andacollo property that overlies the hypogene deposit and since 2010 has been processing hypogene ore through a concentrator on the site.
The Carmen de Andacollo property is located in Coquimbo Province in central Chile. The site is adjacent to the town of Carmen de Andacollo, approximately 55 kilometres southeast of the city of La Serena and 350 kilometres north of Santiago. Access to the Carmen de Andacollo mine is by paved roads from La Serena. The mine is located near the southern limit of the Atacama Desert at an elevation of approximately 1,000 metres. The climate around Carmen de Andacollo is transitional between the desert climate of northern Chile and the Mediterranean climate of the Santiago area. The majority of mine personnel live in the town of Carmen de Andacollo, immediately adjacent to the mine, or in the nearby cities of Coquimbo and La Serena.
The Carmen de Andacollo orebody is a porphyry copper deposit consisting of disseminated and fracture-controlled copper mineralization contained within a gently dipping sequence of andesitic to trachytic volcanic rocks and sub-volcanic intrusions. The mineralization is spatially related to a feldspar porphyry intrusion and a series of deeply rooted fault structures. A primary copper-gold sulphide hypogene deposit containing principally disseminated and quartz vein-hosted chalcopyrite mineralization lies beneath the supergene deposit. The hypogene deposit was subjected to surface weathering processes, resulting in the formation of a barren leached zone 10 to 60 metres thick. The original copper sulphides leached from this zone were re-deposited below the barren leached zone as a copper-rich zone comprised of copper silicates (chrysocolla) and supergene copper sulphides (chalcocite with lesser covellite).
The Carmen de Andacollo mine is an open pit mine. Copper concentrate is produced by processing hypogene ore through semi-autogenous grinding and a flotation plant with the capacity to process up to 55,000 tonnes of ore per day depending on ore hardness. Some supergene ore is also mined, which is transported to heap leach pads. Copper-bearing solutions are processed in an SX-EW plant to produce grade A copper cathode.
The majority of copper cathode produced at Carmen de Andacollo is sold under annual contracts with metal trading companies. The remaining Carmen de Andacollo copper cathode production is sold in the spot market. The price of copper cathodes is based on LME prices plus a premium based on market conditions. Copper concentrates are sold under long-term contracts to smelters in Asia and Europe, using the LME price as the basis for copper pricing, and with treatment and refining charges negotiated on an annual basis.
During 2018, nine diamond drillholes totalling approximately 2,200 metres were drilled at the Carmen de Andacollo mine. Four of these drillholes were for geological logging and grade modelling purposes, and five of these drillholes were for geotechnical and hydrogeological purposes. The geological logging of these drillholes confirms the geological features identified in the deposit and only local changes of geological boundaries were recognized. Diamond drill core is split in halves and sampled in 2.5-metre intervals. One half is sent to the lab at the site for analysis and the other is retained for future reference. For this drilling campaign, one in five samples was submitted to metallurgical testing; subsequently, these samples were returned to the mechanical preparation process. Coarse blank, field duplicated (prior to shipment to the
Teck Resources Limited |
Page 40 |
2018 Annual Information Form
laboratory), crushing duplicated, fine coarse blank, pulp duplicated and standards were used as part of the quality assurance/quality control program.
Carmen de Andacollo produced 63,500 tonnes of copper contained in concentrate in 2018, 12% less than 2017, primarily due to lower copper grades as anticipated in the mine plane partially offset by higher mill throughput. Copper cathode production was 3,700 tonnes in 2018, compared with 3,500 tonnes in 2017. Gold production, on a 100% basis, of 59,600 ounces was higher than the 54,500 ounces produced in 2017, with 100% of the gold produced for the account of RGLD Gold AG, a wholly owned subsidiary of Royal Gold, Inc. In effect, 100% of gold production from the mine has been sold to RGLD Gold AG, which pays a cash price of 15% of the monthly average gold price at the time of each delivery, in addition to an upfront acquisition price paid in previous years.
Consistent with the mine plan, copper grades are expected to continue to decline towards reserve grades in 2019 and future years. Carmen de Andacollos production in 2019 is expected to be in the range of 60,000 to 65,000 tonnes of copper in concentrate and approximately 2,000 tonnes of copper cathode. Annual copper in concentrate production is expected to be approximately 60,000 tonnes for the subsequent three-year period. Cathode production volumes are uncertain past 2019, although there is some potential to extend production.
The current life of mine for Carmen de Andacollo is expected to continue until 2035. Additional permitting or amendments will be required to execute the life of mine plan.
Taxes payable in Chile that affect the operation include the Chilean Specific Mining Tax which applies to operating margin based on a progressive sliding scale from 5% to 14%. CDA is also subject to federal income tax in Chile.
Project Satellite
In March 2017, we publicly launched our Project Satellite initiative, the focus of which is to surface value from five substantial base metals assets all of which are located in the Americas: Zafranal, San Nicolás, Galore Creek, Mesaba, and Schaft Creek. Since 2017, we have invested in consolidating our ownership in a number of the assets, renewing partnerships in others, developing a path-to-development for each asset, and establishing project teams to carry out a range of technical, environmental and social work programs that aim to remove value impediments and to create a more certain business case for each asset.
The focus in 2018 has been to complete environmental and social baseline studies, community engagement programs, and engineering and design work to prepare social and environmental impact assessments (SEIAs) and development permit applications on the Zafranal and San Nicolás assets. In addition, we advanced the Zafranal feasibility study that is scheduled for completion in the first quarter of 2019. At San Nicolás, the project team focused on collecting information to inform a prefeasibility study which was initiated in the fourth quarter of 2018. Lastly, a significant effort was made to renew the Galore Creek partnership, which culminated in the introduction of Newmont Mining Corporation as our 50/50 partner in the Galore Creek Partnership.
Teck Resources Limited |
Page 41 |
2018 Annual Information Form
Zafranal, Peru
The Zafranal property, located in southern Peru 85 kilometres northwest of Arequipa within the Provinces of Castilla and Caylloma, is a mid-sized copper-gold porphyry deposit. The project is held by Compañía Minera Zafranal S.A.C. (CMZ), in which Teck holds an 80% interest, with Mitsubishi Materials Corporation holding the other 20%.
During 2017 and 2018, CMZ completed 35,880 metres of infill and geotechnical drilling programs along with extensive hydrogeological, environmental, social and archeological studies. With the benefit of an additional 163 diamond drill holes, updated geological and geometallurgical models were developed which were used to inform updated reserve and resource estimates as well as an updated mine plan for the feasibility study. With this additional drilling and modeling work complete, 92% of the mineralization is now categorized as proven mineral reserves; 6.3% as probable mineral reserves, 1.0% as measured mineral resources; 0.4% as indicated mineral resources and 12.3% as inferred mineral resources.
During 2018, the project team significantly advanced its understanding of the regional and local hydrogeological environment within both the planned mine and tailings management facility areas. A multi-year water study was completed which identified available and sustainable water sources for the life of the project. Work programs focused on clean water, health and wellness, local infrastructure, and small business development were successfully completed in partnership with several local communities. The feasibility study and the SEIA studies initiated in November 2017 are expected to be completed in the first half of 2019.
Our share of spending in 2018 was $29 million and our share of planned spending in 2019 is $40 million that will be included in capital expenditures for new mine development within our copper business unit.
San Nicolás, Mexico
The San Nicolás property, located in Zacatecas State, one of the oldest mining regions in Mexico, is a massive sulphide deposit with significant copper, zinc, gold and silver. The property is held by Minas de San Nicolas, S.A. de C.V. which is a wholly owned indirect subsidiary of Teck.
During 2018, the San Nicolás project team completed property-wide environmental and social baseline studies, regional and property specific hydrogeological studies and preliminary project engineering programs that had been initiated in the third quarter of 2017. In addition, 30,226 metres of infill, metallurgical, geotechnical and hydrogeological drilling in 109 reverse circulation and diamond drill holes was completed in 2018. This additional drilling, together with the completion of an improved geological and geometallurgical model, resulted in 29% of the mineral resources being categorized as measured mineral resources, 67% as indicated mineral resources and 4% as inferred mineral resources.
This additional geological, geotechnical, hydrogeological and metallurgical information and engineering focused field information, in combination with the baseline study work, has been compiled and integrated and will be used to support a prefeasibility study and an SEIA each of which commenced in November 2018. We expect to complete the prefeasibility study and the SEIA in the second half of 2019.
Teck Resources Limited |
Page 42 |
2018 Annual Information Form
A community office was established in November 2018 in San Nicolás, a small village located immediately south of the project area, to expand awareness and understanding of the planned project with community members in the region.
Spending in 2018 was $18 million and planned spending in 2019 is $26 million that will be included in capital expenditures for new mine development within our copper business unit.
Galore Creek, Canada
The Galore Creek property, located in the territory of the Tahltan in northwestern British Columbia approximately 150 kilometres northwest of the Port of Stewart, BC and 370 kilometres northwest of Smithers, BC, is a significant copper-gold-silver porphyry deposit. The project is owned by the Galore Creek Partnership, a 50/50 partnership between Teck and Newmont Mining Corporation (Newmont), and is managed by Galore Creek Mining Corporation (GCMC), a wholly owned subsidiary of the Galore Creek Partnership.
Following Newmonts acquisition of a 50% interest in Galore Creek from NOVAGOLD Canada Inc. in July 2018, Teck and Newmont agreed to fund future work programs estimated to be $12 to $20 million annually (on a 50% basis) over a three-to-four year period and to reinitiate permitting activities as appropriate. Further, the partners established a project team to carry out the necessary work and studies to inform an updated prefeasibility study which is expected to commence in late 2019 or early 2020.
During 2018, the majority of the program work at Galore Creek was directed at maintaining the mineral properties, managing GCMCs commitments under the existing environmental impact assessment and special use permits, maintaining commitments with the Tahltan, and carrying out preliminary geological mapping, prospecting and mineral deposit studies. The mapping and prospecting work identified several high quality targets in the Galore Creek Valley that have the potential to positively impact the life of mine and provide resources for future development. These targets, along with other high quality prospects in the substantial land tenure package, will be further evaluated in 2019.
Our share of spending in 2018 was $5 million and our share of planned spending in 2019 is $19 million which is included in capital expenditures for new mine development within our copper business unit.
Mesaba, United States
The Mesaba property, located in northeastern Minnesota 100 kilometres north of Duluth, is part of a potentially significant copper, nickel and platinum-palladium-cobalt mining district in the United States. Known ore deposits in the district, including Mesaba, consist of metallurgically complex disseminated copper-nickel sulphides that require a range of mineral processing steps to make saleable concentrate or metal products while meeting state and federal requirements to protect the environment. Mineral rights over the Mesaba deposit are held 100% by Teck through lease agreements with private interests and the State of Minnesota.
A Mesaba project team was formed during 2018 and carried out a range of planning activities, preliminary development and environmental studies and mineral resource estimate work. Drill core logging, extensive re-assaying, sample analysis and geometallurgical modeling work was
Teck Resources Limited |
Page 43 |
2018 Annual Information Form
completed in mid-2018. This work has resulted in an estimate of measured mineral resources of 244 million tonnes of 0.47% copper, 0.1% nickel, indicated mineral resources of 1,344 million tonnes of 0.42% copper, 0.09% nickel and inferred mineral resources of 1,464 million tonnes of 0.35% copper and 0.08% nickel each with important gold, silver, platinum and palladium credits.
In concert with the resource estimation work, in September 2018 we completed a Mineral Inventory Resource Assessment, which is used to describe overall mineral potential and assist in framing future exploration programs. In addition to study work, we acquired several key land parcels in the project area that helped consolidate our land position in and around the project footprint.
Spending in 2018 was $6 million and planned spending in 2019 of $14 million will be included in exploration expenses.
Schaft Creek, Canada
The Schaft Creek property, located in the territory of the Tahltan in northwestern British Columbia, approximately 60 kilometres south of Telegraph Creek and 37 kilometres northeast of the Galore Creek property, is a large copper-molybdenum-gold porphyry deposit. The project is a 75/25 joint venture between Teck and Copper Fox Metals Inc., with Teck holding a 75% interest and acting as the operator.
A multi-disciplinary team was established in early 2018 to describe and further characterize several development scenarios for the Schaft Creek deposit that stemmed from the primary development option outlined in the 2013 Feasibility Study. Based on the work completed in 2018, additional scoping level engineering and design work is planned in 2019 that will assess risks and opportunities associated with a range of development scenarios, the focus of which is to improve financial returns over those outlined in the 2013 Feasibility Study.
Planned fieldwork in 2018 on the Schaft Creek project, intended to collect environmental data, maintain camp and facilities, and maintain existing permits, was not carried out as planned due to wildfires in the district that limited the availability of qualified contractors and access to the project site. Obligations to the Tahltan, outlined in a Communication and Exploration Agreement signed in early 2018, were met. The fieldwork that was not completed in 2018 will be carried out in 2019.
Planned spending in 2019 is $2 million and will be included in capital expenditures for new mine development within our copper business unit.
Other Copper Projects
NuevaUnión, Chile
In November 2015 we combined Goldcorps La Fortuna (formerly El Morro) project and Tecks Relincho project, located approximately 40 kilometres apart in the Huasco Province in the Atacama region of Chile, into a single copper-gold-molybdenum project called NuevaUnión. We hold a 50% interest in NuevaUnión. A prefeasibility study was completed in early 2018, which incorporates key design changes to improve project economics and respond to input from communities and Indigenous Peoples. A Feasibility Study was commenced in the third quarter of 2018 and is expected to be completed by the end of 2019.
Teck Resources Limited |
Page 44 |
2018 Annual Information Form
CESL Limited (CESL)
In 2018, our CESL hydrometallurgical facility, located in Richmond, B.C., continued to advance the commercialization of our proprietary copper, nickel and copper-arsenic process technologies on internal and external opportunities.
Zinc
Mining Operations
Red Dog Mine, United States (Zinc, Lead)
The Red Dog zinc-lead mine, concentrator and shipping facility in the Northwest Arctic Borough, approximately 144 kilometres north of Kotzebue, Alaska, commenced production in December 1989 and began shipping concentrates in July 1990. The Red Dog mine is operated by Teck Alaska Incorporated on lands owned by, and leased from, the NANA Regional Corporation (NANA). The Red Dog mine covers approximately 1,000 hectares.
Red Dog mine is located on a ridge between the middle and south forks of Red Dog Creek, in the DeLong Mountains of the Western Brooks Range. The topography is moderately sloping, with elevations ranging from 260 metres to 1,200 metres above sea level. Vegetation is classified as woody tundra. The mine is accessible from a paved airstrip, five kilometres from the Red Dog mine, which allows jet access from Anchorage and Kotzebue. Mine personnel are generally drawn from surrounding communities as well as from other locations within the State and in North America. Power for the mine is produced on-site by diesel generators with a maximum capacity of 30 megawatts, sufficient for present and expected future power requirements. Potable water is sourced from Bons Creek.
Red Dog is comprised of a number of sedimentary hosted exhalative lead-zinc sulphide deposits hosted in Mississippian-age to Pennsylvanian-age sedimentary rocks. The orebodies are lens shaped and occur within structurally controlled (thrust faults) plates, are relatively flat-lying and are hosted by marine clastic rocks (shales, siltstones, turbidites) and lesser chert and carbonate rocks. Barite rock is common in and above the sulphide units. Silicification is the dominant alteration type.
The sulphide mineralization consists of semi-massive to massive sphalerite, pyrite, marcasite and galena. Common textures within the sulphide zone include massive, fragmental, veined and, rarely, sedimentary layering.
Ore is currently mined from the Aqqaluk and Qanaiyaq pits. All future ore production is also expected to be mined from these pits. The mining method employed is conventional open pit drill-and-blast and truck-and-shovel technology. The mineral processing facilities employ conventional grinding and sulphide flotation methods to produce zinc and lead concentrates.
Tailings storage and waste disposal areas have adequate design capacity to sustain the current life of mine plan. All contaminated water from the mine area and waste dumps is collected and contained in a tailings impoundment and seasonally discharged through a water treatment plant. Mill process water is reclaimed from the tailings pond.
Teck Resources Limited |
Page 45 |
2018 Annual Information Form
In 2018, 19 holes totalling approximately 3,050 metres were drilled in the Aqqaluk pit for resource definition and geotechnical data collection. In addition, 13 holes totalling approximately 650 metres were drilled in the Qanaiyaq pit for resource infill and confirmation. Updates to the Aqqaluk and Qanaiyaq resource models are in progress. While we are not able to fully quantify the impacts until the model updates are complete, no material impacts to the quantity or grade of reserves or resources are anticipated. Diamond drill core (both HQ and NQ diameters) is sawn into halves and sampled in 1.5-metre intervals, with one half being sent to Bureau Veritas in Vancouver for analysis and the other half retained at Red Dog for future reference. The quality assurance/quality control program consists of standards and blanks inserted at regular intervals as well as core, coarse crush and pulp duplicates all analyzed by Bureau Veritas. Five percent of core sample pulps are split and sent to a second lab as a check.
The mine and concentrator properties are leased from, and are being operated under the terms of a development and operating agreement with, NANA, a Regional Alaska Native corporation. Since the third quarter of 2007, we have paid NANA a percentage of the net proceeds of production from the mine, starting at 25% and increasing to 50% by successive increments of 5% at five-year intervals. The net proceeds of production percentage increased from 25% to 30% in the fourth quarter of 2012 and increased to 35% in October 2017. The development and operating agreement also provides for employment and contracting preferences and additional lease rental payments. In addition to the royalties payable to NANA, the operation is subject to federal and state income taxes and the Alaska Mining Licence tax, which applies at 7% of taxable income.
A payment in lieu of taxes (PILT) agreement between Teck Alaska and the Northwest Arctic Borough (the Borough) expired on December 31, 2015. Teck Alaska and the Borough agreed to a new 10-year PILT agreement effective January 1, 2016. Under the new agreement, PILT payments to the Borough, based on the net book value of the mine lands, buildings and equipment in accordance with U.S. Generally Accepted Accounting Principles, increase by approximately US$4 million to between US$14 million and US$18 million per year. In addition, Teck Alaska will make annual payments to a separate fund aimed at social investment in villages in the region. These payments, based on mine profitability, will be between US$4 million and US$8 million per year, with US$11 million invested in the first year.
The mine is in material compliance with all of its permits and related regulatory instruments, and has obtained all of the permits that are material to its current operations.
In 2018, approximately 34% of the zinc concentrate produced at Red Dog was shipped to our metallurgical facilities at Trail, British Columbia, and the balance to customers in Asia and Europe. The lead concentrate production is also shipped to Trail and to customers in Asia. The majority of concentrate sales are pursuant to long-term contracts at market prices, subject to annually negotiated treatment charges. The balance is sold on the spot market at prices based on prevailing market quotations. The shipping season at Red Dog is restricted to approximately 100 days per year because of sea ice conditions and Red Dogs sales are seasonal, with the majority of sales in the last five months of each year. Concentrate is stockpiled at the port facility and is typically shipped between July and October.
In 2018, zinc production at Red Dog increased to 583,200 tonnes compared to 541,900 tonnes in 2018, primarily due to higher zinc grades and recoveries. Lead production in 2018 declined to
Teck Resources Limited |
Page 46 |
2018 Annual Information Form
98,400 tonnes, compared to 111,300 tonnes in 2017, primarily due to lower grades and recoveries.
Work continues on the mill upgrade project that is expected to increase average mill throughput by about 15% over the remaining mine life, helping to offset lower grades and harder ore in the Aqqaluk pit. This project is expected to be complete by the end of 2019 at a capital cost of US$110 million.
Because the upgrade project will permit lower-grade material to be processed, the current mine life, based on existing developed deposits, will remain unchanged through to 2031. In 2019, we plan to continue an exploration drilling program and various studies focused on extending the life of Red Dog past 2031, including possible development of the Paalaaq, Anarraaq and Aktigiruq deposits.
Red Dogs production of contained metal in 2019 is expected to be in the range of 535,000 to 555,000 tonnes of zinc and 85,000 to 90,000 tonnes of lead. From 2020 to 2022, Red Dogs production of contained metal is expected to be in the range of 500,000 to 520,000 tonnes of zinc and 85,000 to 100,000 tonnes of lead per year, respectively.
2019 projected capital costs for Red Dog are approximately US$117 million. The major components of the projected capital costs are:
Component | Approximate projected cost (US$/million)
| |
Sustaining |
72 | |
Major Enhancement |
45 |
2019 projected cash operating costs for Red Dog are approximately US$242 million. The major components of the projected cash operating costs are:
Component |
Approximate projected cost (US$/million)
| |
Labour |
127 | |
Supplies |
75 | |
Energy |
41 | |
Other (including general & administrative, inventory changes) | 33 | |
Less amounts associated with capitalized stripping | (34) | |
Total |
242 |
The cash operating costs presented above do not include transportation or royalties.
Teck Resources Limited |
Page 47 |
2018 Annual Information Form
Pend Oreille Mine, United States (Zinc, Lead)
We own 100% of the Pend Oreille mine, near Metaline Falls, Washington, which began commercial production in early 2004 under Tecks ownership. In February 2009, we suspended operations and put the mine on care and maintenance as a result of low zinc prices. The mine restarted operations in December 2014.
The Pend Oreille mine is a carbonate-hosted zinc-lead orebody situated within the Metaline Formation in the southern portion of the Kootenay arc, an arcuate, narrow belt of sedimentary, volcanic and metamorphic rocks separating Precambrian metasediments to the east and Mesozoic volcanic and sedimentary units to the west. Metaline carbonates host the known zinc-lead deposits within the district.
Mineralization at the Pend Oreille mine is located within the Yellowhead horizon of the Metaline Formation, an intensely altered stratabound dolomitic solution breccia, which has been invaded and replaced by fine-grained pyrite with lesser zinc and lead sulphides. The sulphide zone has relatively simple mineralogy. Sphalerite and galena are the two ore minerals of interest. Gangue minerals include pyrite, dolomite and calcite. The Pend Oreille mine is an underground mine. The mineral processing facilities employ conventional grinding and sulphide flotation methods to produce high-quality zinc and lead concentrates. Pend Oreille holds all permits necessary for its operation and is in material compliance with these permits.
The mine achieved zinc production of 29,700 tonnes in 2018, compared to 33,100 tonnes in 2017. We expect production for the first nine months of 2019 to be between 20,000 and 30,000 tonnes of zinc in concentrate. Production rates beyond the third quarter of 2019 are uncertain.
Other Zinc Projects
We have a 100% interest in the Teena/Reward project which is located eight kilometres west of the McArthur River Mine in the Northern Territory of Australia.
Refining and Smelting
Trail Operations
Teck Metals owns and operates the integrated smelting and refining complex at Trail, British Columbia. The complexs major products are refined zinc, lead and silver. It also produces a variety of precious and specialty metals, chemicals and fertilizer products.
The zinc refinery consists of six major metallurgical plants, one fertilizer plant and two specialty metal plants. Depending on the mix of feeds, the facility has an annual capacity of approximately 300,000 to 310,000 tonnes of refined zinc. Zinc concentrates are initially treated in either roasters or pressure leach plants, where sulphur is separated from the metal-bearing solids. The zinc is put into solution where it is first purified to remove other metal impurities and then electroplated onto cathodes in an electrolytic refining plant. The zinc cathodes are melted and then the zinc is cast into various shapes, grades and alloys to meet customer requirements. Other valuable metals, including indium and germanium, are also recovered as co-products in the zinc plant. The lead smelting operation consists of two major metallurgical plants and one specialty metal plant. Lead concentrates, recycled lead acid batteries, residues from the zinc circuits and various other lead- and silver-bearing materials are treated in the KIVCET flash furnace to produce lead bullion.
Teck Resources Limited |
Page 48 |
2018 Annual Information Form
The bullion is electro-refined in the refinery to produce high-purity lead. The valuable silver and gold are also recovered in this circuit after further processing. Shutdown of the KIVCET furnace for regular maintenance is scheduled to occur approximately every four years. As a result, the KIVCET furnace was shut down for part of the third and fourth quarter of 2018.
Refined zinc production in 2018 was 302,900 tonnes, compared with 310,100 tonnes the previous year. Refined lead production was 61,000 tonnes, down from 87,100 tonnes in 2017, primarily due to the planned extended maintenance shutdown of the KIVCET furnace in late 2018. Other factors impacting production included a temporary shutdown of some facilities due to wildfire smoke and the treatment of lower-grade lead concentrate compared to last year as a result of operating disruptions at some mines that supply lead concentrates which required us to process alternative concentrates. Silver production declined to 11.6 million ounces in 2018 from 21.4 million ounces in 2017 due to the KIVCET maintenance shutdown and lower silver inputs.
Our recycling process treated 41,700 tonnes of material during the year, and we plan to treat about 44,700 tonnes in 2019. Our focus remains on treating lead acid batteries and cathode ray tube glass, plus small quantities of zinc alkaline batteries and other post-consumer waste.
In November 2016, we announced that we would invest $174 million in the installation of a second new acid plant to improve efficiency and environmental performance at Trail Operations. The construction of the acid plant is over 90% complete with commissioning planned in the second quarter of 2019.
In 2019, we expect Trail Operations to produce 305,000 to 310,000 tonnes of refined zinc, approximately 70,000 to 75,000 tonnes of refined lead and approximately 13.0 to 14.0 million ounces of silver. Zinc production from 2020 to 2022 is expected to increase to 310,000 to 315,000 tonnes per year, while annual lead production is expected to rise to 85,000 to 95,000 tonnes. Silver production depends on the amount of silver contained in the purchased concentrates.
Metallurgical effluent, together with site rainfall drainage water, is collected in ponds and treated through an effluent treatment plant before discharge into the Columbia River. The smelter operates under a variety of permits, including effluent and air emission permits issued by the British Columbia Ministry of Environment. The operation is in material compliance with all of its environmental permits and has obtained all of the permits that are material to its operations.
In July 2018, we sold our two-thirds interest in the Waneta Dam to BC Hydro. In connection with the sale, we entered into a 20-year arrangement with BC Hydro, with an option to extend for an additional 10 years, to purchase power for our Trail Operations. Our arrangement with BC Hydro retains our prior obligation to provide for the firm delivery of energy and capacity from Waneta to BC Hydro until 2036. If Teck Metals fails to deliver power as provided for in the agreement, it could be liable to pay liquidated damages to BC Hydro based on the market rate for power at the time of the shortfall. The costs of the liquidated damages could be significant if the shortfall continues and is not covered by our insurance policies.
We also own the related 15-kilometre transmission and distribution system from Waneta to the United States, which BC Hydro has agreed to purchase on a deferred schedule.
Teck Resources Limited |
Page 49 |
2018 Annual Information Form
Energy
Fort Hills Mine
Fort Hills mines, extracts and sells the recoverable bitumen found in certain oil sands deposits underlying six Alberta Oil Sands Leases No.s 7404080933, 7404080932, 7400120008, 7406020438, 7405090634 and 7406020437. The Fort Hills leases are located approximately 90 kilometres north of Fort McMurray, Alberta, and cover a contiguous area of approximately 23,675 hectares on the east bank of the Athabasca River.
On November 30, 2005, we acquired a 15% limited partnership interest in Fort Hills Energy L.P. (the Fort Hills Partnership), which owns the Fort Hills mine. In 2007, we entered into an agreement to increase our interest in the Fort Hills Partnership to 20%. We further increased our interest to approximately 20.89% in 2017 and again to 21.3% in January 2018. As at December 31, 2018, the other limited partners were Suncor Energy Inc. (Suncor) with a 54.1% interest and Total E&P Canada Ltd. (Total) with a 24.6% interest. Relations among the partners are governed by a limited partnership agreement and a unanimous shareholder agreement pertaining to the governance of Fort Hills Energy Corporation, the general partner of the Fort Hills Partnership, in which the limited partners hold pro rata share interests.
Suncor Energy Operating Inc., an affiliate of Suncor, acts as contract operator of Fort Hills pursuant to an operating services contract. The contract operator has exclusive authority to operate Fort Hills, subject to the oversight of a management committee on which each of the shareholders of the general partner are represented. Certain fundamental decisions concerning Fort Hills require super-majority, and in certain cases, unanimous, approval of the management committee. Subject to certain exceptions, limited partners have a right of first refusal in the event of a transfer of anothers limited partnership interest.
Bitumen production from the first two secondary extraction trains at Fort Hills commenced in the first quarter of 2018, followed by the third and final train in May. All commissioning and construction activities are now complete and Fort Hills ran at full design nameplate capacity for much of the fourth quarter of 2018. Tecks share of the overall costs was $3.7 billion from the date the project was sanctioned through to completion, including the impact of foreign exchange.
Fort Hills has produced 45.6 million barrels of bitumen, or 125,000 barrels per day, since first oil in January 2018. Our share of production since January 1, 2018 was 9.7 million barrels, or 26,580 barrels per day, which was near the high end of our guidance of 8.5 million to 10.0 million barrels for 2018.
To meet pipeline viscosity requirements Teck, along with the other Fort Hills partners, are required to purchase diluent blend-stock. In order to facilitate this and the transportation of blended bitumen to the market hub at Hardisty, the Fort Hills partners have jointly entered into long-term take-or-pay agreements with regional pipelines, terminals and blend facilities. These agreements relate to:
| hot bitumen transportation from Fort Hills to the East Tank Farm on the Northern Courier Pipeline, operated by TransCanada; |
| diluent transportation from Edmonton to the East Tank Farm on the Norlite Pipeline, operated by Enbridge; |
Teck Resources Limited |
Page 50 |
2018 Annual Information Form
| use of diluent and bitumen blending facility at the East Tank Farm, operated by the Thebacha partnership, a joint venture between Suncor and regional First Nations (Fort McKay First Nation and Mikisew Cree First Nation); and |
| blended bitumen transportation from the East Tank Farm to the market hub at Hardisty, Alberta, on the Wood Buffalo Pipeline, operated by Enbridge. |
We have separately contracted a 425,000-barrel working-capacity storage tank for our share of blended bitumen at Hardisty, Alberta, and 100,000 barrels of diluent storage capacity at Fort Saskatchewan, Alberta.
We sell our blended bitumen to customers at Hardisty and on the U.S. Gulf Coast. Our tankage at Hardisty is connected to major export pipelines, including the Enbridge common carrier pipeline, the existing Keystone pipeline and the Express crude oil pipeline. Our tankage is also connected to a large unit train loading facility. We have entered into a long-term take-or-pay agreement on the existing Keystone pipeline to ship 10,000 barrels per day of blended bitumen to our customers on the U.S. Gulf Coast. We have also entered into agreements to ship an additional 10,000 barrels per day on the proposed Keystone XL pipeline expansion and an additional 12,500 barrels per day on the proposed TransMountain pipeline expansion to customers on the U.S. Gulf Coast and in Burnaby, B.C., respectively. The balance of our production will be sold at Hardisty, shipped to customers via the Enbridge common carrier pipeline, or transported by rail if required.
Certain of these arrangements permit the infrastructure owners to require Teck to deliver letters of credit or other financial assurances if Teck does not maintain investment grade ratings by specified ratings agencies. Teck had approximately $204 million in letters of credit outstanding at December 31, 2018 as financial assurance related to certain pipeline and storage agreements we entered into in connection with Fort Hills. In addition, if requested by all of Tecks counterparties, the amount of these letters of credit could increase up to approximately $499 million. These Fort Hills-related letters of credit will be terminated if and when we regain investment grade ratings.
Due to extreme price volatility for Alberta crude oil, the Government of Alberta announced a temporary curtailment of provincial crude oil and bitumen production of approximately 325,000 barrels per day effective January 1, 2019. Although some uncertainty on the impacts of the curtailment remains, consistent with the Government of Alberta announcement on December 2, 2018, the production estimates under Description of the Business Oil and Gas Reserves Production Estimate assume the mandatory industry-wide production curtailment of 325,000 barrels per day is in place for the first four months of the year declining to 95,000 barrels per day for the remainder of 2019.
Teck engaged GLJ Petroleum Consultants Ltd. (GLJ) to prepare an independent evaluation of the reserves at Fort Hills effective as of December 31, 2018. The best estimate of Tecks share of the proved plus probable reserves at Fort Hills as at December 31, 2018 is 566 million barrels of bitumen. In 2018, Tecks share of reserves decreased by 28 million barrels due to: the production of 44.6 million barrels of bitumen (on a 100% basis) during 2018 and a slight decrease in ore recovery certainty in the north pit as the latest data indicates that the piezometric head of the underlying Keg River aquifer in that area is higher than previously estimated, each partially offset by an increase in our ownership of Fort Hills from 20.89% to 21.3%. The revised mine plan is still
Teck Resources Limited |
Page 51 |
2018 Annual Information Form
expected to support mining at design production rates for over 46 years. See Oil and Gas Resources below for a further discussion of the reserves for Fort Hills.
Fort Hills is subject to the royalty framework issued by the Government of Alberta (the Oil Sands Royalty), and regulated by the Oil Sands Royalty Regulation 2009 (OSRR 2009) and related regulations. Under the Oil Sands Royalty, royalties for Fort Hills are based on a sliding scale of 25% to 40% of net revenue, subject to a minimum royalty within a range of 1% to 9% of gross revenue. Revenues used in royalty formulas are driven by realized net prices to arms-length customers or, if there are insufficient arms-length sales, benchmark prices for Western Canadian Select (WCS) while sliding-scale percentages in royalty formulas depend on prices for West Texas Intermediate (WTI) from CAD$55/bbl for the minimum rate to the maximum rate at a WTI price of CAD$120/bbl. Fort Hills remains subject to the minimum royalty (the pre-payout phase) until Fort Hills cumulative gross revenue exceeds its cumulative costs, including an annual investment allowance. After the pre-payout phase, the higher of the minimum and regular royalty rates will apply.
Fort Hills is required to upgrade the bitumen produced from the second phase of the project in Alberta or to pay a penalty to the Government of Alberta.
Our share of Fort Hills major enhancement capital expenditures for 2019 is expected to be $100 million and our share of sustaining capital expenditures for 2019 is expected to be $60 million.
Frontier Project
The Frontier oil sands project is wholly owned by Teck and consists of approximately 56,000 hectares of oil sands leases and is located on the west side of the Athabasca River. The Frontier project was designed for a total nominal production of approximately 260,000 barrels per day of bitumen.
During 2018, Teck relinquished 4,608 hectares from its Frontier oil sands leases as well as other oil sands leases back to the Crown to be included as part of a Biodiversity Stewardship Area located just south of the Wood Buffalo National Park.
The regulatory application review of Frontier continued in 2018 with a public hearing before a joint federal/provincial panel, which ran from September through mid-December. The earliest a federal decision statement could be expected for Frontier is in the second half of 2019.
Our expenditures on Frontier are limited to supporting this process. We continue to evaluate the future project schedule and development options as part of our ongoing capital review and prioritization process. Should the project proceed, first oil is not expected before the first quarter of 2026, with production expected to continue for 41 years.
Lease 421 Area
We own a 50% interest in the Lease 421 Area oil sands leases 421, 022, 023 and 899 east of the Athabasca River (approximately 17,900 hectares on a 100% basis). To date, a total of 89 core holes have been completed in the Lease 421 Area.
Teck Resources Limited |
Page 52 |
2018 Annual Information Form
Exploration
In 2018, we incurred exploration expenditures of $69 million, including $6 million for mine site and development/engineering projects. Approximately 59% of expenditures were dedicated to exploration for copper, 20% for zinc and 14% for gold, and approximately 7% were dedicated to other commodities. Of the total exploration expenditures, approximately 53% was spent in North America, 28% in South America, 13% in Europe and Asia, and 6% in Australia. In 2019, planned exploration expenditures are expected to be approximately $81 million, including $14 million for mine site and development/engineering projects.
Exploration is carried out through sole funding and joint ventures with major and junior exploration companies. Exploration is focused on areas in proximity to our existing operations or development projects in regions that we consider have high potential for discovery.
Corporate
For financial reporting purposes, we report on a corporate segment that includes all of our activities in commodities other than copper, coal, zinc and energy, our corporate development and growth initiatives, and groups that provide administrative, technical, financial and other support to all of our business units.
Teck Resources Limited |
Page 53 |
2018 Annual Information Form
Mineral Reserves and Resources
See Notes to Mineral Reserves and Resources Tables below, after the Mineral Resources table.
MINERAL RESERVES as at 31 December 2018 (1)
|
| |||||||||||||||||||||||||||||||
Proven
|
Probable
|
Total
|
Teck |
Recoverable (000 t) (7) |
||||||||||||||||||||||||||||
Tonnes
|
Grade
|
Tonnes
|
Grade
|
Tonnes
|
Grade
|
|||||||||||||||||||||||||||
Copper |
||||||||||||||||||||||||||||||||
Highland Valley Copper |
363,000 | 0.32 | 172,500 | 0.28 | 535,500 | 0.30 | 100.0 | 1,440 | ||||||||||||||||||||||||
Antamina |
||||||||||||||||||||||||||||||||
Copper only ore OP |
153,800 | 1.01 | 125,600 | 0.96 | 279,500 | 0.98 | 22.5 | 570 | ||||||||||||||||||||||||
Copper-zinc ore OP
|
|
81,000
|
|
|
0.87
|
|
|
128,600
|
|
|
0.79
|
|
|
209,600
|
|
|
0.82
|
|
|
22.5
|
|
|
300
|
| ||||||||
Total |
234,900 | 0.96 | 254,200 | 0.87 | 489,100 | 0.91 | 22.5 | 870 | ||||||||||||||||||||||||
Quebrada Blanca |
||||||||||||||||||||||||||||||||
Heap leach (2) |
13,800 | 0.09 | 13,800 | 0.09 | 90.0 | 10 | ||||||||||||||||||||||||||
Dump leach ore (2)
|
|
10,300
|
|
|
0.31
|
|
|
10,300
|
|
|
0.31
|
|
|
90.0
|
|
|
20
|
| ||||||||||||||
Total |
24,100 | 0.18 | 24,100 | 0.18 | 90.0 | 30 | ||||||||||||||||||||||||||
Quebrada Blanca - Mill |
476,300 | 0.51 | 923,800 | 0.47 | 1,400,000 | 0.48 | 90.0 | 5,540 | ||||||||||||||||||||||||
Andacollo - Heap leach (2) |
800 | 0.24 | 4,300 | 0.13 | 5,100 | 0.15 | 90.0 | 3 | ||||||||||||||||||||||||
Andacollo - Mill |
100,100 | 0.34 | 216,300 | 0.32 | 316,400 | 0.33 | 90.0 | 810 | ||||||||||||||||||||||||
NuevaUnion |
||||||||||||||||||||||||||||||||
Relincho |
552,200 | 0.34 | 899,800 | 0.36 | 1,452,100 | 0.35 | 50.0 | 2,250 | ||||||||||||||||||||||||
La Fortuna
|
|
333,600
|
|
|
0.58
|
|
|
243,200
|
|
|
0.45
|
|
|
576,700
|
|
|
0.53
|
|
|
50.0
|
|
|
1,310
|
| ||||||||
Total |
885,800 | 0.43 | 1,143,000 | 0.38 | 2,028,800 | 0.40 | 50.0 | 3,560 | ||||||||||||||||||||||||
Molybdenum |
||||||||||||||||||||||||||||||||
Highland Valley Copper |
363,000 | 0.006 | 172,500 | 0.009 | 535,500 | 0.007 | 100.0 | 20 | ||||||||||||||||||||||||
Antamina |
||||||||||||||||||||||||||||||||
Copper only ore OP |
153,800 | 0.038 | 125,600 | 0.034 | 279,500 | 0.036 | 22.5 | 10 | ||||||||||||||||||||||||
Quebrada Blanca |
||||||||||||||||||||||||||||||||
Quebrada Blanca - Mill |
476,300 | 0.018 | 923,800 | 0.019 | 1,400,000 | 0.018 | 90.0 | 170 | ||||||||||||||||||||||||
NuevaUnion |
||||||||||||||||||||||||||||||||
Relincho |
552,200 | 0.014 | 899,800 | 0.017 | 1,452,100 | 0.016 | 50.0 | 60 |
Teck Resources Limited |
Page 54 |
2018 Annual Information Form
MINERAL RESERVES as at 31 December 2018 (1)
|
| |||||||||||||||||||||||||||||||
Proven
|
Probable
|
Total
|
Teck Interest (%) |
Recoverable (000 t) (7) |
||||||||||||||||||||||||||||
Tonnes
|
Grade
|
Tonnes
|
Grade
|
Tonnes
|
Grade
|
|||||||||||||||||||||||||||
Zinc |
||||||||||||||||||||||||||||||||
Antamina |
||||||||||||||||||||||||||||||||
Copper-zinc ore OP |
81,000 | 2.0 | 128,600 | 2.0 | 209,600 | 2.0 | 22.5 | 750 | ||||||||||||||||||||||||
Red Dog |
||||||||||||||||||||||||||||||||
Mine |
56,000 | 13.1 | 56,000 | 13.1 | 100.0 | 5,910 | ||||||||||||||||||||||||||
Pend Oreille |
400 | 6.1 | 400 | 6.1 | 100.0 | 20 | ||||||||||||||||||||||||||
Lead |
||||||||||||||||||||||||||||||||
Red Dog |
||||||||||||||||||||||||||||||||
Mine |
56,000 | 3.8 | 56,000 | 3.8 | 100.0 | 1,070 | ||||||||||||||||||||||||||
Pend Oreille |
400 | 1.1 | 400 | 1.1 | 100.0 | 2 | ||||||||||||||||||||||||||
Proven
|
Probable
|
Total
|
Teck Interest |
Recoverable (000 oz) (7) | ||||||||||||||||||||||||
Tonnes
|
Grade
|
Tonnes
|
Grade
|
Tonnes
|
Grade
|
|||||||||||||||||||||||
Gold |
||||||||||||||||||||||||||||
Andacollo - Mill (6) |
100,100 | 0.11 | 216,300 | 0.10 | 316,400 | 0.11 | 90.0 | 660 | ||||||||||||||||||||
NuevaUnion |
||||||||||||||||||||||||||||
La Fortuna |
333,600 | 0.55 | 243,200 | 0.38 | 576,700 | 0.48 | 50.0 | 2,960 | ||||||||||||||||||||
Silver |
||||||||||||||||||||||||||||
Antamina | ||||||||||||||||||||||||||||
Copper only ore OP |
153,800 | 7.2 | 125,600 | 8.0 | 279,500 | 7.6 | 22.5 | 12,260 | ||||||||||||||||||||
Copper-zinc ore OP |
|
81,000
|
|
|
16.6
|
|
|
128,600
|
|
|
13.1
|
|
209,600
|
|
14.5
|
|
|
22.5
|
|
13,950
| ||||||||
Total |
234,900 | 10.5 | 254,200 | 10.6 | 489,100 | 10.5 | 22.5 | 26,210 | ||||||||||||||||||||
Quebrada Blanca | ||||||||||||||||||||||||||||
Quebrada Blanca-Mill |
476,300 | 1.4 | 923,800 | 1.3 | 1,400,000 | 1.3 | 90.0 | 36,680 | ||||||||||||||||||||
Red Dog | ||||||||||||||||||||||||||||
Mine |
56,000 | 70.5 | 56,000 | 70.5 | 100.0 | 76,060 | ||||||||||||||||||||||
Teck Resources Limited |
Page 55 |
2018 Annual Information Form
MINERAL RESERVES as at 31 December 2018 (1) |
| |||||||||||||||||||
Proven
|
Probable
|
Total
|
Teck
|
Clean (000 t)
|
||||||||||||||||
Tonnes
|
Tonnes
|
Tonnes
|
||||||||||||||||||
Metallurgical Coal (3) |
||||||||||||||||||||
Fording River |
166,400 | 221,500 | 387,900 | 100.0 | 387,900 | |||||||||||||||
Elkview |
6,800 | 258,300 | 265,100 | 95.0 | 251,800 | |||||||||||||||
Greenhills |
9,700 | 155,300 | 165,100 | 80.0 | 132,100 | |||||||||||||||
Line Creek |
2,400 | 57,800 | 60,200 | 100.0 | 60,200 | |||||||||||||||
Cardinal River |
2,300 | 12,300 | 14,600 | 100.0 | 14,600 | |||||||||||||||
Quintette (Mt Babcock) |
700 | 35,400 | 36,000 | 100.0 | 36,000 | |||||||||||||||
PCI Coal (3) |
||||||||||||||||||||
Cardinal River |
0 | 400 | 400 | 100.0 | 400 | |||||||||||||||
Thermal Coal (3) |
||||||||||||||||||||
Line Creek |
400 | 10,100 | 10,600 | 100.0 | 10,600 | |||||||||||||||
Quintette (Mt Babcock)
|
|
0
|
|
|
900
|
|
|
900
|
|
|
100.0
|
|
|
900
|
|
Project Satellite |
Proven
|
Probable
|
Total
|
|||||||||||||||||||||||||||||||
Tonnes (000s) |
Grade (%) |
Tonnes (000s) |
Grade (%) |
Tonnes (000s) |
Grade (%) |
Teck (%) |
Recoverable (000 t) (7) |
|||||||||||||||||||||||||||
Copper |
||||||||||||||||||||||||||||||||||
Zafranal |
408,800 | 0.39 | 32,000 | 0.21 | 440,700 | 0.38 | 80.0 | 1,150 | ||||||||||||||||||||||||||
Proven
|
Probable
|
Total
|
||||||||||||||||||||||||||||||||
Tonnes (000s) |
Grade (g/t) (4) |
Tonnes (000s) |
Grade (g/t) (4) |
Tonnes (000s) |
Grade (g/t) (4) |
Teck Interest (%) |
Recoverable (000 oz) (7) |
|||||||||||||||||||||||||||
Gold |
||||||||||||||||||||||||||||||||||
Zafranal |
408,800 | 0.07 | 32,000 | 0.05 | 440,700 | 0.07 | 80.0 | 440 |
Teck Resources Limited |
Page 56 |
2018 Annual Information Form
MINERAL RESOURCES as at 31 December 2018 (1) |
| |||||||||||||||||||||||||||
Measured
|
Indicated
|
Inferred
|
||||||||||||||||||||||||||
Tonnes (000s) |
Grade (%) |
Tonnes (000s) |
Grade (%) |
Tonnes (000s) |
Grade (%) |
Teck
|
||||||||||||||||||||||
Copper |
||||||||||||||||||||||||||||
Highland Valley Copper |
499,400 | 0.30 | 671,800 | 0.24 | 166,000 | 0.21 | 100.0 | |||||||||||||||||||||
Antamina |
||||||||||||||||||||||||||||
Copper only ore OP |
88,000 | 0.62 | 315,500 | 0.79 | 528,000 | 0.76 | 22.5 | |||||||||||||||||||||
Copper-zinc ore OP |
24,000 | 0.92 | 137,500 | 1.02 | 238,000 | 0.97 | 22.5 | |||||||||||||||||||||
Copper only ore UG |
296,200 | 1.28 | 22.5 | |||||||||||||||||||||||||
Copper Zinc ore UG |
|
174,200
|
|
|
1.26
|
|
|
22.5
|
| |||||||||||||||||||
Total |
111,900 | 0.68 | 453,000 | 0.86 | 1,236,400 | 0.99 | 22.5 | |||||||||||||||||||||
Quebrada Blanca |
||||||||||||||||||||||||||||
Quebrada Blanca - Mill |
36,200 | 0.42 | 1,558,000 | 0.40 | 3,125,200 | 0.38 | 90.0 | |||||||||||||||||||||
Andacollo - Heap leach(2) |
8,600 | 0.39 | 26,700 | 0.15 | 90.0 | |||||||||||||||||||||||
Andacollo - Mill |
36,600 | 0.29 | 256,100 | 0.26 | 47,400 | 0.26 | 90.0 | |||||||||||||||||||||
NuevaUnion |
||||||||||||||||||||||||||||
Relincho |
132,400 | 0.23 | 329,200 | 0.31 | 589,800 | 0.37 | 50.0 | |||||||||||||||||||||
La Fortuna |
|
400
|
|
|
0.56
|
|
|
52,800
|
|
|
0.67
|
|
|
377,000
|
|
|
0.51
|
|
|
50.0
|
| |||||||
Total |
132,800 | 0.24 | 382,100 | 0.36 | 966,900 | 0.42 | 50.0 | |||||||||||||||||||||
Molybdenum |
||||||||||||||||||||||||||||
Highland Valley Copper |
499,400 | 0.008 | 671,800 | 0.009 | 166,000 | 0.007 | 100.0 | |||||||||||||||||||||
Antamina |
||||||||||||||||||||||||||||
Copper only ore OP |
88,000 | 0.018 | 315,500 | 0.023 | 528,000 | 0.028 | 22.5 | |||||||||||||||||||||
Copper only ore UG |
|
296,200
|
|
|
0.020
|
|
|
22.5
|
| |||||||||||||||||||
Total |
88,000 | 0.018 | 315,500 | 0.023 | 824,200 | 0.025 | 22.5 | |||||||||||||||||||||
Quebrada Blanca |
||||||||||||||||||||||||||||
Quebrada Blanca - Mill |
36,200 | 0.014 | 1,558,000 | 0.016 | 3,125,200 | 0.018 | 90.0 | |||||||||||||||||||||
NuevaUnion |
||||||||||||||||||||||||||||
Relincho |
132,400 | 0.007 | 329,200 | 0.011 | 589,800 | 0.013 | 50.0 |
Teck Resources Limited |
Page 57 |
2018 Annual Information Form
MINERAL RESOURCES as at 31 December 2018 (1) |
| |||||||||||||||||||||||||||
Measured
|
Indicated
|
Inferred
|
Teck
|
|||||||||||||||||||||||||
Tonnes
|
Grade
|
Tonnes
|
Grade
|
Tonnes
|
Grade
|
|||||||||||||||||||||||
Zinc |
||||||||||||||||||||||||||||
Antamina |
||||||||||||||||||||||||||||
Copper-zinc ore OP |
24,000 | 1.4 | 137,500 | 1.6 | 238,000 | 1.6 | 22.5 | |||||||||||||||||||||
Copper zinc ore UG |
|
174,200
|
|
|
1.4
|
|
|
22.5
|
| |||||||||||||||||||
Total |
24,000 | 1.4 | 137,500 | 1.6 | 412,200 | 1.5 | 22.5 | |||||||||||||||||||||
Red Dog |
||||||||||||||||||||||||||||
Red Dog Mine |
12,900 | 8.7 | 8,100 | 11.3 | 100.0 | |||||||||||||||||||||||
Red Dog District |
19,400 | 14.4 | 100.0 | |||||||||||||||||||||||||
Pend Oreille |
400 | 4.4 | 2,300 | 6.4 | 100.0 | |||||||||||||||||||||||
Lead |
||||||||||||||||||||||||||||
Red Dog |
||||||||||||||||||||||||||||
Red Dog Mine |
12,900 | 2.9 | 8,100 | 4.3 | 100.0 | |||||||||||||||||||||||
Red Dog District |
19,400 | 4.2 | 100.0 | |||||||||||||||||||||||||
Pend Oreille |
|
400
|
|
|
0.9
|
|
|
2,300
|
|
|
1.3
|
|
|
100.0
|
| |||||||||||||
Measured
|
Indicated
|
Inferred
|
Teck (%)
|
|||||||||||||||||||||||||
Tonnes
|
Grade
|
Tonnes
|
Grade
|
Tonnes
|
Grade
|
|||||||||||||||||||||||
Gold |
||||||||||||||||||||||||||||
Andacollo - Mill (6) |
36,600 | 0.11 | 256,100 | 0.10 | 47,400 | 0.08 | 90.0 | |||||||||||||||||||||
NuevaUnion |
||||||||||||||||||||||||||||
La Fortuna |
400 | 0.47 | 52,800 | 0.85 | 377,000 | 0.55 | 50.0 | |||||||||||||||||||||
Silver |
||||||||||||||||||||||||||||
Antamina |
||||||||||||||||||||||||||||
Copper only ore OP |
88,000 | 6.9 | 315,500 | 9.0 | 528,000 | 7.7 | 22.5 | |||||||||||||||||||||
Copper-zinc ore OP |
24,000 | 16.4 | 137,500 | 18.2 | 238,000 | 14.9 | 22.5 | |||||||||||||||||||||
Copper only ore UG |
296,200 | 13.0 | 22.5 | |||||||||||||||||||||||||
Copper Zinc ore UG |
|
174,200
|
|
|
17.2
|
|
|
22.5
|
| |||||||||||||||||||
Total |
111,900 | 8.9 | 453,000 | 11.8 | 1,236,400 | 11.7 | 22.5 | |||||||||||||||||||||
Quebrada Blanca |
||||||||||||||||||||||||||||
Quebrada Blanca - Mill |
36,200 | 1.2 | 1,558,000 | 1.1 | 3,125,200 | 1.1 | 90.0 | |||||||||||||||||||||
Red Dog |
||||||||||||||||||||||||||||
Red Dog Mine |
12,900 | 53.5 | 8,100 | 81.6 | 100.0 | |||||||||||||||||||||||
Red Dog District |
19,400 | 73.4 | 100.0 | |||||||||||||||||||||||||
Teck Resources Limited |
Page 58 |
2018 Annual Information Form
MINERAL RESOURCES as at 31 December 2018 (1)
|
| |||||||||||||||
Measured
|
Indicated
|
Inferred
|
Teck Interest (%) |
|||||||||||||
Tonnes (000s) |
Tonnes (000s) |
Tonnes (000s) |
||||||||||||||
Metallurgical Coal (5) |
||||||||||||||||
Fording River |
407,600 | 925,500 | 775,600 | 100.00 | ||||||||||||
Elkview |
223,000 | 156,700 | 205,600 | 95.00 | ||||||||||||
Greenhills |
162,200 | 247,200 | 177,100 | 80.00 | ||||||||||||
Line Creek |
312,200 | 406,500 | 372,800 | 100.00 | ||||||||||||
Cardinal River |
13,400 | 2,200 | 500 | 100.00 | ||||||||||||
Quintette (Mt Babcock) |
31,800 | 92,000 | 114,400 | 100.00 | ||||||||||||
Mt Duke |
24,300 | 102,400 | 122,600 | 92.68 | ||||||||||||
Elco |
25,100 | 115,300 | 112,300 | 75.00 | ||||||||||||
CMO Phase II (Martin Wheeler) |
102,200 | 71,700 | 7,900 | 100.00 | ||||||||||||
PCI Coal (5) |
||||||||||||||||
Cardinal River |
500 | 200 | 50 | 100.00 | ||||||||||||
Coal Mountain |
56,800 | 22,900 | 4,800 | 100.00 | ||||||||||||
Thermal Coal (5) |
||||||||||||||||
Line Creek |
1,700 | 1,900 | 1,800 | 100.00 | ||||||||||||
Quintette (Mt Babcock) |
30 | 200 | 200 | 100.00 | ||||||||||||
Mt Duke |
200 | 700 | 1,300 | 92.68 | ||||||||||||
Elco |
700 | 6,100 | 6,000 | 75.00 | ||||||||||||
CMO Phase II (Martin Wheeler) |
2,800 | 3,700 | 900 | 100.00 | ||||||||||||
Teck Resources Limited |
Page 59 |
2018 Annual Information Form
MINERAL RESOURCES as at 31 December 2018 (1)
|
| |||||||||||||||||||||||||||
Measured
|
Indicated
|
Inferred
|
||||||||||||||||||||||||||
Project Satellite |
Tonnes
|
Grade
|
Tonnes
|
Grade
|
Tonnes
|
Grade
|
Teck
|
|||||||||||||||||||||
Copper |
||||||||||||||||||||||||||||
Galore Creek |
256,800 | 0.72 | 846,700 | 0.39 | 198,100 | 0.27 | 50.0 | |||||||||||||||||||||
Schaft Creek |
166,000 | 0.32 | 1,127,200 | 0.25 | 316,700 | 0.19 | 75.0 | |||||||||||||||||||||
Mesaba |
244,100 | 0.47 | 1,334,100 | 0.42 | 1,462,000 | 0.35 | 100.0 | |||||||||||||||||||||
Zafranal |
5,100 | 0.19 | 2,300 | 0.21 | 62,800 | 0.24 | 80.0 | |||||||||||||||||||||
San Nicolas |
32,400 | 1.27 | 76,500 | 1.12 | 4,700 | 1.25 | 100.0 | |||||||||||||||||||||
Molybdenum |
||||||||||||||||||||||||||||
Schaft Creek |
166,000 | 0.021 | 1,127,200 | 0.016 | 316,700 | 0.019 | 75.0 | |||||||||||||||||||||
Zinc |
||||||||||||||||||||||||||||
San Nicolas |
32,400 | 1.9 | 76,500 | 1.5 | 4,700 | 0.8 | 100.0 | |||||||||||||||||||||
Nickel |
||||||||||||||||||||||||||||
Mesaba |
244,100 | 0.11 | 1,334,100 | 0.10 | 1,462,000 | 0.09 | 100.0 | |||||||||||||||||||||
Cobalt |
||||||||||||||||||||||||||||
Mesaba
|
|
244,100
|
|
|
0.009
|
|
|
1,334,100
|
|
|
0.007
|
|
|
1,462,000
|
|
|
0.006
|
|
|
100.0
|
| |||||||
Measured
|
Indicated
|
Inferred
|
||||||||||||||||||||||||||
Tonnes
|
Grade
|
Tonnes
|
Grade
|
Tonnes
|
Grade
|
Teck
|
||||||||||||||||||||||
Gold |
||||||||||||||||||||||||||||
Galore Creek |
256,800 | 0.36 | 846,700 | 0.23 | 198,100 | 0.21 | 50.0 | |||||||||||||||||||||
Schaft Creek |
166,000 | 0.20 | 1,127,200 | 0.15 | 316,700 | 0.14 | 75.0 | |||||||||||||||||||||
Mesaba |
244,100 | 0.03 | 1,334,100 | 0.03 | 1,462,000 | 0.03 | 100.0 | |||||||||||||||||||||
Zafranal(8) |
5,100 | 0.04 | 2,300 | 0.05 | 62,800 | 0.10 | 80.0 | |||||||||||||||||||||
San Nicolas |
32,400 | 0.46 | 76,500 | 0.42 | 4,700 | 0.23 | 100.0 | |||||||||||||||||||||
Silver |
||||||||||||||||||||||||||||
Galore Creek |
256,800 | 5.8 | 846,700 | 3.7 | 198,100 | 2.7 | 50.0 | |||||||||||||||||||||
Schaft Creek |
166,000 | 1.5 | 1,127,200 | 1.2 | 316,700 | 1.1 | 75.0 | |||||||||||||||||||||
Mesaba |
244,100 | 1.2 | 1,334,100 | 1.0 | 1,462,000 | 0.7 | 100.0 | |||||||||||||||||||||
San Nicolas |
32,400 | 26.0 | 76,500 | 23.8 | 4,700 | 14.2 | 100.0 | |||||||||||||||||||||
Platinum |
||||||||||||||||||||||||||||
Mesaba |
244,100 | 0.04 | 1,334,100 | 0.03 | 1,462,000 | 0.04 | 100.0 | |||||||||||||||||||||
Palladium |
||||||||||||||||||||||||||||
Mesaba |
244,100 | 0.12 | 1,334,100 | 0.09 | 1,462,000 | 0.13 | 100.0 |
Teck Resources Limited |
Page 60 |
2018 Annual Information Form
Notes:
(1) | Mineral reserves and resources are mine and property totals and are not limited to our proportionate interests. |
(2) | For heap leach and dump leach operations, copper grade are reported as % soluble copper rather than % total copper. Soluble copper is defined by an analytical methodology which uses acid and cyanide reagents to approximate the portion of copper recoverable in the heap and dump leach processes. |
(3) | Coal reserves are reported as tonnes of clean coal. |
(4) | g/t = grams per tonne. |
(5) | Coal resources are reported as tonnes of raw coal. |
(6) | In 2015, an interest in future gold production from the Andacollo mine was sold. Compañia Minera Teck Carmen de Andacollo has agreed to sell and deliver to the purchaser an amount of gold equal to 100% of the payable gold produced from the Carmen de Andacollo mine until 900,000 ounces have been delivered, and 50% thereafter. Reserves and resources are stated without accounting for this production interest. |
(7) | Recoverable Metal refers to the amount of metal contained in concentrate or cathode copper. |
(8) | At Zafranal, gold in oxide material is considered to be non-recoverable. |
Definitions for Mineral Reserves and Mineral Resources
Mineral Reserves and Mineral Resources: Proven and probable mineral reserves and Measured, Indicated and Inferred mineral resources are estimated in accordance with the definitions of these terms adopted by the Canadian Institute of Mining, Metallurgy and Petroleum in November, 2010 updated in May 2014 and incorporated in National Instrument 43-101, Standards of Disclosure for Mineral Projects, by Canadian securities regulatory authorities.
Mineral resources are reported separately from, and do not include, that portion of the mineral resources classified as mineral reserves.
Metallurgical coal: means the various grades of coal that are used to produce coke, which is used in the steel making process.
PCI coal: means coal that is pulverized and injected into a blast furnace. Those grades of coal used in the PCI process are generally non-coking. PCI grade coal is used primarily as a heat source in the steel making process in partial replacement for high quality coking coals which are typically more expensive.
Thermal coal: means coal that is used primarily for its heating value. Thermal coals tend not to have the carbonization properties possessed by metallurgical coals. Most thermal coal is used to produce electricity in thermal power plants.
The Canadian Institute of Mining, Metallurgy and Petroleum definitions for mineral resources and mineral reserves are as follows:
A mineral resource is a concentration or occurrence of solid material of economic interest in or on the Earths crust in such form, grade or quality and quantity that there are reasonable prospects for eventual economic extraction. The location, quantity, grade or quality, continuity and other geological characteristics of a mineral resource are known, estimated or interpreted from specific geological evidence and knowledge, including sampling.
An inferred mineral resource is that part of a mineral resource for which quantity and grade or quality are estimated on the basis of limited geological evidence and sampling. Geological evidence is sufficient to imply but not verify geological and grade or quality continuity. An inferred
Teck Resources Limited |
Page 61 |
2018 Annual Information Form
mineral resource has a lower level of confidence than that applying to an indicated mineral resource and must not be converted to a mineral reserve. It is reasonably expected that the majority of inferred mineral resources could be upgraded to indicated mineral resources with continued exploration. An inferred mineral resource is based on limited information and sampling gathered through appropriate sampling techniques from locations such as outcrops, trenches, pits, workings and drillholes. Inferred mineral resources must not be included in the economic analysis, production schedules, or estimated mine life in publicly disclosed prefeasibility or feasibility studies, or in the life of mine plans and cash flow models of developed mines. Inferred mineral resources can only be used in economic studies as provided under National Instrument 43-101.
An indicated mineral resource is that part of a mineral resource for which quantity, grade or quality, densities, shape and physical characteristics are estimated with sufficient confidence to allow the application of modifying factors in sufficient detail to support mine planning and evaluation of the economic viability of the deposit. Geological evidence is derived from adequately detailed and reliable exploration, sampling and testing and is sufficient to assume geological and grade or quality continuity between points of observation. An indicated mineral resource has a lower level of confidence than that applying to a measured mineral resource and may only be converted to a probable mineral reserve. Mineralization may be classified as an indicated mineral resource by the qualified person when the nature, quality, quantity and distribution of data are such as to allow confident interpretation of the geological framework and to reasonably assume the continuity of mineralization. An indicated mineral resource estimate is of sufficient quality to support a prefeasibility study which can serve as the basis for major development decisions.
A measured mineral resource is that part of a mineral resource for which quantity, grade or quality, densities, shape, and physical characteristics are estimated with confidence sufficient to allow the application of modifying factors to support detailed mine planning and final evaluation of the economic viability of the deposit. Geological evidence is derived from detailed and reliable exploration, sampling and testing and is sufficient to confirm geological and grade or quality continuity between points of observation. A measured mineral resource has a higher level of confidence than that applying to either an indicated mineral resource or an inferred mineral resource. It may be converted to a proven mineral reserve or to a probable mineral reserve. Mineralization or other natural material of economic interest may be classified as a measured mineral resource when the nature, quality, quantity and distribution of data are such that the tonnage and grade or quality of the mineralization can be estimated to within close limits and that variation from the estimate would not significantly affect potential economic viability of the deposit. This category requires a high level of confidence in, and understanding of, the geology and controls of the mineral deposit.
A mineral reserve is the economically mineable part of a measured and/or indicated mineral resource. It includes diluting materials and allowances for losses, which may occur when the material is mined or extracted and is defined by studies at prefeasibility or feasibility level as appropriate that include application of modifying factors. These studies demonstrate that, at the time of reporting, extraction could reasonably be justified.
Teck Resources Limited |
Page 62 |
2018 Annual Information Form
A probable mineral reserve is the economically mineable part of an indicated, and in some circumstances, a measured mineral resource. The confidence in the modifying factors applying to a probable mineral reserve is lower than that applying to a proven mineral reserve.
A proven mineral reserve is the economically mineable part of a measured mineral resource. A proven mineral reserve implies a high degree of confidence in the modifying factors.
Methodologies and Assumptions
Mineral reserve and mineral resource estimates are based on various assumptions relating to operating matters, including with respect to production costs, mining and processing recoveries, mining dilution, cut-off values or grades, as well as assumptions relating to long-term commodity prices and, in some cases, exchange rates. Cost estimates are based on feasibility study estimates or operating history.
Methodologies used in reserve and resource estimates vary from property to property depending on the style of mineralization, geology and other factors. Geostatistical methods, appropriate to the style of mineralization, have been used in the estimation of reserves at Tecks material base metal properties.
Assumed metal prices vary from property to property for a number of reasons. Teck has interests in a number of joint ventures for which assumed metal prices are a joint venture decision. In certain cases, assumed metal prices are historical assumptions made at the time of the relevant reserve and resource estimates. For operations with short remaining lives, assumed metal prices may reflect shorter-term commodity price forecasts.
Comments on Individual Operations
Highland Valley Copper
Reserve and resource estimates were prepared assuming long-term metal prices of US$3.00/lb copper, US$9.40/lb molybdenum, US$20.00/oz silver and US$1,250/oz gold and an exchange rate of CAD$1.20 per US$1.00. Resources and reserves are reported at a 0.11% copper equivalent cut-off and a 1.7 molybdenum factor. A 0.11% copper equivalent cut-off equals a net smelter return (NSR) of US$5.51 per tonne.
There was a net decrease of 54 million tonnes of Proven and Probable reserves in 2018 mostly as a result of normal mining activity. The overall reduction is partially offset by updates to the resource model and changes in mine design. Resources significantly decreased by 356 million tonnes when compared to 2017, primarily because of higher assumed long-term operating costs. The resource estimate at Highland Valley is extremely sensitive to changes in these assumptions.
Antamina
Open pit reserve estimates were prepared assuming long-term metal prices of US$2.94/lb copper, US$1.05/lb zinc, US$7.96/lb molybdenum and US$19.54/oz. silver. Open pit and underground resource estimates were prepared assuming long-term metal prices of: US$3.30/lb copper, US$1.23/lb zinc, US$9.50/lb molybdenum and US$20.70/oz silver.
Teck Resources Limited |
Page 63 |
2018 Annual Information Form
Cut-off grades at Antamina are based on the net value before taxes that the relevant material is expected to generate per hour of concentrator operation at assumed prices, and varies by year in an effort to maximize the net present value of the pit.
Antamina engaged a third party to conduct an evaluation of the reasonable prospects for eventual economic extraction for both copper-only and copper-zinc ores to be mined by a more selective underground method than considered in 2017. The mineralized material located below the 2018 mineral resource pit shell was targeted and reported at a conceptual level in sufficient detail to declare Inferred mineral resources.
The total, open pit and underground, resources reported in 2018 are 565 million tonnes of Measured and Indicated and over 1.2 billion tonnes of Inferred. These figures are reduced from those reported in 2017 mostly due to the change in conceptual underground mine design method that reduces tonnes, partially offset by a positive impact in grade, and updates to the resource model.
Quebrada Blanca
Supergene reserves have been fully depleted in 2018. The Quebrada Blanca (hypogene) reserve and resource estimates were prepared assuming a long-term copper price of US$3.00/lb and a long-term molybdenum price of US$9.40/lb.
The hypogene mineral reserves show an increase of 141 million tonnes due to optimization of tailings storage capacity. A more robust resource estimate with higher confidence, updated with over 23,000 m of drilling and revised geological models, supports reporting an additional 270 million tonnes of Measured and Indicated and 985 million tonnes of Inferred resources compared to 2017 reported figures.
Carmen de Andacollo
The Carmen de Andacollo operation includes a heap leach copper operation and a copper-gold hypogene concentrator. The year-end 2018 reserves and reserves are based on the same models that supported 2017 figures; however, different economic assumptions were used to optimize the reserves and resources pit shells.
The hypogene reserves and resources are estimated using a mine plan that considers hourly throughput rates in the optimization model. This variable estimates the processing plant hourly performance based on the ore hardness. Hypogene reserve estimates assume long-term metal prices of US$3.00/lb copper and US$1,250/oz gold. Mineral reserves show some reduction from 2017 by depletion from normal mining activities. Hypogene resources have increased by 120 million tonnes due mostly to favourable operating costs that enabled a reduction of the cut-off for reporting resources.
NuevaUnión
Teck has a 50% interest in NuevaUnión. At the end of the first quarter of 2018, a prefeasibility study (PFS) on the NuevaUnión project was completed which incorporates key design changes to improve project economics and respond to community and Indigenous peoples input. Reserves and resources for two deposits, Relincho and La Fortuna have been updated based on this study.
Teck Resources Limited |
Page 64 |
2018 Annual Information Form
Reserves at Relincho and La Fortuna deposits consider a bulk open-pit mining operation that will be developed in three production phases that will alternate mining operations between the two deposits.
Relincho mineral reserves and mineral resources are reported using an average NSR cut-off of US$ 8.50/t, which assumes metal prices of US$ 3.00/lb copper and US$ 7.50/lb molybdenum.
La Fortuna mineral reserves and open pit mineral resources are reported using an average NSR cut-off of US$ 10.0/t, which assumes metal prices of US$ 3.00/lb copper and US$ 1,250/oz gold. Mineral resources outside of the mineral reserve pit are defined using a conceptual underground mining envelope. This approach assumes the same recoveries, metal prices, processing and general & administration costs as used for the open pits but with mining costs and dilution assumptions that are more appropriate to bulk underground mining.
Red Dog
Teck reports reserves and resources for Red Dog divided into two reporting groups based on the spatial proximity and the land ownership associated with the deposits in and around Red Dog. The names assigned to these groups are Mine and District.
In the Mine group, Teck is currently operating two deposits accessible by open pit mining: Aqqaluk, and Qanaiyaq. The Aqqaluk deposit, with first ore milled in August 2010; is scheduled to be mined through 2031. Mining of the Qanaiyaq deposit started with first ore milled in January 2017 and is planned to have a life span through 2028. The Red Dog Mine area also contains the undeveloped Paalaaq deposit, which is currently only defined to a resource level of confidence.
The District group consists entirely of Inferred resources from the Anarraaq deposit which lies approximately 11 km northwest of the current Red Dog operations. Resources for this deposit are unchanged, at 19.4 million tonnes, from 2017 statement.
All reserves and resources were estimated using long-term metal prices: US$1.10/lb for zinc, US$0.90/lb for lead and US$20.00/oz for silver. Red Dog Mine reserve tonnage has reduced by only 1.5 million tonnes. Gains due to higher metal price assumptions and lower costs and updated mine designs partially offset production depletion of 4.2 million tonnes. Red Dog Mine resources increased by 8.6 million tonnes, primarily due to reporting low-grade possibly reactive material as a resource for the first time.
Pend Oreille
Production in 2018 accounted for 380 kt depletion from reserves, and additional 152 kt from resources. Pend Oreille continued to develop and revise its mine plan with the inclusion of new mining shapes and adjustment of existing mining shapes based on new geologic interpretation. In 2018 the models for the different mine areas were continuously updated as infill drilling progressed.
The reserves and resources for the East Mine (Washington Rock and West Yellowhead resources estimates remain unchanged) are estimated using a 4.5% zinc cut-off. Recovery is 88% for zinc and 61% for lead. The reserves and resource for the MX area of Pend Oreille are
Teck Resources Limited |
Page 65 |
2018 Annual Information Form
estimated using a 4.5% zinc equivalent cut-off. All resources and reserves are estimated using US$1.10/lb zinc and US$0.90/lb for lead.
San Nicolás
Based on the results of the ongoing drilling program, mineral resources have been updated in 2018. NSR calculations include metal price assumptions as US$3.00/lb copper, US$1.10/lb zinc, US$1,250/oz gold and US$20/oz silver and scaled costs from previous studies.
The 2018 resource estimate assumes different NSR cut-offs for different geometallurgical domains from US$9.20/t to US$12.00/t based on an estimate of the marginal cost of production for the relevant ore.
Galore Creek
Teck has a 50% interest in Galore Creek. The year-end 2018 resource statement presents a conceptual change to the project. Only mineral resources are reported in 2018 and are estimated based on commodity prices of US$3.00/lb copper, US$1,200/oz gold and US$20/oz silver.
Schaft Creek
Schaft Creek resources are based on a 2018 Resource Model Update. Open pit mineral resources are reported at an NSR cut-off of US$4.31/t and constrained by a conceptual open pit shape. The resource estimate categorizes 10% of the mineral resources as Measured, 70% as Indicated and 20% as Inferred.
Mesaba
Mineral resources are reported at a cut-off of 0.2% copper, equivalent to a NSR cut-off of US$5.24/ton, and consider the estimates of copper, nickel, silver, cobalt, gold, platinum and palladium.
Zafranal
End-of-year 2018 resource and reserves are supported by a feasibility study being prepared for Compañia Minera Zafranal S.A.C. (CMZ). The resource model is built with updated geological interpretations and assay results from 404 drill holes totaling 120,300 metres. There has been approximately 22,359 metres of new core drilling since the completion of the prefeasibility study in 2016.
Resource and reserves estimates at Zafranal are prepared using price assumptions of US$3.00/lb copper and US$1,200/oz gold. Mining and processing costs, as with other important input parameters, were updated from the prefeasibility study. The total contained metal used in the reserves table are based on variable metallurgical recoveries of up to 89.5% for copper and up to 56% for gold. Open pit mineral reserves are reported using a variable NSR cut-off of US$6.10 to $6.35/t averaging US$6.11/t.
Fording River
The reserve economics assume a long-term selling price at the Port of Vancouver of US$130/tonne for metallurgical coal at an exchange rate of CAD$1.20 per US$1.00.
Teck Resources Limited |
Page 66 |
2018 Annual Information Form
Elkview
Teck has a 95% interest in the Elkview mine. The reserve economics assume a long-term selling price at the Port of Vancouver of US$130/tonne for metallurgical coal at an exchange rate of CAD$1.20 per US$1.00.
Greenhills
Teck is an 80% member of the Greenhills Joint Venture. The reserve economics assume a long term selling price at the Port of Vancouver of US$130/tonne for metallurgical coal at an exchange rate of CAD$1.20 per US$1.00.
Line Creek
The reserve economics assume a long term selling price at the Port of Vancouver of US$130/tonne for metallurgical coal and US$75/tonne for oxide coal at an exchange rate of CAD$1.20 per US$1.00.
Cardinal River
The reserve economics assume a long term selling price of US$130/tonne for metallurgical coal and US$100/tonne for PCI coal at an exchange rate of CAD$1.20 per US$1.00.
Quintette (Mt Babcock)
The reserve economics assume a long-term selling price of US$130/tonne for metallurgical coal and US$75 for oxide coal at an exchange rate of CAD$1.20 per US$1.00.
Risks and Uncertainties
Mineral reserves and mineral resources are estimates of the size and grade of the deposits based on the assumptions and parameters currently available. These assumptions and parameters are subject to a number of risks and uncertainties, including, but not limited to, future changes in metals prices and/or production costs, differences in size, grade, continuity, geometry or location of mineralization from that predicted by geological modeling, recovery rates being less than those expected and changes in project parameters due to changes in production plans. Except as expressly described elsewhere in this Annual Information Form, there are no known environmental, permitting, legal, title, taxation, sociopolitical, marketing or other issues that are currently expected to materially affect the mineral reserves or resources. Certain operations will require further permits over the course of their operating lives in order to continue operating. Where management expects such permits to be issued in the ordinary course, material that may only be mined after such permits are issued is included in Proven and Probable reserves. Specific current permitting issues are described in the narrative concerning the relevant operation under the headings Description of the Business and Health and Safety and Environmental Protection and under the heading Risk Factors We face risks associated with the issuance and renewal of environmental permits.
Teck Resources Limited |
Page 67 |
2018 Annual Information Form
Qualified Persons
Estimates of mineral reserves and resources for our material base metal properties have been prepared under the general supervision of Rodrigo Marinho, P.Geo., who is an employee of Teck Resources Limited. Mineral reserve and resource estimates for Antamina have been prepared under the supervision of Luis Mamani and Lucio Canchis, who are both SME Registered Members and employees of Compañía Minera Antamina S.A. Messrs. Marinho, Canchis and Mamani are the Qualified Persons for the purposes of National Instrument 43-101. Reserve and resource estimates for coal properties were prepared under the general supervision of Don Mills P.Geo. and Robin Gold P.Eng., employees of Teck Coal Limited, who are the Qualified Persons for the purposes of National Instrument 43101.
Oil and Gas Reserves
The reserves information set out below for the Fort Hills mine is based upon evaluations conducted by GLJ, an independent qualified reserves evaluator.
The effective date of the reserves data and other oil and gas information below for Fort Hills is December 31, 2018. Estimates of reserves and projections of production were prepared by GLJ using information provided up to December 31, 2018. The reserves information set out below for Fort Hills is taken from a report prepared by GLJ on January 28, 2019. All reserves information in this section is based on Tecks 21.3% interest in Fort Hills.
Classifications of oil and gas reserves as Proved or Probable are only attempts to define the degree of certainty associated with the estimates. There are numerous uncertainties inherent in estimating quantities of oil reserves. It should not be assumed that the estimates of future net revenues presented in the tables below represent the fair market value of the reserves. There is no assurance that the forecast price and cost assumptions will be attained and variances could be material. The reserves estimates provided herein are estimates only and there is no guarantee that the estimated reserves will be recovered. Actual reserves may be greater or less than the estimates disclosed.
Reserve Categories and Resources
Reserves
For oil and gas, reserves are estimated remaining quantities of oil and natural gas and related substances anticipated to be recoverable from known accumulations, as of a given date, based on analysis of drilling, geological, geophysical and engineering data; the use of established technology; and specified economic conditions that are generally accepted as being reasonable. Reserves are classified into Proved or Probable according to the degree of certainty associated with the estimates.
Proved reserves are those reserves that can be estimated with a high degree of certainty to be recoverable. It is likely that the actual remaining quantities recovered will exceed the estimated Proved reserves.
Teck Resources Limited |
Page 68 |
2018 Annual Information Form
Probable reserves are those additional reserves that are less certain to be recovered than Proved reserves. It is equally likely that the actual remaining quantities recovered will be greater or less than the sum of the estimated Proved plus Probable reserves.
Each of the Proved and Probable reserves categories may be divided into developed and undeveloped categories. All of Tecks reserves are currently categorized as developed reserves since Fort Hills is now in operation. Undeveloped reserves are those reserves expected to be recovered from known accumulations where a significant expenditure (e.g., construction of a primary extraction facility) is required and the necessary equipment is not yet installed to render them capable of production.
Fort Hills Mine
The reserves data presented below summarizes our Proved and Probable reserves and the net present values of future net revenue for these reserves. The reserves data uses forecast prices and costs prior to provision for, and therefore do not take into account, interest, general and administrative expenses or the impact of any hedging activities. In addition, provisions for the abandonment and reclamation of the mines and associated facilities to which reserves have been assigned have been included; all other abandonment and reclamation costs have not been included. These forecasts and other assumptions are taken from the GLJ evaluation report with an effective date of December 31, 2018. Future net revenues have been presented on a before and after tax basis in accordance with National Instrument 51-101.
The future net revenue, development and operating cost, exchange rate, price and other assumptions set out in this Description of the Business Oil and Gas Reserves and Resources Fort Hills Mine section of this AIF are the estimates or assumptions of GLJ, our independent reserves evaluator. In order to estimate reserves and future net revenues, GLJ makes a number of assumptions, including assumptions regarding inflation rates, currency exchange rates, and prices for oil and other products. For planning, project economics, forecasts, accounting and other purposes, our management makes assumptions regarding those same factors and our assumptions generally differ from those of GLJ. Different assumptions would lead to different present value and net revenue figures, and could affect reserve estimates.
GLJ estimates capital and operating costs associated with Fort Hills are based on Suncors estimates, as operator, with consideration to those achieved by other oil sands mining projects. These GLJ-estimated costs differ somewhat from those that the Fort Hills partners use for planning and decision-making for the project, which are based on detailed engineering studies. See Description of the Business Energy Fort Hills Mine for a further description of the project operator estimates regarding costs.
Teck Resources Limited |
Page 69 |
2018 Annual Information Form
All of our reserves are associated with Fort Hills. Bitumen is the only product type associated with our reserves. Reserves are presented on a gross and net basis. Gross in relation to Tecks interest in reserves means Tecks working interest as at December 31, 2018 (21.3%) share before deduction of royalties. Net in relation to Tecks interest in reserves means Tecks working interest as at December 31, 2018 (21.3%) share after deduction of royalties.
Summary of Oil and Gas Reserves
at December 31, 2018
(forecast prices and costs)
(in millions of barrels) | Reserves | |||
Reserves Category | Bitumen
| |||
Gross
|
Net
| |||
Proved Reserves
|
||||
Developed Producing
|
371
|
343
| ||
Developed Nonproducing
|
0
|
0
| ||
Undeveloped
|
0
|
0
| ||
Total Proved Reserves
|
371
|
343
| ||
Probable Reserves
|
195
|
165
| ||
Total Proved plus Probable Reserves
|
566
|
508
|
Teck Resources Limited |
Page 70 |
2018 Annual Information Form
Summary of Net Present Value of Future Net Revenue at December 31, 2018
(forecast prices and costs)
The net present value of future net revenues below in respect of Tecks interest in Fort Hills were computed by applying an average price forecast based on forecasts from three qualified reserves evaluators (including GLJ), GLJs forecast costs as described below, legislated tax rates and Tecks tax pools. The estimates of future net revenue do not necessarily provide a reliable estimate of the expected future cash flows to be obtained from our share of the Fort Hills reserves and do not necessarily represent the fair market value of our Proved and Probable oil reserves. The independent reserves evaluator makes various assumptions, including with respect to production rates and capital and operating costs that may differ from those that the Fort Hills partners use for planning and decision-making for the project, which are based on detailed engineering studies and historical site cost data.
Net Present Value of Future Revenue
|
||||||||||||||||||||||||||||||||||||||||||||
Reserves Category |
|
Before Income Taxes Discounted at (%/year) ($ millions) |
|
|
After Income Taxes Discounted at (%/year) ($ millions) |
|
|
Unit value ($/bbl)(1) |
| |||||||||||||||||||||||||||||||||||
0% | 5% | 10% | 15% | 20% | 0% | 5% | 10% | 15% | 20% | |||||||||||||||||||||||||||||||||||
Proved Reserves |
||||||||||||||||||||||||||||||||||||||||||||
Producing | 5437 | 2472 | 1260 | 703 | 417 | 4648 | 2219 | 1172 | 671 | 405 | 3.67 | |||||||||||||||||||||||||||||||||
Developed Nonproducing | 0 | 0 | 0 | 0 | 0 | 0 | 0 | 0 | 0 | 0 | 0.00 | |||||||||||||||||||||||||||||||||
Undeveloped | 0 | 0 | 0 | 0 | 0 | 0 | 0 | 0 | 0 | 0 | 0.00 | |||||||||||||||||||||||||||||||||
Total Proved | 5437 | 2472 | 1260 | 703 | 417 | 4648 | 2219 | 1172 | 671 | 405 | 3.67 | |||||||||||||||||||||||||||||||||
Total Probable | 4424 | 1134 | 403 | 201 | 128 | 3111 | 846 | 325 | 176 | 118 | 2.44 | |||||||||||||||||||||||||||||||||
Total Proved plus Probable |
9860 | 3606 | 1662 | 904 | 545 | 7759 | 3065 | 1497 | 847 | 522 | 3.27 |
(1) | Unit values are future net revenues, before deducting estimated cash income taxes payable, discounted at 10%, using net reserves. |
Teck Resources Limited |
Page 71 |
2018 Annual Information Form
Total Future Net Revenue as at December 31, 2018 (undiscounted)
(forecast prices and costs)
The future net revenues below in respect of Tecks interest in Fort Hills were computed by applying an average price forecast based on forecasts from three qualified reserves evaluators (including GLJ), GLJs forecast costs as described below, legislated tax rates and Tecks tax pools. The estimates of future net revenue do not necessarily provide a reliable estimate of the expected future cash flows to be obtained from our share of the Fort Hills reserves and do not necessarily represent the fair market value of our proved and probable oil reserves. The capital and operating costs below reflect GLJs estimates and differ from those that the Fort Hills partners use for planning and decision-making for the project, which are based on detailed engineering studies and historical cost data. See Description of the Business Energy Fort Hills Mine for a further description of the project operator projections regarding costs.
(in $ millions) (undiscounted) |
Revenue | Royalties | Operating Costs |
Capital Development Costs |
Abandon- and |
Future net revenue before income taxes |
Income taxes |
Future net revenue after income taxes |
||||||||||||||||||||||||
Proved Producing |
24057 | 1864 | 14181 | 2065 | 510 | 5437 | 788 | 4648 | ||||||||||||||||||||||||
Proved Developed Nonproducing |
0 | 0 | 0 | 0 | 0 | 0 | 0 | 0 | ||||||||||||||||||||||||
Proved Undeveloped | 0 | 0 | 0 | 0 | 0 | 0 | 0 | 0 | ||||||||||||||||||||||||
Total Proved | 24057 | 1864 | 14181 | 2065 | 510 | 5437 | 788 | 4648 | ||||||||||||||||||||||||
Total Probable | 18973 | 3017 | 9930 | 1143 | 459 | 4424 | 1313 | 3111 | ||||||||||||||||||||||||
Total Proved Plus Probable Reserves |
43030 | 4880 | 24111 | 3208 | 970 | 9860 | 2101 | 7759 |
Future Net Revenue by Product Type at December 31, 2018
(at forecast prices and cost)
Reserves Category | Production group |
Future Net Revenue Before Income Taxes(1)
(discounted at 10%/year) |
||||||||
($ millions) | ($/bbl) | |||||||||
Proved Producing | Bitumen | 1260 | 3.67 | |||||||
Total Proved | Bitumen | 1260 | 3.67 | |||||||
Total Proved Plus Probable Reserves | Bitumen | 1662 | 3.27 |
(1) Unit values are based on Tecks net reserves.
Teck Resources Limited |
Page 72 |
2018 Annual Information Form
Forecast Prices Used in Estimates
The determination of reserves requires assumptions of crude oil, natural gas and other important benchmark reference prices, as well as inflation and exchange rates. The forecast prices used in preparing Tecks reserves data, including estimated future net revenues, are provided below and were used by GLJ, our independent qualified reserves evaluator.
The table below reflects a December 31, 2018 average of three qualified reserves evaluators (including GLJ), forecast reference prices, and associated inflation and exchange rates. For determining costs associated with Fort Hills, GLJ has included a 2.0% inflation rate for 2020 onwards.
The forecast reference prices, exchange rates, inflationary assumptions and other forecasts used in preparing the reserves data do not necessarily reflect the assumptions of Tecks management or the Fort Hills partners. The forecast price and other assumptions noted below are not used in Tecks investment or management decisions or for Tecks accounting purposes.
Year |
Exchange Rate ($US/$CAD) |
West Texas Intermediate Crude Oil at Cushing Oklahoma $US/bbl (then current USD)
|
WCS Crude at Hardisty $CAD/bbl (then current CAD) |
Edmonton $CAD/bbl(1)
(then | ||||
2018(2) | 0.7716 | 64.76 | 49.87 | 79.05 | ||||
2019 | 0.7567 | 58.58 | 51.55 | 70.10 | ||||
2020 | 0.7817 | 64.60 | 59.58 | 79.21 | ||||
2021 | 0.7967 | 68.20 | 65.89 | 83.33 | ||||
2022 | 0.8033 | 71.00 | 68.61 | 86.20 | ||||
2023 | 0.8067 | 72.81 | 70.53 | 88.16 | ||||
2024 | 0.8083 | 74.59 | 72.34 | 90.20 | ||||
2025 | 0.8083 | 76.42 | 74.31 | 92.43 | ||||
2026 | 0.8083 | 78.40 | 76.44 | 94.87 | ||||
2027 | 0.8083 | 79.98 | 78.10 | 96.80 | ||||
2028 | 0.8083 | 81.59 | 79.81 | 98.79 | ||||
2029+ | 0.8083 | 83.22 | 81.40 | 100.76 | ||||
|
(1) | Price used when determining the cost of diluent associated with bitumen reserves. Assumed diluent prices equal the posted pentanes prices plus a premium of $4.00/bbl (2019 dollars). |
(2) | Pricing for 2018 reflects the companys historical weighted average prices. |
Teck Resources Limited |
Page 73 |
2018 Annual Information Form
Reconciliation of Changes in Reserves
National Instrument 51-101 requires a reporting issuer to disclose changes between the reserves estimates as at the effective date and the corresponding estimates made as at the last day of the preceding financial year of the reporting issuer.
(in millions of barrels) |
Total Oil Reserves
| |||||
Bitumen (Company Gross)
| ||||||
Proved
|
Probable
|
Proved Plus Probable
| ||||
At December 31, 2017
|
365.6
|
228.7
|
594.3
| |||
Production
|
(9.4)
|
0.0
|
(9.4)
| |||
Acquisitions
|
7.4
|
3.8
|
11.2
| |||
Revisions
|
7.1
|
(37.2)
|
(30.0)
| |||
At December 31, 2018
|
370.7
|
195.4
|
566.1
| |||
|
Additional Information Relating to Reserves Data
All of Tecks Proved and Probable reserves relate to Fort Hills and were first attributed to Teck in 2013. On October 30, 2013, the co-owners of Fort Hills announced project sanction. The plant began producing limited quantities of a bitumen froth product in the fourth quarter of 2017, followed by the first oil milestone on January 27, 2018 when the secondary extraction plant began operating.
(in millions of barrels) |
Bitumen (Company Gross) | |||||||
Proved |
Probable | |||||||
First Attributed
|
Total at Year End
|
First Attributed
|
Total at Year End
| |||||
2016 |
- |
346.0 |
- |
227.0 | ||||
2017 |
15.6 |
365.6 |
9.7 |
228.7 | ||||
2018 |
- |
- |
- |
- |
Teck Resources Limited |
Page 74 |
2018 Annual Information Form
Future Development Costs
The table below provides the development costs GLJ has estimated and assumed are to be incurred for purposes of the estimation of the future net revenue attributable to the reserves. The GLJ future development costs set out below differ from those that the Fort Hills partners use for construction planning and decision-making for the project, which are based on detailed engineering studies and historical cost data. See Description of the Business Energy Fort Hills Mine for a further description of the project operator projections regarding development costs.
Reserves Category ($ thousands)
|
2019 | 2020 | 2021 | 2022 | 2023 | Remainder | Total |
Total (10% discounted)
| ||||||||
Total Proved
|
146,739 | 165,180 | 140,976 | 77,159 | 157,404 | 1,377,829 | 2,065,287 | 905,160 | ||||||||
Total Proved plus Probable Reserves | 156,653 | 174,897 | 149,269 | 81,697 | 166,663 | 2,479,158 | 3,208,337 | 999,507 |
We believe that internally generated cash flows, existing credit facilities and access to capital markets will be sufficient to fund our future development costs. However, there can be no guarantee that the necessary funds will be available or that we will allocate funding to develop all of our reserves. Failure to develop those reserves would have a negative impact on our future cash flow.
The interest or other costs of external funding are not included in the reserves and future net revenue estimates and would reduce future net revenue, depending upon the funding sources utilized. We do not believe that interest or other funding costs would make development of any property uneconomic.
Teck Resources Limited |
Page 75 |
2018 Annual Information Form
Production History
2018 - Fort Hills(1) | Unit | Q1 | Q2 | Q3 | Q4 | Average | ||||||
Total bitumen production |
mbbls/d |
11.9 |
27.9 |
27.4 |
38.8 |
26.6 | ||||||
Bitumen price realized(2)(3) |
$/bbl |
- |
64.59 |
53.41 |
8.98 |
32.81 | ||||||
Crown royalties |
$/bbl |
- |
(3.59) |
(2.90) |
(0.98) |
(2.04) | ||||||
Transportation costs |
$/bbl |
- |
(8.90) |
(9.58) |
(8.22) |
(8.83) | ||||||
Production costs |
$/bbl |
- |
(38.25) |
(39.04) |
(26.91) |
(32.89) | ||||||
Operating netback(3) |
$/bbl |
- |
13.85 |
1.89 |
(27.13) |
(10.95) |
(1) | Other than bitumen production, which includes production from the full 2018 year, numbers provided below are provided following completion of commissioning on June 1, 2018 only. |
(2) | Bitumen price realized represents the realized petroleum revenue (blended bitumen sales revenue) net of diluent expense and before royalties. Blended bitumen sales revenue represents revenue from our share of the heavy crude oil blend known as Fort Hills Reduced Carbon Life Cycle Dilbit Blend, sold at the Hardisty and U.S. Gulf Coast market hubs. |
(3) | Operating netback and Bitumen price realized are non-GAAP financial measures. See Non-GAAP Measures for additional information, including where to find a reconciliation of these measures to GAAP measures. |
Production Estimate
GLJ has forecast Fort Hills production for 2019 to be 148,000 barrels per day and 158,000 barrels per day in the total proved and the total proved plus probable reserves categories, respectively (of which Tecks share would be 31,531 barrels per day and 33,662 barrels per day). Consistent with the Government of Alberta announcement on December 2, 2018, these estimates assume the mandatory industry-wide production curtailment of 325,000 barrels per day is in place for the first four months of the year declining to 95,000 barrels per day for the remainder of 2019. This restriction was implemented January 1, 2019 in order to help boost regional oil prices. The curtailment rules state that they will be fully repealed on December 31, 2019 and GLJ has forecast Fort Hills production accordingly.
Other Oil and Gas Information
Tax Horizon
Because of available tax pools, we are currently shielded from cash income taxes, but not resource taxes, in Canada. We remain subject to cash taxes in foreign jurisdictions. When we will become subject to cash income taxes in Canada is dependent on a number of factors, including but not limited to the price of the commodities that our various business units deal in and the level of our future investments in Canadian operations.
Teck Resources Limited |
Page 76 |
2018 Annual Information Form
Health and Safety and Environmental Protection
Our current and future operations, including development activities and commencement of production on our properties or areas in which we have an interest, are subject to laws and regulations in Canada, the U.S., Chile and elsewhere governing occupational health and safety, protection and remediation of the environment, site reclamation, management of toxic substances and similar matters. Compliance with these laws and regulations can affect the planning, designing, operating, closing and remediating of our mines, refineries and other facilities.
Whether in Canada, the U.S., Chile or elsewhere, we work to apply technically proven and economically feasible measures to protect the environment and worker health and safety throughout the mining life cycle of exploration, construction, mining, processing and closure. Although we believe that, except as described in the narrative concerning the relevant operation, our operations and facilities are currently in substantial compliance in all material respects with all existing laws, regulations and permits, there can be no assurance that additional significant costs will not be incurred to comply with current or future regulations or that liabilities associated with non-compliance will not be incurred.
We are often an active participant in the public regulatory review, revision and development processes with government agencies and non-governmental organizations and, as such, typically have insight regarding emerging regulatory developments and trends. We apply this insight when we estimate risks and liabilities associated with current and future regulatory matters including in the areas of health and safety and the environment. We conduct regular environmental and health and safety audits. The overall objective of our audits is to identify environmental and health and safety risks and assess regulatory compliance. Environmental, health and safety regulations are constantly evolving and it can be a significant challenge to meet changing standards.
Health and Safety
Safety is a core value at Teck. Safety performance and workplace occupational health and hygiene are key priorities for us. Safety statistics are collected from each business unit and operation monthly. Targets for health and safety key performance indicators are set each year and are one factor used in determining management compensation. Safety incidents are thoroughly investigated and findings reports are shared across our business, and occasionally across the industry, to assist in the prevention of similar incidents. We continue to implement our occupational health and hygiene strategy to prevent occupational disease and our high potential risk control strategy and hazard identification training program to prevent serious injuries and fatalities. Our Courageous Safety Leadership program also helps us build a positive culture of safety across the company. At this time, we do not anticipate significant liability associated with long-term occupational health issues.
Reclamation and Closure
In order to obtain mining permits and approvals from regulatory authorities, mine operators must typically submit a reclamation plan for restoring, upon prolonged suspension or completion of mining operations, the mined property to a productive use and meet many other permitted conditions. Typically, we submit the necessary permit applications several months or even years before we plan to begin activities. Some of the permits we require are becoming increasingly
Teck Resources Limited |
Page 77 |
2018 Annual Information Form
difficult and expensive to obtain, and the application and review processes are taking longer to complete, becoming increasingly complex in terms of required background information, and are subject to challenge. For a further discussion of risks associated with the issuance and renewal of environmental permits, see Risk Factors We face risks associated with the issuance and renewal of environmental permits.
For accounting purposes, current costs associated with permit compliance are treated as normal operating costs necessary to maintain operations on an ongoing basis. In addition, amounts are accrued in our accounts to provide for certain and probable future decommissioning, reclamation, site restoration and other closure costs. Financial assurance of various forms, including letters of credit and surety bonds, are posted with various governmental authorities as security to cover estimated reclamation obligations. Our provisions for future reclamation and site restoration are estimated based on known requirements. Many of our sites undergo extensive progressive reclamation during operations so as to proactively address mined-out areas and lessen the works required upon mine closure. The reclamation programs are guided by land capability assessments, which integrate several factors in the reclamation approach, including biological diversity, establishment of sustainable vegetation, diversity of physical landforms and requirements for wildlife habitat. All of our mining operations have closure plans in place that are developed to the level of detail appropriate to the stage of life of the operation. All of the plans undergo regular updates.
Certain idle and closed mines are under continuous care and maintenance as well as progressive closure and, as noted above, many of our active sites undergo extensive progressive reclamation during operations. Cost estimates for these planned and anticipated closure and remediation activities are reviewed on a regular basis and revised as plans for individual sites are refined and implemented, typically with input and oversight from regulatory agencies and other stakeholders.
Our decommissioning and restoration provision as at December 31, 2018 is $1,614 million, of which $610 million is attributable to our operating coal operations, $382 million is attributable to our operating copper operations, $323 million is attributable to our operating zinc operations, $50 million is attributable to our energy operations and $249 million is attributable to closed properties. Of that amount, we expect to spend approximately $91 million in 2019. As at December 31, 2018, we had letters of credit and other bonding in place to secure our reclamation obligations in the aggregate amount of approximately $2.1 billion. British Columbia and Chile are continuing to review their reclamation security requirements, which we expect may result in future increases to the financial security that we may be required to post in respect of our reclamation obligations.
See the disclosure regarding environmental matters under the respective descriptions of our material operations for further details of environmental matters impacting those operations.
Climate Change and Carbon Pricing
As part of the ongoing efforts to address climate change, regulations to control greenhouse gas emissions continue to be developed and enhanced in many jurisdictions. Recognizing our role in combating climate change, we continue to take action to reduce greenhouse gas emissions by improving our energy efficiency and implementing low-carbon technologies at our operations and by working with governments and regulators to advocate for effective and efficient carbon pricing.
Teck Resources Limited |
Page 78 |
2018 Annual Information Form
However, regulatory uncertainty and resulting uncertainty regarding the costs of technology required to comply with current or anticipated regulations make it difficult to predict the ultimate costs of compliance.
Societal focus on controlling carbon emissions, minimizing climate change and preparing for climate change adaptation continues to mount. In 2017, British Columbia announced a planned increase to the carbon tax beginning in 2018, with an increase in the tax rate to $35/tonne and increasing by $5/tonne of carbon dioxide-equivalent (CO2e) per year until reaching $50/tonne of CO2e. At the same time, the Government of British Columbia made a commitment to address impacts to emissions-intensive, trade-exposed industries to ensure that British Columbia operations maintain their competitiveness and that carbon leakage is avoided. On January 1, 2018, Alberta introduced the Carbon Competitiveness Incentive Regulation, an industry-specific carbon pricing policy requiring large emitters, and other facilities that have opted in, to reduce their emissions intensity below a prescribed level, or to purchase emissions credits in concert with or as an alternative to physical abatement, with significant penalties for failure to achieve compliance. In June 2018, the Government of Canada introduced the Greenhouse Gas Pollution Pricing Act that establishes a federal carbon levy for any Province or Territory that has not implemented a compliant carbon-pricing regime. Federal carbon levy rates will start with a minimum price of $10 per tonne in 2018, increasing $10 per year to $50 per tonne by 2022. The Greenhouse Gas Pollution Price Act comes into effect in April 2019 and will only apply in provinces or territories whose policies are not deemed sufficiently similar. Both BC and Albertas policies meet these requirements at this time, and as a result, the national carbon pricing regulations will not currently apply to our operations.
While climate change regulations continue to evolve in most jurisdictions in which we operate, we expect that regional, national, or international regulations, which seek to reduce greenhouse gas emissions, will continue to be established or revised. The cost of reducing our emissions or of obtaining the equivalent amount of credits or offsets in the future, if regulations permit this, remains highly uncertain. The cost of compliance with various climate change regulations will ultimately be determined by the regulations themselves and by the markets that evolve for carbon credits and offsets. Tecks direct greenhouse gas emissions attributable to our operations for 2018 are estimated to be approximately 2.9 million tonnes (CO2e). The most material indirect emissions associated with our activities are those from the use of our steelmaking coal by our customers. Based on our 2018 sales volumes, emissions from the use of our steelmaking coal would have been approximately 76 million tonnes of CO2.
For 2018, our seven B.C.-based operations incurred $58.8 million in British Columbia provincial carbon tax and our Cardinal River operation in Alberta paid $1.2 million in carbon costs, primarily from our use of coal, diesel fuel and natural gas. We may in the future face similar taxation for our activities in other jurisdictions. Similarly, the customers of some of our products may also be subject to new carbon costs or taxation in the future in the jurisdictions where the products are ultimately used.
Water Regulation
In addition to climate change, issues surrounding water regulation remain of particular importance. We continue to monitor regulatory initiatives and participate in consultation opportunities with governments. For example, we are participating in the Canadian federal
Teck Resources Limited |
Page 79 |
2018 Annual Information Form
government consultation focused on developing a Coal Mining Effluent Regulation and updating the Canadian Metal Mining Effluent Regulation. The ultimate form of these regulations may have a material effect on compliance costs, mine plans, and our capital and operating costs at affected mines. See Risk Factors Changes in environmental, health and safety laws may have a material adverse effect on our operations. We are continuing to work to implement a plan for the management of selenium and other constituents at all of our operating steelmaking coal mines in the Elk Valley. Our costs of implementing this plan are uncertain and will depend on the results of ongoing environmental monitoring, other technical developments, and future actions by regulators. See Description of the Business Coal and Risk Factors We face risks associated with the issuance and renewal of environmental permits for further information.
Social and Environmental Policies
We have adopted and implemented social and environmental policies and practices that are essential to our operations. Our operating practices are governed by the principles set out in our Code of Ethics and our Code of Sustainable Conduct.
The Code of Sustainable Conduct emphasizes our overall commitment to sustainability and sets out specific requirements in areas related to: (i) legal compliance and ethical business conduct; (ii) impact risk and opportunity management; (iii) identification, control and promotion of safety and health performance; (iv) sound environmental conduct and continuous improvement in performance; (v) fostering dialogue with stakeholders and respect for the rights, interests and aspirations of Indigenous People; (vi) support for local communities and promotion of responsible use and supply of our products; and (vii) maintaining a confidential feedback mechanism and conducting regular audits to ensure adherence to the Code.
In addition to the Code of Ethics and the Code of Sustainable Conduct, we have adopted a Health and Safety Policy, a Health and Safety Guide for Exploration, a Water Policy, a Human Rights Policy, an Inclusion and Diversity Policy, an Indigenous Peoples Policy, a Tax Policy and a Policy setting out our expectations for suppliers and contractors. We have taken steps to implement the Code of Sustainable Conduct and related policies through adoption of our Health, Safety, Environment and Community Management Standards, which provide direction to all operations and auditable criteria against which performance is measured. Safety and sustainability (including environment and community) performance are metrics used in our bonus plan.
We set objectives in these areas for improvement on an annual basis, and these are used to determine specific objectives for corporate and operational groups within our organization. Overall responsibility for achievement of objectives rests with senior personnel. For example, our Safety and Sustainability Committee of the Board (which reports to the Board of Directors), our corporate Health, Safety, Environment, and Community Risk Management Committee and our Materials Stewardship Committee, which are comprised of members of senior management, provide oversight in these areas.
Teck Resources Limited |
Page 80 |
2018 Annual Information Form
We measure and report our performance on an ongoing and comprehensive basis. Internal monthly, quarterly and annual reporting tracks performance indicators, including compliance with permits, environmental monitoring, health and safety performance, materials inputs and outputs, community concerns expressed and actions taken in response, and reclamation and remediation activities.
Human Resources
As at December 31, 2018, there were approximately 10,000 employees classified as regular employees working at the various operations and projects we manage, as well as our corporate offices. Of those employees, approximately 4,400 were employed by our Coal operations, 2,500 by our Copper operations, 2,200 by our Zinc operations and 900 by our Exploration, Energy, and projects and corporate groups. Our regular employees figure excludes employees classified as casual, fixed-term or inactive.
We reached two agreements in 2018 relating to collective arrangements; both agreements were with our two unions at Quebrada Blanca. The collective agreement at Antamina expired at the end of July 2018; negotiations for a new agreement are ongoing.
Collective bargaining agreements covering unionized employees at our principal operations (including Antamina) are as follows:
Expiry Date of Collective Agreement | ||||
Antamina
|
July 31, 2018
|
|||
Line Creek
|
May 31, 2019
|
|||
Carmen de Andacollo
|
September 30, 2019 (workers union) and December 31, 2019 (supervisors union)
|
|||
Coal Mountain
|
December 31, 2019
|
|||
Elkview
|
October 31, 2020
|
|||
Fording River
|
April 30, 2021
|
|||
Highland Valley Copper
|
September 30, 2021
|
|||
Quebrada Blanca
|
January 31, 2022 (administrative union); November 30, 2019 (Union No. 1); and March 31, 2022 (Union No. 2)
|
|||
Trail
|
May 31, 2022
|
|||
Cardinal River
|
June 30, 2022
|
We are preparing to commence bargaining on new collective agreements that expire later this year at Carmen de Andacollo, Line Creek and Quebrada Blanca. In January, unionized employees at Coal Mountain operations voted to extend the expiry date of that collective agreement to December 31, 2020.
Technology
Teck undertakes and participates in a number of research and development programs designed to improve exploration, mining and processing for new projects and operations, environmental performance in operations, and technologies to assist the sale of products, and hence enhance overall competitiveness and reduce costs.
Teck Resources Limited |
Page 81 |
2018 Annual Information Form
We have technology and research groups at our Applied Research and Technology facility located in Trail, B.C., at our CESL facility in Richmond, B.C., and at our Product Technology Centre in Mississauga, Ontario. The primary focus of these facilities is to create value through the development, testing and implementation of technologies related to our principal products. The programs are aligned with business units and are integrated with operations or other business activities. Our research and development expense for 2018 was $35 million.
Foreign Operations
The Red Dog mine located in Alaska, the Pend Oreille mine in Washington State, the Antamina mine located in Peru, and the Quebrada Blanca and Carmen de Andacollo mines located in Chile are our significant operating assets located outside of Canada. We hold a 22.5% interest in Antamina through our equity interest in CMA, the operating company for the mine. We hold a 100% interest in the Red Dog mine, subject to the royalty in favour of NANA described under the heading Description of the Business Zinc Red Dog Mine, United States (Zinc, Lead) above. We own 90% of the Chilean operating companies that own Quebrada Blanca and Carmen de Andacollo. Foreign operations accounted for approximately 28% of our 2018 consolidated revenue and represented approximately 28% of our total assets as at December 31, 2018.
We also have interests in various exploration and development projects in various foreign countries, with significant activities in Australia, Chile, Ireland, Mexico, Peru, Turkey and the United States. We currently have foreign exploration offices in all of those countries, except the United States. See Risk Factors We operate in foreign jurisdictions and face added risks and uncertainties due to different economic, cultural and political environments for further information on the risks associated with these foreign properties.
Competitive Conditions
Our business is to sell steelmaking coal, base metals, metal concentrates, specialty metals and blended bitumen at prices determined by world markets over which we have no influence or control. These markets are cyclical. Our competitive position is determined by our costs compared to those of other producers throughout the world, and by our ability to maintain our financial capacity through metal, coal and oil price cycles and currency fluctuations. Costs are governed principally by the location, grade and nature of orebodies and mineral deposits; costs of equipment, fuel, power and other inputs; costs of transport and other infrastructure; the location of our Trail metal refining facility and its cost of power; and by operating and management skill.
Over the long term, our competitive position will be determined by our ability to locate, acquire and develop economic orebodies and replace current production, as well as by our ability to hire and retain skilled employees. In this regard, we also compete with other mining companies for employees, mineral properties, joint venture agreements and the acquisition of investments in other mining companies.
Teck Resources Limited |
Page 82 |
2018 Annual Information Form
Risk Factors
You should carefully consider the risks and uncertainties described below as well as the other information contained in this Annual Information Form. These risks and uncertainties are not the only ones facing us. Additional risks and uncertainties not presently known to us or that we currently consider immaterial may also impair our business operations. If any of these events actually occur, our business, prospects, financial condition, cash flows and operating results could be materially harmed.
We face risks in the mining, metals and oil business.
The business of exploring for minerals is inherently risky. Few properties that are explored are ultimately developed into producing mines. The reasons why a mineral property may be non-productive often cannot be anticipated in advance. Even after the commencement of mining operations, those operations may be subject to risks and hazards, including environmental hazards, industrial accidents, unusual or unexpected geological formations, unanticipated metallurgical difficulties, ground control problems, seismic activity, weather events, labour-force disruptions, supply problems and delays, and flooding.
Our mining, oil and exploration operations require reliable infrastructure such as roads, rail, ports, pipelines, power sources and transmission facilities, and water supplies. Availability and cost of infrastructure affects the production and sales from operations, as well as our capital and operating costs.
The Trail metallurgical operations, our concentrate mills, our coal preparation plants, and our oil extraction and processing plants are also subject to risks and hazards, including process upsets and equipment malfunctions. Equipment and supplies may from time to time be unavailable on a timely basis.
Our operating mines and certain closed sites have large tailings dams, which could fail as a result of seismic activity or for other reasons.
The occurrence of any of the foregoing could result in damage to or destruction of mineral properties or production or logistics facilities, personal injuries or death, environmental damage, delays or interruption of production, increases in production costs, monetary losses, legal liability and/or adverse governmental action.
Fluctuations in the market price of base metals, steelmaking coal, specialty metals and blended bitumen may significantly adversely affect the results of our operations.
The results of our operations are significantly affected by the market price of base metals, steelmaking coal, blended bitumen, and speciality metals which are cyclical and subject to substantial price fluctuations. Our earnings are particularly sensitive to changes in the market price of steelmaking coal, copper, zinc and blended bitumen. Market prices can be affected by numerous factors beyond our control, including levels of supply and demand for a broad range of industrial products, substitution of new or different products in critical applications for our existing products, expectations with respect to the rate of inflation, the relative strength of the Canadian dollar and of certain other currencies, interest rates, speculative activities, transportation and pipeline capacity, global or regional political or economic crises, government policy changes,
Teck Resources Limited |
Page 83 |
2018 Annual Information Form
including tariffs and the potential for trade disputes and sales of base metals by holders in response to such factors.
The Chinese market is a significant source of global demand for commodities, including steelmaking coal, zinc and copper. A sustained slowdown in Chinas growth or demand, or a significant slowdown in other markets, in either case, that is not offset by reduced supply or increased demand from other regions could have an adverse effect on the price and/or demand for our products.
If prices should decline below our cash costs of production and remain at such levels for any sustained period, we could determine that it is not economically feasible to continue commercial production at any or all of our operations. We may also curtail or suspend some or all of our exploration activities, with the result that our depleted reserves are not replaced. A substantial reduction in hard coking coal price premiums would have a material adverse effect on our business.
Prices for our blended bitumen can be influenced by global and regional factors that are beyond our control and can result in a high degree of volatility. Prices are also affected by, among other things, constraints on rail and pipeline capacity, regional supply and demand imbalances, political developments, decisions by the Organization of the Petroleum Exporting Countries (OPEC) or other governments to impose or not impose quotas, compliance or non- compliance with agreed quotas by OPEC members, and weather.
A prolonged period of low and/or volatile commodity prices, particularly of one or more of our principal products, could have a significant adverse affect on our operations, business and financial condition.
Our general policy has been not to hedge changes in prices of our mineral or energy products. From time to time, however, we have in the past and may in the future undertake hedging programs in specific circumstances, with an intention to reduce the risk of declines in a commoditys market price while optimizing upside participation, to maintain adequate cash flows and profitability to contribute to the long-term viability of our business. There are, however, risks associated with hedging programs including, among other things, the risk of opportunity losses in the event of an increase in the world price of the commodity, an increase in interest rates, the possibility that rising operating costs will make delivery into hedged positions uneconomic, counterparty risks and the impact of production interruption events.
Product alternatives may reduce demand for our products.
Most of our products are primarily used in specific applications, such as the use of copper in electrical wiring and electronic applications, the use of refined zinc to galvanize steel, the use of steelmaking coal in steel production and the use of heavy crude oils, such as our blended bitumen, to make refined petroleum products. Alternative technologies are continually being investigated and developed with a view to reducing production costs or for other reasons, such as minimizing environmental or social impact. If competitive technologies emerge that use other materials in place of our products, demand and price for our commodities might fall.
For example, substantially all of our coal production is high-quality hard coking coal, which commands a significant price premium over other forms of coal because of its value in use in
Teck Resources Limited |
Page 84 |
2018 Annual Information Form
blast furnaces for steel production. High-quality hard coking coal is globally scarce, and has specific physical and chemical properties that are necessary for efficient blast furnace operation. Steel producers are continually investigating alternative steel production technologies with a view to reducing production costs. Many of those alternative technologies are designed to use lower quality coals or other sources of carbon instead of higher cost high-quality hard coking coal. While conventional blast furnace technology has been the most economic large-scale steel production technology for decades, and while emergent technologies typically take many years to commercialize, there can be no assurance that over the longer term competitive technologies not reliant on hard coking coal could emerge, which could reduce demand and price premiums for hard coking coal.
As the world transitions to a lower-carbon economy, there is increasing focus on low-carbon technologies to replace carbon-intensive ones. Changes in carbon regulation or taxation may decrease demand for our blended bitumen product.
Volatility in commodity markets and financial markets may adversely affect our ability to operate and our financial condition.
Recent global financial conditions and commodity markets have been volatile. From time to time, access to financing has been negatively affected by many factors, including the financial distress of banks and other credit market participants. This volatility has from time to time affected and may in the future affect our ability to obtain equity or debt financing on acceptable terms, and may make it more difficult to plan our operations and to operate effectively. If volatility or market disruption affects our access to financing on reasonable terms, our operations and financial condition could be adversely affected.
Failure to secure water rights could have negative effects on our operations and financial condition.
Water rights are an area of significant and increasing focus for our foreign operations, and community relations are significantly impacted by access and sourcing of water. If water supplies become scarce or are negatively affected by environmental events or factors such as drought, water supplies to our operations might be reduced in order to maintain supply to the local communities in which we operate or for ecological purposes. Any reduction in the availability of water, or other necessary infrastructure supplies, may preclude development of otherwise potentially economic mineral deposits or may negatively affect costs, production and/or sales from our affected operations.
Our arrangements relating to our relationship with BC Hydro regarding the Waneta hydroelectric plant may require us to incur substantial costs.
In connection with the sale of our interest in the Waneta hydroelectric plant in 2018, we entered into a 20-year arrangement with BC Hydro, with the ability to renew for an additional 10 years, to use a portion of the energy derived from the Waneta hydroelectric plant for our Trail Operations. Under our arrangement with BC Hydro, Teck Metals is required to provide firm delivery of a portion of the energy from the Waneta hydroelectric plant to BC Hydro until 2036. If Teck Metals does not deliver power as required, it could be required to purchase replacement power in the open market or to pay liquidated damages to BC Hydro based on the market rate for power at the
Teck Resources Limited |
Page 85 |
2018 Annual Information Form
time of the shortfall. These costs are generally not covered by our insurance policies and we could incur substantial costs, especially if the shortfall is protracted.
In addition, the portion of power that Teck Metals is required to make available to BC Hydro is estimated to be surplus to the current and anticipated future requirements of our Trail Operations. If our entitlement to power from the Waneta hydroelectric plant (taking into account our arrangements with BC Hydro) is not sufficient to supply the requirements of our Trail Operations, we may be required to reduce production at our Trail Operations, or purchase power in the open market, in order to address any shortfall. Following expiry of this lease we may be required to purchase power in the open market to power our Trail Operations, which may require us to incur substantial additional costs to operate our Trail Operations.
We face risks in connection with our committed downstream arrangements in connection with Fort Hills.
Under the arrangements governing Fort Hills, we are obliged to lift our pro rata share of project production, and to supply the diluent required in order to create a bitumen blend that meets pipeline specifications. In order to meet our lifting obligations and to ensure that our share of project production reaches a market, we are required to enter into commitments to secure tankage and transportation (pipeline, rail) capacity. These commitments involve long-term take-or-pay obligations. There is a risk that there may be delays or interruptions in the availability of appropriate pipeline or rail capacity, that we may be unable to provide the required diluent despite our efforts to secure diluent supply, or that unanticipated events may otherwise interfere with our ability to lift and dispose of our share of Fort Hills production. In any of these events, we may face additional costs or penalties under the Fort Hills arrangements. In addition, interruptions in production at Fort Hills may not relieve us of take-or-pay obligations incurred in connection with our downstream arrangements, causing us to incur significant costs. We may face material losses in any of these situations, which may not be covered by insurance.
We have indebtedness to service and repay.
As of December 31, 2018, we and our consolidated subsidiaries had total indebtedness of $5.5 billion. We must generate sufficient amounts of cash to service and repay our debt, and our ability to generate cash will be affected by general economic, financial, competitive, legislative, regulatory and other factors that are beyond our control.
Our material financing agreements contain financial and other covenants that may impose restrictions on our business and, if breached by us, may require us to redeem, repay, repurchase or refinance our existing debt obligations prior to their scheduled maturity.
We are party to a number of financing agreements, including our credit facilities and the indentures governing our various public indebtedness, which contain financial and other covenants, including restrictive covenants. If we breach covenants contained in our financing agreements, we may be required to redeem, repay, repurchase or refinance our existing debt obligations prior to their scheduled maturity, and our ability to do so may be restricted or limited by the prevailing conditions in the capital markets, available liquidity and other factors. If we are unable to refinance any of our debt obligations in such circumstances, our ability to make capital expenditures and our financial condition and cash flows could be adversely impacted. In addition,
Teck Resources Limited |
Page 86 |
2018 Annual Information Form
our ability to borrow under our credit facilities is subject to our compliance with certain covenants, and the making of certain representations and warranties at the time of a borrowing request. See Credit Facilities and Debt Securities for further information regarding, and a further discussion of the covenants in, our financing arrangements.
In addition, from time to time, new accounting rules, pronouncements and interpretations are enacted or promulgated that may require us, depending on the nature of those new accounting rules, pronouncements and interpretations, to reclassify or restate certain elements of our financing agreements and other debt instruments, which may in turn cause us to be in breach of the financial or other covenants contained in our financing agreements and other debt instruments.
We may not have access to credit in the future, and access to letters of credit may require the deposit of cash collateral.
If future debt financing is not available to us when required or is not available on acceptable terms, we may be unable to grow our business, finance our projects, take advantage of business opportunities, respond to competitive pressure or refinance maturing debt, any of which could have a material adverse effect on our operating results and financial condition.
We have significant financial support in the form of outstanding letters of credit issued by banks, which reduces the amount of other credit, including loans, that issuing banks may be willing to extend to us by way of debt financing. We also have a significant amount of surety bonds issued by insurance companies. These letters of credit and surety bonds are required for a number of purposes, mainly as security for reclamation obligations and security for our take-or-pay commitments in respect of our Fort Hills downstream arrangements and Quebrada Blanca Phase 2 power arrangements. The surety bonds and credit facilities that support our letters of credit do not currently require us to deliver cash collateral or other security, although we may elect to do so from time to time to reduce borrowing costs. If letters of credit, surety bonds or other acceptable financial assurance are not available to us on an unsecured basis, we may be required to deliver cash collateral to a financial institution that will issue the financial assurance, which would reduce our cash available for use in our business.
In addition, certain of our letters of credit are issued under uncommitted standby facilities. Our standby letter of credit facilities may be terminated at the election of the bank counterparty upon at least 90 days notice. In the event that a standby letter of credit facility is terminated, we would be required to deliver cash collateral to the bank counterparty if we were unable to terminate the letter of credit issued by the bank. Providers of our surety bonds also have the right to require the delivery of cash collateral upon 60 days notice.
Investor or general societal pressures may limit the appetite of certain institutions to lend to, or hold debt securities of, issuers, such as Teck, in carbon-intensive industries or industries with a track record of social and environmental controversy, despite our efforts to adhere to the best industry practices regarding social and environmental matters.
Teck Resources Limited |
Page 87 |
2018 Annual Information Form
We may be adversely affected by interest rate changes.
Our exposure to changes in interest rates results from investing and borrowing activities undertaken to manage our liquidity and capital requirements. We have incurred indebtedness that bears interest at fixed and floating rates, and we may from time to time enter into interest rate swap agreements to effectively convert some fixed rate exposure to floating rate exposure. There can be no assurance that we will not be materially adversely affected by interest rate changes in the future. In addition, our use of interest rate swaps exposes us to the risk of default by the counterparties to those arrangements. Any default by a counterparty could have a material adverse effect on our business.
Our business is subject to the Canadian Corruption of Foreign Public Officials Act, the U.S. Foreign Corrupt Practices Act and similar worldwide anti-bribery laws, a breach or violation of which could lead to civil and criminal fines and penalties, loss of licences or permits and reputational harm.
We operate in certain jurisdictions that have experienced governmental and private sector corruption to some degree, and, in certain circumstances, strict compliance with anti-bribery laws may conflict with certain local customs and practices. For example, the Canadian Corruption of Foreign Public Officials Act, the U.S. Foreign Corrupt Practices Act, and anti-corruption and anti-bribery laws in other jurisdictions generally prohibit companies and their intermediaries from making improper payments for the purpose of obtaining or retaining business or other commercial advantage. In recent years, there has been a general increase in both the frequency of enforcement and the severity of penalties under such laws, resulting in greater scrutiny of and punishment to companies convicted of violating anti-corruption and anti-bribery laws. Furthermore, a company may be found liable for violations by not only its employees, but also by its contractors and third-party agents.
Our Code of Ethics, our Anti-Corruption Policy and other corporate policies mandate compliance with these anti-corruption and anti-bribery laws, and we have implemented training programs, internal monitoring and controls, and reviews and audits to ensure compliance with such laws. However, there can be no assurance that our internal control policies and procedures will always protect us from recklessness, fraudulent behaviour, dishonesty or other inappropriate acts committed by our affiliates, employees, contractors or agents. Violations of these laws, or allegations of such violations, could lead to civil and criminal fines and penalties, litigation, loss of operating licences or permits, or withdrawal of mining tenements, and may damage our reputation, which could have a material adverse effect on our business, financial position and results of operations, or cause the market value of our shares to decline. We may face disruption in our permitting, exploration or other activities resulting from our refusal to make facilitation payments in certain jurisdictions where such payments are otherwise prevalent.
Our insurance may not provide adequate coverage.
We maintain large self-insured retentions and insure against most risks up to reasonably high limits through capture insurance companies. Our property, business interruption and liability insurance may not provide sufficient coverage for losses related to certain hazards, and large losses within our captive insurers could have an effect on our consolidated financial position. Insurance against certain risks, including certain liabilities for environmental pollution, may not be
Teck Resources Limited |
Page 88 |
2018 Annual Information Form
available to us or to other companies within the industry. In addition, our insurance coverage may not continue to be available at economically feasible premiums, or at all. Any such event could have a material adverse effect on our business.
We could be subject to potential labour unrest or other labour disturbances as a result of the failure of negotiations in respect of our collective agreements.
Approximately 5,800 of our approximately 10,000 regular employees (as of December 31, 2018) are employed under collective bargaining agreements. We could be subject to labour unrest or other labour disturbances as a result of delays in or the failure of negotiations in respect of our collective agreements, which could, while ongoing, have a material adverse effect on our business. See Description of the Business Human Resources for a description of our regular employee category and the expiry dates of the collective bargaining agreements covering unionized employees at our material projects.
We may not be able to hire enough skilled employees to support our operations.
We compete with other mining companies to attract and retain key executives and skilled and experienced employees. The mining industry is labour intensive and our success depends to a significant extent on our ability to attract, hire, train and retain qualified employees, including our ability to attract employees with needed skills in the geographic areas in which we operate. We face competition for limited candidates in many trades and professions, and may see current employees leave to pursue other opportunities. We could experience increases in our recruiting and training costs, and decreases in our operating efficiency, productivity and profit margins if we are not able to attract, hire and retain a sufficient number of skilled employees to support our operations.
Our pension and other post-retirement liabilities and the assets available to fund them could change materially.
We have substantial assets in defined benefit pension plans which arise through employer contributions and returns on investments made by the plans. The returns on investments are subject to fluctuations depending upon market conditions and we are responsible for funding any shortfall of pension assets compared to our pension obligations under these plans.
We also have certain obligations to current and former employees with respect to post-retirement benefits. The cost of providing these benefits can fluctuate and the fluctuations can be material.
Our liabilities under defined benefit pension plans and in respect of other post-retirement benefits are estimated based on actuarial and other assumptions. These assumptions may prove to be incorrect and may change over time, and the effect of these changes can be material.
Teck Resources Limited |
Page 89 |
2018 Annual Information Form
A number of our concentrate products include varying amounts of minor elements that are subject to increasing environment regulation, which may expose us to higher smelter treatment charges, penalties or limit our ability to sell certain products.
Our customer smelters are subject to increasingly stringent environmental regulation, in particular with respect to minor elements such as mercury, cadmium and thallium, which could adversely affect their ability to treat copper, zinc and lead concentrates from certain of our operations. We rely on customer smelters to process our concentrates into metals for sale. We may be required to pay higher smelter treatment charges or specific penalties relating to minor elements present in our concentrates, we may incur additional costs to blend certain products, or we may not be able to sell certain products at all in certain jurisdictions, depending on the regulatory environment.
The profitability of our Trail Operations depends in part on our ability to sell various products that may face more stringent environmental regulation.
In addition to zinc and lead, Trail Operations produces various minor metals and other compounds, which are sold into specialized markets. Changes in market demand for these products, or changes in export regulations or other regulatory restrictions, may limit our ability to sell these products. If we are unable to sell certain products at a profit, we may incur significant storage and disposal costs, or costs to change our production facilities or processes.
Fluctuations in the price and availability of consumed commodities affect our costs of production.
Prices and availability of commodities consumed or used in connection with exploration, development, mining, smelting, refining and blending, such as natural gas, diesel, oil, diluent and electricity, as well as reagents such as copper sulphate, fluctuate and these fluctuations affect the costs of production at our various operations. Our smelting and refining operations at Trail require concentrates, some of which are produced at our Red Dog and Pend Oreille mines and some of which we purchase from third parties. The availability of those concentrates and the treatment charges we can negotiate fluctuate depending on market conditions. These fluctuations can be unpredictable, can occur over short periods, and may have a material adverse impact on our operating costs or on the timing and costs of various projects. Our general policy is not to hedge our exposure to changes in prices of the commodities we use in our business.
We face competition in product markets.
The mining industry in general is intensely competitive and even if commercial quantities of mineral resources are developed, a profitable market may not exist for the sale of the minerals. We must sell base metals, metal concentrates, by-product metals and concentrate, blended bitumen and steelmaking coal at prices determined by world markets over which we have no influence or control. Our competitive position is determined by our costs in comparison to those of other producers in the world. If our costs increase due to our locations, grade and nature of orebodies, foreign exchange rates, government policy changes or our operating and management skills, our profitability may be affected. We have to compete with larger companies that have greater assets and financial and human resources than us and which may be able to sustain larger losses than us.
Teck Resources Limited |
Page 90 |
2018 Annual Information Form
We may face market access restrictions or tariffs.
Access to our markets may be subject to ongoing interruptions or trade barriers due to policies and tariffs of individual countries, and the actions of certain interest groups to restrict the import of certain commodities. Our products may also be subject to tariffs that do not apply to producers based in other countries. In 2018, the Chinese government imposed tariffs on our zinc and lead concentrates produced in the U.S. While these tariffs did not materially affect our business or our access to Chinese markets in 2018, there is no assurance that they will not do so in the future or that those tariffs will not increase in the future. Other than the foregoing, there are currently no significant trade barriers existing or impending of which we are aware that do, or could, materially affect our access to certain markets; however, there can be no assurance that our access to these markets will not be restricted in the future, or that tariffs or similar measures will not impair the competitiveness of our products.
Our reserve and resource estimates may prove to be incorrect.
Disclosed reserve and mine life estimates should not be interpreted as assurances of mine life or of the profitability of current or future operations. We estimate and report our mineral and oil and gas reserves and resources in accordance with the requirements of the applicable Canadian securities regulatory authorities and industry practice.
We disclose both mineral reserves and mineral resources. Mineral resources are concentrations or occurrences of minerals that are judged to have reasonable prospects for economic extraction, but for which the economics of extraction cannot be assessed, whether because of insufficiency of geological information or lack of feasibility analysis, or for which economic extraction cannot be justified at the time of reporting. Consequently, mineral resources are of a higher risk and are less likely to be accurately estimated or recovered than mineral reserves.
In general, our mineral reserves and resources are estimated by persons who are, or were at the time of their report, employees of the respective operating company for each of our operations under the supervision of our employees. These individuals are not independent for purposes of applicable securities legislation. Generally, we do not use outside sources to verify mineral reserves or resources, except at the initial feasibility stage.
The mineral and oil and gas reserve and resource figures included or incorporated in this disclosure document by reference are estimates based on the interpretation of limited sampling and subjective judgments regarding the grade, continuity and existence of mineralization, as well as the application of economic assumptions, including assumptions as to operating costs, production costs, mining and processing recoveries, cut-off grades, long-term commodity prices and, in some cases, exchange rates, inflation rates and capital costs. As a result, changes in estimates or inaccuracy of estimates may affect our reserves and resources. The sampling, interpretations or assumptions underlying any reserve or resource estimate may be incorrect, and the impact on reserves or resources may be material.
Should the mineralization and/or configuration of a deposit ultimately turn out to be significantly different from that currently envisaged, or should regulatory standards or enforcement change, then the proposed mining plan may have to be altered in a way that could affect the tonnage and grade of the reserves mined and rates of production and, consequently, could adversely affect
Teck Resources Limited |
Page 91 |
2018 Annual Information Form
the profitability of the mining operations. In addition, short-term operating factors relating to the reserves, such as the need for orderly development of orebodies or the processing of new or different ores, may cause reserve and resource estimates to be modified or operations to be unprofitable in any particular fiscal period.
There can be no assurance that our projects or operations will be, or will continue to be, economically viable, that the indicated amount of minerals or hydrocarbons will be recovered, or that they will be recovered at the prices assumed for purposes of estimating reserves.
We face risks associated with the issuance and renewal of environmental permits.
Numerous governmental permits or approvals are required for mining operations. We have significant permitting activities currently underway for new projects and for the extension or expansion of existing operations. In addition, many existing permits require periodic renewals. Examples of current significant permitting efforts include the Quebrada Blanca Phase 2 project, the Frontier oil sands project and steelmaking coal mine operations in the Elk Valley. When we apply for these permits and approvals, we are often required to prepare and present data to various government authorities pertaining to the potential effects or impacts that any proposed project may have on the environment and on communities. The authorization, permitting and implementation requirements imposed by any of these authorities may be costly and time-consuming, and may delay commencement or continuation of mining operations. Regulations also provide that a mining permit or modification can be delayed, refused or revoked. In certain jurisdictions, some parties have extensive rights to appeal the issuance of permits or to otherwise intervene in the regulatory process. Permits may be stayed or withdrawn during the pendency of appeals. Delays associated with permitting may cause us to incur material additional costs in connection with the development of new projects, including penalties or other costs in relation to long-lead equipment orders and other commitments associated with projects. If we are unable to secure permits, we may be unable to extend, expand or continue with existing operations or construct new projects.
Past or ongoing violations of mining or environmental laws could provide a basis to revoke existing permits or to deny the issuance of additional permits. In addition, evolving reclamation or environmental concerns may threaten our ability to renew existing permits or obtain new permits in connection with future development, expansions and operations. Ongoing operation of our steelmaking coal mines in the Elk Valley, British Columbia, continually requires new permits or amendments to existing permits from applicable government agencies. We received approval in 2014 of a plan to manage water quality for the Elk Valley watershed as a whole. The Elk Valley Water Quality Plan is intended to provide a regulatory framework for permitting current and future projects and for managing the cumulative effects of new projects. The plan contemplates ongoing monitoring of the receiving environment, and adjustment of water quality targets if unacceptable environmental impacts are identified. There can be no assurance that the water quality targets set out in our valley-wide water quality management plan will prove to be suitably protective of the environment, that our planned mitigation efforts will be sufficient to meet those targets, or that ongoing monitoring will not disclose unanticipated environmental effects of our operations that will require additional mitigation. For example, we previously announced that we were working to address an issue regarding selenium compounds in effluent from the West Line Creek active water treatment facility, which was constructed as part of our Elk Valley Water Quality Plan, and
Teck Resources Limited |
Page 92 |
2018 Annual Information Form
we delayed commencement of construction of our next water treatment facility, at the Fording River operation, to incorporate certain related design changes. Notwithstanding the approval of the plan in 2014, during the third quarter of 2018, we received notice from Canadian federal prosecutors of potential charges under the Fisheries Act in connection with discharges of selenium and calcite from coal mines in the Elk Valley. See Legal Proceedings and Regulatory Actions Fisheries Act for more details. We cannot operate our Elk Valley coal mines in compliance with the Fisheries Act and its current associated regulations. Federal regulatory issues may create additional difficulties in obtaining permits for our Elk Valley operations, whether or not charges are eventually laid or we are successful in defending any charges.
Any negative developments referred to above may result in consequential delays in permitting new mining areas, which would limit our ability to maintain or increase steelmaking coal production in accordance with our long-term plans or to realize the projected mine life of our operations. The potential shortfall in production may be material.
We face risks associated with our reclamation obligations.
We are required to reclaim properties as mining progresses and after mining is completed and specific requirements vary among jurisdictions. We are required by various governments in the jurisdictions in which we operate to provide financial assurances to cover any reclamation obligations we may have at our mine sites. The amount of these financial assurances is significant and is subject to change from time to time by the governments in the jurisdictions in which we operate, and may exceed our estimates for such costs. The amount and nature of our financial assurance obligations depend on a number of factors, including our financial condition and reclamation cost estimates. Reclamation cost estimates can escalate because of new regulatory requirements, changes in site conditions or conditions in the receiving environment, or changes in analytical methods or scientific understanding of the impacts of various constituents in the environment. Since 2016, the B.C. government has been carrying out a review of its financial assurance requirements for reclamation obligations. While it is not clear what the new requirements will be, we expect they will result in a substantial increase to our financial assurance requirements, for both our ongoing operations and our projects in B.C.
Changes to the form or amount of our financial assurance obligations in respect of reclamation obligations could significantly increase our costs, making the maintenance and development of existing or new mines less economically feasible. Increases in financial assurance requirements could severely impact our credit capacity and our ability to raise capital for other projects or acquisitions. We may be unable to obtain letters of credit or surety bonds to satisfy these requirements, in which case we may be required to deposit cash as financial assurance. If we are unable to satisfy these requirements, we may face loss of permits, fines and other material and negative consequences.
Although we currently make provisions for our reclamation obligations, there can be no assurance that these provisions will be accurate in the future. Failure to provide regulatory authorities with the required financial assurances could potentially result in the closure of one or more of our operations, which could result in a material adverse effect on our operations and therefore our profitability.
Teck Resources Limited |
Page 93 |
2018 Annual Information Form
Climate change may have an adverse effect on our operations or on demand for our products.
Climate change may have an adverse effect on our operations or on demand for our products. Climate change may, among other things, cause or result in sea level increases, changes in precipitation, changes in fresh water levels, increases in extreme weather events, melting permafrost in the Arctic and resource shortages. While our operations are located well above sea level, an increase in sea level could affect our ocean transportation and shipping facilities. Extreme weather events have the potential to disrupt operations at our mines and to impact our transportation infrastructure, including by affecting the length of our shipping season at our Red Dog mine. Climate change may also result in shortages in certain consumables and other products required to sustain our operations, and any such shortage could impact our production capacity. Our Red Dog mine is located in the Arctic and could be materially impacted by melting permafrost.
Climate change may have similar impacts on our customers, reducing demand for our products. In addition, government action to address climate change and societal pressures towards a lower-carbon economy may reduce the demand for our products. Climate change may result in increased regulations for our operations or those of our customers and/or restrict the development of our projects, which may increase costs and/or limit production.
Concerns regarding climate change may lead to further changes in legal and regulatory regimes, and technological development of alternatives to certain of our products, such as steelmaking coal and oil.
Although we make efforts to anticipate potential costs associated with climate change to mitigate the physical risks of climate change, and work with governments to influence regulatory requirements regarding climate change, there can be no assurances that these efforts will be effective or that climate change or associated governmental action will not have an adverse impact on our operations and therefore our profitability.
Regulatory efforts to control or reduce greenhouse gas emissions or societal pressures in relation to climate change could materially negatively affect our business.
Our businesses include several operations that emit large quantities of carbon dioxide, or that produce or may produce products that emit large quantities of carbon dioxide when consumed by end users. This is particularly the case with our steelmaking coal operations and our oil sands operation and projects. Carbon dioxide and other greenhouse gases are the subject of increasing public concern and regulatory scrutiny. See Health and Safety and Environmental Protection Climate Change and Carbon Pricing.
The primary source of greenhouse gas emissions in Canada is the use of hydrocarbon energy. Our operations depend significantly on hydrocarbon energy sources to conduct daily operations, and there are typically no economic substitutes for these forms of energy. While carbon tax legislation has been adopted in several jurisdictions where we operate, it is not yet possible to reasonably estimate the nature, extent, timing and cost of any additional taxes or other programs that may be enacted.
Teck Resources Limited |
Page 94 |
2018 Annual Information Form
Most of our steelmaking coal products are sold outside of Canada, and sales are not expected to be significantly affected by the greenhouse gas emissions targets Canada committed to under the Paris Agreement or the resulting provincial and federal carbon tax legislation. However, the broad adoption of emission limitations or other regulatory efforts to control or reduce greenhouse gas emissions by other countries could materially negatively affect the demand for steelmaking coal and oil, as well as restrict development of new steelmaking coal or oil sands projects and increase production and transportation costs.
Investor concerns regarding environmental matters may adversely affect our ability to access capital markets, and similar concerns may reduce the appetite of lenders and insurers to lend to us or to provide insurance for our assets and operations.
We may be adversely affected by currency fluctuations.
Our operating results and cash flow are affected by changes in the Canadian dollar exchange rate relative to the currencies of other countries. Exchange rate movements can have a significant impact on results, as a significant portion of our operating costs are incurred in Canadian and other currencies, most revenues are earned in U.S. dollars, and a significant portion of the capital costs for our QB2 project will be incurred in Chilean pesos. To reduce the exposure to currency fluctuations, we enter into foreign exchange contracts from time to time, but these hedges do not eliminate the potential that those fluctuations may have an adverse effect on us. In addition, foreign exchange contracts expose us to the risk of default by the counterparties to those contracts, which could have a material adverse effect on our business. In addition, our operating costs are influenced by the strength of the currencies of those countries where our operations are located, such as Chile, Peru and the United States.
The depletion of our mineral reserves may not be offset by future discoveries or acquisitions of mineral reserves.
We must continually replace mineral reserves depleted by production to maintain production levels over the long term. This is done by expanding known mineral reserves or by locating or acquiring new mineral deposits.
There is, however, a risk that depletion of reserves will not be offset by future discoveries of mineral reserves. Exploration for minerals and oil and gas is highly speculative and the projects involve many risks. Many projects are unsuccessful and there are no assurances that current or future exploration programs will be successful. Further, significant costs are incurred to establish mineral or oil and gas reserves and to construct mining and processing facilities. Development projects have no operating history upon which to base estimates of future cash flow and are subject to the successful completion of feasibility studies, obtaining necessary government permits, obtaining title or other land rights, and availability of financing. In addition, assuming discovery of an economic orebody, depending on the type of mining operation involved many years may elapse from the initial phases of drilling until commercial operations are commenced. Accordingly, there can be no assurances that our current work programs will result in any new commercial mining operations or yield new reserves to replace and/or expand current reserves in a timely manner.
Teck Resources Limited |
Page 95 |
2018 Annual Information Form
Failure to comply with environmental, health and safety laws may have a material adverse effect on our operations and projects.
Environmental, health and safety legislation affects nearly all aspects of our operations, including mine development, worker health and safety, waste disposal, emissions controls, and protection of endangered and protected species. Compliance with environmental, health and safety legislation can require significant expenditures and can restrict the manner in which mining operations can be conducted.
In addition, failure to comply with environmental, health or safety legislation may result in the imposition of significant fines and/or penalties, the temporary or permanent suspension of operations or other regulatory sanctions including cleanup costs arising out of contaminated properties, damages, the loss of important permits, or civil suits or criminal charges. Exposure to these liabilities arises not only from our existing operations, but also from operations that have been closed or sold to third parties. Some of our historical operations have generated significant environmental contamination and other issues in the context of current regulation. We could also be held liable for worker exposure to hazardous substances. There can be no assurance that we will at all times be in compliance with all environmental, health and safety regulations or that steps to achieve compliance would not materially adversely affect our business.
Changes in environmental, health and safety laws may have a material adverse effect on our operations and projects.
In February 2018, the Government of Canada proposed new regulations under the Fisheries Act relating to coal mining effluent. While these regulations are still in development, they could impose significant costs and operating limitations on our steelmaking coal operations. In the absence of these new regulations, our coal mining activities cannot be conducted in compliance with the Fisheries Act and we may face significant liability as a result. There can be no assurance that the new regulations will completely remedy this situation. Also in 2018, the Government of Canada proposed sweeping changes to the federal governments current environmental assessment and regulatory processes for resource development projects. While this legislation is still in development and has not been approved, any new legislation may affect our ability to obtain or renew permits for our Canadian operations and projects in an efficient and cost-effective manner or at all. In addition, on November 2018, the British Columbia government introduced a bill to reform British Columbias environmental assessment process for resource projects which, if passed may affect our ability to obtain or renew necessary permits for our operations and projects in British Columbia in an efficient and cost-effective manner or at all.
Environmental, health and safety laws and regulations are evolving in all jurisdictions where we have activities. We are not able to determine the specific impact that future changes in environmental laws and regulations may have on our operations and activities, and our resulting financial position; however, we anticipate that capital expenditures and operating expenses will increase in the future as a result of the implementation of new and increasingly stringent environmental, health and safety regulations. For example, emissions standards for carbon dioxide and sulphur dioxide are becoming increasingly stringent, as are laws relating to the use and production of regulated chemical substances. Further changes in environmental, health and safety laws, new information on existing environmental, health and safety conditions or other events, including legal proceedings based upon such conditions, or an inability to obtain
Teck Resources Limited |
Page 96 |
2018 Annual Information Form
necessary permits, could require increased financial reserves or compliance expenditures, or otherwise have a material adverse effect on us. Changes in environmental, health and safety legislation could also have a material adverse effect on product demand, product quality and methods of production and distribution. In the event that any of our products were demonstrated to have negative health effects, we could be exposed to workers compensation and product liability claims, which could have a material adverse effect on our business.
Our operations depend on information technology systems, which may be disrupted.
We rely on information technology systems and networks in our operations. We could be materially and adversely affected in the event that our information technology systems or networks are compromised. This information technology infrastructure may be subject to security breaches or other cybersecurity incidents, or may be compromised by natural disasters or defects in software or hardware systems. Potential consequences of our information technology systems being compromised include material and adverse impacts on our financial condition, operations, production, sales, and reputation, including environmental and physical damage to our operations or surrounding areas.
We are highly dependent on third parties for the provision of transportation services.
Due to the geographical location of many of our mining properties and operations, we are highly dependent on third parties for the provision of transportation services, including rail, pipeline and port services. We negotiate prices for the provision of these services in circumstances where we may not have viable alternatives to using specific providers, or have access to regulated rate setting mechanisms. Contractual disputes, demurrage charges, rail, pipeline and port capacity issues, availability of vessels and railcars, weather problems or other factors can have a material adverse effect on our ability to transport materials according to schedules and contractual commitments, and result in lower than anticipated sales volumes and revenue. Recently we have experienced a loss of revenue and an increase in cost of coal product due, in part, to logistics issues with our transportation service providers. In 2018, we experienced significant challenges with pipeline capacity for our energy products resulting in low realized prices for our blended bitumen. In December 2018, the Government of Alberta announced temporary curtailment measures that affect our production at Fort Hills. There can be no assurances that pipeline capacity challenges or production curtailment will not continue or increase in the future, each of which may materially affect our energy operations and revenue.
Our Red Dog operation is subject to a limited annual shipping window, which increases the consequences of restrictions on our ability to ship concentrate from the operation.
Like our other mines, our Red Dog mine operates year-round on a 24-hour-per-day basis. Due to sea ice and weather conditions, the annual production of the mine must be stored at the port site and shipped within an approximate 100-day window when sea ice and weather conditions permit. Two purpose-designed shallow draft barges transport the concentrates to deep-water moorings. The barges cannot operate in severe swell conditions.
Unusual ice or weather conditions, or damage to the barges or ship loading equipment could restrict our ability to ship all of the stored concentrate. Failure to ship the concentrate during the
Teck Resources Limited |
Page 97 |
2018 Annual Information Form
shipping season could have a material adverse effect on our sales, as well as on our Trail Operations, and could materially restrict mine production subsequent to the shipping season.
Indigenous Peoples title claims and rights to consultation and accommodation may affect our existing operations worldwide as well as development projects and future acquisitions.
Governments in many jurisdictions must consult with Indigenous Peoples with respect to grants of mineral rights and the issuance or amendment of project authorizations. Consultation and other rights of Indigenous Peoples may require accommodations, including undertakings regarding financial compensation, employment, and other matters in impact and benefit agreements. This may affect our ability to acquire within a reasonable time frame effective mineral titles or environmental permits in these jurisdictions, including in some parts of Canada in which Aboriginal title is claimed, and may affect the timetable and costs of development of mineral properties in these jurisdictions. The risk of unforeseen Aboriginal title claims or grievances also could affect existing operations as well as development projects and future acquisitions. These legal requirements and the risk of Aboriginal opposition may increase our operating costs and affect our ability to expand or transfer existing operations or to develop new projects.
We are subject to changes in law or policy in relation to taxes, fees and royalties
We are subject to taxes (including income taxes and mineral taxes), various fees and royalties imposed by various levels of government across the jurisdictions in which we operate. The laws imposing these taxes, fees and royalties and the manner in which they are administered may in the future be changed or interpreted in a manner that materially and adversely affects our business, financial position and results of operations.
We operate in foreign jurisdictions and face added risks and uncertainties due to different economic, cultural and political environments.
Our business operates in a number of foreign countries where there are added risks and uncertainties due to the different economic, cultural and political environments. Some of these risks include nationalization and expropriation, social unrest and political instability, uncertainties in perfecting mineral titles, trade barriers and exchange controls and material changes in taxation. Further, developing country status or an unfavourable political climate may make it difficult for us to obtain financing for projects in some countries.
We face risks associated with our development projects.
We are involved in a number of development projects. Our major projects include our Quebrada Blanca Phase 2, Frontier, NuevaUnión, San Nicolás, Mesaba, Zafranal and Galore Creek projects. We also have a number of other projects in our development portfolio.
Development and exploitation of the hypogene resource at Quebrada Blanca Phase 2 will require considerable capital expenditures and various environmental and other permits and governmental authorizations. NuevaUnión, San Nicolás, Zafranal and our Frontier project are all in early stages of development.
Teck Resources Limited |
Page 98 |
2018 Annual Information Form
Construction and development of these projects are subject to numerous risks, including, without limitation:
∎ | risks resulting from the fact that the projects are at various early stages of development and therefore are subject to development and construction risks, including the risk of significant cost overruns and delays in construction, and technical and other problems; |
∎ | risks associated with delays in obtaining, or conditions imposed by, regulatory approvals; |
∎ | risks associated with obtaining amendments to existing regulatory approvals or permits, and additional regulatory approvals or permits that will be required; |
∎ | risks of other adverse regulatory developments, including the imposition of new regulations; |
∎ | risks of significant fluctuation in prevailing prices for copper and other metals, oil, other petroleum products and natural gas, which may affect the profitability of the projects; |
∎ | risks associated with the fact that our company and Goldcorp Inc. are 50% partners in NuevaUnión and major project decisions require the agreement of both parties; |
∎ | risks associated with the fact that our company and Newmont Mining Corporation are 50% partners in the Galore Creek project and major project decisions require the agreement of both parties; |
∎ | risks associated with the closing of the acquisition of a 30% interest in QBSA by Sumitomo Metal Mining Co. Ltd. and Sumitomo Corporation; |
∎ | risks associated with fact that our company and Sumitomo Metal Mining Co. Ltd. Sumitomo Corporation and the Chilean government entity, ENAMI are or will be partners in the Quebrada Blanca 2 project and certain decisions will require the agreement of one or more of our partners; |
∎ | risks associated with litigation; |
∎ | risks resulting from dependence on third parties for services and utilities; |
∎ | risk associated with our failure to develop or manage a project in accordance with our planning expectations; |
∎ | risks associated with the ability of our partners to finance their respective shares of project expenditures; and |
∎ | risks associated with our being in a position to finance our share of project costs, or obtaining financing for these projects on commercially reasonable terms, or at all. |
We face risks associated with our joint venture operations and projects.
A number of our projects and operations are developed and operated through joint venture or shared ownership arrangements with third parties. These joint arrangements include, among others, Quebrada Blanca Phase 2, Fort Hills, Antamina, NuevaUnión, Zafranal, Galore Creek, Elkview and Greenhills. We face risks from the fact that at certain of our operations, like Fort Hills and Antamina, we are a minority partner and major decisions may be made without our consent, meaning we may not have control over a number of factors including, timing and amount of
Teck Resources Limited |
Page 99 |
2018 Annual Information Form
capital and operating expenditures, operation and production decisions, risk management and other operational practices.
We also face risks from the fact that at certain other projects, like NuevaUnión and Galore Creek, we hold a 50% interest and many decisions require the consent of our partner, and, even at projects where we hold a majority interest, such as Quebrada Blanca, Zafranal, Elkview and Greenhills, major decisions affecting the project or operations may require agreement with our partners. Dispute resolution provisions with respect to major project decisions in the relevant agreements may result in major project decisions being made without our consent or may trigger other remedies.
The success and timing of these projects depend on a number of factors that may be outside our control including, the financial resources of our partners and the objectives and interests of our partners. While joint venture partners may generally reach consensus regarding the direction and operation of the project, there are no assurances that this will always be the case or that future demands and expectations will continue to align. Failure for joint venture partners to agree on matters requiring consensus may lead to development or operational delays, failure to obtain necessary permits or approvals in an efficient manner or at all, remedies under dispute resolution mechanisms, or the inability to progress with the development of the relevant project in accordance with expectations or at all, which could materially affect the development of such projects and our business and financial condition.
Although we believe our financial statements are prepared with reasonable safeguards to ensure reliability, we cannot provide absolute assurance.
We prepare our financial reports in accordance with accounting policies and methods prescribed by International Financial Reporting Standards. In the preparation of financial reports, management may need to rely upon assumptions, make estimates or use their best judgment in determining the financial condition of the company. Significant accounting policies are described in more detail in the notes to our annual consolidated financial statements for the year ended December 31, 2018. In order to have a reasonable level of assurance that financial transactions are properly authorized, assets are safeguarded against unauthorized or improper use, and transactions are properly recorded and reported, we have implemented and continue to analyze our internal control systems for financial reporting. Although we believe our financial reporting and financial statements are prepared with reasonable safeguards to ensure reliability, we cannot provide absolute assurance in that regard.
We are subject to legal proceedings, the outcome of which may affect our business.
The nature of our business subjects us to numerous regulatory investigations, claims, lawsuits and other proceedings in the ordinary course of our business. The results of these legal proceedings cannot be predicted with certainty. There can be no assurances that these matters will not have a material adverse effect on our business. See Legal Proceedings and Regulatory Actions below.
Teck Resources Limited |
Page 100 |
2018 Annual Information Form
Dividends
Our Class A common shares and Class B subordinate voting shares rank equally as to the payment of dividends. Total dividends per share declared and paid in the past three years were:
Year ended December 31
|
2018
|
2017
|
2016
|
|||||||||||||
Dividends paid per share |
0.30 | $ | 0.60 | $ | 0.10 |
In 2017, our Board adopted a dividend policy which contemplates the payment of a quarterly base dividend and annual consideration of a supplemental dividend. Each year, the Board reviews the free cash flow generated by the business, the outlook for business conditions and priorities regarding capital allocation, and determine whether a supplemental dividend should be paid. Any supplemental dividends declared are expected to be paid on the last business day of the calendar year. If declared, supplemental dividends may be highly variable from year to year, given the volatility of commodity prices and the potential need to conserve cash for certain project capital expenditures or other corporate policies. In accordance with the policy, the dividends declared and paid in 2018 include an aggregate $0.20 per share base dividend and $0.10 per share supplemental dividend. The payment of dividends is at the discretion of the Board, who will review the dividend policy regularly.
All dividends paid on our Class A common shares and Class B subordinate voting shares after 2005 are eligible dividends for purposes of the federal and provincial enhanced dividend tax credit that may be claimed by Canadian resident individuals.
We may not pay dividends on the Class A common shares and Class B subordinate voting shares unless all dividends on any preferred shares outstanding have been paid to date. We do not currently have any preferred shares outstanding.
Description of Capital Structure
General Description of Capital Structure
Share Capital
Teck is authorized to issue an unlimited number of Class A common shares and Class B subordinate voting shares and an unlimited number of preference shares, issuable in series.
Class A common shares carry the right to 100 votes per share. Class B subordinate voting shares carry the right to one vote per share. Each Class A common share is convertible, at the option of the holder, into one Class B subordinate voting share. In all other respects, including dividend rights and the distribution of property upon dissolution or winding-up of the Company, the Class A common shares and Class B subordinate voting shares rank equally.
The attributes of the Class B subordinate voting shares contain so called coattail provisions, which provide that, in the event that an offer (an Exclusionary Offer) to purchase Class A common shares, which is required to be made to all or substantially all holders thereof, is not made concurrently with an offer to purchase Class B subordinate voting shares on identical
Teck Resources Limited |
Page 101 |
2018 Annual Information Form
terms, then each Class B subordinate voting share will be convertible into one Class A common share at the option of the holder during a certain period, provided that any Class A common shares received upon such conversion are deposited to the Exclusionary Offer. Any Class B subordinate voting shares converted into Class A common shares pursuant to such conversion right will automatically convert back to Class B subordinate voting shares in the event that any such shares are withdrawn from the Exclusionary Offer or are not otherwise ultimately taken up and paid for under the Exclusionary Offer.
The Class B subordinate voting shares will not be convertible in the event that holders of a majority of the Class A common shares (excluding those shares held by the offeror making the Exclusionary Offer) certify to Teck that they will not, among other things, tender their Class A common shares to the Exclusionary Offer.
If an offer to purchase Class A common shares does not, under applicable securities legislation or the requirements of any stock exchange having jurisdiction, constitute a takeover bid or is otherwise exempt from any requirement that such offer be made to all or substantially all holders of Class A common shares, the coattail provisions will not apply.
The above is a summary only. Reference should be made to the articles of Teck, a copy of which may be obtained on SEDAR at www.sedar.com or by writing to the Corporate Secretary.
Securities subject to contractual restriction on transfer
On July 15, 2009, Teck issued 101.3 million Class B subordinate voting shares to Fullbloom Investment Corporation (Fullbloom), a wholly owned subsidiary of China Investment Corporation (CIC). Each of Fullbloom and CIC have agreed that neither of them will, without the prior written consent of Teck, knowingly dispose or agree to dispose (directly or indirectly) of all or a significant portion of their Class B shares to any person that at the time of the disposition is (i) either itself, or through its affiliates, a direct participant in the mining, metals or minerals industries with respect to a substantial portion of the business of itself and its affiliates taken together, (ii) a material customer of Teck, or (iii) a person who, based on Fullbloom and CICs actual knowledge without inquiry, is not dealing at arms-length with any of the persons referred to in (i) or (ii) in connection with securities of Teck, in each case anywhere in the world. These transfer restrictions are subject to certain exceptions.
In September 2017, Fullbloom sold 42 million of its Class B subordinate voting shares. As a result, 59.3 million shares remain subject to the restrictions described above, representing 10.5% of Tecks outstanding Class B subordinate voting shares as of February 25, 2019.
Credit Facilities and Debt Securities
Credit Facilities
We maintain various committed and uncommitted credit facilities for liquidity and for the issuance of letters of credit. As at December 31, 2018, we or our subsidiaries were party to various credit agreements establishing the following credit facilities (collectively, the credit facilities):
∎ | A US$4 billion revolving credit facility provided by a syndicate of lenders, which matures on November 23, 2023 and which, as at December 31, 2018, was undrawn |
Teck Resources Limited |
Page 102 |
2018 Annual Information Form
∎ | A US$600 million revolving credit facility provided by a syndicate of lenders, which matures on November 23, 2021. As at December 31, 2018, US$573 million of letters of credit were outstanding. |
∎ | A $200 million uncommitted standby letter of credit facility with Bank of Montreal. As at December 31, 2018, $147 million of letters of credit under the facility were outstanding. |
∎ | A $150 million uncommitted credit facility with Royal Bank of Canada. As at December 31, 2018, $101 million of letters of credit under the facility were outstanding. |
∎ | A $100 million uncommitted standby letter of credit facility with Canadian Imperial Bank of Commerce. As at December 31, 2018, $60 million of letters of credit under the facility were outstanding. |
∎ | A $50 million uncommitted standby letter of credit facility with the Toronto-Dominion Bank. As at December 31, 2018, $38 million of letters of credit under the facility were outstanding. |
∎ | A $125 million uncommitted standby letter of credit facility with BNP Paribas. As at December 31, 2018, $97 million of letters of credit under the facility were outstanding. |
∎ | A $125 million uncommitted standby letter of credit facility with United Overseas Bank. As at December 31, 2018, $115 million of letters of credit under the facility were outstanding. |
∎ | A $100 million uncommitted standby letter of credit facility with National Bank of Canada. As at December 31, 2018, $75 million of letters of credit under the facility were outstanding. |
∎ | A $75 million uncommitted standby letter of credit facility with Sumitomo Mitsui Banking Corporation. As at December 31, 2018, $46 million of letters of credit under the facility were outstanding. |
∎ | A $50 million uncommitted standby letter of credit facility with MUFG Bank Ltd. As at December 31, 2018, $39 million of letters of credit under the facility were outstanding. |
∎ | A US$75 million uncommitted standby letter of credit facility with Banco del Estado de Chile. As at December 31, 2018, US$75 million of letters of credit under the facility were outstanding. |
∎ | A US$75 million uncommitted standby letter of credit facility with Banco de Credito E Inversiones. As at December 31, 2018, US$75 million of letters of credit under the facility were outstanding. |
∎ | A US$450 million Performance Security Guarantee Issuance and Indemnity Agreement with Export Development Canada (EDC), regarding our Red Dog mine. As at December 31, 2018, US$419 million of letters of credit, issued by third-party banks but secured by EDC under this arrangement, were outstanding. |
∎ | A $150 million Performance Security Guarantee Issuance and Indemnity Agreement with EDC, regarding our coal operations. As at December 31, 2018, $125 million of letters of credit, issued by third-party banks but secured by EDC under this arrangement, were outstanding. |
Teck Resources Limited |
Page 103 |
2018 Annual Information Form
∎ | A US$150 million credit facility with Goldman Sachs Mortgage Company. As at December 31, 2018, US$150 million of letters of credit were outstanding. |
In addition to the letters of credit outstanding under the facilities listed above, we also had, as at December 31, 2018, $369 million of stand-alone letters of credit and $350 million of surety bonds outstanding. The stand-alone letters of credit are issued by financial institutions on an as-negotiated basis mainly to support our reclamation obligations. While a variety of banks issue these stand-alone letters of credit, approximately $311 million were issued by the Bank of Nova Scotia. The surety bonds are provided by insurance companies and support our reclamation obligations.
Our uncommitted standby letter of credit facilities may be terminated at the election of the bank counterparty upon at least 90 days notice. In the event that a standby letter of credit facility is terminated, we would be required to deliver cash collateral to the bank counterparty if we were unable to terminate the letter of credit issued by the bank. These facilities are typically renewed on an annual basis. From time to time, at our election, we may reduce the fees paid to banks issuing letters of credit by making short-term deposits of excess cash with those banks. The deposits earn a competitive rate of interest and are generally refundable on demand. At December 31, 2018, we had US$811 million of such deposits. Our surety bonds provide the insurance issuer with the right, on 60 days notice, in certain circumstances, to require Teck to obtain the return of a surety bond or to deliver cash collateral if we are unable to return the bond.
The owner of the Antamina project, CMA, is party to a credit facility. We hold a 22.5% interest in CMA. As at December 31, 2018, our proportionate share of CMAs US$100 million senior revolving credit facility was US$22.5 million. This facility is fully drawn and is non-recourse to us and the other Antamina project sponsors. The facility matures on April 30, 2020.
Both of our US$4.0 billion and US$600 million revolving credit facilities contain restrictive and financial covenants, including:
∎ | a requirement to maintain a net debt to total capitalization (net debt over debt-plus-equity) ratio of not more than 0.55:1.0. As of December 31, 2018, our ratio of net debt to total capitalization for purposes of our credit facilities was 0.13:1.0; |
∎ | a restriction on certain of our subsidiaries incurring indebtedness of more than an aggregate of US$675 million unless the relevant subsidiary guarantees the credit facility; |
∎ | a provision requiring prepayment in the event of a change of control at Teck; and |
∎ | a prohibition on agreements that might restrict certain subsidiaries from issuing dividends or other distributions to, or making or repayment of loans to, Teck. |
In November 2018, the subsidiary guarantees of our revolving and bilateral credit facilities were terminated.
Our revolving credit facilities include customary events of default, which include non-payment of principal, interest, fees or other amounts owing in connection with such credit facilities, inaccuracy of representations and warranties, violation of covenants (subject, in the case of certain affirmative covenants, to a grace period), a payment default by Teck or any material subsidiary (as defined in the applicable credit facility) in respect of indebtedness equal to or in
Teck Resources Limited |
Page 104 |
2018 Annual Information Form
excess of US$100 million, acceleration of indebtedness equal to or in excess of US$100 million, bankruptcy or insolvency events of Teck or a material subsidiary, the rendering of a final judgment against Teck or any material subsidiary or a combination thereof in excess of US$100 million, the rendering of a final judgment not involving the payment of money against Teck or any material subsidiary that could reasonably be expected to result in a material adverse effect (as defined in the applicable credit facility) and certain events under the United States Employee Retirement Income Security Act of 1974.
Borrowing under our primary committed credit facilities is subject to our compliance with the covenants in the relevant agreement and our ability to make certain representations and warranties at the time of the borrowing request.
Our reclamation obligations are included in the Other Liabilities and Provisions line item on our balance sheet. Associated letters of credit and surety bonds would not become a liability unless the letter of credit or surety bond is drawn by the beneficiary, which drawing would be triggered if we did not perform our obligations under the relevant contract or permit. In the event of a drawing, we would be required to reimburse the issuing bank or surety bond provider for the amount drawn on the letter of credit or surety bond, respectively. Issued letters of credit and outstanding surety bonds do not constitute debt for the purpose of the net debt-to-debt plus equity covenant in our bank credit agreements or limitations on indebtedness under our 2016 indenture (as defined below).
There are no restrictions on borrowing, or additional covenants, triggered under our credit facilities as a result of ratings downgrades, although the pricing under certain of our credit facilities varies with ratings. Tecks indebtedness outstanding under each of the credit facilities ranks pari passu in right of payment with the indebtedness under each of the other credit facilities and with all of Tecks other indebtedness for borrowed money, except that which is secured by liens permitted by the credit facilities and indentures.
Public Indebtedness
As of December 31, 2018, our public indebtedness consisted of nine series of outstanding notes.
We have issued notes under an indenture dated September 12, 2002, an indenture dated August 17, 2010 (as supplemented from time to time in connection with an offering of notes) and an indenture dated June 7, 2016. The Bank of New York Mellon acts as trustee under each indenture. All of our notes are issued under the 2010 indenture, except for our (a) 6.125% notes due October 1, 2035, which were issued under the 2002 indenture, and (b) 8.500% notes due 2024, which were issued under the 2016 indenture. Our 8.500% notes due 2024 were issued in a private placement and are not registered under the securities laws of any jurisdiction.
The details of the outstanding principal amount, coupon and issuance date of each issuance of our outstanding series of notes as of December 31, 2018 follows:
∎ | US$116.896 million of 4.500% notes due 2021 issued on September 8, 2010; |
∎ | US$201.856 million of 4.750% notes due 2022 issued on July 5, 2011; |
∎ | US$219.943 million of 3.750% notes due 2023 issued on August 8, 2012; |
Teck Resources Limited |
Page 105 |
2018 Annual Information Form
∎ | US$600 million of 8.500% notes due 2024 issued on June 7, 2016 (callable on or after June 1, 2019); |
∎ | US$609.355 million of 6.125% notes due 2035 issued on September 28, 2005; |
∎ | US$490.670 million of 6.000% notes due 2040 issued on August 17, 2010 and September 8, 2010; |
∎ | US$794.717 million of 6.250% notes due 2041 issued on July 5, 2011; |
∎ | US$399.043 million of 5.200% notes due 2042 issued on February 28, 2012; and |
∎ | US$376.908 million of 5.400% notes due 2043 issued on August 8, 2012. |
In February 2018, our 2.500% notes due 2018 were retired at their maturity.
The indentures contain covenants requiring us to offer to purchase the notes in the event of a change in control (as defined in the indentures), and restrictive covenants regarding liens on certain assets of Teck and certain restricted subsidiaries (as defined in the indentures). The indentures also provide for customary events of default, which include non-payment of principal or interest, failure to comply with covenants, the bankruptcy or insolvency of Teck or a material subsidiary, final judgments against Teck or a material subsidiary in excess of US$100 million, failure to pay other indebtedness in excess of US$100 million, or an acceleration of other indebtedness in excess of US$100 million.
In December 2018, subsidiary guarantees of the 8.500% notes due 2024 were terminated. None of our public indebtedness is currently supported with a subsidiary guarantee.
The above is a summary of the terms of our public notes and is qualified in its entirety by reference to the indentures under which the notes were issued. A copy of the indentures can be found under Tecks profile on SEDAR at www.sedar.com.
Ratings
The following table sets forth the current ratings that we have received from rating agencies in respect of our outstanding securities. The cost of funds under our credit facilities depend in part on our credit ratings from time to time. In addition, credit ratings affect our ability to obtain other short-term and long-term financing and the cost of such financing. The drawn and undrawn costs under some of our credit facilities are based upon our credit ratings, and could increase, or decrease, if Tecks credit ratings are downgraded, or upgraded, respectively.
Credit ratings are not recommendations to purchase, hold or sell securities and do not address the market price or suitability of a specific security for a particular investor. Credit ratings may not reflect the potential impact of all risks on the value of securities and may be revised or withdrawn at any time by the credit rating organization. In addition, real or anticipated changes in the ratings assigned to a security will generally affect the market value of that security. We cannot guarantee that a rating will remain in effect for any given period of time or that a rating will not be revised or withdrawn entirely by a rating agency in the future.
Teck Resources Limited |
Page 106 |
2018 Annual Information Form
Our current credit ratings are as follows:
Moodys
|
Standard &
|
Fitch
| ||||
Senior Unsecured Notes(1)
|
Baa3 | BB+ | BBB- |
(1) Our senior unsecured notes are issued under the 2002 Indenture, the 2010 Indenture, and the 2016 Indenture. The guarantees on the notes issued under our 2016 Indenture were released on December 14, 2018.
A description of the rating categories of each of the rating agencies is set out below.
Moodys Investor Service (Moodys)
Moodys long-term credit ratings are on a rating scale that ranges from Aaa to C, which represents the range from highest to lowest quality of securities rated. Moodys Baa rating assigned to our senior unsecured notes is the fourth-highest rating of nine major rating categories. Obligations rated Baa are subject to moderate credit risk. They are considered medium-grade and as such may possess speculative characteristics. Moodys appends numerical modifiers from 1 to 3 to its long-term debt ratings, which indicates where the obligation ranks within its ranking category, with 1 being the highest.
Standard & Poors (S&P)
S&Ps long-term issue credit ratings are on a rating scale that ranges from AAA to D, which represents the range from highest to lowest quality of securities rated. S&Ps BB rating assigned to our senior unsecured notes is the fifth-highest rating of 10 major rating categories. A BB rating is among those S&Ps ratings that indicate an obligation is regarded as having significant speculative characteristics; however, such obligation is considered less vulnerable to nonpayment than speculative issues with lower ratings. BB rated obligations face major ongoing uncertainties or exposure to adverse business, financial or economic conditions that could lead to the obligors inadequate capacity to meet its financial commitments. S&P uses + or - designations to indicate the relative standing of securities within a particular rating category.
Fitch Ratings (Fitch)
Fitchs long-term credit ratings are on a scale ranging from AAA to D, representing the range from highest to lowest quality of securities rated. Fitch has assigned a rating of BBB- to our senior unsecured notes representing the fourth highest of Fitchs nine major rating categories for long-term debt. Debt securities rated BBB are considered good credit quality. Such rating indicates that expectations of default risk are currently low. The capacity for payment of financial commitments is considered adequate, but adverse business or economic conditions are more likely to impair this capacity. Fitchs may append the modifier + or - to a rating to denote the relative status of a security within a major rating category.
Payments to Agencies
We have made payments in respect of certain services provided to us by each of Moodys, S&P and Fitch during the last two years.
Teck Resources Limited |
Page 107 |
2018 Annual Information Form
Market for Securities
Trading Price and Volume
Our Class A common shares are listed on the Toronto Stock Exchange under the ticker symbol TECK.A. Our Class B subordinate voting shares are listed on the Toronto Stock Exchange under the ticker symbol TECK.B and on the New York Stock Exchange under the symbol TECK. The following tables set out the monthly price ranges and volumes traded on The Toronto Stock Exchange during 2018 for the Class A common shares and Class B subordinate voting shares.
Teck Resources A
|
Teck Resources B
| |||||||||||||
Month
|
High ($)
|
Low ($)
|
Volume
|
High ($)
|
Low ($)
|
Volume
| ||||||||
January
|
$ 38.88
|
$ 32.86
|
170716
|
$ 38.89 | $ 32.89 | 46427248 | ||||||||
February
|
$ 38.90
|
$ 33.26
|
103512
|
$ 38.66 | $ 33.28 | 43297957 | ||||||||
March
|
$ 37.10
|
$ 31.80
|
61368
|
$ 37.17 | $ 31.65 | 35023464 | ||||||||
April
|
$ 34.52
|
$ 31.42
|
46129
|
$ 34.88 | $ 31.33 | 33114938 | ||||||||
May
|
$ 37.10
|
$ 31.90
|
39944
|
$ 37.07 | $ 31.77 | 39070536 | ||||||||
June
|
$ 39.00
|
$ 32.23
|
80399
|
$ 39.08 | $ 31.95 | 35499605 | ||||||||
July
|
$ 34.99
|
$ 31.26
|
45271
|
$ 34.49 | $ 31.61 | 28497978 | ||||||||
August
|
$ 33.16
|
$ 28.95
|
48783
|
$ 33.26 | $ 28.49 | 28265221 | ||||||||
September
|
$ 33.34
|
$ 27.93
|
43131
|
$ 33.34 | $ 27.94 | 25962369 | ||||||||
October
|
$ 32.03
|
$ 23.89
|
39438
|
$ 32.49 | $ 23.90 | 46553045 | ||||||||
November
|
$ 29.98
|
$ 25.12
|
31392
|
$ 29.48 | $ 24.95 | 36238377 | ||||||||
December
|
$ 30.31
|
$ 27.79
|
58089
|
$ 30.44 | $ 27.36 | 37729314 | ||||||||
Source: TSX
Teck Resources Limited |
Page 108 |
2018 Annual Information Form
Directors and Officers
Directors
As of February 25, 2019, the Directors of Teck are as follows:
Name, City, Province/State
|
Principal Occupations within Previous Five Years
|
Director Since
| ||
Mayank M. Ashar(3)(5)(6) Calgary, Alberta, Canada |
Currently an advisor for Reliance Industries Limited. Managing Director and Chief Executive Officer of Cairn India Limited from November 2014 to June 2016; previously, President and Chief Executive Officer of Irving Oil Limited.
|
November 2007 | ||
Dominic S. Barton (4)
Singapore, Singapore |
Chair of the Board of the Company; previously Global Managing Partner of McKinsey & Company from 2009 to 2018. | September 2018 | ||
Quan Chong Beijing, China |
Chair of the China Society for World Trade Organization Studies; previously, Deputy China International Trade Representative (Vice-Ministerial level) from 2010 to 2018.
|
April 2016 | ||
Laura L.
Dottori-Attanasio(2)(4)(5)(6)
|
Senior Executive Vice President and Chief Risk Officer for the Canadian Imperial Bank of Commerce | November 2014 | ||
Edward C.
Dowling(1)(3)(4)(6) Colorado, United States
|
Chairman, Alacer Gold Corp. and Polyus Open Joint Stock Company. | September 2012 | ||
Eiichi Fukuda(6) Vancouver, British Columbia, Canada |
President of Sumitomo Metal Mining Canada Inc. and SMM Gold Cote Inc.; previously Executive Vice President of Sumitomo Metal Mining America, Incorporated and held various other roles within the Sumitomo Metal Mining group.
|
April 2016 | ||
Norman B. Keevil III(1)(5)(6) Victoria, British Columbia, Canada |
Vice Chair of Teck. President of Boydel Wastewater Technologies Inc.; previously Chief Operating Officer of Sunpump Solar Inc. 2015 to 2016 and President of Poncho Wilcox Engineering from 2009 to 2015.
|
April 1997 | ||
Takeshi
Kubota(5)(6)
|
Advisor to Sumitomo Metal Mining Co., Ltd.; previously, Director & Senior Managing Officer of Sumitomo Metal Mining Co., Ltd. | April 2012 | ||
Donald R.
Lindsay(1)
|
President and Chief Executive Officer of the Company. | February 2005 | ||
Tracey L.
McVicar(2)(3)(7)
|
Managing Partner of CAI Capital Management Co. since 2014; previously, Managing Director of CAI Capital Management Co. | November 2014 | ||
Sheila A. Murray (4)(5) Toronto, Ontario, Canada |
President of CI Financial Corp. since 2016; previously, Executive Vice-President, General Counsel and Secretary of CI Financial Corp. | April 2018 |
Teck Resources Limited |
Page 109 |
2018 Annual Information Form
Name, City, Province/State
|
Principal Occupations within Previous Five Years
|
Director Since
| ||
Kenneth W.
Pickering (3)(5)(6)
|
Corporate Director and private international mining operations and project development consultant; previously, VP Major Products, Closed Mines & North American Assets, BHP Billiton Base Metals.
|
April 2015 | ||
Una M. Power
(2)(6)
|
Corporate Director; previously, Chief Financial Officer of Nexen Energy ULC.
|
April 2017 | ||
Timothy R.
Snider (1)(2)(3)(4)
|
Chairman of Cupric Canyon Capital, LLC; previously, President & COO, Freeport-McMoRan Copper and Gold, Inc.
|
April 2015 |
(1) | Member of the Executive Committee |
(2) | Member of the Audit Committee |
(3) | Member of the Compensation Committee |
(4) | Member of the Corporate Governance and Nominating Committee |
(5) | Member of the Safety & Sustainability Committee |
(6) | Member of the Reserves Committee |
(7) | Ms. McVicar was a director of G.L.M. Industries LP (GLM), a portfolio company of CAI Capital Management Co. In July 2015, at the time Ms. McVicar was a director of GLM, a court order granted by the Court of Queens Bench of Alberta placed GLM into receivership and appointed a receiver of GLM. Ms. McVicar was a director of Tervita Corporation until December 2016. In December 2016, Tervita completed a recapitalization by way of a court-approved plan of arrangement reducing Terivitas total debt. |
Each of the Directors is elected to hold office until the next annual meeting of the Company or until a successor is duly elected or appointed. The next annual meeting of the Company is scheduled to be held on April 24, 2019.
Officers
As of February 25, 2019, the officers of Teck are as follows:
Name, City, Province/State and
|
Office Held with Teck and Principal Occupations within Previous Five Years
| |
Dominic S.
Barton
|
Chair of the Board; previously, Global Managing Partner of McKinsey & Company from 2009 to 2018
| |
Donald R.
Lindsay
|
President and Chief Executive Officer of the Company | |
Dale E.
Andres
|
Senior Vice President, Base Metals since May 2016; previously, Senior Vice President, Copper
| |
Alex N.
Christopher
|
Senior Vice President, Exploration, Projects & Technical Services since July 2016; previously, Vice President, Exploration
| |
Andrew J.
Golding
|
Senior Vice President, Corporate Development |
Teck Resources Limited |
Page 110 |
2018 Annual Information Form
Name, City, Province/State and
|
Office Held with Teck and Principal Occupations within Previous Five Years
| |
Ronald A. Millos Vancouver, British Columbia, Canada |
Senior Vice President, Finance and Chief Financial Officer | |
Kieron McFadyen Calgary, Alberta |
Senior Vice President, Energy since March 2018; previously, Executive Vice President and President, Upstream Oil and Gas, Cenovus Energy Inc. from 2016 to 2018 and prior to that Vice President, Non-Operated Joint Ventures, Royal Dutch Shell plc
| |
Andrew K. Milner Vancouver, British Columbia |
Senior Vice President, Technology and Innovation since November 2018; previously, Vice President, Production Systems, BHP Billiton Limited. | |
H. Fraser
Phillips Canada
|
Senior Vice President, Investor Relations and Strategic Analysis since March 2017; previously, Managing Director, RBC Capital Markets
| |
Peter C. Rozee West Vancouver, British Columbia, Canada |
Senior Vice President, Commercial and Legal Affairs | |
Robin B.
Sheremeta Canada
|
Senior Vice President, Coal since May 2016; previously, Vice President, Operations, Coal | |
Marcia M. Smith Vancouver, British Columbia, Canada |
Senior Vice President, Sustainability and External Affairs | |
Andrew A. Stonkus North Vancouver, British Columbia, Canada |
Senior Vice President, Marketing and Logistics since March 2015; previously, Vice President, Base Metals Marketing | |
Dean C. Winsor West Vancouver, British Columbia, Canada |
Senior Vice President and Chief Human Resources Officer since November 2018; previously, Vice President, Human Resources | |
Shehzad
Bharmal Canada
|
Vice President, North American Operations, Base Metals since February 2018; previously, Vice President, Planning & Development, Base Metals and Vice President, Strategy & Development, Copper
| |
Greg J. Brouwer Kamloops, British Columbia |
Vice President, Technology and Innovation since November 2018; previously General Manager, Technology and Innovation and General Manager, Teck Highland Valley Copper
| |
Anne J.
Chalmers Canada |
Vice President, Risk and Security and Chair, Materials Stewardship Committee | |
Amparo Cornejo Santiago, Chile |
Vice President, Chile Sustainability and Corporate Affairs since November 2018; previously, Director, Social Responsibility and Corporate Affairs since 2014; previously, Manager, Corporate Affairs, Methanex Chile
| |
Larry M.
Davey
|
Vice President, Planning & Development, Coal since May 2016; previously Vice President, Development, Coal and General Manager Elkview Coal Mine
|
Teck Resources Limited |
Page 111 |
2018 Annual Information Form
Name, City, Province/State and
|
Office Held with Teck and Principal Occupations within Previous Five Years
| |
Christopher J. Dechert Santiago, Chile |
Vice President, South America, since November 2018; previously, Vice President, Copper, Chile Operations and General Manager, Teck Highland Valley Copper
| |
Sepanta Dorri Toronto, Ontario, Canada |
Vice President, Corporate Development since December 2018; previously, Vice President, Corporate and Stakeholder Development, Teranga Gold Corporation | |
Mark Edwards Port Moody, British Columbia, Canada |
Vice President, Community and Government Relations | |
Réal Foley Calgary, Alberta, Canada |
Vice President, Marketing, Coal and Base Metals since April 2018; previously, Vice President, Coal Marketing
| |
John F. Gingell Tsawwassen, British Columbia, Canada |
Vice President, Financial Systems since December 2018; previously, Vice President and Corporate Controller | |
C. Jeffrey
Hanman Canada |
Vice President, Corporate Affairs since March 2017; previously, Head of Corporate Affairs and Director of Communications | |
M. Colin Joudrie North Vancouver, British Columbia, Canada |
Vice President, Business Development | |
Ralph J. Lutes Beijing, China |
Vice President, Asia | |
Scott E.
Maloney Canada |
Vice President, Environment since September 2017; previously, Lead HSE Assurance and Review and Manager Health Safety Environment Community at BHP | |
Karla L. Mills Coquitlam, British Columbia, Canada |
Vice President, Project Development since November 2018; previously, Director, Project Development and Engineering | |
Douglas J.
Powrie Canada |
Vice President, Tax | |
Crystal J. Prystai North Vancouver, British Columbia, Canada |
Vice President and Corporate Controller since December 2018; previously, Director, Finance, Reporting and Compliance | |
Amanda R.
Robinson Canada |
Corporate Secretary since February 2018; previously Partner and Associate at Fasken Martineau DuMoulin LLP | |
Kalev Ruberg West Vancouver, British Columbia, Canada |
Vice President, Teck Digital Systems and Chief Information Officer since November 2017; previously, Chief Information Officer | |
Keith G.
Stein Canada |
Vice President, Major Projects since November 2018; previously, Vice President, Project Development and Vice President Projects |
Teck Resources Limited |
Page 112 |
2018 Annual Information Form
Name, City, Province/State and
|
Office Held with Teck and Principal Occupations within Previous Five Years
| |
Lawrence A.
Watkins Canada
|
Vice President, Health and Safety since September 2015; previously, Director, Health and Safety; previously Principal, HSE Consulting | |
Scott R.
Wilson Canada
|
Vice President and Treasurer |
Audit Committee Information
Mandate of Audit Committee
The full text of our Audit Committees mandate is included as Schedule A to this Annual Information Form.
Composition of the Audit Committee
Our Audit Committee consists of four members. All of the members of the Committee are independent and financially literate. The names, relevant education and experience of each Audit Committee member are outlined below:
Laura L. Dottori-Attanasio
Ms. Dottori-Attanasio is a graduate of the University of Western Ontario (Bachelor of Administrative and Commercial Studies (Finance and Economics)). She has over 20 years of experience in the finance sector, and is currently the Senior Executive Vice President and Chief Risk Officer at the Canadian Imperial Bank of Commerce.
Tracey L. McVicar (Chair)
Ms. McVicar is a graduate of the Sauder School of Business (B.Comm, Finance). She has over 20 years of experience in finance and investment banking. She is a Chartered Financial Analyst (CFA Institute) and Institute Certified Director (Institute of Corporate Directors). She served as the audit committee chair of BC Hydro Corporation from 2009 to 2014.
Una M. Power
Ms. Power is a graduate of Memorial University B.Comm (Honours), and also holds CPA, CA and CFA designations. Ms. Power is the former Chief Financial Officer of Nexen Energy ULC, and held various other executive positions covering financial reporting, financial management, investor relations, business development, strategic planning and investment at Nexen. She is also a director of the Bank of Nova Scotia and Kinross Gold Corporation.
Timothy R. Snider
Mr. Snider is a graduate of Northern Arizona University (B.Sc) and is currently Chairman of Cupric Canyon Capital, LLC. Previously, he was President and Chief Operating Officer of Freeport McMoRan and Phelps Dodge Corporation, where he participated in the review and publication of financial statements.
Teck Resources Limited |
Page 113 |
2018 Annual Information Form
Pre-Approval Policies and Procedures
The Audit Committee has adopted policies and procedures with respect to the pre-approval of audit and permitted non-audit services to be provided by PricewaterhouseCoopers LLP. All non-audit services are pre-approved by the Committee prior to commencement. In addition, the Committee has prohibited the use of the external auditors for the following non-audit services:
∎ | bookkeeping or other services related to the accounting records or financial statements; |
∎ | financial information systems design and implementation; |
∎ | appraisal or valuation services, fairness opinions or contribution-in-kind reports; |
∎ | actuarial services; |
∎ | internal audit outsourcing services; |
∎ | management functions or human resources functions; |
∎ | broker or dealer, investment advisor, or investment banking services; |
∎ | legal services; |
∎ | expert services unrelated to the audit; and |
∎ | all other non-audit services unless there is a strong financial or other reason for external auditors to provide those services. |
Auditors Fees
For the years ended December 31, 2018 and 2017, the Company paid the external auditors $6,607,566 and $5,752,593, respectively, as detailed below:
Year Ended
|
Year Ended
|
|||||||||||
Audit Services(1)
|
|
4,950
|
|
|
4,892
|
|
||||||
Audit-Related Services(2)
|
|
340
|
|
|
269
|
|
||||||
Tax Fees(3)
|
|
306
|
|
|
124
|
|
||||||
All Other Fees(4)
|
|
1,011
|
|
|
468
|
|
||||||
Notes:
(1) | Includes services that are provided by the Corporations external auditors in connection with the audit of the financial statements and internal controls over financial reporting. |
(2) | Includes assurance and related services that are related to the performance of the audit, pension plan and special purpose audits. |
(3) | Fees are for corporate and international expatriate tax services. |
(4) | Amounts relate to a number of projects, including ISO 14001/9001 audits, greenhouse gas verification and sustainability assurance, as well as subscriptions to online accounting guidance and publications. |
Teck Resources Limited |
Page 114 |
2018 Annual Information Form
Ownership by Directors and Officers and Interests in Material Transactions
As of February 25, 2019, the Directors and executive officers as a group beneficially own or exercise control or direction, directly or indirectly, over the following shares issued by Teck:
Shares beneficially owned or
|
As a % of the total
|
|||||||
Class A common shares
|
|
2,800
|
|
|
0.04%
|
| ||
Class B subordinate voting shares
|
|
503,298
|
|
|
0.09%
|
| ||
In addition, Keevil Holding Corporation owns 51% of the outstanding shares of Temagami Mining Company Limited (Temagami) that, as of February 25, 2019, beneficially owned or exercised direction or control, directly or indirectly, over 4,300,000 Class A common shares, representing 55.35% of the Class A common shares outstanding and 725,000 Class B subordinate voting shares, representing 0.13% of the Class B subordinate voting shares outstanding. Norman Keevil, III is a director of Keevil Holding Corporation and 98% of the votes attached to the outstanding shares of Keevil Holding Corporation are held by a trust for the benefit of certain members of the Keevil family. The other 49% of the outstanding Temagami shares are owned by Sumitomo Metal Mining Co. Ltd. (SMM). One of our directors, Takeshi Kubota, is an advisor to and a former director and officer of SMM and another director, Eiichi Fukuda, is a director and officer of certain entities that are affiliated with SMM. Messrs. Keevil III, Kubota and Fukuda are also directors of Temagami.
We have recently entered into an agreement whereby SMM and Sumitomo Corporation will acquire a 30% indirect interest in our Quebrada Blanca Phase 2 project. See Description of the Business Individual Operations - Copper Quebrada Blanca Mine, Chile for further details. SMM is a significant shareholder of our company and has a material interest in transaction. Dr. Keevil (who was on the Board at the time) and Messrs. Keevil III, Kubota and Fukuda each declared their potential conflict of interest and recused themselves from all Board discussions related to this transaction.
Legal Proceedings and Regulatory Actions
Upper Columbia River Basin (Lake Roosevelt)
Prior to our acquisition in 2000 of a majority interest in Cominco Ltd. (now Teck Metals Ltd.), the Trail smelter discharged smelter slag into the Columbia River. These discharges commenced prior to Teck Metals acquisition of the Trail smelter in 1906 and continued until 1996. Slag was discharged pursuant to permits issued in British Columbia subsequent to the enactment of relevant environmental legislation in 1967.
Slag is a glass-like compound consisting primarily of silica, calcium and iron that also contains small amounts of base metals including zinc, lead, copper and cadmium. It is sufficiently inert that
Teck Resources Limited |
Page 115 |
2018 Annual Information Form
it is not characterized as a hazardous waste under applicable Canadian or U.S. regulations and is sold to the cement industry.
While slag has been deposited into the river, further study is required to assess what effect the presence of metals in the river has had and whether it poses an unacceptable risk to human health or the environment.
A large number of studies regarding slag deposition and its effects have been conducted by various governmental agencies on both sides of the border. The historical studies of which we are aware have not identified unacceptable risks resulting from the presence of slag in the river. In June 2006, Teck Metals and its affiliate, Teck American Incorporated (TAI), entered into a Settlement Agreement with the U.S. Environmental Protection Agency (the EPA) and the United States under which TAI is paying for and conducting a remedial investigation and feasibility study (RI/FS) of contamination in the Upper Columbia River under the oversight of the EPA.
The RI/FS is being prepared by independent consultants approved by the EPA and retained by TAI. TAI is paying the EPAs oversight costs and providing funding for the participation of other governmental parties: the Department of Interior, the State of Washington, and two native tribes, the Confederated Tribes of the Colville Nation (the Colville Tribe) and the Spokane Tribe. Teck Metals has guaranteed TAIs performance of the Settlement Agreement. TAI has also placed US$20 million in escrow as financial assurance of its intention to discharge its obligations under the Settlement Agreement. We have accrued our estimate of the costs of the RI/FS.
Two citizens of Washington State and members of the Colville Tribe commenced an enforcement proceeding under the Comprehensive Environmental Response, Compensation and Liability Act (CERCLA) to enforce an EPA administrative order against Teck and to seek fines and penalties against Teck Metals for non-compliance. Subsequently, an amended complaint was filed in District Court adding the Colville Tribe as a plaintiff and seeking natural resource damages and costs. Teck Metals sought to have the claims dismissed on the basis that the court lacked jurisdiction because the CERCLA statute, in Teck Metals view, was not intended to govern the discharges of a facility in another country. That case proceeded through U.S. Federal District Court and the Federal Court of Appeals for the 9th Circuit. The 9th Circuit found that CERCLA could be applied to Teck Metals disposal practices in British Columbia because they may have resulted in a release of toxic materials from a facility in Washington State.
The litigation continues. In September 2012, Teck Metals entered into an agreement with the plaintiffs, agreeing that certain facts were established for purposes of the litigation. The agreement stipulates that some portion of the slag discharged from our Trail Operations into the Columbia River between 1896 and 1995, and some portion of the effluent discharged from Trail Operations, has been transported to and is present in the Upper Columbia River in the United States, and that some hazardous substances from the slag and effluent have been released into the environment within the United States. In December 2012, the District Court found in favour of the plaintiffs in phase one of the case, issuing a declaratory judgment that Teck Metals is liable under CERCLA for response costs, the amount of which will be determined in a subsequent phase of the case.
In October 2013, the Colville Tribe filed an omnibus motion with the District Court seeking an order stating that it is permitted to seek recovery from Teck Metals for environmental response
Teck Resources Limited |
Page 116 |
2018 Annual Information Form
costs and, in a subsequent proceeding, natural resource damages and assessment costs arising from the alleged deposition of hazardous substances in the United States from aerial emissions from Teck Metals Trail Operations. Prior allegations by the Tribes related solely to solid and liquid materials discharged to the Columbia River. The motion does not state the amount of response costs allegedly attributable to aerial emissions, nor did it attempt to define the extent of natural resource damages, if any, attributable to past smelter operations. In December 2013, the District Court ruled in favour of plaintiffs. The plaintiffs subsequently filed amended pleadings in relation to air emissions. The Court dismissed a motion to strike the air claims on the basis that CERCLA does not apply to air emissions in the manner proposed by the plaintiffs, and a subsequent Teck Metals motion seeking reconsideration of the dismissal. Teck Metals sought leave to appeal both of these decisions in the Ninth Circuit on an interlocutory basis, and in July 2016 the Ninth Circuit unanimously ruled in favour of Teck Metals on its appeal of the District Court decision. Plaintiffs sought an en banc review of the decision in the Ninth Circuit, which was denied in October 2016. As a result, alleged damages associated with air emissions are no longer part of the case.
A hearing with respect to past response costs took place in December 2015. In August 2016, the trial court judge ruled in favour of the plaintiffs. Teck Metals appealed that decision, along with certain other findings in the first phase of this case, in the Ninth Circuit Court of Appeals, which upheld the trial court ruling in September 2018. Teck Metals applied for rehearing of the Ninth Circuit ruling, which application was denied. Teck Metals intends to seek leave to appeal certain findings in the U.S. Supreme Court.
A hearing with respect to claims for natural resource damages and assessment costs is expected to occur when the remedial investigation and feasibility study being undertaken by TAI are completed.
Natural resource damages are assessed for injury to, destruction of, or loss of natural resources including the reasonable cost of a damage assessment. TAI commissioned a study by recognized experts in damage assessment in 2008. Based on the assessment performed, Teck Metals estimates that the compensable value of such damage will not be material.
TAI intends to fulfill its obligations under the Settlement Agreement reached with the United States and the EPA in June 2006 and to complete the RI/FS mentioned above. The Settlement Agreement is not affected by the litigation.
There can be no assurance that we will ultimately be successful in our defence of the litigation or that we or our affiliates will not be faced with further liability in relation to this matter. Until the studies contemplated by the Settlement Agreement and additional damage assessments are completed, it is not possible to estimate the extent and cost, if any, of any additional remediation or restoration that may be required or to assess our potential liability for damages. The studies may conclude, on the basis of risk, cost, technical feasibility or other grounds, that no remediation other than some residential soil removal should be undertaken. If other remediation is required and damage to resources found, the cost of that remediation may be material.
Teck Resources Limited |
Page 117 |
2018 Annual Information Form
Fisheries Act
During the third quarter of 2018, we received notice from Canadian federal prosecutors of potential charges under the Fisheries Act in connection with discharges of selenium and calcite from coal mines in the Elk Valley. Since 2014, compliance limits and site performance objectives for selenium and other constituents, as well as requirements to address calcite, in surface water throughout the Elk Valley and in the Koocanusa Reservoir have been established under a regional permit issued by the Provincial government, which references the Elk Valley Water Quality Plan. If Canadian Federal charges are laid, potential penalties may include fines as well as orders with respect to operational matters. We expect that discussions with respect to the draft charges will continue at least into the third quarter of 2019. It is not possible at this time to fully assess the viability of our potential defences to any charges, or to estimate the potential financial impact on us of any conviction. Nonetheless, that impact may be material.
Transfer Agents and Registrars
AST Trust Company (Canada) is the transfer agent and registrar for the Class A common and Class B subordinate voting shares and maintains registers in Vancouver, British Columbia and Toronto, Ontario.
Material Contracts
The following are the only contracts entered into by Teck that are material, still in effect and not entered into in the ordinary course of business:
∎ | Waneta Transmission Agreement, dated as of July 26, 2018, between Teck Metals Ltd. and British Columbia Hydro and Power Authority |
∎ | Indenture, dated as of August 17, 2010, between Teck and The Bank of New York Mellon, as trustee, and the first, second, third, fourth and fifth supplemental indentures thereto |
∎ | Indenture, dated as of June 7, 2016, between Teck and The Bank of New York Mellon, as trustee |
Interests of Experts
PricewaterhouseCoopers LLP, Chartered Professional Accountants, are the Companys auditors and have prepared an opinion with respect to the Companys consolidated financial statements as at and for the year ended December 31, 2018. PricewaterhouseCoopers LLP report that they are independent of the Company in accordance with the Chartered Professional Accountants of British Columbia Code of Professional Conduct and the rules of the Public Company Accounting Oversight Board.
Rodrigo Marinho, P.Geo., Don Mills, P.Geo., Robin Gold, P.Eng., Luis Mamani, SME Registered Member, and Lucio Canchis, SME Registered Member have acted as qualified persons in connection with the estimates of mineral reserves and resources presented in this Annual Information Form. Mr. Marinho is an employee of the Company. Messrs. Mills and Gold are employees of Teck Coal Limited, which is directly and indirectly wholly owned by Teck.
Teck Resources Limited |
Page 118 |
2018 Annual Information Form
Messrs. Mamani and Canchis are employees of Compañía Minera Antamina S.A., in which the Company holds a 22.5% share interest.
GLJ Petroleum Consultants Ltd. has acted as an independent qualified reserves evaluator in connection with our interest in Fort Hills. Sproule Associates Limited has acted as an independent reserves evaluator in connection with our interest in the Frontier oil sands project.
Messrs. Marinho, Mills, Gold, Mamani, Canchis and the designated professionals of GLJ Petroleum Consultants Ltd. and Sproule Associates Limited, each respectively, hold beneficially, directly or indirectly, less than 1% of any class of the Companys securities.
Teck Resources Limited |
Page 119 |
2018 Annual Information Form
Disclosure Pursuant to the Requirements of the New York Stock Exchange
The Board and management are committed to leadership in corporate governance. As a Canadian reporting issuer with securities listed on the Toronto Stock Exchange, we have in place a system of corporate governance practices that meets or exceeds all applicable Canadian requirements.
Notwithstanding that Teck is a foreign private issuer for purposes of its New York Stock Exchange (NYSE) listing and, as such, the NYSE director independence requirements that are applicable to U.S. domestic issuers do not apply to Teck, the Board has established a policy that at least a majority of its directors must satisfy the director independence requirements under Section 303A.02 of the NYSE corporate governance rules. The Board annually reviews and makes such determination as to the independence of each director for both Canadian and NYSE purposes.
The NYSE requires that, as a foreign private issuer that is not required to comply with all of the NYSEs corporate governance rules applicable to U.S. domestic issuers, Teck disclose any significant ways in which its corporate governance practices differ from those followed by NYSE listed U.S. domestic issuers. The differences between our practices and the NYSE rules are not material and are more of a matter of form than substance.
Non-GAAP Measures
Our financial results are prepared in accordance with International Financial Reporting Standards (IFRS). This document refers to Operating Netback and Bitumen Price Realized which are non-GAAP financial measures not recognized under IFRS in Canada. These measures do not have standardized meanings prescribed by IFRS or Generally Accepted Accounting Principles (GAAP) in the United States. As a result they may not be comparable to similar measures reported by other companies.
Operating Netbacks per barrel in our energy business unit are calculated as blended bitumen sales revenue net of diluent expenses (also referred to as bitumen price realized), less royalties, transportation and operating expenses divided by barrels of bitumen sold. We include this information as investors and analysts use it to measure our profitability on a per barrel basis.
Bitumen price realized is revenue from the sale of our blended bitumen excluding non-proprietary product revenue with crown royalties added back in divided by blended bitumen barrels sold in the period.
Operating Netback and Bitumen price realized are each reconciled to Revenue under the heading Use of Non-GAAP Measures Energy Business Unit Operating Netback, Bitumen and Blende Bitumen Price Realized Reconciliations of our Managements Discussion and Analysis for the year ended December 31, 2018, which can be found under our profile on SEDAR at www.sedar.com.
Teck Resources Limited |
Page 120 |
2018 Annual Information Form
Additional Information
1. | Additional information relating to the Company may be found under our profile on SEDAR at www.sedar.com. |
2. | Additional information, including directors and officers remuneration and indebtedness, principal holders of the Companys securities, securities authorized for issuance under equity compensation plans, options to purchase securities and interests of insiders in material transactions, is contained in the Management Proxy Circular to be issued for our Annual Meeting of Shareholders to be held on April 24, 2019. Additional financial information is also provided in our comparative financial statements and in the Managements Discussion and Analysis for the year ended December 31, 2018. Copies of these documents are available upon request from our Corporate Secretary. |
3. | Unless otherwise stated, information contained herein is as at December 31, 2018. |
Teck Resources Limited |
Page 121 |
Schedule A Audit Committee Charter
Teck Resources Limited
AUDIT COMMITTEE CHARTER
A. | GENERAL |
1. | Purpose |
The purpose of the Audit Committee (the Committee) of the Board of Directors (the Board) of Teck Resources Limited (the Corporation) is to provide an open avenue of communication between management, the external auditor, the internal auditors and the Board and to assist the Board in its oversight of the:
| integrity, adequacy and timeliness of the Corporations financial reporting and disclosure practices; |
| processes for identifying the principal financial risks of the Corporation and reviewing the Corporations internal control systems to ensure that they are adequate to ensure fair, complete and accurate financial reporting; |
| Corporations compliance with legal and regulatory requirements related to financial reporting; |
| accounting principles, policies and procedures used by management in determining significant estimates; |
| antifraud programs and controls, including managements identification of fraud risks and implementation of antifraud measures; |
| mechanisms for employees to report concerns about accounting policies and financial reporting; |
| engagement, independence and performance of the Corporations external auditor; and |
| internal audit mandate, internal audit plans, internal audit and Sarbanes Oxley (SOX) audit programs and results of internal audits and SOX compliance audits performed by the Corporations internal audit department. |
Another purpose of the Committee is to assist the Board in fulfilling its responsibilities to oversee and monitor the management and overall governance of the Corporations various pension plans (Pension Matters).
The Committee shall also perform any other activities consistent with this Charter, the Corporations by-laws and governing laws as the Committee or Board deems necessary or appropriate.
2. | Responsibilities |
The Committees role is one of oversight. Management is responsible for preparing the Corporations financial statements and other financial information, for the fair presentation of the information set forth in the financial statements in accordance with GAAP, for establishing, documenting, maintaining and reviewing systems of internal control and for maintaining the appropriate accounting and financial reporting principles and policies designed to assure compliance with accounting standards and all applicable laws and regulations. Management has also been delegated responsibility for day-to-day administrative and sponsorship responsibilities with respect to Pension Matters.
The external auditors responsibility is to audit the Corporations financial statements and provide an opinion, based on their audit conducted in accordance with Canadian generally accepted auditing
Teck Resources Limited |
A-1 |
standards, that the financial statements present fairly, in all material respects, the financial position, results of operations and cash flows of the Corporation in accordance with GAAP.
In accordance with the Sarbanes Oxley Act of 2002, Section 404, the external auditors are also responsible for providing an opinion on the effectiveness of the Corporations internal controls over financial reporting.
The Committee is responsible for recommending to the Board for recommendation to the shareholders of the Corporation the appointment of the external auditor. The Committee is responsible for the evaluation and oversight of the work of the external auditor and oversees the resolution of any disagreements between management and the external auditor regarding financial reporting and SOX assessment. The external auditor shall report directly to the Committee, as the external auditor is accountable to the Board as representatives of the Corporations shareholders. It is not the duty or responsibility of the Committee or any of its members to plan or conduct any type of audit or accounting review or procedure.
The Committee shall be responsible for approving the external auditors remuneration.
B. | AUTHORITY AND RESPONSIBILITIES WITH RESPECT TO FINANCIAL REPORTING AND RELATED MATTERS |
In performing its oversight responsibilities, the Committee shall:
1. | Meet at least five times per year. The Committee may ask members of management or others to attend meetings to provide information as necessary. |
2. | Meet separately with the Chief Executive Officer and the Chief Financial Officer, senior financial management, the external auditor and the Corporations chief audit executive at least four times per year, or more frequently as required, to discuss matters that the Committee or these individuals or groups believe should be discussed privately with the Committee. |
3. | Review and assess the adequacy of this Charter and recommend any proposed changes to the Board for approval at least once per year. |
4. | Review the appointments of the Corporations Chief Financial Officer and any other key financial executives involved in the financial reporting process. |
5. | Review with management, the external auditor and the Corporations chief audit executive the adequacy and effectiveness of the Corporations systems of internal control, the status of managements implementation of internal audit recommendations and the remediation status of any reported control deficiencies. Particular emphasis will be placed on those deficiencies evaluated as either a significant deficiency or a material weakness, which have been identified as a result of audits and/or during annual controls compliance testing as required under SOX legislation. |
6. | Review the Corporations process for the CEO and CFO certifications required by securities regulations to which the Corporation is subject with respect to the Corporations financial statements, disclosures and internal controls, including any significant changes or deficiencies in such controls. |
7. | Review with management and the external auditor the annual audited financial statements and managements discussion and analysis and recommend their approval by the full Board prior to their release and/or filing with the applicable regulatory agencies. |
8. | Review with management and the external auditor the unaudited quarterly financial statements, associated managements discussion and analysis and interim earnings news releases and approve |
Teck Resources Limited |
A-2 |
them on behalf of the Board, prior to their release and/or filing with the applicable regulatory agencies. |
9. | As appropriate, review other news releases and reporting documents that include material non-public financial information prior to their public disclosure by filing or distribution of these documents. Such review includes financial matters required to be reported under applicable legal or regulatory requirements, but does not necessarily include news releases that contain financial information incidental to the announcement of acquisitions, financings or other transactions. |
10. | Ensure that adequate procedures are in place for the review of the Corporations public disclosure of financial information extracted or derived from the Corporations financial statements, other than the disclosure documents referred to above, and periodically assess the adequacy of these procedures. |
11. | Review the Corporations financial reporting and accounting standards and principles and significant changes in such standards or principles or in their application, including key accounting decisions affecting the financial statements, alternatives thereto and the rationale for decisions made. |
12. | Review the quality and appropriateness, not just the acceptability, of the accounting policies and the clarity of financial information and disclosure practices adopted by the Corporation, including consideration of the external auditors judgments about the quality and appropriateness of the Corporations accounting policies. This review shall include discussions with the external auditor without the presence of management. |
13. | Review with management, the external auditor and the Corporations chief audit executive significant related party transactions and potential conflicts of interest. |
14. | Review with management the tax policy adopted by the Corporation and material developments in the Corporations tax affairs. |
15. | To assist the Board with its recommendations to shareholders, recommend (a) the external auditor to be nominated to examine the Corporations accounts and financial statements and prepare and issue an auditors report on them or perform other audit, review or attest services for the Corporation and (b) the compensation of the external auditor. |
16. | Approve all audit engagement terms and fees. |
17. | Review with management and the external auditor and approve the annual external audit plan and results of and any problems or difficulties encountered during any external audits and managements responses thereto. |
18. | Receive the reports of the external auditor on completion of the quarterly reviews and the annual audit. |
19. | Monitor the independence of the external auditors by reviewing all relationships between the external auditor and the Corporation and all audit, non-audit and assurance work performed for the Corporation by the external auditor on at least a quarterly basis. The Committee will receive an annual written confirmation of independence from the external auditor. |
20. | Pre-approve all audit, non-audit and assurance services provided by the independent auditor prior to the commencement of any such engagement. The Committee may delegate the responsibility for approving non-audit services to the Chair or another member of the Committee appointed by the Chair where the fee does not exceed $50,000. The Committee will review a summary of all audit, non-audit and assurance work performed for the Corporation at least twice per year. |
Teck Resources Limited |
A-3 |
21. | Review and approve the Corporations hiring policies regarding partners, employees or former partners and employees of the present or former external auditor of the Corporation, including: |
| the appointment of any employee or former employee of the Corporations present and former external auditor to a senior financial management position with the Corporation, and |
| managements reports of the profiles of all individuals hired during the past year who were employed by the present and former external auditor at any time during the two years prior to being hired by the Corporation. |
22. | Review and approve the functions of the Corporations Audit and Operational Review Department, including: |
| its mandate, authority and organizational reporting lines; |
| its annual and longer term internal audit plans, budgets and staffing; |
| its performance; and |
| the appointment, reassignment or replacement of the Corporations chief audit executive. |
This review will include discussions with the Corporations chief audit executive without the presence of management or the external auditor.
23. | Review the Corporations procedures and establish procedures for the Committee for the: |
| receipt, retention and resolution of complaints regarding accounting, internal accounting controls, financial disclosure or auditing matters; and |
| confidential, anonymous submission by employees regarding questionable accounting, auditing or financial reporting and disclosure matters or violations of the Corporations Code of Ethics or associated policies. |
24. | Review the adequacy of the Corporations bank lines of credit and guidelines for the investment of cash. |
25. | Review with senior financial management, the external auditor, the Corporations chief audit executive, and such others as the Committee deems appropriate, the results of operational reviews, audits, SOX controls compliance audits and any problems or difficulties encountered during the audits. |
C. | AUTHORITY AND RESPONSIBILITIES WITH RESPECT TO PENSION MATTERS |
In assisting the Board in fulfilling its responsibilities with respect to the management and governance of the Corporations pension plans, the Committee shall:
1. | With respect to the Corporations role as plan sponsor, |
| Review and oversee the implementation of the design of the Corporations pension plans, the coverage afforded by the plans and changes to the plans. |
| Review the funding policies for the Corporations defined benefit plans and where appropriate, recommend the Boards approval of these policies. |
| Review the level of the Corporations contributions to the Corporations defined contribution plans and any proposed changes thereto and where appropriate recommend approval of such changes to the Board. |
Teck Resources Limited |
A-4 |
| Review proposals for the wind-up or partial wind-up of any of the Corporation pension plans, having regard to any collective bargaining and regulatory requirements and making appropriate recommendations in respect thereof to the Board. |
2. | With respect to the Corporations role as plan administrator |
| Oversee and monitor the authority delegated to managements Executive Pension Committee to administer each of the pension plans in accordance with relevant pension legislation, the terms of the plans and all other requirements of law. |
| Review compliance with minimum funding requirements (if any) prescribed by applicable pension legislation and the policies and procedures in place in respect thereof, including requisitioning and reviewing actuarial reports. |
| Review and monitor the investment of pension fund assets (in the case of a defined benefit plan), including the policies and procedures in place in respect thereof. |
| Review and monitor the sufficiency and appropriateness of the investment choices available to plan members of the defined contribution plans and the Corporation communication and educational materials provided to plan members. |
| Review and monitor the performance of the investment managers chosen by management for the Corporations pension plans, including the process established for the selection, retention or replacement of any investment manager or advisors. |
3. | Advise the Board, either orally or in writing, of any pension-related matters that the Committee believes have or could have a material effect on the financial condition or affairs of the Corporation and/or any of its pension plans and make appropriate recommendations to the Board in respect of matters requiring Board approval. |
D. | COMMITTEE COMPOSITION |
1. | Member Qualifications |
The Committee shall consist of at least three directors, a quorum of which shall be a majority of the members. All members of the Committee shall be independent directors and shall be sufficiently financially literate to enable them to discharge their responsibilities in accordance with applicable laws and/or requirements of the stock exchanges on which the Corporations securities trade and in accordance with Multilateral Investment Instrument 52-110. Financial literacy means the ability to read and understand a balance sheet, income statement, cash flow statement and associated notes which represent a breadth and level of complexity of accounting issues that are generally comparable to the breadth and complexity of the issues that can reasonably be expected to be raised by the consolidated financial statements of the Corporation. At least one member of the Committee shall have accounting or related financial management expertise that allows that member to read and understand financial statements and the related notes attached thereto in accordance with Canadian generally accepted accounting principles (GAAP), which for the Corporation is International Financial Reporting Standards.
2. | Member Appointment and Removal |
The members of the Committee shall be appointed annually at the time of each annual meeting of shareholders and shall hold office until the next annual meeting or until they cease to be directors of the Corporation.
Teck Resources Limited |
A-5 |
3. | QUORUM |
A quorum for the Committee shall be a majority of the members.
E. | PROCEDURES AND OTHER MATTERS |
1. | Litigation and Ethics Matters |
At each Audit Committee meeting the General Counsel and the Corporations chief audit executive shall report any litigation, claim or other contingency that could have a significant effect on the Corporations financial results or disclosures and any real or suspected incidents of fraud, theft or violations of the Corporations Code of Ethics or associated policies that have been reported to management or to the internal audit department. The Committee shall review any such reports or similar reports submitted by other employees or members of management and if deemed necessary, report such matters related to auditing, accounting and financial reporting and/or disclosure to the full Board.
2. | Evaluations |
The Committee shall establish and annually implement an evaluation process for the Committee and its individual members and the results of that evaluation shall be reported to the Committee and the Board.
3. | Disclosure Controls |
The Committee shall be provided with copies of the minutes of meetings of managements Disclosure Committee and the Chair of the Committee or an appointee shall meet at least once per year with managements Disclosure Committee to review the Corporations disclosure controls and procedures.
4. | Pension Minutes |
The Committee shall be provided with copies of the minutes of meetings of the Executive Pension Committee.
5. | Investigations and Advisors |
The Committee shall conduct or authorize investigations into any matter that the Committee believes is within the scope of its responsibilities. The Committee has the authority to (a) retain independent counsel, accountants or other advisors to assist it in the conduct of any investigation or otherwise to assist it in the discharge of its duties, at the expense of the Corporation, (b) set and pay the compensation of any advisors retained by it and (c) communicate directly with the internal and external auditors.
6. | Reporting |
The Chair of the Committee shall report to the Board with respect to the activities and recommendations of the Committee when he or she may deem appropriate, but not later than the next meeting of the Board. The minutes of Committee meetings will be made available to the Board.
Teck Resources Limited |
A-6 |
7. | Audit Committee Report |
The Chair of the Committee shall prepare or cause to be prepared an audit committee report to be included in the Corporations annual management proxy circular, which report shall be approved by the Committee.
Teck Resources Limited |
A-7 |
Schedule B Report of Management and Directors on Reserves Data and Other Information
Management of Teck Resources Limited (the Company) is responsible for the preparation and disclosure of information with respect to the Companys oil and gas activities in accordance with securities regulatory requirements. This information includes reserves data.
Independent qualified reserves evaluators have evaluated the Companys reserves data. The reports of the independent qualified reserves evaluators will be filed with securities regulatory authorities concurrently with this report.
The Reserves Committee of the Board of Directors of the Company composed of a majority of independent directors has:
(a) | reviewed the Companys procedures for providing information to the independent qualified reserves evaluators; |
(b) | met with the independent qualified reserves evaluators to determine whether any restrictions affected the ability of the independent qualified reserves evaluators to report without reservation; and |
(c) | reviewed the reserves data with management and the independent qualified reserves evaluators. |
The Reserves Committee of the Board of Directors has reviewed the Companys procedures for assembling and reporting other information associated with oil and gas activities and has reviewed that information with management. The Board of Directors has, on the recommendation of the Reserves Committee, approved:
(a) | the content and filing with securities regulatory authorities of Form 51-101F1 containing reserves data and other oil and gas information; |
(b) | the filing of Form 51-101F2 which is the report of the independent qualified reserves evaluators on the reserves data; and |
(c) | the content and filing of this report. |
Because the reserves data are based on judgments regarding future events, actual results will vary and the variations may be material.
Donald R. Lindsay
|
Norman B. Keevil III
| |||
(Signed) Donald R. Lindsay |
(Signed) Norman B. Keevil III | |||
Ronald A. Millos
|
Kenneth W. Pickering
| |||
(Signed) Ronald A. Millos Financial Officer |
(Signed) Kenneth W. Pickering
| |||
Date: February 25, 2019 |
Teck Resources Limited |
B-1 |
Schedule C Report on Reserves Data by Independent Qualified
Reserves Evaluator or Auditor
To the Board of Directors of Teck Resources Limited (the Company):
1. | We have evaluated the Companys reserves data as at December 31, 2018. The reserves data are estimates of proved reserves and probable reserves and related future net revenue as at December 31, 2018, estimated using forecast prices and costs. |
2. | The reserves data are the responsibility of the Companys management. Our responsibility is to express an opinion on the reserves data based on our evaluation. |
3. | We carried out our evaluation in accordance with standards set out in the Canadian Oil and Gas Evaluation Handbook as amended from time to time (the COGE Handbook) maintained by the Society of Petroleum Evaluation Engineers (Calgary Chapter). |
4. | Those standards require that we plan and perform an evaluation to obtain reasonable assurance as to whether the reserves data are free of material misstatement. An evaluation also includes assessing whether the reserves data are in accordance with principles and definitions presented in the COGE Handbook. |
5. | The following table shows the net present value of future net revenue (before deduction of income taxes) attributed to proved plus probable reserves, estimated using forecast prices and costs and calculated using a discount rate of 10%, included in the reserves data of the Company evaluated for the year ended December 31, 2018, and identifies the respective portions thereof that we have evaluated and reported on to the Companys Board of Directors: |
Independent Qualified Reserves Evaluator or Auditor |
Effective Date of Evaluation Report |
Location of Reserves (Country or Foreign Geographic Area) |
Net Present Value of Future Net
Revenue |
|||||||||||||||||
Audited |
Evaluated |
Reviewed |
Total | |||||||||||||||||
GLJ Petroleum Consultants |
12/31/2018 | Canada | 1,662 | - | 1,662 |
6. | In our opinion, the reserves data evaluated by us have, in all material respects, been determined and are in accordance with the COGE Handbook, consistently applied. We express no opinion on the reserves data that we reviewed but did not audit or evaluate. |
7. | We have no responsibility to update our reports referred to in paragraph 5 for events and circumstances occurring after the effective date of our reports. |
8. | Because the reserves data are based on judgments regarding future events, actual results will vary and the variations may be material. |
Executed as to our report referred to above:
GLJ Petroleum Consultants Ltd., Calgary, Alberta, Canada, February 11, 2019
Originally Signed By |
Tim R. Freeborn, P. Eng. |
Vice President |
Teck Resources Limited |
C-1 |
Schedule D List of Technical Reports
As required by Form 51-102F2 under National Instrument 51-102, the following table sets out the title, date and author(s) of the current National Instrument 43-101 technical report for each of Tecks material properties. Notwithstanding the authorship of the reports noted below, the scientific and technical information included in this Annual Information Form regarding Tecks mining properties is approved by, and prepared under the supervision of, Rodrigo Marinho, P.Geo., who is an employee of Teck Resources Limited, except for (a) the Antamina property, for which the reserve and resource estimates included in this Annual Information Form is approved by, and prepared under the supervision of Luis Mamani and Lucio Canchis, each SME Registered Members and employees of Compañía Minera Antamina S.A., and (b) the Fording River, Elkview and Greenhills properties, for which the scientific and technical information included in this Annual Information Form is approved by, and prepared under the supervision of. Don Mills, P.Geo., and Robin Gold, P.Eng., who are employees of Teck Coal Limited. Other than Messrs. Mills and Marinho, the authors of the reports below have not prepared or approved the disclosure in this Annual Information Form, and the inclusion of their names below is not intended to imply that they have prepared or approved any such disclosure.
Property
|
Title, Date and Author of Report
| |
Highland Valley Copper Mine | NI 43-101 Technical Report Teck Highland Valley Copper; March 6, 2013; Ronald Graden
| |
Antamina | Technical Report, Mineral Reserves and Resources, Antamina Deposit, Peru; January 31, 2011; Luis Lozada and Jhon Espinoza
| |
Fording | NI 43-101 Technical Report on Coal Resources and Reserves of the Fording River Operations; December 31, 2011; Eric Jensen, Andrew Knight, Don Mills and Barry Musil
| |
Elkview | Technical Report on Coal Resources and Reserves of the Elkview Property; February 28, 2008; Marston Canada Ltd.
| |
Greenhills | NI 43-101 Technical Report on the Mineral Resource and Mineral Reserve Estimates for the Greenhills Operation; February 26, 2016; Andrew J. Knight, Don Mills and Alison J. Seward
| |
Red Dog | NI 43-101 Technical Report, Red Dog Mine, Alaska, USA; February 21, 2017; Thomas Krolak, Kevin Palmer, Brigitte Lacouture and Norman Paley
| |
Quebrada Blanca | NI 43-101 Technical Report on Quebrada Blanca Phase 2, Región de Tarapacá, Chile; February 25, 2019; Rodrigo Marinho, Paul Kolisnyk, Bryan Rairdan and Eldwin Huls
|
Teck Resources Limited |
D-1 |
Exhibit 99.2
Teck Resources Limited
Consolidated Financial Statements
For the Years Ended December 31, 2018 and 2017
Managements Responsibility for Financial Reporting
Management is responsible for the integrity and fair presentation of the financial information contained in this annual report. Where appropriate, the financial information, including financial statements, reflects amounts based on the best estimates and judgments of management. The financial statements have been prepared in accordance with International Financial Reporting Standards as issued by the International Accounting Standards Board. Financial information presented elsewhere in the annual report is consistent with that disclosed in the financial statements.
Management is responsible for establishing and maintaining adequate internal control over financial reporting. Any system of internal control over financial reporting, no matter how well-designed, has inherent limitations. Therefore, even those systems determined to be effective can provide only reasonable assurance with respect to financial statement preparation and presentation. The system of controls is also supported by a professional staff of internal auditors who conduct periodic audits of many aspects of our operations and report their findings to management and the Audit Committee.
Management has a process in place to evaluate internal control over financial reporting based on the criteria established by the Committee of Sponsoring Organizations of the Treadway Commission (COSO) 2013 framework.
The Board of Directors oversees managements responsibility for financial reporting and internal control systems through an Audit Committee, which is composed entirely of independent directors. The Audit Committee meets periodically with management, our internal auditors and independent auditors to review the scope and results of the annual audit, and to review the financial statements and related financial reporting and internal control matters before the financial statements are approved by the Board of Directors and submitted to the shareholders.
PricewaterhouseCoopers LLP, an independent registered public accounting firm, appointed by the shareholders, have audited our financial statements in accordance with the standards of the Public Company Accounting Oversight Board (United States) and have expressed their opinion in the Report of Independent Registered Public Accounting Firm.
Donald R. Lindsay
President and Chief Executive Officer
Ronald A. Millos
Senior Vice President, Finance and Chief Financial Officer
February 12, 2019
Report of Independent Registered Public Accounting Firm
To the Shareholders and Board of Directors of Teck Resources Limited
Opinions on the Financial Statements and Internal Control over Financial Reporting
We have audited the accompanying consolidated balance sheets of Teck Resources Limited and its subsidiaries, (together, the Company) as of December 31, 2018 and 2017, and the related consolidated statements of income, comprehensive income, cash flows, and changes in equity for the years then ended, including the related notes (collectively referred to as the consolidated financial statements). We also have audited the Companys internal control over financial reporting as of December 31, 2018, based on criteria established in Internal Control Integrated Framework (2013) issued by the Committee of Sponsoring Organizations of the Treadway Commission (COSO).
In our opinion, the consolidated financial statements referred to above present fairly, in all material respects, the financial position of the Company as of December 31, 2018 and 2017, and their financial performance and their cash flows for the years then ended in conformity with International Financial Reporting Standards as issued by the International Accounting Standards Board (IFRS). Also in our opinion, the Company maintained, in all material respects, effective internal control over financial reporting as of December 31, 2018, based on criteria established in Internal Control Integrated Framework (2013) issued by the COSO.
Change in Accounting Principles
As discussed in Note 32 to the consolidated financial statements, the Company changed the manner in which it accounts for revenue from contracts with customers and the manner in which it accounts for financial instruments in 2018.
Basis for Opinions
The Companys management is responsible for these consolidated financial statements, for maintaining effective internal control over financial reporting, and for its assessment of the effectiveness of internal control over financial reporting, included in Managements Report on Internal Control Over Financial Reporting, appearing in Managements Discussion and Analysis. Our responsibility is to express opinions on the Companys consolidated financial statements and on the Companys internal control over financial reporting based on our audits. We are a public accounting firm registered with the Public Company Accounting Oversight Board (United States) (PCAOB) and are required to be independent with respect to the Company in accordance with the U.S. federal securities laws and the applicable rules and regulations of the Securities and Exchange Commission and the PCAOB.
We conducted our audits in accordance with the standards of the PCAOB. Those standards require that we plan and perform the audits to obtain reasonable assurance about whether the consolidated financial statements are free of material misstatement, whether due to error or fraud, and whether effective internal control over financial reporting was maintained in all material respects.
Our audits of the consolidated financial statements included performing procedures to assess the risks of material misstatement of the consolidated financial statements, whether due to error or fraud, and performing procedures that respond to those risks. Such procedures included examining, on a test basis, evidence regarding the amounts and disclosures in the consolidated financial statements. Our audits also included evaluating the accounting principles used and significant estimates made by management, as well as evaluating the overall presentation of the consolidated financial statements. Our audit of internal control over financial reporting included obtaining an understanding of internal control over financial reporting, assessing the risk that a material weakness exists, and testing and evaluating the design and operating effectiveness of internal control based on the assessed risk. Our audits also included performing such other procedures as we considered necessary in the circumstances. We believe that our audits provide a reasonable basis for our opinions.
Definition and Limitations of Internal Control over Financial Reporting
A companys internal control over financial reporting is a process designed to provide reasonable assurance regarding the reliability of financial reporting and the preparation of financial statements for external purposes in accordance with generally accepted accounting principles. A companys internal control over financial reporting includes those policies and procedures that (i) pertain to the maintenance of records that, in reasonable detail, accurately and fairly reflect the transactions and dispositions of the assets of the company; (ii) provide reasonable assurance that transactions are recorded as necessary to permit preparation of financial statements in accordance with generally accepted accounting principles, and that receipts and expenditures of the company are being made only in accordance with authorizations of management and directors of the company; and (iii) provide reasonable assurance regarding prevention or timely detection of unauthorized acquisition, use, or disposition of the companys assets that could have a material effect on the financial statements.
Because of its inherent limitations, internal control over financial reporting may not prevent or detect misstatements. Also, projections of any evaluation of effectiveness to future periods are subject to the risk that controls may become inadequate because of changes in conditions, or that the degree of compliance with the policies or procedures may deteriorate.
Chartered Professional Accountants
Vancouver, Canada
February 12, 2019
We have served as the Companys auditor since 1964.
Teck Resources Limited
Consolidated Statements of Income
Years ended December 31
2018 | 2017 | |||||||
(CAD$ in millions, except for share data) |
|
(restated) | ||||||
Revenues (Note 6) |
$ | 12,564 | $ | 11,910 | ||||
Cost of sales |
(7,943 | ) | (7,343 | ) | ||||
|
|
|
|
|||||
Gross profit |
4,621 | 4,567 | ||||||
Other operating income (expenses) |
||||||||
General and administration |
(142 | ) | (116 | ) | ||||
Exploration |
(69 | ) | (58 | ) | ||||
Research and development |
(35 | ) | (55 | ) | ||||
Impairment reversal and (asset impairments) (Note 8) |
(41 | ) | 163 | |||||
Other operating income (expense) (Note 9) |
450 | (230 | ) | |||||
|
|
|
|
|||||
Profit from operations |
4,784 | 4,271 | ||||||
Finance income (Note 10) |
33 | 17 | ||||||
Finance expense (Note 10) |
(252 | ) | (229 | ) | ||||
Non-operating income (expense) (Note 11) |
(52 | ) | (151 | ) | ||||
Share of income (loss) of associates and joint ventures (Note 15) |
(3 | ) | 6 | |||||
|
|
|
|
|||||
Profit before taxes |
4,510 | 3,914 | ||||||
Provision for income taxes (Note 20) |
(1,365 | ) | (1,425 | ) | ||||
|
|
|
|
|||||
Profit for the year |
$ | 3,145 | $ | 2,489 | ||||
|
|
|
|
|||||
Profit attributable to: |
||||||||
Shareholders of the company |
$ | 3,107 | $ | 2,460 | ||||
Non-controlling interests |
38 | 29 | ||||||
|
|
|
|
|||||
Profit for the year |
$ | 3,145 | $ | 2,489 | ||||
|
|
|
|
|||||
Earnings per share (Note 23(f)) |
||||||||
Basic |
$ | 5.41 | $ | 4.26 | ||||
Diluted |
$ | 5.34 | $ | 4.19 | ||||
Weighted average shares outstanding (millions) |
573.9 | 577.5 | ||||||
Weighted average diluted shares outstanding (millions) |
582.1 | 586.4 | ||||||
Shares outstanding at end of year (millions) |
570.7 | 573.3 | ||||||
|
|
|
|
The accompanying notes are an integral part of these financial statements. Certain 2017 amounts have been restated for the adoption of new accounting pronouncements (Note 32).
5
Teck Resources Limited
Consolidated Statements of Comprehensive Income
Years ended December 31
2018 | 2017 | |||||||
(CAD$ in millions) |
|
(restated) | ||||||
Profit for the year |
$ | 3,145 | $ | 2,489 | ||||
Other comprehensive income (loss) in the year |
||||||||
Items that may be reclassified to profit |
||||||||
Currency translation differences (net of taxes of $40 and $(46)) |
393 | (203 | ) | |||||
Change in fair value of debt securities (2017 change in fair value of available-for-sale financial instruments) (net of taxes of $nil and $2) |
| (10 | ) | |||||
Share of other comprehensive loss of associates and joint ventures (Note 15) |
| (1 | ) | |||||
|
|
|
|
|||||
393 | (214 | ) | ||||||
Items that will not be reclassified to profit |
||||||||
Change in fair value of marketable equity securities (net of taxes of $1 and $nil) |
(9 | ) | | |||||
Remeasurements of retirement benefit plans (net of taxes of $(2) and $(55)) |
8 | 129 | ||||||
|
|
|
|
|||||
(1 | ) | 129 | ||||||
|
|
|
|
|||||
Total other comprehensive income (loss) for the year |
392 | (85 | ) | |||||
|
|
|
|
|||||
Total comprehensive income for the year |
$ | 3,537 | $ | 2,404 | ||||
|
|
|
|
|||||
Total other comprehensive income (loss) attributable to: |
||||||||
Shareholders of the company |
$ | 382 | $ | (77 | ) | |||
Non-controlling interests |
10 | (8 | ) | |||||
|
|
|
|
|||||
$ | 392 | $ | (85 | ) | ||||
|
|
|
|
|||||
Total comprehensive income attributable to: |
||||||||
Shareholders of the company |
$ | 3,489 | $ | 2,383 | ||||
Non-controlling interests |
48 | 21 | ||||||
|
|
|
|
|||||
$ | 3,537 | $ | 2,404 | |||||
|
|
|
|
The accompanying notes are an integral part of these financial statements. Certain 2017 amounts have been restated for the adoption of new accounting pronouncements (Note 32).
6
Teck Resources Limited
Consolidated Statements of Cash Flows
Years ended December 31
2018 | 2017 | |||||||
(CAD$ in millions) |
|
(restated) | ||||||
Operating activities |
||||||||
Profit for the year |
$ | 3,145 | $ | 2,489 | ||||
Depreciation and amortization |
1,483 | 1,492 | ||||||
Provision for income taxes |
1,365 | 1,425 | ||||||
Asset impairments (impairment reversal) |
41 | (163 | ) | |||||
Gain on sale of investments and assets |
(892 | ) | (51 | ) | ||||
Foreign exchange gains |
(16 | ) | (5 | ) | ||||
Loss on debt repurchase |
26 | 216 | ||||||
Loss (gain) on debt prepayment options |
42 | (51 | ) | |||||
Net finance expense |
219 | 212 | ||||||
Income taxes paid |
(780 | ) | (879 | ) | ||||
Other |
(166 | ) | 195 | |||||
Net change in non-cash working capital items |
(29 | ) | 169 | |||||
|
|
|
|
|||||
4,438 | 5,049 | |||||||
Investing activities |
||||||||
Expenditures on property, plant and equipment |
(1,906 | ) | (1,621 | ) | ||||
Capitalized production stripping costs |
(707 | ) | (678 | ) | ||||
Expenditures on investments and other assets |
(284 | ) | (309 | ) | ||||
Proceeds from investments and assets |
1,292 | 126 | ||||||
|
|
|
|
|||||
(1,605 | ) | (2,482 | ) | |||||
Financing activities |
||||||||
Repurchase and repayment of debt |
(1,410 | ) | (1,929 | ) | ||||
Debt interest and finance charges paid |
(407 | ) | (495 | ) | ||||
Issuance of Class B subordinate voting shares |
54 | 26 | ||||||
Purchase and cancellation of Class B subordinate voting shares |
(189 | ) | (175 | ) | ||||
Dividends paid |
(172 | ) | (344 | ) | ||||
Distributions to non-controlling interests |
(40 | ) | (56 | ) | ||||
|
|
|
|
|||||
(2,164 | ) | (2,973 | ) | |||||
Effect of exchange rate changes on cash and cash equivalents |
113 | (49 | ) | |||||
|
|
|
|
|||||
Increase (decrease) in cash and cash equivalents |
782 | (455 | ) | |||||
Cash and cash equivalents at beginning of year |
952 | 1,407 | ||||||
|
|
|
|
|||||
Cash and cash equivalents at end of year |
$ | 1,734 | $ | 952 | ||||
|
|
|
|
Supplemental cash flow information (Note 12)
The accompanying notes are an integral part of these financial statements. Certain 2017 amounts have been restated for the adoption of new accounting pronouncements (Note 32).
7
Teck Resources Limited
Consolidated Balance Sheets
December 31, 2018 |
December 31, 2017 |
January 1, 2017 |
||||||||||
(CAD$ in millions) |
|
(restated) | (restated) | |||||||||
ASSETS |
||||||||||||
Current assets |
||||||||||||
Cash and cash equivalents (Note 12) |
$ | 1,734 | $ | 952 | $ | 1,407 | ||||||
Current income taxes receivable |
78 | 48 | 97 | |||||||||
Trade and settlement receivables |
1,180 | 1,419 | 1,413 | |||||||||
Inventories (Note 13) |
2,065 | 1,669 | 1,673 | |||||||||
Prepaids and other current assets |
260 | 310 | 172 | |||||||||
Assets held for sale (Note 5 (b)) |
| 350 | | |||||||||
|
|
|
|
|
|
|||||||
5,317 | 4,748 | 4,762 | ||||||||||
Financial and other assets (Note 14) |
907 | 1,051 | 1,034 | |||||||||
Investments in associates and joint ventures (Note 15) |
1,071 | 943 | 1,012 | |||||||||
Property, plant and equipment (Note 8 and Note 16) |
31,050 | 29,045 | 27,595 | |||||||||
Deferred income tax assets (Note 20) |
160 | 154 | 112 | |||||||||
Goodwill (Note 8 and Note 17) |
1,121 | 1,087 | 1,114 | |||||||||
|
|
|
|
|
|
|||||||
$ | 39,626 | $ | 37,028 | $ | 35,629 | |||||||
|
|
|
|
|
|
|||||||
LIABILITIES AND EQUITY |
||||||||||||
Current liabilities |
||||||||||||
Trade accounts payable and other liabilities (Note 18) |
$ | 2,333 | $ | 2,290 | $ | 1,870 | ||||||
Current income taxes payable |
151 | 268 | 199 | |||||||||
Debt (Note 19) |
32 | 55 | 99 | |||||||||
|
|
|
|
|
|
|||||||
2,516 | 2,613 | 2,168 | ||||||||||
Debt (Note 19) |
5,487 | 6,314 | 8,244 | |||||||||
Deferred income tax liabilities (Note 20) |
6,331 | 5,579 | 5,086 | |||||||||
Retirement benefit liabilities (Note 21) |
482 | 552 | 643 | |||||||||
Provisions and other liabilities (Note 22) |
1,792 | 1,977 | 1,322 | |||||||||
|
|
|
|
|
|
|||||||
16,608 | 17,035 | 17,463 | ||||||||||
Equity |
||||||||||||
Attributable to shareholders of the company |
22,884 | 19,851 | 18,007 | |||||||||
Attributable to non-controlling interests (Note 24) |
134 | 142 | 159 | |||||||||
|
|
|
|
|
|
|||||||
23,018 | 19,993 | 18,166 | ||||||||||
|
|
|
|
|
|
|||||||
$ | 39,626 | $ | 37,028 | $ | 35,629 | |||||||
|
|
|
|
|
|
|||||||
Contingencies (Note 25) |
||||||||||||
Commitments (Note 26) |
The accompanying notes are an integral part of these financial statements. Certain 2017 amounts have been restated for the adoption of new accounting pronouncements (Note 32).
Approved on behalf of the Board of Directors
Tracey L. McVicar |
Una M. Power | |||
Tracey L. McVicar | Una M. Power | |||
Chair of the Audit Committee | Director |
8
Teck Resources Limited
Consolidated Statements of Changes in Equity
Years ended December 31
2018 | 2017 | |||||||
(CAD$ in millions) |
|
(restated) | ||||||
Class A common shares (Note 23) |
||||||||
Beginning of year |
$ | 6 | $ | 7 | ||||
Class A shares conversion (Note 23(b)) |
| (1 | ) | |||||
|
|
|
|
|||||
End of year |
6 | 6 | ||||||
Class B subordinate voting shares (Note 23) |
||||||||
Beginning of year |
6,603 | 6,637 | ||||||
Share repurchases (Note 23(h)) |
(77 | ) | (69 | ) | ||||
Issued on exercise of options (Note 23(c)) |
69 | 34 | ||||||
Class A shares conversion (Note 23(b)) |
| 1 | ||||||
|
|
|
|
|||||
End of year |
6,595 | 6,603 | ||||||
Retained earnings |
||||||||
Beginning of year |
12,796 | 10,720 | ||||||
IFRS 9 transition adjustment on January 1, 2018 (Note 32(c)) |
34 | | ||||||
Profit for the year attributable to shareholders of the company |
3,107 | 2,460 | ||||||
Dividends paid (Note 23(g)) |
(172 | ) | (344 | ) | ||||
Share repurchases (Note 23(h)) |
(119 | ) | (106 | ) | ||||
Purchase of non-controlling interests (Note 5(a)) |
(159 | ) | (63 | ) | ||||
Remeasurements of retirement benefit plans |
8 | 129 | ||||||
|
|
|
|
|||||
End of year |
15,495 | 12,796 | ||||||
Contributed surplus |
||||||||
Beginning of year |
202 | 193 | ||||||
Share option compensation expense (Note 23(c)) |
17 | 17 | ||||||
Transfer to Class B subordinate voting shares on exercise of options |
(15 | ) | (8 | ) | ||||
|
|
|
|
|||||
End of year |
204 | 202 | ||||||
Accumulated other comprehensive income attributable to shareholders of the company (Note 23(e)) |
||||||||
Beginning of year |
244 | 450 | ||||||
IFRS 9 transition adjustment on January 1, 2018 (Note 32(c)) |
(34 | ) | | |||||
Other comprehensive income (loss) |
382 | (77 | ) | |||||
Less remeasurements of retirement benefit plans recorded in retained earnings |
(8 | ) | (129 | ) | ||||
|
|
|
|
|||||
End of year |
584 | 244 | ||||||
Non-controlling interests (Note 24) |
||||||||
Beginning of year |
142 | 159 | ||||||
Profit for the year attributable to non-controlling interests |
38 | 29 | ||||||
Other comprehensive income (loss) attributable to non-controlling interests |
10 | (8 | ) | |||||
Purchase of non-controlling interests (Note 5(a)) |
(16 | ) | | |||||
Acquisition of AQM Copper Inc. |
| 18 | ||||||
Dividends or distributions |
(40 | ) | (56 | ) | ||||
|
|
|
|
|||||
End of year |
134 | 142 | ||||||
|
|
|
|
|||||
Total equity |
$ | 23,018 | $ | 19,993 | ||||
|
|
|
|
The accompanying notes are an integral part of these financial statements. Certain 2017 amounts have been restated for the adoption of new accounting pronouncements (Note 32).
9
Notes to Consolidated Financial Statements
Years ended December 31, 2018 and 2017
1. | Nature of Operations |
Teck Resources Limited and its subsidiaries (Teck, we, us or our) are engaged in mining and related activities including research, exploration and development, processing, smelting, refining and reclamation. Our major products are steelmaking coal, copper, zinc and blended bitumen. We also produce precious metals, molybdenum, fertilizers and other metals. Metal products are sold as refined metals or concentrates.
Teck Resources Limited is a Canadian corporation and our registered office is at 550 Burrard Street, Vancouver, British Columbia, Canada, V6C 0B3.
2. | Basis of Preparation and New IFRS Pronouncements |
a) | Basis of Preparation |
These annual consolidated financial statements have been prepared by management in accordance with International Financial Reporting Standards (IFRS) as issued by the International Accounting Standards Board (IASB) and were approved by the Board of Directors on February 12, 2019.
We adopted IFRS 15, Revenue from Contracts with Customers (IFRS 15) and IFRS 9, Financial Instruments (IFRS 9), which became effective January 1, 2018. Effective October 1, 2018, we also adopted the hedging requirements section of IFRS 9. Note 32 discloses the effects of the adoption of these new IFRS pronouncements for all periods presented, including the nature and effect of changes in accounting policies.
b) | New IFRS Pronouncements |
New IFRS pronouncements that have been issued but are not yet effective at the date of these financial statements are listed below. We plan to apply the new standards or interpretations in the annual period for which they are first required.
Leases
The IASB issued IFRS 16, Leases (IFRS 16), which eliminates the classification of leases as either operating or finance leases for a lessee. IFRS 16 is effective from January 1, 2019. Under IFRS 16, all leases will be recorded on the balance sheet for the lessee. The only exemptions to this will be for leases that are 12 months or less in duration or for leases of low-value assets. The requirement to record all leases on the balance sheet under IFRS 16 will increase right-of-use assets and lease liabilities on an entitys financial statements. IFRS 16 will also change the nature of expenses relating to leases, as the straight-line lease expense previously recognized for operating leases will be replaced with depreciation expense for right-of-use assets and finance expense for lease liabilities. IFRS 16 includes an overall disclosure objective and requires a company to disclose (a) information about right-of-use assets and expenses and cash flows related to leases, (b) a maturity analysis of lease liabilities, and (c) any additional company-specific information that is relevant to satisfying the disclosure objective.
As at December 31, 2018, our review and assessment of IFRS 16 and the effect on our financial statements is nearing completion. Our work around identification of leases is substantially complete and we are currently finalizing our calculation and review of the lease balances under the requirements of IFRS 16. We are also reviewing our processes and internal controls to ensure leases are properly identified and accounted for going forward. We will apply IFRS 16 as at January 1, 2019 using a cumulative catch-up approach where we will record leases prospectively from that date forward and will not restate comparative information. We will record right-of-use assets based on the lease liabilities determined as at January 1, 2019 and as a result, will not have a retained earnings adjustment on transition.
10
2. | Basis of Preparation and New IFRS Pronouncements (continued) |
Conceptual Framework
In March 2018, the IASB issued a comprehensive set of concepts for financial reporting, the revised Conceptual Framework for Financial Reporting (revised Conceptual Framework), replacing the previous version of the Conceptual Framework issued in 2010. The purpose of the revised Conceptual Framework is to assist preparers of financial reports to develop consistent accounting policies for transactions or other events when no IFRS applies or IFRS allows a choice of accounting policies and to assist all parties to understand and interpret IFRS.
The revised Conceptual Framework sets out the objective of general purpose financial reporting; the qualitative characteristics of useful financial information; a description of the reporting entity and its boundary; definitions of an asset, a liability, equity, income and expenses and guidance on when to derecognize them; measurement bases and guidance on when to use them; concepts and guidance on presentation and disclosure; and concepts relating to capital and capital maintenance. The revised Conceptual Framework provides concepts and guidance that underpin the decisions the IASB makes when developing standards but is not in itself an IFRS standard and does not override any IFRS standard or any requirement of an IFRS standard. The revised Conceptual Framework is applicable to annual periods beginning on or after January 1, 2020 for preparers who develop an accounting policy based on the Conceptual Framework. We are currently assessing the effect of the revised Conceptual Framework on our financial statements.
3. | Summary of Significant Accounting Policies |
The significant accounting policies applied in the preparation of these consolidated financial statements are set out below. These policies have been consistently applied to all periods presented, unless otherwise stated.
Basis of Presentation
Our consolidated financial statements include the accounts of Teck Resources Limited and all of its subsidiaries. Our significant operating subsidiaries include Teck Metals Ltd. (TML), Teck Alaska Incorporated (TAK), Teck Highland Valley Copper Partnership (Highland Valley Copper), Teck Coal Partnership (Teck Coal), Teck Washington Incorporated (TWI), Compañía Minera Teck Quebrada Blanca S.A. (QBSA or Quebrada Blanca) and Compañía Minera Teck Carmen de Andacollo (Carmen de Andacollo).
All subsidiaries are entities that we control, either directly or indirectly. Control is defined as the exposure, or rights, to variable returns from involvement with an investee and the ability to affect those returns through power over the investee. Power over an investee exists when our existing rights give us the ability to direct the activities that significantly affect the investees returns. This control is generally evidenced through owning more than 50% of the voting rights or currently exercisable potential voting rights of a companys share capital. All of our intra-group balances and transactions, including unrealized profits and losses arising from intra-group transactions, have been eliminated in full. For subsidiaries that we control but do not own 100% of, the net assets and net profit attributable to outside shareholders are presented as amounts attributable to non-controlling interests in the consolidated balance sheet and consolidated statements of income and comprehensive income.
Certain of our business activities are conducted through joint arrangements. Our interests in joint operations include Galore Creek Partnership (Galore Creek, 50% share) and Fort Hills Energy L.P. (Fort Hills, 21.3% share), which operate in Canada, and Compañia Minera Antamina S.A. (Antamina, 22.5% share), which operates in Peru. We account for our interests in these joint operations by recording our share of the respective assets, liabilities, revenue, expenses and cash flows. We also have an interest in a joint venture, NuevaUnión SPA (NuevaUnión, 50% share), in Chile that we account for using the equity method (Note 15).
During the year ended December 31, 2018, our share of the Fort Hills oil sands mine increased from 20.89% to 21.3% on resolution of a commercial dispute between the Fort Hills partners. We funded an increased share of the project capital in the amount of $58 million, as consideration for the additional interest in the project.
All dollar amounts are presented in Canadian dollars unless otherwise specified.
11
3. | Summary of Significant Accounting Policies (continued) |
Interests in Joint Arrangements
A joint arrangement can take the form of a joint venture or joint operation. All joint arrangements involve a contractual arrangement that establishes joint control, which exists only when decisions about the activities that significantly affect the returns of the investee require unanimous consent of the parties sharing control. A joint operation is a joint arrangement in which we have rights to the assets and obligations for the liabilities relating to the arrangement. A joint venture is a joint arrangement in which we have rights to only the net assets of the arrangement.
Joint ventures are accounted for in accordance with the policy Investments in Associates and Joint Ventures. Joint operations are accounted for by recognizing our share of the assets, liabilities, revenue, expenses and cash flows of the joint operation in our consolidated financial statements.
Investments in Associates and Joint Ventures
Investments over which we exercise significant influence but do not control or jointly control are associates. Investments in associates are accounted for using the equity method, except when classified as held for sale. Investments in joint ventures as determined in accordance with the policy Interests in Joint Arrangements are also accounted for using the equity method.
The equity method involves recording the initial investment at cost and subsequently adjusting the carrying value of the investment for our proportionate share of the profit or loss, other comprehensive income or loss and any other changes in the associates or joint ventures net assets, such as further investments or dividends.
Our proportionate share of the associates or joint ventures profit or loss and other comprehensive income or loss is based on its most recent financial statements. Adjustments are made to align any inconsistencies between our accounting policies and our associates or joint ventures policies before applying the equity method. Adjustments are also made to account for depreciable assets based on their fair values at the acquisition date of the investment and for any impairment losses recognized by the associate or joint venture.
If our share of the associates or joint ventures losses were equal to or exceeded our investment in the associate or joint venture, recognition of further losses would be discontinued. After our interest is reduced to zero, additional losses would be provided for and a liability recognized only to the extent that we have incurred legal or constructive obligations to provide additional funding or make payments on behalf of the associate or joint venture. If the associate or joint venture subsequently reports profits, we resume recognizing our share of those profits only when we have a positive interest in the entity.
At each balance sheet date, we consider whether there is objective evidence of impairment in associates and joint ventures. If there is such evidence, we determine the amount of impairment to record, if any, in relation to the associate or joint venture.
Foreign Currency Translation
The functional currency of each of our subsidiaries and our joint operations, joint ventures and associates is the currency of the primary economic environment in which the entity operates. Transactions in foreign currencies are translated to the functional currency of the entity at the exchange rate in existence at the date of the transaction. Monetary assets and liabilities denominated in foreign currencies at the balance sheet date are retranslated at the period end date exchange rates.
The functional currency of Teck Resources Limited, the parent entity, is the Canadian dollar, which is also the presentation currency of our consolidated financial statements.
Foreign operations are translated from their functional currencies, generally the U.S. dollar, into Canadian dollars on consolidation. Items in the statements of income and other comprehensive income are translated using weighted average exchange rates that reasonably approximate the exchange rate at the transaction date. Items on the balance sheet are translated at the closing spot exchange rate. Exchange differences on the translation of the net assets of entities with functional currencies other than the Canadian dollar, and any offsetting exchange differences on net debt used to hedge those assets, are recognized in a separate component of equity through other comprehensive income (loss).
12
3. | Summary of Significant Accounting Policies (continued) |
Exchange differences that arise relating to long-term intra-group balances that form part of the net investment in a foreign operation are also recognized in this separate component of equity through other comprehensive income (loss).
On disposition or partial disposition of a foreign operation, the cumulative amount of related exchange differences recorded in a separate component of equity is recognized in the statement of income.
Revenue
Our revenue consists of sales of steelmaking coal, copper, zinc and lead concentrates, refined zinc, lead and silver, and blended bitumen. We also sell other by-products, including molybdenum concentrates, various refined specialty metals, chemicals and fertilizers. Our performance obligations relate primarily to the delivery of these products to our customers, with each separate shipment representing a separate performance obligation.
Revenue, including revenue from the sale of by-products, is recognized at the point in time when the customer obtains control of the product. Control is achieved when a product is delivered to the customer, we have a present right to payment for the product, significant risks and rewards of ownership have transferred to the customer according to contract terms and there is no unfulfilled obligation that could affect the customers acceptance of the product.
Steelmaking coal
For steelmaking coal, control of the product generally transfers to the customer when an individual shipment parcel is loaded onto a carrier accepted or directly contracted by the customer. For a majority of steelmaking coal sales we are not responsible for the provision of shipping or product insurance after the transfer of control. For certain sales we arrange shipping on behalf of our customers and are agent to these shipping transactions.
Steelmaking coal is sold under spot or average pricing contracts. For spot price contracts, pricing is final when revenue is recognized. For average pricing contracts, the final pricing is determined based on quoted steelmaking coal price assessments over a specific period. Control of the goods may transfer and revenue may be recognized before, during or subsequent to the period in which final average pricing is determined. For all steelmaking coal sales under average pricing contracts where pricing is not finalized when revenue is recognized, revenue is recorded based on estimated consideration to be received at the date of sale with reference to steelmaking coal price assessments. For average pricing contracts, adjustments are made to settlement receivables in subsequent periods based on published price assessments up to the date of final pricing. This adjustment mechanism is based on the market price of the commodity and accordingly, the changes in value of the settlement receivables are not considered to be revenue from contracts with customers. The changes in fair value of settlement receivables are recorded in other operating income (expense).
Steelmaking coal sales are billed based on final quality measures upon the passage of control to the customer. If pricing is not finalized when control of the product is transferred, a subsequent invoice is issued when pricing is finalized. The payment terms generally require prompt collection from customers; however, payment terms are customer specific and subject to change based on market conditions and other factors. We generally retain title to these products until we receive the first contracted payment, which is typically received shortly after loading, solely to manage the credit risk of the amounts due to us. This retention of title does not preclude the customer from obtaining control of the product.
Base metal concentrates
For copper, lead and zinc concentrates, control of the product generally transfers to the customer when an individual shipment parcel is loaded onto a carrier accepted by the customer. We sell a majority of our concentrates on commercial terms where we are responsible for providing freight services after the date at which control of the product passes to the customer. We are the principal to this freight performance obligation. A minority of zinc and lead concentrate sales are made on consignment. For consignment transactions, control of the product transfers to the customer and revenue is recognized at the time the product is consumed in the customers process.
13
3. | Summary of Significant Accounting Policies (continued) |
The majority of our metal concentrates are sold under pricing arrangements where final prices are determined by quoted market prices in a period subsequent to the date of sale. For these sales, revenue is recorded based on the estimated consideration to be received at the date of sale with reference to relevant commodity market prices. Adjustments are made to settlement receivables in subsequent periods based on movements in quoted commodity prices up to the date of final pricing. This adjustment mechanism is based on the market price of the commodity and accordingly, the changes in value of the settlement receivables are not considered to be revenue from contracts with customers. The changes in fair value of settlement receivables are recorded in other operating income (expense).
Metal concentrate sales are billed based on provisional weights and assays upon the passage of control to the customer. The first provisional invoice is billed to the customer at the time of transfer of control. As final prices, weights and assays are received, additional invoices are issued and collected. In general, consideration is promptly collected from customers; however, the payment terms are customer specific and subject to change based on market conditions and other factors. We generally retain title to these products until we receive the first contracted payment, which is typically received shortly after loading, solely to manage the credit risk of the amounts due to us. This retention of title does not preclude the customer from obtaining control of the product.
Refined metals
For sales of refined metals, chemicals and fertilizers, control of the product transfers to the customer when the product is loaded onto a carrier specified by the customer. For these products, loading generally coincides with the transfer of title.
Our refined metals, chemicals and fertilizers are sold under spot or average pricing contracts. For spot sales contracts, pricing is final when revenue is recognized. For refined metal sales contracts where pricing is not finalized when revenue is recognized, revenue is recorded based on the estimated consideration to be received at the date of sale with reference to commodity market prices. Adjustments are made to settlement receivables in subsequent periods based on movements in quoted commodity prices up to the date of final pricing. This adjustment mechanism is based on the market price of the commodity and accordingly, the changes in value of the settlement receivables are not considered to be revenue from contracts with customers. The changes in fair value of settlement receivables are recorded in other operating income (expense).
We sell a portion of our refined metals on commercial terms where we are responsible for providing freight services after the date at which control of the product passes to the customer. We are the principal to this freight performance obligation.
Refined metal sales are billed based on final specification measures upon the passage of control to the customer. If pricing is not finalized when control of the product is transferred, a subsequent invoice is issued when pricing is finalized.
In general, consideration is promptly collected from customers; however, the payment terms are customer specific and subject to change based on market conditions and other factors.
Blended bitumen
For blended bitumen, control of the product generally transfers to the customer when the product passes the delivery point as specified in the contract, which normally coincides with title and risk transfer to the customer. The majority of our blended bitumen is sold under pricing arrangements where final prices are determined based on commodity price indices that are finalized at or near the date of sale. Payments for blended bitumen sales are usually due and settled within 30 days. Our revenue for blended bitumen is net of royalty payments to governments.
Financial Instruments
The following financial instruments accounting policies have been applied as at January 1, 2018 on adoption of IFRS 9 and for the year ended December 31, 2018. For the year ended December 31, 2017, we applied financial instruments policies aligned with IAS 39, Financial Instruments Recognition and Measurement (IAS 39). Note 32 outlines the policy changes required to our IAS 39 polices to meet the IFRS 9 requirements, effective January 1, 2018.
We recognize financial assets and liabilities on the balance sheet when we become a party to the contractual provisions of the instrument.
14
3. | Summary of Significant Accounting Policies (continued) |
Cash and cash equivalents
Cash and cash equivalents include cash on account, demand deposits and money market investments with maturities from the date of acquisition of three months or less, which are readily convertible to known amounts of cash and are subject to insignificant changes in value. Cash is classified as a financial asset that is subsequently measured at amortized cost. Cash equivalents are classified as subsequently measured at amortized cost, except for money market investments, which are classified as subsequently measured at fair value through profit or loss.
Trade receivables
Trade receivables relate to amounts received from sales under our spot pricing contracts for steelmaking coal, refined metals, blended bitumen, chemicals and fertilizers. These receivables are non-interest bearing and are recognized at face amount, except when fair value is materially different, and are subsequently measured at amortized cost. Trade receivables recorded are net of lifetime expected credit losses.
Settlement receivables
Settlement receivables arise from average pricing steelmaking coal contracts and base metal concentrate sales contracts where amounts receivable vary based on steelmaking coal price assessments or underlying commodity prices. Settlement receivables are classified as fair value through profit or loss and are recorded at fair value at each reporting period based on published price assessments or quoted commodity prices up to the date of final pricing. The changes in fair value are recorded in other operating income (expense).
Investments in marketable equity securities
Investments in marketable equity securities are classified, at our election, as subsequently measured at fair value through other comprehensive income. For new investments in marketable equity securities, we can elect the same classification as subsequently measured at fair value through other comprehensive income, or we can elect to classify an investment as at fair value through profit or loss. This election can be made on an investment-by-investment basis and is irrevocable. Investment transactions are recognized on the trade date with transaction costs included in the underlying balance. Fair values are determined by reference to quoted market prices at the balance sheet date.
When investments in marketable equity securities are disposed of, the cumulative gains and losses recognized in other comprehensive income (loss) are not recycled to profit and remain within equity. Dividends are recognized in profit and these investments are not assessed for impairment.
Investments in debt securities
Investments in debt securities are classified as subsequently measured at fair value through other comprehensive income and recorded at fair value. Investment transactions are recognized on the trade date with transaction costs included in the underlying balance. Fair values are determined by reference to quoted market prices at the balance sheet date.
Unrealized gains and losses on debt securities are recognized in other comprehensive income (loss) until investments are disposed of and the cumulative gains and losses recognized in other comprehensive income (loss) are reclassified from equity to profit at that time. Loss allowances and interest income are recognized in profit.
Trade payables
Trade payables are non-interest bearing if paid when due and are recognized at face amount, except when fair value is materially different. Trade payables are subsequently measured at amortized cost.
Debt
Debt is initially recorded at fair value, less transaction costs. Debt is subsequently measured at amortized cost, calculated using the effective interest rate method.
15
3. | Summary of Significant Accounting Policies (continued) |
Derivative instruments
Derivative instruments, including embedded derivatives in executory contracts or financial liability contracts, are classified as at fair value through profit or loss and, accordingly, are recorded on the balance sheet at fair value. Unrealized gains and losses on derivatives not designated in a hedging relationship are recorded as part of other operating income (expense) or non-operating income (expense) in profit depending on the nature of the derivative. Fair values for derivative instruments are determined using inputs based on market conditions existing at the balance sheet date or settlement date of the derivative. Derivatives embedded in non-derivative contracts are recognized separately unless they are closely related to the host contract.
Expected credit losses
For trade receivables, we apply the simplified approach to determining expected credit losses, which requires expected lifetime losses to be recognized upon initial recognition of the receivables.
Loss allowances on investments in debt securities are initially assessed based on the expected 12-month credit losses. At each reporting date, we assess whether the credit risk for our debt securities has increased significantly since initial recognition. If the credit risk has increased significantly since initial recognition, the loss allowance is adjusted to be based on the lifetime expected credit losses.
Hedging
Certain derivative investments may qualify for hedge accounting. At inception of hedge relationships, we document the economic relationship between hedging instruments and hedged items and our risk management objective and strategy for undertaking the hedge transactions.
For fair value hedges, any gains or losses on both the hedged item and the hedging instrument are recognized in the same line item in profit.
For cash flow hedges, any unrealized gains and losses on the hedging instrument relating to the effective portion of the hedge are initially recorded in other comprehensive income (loss). Gains and losses are recognized in profit upon settlement of the hedging instrument, when the hedged item ceases to exist, or when the hedge is determined to be ineffective.
For hedges of net investments in foreign operations, any foreign exchange gains or losses on the hedging instrument relating to the effective portion of the hedge are initially recorded in other comprehensive income (loss). Gains and losses are recognized in profit on the ineffective portion of the hedge, or when there is a disposition or partial disposition of a foreign operation being hedged.
Inventories
Finished products, work in process, raw materials and supplies inventories are valued at the lower of weighted average cost and net realizable value. Raw materials include concentrates for use at smelting and refining operations. Work in process inventory includes inventory in the milling, smelting or refining process and stockpiled ore at mining operations. For our oil sands mine, raw materials consist of diluent used in blending, work in process inventory consists of raw bitumen and finished products consist of blended bitumen.
For work in process and finished product inventories, cost includes all direct costs incurred in production, including direct labour and materials, freight, depreciation and amortization, and directly attributable overhead costs. Production stripping costs that are not capitalized are included in the cost of inventories as incurred. Depreciation and amortization of capitalized production stripping costs are included in the cost of inventory.
When inventories have been written down to net realizable value, we make a new assessment of net realizable value in each subsequent period. If the circumstances that caused the write-down no longer exist, the remaining amount of the write-down on inventory not yet sold is reversed.
16
3. | Summary of Significant Accounting Policies (continued) |
We use both joint-product and by-product costing for work in process and finished product inventories. Joint-product costing is applied to primary products where the profitability of the operations is dependent upon the production of these products. Joint-product costing allocates total production costs based on the relative values of the products. By-product costing is used for products that are not the primary products produced by the operation. The by-products are allocated only the incremental costs of processes that are specific to the production of that product.
Supplies inventory is valued at the lower of weighted average cost and net realizable value. Cost includes acquisition, freight and other directly attributable costs.
Property, Plant and Equipment
Land, buildings, plant and equipment
Land is recorded at cost and buildings, plant and equipment are recorded at cost less accumulated depreciation and impairment losses. Cost includes the purchase price and the directly attributable costs to bring the assets to the location and condition necessary for them to be capable of operating in the manner intended by management.
Depreciation of mobile equipment, buildings used for production, and plant and processing equipment at our mining operations are calculated on a units-of-production basis. Depreciation of buildings not used for production, and of plant and equipment at our smelting operations is calculated on a straight-line basis over the assets estimated useful lives. Where components of an asset have different useful lives, depreciation is calculated on each component separately. Depreciation commences when an asset is ready for its intended use. Estimates of remaining useful lives and residual values are reviewed annually. Changes in estimates are accounted for prospectively.
The expected useful lives are as follows:
Buildings and equipment (not used for production) |
250 years | |
Plant and equipment (smelting operations) |
330 years |
Mineral properties and mine development costs
The cost of acquiring and developing mineral properties or property rights, including pre-production waste rock stripping costs related to mine development and costs incurred during production to increase future output, are capitalized.
Waste rock stripping costs incurred in the production phase of a surface mine are recorded as capitalized production stripping costs within property, plant and equipment when it is probable that the stripping activity will improve access to the orebody, when the component of the orebody or pit to which access has been improved can be identified, and when the costs relating to the stripping activity can be measured reliably. When the actual waste-to-ore stripping ratio in a period is greater than the expected life-of-component waste-to-ore stripping ratio for that component, the excess is recorded as capitalized production stripping costs.
Once available for use, mineral properties and mine development costs are depreciated on a units-of-production basis over the proven and probable reserves to which they relate. Since the stripping activity within a component of a mine improves access to the reserves of the same component, capitalized production stripping costs incurred during the production phase of a mine are depreciated on a units-of-production basis over the proven and probable reserves expected to be mined from the same component.
Underground mine development costs are depreciated using the block depreciation method, where development costs associated with each distinct section of the mine are depreciated over the reserves to which they relate.
17
3. | Summary of Significant Accounting Policies (continued) |
Exploration and evaluation costs
Property acquisition costs are capitalized. Other exploration and evaluation costs are capitalized if they relate to specific properties for which resources, as defined under National Instrument 43-101, Standards of Disclosure for Mineral Projects, exist or are near a specific property with a defined resource, and it is expected that the expenditure can be recovered by future exploitation or sale. All other costs are charged to profit in the year in which they are incurred. Capitalized exploration and evaluation costs are considered to be tangible assets. These assets are not depreciated as they are not currently available for use. When proven and probable reserves are determined and development is approved, capitalized exploration and evaluation costs are reclassified to mineral properties within property, plant and equipment.
Costs of oil sands properties
The costs of acquiring, exploring, evaluating and developing oil sands properties are capitalized when it is expected that these costs will be recovered through future exploitation or sale of the property. Capitalized development costs of oil sands properties are tangible assets. These assets are not depreciated as they are not currently available for use. When proven and probable reserves are determined and development is approved, capitalized development costs for oil sands properties are reclassified to mineral properties within property, plant and equipment.
Construction in progress
Assets in the course of construction are capitalized as construction in progress. On completion, the cost of construction is transferred to the appropriate category of property, plant and equipment, and depreciation commences when the asset is available for its intended use.
Impairment of non-current assets
The carrying amounts of assets included in property, plant and equipment are reviewed for impairment whenever facts and circumstances indicate that the carrying amounts are less than the recoverable amounts. If there are indicators of impairment, the recoverable amount of the asset is estimated in order to determine the extent of any impairment. Where the asset does not generate cash flows that are independent from other assets, the recoverable amount of the cash-generating unit (CGU) to which the asset belongs is determined. The recoverable amount of an asset or CGU is determined as the higher of its fair value less costs of disposal and its value in use. An impairment loss exists if the assets or CGUs carrying amount exceeds the estimated recoverable amount, and is recorded as an expense immediately.
Fair value is the price that would be received from selling an asset in an orderly transaction between market participants at the measurement date. Costs of disposal are incremental costs directly attributable to the disposal of an asset. For mining assets, when a binding sale agreement is not readily available, fair value less costs of disposal is usually estimated using a discounted cash flow approach, unless comparable market transactions on which to estimate fair value are available. Estimated future cash flows are calculated using estimated future commodity prices, reserves and resources, and operating and capital costs. All inputs used are those that an independent market participant would consider appropriate. Value in use is determined as the present value of the future cash flows expected to be derived from continuing use of an asset or CGU in its present form. These estimated future cash flows are discounted to their present value using a pre-tax discount rate that reflects current market assessments of the time value of money and the risks specific to the asset or CGU for which estimates of future cash flows have not been adjusted. A value in use calculation uses a pre-tax discount rate and a fair value less costs of disposal calculation uses a post-tax discount rate.
Indicators of impairment for exploration and evaluation assets are assessed on a project-by-project basis or as part of the existing operation to which they relate.
Tangible assets that have been impaired in prior periods are tested for possible reversal of impairment whenever events or significant changes in circumstances indicate that the impairment may have reversed. Indicators of a potential reversal of an impairment loss mainly mirror the indicators present when the impairment was originally recorded. If the impairment has reversed, the carrying amount of the asset is increased to its recoverable amount, but not beyond the carrying amount that would have been determined, net of depreciation, had no impairment loss been recognized for the asset in prior periods. A reversal of an impairment loss is recognized into profit immediately.
18
3. | Summary of Significant Accounting Policies (continued) |
Repairs and maintenance
Repairs and maintenance costs, including shutdown maintenance costs, are charged to expense as incurred, except when these repairs significantly extend the life of an asset or result in a significant operating improvement. In these instances, the portion of these repairs relating to the betterment is capitalized as part of plant and equipment.
Borrowing costs
We capitalize borrowing costs that are directly attributable to the acquisition, construction or production of an asset that takes a substantial period of time to construct or prepare for its intended use. We begin capitalizing borrowing costs when there are general or specific borrowings, expenditures are incurred, and activities are undertaken to prepare the asset for its intended use. The amount of borrowing costs capitalized cannot exceed the actual amount of borrowing costs incurred during the period. All other borrowing costs are expensed as incurred.
We discontinue the capitalization of borrowing costs when substantially all of the activities necessary to prepare the qualifying asset for its intended use or sale are complete. In addition, we cease capitalization of borrowing costs when there is suspension of activities to prepare an asset for its intended use or sale. Capitalization recommences when the activities are restarted. Capitalized borrowing costs are amortized over the useful life of the related asset.
Leased assets
Leased assets from which we receive substantially all of the risks and rewards of ownership of the asset are capitalized as finance leases at the lower of the fair value of the asset or the estimated present value of the minimum lease payments. The corresponding lease obligation is recorded within debt on the balance sheet. We review arrangements entered into during the year to assess if the arrangements are, or contain, leases that should be accounted for as such.
Assets under operating leases are not capitalized, and rental payments are expensed based on the terms of the lease.
Goodwill
We allocate goodwill arising from business combinations to each CGU or group of CGUs that are expected to receive the benefits from the business combination. The carrying amount of the CGU or group of CGUs to which goodwill has been allocated is tested annually for impairment or when there is an indication that the goodwill may be impaired. Any impairment is recognized as an expense immediately. Should there be a recovery in the value of a CGU, any impairment of goodwill previously recorded is not subsequently reversed.
Income Taxes
Taxes, comprising both income taxes and resource taxes, are accounted for as income taxes under IAS 12, Income Taxes and are recognized in the statement of income, except where they relate to items recognized in other comprehensive income (loss) or directly in equity, in which case the related taxes are recognized in other comprehensive income (loss) or equity.
Current taxes receivable or payable are based on estimated taxable income for the current year at the statutory tax rates enacted or substantively enacted less amounts paid or received on account.
Deferred tax assets and liabilities are recognized based on temporary differences (the difference between the tax and accounting values of assets and liabilities) and are calculated using enacted or substantively enacted tax rates for the periods in which the differences are expected to reverse. The effect of changes in tax legislation, including changes in tax rates, is recognized in the period of substantive enactment.
Deferred tax assets are recognized only to the extent that it is probable that future taxable profits of the relevant entity or group of entities in a particular jurisdiction will be available, against which the assets can be utilized.
Deferred tax liabilities are recognized for taxable temporary differences arising on investments in subsidiaries, joint ventures and associates. However, we do not recognize such deferred tax liabilities where the timing of the reversal of the temporary differences can be controlled without affecting our operations or business, and it is probable that the temporary differences will not reverse in the foreseeable future.
19
3. | Summary of Significant Accounting Policies (continued) |
Deferred tax assets and liabilities are not recognized if the temporary differences arise from the initial recognition of goodwill or an asset or liability in a transaction, other than in a business combination, which will affect neither accounting profit nor taxable profit.
We are subject to assessments by various taxation authorities, who may interpret tax legislation differently than we do. The final amount of taxes to be paid depends on a number of factors, including the outcomes of audits, appeals or negotiated settlements. We account for such differences based on our best estimate of the probable outcome of these matters.
Employee Benefits
Defined benefit pension plans
Defined benefit pension plan obligations are based on actuarial determinations. The projected unit credit method, which sees each period of service as giving rise to an additional unit of benefit entitlement and measures each unit separately to build up the final obligation, is used to determine the defined benefit obligations, the related current service costs and, where applicable, the past service costs. Actuarial assumptions used in the determination of defined benefit pension plan assets and liabilities are based upon our best estimates, including discount rates, salary escalation, expected health care costs and retirement dates of employees.
Vested and unvested costs arising from past service following the introduction of changes to a defined benefit plan are recognized immediately as an expense when the changes are made.
Actuarial gains and losses can arise from differences between expected and actual outcomes or changes in actuarial assumptions. Actuarial gains and losses, changes in the effect of asset ceiling rules and return on plan assets are collectively referred to as remeasurements of retirement benefit plans and are recognized immediately through other comprehensive income (loss) and directly into retained earnings. Measurement of our net defined benefit asset is limited to the lower of the surplus of assets less liabilities in the defined benefit plan and the asset ceiling less liabilities in the defined benefit plan. The asset ceiling is the present value of the expected economic benefit available to us in the form of refunds from the plan or reductions in future contributions to the plan.
We apply one discount rate to the net defined benefit asset or liability for the purposes of determining the interest component of the defined benefit cost. This interest component is recorded as part of finance expense. Depending on the classification of the salary of plan members, current service costs and past service costs are included in either operating expenses or general and administration expenses.
Defined contribution pension plans
The cost of providing benefits through defined contribution plans is charged to profit as the obligation to contribute is incurred.
Non-pension post-retirement plans
We provide health care benefits for certain employees when they retire. Non-pension post-retirement plan obligations are based on actuarial determinations. The cost of these benefits is expensed over the period in which the employees render services. We fund these non-pension post-retirement benefits as they become due.
Termination benefits
We recognize a liability and an expense for termination benefits when we have demonstrably committed to terminate employees. We are demonstrably committed to a termination when, and only when, there is a formal plan for the termination with no realistic possibility of withdrawal. The plan should include, at a minimum, the location, function and approximate number of employees whose services are to be terminated, the termination benefits for each job classification or function, and the time at which the plan will be implemented without significant changes.
20
3. | Summary of Significant Accounting Policies (continued) |
Share-Based Payments
The fair value method of accounting is used for share-based payment transactions. Under this method, the cost of share options and other equity-settled share-based payment arrangements is recorded based on the estimated fair value at the grant date, including an estimate of the forfeiture rate, and charged to other operating income (expense) over the vesting period. For employees eligible for normal retirement prior to vesting, the expense is charged to other operating income (expense) over the period from the grant date to the date they are eligible for retirement.
Share-based payment expense relating to cash-settled awards, including deferred, restricted and performance share units, is accrued over the vesting period of the units based on the quoted market value of Class B subordinate voting shares. Performance share units (PSUs) have an additional vesting factor determined by our total shareholder return in comparison to a group of specified companies. PSUs issued in 2017 and onwards and performance deferred share units (PDSUs) also have a vesting factor determined by the ratio of the change in our earnings before interest, taxes, depreciation and amortization (EBITDA) over the life of the share unit to the change in a specified weighted commodity price index. As these awards will be settled in cash, the expense and liability are adjusted each reporting period for changes in the underlying share price as well as changes to the above-noted vesting factors, as applicable.
Share Repurchases
Where we repurchase any of our equity share capital, the excess of the consideration paid over book value is deducted from retained earnings.
Provisions
Decommissioning and restoration provisions
Future obligations to retire an asset and to restore a site, including dismantling, remediation and ongoing treatment and monitoring of the site related to normal operations, are initially recognized and recorded as a provision based on estimated future cash flows discounted at a credit-adjusted risk-free rate. This decommissioning and restoration provision is adjusted at each reporting period for changes to factors including the expected amount of cash flows required to discharge the liability, the timing of such cash flows and the discount rate.
The provisions are also accreted to full value over time through periodic charges to profit. This unwinding of the discount is charged to finance expense in the statement of income.
The amount of the decommissioning and restoration provision initially recognized is capitalized as part of the related assets carrying value. The method of depreciation follows that of the underlying asset. For a closed site or where the asset that generated a decommissioning and restoration provision no longer exists, there is no longer any future benefit related to the costs, and as such, the amounts are expensed through other operating income (expense). For operating sites, a revision in estimates or a new disturbance will result in an adjustment to the provision with an offsetting adjustment to the capitalized asset retirement cost.
During the operating life of an asset, events such as infractions of environmental laws or regulations may occur. These events are not related to the normal operation of the asset. The costs associated with these provisions are accrued and charged to other operating income (expense) in the period in which the event giving rise to the liability occurs. Changes in the estimated liability resulting in an adjustment to the provision are also charged to other operating income (expense) in the period in which the estimate changes.
Other provisions
Provisions are recognized when a present legal or constructive obligation exists as a result of past events, and it is probable that an outflow of resources that can be reliably estimated will be required to settle the obligation. Where the effect is material, the provision is discounted using an appropriate credit-adjusted risk-free rate.
21
3. | Summary of Significant Accounting Policies (continued) |
Research and Development
Research costs are expensed as incurred. Development costs are only capitalized when the product or process is clearly defined; the technical feasibility has been established; the future market for the product or process is clearly defined; and we are committed, and have the resources, to complete the project.
Earnings per Share
Earnings per share is calculated based on the weighted average number of shares outstanding during the year. For diluted earnings per share, dilution is calculated based upon the net number of common shares issued should in-the-money options and warrants be exercised and the proceeds be used to repurchase common shares at the average market price in the year.
4. | Areas of Judgment and Estimation Uncertainty |
In preparing our consolidated financial statements, we make judgments in applying our accounting policies. The judgments that have the most significant effect on the amounts recognized in our financial statements are outlined below. In addition, we make assumptions about the future in deriving estimates used in preparing our consolidated financial statements. We have outlined below information about assumptions and other sources of estimation uncertainty as at December 31, 2018 that have a risk of resulting in a material adjustment to the carrying amounts of assets and liabilities within the next year.
a) | Areas of Judgment |
Assessment of Impairment Indicators
Judgment is required in assessing whether certain factors would be considered an indicator of impairment or impairment reversal. We consider both internal and external information to determine whether there is an indicator of impairment or impairment reversal present and, accordingly, whether impairment testing is required. The information we consider in assessing whether there is an indicator of impairment or impairment reversal includes, but is not limited to, market transactions for similar assets, commodity prices, interest rates, inflation rates, our market capitalization, reserves and resources, mine plans and operating results.
Property, Plant and Equipment Determination of Available for Use Date
Judgment is required in determining the date that property, plant and equipment is available for use. An asset is available for use when it is in the location and condition necessary to operate in the manner intended by management. At that time, we commence depreciation of the asset and cease capitalization of borrowing costs. We consider a number of factors in making the determination of when an asset is available for use including, but not limited to, design capacity of the asset, production levels achieved, capital spending remaining and commissioning status. Fort Hills produced first oil in January 2018 and were considered available for use as at June 1, 2018. When concluding that these assets were available for use at June 1, 2018, we considered whether all three secondary extraction trains were running as expected, whether the production and product quality were consistent with expectations, and the status of asset commissioning. We have included the operating results for Fort Hills in our consolidated statements of income from that date forward.
22
4. | Areas of Judgment and Estimation Uncertainty (continued) |
Joint Arrangements
We are a party to a number of arrangements over which we do not have control. Judgment is required in determining whether joint control over these arrangements exists and, if so, which parties have joint control and whether each arrangement is a joint venture or joint operation. In assessing whether we have joint control, we analyze the activities of each arrangement and determine which activities most significantly affect the returns of the arrangement over its life. These activities are determined to be the relevant activities of the arrangement. If unanimous consent is required over the decisions about the relevant activities, the parties whose consent is required would have joint control over the arrangement. The judgments around which activities are considered the relevant activities of the arrangement are subject to analysis by each of the parties to the arrangement and may be interpreted differently. When performing this assessment, we generally consider decisions about activities such as managing the asset while it is being designed, developed and constructed, during its operating life and during the closure period. We may also consider other activities including the approval of budgets, expansion and disposition of assets, financing, significant operating and capital expenditures, appointment of key management personnel, representation on the board of directors and other items. When circumstances or contractual terms change, we reassess the control group and the relevant activities of the arrangement.
If we have joint control over the arrangement, an assessment of whether the arrangement is a joint venture or joint operation is required. This assessment is based on whether we have rights to the assets, and obligations for the liabilities, relating to the arrangement or whether we have rights to the net assets of the arrangement. In making this determination, we review the legal form of the arrangement, the terms of the contractual arrangement and other facts and circumstances. In a situation where the legal form and the terms of the contractual arrangement do not give us rights to the assets and obligations for the liabilities, an assessment of other facts and circumstances is required, including whether the activities of the arrangement are primarily designed for the provision of output to the parties and whether the parties are substantially the only source of cash flows contributing to the arrangement. The consideration of other facts and circumstances may result in the conclusion that a joint arrangement is a joint operation. This conclusion requires judgment and is specific to each arrangement. Other facts and circumstances have led us to conclude that Antamina and Fort Hills are joint operations for the purposes of our consolidated financial statements. The other facts and circumstances considered for both of these arrangements include the provisions of output to the parties of the joint arrangements and the funding obligations. For both Antamina and Fort Hills, we will take our share of the output from the assets directly over the life of the arrangement. We have concluded that this gives us direct rights to the assets and obligations for the liabilities of these arrangements proportionate to our ownership interests.
Streaming Transactions
When we enter into a long-term streaming arrangement linked to production at specific operations, judgment is required in assessing the appropriate accounting treatment for the transaction on the closing date and in future periods. We consider the specific terms of each arrangement to determine whether we have disposed of an interest in the reserves and resources of the respective operation or executed some other form of arrangement. This assessment considers what the counterparty is entitled to and the associated risks and rewards attributable to them over the life of the operation. These include the contractual terms related to the total production over the life of the arrangement as compared to the expected production over the life of the mine, the percentage being sold, the percentage of payable metals produced, the commodity price referred to in the ongoing payment and any guarantee relating to the upfront payment if production ceases.
For our silver and gold streaming arrangements entered into in 2015, there is no guarantee associated with the upfront payment. We have concluded that control of the rights to the silver and gold mineral interests were transferred to the buyer when the contracts came into effect at Antamina and Carmen de Andacollo, respectively. Therefore, we consider these arrangements a disposition of a mineral interest.
Any gains from the sale of mineral properties are recognized in accordance with IFRS 15. For both streaming transactions, the total transaction price less costs was allocated to the identified performance obligations based on their estimated stand-alone selling prices. The performance obligations include the interest in the reserves and resources of the operation, mining, refining and delivery services. The allocation involved the use of a variety of estimates in a discounted cash flow model to estimate the stand-alone selling price of the mineral interest. The significant estimates included expected commodity prices, production costs, discount rates and mine plans. A residual value approach was used to estimate the selling prices of mining services.
23
4. | Areas of Judgment and Estimation Uncertainty (continued) |
Based on our judgment, control of the interest in the reserves and resources transferred to the buyer when the contract was executed. At that time, we had the right to payment, the customer was entitled to the commodities, the buyer had no recourse in requiring Teck to mine the product, and the buyer had significant risks and rewards of ownership of the reserves and resources. The allocation of proceeds under IFRS 15 resulted in a net gain allocated to the reserves and resources for the Antamina silver stream transaction. This resulted in an IFRS 15 transition pre-tax adjustment of $755 million to retained earnings, as the amount was previously recorded as deferred consideration (Note 32). There was no net gain or loss adjustment on application of IFRS 15 to the Carmen de Andacollo gold stream.
We recognize the amount of consideration related to refining, mining and delivery services as the work is performed.
Deferred Tax Assets and Liabilities
Judgment is required in assessing whether deferred tax assets and certain deferred tax liabilities are recognized on the balance sheet and what tax rate is expected to be applied in the year when the related temporary differences reverse, particularly in regard to the utilization of tax loss carryforwards. We also evaluate the recoverability of deferred tax assets based on an assessment of our ability to use the underlying future tax deductions before they expire against future taxable income. Deferred tax liabilities arising from temporary differences on investments in subsidiaries, joint ventures and associates are recognized unless the reversal of the temporary differences is not expected to occur in the foreseeable future and can be controlled. Judgment is also required on the application of income tax legislation. These judgments are subject to risk and uncertainty and could result in an adjustment to the deferred tax provision and a corresponding credit or charge to profit.
b) | Sources of Estimation Uncertainty |
Impairment Testing
When impairment testing is required, discounted cash flow models are used to determine the recoverable amount of respective assets. These models are prepared internally with assistance from third-party advisors when required. When market transactions for comparable assets are available, these are considered in determining the recoverable amount of assets. Significant assumptions used in preparing discounted cash flow models include commodity prices, reserves and resources, mine plans, operating costs, capital expenditures, discount rates, foreign exchange rates and inflation rates. Note 8 outlines the significant inputs used when performing goodwill and other asset impairment testing. These inputs are based on managements best estimates of what an independent market participant would consider appropriate. Changes in these inputs may alter the results of impairment testing, the amount of the impairment charges or reversals recorded in the statement of income and the resulting carrying values of assets.
Estimated Recoverable Reserves and Resources
Mineral and oil reserve and resource estimates are based on various assumptions relating to operating matters as set forth in National Instrument 43-101, Standards of Disclosure for Mineral Projects and National Instrument 51-101, Standards of Disclosure for Oil and Gas Activities. Assumptions used include production costs, mining and processing recoveries, cut-off grades, marketing and sales, long-term commodity prices and, in some cases, exchange rates, inflation rates and capital costs. Cost estimates are based on pre-feasibility or feasibility study estimates or operating history. Estimates are prepared by or under the supervision of appropriately qualified persons, or qualified reserves evaluators, but will be affected by forecasted commodity prices, inflation rates, exchange rates, capital and production costs, and recoveries, among other factors. Estimated recoverable reserves and resources are used to determine the depreciation of property, plant and equipment at operating mine sites, in accounting for capitalized production stripping costs, in performing impairment testing, and in forecasting the timing of the payment of decommissioning and restoration costs. Therefore, changes in the assumptions used could affect the carrying value of assets, depreciation and impairment charges recorded in the statement of income and the carrying value of the decommissioning and restoration provision.
24
4. | Areas of Judgment and Estimation Uncertainty (continued) |
Decommissioning and Restoration Provisions
The decommissioning and restoration provision (DRP) is based on future cost estimates using information available at the balance sheet date (Note 22(a)). The DRP represents the present value of estimated costs of future decommissioning and other site restoration activities. The DRP is adjusted at each reporting period for changes to factors such as the expected amount of cash flows required to discharge the liability, the timing of such cash flows and the credit-adjusted discount rate. The DRP requires other significant estimates and assumptions, including the requirements of the relevant legal and regulatory framework and the timing, extent and costs of required decommissioning and restoration activities. To the extent the actual costs differ from these estimates, adjustments will be recorded and the income statement may be affected.
Provision for Income Taxes
We calculate current and deferred tax provisions for each of the jurisdictions in which we operate. Actual amounts of income tax expense are not final until tax returns are filed and accepted by the relevant authorities. This occurs subsequent to the issuance of our financial statements, and the final determination of actual amounts may not be completed for a number of years. Therefore, profit in subsequent periods will be affected by the amount that estimates differ from the final tax return.
Deferred Tax Assets and Liabilities
Assumptions about the generation of future taxable profits and repatriation of retained earnings depend on managements estimates of future production and sales volumes, commodity prices, reserves and resources, operating costs, decommissioning and restoration costs, capital expenditures, dividends and other capital management transactions. These estimates could result in an adjustment to the deferred tax provision and a corresponding credit or charge to profit.
5. | Transactions |
a) | Quebrada Blanca |
In April of 2018, we acquired an additional 13.5% interest in QBSA through the purchase of Inversiones Mineras S.A. (IMSA), a private Chilean company. This acquisition brought our interest in QBSA from 76.5% to 90%.
The purchase price consisted of US$53 million paid in cash on closing, an additional US$60 million paid in 2018 on the issuance of the major approval of the social and environmental impact assessment for the Quebrada Blanca Phase 2 copper development project (QB2) and a further US$50 million payable within 30 days of the commencement of commercial production at QB2. Additional amounts may become payable to the extent that average copper prices exceed US$3.15 per pound in each of the first three years following commencement of commercial production, up to a cumulative maximum of US$100 million if commencement of commercial production occurs prior to January 21, 2024, or up to a lesser maximum in certain circumstances thereafter.
This transaction is considered a change in the ownership of a subsidiary that we control and accordingly, we accounted for this as an equity transaction. At the acquisition date, we recorded a cash payment of $67 million and liabilities for the estimated fair value of amounts due in the future, which are recorded in provisions and other liabilities on the balance sheet. The total fair value of $175 million was recorded as a reduction in non-controlling interests and equity attributable to shareholders of $16 million and $159 million, respectively, as at December 31, 2018.
In December of 2018, we announced a transaction for Sumitomo Metal Mining Co., Ltd. and Sumitomo Corporation (together referred to as Sumitomo) to subscribe for a 30% indirect interest in QBSA, which owns QB2. Upon closing, Teck and Sumitomo will have an indirect ownership interest in QBSA of 60% and 30%, respectively, and Empresa Nacional de Minería (ENAMI) will continue to have a 10% direct ownership interest in QBSA. ENAMI, a Chilean State agency, holds a preference share interest in QBSA, which does not require ENAMI to fund capital spending. Closing of the transaction is subject to customary conditions precedent, including receipt of necessary regulatory approvals, and is expected to occur before the end of March 2019.
We analyzed the implied fair value that can be derived from this announced market transaction as part of our impairment testing for the Quebrada Blanca CGU (Note 8(b)).
25
5. | Transactions (continued) |
b) | Waneta Dam Sale |
During 2018, the transaction for the sale of our two-thirds interest in the Waneta Dam and related transmission assets to BC Hydro closed. The Waneta Dam and related transmission assets were previously classified as assets held for sale of $350 million on our consolidated balance sheet as at December 31, 2017. As part of the sale, we entered into a 20-year arrangement to purchase power for our Trail Operations, with an option to extend the arrangement for a further 10 years on comparable terms. We recognized this transaction as a disposition of the Waneta Dam and related transmission assets and recorded a pre-tax gain, net of transaction costs, of $888 million (after-tax $812 million) based on proceeds of $1.203 billion. The gain is recorded in other operating income (expense) (Note 9). The power supply arrangement is accounted for as an ongoing cost to operate and is recorded in cost of sales.
6. | Revenues |
a) | Total Revenues by Major Product Type and Business Unit |
The following table shows our revenue disaggregated by major product type and by business unit. Our business units are reported based on the primary products that they produce and are consistent with our reportable segments (Note 27) that have revenue from contracts with customers. A business unit can have revenue from more than one commodity as it can include an operation that produces more than one product. Intra-segment revenues are accounted for at current market prices as if the sales were made to arms-length parties and are eliminated on consolidation.
(CAD$ in millions) |
2018 | |||||||||||||||||||
Steelmaking Coal | Copper | Zinc | Energy1 | Total | ||||||||||||||||
Steelmaking coal |
$ | 6,349 | $ | | $ | | $ | | $ | 6,349 | ||||||||||
Copper |
| 2,242 | | | 2,242 | |||||||||||||||
Zinc |
| 279 | 2,701 | | 2,980 | |||||||||||||||
Blended bitumen |
| | | 407 | 407 | |||||||||||||||
Silver |
| 18 | 306 | | 324 | |||||||||||||||
Lead |
| | 419 | | 419 | |||||||||||||||
Other |
| 175 | 318 | | 493 | |||||||||||||||
Intra-segment |
| | (650 | ) | | (650 | ) | |||||||||||||
|
|
|
|
|
|
|
|
|
|
|||||||||||
$ | 6,349 | $ | 2,714 | $ | 3,094 | $ | 407 | $ | 12,564 | |||||||||||
|
|
|
|
|
|
|
|
|
|
(CAD$ in millions) |
2017 (restated) | |||||||||||||||||||
Steelmaking Coal | Copper | Zinc | Energy | Total | ||||||||||||||||
Steelmaking coal |
$ | 6,014 | $ | | $ | | $ | | $ | 6,014 | ||||||||||
Copper |
| 2,022 | | | 2,022 | |||||||||||||||
Zinc |
| 252 | 2,673 | | 2,925 | |||||||||||||||
Silver |
| 16 | 556 | | 572 | |||||||||||||||
Lead |
| | 570 | | 570 | |||||||||||||||
Other |
| 110 | 332 | | 442 | |||||||||||||||
Intra-segment |
| | (635 | ) | | (635 | ) | |||||||||||||
|
|
|
|
|
|
|
|
|
|
|||||||||||
$ | 6,014 | $ | 2,400 | $ | 3,496 | $ | | $ | 11,910 | |||||||||||
|
|
|
|
|
|
|
|
|
|
Note:
1) | Includes revenue for Fort Hills from June 1, 2018 (Note 4(a)). |
26
6. | Revenues (continued) |
b) | Total Revenues by Regions |
The following table shows our revenue disaggregated by geographical region. Revenues are attributed to regions based on the destination port or delivery location as designated by the customer. The 2018 results include revenue for Fort Hills from June 1, 2018.
2018 | 2017 | |||||||
(CAD$ in millions) |
|
(restated) | ||||||
Asia |
||||||||
China |
$ | 2,060 | $ | 2,079 | ||||
Japan |
1,880 | 1,872 | ||||||
South Korea |
1,515 | 1,352 | ||||||
India |
981 | 761 | ||||||
Other |
1,207 | 951 | ||||||
Americas |
||||||||
United States |
1,609 | 1,357 | ||||||
Canada |
932 | 920 | ||||||
Latin America |
297 | 407 | ||||||
Europe |
||||||||
Germany |
561 | 578 | ||||||
Finland |
242 | 284 | ||||||
Netherlands |
240 | 215 | ||||||
Other |
1,040 | 1,134 | ||||||
|
|
|
|
|||||
$ | 12,564 | $ | 11,910 | |||||
|
|
|
|
27
7. | Expenses by Nature |
2018 | 2017 | |||||||
(CAD$ in millions) |
|
(restated) | ||||||
Employment-related costs: |
||||||||
Wages and salaries |
$ | 1,005 | $ | 899 | ||||
Employee benefits and other wage-related costs |
247 | 236 | ||||||
Bonus payments |
191 | 192 | ||||||
Post-employment benefits and pension costs |
112 | 122 | ||||||
|
|
|
|
|||||
1,555 | 1,449 | |||||||
Transportation |
1,408 | 1,245 | ||||||
Depreciation and amortization |
1,483 | 1,492 | ||||||
Raw material purchases |
914 | 824 | ||||||
Fuel and energy |
830 | 657 | ||||||
Operating supplies consumed |
640 | 569 | ||||||
Maintenance and repair supplies |
775 | 698 | ||||||
Contractors and consultants |
738 | 570 | ||||||
Overhead costs |
365 | 287 | ||||||
Royalties |
370 | 453 | ||||||
Other operating costs |
15 | 9 | ||||||
|
|
|
|
|||||
9,093 | 8,253 | |||||||
Less: |
||||||||
Capitalized production stripping costs |
(707 | ) | (678 | ) | ||||
Change in inventory |
(197 | ) | (3 | ) | ||||
|
|
|
|
|||||
Total cost of sales, general and administration, exploration and research and development expenses |
$ | 8,189 | $ | 7,572 | ||||
|
|
|
|
Approximately 26% (2017 29%) of our costs are incurred at our foreign operations where the functional currency is the U.S. dollar.
8. | Asset and Goodwill Impairment Testing |
a) | Impairment Reversal and Asset Impairments |
The following pre-tax impairment reversal and (asset impairments) were recorded in the statement of income:
Impairment Reversal and (Asset Impairments)
(CAD$ in millions) |
2018 | 2017 | ||||||
Steelmaking coal CGU |
$ | | $ | 207 | ||||
Other |
(41 | ) | (44 | ) | ||||
|
|
|
|
|||||
Total |
$ | (41 | ) | $ | 163 | |||
|
|
|
|
Steelmaking Coal CGU
We did not identify any asset impairment or impairment reversal indicators for our steelmaking coal CGU during 2018. The results of our annual goodwill impairment testing for our steelmaking coal CGU as at October 31, 2018 are outlined in Note 8(b).
28
8. | Asset and Goodwill Impairment Testing (continued) |
As at December 31, 2017, we recorded a pre-tax impairment reversal of $207 million (after-tax $131 million) related to one of the mines in our steelmaking coal business unit. The estimated post-tax recoverable amount of this mine was significantly higher than the carrying value. This impairment reversal arose as a result of changes in short-term and long-term market participant price expectations for steelmaking coal and expected future operating cost estimates included in our annual goodwill impairment testing performed in 2017. The impairment reversal affected the profit (loss) of our steelmaking coal operating segment (Note 27).
Other
During the year ended December 31, 2018, we recorded asset impairments of $41 million, of which $31 million is related to capitalized exploration expenditures that are not expected to be recovered and $10 million ($44 million 2017) is related to Quebrada Blanca assets that will not be recovered through use.
b) | Annual Goodwill Impairment Testing |
The allocation of goodwill to CGUs or groups of CGUs reflects how goodwill is monitored for internal management purposes. Our Quebrada Blanca CGU and steelmaking coal CGU have goodwill allocated to them (Note 17). The Quebrada Blanca CGU primarily relates to assets of QB2.
We performed our annual goodwill impairment testing at October 31, 2018 and did not identify any goodwill impairment losses.
Cash flow projections are based on expected mine life. For our steelmaking coal operations, the cash flows cover periods of 9 to 51 years, with a steady state thereafter until reserves and resources are exhausted. For Quebrada Blanca, the cash flow covers 31 years, with our estimate of cash flows thereafter until reserves and resources are exhausted.
Given the nature of expected future cash flows used to determine the recoverable amount, a material change could occur over time as the cash flows are significantly affected by the key assumptions described below in Note 8(c).
Sensitivity Analysis
Our annual goodwill impairment test carried out at October 31, 2018 resulted in the recoverable amount of our steelmaking coal CGU exceeding its carrying value by approximately $6.7 billion. The recoverable amount of our steelmaking coal CGU is most sensitive to the long-term Canadian dollar steelmaking coal price assumption. In isolation, a 15% decrease in the long-term Canadian dollar steelmaking coal price would result in the recoverable amount of the steelmaking coal CGU being equal to the carrying value.
Our annual goodwill impairment test for the Quebrada Blanca CGU carried out at October 31, 2018 resulted in a recoverable amount that exceeded the carrying value and no goodwill impairment losses were identified. Subsequent to our annual goodwill impairment test, Teck announced the QB2 partnering transaction (Note 5(a)). We compared the implied fair value that can be derived from the announced market transaction to the carrying value for our Quebrada Blanca CGU and concluded that the fair value exceeded our carrying value, including goodwill. In deriving a fair value for QBSA relative to the interest subscribed for by Sumitomo, we adjusted the transaction value to reflect the additional value attributed to a controlling interest.
29
8. | Asset and Goodwill Impairment Testing (continued) |
c) | Key Assumptions |
The following are the key assumptions used in our impairment testing calculations during the years ended December 31, 2018 and 2017:
2018 |
2017 | |||
Steelmaking coal prices | Current price used in initial year, decreased to a long-term price in 2023 of US$150 per tonne | Current price used in initial year, decreased to a long-term price in 2022 of US$140 per tonne | ||
Copper prices | Current price used in initial year, increased to a long-term price in 2023 of US$3.00 per pound | Current price used in initial year, decreased to a long-term price in 2022 of US$3.00 per pound | ||
Discount rate | 6.0% | 5.9% | ||
Long-term foreign exchange rate | 1 U.S. to 1.25 Canadian dollars | 1 U.S. to 1.25 Canadian dollars | ||
Inflation rate | 2% | 2% |
Commodity Prices
Commodity price assumptions are based on a number of factors, including forward curves in the near term, and are benchmarked with external sources of information, including information published by our peers and market transactions, where possible, to ensure they are within the range of values used by market participants.
Discount Rates
Discount rates are based on a mining weighted average cost of capital for all mining operations. For the year ended December 31, 2018, we used a discount rate of 6.0% real, 8.1% nominal post-tax (2017 5.9% real, 8.0% nominal post-tax) for mining operations and goodwill.
Foreign Exchange Rates
Foreign exchange rates are benchmarked with external sources of information based on a range used by market participants. Long-term foreign exchange assumptions are from year 2023 onwards for analysis performed in the year ended December 31, 2018 and are from year 2022 onwards for analysis performed in the year ended December 31, 2017.
Inflation Rates
Inflation rates are based on average historical inflation for the location of each operation and long-term government targets.
Reserves and Resources
Future mineral production is included in projected cash flows based on mineral reserve and resource estimates and on exploration and evaluation work undertaken by appropriately qualified persons.
Operating Costs and Capital Expenditures
Operating costs and capital expenditures are based on life of mine plans and internal management forecasts. Cost estimates incorporate management experience and expertise, current operating costs, the nature and location of each operation, and the risks associated with each operation. Future capital expenditures are based on managements best estimate of expected future capital requirements, which are generally for the extraction and processing of existing reserves and resources. All committed and anticipated capital expenditures based on future cost estimates have been included in the projected cash flows. Operating cost and capital expenditure assumptions are continuously subjected to ongoing optimization and review by management.
30
8. | Asset and Goodwill Impairment Testing (continued) |
Recoverable Amount Basis
In the absence of a relevant market transaction, we estimate the recoverable amount of our CGUs on a fair value less costs of disposal (FVLCD) basis using a discounted cash flow methodology, taking into account assumptions likely to be made by market participants unless it is expected that the value-in-use methodology would result in a higher recoverable amount. For the asset impairment, impairment reversal and goodwill impairment analyses performed in 2018 and 2017 (Note 8(a)), we have applied the FVLCD basis. These estimates are classified as a Level 3 measurement within the fair value measurement hierarchy (Note 29).
9. | Other Operating Income (Expense) |
(CAD$ in millions) |
2018 | 2017 | ||||||
Settlement pricing adjustments (Note 28(b)) |
$ | (117 | ) | $ | 190 | |||
Share-based compensation |
(59 | ) | (125 | ) | ||||
Environmental and care and maintenance costs |
(31 | ) | (186 | ) | ||||
Social responsibility and donations |
(18 | ) | (7 | ) | ||||
Gain (loss) on sale of assets |
(3 | ) | 35 | |||||
Commodity derivatives |
(36 | ) | 12 | |||||
Take or pay contract costs |
(106 | ) | (81 | ) | ||||
Waneta Dam sale (a) |
888 | (28 | ) | |||||
Other |
(68 | ) | (40 | ) | ||||
|
|
|
|
|||||
$ | 450 | $ | (230 | ) | ||||
|
|
|
|
a) | The 2018 amount relates to the pre-tax gain from the Waneta Dam sale (Note 5(b)). The 2017 amount relates to the break fee on that sale paid to Fortis Inc. |
10. | Finance Income and Finance Expense |
(CAD$ in millions) |
2018 | 2017 | ||||||
Finance income |
||||||||
Investment income |
$ | 33 | $ | 17 | ||||
|
|
|
|
|||||
Total finance income |
$ | 33 | $ | 17 | ||||
|
|
|
|
|||||
Finance expense |
||||||||
Debt interest |
$ | 338 | $ | 385 | ||||
Finance lease interest |
24 | 2 | ||||||
Letters of credit and standby fees |
65 | 76 | ||||||
Net interest expense on retirement benefit plans |
6 | 12 | ||||||
Accretion on decommissioning and restoration provisions (Note 22(a)) |
101 | 81 | ||||||
Other |
11 | 6 | ||||||
|
|
|
|
|||||
545 | 562 | |||||||
Less capitalized borrowing costs (Note 16(c)) |
(293 | ) | (333 | ) | ||||
|
|
|
|
|||||
Total finance expense |
$ | 252 | $ | 229 | ||||
|
|
|
|
31
11. | Non-Operating Income (Expense) |
(CAD$ in millions) |
2018 | 2017 | ||||||
Foreign exchange gains |
$ | 16 | $ | 5 | ||||
Gain (loss) on debt prepayment options (Note 28(b)) |
(42 | ) | 51 | |||||
Gain on sale of investments |
| 9 | ||||||
Loss on debt repurchases (Note 19(a) and Note 19(b)) |
(26 | ) | (216 | ) | ||||
|
|
|
|
|||||
$ | (52 | ) | $ | (151 | ) | |||
|
|
|
|
12. | Supplemental Cash Flow Information |
(CAD$ in millions) |
December 31, 2018 |
December 31, 2017 |
||||||
Cash and cash equivalents |
||||||||
Cash |
$ | 438 | $ | 230 | ||||
Investments with maturities from the date of acquisition of three months or less |
1,296 | 722 | ||||||
|
|
|
|
|||||
$ | 1,734 | $ | 952 | |||||
|
|
|
|
2018 | 2017 | |||||||
(CAD$ in millions) |
|
(restated) | ||||||
Net change in non-cash working capital items |
||||||||
Trade and settlements receivables |
$ | 282 | $ | (44 | ) | |||
Prepaids and other current assets |
(26 | ) | (145 | ) | ||||
Inventories |
(338 | ) | (27 | ) | ||||
Trade accounts payable and other liabilities |
53 | 385 | ||||||
|
|
|
|
|||||
$ | (29 | ) | $ | 169 | ||||
|
|
|
|
13. | Inventories |
December 31, 2018 |
December 31, 2017 |
|||||||
(CAD$ in millions) |
|
(restated) | ||||||
Supplies |
$ | 693 | $ | 563 | ||||
Raw materials |
300 | 223 | ||||||
Work in process |
595 | 529 | ||||||
Finished products |
539 | 462 | ||||||
|
|
|
|
|||||
2,127 | 1,777 | |||||||
Less long-term portion (Note 14) |
(62 | ) | (108 | ) | ||||
|
|
|
|
|||||
$ | 2,065 | $ | 1,669 | |||||
|
|
|
|
Cost of sales of $7.9 billion (2017 $7.3 billion) include $7.3 billion (2017 $6.6 billion) of inventories recognized as an expense during the year.
Total inventories held at net realizable value amounted to $172 million at December 31, 2018 (December 31, 2017 $17 million). Total inventory write-downs in 2018 were $82 million (2017 $20 million) and were included as part of cost of sales. Total reversals of inventory write-downs previously recorded was nil in 2018 (2017 $30 million).
32
13. | Inventories (continued) |
Long-term inventories consist of ore stockpiles and other in-process materials that are not expected to be processed within one year.
14. | Financial and Other Assets |
(CAD$ in millions) |
December 31, 2018 |
December 31, 2017 |
||||||
Long-term receivables and deposits |
$ | 220 | $ | 209 | ||||
Marketable equity and debt securities carried at fair value |
167 | 156 | ||||||
Debt prepayment options (Note 28(c)) |
73 | 108 | ||||||
Pension plans in a net asset position (Note 21(a)) |
254 | 339 | ||||||
Long-term portion of inventories (Note 13) |
62 | 108 | ||||||
Intangibles |
80 | 76 | ||||||
Other |
51 | 55 | ||||||
|
|
|
|
|||||
$ | 907 | $ | 1,051 | |||||
|
|
|
|
15. | Investments in Associates and Joint Ventures |
(CAD$ in millions) |
NuevaUnión | Other | Total | |||||||||
At January 1, 2017 |
$ | 946 | $ | 66 | $ | 1,012 | ||||||
Contributions |
43 | 4 | 47 | |||||||||
Changes in foreign exchange rates |
(64 | ) | 1 | (63 | ) | |||||||
Share of income |
4 | 2 | 6 | |||||||||
Share of other comprehensive loss |
| (1 | ) | (1 | ) | |||||||
Acquisition of AQM Copper Inc. |
| (58 | ) | (58 | ) | |||||||
|
|
|
|
|
|
|||||||
At December 31, 2017 |
$ | 929 | $ | 14 | $ | 943 | ||||||
Contributions |
48 | | 48 | |||||||||
Changes in foreign exchange rates |
83 | | 83 | |||||||||
Share of loss |
(2 | ) | (1 | ) | (3 | ) | ||||||
At December 31, 2018 |
$ | 1,058 | $ | 13 | $ | 1,071 | ||||||
|
|
|
|
|
|
33
16. | Property, Plant and Equipment |
(CAD$ in millions) |
Exploration and Evaluation |
Mineral Properties |
Land, Buildings, Plant and Equipment |
Capitalized Production Stripping Costs |
Construction In Progress |
Total | ||||||||||||||||||
At December 31, 2016 |
||||||||||||||||||||||||
Cost |
$ | 1,613 | $ | 18,667 | $ | 13,517 | $ | 4,269 | $ | 3,907 | $ | 41,973 | ||||||||||||
Accumulated depreciation |
| (5,105 | ) | (7,165 | ) | (2,108 | ) | | (14,378 | ) | ||||||||||||||
|
|
|
|
|
|
|
|
|
|
|
|
|||||||||||||
Net book value |
$ | 1,613 | $ | 13,562 | $ | 6,352 | $ | 2,161 | $ | 3,907 | $ | 27,595 | ||||||||||||
|
|
|
|
|
|
|
|
|
|
|
|
|||||||||||||
Year ended December 31, 2017 |
||||||||||||||||||||||||
Opening net book value |
$ | 1,613 | $ | 13,562 | $ | 6,352 | $ | 2,161 | $ | 3,907 | $ | 27,595 | ||||||||||||
Additions |
171 | 174 | 562 | 742 | 1,284 | 2,933 | ||||||||||||||||||
Disposals |
| | (67 | ) | | | (67 | ) | ||||||||||||||||
Impairment reversal and (asset impairments) (Note 8) |
| 207 | (44 | ) | | | 163 | |||||||||||||||||
Depreciation and amortization |
| (368 | ) | (640 | ) | (566 | ) | | (1,574 | ) | ||||||||||||||
Transfers between classifications |
| (8 | ) | 104 | | (96 | ) | | ||||||||||||||||
Decommissioning and restoration provision change in estimate |
| 501 | 24 | | | 525 | ||||||||||||||||||
Capitalized borrowing costs |
| 102 | | | 231 | 333 | ||||||||||||||||||
Reclassification of Waneta Dam to assets held for sale and other |
| 40 | (394 | ) | | | (354 | ) | ||||||||||||||||
Changes in foreign exchange rates |
(10 | ) | (240 | ) | (155 | ) | (39 | ) | (65 | ) | (509 | ) | ||||||||||||
|
|
|
|
|
|
|
|
|
|
|
|
|||||||||||||
Closing net book value |
$ | 1,774 | $ | 13,970 | $ | 5,742 | $ | 2,298 | $ | 5,261 | $ | 29,045 | ||||||||||||
|
|
|
|
|
|
|
|
|
|
|
|
|||||||||||||
At December 31, 2017 |
||||||||||||||||||||||||
Cost |
$ | 1,774 | $ | 19,329 | $ | 12,948 | $ | 4,561 | $ | 5,261 | $ | 43,873 | ||||||||||||
Accumulated depreciation |
| (5,359 | ) | (7,206 | ) | (2,263 | ) | | (14,828 | ) | ||||||||||||||
|
|
|
|
|
|
|
|
|
|
|
|
|||||||||||||
Net book value |
$ | 1,774 | $ | 13,970 | $ | 5,742 | $ | 2,298 | $ | 5,261 | $ | 29,045 | ||||||||||||
|
|
|
|
|
|
|
|
|
|
|
|
|||||||||||||
Year ended December 31, 2018 |
||||||||||||||||||||||||
Opening net book value |
$ | 1,774 | $ | 13,970 | $ | 5,742 | $ | 2,298 | $ | 5,261 | $ | 29,045 | ||||||||||||
Additions |
144 | 86 | 710 | 761 | 1,135 | 2,836 | ||||||||||||||||||
Disposals |
| | (12 | ) | | | (12 | ) | ||||||||||||||||
Asset impairments (Note 8) |
(31 | ) | (6 | ) | (4 | ) | | | (41 | ) | ||||||||||||||
Depreciation and amortization |
| (372 | ) | (595 | ) | (543 | ) | | (1,510 | ) | ||||||||||||||
Transfers between classifications |
| 1,050 | 3,307 | | (4,357 | ) | | |||||||||||||||||
Decommissioning and restoration provision change in estimate |
| (250 | ) | (29 | ) | | | (279 | ) | |||||||||||||||
Capitalized borrowing costs |
| 108 | | | 185 | 293 | ||||||||||||||||||
Other |
| (2 | ) | 56 | | | 54 | |||||||||||||||||
Changes in foreign exchange rates |
21 | 290 | 182 | 50 | 121 | 664 | ||||||||||||||||||
|
|
|
|
|
|
|
|
|
|
|
|
|||||||||||||
Closing net book value |
$ | 1,908 | $ | 14,874 | $ | 9,357 | $ | 2,566 | $ | 2,345 | $ | 31,050 | ||||||||||||
|
|
|
|
|
|
|
|
|
|
|
|
|||||||||||||
At December 31, 2018 |
||||||||||||||||||||||||
Cost |
$ | 1,908 | $ | 20,613 | $ | 17,452 | $ | 5,435 | $ | 2,345 | $ | 47,753 | ||||||||||||
Accumulated depreciation |
| (5,739 | ) | (8,095 | ) | (2,869 | ) | | (16,703 | ) | ||||||||||||||
|
|
|
|
|
|
|
|
|
|
|
|
|||||||||||||
Net book value |
$ | 1,908 | $ | 14,874 | $ | 9,357 | $ | 2,566 | $ | 2,345 | $ | 31,050 | ||||||||||||
|
|
|
|
|
|
|
|
|
|
|
|
34
16. | Property, Plant and Equipment (continued) |
a) | Exploration and Evaluation |
Significant exploration and evaluation projects in property, plant and equipment include primarily Galore Creek and non-Fort Hills oil sands properties in Alberta.
b) | Finance Leases |
The net carrying value of property, plant and equipment held under finance leases (Note 19(c)) at December 31, 2018 is $613 million (2017 $406 million), of which $504 million (2017 $192 million) is included in land, buildings, plant and equipment. During the year ended December 31, 2018, our share of the pipeline leases of Fort Hills were transferred from construction in progress to land, buildings, plant and equipment. Ownership of leased assets remains with the lessor.
c) | Borrowing Costs |
Borrowing costs are capitalized at a rate based on our weighted average cost of borrowing or at the rate on the project-specific debt, as applicable. These projects are shown as part of mineral properties and leases, land, buildings, plant and equipment, or construction in progress. Our weighted average borrowing rate used for capitalization of borrowing costs in 2018 was 5.9% (2017 5.8%).
17. | Goodwill |
(CAD$ in millions) |
Steelmaking Coal Operations |
Quebrada Blanca |
Total | |||||||||
January 1, 2017 |
$ | 702 | $ | 412 | $ | 1,114 | ||||||
Changes in foreign exchange rates |
| (27 | ) | (27 | ) | |||||||
|
|
|
|
|
|
|||||||
December 31, 2017 |
$ | 702 | $ | 385 | $ | 1,087 | ||||||
Changes in foreign exchange rates |
| 34 | 34 | |||||||||
|
|
|
|
|
|
|||||||
December 31, 2018 |
$ | 702 | $ | 419 | $ | 1,121 | ||||||
|
|
|
|
|
|
The results of our annual goodwill impairment analysis and key assumptions used in the analysis are outlined in Notes 8(b) and 8(c).
18. | Trade Accounts Payable and Other Liabilities |
December 31, 2018 |
December 31, 2017 |
January 1, 2017 |
||||||||||
(CAD$ in millions) |
|
(restated) | (restated) | |||||||||
Trade accounts payable and accruals |
$ | 1,185 | $ | 1,111 | $ | 943 | ||||||
Capital project accruals |
201 | 149 | 142 | |||||||||
Payroll-related liabilities |
361 | 420 | 252 | |||||||||
Accrued interest |
102 | 120 | 148 | |||||||||
Commercial and government royalties |
211 | 296 | 246 | |||||||||
Customer deposits |
67 | 19 | 18 | |||||||||
Current portion of provisions (Note 22(a)) |
155 | 133 | 71 | |||||||||
Settlement payables (Note 28(b)) |
45 | 39 | 43 | |||||||||
Other |
6 | 3 | 7 | |||||||||
|
|
|
|
|
|
|||||||
$ | 2,333 | $ | 2,290 | $ | 1,870 | |||||||
|
|
|
|
|
|
35
19. | Debt |
($ in millions) |
December 31, 2018 | December 31, 2017 | ||||||||||||||||||||||
Face | Carrying | Fair | Face | Carrying | Fair | |||||||||||||||||||
Value | Value | Value | Value | Value | Value | |||||||||||||||||||
(US$) | (CAD$) | (CAD$) | (US$) | (CAD$) | (CAD$) | |||||||||||||||||||
2.5% notes due February 2018 |
$ | | $ | | $ | | $ | 22 | $ | 28 | $ | 28 | ||||||||||||
4.5% notes due January 2021 (a)(b) |
117 | 159 | 159 | 220 | 274 | 285 | ||||||||||||||||||
4.75% notes due January 2022 (a)(b) |
202 | 275 | 275 | 672 | 841 | 884 | ||||||||||||||||||
3.75% notes due February 2023 (a)(b) |
220 | 295 | 286 | 646 | 804 | 818 | ||||||||||||||||||
8.5% notes due June 2024 |
600 | 819 | 883 | 600 | 753 | 853 | ||||||||||||||||||
6.125% notes due October 2035 |
609 | 818 | 802 | 609 | 751 | 865 | ||||||||||||||||||
6.0% notes due August 2040 |
490 | 666 | 621 | 491 | 613 | 686 | ||||||||||||||||||
6.25% notes due July 2041 |
795 | 1,072 | 1,031 | 795 | 986 | 1,144 | ||||||||||||||||||
5.2% notes due March 2042 |
399 | 537 | 465 | 399 | 494 | 502 | ||||||||||||||||||
5.4% notes due February 2043 |
377 | 509 | 449 | 377 | 468 | 481 | ||||||||||||||||||
|
|
|
|
|
|
|
|
|
|
|
|
|||||||||||||
3,809 | 5,150 | 4,971 | 4,831 | 6,012 | 6,546 | |||||||||||||||||||
Antamina term loan due April 2020 |
23 | 31 | 31 | 23 | 28 | 28 | ||||||||||||||||||
Finance lease liabilities (c) |
248 | 338 | 338 | 250 | 313 | 313 | ||||||||||||||||||
Other |
| | | 13 | 16 | 16 | ||||||||||||||||||
|
|
|
|
|
|
|
|
|
|
|
|
|||||||||||||
4,080 | 5,519 | 5,340 | 5,117 | 6,369 | 6,903 | |||||||||||||||||||
Less current portion of debt |
(24 | ) | (32 | ) | (32 | ) | (45 | ) | (55 | ) | (55 | ) | ||||||||||||
|
|
|
|
|
|
|
|
|
|
|
|
|||||||||||||
$ | 4,056 | $ | 5,487 | $ | 5,308 | $ | 5,072 | $ | 6,314 | $ | 6,848 | |||||||||||||
|
|
|
|
|
|
|
|
|
|
|
|
The fair values of debt are determined using market values, if available, and discounted cash flows based on our cost of borrowing where market values are not available. The latter are considered Level 2 fair value measurements with significant other observable inputs on the fair value hierarchy (Note 29).
The 2024 notes include a prepayment option that is considered to be an embedded derivative (Note 28(c)).
a) | Debt Transactions 2018 |
During the year ended December 31, 2018, we purchased US$1 billion aggregate principal amount of certain of our outstanding notes pursuant to cash tender offers. The principal amount of notes purchased was US$103 million of 4.5% notes due 2021, US$471 million of 4.75% notes due 2022, and US$426 million of 3.75% notes due 2023. The total cost of the purchases, which were funded from cash on hand, including the premiums, was US$1.01 billion. We recorded an expense of $26 million in non-operating income (expense) (Note 11) in connection with these purchases.
b) | Debt Transactions 2017 |
During the year ended December 31, 2017, we purchased US$1.26 billion aggregate principal amount of our outstanding notes pursuant to cash tender offers, make-whole redemptions and open-market purchases. The principal amount of notes purchased was US$278 million of 3.00% notes due 2019, US$280 million of 4.50% notes due January 2021, US$650 million of 8.00% notes due June 2021 (June 2021 notes), US$28 million of 4.75% notes due 2022 and US$24 million of 3.75% notes due 2023. The total cost of the purchases, which was funded from cash on hand, including the premiums, was US$1.36 billion. We recorded an expense of $216 million in non-operating income (expense) (Note 11) in connection with these purchases for the year ended December 31, 2017. The accounting charge of $216 million included $75 million relating to the write-off of the prepayment option recorded in other assets for the June 2021 notes (Note 28(c)).
36
19. | Debt (continued) |
c) | Finance Lease Liabilities |
As at December 31, 2018, the carrying amount of assets under finance leases was $613 million (2017 $406 million) (Note 16(b)) and the corresponding finance lease liabilities were $338 million (2017 $313 million).
Minimum lease payments in respect of finance lease liabilities and the effect of discounting are as follows:
(CAD$ in millions) |
December 31, 2018 |
December 31, 2017 |
||||||
Undiscounted minimum finance lease payments: |
||||||||
Less than one year |
$ | 50 | $ | 51 | ||||
One to five years |
147 | 134 | ||||||
Thereafter |
556 | 554 | ||||||
|
|
|
|
|||||
753 | 739 | |||||||
Effect of discounting |
(415 | ) | (426 | ) | ||||
|
|
|
|
|||||
Present value of minimum finance lease payments total finance lease liabilities |
338 | 313 | ||||||
Less current portion |
(32 | ) | (27 | ) | ||||
|
|
|
|
|||||
Long-term finance lease liabilities |
$ | 306 | $ | 286 | ||||
|
|
|
|
The present value of finance lease liabilities and their expected timing of payment are as follows:
(CAD$ in millions) |
December 31, 2018 |
December 31, 2017 |
||||||
Less than one year |
$ | 46 | $ | 48 | ||||
One to five years |
114 | 106 | ||||||
Thereafter |
178 | 159 | ||||||
|
|
|
|
|||||
Total |
$ | 338 | $ | 313 | ||||
|
|
|
|
Fort Hills entered into a service agreement in 2017 with TransCanada Corp. for the operation of the Northern Courier Pipeline to transport bitumen between Fort Hills and Fort McMurray, Alberta, for a period of 25 years with an option to renew for four additional five-year periods. As at December 31, 2018, our share of the related lease liability was $207 million (2017 $229 million).
d) | Optional Redemptions |
All of our outstanding notes, except the 2024 notes, are redeemable at any time by repaying the greater of the principal amount and the present value of the sum of the remaining scheduled principal and interest amounts discounted at a comparable treasury yield plus a stipulated spread, plus, in each case, accrued interest to, but not including, the date of redemption. In addition, the 2023, 2042 and 2043 notes issued in 2012 are callable at 100% (plus accrued interest to, but not including, the date of redemption) at any time on or after November 1, 2022, September 1, 2041, and August 1, 2042, respectively. The 2022 and 2041 notes issued in 2011 are callable at 100% at any time on or after October 15, 2021, and January 15, 2041, respectively. The January 2021 notes are callable at 100% on or after October 15, 2020, and the 2040 notes are callable at 100% on or after February 15, 2040. The 2024 notes issued in 2016 are callable on or after June 1, 2019 at predefined prices based on the date of redemption. Prior to June 1, 2019, the 2024 notes can be redeemed in whole or in part, at a redemption price equal to the principal amount plus accrued interest to, but not including, the date of redemption and a make-whole call premium.
37
19. | Debt (continued) |
e) | Revolving Facilities |
On November 23, 2018, we completed several amendments to our two committed revolving credit facilities. The size of our US$3.0 billion facility was increased to US$4.0 billion and its maturity was extended to November 2023. The size of our US$1.2 billion facility was reduced to US$600 million and its maturity was extended to November 2021. In addition, guarantees from material subsidiaries of our obligations under the facilities were released.
At December 31, 2018, the US$4.0 billion facility maturing November 2023 was undrawn and the US$600 million facility maturing November 2021 had an aggregate of US$573 million in outstanding letters of credit drawn against it.
Any amounts drawn under the committed revolving credit facilities can be repaid at any time and are due in full at maturity. Amounts outstanding under these facilities bear interest at LIBOR plus an applicable margin based on credit ratings. Both facilities require that our net debt-to-capitalization ratio, which was 0.13 to 1.0 at December 31, 2018, not exceed 0.55 to 1.0.
When our credit ratings are below investment grade, we are required to satisfy financial security requirements under power purchase agreements at Quebrada Blanca and transportation, tank storage and pipeline capacity agreements for our interest in Fort Hills. At December 31, 2018, we had an aggregate of US$822 million in letters of credit outstanding for these security requirements. These letters of credit will be terminated if and when we regain investment grade ratings and for the power purchase agreements will also be reduced, if, and when, certain project milestones are reached.
We maintain uncommitted bilateral credit facilities primarily for the issuance of letters of credit to support our future reclamation obligations. As at December 31, 2018, we were party to various uncommitted credit facilities providing for a total of $2.15 billion of capacity, and the aggregate outstanding letters of credit issued thereunder were $1.82 billion. In addition to the letters of credit outstanding under these uncommitted credit facilities, we also had stand-alone letters of credit of $369 million outstanding at December 31, 2018, which were not issued under a credit facility. These uncommitted credit facilities and stand-alone letters of credit are typically renewed on an annual basis.
We also have $350 million in surety bonds outstanding at December 31, 2018, to support current and future reclamation obligations.
f) | Scheduled Principal Payments |
At December 31, 2018, the scheduled principal payments excluding finance lease liabilities (c), during the next five years and thereafter are as follows:
($ in millions) |
US$ | CAD$ Equivalent |
||||||
2019 |
$ | | $ | | ||||
2020 |
23 | 31 | ||||||
2021 |
117 | 159 | ||||||
2022 |
202 | 275 | ||||||
2023 |
220 | 300 | ||||||
Thereafter |
3,270 | 4,462 | ||||||
|
|
|
|
|||||
$ | 3,832 | $ | 5,227 | |||||
|
|
|
|
38
19. | Debt (continued) |
g) | Debt Continuity |
($ in millions) |
US$ | CAD$ Equivalent | ||||||||||||||
2018 | 2017 | 2018 | 2017 | |||||||||||||
As at January 1 |
$ | 5,077 | $ | 6,213 | $ | 6,369 | $ | 8,343 | ||||||||
Cash flows |
||||||||||||||||
Scheduled debt repayments |
(22 | ) | (49 | ) | (28 | ) | (64 | ) | ||||||||
Debt repurchases |
(1,015 | ) | (1,356 | ) | (1,328 | ) | (1,831 | ) | ||||||||
Finance lease payments (c) |
(42 | ) | (26 | ) | (54 | ) | (34 | ) | ||||||||
Non-cash changes |
||||||||||||||||
Loss on debt repurchases (a)(b) |
20 | 105 | 26 | 141 | ||||||||||||
Changes in foreign exchange rates |
(20 | ) | | 472 | (424 | ) | ||||||||||
Finance lease liabilities (c) |
60 | 187 | 78 | 234 | ||||||||||||
Finance fees and discount amortization |
| 3 | 1 | 4 | ||||||||||||
Other |
(12 | ) | | (17 | ) | | ||||||||||
|
|
|
|
|
|
|
|
|||||||||
As at December 31 |
$ | 4,046 | $ | 5,077 | $ | 5,519 | $ | 6,369 | ||||||||
|
|
|
|
|
|
|
|
20. | Income Taxes |
a) | Provision for Income Taxes |
2018 | 2017 | |||||||
(CAD$ in millions) |
|
(restated) | ||||||
Current |
||||||||
Current taxes on profits for the year |
$ | 697 | $ | 1,009 | ||||
Adjustments for current taxes of prior periods |
(6 | ) | (15 | ) | ||||
|
|
|
|
|||||
Total current taxes |
$ | 691 | $ | 994 | ||||
|
|
|
|
|||||
Deferred |
||||||||
Origination and reversal of temporary differences |
$ | 686 | $ | 436 | ||||
Adjustments to deferred taxes of prior periods |
(16 | ) | 23 | |||||
Tax losses not recognized (recognition of previously unrecognized losses) |
4 | (9 | ) | |||||
Effect due to tax legislative changes |
| (19 | ) | |||||
|
|
|
|
|||||
Total deferred taxes |
$ | 674 | $ | 431 | ||||
|
|
|
|
|||||
$ | 1,365 | $ | 1,425 | |||||
|
|
|
|
39
20. | Income Taxes (continued) |
b) | Reconciliation of income taxes calculated at the Canadian statutory income tax rate to the actual provision for income taxes is as follows: |
2018 | 2017 | |||||||
(CAD$ in millions) |
|
(restated) | ||||||
Tax expense at the Canadian statutory income tax rate of 27% (2017 26.10%) |
$ | 1,217 | $ | 1,021 | ||||
Tax effect of: |
||||||||
Resource taxes |
360 | 368 | ||||||
Resource and depletion allowances |
(80 | ) | (127 | ) | ||||
Non-temporary differences including one-half of capital gains and losses |
(157 | ) | 14 | |||||
Tax pools not recognized (recognition of previously unrecognized tax pools) |
4 | (9 | ) | |||||
Effect due to tax legislative changes |
| (13 | ) | |||||
Withholding taxes |
47 | 57 | ||||||
Difference in tax rates in foreign jurisdictions |
2 | 129 | ||||||
Revisions to prior year estimates |
(21 | ) | 12 | |||||
Other |
(7 | ) | (27 | ) | ||||
|
|
|
|
|||||
$ | 1,365 | $ | 1,425 | |||||
|
|
|
|
c) | The amount of deferred tax expense charged (credited) to the income statement is as follows: |
2018 | 2017 | |||||||
(CAD$ in millions) |
|
(restated) | ||||||
Net operating loss carryforwards |
$ | 234 | $ | 127 | ||||
Capital allowances in excess of depreciation |
(92 | ) | 775 | |||||
Decommissioning and restoration provisions |
264 | (393 | ) | |||||
U.S. alternative minimum tax credits |
105 | (31 | ) | |||||
Unrealized foreign exchange losses |
(11 | ) | 89 | |||||
Withholding taxes |
25 | (10 | ) | |||||
Inventories |
32 | (12 | ) | |||||
Other temporary differences |
117 | (114 | ) | |||||
|
|
|
|
|||||
$ | 674 | $ | 431 | |||||
|
|
|
|
40
20. | Income Taxes (continued) |
d) | Temporary differences giving rise to deferred income tax assets and liabilities are as follows: |
December 31, 2018 |
December 31, 2017 |
January 1, 2017 |
||||||||||
(CAD$ in millions) |
|
(restated) | (restated) | |||||||||
Net operating loss carryforwards |
$ | 139 | $ | 58 | $ | 32 | ||||||
Property, plant and equipment |
(130 | ) | (189 | ) | 35 | |||||||
Decommissioning and restoration provisions |
94 | 78 | | |||||||||
U.S. alternative minimum tax credits |
| 143 | | |||||||||
Other temporary differences |
57 | 64 | 45 | |||||||||
|
|
|
|
|
|
|||||||
Deferred income tax assets |
$ | 160 | $ | 154 | $ | 112 | ||||||
|
|
|
|
|
|
|||||||
Net operating loss carryforwards |
$ | (750 | ) | $ | (1,065 | ) | $ | (1,218 | ) | |||
Property, plant and equipment |
7,422 | 7,390 | 6,881 | |||||||||
Decommissioning and restoration provisions |
(474 | ) | (754 | ) | (439 | ) | ||||||
U.S. alternative minimum tax credits |
(38 | ) | | (112 | ) | |||||||
Unrealized foreign exchange |
(146 | ) | (135 | ) | (224 | ) | ||||||
Withholding taxes |
104 | 79 | 89 | |||||||||
Inventories |
97 | 65 | 77 | |||||||||
Other temporary differences |
116 | (1 | ) | 32 | ||||||||
|
|
|
|
|
|
|||||||
Deferred income tax liabilities |
$ | 6,331 | $ | 5,579 | $ | 5,086 | ||||||
|
|
|
|
|
|
e) | The movement in the net deferred income taxes account is as follows: |
2018 | 2017 | |||||||
(CAD$ in millions) |
|
(restated) |
||||||
As at January 1 |
$ | 5,425 | $ | 4,974 | ||||
Income statement change |
674 | 431 | ||||||
Tax charge relating to components of other comprehensive income |
(47 | ) | 90 | |||||
Foreign exchange and other differences |
119 | (70 | ) | |||||
|
|
|
|
|||||
As at December 31 |
$ | 6,171 | $ | 5,425 | ||||
|
|
|
|
f) | Deferred Tax Liabilities Not Recognized |
Deferred tax liabilities of approximately $745 million (2017 $694 million) have not been recognized on the unremitted foreign earnings associated with investments in subsidiaries and interests in joint arrangements where we are in a position to control the timing of the reversal of the temporary differences, and it is probable that such differences will not reverse in the foreseeable future.
g) | Loss Carryforwards and Canadian Development Expenses |
At December 31, 2018, we had $2.91 billion of Canadian federal net operating loss carryforwards (2017 $3.63 billion). These loss carryforwards expire at various dates between 2029 and 2038. We have $685 million of cumulative Canadian development expenses at December 31, 2018 (2017 $981 million), which are deductible for income tax purposes on a declining balance basis at a maximum rate of 30% per year. The deferred tax benefits of these pools have been recognized. In addition, we have $106 million (2017 $104 million) of Canadian federal and provincial investment tax credits that expire at various dates between 2022 and 2038.
41
20. | Income Taxes (continued) |
h) | Deferred Tax Assets Not Recognized |
We have not recognized $239 million (2017 $231 million) of deferred tax assets associated with unused tax credits and tax pools in entities and jurisdictions that do not have established sources of taxable income.
i) | Scope of Antaminas Peruvian Tax Stability Agreement |
Subsequent to year end, the Peruvian tax authority, La Superintendencia Nacional de Aduanas y de Administración Tributaria (SUNAT), issued an income tax assessment to Antamina (our joint operation in which we own a 22.5% share) denying its accelerated depreciation allowance on costs incurred in 2013 related to the expansion of the Antamina mine, as provided under Antaminas tax stability agreement. If the assessment is sustained, our indirect share of the current tax debt that Antamina may have to pay, including interest and penalties, is estimated to be approximately $40 million (US$30 million). However, since these items are mainly a matter of timing rather than the ultimate liability, the resulting charge to our earnings would be approximately $20 million (US$15 million) consisting of interest and penalties. If SUNATs view on the scope of the tax stability agreement were sustained and extended to 2015 (being the last year of tax stability), our indirect share of the tax debt that Antamina may have to pay, including interest and penalties, could reach about $125 million (US$94 million) and the charge to our earnings could reach about $60 million (US$45 million). Based on opinions from Peruvian counsel, we believe that Antaminas original filing positions will ultimately prevail and Antamina will appeal the 2013 income tax assessment in due course. As a result, we have not provided for this matter in our financial statements as at December 31, 2018.
21. | Retirement Benefit Plans |
We have defined contribution pension plans for certain groups of employees. Our share of contributions to these plans is expensed in the year earned by employees.
We have multiple defined benefit pension plans registered in various jurisdictions that provide benefits based principally on employees years of service and average annual remuneration. These plans are only available to certain qualifying employees, and some are now closed to additional members. The plans are flat-benefit or final-pay plans and may provide for inflationary increases in accordance with certain plan provisions. All of our registered defined benefit pension plans are governed and administered in accordance with applicable pension legislation in either Canada or the United States. Actuarial valuations are performed at least every three years to determine minimum annual contribution requirements as prescribed by applicable legislation. For the majority of our plans, current service costs are funded based on a percentage of pensionable earnings or as a flat dollar amount per active member depending on the provisions of the pension plans. Actuarial deficits are funded in accordance with minimum funding regulations in each applicable jurisdiction. All of our defined benefit pension plans were actuarially valued within the past three years. While the majority of benefit payments are made from registered held-in-trust funds, there are also several unregistered and unfunded plans where benefit payment obligations are met as they fall due.
We also have several post-retirement benefit plans that provide post-retirement medical, dental and life insurance benefits to certain qualifying employees and surviving spouses. These plans are unfunded, and we meet benefit obligations as they come due.
42
21. | Retirement Benefit Plans (continued) |
a) | Actuarial Valuation of Plans |
(CAD$ in millions) |
2018 | 2017 | ||||||||||||||
Defined | Non-Pension | Defined | Non-Pension | |||||||||||||
Benefit | Post- | Benefit | Post- | |||||||||||||
Pension | Retirement | Pension | Retirement | |||||||||||||
Plans | Benefit Plans | Plans | Benefit Plans | |||||||||||||
Defined benefit obligation |
||||||||||||||||
Balance at beginning of year |
$ | 2,224 | $ | 455 | $ | 2,106 | $ | 538 | ||||||||
Current service cost |
50 | 19 | 48 | 24 | ||||||||||||
Past service costs arising from plan improvements |
| | 10 | | ||||||||||||
Benefits paid |
(139 | ) | (19 | ) | (153 | ) | (23 | ) | ||||||||
Interest expense |
73 | 17 | 79 | 22 | ||||||||||||
Obligation experience adjustments |
26 | (30 | ) | 27 | (22 | ) | ||||||||||
Effect from change in financial assumptions |
(127 | ) | (35 | ) | 119 | 25 | ||||||||||
Effect from change in demographic assumptions |
4 | (20 | ) | | (104 | ) | ||||||||||
Changes in foreign exchange rates |
14 | 5 | (12 | ) | (5 | ) | ||||||||||
|
|
|
|
|
|
|
|
|||||||||
Balance at end of year |
2,125 | 392 | 2,224 | 455 | ||||||||||||
Fair value of plan assets |
||||||||||||||||
Fair value at beginning of year |
2,510 | | 2,342 | | ||||||||||||
Interest income |
82 | | 88 | | ||||||||||||
Return on plan assets, excluding amounts included in interest income |
(84 | ) | | 212 | | |||||||||||
Benefits paid |
(139 | ) | (19 | ) | (153 | ) | (23 | ) | ||||||||
Contributions by the employer |
42 | 19 | 31 | 23 | ||||||||||||
Changes in foreign exchange rates |
12 | | (10 | ) | | |||||||||||
|
|
|
|
|
|
|
|
|||||||||
Fair value at end of year |
2,423 | | 2,510 | | ||||||||||||
|
|
|
|
|
|
|
|
|||||||||
Funding surplus (deficit) |
298 | (392 | ) | 286 | (455 | ) | ||||||||||
|
|
|
|
|
|
|
|
|||||||||
Less effect of the asset ceiling |
||||||||||||||||
Balance at beginning of year |
44 | | 58 | | ||||||||||||
Interest on asset ceiling |
1 | | 3 | | ||||||||||||
Change in asset ceiling |
89 | | (17 | ) | | |||||||||||
|
|
|
|
|
|
|
|
|||||||||
Balance at end of year |
134 | | 44 | | ||||||||||||
|
|
|
|
|
|
|
|
|||||||||
Net accrued retirement benefit asset (liability) |
$ | 164 | $ | (392 | ) | $ | 242 | $ | (455 | ) | ||||||
|
|
|
|
|
|
|
|
|||||||||
Represented by: |
||||||||||||||||
Pension assets (Note 14) |
$ | 254 | $ | | $ | 339 | $ | | ||||||||
Accrued retirement benefit liability |
(90 | ) | (392 | ) | (97 | ) | (455 | ) | ||||||||
|
|
|
|
|
|
|
|
|||||||||
Net accrued retirement benefit asset (liability) |
$ | 164 | $ | (392 | ) | $ | 242 | $ | (455 | ) | ||||||
|
|
|
|
|
|
|
|
A number of the plans have a surplus totalling $134 million at December 31, 2018 (December 31, 2017 $44 million), which is not recognized on the basis that future economic benefits are not available to us in the form of a reduction in future contributions or a cash refund.
In 2018, we recorded a $19 million gain (2017 $104 million) through other comprehensive income (loss) as a result of changes in assumptions related to a reduction in future Medical Services Plan premiums required for post-retirement benefit plan members in the province of British Columbia.
43
21. | Retirement Benefit Plans (continued) |
We expect to contribute $22 million to our defined benefit pension plans in 2019 based on minimum funding requirements. The weighted average duration of the defined benefit pension obligation is 14 years and the weighted average duration of the non-pension post-retirement benefit obligation is 16 years.
Defined contribution expense for 2018 was $47 million (2017 $44 million).
b) | Significant Assumptions |
The discount rate used to determine the defined benefit obligations and the net interest cost was determined by reference to the market yields on high-quality debt instruments at the measurement date with durations similar to the duration of the expected cash flows of the plans.
Weighted average assumptions used to calculate the defined benefit obligation at the end of each year are as follows:
2018 | 2017 | |||||||||||||||
Non-Pension | Non-Pension | |||||||||||||||
Defined | Post- | Defined | Post- | |||||||||||||
Benefit | Retirement | Benefit | Retirement | |||||||||||||
Pension | Benefit | Pension | Benefit | |||||||||||||
Plans | Plans | Plans | Plans | |||||||||||||
Discount rate |
3.78 | % | 3.88 | % | 3.36 | % | 3.44 | % | ||||||||
Rate of increase in future compensation |
3.25 | % | 3.25 | % | 3.25 | % | 3.25 | % | ||||||||
Medical trend rate |
| 5.00 | % | | 5.00 | % |
c) | Sensitivity of the defined benefit obligation to changes in the weighted average assumptions: |
2018 | ||||||||||||
Effect on Defined Benefit Obligation | ||||||||||||
Change in Assumption |
Increase in Assumption |
Decrease in Assumption |
||||||||||
Discount rate |
1.0 | % | Decrease by 12 | % | Increase by 14 | % | ||||||
Rate of increase in future compensation |
1.0 | % | Increase by 1 | % | Decrease by 1 | % | ||||||
Medical cost claim trend rate |
1.0 | % | Increase by 1 | % | Decrease by 1 | % | ||||||
2017 | ||||||||||||
Effect on Defined Benefit Obligation | ||||||||||||
Change in Assumption |
Increase in Assumption |
Decrease in Assumption |
||||||||||
Discount rate |
1.0 | % | Decrease by 15 | % | Increase by 17 | % | ||||||
Rate of increase in future compensation |
1.0 | % | Increase by 1 | % | Decrease by 1 | % | ||||||
Medical cost claim trend rate |
1.0 | % | Increase by 2 | % | Decrease by 2 | % |
The above sensitivity analyses are based on a change in each actuarial assumption while holding all other assumptions constant. The sensitivity analyses on our defined benefit obligation are calculated using the same methods as those used for calculating the defined benefit obligation recognized on our balance sheet. The methods and types of assumptions used in preparing the sensitivity analyses did not change from the prior period.
44
21. | Retirement Benefit Plans (continued) |
d) | Mortality Assumptions |
Assumptions regarding future mortality are set based on managements best estimate in accordance with published mortality tables and expected experience. These assumptions translate into the following average life expectancies for an employee retiring at age 65:
2018 | 2017 | |||||||||||||||
Male | Female | Male | Female | |||||||||||||
Retiring at the end of the reporting period |
85.2 years | 87.7 years | 85.2 years | 87.6 years | ||||||||||||
Retiring 20 years after the end of the reporting period |
86.3 years | 88.6 years | 86.3 years | 88.6 years |
e) | Significant Risks |
The defined benefit pension plans and post-retirement benefit plans expose us to a number of risks, the most significant of which include asset volatility risk, changes in bond yields, and an increase in life expectancy.
Asset volatility risk
The discount rate used to determine the defined benefit obligations is based on AA-rated corporate bond yields. If our plan assets underperform this yield, the deficit will increase. Our strategic asset allocation includes a significant proportion of equities that increases volatility in the value of our assets, particularly in the short term. We expect equities to outperform corporate bonds in the long term.
Changes in bond yields
A decrease in bond yields increases plan liabilities, which are partially offset by an increase in the value of the plans bond holdings.
Life expectancy
The majority of the plans obligations are to provide benefits for the life of the member. Increases in life expectancy will result in an increase in the plans liabilities.
f) | Investment of Plan Assets |
The assets of our defined benefit pension plans are managed by external asset managers under the oversight of the Teck Resources Limited Executive Pension Committee.
Our pension plan investment strategies support the objectives of each defined benefit plan and are related to each plans demographics and timing of expected benefit payments to plan members. The objective for the plan asset portfolios is to achieve annualized portfolio returns over five-year periods in excess of the annualized percentage change in the Consumer Price Index plus a certain premium.
Strategic asset allocation policies have been developed for each defined benefit plan to achieve this objective. The policies also reflect an asset/liability matching framework that seeks to reduce the effect of interest rate changes on each plans funded status by matching the duration of the bond investments with the duration of the pension liabilities. We do not use derivatives to manage interest risk. Asset allocation is monitored at least quarterly and rebalanced if the allocation to any asset class exceeds its allowable allocation range. Portfolio and investment manager performance is monitored quarterly and the investment guidelines for each plan are reviewed at least annually.
45
21. | Retirement Benefit Plans (continued) |
The defined benefit pension plan assets at December 31, 2018 and 2017 are as follows:
(CAD$ in millions) |
2018 | 2017 | ||||||||||||||||||||||
Quoted | Unquoted | Total % | Quoted | Unquoted | Total % | |||||||||||||||||||
Equity securities |
$ | 850 | $ | | 35 | % | $ | 1,184 | $ | | 47 | % | ||||||||||||
Debt securities |
$ | 1,225 | $ | | 51 | % | $ | 935 | $ | | 37 | % | ||||||||||||
Real estate and other |
$ | 91 | $ | 257 | 14 | % | $ | 74 | $ | 317 | 16 | % |
22. | Provisions and Other Liabilities |
(CAD$ in millions) |
December 31, 2018 |
December 31, 2017 |
||||||
Provisions (a) |
$ | 1,653 | $ | 1,905 | ||||
Derivative liabilities (net of current portion of $6 (2017 $nil)) |
39 | 43 | ||||||
IMSA payable |
58 | | ||||||
Other |
42 | 29 | ||||||
|
|
|
|
|||||
$ | 1,792 | $ | 1,977 | |||||
|
|
|
|
a) | Provisions |
The following table summarizes the movements in provisions for the year ended December 31, 2018:
(CAD$ in millions) |
Decommissioning and |
Other |
Total |
|||||||||
As at January 1, 2018 |
$ | 1,844 | $ | 194 | $ | 2,038 | ||||||
Settled during the year |
(76 | ) | (29 | ) | (105 | ) | ||||||
Change in discount rate |
(409 | ) | | (409 | ) | |||||||
Change in amount and timing of cash flows |
111 | 18 | 129 | |||||||||
Accretion |
101 | 2 | 103 | |||||||||
Other |
(2 | ) | | (2 | ) | |||||||
Changes in foreign exchange rates |
45 | 9 | 54 | |||||||||
|
|
|
|
|
|
|||||||
As at December 31, 2018 |
1,614 | 194 | 1,808 | |||||||||
Less current portion of provisions (Note 18) |
(91 | ) | (64 | ) | (155 | ) | ||||||
|
|
|
|
|
|
|||||||
Long-term provisions |
$ | 1,523 | $ | 130 | $ | 1,653 | ||||||
|
|
|
|
|
|
During the year ended December 31, 2018, we recorded $33 million (2017 $121 million) of additional study and environmental costs arising from legal obligations through other provisions.
Decommissioning and Restoration Provisions
The decommissioning and restoration provisions represent the present value of estimated costs for required future decommissioning and other site restoration activities. The majority of the decommissioning and site restoration expenditures occur at the end of, or after, the life of the related operation. Our provision for these expenditures was $1,160 million as at December 31, 2018. After the end of the life of certain operations, water quality management costs may extend for periods in excess of 100 years. Our provision for these expenditures was $454 million as at December 31, 2018. In 2018, the decommissioning and restoration provision was calculated using nominal discount rates between 6.49% and 7.99%. We also used an inflation rate of 2.00% in our cash flow estimates. The decommissioning and restoration provision includes $249 million (2017 $270 million) in respect of closed operations.
46
23. | Equity |
a) | Authorized Share Capital |
Our authorized share capital consists of an unlimited number of Class A common shares without par value, an unlimited number of Class B subordinate voting shares (Class B shares) without par value and an unlimited number of preferred shares without par value issuable in series.
Class A common shares carry the right to 100 votes per share. Class B shares carry the right to one vote per share. Each Class A common share is convertible, at the option of the holder, into one Class B share. In all other respects, the Class A common shares and Class B shares rank equally.
The attributes of the Class B subordinate voting shares contain so-called coattail provisions, which provide that, in the event that an offer (an Exclusionary Offer) to purchase Class A common shares, which is required to be made to all or substantially all holders thereof, is not made concurrently with an offer to purchase Class B subordinate voting shares on identical terms, then each Class B subordinate voting share will be convertible into one Class A common share at the option of the holder during a certain period provided that any Class A common shares received upon such conversion are deposited to the Exclusionary Offer. Any Class B subordinate voting shares converted into Class A common shares pursuant to such conversion right will automatically convert back to Class B subordinate voting shares in the event that any such shares are withdrawn from the Exclusionary Offer or not otherwise ultimately taken up and paid for under the Exclusionary Offer.
The Class B subordinate voting shares will not be convertible in the event that holders of a majority of the Class A common shares (excluding those shares held by the offeror making the Exclusionary Offer) certify to Teck that they will not, among other things, tender their Class A common shares to the Exclusionary Offer.
If an offer to purchase Class A common shares does not, under applicable securities legislation or the requirements of any stock exchange having jurisdiction, constitute a take-over bid or is otherwise exempt from any requirement that such offer be made to all or substantially all holders of Class A common shares, the coattail provisions will not apply.
b) | Class A Common Shares and Class B Subordinate Voting Shares Issued and Outstanding |
Class A | Class B | |||||||
Common | Subordinate | |||||||
Shares (in 000s) |
Shares |
Voting Shares |
||||||
As at January 1, 2017 |
9,353 | 567,546 | ||||||
Class A shares conversion |
(1,576 | ) | 1,576 | |||||
Options exercised (c) |
| 2,275 | ||||||
Acquired and cancelled pursuant to normal course issuer bid (h) |
| (5,891 | ) | |||||
|
|
|
|
|||||
As at December 31, 2017 |
7,777 | 565,506 | ||||||
Class A shares conversion |
(9 | ) | 9 | |||||
Options exercised (c) |
| 3,710 | ||||||
Acquired and cancelled pursuant to normal course issuer bid (h) |
| (6,300 | ) | |||||
|
|
|
|
|||||
As at December 31, 2018 |
7,768 | 562,925 | ||||||
|
|
|
|
During the year ended December 31, 2017, 1,576,166 Class A common shares were converted into the same number of Class B subordinate voting shares. As a result of this conversion, the percentage of total votes attached to outstanding Class A common shares was reduced from 62.2% to 57.7%.
c) | Share Options |
The maximum number of Class B shares issuable to full-time employees pursuant to options granted under our current stock option plan is 28 million. As at December 31, 2018, 3,443,007 share options remain available for grant. The exercise price for each option is the closing price for our Class B shares on the last trading day before the date of grant. Our share options are settled through the issuance of Class B shares.
47
23. | Equity (continued) |
During the year ended December 31, 2018, we granted 1,575,355 Class B share options to employees. These share options have a weighted average exercise price of $37.44, vest in equal amounts over three years, and have a term of 10 years.
The weighted average fair value of Class B share options granted in the year was estimated at $11.10 per option (2017 $8.32) at the grant date based on the Black-Scholes option-pricing model using the following assumptions:
2018 | 2017 | |||||||
Weighted average exercise price |
$ | 37.44 | $ | 27.79 | ||||
Dividend yield |
2.67 | % | 2.20 | % | ||||
Risk-free interest rate |
2.06 | % | 1.06 | % | ||||
Expected option life |
4.2 years | 4.2 years | ||||||
Expected volatility |
41 | % | 42 | % | ||||
Forfeiture rate |
0.54 | % | 0.36 | % |
The expected volatility is based on a statistical analysis of historical daily share prices over a period equal to the expected option life.
Outstanding share options are as follows:
2018 | 2017 | |||||||||||||||
Share | Weighted | Share | Weighted | |||||||||||||
Options | Average | Options | Average | |||||||||||||
(in 000s) | Exercise Price | (in 000s) | Exercise Price | |||||||||||||
Outstanding at beginning of year |
22,068 | $ | 19.52 | 22,854 | $ | 18.38 | ||||||||||
Granted |
1,575 | 37.44 | 2,011 | 27.79 | ||||||||||||
Exercised |
(3,710 | ) | 14.58 | (2,275 | ) | 11.47 | ||||||||||
Forfeited |
(107 | ) | 32.92 | (78 | ) | 16.25 | ||||||||||
Expired |
(51 | ) | 37.56 | (444 | ) | 40.40 | ||||||||||
|
|
|
|
|
|
|
|
|||||||||
Outstanding at end of year |
19,775 | $ | 21.75 | 22,068 | $ | 19.52 | ||||||||||
|
|
|
|
|
|
|
|
|||||||||
Vested and exercisable at end of year |
14,036 | $ | 22.83 | 12,266 | $ | 24.94 | ||||||||||
|
|
|
|
|
|
|
|
The average share price during the year was $32.55 (2017 $27.86).
Information relating to share options outstanding at December 31, 2018, is as follows:
Outstanding Share Options (in 000s) |
Exercise Price Range |
Weighted Average Remaining Life of Outstanding Options (months) |
||||||
6,411 | $ | 4.15 $ 12.35 | 78 | |||||
3,634 | $ | 12.36 $ 20.14 | 71 | |||||
2,218 | $ | 20.15 $ 26.79 | 59 | |||||
4,386 | $ | 26.80 $ 36.85 | 63 | |||||
3,126 | $ | 36.86 $ 58.80 | 68 | |||||
|
|
|
|
|
||||
19,775 |
$ | 4.15 $ 58.80 | 70 | |||||
|
|
|
|
|
Total share option compensation expense recognized for the year was $17 million (2017 $17 million).
48
23. | Equity (continued) |
d) | Deferred Share Units, Restricted Share Units, Performance Share Units and Performance Deferred Share Units |
We have issued and outstanding deferred share units (DSUs), restricted share units (RSUs), performance share units (PSUs) and performance deferred share units (PDSUs) (collectively, Units).
As of 2017, DSUs are granted to directors only. RSUs are granted to both employees and directors. PSUs and PDSUs are granted to certain officers only. DSUs entitle the holder to a cash payment equal to the closing price of one Class B subordinate voting share on the Toronto Stock Exchange on the day prior to exercise. RSUs entitle the holder to a cash payment equal to the weighted average trading price of one Class B share on the Toronto Stock Exchange over either 10 or 20 consecutive trading days prior to the payout date, depending on the date issued. PSUs granted prior to 2017 vest in a percentage of the original grant varying from 0% to 200% based on our total shareholder return ranking compared to a group of specified companies. PSUs issued in 2018 and 2017 vest in a percentage from 0% to 200% based on both relative total shareholder return and a calculation based on the change in EBITDA over the vesting period divided by the change in a weighted commodity price index. Once vested, PSUs entitle the holder to a cash payment equal to the weighted average trading price of one Class B subordinate voting share on the Toronto Stock Exchange over either 10 or 20 consecutive trading days prior to vesting, depending on the date issued. Officers granted PSUs in 2018 and 2017 can elect on the grant date to receive PSUs or PDSUs, which pay out following termination of employment as described below.
RSUs, PSUs, and PDSUs vest on December 20 in the year prior to the third anniversary of the grant date. DSUs vest immediately for directors, and on the December 20 in the year prior to the third anniversary of the grant date for employees. Units vest on a pro rata basis if employees retire or are terminated without cause, and unvested units are forfeited if employees resign or are terminated with cause.
DSUs and PDSUs may be exercised on or before December 15 of the first calendar year commencing after the date on which the participant ceases to be a director or employee. RSUs and PSUs pay out on the vesting date.
Additional Units are issued to Unit holders to reflect dividends paid and other adjustments to Class B subordinate voting shares.
In 2018, we recognized compensation expense of $42 million for Units (2017 $108 million). The total liability and intrinsic value for vested Units as at December 31, 2018 was $103 million (2017 $185 million).
The outstanding Units are summarized in the following table:
(in 000s) |
2018 | 2017 | ||||||||||||||
Outstanding | Vested | Outstanding | Vested | |||||||||||||
DSUs |
2,644 | 2,644 | 2,648 | 2,423 | ||||||||||||
RSUs |
821 | 381 | 2,823 | 1,699 | ||||||||||||
PSUs |
667 | 312 | 1,517 | 869 | ||||||||||||
PDSUs |
123 | 61 | 70 | 20 | ||||||||||||
|
|
|
|
|
|
|
|
|||||||||
4,255 | 3,398 | 7,058 | 5,011 | |||||||||||||
|
|
|
|
|
|
|
|
49
23. | Equity (continued) |
e) | Accumulated Other Comprehensive Income |
(CAD$ in millions) |
2018 |
2017 (restated) |
||||||
Accumulated other comprehensive income beginning of year |
$ | 244 | $ | 450 | ||||
IFRS 9 transition adjustment on January 1, 2018 (Note 32(c)) |
(34 | ) | | |||||
Currency translation differences: |
||||||||
Unrealized gains (losses) on translation of foreign subsidiaries |
638 | (536 | ) | |||||
Foreign exchange differences on debt designated as a hedge of our investment in foreign subsidiaries (net of taxes of $40 and $(46)) |
(255 | ) | 341 | |||||
|
|
|
|
|||||
383 | (195 | ) | ||||||
Marketable equity and debt securities (2017 Available-for-sale financial assets): |
||||||||
Unrealized loss on marketable equity and debt securities (2017 available-for-sale financial assets) (net of taxes of $1 and $1) |
(10 | ) | (4 | ) | ||||
Realized gain on marketable equity and debt securities (net of taxes of $nil and $nil) |
1 | | ||||||
Realized loss on available-for-sale financial assets reclassified to profit (net of taxes of $nil and $1) |
| (6 | ) | |||||
|
|
|
|
|||||
(9 | ) | (10 | ) | |||||
Share of other comprehensive loss of associates and joint ventures |
| (1 | ) | |||||
Remeasurements of retirement benefit plans (net of taxes of $(2) and $(55)) |
8 | 129 | ||||||
|
|
|
|
|||||
Total other comprehensive income (loss) |
382 | (77 | ) | |||||
Less remeasurements of retirement benefit plans recorded in retained earnings |
(8 | ) | (129 | ) | ||||
|
|
|
|
|||||
Accumulated other comprehensive income end of year |
$ | 584 | $ | 244 | ||||
|
|
|
|
f) | Earnings Per Share |
The following table reconciles our basic and diluted earnings per share:
(CAD$ in millions, except per share data) |
2018 |
2017 (restated) |
||||||
Net basic and diluted profit attributable to shareholders of the company |
$ | 3,107 | $ | 2,460 | ||||
|
|
|
|
|||||
Weighted average shares outstanding (000s) |
573,905 | 577,482 | ||||||
Dilutive effect of share options |
8,233 | 8,910 | ||||||
|
|
|
|
|||||
Weighted average diluted shares outstanding (000s) |
582,138 | 586,392 | ||||||
|
|
|
|
|||||
Basic earnings per share |
$ | 5.41 | $ | 4.26 | ||||
Diluted earnings per share |
$ | 5.34 | $ | 4.19 | ||||
|
|
|
|
At December 31, 2018, 5,458,816 (2017 4,240,949) potentially dilutive shares were not included in the diluted earnings per share calculation because their effect was anti-dilutive.
g) | Dividends |
We declared and paid dividends on our Class A common and Class B subordinate voting shares of $0.05 per share in each of the first three quarters of 2018, $0.15 per share in the fourth quarter of 2018 and $0.10, $0.05 and $0.45 per share in the second, third and fourth quarters of 2017, respectively.
50
23. | Equity (continued) |
h) | Normal Course Issuer Bid |
On occasion, we purchase and cancel Class B subordinate voting shares pursuant to normal course issuer bids that allow us to purchase up to a specified maximum number of shares over a one-year period.
In 2018, we purchased 6,539,558 Class B subordinate voting shares under our normal course issuer bids. As at December 31, 2018, of the shares repurchased, 6,299,558 shares have been cancelled and 240,000 shares are pending cancellation.
24. | Non-Controlling Interests |
Set out below is information about our subsidiaries with non-controlling interests and the non-controlling interest balances included in equity.
(CAD$ in millions) |
Principal Place of Business |
Percentage of
Ownership Interest and Voting Rights Held by Non-Controlling Interest |
December 31, 2018 |
December 31, 2017 |
||||||||||||
Carmen de Andacollo |
Region IV, Chile | 10 | % | $ | 32 | $ | 34 | |||||||||
Quebrada Blanca (a) |
Region I, Chile | 10 | % | 10 | 30 | |||||||||||
Elkview Mine Limited Partnership |
|
British Columbia, Canada |
|
5 | % | 59 | 53 | |||||||||
Compañía Minera Zafranal S.A.C. |
|
Arequipa Region, Peru |
|
20 | % | 33 | 25 | |||||||||
|
|
|
|
|||||||||||||
$ | 134 | $ | 142 | |||||||||||||
|
|
|
|
a) | During the year ended December 31, 2018, we acquired an additional 13.5% interest in QBSA (Note 5(a)). The total fair value of the transaction of $175 million was recorded as a reduction of our non-controlling interests by $16 million and equity by $159 million. |
51
25. | Contingencies |
We consider provisions for all of our outstanding and pending legal claims to be adequate. The final outcome with respect to actions outstanding or pending as at December 31, 2018, or with respect to future claims, cannot be predicted with certainty. Significant contingencies not disclosed elsewhere in the notes to our financial statements are as follows:
Upper Columbia River Basin
Teck American Inc. (TAI) continues studies under the 2006 settlement agreement with the U.S. Environmental Protection Agency (EPA) to conduct a remedial investigation on the Upper Columbia River in Washington state. Residential soil testing within the study site has identified certain properties where remediation is required. TAI and EPA have reached an agreement regarding remediation to be undertaken, and that work is ongoing.
The Lake Roosevelt litigation involving TML in the Federal District Court for the Eastern District of Washington continues. In September 2012, TML entered into an agreement with the plaintiffs, agreeing that certain facts were established for purposes of the litigation. The agreement stipulated that some portion of the slag discharged from TMLs Trail Operations into the Columbia River between 1896 and 1995, and some portion of the effluent discharged from Trail Operations, have been transported to and are present in the Upper Columbia River in the United States, and that some hazardous substances from the slag and effluent have been released into the environment within the United States. In December 2012, the Court found in favour of the plaintiffs in phase one of the case, issuing a declaratory judgment that TML is liable under the Comprehensive Environmental Response, Compensation, and Liability Act (CERCLA) for response costs, the amount of which will be determined in later phases of the case. In August 2016 the District Court ruled in favour of the Tribal plaintiffs awarding approximately US$9 million in past response costs and TML appealed that decision, along with certain other findings in the first phase of the case, in the Ninth Circuit Court of Appeals, which upheld the trial court ruling in September 2018. TML applied for rehearing of the Ninth Circuit ruling, which was denied, and is seeking leave to appeal certain findings in phase one of the case to the United States Supreme Court.
A District Court ruling in favour of plaintiffs on a motion seeking recovery from TML for environmental response costs, and in a subsequent proceeding, natural resource damages and assessment costs, arising from the alleged deposition of hazardous substances in the United States from aerial emissions from TMLs Trail Operations was overturned on appeal in the Ninth Circuit in July 2016, with the result that alleged damages associated with air emissions are no longer part of the case.
A hearing with respect to natural resource damages and assessment costs is expected to follow resolution of appeals with respect to issues raised in the first phase of the litigation and completion of the remedial investigation and Feasibility Study being undertaken by TAI.
There is no assurance that we will ultimately be successful in our defence of the litigation or that we or our affiliates will not be faced with further liability in relation to this matter. Until the studies contemplated by the EPA settlement agreement and additional damage assessments are completed, it is not possible to estimate the extent and cost, if any, of any additional remediation or restoration that may be required or to assess our potential liability for damages. The studies may conclude, on the basis of risk, cost, technical feasibility or other grounds, that no remediation other than some residential soil removal should be undertaken. If other remediation is required and damage to resources found, the cost of that remediation may be material.
Elk Valley Water Quality
During the year ended December 31, 2018, Teck Coal Limited (TCL) received notice from Canadian federal prosecutors of potential charges under the Fisheries Act in connection with discharges of selenium and calcite from coal mines in the Elk Valley. Since 2014, compliance limits and site performance objectives for selenium and other constituents, as well as requirements to address calcite, in surface water throughout the Elk Valley and in the Koocanusa Reservoir have been established under a regional permit issued by the provincial government in British Columbia. This permit references the Elk Valley Water Quality Plan, an area-based management plan developed by Teck in accordance with a 2013 Order of the British Columbia Minister of Environment. If federal charges are laid, potential penalties may include fines as well as orders with respect to operational matters. It is not possible at this time to fully assess the viability of TCLs potential defences to any charges, or to estimate the potential financial impact on TCL of any conviction. Nonetheless, that impact may be material.
52
26. | Commitments |
a) | Capital Commitments |
As at December 31, 2018, we had contracted for $724 million of capital expenditures that have not yet been incurred for the purchase of property, plant and equipment. This amount includes $562 million for QB2, $113 million for our steelmaking coal operations and $49 million for our 22.5% share of Antamina. The amount includes $638 million that is expected to be incurred within one year and $86 million within two to five years.
b) | Operating Lease Commitments |
We lease office premises, mining equipment and rail facilities under operating leases. The terms of these leases are up to 17 years.
TAK leases road and port facilities from the Alaska Industrial Development and Export Authority, through which it ships all concentrates produced at the Red Dog Operations. The lease requires TAK to pay a minimum annual user fee of US$18 million for the next four years and US$6 million for the following 18 years, totalling US$173 million over 22 years.
The future aggregate minimum lease payments under non-cancellable operating leases are as follows:
(CAD$ in millions) |
2018 | 2017 | ||||||
Less than one year |
$ | 113 | $ | 93 | ||||
One to five years |
162 | 179 | ||||||
Thereafter |
164 | 327 | ||||||
|
|
|
|
|||||
$ | 439 | $ | 599 | |||||
|
|
|
|
Total operating lease expenses were $118 million (2017 $113 million). This consists of $13 million (2017 $13 million) for office premises, $66 million (2017 $60 million) for mining equipment, $6 million (2017 $12 million) for rail facilities and $33 million (2017 $28 million) for road and port facilities.
c) | Red Dog Royalty |
In accordance with the operating agreement governing the Red Dog mine, TAK pays a royalty to NANA Regional Corporation, Inc. (NANA) on the net proceeds of production. A 25% royalty became payable in the third quarter of 2007 after we had recovered cumulative advance royalties previously paid to NANA. The net proceeds of production royalty rate will increase by 5% every fifth year to a maximum of 50%. The increase to 35% of net proceeds of production occurred in the fourth quarter of 2017. An expense of US$252 million was recorded in 2018 (2017 US$324 million) in respect of this royalty.
d) | Antamina Royalty |
Our interest in the Antamina mine is subject to a net profits royalty equivalent to 7.4% of our share of the mines free cash flow. An expense of $25 million was recorded in 2018 (2017 $28 million) in respect of this royalty.
e) | Purchase Commitments |
We have a number of forward purchase commitments for the purchase of concentrates and other process inputs, and for shipping and distribution of products, which are incurred in the normal course of business. The majority of these contracts are subject to force majeure provisions.
We have contractual arrangements for the purchase of 240 megawatts of power for the expansion of our Quebrada Blanca Operations. These contracts contain monthly fixed prices and variable prices per hour and were effective from dates between November 2016 and January 2018. We also have a contractual arrangement to purchase power for our Trail Operations for 20 years, with an option to extend for a further 10 years. This arrangement requires a payment of $75 million per year, escalating at 2% per year (Note 5(b)).
53
27. | Segmented Information |
Based on the primary products we produce and our development projects, we have five reportable segments steelmaking coal, copper, zinc, energy and corporate which is the way we report information to our Chief Executive Officer. The corporate segment includes all of our initiatives in other commodities, our corporate growth activities, and groups that provide administrative, technical, financial and other support to all of our business units. Other operating expenses include general and administration costs, exploration, research and development, and other operating income (expenses). Sales between segments are carried out on terms that arms-length parties would use. Total assets does not include intra-group receivables between segments. Deferred tax assets have been allocated amongst segments.
(CAD$ in millions) |
December 31, 2018 | |||||||||||||||||||||||
Steelmaking Coal | Copper | Zinc | Energy | Corporate | Total | |||||||||||||||||||
Segment revenues |
$ | 6,349 | $ | 2,714 | $ | 3,744 | $ | 407 | $ | | $ |
13,214 |
| |||||||||||
Less: Intra-segment revenues |
| | (650 | ) | | | (650 | ) | ||||||||||||||||
|
|
|
|
|
|
|
|
|
|
|
|
|||||||||||||
Revenues |
6,349 | 2,714 | 3,094 | 407 | | 12,564 | ||||||||||||||||||
Cost of sales |
(3,309 | ) | (1,837 | ) | (2,225 | ) | (572 | ) | | (7,943 | ) | |||||||||||||
|
|
|
|
|
|
|
|
|
|
|
|
|||||||||||||
Gross profit (loss) |
3,040 | 877 | 869 | (165 | ) | | 4,621 | |||||||||||||||||
Asset impairments |
| (10 | ) | (31 | ) | | | (41 | ) | |||||||||||||||
Other operating income (expenses) |
(79 | ) | (247 | ) | 826 | 1 | (297 | ) | 204 | |||||||||||||||
|
|
|
|
|
|
|
|
|
|
|
|
|||||||||||||
Profit (loss) from operations |
2,961 | 620 | 1,664 | (164 | ) | (297 | ) | 4,784 | ||||||||||||||||
Net finance expense |
(47 | ) | (47 | ) | (37 | ) | (16 | ) | (72 | ) | (219 | ) | ||||||||||||
Non-operating income (expense) |
37 | 4 | 11 | | (104 | ) | (52 | ) | ||||||||||||||||
Share of loss of associates and joint ventures |
| (2 | ) | | | (1 | ) | (3 | ) | |||||||||||||||
|
|
|
|
|
|
|
|
|
|
|
|
|||||||||||||
Profit (loss) before taxes |
2,951 | 575 | 1,638 | (180 | ) | (474 | ) | 4,510 | ||||||||||||||||
|
|
|
|
|
|
|
|
|
|
|
|
|||||||||||||
Capital expenditures |
969 | 850 | 409 | 375 | 10 | 2,613 | ||||||||||||||||||
|
|
|
|
|
|
|
|
|
|
|
|
|||||||||||||
Goodwill |
702 | 419 | | | | 1,121 | ||||||||||||||||||
|
|
|
|
|
|
|
|
|
|
|
|
|||||||||||||
Total assets |
15,491 | 10,219 | 3,692 | 6,131 | 4,093 | 39,626 | ||||||||||||||||||
|
|
|
|
|
|
|
|
|
|
|
|
54
27. | Segmented Information (continued) |
(CAD$ in millions) |
December 31, 2017 (restated) | |||||||||||||||||||||||
Steelmaking Coal | Copper | Zinc | Energy | Corporate | Total | |||||||||||||||||||
Segment revenues |
$ | 6,014 | $ | 2,400 | $ | 4,131 | $ | | $ | | $ | 12,545 | ||||||||||||
Less: Intra-segment revenues |
| | (635 | ) | | | (635 | ) | ||||||||||||||||
|
|
|
|
|
|
|
|
|
|
|
|
|||||||||||||
Revenues |
6,014 | 2,400 | 3,496 | | | 11,910 | ||||||||||||||||||
Cost of sales |
(3,000 | ) | (1,814 | ) | (2,529 | ) | | | (7,343 | ) | ||||||||||||||
|
|
|
|
|
|
|
|
|
|
|
|
|||||||||||||
Gross profit |
3,014 | 586 | 967 | | | 4,567 | ||||||||||||||||||
Impairment reversal and (asset impairments) |
207 | (44 | ) | | | | 163 | |||||||||||||||||
Other operating income (expenses) |
(99 | ) | 63 | (28 | ) | (3 | ) | (392 | ) | (459 | ) | |||||||||||||
|
|
|
|
|
|
|
|
|
|
|
|
|||||||||||||
Profit (loss) from operations |
3,122 | 605 | 939 | (3 | ) | (392 | ) | 4,271 | ||||||||||||||||
Net finance expense |
(5 | ) | (45 | ) | (31 | ) | (7 | ) | (124 | ) | (212 | ) | ||||||||||||
Non-operating income (expense) |
(29 | ) | 5 | (9 | ) | | (118 | ) | (151 | ) | ||||||||||||||
Share of income of associates and joint ventures |
| 3 | | | 3 | 6 | ||||||||||||||||||
|
|
|
|
|
|
|
|
|
|
|
|
|||||||||||||
Profit (loss) before taxes |
3,088 | 568 | 899 | (10 | ) | (631 | ) | 3,914 | ||||||||||||||||
|
|
|
|
|
|
|
|
|
|
|
|
|||||||||||||
Capital expenditures |
673 | 467 | 244 | 911 | 4 | 2,299 | ||||||||||||||||||
|
|
|
|
|
|
|
|
|
|
|
|
|||||||||||||
Goodwill |
702 | 385 | | | | 1,087 | ||||||||||||||||||
|
|
|
|
|
|
|
|
|
|
|
|
|||||||||||||
Total assets |
15,241 | 9,533 | 3,720 | 5,667 | 2,867 | 37,028 | ||||||||||||||||||
|
|
|
|
|
|
|
|
|
|
|
|
The geographical distribution of our non-current assets is as follows:
(CAD$ in millions) |
December 31, 2018 |
December 31, 2017 |
||||||
Canada |
$ | 23,238 | $ | 22,466 | ||||
Chile |
7,146 | 6,077 | ||||||
Peru |
1,477 | 1,305 | ||||||
United States |
1,282 | 1,131 | ||||||
Other |
99 | 96 | ||||||
|
|
|
|
|||||
$ | 33,242 | $ | 31,075 | |||||
|
|
|
|
Non-current assets attributed to geographical locations exclude deferred income tax assets and financial and other assets.
28. | Financial Instruments and Financial Risk Management |
a) | Financial Risk Management |
Our activities expose us to a variety of financial risks, which include liquidity risk, foreign exchange risk, interest rate risk, commodity price risk, credit risk and other risks associated with capital markets. From time to time, we may use foreign exchange, commodity price and interest rate contracts to manage exposure to fluctuations in these variables. We do not have a practice of trading derivatives. Our use of derivatives is based on established practices and parameters to mitigate risk and is subject to the oversight of our Hedging Committee and our Board of Directors.
55
28. | Financial Instruments and Financial Risk Management (continued) |
Foreign Exchange Risk
We operate on an international basis, and therefore, foreign exchange risk exposures arise from transactions denominated in a currency other than the functional currency of the entity. Our foreign exchange risk arises primarily with respect to the U.S. dollar and to a lesser extent, the Chilean peso and Peruvian sol. Our cash flows from Canadian, Chilean and Peruvian operations are exposed to foreign exchange risk, as commodity sales are denominated in U.S. dollars and a substantial portion of operating expenses are denominated in local currencies.
We also have various investments in U.S. dollar foreign operations, whose net assets are exposed to foreign currency translation risk. This currency exposure is managed in part through our U.S. dollar denominated debt as a hedge against net investments in foreign operations.
U.S. dollar financial instruments subject to foreign exchange risk consist of U.S. dollar denominated items held in Canada and are summarized below. This risk is reduced by our policy to apply a hedge against our U.S. dollar net investments using our U.S. dollar debt.
(US$ in millions) |
December 31, 2018 |
December 31, 2017 |
||||||
Cash and cash equivalents |
$ | 907 | $ | 368 | ||||
Trade and settlement receivables |
640 | 913 | ||||||
Trade accounts payable and other liabilities |
(421 | ) | (569 | ) | ||||
Debt |
(3,809 | ) | (4,831 | ) | ||||
|
|
|
|
|||||
(2,683 | ) | (4,119 | ) | |||||
Net investment in foreign operations hedged |
2,628 | 4,149 | ||||||
|
|
|
|
|||||
Net U.S. dollar exposure |
$ | (55 | ) | $ | 30 | |||
|
|
|
|
As at December 31, 2018, with other variables unchanged, a $0.10 strengthening of the Canadian dollar against the U.S. dollar would result in a $8 million pre-tax loss (2017 $3 million) from our financial instruments. There would also be a $408 million pre-tax loss (2017 $157 million) in other comprehensive income from the translation of our foreign operations. The inverse effect would result if the Canadian dollar weakened by $0.10 against the U.S. dollar.
Liquidity Risk
Liquidity risk arises from our general and capital funding requirements. We have planning, budgeting and forecasting processes to help determine our funding requirements to meet various contractual and other obligations. Note 19(e) details our available credit facilities as at December 31, 2018.
Contractual undiscounted cash flow requirements for financial liabilities as at December 31, 2018 are as follows:
(CAD$ in millions) |
Less Than 1 Year |
23 Years |
45 Years |
More Than 5 Years |
Total | |||||||||||||||
Trade accounts payable and other liabilities (Note 18) |
$ | 2,333 | $ | | $ | | $ | | $ | 2,333 | ||||||||||
Debt (Note 19(f)) |
| 190 | 575 | 4,462 | 5,227 | |||||||||||||||
Estimated interest payments on debt |
$ | 317 | $ | 625 | $ | 582 | $ | 3,528 | $ | 5,052 | ||||||||||
|
|
|
|
|
|
|
|
|
|
56
28. | Financial Instruments and Financial Risk Management (continued) |
Interest Rate Risk
Our interest rate risk is both fair value and cash flow risk and arises mainly in respect of our holdings of cash and cash equivalents. Our interest rate management policy is generally to borrow at fixed rates. However, floating rate funding may be used to fund short-term operating cash flow requirements or, in conjunction with fixed to floating interest rate swaps, be used to offset interest rate risk from our cash. The fair value of fixed-rate debt fluctuates with changes in market interest rates, but the cash flows, denominated in U.S. dollars, do not.
Cash and cash equivalents have short terms to maturity and receive interest based on market interest rates.
A 1% increase in the short-term interest rate at the beginning of the year, with other variables unchanged, would have resulted in a $15 million pre-tax increase in our profit (2017 $10 million). There would be no effect on other comprehensive income. The inverse effect would result if the short-term interest rate decreased by 1%.
Commodity Price Risk
We are subject to price risk from fluctuations in market prices of the commodities that we produce. From time to time, we may use commodity price contracts to manage our exposure to fluctuations in commodity prices. At the balance sheet date, we had zinc and lead derivative contracts outstanding as described in (b) below.
Our commodity price risk associated with financial instruments primarily relates to changes in fair value caused by final settlement pricing adjustments to receivables and payables, derivative contracts for zinc and lead, embedded derivatives in one of our road and port contracts, and in the ongoing payments under our silver stream and gold stream arrangements.
The following represents the effect on profit attributable to shareholders from a 10% change in commodity prices, based on outstanding receivables and payables subject to final pricing adjustments at December 31, 2018. There is no effect on other comprehensive income.
Price on December 31, | Change in Profit Attributable to Shareholders |
|||||||||||||||
(CAD$ in millions, except for US$/lb. data) |
2018 | 2017 | 2018 | 2017 | ||||||||||||
Copper |
US$ | 2.70/lb. | US$ | 3.26/lb. | $ | 21 | $ | 35 | ||||||||
Zinc |
US$ | 1.12/lb. | US$ | 1.50/lb. | $ | 7 | $ | 5 |
A 10% change in the price of zinc, lead, silver and gold, respectively, with other variables unchanged, would change our net liability relating to derivatives and embedded derivatives, excluding receivables and payables subject to final pricing adjustments, and change our pre-tax profit attributable to shareholders by $16 million (2017 $26 million). There would be no effect on other comprehensive income.
Credit Risk
Credit risk arises from cash, cash equivalents, derivative contracts, debt securities and trade receivables. While we are exposed to credit losses due to the non-performance of our counterparties, there are no significant concentrations of credit risk and we do not consider this to be a material risk.
Our primary counterparties related to our cash, cash equivalents, derivative contracts and debt securities carry investment grade ratings as assessed by external rating agencies, which are monitored on an ongoing basis. All of our commercial customers are assessed for credit quality at least once a year or more frequently if business or customer specific conditions change based on an extensive credit rating scorecard developed internally using key credit metrics and measurements that were adapted from S&Ps and Moodys rating methodologies. Sales to customers that do not meet the credit quality criteria are secured either by a parental guarantee, letter of credit or prepayment.
57
28. | Financial Instruments and Financial Risk Management (continued) |
For our trade receivables, we apply the simplified approach for determining expected credit losses, which requires us to determine the lifetime expected losses for all our trade receivables. The expected lifetime credit loss provision for our trade receivables is based on historical counterparty default rates and adjusted for relevant forward-looking information, as required. Since the majority of our customers are considered to have low default risk and our historical default rate and frequency of loss are low, the lifetime expected credit loss allowance for trade receivables is nominal as at December 31, 2018 and January 1, 2018.
Our investments in debt securities carried at fair value through other comprehensive income are considered to have low credit risk as our counterparties have investment grade credit ratings. The credit risk of our investments in debt securities has not increased significantly since initial recognition of these investments and accordingly, the loss allowance for investments in debt securities is determined based on the 12-month expected credit losses. The 12-month expected credit loss allowance is based on historical and forward-looking default rates for investment grade entities, which are low and accordingly, the 12-month expected credit loss allowance for our investments in debt securities is nominal as at December 31, 2018 and January 1, 2018.
b) | Derivative Financial Instruments and Hedges |
Sale and Purchase Contracts
We record adjustments to our settlement receivables and payables for provisionally priced sales and purchases, respectively, in periods up to the date of final pricing based on movements in quoted market prices or published price assessments (for steelmaking coal). These arrangements are based on the market price of the commodity and the value of our settlement receivables and payables will vary as prices for the underlying commodities vary in the metal markets. These final pricing adjustments result in gains (losses from purchases) in a rising price environment and losses (gains from purchases) in a declining price environment and are recorded in other operating income (expense).
The table below outlines our outstanding settlement receivables and payables, which were provisionally valued at December 31, 2018, and December 31, 2017.
Outstanding at December 31, 2018 |
Outstanding at December 31, 2017 |
|||||||||||||||
(Pounds in millions) |
Pounds | US$/lb. | Pounds | US$/lb. | ||||||||||||
Receivable positions |
||||||||||||||||
Copper |
93 | $ | 2.70 | 138 | $ | 3.26 | ||||||||||
Zinc |
208 | $ | 1.12 | 197 | $ | 1.50 | ||||||||||
Lead |
24 | $ | 0.91 | 44 | $ | 1.13 | ||||||||||
Payable positions |
||||||||||||||||
Zinc payable |
77 | $ | 1.12 | 97 | $ | 1.50 | ||||||||||
Lead payable |
16 | $ | 0.91 | 30 | $ | 1.13 |
At December 31, 2018, total outstanding settlement receivables were $557 million (2017 $687 million), and total outstanding settlement payables were $45 million (2017 $39 million). These amounts are included in trade and settlement receivables and trade accounts payable and other liabilities, respectively, on the consolidated balance sheet.
58
28. | Financial Instruments and Financial Risk Management (continued) |
Zinc and Lead Swaps
Due to ice conditions, the port serving our Red Dog mine is normally only able to ship concentrates from July to October each year. As a result, zinc and lead concentrate sales volumes are generally higher in the third and fourth quarter of each year than in the first and second quarter. During 2018 and 2017, we purchased and sold zinc and lead swaps to match our economic exposure to the average zinc and lead prices over our shipping year, which is from July of one year to June of the following year. We do not apply hedge accounting to the zinc or lead swaps.
The fair value of our commodity swaps is calculated using a discounted cash flow method based on forward metal prices. A summary of these derivative contracts and related fair values as at December 31, 2018 is as follows:
Derivatives not designated as hedging instruments |
Quantity | Average Price of Purchase Commitments |
Average Price of Sale Commitments |
Fair Value Asset (Liability) (CAD$ in millions) |
||||||||||||
Zinc swaps |
122 million lbs. | US$ | 1.14/lb. | US$ | 1.11/lb. | $ | (6 | ) | ||||||||
Lead swaps |
70 million lbs. | US$ | 0.90/lb. | US$ | 0.92/lb. | 2 | ||||||||||
|
|
|||||||||||||||
$ | (4 | ) | ||||||||||||||
|
|
All free-standing derivative contracts mature in 2019 and 2020.
Free-standing derivatives, not designated as hedging instruments, are recorded in prepaid and other current assets in the amount of $2 million and in trade accounts payable and other liabilities in the amount of $6 million on the consolidated balance sheet.
Derivatives Not Designated as Hedging Instruments and Embedded Derivatives
(CAD$ in millions) |
Amount of Gain (Loss) Recognized in Other Operating Income (Expense) (Note 9) |
|||||||
2018 | 2017 | |||||||
Zinc derivatives |
$ | (40 | ) | $ | 11 | |||
Lead derivatives |
(4 | ) | 10 | |||||
Settlements receivable and payable |
(117 | ) | 190 | |||||
Contingent zinc escalation payment embedded derivative (c) |
13 | (24 | ) | |||||
Gold stream embedded derivative (c) |
(1 | ) | 13 | |||||
Silver stream embedded derivative (c) |
(4 | ) | 2 | |||||
|
|
|
|
|||||
$ | (153 | ) | $ | 202 | ||||
|
|
|
|
During the year ended December 31, 2018, we recorded a $42 million loss (2017 $51 million gain) in non-operating income (expense) (Note 11) related to a decrease in the value of debt prepayment options (Note 28(c)).
Accounting Hedges
Net investment hedge
We manage the foreign currency translation risk of our various investments in U.S. dollar foreign operations in part through the designation of our U.S. dollar denominated debt as a hedge against net investments in foreign operations (Note 28(a)). We designate the spot element of the U.S. dollar debt as the hedging instrument. As only the spot rate element of the debt is designated in the hedging relationship, no ineffectiveness is expected and no ineffectiveness was recognized in profit for the years ended December 31, 2018 and 2017. The hedged foreign currency risk component is the change in the carrying amount of the net assets of the foreign operation arising from spot U.S. dollar to Canadian dollar exchange rate movements. At December 31, 2018, US$2.6 billion of our debt (2017 US$4.1 billion) and U.S. dollar investment in foreign operations was designated in a net investment hedging relationship. During the year ended December 31, 2018, $295 million (2017 $387 million) of foreign exchange translation on our U.S. dollar investment in foreign operations was hedged by an offsetting amount of foreign exchange translation on our U.S. dollar denominated debt. Refer to Note 23(e) for the effect of our net investment hedges on other comprehensive income (loss).
59
28. | Financial Instruments and Financial Risk Management (continued) |
c) | Embedded Derivatives |
One of our road and port contracts contains a contingent zinc escalation payment that is considered to be an embedded derivative. The fair value of this embedded derivative was $34 million at December 31, 2018 (2017 $43 million) and is included in provisions and other liabilities on the consolidated balance sheet.
The gold stream and silver stream agreements entered into in 2015 each contain an embedded derivative in the ongoing future payments due to Teck. The gold streams 15% ongoing payment contains an embedded derivative relating to the gold price. The fair value of this embedded derivative was $11 million at December 31, 2018 (2017 $9 million) and is included in financial and other assets on the consolidated balance sheet. The silver streams 5% ongoing payment contains an embedded derivative relating to the silver price. The fair value of this embedded derivative was $1 million at December 31, 2018 (2017 $3 million) and is included in provisions and other liabilities (2017 financial and other assets) on the consolidated balance sheet.
Our 2024 notes include a prepayment option that is considered to be an embedded derivative (Note 19). At December 31, 2018, the prepayment option in the 2024 notes is recorded as financial and other assets (Note 14) on the consolidated balance sheet at a fair value of $73 million (2017 $108 million) based on current market interest rates for similar instruments and our credit spread.
29. | Fair Value Measurements |
Certain of our financial assets and liabilities are measured at fair value on a recurring basis and classified in their entirety based on the lowest level of input that is significant to the fair value measurement. Certain non-financial assets and liabilities may also be measured at fair value on a non-recurring basis. There are three levels of the fair value hierarchy that prioritize the inputs to valuation techniques used to measure fair value, with Level 1 inputs having the highest priority. The levels and the valuation techniques used to value our financial assets and liabilities are described below:
Level 1 Quoted Prices in Active Markets for Identical Assets
Unadjusted quoted prices in active markets that are accessible at the measurement date for identical, unrestricted assets or liabilities.
Certain cash equivalents, certain marketable equity securities and certain debt securities are valued using quoted market prices in active markets. Accordingly, these items are included in Level 1 of the fair value hierarchy.
Level 2 Significant Observable Inputs Other than Quoted Prices
Quoted prices in markets that are not active, quoted prices for similar assets or liabilities in active markets, or inputs that are observable, either directly or indirectly, for substantially the full term of the asset or liability.
Derivative instruments and embedded derivatives are included in Level 2 of the fair value hierarchy as they are valued using pricing models or discounted cash flow models. These models require a variety of inputs, including, but not limited to, market prices, forward price curves, yield curves and credit spreads. These inputs are obtained from or corroborated with the market. Also included in Level 2 are settlement receivables and settlement payables from provisional pricing on concentrate sales and purchases, certain refined metal sales and steelmaking coal sales because they are valued using quoted market prices derived based on forward curves for the respective commodities and published price assessments for steelmaking coal sales.
Level 3 Significant Unobservable Inputs
Unobservable (supported by little or no market activity) prices.
We include investments in certain debt securities and certain equity securities in non-public companies in Level 3 of the fair value hierarchy because they trade infrequently and have little price transparency. We review the fair value of these instruments periodically and estimate an impairment charge based on managements best estimates, which are unobservable inputs.
60
29. | Fair Value Measurements (continued) |
The fair values of our financial assets and liabilities measured at fair value on a recurring basis at December 31, 2018 and 2017, are summarized in the following table:
(CAD$ in millions) |
2018 | 2017 | ||||||||||||||||||||||||||||||
Level 1 | Level 2 | Level 3 | Total | Level 1 | Level 2 | Level 3 | Total | |||||||||||||||||||||||||
Financial assets |
||||||||||||||||||||||||||||||||
Cash equivalents |
$ | 68 | $ | | $ | | $ | 68 | $ | 722 | $ | | $ | | $ | 722 | ||||||||||||||||
Marketable equity securities |
44 | | 36 | 80 | 124 | | | 124 | ||||||||||||||||||||||||
Debt securities |
90 | | 3 | 93 | 37 | | 4 | 41 | ||||||||||||||||||||||||
Settlement receivables |
| 557 | | 557 | | 687 | | 687 | ||||||||||||||||||||||||
Derivative instruments and embedded derivatives |
| 86 | | 86 | | 126 | | 126 | ||||||||||||||||||||||||
|
|
|
|
|
|
|
|
|
|
|
|
|
|
|
|
|||||||||||||||||
$ | 202 | $ | 643 | $ | 39 | $ | 884 | $ | 883 | $ | 813 | $ | 4 | $ | 1,700 | |||||||||||||||||
|
|
|
|
|
|
|
|
|
|
|
|
|
|
|
|
|||||||||||||||||
Financial liabilities |
||||||||||||||||||||||||||||||||
Derivative instruments and embedded derivatives |
$ | | $ | 45 | $ | | $ | 45 | $ | | $ | 43 | $ | | $ | 43 | ||||||||||||||||
Settlement payables |
| 45 | | 45 | | 39 | | 39 | ||||||||||||||||||||||||
|
|
|
|
|
|
|
|
|
|
|
|
|
|
|
|
|||||||||||||||||
$ | | $ | 90 | $ | | $ | 90 | $ | | $ | 82 | $ | | $ | 82 | |||||||||||||||||
|
|
|
|
|
|
|
|
|
|
|
|
|
|
|
|
As at December 31, 2017, we measured certain non-financial assets at their recoverable amounts using a FVLCD basis, which is classified as a Level 3 measurement. Refer to Note 8 for information about these fair value measurements.
30. | Capital Management |
The capital we manage is the total of equity and debt on our balance sheet. Our capital management objectives are to maintain access to the capital we require to operate and grow our business while minimizing the cost of such capital and providing for returns to our investors. Our financial policies are to maintain, on average over time, a target debt to debt-plus-equity ratio of less than 30% and a target debt-to-EBITDA ratio of less than 2.5x. These ratios are expected to vary from their target levels from time to time, reflecting commodity price cycles and corporate activity, including the development of major projects. We may also review and amend such policy targets from time to time. We maintain two committed revolving credit facilities consisting of a core liquidity facility of US$4.0 billion and a US$600 million facility, which is used for financial letters of credit required while our credit rating is non-investment grade. These credit facilities include a financial covenant that requires us to maintain a net debt-to-capitalization ratio that does not exceed 0.55 (Note 19).
As at December 31, 2018, our debt to debt-plus-equity ratio was 19% (2017 24%), our debt-to-EBITDA ratio was 0.9 (2017 1.1) and our net debt-to-capitalization ratio was 0.13 (2017 0.21). We manage the risk of not meeting our financial targets through the issuance and repayment of debt, our distribution policy, the issuance of equity capital, asset sales as well as through the ongoing management of operations, investments and capital expenditures.
61
31. | Key Management Compensation |
The compensation for key management recognized in total comprehensive income in respect of employee services is summarized in the table below. Key management includes our directors and senior vice presidents.
(CAD$ in millions) |
2018 | 2017 | ||||||
Salaries, bonuses, director fees and other short-term benefits |
$ | 16 | $ | 16 | ||||
Post-employment benefits |
1 | 5 | ||||||
Share option compensation expense (Note 23(c)) |
6 | 7 | ||||||
Compensation expense related to Units (Note 23(d)) |
7 | 52 | ||||||
|
|
|
|
|||||
$ | 30 | $ | 80 | |||||
|
|
|
|
32. | Adoption of New IFRS Pronouncements |
We have adopted the new IFRS pronouncements listed below as at January 1, 2018, in accordance with the transitional provisions outlined in the respective standards and described below. The adoption of these new IFRS pronouncements has resulted in adjustments to previously reported figures as outlined below.
a) | Adjustments to Consolidated Financial Statements |
All of the adjustments to previously reported figures outlined below relate to the adoption of IFRS 15 (Note 32(b)).
Adjustments to Condensed Consolidated Balance Sheets
(CAD$ in millions) |
December 31, 2017 | January 1, 2017 | ||||||
Equity before accounting changes |
$ | 19,525 | $ | 17,601 | ||||
Adjustments to equity relating to: |
||||||||
Trade and settlement receivables |
(61 | ) | | |||||
Inventories |
32 | | ||||||
Current portion of deferred consideration |
23 | 32 | ||||||
Current income taxes payable |
5 | | ||||||
Deferred consideration |
651 | 723 | ||||||
Deferred income tax liabilities |
(182 | ) | (190 | ) | ||||
|
|
|
|
|||||
Equity after accounting changes |
$ | 19,993 | $ | 18,166 | ||||
|
|
|
|
|||||
Equity after accounting changes attributable to: |
||||||||
Shareholders of the company |
$ | 19,851 | $ | 18,007 | ||||
Non-controlling interests |
142 | 159 | ||||||
|
|
|
|
|||||
$ | 19,993 | $ | 18,166 | |||||
|
|
|
|
62
32. | Adoption of New IFRS Pronouncements (continued) |
Adjustments to Condensed Consolidated Statements of Income
(CAD$ in millions) |
Year ended December 31, 2017 |
|||
Profit for the year before accounting changes |
$ | 2,538 | ||
Adjustments to profit relating to: |
||||
Revenues |
(138 | ) | ||
Cost of sales |
76 | |||
Provision for income taxes |
13 | |||
|
|
|||
Profit for the year after accounting changes |
$ | 2,489 | ||
|
|
|||
Profit for the year after accounting changes attributable to: |
$ | 2,460 | ||
Non-controlling interests |
29 | |||
|
|
|||
$ | 2,489 | |||
|
|
|||
Earnings per share after accounting changes |
||||
Basic |
$ | 4.26 | ||
Diluted |
$ | 4.19 | ||
|
|
The adjustments to profit relating to the new IFRS pronouncements in Note 32(b) decreased basic earnings per share by $0.08 and diluted earnings per share by $0.09 for the year ended December 31, 2017.
Adjustments to Condensed Consolidated Statements of Comprehensive Income
(CAD$ in millions) |
Year ended December 31, 2017 |
|||
Total comprehensive income before accounting changes |
$ | 2,501 | ||
Adjustments to comprehensive income relating to: |
||||
Profit |
(49 | ) | ||
Other comprehensive income: |
||||
Currency translation differences |
(48 | ) | ||
|
|
|||
Total comprehensive income after accounting changes |
$ | 2,404 | ||
|
|
|||
Total comprehensive income after accounting changes attributable to: |
||||
Shareholders of the company |
$ | 2,383 | ||
Non-controlling interests |
21 | |||
|
|
|||
$ | 2,404 | |||
|
|
b) | Revenue from Contracts with Customers |
Overview of Changes in IFRS
We adopted IFRS 15 on January 1, 2018 in accordance with the transitional provisions of the standard, applying a full retrospective approach in restating our prior period financial information.
63
32. | Adoption of New IFRS Pronouncements (continued) |
The new revenue standard introduces a single principles-based, five-step model for the recognition of revenue when control of goods is transferred to, or a service is performed for, the customer. The five steps are to identify the contract(s) with the customer, identify the performance obligations in the contract, determine the transaction price, allocate the transaction price to each performance obligation and recognize revenue as each performance obligation is satisfied. IFRS 15 also requires enhanced disclosures about revenue to help users better understand the nature, amount, timing and uncertainty of revenue and cash flows from contracts with customers.
Timing and Amount of Revenue Recognized
Based on our analysis, the timing and amount of our revenue from product sales did not change significantly under IFRS 15. For steelmaking coal sales where we have a shipment that is partially loaded on a vessel at a reporting date, we concluded that the performance obligation in these contracts is for the full shipment. Therefore, we cannot recognize revenue until the full shipment is loaded. This does not significantly affect the revenue recognized in a period. This is a timing difference only and does not change the amount of revenue recognized for the full shipment.
As part of our assessment of IFRS 15, we analyzed the treatment of freight services provided to customers subsequent to the transfer of control of the product sold. Under IFRS 15, in our view, these services represent performance obligations that should be recognized separately. For the performance obligation related to these freight services, we have concluded that we are the principal to the shipping of product in our refined metal sales and concentrate sales contracts and will continue to reflect the revenue in these arrangements on a gross basis. For certain of our steelmaking coal sales contracts, we have concluded that we are the agent to the ocean freight shipping of product due to the terms of the arrangement, and our revenue will be reported on a net basis for these arrangements. There will be no effect on our gross profit, as the freight costs will be netted against revenue for these arrangements and not presented within cost of sales.
We have assessed the effects of IFRS 15 on our silver and gold streaming arrangements. At the date these transactions were completed, we accounted for the arrangements as the sale of a portion of our mineral interests at Antamina and Carmen de Andacollo, respectively. We did not recognize disposal gains on the transactions as a result of the requirements of the IFRS standards in effect at the dates of closing. Under the recognition and measurement principles of IFRS 15, any gain on these streaming transactions would have been recognized in full as control over the right to the silver or gold mineral interest transferred to the purchaser. Accordingly, we have recognized the deferred consideration recorded on our balance sheet through equity on transition to IFRS 15 as at January 1, 2017. We have also reversed the amortization of the deferred consideration that was recorded as a reduction of cost of sales for the year ended December 31, 2017.
The tables in Note 32(a) outline the adjustments to our financial statements resulting from the adoption of IFRS 15, described above, for all comparative periods presented.
c) | Financial Instruments |
Overview of Changes in IFRS
We adopted IFRS 9 on January 1, 2018 in accordance with the transitional provisions of the standard, with the exception of the hedging provisions. Effective October 1, 2018, we adopted the hedging requirements section of IFRS 9.
IFRS 9 addresses the classification, measurement and recognition of financial assets and financial liabilities and supersedes the guidance relating to the classification and measurement of financial instruments in IAS 39.
IFRS 9 requires financial assets to be classified into three measurement categories on initial recognition: those measured at fair value through profit and loss, those measured at fair value through other comprehensive income and those measured at amortized cost. Investments in equity instruments are required to be measured by default at fair value through profit or loss. However, there is an irrevocable option for each equity instrument to present fair value changes in other comprehensive income. Measurement and classification of financial assets is dependent on the entitys business model for managing the financial assets and the contractual cash flow characteristics of the financial asset. For financial liabilities, the standard retains most of the IAS 39 requirements. The main change is that, in cases where the fair value option is taken for financial liabilities, the part of a fair value change relating to an entitys own credit risk is recorded in other comprehensive income rather than the income statement, unless this creates an accounting mismatch.
64
32. | Adoption of New IFRS Pronouncements (continued) |
IFRS 9 introduces a new three-stage expected credit loss model for calculating impairment for financial assets. IFRS 9 no longer requires a triggering event to have occurred before credit losses are recognized. An entity is required to recognize expected credit losses when financial instruments are initially recognized and to update the amount of expected credit losses recognized at each reporting date to reflect changes in the credit risk of the financial instruments. In addition, IFRS 9 requires additional disclosure requirements about expected credit losses and credit risk.
The new hedge accounting model in IFRS 9 aligns hedge accounting with risk management activities undertaken by an entity. Components of both financial and non-financial items are now be eligible for hedge accounting, as long as the risk component can be identified and measured. The hedge accounting model includes eligibility criteria that must be met, but these criteria are based on an economic assessment of the strength of the hedging relationship.
Classification and Measurement Changes
We have assessed the classification and measurement of our financial assets and financial liabilities under IFRS 9 and have summarized the original measurement categories under IAS 39 and the new measurement categories under IFRS 9 in the following table:
Measurement Category | ||||
2017 (IAS 39) | 2018 (IFRS 9) | |||
Financial Assets: |
||||
Cash |
Amortized cost | Amortized cost | ||
Cash equivalents |
Available-for-sale | Amortized cost/fair value through profit or loss | ||
Trade receivables |
Amortized cost | Amortized cost | ||
Settlement receivables |
Fair value through profit or loss | Fair value through profit or loss | ||
Marketable equity securities |
Available-for-sale | Fair value through other comprehensive income | ||
Debt securities |
Available-for-sale | Fair value through other comprehensive income | ||
Long term receivables and deposits |
Amortized cost | Amortized cost | ||
Derivative instruments and embedded derivatives with non-financial host contracts |
Fair value through profit or loss | Fair value through profit or loss | ||
Financial Liabilities: |
||||
Trade payables |
Amortized cost | Amortized cost | ||
Settlement payables |
Fair value through profit or loss | Fair value through profit or loss | ||
Debt |
Amortized cost | Amortized cost | ||
Derivative instruments and embedded derivatives |
Fair value through profit or loss | Fair value through profit or loss |
There has been no change in the carrying value of our financial instruments or to previously reported figures as a result of changes to the measurement categories in the table noted above.
Cash equivalents
Our cash equivalents were reclassified from available-for sale to amortized cost or fair value through profit or loss, depending on their nature. The fair value of $640 million as at January 1, 2018 is deemed to be the starting amortized cost for cash equivalents classified as subsequently measured at amortized cost. There was no impact on retained earnings as at January 1, 2018 as a result of this reclassification because the fair value is equal to the carrying value.
65
32. | Adoption of New IFRS Pronouncements (continued) |
Marketable equity securities
We have made the irrevocable classification choice to record fair value changes on our current portfolio of investments in marketable equity securities through other comprehensive income. As a result, marketable equity securities with a fair value of $124 million were reclassified from available-for-sale financial assets to financial assets through other comprehensive income. Available-for-sale financial assets under IAS 39 were accounted for at fair value with changes in fair value recorded in other comprehensive income. Realized gain or losses on available-for-sale financial assets were recycled into profit. This election resulted in the reclassification of a $41 million loss ($34 million after-tax) from our retained earnings to accumulated other comprehensive income (loss), all within equity, on January 1, 2018. This adjustment is presented in our Consolidated Statement of Changes in Equity for the year ended December 31, 2018.
Debt securities
Investments in debt securities were reclassified from available-for-sale to fair value through other comprehensive income, as the companys business model is achieved both by collecting contractual cash flows and selling of these assets. The contractual cash flows of these investments are solely principal and interest. As a result, debt securities with a fair value of $41 million were reclassified from available-for-sale financial assets to financial assets at fair value through other comprehensive income.
Expected credit losses
Credit risk arises from cash, cash equivalents, derivative contracts, debt securities and trade receivables. While we are exposed to credit losses due to the non-performance of our counterparties, there are no significant concentrations of credit risk and we do not consider this to be a material risk.
Our primary counterparties related to our cash, cash equivalents, derivative contracts and debt securities carry investment grade ratings as assessed by external rating agencies. There is ongoing review to evaluate the creditworthiness of these counterparties. All of our customers are assessed for credit quality by taking into account external credit ratings, where available, an analysis of financial position and liquidity, past experience and other factors. Individual customer credit limits are set based on internal or external ratings in accordance with our credit policy. Customer credit ratings and compliance with credit limits is regularly monitored by management. For some customers, we may obtain security over trade and settlement receivables in the form of letters of credit.
Under IAS 39 we applied an incurred loss model. We have reviewed our expected credit losses on our trade receivables and debt securities carried at fair value through other comprehensive income on transition to IFRS 9. We have also implemented a process for managing and estimating provisions relating to trade receivables going forward under IFRS 9. For our trade receivables, we apply the simplified approach for determining expected credit losses which requires us to determine the lifetime expected losses for all our trade receivables. The expected lifetime credit loss provision for our trade receivables is based on historical counterparty default rates and adjusted for relevant forward-looking information, as required. As the majority of our customers are considered to have low default risk and we do not extend credit to customers with high default risk, historical default rates are low and the lifetime expected credit loss allowance for trade receivables is nominal as at January 1, 2018. Accordingly, we did not record an adjustment relating to the implementation of the expected credit loss model for our trade receivables.
Our investments in debt securities carried at fair value through other comprehensive income are considered to have low credit risk, as our counterparties have investment grade credit ratings. As at January 1, 2018, the credit risk of our investments in debt securities has not increased significantly since initial recognition of these investments and accordingly, the loss allowance for investments in debt securities is determined based on the 12-month expected credit losses. The 12-month expected credit loss allowance is based on historical default rates for investment grade entities, which are low and accordingly, the 12-month expected credit loss allowance for our investments in debt securities is nominal as at January 1, 2018. Therefore, we did not record an adjustment relating to the implementation of the expected credit loss model for our investments in debt securities.
Hedges
The adoption of the hedging requirements section of IFRS 9 did not affect our existing designated hedging arrangements (Note 28(b)).
66
Exhibit 99.3
Managements Discussion and Analysis
February 12, 2019
|
|
Managements Discussion and Analysis
Our business is exploring for, acquiring, developing and producing natural resources. We are organized into business units focused on steelmaking coal, copper, zinc and energy. These are supported by our corporate offices, which manage our corporate growth initiatives and provide marketing, administrative, technical, financial and other services.
Through our interests in mining and processing operations in Canada, the United States (U.S.), Chile and Peru, we are the worlds second-largest seaborne exporter of steelmaking coal, an important producer of copper, one of the worlds largest producers of mined zinc and we have an interest in a large producing oil sands mine. We also produce lead, silver, molybdenum and various specialty and other metals, chemicals and fertilizers. We actively explore for copper, zinc and gold, and we hold interests in oil sands assets in the Athabasca region of Alberta.
This Managements Discussion and Analysis of our results of operations is prepared as at February 12, 2019 and should be read in conjunction with our audited annual consolidated financial statements for the year ended December 31, 2018. Unless the context otherwise dictates, a reference to Teck, Teck Resources, the Company, us, we or our refers to Teck Resources Limited and its subsidiaries, including Teck Metals Ltd. and Teck Coal Partnership. All dollar amounts are in Canadian dollars, unless otherwise stated, and are based on our 2018 audited annual consolidated financial statements that are prepared in accordance with International Financial Reporting Standards (IFRS). Certain comparative amounts have been restated as a result of the adoption of new IFRS pronouncements. Please refer to Note 32 to our audited annual consolidated financial statements for the year ended December 31, 2018 for more details. In addition, we use certain financial measures, which are identified throughout the Managements Discussion and Analysis in this report, that are not measures recognized under IFRS and do not have a standardized meaning prescribed by IFRS. See Use of Non-GAAP Financial Measures on page 56 for an explanation of these financial measures and reconciliation to the most directly comparable financial measures under IFRS.
This Managements Discussion and Analysis contains certain forward-looking information and forward-looking statements. You should review the cautionary statement on forward-looking statements under the heading Cautionary Statement on Forward-Looking Statements on page 66, which forms part of this Managements Discussion and Analysis, as well as the risk factors discussed in our most recent Annual Information Form.
Additional information about us, including our most recent Annual Information Form, is available on our website at www.teck.com, under Tecks profile at www.sedar.com (SEDAR), and on the EDGAR section of the United States Securities and Exchange Commission (SEC) website at www.sec.gov.
2
Teck 2018 Managements Discussion and Analysis
Business Unit Results
The following table shows a summary of our production of our major commodities for the last five years and estimated production for 2019.
Five-Year Production Record and Our Estimated Production in 2019
Principal Products | 2014 | 2015 | 2016 | 2017 | 2018 | 2019 estimate(3) |
||||||||||||||||||||
Steelmaking coal |
million tonnes | 26.7 | 25.3 | 27.6 | 26.6 | 26.2 | 26.25 | |||||||||||||||||||
Copper(1) |
thousand tonnes | 333 | 358 | 324 | 287 | 294 | 300 | |||||||||||||||||||
Zinc |
||||||||||||||||||||||||||
Contained in concentrate |
thousand tonnes | 660 | 658 | 662 | 659 | 705 | 635 | |||||||||||||||||||
Refined |
thousand tonnes | 277 | 307 | 312 | 310 | 303 | 307 | |||||||||||||||||||
Energy (bitumen)(1)(2)
|
million barrels
|
|
|
|
|
|
|
|
|
|
|
|
|
|
6.8
|
|
|
13.0
|
|
Notes: |
(1) | We include 100% of the production and sales from Quebrada Blanca and Carmen de Andacollo mines in our production and sales volumes, even though we own 90% of these operations, because we fully consolidate their results in our financial statements. Our ownership in Quebrada Blanca is expected to be 60% upon closing of our transaction with Sumitomo Metal Mining Co., Ltd. and Sumitomo Corporation, and production and sales will continue to be reported on a 100% basis. We include 22.5% and 21.31% of production and sales from Antamina and Fort Hills, respectively, representing our proportionate ownership interest in these operations. Copper production includes cathode production at Quebrada Blanca. Zinc contained in concentrate production includes co-product zinc production from our copper business unit. |
(2) | Energy (bitumen) results for the year ended December 31, 2018 are included from June 1, 2018. |
(3) | Production estimates for 2019 represent the midpoint of our production guidance range. |
3
Teck 2018 Managements Discussion and Analysis
Average commodity prices and exchange rates for the past three years, which are key drivers of our profit, are summarized in the following table.
US$ | CAD$ | |||||||||||||||||||||||||||||||||||||||
2018 | % chg | 2017 | % chg | 2016 | 2018 | % chg | 2017 | % chg | 2016 | |||||||||||||||||||||||||||||||
Steelmaking coal (realized $/tonne)(1) |
187 | +7% | 174 | +51% | 115 | 243 | +8% | 226 | +48% | 153 | ||||||||||||||||||||||||||||||
Copper (LME cash $/pound) |
2.96 | +6% | 2.80 | +27% | 2.21 | 3.84 | +5% | 3.64 | +24% | 2.94 | ||||||||||||||||||||||||||||||
Zinc (LME cash $/pound) |
1.33 | +2% | 1.31 | +38% | 0.95 | 1.72 | +1% | 1.70 | +35% | 1.26 | ||||||||||||||||||||||||||||||
Blended bitumen (realized $/barrel)(2) |
35.12 | | | | | 46.14 | | | | | ||||||||||||||||||||||||||||||
Exchange rate (Bank of Canada) |
||||||||||||||||||||||||||||||||||||||||
US$1 = CAD$ |
1.30 | 0% | 1.30 | -2% | 1.33 | |||||||||||||||||||||||||||||||||||
CAD$1 = US$ |
0.77 | 0% | 0.77 | +2% | 0.75 |
Notes: |
(1) | Certain 2017 comparative figures have been restated for new IFRS pronouncements. 2016 figures have not been restated. Please refer to Note 32 to our audited annual consolidated financial statements for the year ended December 31, 2018. |
(2) | Energy (bitumen) results for the year ended December 31, 2018 are included from June 1, 2018. |
Our revenues, gross profit before depreciation and amortization, and gross profit by business unit for the past three years are summarized in the following table.
Revenues(2) | Gross Profit Before Depreciation and Amortization(1)(2) |
Gross Profit (Loss)(2) | ||||||||||||||||||||||||||||||||||
($ in millions) |
2018 | 2017 | 2016 | 2018 | 2017 | 2016 | 2018 | 2017 | 2016 | |||||||||||||||||||||||||||
Steelmaking coal |
$ | 6,349 | $ | 6,014 | $ | 4,144 | $ | 3,770 | $ | 3,732 | $ | 2,007 | $ | 3,040 | $ | 3,014 | $ | 1,379 | ||||||||||||||||||
Copper |
2,714 | 2,400 | 2,007 | 1,355 | 1,154 | 788 | 877 | 586 | 190 | |||||||||||||||||||||||||||
Zinc |
3,094 | 3,496 | 3,147 | 1,085 | 1,173 | 984 | 869 | 967 | 830 | |||||||||||||||||||||||||||
Energy(3) |
407 | | 2 | (106) | | 2 | (165) | | (3) | |||||||||||||||||||||||||||
Total |
$ | 12,564 | $ | 11,910 | $ | 9,300 | $ | 6,104 | $ | 6,059 | $ | 3,781 | $ | 4,621 | $ | 4,567 | $ | 2,396 |
Notes: |
(1) | Non-GAAP Financial Measure. See Use of Non-GAAP Financial Measures section for further information. |
(2) | Certain 2017 comparative figures have been restated for new IFRS pronouncements. 2016 figures have not been restated. Please refer to Note 32 to our audited annual consolidated financial statements for the year ended December 31, 2018. |
(3) | Energy (bitumen) results for the year ended December 31, 2018 are included from June 1, 2018. |
4
Teck 2018 Managements Discussion and Analysis
Steelmaking Coal
In 2018, our six steelmaking coal operations in Western Canada produced 26.2 million tonnes of coal, with sales of 26.0 million tonnes. The majority of our sales are to the Asia-Pacific region, with lesser amounts going primarily to Europe and the Americas. Our long-term production capacity is approximately 27 million tonnes, and we have total proven and probable reserves of 883 million tonnes of steelmaking coal.
In 2018, Coal Mountain Operations production declined as it reached the end of its mine reserve. However, favourable geology at Coal Mountain will allow for the mining and processing of a small amount of coal in the first quarter of 2019. In addition, throughout 2018, we hauled a portion of raw coal from Elkview Operations to Coal Mountain Operations for processing and we anticipate that practice to continue through at least the first quarter of 2019.
In 2018, our steelmaking coal business unit accounted for 50% of revenue and 62% of gross profit before depreciation and amortization.
($in millions) | 2018 | 2017 | 2016 | |||||||||
Revenues(2) |
$ | 6,349 | $ | 6,014 | $ | 4,144 | ||||||
Gross profit before depreciation and amortization(1)(2) |
$ | 3,770 | $ | 3,732 | $ | 2,007 | ||||||
Gross profit(2) |
$ | 3,040 | $ | 3,014 | $ | 1,379 | ||||||
Production (million tonnes) |
26.2 | 26.6 | 27.6 | |||||||||
Sales (million tonnes)(2) |
26.0 | 26.5 | 27.0 |
Notes:
(1) | Non-GAAP Financial Measure. See Use of Non-GAAP Financial Measures section for further information. |
(2) | Certain 2017 comparative figures have been restated for new IFRS pronouncements. 2016 figures have not been restated. Please refer to Note 32 to our audited annual consolidated financial statements for the year ended December 31, 2018. |
Operations
Gross profit before depreciation and amortization increased slightly to $3.8 billion in 2018. Gross profit was $3.0 billion in 2018, similar to 2017, as higher prices were mostly offset by lower sales volumes and higher unit operating costs.
Our average realized selling price in 2018 increased to US$187 per tonne, compared with US$174 per tonne in 2017 and US$115 per tonne in 2016.
Sales volumes were 26.0 million tonnes in 2018, slightly lower than 26.5 million tonnes sold in 2017. Sales volumes of steelmaking coal were negatively affected by logistical issues throughout the supply chain during the year.
Our 2018 production of 26.2 million tonnes was 400,000 tonnes less than 2017, primarily due to declining production at Coal Mountain Operations as it reached the end of its current reserve life. In the first quarter of 2018, a pressure event in the coal dryer at Elkview Operations affected production. However, it was fully recovered in subsequent quarters by hauling a portion of raw coal from Elkview Operations to Coal Mountain Operations for processing.
5
Teck 2018 Managements Discussion and Analysis
The cost of product sold in 2018, before transportation and depreciation, was $62 per tonne, compared with $52 per tonne in 2017. This cost increase was a result of increased mining activity, equipment rentals and associated labour to generate production to capture margin in a favourable coal price environment. In addition, the business unit experienced inflationary pressures, predominantly affecting diesel costs, the result of higher oil prices. All of these factors, combined with slightly lower production, longer haul distances and increased activity on mobile maintenance, increased the unit cost per tonne, but have not undermined our strong profitability.
Capital spending in 2018 included $232 million for sustaining capital, $140 million for major enhancements to maintain and increase long-term production capacity, and $90 million for the Neptune Bulk Terminals upgrade.
Elk Valley Water Management
We continue to implement the water quality management measures required by the Elk Valley Water Quality Plan (the Plan), an Area-Based Management Plan approved in 2014 by the B.C. Minister of Environment. The Plan establishes short-, medium- and long-term water quality targets for selenium, nitrate, sulphate and cadmium to protect the environment and human health, as well as a plan to manage calcite formation. In accordance with the Plan, we have constructed and are operating the first active water treatment facility (AWTF) at West Line Creek.
In the fourth quarter, we commissioned an additional treatment step to address an issue regarding selenium compounds in effluent from the West Line Creek AWTF. The facility is operating as designed. We have commenced construction on our next AWTF at Fording River Operations, which will use the same treatment process as the modified West Line Creek AWTF.
In 2018, we successfully operated our first saturated rock fill (SRF) project at our Elkview Operations. The SRF has been in operation for the past 12 months and is demonstrating near-complete removal of nitrate and selenium from the feed water. Results to date from the full-scale trial show that the technology has the potential to replace future AWTFs, as well as to reduce capital and operating costs for water treatment. We are working to increase the capacity of the Elkview SRF to potentially reduce reliance on active water treatment. This approach has not yet received necessary approvals and we continue to progress the construction of additional AWTFs to comply with the Plan.
Capital spending on water treatment in 2019 is expected to be approximately $235 million, including advancing a clean water diversion at Fording River, application of SRF technology at Elkview, construction of Fording River South AWTF, and advancing management of calcite and the early development of water treatment for Fording River North. This compares to approximately $57 million of capital spending on water treatment in 2018.
In our previous guidance, we estimated total capital spending for water treatment between 2018 and 2022 of $850 to $900 million. We intend to complete construction of the Fording River South AWTF, currently under construction. If we are successful in permitting SRF projects to replace the Elkview AWTF and Fording River North AWTF, we estimate that total capital spending on water treatment during this period would reduce to $600 to $650 million. If no reduction in AWTF capacity is permitted, overall capital in the same period would increase by approximately $250 million over our previous guidance, as a result of engineering scope changes at the Elkview AWTF and an increased volume of water treated at Fording River North. We have
6
Teck 2018 Managements Discussion and Analysis
presented regulators with evidence that SRFs are a viable technical alternative to active water treatment, and are working through a review process. We expect that this process will result in a decision in the first half of 2019.
We continue to advance research and development, including the SRF technology. We estimate that over the longer term, SRFs will have capital and operating costs that are 20% and 50%, respectively, of AWTFs of similar capacity. If we are successful in replacing a substantial portion of active water treatment capacity with SRFs, we believe that our long-term operating costs associated with water treatment could be reduced substantially.
All of the foregoing estimates are uncertain. Final costs of implementing the Plan will depend in part on the technologies applied and on the results of ongoing environmental monitoring and modelling. The timing of expenditures will depend on resolution of technical issues, permitting timelines and other factors. We expect that, in order to maintain water quality, some form of water treatment will continue for an indefinite period after mining operations end. The Plan contemplates ongoing monitoring to ensure that the water quality targets set out in the Plan are in fact protective of the environment and human health, and provides for adjustments if warranted by monitoring results. This ongoing monitoring, as well as our continued research into treatment technologies, could reveal unexpected environmental impacts, technical issues or advances associated with potential treatment technologies that could substantially increase or decrease both capital and operating costs associated with water quality management.
During the third quarter of 2018, we received notice from Canadian federal prosecutors of potential charges under the Fisheries Act in connection with discharges of selenium and calcite from coal mines in the Elk Valley. Since 2014, compliance limits and site performance objectives for selenium and other constituents, as well as requirements to address calcite, in surface water throughout the Elk Valley and in the Koocanusa Reservoir have been established under a regional permit issued by the provincial government, which references the Plan. If federal charges are laid, potential penalties may include fines as well as orders with respect to operational matters. We expect that discussions with respect to the draft charges will continue at least into the third quarter of 2019. It is not possible at this time to fully assess the viability of our potential defences to any charges, or to estimate the potential financial impact on us of any conviction. Nonetheless, that impact may be material.
Rail
Rail transportation of product from our five steelmaking coal mines in southeast B.C. to Vancouver port terminals is provided under a 10-year agreement with CP Rail, which expires March 31, 2021. Most eastbound coal deliveries to North American customers are shipped pursuant to an arrangement with CP Rail. The remaining eastbound coal deliveries are shipped via the BNSF Railway. Our Cardinal River Operations in Alberta is served by Canadian National Railway (CN), which transports our product to ports on the west coast. Currently, Teck is shipping under tariff with CN.
Ports
We maintain access to terminal loading capacity in excess of our planned 2019 shipments. We continue to progress a facility upgrade at the Neptune Bulk Terminals, which will increase terminal loading capacity. In 2018, we invested $90 million on the project, primarily in the third and fourth quarters. The program includes an additional $210 million to be spent in 2019 and approximately $170 million in 2020. The upgrades are expected to be completed in the third quarter of 2020.
7
Teck 2018 Managements Discussion and Analysis
In addition, our contract with Westshore Terminals, which expires March 31, 2021, provides us with 19 million tonnes of annual capacity, and we have contracted capacity at Ridley Terminals near Prince Rupert. We are exploring additional options for coal shipments following the expiration of our contract with Westshore Terminals in 2021.
Sales
Our steelmaking coal marketing strategy is focused on maintaining and building relationships with our traditional customers, while establishing new customers in markets where we anticipate long-term growth in steel production and demand for seaborne steelmaking coal. In 2018, we continued to focus our marketing in areas with the greatest demand growth, increasing sales volumes to areas such as India and Southeast Asia.
Markets
Global steel production and demand for seaborne steelmaking coal continued to be strong in 2018. The World Steel Association reported that global steel production increased by 4.6% in 2018 compared to 2017. This was due to resilient steel pricing and demand supported by the recovery in investment activities in developed economies and the improved performance of emerging economies. Depletion and reduced production of some Eastern European coal mines continued to increase demand from European steel mills for seaborne steelmaking coal.
The following graphs show key metrics affecting steelmaking coal sales: spot price assessments and quarterly pricing, hot metal production (each tonne of hot metal, or pig iron, produced requires approximately 650700 kilograms of steelmaking coal), and Chinas steelmaking coal imports by source.
Outlook
Market expectations are that global steel production and demand for steelmaking coal will remain strong in 2019. A robust steelmaking coal market is supported by the demand effect of continued steel capacity growth
8
Teck 2018 Managements Discussion and Analysis
in India and Southeast Asia, the relocation of steel production to coastal areas in China, as well as concerns regarding supply from Australia and the U.S. While demand for steelmaking coal remains strong, pricing has softened somewhat since the beginning of 2019, reflecting shorter vessel queues in Australia and the relaxation of import restrictions in China, which were imposed from November 2018. We continue to monitor the effects that government policy and trade uncertainty might have on potential price volatility.
Steelmaking coal production in 2019 is expected to be between 26.0 and 26.5 million tonnes. We will continue to evaluate raw coal processing opportunities to capture the latent production capacity of our Elk Valley processing plants in 2019. As in prior years, annual production volumes can be adjusted to reflect market demand for our products, subject to adequate rail and port service. Assuming that current market conditions persist, annual production from 2020 to 2022 is expected to be higher than 2019, despite the closure of our Coal Mountain Operations in early 2019.
We continue to advance mining in new areas at our Fording River, Elkview and Greenhills operations, which will extend the lives of these mines and allow us to increase production to compensate for the closure of Coal Mountain. We are investing in processing plants and have transferred mining equipment from Coal Mountain in order to develop the new mining areas at each of these sites. As part of our strategy to maintain production capacity of approximately 27 million tonnes in the Elk Valley, Elkview Operations is well positioned for expansion. The operation is anticipating a higher strip ratio in 2019, with a natural reduction of strip ratios over the next three to five years. The reduction in strip ratios will provide opportunity for a low capital-intensity investment in plant throughput capacity to capitalize on the increased raw coal release beyond 2019 for increasing production.
Although coal prices have softened somewhat since the beginning of 2019, market fundamentals remain supportive for strong coal pricing levels. We are expecting 2019 first quarter sales to reach approximately 6.1 to 6.3 million tonnes. As always, our sales may vary depending on the performance of our logistics chain.
Customers determine vessel nominations for the majority of our sales. Final sales and average prices for the quarter will depend on product mix, market direction for spot priced sales and timely arrival of vessels, as well as the performance of the rail transportation network and port loading facilities.
In December, we experienced poor performance across the supply chain due to underperformance in rail, material handling issues and high wind events in Vancouver. Logistical challenges continued in January, including unplanned dumper outages at Westshore Terminals, which affected train unloading and negatively affected supply chain performance. Performance has improved since late January, but these factors continue to present a risk to our quarterly sales guidance.
We expect our site unit costs to be in the range of $62 to $65 per tonne in 2019. This range is slightly higher than in 2018, primarily as the result of the efforts described above to maintain total production after the closure of Coal Mountain, which will require the use of additional equipment, diesel and labour. We expect quarterly cost of sales to fluctuate in 2019, with higher cost of sales in the second and third quarter when our operations are scheduled to complete major plant maintenance outages.
Transportation costs in 2019 are expected to remain consistent at approximately $37 to $39 per tonne.
We invested approximately $7.5 million in 2018 to continue to evaluate the MacKenzie Redcap detailed design study at our Cardinal River Operations and will be continuing this evaluation in 2019. The MacKenzie Redcap development is expected to supply approximately 1.8 million tonnes of steelmaking coal production
9
Teck 2018 Managements Discussion and Analysis
per year and has the potential to extend production at Cardinal River to approximately 2027, beyond the planned closure in 2020. Beyond 2020, this additional tonnage would add to the current longer-term planned production capacity of approximately 27 million tonnes in the Elk Valley.
We expect sustaining capital expenditures for our steelmaking coal operations to be approximately $485 million in 2019, including approximately $235 million related to water treatment and $250 million for ongoing operations. Sustaining capital expenditures largely relate to reinvestment in our equipment fleets. In addition, approximately $200 million will be invested in major enhancement projects in 2019, primarily relating to the development of the new mining areas at our Elk Valley operations and increasing the plant capacity at our Elkview Operations. This is expected to increase our long-term production capacity and mitigate reduced production on closure of Coal Mountain Operations.
On February 11, 2019, we agreed with Poscan, pursuant to a reopener in the Greenhills joint venture agreement, to increase the royalty paid by Poscan in respect of its 20% share of Greenhills coal production. At current benchmark coal prices of approximately US$200 tonne, the royalty payment will increase by approximately $90 million annually. At current exchange rates, a US$10 per tonne increase or decrease in the coal price would increase or decrease the annual royalty by approximately $4 million. The new royalty remains in effect until December 31, 2022.
10
Teck 2018 Managements Discussion and Analysis
Copper
In 2018, we produced 293,900 tonnes of copper from our Highland Valley Copper Operations in B.C., our 22.5% interest in Antamina in Peru, and our Carmen de Andacollo and Quebrada Blanca operations in Chile. Copper production rose by 2% from 2017, as higher production from Highland Valley Copper, Antamina and Quebrada Blanca was partially offset by lower production from Carmen de Andacollo as a result of declining ore grades.
In 2018, our copper operations accounted for 22% of our revenue and 22% of our gross profit before depreciation and amortization.
Revenues
|
Gross Profit (Loss) Before Depreciation and Amortization(1)(2)
|
Gross Profit (Loss)(2)
|
||||||||||||||||||||||||||||||||||
($ in millions) | 2018 | 2017 | 2016 | 2018 | 2017 | 2016 | 2018 | 2017 | 2016 | |||||||||||||||||||||||||||
Highland Valley Copper |
$ | 941 | $ | 733 | $ | 750 | $ | 343 | $ | 213 | $ | 268 | $ | 164 | $ | 18 | $ | 86 | ||||||||||||||||||
Antamina |
1,061 | 936 | 627 | 794 | 670 | 409 | 652 | 534 | 305 | |||||||||||||||||||||||||||
Carmen de Andacollo |
488 | 549 | 401 | 193 | 222 | 86 | 121 | 142 | 9 | |||||||||||||||||||||||||||
Quebrada Blanca |
224 | 182 | 229 | 26 | 50 | 24 | (59) | (107 | ) | (211) | ||||||||||||||||||||||||||
Other |
| | | (1) | (1 | ) | 1 | (1) | (1 | ) | 1 | |||||||||||||||||||||||||
Total |
$ | 2,714 | $ | 2,400 | $ | 2,007 | $ | 1,355 | $ | 1,154 | $ | 788 | $ | 877 | $ | 586 | $ | 190 |
Notes:
(1) | Non-GAAP Financial Measure. See Use of Non-GAAP Financial Measures section for further information. |
(2) | Certain 2017 comparative figures have been restated for new IFRS pronouncements. 2016 figures have not been restated. Please refer to Note 32 to our audited annual consolidated financial statements for the year ended December 31, 2018. |
Production
|
Sales
|
|||||||||||||||||||||||
(thousand tonnes) |
2018 | 2017 | 2016 | 2018 | 2017 | 2016 | ||||||||||||||||||
Highland Valley Copper |
101 | 93 | 119 | 103 | 89 | 122 | ||||||||||||||||||
Antamina |
100 | 95 | 97 | 99 | 94 | 95 | ||||||||||||||||||
Carmen de Andacollo |
67 | 76 | 73 | 64 | 77 | 73 | ||||||||||||||||||
Quebrada Blanca |
26 | 23 | 35 | 26 | 23 | 35 | ||||||||||||||||||
Total |
294 | 287 | 324 | 292 | 283 | 325 |
Operations
Highland Valley Copper
Our Highland Valley Copper Operations is located in south-central B.C. Gross profit before depreciation and amortization was $343 million in 2018, compared to $213 million in 2017 and $268 million in 2016. Gross profit was $164 million in 2018, compared with $18 million in 2017, due to higher production and sales volumes as a result of improved copper ore grades and recoveries, and higher copper and molybdenum prices, partially offset by higher operating costs.
Highland Valley Coppers 2018 copper production was 100,800 tonnes, compared to 92,800 tonnes in 2017 and 119,300 tonnes in 2016. The increase was primarily due to significantly higher copper grades and higher recoveries in the first half of 2018 compared to early 2017. Copper and molybdenum ore grades declined as expected in the second half of 2018 as we mined ore from lower-grade sections of the Lornex and Valley pits as anticipated in the mine plan. Molybdenum production was 6% lower in 2018 at 8.7 million pounds,
11
Teck 2018 Managements Discussion and Analysis
compared to 9.3 million pounds in 2017, primarily due to lower molybdenum grades.
A $73 million project to install an additional ball mill to increase grinding circuit capacity is progressing on budget and on schedule, with start-up anticipated in the third quarter of 2019. An autonomous haulage pilot project was successfully started during the second half of 2018 in the Lornex pit, with six autonomous haul trucks now fully operational. We also continued studies to assess the potential economic viability of extending the Highland Valley Copper mine life to 2040.
Copper production in 2019 is anticipated to be between 115,000 and 120,000 tonnes, with a relatively even distribution throughout the year. Annual copper production from 2020 to 2022 is expected to be between 135,000 and 155,000 tonnes per year, increasing from the low end to high end of the range during the three-year period. Copper production is anticipated to average about 150,000 tonnes per year after 2022, through to the end of the current mine plan in 2028. Molybdenum production in 2019 is expected to be approximately 6.0 million pounds contained in concentrate, with annual production expected to decline to between 4.0 million and 5.0 million pounds per year afterwards.
Antamina
We have a 22.5% share interest in Antamina, a copper-zinc mine in Peru. The other shareholders are BHP Billiton plc (33.75%), Glencore plc (33.75%) and Mitsubishi Corporation (10%). In 2018, our share of gross profit before depreciation and amortization was $794 million, compared with $670 million in 2017 and $409 million in 2016. Gross profit in 2018 was $652 million, compared with $534 million in 2017 and $305 million in 2016. Gross profit in 2018 increased from 2017 due to higher copper and zinc prices, as well as record production levels of total copper and zinc concentrates of 2.4 million tonnes in 2018.
Antaminas copper production (100% basis) in 2018 was 446,100 tonnes, compared to 422,500 tonnes in 2017, with the increase primarily as a result of higher copper grades. Zinc production was 409,300 tonnes in 2018, an increase from 372,100 tonnes of production in 2017, primarily due to a higher portion of copper-zinc ores processed in 2018. In 2018, molybdenum production was 10.2 million pounds, which was 17% higher than in 2017.
Pursuant to a long-term streaming agreement made in 2015, Teck delivers an equivalent to 22.5% of payable silver sold by Compañía Minera Antamina S.A. to a subsidiary of Franco-Nevada Corporation (FNC). FNC pays a cash price of 5% of the spot price at the time of each delivery, in addition to an upfront acquisition price previously paid. In 2018, approximately 3.2 million ounces of silver were delivered under the agreement. After 86 million ounces of silver have been delivered under the agreement, the stream will be reduced by one-third. A total of 13.2 million ounces of silver have been delivered under the agreement from the effective date in 2015 to December 31, 2018.
Our 22.5% share of Antaminas 2019 production is expected to be in the range of 95,000 to 100,000 tonnes of copper, 65,000 to 70,000 tonnes of zinc and approximately 2.0 million pounds of molybdenum in concentrate. Our share of copper production is expected to be between 90,000 and 95,000 tonnes per year from 2020 to 2022. The lower zinc production in 2019 is a result of mine sequencing, and is expected to return to higher production levels after 2019 with higher grades and a higher proportion of copper-zinc ore to process. Our share of zinc production is expected to average between 100,000 and 110,000 tonnes per year from 2020 to 2022, although annual production will fluctuate due to feed grades and the amount of copper-zinc ore processed. Our share of annual molybdenum production is expected to be between 2.0 and 3.0
12
Teck 2018 Managements Discussion and Analysis
million pounds per year between 2020 and 2022.
Carmen de Andacollo
We have a 90% interest in the Carmen de Andacollo mine, which is located in the Coquimbo Region of central Chile. The remaining 10% is owned by Empresa Nacional de Minería (ENAMI), a state-owned Chilean mining company. Gross profit before depreciation and amortization was $193 million in 2018, compared to $222 million in 2017 and $86 million in 2016. Gross profit decreased to $121 million from $142 million in 2017, primarily due to lower copper production and sales volumes.
Carmen de Andacollo produced 63,500 tonnes of copper contained in concentrate in 2018, compared to 72,500 tonnes in 2017. This was primarily due to lower grades as anticipated in the mine plan, partially offset by higher mill throughput. Mill throughput was a record 4.93 million tonnes in the fourth quarter. Copper cathode production was 3,700 tonnes in 2018, compared with 3,500 tonnes in 2017. Gold production of 59,600 ounces in 2018 was higher than the 54,500 ounces produced in 2017, with 100% of the gold produced for the account of RGLD Gold AG, a wholly owned subsidiary of Royal Gold, Inc. In effect, 100% of gold production from the mine has been sold to Royal Gold, Inc., who pays a cash price of 15% of the monthly average gold price at the time of each delivery, in addition to an upfront acquisition price previously paid.
Consistent with the mine plan, copper grades are expected to continue to decline towards reserve grades in 2019 and future years. We continue to study and implement projects that could help to increase production, including the installation of a sizer to better manage harder ores at depth and increase mill throughput. The sizer project is anticipated to be operational in the first half of 2019 and is included in our production guidance. Carmen de Andacollos production in 2019 is expected to be in the range of 60,000 to 65,000 tonnes of copper in concentrate and approximately 2,000 tonnes of copper cathode. Annual copper in concentrate production is expected to be approximately 60,000 tonnes from 2020 to 2022. Cathode production volumes are uncertain past 2019, although there is some potential to extend production.
Quebrada Blanca
Quebrada Blanca Operations is located in the Tarapacá Region of northern Chile. In April 2018, we increased our interest in Quebrada Blanca to 90% by acquiring an additional indirect 13.5% interest in Compañía Minera Teck Quebrada Blanca S.A. (QBSA) through the purchase of Inversiones Mineras S.A. The purchase price consisted of US$52.5 million paid in cash on closing, an additional payment of US$60 million paid on approval of the social and environmental impact assessment for the Quebrada Blanca Phase 2 (QB2) project and the expiry of certain appeal rights, and a further US$50 million paid within 30 days of the commencement of commercial production at QB2. Additional amounts may become payable to the extent that average copper prices exceed US$3.15 per pound in each of the first three years following commencement of commercial production, up to a cumulative maximum of US$100 million if commencement of commercial production occurs prior to January 21, 2024, or up to a lesser maximum in certain circumstances thereafter.
The other shareholder of QBSA is ENAMI, a Chilean state agency, which holds a 10% preference share interest in QBSA that does not require ENAMI to fund capital spending.
Since the first quarter of 2017, all supergene ore mined has been sent directly to the dump leach circuit. This has resulted in lower recovery and a longer leaching cycle at reduced operating costs, compared to the
13
Teck 2018 Managements Discussion and Analysis
previous operations of the heap leach circuit. Mining of the supergene was expected to end in the second quarter of 2018, but continued until the fourth quarter due to an extension in the mine plan. Mining equipment and personnel have been redeployed to the QB2 project, and the operation is now focused on leaching the dump material and secondary extraction.
Quebrada Blanca produced 25,500 tonnes of copper cathode in 2018, compared to 23,400 tonnes in 2017, with the increase primarily due to increased production from secondary leaching.
Quebrada Blancas gross profit before depreciation and amortization was $26 million in 2018, compared to $50 million in 2017 and $24 million in 2016. Quebrada Blanca incurred a gross loss of $59 million, compared to $107 million in 2017. The improvement in 2018 related to a reduction in depreciation and amortization charges due to the asset impairment charge taken in 2017. However, after depreciation and amortization, a gross loss was recorded in both 2018 and 2017.
We expect production of approximately 20,000 to 23,000 tonnes of copper cathode in 2019. We expect cathode production to carry on into early 2020.
Quebrada Blanca Phase 2
The Quebrada Blanca Phase 2 (QB2) project is one of the worlds largest undeveloped copper resources. QB2 is expected to have low operating costs, an initial mine life of 28 years, and significant potential for further growth.
The social and environmental impact assessment (SEIA) for the QB2 project was approved in August 2018. The Chile Environmental Evaluation Commission unanimously voted to approve the project on August 8, 2018. The final regulatory approval document, or RCA, was received on August 29, 2018. Long-term community agreements have been reached with all Indigenous communities involved in the evaluation. As expected, various administrative and legal appeals have been filed in respect of the SEIA approval, and QBSA and the relevant Chilean authorities are responding in the ordinary course.
In December, our Board of Directors approved the QB2 project for full construction and we announced a transaction with Sumitomo Metal Mining Co., Ltd. (SMM) and Sumitomo Corporation (SC) to subscribe for a 30% indirect interest in QBSA, which owns 100% of the QB2 project. The consideration payable by SMM and SC consists of a US$1.2 billion contribution for a 30% indirect interest in QBSA, US$50 million to Teck if QB2 achieves optimized target mill throughput of 154,000 tonnes per day by December 31, 2025, subject to adjustment; and a contingent contribution of 12% of the incremental NPV of a major expansion project (QB3) upon approval of construction, subject to adjustment (8% contingent earn-in contribution, 4% matching contribution). Closing of the transaction is subject to customary conditions precedent, including receipt of necessary regulatory approvals, and is now expected to occur before the end of March 2019.
On announcement of the transaction with SMM/SC, the Teck Board approved the QB2 project for full construction. Project development expenditures for 2019 are anticipated to be approximately US$1,460 million. After the transaction proceeds have been expended, Teck and SMM/SC will fund the balance of project costs with proceeds from the expected US$2.5 billion of project financing and pro rata contributions from Teck and SMM/SC on a 66.67% and 33.33% basis, respectively. ENAMI is not required to provide funding toward the capital cost of QB2. Teck and SMM/SC are in discussions with export credit agencies and commercial banks with respect to a proposed limited recourse project finance facility of up to US$2.5 billion.
14
Teck 2018 Managements Discussion and Analysis
The combination of the contributions by SMM and SC from the transaction and proposed project financing reduces Tecks share of equity contributions toward the un-escalated US$4.739 billion1 estimated capital cost of the QB2 project to US$693 million2 with Tecks first contributions post-closing not required until late 2020. The target date for project completion and the start of commissioning and ramp-up is the fourth quarter of 2021. Full production is expected in the middle of 2022.
On a 100% basis, average annual copper-equivalent production of QB2 over the first five full years of operation is estimated at 316,000 tonnes. The mine plan is constrained by the current capacity of the tailings facility and exploits less than 25% of the total defined reserve and resource. The significant resource outside the current mine plan provides the potential for expansions in future years and the mine facilities have been designed with this in mind. The project scope includes the construction of a 143,000-tonne-per-day concentrator and related facilities, which are connected to a new port and desalination plant by 165-kilometre concentrate and desalinated water pipelines.
Project development expenditures during 2018 were approximately US$317 million. During the fourth quarter we started to ramp up field activities and release major contracts. There are currently about 2,000 beds available for construction, with the current construction workforce already over 1,000 people. Earthworks activities are fully underway, including utilizing the existing mine fleet and third-party contractors, as well as other enabling construction activities including camp construction and development of infrastructure for power and water. Other project activities during the year focused on advancing detailed engineering, procurement and contracting activities to support construction as well as advancing operational readiness.
Engineering studies are also underway to assess the expansion potential beyond QB2, including a potential doubling of throughput capacity in the future.
NuevaUnión
Compañía Minera NuevaUnión S.A., which owns the Relincho and La Fortuna projects, is owned 50% by Teck and 50% by Goldcorp Inc. A prefeasibility study (PFS) on the NuevaUnión project was completed in early 2018, which incorporates key design changes from the earlier scoping study to improve project economics and respond to community and Indigenous Peoples input.
The PFS estimates an initial capital cost for the Phase 1 development of the project on a 100% basis of US$3.4 to US$3.5 billion (not including working capital or interest during construction). Phase 2 development of the project will require additional capital investment to link the La Fortuna site to the processing facility. Mining the higher-grade portions of Relincho in Phase 1 will allow the project to help fund Phase 2 from project cash flows. Initial production from the La Fortuna mine in Phase 2 will also focus on higher-grade areas, providing significant cash flows in the early years of this phase. As a result, the PFS contemplates average annual production of 224,000 tonnes of copper, 269,000 ounces of gold and 1,700 tonnes of molybdenum in concentrate for the first five full years of mine life, or approximately 283,000 tonnes per year of copper-equivalent production.
1 On a 100% go-forward basis from January 1, 2019 in constant Q2 2017 dollars and a CLP/USD exchange rate of 625, not including escalation (estimated at US$300$470 million based on 2%3% per annum inflation), working capital or interest during construction. Includes approximately US$500 million in contingency. At the current spot CLP/USD rate of approximately 675, capital would be reduced by approximately US$270 million.
2 On a go-forward basis from January 1, 2019. Assumes US$2.5 billion in project finance loans and without deduction of fees and interest during construction, and US$1.2 billion contribution from SMM and SC.
15
Teck 2018 Managements Discussion and Analysis
A feasibility study (FS) commenced in the third quarter of 2018 and is anticipated to be complete in late 2019. The project team continues to work closely with the local communities and is preparing to submit an Environmental Impact Assessment (EIA) to the regulatory authorities in the second half of 2019. Detailed project economics will be released with the completion of the FS.
Project Satellite
The objective of the Project Satellite initiative is to surface value from five substantial base metals assets: Zafranal, San Nicolás, Galore Creek, Mesaba and Schaft Creek, all of which are located in stable jurisdictions in the Americas.
At the Zafranal copper-gold project in southern Peru, the project team significantly advanced its activities in support of a feasibility study, which we expect to complete in the first half of 2019. We expect to submit the SEIA in the second quarter of 2019, which is approximately two quarters later than originally planned as a result of the requirement to complete detailed pre-reviews with the regulator prior to submission. Spending in 2018 was $29.4 million and planned spending in 2019 is $39.7 million.
At the San Nicolás copper-zinc-silver-gold project in Zacatecas, Mexico, a significant drill program was completed, which included infill, geotechnical, hydrogeological, exploration and condemnation drillholes. In addition, the project team advanced social and environmental baseline studies, community engagement activities, preliminary hydrogeological studies and project engineering programs in support of a prefeasibility study (PFS) and early permitting activities. We expect the PFS to be complete in the fourth quarter of 2019. Spending in 2018 was $18.2 million and planned spending in 2019 is $25.6 million.
At the Galore Creek copper-gold-silver project in British Columbia, Newmont Mining Corporation acquired NOVAGOLD Resources Inc.s 50% interest in the Galore Creek Partnership in July 2018. Since Newmonts entry into the partnership, subject matter experts from both Newmont and Teck have worked together to develop the scope of fieldwork programs and prefeasibility study work to be carried out over the next three to four years. Program work in 2018 focused on maintaining the mineral properties and carrying out preliminary geological mapping, prospecting and mineral deposit studies. Our share of spending in 2018 was $4.6 million and our share of planned spending in 2019 is $19.2 million.
At the Mesaba copper-nickel-platinum group metals-cobalt deposit in northeastern Minnesota, the project team completed a range of planning activities, preliminary development and environmental studies, and mineral resource estimate work. Spending in 2018 was $6.4 million and planned spending in 2019 is $13.5 million.
Markets
Copper prices on the London Metal Exchange (LME) averaged US$2.96 per pound in 2018, up US$0.16 per pound from average prices in 2017.
Copper stocks on the LME fell by 35% to 132,200 tonnes in 2018, while copper stocks on the Shanghai Futures Exchange fell by 21% to 118,700 tonnes and COMEX warehouse stocks fell 54% to 84,900 tonnes. Combined exchange stocks decreased by 197,700 tonnes during 2018 and ended the year at 335,800 tonnes, the lowest levels since 2014. Total reported global stocks, including producer, consumer, merchant and terminal stocks, stood at an estimated 17.3 days of global consumption versus the 25-year average of
16
Teck 2018 Managements Discussion and Analysis
28 days.
In 2018, global copper mine production increased 2.8% according to Wood Mackenzie, a commodity research consultancy, with total production estimated at 20.6 million tonnes. While the industry experienced several disruptions at large mines in 2017, production at these mines achieved expected production levels in 2018, and, despite a large number of labour contracts expiring in 2018, most settled without incident. Wood Mackenzie is forecasting a 0.3% increase in global mine production in 2019 to 20.7 million tonnes.
Copper scrap availability decreased in 2018 as global trade patterns were disrupted by environmental restrictions on certain types of scrap imports into China. Scrap and unrefined copper imports into China, including blister and anode, were down 15% year over year to September 2018.
Wood Mackenzie estimates that global refined copper production grew 2.5% in 2018, below the 3.0% growth rate for global copper cathode demand. They are projecting that refined production will increase 1.6% in 2019, reaching 23.9 million tonnes. Fundamentals for copper are expected to remain positive over the medium to long term, with mine supply constrained by lower grades and a lack of investment in new mine projects. Wood Mackenzie are forecasting that global copper metal demand will increase by 2.5% in 2019, reaching 24.3 million tonnes, suggesting the refined copper market will be in deficit again in 2019.
Outlook
We expect 2019 copper production to be in the range of 290,000 to 310,000 tonnes, slightly higher than 2018 production levels. The higher production is primarily due to improving grades at Highland Valley Copper.
In 2019, we expect our copper unit costs to be in the range of US$1.70 to US$1.80 per pound before margins from by-products, similar to 2018 levels. Copper unit costs are expected to be in the range of US$1.45 to US$1.55 per pound after by-products based on current production plans, by-product prices and exchange rates, an increase from 2018 due to expected lower by-product prices in 2019.
We expect annual copper production to be in the range of 285,000 to 305,000 tonnes from 2020 to 2022, excluding QB2, which is scheduled for first production in late 2021 and is expected to add substantially to our overall copper production in 2022.
17
Teck 2018 Managements Discussion and Analysis
Zinc
We are one of the worlds largest producers of mined zinc, primarily from our Red Dog Operations in Alaska, the Antamina copper mine in northern Peru (where zinc is a co-product) and our Pend Oreille mine in Washington state. Our metallurgical complex in Trail, B.C. is one of the worlds largest integrated zinc and lead smelting and refining operations. In 2018, we produced 705,000 tonnes of zinc in concentrate, while our Trail Operations produced 302,900 tonnes of refined zinc.
In 2018, our zinc business unit accounted for 25% of revenue and 18% of gross profit before depreciation and amortization.
Revenues | Gross Profit (Loss) Before Depreciation and Amortization(1) |
Gross Profit (Loss) | ||||||||||||||||||||||||||||||||||
($ in millions) |
2018 | 2017 | 2016 | 2018 | 2017 | 2016 | 2018 | 2017 | 2016 | |||||||||||||||||||||||||||
Red Dog |
$ | 1,696 | $ | 1,752 | $ | 1,444 | $ | 990 | $ | 971 | $ | 749 | $ | 864 | $ | 874 | $ | 668 | ||||||||||||||||||
Trail Operations |
1,942 | 2,266 | 2,049 | 91 | 209 | 241 | 16 | 131 | 178 | |||||||||||||||||||||||||||
Pend Oreille |
98 | 105 | 77 | (5) | 19 | | (20) | (12) | (10) | |||||||||||||||||||||||||||
Other |
8 | 8 | 7 | 9 | (26) | (6) | 9 | (26) | (6) | |||||||||||||||||||||||||||
Intra-segment |
(650) | (635) | (430) | | | | | | | |||||||||||||||||||||||||||
Total |
$ | 3,094 | $ | 3,496 | $ | 3,147 | $ | 1,085 | $ | 1,173 | $ | 984 | $ | 869 | $ | 967 | $ | 830 |
Note:
(1) | Non-GAAP Financial Measure. See Use of Non-GAAP Financial Measures section for further information. |
Production
|
Sales
|
|||||||||||||||||||||||
(thousand tonnes) | 2018 | 2017 | 2016 | 2018 | 2017 | 2016 | ||||||||||||||||||
Refined zinc |
||||||||||||||||||||||||
Trail Operations |
303 | 310 | 312 | 304 | 309 | 312 | ||||||||||||||||||
Contained in concentrate |
||||||||||||||||||||||||
Red Dog |
583 | 542 | 583 | 521 | 534 | 600 | ||||||||||||||||||
Pend Oreille |
30 | 33 | 34 | 30 | 32 | 34 | ||||||||||||||||||
Copper business unit(1) |
92 | 84 | 45 | 93 | 85 | 43 | ||||||||||||||||||
Total |
705 | 659 | 662 | 644 | 651 | 677 |
Note:
(1) | Includes zinc production from Antamina. |
Operations
Red Dog
Red Dog Operations, located in northwest Alaska, is one of the worlds largest zinc mines. Red Dogs gross profit before depreciation and amortization in 2018 was $990 million, compared with $971 million in 2017 and $749 million in 2016. Gross profit in 2018 was $864 million, similar to 2017, as sales volumes and metal prices were similar year over year.
In 2018, zinc production at Red Dog increased to 583,200 tonnes compared to 541,900 tonnes in 2017, primarily due to higher zinc grades and recoveries. Lead production in 2018 declined to 98,400 tonnes,
18
Teck 2018 Managements Discussion and Analysis
compared to 111,300 tonnes in 2017, primarily due to lower grades and recoveries.
Work continues on the US$110 million mill upgrade project, which is progressing as planned. Construction started in late 2017 and is expected to increase average mill throughput by about 15% over the remaining mine life, helping to offset lower grades and harder ore, with planned start-up in the first quarter of 2020.
Red Dogs location exposes the operation to severe weather and winter ice conditions, which can significantly affect production, sales volumes and operating costs. In addition, the mines bulk supply deliveries and all concentrate shipments occur during a short ocean shipping season that normally runs from early July to late October. This short shipping season means that Red Dogs sales volumes are usually higher in the last six months of the year, resulting in significant variability in its quarterly profit, depending on metal prices.
In accordance with the operating agreement between Teck and NANA Regional Corporation, Inc. (NANA) governing the Red Dog mine, we pay a royalty on net proceeds of production each quarter. This royalty increases by 5% every fifth year to a maximum of 50%. The most recent increase occurred in October 2017, bringing the royalty to 35%. The NANA royalty charge in 2018 was US$252 million, compared with US$324 million in 2017. NANA has advised us that it ultimately shares approximately 60% of this royalty, net of allowable costs, with other Regional Alaska Native Corporations pursuant to section 7(i) of the Alaska Native Claims Settlement Act.
Red Dogs production of contained metal in 2019 is expected to be in the range of 535,000 to 555,000 tonnes of zinc and 85,000 to 90,000 tonnes of lead. From 2020 to 2022, Red Dogs production of contained metal is expected to be in the range of 500,000 to 520,000 tonnes of zinc and 85,000 to 100,000 tonnes of lead per year, respectively.
Trail Operations
Our Trail Operations in southern B.C. produces refined zinc and lead, as well as a variety of precious and specialty metals, chemicals and fertilizer products.
Trail Operations had a gross profit before depreciation and amortization of $91 million in 2018, compared with $209 million in 2017 and $241 million in 2016. Gross profit was $16 million in 2018, a decrease of $115 million from 2017, primarily due to lower production levels, historically low treatment and refining charges, and increased electricity costs after the sale of the Waneta Dam.
The British Columbia Utilities Commission (BCUC) approved the $1.2 billion sale of our two-thirds interest in the Waneta Dam to BC Hydro in the third quarter and closing of the sale occurred on July 26, 2018. Under our agreement with BC Hydro, we entered into a 20-year arrangement to purchase power for our Trail Operations, with an option to extend the arrangement for a further 10 years on comparable terms. This arrangement results in additional annual power costs for Trail Operations of $75 million, escalating at 2% per year. We recognized this transaction as a disposition of the Waneta Dam and related transmission assets. We recorded a pre-tax gain, net of transaction costs of $888 million ($812 million after tax).
Refined zinc production in 2018 was 302,900 tonnes, compared with 310,100 tonnes in 2017. Refined lead production in 2018 was 61,000 tonnes, compared with 87,100 tonnes in 2017. The decline in refined lead production was primarily due to a planned extended maintenance shutdown of the KIVCET furnace
19
Teck 2018 Managements Discussion and Analysis
completed in the fourth quarter of 2018, which occurs once every four years. Additional factors included the effect of wildfire smoke that caused a temporary shutdown of some facilities in August. Silver production declined to 11.6 million ounces in 2018 from 21.4 million ounces in 2017, due to the KIVCET maintenance shutdown and lower silver inputs.
Our recycling process treated 41,700 tonnes of material during the year, and we plan to treat about 44,700 tonnes in 2019. Our focus remains on treating lead acid batteries and cathode ray tube glass, plus small quantities of zinc alkaline batteries and other post-consumer waste.
In November 2016, we announced that we would invest $174 million in the installation of a second new acid plant to improve efficiency and environmental performance at Trail Operations. The construction of the acid plant is over 90% completed, and on time and on budget, with commissioning planned in the second quarter of 2019.
In 2019, we expect Trail Operations to produce 305,000 to 310,000 tonnes of refined zinc, approximately 70,000 to 75,000 tonnes of refined lead and 13.0 to 14.0 million ounces of silver. Zinc production from 2020 to 2022 is expected to increase to 310,000 to 315,000 tonnes per year, while annual lead production is expected to rise to 85,000 to 95,000 tonnes. Silver production depends on the amount of silver contained in the purchased concentrates.
Pend Oreille
Pend Oreille, located in Washington state, achieved zinc production of 29,700 tonnes in 2018, compared to 33,100 tonnes in 2017. Production declined due to reduced availability of higher-grade ore sources and additional ground support requirements in the first half of 2018.
We expect production in 2019 to be between 20,000 and 30,000 tonnes of zinc in concentrate. Production rates beyond the third quarter of 2019 are uncertain.
Markets
Zinc prices on the LME averaged US$1.33 per pound for the year, similar to US$1.31 per pound in 2017.
Zinc stocks on the LME fell by 52,700 tonnes in 2018, a 29% decline from 2017 levels, finishing the year at 129,300 tonnes, the lowest levels since early 2008. Stocks held on the Shanghai Futures Exchange fell 48,500 tonnes in 2018, a 71% decline from 2017 levels, finishing the year at 20,100 tonnes, the lowest level since stocks started to be reported in early 2007. We estimate that total reported global stocks, which include producer, consumer, merchant and terminal stocks, fell by approximately 102,000 tonnes in 2018 to 0.7 million tonnes at year-end, representing an estimated 21 days of global demand, compared to the 25-year average of 41 days.
In 2018, global zinc mine production increased 2.5% according to Wood Mackenzie, a commodity research consultancy, with total production reaching 12.9 million tonnes. Zinc mine production increased for the second consecutive year, but still remained below 2015 production levels. Wood Mackenzie expects global zinc mine production to grow to 13.9 million tonnes in 2019, largely attributable to restarts at several previously closed mines, along with some previously committed new larger-scale mines.
20
Teck 2018 Managements Discussion and Analysis
Wood Mackenzie estimates that the global zinc metal market remained in deficit in 2018 for the third consecutive year, recording a shortfall of 1.14 million tonnes. Global refined zinc demand was relatively flat at 14.3 million tonnes, growing only an estimated 0.6% over 2017.
Wood Mackenzie estimates that global refined zinc production fell 2.5% in 2018 for the third year in a row on tight concentrate supplies, with refined production reaching 13.2 million tonnes. They also estimate that refined zinc production will see a 6.4% increase in 2019 over 2018 levels, to 14.0 million tonnes, the first increase to refined production in four years. The estimate for the total increase in supply will still be below global metal demand, which is forecast to grow 1.5% to 14.5 million tonnes, suggesting that the refined metal market will continue in deficit into 2019.
Outlook
We expect zinc in concentrate production in 2019, including co-product zinc production from our copper business unit, to be in the range of 620,000 to 650,000 tonnes.
In 2019, we expect our zinc unit costs to be in the range of US$0.50 to US$0.55 per pound before margins from by-products and US$0.35 to US$0.40 per pound after margins from by-products based on current production plans, by-product prices and exchange rates. Unit costs after by-product margins are expected to vary significantly throughout the year with higher costs in the first half, as sales of Red Dog lead, our main by-product, are typically completed in the third and fourth quarters.
For the 2020 to 2022 period, we expect total annual zinc in concentrate production to be in the range of 600,000 to 630,000 tonnes excluding Pend Oreille, which has an uncertain production profile beyond 2019.
Benchmark terms for zinc treatment and refining charges were at historical lows in 2018, contributing to Trail Operations profitability challenges in the fourth quarter. Trail Operations uses a long-term concentrate purchase strategy that averages payment terms and results in composite treatment charge terms generally over two years. We estimate that more than half of Trail Operations concentrate purchases for the first half of 2019 are referenced to 2018 benchmark terms.
21
Teck 2018 Managements Discussion and Analysis
Energy
Our energy assets include a 21.3% interest in the Fort Hills oil sands mine, a 100% interest in the Frontier oil sands project and a 50% interest in various other oil sands leases in the exploration phase, including the Lease 421 Area. All these assets are located in the Athabasca oil sands region of northeastern Alberta.
In 2018, our Energy business unit accounted for 3% of revenue and incurred a $106 million gross loss before depreciation and amortization. Fort Hills results were effective from June 1, 2018 when we concluded the mine was operational.
Fort Hills(1)(3)
($ in millions) | 2018 | |||
Blended bitumen price realized (US$/bbl)(2)(4) |
$ | 35.12 | ||
Bitumen price realized (CAD$/bbl)(2)(4) |
$ | 32.81 | ||
Operating netback (CAD$/bbl)(2)(4) |
$ | (10.95 | ) | |
Production (million bitumen barrels) |
6.8 | |||
Production (average barrels per day) |
31,955 | |||
Gross profit (loss) before depreciation and amortization(2) |
$ | (106 | ) | |
Gross profit (loss) |
$ | (165 | ) |
Notes: |
(1) | Fort Hills results for the year ended December 31, 2018 are effective from June 1, 2018. |
(2) | Non-GAAP Financial Measure. See Use of Non-GAAP Financial Measures section for further information. |
(3) | Fort Hills figures presented at our ownership interest of 21.3%. |
(4) | See Use of Non-GAAP Financial Measures section for reconciliation. |
Fort Hills
The Fort Hills oil sands mine is located in northern Alberta. As at December 31, 2018, we held a 21.3% interest in the Fort Hills Energy Limited Partnership (Fort Hills Partnership), which owns the Fort Hills oil sands mine, with Total E&P Canada Ltd. (Total) and Suncor Energy Inc. (Suncor) holding the remaining interest. An affiliate of Suncor is the operator of the project.
Both production volumes and product quality on start-up have exceeded our expectations. Bitumen production from the first two secondary extraction trains at Fort Hills commenced in the first quarter of 2018, followed by the third and final train in May. All commissioning and construction activities are now complete. In the second quarter, we concluded that Fort Hills was operational, and results from Fort Hills are included in our consolidated results from June 1, 2018.
Realized prices and operating results in the fourth quarter were significantly impacted by a material decline in global benchmark prices and the widening of Canadian heavy blend differentials, namely Western Canada Select (WCS). In addition, costs associated with diluent increased significantly during the fourth quarter of 2018 due to a seasonal increase in diluent consumption and unusual widening in the spread between diluent and WCS. As a result of the decline in prices, we recorded inventory write-downs during the fourth quarter of approximately $34 million.
The plant was successfully tested and ran at full design nameplate capacity for much of the fourth quarter, with December production exceeding 200,000 barrels per day. Fort Hills produced 46 million barrels of bitumen, or 125,000 barrels per day, since first oil in January 2018. Our share of production since January 1, 2018 was 9.7 million barrels, or 26,580 barrels per day, which was near the high end of our guidance of 8.5
22
Teck 2018 Managements Discussion and Analysis
million to 10.0 million barrels. Unit operating costs averaged $32.89 for the year and continued to improve to below $23.00 per barrel in December as production ramped up to full capacity.
Fort Hills has performed very well during start-up and commissioning and there is further potential to debottleneck and expand the production capacity. Evaluation of debottlenecking opportunities will include near-term work to improve the performance of the existing facilities with minimal capital. Long-term opportunities that may require modest capital expenditure will also be investigated. Between the near-term and long-term opportunities, there is a potential to increase Fort Hills production by 20,000 to 40,000 barrels per day of bitumen on a 100% basis. Our share of annual production could increase from 14 million barrels to approximately 15.5 to 17 million barrels.
Our share of Fort Hills major enhancement capital expenditures was $69 million in 2018 and is expected to be $100 million in 2019. Sustaining capital expenditures were $21 million in 2018 and are expected to be $60 million in 2019. Fort Hills major enhancement and sustaining capital is expected to remain elevated in 2019 at approximately $13.50 per barrel, primarily due to tailings and equipment ramp-up spending, before sustaining capital declines to $3 to $5 per barrel on average over the life of mine. Major enhancement capital is variable over the life of mine due to phasing of tailings and other development spending.
Markets
Based on industry estimates, we forecast global crude oil demand growth in 2019 to be approximately 1.325 million barrels per day. Non-OPEC production growth in 2019 is forecast at 2.000 million barrels per day, with North America contributing 1.500 million barrels per day of incremental supply. In order for the market to be in balance given the projected imbalance between demand growth and non-OPEC supply growth the production curtailment accord between OPEC and certain Russian producers announced in December 2018 needs to be adhered to in some measure. Canadian crude oil supply growth in 2019 is forecast at 0.270 million barrels per day. As in 2018, the majority of the supply increase in 2019 is anticipated to come from heavy blends. Supply growth will be generated via the commissioning and start-up of smaller or brownfield oil sands projects.
Export pipeline capacity for Canadian crude oil versus overall supply was in deficit through 2018 and is expected to remain that way until new capacity is developed. Exacerbating the imbalance was a slower-than-expected ramp-up of crude by rail takeaway capacity. Once contracted for, committed rail capacity will be utilized on a regular basis to ship heavy blends.
Fort Hills bitumen production is delivered via pipeline to the East Tank Farm blend facility and ultimately sold as a blended bitumen product known as Fort Hills Reduced Carbon Life Cycle Dilbit Blend (FRB). We sell our share of FRB to a variety of customers at Hardisty market hub and the U.S. Gulf Coast. Approximately 80% of our FRB sales are at Hardisty, with the remainder at the U.S. Gulf Coast.
Net bitumen realizations at Fort Hills are influenced by a combination of North American crude oil benchmark prices, including the New York Mercantile Exchange (NYMEX) light sweet crude oil (WTI), Canadian heavy crude oil (WCS at Hardisty) and diluent (condensate at Edmonton). Bitumen price realizations are also affected by specific bitumen quality and spot sales.
The NYMEX WTI is the current light oil benchmark for North American crude oil prices. WTI averaged US$64.77 per barrel in 2018.
23
Teck 2018 Managements Discussion and Analysis
WCS is a blend of conventionally produced heavy oils and bitumen, blended with diluent (condensate). WCS is a widely marketed crude grade with transparent market price references quoted at Hardisty and U.S. Gulf Coast market hubs. The index pricing period for WCS at Hardisty is typically the first nine to 11 business days that begin on the first business day of the calendar month prior to the month of delivery. WCS at Hardisty typically trades at a differential below the NYMEX WTI benchmark price, and traded at an average discount of US$39.45 per barrel for fourth quarter deliveries, for a value of US$19.35 per barrel. Hardisty differentials widened substantially in the quarter as increases in production strained crude oil export infrastructure and regional storage capacities.
WCS at the U.S. Gulf Coast is priced at a material premium to WCS at Hardisty, reflective of strong heavy sour oil demand, and reduced supply from Venezuela and Mexico. The U.S. Gulf Coast WCS differential to the NYMEX WTI in 2018 ranged between a discount of US$5.45 per barrel and a premium of US$1.12 per barrel, for an average 2018 discount of US$2.63 per barrel.
Operating Netback
The following table summarizes our Fort Hills operating netback for the year.
(Amounts reported in CAD$ per barrel of bitumen sold) | 2018(2) | |||
Bitumen price realized(1)(3)(4) |
$ | 32.81 | ||
Crown royalties(5) |
(2.04 | ) | ||
Transportation costs(6) |
(8.83 | ) | ||
Adjusted operating costs(1)(3)(7) |
(32.89 | ) | ||
Operating netback(1) |
$ | (10.95 | ) |
Notes: |
(1) | Non-GAAP measure. See Use of Non-GAAP Financial Measures section for further details. |
(2) | Fort Hills financial results for the year ended December 31, 2018 are included in operating results from June 1, 2018. |
(3) | See Use of Non-GAAP Financial Measures section for reconciliation. |
(4) | Bitumen price realized represents the realized petroleum revenue (blended bitumen sales revenue) net of diluent expense, expressed on a per barrel basis. Blended bitumen sales revenue represents revenue from our share of the heavy crude oil blend known as Fort Hills Reduced Carbon Life Cycle Dilbit Blend (FRB), sold at the Hardisty and U.S. Gulf Coast market hubs. FRB is comprised of bitumen produced from the Fort Hills oil sands mining and processing operations blended with purchased diluent. The cost of blending is affected by the amount of diluent required and the cost of purchasing, transporting and blending the diluent. A portion of diluent expense is effectively recovered in the sales price of the blended product. Diluent expense is also affected by Canadian and U.S. benchmark pricing and changes in the value of the Canadian dollar relative to the U.S. dollar. |
(5) | The royalty rate applicable to pre-payout oil sands operations starts at 1% of gross revenue and increases for every dollar by which the WTI crude oil price in Canadian dollars exceeds $55 per barrel, to a maximum of 9% when the WTI crude oil price is $120 per barrel or higher. Fort Hills is currently in the pre-payout phase. Detailed information regarding Alberta oil sands royalties can be found on the following website: https://www.energy.alberta.ca/OS/OSRoyalty/Pages/default.aspx. |
(6) | Transportation costs represent pipeline and storage costs downstream of the East Tank Farm blending facility. We use various pipeline and storage facilities to transport and sell our blend to customers throughout North America. Sales to the U.S. markets require additional transportation costs, but realize higher selling prices. |
(7) | Operating costs represent the costs to produce a barrel of bitumen from the Fort Hills mine and processing operation. |
Outlook
Due to limited export capacity and extreme price volatility for Alberta crude oil, the Government of Alberta announced the curtailment of provincial crude oil and bitumen production, effective January 1, 2019. Initially, 325,000 barrels per day for the first quarter of 2019 was to be reduced across the industry, declining to approximately 30% of the initial curtailment levels for the remainder of the year. The government subsequently revised the first quarter curtailment level to 250,000 barrels per day for the production months of February and March.
Although there continues to be uncertainty around the details of the Government of Alberta announced curtailment, we expect it to affect both production and unit operating costs in 2019. We expect our 2019 share of bitumen production to be in the range of 33,000 to 38,000 barrels per day (12 to 14 million barrels annualized), including estimated production curtailments and unit operating costs to be $26.00 to $29.00 per barrel for the year. Consistent with the announced curtailments, we expect production to be lower in the first
24
Teck 2018 Managements Discussion and Analysis
quarter at a range of 30,000 to 32,000 barrels per day. With the lower production, we also expect unit operating costs to be higher in the first quarter.
Consistent with the Government of Albertas production curtailment announcement, our production guidance for 2019 assumes the mandatory production curtailments as described above. The high end of our production guidance reflects curtailments being lifted in the second quarter.
Based on our share of Fort Hills operating at full production rates (approximately 90% of nameplate capacity of 194,000 barrels per day), our estimated EBITDA sensitivity to a US$1/barrel change in the WCS price is approximately $18.5 million, and $13.5 million in respect of our after-tax profit.
Frontier Project
We hold a 100% interest in the Frontier oil sands project, which is located in northern Alberta. The regulatory application review of Frontier continued with a public hearing before a joint federal/provincial panel that concluded in December 2018. The earliest a federal decision statement could be expected for Frontier is in the second half of 2019. Our expenditures on Frontier are limited to supporting this process. We continue to evaluate the future project schedule and development options as part of our ongoing capital review and prioritization process.
As of December 31, 2018, our best estimate of unrisked contingent bitumen resources for the Frontier project is approximately 3.2 billion barrels. The project has been designed for a total nominal production of approximately 260,000 barrels per day of bitumen. The Frontier contingent resources have been subcategorized as development pending and economically viable. There is uncertainty that it will be commercially viable to produce any portion of the resources.
The disclosure regarding our oil sands assets includes references to reserves and contingent bitumen resource estimates. Further information about these resource estimates, and the related risks and uncertainties, and contingencies that prevent the classification of resources as reserves, is set out on page 68 under the heading Contingent Resource Disclosure. For further information about these reserve estimates, see our most recent Annual Information Form, which is available on our website at www.teck.com, on the Canadian Securities Administrators website at www.sedar.com (SEDAR), and under cover of Form 40-F on the EDGAR section of the Securities Exchange Commission (SEC) website at www.sec.gov.
Lease 421 Area
We hold a 50% interest in the Lease 421 Area, which is located east of the Fort Hills project in northern Alberta. To date, a total of 89 core holes have been completed in the Lease 421 Area.
25
Teck 2018 Managements Discussion and Analysis
Exploration
Throughout 2018, we conducted exploration around the world through our seven regional offices. Expenditures for the year of $69 million were focused on copper, zinc and gold.
Exploration plays three critical roles at Teck: discovery of new orebodies through early stage exploration and acquisition; pursuit, evaluation and acquisition of development opportunities; and delivery of geoscience solutions and services to create value at our existing mines and development projects.
During 2018, early stage copper exploration continued to focus primarily on advancing porphyry-style projects in Chile, Peru, the United States and Mexico. In addition, significant exploration was carried out in and around our existing operations and advanced projects, including approximately 18 kilometres at QB2 and QB3. In 2019, we plan to drill several early stage copper projects, and we will continue to explore around our existing operations and advanced projects, with a significant program to support QB3 studies.
Zinc exploration has been concentrated in four areas: the Red Dog mine district in Alaska, western Canada, northeastern Australia, and Ireland. In Alaska, Australia and Canada, the targets are large, high-grade, sediment-hosted deposits similar to major world-class deposits. In 2018, we continued to drill on 100% state-owned lands near our Red Dog mine (completing approximately 10 kilometres), and at our Reward project (Teena Deposit) in the McArthur district of Australia (completing approximately 9 kilometres), to better define external limits and internal continuity to mineralization.
We have ongoing exploration for, and partnerships in, gold opportunities. Our plan is to explore, find and advance gold resources through targeted exploration in select jurisdictions. Once an opportunity has been recognized, the strategy is to optimize that opportunity or asset through further definition drilling and engineering studies, then capture value through periodic divestitures. Our current exploration efforts and drill testing for gold are primarily focused in Chile, Peru and Turkey.
26
Teck 2018 Managements Discussion and Analysis
Financial Overview
Financial Summary
($ in millions, except per share data) | 2018 | 2017(2) | 2016(2) | |||||||||
Revenues and profit |
||||||||||||
Revenues |
$ | 12,564 | $ | 11,910 | $ | 9,300 | ||||||
Gross profit before depreciation and amortization(1) |
$ | 6,104 | $ | 6,059 | $ | 3,781 | ||||||
Gross profit |
$ | 4,621 | $ | 4,567 | $ | 2,396 | ||||||
EBITDA(1) |
$ | 6,174 | $ | 5,589 | $ | 3,350 | ||||||
Profit attributable to shareholders |
$ | 3,107 | $ | 2,460 | $ | 1,040 | ||||||
Cash flow |
||||||||||||
Cash flow from operations |
$ | 4,438 | $ | 5,049 | $ | 3,056 | ||||||
Property, plant and equipment expenditures |
$ | 1,906 | $ | 1,621 | $ | 1,416 | ||||||
Capitalized production stripping costs |
$ | 707 | $ | 678 | $ | 477 | ||||||
Investment expenditures |
$ | 284 | $ | 309 | $ | 114 | ||||||
Balance sheet |
||||||||||||
Cash balances |
$ | 1,734 | $ | 952 | $ | 1,407 | ||||||
Total assets |
$ | 39,626 | $ | 37,028 | $ | 35,629 | ||||||
Debt, including current portion |
$ | 5,519 | $ | 6,369 | $ | 8,343 | ||||||
Per share amounts |
||||||||||||
Profit attributable to shareholders |
$ | 5.41 | $ | 4.26 | $ | 1.80 | ||||||
Dividends declared |
$ | 0.30 | $ | 0.60 | $ | 0.10 |
Notes: |
(1) | Non-GAAP Financial Measures. See Use of Non-GAAP Financial Measures section for further information and a reconciliation to GAAP measures. |
(2) | Certain 2017 comparative figures have been restated for new IFRS pronouncements. 2016 figures have not been restated. Please refer to Note 32 to our audited annual consolidated financial statements for the year ended December 31, 2018. |
Our revenue and profit depend on the prices for the commodities we produce, sell and use in our production processes. Commodity prices are determined by the supply of and demand for those commodities, which are influenced by global economic conditions. We normally sell the products that we produce at prevailing market prices or, in the case of steelmaking coal, through an index-linked pricing mechanism or on a spot basis. Prices for our products can fluctuate significantly and that volatility can have a material effect on our financial results.
Foreign exchange rate movements can also have a significant effect on our results and cash flows, as a substantial portion of our operating costs are incurred in Canadian and other currencies, and most of our revenue and debt are denominated in U.S. dollars. We determine our financial results in local currency and report those results in Canadian dollars and, accordingly, our reported operating results and cash flows are affected by changes in the Canadian dollar exchange rate relative to the U.S. dollar, as well as the Peruvian sol and Chilean peso.
In 2018, our profit attributable to shareholders was $3.1 billion, or $5.41 per share. This compares with $2.5 billion or $4.26 per share in 2017 and $1.0 billion or $1.80 per share in 2016. The changes are mainly due to the gain on the sale of the Waneta Dam in 2018, varying commodity prices, sales volumes, exchange rate
27
Teck 2018 Managements Discussion and Analysis
movements and the after-tax impairment charges and reversals recorded in the respective periods.
Our profit over the past three years has included items that we segregate for presentation to investors so that the ongoing profit of the company may be more clearly understood. Our adjusted profit, which takes these items into account, was $2.4 billion in 2018, $2.5 billion in 2017 and $1.1 billion in 2016, or $4.13, $4.36 and $1.91 per share, respectively. These items are described below and summarized in the table that follows.
In 2018, we completed the sale of our two-thirds interest in the Waneta Dam to BC Hydro for $1.2 billion cash and recorded a pre-tax gain of $888 million, with no cash taxes payable on the transaction. We also purchased US$1.0 billion principal amount of our near-term debt maturities, reducing the outstanding balance to US$3.8 billion and recorded a $26 million pre-tax charge on the transaction. We also recorded a non-cash pre-tax asset impairment of $41 million, of which $31 million related to capitalized exploration expenditures that are not expected to be recovered, and $10 million related to Quebrada Blanca assets that will not be recovered through use because mining operations ended in the fourth quarter of 2018.
In 2017, due to the improvement in steelmaking coal prices and future operating cost estimates, we recorded a $207 million non-cash pre-tax reversal of an impairment charge that we took against our steelmaking coal operations in 2015. This was partially offset by a non-cash pre-tax asset impairment of $44 million recorded against our Quebrada Blanca assets that will not be recovered through use. We also recorded an $82 million charge related to increased provincial tax rates in B.C., and the reduction in tax rates in the U.S. resulted in a $101 million non-cash credit to our 2017 tax expense. We incurred a $216 million pre-tax loss on the repurchase of certain of our outstanding notes in the first half of the year.
In 2016, we recorded an impairment of our investment in the Fort Hills oil sands project due to increased development costs. We also recorded asset impairments relating to a project at our Trail Operations and our interest in the Wintering Hills Wind Power Facility, which was sold in 2017. These non-cash charges totalled $294 million on a pre-tax basis and $217 million on an after-tax basis.
The following table shows the effect of these items on our profit.
($ in millions, except per share data) | 2018 | 2017(3) | 2016(3) | |||||||||
Profit attributable to shareholders |
$ | 3,107 | $ | 2,460 | $ | 1,040 | ||||||
Add (deduct): |
||||||||||||
Debt purchase loss (gain) |
19 | 159 | (44) | |||||||||
Debt prepayment option loss (gain) |
31 | (38 | ) | (84) | ||||||||
Asset sales |
(809 | ) | (5 | ) | (53) | |||||||
Foreign exchange (gain) loss |
(8 | ) | (4 | ) | (45) | |||||||
Environmental provisions |
13 | 60 | | |||||||||
Asset impairments (reversals) |
30 | (100 | ) | 217 | ||||||||
Other |
(11 | ) | (12 | ) | 72 | |||||||
Adjusted profit(1)(2) |
$ | 2,372 | $ | 2,520 | $ | 1,103 | ||||||
Adjusted basic earnings per share(1)(2) |
$ | 4.13 | $ | 4.36 | $ | 1.91 | ||||||
Adjusted diluted earnings per share(1)(2) |
$ | 4.07 | $ | 4.30 | $ | 1.89 |
Notes: |
(1) | Non-GAAP Financial Measures. See Use of Non-GAAP Financial Measures section for further information. |
(2) | See Use of Non-GAAP Financial Measures section for reconciliation. |
(3) | Certain 2017 comparative figures have been restated for new IFRS pronouncements. The 2016 figures have not been restated. Please refer to Note 32 to our audited annual consolidated financial statements for the year ended December 31, 2018. |
28
Teck 2018 Managements Discussion and Analysis
Cash flow from operations in 2018 was $4.4 billion, compared with $5.0 billion in 2017 and $3.1 billion in 2016. The changes in cash flow from operations are mainly due to varying commodity prices and sales volumes, offset to some extent by changes in foreign exchange rates.
At December 31, 2018, our cash balance was $1.7 billion. Total debt was $5.5 billion and our net debt to net-debt-plus-equity ratio was 14% at December 31, 2018, compared with 21% at December 31, 2017 and 28% at the end of 2016.
Gross Profit
Our gross profit is made up of our revenue less the operating expenses at our producing operations, including depreciation and amortization. Income and expenses from our business activities that do not produce commodities for sale are included in our other operating income and expenses or in our non-operating income and expenses.
Our principal commodities are steelmaking coal, copper, zinc and blended bitumen, which accounted for 50%, 18%, 19% and 3% of revenue, respectively, in 2018. Silver and lead are significant by-products of our zinc operations, each accounting for 3% of our 2018 revenue. We also produce a number of other by-products, including molybdenum, various specialty metals, and chemicals and fertilizers, which in total accounted for 4% of our revenue in 2018.
Our revenue is affected by sales volumes, which are determined by our production levels and by demand for the commodities we produce, commodity prices and currency exchange rates.
Our revenue was a record $12.6 billion in 2018, compared with $11.9 billion in 2017 and $9.3 billion in 2016. The increase in 2018 revenue was mainly due to higher steelmaking coal and copper prices and the addition of revenue from the sale of blended bitumen from our Fort Hills oil sands mine, partially offset by lower sales volumes of refined lead and silver from our Trail Operations. Average prices for steelmaking coal and copper were 7% and 6% higher in 2018 than in 2017. The increase in 2017 from 2016 revenue was mainly due to higher steelmaking coal, copper and zinc prices, partially offset by lower sales volumes of steelmaking coal and a slightly weaker average U.S. dollar exchange rate.
Our cost of sales includes all of the expenses required to produce our products, such as labour, energy, operating supplies, concentrates purchased for our Trail Operations refining and smelting activities, diluent purchased for our Fort Hills oil sands mine to transport our bitumen by pipeline, royalties, and marketing and distribution costs required to sell and transport our products to various delivery points. Our cost of sales also
29
Teck 2018 Managements Discussion and Analysis
includes depreciation and amortization expense. Due to the geographic locations of many of our operations, we are highly dependent on third parties for the provision of rail, port, pipeline and other distribution services. In certain circumstances, we negotiate prices and other terms for the provision of these services where we may not have viable alternatives to using specific providers, or may not have access to regulated rate-setting mechanisms or appropriate remedies for service failures. Contractual disputes, demurrage charges, rail, port and pipeline capacity issues, availability of vessels and railcars, weather problems and other factors can have a material effect on our ability to transport materials from our suppliers and to our customers in accordance with schedules and contractual commitments.
Our costs are dictated mainly by our production volumes, by the costs for labour, operating supplies, concentrate purchases and diluent purchases, and by strip ratios, haul distances, ore grades, distribution costs, commodity prices, foreign exchange rates, costs related to non-routine maintenance projects, and our ability to manage these costs. Production volumes mainly affect our variable operating and our distribution costs. In addition, production affects our sales volumes and, when combined with commodity prices, affects profitability and, ultimately, our royalty expenses.
Our cost of sales was $7.9 billion in 2018, compared with $7.3 billion in 2017 and $6.9 billion in 2016. In our steelmaking coal business, unit cost increases were partly driven by our decision to increase mining activity to capture margin in a favourable steelmaking coal price environment. In addition, increased diesel and operating supplies costs also resulted in increased unit costs. Costs were higher at our Trail Operations due to both maintenance issues and the effect of wildfires in southeast British Columbia, as well as the increase in power costs resulting from the sale of the Waneta Dam to BC Hydro in July 2018. Cost of sales in 2018 also included costs from Fort Hills, which produced its first bitumen in January and achieved commercial production on June 1.
Our 2017 costs were higher than 2016 due to a number of factors, including difficult weather conditions early in the year, higher employee turnover rates and geotechnical issues at our coal operations, all of which affected material movement. Our Highland Valley Copper Operations was mining lower-grade ore as planned, which results in higher unit operating costs. At Red Dog, we had some challenges early in the year that affected production and costs. A metallurgically complex, highly oxidized, higher-grade ore from the Qanaiyaq pit was introduced to the mill early in the year, impacting recoveries. As we gained processing experience with this ore and deepened the pit to access less-weathered ore, recoveries improved and allowed us to increase the amount of Qanaiyaq ore, which resulted in a significant improvement in metal production in the second half of the year.
30
Teck 2018 Managements Discussion and Analysis
Other Expenses
($ in millions) | 2018 | 2017 | 2016 | |||||||||
General and administration |
$ | 142 | $ | 116 | $ | 99 | ||||||
Exploration |
69 | 58 | 51 | |||||||||
Research and development |
35 | 55 | 30 | |||||||||
Asset impairments (impairment reversal) |
41 | (163) | 294 | |||||||||
Other operating expense (income) |
(450) | 230 | 197 | |||||||||
Finance income |
(33) | (17) | (16) | |||||||||
Finance expense |
252 | 229 | 354 | |||||||||
Non-operating expense (income) |
52 | 151 | (239) | |||||||||
Share of losses (income) of associates |
3 | (6) | (2) | |||||||||
$ | 111 | $ | 653 | $ | 768 |
We must continually replace our reserves as they are depleted in order to maintain production levels over the long term. We try to do this through our exploration and development programs and through acquisition of interests in new properties or in companies that own them. Exploration for minerals, steelmaking coal and oil is highly speculative and the projects involve many risks. The vast majority of exploration projects are unsuccessful and there are no assurances that current or future exploration programs will find deposits that are ultimately brought into production.
Our research and development expenditures are primarily focused on advancing our proprietary CESL hydrometallurgical technology, the development of internal and external growth opportunities, and the development and implementation of process and environmental technology improvements at operations, such as the saturated rock fill project.
In 2018, we recorded asset impairments of $41 million, of which $31 million related to capitalized exploration expenditures that are not expected to be recovered, and $10 million related to our Quebrada Blanca assets that will not be recorded through use because mining operations ended in the fourth quarter of 2018 as reserves were depleted.
In 2017, due to the improvement in steelmaking coal prices and future operating cost estimates, we recorded a $207 million reversal of an impairment charge that we took against our steelmaking coal operations in 2015. This was partially offset by an impairment of $44 million recorded on our Quebrada Blanca assets that will not be recovered through use.
During 2016, we recorded an impairment of our investment in the Fort Hills oil sands project as a result of increased development costs. We also recorded asset impairments relating to a project at our Trail Operations and our interest in the Wintering Hills Wind Power Facility. These charges, primarily related to Fort Hills, totalled $294 million on a pre-tax basis and $217 million on an after-tax basis.
The key inputs used in determining the magnitude of asset impairments and reversals are outlined on pages 48 to 51 in this Managements Discussion and Analysis.
31
Teck 2018 Managements Discussion and Analysis
The impairment charges and (reversals) were as follows:
($ in millions) | 2018 | 2017 | 2016 | |||||||||||
Steelmaking coal operations |
$ | | $ | (207) | $ | | ||||||||
Energy Fort Hills |
| | 222 | |||||||||||
Other |
41 | 44 | 72 | |||||||||||
$ | 41 | $ | (163) | $ | 294 |
Other operating income and expenses include items we consider to be related to the operation of our business, such as final pricing adjustments (which are further described in the following paragraph), share-based compensation, gains or losses on commodity derivatives, gains or losses on the sale of operating or exploration assets, and provisions for various costs at our closed properties. Significant items in 2018 included an $888 million gain on the sale of our two-thirds interest in the Waneta Dam to BC Hydro, $117 million of negative pricing adjustments, $31 million for environmental costs, $59 million for share-based compensation and a $106 million charge for take-or-pay contracts. Significant items in 2017 included $190 million of positive pricing adjustments, $186 million for environmental costs, $125 million for share-based compensation, an $81 million charge for take-or-pay contracts and a $28 million break fee related to the sale of the Waneta Dam that was paid to Fortis. Significant items in 2016 included a $171 million expense for share-based compensation, $153 million of positive pricing adjustments, a $48 million charge for take-or-pay contracts and $144 million for environmental costs.
Sales of our products, including by-products, are recognized in revenue at the point in time when the customer obtains control of the product. Control is achieved when a product is delivered to the customer, we have present right to payment for the product, significant risks and rewards of ownership have transferred to the customer according to contract terms, and there is no unfulfilled obligation that could affect the customers acceptance of the product. For sales of steelmaking coal and copper, zinc and lead concentrates, control of the product generally transfers to the customer when an individual shipment parcel is loaded onto a carrier accepted or directly contracted by the customer. For sales of refined metals, chemicals, and fertilizers, control of the product transfers to the customer when the product is loaded onto a carrier specified by the customer. For blended bitumen, control of the product generally transfers to the customer when the product passes the delivery point specified in the sales contract.
The majority of our base metal concentrates and refined metals are sold under pricing arrangements where final prices are determined by quoted market prices in a period subsequent to sale. For these sales, revenue is recognized based on the estimated consideration to be received at the date of sale with reference to relevant commodity market prices. Our refined metals are sold under spot or average pricing contracts. For all steelmaking coal sales under average pricing contracts where pricing is not finalized when revenue is recognized, revenue is recorded based on the estimated consideration to be received at the date of sale with reference to steelmaking coal price assessments. The majority of our blended bitumen is sold under pricing arrangements where final prices are determined based on commodity price indices that are finalized at or near the date of sale. Our revenue for blended bitumen is net of royalty payments to governments.
Adjustments are made to settlement receivables in subsequent periods based on movements in quoted market prices or published price assessments (for steelmaking coal) up to the date of final pricing. These pricing adjustments result in gains in a rising price environment and losses in a declining price environment, and are recorded as other operating income or expense. The extent of the pricing adjustments also takes
32
Teck 2018 Managements Discussion and Analysis
into account the actual price participation terms as provided in certain concentrate sales agreements. It should be noted that these effects arise on the sale of concentrates, as well as on the purchase of concentrates at our Trail Operations.
The following table outlines our outstanding receivable positions, which were provisionally valued at December 31, 2018 and 2017, respectively.
Outstanding at | Outstanding at | |||||||||||||||
December 31, 2018 | December 31, 2017 | |||||||||||||||
(payable pounds in millions) | Pounds | US$/lb. | Pounds | US$/lb. | ||||||||||||
Copper |
93 | $ 2.70 | 138 | $ 3.26 | ||||||||||||
Zinc |
208 | $ 1.12 | 197 | $ 1.50 |
Our finance expense includes the interest expense on our debt, finance lease interest, letters of credit and standby fees, the interest components of our pension obligations, and accretion on our decommissioning and restoration provisions, less any interest that we capitalize against the cost of our development projects. Debt interest expense decreased in 2018, mainly due to the reduction in our outstanding notes. These items were partially offset by additional fees from an increase in our outstanding letters of credit, and the effect of accretion on our decommissioning and restoration provisions. Further detail is provided in Note 10 to our 2018 audited annual consolidated financial statements.
Non-operating income (expense) includes items that arise from financial and other matters and includes such items as foreign exchange gains or losses, debt refinancing costs, gains or losses on the revaluation of debt prepayment options, and gains or losses on the sale of investments. In 2018, other non-operating expenses included $42 million of losses on debt prepayment options, $16 million of foreign exchange gains and a $26 million charge on debt repurchased during the year. In 2017, other non-operating expenses included $51 million of gains on debt prepayment options, $5 million of foreign exchange gains, $9 million of gains on sale of investments and a $216 million charge on debt repurchased during the year. In 2016, other non-operating expenses included $113 million of gains on debt prepayment options, $46 million of foreign exchange gains, $49 million of gains on debt repurchases and $34 million of gains on sale of investments.
Profit (loss) attributable to non-controlling interests relates to the ownership interests that are held by third parties in our Quebrada Blanca, Carmen de Andacollo and Elkview operations, and Compañia Minera Zafranal S.A.C.
Income Taxes
Income and resource taxes in 2018 were $1.4 billion, or 30% of pre-tax profits. This effective tax rate is higher than the Canadian statutory income tax rate of 27% as a result of resource taxes and higher rates in some foreign jurisdictions. The effect of these is partially offset by the gain on the sale of our two-thirds interest in the Waneta Dam, which was taxed at a lower rate. Due to available tax pools, we are currently shielded from cash income taxes, but not resource taxes, in Canada. We remain subject to cash taxes in foreign jurisdictions.
Subsequent to year-end, the Peruvian tax authority, Superintendencia Nacional de Aduanas y de Administración Tributaria (SUNAT), issued an income tax assessment to Antamina (our joint operation in
33
Teck 2018 Managements Discussion and Analysis
which we own a 22.5% share) denying its accelerated depreciation allowance on costs incurred in 2013 related to the expansion of the Antamina mine, as provided under Antaminas tax stability agreement. If the assessment is sustained, our indirect share of the current tax debt that Antamina may have to pay, including interest and penalties, is estimated to be approximately $40 million (US$30 million). However, since these items are mainly a matter of timing rather than the ultimate liability, the resulting charge to our earnings would be approximately $20 million (US$15 million) consisting of interest and penalties. If SUNATs view on the scope of the tax stability agreement were sustained and extended to 2015 (being the last year of tax stability), our indirect share of the tax debt that Antamina may have to pay, including interest and penalties, could reach about $125 million (US$94 million) and the charge to our earnings could reach about $60 million (US$45 million). Based on opinions from Peruvian counsel, we believe that Antaminas original filing positions will ultimately prevail and Antamina will appeal the 2013 income tax assessment in due course. As a result, we have not provided for this matter in our financial statements as at December 31, 2018.
Financial Position and Liquidity
Our financial position and liquidity have improved from our strong position at the beginning of the year. At December 31, 2018, we had $1.7 billion of cash and a US$4.0 billion unused line of credit, providing us with $7.2 billion of liquidity. Based on our current strong financial position, we expect to be able to maintain our operations and fund our development activities as planned.
Our outstanding debt was $5.5 billion at December 31, 2018, compared with $6.4 billion at the end of 2017 and $8.3 billion at the end of 2016. The decrease is due primarily to the US$1.0 billion of notes that we repurchased and retired in the third quarter of 2018. Additionally, in the first quarter of 2018, we repaid US$22 million of notes that matured. In total, since September 2015, our term notes have been reduced by US$3.4 billion, reducing the principal outstanding to US$3.8 billion.
Our debt positions and credit ratios are summarized in the following table:
2018 | 2017(4) | 2016 | ||||||||||
Term notes face value |
$ | 3,809 | $ | 4,831 | $ | 6,141 | ||||||
Unamortized fees and discounts |
(31 | ) | (40 | ) | (50 | ) | ||||||
Other |
268 | 286 | 122 | |||||||||
Debt (US$ in millions) |
$ | 4,046 | $ | 5,077 | $ | 6,213 | ||||||
Debt (CAD$ equivalent)(1) (A) |
$ | 5,519 | $ | 6,369 | $ | 8,343 | ||||||
Less cash balances |
(1,734 | ) | (952 | ) | (1,407 | ) | ||||||
Net debt(2) (B) |
$ | 3,785 | $ | 5,417 | $ | 6,936 | ||||||
Equity (C) |
$ | 23,018 | $ | 19,993 | $ | 18,007 | ||||||
Debt to debt-plus-equity ratio(2) (A/(A+C)) |
19% | 24% | 32% | |||||||||
Net debt to net-debt-plus-equity ratio(2) (B/(B+C)) |
14% | 21% | 28% | |||||||||
Debt to EBITDA ratio(2)(3) |
0.9x | 1.1x | 2.5x | |||||||||
Net debt to EBITDA ratio(2)(3) |
0.6x | 1.0x | 2.1x | |||||||||
Average interest rate |
6.1% | 5.7% | 5.7% |
Notes: |
(1) | Translated at year-end exchange rates. |
(2) | Non-GAAP Financial Measure. See Use of Non-GAAP Financial Measures section for further information. |
(3) | See Use of Non-GAAP Financial Measures section for reconciliation. |
(4) | Certain 2017 comparative figures have been restated for new IFRS pronouncements. 2016 figures have not been restated. Please refer to Note 32 to our audited annual consolidated financial statements for the year ended December 31, 2018. |
34
Teck 2018 Managements Discussion and Analysis
At December 31, 2018, the weighted average maturity of our term notes is approximately 16 years and the weighted average coupon rate is approximately 6.1%.
Our primary sources of liquidity and capital resources are our cash and temporary investments, cash flow provided from operations, and funds available under our committed and uncommitted bank credit facilities, of which approximately US$4.1 billion is currently available. Further information about our liquidity and associated risks is outlined in Notes 28 and 30 to our 2018 audited annual consolidated financial statements.
Cash flow from operations was $4.4 billion in 2018. Our cash position increased from $952 million at the end of 2017 to $1.7 billion at December 31, 2018. Significant outflows included $2.6 billion of capital expenditures, $1.4 billion to purchase and cancel US$1.0 billion of notes, $172 million on returns to shareholders through dividends, $189 million on share buybacks and $407 million primarily consisting of interest on our outstanding debt.
We maintain various committed and uncommitted credit facilities for liquidity and for the issuance of letters of credit. Our US$4.0 billion revolving credit facility matures in November 2023 and has a letter of credit sub-limit of US$1.5 billion. There are currently no drawings on this facility and it remains fully available as at February 12, 2019.
We also have a US$600 million facility that matures in November 2021. As at December 31, 2018, there were US$573 million of letters of credit issued on this facility.
Borrowing under our primary committed credit facilities is subject to our compliance with the covenants in the agreement and our ability to make certain representations and warranties at the time of the borrowing request.
In addition to our two primary revolving committed credit facilities, we maintain uncommitted bilateral credit facilities with various banks and with Export Development Canada for the issuance of letters of credit, stand-alone letters of credit and surety bonds, all primarily to support our future reclamation obligations. At December 31, 2018, we had $1.82 billion of letters of credit issued on the $2.15 billion of bilateral credit facilities that we have. In addition to the letters of credit outstanding under these uncommitted credit facilities, we also had stand-alone letters of credit of $369 million outstanding as at December 31, 2018, which were not issued under a credit facility. We also had surety bonds of $350 million outstanding as at December 31, 2018 to support our current and future reclamation obligations.
The cost of funds under certain of our credit facilities depends on our credit ratings. Teck was upgraded to an investment grade credit rating by Moodys on January 16, 2019, at Baa3 with a stable outlook. Our current credit ratings from S&P and Fitch are BB+ and BB+, respectively, with positive outlooks. As a result of the Moodys upgrade, the drawn cost on our US$4.0 billion revolving credit facility has been reduced by 0.35%. Should another rating agency upgrade our rating by a single notch, letters of credit totalling US$672 million could be released.
Under the terms of the silver streaming agreement relating to Antamina, if there is an event of default under the agreement or Teck insolvency, Teck Base Metals Ltd., our subsidiary that holds our interest in Antamina, is restricted from paying dividends or making other distributions to Teck to the extent that there are unpaid amounts under the agreement.
35
Teck 2018 Managements Discussion and Analysis
Operating Cash Flow
Cash flow from operations was $4.4 billion in 2018, compared with a record $5.0 billion in 2017 and $3.1 billion in 2016. The decrease in 2018 was primarily associated with the changes in non-cash working capital items due to the buildup of inventories with the ramp-up of Fort Hills, along with a reduction of accounts payable early in the year following a significant increase in the fourth quarter of 2017 related to Red Dogs seasonality. The increase in 2017 compared to 2016 was mainly due to the higher average commodity prices.
Investing Activities
Capital expenditures in 2018 were $1.9 billion property, plant and equipment and $707 million for capitalized stripping, as summarized in the table on pages 44 to 45.
The largest components of sustaining capital included $232 million at our steelmaking coal operations, $150 million at Trail Operations, $65 million at Red Dog Operations and $63 million for our share of spending at Antamina.
Major enhancement expenditures included $230 million at our steelmaking coal operations, primarily related to the upgrade at Neptune Terminals, developing the Baldy Ridge pit at Elkview Operations and the Swift pit at Fording River Operations; $100 million for the mill upgrade project at Red Dog Operations; $55 million towards installing an additional ball mill to increase grinding circuit capacity at Highland Valley Copper Operations; and $69 million on tailings and equipment ramp-up spending at Fort Hills.
New mine development included $414 million for the Quebrada Blanca Phase 2 project, $263 million for our share of completing the development of the Fort Hills oil sands project and $56 million on our Project Satellite.
Expenditures on investments in 2018 and 2017 were $284 million and $309 million, respectively. In 2018, we paid US$112.5 million US$52.5 million on closing and US$60 million upon receipt of the regulatory approvals received in August to acquire Inversiones Mineras S.A. to bring our ownership share of Quebrada Blanca to 90%. Other investments include $44 million for the 1.3% increase in Fort Hills, and $48 million on NuevaUnión, which is an equity investment under the IFRS accounting rules. For 2017, investments included $121 million for a 0.89% increase in our share of Fort Hills, $43 million on our NuevaUnión copper project, $63 million to acquire Goldcorps minority 21% interest in the San Nicolás copper project, and $13 million to acquire the remaining 70% of AQM Copper Inc. not already owned, giving us an 80% interest in the Zafranal copper-gold project located in southern Peru.
Cash proceeds from the sale of assets and investments were $1.3 billion in 2018, $126 million in 2017 and $170 million in 2016. The major item in 2018 was the $1.2 billion of proceeds from the sale of our two-thirds interest in the Waneta Dam. Significant items in 2017 were proceeds of $59 million from the sale of our 49% interest in the Wintering Hills Wind Power Facility and $30 million from the sale of marketable securities and various royalty interests.
Financing Activities
In 2018, we purchased US$1.0 billion aggregate principal amount of our outstanding notes pursuant to cash tender offers. The principal amount of notes purchased was US$103 million of 4.50% notes due January 2021, US$471 million of 4.75% notes due 2022 and US$426 million of 3.75% notes due 2023. The total cost
36
Teck 2018 Managements Discussion and Analysis
of the purchases, which was funded from cash on hand, including the premiums, was US$1.01 billion. We recorded a pre-tax accounting charge of $26 million ($19 million after tax) in non-operating income (expense) in connection with these purchases.
In November 2018, we changed the amounts and maturity dates, and made certain other amendments to our two committed revolving credit facilities. We increased our US$3.0 billion facility to US$4.0 billion (undrawn at December 31, 2018) and extended the maturity date from October 2022 to November 2023. We decreased the US$1.2 billion facility to US$600 million (US$573 million drawn for letters of credit at December 31, 2018) and extended the maturity date from October 2020 to November 2021. In addition, our obligations under these agreements and our outstanding 8.5% term notes due 2024 are no longer guaranteed on a senior unsecured basis by certain Teck subsidiaries.
In April 2017, our Board announced a dividend policy reflecting our commitment to return cash to shareholders in balance with the needs and opportunities to invest in, and the inherent cyclicality of, our underlying businesses. The policy is anchored by an annual base dividend of $0.20 per share, to be paid $0.05 on the last business day of each quarter. Each year the Board will review the free cash flow generated by the business, the outlook for business conditions and priorities regarding capital allocation, and determine whether a supplemental dividend should be paid. Any supplemental dividends declared are expected to be paid on the last business day of the calendar year. If declared, supplemental dividends may be highly variable from year to year, given the volatility of commodity prices and the potential need to conserve cash for certain project capital expenditures or other corporate priorities. As always, the payment of dividends is at the discretion of the Board, who will review the dividend policy regularly. During 2018, we paid $172 million of eligible dividends, of which approximately $57 million, or $0.10 per share, was for the supplemental dividend.
In 2018, we purchased and cancelled approximately 6.3 million Class B shares at a cost of $189 million under our normal course issuer bids. Our current normal course issuer bid allows us to purchase up to 40 million Class B shares during the period starting October 10, 2018 and ending October 9, 2019. As of February 12, 2019, we have purchased approximately 8.5 million shares under this bid for $247 million, of which 4.7 million shares were purchased and cancelled in 2018.
Teck is making the normal course issuer bid because it believes that the market price of its Class B Shares may, from time to time, not reflect their underlying value and that the share buyback program may provide value by reducing the number of shares outstanding at attractive prices. All repurchased shares will be cancelled. During Tecks prior normal course issuer bid, which commenced on October 10, 2017 and ended October 9, 2018, Teck purchased 7,483,388 Class B Shares on the open market at a volume-weighted average price of $31.05 per Class B Share. Shareholders may obtain a copy of Tecks normal course issuer bid notice by contacting our Corporate Secretary.
37
Teck 2018 Managements Discussion and Analysis
Quarterly Profit and Cash Flow
($ in millions except per share data) | 2018 | 2017 (restated) | ||||||||||||||||||||||||||||||
Q4 | Q3 | Q2 | Q1 | Q4 | Q3 | Q2 | Q1 | |||||||||||||||||||||||||
Revenue |
$ | 3,247 | $ | 3,209 | $ | 3,016 | $ | 3,092 | $ | 3,156 | $ | 3,075 | $ | 2,832 | $ | 2,847 | ||||||||||||||||
Gross profit |
1,011 | 1,009 | 1,241 | 1,360 | 1,263 | 1,068 | 1,073 | 1,163 | ||||||||||||||||||||||||
EBITDA(1) |
1,152 | 2,064 | 1,403 | 1,555 | 1,563 | 1,370 | 1,341 | 1,315 | ||||||||||||||||||||||||
Profit attributable to shareholders |
433 | 1,281 | 634 | 759 | 740 | 584 | 580 | 556 | ||||||||||||||||||||||||
Basic earnings per share |
$ | 0.75 | $ | 2.23 | $ | 1.10 | $ | 1.32 | $ | 1.28 | $ | 1.01 | $ | 1.00 | $ | 0.96 | ||||||||||||||||
Diluted earnings per share |
$ | 0.75 | $ | 2.20 | $ | 1.09 | $ | 1.30 | $ | 1.26 | $ | 0.99 | $ | 0.99 | $ | 0.95 | ||||||||||||||||
Cash flow from operations |
$ | 1,352 | $ | 872 | $ | 1,100 | $ | 1,114 | $ | 1,458 | $ | 894 | $ | 1,407 | $ | 1,290 |
Notes: |
(1) | Non-GAAP Financial Measure. See Use of Non-GAAP Financial Measures section for further information. |
Gross profit in the fourth quarter from our steelmaking coal business unit was $819 million, compared with $625 million a year ago. Strong fourth quarter sales and significantly higher realized steelmaking coal prices increased gross profit before depreciation and amortization by $196 million from a year ago, despite higher operating and transportation unit costs.
Sales volumes of 6.6 million tonnes in the fourth quarter were 5% higher than the same period a year ago, including record high monthly sales in November. This strong performance resulted from a combination of robust demand in all market areas led by continued steel production capacity growth in India and Southeast Asia and steelmaking coal supply concerns, mainly in Australia.
Gross profit from our copper business unit was $138 million in the fourth quarter, compared with $288 million a year ago. Gross profit before depreciation and amortization decreased by $166 million, compared with a year ago due mainly to lower copper sales and lower prices for copper and zinc. A sharp decline in copper prices, especially in December, also resulted in inventory write-down charges at Quebrada Blanca ($27 million) and Highland Valley Copper ($14 million). In the same period last year, we reversed prior inventory write-downs at our Quebrada Blanca mine of $25 million as a result of higher copper prices.
Copper production in the fourth quarter decreased by 7% from a year ago primarily due to lower ore grades and mill throughput at Highland Valley Copper, as expected in the mine plan. Our total cash unit costs3 before by-product credits in the fourth quarter were US$1.76 per pound, similar to the same period a year ago. Higher zinc and molybdenum sales volumes in 2018 were offset by lower zinc prices. As a result, cash unit costs after by-product credits of US$1.28 per pound in the fourth quarter were also similar to US$1.27 per pound in the fourth quarter last year.
Gross profit from our zinc business unit was $206 million in the fourth quarter, compared with $350 million a year ago. Gross profit before depreciation and amortization decreased by $133 million due primarily to lower zinc prices and a decrease in by-product revenues from lead and silver, partially offset by lower royalties.
3 Non-GAAP Financial Measure. See Use of Non-GAAP Financial Measures section for further information.
38
Teck 2018 Managements Discussion and Analysis
Fourth quarter production was lower at our Trail Operations due to planned major maintenance in the lead circuit and the treatment of lead concentrates with lower silver content in the period, resulting in refined lead and silver production declining substantially by 45% and 77%, respectively, compared with a year ago. Refined zinc production was 7% lower due to temporary maintenance issues in the zinc roasters. Profit at Trail Operations was also negatively affected by historically low treatment and refining charges and increased electricity costs. At Red Dog, zinc and lead production increased by 13% and 6%, respectively, compared to a year ago as a result of strong operational performance with higher than planned throughput.
In our energy business unit, both production volumes and product quality on start-up at the Fort Hills mine have exceeded our expectations. Bitumen production from the first two secondary extraction trains at Fort Hills commenced in the first quarter of 2018, followed by the third and final train in May. All commissioning and construction activities are now complete. In the second quarter, we concluded that Fort Hills was operational and results from Fort Hills are included in our consolidated results from June 1, 2018.
Realized prices and operating results in the fourth quarter were significantly affected by a material decline in global benchmark crude oil prices and the widening of Canadian heavy blend differentials, for WCS. In addition, costs associated with diluent increased significantly during the fourth quarter of 2018 due to a seasonal increase in diluent consumption and unusual widening in the spread between diluent and WCS. As a result of the decline in prices, we recorded inventory write-downs during the fourth quarter of approximately $34 million.
Our profit attributable to shareholders was $433 million, or $0.75 per share, in the fourth quarter compared with $740 million, or $1.28 per share, a year ago.
Cash flow from operations was $1.4 billion in the fourth quarter, similar to $1.5 billion a year ago.
Outlook
The sales of our products are denominated in U.S. dollars while a significant portion of our expenses are incurred in local currencies, particularly the Canadian dollar and the Chilean peso. Foreign exchange fluctuations can have a significant effect on our operating margins, unless such fluctuations are offset by related changes to commodity prices.
Our U.S. dollar denominated debt is subject to revaluation based on changes in the Canadian/U.S. dollar exchange rate. As at December 31, 2018, $2.6 billion of our U.S. dollar denominated debt is designated as a hedge against our foreign operations that have a U.S. dollar functional currency. As a result, any foreign exchange gains or losses arising on that amount of our U.S. dollar debt are recorded in other comprehensive income, with the remainder being charged to profit.
Commodity markets are volatile. Prices can change rapidly and customers can alter shipment plans. This can have a substantial effect on our business and financial results. Demand fundamentals, especially for steelmaking coal, refined zinc and refined copper, remain strong and prices for steelmaking coal rose substantially in the past year, contributing additional revenues and cash flows. Production and logistics disruptions in a number of the coal producing regions continued to have an effect on available supplies and market prices. Recent uncertainty in global markets arising from government policy changes, including tariffs and the potential for trade disputes, may have a significant positive or negative effect on the various products we produce. Price volatility will continue, but over the long term, the industrialization of emerging economies,
39
Teck 2018 Managements Discussion and Analysis
as well as infrastructure replacement in developed economies, will continue to be a major factor in the demand for the commodities we produce.
While price volatility remains a significant factor in our industry, we have taken significant steps to insulate our company from its effects. We have improved operations and made selective short-term decisions to maximize production more specifically in our steelmaking coal operations to capture significant gross profit cash margins. We have strengthened our balance sheet and credit ratings by reducing debt. Further, the supply and demand balance for our products is favourable. Combined, these factors are significant positives for the outlook for our company.
Commodity Prices and Sensitivities
Commodity prices are a key driver of our profit and cash flows. On the supply side, the depleting nature of ore reserves, difficulties in finding new ore-bodies, the permitting processes and the availability of skilled resources to develop projects, as well as infrastructure constraints, political risk and significant cost inflation, may continue to have a moderating effect on the growth in future production for the industry as a whole.
The sensitivity of our annual profit attributable to shareholders and EBITDA to changes in the Canadian/U.S. dollar exchange rate and commodity prices, before pricing adjustments, based on our current balance sheet, our expected 2019 mid-range production estimates, current commodity prices and a Canadian/U.S. dollar exchange rate of $1.32, is as follows:
2019 Mid-Range Production Estimates(1) |
Change | Estimated Effect of Change On Profit(2) |
Estimated Effect on EBITDA(2) |
|||||||||||||
US$ exchange |
CAD$0.01 | $ 48 million | $ 76 million | |||||||||||||
Steelmaking coal (million tonnes) |
26.25 | US$1/tonne | $ 20 million | $ 31 million | ||||||||||||
Copper (thousand tonnes) |
300.0 | US$0.01/lb. | $ 5 million | $ 8 million | ||||||||||||
Zinc (thousand tonnes)(3) |
942.5 | US$0.01/lb. | $ 10 million | $ 13 million | ||||||||||||
WCS (million bbl)(4) |
13.0 | US$1/bbl | $ 12 million | $ 17 million | ||||||||||||
WTI(5) |
US$1/bbl | $ 9 million | $ 12 million |
Notes: |
(1) | All production estimates are subject to change based on market and operating conditions. |
(2) | The effect on our profit attributable to shareholders and on EBITDA of commodity price and exchange rate movements will vary from quarter to quarter depending on sales volumes. Our estimate of the sensitivity of profit and EBITDA to changes in the U.S. dollar exchange rate is sensitive to commodity price assumptions. |
(3) | Zinc includes 307,500 tonnes of refined zinc and 635,000 tonnes of zinc contained in concentrate. |
(4) | Bitumen volumes from our energy business unit. |
(5) | Our WTI oil price sensitivity takes into account our interest in Fort Hills for respective change in revenue, partially offset by the effect of the change in diluent purchase costs as well as the effect on the change in operating costs across our business units, as our operations use a significant amount of diesel fuel. |
2019 Production and Other Guidance
Our steelmaking coal production in 2019 is expected to be in the range of 26.0 to 26.5 million tonnes, compared with 26.2 million tonnes produced in 2018. Our actual production will depend primarily on customer demand for deliveries of steelmaking coal. Depending on market conditions and the sales outlook, we may adjust our production plans.
Our copper production for 2019 is expected to be in the range of 290,000 to 310,000 tonnes, compared with 293,900 tonnes produced in 2018. Copper production at Highland Valley Copper is expected to increase approximately 17,000 tonnes as a result of higher ore grades. Our share of production from Antamina and Carmen de Andacollo is expected to remain similar to 2018 levels.
40
Teck 2018 Managements Discussion and Analysis
Our zinc in concentrate production in 2019 is expected to be in the range of 620,000 to 650,000 tonnes, compared with 705,000 tonnes produced in 2018. Red Dogs production is expected to be between 535,000 to 555,000 tonnes, approximately 7% lower than 2018 production levels. Our share of Antaminas zinc production in 2019 is expected to decrease by approximately 25,000 tonnes. Refined zinc production in 2019 from our Trail Operations is expected to be in the range of 305,000 to 310,000 tonnes, compared with 302,900 tonnes produced in 2018.
Our share of bitumen production in 2019 is expected to be in the range of 12 to 14 million barrels (33,000 to 38,000 barrels per day), including estimated production curtailments. The high end of our guidance reflects the Government of Albertas production curtailments being lifted in the second quarter of 2019.
In 2019, we expect to spend approximately $140 million on research and development initiatives including our Ideas at Work technology and innovation fund, projects that could reduce our energy consumption and greenhouse gas emissions and the continued advancement of research and development of alternative water treatment strategies, including with respect to SRF technology.
We will apply IFRS 16, Leases (IFRS 16) from January 1, 2019 and expect to record additional leases on our consolidated balance sheet, which will increase our debt and property, plant and equipment balances. As a result of recognizing additional lease liabilities and right of use assets, we expect a reduction in our cost of sales, as operating lease expense will be replaced by depreciation expense and finance expense.
41
Teck 2018 Managements Discussion and Analysis
Guidance
Production Guidance
The table below shows our share of production of our principal products for 2018, our guidance for production in 2019 and our guidance for production for the following three years.
Units in thousand tonnes (excluding steelmaking coal, molybdenum and bitumen) |
2018 | 2019 Guidance |
Three-Year Guidance 20202022 |
|||||||||
Principal Products |
||||||||||||
Steelmaking coal (million tonnes) |
26.2 | 26.026.5 | 26.527.5 | |||||||||
Copper(1)(2)(3) |
||||||||||||
Highland Valley Copper |
100.8 | 115120 | 135155 | |||||||||
Antamina |
100.4 | 95100 | 9095 | |||||||||
Carmen de Andacollo |
67.2 | 6267 | 60 | |||||||||
Quebrada Blanca(5) |
25.5 | 2023 | | |||||||||
|
||||||||||||
293.9 | 290310 | 285305 | ||||||||||
|
||||||||||||
Zinc(1)(2)(4) |
||||||||||||
Red Dog |
583.2 | 535555 | 500520 | |||||||||
Antamina |
92.1 | 6570 | 95110 | |||||||||
Pend Oreille |
29.7 | 2030 | | |||||||||
|
||||||||||||
705.0 | 620650 | 600630 | ||||||||||
|
||||||||||||
Refined zinc |
||||||||||||
Trail Operations |
302.9 | 305310 | 310315 | |||||||||
Bitumen (million barrels)(2)(6)(7) |
||||||||||||
Fort Hills |
6.8 | 1214 | 14 | |||||||||
Other Products |
||||||||||||
Lead(1) |
||||||||||||
Red Dog |
98.4 | 8590 | 85100 | |||||||||
Refined lead |
||||||||||||
Trail Operations |
61.0 | 7075 | 8595 | |||||||||
Molybdenum (million pounds)(1)(2) |
||||||||||||
Highland Valley Copper |
8.7 | 6.0 | 4.05.0 | |||||||||
Antamina |
2.3 | 2.0 | 2.03.0 | |||||||||
|
||||||||||||
11.0 | 8.0 | 6.08.0 | ||||||||||
|
||||||||||||
Refined silver (million ounces) |
||||||||||||
Trail Operations |
11.6 | 1314 | N/A | |||||||||
|
Notes:
(1) | Metal contained in concentrate. |
(2) | We include 100% of production and sales from our Quebrada Blanca and Carmen de Andacollo mines in our production and sales volumes, even though we own 90% of these operations, because we fully consolidate their results in our financial statements. We include 22.5% and 21.3% of production and sales from Antamina and Fort Hills, respectively, representing our proportionate ownership interest in these operations. |
(3) | Copper production includes cathode production at Quebrada Blanca and Carmen de Andacollo. |
(4) | Total zinc includes co-product zinc production from our copper business unit. |
(5) | Excludes production from QB2 for three-year guidance 20202022. |
(6) | Results for 2018 are effective from June 1, 2018. |
(7) | The 20202022 bitumen production guidance does not include potential near-term debottlenecking opportunities. See energy business unit for more information. |
42
Teck 2018 Managements Discussion and Analysis
Sales Guidance
The table below shows our sales for the last quarter and our sales guidance for the next quarter for selected primary products.
Q4 2018 | Q1 2019 Guidance | |||||||||||||||
Steelmaking coal (million tonnes) |
6.6 | 6.16.3 | ||||||||||||||
Zinc (thousand tonnes)(1) |
||||||||||||||||
Red Dog |
175.7 | 125130 |
Note:
(1) | Metal contained in concentrate. |
Unit Cost Guidance
The table below reports our unit costs for selected principal products for 2018 and our guidance for unit costs for selected principal products in 2019.
|
||||||||||||||||||||
(Per unit costs CAD$/tonne) |
2018 | 2019 Guidance | ||||||||||||||||||
|
||||||||||||||||||||
Steelmaking coal(1) |
||||||||||||||||||||
Adjusted site cost of sales(5) |
$ 62 | $ 6265 | ||||||||||||||||||
Transportation costs |
37 | 3739 | ||||||||||||||||||
|
||||||||||||||||||||
Unit costs(5) |
$ 99 | $ 99-104 | ||||||||||||||||||
|
||||||||||||||||||||
Copper(2) |
||||||||||||||||||||
Total cash unit costs(5) (US$/lb.) |
$ 1.74 | $ 1.701.80 | ||||||||||||||||||
Net cash unit costs(3)(5) (US$/lb.) |
$ 1.23 | $ 1.451.55 | ||||||||||||||||||
Zinc(4) |
||||||||||||||||||||
Total cash unit costs(5) (US$/lb.) |
$ 0.49 | $ 0.500.55 | ||||||||||||||||||
Net cash unit costs(3)(5) (US$/lb.) |
$ 0.31 | $ 0.350.40 | ||||||||||||||||||
|
||||||||||||||||||||
Energy (bitumen) |
||||||||||||||||||||
Adjusted operating costs(5) (CAD$/barrel) |
$ 32.89 | $ 2629 | ||||||||||||||||||
|
Notes:
(1) | Steelmaking coal unit costs are reported in Canadian dollars per tonne. Steelmaking coal unit cost of sales include site costs, transport costs, and other and does not include capitalized stripping or capital expenditures. See Use of Non-GAAP Financial Measures section for further information. |
(2) | Copper unit costs are reported in U.S. dollars per payable pound of metal contained in concentrate. Copper total cash costs after by-product margins include adjusted cash cost of sales, smelter processing charges and cash margin for by-products including co-products. Assumes a zinc price of US$1.30 per pound, a molybdenum price of US$12 per pound, a silver price of US$16.00 per ounce, a gold price of US$1,250 per ounce and a Canadian/U.S. dollar exchange rate of $1.30. See Use of Non-GAAP Financial Measures section for further information. |
(3) | After co-product and by-product margins. |
(4) | Zinc unit costs are reported in U.S. dollars per payable pound of metal contained in concentrate. Zinc total cash costs after by-product margins are mine costs including adjusted cash cost of sales, smelter processing charges and cash margin for by-products. Assumes a lead price of US$1.00 per pound, a silver price of US$16.00 per ounce and a Canadian/U.S. dollar exchange rate of $1.30. By-products include both by-products and co-products. |
(5) | Non-GAAP Financial Measure. See Use of Non-GAAP Financial Measures section for further information and reconciliation. |
43
Teck 2018 Managements Discussion and Analysis
Capital Expenditure Guidance
The table below reports our capital expenditures for 2018 and our guidance for capital expenditures in 2019.
(Tecks share in $ millions) | 2018 | 2019 Guidance | ||||||
Sustaining |
||||||||
Steelmaking coal(1) |
$ | 232 | $ | 540 | ||||
Copper |
157 | 240 | ||||||
Zinc |
225 | 170 | ||||||
Energy |
21 | 60 | ||||||
Corporate |
10 | 5 | ||||||
$ | 645 | $ | 1,015 | |||||
Major Enhancement |
||||||||
Steelmaking coal(2) |
$ | 230 | $ | 410 | ||||
Copper |
62 | 70 | ||||||
Zinc |
107 | 60 | ||||||
Energy |
69 | 100 | ||||||
$ | 468 | $ | 640 | |||||
New Mine Development |
||||||||
Copper(3) |
$ | 56 | $ | 130 | ||||
Zinc |
38 | 30 | ||||||
Energy |
285 | 30 | ||||||
$ | 379 | $ | 190 | |||||
Total |
||||||||
Steelmaking coal |
$ | 462 | $ | 950 | ||||
Copper |
275 | 440 | ||||||
Zinc |
370 | 260 | ||||||
Energy |
375 | 190 | ||||||
Corporate |
10 | 5 | ||||||
$ | 1,492 | $ | 1,845 | |||||
QB2 capital expenditures |
$ | 414 | $ | 1,930 | ||||
Total before SMM and SC contributions |
$ | 1,906 | $ | 3,775 | ||||
Estimated SMM and SC contributions to capital expenditures(4) |
| (1,585 | ) | |||||
Total Teck spend |
$ | 1,906 | $ | 2,190 |
Notes:
(1) | For steelmaking coal, sustaining capital includes Tecks share of water treatment charges of $57 million in 2018. Sustaining capital guidance includes Tecks share of water treatment charges related to the Elk Valley Water Quality Plan, which are approximately $235 million in 2019. |
(2) | For steelmaking coal major enhancement capital guidance includes $210 million relating to the facility upgrade at Neptune Bulk Terminals that will be funded by Teck. |
(3) | For copper, new mine development guidance for 2019 includes early scoping studies for QB3, Zafranal, San Nicolás and Galore Creek. |
(4) | Total estimated SMM and SC contributions are $1.77 billion. The difference will be in cash at December 31, 2019. Total estimated contributions are US$1.2 billion as disclosed and US$142 million for their share of expenditures from January 1, 2019 to March 31, 2019. |
Consistent with our direct funding of the capital expenditures, we have included our investments in both sustaining and major expansion at Neptune Bulk Terminals in our capital expenditures and guidance going forward. This is consistent with our presentation of these items in previous years when we funded significant capital projects, most recently in 2013.
44
Teck 2018 Managements Discussion and Analysis
Capital Expenditure Guidance Capitalized Stripping
(Tecks share in CAD$ millions) | 2018 | 2019 Guidance | ||||||
Capitalized Stripping |
||||||||
Steelmaking coal |
$ | 507 | $ 410 | |||||
Copper |
161 | 175 | ||||||
Zinc |
39 | 45 | ||||||
$ | 707 | $ 630 |
Other Information
Carbon Pricing Policies and Associated Costs
Across our operations, the most significant carbon pricing action has taken place in Canada. In 2018, our most material carbon pricing policy impacts were related to B.C.s carbon tax. In 2018, the Province of B.C. increased the carbon tax by $5 per tonne of CO2-equivalent (CO2e) from $30 to $35. This price is expected to increase by $5 per tonne of CO2e per year until reaching $50 per tonne of CO2e. The B.C. Government also made a commitment to address impacts on emissions-intensive, trade-exposed industries to ensure that B.C. operations maintain their competitiveness and to minimize carbon leakage.
On January 1, 2018, Alberta introduced the Carbon Competitiveness Incentive Regulation, an industry-specific carbon pricing policy requiring large emitters, and other facilities that have opted in, to reduce their emissions intensity below a prescribed level, or to purchase emissions credits in concert with or as an alternative to physical abatement, with significant penalties for failure to achieve compliance. In June 2018, the Government of Canada introduced the Greenhouse Gas Pollution Pricing Act that establishes a federal carbon levy for any province or territory that has not implemented a compliant carbon-pricing regime. Federal carbon levy rates will start with a minimum price of $10 per tonne in 2018, increasing $10 per year to $50 per tonne by 2022. The Greenhouse Gas Pollution Pricing Act comes into effect in April 2019 and will only apply in provinces or territories whose policies are not deemed sufficiently similar. Both B.C.s and Albertas policies meet these requirements at this time, and as a result, the national carbon pricing regulations will not apply to our operations.
The cost of compliance with various climate change regulations will ultimately be determined by the regulations themselves and by the markets that evolve for carbon credits and offsets. Tecks greenhouse gas emissions attributable to our operations for 2018 are estimated to be approximately 2.9 million tonnes (CO2e). The most material indirect emissions associated with our activities are those from the use of our steelmaking coal by our customers. Based on our 2018 sales volumes, emissions from the use of our steelmaking coal would have been approximately 76 million tonnes of CO2.
For 2018, our seven B.C.-based operations incurred $58.8 million in British Columbia provincial carbon tax and our Cardinal River Operations in Alberta paid $1.2 million in carbon costs, primarily from our use of coal, diesel fuel and natural gas.
We will continue to assess the potential implications of the updated policies on our operations and projects.
Financial Instruments and Derivatives
We hold a number of financial instruments, derivatives and contracts containing embedded derivatives,
45
Teck 2018 Managements Discussion and Analysis
which are recorded on our consolidated balance sheet at fair value with gains and losses in each period included in other comprehensive income (loss) in the year and profit for the period on our consolidated statements of income and consolidated statements of other comprehensive income, as appropriate. The most significant of these instruments are investments in marketable equity and debt securities, commodity swap contracts, metal-related forward contracts, settlement receivables and payables, embedded debt prepayment options, and gold stream and silver stream embedded derivatives. Some of our gains and losses on metal-related financial instruments are affected by smelter price participation and are taken into account in determining royalties and other expenses. All are subject to varying rates of taxation, depending on their nature and jurisdiction. Further information about our financial instruments, derivatives and contracts containing embedded derivatives and associated risks is outlined in Note 28 to our 2018 audited annual consolidated financial statements.
Areas of Judgment and Critical Accounting Estimates
In preparing our consolidated financial statements, we make judgments in applying our accounting policies. The judgments that have the most significant effect on the amounts recognized in our financial statements are outlined below. In addition, we make assumptions about the future in deriving estimates used in preparing our consolidated financial statements. We have outlined below information about assumptions and other sources of estimation uncertainty as at December 31, 2018 that have a risk of resulting in a material adjustment to the carrying amounts of assets and liabilities within the next year.
a) | Areas of Judgment |
Assessment of Impairment Indicators
Judgment is required in assessing whether certain factors would be considered an indicator of impairment or impairment reversal. We consider both internal and external information to determine whether there is an indicator of impairment or impairment reversal present and, accordingly, whether impairment testing is required. The information we consider in assessing whether there is an indicator of impairment or impairment reversal includes, but is not limited to, market transactions for similar assets, commodity prices, interest rates, inflation rates, our market capitalization, reserves and resources, mine plans and operating results. Refer to the impairment testing section below for further detail on our assessment of impairment indicators in 2018 and 2017.
Property, Plant and Equipment Determination of Available for Use Date
Judgment is required in determining the date that property, plant and equipment is available for use. An asset is available for use when it is in the location and condition necessary to operate in the manner intended by management. At that time, we commence depreciation of the asset and cease capitalization of borrowing costs. We consider a number of factors in making the determination of when an asset is available for use including, but not limited to, design capacity of the asset, production levels achieved, capital spending remaining and commissioning status. Fort Hills produced first oil in January 2018 and was considered available for use as at June 1, 2018. When concluding that these assets were available for use at June 1, 2018, we considered whether all three secondary extraction trains were running as expected, whether the production and product quality were consistent with expectations, and the status of asset commissioning. We have included the operating results for Fort Hills in our consolidated statements of income from that date forward.
46
Teck 2018 Managements Discussion and Analysis
Joint Arrangements
We are a party to a number of arrangements over which we do not have control. Judgment is required in determining whether joint control over these arrangements exists and, if so, which parties have joint control and whether each arrangement is a joint venture or joint operation. In assessing whether we have joint control, we analyze the activities of each arrangement and determine which activities most significantly affect the returns of the arrangement over its life. These activities are determined to be the relevant activities of the arrangement. If unanimous consent is required over the decisions about the relevant activities, the parties whose consent is required would have joint control over the arrangement. The judgments around which activities are considered the relevant activities of the arrangement are subject to analysis by each of the parties to the arrangement and may be interpreted differently. When performing this assessment, we generally consider decisions about activities such as managing the asset while it is being designed, developed and constructed, during its operating life and during the closure period. We may also consider other activities including the approval of budgets, expansion and disposition of assets, financing, significant operating and capital expenditures, appointment of key management personnel, representation on the Board of Directors and other items. When circumstances or contractual terms change, we reassess the control group and the relevant activities of the arrangement.
If we have joint control over the arrangement, an assessment of whether the arrangement is a joint venture or joint operation is required. This assessment is based on whether we have rights to the assets, and obligations for the liabilities, relating to the arrangement or whether we have rights to the net assets of the arrangement. In making this determination, we review the legal form of the arrangement, the terms of the contractual arrangement and other facts and circumstances. In a situation where the legal form and the terms of the contractual arrangement do not give us rights to the assets and obligations for the liabilities, an assessment of other facts and circumstances is required, including whether the activities of the arrangement are primarily designed for the provision of output to the parties and whether the parties are substantially the only source of cash flows contributing to the arrangement. The consideration of other facts and circumstances may result in the conclusion that a joint arrangement is a joint operation. This conclusion requires judgment and is specific to each arrangement. Other facts and circumstances have led us to conclude that Antamina and Fort Hills are joint operations for the purposes of our 2018 audited annual consolidated financial statements. The other facts and circumstances considered for both of these arrangements include the provisions of output to the parties of the joint arrangements and the funding obligations. For both Antamina and Fort Hills, we will take our share of the output from the assets directly over the life of the arrangement. We have concluded that this gives us direct rights to the assets and obligations for the liabilities of these arrangements proportionate to our ownership interests.
Streaming Transactions
When we enter into a long-term streaming arrangement linked to production at specific operations, judgment is required in assessing the appropriate accounting treatment for the transaction on the closing date and in future periods. We consider the specific terms of each arrangement to determine whether we have disposed of an interest in the reserves and resources of the respective operation or executed some other form of arrangement. This assessment considers what the counterparty is entitled to and the associated risks and rewards attributable to them over the life of the operation. These include the contractual terms related to the total production over the life of the arrangement as compared to the expected production over the life of the mine, the percentage being sold, the percentage of payable metals produced, the commodity price referred to in the ongoing payment and any guarantee relating to the upfront payment if production ceases.
47
Teck 2018 Managements Discussion and Analysis
For our silver and gold streaming arrangements entered into in 2015, there is no guarantee associated with the upfront payment. We have concluded that control of the rights to the silver and gold mineral interests were transferred to the buyer when the contracts came into effect at Antamina and Carmen de Andacollo, respectively. Therefore, we consider these arrangements a disposition of a mineral interest.
Any gains from the sale of mineral properties are recognized in accordance with IFRS 15, Revenue from Contracts with Customers (IFRS 15). For both streaming transactions, the total transaction price less costs was allocated to the identified performance obligations based on their estimated stand-alone selling prices. The performance obligations include the interest in the reserves and resources of the operation, mining, refining and delivery services. The allocation involved the use of a variety of estimates in a discounted cash flow model to estimate the stand-alone selling price of the mineral interest. The significant estimates included expected commodity prices, production costs, discount rates and mine plans. A residual value approach was used to estimate the selling prices of mining services.
Based on our judgment, control of the interest in the reserves and resources transferred to the buyer when the contract was executed. At that time, we had the right to payment, the customer was entitled to the commodities, the buyer had no recourse in requiring Teck to mine the product, and the buyer had significant risks and rewards of ownership of the reserves and resources. The allocation of proceeds under IFRS 15 resulted in a net gain allocated to the reserves and resources for the Antamina silver stream transaction. This resulted in an IFRS 15 transition pre-tax adjustment of $755 million to retained earnings, as the amount was previously recorded as deferred consideration. There was no net gain or loss adjustment on application of IFRS 15 to the Carmen de Andacollo gold stream.
We recognize the amount of consideration related to refining, mining and delivery services as the work is performed.
Deferred Tax Assets and Liabilities
Judgment is required in assessing whether deferred tax assets and certain deferred tax liabilities are recognized on the balance sheet and what tax rate is expected to be applied in the year when the related temporary differences reverse, particularly in regard to the utilization of tax loss carryforwards. We also evaluate the recoverability of deferred tax assets based on an assessment of our ability to use the underlying future tax deductions before they expire against future taxable income. Deferred tax liabilities arising from temporary differences on investments in subsidiaries, joint ventures and associates are recognized unless the reversal of the temporary differences is not expected to occur in the foreseeable future and can be controlled. Judgment is also required on the application of income tax legislation. These judgments are subject to risk and uncertainty and could result in an adjustment to the deferred tax provision and a corresponding credit or charge to profit.
b) | Sources of Estimation Uncertainty |
Impairment Testing
When impairment testing is required, discounted cash flow models are used to determine the recoverable amount of respective assets. These models are prepared internally with assistance from third-party advisors when required. When market transactions for comparable assets are available, these are considered in determining the recoverable amount of assets. Significant assumptions used in preparing discounted cash flow models include commodity prices, reserves and resources, mine plans, operating costs, capital expenditures, discount rates, foreign exchange rates and inflation rates. These inputs are based on
48
Teck 2018 Managements Discussion and Analysis
managements best estimates of what an independent market participant would consider appropriate. Changes in these inputs may alter the results of impairment testing, the amount of the impairment charges or reversals recorded in the statement of income and the resulting carrying values of assets.
We allocate goodwill arising from business combinations to the cash-generating unit (CGU) or group of CGUs acquired that is expected to receive the benefits from the business combination. When performing annual goodwill impairment tests, we are required to determine the recoverable amount of each CGU or group of CGUs to which goodwill has been allocated. Our Quebrada Blanca CGU and steelmaking coal CGU have goodwill allocated to them. The recoverable amount of each CGU or group of CGUs is determined as the higher of its fair value less costs of disposal and its value in use.
Asset Impairments and Impairment Reversals
($ in millions) | 2018 | 2017 | ||||||||||||||
Steelmaking coal CGU |
$ | | $ | (207 | ) | |||||||||||
Other |
41 | 44 | ||||||||||||||
Total |
$ | 41 | $ | (163 | ) |
Steelmaking Coal CGU
In 2018, there were no indicators of impairment or impairment reversal relating to our steelmaking coal CGU. We performed our annual goodwill impairment testing for the steelmaking coal CGU as at October 31, 2018, which is outlined in more detail below.
As at December 31, 2017, we recorded a pre-tax impairment reversal of $207 million ($131 million after tax) related to one of the mines in our steelmaking coal CGU. The estimated post-tax recoverable amount of this mine was significantly higher than the carrying value. This impairment reversal arose as a result of changes in short-term and long-term market participant price expectations for steelmaking coal and expected future operating cost estimates included in our annual goodwill impairment testing.
Other
During the year ended December 31, 2018, we recorded other asset impairments of $41 million, of which $31 million is related to capitalized exploration expenditures that are not expected to be recovered and $10 million ($44 million2017) is related to Quebrada Blanca assets that will not be recovered through use.
Annual Goodwill Impairment Testing
In 2018, we performed our annual goodwill impairment testing at October 31 and did not identify any goodwill impairment losses.
Given the nature of expected future cash flows used to determine the recoverable amount, a material change could occur over time, as the cash flows are significantly affected by the key assumptions described as follows.
Sensitivity Analysis
Our annual goodwill impairment test carried out at October 31, 2018 resulted in the recoverable amount of our steelmaking coal CGU exceeding its carrying value by approximately $6.7 billion. The recoverable amount of our steelmaking coal CGU is most sensitive to the long-term Canadian dollar steelmaking coal price assumption. In isolation, a 15% decrease in the long-term Canadian dollar steelmaking coal price would result in the recoverable amount of the steelmaking coal CGU being equal to the carrying value.
49
Teck 2018 Managements Discussion and Analysis
Our annual goodwill impairment test for the Quebrada Blanca CGU carried out at October 31, 2018 resulted in a recoverable amount that exceeded the carrying value and no goodwill impairment losses were identified. Subsequent to our annual goodwill impairment test, Teck announced the QB2 partnering transaction with SMM and SC. We compared the implied fair value that can be derived from the announced market transaction to the carrying value for our Quebrada Blanca CGU and concluded that the fair value exceeded our carrying value, including goodwill. In deriving a fair value for QBSA relative to the interest subscribed for by SMM and SC, we adjusted the transaction value to reflect the additional value attributed to a controlling interest.
Key Assumptions
The following are the key assumptions used in our impairment testing calculations during the years ended December 31, 2018 and 2017:
2018 | 2017 | |||
Steelmaking coal prices | Current price used in initial year, decreased to a long-term price in 2023 of US$150 per tonne | Current price used in initial year, decreased to a long-term price in 2022 of US$140 per tonne | ||
Copper prices | Current price used in initial year, increased to a long-term price in 2023 of US$3.00 per pound | Current price used in initial year, decreased to a long-term price in 2022 of US$3.00 per pound | ||
Discount rate | 6.0% | 5.9% | ||
Long-term foreign exchange rate | 1 U.S. to 1.25 Canadian dollars | 1 U.S. to 1.25 Canadian dollars | ||
Inflation rate | 2% | 2% |
Commodity Prices
Commodity price assumptions are based on a number of factors, including forward curves in the near term, and are benchmarked with external sources of information, including information published by our peers and market transactions, where possible, to ensure they are within the range of values used by market participants.
Discount Rates
Discount rates are based on a mining weighted average cost of capital for all mining operations. For the year ended December 31, 2018, we used a discount rate of 6.0% real, 8.1% nominal post-tax (2017 5.9% real, 8.0% nominal post-tax) for mining operations and goodwill.
Foreign Exchange Rates
Foreign exchange rates are benchmarked with external sources of information based on a range used by market participants. Long-term foreign exchange assumptions are from year 2023 onwards for analysis performed in the year ended December 31, 2018, and are from year 2022 onwards for analysis performed in the year ended December 31, 2017.
50
Teck 2018 Managements Discussion and Analysis
Inflation Rates
Inflation rates are based on average historical inflation for the location of each operation and long-term government targets.
Reserves and Resources
Future mineral production is included in projected cash flows based on mineral reserve and resource estimates, and on exploration and evaluation work undertaken by appropriately qualified persons.
Operating Costs and Capital Expenditures
Operating costs and capital expenditures are based on life of mine plans and internal management forecasts. Cost estimates incorporate management experience and expertise, current operating costs, the nature and location of each operation, and the risks associated with each operation. Future capital expenditures are based on managements best estimate of expected future capital requirements, which are generally for the extraction and processing of existing reserves and resources. All committed and anticipated capital expenditures based on future cost estimates have been included in the projected cash flows. Operating cost and capital expenditure assumptions are continuously subjected to ongoing optimization and review by management.
Recoverable Amount Basis
In the absence of a relevant market transaction, we estimate the recoverable amount of our CGUs on a fair value less costs of disposal (FVLCD) basis using a discounted cash flow methodology and taking into account assumptions likely to be made by market participants unless it is expected that the value-in-use methodology would result in a higher recoverable amount. For the asset impairment, impairment reversal and goodwill impairment analyses performed in 2018 and 2017, we have applied the FVLCD basis.
Estimated Recoverable Reserves and Resources
Mineral and oil reserve and resource estimates are based on various assumptions relating to operating matters as set forth in National Instrument 43-101, Standards of Disclosure for Mineral Projects and National Instrument 51-101, Standards of Disclosure for Oil and Gas Activities. Assumptions used include production costs, mining and processing recoveries, cut-off grades, marketing and sales, long-term commodity prices and, in some cases, exchange rates, inflation rates and capital costs. Cost estimates are based on pre-feasibility or feasibility study estimates or operating history. Estimates are prepared by, or under the supervision of, appropriately qualified persons, or qualified reserves evaluators, but will be affected by forecasted commodity prices, inflation rates, exchange rates, capital and production costs, and recoveries, among other factors. Estimated recoverable reserves and resources are used to determine the depreciation of property, plant and equipment at operating mine sites, in accounting for capitalized production stripping costs, in performing impairment testing, and in forecasting the timing of the payment of decommissioning and restoration costs. Therefore, changes in the assumptions used could affect the carrying value of assets, depreciation and impairment charges recorded in the statement of income, and the carrying value of the decommissioning and restoration provision.
Decommissioning and Restoration Provisions
The decommissioning and restoration provision (DRP) is based on future cost estimates using information available at the balance sheet date. The DRP represents the present value of estimated costs of future decommissioning and other site restoration activities. The DRP is adjusted at each reporting period for changes to factors such as the expected amount of cash flows required to discharge the liability, the timing of such cash flows and the credit-adjusted discount rate. The DRP requires other significant estimates and
51
Teck 2018 Managements Discussion and Analysis
assumptions, including the requirements of the relevant legal and regulatory framework and the timing, extent and costs of required decommissioning and restoration activities. To the extent the actual costs differ from these estimates, adjustments will be recorded and the income statement may be affected.
Provision for Income Taxes
We calculate current and deferred tax provisions for each of the jurisdictions in which we operate. Actual amounts of income tax expense are not final until tax returns are filed and accepted by the relevant authorities. This occurs subsequent to the issuance of our financial statements, and the final determination of actual amounts may not be completed for a number of years. Therefore, profit in subsequent periods will be affected by the amount that estimates differ from the final tax return.
Deferred Tax Assets and Liabilities
Assumptions about the generation of future taxable profits and repatriation of retained earnings depend on managements estimates of future production and sales volumes, commodity prices, reserves and resources, operating costs, decommissioning and restoration costs, capital expenditures, dividends and other capital management transactions. These estimates could result in an adjustment to the deferred tax provision and a corresponding credit or charge to profit.
Adoption of New Accounting Standards and Accounting Developments
Adoption of New Accounting Standards
We adopted IFRS 15 and IFRS 9, Financial Instruments (IFRS 9), which became effective January 1, 2018. Effective October 1, 2018, we also adopted the hedging requirements section of IFRS 9. We have adopted these new IFRS pronouncements in accordance with the transitional provisions outlined in the respective standards.
IFRS 9 was adopted prospectively from January 1, 2018 and did not affect our previously reported figures for 2017. There were no measurement changes to our financial assets or financial liabilities as a result of adopting IFRS 9. In addition, the adoption of the hedging requirements section of IFRS 9 on October 1, 2018 did not affect our existing designated hedging relationships.
We adopted IFRS 15 on January 1, 2018 in accordance with the transitional provisions of the standard, applying a full retrospective approach in restating our prior period financial information. Based on our analysis, the timing and amount of our revenue from product sales did not change significantly under IFRS 15. For steelmaking coal sales where we have a shipment that is partially loaded on a vessel at a reporting date, we concluded that the performance obligation in these contracts is for the full shipment. Therefore, we cannot recognize revenue until the full shipment is loaded. This does not significantly affect the revenue recognized in a period. This is a timing difference only and does not change the amount of revenue recognized for the full shipment.
As part of our assessment of IFRS 15, we analyzed the treatment of freight services provided to customers subsequent to the transfer of control of the product sold. Under IFRS 15, in our view, these services represent performance obligations that should be recognized separately. For the performance obligation related to these freight services, we have concluded that we are the principal to the shipping of product in our refined metal sales and concentrate sales contracts and will continue to reflect the revenue in these arrangements on a gross basis. For certain of our steelmaking coal sales contracts, we have concluded that we are the agent to the ocean freight shipping of product due to the terms of the arrangement, and our
52
Teck 2018 Managements Discussion and Analysis
revenue will be reported on a net basis for these arrangements. There will be no effect on our gross profit, as the freight costs will be netted against revenue for these arrangements and not presented within cost of sales.
We have assessed the effects of IFRS 15 on our silver and gold streaming arrangements. At the date these transactions were completed, we accounted for the arrangements as the sale of a portion of our mineral interests at Antamina and Carmen de Andacollo, respectively. We did not recognize disposal gains on the transactions as a result of the requirements of the IFRS standards in effect at the dates of closing. Under the recognition and measurement principles of IFRS 15, any gain on these streaming transactions would have been recognized in full as control over the right to the silver or gold mineral interest transferred to the purchaser. Accordingly, we have recognized the deferred consideration recorded on our balance sheet through equity on transition to IFRS 15 as at January 1, 2017, resulting in an increase in equity of $565 million, reduction in deferred consideration on the balance sheet of $755 million and an increase in our deferred tax liabilities of $190 million. We also reversed the amortization of the deferred consideration that was recorded as a reduction of cost of sales for the year ended December 31, 2017.
The tables in Note 32(a) to our audited consolidated financial statements for the year ended December 31, 2018 outline the adjustments to our financial statements resulting from the adoption of IFRS 15, described above, for all comparative periods presented, and includes a summary of changes to our significant accounting policies that resulted from the adoption of IFRS 15 and IFRS 9.
The adoption of these new IFRS pronouncements has resulted in adjustments to previously reported figures for 2017. Refer to Note 32 to our audited annual consolidated financial statements for the year ended December 31, 2018 for further detail on the adjustments to previously reported figures and our assessment of the effect of adoption of these new IFRS pronouncements, including changes to our significant accounting policies that resulted from the adoption.
Accounting Developments
New IFRS pronouncements that have been issued but are not yet effective are listed below. We plan to apply the new standard or interpretation in the annual period for which it is required.
Leases
The International Accounting Standards Board (IASB) issued IFRS 16, Leases (IFRS 16), which eliminates the classification of leases as either operating or finance leases for a lessee. IFRS 16 is effective from January 1, 2019. Under IFRS 16, all leases will be recorded on the balance sheet for the lessee. The only exemptions to this will be for leases that are 12 months or less in duration or for leases of low-value assets. The requirement to record all leases on the balance sheet under IFRS 16 will increase right-of-use assets and lease liabilities on an entitys financial statements. IFRS 16 will also change the nature of expenses relating to leases, as the straight-line lease expense previously recognized for operating leases will be replaced with depreciation expense for right-of-use assets and finance expense for lease liabilities. IFRS 16 includes an overall disclosure objective and requires a company to disclose (a) information about right-of-use assets and expenses and cash flows related to leases, (b) a maturity analysis of lease liabilities, and (c) any additional company-specific information that is relevant to satisfying the disclosure objective.
As at December 31, 2018, our review and assessment of IFRS 16 and the effect on our financial statements is nearing completion. Our work around identification of leases is substantially complete and we are currently finalizing our calculation and review of the lease balances under the requirements of IFRS 16. We are also
53
Teck 2018 Managements Discussion and Analysis
reviewing our processes and internal controls to ensure leases are properly identified and accounted for going forward. We will apply IFRS 16 as at January 1, 2019 using a cumulative catch-up approach where we will record leases prospectively from that date forward and will not restate comparative information. We will record right-of-use assets based on the lease liabilities determined as at January 1, 2019 and as a result, will not have a retained earnings adjustment on transition.
Conceptual Framework
In March 2018, the IASB issued a comprehensive set of concepts for financial reporting, the revised Conceptual Framework for Financial Reporting (revised Conceptual Framework), replacing the previous version of the Conceptual Framework issued in 2010. The purpose of the revised Conceptual Framework is to assist preparers of financial reports to develop consistent accounting policies for transactions or other events when no IFRS applies or IFRS allows a choice of accounting policies and to assist all parties to understand and interpret IFRS.
The revised Conceptual Framework sets out the objective of general purpose financial reporting; the qualitative characteristics of useful financial information; a description of the reporting entity and its boundary; definitions of an asset, a liability, equity, income and expenses and guidance on when to derecognize them; measurement bases and guidance on when to use them; concepts and guidance on presentation and disclosure; and concepts relating to capital and capital maintenance. The revised Conceptual Framework provides concepts and guidance that underpin the decisions the IASB makes when developing standards but is not in itself an IFRS standard and does not override any IFRS standard or any requirement of an IFRS standard. The revised Conceptual Framework is applicable to annual periods beginning on or after January 1, 2020 for preparers who develop an accounting policy based on the Conceptual Framework. We are currently assessing the effect of the revised Conceptual Framework on our financial statements.
Outstanding Share Data
As at February 12, 2019, there were approximately 559.7 million Class B subordinate voting shares and 7.8 million Class A common shares outstanding. In addition, there were approximately 19.6 million employee stock options outstanding, with exercise prices ranging between $4.15 and $58.80 per share. More information on these instruments, and the terms of their conversion, is set out in Note 23 to our 2018 audited financial statements.
54
Teck 2018 Managements Discussion and Analysis
Contractual and Other Obligations
($ in millions) | Less than 1 Year |
23 Years |
45 Years |
More than 5 Years |
Total | |||||||||||||||
Principal and interest payments on debt |
$ 317 | $ 815 | $ 1,157 | $ 7,990 | $ 10,279 | |||||||||||||||
Operating leases(1) |
113 | 105 | 57 | 164 | 439 | |||||||||||||||
Capital leases |
50 | 84 | 63 | 556 | 753 | |||||||||||||||
Minimum purchase obligations(2) |
||||||||||||||||||||
Concentrate, equipment, supply and other purchases |
683 | 168 | 35 | 36 | 922 | |||||||||||||||
Shipping and distribution |
436 | 490 | 322 | 760 | 2,008 | |||||||||||||||
Energy contracts |
260 | 530 | 546 | 3,666 | 5,002 | |||||||||||||||
NAB PILT and VIF payments(7) |
37 | 83 | 83 | 77 | 280 | |||||||||||||||
Pension funding(3) |
22 | | | | 22 | |||||||||||||||
Other non-pension post-retirement benefits(4) |
15 | 32 | 34 | 311 | 392 | |||||||||||||||
Decommissioning and restoration provision(5) |
91 | 133 | 100 | 1,290 | 1,614 | |||||||||||||||
Other long-term liabilities(6) |
64 | 79 | 21 | 30 | 194 | |||||||||||||||
$ 2,088 | $ 2,519 | $ 2,418 | $ 14,880 | $ 21,905 |
Notes:
(1) | We lease road and port facilities from the Alaska Industrial Development and Export Authority, through which it ships metal concentrates produced at the Red Dog mine. Minimum lease payments are US$18 million for the next 4 years and US$6 million for the following 18 years and are subject to deferral and abatement for force majeure events. |
(2) | The majority of our minimum purchase obligations are subject to continuing operations and force majeure provisions. |
(3) | As at December 31, 2018, the company had a net pension asset of $164 million, based on actuarial estimates prepared on a going concern basis. The amount of minimum funding for 2019 in respect of defined benefit pension plans is $22 million. The timing and amount of additional funding after 2019 is dependent upon future returns on plan assets, discount rates and other actuarial assumptions. |
(4) | We had a discounted, actuarially determined liability of $392 million in respect of other non-pension post-retirement benefits as at December 31, 2018. Amounts shown are estimated expenditures in the indicated years. |
(5) | We accrue environmental and reclamation obligations over the life of our mining operations, and amounts shown are estimated expenditures in the indicated years at fair value, assuming credit-adjusted risk-free discount rates between 6.49% and 7.99% and an inflation factor of 2.00%. |
(6) | Other long-term liabilities include amounts for post-closure, environmental costs and other items. |
(7) | On April 25, 2017, Teck Alaska entered into a 10-year agreement with the Northwest Arctic Borough (NAB) for payments in lieu of taxes (PILT). Payments under the agreement are based on a percentage of land, buildings and equipment at cost less accumulated depreciation. The effective date of this agreement was January 1, 2016 and this agreement expires on December 31, 2025. On April 25, 2017, Teck Alaska entered into a 10-year agreement with the Northwest Arctic Borough (NAB) for payments to a village improvement fund (VIF). Payments under the agreement are based on a percentage of earnings before income taxes, with 20172025 having minimum payments of $4 million and maximum payments of $8 million. The effective date of this agreement was January 1, 2016 and this agreement expires on December 31, 2025. |
Disclosure Controls and Internal Control Over Financial Reporting
Disclosure Controls and Procedures
Disclosure controls and procedures are designed to provide reasonable assurance that information required to be disclosed in reports filed or submitted by us under U.S. and Canadian securities legislation is recorded, processed, summarized and reported within the time periods specified in those rules, and include controls and procedures designed to ensure that information required to be disclosed in reports filed or submitted by us under U.S. and Canadian securities legislation is accumulated and communicated to management, including the Chief Executive Officer and Chief Financial Officer, as appropriate, to permit timely decisions regarding required disclosure. Management, including the Chief Executive Officer and Chief Financial Officer, has evaluated the effectiveness of the design and operation of our disclosure controls and procedures, as defined in the rules of the U.S. Securities and Exchange Commission and the Canadian Securities Administrators, as at December 31, 2018. Based on this evaluation, the Chief Executive Officer and Chief Financial Officer have concluded that our disclosure controls and procedures were effective as at December 31, 2018.
55
Teck 2018 Managements Discussion and Analysis
Managements Report on Internal Control Over Financial Reporting
Our management is responsible for establishing and maintaining adequate internal control over financial reporting. Any system of internal control over financial reporting, no matter how well-designed, has inherent limitations. Therefore, even those systems determined to be effective can provide only reasonable assurance with respect to financial statement preparation and presentation. Management has used the Committee of Sponsoring Organizations of the Treadway Commission (COSO) 2013 framework to evaluate the effectiveness of our internal control over financial reporting. Based on this assessment, management has concluded that as at December 31, 2018, our internal control over financial reporting was effective.
The effectiveness of our internal controls over financial reporting has been audited by PricewaterhouseCoopers LLP, an independent registered public accounting firm, who have expressed their opinion in their report included with our annual consolidated financial statements.
Use of Non-GAAP Financial Measures
Our financial results are prepared in accordance with International Financial Reporting Standards (IFRS). This document refers to a number of Non-GAAP Financial Measures, which are not measures recognized under IFRS in Canada and do not have a standardized meaning prescribed by IFRS or Generally Accepted Accounting Principles (GAAP) in the United States.
The Non-GAAP Measures described below do not have standardized meanings under IFRS, may differ from those used by other issuers, and may not be comparable to such measures as reported by others. These measures have been derived from our financial statements and applied on a consistent basis as appropriate. We disclose these measures because we believe they assist readers in understanding the results of our operations and financial position and are meant to provide further information about our financial results to investors. These measures should not be considered in isolation or used in substitute for other measures of performance prepared in accordance with IFRS.
Adjusted profit: For adjusted profit, we adjust profit attributable to shareholders as reported to remove the after-tax effect of certain types of transactions that in our judgment are not indicative of our normal operating activities or do not necessarily occur on a regular basis.
Adjusted basic earnings per share: Adjusted basic earnings per share is adjusted profit divided by average number of shares outstanding in the period.
Adjusted diluted earnings per share: Adjusted diluted earnings per share is adjusted profit divided by average number of fully diluted shares in a period.
EBITDA: EBITDA is profit attributable to shareholders before net finance expense, provision for income taxes, and depreciation and amortization.
Adjusted EBITDA: Adjusted EBITDA is EBITDA before the pre-tax effect of the adjustments that we make to adjusted profit attributable to shareholders as described above.
The above adjustments to profit attributable to shareholders and EBITDA highlight items and allow us and readers to analyze the rest of our results more clearly. We believe that disclosing these measures assists readers in understanding the ongoing cash generating potential of our business in order to provide liquidity to
56
Teck 2018 Managements Discussion and Analysis
fund working capital needs, service outstanding debt, fund future capital expenditures and investment opportunities, and pay dividends.
Gross profit before depreciation and amortization: Gross profit before depreciation and amortization is gross profit with the depreciation and amortization expense added back. We believe this measure assists us and readers to assess our ability to generate cash flow from our business units or operations.
Unit costs: Unit costs for our steelmaking coal operations are total cost of goods sold, divided by tonnes sold in the period, excluding depreciation and amortization charges. We include this information as it is frequently requested by investors and investment analysts who use it to assess our cost structure and margins and compare it to similar information provided by many companies in the industry.
Adjusted site cost of sales: Adjusted site cost of sales for our steelmaking coal operations is defined as the cost of the product as it leaves the mine excluding depreciation and amortization charges, outbound transportation costs and any one-time collective agreement charges and inventory write-down provisions.
Total cash unit costs: Total cash unit costs for our copper and zinc operations include adjusted cash costs of sales, as described above, plus the smelter and refining charges added back in determining adjusted revenue. This presentation allows a comparison of total cash unit costs, including smelter charges, to the underlying price of copper or zinc in order to assess the margin for the mine on a per unit basis.
Net cash unit costs: Net cash unit costs of principal product, after deducting co-product and by-product margins, are also a common industry measure. By deducting the co- and by-product margin per unit of the principal product, the margin for the mine on a per unit basis may be presented in a single metric for comparison to other operations. Readers should be aware that this metric, by excluding certain items and reclassifying cost and revenue items, distorts our actual production costs as determined under IFRS.
Adjusted cash costs of sales: Adjusted cash cost of sales for our copper and zinc operations is defined as the cost of the product delivered to the port of shipment, excluding depreciation and amortization charges, any one-time collective agreement charges or inventory write-down provisions, and by-product cost of sales. It is common practice in the industry to exclude depreciation and amortization, as these costs are non-cash, and discounted cash flow valuation models used in the industry substitute expectations of future capital spending for these amounts.
Adjusted operating costs: Adjusted operating costs for our energy business unit are defined as the costs of product as it leaves the mine, excluding depreciation and amortization charges, cost of diluent for blending to transport our bitumen by pipeline, cost of non-proprietary product purchased, and transportation costs of our product, and non-proprietary product and any one-time collective agreement charges or inventory write-down provisions.
Cash margins for by-products: Cash margins for by-products is revenue from by-products and co-products, less any associated cost of sales of the by-product and co-product. In addition, for our copper operations, by-product cost of sales also includes cost recoveries associated with our streaming transactions.
Adjusted revenue: Adjusted revenue for our copper and zinc operations excludes the revenue from co-products and by-products, but adds back the processing and refining charges to arrive at the value of the
57
Teck 2018 Managements Discussion and Analysis
underlying payable pounds of copper and zinc. Readers may compare this on a per unit basis with the price of copper and zinc on the LME.
Adjusted revenue for our energy business unit excludes the cost of diluent for blending and non-proprietary product revenues, but adds back Crown royalties to arrive at the value of the underlying bitumen.
Blended bitumen revenue: Blended bitumen revenue is revenue as reported for our energy business unit, but excludes non-proprietary product revenue, and adds back Crown royalties that are deducted from revenue.
Blended bitumen price realized: Blended bitumen price realized is blended bitumen revenue divided by blended bitumen barrels sold in the period.
Operating netback: Operating netbacks per barrel in our energy business unit are calculated as blended bitumen sales revenue net of diluent expenses (also referred to as bitumen price realized), less Crown royalties, transportation and operating expenses divided by barrels of bitumen sold. We include this information as investors and investment analysts use it to measure our profitability on a per barrel basis and compare it to similar information provided by other companies in the oil sands industry.
The debt-related measures outlined below are disclosed as we believe they provide readers with information that allows them to assess our credit capacity and the ability to meet our short and long-term financial obligations.
Net debt: Net debt is total debt, less cash and cash equivalents.
Debt to debt-plus-equity ratio: Debt to debt-plus-equity ratio takes total debt as reported and divides that by the sum of total debt plus total equity, expressed as a percentage.
Net debt to net debt-plus-equity ratio: Net debt to net debt-plus-equity ratio is net debt divided by the sum of net debt plus total equity, expressed as a percentage.
Debt to EBITDA ratio: Debt to EBITDA ratio takes total debt as reported and divides that by EBITDA for the 12 months ended at the reporting period, expressed as the number of times EBITDA needs to be earned to repay all of the outstanding debt.
Net debt to EBITDA ratio: Net debt to EBITDA ratio is the same calculation as the debt to EBITDA ratio, but using net debt as the numerator.
58
Teck 2018 Managements Discussion and Analysis
Reconciliation of Basic Earnings per share to Adjusted Basic Earnings per share
(Per share amounts) | 2018 | 2017(1) | ||||||||||
Earnings per share |
$ 5.41 | $ 4.26 | ||||||||||
Add (deduct): |
||||||||||||
Debt purchase losses |
0.03 | 0.28 | ||||||||||
Debt prepayment option loss (gain) |
0.05 | (0.07 | ) | |||||||||
Asset sales |
(1.40 | ) | (0.01 | ) | ||||||||
Foreign exchange loss (gain) |
(0.01 | ) | (0.01 | ) | ||||||||
Environmental provisions |
0.02 | 0.10 | ||||||||||
Asset impairments (reversals) |
0.05 | (0.17 | ) | |||||||||
Other |
(0.02 | ) | (0.02 | ) | ||||||||
Adjusted earnings per share |
$ 4.13 | $ 4.36 |
Note:
(1) | Certain 2017 comparative figures have been restated for new IFRS pronouncements. 2016 figures have not been restated. Please refer to Note 32 to our audited annual consolidated financial statements for the year ended December 31, 2018. |
Reconciliation of Diluted Earnings per share to Adjusted Diluted Earnings per share
(Per share amounts) | 2018 | 2017(1) | ||||||||||
Diluted earnings per share |
$ 5.34 | $ 4.19 | ||||||||||
Add (deduct): |
||||||||||||
Debt purchase losses |
0.03 | 0.28 | ||||||||||
Debt prepayment option loss (gain) |
0.05 | (0.06 | ) | |||||||||
Asset sales |
(1.39 | ) | (0.01 | ) | ||||||||
Foreign exchange loss (gain) |
(0.01 | ) | (0.01 | ) | ||||||||
Environmental provisions |
0.02 | 0.10 | ||||||||||
Asset impairments (reversals) |
0.05 | (0.17 | ) | |||||||||
Other |
(0.02 | ) | (0.02 | ) | ||||||||
Adjusted diluted earnings per share |
$ 4.07 | $ 4.30 |
Note:
(1) | Certain 2017 comparative figures have been restated for new IFRS pronouncements. 2016 figures have not been restated. Please refer to Note 32 to our audited annual consolidated financial statements for the year ended December 31, 2018. |
Reconciliation of Net Debt to EBITDA Ratio
($ in millions) | 2018 | 2017(1) | ||||||||||
Profit attributable to shareholders |
$ 3,107 | $ 2,460 | ||||||||||
Finance expense net of finance income |
219 | 212 | ||||||||||
Provision for income taxes |
1,365 | 1,425 | ||||||||||
Depreciation and amortization |
1,483 | 1,492 | ||||||||||
EBITDA |
$ 6,174 | $ 5,589 | ||||||||||
Total debt at period end |
$ 5,519 | $ 6,369 | ||||||||||
Less: cash and cash equivalents at period end |
(1,734 | ) | (952 | ) | ||||||||
Net debt |
$ 3,785 | $ 5,417 | ||||||||||
Debt to EBITDA ratio |
0.9 | 1.1 | ||||||||||
Net Debt to EBITDA ratio |
0.6 | 1.0 |
Note:
(1) | Certain 2017 comparative figures have been restated for new IFRS pronouncements. 2016 figures have not been restated. Please refer to Note 32 to our audited annual consolidated financial statements for the year ended December 31, 2018. |
59
Teck 2018 Managements Discussion and Analysis
Reconciliation of EBITDA and Adjusted EBITDA
($ in millions) | 2018 | 2017(1) | ||||||||||||||
Profit attributable to shareholders |
$ | 3,107 | $ | 2,460 | ||||||||||||
Finance expense net of finance income |
219 | 212 | ||||||||||||||
Provision for income taxes |
1,365 | 1,425 | ||||||||||||||
Depreciation and amortization |
1,483 | 1,492 | ||||||||||||||
EBITDA |
$ | 6,174 | $ | 5,589 | ||||||||||||
Add (deduct): |
||||||||||||||||
Debt repurchase losses |
26 | 216 | ||||||||||||||
Debt prepayment option (gains) losses |
42 | (51 | ) | |||||||||||||
Asset sales |
(885 | ) | (7 | ) | ||||||||||||
Foreign exchange (gains) losses |
(16 | ) | (5 | ) | ||||||||||||
Environmental provisions |
18 | 81 | ||||||||||||||
Asset impairments (reversals) |
41 | (163 | ) | |||||||||||||
Other |
(10 | ) | | |||||||||||||
Adjusted EBITDA |
$ | 5,390 | $ | 5,660 |
Note:
(1) | Certain 2017 comparative figures have been restated for new IFRS pronouncements. 2016 figures have not been restated. Please refer to Note 32 to our audited annual consolidated financial statements for the year ended December 31, 2018. |
Reconciliation of Gross Profit (Loss) Before Depreciation and Amortization
($ in millions) | 2018 | 2017(2) | 2016 | |||||||||||||||||||||
Gross profit |
$ | 4,621 | $ | 4,567 | $ | 2,396 | ||||||||||||||||||
Depreciation and amortization |
1,483 | 1,492 | 1,385 | |||||||||||||||||||||
Gross profit before depreciation and amortization |
$ | 6,104 | $ | 6,059 | $ | 3,781 | ||||||||||||||||||
Reported as: |
||||||||||||||||||||||||
Steelmaking coal |
$ | 3,770 | $ | 3,732 | $ | 2,007 | ||||||||||||||||||
Copper |
||||||||||||||||||||||||
Highland Valley Copper |
343 | 213 | 268 | |||||||||||||||||||||
Antamina |
794 | 670 | 409 | |||||||||||||||||||||
Quebrada Blanca |
26 | 50 | 24 | |||||||||||||||||||||
Carmen de Andacollo |
193 | 222 | 86 | |||||||||||||||||||||
Other |
(1 | ) | (1 | ) | 1 | |||||||||||||||||||
$ | 1,355 | $ | 1,154 | $ | 788 | |||||||||||||||||||
Zinc |
||||||||||||||||||||||||
Trail Operations |
91 | 209 | 241 | |||||||||||||||||||||
Red Dog |
990 | 971 | 749 | |||||||||||||||||||||
Pend Oreille |
(5 | ) | 19 | | ||||||||||||||||||||
Other |
9 | (26 | ) | (6 | ) | |||||||||||||||||||
$ | 1,085 | $ | 1,173 | $ | 984 | |||||||||||||||||||
Energy(1) |
$ | (106 | ) | $ | | $ | 2 | |||||||||||||||||
Gross profit before depreciation and amortization |
$ | 6,104 | $ | 6,059 | $ | 3,781 |
Notes:
(1) | Energy results for the year ended December 31, 2018 are included from June 1, 2018. |
(2) | Certain 2017 comparative figures have been restated for new IFRS pronouncements. 2016 figures have not been restated. Please refer to Note 32 to our audited annual consolidated financial statements for the year ended December 31, 2018. |
60
Teck 2018 Managements Discussion and Analysis
Steelmaking Coal Unit Cost Reconciliation
(CAD$ in millions, except where noted) |
2018 | 2017(2) | ||||||
Cost of sales as reported |
$ | 3,309 | $ | 3,000 | ||||
Less: |
||||||||
Transportation |
(975) | (892) | ||||||
Depreciation and amortization |
(730) | (718) | ||||||
Adjusted cash cost of sales |
$ | 1,604 | $ | 1,390 | ||||
Tonnes sold (millions) |
26.0 | 26.5 | ||||||
Per unit amounts CAD$/tonne |
||||||||
Adjusted cash cost of sales |
$ | 62 | $ | 52 | ||||
Transportation |
37 | 34 | ||||||
Cash unit costs CAD$/tonne |
$ | 99 | $ | 86 | ||||
US$ amounts(1) |
||||||||
Average exchange rate (CAD$ per US$1.00) |
$ | 1.30 | $ | 1.30 | ||||
Per unit amounts US$/tonne |
||||||||
Adjusted cash cost of sales |
$ | 47 | $ | 40 | ||||
Transportation |
29 | 26 | ||||||
Cash unit costs US$/tonne |
$ | 76 | $ | 66 |
Notes:
(1) | Average period exchange rates are used to convert to US$/tonne equivalent. |
(2) | Certain 2017 comparative figures have been restated for new IFRS pronouncements. 2016 figures have not been restated. Please refer to Note 32 to our audited annual consolidated financial statements for the year ended December 31, 2018. |
61
Teck 2018 Managements Discussion and Analysis
Copper Unit Cost Reconciliation
(CAD$ in millions, except where noted) |
2018 | 2017(2) | ||||||
Revenue as reported |
$ | 2,714 | $ | 2,400 | ||||
By-product revenue (A) |
(472) | (378) | ||||||
Smelter processing charges (B) |
157 | 180 | ||||||
Adjusted revenue |
$ | 2,399 | $ | 2,202 | ||||
Cost of sales as reported |
$ | 1,837 | $ | 1,814 | ||||
Less: |
||||||||
Depreciation and amortization |
(478) | (568) | ||||||
Inventory (write-downs) provision reversal |
(44) | 12 | ||||||
Collective agreement charges |
(5) | (15) | ||||||
By-product cost of sales (C) |
(61) | (54) | ||||||
Adjusted cash cost of sales (D) |
$ | 1,249 | $ | 1,189 | ||||
Payable pounds sold (millions) (E) |
622.9 | 604.4 | ||||||
Per unit amounts CAD$/pound |
||||||||
Adjusted cash cost of sales (D/E) |
$ | 2.01 | $ | 1.97 | ||||
Smelter processing charges (B/E) |
0.25 | 0.30 | ||||||
Total cash unit costs CAD$/pound |
$ | 2.26 | $ | 2.27 | ||||
Cash margin for by-products ((A-C)/E) |
(0.66) | (0.54) | ||||||
Net cash unit cost CAD$/pound |
$ | 1.60 | $ | 1.73 | ||||
US$ amounts(1) |
||||||||
Average exchange rate (CAD$ per US$1.00) |
$ | 1.30 | $ | 1.30 | ||||
Per unit amounts US$/pound |
||||||||
Adjusted cash cost of sales |
$ | 1.55 | $ | 1.52 | ||||
Smelter processing charges |
0.19 | 0.23 | ||||||
Total cash unit costs US$/pound |
$ | 1.74 | $ | 1.75 | ||||
Cash margin for by-products |
(0.51) | (0.42) | ||||||
Net cash unit costs US$/pound |
$ | 1.23 | $ | 1.33 |
Notes:
(1) | Average period exchange rates are used to convert to US$/pound equivalent. |
(2) | Certain 2017 comparative figures have been restated for new IFRS pronouncements. 2016 figures have not been restated. Please refer to Note 32 to our audited annual consolidated financial statements for the year ended December 31, 2018. |
62
Teck 2018 Managements Discussion and Analysis
Zinc Unit Cost Reconciliation (mining operations(1))
(CAD$ in millions, except where noted) |
2018 | 2017(3) | ||||||
Revenue as reported |
$ | 3,094 | $ | 3,496 | ||||
Less: |
||||||||
Trail Operations revenues as reported |
(1,942) | (2,266) | ||||||
Other revenues as reported |
(8) | (8) | ||||||
Add back: Inter-segment revenues as reported |
650 | 635 | ||||||
$ | 1,794 | $ | 1,857 | |||||
By-product revenues (A) |
(316) | (400) | ||||||
Smelter processing charges (B) |
255 | 339 | ||||||
Adjusted revenue |
$ | 1,733 | $ | 1,796 | ||||
Cost of sales as reported |
$ | 2,225 | $ | 2,529 | ||||
Less: |
||||||||
Trail Operations cost of sales as reported |
(1,926) | (2,135) | ||||||
Other costs of sales as reported |
1 | (34) | ||||||
Add back: Inter-segment purchases as reported |
650 | 635 | ||||||
950 | 995 | |||||||
Less: |
||||||||
Depreciation and amortization |
(141) | (128) | ||||||
Royalty costs |
(328) | (412) | ||||||
By-product cost of sales (C) |
(70) | (77) | ||||||
Adjusted cash cost of sales (D) |
$ | 411 | $ | 378 | ||||
Payable pounds sold (millions) (E) |
1,035.5 | 1,060.9 | ||||||
Per unit amounts CAD$/pound |
||||||||
Adjusted cash cost of sales (D/E) |
$ | 0.40 | $ | 0.35 | ||||
Smelter processing charges (B/E) |
0.25 | 0.32 | ||||||
Total cash unit costs CAD$/pound |
$ | 0.65 | $ | 0.67 | ||||
Cash margin for by-products ((A-C)/E) |
(0.24) | (0.30) | ||||||
Net cash unit cost CAD$/pound |
$ | 0.41 | $ | 0.37 | ||||
US$ amounts(2) |
||||||||
Average exchange rate (CAD$ per US$1.00) |
$ | 1.30 | $ | 1.30 | ||||
Per unit amounts US$/pound |
||||||||
Adjusted cash cost of sales |
$ | 0.30 | $ | 0.27 | ||||
Smelter processing charges |
0.19 | 0.25 | ||||||
Total cash unit costs US$/pound |
$ | 0.49 | $ | 0.52 | ||||
Cash margin for by-products |
(0.18) | (0.24) | ||||||
Net cash unit cost US$/pound |
$ | 0.31 | $ | 0.28 |
Notes:
(1) | Red Dog and Pend Oreille. |
(2) | Average period exchange rates are used to convert to US$/pound equivalent. |
(3) | Certain 2017 comparative figures have been restated for new IFRS pronouncements. 2016 figures have not been restated. Please refer to Note 32 to our audited annual consolidated financial statements for the year ended December 31, 2018. |
63
Teck 2018 Managements Discussion and Analysis
Energy Business Unit Operating Netback, Bitumen and Blended Bitumen Price Realized Reconciliations(1)
(CAD$ in millions, except where noted) |
2018 | |||
Revenue as reported |
$ | 407 | ||
Less: |
||||
Cost of diluent for blending |
(181) | |||
Non-proprietary product revenue |
(18) | |||
Add back: Crown royalties (D) |
14 | |||
Adjusted revenue (A) |
$ | 222 | ||
Cost of sales as reported |
$ | 572 | ||
Less: |
||||
Depreciation and amortization |
(59) | |||
Inventory write-downs |
(34) | |||
Cash cost of sales |
$ | 479 | ||
Less: |
||||
Cost of diluent for blending |
(181) | |||
Cost of non-proprietary product purchased |
(12) | |||
Transportation for non-proprietary product purchased |
(3) | |||
Transportation costs for FRB (C) |
(60) | |||
Adjusted operating costs (E) |
$ | 223 | ||
Blended bitumen barrels sold (thousands) |
8,746 | |||
Less diluent barrels included in blended bitumen (thousands) |
(1,965) | |||
Bitumen barrels sold (thousands) (B) |
6,781 | |||
Per barrel amounts CAD$ |
||||
Bitumen price realized (A/B)(2) |
$ | 32.81 | ||
Crown royalties (D/B) |
(2.04) | |||
Transportation costs for FRB (C/B) |
(8.83) | |||
Adjusted operating costs (E/B) |
(32.89) | |||
Operating netback CAD$ per barrel |
$ | (10.95) |
Notes:
(1) | Results for the year ended December 31, 2018 are effective from June 1, 2018. |
(2) | Bitumen price realized represents the realized petroleum revenue (blended bitumen sales revenue) net of diluent expense, expressed on a per barrel basis. Blended bitumen sales revenue represents revenue from our share of the heavy crude oil blend known as Fort Hills Reduced Carbon Life Cycle Dilbit Blend (FRB), sold at the Hardisty and U.S. Gulf Coast market hubs. FRB is comprised of bitumen produced from Fort Hills blended with purchased diluent. The cost of blending is affected by the amount of diluent required and the cost of purchasing, transporting and blending the diluent. A portion of diluent expense is effectively recovered in the sales price of the blended product. Diluent expense is also affected by Canadian and U.S. benchmark pricing and changes in the value of the Canadian dollar relative to the U.S. dollar. |
Blended Bitumen Price Realized Reconciliation(2)
(CAD$ in millions, except where noted) |
2018 | |||
Revenue as reported |
$ | 407 | ||
Less: non-proprietary product revenue |
(18) | |||
Add back: Crown royalties |
14 | |||
Blended bitumen revenue (A) |
$ | 403 | ||
Blended bitumen barrels sold (thousands) (B) |
8,746 | |||
Blended bitumen price realized (CAD$/barrel) (A/B) = D(1) |
$ | 46.14 | ||
Average exchange rate (CAD$ per US$1.00) (C) |
1.31 | |||
Blended bitumen price realized (US$/barrel) (D/C)(1) |
$ | 35.12 |
Notes:
(1) | Calculated per unit amounts may differ due to rounding. |
(2) | Results for the year ended December 31, 2018 are effective from June 1, 2018. |
64
Teck 2018 Managements Discussion and Analysis
Quarterly Reconciliation
($in millions) | 2018 | 2017(1) | ||||||||||||||||||||||||||||||
Q4 | Q3 | Q2 | Q1 | Q4 | Q3 | Q2 | Q1 | |||||||||||||||||||||||||
|
||||||||||||||||||||||||||||||||
Profit attributable to shareholders |
$ | 433 | $ | 1,281 | $ | 634 | $ | 759 | $ | 740 | $ | 584 | $ | 580 | $ | 556 | ||||||||||||||||
Finance expense, net of finance income |
58 | 74 | 48 | 39 | 39 | 39 | 58 | 76 | ||||||||||||||||||||||||
Provision for income taxes |
261 | 329 | 368 | 407 | 407 | 347 | 334 | 337 | ||||||||||||||||||||||||
Depreciation and amortization |
400 | 380 | 353 | 350 | 377 | 400 | 369 | 346 | ||||||||||||||||||||||||
EBITDA |
$ | 1,152 | $ | 2,064 | $ | 1,403 | $ | 1,555 | $ | 1,563 | $ | 1,370 | $ | 1,341 | $ | 1,315 |
Note:
(1) | Certain 2017 comparative figures have been restated for new IFRS pronouncements. 2016 figures have not been restated. Please refer to Note 32 to our audited annual consolidated financial statements for the year ended December 31, 2018. |
65
Teck 2018 Managements Discussion and Analysis
Cautionary Statement on Forward-Looking Statements
This document contains certain forward-looking information and forward-looking statements as defined in applicable securities laws (collectively referred to as forward-looking statements). All statements other than statements of historical fact are forward-looking statements. Forward-looking statements involve known and unknown risks, uncertainties and other factors, which may cause the actual results, performance or achievements of Teck to be materially different from any future results, performance or achievements expressed or implied by the forward-looking statements. These forward-looking statements include, but are not limited to, estimates, forecasts and statements as to managements expectations with respect to, among other things, anticipated future production at our business units, products and individual operations (including our long-term production guidance), cost and spending guidance for our business units and individual operations, production and sales forecasts for our products and operations, our expectation that we will meet our production guidance, sales volume and selling prices for our products (including settlement of coal contracts with customers), forecast capital expenditures and capital spending, mine lives and the expected life of our various operations, including our expectation that we will be able to extend the mine lives of Fording River, Elkview and Greenhills, our expectation we will be able to increase production at our Elkview Operations beyond 2019, expected prices and demand for our products, expected receipt of regulatory approvals and timing thereof, expected receipt of pre-feasibility studies, feasibility studies and other studies and the timing thereof, plans and expectations for our development projects, including forecast operating costs and costs of product sold, expected production, including our expectation that we will be able to increase production at our other coal operations to compensate for the closure of Coal Mountain, expected progress, planned activities, costs and outcomes of our various projects and investments, including, but not limited to, those described in the discussions of our operations, the effect of currency exchange rates and commodity price changes, our strategies and objectives, discussions of our areas of focus for 2019, discussions of new or proposed technology or innovations, our expectations for the general market for our commodities, future trends for the company, expectations regarding the potential for the proposed MacKenzie Redcap development at Cardinal River to supply additional coal production or extend production at Cardinal River and the costs and accounting adjustments associated therewith, the costs, steps and potential impact of managing water quality at our coal operations, including but not limited to statements relating to our expectations regarding timing and costs of active water treatment, capital spending guidance, the potential for saturated rock fills to reduce capital and operating costs associated with active water treatment, the regulatory process relating to active water treatment and estimates of our long-term costs of water management; our expectation that will be able to continue to capture latent production capacity by hauling raw coal from Elkview to Coal Mountain for processing, expectation that Neptune Bulk Terminals will increase our terminal loading capacity and our expectation that it will be completed in the first half of 2020, expectation that steelmaking coal production from 2020 to 2022 will be higher than 2019, our expectations regarding the increase in the royalty paid by Poscan in respect of our Greenhills property; anticipated benefits and timing of our ball mill project at Highland Valley Copper, the statement that there is potential to extend cathode production at Carmen de Andacollo past 2019, expectations regarding the Quebrada Blanca Phase 2 project, including expectations regarding capacity, mine life, reserve and resources, projected expenditures, timing of contributions and project financing, expected spending and activities on our Project Satellite properties, the anticipated benefits of the Red Dog mill upgrade project and the associated timing and cost, the timing of closing of the sale of a 30% interest in QBSA and expectation that the transaction will close, benefits of the new acid plant at our Trail Operations and the timing thereof, our expectation that unit operating costs at Fort Hills will continue to improve, our expectation regarding the potential to debottleneck and expand production capacity at Fort Hills, our expectation relating to curtailment measures affecting Fort
66
Teck 2018 Managements Discussion and Analysis
Hills, our expectations regarding the adequacy of our logistic arrangements for delivering our products to our customers, timing expectations regarding the Frontier project review and permitting process, the availability of our credit facilities, sources of liquidity and capital resources, statements regarding the impact and sensitivity of our annual profit attributable to shareholders and EBITDA to changes in exchange rates and commodity prices, our expectation that we will fund our commitments from cash on hand and our credit facilities, expectations regarding our dividend policy, including that an annual base dividend will be declared and paid, impact of carbon pricing policies and associated costs including our expectation that Canadian federal carbon tax policies will not apply to our operations, projections and sensitivities under the heading Commodity Prices and 2018 Production, all guidance appearing in this document appearing in this documentation including but not limited to the production, sales, unit cost and capital expenditure guidance under the heading Guidance, including our estimate of reduction in current taxes, forecast and demand and market outlook for commodities and our products. These forward-looking statements involve numerous assumptions, risks and uncertainties and actual results may vary materially.
These statements are based on a number of assumptions, including, but not limited to, assumptions regarding general business, regulatory and economic conditions, the supply and demand for, deliveries of, and the level and volatility of prices of zinc, copper, steelmaking coal and bitumen and other primary metals and minerals as well as oil, and related products, the timing of the receipt of regulatory and governmental approvals for our development projects and other operations, our costs of production, and production and productivity levels, as well as those of our competitors, power prices, continuing availability of water and power resources for our operations, market competition, the accuracy of our reserve and resource estimates (including with respect to size, grade and recoverability) and the geological, operational and price assumptions on which these are based, conditions in financial markets, the future financial performance of the company, our ability to attract and retain skilled staff, our ability to procure equipment and operating supplies, positive results from the studies on our expansion projects, our steelmaking coal and other product inventories, our ability to secure adequate transportation, including rail, port and pipeline services, for our products and the costs associated therewith, our ability to obtain permits for our operations and expansions, and our ongoing relations with our employees, business partners and joint venturers. Assumptions regarding the Elk Valley Water Quality Plan include assumptions that additional treatment will be effective at scale, and that the technology and facilities operate as expected, as well as additional assumptions discussed under the heading Steelmaking Coal Elk Valley Water Management. Expectations regarding Quebrada Blanca Phase 2 are based on current project assumptions and the final feasibility study. Assumptions regarding Fort Hills are based on assumptions regarding the performance of the plant and other facilities at Fort Hills, and the operation of the project. Expectations regarding the impact of foreign exchange and commodity prices are based on 2019 mid-range production estimates, current commodity prices and a Canadian/U.S. dollar exchange rate of $1.32. Statements regarding the availability of our credit facilities are based on assumptions that we will be able to satisfy the conditions for borrowing at the time of a borrowing request and that the credit facilities are not otherwise terminated or accelerated due to an event of default. Assumptions relating to our expectations for the closing of the QB2 transaction, include that all regulatory approvals will be obtained in a timely manner. The foregoing list of assumptions is not exhaustive. Events or circumstances could cause actual results to vary materially.
Factors that may cause actual results to vary materially include, but are not limited to, changes in commodity and power prices, changes in market demand for our products, changes in interest and currency exchange rates, acts of foreign or domestic governments, the outcome of legal proceedings, inaccurate geological and metallurgical assumptions (including with respect to the size, grade and recoverability of mineral reserves
67
Teck 2018 Managements Discussion and Analysis
and resources), unanticipated operational difficulties (including failure of plant, equipment or processes to operate in accordance with specifications or expectations, cost escalation, unavailability of materials and equipment, government action or delays in the receipt of government approvals, changes in tax or royalty rates, industrial disturbances or other job action, adverse weather conditions and unanticipated events related to health, safety and environmental matters), union labour disputes, political risk, social unrest, failure of customers or counterparties to perform their contractual obligations (including but not limited to port, rail, pipeline and other logistics providers), changes in our credit ratings, unanticipated increases in costs to construct our development projects, difficulty in obtaining permits, inability to address concerns regarding permits or environmental impact assessments, and changes or further deterioration in general economic conditions. The amount and timing of actual capital expenditures is dependent upon, among other matters, being able to secure permits, equipment, supplies, materials and labour on a timely basis and at expected costs to enable the related capital project to be completed as currently anticipated. Our Fort Hills project is not controlled by us and production schedules may be adjusted by our partners. Certain of our other operations and projects are operated through joint arrangements where we may not have control over all decisions, which may cause outcomes to differ from current expectations. Further factors associated with our Elk Valley Water Quality Plan are discussed under the heading Managements Discussion and Analysis Steelmaking Coal Elk Valley Water Management. Declaration and payment of dividends is in the discretion of the Board, and our dividend policy will be reviewed regularly and may change. Closing of the QB2 transaction depends on certain regulatory approvals; if all required approvals are not received in a timely manner, the timing and ability to close will be jeopardized.
Statements concerning future production costs or volumes, mine lives of our operations and the sensitivity of the companys profit to changes in commodity prices and exchange rates, are based on numerous assumptions of management regarding operating matters and on assumptions that demand for products develops as anticipated, that customers and other counterparties perform their contractual obligations, that operating and capital plans will not be disrupted by issues such as mechanical failure, unavailability of parts and supplies, labour disturbances, interruption in transportation or utilities, and adverse weather conditions, and that there are no material unanticipated variations in the cost of energy or supplies. Statements regarding anticipated steelmaking coal sales volumes and average steelmaking coal prices depend on timely arrival of vessels and performance of our steelmaking coal-loading facilities, as well as the level of spot pricing sales.
We assume no obligation to update forward-looking statements except as required under securities laws. Further information concerning risks, assumptions and uncertainties associated with these forward-looking statements and our business can be found in our Annual Information Form for the year ended December 31, 2018, filed under our profile on SEDAR (www.sedar.com) and on EDGAR (www.sec.gov) under cover of Form 40-F, as well as subsequent filings that can also be found under our profile.
Scientific and technical information regarding our material mining projects in this annual report was approved by Mr. Rodrigo Alves Marinho, P.Geo., an employee of Teck. Mr. Marinho is a qualified person, as defined under National Instrument (NI) 43-101.
Contingent Resource Disclosure
The contingent bitumen resources at Frontier have been prepared by Sproule Associates Limited, a qualified resources evaluator, in accordance with the guidelines set out in the Canadian Oil and Gas Evaluation Handbook. The Sproule estimates of contingent resources have not been adjusted for risk based on the
68
Teck 2018 Managements Discussion and Analysis
chance of development (85% chance of development risk). There is uncertainty that any of these resources will be commercially viable to produce any portion of the resources. Contingent bitumen resources are defined for this purpose as those quantities of petroleum estimated, as of a given date, to be potentially recoverable from known accumulations using established technology or technology under development, but which are not currently considered to be commercially recoverable due to one or more contingencies. The entire contingent bitumen resources for Frontier oil sands mine are sub-classified into the development pending project maturity sub-class as extensive pre-development work has been completed. Contingencies may include factors such as economic, legal, environmental, political and regulatory matters or a lack of markets. Contingent resources do not constitute, and should not be confused with, reserves. There is no certainty that the Frontier project will produce any portion of the volumes currently classified as contingent resources. The primary contingencies that currently prevent the classification of the contingent resources disclosed above for the Frontier project as reserves include project economics due to the uncertainty in oil price and uncertainty in exchange rate; uncertainties around receiving regulatory approval to develop the project; potential issues regarding social licence for oil sands mining generally and climate change policy costs. In addition, there would be a need for approval of a decision to proceed to construction of the project by Teck. The Frontier project is based on a development study. The recovery technology at Frontier is expected to be a paraffinic froth treatment process. The total cost required to achieve first commercial production has been estimated by the resources evaluator at $16.2 billion.
69
Teck 2018 Managements Discussion and Analysis
[C!D71C
MDLQIV%)@4Y !88^4'
P!+-N.1G##=S@Y% %^J>IW4UG9-/"L)V\NTS[41>[' )/T'K5RJM
M_I]MJ4"PW2,T:N) %D9"&'0Y4B@#&_X2.\\MI/[.5/W9 CDE(82B(2$-QP,'
M&>N1TJ>TUY[K5_L@@5801&7);)D\L28'&T\'IG/!-7AH]@)FF,):1H_+9FD9
MLCU/4@ ;NN.].32K*.\6[2#$RC .XX'&W.,XSCC.,XXH N5FZIJ%S8/;F*
M".2.214;=)AF)( 51CDXR>>, UI53NM+M;RZ@NIED\Z $1LDK)C.,]",]!0!
MCP^)KB;R2+*/9,\#*?-/$4KE 3Q][*].G/6M+3+R]N;N]ANH[<+;LJ!X&8Y8
MC)!R.P*_G3XM&T^#=Y=LJ[I%E/S'AE.Y<<\ ')P..3Q5N"WBMU98D"AG9V]V
M)R3^= $E 4)&<'Z4R_GFM[-Y8$B9UY)FDV(H[LQ] .:GCC$4:QJ6*J,#<
MQ8_B3R:@OK"WU*U-M=(7A)#%0Y7D'(Y!!ZT 8)\531VWVJ:P"0K&/,7S#O#F
M,R# Q]T@#K@\].*:?%5Q%JSZ9-:0K/;%&N75W,85R-I!V\=?XL=/>MG^Q-/,
M@D> R.(_+)DD9]PP1SD\G!(R><'%,7P]I2&,BUY1MV3(Q+<@_,2?F P,!LXQ
M0!IUG:O?W&GPQRP0Q2*6PP=RI8D@!% !RQ)X[<
RU*;2M46]EN&NID*1@/M _=K]S!XRV[G-4)%UH1A;47ZN(E$6\_*
M(_*^8-G_ ):;\XS_ +/;-=-9W]O>VD-S$X"S ;0Q&02,[3[^U-AU*SG$N)XU
M:$MYBLX!0*2"2,\#CK0!B?8-3-Q#;F[U#[-]YY/,&[/E],^F[G'K[<4S2AKQ
MU>)KUIPF29 5_=E-G'?&[=Z#.<]JZ'[?98B/VNWQ-_JSYJ_/].>?PJ*?5K&W
M(#W,7$GE.?,7$;8)^;GCH: ,:?2+^?3]7C21AY\[LD#*H$BY!^]U^8 CGUJM
MJ<-S?3B]M=.N;9(5B1LQ+YCD3(W"=PH5N??BNF;4+)&VO>6ZMLWX,J@[>N>O
M3WIWVVTWHGVF'Z_LK4X;QVFN+E"@=Y20P\M5'^[\V3P!US5&72=6,>R
MW22%O+41O]HXB01;3'C/)+9.[W!SQ0!UM%
'M6^S:
M=!;6;S6UI %+1#//?CK7)3KTYQIP4MM_DCNJX>K"56HX[[?-GG-%*RLC%74J
MPX((P125ZAXYHZ1K=_HEVMQ93LA!Y7^%O8BO:/"OC&S\1P!"1%>*/GB)Z^XK
MP:I[2[GL;J.YMI&CE0Y5@:X\5@X5UV?<[L'CIX>5MX]CZ8JIJ3W,=D[VK0I(
M.=TV=JCN:Q?!_BF+Q'IPW$+=Q#$J>ON*TM>M(;W3'AG>X6,G+>1][_\ 57SK
M@Z=3EGI8^IC456GST];G,GQ/J9\@/*D4;%OWZ6Y<.H[XSP*TFUC44NP^0]HZ
M#9)L 4Y'7/\ 2BWL;"\L(D_M2\6/[JB20(6']W%:W]GV4\"VR.&CA7RPBMG;
M]?>MI5*71&,*=7JRU:7$=S;J\.G5?+'2)
M]3@LNA07-/67Y , 8HHHK@/2"BBB@#!UWPCI6O1-]H@"3X^6:,88?XUX[X
ME\)WWANXQ,OF6S'Y)E'!^OH:^@*K:A86VIV
BBODF[NY]LE96"BBBD,**** "BBB@ HHHH **** "BBB@ HHHH R?$FCIK
M>AW%FP^9ERA]&'2OGNX@DM;B2"92LD;%6!]:^FJ\P^)/A1F)UJRCSQ^_51_X
M]7J9;B5"7LY;/\SQ\VPCJ0]K'=?D>7TZ.1XI%DC8JZG(([&FT5[Q\V>T>"O'
M$.L0)8W\BQWR# ).!)_]>NWKYB1VC<.C%6!R"#R*[WP[\3;NP1+?5(S=0C@2
M _.!_6O%Q>6N_/1^X]_!9JK$>)]&?1-
VR3(?[PY'T-7**:;3NA-*2
MLSS35_A1$Y:32KLQYY\J;D?@:XZ^\"^(; G=8/*H_BA.[/\ 6O?**[Z>95H:
M/4\VKE6'J:K3T/FF73KV XFL[B,_[<1']*B\B8G'E/\ ]\FOIDHC?>4'ZBF^
M1"#D1)_WR*Z5F[ZP_$Y7DBZ3_#_@GSC!H^IW1 @T^YDSW6(XKH-/^'/B"^*F
M2!+6,_Q2MS^0KW$*!T 'T%+6<\UJ/X4D:T\FI+XY-_@<)HWPPTRR*RW\C7D@
M_A/"?E7;P016T2Q01K'&HP%48 J2BO/JUJE5WF[GI43HJU-6"BBBLC8***
M* "BBB@ HHHH **** "BBB@ HHHH **** "BBB@ HHHH KW-C:WD92YMXI5/
M9U!K!N? 'ANZ))T]8R?^>;%?Y5TU%:0JSA\+:,YT:<_CBF<6?A?X>S]VX'_;
M4U/!\-_#<)RUK))_OR&NMHK1XJN_MLR6#PZ^PON,ZQT'2M._X]+""(^JH,_G
M6CTZ5F>()+J+19VL_,\_@+Y?WNO:N8_M>[80V$=U>03F5A,\S*S+A<@ ]*4:
M
'1)
V-MA>- -?WOY:C^S[H_GV@]R*:]1ISH?!(8.1_IV"22Z*6Z
M@[8'/YK&[$E,Q;TRNYUWJU-M?RXO$GAO=R(,'$'J16/TH(LYU!U*:C#K96&V
MM9:_7<_8ULZDCVM'YJL)*14X]-$^DW;NB=2>/ZQ0LQO3W%@S36"WWL]1P:1J
MQFYLD?X1]3?[;%:0,C'-QD.##M+9V-<=2QWY\_Z/Z/\ Y!)2)S^EOR66NMJ-
MXTK.\3^=]$;O)Z86=*;DG(%M7KD07[Q,'V_O?R$PP,@!H^T-AL3^A9K&WW?U
MM')'IUQKV"]K3 &YM-?8DSM<'-24RJ=TNLOLJLJ!LDO<'C63+M=WFE0WI;JG
M8^.ZIU=@( S*_,YK T\VX,-/@SCGW#G.
MO)6^<@;[+R[S"D2[DD:.1&X==,@JO< ,TXCRZG7D/GS8/^QGM7_P!.
MS]O_ /I36?\ U83KA/[R_P#3VO [FX>W&Z6W-O
MMW8;=LAGMRT\5^MPZL)5* 1 D,U%)_"#7J5_NXUNTE,3R1E+![R(H]O/-#W46O>Y%'1E1QA+9?Y(=R87']Q]GMB.MLIU7TUW
M=D^ML_M.&@W+C>P:G9^'K-K8[*;NQ>ZYMQ5^W,AGJ)MQ/5IBGQ%-'514_@6J
M2617]KK;DOENZFY
.QG\/-+CL17X#:^!@@I1)C4=C+#-*S,UWL;
M!!_7"ZBWZRYBV_:;*TOH"S 1))H9FU59UDED)/<1A@*4QT8'DBTGY
SF2RHN?KICK:F:)!_@J@#V\ !
MP'3=3YGI-@ #@ "P _H![MUKKOWKKW7O?NO=78_RQ_\ LDG ?^)5^0W_
M +_KL7VDD^-NE*_"/LZ.'/VOU;2C,FI[)V#3#;F>H=J[A,^\=NPC [GR
376[@S,O#//E\Y5M-D:^220:B'D\:L3I51Q[ADL6XGJ= .'
M7S__ )T_]EJ?+/\ \6+[@^O_ (?6:]]BO:O_ *=G[?\ _2FL_P#JPG7"CWF_
MZ>U[E?\ 2]OO^TF7H
!3%4PR)S:YP%]ZMVGYA]R
M^8]WN-ENMNGE\'5;W*A)XRMO$E'4$CNTZE(-"I!\^NE7L+L=MRQ[4