UNITED STATES
SECURITIES AND EXCHANGE COMMISSION
Washington, D.C. 20549
FORM N-CSR
CERTIFIED SHAREHOLDER REPORT OF REGISTERED
MANAGEMENT INVESTMENT COMPANIES
|
Investment Company Act file number |
811-06637 | |||||||
|
| ||||||||
|
The UBS Funds | ||||||||
|
(Exact name of registrant as specified in charter) | ||||||||
|
| ||||||||
|
One North Wacker Drive, Chicago, IL |
|
60606-2807 | ||||||
|
(Address of principal executive offices) |
|
(Zip code) | ||||||
|
| ||||||||
|
Tammie Lee, Esq. UBS Global Asset Management (Americas) Inc. 1285 Avenue of the Americas New York, NY 10019 | ||||||||
|
(Name and address of agent for service) | ||||||||
|
| ||||||||
|
Copy to: Bruce Leto, Esq. Stradley Ronon Stevens & Young, LLP 2600 One Commerce Square Philadelphia, PA 19103-7098 | ||||||||
|
| ||||||||
|
Registrant’s telephone number, including area code: |
212-821-3000 |
| ||||||
|
| ||||||||
|
Date of fiscal year end: |
June 30 |
| ||||||
|
| ||||||||
|
Date of reporting period: |
June 30, 2015 |
| ||||||
Item 1. Reports to Stockholders.

UBS Asset
Allocation Funds
June 30, 2015
The UBS Funds—Asset Allocation
Annual Report
|
Table of contents |
|||||||
|
President's letter |
1 |
||||||
|
Market commentary |
3 |
||||||
|
Asset Allocation Funds |
|||||||
|
UBS Asset Growth Fund |
5 |
||||||
|
UBS Dynamic Alpha Fund |
12 | ||||||
|
UBS Global Allocation Fund |
33 | ||||||
|
UBS Multi-Asset Income Fund |
48 | ||||||
|
Explanation of expense disclosure |
62 | ||||||
|
Statement of assets and liabilities |
66 | ||||||
|
Statement of operations |
70 | ||||||
|
Statement of changes in net assets |
72 | ||||||
|
Financial highlights |
74 | ||||||
|
Notes to financial statements |
82 | ||||||
|
Report of independent registered public accounting firm |
106 | ||||||
|
General information |
107 | ||||||
|
Board approval of investment advisory agreements |
108 | ||||||
|
Trustee and Officer information |
112 | ||||||
|
Federal tax information |
119 | ||||||
This page intentionally left blank.
President's letter
August 14, 2015
Dear Shareholder,
In my last letter, I wrote about the building forward momentum of the US economy against a backdrop of economic weakness outside the United States. Since I last wrote to you, the rise of two economic themes has begun to cast a shadow on the global growth story. The first of these, the continuing Greek debt crisis, appears to be on the road to resolution after an agreement was reached in July between the Greek government and its creditors. Although the risk of Greece's exit from the eurozone is somewhat reduced, substantial political and economic challenges remain. While the news of an agreement has brought relief to global markets, it is disconcerting to consider that the future of the European project has not been in such peril since the introduction of the euro in 1999.
Turning to a development that is decidedly less settled, Chinese equity markets have seen some spectacular declines in recent months, raising questions about the durability of the world's second-largest economy. The Shanghai composite index hit a high of 5,166 on June 12, before falling 30% in just three weeks. Taken together, over $3 trillion of value has been wiped away from the Shanghai and Shenzhen exchanges in a matter of weeks. China's economy grew at its slowest pace since 1990 last year, and early indicators suggest that the economy has weakened further so far into 2015. While investor confidence in China has been understandably shaken, it remains to be seen what effect these headwinds may have outside of the country.
In this global investment landscape of debt crises and shaken confidence, partnering with a knowledgeable asset manager, such as UBS Global Asset Management, can help investors avoid potential pitfalls on the path to reaching their long-term financial goals. As we continue to review the UBS family of funds with an eye toward an ever-changing investment landscape, we remain committed to providing a diverse range of solutions that can be used to create a comprehensive investment plan. Core funds—such as UBS US Large Cap Equity Fund—are the foundation on which many investors build their portfolios. Driven by fundamental research and long-term perspective, these funds used disciplined approaches that time and experience have shown can lead to successful outcomes, despite shorter-term market fluctuations and shocks.
Furthermore, we believe that flexible investment solutions can strengthen an investment plan against market shocks and declines. In this spirit, UBS Global Asset Management provides flexibly managed funds to help create well-balanced, globally diversified portfolios. In our view, flexible funds that may be less correlated to market trends and have multiple sources of revenue are an important component of a comprehensive investment plan. Many of the funds in the UBS family—such as UBS Dynamic Alpha Fund—are designed to achieve consistent returns with less reliance on favorable market conditions. When included in a comprehensive investment plan, these funds act as ballast during volatile market conditions and may have the effect of smoothing a portfolio's performance over time. As we have seen in the first half of 2015, market shocks can take any number of forms and can originate in any corner of the world. In today's market environment, we believe it is crucial that investors diversify their holdings within the context of a carefully considered plan. When combined in the context of such a plan, UBS Global Asset Management's foundational and flexible funds can assist investors in obtaining peace of mind while looking toward the future.
1
President's letter
In my correspondence over the years, I have written at considerable length about the importance of having a sound investment plan. Creating an investment plan with a knowledgeable financial advisor is an opportunity to envision the future that you would like to have, while being cognizant of the potential challenges that lie ahead. At UBS Global Asset Management, we believe that in managing our funds we create more than investment returns: we help our clients achieve their goals. As we continue to evolve our funds to provide stable returns in a variety of market conditions, we rely on our firm's client-oriented culture to guide everything we do. With over 30 years of experience in active investment management, UBS Global Asset Management is ready to serve you with our family of funds and knowledgeable professionals as we look toward the future, a future we create together.
Sincerely,

Mark E. Carver
President
The UBS Funds
Managing Director
UBS Global Asset Management (Americas) Inc.
Mutual funds are sold by prospectus only. You should read it carefully and consider a fund's investment objectives, risks, charges, expenses and other important information contained in the prospectus before investing. A prospectus or summary prospectus for the funds can be obtained from your financial advisor, by calling UBS Funds at 800-647 1568 or by visiting our Web site at www.ubs.com.
2
The markets in review
Global growth generally improves
Growth in the US fluctuated during the reporting period. The US Commerce Department reported that gross domestic product ("GDP") expanded at a 4.3% seasonally adjusted annualized rate during the third quarter of 2014. GDP growth then moderated to 2.1% during the fourth quarter and 0.6% for the first quarter of 2015, partially due to severe winter weather in parts of the country. However, the economy then improved, as the Commerce Department's initial estimate for second quarter GDP was 2.3%.1
The US Federal Reserve Board largely maintained its accommodative monetary policy during the reporting period. The central bank continued to hold the fed funds rate at a historically low range between 0% and 0.25%. (The federal funds rate or the "fed funds rate," is the rate banks charge one another for funds they borrow on an overnight basis.) However, at the Fed's meeting in October 2014, it said that it had concluded its asset purchase program, also known as quantitative easing. At its March 2015 meeting, the Fed said that it "... anticipates that it will be appropriate to raise the target range for the federal funds rate when it has seen further improvement in the labor market and is reasonably confident that inflation will move back to its 2% objective over the medium term." Finally, at the central bank's meeting that concluded in June 2015, the Fed said that it "...currently anticipates that, even after employment and inflation are near mandate-consistent levels, economic conditions may, for some time, warrant keeping the target federal funds rate below levels the Committee views as normal in the longer run."
In terms of the global economy, the International Monetary Fund's ("IMF") July 2015 World Economic Outlook Update, released after the reporting period ended, said "A setback to activity in the first quarter of 2015, mostly in North America, has resulted in a small downward revision to global growth for 2015 relative to the April 2015 World Economic Outlook. Nevertheless, the underlying drivers for a gradual acceleration in economic activity in advanced economies—easy financial conditions, more neutral fiscal policy in the euro area, lower fuel prices, and improving confidence and labor market conditions—remain intact." The IMF projects that 2015 growth in the eurozone will be 1.5%, versus 0.8% in 2014. Japan's economy is expected to expand 0.8% in 2015, an improvement from the 0.1% contraction in 2014. In contrast, the IMF sees growth in emerging market countries decelerating in 2015, with GDP of 4.2% compared to 4.6% in 2014.
US equities post superior results
While it experienced several setbacks, the US equity market generated solid results during the reporting period. Investor sentiment was challenged at times given some mixed global economic data and corporate profit figures, as well as numerous geopolitical issues. All told, the US stock market, as measured by the S&P 500 Index,2 gained 7.42% for the 12 months ended June 30, 2015. In contrast, international equities produced weak results, as they were dragged down by growth concerns, fluctuating oil prices and, most recently, the escalating crisis in Greece. International developed equities, as measured by the MSCI EAFE Index (net),3 fell 4.22% during the period. Emerging market equities, as measured by the MSCI Emerging Markets Index (net),4 declined 5.12% over the same period.
1 Based on the Commerce Department's initial estimate announced on July 30, 2015, after the reporting period had ended.
2 The S&P 500 Index is an unmanaged, weighted index composed of 500 widely held common stocks varying in composition and is not available for direct investment. Investors should note that indices do not reflect the deduction of fees and expenses.
3 The MSCI EAFE Index (net) is an index of stocks designed to measure the investment returns of developed economies outside of North America. Net total return indices reinvest dividends after the deduction of withholding taxes, using a tax rate applicable to non-resident institutional investors who do not benefit from double taxation treaties. The index is constructed and managed with a view to being fully investable from the perspective of international institutional investors. Investors should note that indices do not reflect the deduction of fees and expenses.
4 The MSCI Emerging Markets Index (net) is a market capitalization-weighted index composed of different emerging market countries in Europe, Latin America, and the Pacific Basin. Net total return indices reinvest dividends after the deduction of withholding taxes, using a tax rate applicable to non-resident institutional investors who do not benefit from double taxation treaties. The index is constructed and managed with a view to being fully investable from the perspective of international institutional investors. Investors should note that indices do not reflect the deduction of fees and expenses.
3
The markets in review
Mixed returns in the fixed income market
The global fixed income markets experienced periods of volatility during the reporting period. This was triggered by incoming economic data, uncertainties surrounding future monetary policy and—as was the case for the equity market—unfolding geopolitical events. Against this backdrop, the yield on the 10-year Treasury fell from 2.53% to 2.35% during the reporting period and the overall US bond market, as measured by the Barclays US Aggregate Index,5 gained 1.86%. A sharp sell-off late in the reporting period pushed the returns of riskier fixed income securities into negative territory for the 12 months ended June 30, 2015. High yield bonds, as measured by the BofA Merrill Lynch US High Yield Cash Pay Constrained Index6 declined 0.52% during the reporting period. Emerging markets debt, as measured by the J.P. Morgan Emerging Markets Bond Index Global (EMBI Global),7 fell 1.57%.
5 The Barclays US Aggregate Index is an unmanaged broad based index designed to measure the US dollar-denominated, investment-grade, taxable bond market. The index includes bonds from the Treasury, government-related, corporate, mortgage-backed, asset-backed and commercial mortgage-backed sectors. Investors should note that indices do not reflect the deduction of fees and expenses.
6 The BofA Merrill Lynch US High Yield Cash Pay Constrained Index is an unmanaged index of publicly placed, non-convertible, coupon-bearing US dollar denominated, below investment grade corporate debt with a term to maturity of at least one year. The index is market capitalization weighted, so that larger bond issuers have a greater effect on the index's return. However, the representation of any single bond issuer is restricted to a maximum of 2% of the total index. Investors should note that indices do not reflect the deduction of fees and expenses.
7 The J.P. Morgan Emerging Markets Bond Index Global (EMBI Global) is an unmanaged index which is designed to track total returns for US dollar denominated debt instruments issued by emerging market sovereign and quasi-sovereign entities: Brady bonds, loans and Eurobonds. Investors should note that indices do not reflect the deduction of fees and expenses.
4
UBS Asset Growth Fund
Portfolio performance
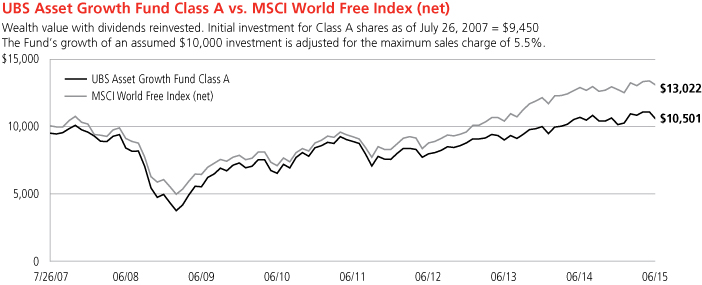
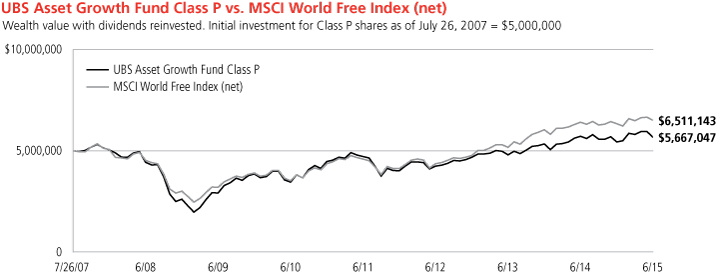
For the 12 months ended June 30, 2015, Class A shares of UBS Asset Growth Fund declined 1.18% (Class A shares fell 6.58% after the deduction of the maximum sales charge), while Class P shares declined 0.96%. The Fund's benchmark, the MSCI World Free Index (net) (the "Index") gained 1.43%. (Class P shares have lower expenses than other share classes of the Fund. Returns for all share classes over various time periods are shown on page 7; please note that these returns do not reflect the deduction of taxes that a shareholder would pay on Fund distributions or the redemption of Fund shares, while the Index returns do not reflect the deduction of fees and expenses.)
The Fund produced a negative return during the reporting period and underperformed the benchmark.
During the reporting period, we used derivatives for risk management purposes and as a tool to help enhance returns across various strategies. With respect to our active currency strategy, the utilization of currency futures had a direct negative impact on Fund performance. Various equity and fixed income futures and exchange traded funds (ETFs) were used to implement our market allocation strategy. Derivatives were just one tool, among others, that we used to implement our market allocation strategy. In aggregate, these derivatives added to performance relative to the benchmark during the reporting period.
Portfolio performance summary1
What worked:
• The Fund's long directional position in certain equity markets generated positive absolute returns.
– The Fund's position in Japanese equities was the biggest contributor to performance. Japan continued to be a top performing equity market, as monetary stimulus by the Bank of Japan has had a positive effect on equity markets.
– The Fund also maintained an overweight position in European equities, which had a strong run of performance following the European Central Bank's decision to enact quantitative easing in January 2015.
What didn't work:
• The Fund's position in fixed income securities was negative for results.
– The Fund held positions in US credit, both investment grade and high yield, which negatively impacted performance. Credit spreads widened during the reporting period, creating negative price action on corporate credit.
• Certain equity positions were negative for performance.
– The Fund was hurt by a long position in emerging market equities which underperformed during the period. Volatility was high, as the Chinese stock market had a significant rally and subsequent fall.
1 For a detailed commentary on the market environment in general during the reporting period, see page 3.
5
UBS Asset Growth Fund
• Leverage detracted from the Fund's performance.
– The Fund maintains a volatility target of 15% or less annually. During the reporting period, both market volatility and Fund-realized volatility remained mostly subdued and, therefore, the Fund maintained leverage throughout the period. However, during October and December 2014, the volatility of the baseline portfolio rose to the point where the amount of leverage being applied to reach the Fund's target volatility of 15% was reduced. The Fund's leverage ranged from the maximum 175% down to 125%. Since the Fund maintained leverage throughout a period where some of its market allocations were negative, leverage detracted from performance.
This letter is intended to assist shareholders in understanding how the Fund performed during the 12 months ended June 30, 2015. The views and opinions in the letter were current as of August 14, 2015. They are not guarantees of future performance or investment results and should not be taken as investment advice. Investment decisions reflect a variety of factors, and we reserve the right to change our views about individual securities, sectors and markets at any time. As a result, the views expressed should not be relied upon as a forecast of the Fund's future investment intent. We encourage you to consult your financial advisor regarding your personal investment program.
Mutual funds are sold by prospectus only. You should read it carefully and consider a fund's investment objectives, risks, charges, expenses and other important information contained in the prospectus before investing. Prospectuses for most of our funds can be obtained from your financial advisor, by calling UBS Funds at 800-647 1568 or by visiting our Web site at www.ubs.com.
6
UBS Asset Growth Fund
Average annual total returns for periods ended 06/30/15 (unaudited)
|
1 year |
5 years |
Inception1 |
|||||||||||||
|
Before deducting maximum sales charge |
|||||||||||||||
|
Class A2 |
(1.18 |
)% |
10.16 |
% |
1.34 |
% |
|||||||||
|
Class C3 |
(1.94 |
) |
9.33 |
0.58 |
|||||||||||
|
Class P4 |
(0.96 |
) |
10.42 |
1.59 |
|||||||||||
|
After deducting maximum sales charge |
|||||||||||||||
|
Class A2 |
(6.58 |
)% |
8.91 |
% |
0.62 |
% |
|||||||||
|
Class C3 |
(2.92 |
) |
9.33 |
0.58 |
|||||||||||
|
MSCI World Free Index (net)5 |
1.43 |
% |
13.10 |
% |
3.39 |
% |
|||||||||
The annualized gross and net expense ratios, respectively, for each class of shares as in the October 28, 2014 prospectuses were as follows: Class A—2.36% and 1.57%; Class C—3.13% and 2.32%; Class P—2.11% and 1.32%. Net expenses reflect fee waivers and/or expense reimbursements, if any, pursuant to an agreement that is in effect to cap the expenses. The Trust, with respect to the Fund, and UBS Global Asset Management (Americas) Inc., the Fund's investment advisor ("UBS Global AM (Americas)" or the "Advisor"), have entered into a written agreement pursuant to which the Advisor has agreed to waive a portion of its management fees and/or to reimburse expenses (excluding expenses incurred through investment in other investment companies, interest, taxes, brokerage commissions, extraordinary expenses, and dividend expense and security loan fees for securities sold short) to the extent necessary so that the Fund's ordinary operating expenses (excluding expenses incurred through investment in other investment companies, interest, taxes, brokerage commissions, extraordinary expenses, and dividend expense and security loan fees for securities sold short), through the period ending October 27, 2015, do not exceed 1.40% for Class A shares, 2.15% for Class C shares and 1.15% for Class P shares. Pursuant to the written agreement, the Advisor is entitled to be reimbursed for any fees it waives and expenses it reimburses for a period of three years following such fee waivers and expense reimbursements to the extent that such reimbursement of the Advisor by the Fund will not cause the Fund to exceed any applicable expense limit that is in place for the Fund. The fee waiver/expense reimbursement agreement may be terminated by the Fund's Board of Trustees at any time and also will terminate automatically upon the expiration or termination of the Fund's advisory contract with the Advisor. Upon termination of the fee waiver/expense reimbursement agreement, however, UBS Global AM (Americas)'s three year recoupment rights will survive.
1 Inception date of all share classes of UBS Asset Growth Fund and the index is July 26, 2007.
2 Maximum sales charge for Class A shares is 5.5%. Class A shares bear ongoing 12b-1 service fees.
3 Maximum contingent deferred sales charge for Class C shares is 1% imposed on redemptions and is reduced to 0% after one year. Class C shares bear ongoing 12b-1 distribution and service fees.
4 Class P shares do not bear initial or contingent deferred sales charges or ongoing 12b-1 service and distribution fees, but Class P shares held through advisory programs may be subject to a program fee, which, if included, would have reduced performance.
5 The MSCI World Free Index (net) is a free float-adjusted market capitalization weighted index that is designed to measure the equity market performance of developed markets. Net total return indices reinvest dividends after the deduction of withholding taxes, using a tax rate applicable to non-resident institutional investors who do not benefit from double taxation treaties. The index is constructed and managed with a view to being fully investable from the perspective of international institutional investors. Investors should note that indices do not reflect the deduction of fees and expenses.
Prior to February 17, 2015, if an investor sold or exchanged shares less than 90 days after purchase, a redemption fee of 1.00% of the amount sold or exchanged was deducted at the time of the transaction, except as noted otherwise in the prospectus. For sales or exchanges taking place on or after February 17, 2015 but prior to August 3, 2015, there is a reduction in the redemption holding period from 90 days to 30 days. Effective August 3, 2015, the 1.00% redemption fee imposed on sales or exchanges of any class of shares of the funds made during the holding periods specified in the prospectus will be eliminated. Please refer to the prospectus for further information.
Past performance does not predict future performance, and the performance information provided does not reflect the deduction of taxes that a shareholder would pay on Fund distributions or the redemption of Fund shares. The return and principal value of an investment will fluctuate, so that an investor's shares, when redeemed, may be worth more or less than their original cost. Performance results assume reinvestment of all dividends and capital gain distributions at net asset value on the ex-dividend dates. Current performance may be higher or lower than the performance data quoted. For month-end performance figures, please visit http://globalam-us.ubs.com/corpweb/performance.do.
7
UBS Asset Growth Fund
Illustration of an assumed investment of $10,000 in Class A shares (adjusted for 5.5% maximum sales charge) and $5,000,000 in Class P shares (unaudited)
The following two graphs depict the performance of UBS Asset Growth Fund Class A and Class P shares versus the MSCI World Free Index (net) from July 26, 2007, which is the inception date of the two classes, through June 30, 2015. The performance of Class C shares will vary based upon the different class specific expenses and sales charges. The performance provided does not reflect the deduction of taxes that a shareholder would pay on Fund distributions or the redemption of Fund shares. Past performance is no guarantee of future results. Share price and returns will vary with market conditions; investors may realize a gain or loss upon redemption.
Past performance does not predict future performance, and the performance information provided does not reflect the deduction of taxes that a shareholder would pay on Fund distributions or the redemption of Fund shares. The return and principal value of an investment will fluctuate, so that an investor's shares, when redeemed, may be worth more or less than their original cost. Performance results assume reinvestment of all dividends and capital gain distributions at net asset value on the ex-dividend dates. Current performance may be higher or lower than the performance data quoted. For month-end performance figures, please visit http://globalam-us.ubs.com/corpweb/performance.do.
8
UBS Asset Growth Fund
Industry diversification (unaudited)1
As a percentage of net assets as of June 30, 2015
|
Investment companies |
|||||||
|
iShares Emerging Markets Local Currency Bond ETF |
1.70 |
% |
|||||
|
iShares iBoxx $ High Yield Corporate Bond ETF |
14.52 |
||||||
|
iShares iBoxx $ Investment Grade Corporate Bond ETF |
12.98 |
||||||
|
iShares JP Morgan USD Emerging Markets Bond ETF |
1.74 |
||||||
|
iShares MSCI Switzerland Capped ETF |
4.28 |
||||||
|
iShares TIPS Bond ETF |
11.54 |
||||||
|
SPDR Barclays Convertible Securities ETF |
3.52 |
||||||
|
Total investment companies |
50.28 |
% |
|||||
|
Short-term investment |
34.82 |
||||||
|
Investment of cash collateral from securities loaned |
18.82 |
||||||
|
Total investments |
103.92 |
% |
|||||
|
Liabilities, in excess of cash and other assets |
(3.92 |
) |
|||||
|
Net assets |
100.00 |
% |
|||||
1 Figures represent the direct investments of UBS Asset Growth Fund. Figures may be different if a breakdown of the underlying investment companies was included.
9
UBS Asset Growth Fund
Portfolio of investments
June 30, 2015
|
Shares |
Value |
||||||||||
|
Investment companies: 50.28% |
|||||||||||
|
iShares Emerging Markets Local Currency Bond ETF |
9,937 |
$ |
434,247 |
||||||||
|
iShares iBoxx $ High Yield Corporate Bond ETF1 |
41,854 |
3,716,635 |
|||||||||
|
iShares iBoxx $ Investment Grade Corporate Bond ETF |
28,714 |
3,322,784 |
|||||||||
|
iShares JP Morgan USD Emerging Markets Bond ETF1 |
4,046 |
444,736 |
|||||||||
|
iShares MSCI Switzerland Capped ETF |
33,455 |
1,095,651 |
|||||||||
|
iShares TIPS Bond ETF |
26,361 |
2,953,750 |
|||||||||
|
SPDR Barclays Convertible Securities ETF |
18,920 |
900,025 |
|||||||||
|
Total investment companies (cost $13,132,577) |
12,867,828 |
||||||||||
|
Short-term investment: 34.82% |
|||||||||||
|
Investment company: 34.82% |
|||||||||||
|
UBS Cash Management Prime Relationship Fund2 (cost $8,911,211) |
8,911,211 |
8,911,211 |
|||||||||
|
Shares |
Value |
||||||||||
|
Investment of cash collateral from securities loaned: 18.82% |
|||||||||||
|
UBS Private Money Market Fund LLC2 (cost $4,817,108) |
4,817,108 |
$ |
4,817,108 |
||||||||
|
Total investments: 103.92% (cost $26,860,896) |
26,596,147 |
||||||||||
|
Liabilities, in excess of cash and other assets: (3.92)% |
(1,002,548 |
) |
|||||||||
|
Net assets: 100.00% |
$ |
25,593,599 |
|||||||||
Notes to portfolio of investments
Aggregate cost for federal income tax purposes was $27,021,203; and net unrealized depreciation consisted of:
|
Gross unrealized appreciation |
$ |
6,973 |
|||||
|
Gross unrealized depreciation |
(432,029 |
) |
|||||
|
Net unrealized depreciation of investments |
$ |
(425,056 |
) |
||||
For a listing of defined portfolio acronyms, counterparty abbreviations and currency abbreviations that are used throughout the Portfolio of investments as well as the tables that follow, please refer to page 61. Portfolio footnotes begin on page 11.
Futures contracts
|
Expiration date |
Cost/ (proceeds) |
Value |
Unrealized appreciation/ (depreciation) |
||||||||||||||||
|
Index futures buy contracts: |
|||||||||||||||||||
|
E-mini S&P 500 Index, 58 contracts (USD) |
September 2015 |
$ |
6,019,370 |
$ |
5,957,760 |
$ |
(61,610 |
) |
|||||||||||
|
EURO STOXX 50 Index, 134 contracts (EUR) |
September 2015 |
5,163,374 |
5,133,037 |
(30,337 |
) |
||||||||||||||
|
FTSE 100 Index, 39 contracts (GBP) |
September 2015 |
4,091,420 |
3,979,442 |
(111,978 |
) |
||||||||||||||
|
Mini MSCI Emerging Markets Index, 94 contracts (USD) |
September 2015 |
4,496,302 |
4,509,180 |
12,878 |
|||||||||||||||
|
SPI 200 Index, 20 contracts (AUD) |
September 2015 |
2,124,614 |
2,082,028 |
(42,586 |
) |
||||||||||||||
|
TOPIX Index, 27 contracts (JPY) |
September 2015 |
3,642,568 |
3,597,132 |
(45,436 |
) |
||||||||||||||
|
Currency futures buy contracts: |
|||||||||||||||||||
|
Australian Dollar, 7 contracts (USD) |
September 2015 |
539,852 |
537,950 |
(1,902 |
) |
||||||||||||||
|
Euro, 9 contracts (USD) |
September 2015 |
1,268,791 |
1,255,050 |
(13,741 |
) |
||||||||||||||
|
Great Britain Pound, 16 contracts (USD) |
September 2015 |
1,550,828 |
1,572,500 |
21,672 |
|||||||||||||||
|
Japanese Yen, 5 contracts (USD) |
September 2015 |
507,071 |
511,406 |
4,335 |
|||||||||||||||
|
Currency futures sell contracts: |
|||||||||||||||||||
|
Swiss Franc, 6 contracts (USD) |
September 2015 |
(805,639 |
) |
(804,150 |
) |
1,489 |
|||||||||||||
|
Net unrealized depreciation on futures contracts |
$ |
(267,216 |
) |
||||||||||||||||
10
UBS Asset Growth Fund
Portfolio of investments
June 30, 2015
The following is a summary of the fair valuations according to the inputs used as of June 30, 2015 in valuing the Fund's investments:
|
Description |
Unadjusted quoted prices in active markets for identical investments (Level 1) |
Other significant observable inputs (Level 2) |
Unobservable inputs (Level 3) |
Total |
|||||||||||||||
|
Assets |
|||||||||||||||||||
|
Investment companies |
$ |
12,867,828 |
$ |
— |
$ |
— |
$ |
12,867,828 |
|||||||||||
|
Short-term investment |
— |
8,911,211 |
— |
8,911,211 |
|||||||||||||||
|
Investment of cash collateral from securities loaned |
— |
4,817,108 |
— |
4,817,108 |
|||||||||||||||
|
Futures contracts |
40,374 |
— |
— |
40,374 |
|||||||||||||||
|
Total |
$ |
12,908,202 |
$ |
13,728,319 |
$ |
— |
$ |
26,636,521 |
|||||||||||
|
Liabilities |
|||||||||||||||||||
|
Futures contracts |
$ |
(307,590 |
) |
$ |
— |
$ |
— |
$ |
(307,590 |
) |
|||||||||
At June 30, 2015, there were no transfers between Level 1 and Level 2.
Portfolio footnotes
1 Security, or portion thereof, was on loan at June 30, 2015.
2 The table below details the Fund's investments in funds advised by the same Advisor as the Fund. The Advisor does not earn a management fee from the affiliated UBS Relationship Fund.
|
Security description |
Value 06/30/14 |
Purchases during the year ended 06/30/15 |
Sales during the year ended 06/30/15 |
Value 06/30/15 |
Net income earned from affiliate for the year ended 06/30/15 |
||||||||||||||||||
|
UBS Cash Management Prime Relationship Fund |
$ |
7,680,934 |
$ |
47,399,640 |
$ |
46,169,363 |
$ |
8,911,211 |
$ |
8,112 |
|||||||||||||
|
UBS Private Money Market Fund LLCa |
7,801,795 |
65,294,817 |
68,279,504 |
4,817,108 |
319 |
||||||||||||||||||
|
$ |
15,482,729 |
$ |
112,694,457 |
$ |
114,448,867 |
$ |
13,728,319 |
$ |
8,431 |
||||||||||||||
a The Advisor earns a management fee from this affiliated fund. Please see the Notes to financial statements for further information.
See accompanying notes to financial statements.
11
UBS Dynamic Alpha Fund
Portfolio performance
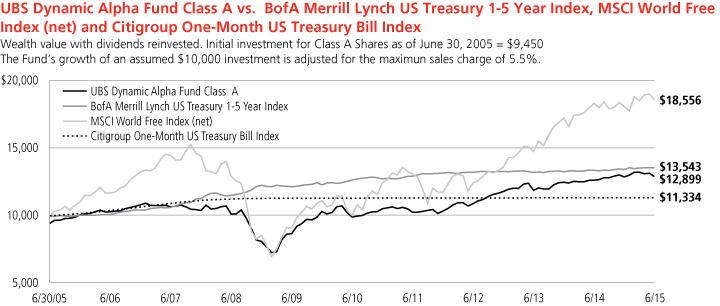
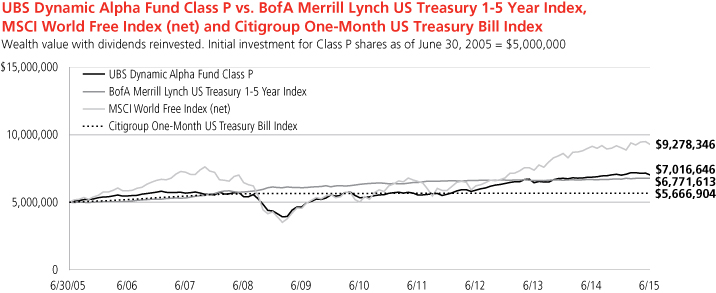
For the 12 months ended June 30, 2015, Class A shares of UBS Dynamic Alpha Fund (the "Fund") gained 2.03% (Class A shares declined 3.56% after the deduction of the maximum sales charge), while Class P shares rose 2.29%. For purposes of comparison, the BofA Merrill Lynch US Treasury 1-5 Year Index returned 1.38% during the same time period, the MSCI World Free Index (net) gained 1.43%, and the Citigroup One-Month US Treasury Bill Index returned 0.02%. (Class P shares have lower expenses than other share classes of the Fund. Returns for all share classes over various time periods are shown on page 14; please note that these returns do not reflect the deduction of taxes that a shareholder would pay on Fund distributions or the redemption of Fund shares, while the Index returns do not reflect the deduction of fees and expenses.)
The Fund produced a positive absolute return during the reporting period. Performance was due to asset allocation and currency decisions.
During the reporting period, we used derivatives for risk management purposes and as a tool to help enhance returns across various strategies. With respect to our active currency strategy, utilizing currency forwards had a direct positive impact on Fund performance. We used a variety of equity and fixed income options, futures and swaps to implement our market allocation strategy. Derivatives were just one tool, among others, that we used to implement our market allocation strategy. These derivatives, in aggregate, contributed to performance during the reporting period.
Portfolio performance summary1
What worked:
• Overall, the Fund's positions in equities were the biggest drivers of returns during the reporting period.
– Net long positions in developed-market equities were additive for results. Strong performance was achieved from the Fund's long position in Japanese equities, which rallied on the back of monetary stimulus. A long position in European equities was also beneficial. They generated strong performance following the European Central Bank's decision to enact quantitative easing.
– The Fund's positioning within Chinese equities was beneficial to performance. The Fund took advantage of mispricing in the China A-share market and China H-share market through the use of futures.
• Certain fixed income positions added value over the reporting period.
– The Fund held a long position in Australian government bonds, which added significant value, as the Reserve Bank of Australia cut interest rates in early 2015.
– The Fund's relative value trade of long German government bonds versus French government bonds added value, as the spread between these two sovereigns widened.
• Overall, the Fund's active currency strategy added to performance.
– The Fund's short position in commodity currencies such as the New Zealand dollar and Australian dollar relative to the US dollar were the biggest contributors to currency results, as commodity prices declined during the reporting period.
– The Fund's trade of long Mexican peso versus Canadian dollar added to performance.
1 For a detailed commentary on the market environment in general during the reporting period, see page 3.
12
UBS Dynamic Alpha Fund
What didn't work:
• Certain equity positions were negative during the reporting period.
– The Fund's pair trade of long US industrials versus US consumer staples was a headwind for results. Historically, consumer staples have underperformed industrials during the growth phase of the business cycle, but this did not occur as expected during the reporting period.
– The Fund's positioning in emerging market equities was negative for performance. While there appears to be a general weakness in the broad emerging market, strong returns in December, January and February did not favor our short emerging market position.
• Overall, the Fund's fixed income positioning was slightly negative for results.
– The Fund's position in emerging market debt was the biggest detractor from performance, as concerns grew over the falling price of oil.
– The Fund was hurt by its positioning in US government bonds, particularly since the Fund was positioned for a flattening of the US yield curve, which did not occur.
• Several currency trades performed poorly.
– The Fund's trade of long Japanese yen versus the US dollar and euro detracted from performance over the reporting period, as the yen significantly depreciated due to the Bank of Japan's actions during the reporting period.
– The position of long Mexican peso versus Malaysian ringgit was negative for performance, as the peso depreciated, primarily due to falling oil prices.
This letter is intended to assist shareholders in understanding how the Fund performed during the 12 months ended June 30, 2015. The views and opinions in the letter were current as of August 14, 2015. They are not guarantees of future performance or investment results and should not be taken as investment advice. Investment decisions reflect a variety of factors, and we reserve the right to change our views about individual securities, sectors and markets at any time. As a result, the views expressed should not be relied upon as a forecast of the Fund's future investment intent. We encourage you to consult your financial advisor regarding your personal investment program.
Mutual funds are sold by prospectus only. You should read it carefully and consider a fund's investment objectives, risks, charges, expenses and other important information contained in the prospectus before investing. Prospectuses for most of our funds can be obtained from your financial advisor, by calling UBS Funds at 800-647 1568 or by visiting our Web site at www.ubs.com.
13
UBS Dynamic Alpha Fund
Average annual total returns for periods ended 06/30/15 (unaudited)
|
1 year |
5 years |
10 years |
|||||||||||||
|
Before deducting maximum sales charge |
|||||||||||||||
|
Class A1 |
2.03 |
% |
5.40 |
% |
3.16 |
% |
|||||||||
|
Class C2 |
1.21 |
4.63 |
2.37 |
||||||||||||
|
Class P3 |
2.29 |
5.67 |
3.45 |
||||||||||||
|
After deducting maximum sales charge |
|||||||||||||||
|
Class A1 |
(3.56 |
)% |
4.20 |
% |
2.58 |
% |
|||||||||
|
Class C2 |
0.23 |
4.63 |
2.37 |
||||||||||||
|
BofA Merrill Lynch US Treasury 1-5 Year Index4 |
1.38 |
% |
1.37 |
% |
3.08 |
% |
|||||||||
|
MSCI World Free Index (net)5 |
1.43 |
13.10 |
6.38 |
||||||||||||
|
Citigroup One-Month US Treasury Bill Index6 |
0.02 |
0.05 |
1.26 |
||||||||||||
The annualized gross and net expense ratios, respectively, for each class of shares as in the October 28, 2014 prospectuses were as follows: Class A—1.42% and 1.35%; Class C—2.18% and 2.10%; Class P—1.15% and 1.10%. Net expenses reflect fee waivers and/or expense reimbursements, if any, pursuant to an agreement that is in effect to cap the expenses. The Trust, with respect to the Fund, and UBS Global Asset Management (Americas) Inc., the Fund's investment advisor ("UBS Global AM (Americas)" or the "Advisor"), have entered into a written agreement pursuant to which the Advisor has agreed to waive a portion of its management fees and/or to reimburse expenses (excluding expenses incurred through investment in other investment companies, interest, taxes, brokerage commissions, extraordinary expenses, and dividend expense and security loan fees for securities sold short) to the extent necessary so that the Fund's ordinary operating expenses (excluding expenses incurred through investment in other investment companies, interest, taxes, brokerage commissions, extraordinary expenses, and dividend expense and security loan fees for securities sold short), through the period ending October 27, 2015, do not exceed 1.35% for Class A shares, 2.10% for Class C shares and 1.10% for Class P shares. Pursuant to the written agreement, the Advisor is entitled to be reimbursed for any fees it waives and expenses it reimburses for a period of three years following such fee waivers and expense reimbursements to the extent that such reimbursement of the Advisor by the Fund will not cause the Fund to exceed any applicable expense limit that is in place for the Fund. The fee waiver/expense reimbursement agreement may be terminated by the Fund's Board of Trustees at any time and also will terminate automatically upon the expiration or termination of the Fund's advisory contract with the Advisor. Upon termination of the fee waiver/expense reimbursement agreement, however, UBS Global AM (Americas)'s three year recoupment rights will survive.
1 Maximum sales charge for Class A shares is 5.5%. Class A shares bear ongoing 12b-1 service fees.
2 Maximum contingent deferred sales charge for Class C shares is 1% imposed on redemptions and is reduced to 0% after one year. Class C shares bear ongoing 12b-1 distribution and service fees.
3 Class P shares do not bear initial or contingent deferred sales charges or ongoing 12b-1 service and distribution fees, but Class P shares held through advisory programs may be subject to a program fee, which, if included, would have reduced performance.
4 The BofA Merrill Lynch US Treasury 1-5 Year Index is an unmanaged index designed to track US Treasury securities with maturities between 1 and 5 years. Investors should note that indices do not reflect the deduction of fees and expenses.
5 The MSCI World Free Index (net) is a free float-adjusted market capitalization weighted index that is designed to measure the equity market performance of developed markets. Net total return indices reinvest dividends after the deduction of withholding taxes, using a tax rate applicable to non-resident institutional investors who do not benefit from double taxation treaties. The index is constructed and managed with a view to being fully investable from the perspective of international institutional investors. Investors should note that indices do not reflect the deduction of fees and expenses.
6 The Citigroup One-Month US Treasury Bill Index is an unmanaged index representing monthly return equivalents of yield averages of the last one month Treasury Bill issue. Investors should note that indices do not reflect the deduction of fees and expenses.
Prior to February 17, 2015, if an investor sold or exchanged shares less than 90 days after purchase, a redemption fee of 1.00% of the amount sold or exchanged was deducted at the time of the transaction, except as noted otherwise in the prospectus. For sales or exchanges taking place on or after February 17, 2015 but prior to August 3, 2015, there is a reduction in the redemption holding period from 90 days to 30 days. Effective August 3, 2015, the 1.00% redemption fee imposed on sales or exchanges of any class of shares of the funds made during the holding periods specified in the prospectus will be eliminated. Please refer to the prospectus for further information.
Past performance does not predict future performance, and the performance information provided does not reflect the deduction of taxes that a shareholder would pay on Fund distributions or the redemption of Fund shares. The return and principal value of an investment will fluctuate, so that an investor's shares, when redeemed, may be worth more or less than their original cost. Performance results assume reinvestment of all dividends and capital gain distributions at net asset value on the ex-dividend dates. Current performance may be higher or lower than the performance data quoted. For month-end performance figures, please visit http://globalam-us.ubs.com/corpweb/performance.do.
14
UBS Dynamic Alpha Fund
Illustration of an assumed investment of $10,000 in Class A shares (adjusted for 5.5% maximum sales charge) and $5,000,000 in Class P shares (unaudited)
The following two graphs depict the performance of UBS Dynamic Alpha Fund Class A and Class P shares versus the BofA Merrill Lynch US Treasury 1-5 Year Index, the MSCI World Free Index (net) and the Citigroup One-Month US Treasury Bill Index over the 10 years ended June 30, 2015. The performance of Class C shares will vary based upon the different class specific expenses and sales charges. The performance provided does not reflect the deduction of taxes that a shareholder would pay on Fund distributions or the redemption of Fund shares. Past performance is no guarantee of future results. Share price and returns will vary with market conditions; investors may realize a gain or loss upon redemption.
Past performance does not predict future performance, and the performance information provided does not reflect the deduction of taxes that a shareholder would pay on Fund distributions or the redemption of Fund shares. The return and principal value of an investment will fluctuate, so that an investor's shares, when redeemed, may be worth more or less than their original cost. Performance results assume reinvestment of all dividends and capital gain distributions at net asset value on the ex-dividend dates. Current performance may be higher or lower than the performance data quoted. For month-end performance figures, please visit http://globalam-us.ubs.com/corpweb/performance.do.
15
UBS Dynamic Alpha Fund
Top ten long-term fixed income holdings (unaudited)
As of June 30, 2015
|
Percentage of net assets |
|||||||
|
Government of Australia, 4.500%, due 04/15/20 |
1.9 |
% |
|||||
|
Government of Australia, 4.250%, due 07/21/17 |
1.8 |
||||||
|
Government of Australia, 4.750%, due 06/15/16 |
1.6 |
||||||
|
JPMorgan Chase & Co., 3.200%, due 01/25/23 |
0.8 |
||||||
|
Bank of America Corp., 1.875%, due 01/10/19 |
0.5 |
||||||
|
General Electric Capital Corp., Series A, 6.750%, due 03/15/32 |
0.5 |
||||||
|
Buoni Poliennali Del Tesoro, 4.500%, due 07/15/15 |
0.5 |
||||||
|
Morgan Stanley, 2.375%, due 07/23/19 |
0.5 |
||||||
|
Wachovia Corp., 5.750%, due 02/01/18 |
0.5 |
||||||
|
Goldman Sachs Group, Inc., 1.375%, due 07/26/22 |
0.5 |
||||||
|
Total |
9.1 |
% |
|||||
Country exposure by issuer, top five (unaudited)
As of June 30, 2015
|
Percentage of net assets |
|||||||
|
United States |
26.6 |
% |
|||||
|
Australia |
8.7 |
||||||
|
United Kingdom |
7.6 |
||||||
|
Netherlands |
4.8 |
||||||
|
France |
2.0 |
||||||
|
Total |
49.7 |
% |
|||||
16
UBS Dynamic Alpha Fund
Industry diversification (unaudited)
As a percentage of net assets as of June 30, 2015
|
Bonds |
|||||||
|
Corporate bonds |
|||||||
|
Aerospace & defense |
0.10 |
% |
|||||
|
Airlines |
0.23 |
||||||
|
Auto components |
0.05 |
||||||
|
Automobiles |
0.14 |
||||||
|
Banks |
11.66 |
||||||
|
Beverages |
1.41 |
||||||
|
Biotechnology |
0.20 |
||||||
|
Capital markets |
2.20 |
||||||
|
Chemicals |
0.77 |
||||||
|
Commercial services & supplies |
0.53 |
||||||
|
Communications equipment |
0.26 |
||||||
|
Construction & engineering |
0.54 |
||||||
|
Consumer finance |
1.59 |
||||||
|
Diversified financial services |
2.48 |
||||||
|
Diversified telecommunication services |
2.67 |
||||||
|
Electric utilities |
3.09 |
||||||
|
Energy equipment & services |
0.57 |
||||||
|
Food & staples retailing |
0.25 |
||||||
|
Food products |
0.98 |
||||||
|
Gas utilities |
1.01 |
||||||
|
Health care equipment & supplies |
0.48 |
||||||
|
Health care providers & services |
0.52 |
||||||
|
Hotels, restaurants & leisure |
0.12 |
||||||
|
Household durables |
0.10 |
||||||
|
Independent power and renewable electricity producers |
0.27 |
||||||
|
Industrial conglomerates |
0.34 |
||||||
|
Insurance |
5.98 |
||||||
|
Internet & catalog retail |
0.29 |
||||||
|
Internet software & services |
0.14 |
||||||
|
IT services |
0.17 |
||||||
|
Life sciences tools & services |
0.10 |
||||||
|
Machinery |
0.18 |
||||||
|
Marine |
0.24 |
||||||
|
Media |
2.09 |
||||||
|
Metals & mining |
0.97 |
||||||
|
Multi-utilities |
0.75 |
||||||
|
Oil, gas & consumable fuels |
7.17 |
||||||
|
Pharmaceuticals |
1.28 |
||||||
|
Real estate investment trust (REIT) |
0.29 |
||||||
|
Real estate management & development |
0.10 |
||||||
|
Road & rail |
0.66 |
||||||
|
Software |
0.30 |
||||||
|
Specialty retail |
0.29 |
||||||
|
Textiles, apparel & luxury goods |
0.07 |
||||||
|
Thrifts & mortgage finance |
0.15 |
||||||
|
Tobacco |
1.27 |
||||||
|
Transportation infrastructure |
0.89 |
||||||
|
Water utilities |
0.56 |
||||||
|
Wireless telecommunication services |
0.92 |
||||||
|
Total corporate bonds |
57.42 |
% |
|||||
|
Collateralized debt obligation |
0.00 |
%1 |
|||||
|
Mortgage & agency debt security |
0.01 |
||||||
|
Non-US government obligations |
5.77 |
||||||
|
Supranational bonds |
0.42 |
||||||
|
Total bonds |
63.62 |
% |
|||||
|
Short-term investments |
23.35 |
||||||
|
Options purchased |
0.87 |
||||||
|
Investment of cash collateral from securities loaned |
0.48 |
||||||
|
Total investments |
88.32 |
% |
|||||
|
Cash and other assets, less liabilities |
11.68 |
||||||
|
Net assets |
100.00 |
% |
|||||
1 Amount represents less than 0.005%.
17
UBS Dynamic Alpha Fund
Portfolio of investments
June 30, 2015
|
Face amount |
Value |
||||||||||
|
Bonds: 63.62% |
|||||||||||
|
Corporate bonds: 57.42% |
|||||||||||
|
Australia: 3.39% |
|||||||||||
|
Adani Abbot Point Terminal Pty Ltd., 5.750%, due 11/01/18 |
AUD |
1,025,000 |
$ |
808,145 |
|||||||
|
APT Pipelines Ltd., 4.200%, due 03/23/251 |
$ |
910,000 |
889,955 |
||||||||
|
Aurizon Network Pty Ltd., 2.000%, due 09/18/24 |
EUR |
500,000 |
543,913 |
||||||||
|
Australia & New Zealand Banking Group Ltd., 4.500%, due 03/19/242 |
$ |
250,000 |
251,391 |
||||||||
|
Australia Pacific Airports Melbourne Pty Ltd., 1.750%, due 10/15/24 |
EUR |
450,000 |
497,044 |
||||||||
|
BHP Billiton Finance USA Ltd., 5.000%, due 09/30/43 |
$ |
290,000 |
301,030 |
||||||||
|
Commonwealth Bank of Australia, 1.125%, due 03/13/17 |
370,000 |
370,278 |
|||||||||
|
2.250%, due 03/16/171 |
630,000 |
643,538 |
|||||||||
|
2.250%, due 03/16/172 |
250,000 |
255,373 |
|||||||||
|
National Australia Bank Ltd., 2.000%, due 11/12/243 |
EUR |
550,000 |
607,391 |
||||||||
|
2.750%, due 03/09/17 |
$ |
650,000 |
668,327 |
||||||||
|
Origin Energy Finance Ltd., 2.500%, due 10/23/202 |
EUR |
775,000 |
892,041 |
||||||||
|
5.450%, due 10/14/212 |
$ |
345,000 |
372,490 |
||||||||
|
QBE Insurance Group Ltd., 2.400%, due 05/01/182 |
405,000 |
407,242 |
|||||||||
|
6.750%, due 12/02/443 |
795,000 |
834,750 |
|||||||||
|
Santos Finance Ltd., 8.250%, due 09/22/703 |
EUR |
380,000 |
458,594 |
||||||||
|
Scentre Group Trust 1, 1.500%, due 07/16/20 |
250,000 |
283,036 |
|||||||||
|
SGSP Australia Assets Pty Ltd., 2.000%, due 06/30/22 |
350,000 |
396,486 |
|||||||||
|
Suncorp-Metway Ltd., 1.700%, due 03/28/172 |
$ |
440,000 |
443,371 |
||||||||
|
Telstra Corp. Ltd., 4.800%, due 10/12/211 |
200,000 |
223,924 |
|||||||||
|
4.800%, due 10/12/212 |
350,000 |
391,866 |
|||||||||
|
Transurban Finance Co. Pty Ltd., 1.875%, due 09/16/24 |
EUR |
300,000 |
329,310 |
||||||||
|
2.500%, due 10/08/20 |
210,000 |
248,013 |
|||||||||
|
Total Australia corporate bonds |
11,117,508 |
||||||||||
|
Belgium: 0.35% |
|||||||||||
|
AG Insurance SA, 3.500%, due 06/30/473 |
900,000 |
897,438 |
|||||||||
|
Elia System Operator SA, 3.250%, due 04/04/282 |
200,000 |
253,411 |
|||||||||
|
Total Belgium corporate bonds |
1,150,849 |
||||||||||
|
Face amount |
Value |
||||||||||
|
Bermuda: 0.17% |
|||||||||||
|
Bacardi Ltd., 2.750%, due 07/03/232 |
EUR |
470,000 |
$ |
558,371 |
|||||||
|
Brazil: 0.56% |
|||||||||||
|
BRF SA, 2.750%, due 06/03/221 |
210,000 |
227,973 |
|||||||||
|
Petrobras Global Finance BV, 3.250%, due 04/01/192 |
610,000 |
644,053 |
|||||||||
|
3.875%, due 01/27/16 |
$ |
440,000 |
441,892 |
||||||||
|
Vale SA, 5.625%, due 09/11/42 |
640,000 |
538,739 |
|||||||||
|
Total Brazil corporate bonds |
1,852,657 |
||||||||||
|
Canada: 1.90% |
|||||||||||
|
Bank of Montreal, 6.020%, due 05/02/18 |
CAD |
470,000 |
424,445 |
||||||||
|
Bank of Nova Scotia, 4.100%, due 06/08/17 |
695,000 |
586,499 |
|||||||||
|
Canadian Imperial Bank of Commerce, 1.350%, due 07/18/16 |
$ |
445,000 |
447,587 |
||||||||
|
3.400%, due 01/14/16 |
CAD |
515,000 |
417,570 |
||||||||
|
Canadian Natural Resources Ltd., 3.900%, due 02/01/25 |
$ |
320,000 |
316,179 |
||||||||
|
Hydro One, Inc., 5.360%, due 05/20/36 |
CAD |
335,000 |
325,521 |
||||||||
|
Nexen Energy ULC, 6.400%, due 05/15/37 |
$ |
500,000 |
596,518 |
||||||||
|
Royal Bank of Canada, 2.980%, due 05/07/19 |
CAD |
475,000 |
400,430 |
||||||||
|
Suncor Energy, Inc., 6.500%, due 06/15/38 |
$ |
515,000 |
627,480 |
||||||||
|
Talisman Energy, Inc., 3.750%, due 02/01/21 |
480,000 |
475,189 |
|||||||||
|
TELUS Corp., 3.750%, due 01/17/25 |
CAD |
165,000 |
135,535 |
||||||||
|
Thomson Reuters Corp., 1.300%, due 02/23/17 |
$ |
480,000 |
478,883 |
||||||||
|
Toronto-Dominion Bank, 3.367%, due 11/02/203 |
CAD |
660,000 |
531,826 |
||||||||
|
Yamana Gold, Inc., 4.950%, due 07/15/24 |
$ |
470,000 |
452,719 |
||||||||
|
Total Canada corporate bonds |
6,216,381 |
||||||||||
|
Cayman Islands: 0.82% |
|||||||||||
|
Hutchison Whampoa International 09 Ltd., 7.625%, due 04/09/191 |
300,000 |
355,038 |
|||||||||
|
7.625%, due 04/09/192 |
125,000 |
147,933 |
|||||||||
|
Noble Holding International Ltd., 5.950%, due 04/01/25 |
245,000 |
241,564 |
|||||||||
18
UBS Dynamic Alpha Fund
Portfolio of investments
June 30, 2015
|
Face amount |
Value |
||||||||||
|
Bonds—(Continued) |
|||||||||||
|
Corporate bonds—(Continued) |
|||||||||||
|
Cayman Islands—(Concluded) |
|||||||||||
|
Principal Financial Global Funding II LLC, 4.500%, due 01/26/17 |
EUR |
650,000 |
$ |
769,530 |
|||||||
|
Tencent Holdings Ltd., 3.375%, due 05/02/191 |
$ |
450,000 |
461,340 |
||||||||
|
Thames Water Utilities Cayman Finance Ltd., 5.375%, due 07/21/253 |
GBP |
190,000 |
316,447 |
||||||||
|
Yorkshire Water Services Bradford Finance Ltd., 6.000%, due 04/24/253 |
230,000 |
385,798 |
|||||||||
|
Total Cayman Islands corporate bonds |
2,677,650 |
||||||||||
|
China: 0.44% |
|||||||||||
|
AIA Group Ltd., 1.750%, due 03/13/182 |
$ |
760,000 |
752,536 |
||||||||
|
2.250%, due 03/11/191 |
275,000 |
272,993 |
|||||||||
|
Bank of China Ltd., 5.000%, due 11/13/241 |
200,000 |
203,933 |
|||||||||
|
Bao-trans Enterprises Ltd., 1.625%, due 02/23/182 |
EUR |
200,000 |
224,271 |
||||||||
|
Total China corporate bonds |
1,453,733 |
||||||||||
|
Czech Republic: 0.20% |
|||||||||||
|
NET4GAS sro, 2.500%, due 07/28/21 |
560,000 |
644,606 |
|||||||||
|
Denmark: 0.24% |
|||||||||||
|
AP Moeller - Maersk A/S, 3.375%, due 08/28/192 |
650,000 |
798,401 |
|||||||||
|
Finland: 0.69% |
|||||||||||
|
Elenia Finance Oyj, 2.875%, due 12/17/20 |
550,000 |
652,760 |
|||||||||
|
Pohjola Bank Oyj, 1.125%, due 06/17/19 |
100,000 |
113,395 |
|||||||||
|
1.750%, due 08/29/18 |
300,000 |
346,864 |
|||||||||
|
Sampo Oyj, 1.500%, due 09/16/21 |
250,000 |
279,966 |
|||||||||
|
Teollisuuden Voima Oyj, 2.500%, due 03/17/21 |
425,000 |
474,383 |
|||||||||
|
4.625%, due 02/04/192 |
335,000 |
408,408 |
|||||||||
|
Total Finland corporate bonds |
2,275,776 |
||||||||||
|
France: 2.01% |
|||||||||||
|
Arkema SA, 1.500%, due 01/20/25 |
200,000 |
212,110 |
|||||||||
|
Face amount |
Value |
||||||||||
|
AXA SA, 6.667%, due 07/06/163,4 |
GBP |
285,000 |
$ |
455,307 |
|||||||
|
BNP Paribas SA, 2.700%, due 08/20/18 |
$ |
500,000 |
511,667 |
||||||||
|
2.875%, due 03/20/263 |
EUR |
350,000 |
394,668 |
||||||||
|
Christian Dior SE, 1.375%, due 06/19/19 |
200,000 |
226,052 |
|||||||||
|
CNP Assurances, 4.250%, due 06/05/453 |
100,000 |
113,113 |
|||||||||
|
Credit Logement SA, 1.136%, due 09/16/152,3,4 |
200,000 |
184,619 |
|||||||||
|
Electricite de France SA, 4.125%, due 01/22/223,4 |
300,000 |
342,816 |
|||||||||
|
5.625%, due 01/22/241,3,4 |
$ |
280,000 |
284,760 |
||||||||
|
6.950%, due 01/26/391 |
200,000 |
259,477 |
|||||||||
|
GDF Suez, 4.750%, due 07/10/213,4 |
EUR |
600,000 |
725,399 |
||||||||
|
Infra Foch SAS, 1.250%, due 10/16/20 |
200,000 |
221,996 |
|||||||||
|
Orange SA, 5.875%, due 02/07/223,4 |
GBP |
300,000 |
480,803 |
||||||||
|
Societe Des Autoroutes Paris-Rhin-Rhone, 2.250%, due 01/16/20 |
EUR |
600,000 |
706,354 |
||||||||
|
Total Capital International SA, 1.550%, due 06/28/17 |
$ |
1,190,000 |
1,201,037 |
||||||||
|
TOTAL SA, 2.625%, due 02/26/253,4 |
EUR |
265,000 |
274,528 |
||||||||
|
Total France corporate bonds |
6,594,706 |
||||||||||
|
Germany: 0.25% |
|||||||||||
|
Allianz SE, 4.750%, due 10/24/233,4 |
200,000 |
239,869 |
|||||||||
|
Merck KGaA, 3.375%, due 12/12/743 |
265,000 |
291,222 |
|||||||||
|
RWE AG, 2.750%, due 04/21/753 |
270,000 |
281,124 |
|||||||||
|
Total Germany corporate bonds |
812,215 |
||||||||||
|
Guernsey: 0.13% |
|||||||||||
|
Credit Suisse Group Guernsey I Ltd., 7.875%, due 02/24/412,3 |
$ |
415,000 |
433,904 |
||||||||
|
India: 0.16% |
|||||||||||
|
Reliance Industries Ltd., 4.125%, due 01/28/251 |
525,000 |
512,339 |
|||||||||
|
Ireland: 0.60% |
|||||||||||
|
Aquarius + Investments PLC for Swiss Reinsurance Co., Ltd., 6.375%, due 09/01/243 |
200,000 |
207,166 |
|||||||||
19
UBS Dynamic Alpha Fund
Portfolio of investments
June 30, 2015
|
Face amount |
Value |
||||||||||
|
Bonds—(Continued) |
|||||||||||
|
Corporate bonds—(Continued) |
|||||||||||
|
Ireland—(Concluded) |
|||||||||||
|
Cloverie PLC for Zurich Insurance Co., Ltd., 1.750%, due 09/16/24 |
EUR |
130,000 |
$ |
142,609 |
|||||||
|
FGA Capital Ireland PLC, 2.625%, due 04/17/19 |
435,000 |
500,721 |
|||||||||
|
Perrigo Co. PLC, 4.000%, due 11/15/23 |
$ |
200,000 |
202,683 |
||||||||
|
PGH Capital Ltd., 5.750%, due 07/07/21 |
GBP |
280,000 |
466,421 |
||||||||
|
XL Group PLC, 4.450%, due 03/31/25 |
$ |
275,000 |
272,595 |
||||||||
|
5.250%, due 12/15/43 |
185,000 |
191,019 |
|||||||||
|
Total Ireland corporate bonds |
1,983,214 |
||||||||||
|
Israel: 0.38% |
|||||||||||
|
Delek & Avner Tamar Bond Ltd., 3.839%, due 12/30/181 |
1,020,000 |
1,034,025 |
|||||||||
|
Teva Pharmaceutical Finance IV BV, 3.650%, due 11/10/21 |
200,000 |
203,350 |
|||||||||
|
Total Israel corporate bonds |
1,237,375 |
||||||||||
|
Italy: 1.17% |
|||||||||||
|
2i Rete Gas SpA, 1.125%, due 01/02/20 |
EUR |
200,000 |
220,427 |
||||||||
|
Assicurazioni Generali SpA, 2.875%, due 01/14/20 |
120,000 |
142,246 |
|||||||||
|
Ei Towers SpA, 3.875%, due 04/26/18 |
400,000 |
477,022 |
|||||||||
|
Intesa Sanpaolo SpA, 3.625%, due 08/12/151 |
$ |
235,000 |
235,682 |
||||||||
|
3.875%, due 01/16/18 |
320,000 |
330,347 |
|||||||||
|
4.375%, due 10/15/192 |
EUR |
400,000 |
496,444 |
||||||||
|
Snam SpA, 3.875%, due 03/19/182 |
660,000 |
797,155 |
|||||||||
|
Terna Rete Elettrica Nazionale SpA, 4.125%, due 02/17/17 |
365,000 |
430,791 |
|||||||||
|
UniCredit SpA, 3.250%, due 01/14/21 |
EUR |
295,000 |
349,392 |
||||||||
|
6.375%, due 05/02/232,3 |
$ |
340,000 |
355,529 |
||||||||
|
Total Italy corporate bonds |
3,835,035 |
||||||||||
|
Japan: 0.23% |
|||||||||||
|
Bank of Tokyo-Mitsubishi UFJ Ltd., 2.350%, due 09/08/191 |
380,000 |
379,518 |
|||||||||
|
2.350%, due 09/08/192 |
200,000 |
199,746 |
|||||||||
|
Nippon Telegraph & Telephone Corp., 1.400%, due 07/18/17 |
190,000 |
190,229 |
|||||||||
|
Total Japan corporate bonds |
769,493 |
||||||||||
|
Face amount |
Value |
||||||||||
|
Jersey, Channel Islands: 0.83% |
|||||||||||
|
AA Bond Co., Ltd., 4.720%, due 07/31/182 |
GBP |
275,000 |
$ |
457,978 |
|||||||
|
Gatwick Funding Ltd., 5.250%, due 01/23/242 |
250,000 |
442,327 |
|||||||||
|
Heathrow Funding Ltd., 1.500%, due 02/11/30 |
EUR |
425,000 |
412,981 |
||||||||
|
4.600%, due 02/15/182 |
590,000 |
726,184 |
|||||||||
|
HSBC Capital Funding LP, 5.130%, due 03/29/163,4 |
170,000 |
192,829 |
|||||||||
|
QBE Capital Funding III Ltd., 7.250%, due 05/24/412,3 |
$ |
430,000 |
475,586 |
||||||||
|
Total Jersey, Channel Islands corporate bonds |
2,707,885 |
||||||||||
|
Luxembourg: 0.15% |
|||||||||||
|
Belfius Financing Co., 1.267%, due 02/09/173 |
GBP |
325,000 |
505,550 |
||||||||
|
Mexico: 0.45% |
|||||||||||
|
America Movil SAB de CV, 5.000%, due 03/30/20 |
$ |
735,000 |
813,608 |
||||||||
|
5.125%, due 09/06/733 |
EUR |
145,000 |
170,949 |
||||||||
|
Coca-Cola Femsa SAB de CV, 2.375%, due 11/26/18 |
$ |
490,000 |
497,742 |
||||||||
|
Total Mexico corporate bonds |
1,482,299 |
||||||||||
|
Netherlands: 4.85% |
|||||||||||
|
ABN AMRO Bank NV, 4.875%, due 01/16/192 |
GBP |
350,000 |
605,451 |
||||||||
|
6.250%, due 09/13/223 |
$ |
370,000 |
396,825 |
||||||||
|
Achmea BV, 2.500%, due 11/19/20 |
EUR |
960,000 |
1,127,172 |
||||||||
|
4.250%, due 02/04/253,4 |
350,000 |
375,294 |
|||||||||
|
Allianz Finance II BV, 4.375%, due 02/17/173,4 |
435,000 |
501,934 |
|||||||||
|
BAT Netherlands Finance BV, 2.375%, due 01/19/232 |
550,000 |
645,397 |
|||||||||
|
Bharti Airtel International Netherlands BV, 3.375%, due 05/20/211 |
100,000 |
116,641 |
|||||||||
|
4.000%, due 12/10/18 |
650,000 |
773,567 |
|||||||||
|
Coca-Cola HBC Finance BV, 2.375%, due 06/18/202 |
560,000 |
649,693 |
|||||||||
|
5.500%, due 09/17/15 |
$ |
355,000 |
357,010 |
||||||||
|
Cooperatieve Centrale Raiffeisen-Boerenleenbank BA, 1.700%, due 03/19/18 |
830,000 |
832,050 |
|||||||||
|
2.500%, due 05/26/263 |
EUR |
745,000 |
823,811 |
||||||||
|
5.500%, due 06/29/203,4 |
850,000 |
954,730 |
|||||||||
|
Deutsche Annington Finance BV, 4.000%, due 12/17/213,4 |
300,000 |
332,725 |
|||||||||
20
UBS Dynamic Alpha Fund
Portfolio of investments
June 30, 2015
|
Face amount |
Value |
||||||||||
|
Bonds—(Continued) |
|||||||||||
|
Corporate bonds—(Continued) |
|||||||||||
|
Netherlands—(Concluded) |
|||||||||||
|
Deutsche Telekom International Finance BV, 6.500%, due 04/08/22 |
GBP |
170,000 |
$ |
324,632 |
|||||||
|
E.ON International Finance BV, 6.650%, due 04/30/381 |
$ |
145,000 |
174,458 |
||||||||
|
EDP Finance BV, 2.000%, due 04/22/25 |
EUR |
255,000 |
256,512 |
||||||||
|
4.625%, due 06/13/16 |
405,000 |
466,423 |
|||||||||
|
Heineken NV, 2.125%, due 08/04/202 |
645,000 |
757,898 |
|||||||||
|
Koninklijke KPN NV, 6.500%, due 01/15/16 |
257,000 |
296,049 |
|||||||||
|
LYB International Finance BV, 5.250%, due 07/15/43 |
$ |
285,000 |
290,332 |
||||||||
|
Nomura Europe Finance NV, 1.500%, due 05/12/21 |
EUR |
300,000 |
328,530 |
||||||||
|
Redexis Gas Finance BV, 1.875%, due 04/27/27 |
650,000 |
642,531 |
|||||||||
|
2.750%, due 04/08/21 |
450,000 |
531,369 |
|||||||||
|
REN Finance BV, 2.500%, due 02/12/25 |
300,000 |
317,272 |
|||||||||
|
4.750%, due 10/16/20 |
345,000 |
436,504 |
|||||||||
|
Repsol International Finance BV, 4.250%, due 02/12/162 |
200,000 |
228,278 |
|||||||||
|
4.375%, due 02/20/182 |
200,000 |
243,463 |
|||||||||
|
Shell International Finance BV, 4.375%, due 05/11/45 |
$ |
825,000 |
814,334 |
||||||||
|
Siemens Financieringsmaatschappij NV, 5.125%, due 02/20/17 |
EUR |
335,000 |
403,464 |
||||||||
|
6.125%, due 09/14/663 |
GBP |
225,000 |
367,672 |
||||||||
|
Swiss Reinsurance Co. via ELM BV, 2.600%, due 09/01/253,4 |
EUR |
230,000 |
234,726 |
||||||||
|
TenneT Holding BV, 6.655%, due 06/01/173,4 |
250,000 |
304,145 |
|||||||||
|
Total Netherlands corporate bonds |
15,910,892 |
||||||||||
|
Norway: 0.62% |
|||||||||||
|
DNB Bank ASA, 3.200%, due 04/03/171 |
$ |
450,000 |
464,143 |
||||||||
|
SpareBank 1 SR-Bank ASA, 2.125%, due 04/14/21 |
EUR |
650,000 |
757,751 |
||||||||
|
Statoil ASA, 3.125%, due 08/17/17 |
$ |
430,000 |
446,743 |
||||||||
|
4.800%, due 11/08/43 |
355,000 |
375,862 |
|||||||||
|
Total Norway corporate bonds |
2,044,499 |
||||||||||
|
Face amount |
Value |
||||||||||
|
Portugal: 0.07% |
|||||||||||
|
Caixa Geral de Depositos SA, 3.750%, due 01/18/18 |
EUR |
200,000 |
$ |
241,714 |
|||||||
|
Qatar: 0.06% |
|||||||||||
|
Qtel International Finance Ltd., 3.875%, due 01/31/281 |
$ |
200,000 |
189,042 |
||||||||
|
Singapore: 0.08% |
|||||||||||
|
United Overseas Bank Ltd., 3.750%, due 09/19/243 |
250,000 |
254,405 |
|||||||||
|
South Korea: 0.10% |
|||||||||||
|
GS Caltex Corp., 5.500%, due 04/24/172 |
300,000 |
318,070 |
|||||||||
|
Spain: 1.38% |
|||||||||||
|
Aigues de Barcelona Finance SAU, 1.944%, due 09/15/21 |
EUR |
430,000 |
483,735 |
||||||||
|
Banco de Sabadell SA, 3.375%, due 01/23/18 |
100,000 |
120,196 |
|||||||||
|
BBVA Senior Finance SAU, 3.250%, due 03/21/16 |
200,000 |
227,472 |
|||||||||
|
BBVA US Senior SAU, 4.664%, due 10/09/15 |
$ |
460,000 |
464,407 |
||||||||
|
Canal de Isabel II Gestion SA, 1.680%, due 02/26/25 |
EUR |
300,000 |
305,551 |
||||||||
|
Santander Consumer Finance SA, 0.900%, due 02/18/202 |
900,000 |
983,779 |
|||||||||
|
Santander International Debt SAU, 1.375%, due 03/25/17 |
800,000 |
903,453 |
|||||||||
|
Telefonica Emisiones SAU, 4.710%, due 01/20/202 |
800,000 |
1,028,293 |
|||||||||
|
Total Spain corporate bonds |
4,516,886 |
||||||||||
|
Sweden: 0.73% |
|||||||||||
|
PGE Sweden AB, 1.625%, due 06/09/19 |
200,000 |
226,017 |
|||||||||
|
Svenska Handelsbanken AB, 5.125%, due 03/30/201 |
$ |
475,000 |
536,509 |
||||||||
|
5.125%, due 03/30/202 |
115,000 |
129,892 |
|||||||||
|
5.250%, due 03/01/213,4 |
475,000 |
459,752 |
|||||||||
|
Swedbank AB, 5.500%, due 03/17/203,4 |
400,000 |
391,375 |
|||||||||
|
Swedbank Hypotek AB, 2.375%, due 04/05/171 |
440,000 |
449,937 |
|||||||||
|
2.375%, due 04/05/172 |
200,000 |
204,688 |
|||||||||
|
Total Sweden corporate bonds |
2,398,170 |
||||||||||
|
Switzerland: 0.12% |
|||||||||||
|
Credit Suisse, 3.000%, due 10/29/21 |
380,000 |
377,037 |
|||||||||
21
UBS Dynamic Alpha Fund
Portfolio of investments
June 30, 2015
|
Face amount |
Value |
||||||||||
|
Bonds—(Continued) |
|||||||||||
|
Corporate bonds—(Continued) |
|||||||||||
|
United Kingdom: 7.60% |
|||||||||||
|
Abbey National Treasury Services PLC, 4.000%, due 03/13/245 |
$ |
490,000 |
$ |
505,543 |
|||||||
|
Anglian Water Services Financing PLC, 4.500%, due 02/22/262 |
GBP |
200,000 |
329,535 |
||||||||
|
Aon PLC, 2.875%, due 05/14/26 |
EUR |
155,000 |
179,814 |
||||||||
|
4.750%, due 05/15/45 |
$ |
470,000 |
453,027 |
||||||||
|
Arqiva Financing PLC, 4.040%, due 06/30/202 |
GBP |
525,000 |
861,376 |
||||||||
|
4.882%, due 12/31/322 |
250,000 |
423,208 |
|||||||||
|
Barclays Bank PLC, 2.250%, due 05/10/171,5 |
$ |
360,000 |
367,549 |
||||||||
|
2.250%, due 05/10/172 |
200,000 |
204,194 |
|||||||||
|
4.375%, due 09/11/24 |
960,000 |
920,703 |
|||||||||
|
5.750%, due 08/17/212 |
GBP |
255,000 |
470,211 |
||||||||
|
6.625%, due 03/30/222 |
EUR |
260,000 |
358,860 |
||||||||
|
BP Capital Markets PLC, 1.375%, due 05/10/18 |
$ |
390,000 |
387,880 |
||||||||
|
2.750%, due 05/10/23 |
220,000 |
210,419 |
|||||||||
|
British Telecommunications PLC, 8.500%, due 12/07/162 |
GBP |
395,000 |
681,032 |
||||||||
|
BUPA Finance PLC, 3.375%, due 06/17/21 |
210,000 |
338,191 |
|||||||||
|
6.125%, due 09/16/203,4 |
250,000 |
416,381 |
|||||||||
|
Centrica PLC, 5.250%, due 04/10/753 |
225,000 |
343,733 |
|||||||||
|
5.375%, due 10/16/431 |
$ |
200,000 |
204,832 |
||||||||
|
Close Brothers Finance PLC, 3.875%, due 06/27/21 |
GBP |
475,000 |
778,704 |
||||||||
|
Diageo Capital PLC, 3.875%, due 04/29/43 |
$ |
335,000 |
297,404 |
||||||||
|
EE Finance PLC, 4.375%, due 03/28/192 |
GBP |
345,000 |
578,117 |
||||||||
|
GlaxoSmithKline Capital PLC, 1.500%, due 05/08/17 |
$ |
570,000 |
573,984 |
||||||||
|
Gwynt y Mor OFTO PLC, 2.778%, due 02/17/34 |
GBP |
207,494 |
313,702 |
||||||||
|
HSBC Holdings PLC, 5.100%, due 04/05/21 |
$ |
940,000 |
1,047,834 |
||||||||
|
Imperial Tobacco Finance PLC, 2.050%, due 02/11/181 |
420,000 |
418,071 |
|||||||||
|
9.000%, due 02/17/222 |
GBP |
190,000 |
394,759 |
||||||||
|
Liverpool Victoria Friendly Society Ltd., 6.500%, due 05/22/432,3 |
610,000 |
962,028 |
|||||||||
|
Face amount |
Value |
||||||||||
|
Lloyds Bank PLC, 7.500%, due 04/15/24 |
GBP |
315,000 |
$ |
652,373 |
|||||||
|
11.875%, due 12/16/212,3 |
EUR |
300,000 |
383,010 |
||||||||
|
Manchester Airport Group Funding PLC, 4.750%, due 03/31/34 |
GBP |
120,000 |
203,254 |
||||||||
|
National Express Group PLC, 6.250%, due 01/13/17 |
200,000 |
334,433 |
|||||||||
|
National Grid Electricity Transmission PLC, 4.000%, due 06/08/272 |
230,000 |
386,208 |
|||||||||
|
Northern Gas Networks Finance PLC, 5.875%, due 07/08/19 |
225,000 |
401,616 |
|||||||||
|
Prudential PLC, 1.375%, due 01/19/18 |
470,000 |
733,884 |
|||||||||
|
Royal Bank of Scotland PLC, 6.934%, due 04/09/18 |
EUR |
690,000 |
861,634 |
||||||||
|
Scottish & Southern Energy PLC, 5.453%, due 10/01/153,4 |
GBP |
302,000 |
475,799 |
||||||||
|
Scottish Widows PLC, 5.500%, due 06/16/23 |
400,000 |
650,501 |
|||||||||
|
Sinopec Capital 2013 Ltd., 3.125%, due 04/24/231 |
$ |
680,000 |
648,918 |
||||||||
|
3.125%, due 04/24/232 |
230,000 |
219,487 |
|||||||||
|
Sky PLC, 2.500%, due 09/15/26 |
EUR |
250,000 |
280,777 |
||||||||
|
Southern Gas Networks PLC, 2.500%, due 02/03/25 |
GBP |
115,000 |
169,056 |
||||||||
|
SSE PLC, 3.875%, due 09/10/203,4 |
200,000 |
304,037 |
|||||||||
|
Standard Chartered PLC, 4.000%, due 07/12/222,3 |
$ |
950,000 |
972,074 |
||||||||
|
State Grid Europe Development 2014 PLC, Series A, 1.500%, due 01/26/22 |
EUR |
325,000 |
359,906 |
||||||||
|
Tesco Property Finance 4 PLC, 5.801%, due 10/13/402 |
GBP |
247,154 |
369,083 |
||||||||
|
Thames Water Utilities Finance Ltd., 5.125%, due 09/28/37 |
460,000 |
831,764 |
|||||||||
|
Wales & West Utilities Finance PLC, 5.125%, due 12/02/162 |
710,000 |
1,172,790 |
|||||||||
|
6.750%, due 12/17/363 |
50,000 |
89,084 |
|||||||||
|
Western Power Distribution West Midlands PLC, 5.750%, due 04/16/322 |
200,000 |
384,364 |
|||||||||
|
WPP Finance 2010, 3.750%, due 09/19/24 |
$ |
365,000 |
363,818 |
||||||||
|
WPP PLC, 6.625%, due 05/12/162 |
EUR |
405,000 |
476,046 |
||||||||
22
UBS Dynamic Alpha Fund
Portfolio of investments
June 30, 2015
|
Face amount |
Value |
||||||||||
|
Bonds—(Continued) |
|||||||||||
|
Corporate bonds—(Continued) |
|||||||||||
|
United Kingdom—(Concluded) |
|||||||||||
|
Yorkshire Building Society, 4.125%, due 11/20/243 |
GBP |
115,000 |
$ |
181,009 |
|||||||
|
Total United Kingdom corporate bonds |
24,926,016 |
||||||||||
|
United States: 26.62% |
|||||||||||
|
21st Century Fox America, Inc., 6.200%, due 12/15/34 |
$ |
760,000 |
882,051 |
||||||||
|
ABB Finance USA, Inc., 2.875%, due 05/08/22 |
520,000 |
511,592 |
|||||||||
|
AbbVie, Inc., 2.500%, due 05/14/20 |
185,000 |
183,102 |
|||||||||
|
2.900%, due 11/06/22 |
565,000 |
547,090 |
|||||||||
|
3.200%, due 11/06/22 |
115,000 |
113,873 |
|||||||||
|
4.400%, due 11/06/42 |
330,000 |
312,240 |
|||||||||
|
Actavis Funding SCS, 1.300%, due 06/15/17 |
220,000 |
218,514 |
|||||||||
|
3.450%, due 03/15/22 |
350,000 |
346,685 |
|||||||||
|
4.750%, due 03/15/45 |
295,000 |
280,856 |
|||||||||
|
Aetna, Inc., 3.500%, due 11/15/24 |
465,000 |
455,828 |
|||||||||
|
Albemarle Corp., 1.875%, due 12/08/21 |
EUR |
150,000 |
164,883 |
||||||||
|
4.150%, due 12/01/24 |
$ |
690,000 |
687,772 |
||||||||
|
Alltel Corp., 7.875%, due 07/01/32 |
435,000 |
578,010 |
|||||||||
|
Altria Group, Inc., 4.250%, due 08/09/42 |
1,165,000 |
1,033,939 |
|||||||||
|
American Airlines Pass Through Trust, Series 2014-1, Class B, 4.375%, due 10/01/22 |
62,004 |
62,934 |
|||||||||
|
American Express Credit Corp., 1.300%, due 07/29/16 |
275,000 |
275,875 |
|||||||||
|
2.375%, due 05/26/20 |
230,000 |
228,350 |
|||||||||
|
American International Group, Inc., 3.375%, due 08/15/20 |
645,000 |
667,619 |
|||||||||
|
3.875%, due 01/15/35 |
250,000 |
225,808 |
|||||||||
|
4.500%, due 07/16/44 |
260,000 |
247,324 |
|||||||||
|
Anadarko Petroleum Corp., 6.375%, due 09/15/17 |
1,035,000 |
1,135,813 |
|||||||||
|
Anthem, Inc., 5.100%, due 01/15/44 |
215,000 |
210,149 |
|||||||||
|
Apache Corp., 4.750%, due 04/15/43 |
845,000 |
781,982 |
|||||||||
|
Archer-Daniels-Midland Co., Class C, 1.750%, due 06/23/23 |
EUR |
225,000 |
251,945 |
||||||||
|
Face amount |
Value |
||||||||||
|
AT&T, Inc., 3.000%, due 02/15/22 |
$ |
410,000 |
$ |
400,204 |
|||||||
|
4.750%, due 05/15/46 |
515,000 |
468,637 |
|||||||||
|
5.550%, due 08/15/41 |
560,000 |
573,759 |
|||||||||
|
Bank of America Corp., 1.375%, due 09/10/21 |
EUR |
300,000 |
332,429 |
||||||||
|
1.875%, due 01/10/19 |
1,445,000 |
1,670,145 |
|||||||||
|
5.875%, due 02/07/42 |
$ |
350,000 |
403,642 |
||||||||
|
Bank of New York Mellon Corp., 1.350%, due 03/06/18 |
730,000 |
725,705 |
|||||||||
|
Berkshire Hathaway Finance Corp., 1.300%, due 05/15/18 |
310,000 |
310,034 |
|||||||||
|
Branch Banking & Trust Co., 1.350%, due 10/01/17 |
265,000 |
264,767 |
|||||||||
|
Burlington Northern Santa Fe LLC, 3.000%, due 03/15/23 |
590,000 |
576,417 |
|||||||||
|
5.400%, due 06/01/41 |
325,000 |
358,163 |
|||||||||
|
Cadence Design Systems, Inc., 4.375%, due 10/15/24 |
105,000 |
105,337 |
|||||||||
|
Capital One Financial Corp., 1.000%, due 11/06/15 |
840,000 |
838,732 |
|||||||||
|
Caterpillar, Inc., 4.750%, due 05/15/64 |
350,000 |
342,599 |
|||||||||
|
CF Industries, Inc., 5.150%, due 03/15/34 |
450,000 |
444,467 |
|||||||||
|
Chevron Corp., 2.355%, due 12/05/22 |
400,000 |
382,792 |
|||||||||
|
2.427%, due 06/24/20 |
165,000 |
166,523 |
|||||||||
|
Citigroup, Inc., 0.674%, due 05/31/173 |
EUR |
625,000 |
691,555 |
||||||||
|
3.875%, due 10/25/23 |
$ |
500,000 |
510,260 |
||||||||
|
Coca-Cola Co., 1.800%, due 09/01/16 |
550,000 |
556,648 |
|||||||||
|
1.875%, due 09/22/26 |
EUR |
305,000 |
339,596 |
||||||||
|
Comcast Corp., 4.750%, due 03/01/44 |
$ |
165,000 |
167,499 |
||||||||
|
ConocoPhillips Co., 2.200%, due 05/15/20 |
740,000 |
734,700 |
|||||||||
|
Daimler Finance North America LLC, 2.450%, due 05/18/201 |
450,000 |
447,093 |
|||||||||
|
Delta Air Lines Pass Through Trust, Series 2007-1, Class A, 6.821%, due 08/10/22 |
42,359 |
48,607 |
|||||||||
|
DIRECTV Holdings LLC, 5.000%, due 03/01/21 |
880,000 |
952,918 |
|||||||||
|
Duke Energy Corp., 3.050%, due 08/15/22 |
545,000 |
540,463 |
|||||||||
|
Enable Midstream Partners LP, 3.900%, due 05/15/241 |
315,000 |
291,892 |
|||||||||
|
Energy Transfer Partners LP, 6.050%, due 06/01/41 |
580,000 |
569,295 |
|||||||||
23
UBS Dynamic Alpha Fund
Portfolio of investments
June 30, 2015
|
Face amount |
Value |
||||||||||
|
Bonds—(Continued) |
|||||||||||
|
Corporate bonds—(Continued) |
|||||||||||
|
United States—(Continued) |
|||||||||||
|
Enterprise Products Operating LLC, 4.850%, due 03/15/44 |
$ |
415,000 |
$ |
390,299 |
|||||||
|
5.200%, due 09/01/20 |
325,000 |
361,734 |
|||||||||
|
ERAC USA Finance LLC, 5.625%, due 03/15/421 |
335,000 |
359,015 |
|||||||||
|
ERP Operating LP, 3.375%, due 06/01/25 |
470,000 |
460,218 |
|||||||||
|
Expedia, Inc., 2.500%, due 06/03/22 |
EUR |
360,000 |
395,590 |
||||||||
|
Express Scripts Holding Co., 2.250%, due 06/15/19 |
$ |
465,000 |
461,235 |
||||||||
|
Exxon Mobil Corp., 1.819%, due 03/15/19 |
320,000 |
320,415 |
|||||||||
|
3.567%, due 03/06/45 |
190,000 |
171,993 |
|||||||||
|
Fifth Third Bank, 2.875%, due 10/01/21 |
545,000 |
539,642 |
|||||||||
|
Five Corners Funding Trust, 4.419%, due 11/15/231 |
590,000 |
609,448 |
|||||||||
|
Ford Motor Credit Co. LLC, 3.000%, due 06/12/17 |
1,380,000 |
1,411,588 |
|||||||||
|
Freeport-McMoRan, Inc., 3.875%, due 03/15/23 |
365,000 |
331,576 |
|||||||||
|
4.000%, due 11/14/21 |
625,000 |
613,734 |
|||||||||
|
General Electric Capital Corp., 1.000%, due 12/11/15 |
765,000 |
767,179 |
|||||||||
|
4.375%, due 09/16/20 |
755,000 |
822,127 |
|||||||||
|
Series A, 6.750%, due 03/15/32 |
1,275,000 |
1,655,269 |
|||||||||
|
General Electric Co., 1.875%, due 05/28/27 |
EUR |
320,000 |
351,149 |
||||||||
|
4.125%, due 10/09/42 |
$ |
285,000 |
274,214 |
||||||||
|
General Motors Financial Co., Inc., 3.500%, due 07/10/19 |
505,000 |
515,690 |
|||||||||
|
Georgia Power Co., 0.750%, due 08/10/15 |
375,000 |
375,128 |
|||||||||
|
5.400%, due 06/01/40 |
360,000 |
398,804 |
|||||||||
|
Gilead Sciences, Inc., 2.050%, due 04/01/19 |
280,000 |
281,589 |
|||||||||
|
4.800%, due 04/01/44 |
375,000 |
385,958 |
|||||||||
|
Glencore Funding LLC, 2.500%, due 01/15/191 |
500,000 |
494,389 |
|||||||||
|
3.125%, due 04/29/191 |
230,000 |
231,955 |
|||||||||
|
Goldman Sachs Group, Inc., 1.375%, due 07/26/22 |
EUR |
1,390,000 |
1,515,816 |
||||||||
|
5.150%, due 05/22/45 |
$ |
395,000 |
381,067 |
||||||||
|
Hartford Financial Services Group, Inc., 4.300%, due 04/15/43 |
305,000 |
288,728 |
|||||||||
|
HJ Heinz Co., 2.800%, due 07/02/201 |
355,000 |
355,276 |
|||||||||
|
Face amount |
Value |
||||||||||
|
Hospira, Inc., 5.200%, due 08/12/20 |
$ |
485,000 |
$ |
542,136 |
|||||||
|
HSBC Finance Capital Trust IX, 5.911%, due 11/30/353 |
500,000 |
502,775 |
|||||||||
|
Illinois Tool Works, Inc., 3.000%, due 05/19/34 |
EUR |
215,000 |
245,948 |
||||||||
|
International Business Machines Corp., 3.375%, due 08/01/23 |
$ |
560,000 |
562,690 |
||||||||
|
Jefferies Group LLC, 2.375%, due 05/20/20 |
EUR |
175,000 |
189,513 |
||||||||
|
Johnson Controls, Inc., 4.950%, due 07/02/64 |
$ |
165,000 |
156,775 |
||||||||
|
JPMorgan Chase & Co., 3.125%, due 01/23/25 |
305,000 |
291,201 |
|||||||||
|
3.200%, due 01/25/23 |
2,765,000 |
2,711,865 |
|||||||||
|
3.875%, due 09/10/24 |
260,000 |
255,815 |
|||||||||
|
Juniper Networks, Inc., 4.500%, due 03/15/24 |
370,000 |
373,387 |
|||||||||
|
Kellogg Co., 1.875%, due 11/17/16 |
380,000 |
383,588 |
|||||||||
|
Kinder Morgan Energy Partners LP, 5.000%, due 03/01/43 |
585,000 |
510,481 |
|||||||||
|
Kinder Morgan, Inc., 5.000%, due 02/15/211 |
650,000 |
687,651 |
|||||||||
|
5.625%, due 11/15/231 |
220,000 |
234,022 |
|||||||||
|
Kraft Foods Group, Inc., 5.000%, due 06/04/42 |
475,000 |
473,348 |
|||||||||
|
Laboratory Corp. of America Holdings, 2.500%, due 11/01/18 |
235,000 |
236,971 |
|||||||||
|
Liberty Mutual Group, Inc., 4.250%, due 06/15/231 |
600,000 |
617,043 |
|||||||||
|
Lincoln National Corp., 3.350%, due 03/09/25 |
55,000 |
53,351 |
|||||||||
|
4.200%, due 03/15/22 |
810,000 |
849,965 |
|||||||||
|
Lowe's Cos., Inc., 4.250%, due 09/15/44 |
520,000 |
502,786 |
|||||||||
|
Marathon Oil Corp., 3.850%, due 06/01/25 |
370,000 |
362,632 |
|||||||||
|
Marathon Petroleum Corp., 3.625%, due 09/15/24 |
515,000 |
505,631 |
|||||||||
|
Medtronic, Inc., 3.150%, due 03/15/221 |
500,000 |
502,240 |
|||||||||
|
4.000%, due 04/01/43 |
335,000 |
309,171 |
|||||||||
|
Merck & Co., Inc., 1.875%, due 10/15/26 |
EUR |
225,000 |
251,771 |
||||||||
|
3.700%, due 02/10/45 |
$ |
160,000 |
142,939 |
||||||||
|
Metropolitan Life Global Funding I, 0.875%, due 01/20/22 |
EUR |
100,000 |
107,647 |
||||||||
|
1.250%, due 09/17/21 |
560,000 |
619,599 |
|||||||||
|
2.375%, due 09/30/192 |
530,000 |
625,789 |
|||||||||
24
UBS Dynamic Alpha Fund
Portfolio of investments
June 30, 2015
|
Face amount |
Value |
||||||||||
|
Bonds—(Continued) |
|||||||||||
|
Corporate bonds—(Continued) |
|||||||||||
|
United States—(Continued) |
|||||||||||
|
Microsoft Corp., 2.625%, due 05/02/33 |
EUR |
440,000 |
$ |
511,315 |
|||||||
|
3.500%, due 11/15/42 |
$ |
420,000 |
363,297 |
||||||||
|
Mohawk Industries, Inc., 2.000%, due 01/14/22 |
EUR |
285,000 |
318,553 |
||||||||
|
Mondelez International, Inc., 2.375%, due 01/26/21 |
830,000 |
974,095 |
|||||||||
|
Monongahela Power Co., 5.400%, due 12/15/431 |
$ |
260,000 |
287,130 |
||||||||
|
Monsanto Co., 4.200%, due 07/15/34 |
435,000 |
396,416 |
|||||||||
|
Morgan Stanley, 2.375%, due 07/23/19 |
1,610,000 |
1,599,427 |
|||||||||
|
2.650%, due 01/27/20 |
620,000 |
618,894 |
|||||||||
|
4.350%, due 09/08/26 |
460,000 |
450,745 |
|||||||||
|
6.375%, due 07/24/42 |
210,000 |
257,836 |
|||||||||
|
Mosaic Co., 5.450%, due 11/15/33 |
295,000 |
314,020 |
|||||||||
|
Navient Corp., 6.250%, due 01/25/16 |
270,000 |
275,400 |
|||||||||
|
NBCUniversal Media LLC, 4.375%, due 04/01/21 |
1,195,000 |
1,294,276 |
|||||||||
|
5.150%, due 04/30/20 |
445,000 |
499,762 |
|||||||||
|
Noble Energy, Inc., 5.050%, due 11/15/44 |
205,000 |
196,416 |
|||||||||
|
Occidental Petroleum Corp., 4.625%, due 06/15/45 |
205,000 |
203,735 |
|||||||||
|
Oncor Electric Delivery Co. LLC, 7.000%, due 05/01/32 |
196,000 |
255,731 |
|||||||||
|
PacifiCorp, 6.000%, due 01/15/39 |
505,000 |
613,952 |
|||||||||
|
Pemex Project Funding Master Trust, 5.500%, due 02/24/252 |
EUR |
355,000 |
464,298 |
||||||||
|
Philip Morris International, Inc., 4.250%, due 11/10/44 |
$ |
500,000 |
470,153 |
||||||||
|
Phillips 66, 4.650%, due 11/15/34 |
225,000 |
220,113 |
|||||||||
|
Phillips 66 Partners LP, 4.680%, due 02/15/45 |
160,000 |
140,851 |
|||||||||
|
PNC Funding Corp., 2.700%, due 09/19/16 |
385,000 |
391,683 |
|||||||||
|
PPL Capital Funding, Inc., 4.700%, due 06/01/43 |
285,000 |
284,838 |
|||||||||
|
Priceline Group, Inc., 2.375%, due 09/23/24 |
EUR |
320,000 |
349,028 |
||||||||
|
Prudential Financial, Inc., 4.600%, due 05/15/44 |
$ |
710,000 |
686,461 |
||||||||
|
Face amount |
Value |
||||||||||
|
QVC, Inc., 4.375%, due 03/15/23 |
$ |
200,000 |
$ |
196,574 |
|||||||
|
Republic Services, Inc., 5.250%, due 11/15/21 |
940,000 |
1,053,426 |
|||||||||
|
Reynolds American, Inc., 4.000%, due 06/12/22 |
185,000 |
188,971 |
|||||||||
|
5.700%, due 08/15/35 |
125,000 |
129,609 |
|||||||||
|
6.750%, due 06/15/17 |
655,000 |
715,750 |
|||||||||
|
RJ Reynolds Tobacco Co., 3.750%, due 05/20/23 |
155,000 |
150,649 |
|||||||||
|
SABMiller Holdings, Inc., 3.750%, due 01/15/221 |
590,000 |
609,620 |
|||||||||
|
Santander Holdings USA, Inc., 3.000%, due 09/24/15 |
605,000 |
606,670 |
|||||||||
|
Sempra Energy, 6.000%, due 10/15/39 |
430,000 |
508,760 |
|||||||||
|
Southwestern Electric Power Co., 6.200%, due 03/15/40 |
575,000 |
694,131 |
|||||||||
|
Southwestern Energy Co., 4.050%, due 01/23/20 |
165,000 |
169,569 |
|||||||||
|
SunTrust Banks, Inc., 1.350%, due 02/15/17 |
790,000 |
789,500 |
|||||||||
|
2.350%, due 11/01/18 |
550,000 |
553,487 |
|||||||||
|
Swiss Re Treasury US Corp., 4.250%, due 12/06/421 |
250,000 |
241,219 |
|||||||||
|
Teachers Insurance & Annuity Association of America, 4.900%, due 09/15/441 |
295,000 |
300,830 |
|||||||||
|
Thermo Fisher Scientific, Inc., 3.300%, due 02/15/22 |
155,000 |
153,168 |
|||||||||
|
5.300%, due 02/01/44 |
175,000 |
184,962 |
|||||||||
|
Time Warner Cable, Inc., 4.500%, due 09/15/42 |
315,000 |
256,946 |
|||||||||
|
5.000%, due 02/01/20 |
1,120,000 |
1,209,167 |
|||||||||
|
Transocean, Inc., 6.500%, due 11/15/205 |
1,505,000 |
1,394,006 |
|||||||||
|
6.800%, due 03/15/385 |
320,000 |
239,200 |
|||||||||
|
Tyson Foods, Inc., 3.950%, due 08/15/24 |
550,000 |
554,036 |
|||||||||
|
United Airlines Pass Through Trust, Series 2014-1, Class A, 4.000%, due 04/11/26 |
435,000 |
439,350 |
|||||||||
|
United Technologies Corp., 1.250%, due 05/22/23 |
EUR |
310,000 |
335,546 |
||||||||
|
US Bancorp, 1.650%, due 05/15/17 |
$ |
365,000 |
369,398 |
||||||||
|
Valero Energy Corp., 6.625%, due 06/15/37 |
570,000 |
643,764 |
|||||||||
|
Ventas Realty LP, 3.500%, due 02/01/25 |
215,000 |
206,658 |
|||||||||
25
UBS Dynamic Alpha Fund
Portfolio of investments
June 30, 2015
|
Face amount |
Value |
||||||||||
|
Bonds—(Concluded) |
|||||||||||
|
Corporate bonds—(Concluded) |
|||||||||||
|
United States—(Concluded) |
|||||||||||
|
Verizon Communications, Inc., 2.625%, due 02/21/20 |
$ |
1,192,000 |
$ |
1,189,320 |
|||||||
|
3.000%, due 11/01/21 |
240,000 |
236,771 |
|||||||||
|
4.500%, due 09/15/20 |
525,000 |
566,336 |
|||||||||
|
6.550%, due 09/15/43 |
1,180,000 |
1,380,310 |
|||||||||
|
Virginia Electric & Power Co., Series A, 6.000%, due 05/15/37 |
290,000 |
352,237 |
|||||||||
|
Wachovia Corp., 5.750%, due 02/01/18 |
1,380,000 |
1,524,105 |
|||||||||
|
Walgreens Boots Alliance, Inc., 3.800%, due 11/18/24 |
450,000 |
440,720 |
|||||||||
|
Waste Management, Inc., 4.100%, due 03/01/45 |
510,000 |
465,207 |
|||||||||
|
Williams Partners LP, 4.300%, due 03/04/24 |
485,000 |
477,006 |
|||||||||
|
Xcel Energy, Inc., 4.800%, due 09/15/41 |
260,000 |
269,636 |
|||||||||
|
Yum! Brands, Inc., 5.350%, due 11/01/43 |
415,000 |
398,416 |
|||||||||
|
Zimmer Biomet Holdings, Inc., 3.150%, due 04/01/22 |
360,000 |
354,116 |
|||||||||
|
4.450%, due 08/15/45 |
435,000 |
399,007 |
|||||||||
|
Total United States corporate bonds |
87,335,245 |
||||||||||
|
Virgin Islands, British: 0.07% |
|||||||||||
|
CNPC General Capital Ltd., 3.400%, due 04/16/231,5 |
250,000 |
243,195 |
|||||||||
|
Total corporate bonds (cost $195,383,140) |
188,375,118 |
||||||||||
|
Collateralized debt obligation: 0.00%6 |
|||||||||||
|
Cayman Islands: 0.00%6 |
|||||||||||
|
LNR CDO Ltd., Series 2006-1A, Class FFX, 7.592%, due 05/28/437 (cost $8,105,403) |
8,000,000 |
0 |
|||||||||
|
Mortgage & agency debt security: 0.01% |
|||||||||||
|
United States: 0.01% |
|||||||||||
|
Structured Adjustable Rate Mortgage Loan Trust, Series 2005-7, Class B11, 2.546%, due 04/25/353 (cost $65,226) |
532,435 |
29,042 |
|||||||||
|
Face amount |
Value |
||||||||||
|
Non-US government obligations: 5.77% |
|||||||||||
|
Australia: 5.27% |
|||||||||||
|
Government of Australia, 4.250%, due 07/21/17 |
AUD |
7,482,000 |
$ |
6,029,791 |
|||||||
|
4.500%, due 04/15/20 |
7,276,000 |
6,171,848 |
|||||||||
|
4.750%, due 06/15/16 |
6,440,000 |
5,100,619 |
|||||||||
|
17,302,258 |
|||||||||||
|
Italy: 0.50% |
|||||||||||
|
Buoni Poliennali Del Tesoro, 4.500%, due 07/15/15 |
EUR |
1,455,000 |
1,624,931 |
||||||||
|
Total Non-US government obligations (cost $21,763,453) |
18,927,189 |
||||||||||
|
Supranational bonds: 0.42% |
|||||||||||
|
Asian Development Bank, 1.000%, due 12/15/15 |
180,000 |
283,243 |
|||||||||
|
European Investment Bank, 3.000%, due 12/07/15 |
250,000 |
396,674 |
|||||||||
|
Inter-American Development Bank, 0.625%, due 12/15/15 |
225,000 |
353,439 |
|||||||||
|
International Finance Corp., 0.625%, due 12/15/15 |
235,000 |
369,052 |
|||||||||
|
Total supranational bonds (cost $1,394,047) |
1,402,408 |
||||||||||
|
Total bonds (cost $226,711,269) |
208,733,757 |
||||||||||
|
Shares |
|||||||||||
|
Short-term investments: 23.35% |
|||||||||||
|
Investment company: 8.05% |
|||||||||||
|
UBS Cash Management Prime Relationship Fund9 (cost $26,421,851) |
26,421,851 |
26,421,851 |
|||||||||
|
Face amount |
|||||||||||
|
US government obligations: 15.30% |
|||||||||||
|
US Treasury Bills 0.095%, due 02/04/168 |
$ |
34,000,000 |
33,981,470 |
||||||||
|
0.050%, due 10/15/155,8 |
6,600,000 |
6,599,611 |
|||||||||
|
0.156%, due 09/17/155,8 |
9,600,000 |
9,600,000 |
|||||||||
|
Total US government obligations (cost $50,176,224) |
50,181,081 |
||||||||||
|
Total short-term investments (cost $76,598,075) |
76,602,932 |
||||||||||
26
UBS Dynamic Alpha Fund
Portfolio of investments
June 30, 2015
|
Number of contracts |
Value |
||||||||||
|
Options purchased : 0.87% |
|||||||||||
|
Call options: 0.38% |
|||||||||||
|
EURO STOXX 50 Index, strike @ EUR 3,600.00, expires August 2015 |
678 |
$ |
549,516 |
||||||||
|
EURO STOXX 50 Index, strike @ EUR 3,600.00, expires September 2015 |
678 |
693,131 |
|||||||||
|
1,242,647 |
|||||||||||
|
Put options: 0.49% |
|||||||||||
|
E-mini S&P 500 Index, strike @ USD 2,000.00, expires July 2015 |
235 |
305,500 |
|||||||||
|
EURO STOXX 50 Index, strike @ EUR 2,500.00, expires September 2015 |
1,707 |
157,953 |
|||||||||
|
Number of contracts |
Value |
||||||||||
|
S&P 500 Index, strike @ USD 1,700.00, expires December 2016 |
156 |
$ |
1,146,600 |
||||||||
|
1,610,053 |
|||||||||||
|
Total options purchased (cost $3,254,027) |
2,852,700 |
||||||||||
|
Investment of cash collateral from securities loaned: 0.48% |
|||||||||||
|
UBS Private Money Market Fund LLC9 (cost $1,558,438) |
1,558,438 |
1,558,438 |
|||||||||
|
Total investments: 88.32% (cost $308,121,809) |
289,747,827 |
||||||||||
|
Cash and other assets, less liabilities: 11.68% |
38,320,798 |
||||||||||
|
Net assets: 100.00% |
$ |
328,068,625 |
|||||||||
Notes to portfolio of investments
Aggregate cost for federal income tax purposes was $307,766,891; and net unrealized depreciation consisted of:
|
Gross unrealized appreciation |
$ |
1,469,628 |
|||||
|
Gross unrealized depreciation |
(19,488,692 |
) |
|||||
|
Net unrealized depreciation of investments |
$ |
(18,019,064 |
) |
||||
For a listing of defined portfolio acronyms, counterparty abbreviations and currency abbreviations that are used throughout the Portfolio of investments as well as the tables that follow, please refer to page 61. Portfolio footnotes begin on page 31.
Forward foreign currency contracts
|
Counterparty |
Contracts to deliver |
In exchange for |
Maturity date |
Unrealized appreciation/ (depreciation) |
|||||||||||||||
|
CIBC |
CHF |
19,265,000 |
USD |
20,719,844 |
09/11/15 |
$ |
56,153 |
||||||||||||
|
CIBC |
EUR |
47,555,000 |
USD |
53,756,362 |
09/11/15 |
685,776 |
|||||||||||||
|
CIBC |
GBP |
17,940,000 |
USD |
27,588,491 |
09/11/15 |
(585,077 |
) |
||||||||||||
|
CIBC |
USD |
6,617,336 |
GBP |
4,195,000 |
09/11/15 |
(29,369 |
) |
||||||||||||
|
CIBC |
USD |
12,364,020 |
MXN |
193,330,000 |
09/11/15 |
(126,519 |
) |
||||||||||||
|
CIBC |
USD |
9,146,846 |
SEK |
75,480,000 |
09/11/15 |
(27,949 |
) |
||||||||||||
|
JPMCB |
CAD |
4,165,000 |
USD |
3,329,015 |
09/11/15 |
(2,410 |
) |
||||||||||||
|
JPMCB |
EUR |
11,940,000 |
CHF |
12,350,617 |
09/11/15 |
(77,536 |
) |
||||||||||||
|
JPMCB |
EUR |
875,000 |
USD |
978,583 |
09/11/15 |
2,097 |
|||||||||||||
|
JPMCB |
HKD |
18,695,000 |
USD |
2,411,296 |
09/11/15 |
(287 |
) |
||||||||||||
|
MSCI |
USD |
9,847,273 |
NZD |
14,455,000 |
09/11/15 |
(112,384 |
) |
||||||||||||
|
SSB |
AUD |
27,165,000 |
USD |
20,840,336 |
09/11/15 |
(36,160 |
) |
||||||||||||
|
SSB |
KRW |
16,031,000,000 |
USD |
14,392,423 |
09/11/15 |
44,533 |
|||||||||||||
|
SSB |
MYR |
48,082,000 |
USD |
12,899,262 |
09/11/15 |
225,695 |
|||||||||||||
|
SSB |
NZD |
27,745,000 |
USD |
19,626,813 |
09/11/15 |
941,618 |
|||||||||||||
|
SSB |
USD |
12,401,931 |
INR |
809,350,000 |
09/11/15 |
125,437 |
|||||||||||||
|
SSB |
USD |
6,851,276 |
PHP |
308,650,000 |
09/11/15 |
(32,914 |
) |
||||||||||||
|
Net unrealized appreciation on forward foreign currency contracts |
$ |
1,050,704 |
|||||||||||||||||
27
UBS Dynamic Alpha Fund
Portfolio of investments
June 30, 2015
Futures contracts
|
Expiration date |
Cost/ (proceeds) |
Value |
Unrealized appreciation/ (depreciation) |
||||||||||||||||
|
US Treasury futures buy contracts: |
|||||||||||||||||||
|
5 Year US Treasury Notes, 15 contracts (USD) |
September 2015 |
$ |
1,789,592 |
$ |
1,788,867 |
$ |
(725 |
) |
|||||||||||
|
10 Year US Treasury Notes, 104 contracts (USD) |
September 2015 |
13,088,809 |
13,121,875 |
33,066 |
|||||||||||||||
|
US Treasury futures sell contracts: |
|||||||||||||||||||
|
US Ultra Bond, 16 contracts (USD) |
September 2015 |
(2,537,477 |
) |
(2,465,000 |
) |
72,477 |
|||||||||||||
|
2 Year US Treasury Notes, 228 contracts (USD) |
September 2015 |
(49,810,736 |
) |
(49,917,750 |
) |
(107,014 |
) |
||||||||||||
|
5 Year US Treasury Notes, 446 contracts (USD) |
September 2015 |
(53,102,473 |
) |
(53,188,985 |
) |
(86,512 |
) |
||||||||||||
|
10 Year US Treasury Notes, 443 contracts (USD) |
September 2015 |
(56,153,324 |
) |
(55,894,140 |
) |
259,184 |
|||||||||||||
|
Index futures buy contracts: |
|||||||||||||||||||
|
DAX Index, 41 contracts (EUR) |
September 2015 |
12,398,712 |
12,571,648 |
172,936 |
|||||||||||||||
|
FTSE 100 Index, 64 contracts (GBP) |
September 2015 |
6,661,369 |
6,530,366 |
(131,003 |
) |
||||||||||||||
|
Hong Kong Hang Seng Index, 194 contracts (HKD) |
July 2015 |
16,623,571 |
16,173,862 |
(449,709 |
) |
||||||||||||||
|
KOSPI 200 Index, 82 contracts (KRW) |
September 2015 |
9,360,668 |
9,271,818 |
(88,850 |
) |
||||||||||||||
|
MSCI Taiwan Index, 147 contracts (USD) |
July 2015 |
5,049,994 |
5,031,810 |
(18,184 |
) |
||||||||||||||
|
Russell 2000 Mini Index, 132 contracts (USD) |
September 2015 |
16,666,637 |
16,505,280 |
(161,357 |
) |
||||||||||||||
|
S&P 500 Index, 19 contracts (USD) |
September 2015 |
9,979,569 |
9,758,399 |
(221,170 |
) |
||||||||||||||
|
TOPIX Index, 219 contracts (JPY) |
September 2015 |
29,901,842 |
29,176,738 |
(725,104 |
) |
||||||||||||||
|
Index futures sell contracts: |
|||||||||||||||||||
|
FTSE China A50 Index, 373 contracts (USD) |
July 2015 |
(4,387,041 |
) |
(4,628,930 |
) |
(241,889 |
) |
||||||||||||
|
Mini MSCI Emerging Markets Index, 489 contracts (USD) |
September 2015 |
(23,448,246 |
) |
(23,457,330 |
) |
(9,084 |
) |
||||||||||||
|
OMXS30 Index, 679 contracts (SEK) |
July 2015 |
(12,744,611 |
) |
(12,628,072 |
) |
116,539 |
|||||||||||||
|
Interest rate futures buy contracts: |
|||||||||||||||||||
|
Australian Government 10 Year Bond, 165 contracts (AUD) |
September 2015 |
15,842,836 |
15,946,501 |
103,665 |
|||||||||||||||
|
Canadian Government 10 Year Bond, 16 contracts (CAD) |
September 2015 |
1,777,597 |
1,793,434 |
15,837 |
|||||||||||||||
|
Euro-Bund, 13 contracts (EUR) |
September 2015 |
2,175,848 |
2,202,944 |
27,096 |
|||||||||||||||
|
Long Gilt, 54 contracts (GBP) |
September 2015 |
9,912,405 |
9,819,401 |
(93,004 |
) |
||||||||||||||
|
Interest rate futures sell contracts: |
|||||||||||||||||||
|
Euro-Bund, 58 contracts (EUR) |
September 2015 |
(9,807,695 |
) |
(9,828,517 |
) |
(20,822 |
) |
||||||||||||
|
Japanese Government 10 Year Bond, 21 contracts (JPY) |
September 2015 |
(25,182,622 |
) |
(25,218,532 |
) |
(35,910 |
) |
||||||||||||
|
Long Gilt, 2 contracts (GBP) |
September 2015 |
(367,213 |
) |
(363,681 |
) |
3,532 |
|||||||||||||
|
Net unrealized depreciation on futures contracts |
$ |
(1,586,005 |
) |
||||||||||||||||
Interest rate swap agreements
|
Counterparty |
Notional amount |
Termination date |
Payments made by the Fund10 |
Payments received by the Fund10 |
Upfront payments |
Value |
Unrealized appreciation/ (depreciation) |
||||||||||||||||||||||||
|
DB |
EUR |
32,600,000 |
11/01/21 |
2.698 |
% |
6 month EURIBOR |
$ |
— |
$ |
(5,147,588 |
) |
$ |
(5,147,588 |
) |
|||||||||||||||||
|
GSI |
EUR |
31,200,000 |
06/21/21 |
6 month EURIBOR |
3.325 |
% |
— |
5,499,919 |
5,499,919 |
||||||||||||||||||||||
|
$ |
— |
$ |
352,331 |
$ |
352,331 |
||||||||||||||||||||||||||
28
UBS Dynamic Alpha Fund
Portfolio of investments
June 30, 2015
Credit default swaps on corporate issues—buy protection11
|
Counterparty |
Referenced obligation12 |
Notional amount |
Termination date |
Payments made by the Fund10 |
Upfront payments received |
Value |
Unrealized appreciation/ (depreciation) |
||||||||||||||||||||||||
|
BB |
METRO AG bond, 3.375%, due 03/01/19 |
EUR |
455,000 |
06/20/20 |
1.000 |
% |
$ |
2,850 |
$ |
(1,848 |
) |
$ |
1,002 |
||||||||||||||||||
|
CITI |
HSBC Bank PLC bond, 4.000%, due 01/15/21 |
EUR |
325,000 |
03/20/20 |
1.000 |
9,838 |
(5,371 |
) |
4,467 |
||||||||||||||||||||||
|
JPMCB |
Bayer AG bond, 5.625%, due 05/23/18 |
EUR |
585,000 |
03/20/18 |
1.000 |
6,780 |
(13,843 |
) |
(7,063 |
) |
|||||||||||||||||||||
|
JPMCB |
Pfizer Inc. bond, 4.650%, due 03/01/18 |
USD |
1,345,000 |
06/20/20 |
1.000 |
52,421 |
(49,652 |
) |
2,769 |
||||||||||||||||||||||
|
$ |
71,889 |
$ |
(70,714 |
) |
$ |
1,175 |
|||||||||||||||||||||||||
Credit default swaps on corporate issues—sell protection13
|
Counterparty |
Referenced obligation12 |
Notional amount |
Termination date |
Payments received by the Fund10 |
Upfront Payments (made)/ received |
Value |
Unrealized appreciation/ (depreciation) |
Credit spread14 |
|||||||||||||||||||||||||||
|
CITI |
Glencore International AG bond, 6.500%, due 02/27/19 |
EUR |
355,000 |
06/20/19 |
1.000 |
% |
$ |
18,351 |
$ |
(4,623 |
) |
$ |
13,728 |
1.306 |
% |
||||||||||||||||||||
|
CITI |
Standard Chartered Bank PLC bond, 0.000%, due 10/15/14 |
EUR |
325,000 |
03/20/20 |
1.000 |
(1,134 |
) |
2,077 |
943 |
0.882 |
|||||||||||||||||||||||||
|
GSI |
Freeport-McMoRan, Inc. bond, 3.550%, due 03/01/22 |
USD |
420,000 |
12/20/19 |
1.000 |
18,628 |
(21,072 |
) |
(2,444 |
) |
2.206 |
||||||||||||||||||||||||
|
JPMCB |
Lanxess AG bond, 4.125%, due 05/23/18 |
EUR |
595,000 |
06/20/19 |
1.000 |
7,124 |
12,572 |
19,696 |
0.528 |
||||||||||||||||||||||||||
|
JPMCB |
Portugal Telecom International Finance B.V. bond, 4.375%, due 03/24/17 |
EUR |
445,000 |
09/20/19 |
5.000 |
(72,470 |
) |
8,135 |
(64,335 |
) |
4.593 |
||||||||||||||||||||||||
|
JPMCB |
Teck Resources Limited bond, 3.150%, due 01/15/17 |
USD |
420,000 |
12/20/19 |
1.000 |
37,003 |
(36,807 |
) |
196 |
3.150 |
|||||||||||||||||||||||||
|
JPMCB |
Teck Resources Limited bond, 3.150%, due 01/15/17 |
USD |
90,000 |
03/20/20 |
1.000 |
6,846 |
(9,050 |
) |
(2,204 |
) |
3.363 |
||||||||||||||||||||||||
|
$ |
14,348 |
$ |
(48,768 |
) |
$ |
(34,420 |
) |
||||||||||||||||||||||||||||
Options written
UBS Dynamic Alpha Fund had the following open options written as of June 30, 2015:
|
Put options |
Expiration date |
Premiums received |
Value |
||||||||||||
|
EURO STOXX 50 Index, 1,615 contracts, strike @ EUR 3,200.00 |
September 2015 |
$ |
1,155,635 |
$ |
(1,586,225 |
) |
|||||||||
29
UBS Dynamic Alpha Fund
Portfolio of investments
June 30, 2015
Written options activity for the year ended June 30, 2015 was as follows:
|
Number of contracts |
Premiums received |
||||||||||
|
Options outstanding at June 30, 2014 |
235 |
$ |
1,122,533 |
||||||||
|
Options written |
4,611 |
4,583,030 |
|||||||||
|
Options terminated in closing purchase transactions |
(3,231 |
) |
(4,549,928 |
) |
|||||||
|
Options expired prior to exercise |
— |
— |
|||||||||
|
Options outstanding at June 30, 2015 |
1,615 |
$ |
1,155,635 |
||||||||
The following is a summary of the fair valuations according to the inputs used as of June 30, 2015 in valuing the Fund's investments:
|
Description |
Unadjusted quoted prices in active markets for identical investments (Level 1) |
Other significant observable inputs (Level 2) |
Unobservable inputs (Level 3) |
Total |
|||||||||||||||
|
Assets |
|||||||||||||||||||
|
Corporate bonds |
$ |
— |
$ |
188,375,118 |
$ |
— |
$ |
188,375,118 |
|||||||||||
|
Collateralized debt obligation |
— |
— |
0 |
0 |
|||||||||||||||
|
Mortgage & agency debt security |
— |
29,042 |
— |
29,042 |
|||||||||||||||
|
Non-US government obligations |
— |
18,927,189 |
— |
18,927,189 |
|||||||||||||||
|
Supranational bonds |
— |
1,402,408 |
— |
1,402,408 |
|||||||||||||||
|
Short-term investments |
— |
76,602,932 |
— |
76,602,932 |
|||||||||||||||
|
Investment of cash collateral from securities loaned |
— |
1,558,438 |
— |
1,558,438 |
|||||||||||||||
|
Options purchased |
2,852,700 |
— |
— |
2,852,700 |
|||||||||||||||
|
Forward foreign currency contracts |
— |
2,081,309 |
— |
2,081,309 |
|||||||||||||||
|
Futures contracts |
804,332 |
— |
— |
804,332 |
|||||||||||||||
|
Swap agreements |
— |
5,522,703 |
— |
5,522,703 |
|||||||||||||||
|
Total |
$ |
3,657,032 |
$ |
294,499,139 |
$ |
— |
$ |
298,156,171 |
|||||||||||
|
Liabilities |
|||||||||||||||||||
|
Forward foreign currency contracts |
$ |
— |
$ |
(1,030,605 |
) |
$ |
— |
$ |
(1,030,605 |
) |
|||||||||
|
Futures contracts |
(2,390,337 |
) |
— |
— |
(2,390,337 |
) |
|||||||||||||
|
Swap agreements |
— |
(5,289,854 |
) |
— |
(5,289,854 |
) |
|||||||||||||
|
Options written |
(1,586,225 |
) |
— |
— |
(1,586,225 |
) |
|||||||||||||
|
Total |
$ |
(3,976,562 |
) |
$ |
(6,320,459 |
) |
$ |
— |
$ |
(10,297,021 |
) |
||||||||
At June 30, 2015, there were no transfers between Level 1 and Level 2.
30
UBS Dynamic Alpha Fund
Portfolio of investments
June 30, 2015
Level 3 Rollforward Disclosure
The following is a rollforward of the Fund's investments that were valued using unobservable inputs for the period.
|
Collateralized debt obligation |
Total |
||||||||||
|
Assets |
|||||||||||
|
Beginning balance |
$ |
8,000 |
$ |
8,000 |
|||||||
|
Purchases |
— |
— |
|||||||||
|
Issuances |
— |
— |
|||||||||
|
Sales |
— |
— |
|||||||||
|
Accrued discounts (premiums) |
(3,774 |
) |
(3,774 |
) |
|||||||
|
Total realized gain |
— |
— |
|||||||||
|
Change in net unrealized appreciation/depreciation |
(4,226 |
) |
(4,226 |
) |
|||||||
|
Transfers into Level 3 |
— |
— |
|||||||||
|
Transfers out of Level 3 |
— |
— |
|||||||||
|
Ending balance |
$ |
0 |
$ |
0 |
|||||||
The change in net unrealized appreciation/depreciation relating to the Level 3 investments held at June 30, 2015 was $(4,226).
Portfolio footnotes
1 Security exempt from registration pursuant to Rule 144A under the Securities Act of 1933. These securities are considered liquid, unless noted otherwise, and may be resold in transactions exempt from registration, normally to qualified institutional buyers. At June 30, 2015, the value of these securities amounted to $16,066,613 or 4.90% of net assets.
2 Security exempt from registration pursuant to Regulation S under the Securities Act of 1933. Regulation S applies to securities offerings that are made outside of the United States and do not involve direct selling efforts in the United States. At June 30, 2015, the value of these securities amounted to $27,882,001 or 8.50% of net assets.
3 Variable or floating rate security—The interest rate shown is the current rate as of June 30, 2015 and changes periodically.
4 Perpetual investment. Date shown reflects the next call date.
5 Security, or portion thereof, was on loan at June 30, 2015.
6 Amount represents less than 0.005%.
7 Illiquid investment as of June 30, 2015.
8 Rate shown is the discount rate at the date of purchase.
9 The table below details the Fund's investments in funds advised by the same Advisor as the Fund. The Advisor does not earn a management fee from the affiliated UBS Relationship Funds.
|
Security description |
Value 06/30/14 |
Purchases during the year ended 06/30/15 |
Sales during the year ended 06/30/15 |
Value 06/30/15 |
Net income earned from affiliate for the year ended 06/30/15 |
||||||||||||||||||
|
UBS Cash Management Prime Relationship Fund |
$ |
15,567,483 |
$ |
326,140,078 |
$ |
315,285,710 |
$ |
26,421,851 |
$ |
25,172 |
|||||||||||||
|
UBS Private Money Market Fund LLCa |
816,590 |
14,241,223 |
13,499,375 |
1,558,438 |
113 |
||||||||||||||||||
|
$ |
16,384,073 |
$ |
340,381,301 |
$ |
328,785,085 |
$ |
27,980,289 |
$ |
25,285 |
||||||||||||||
a The Advisor earns a management fee from this affiliated fund. Please see the Notes to financial statements for further information.
10 Payments made or received are based on the notional amount.
31
UBS Dynamic Alpha Fund
Portfolio of investments
June 30, 2015
11 If the Fund is a buyer of protection and a credit event occurs, as defined under the terms of that particular swap agreement, the Fund will either (i) receive from the seller of protection an amount equal to the notional amount of the swap and deliver the referenced obligation or (ii) receive a net settlement amount in the form of cash or securities equal to the notional amount of the swap less the recovery value of the referenced obligation.
12 Payments from/to the counterparty will be received/made upon the occurrence of bankruptcy and/or restructuring event with respect to the referenced obligation.
13 If the Fund is a seller of protection and a credit event occurs, as defined under the terms of that particular swap agreement, the Fund will either (i) pay to the buyer of protection an amount equal to the notional amount of the swap and take delivery of the referenced obligation or (ii) pay a net settlement amount in the form of cash or securities equal to the notional amount of the swap agreement less the recovery value of the referenced obligation.
14 Credit spreads, represented in absolute terms, utilized in determining the market value as of period end serve as an indicator of the current status of the payment/performance risk and represent the likelihood or risk of default or other credit event occurring for the credit derivative. The credit spread of a particular referenced entity reflects the cost of buying/selling protection and may include upfront payments required to be made to enter into the agreement. Wider credit spreads represent a deterioration of the referenced entity's credit soundness and a greater likelihood or risk of default or other credit event occurring as defined under the terms of the agreement. A credit spread identified as "Defaulted" indicates a credit event has occurred for the referenced entity. Credit spreads are unaudited.
See accompanying notes to financial statements.
32
UBS Global Allocation Fund
Portfolio performance
For the 12 months ended June 30, 2015, Class A shares of UBS Global Allocation Fund (the "Fund") gained 2.08% (Class A shares declined 3.51% after the deduction of the maximum sales charge), while Class P shares rose 2.31%. In contrast, the Fund's benchmark, the 60% MSCI All Country World Index (net)/40% Citigroup World Government Bond Index (Hedged in USD), returned 1.95% during the same time period. For comparison purposes, the MSCI All Country World Index (net) returned 0.71% and the Citigroup World Government Bond Index (Hedged in USD) returned 3.54% over the same period. (Class P shares have lower expenses than other share classes of the Fund. Returns for all share classes over various time periods are shown on page 35; please note that these returns do not reflect the deduction of taxes that a shareholder would pay on Fund distributions or the redemption of Fund shares, while the Index returns do not reflect the deduction of fees and expenses.)
The Fund produced a positive absolute return during the reporting period and slightly outperformed the benchmark. Positive performance was primarily due to our active currency strategy and bottom-up security selection.
During the reporting period, we used derivatives for risk management purposes and as a tool to help enhance returns across various strategies. With respect to our active currency strategy, utilizing currency forwards had a direct positive impact on Fund performance. We used a variety of equity and fixed income options, futures and swaps to implement our market allocation strategy. Derivatives were just one tool, among others, that we used to implement our market allocation strategy. These derivatives, in aggregate, contributed to performance during the reporting period.
Portfolio performance summary1
What worked:
• Certain active equity positions added to performance.
– The Fund's overweight to Japanese equities significantly added to performance over the reporting period. Japanese equities rallied amid monetary policy easing by the Bank of Japan.
– The Fund also benefited from a relative value trade of long German equities versus Swedish equities, as European equities stand to benefit from easing by the European Central Bank and a weakening currency.
• Certain active fixed income positions were positive for performance.
– Throughout the period, the Fund maintained a significant underweight to US bonds, which was the correct asset allocation decision, as US bonds underperformed other asset classes.
– The Fund held an overweight position in UK government bonds, which was additive for results.
– The Fund's underweight to Japanese bonds was beneficial, as yields on Japanese government bonds rose during the period, resulting in falling bond prices.
1 For a detailed commentary on the market environment in general during the reporting period, see page 3.
33
UBS Global Allocation Fund
• Overall, the Fund's active currency positions were additive for performance.
– The Fund maintained an overweight to the US dollar relative to commodity currencies such as the New Zealand dollar and Australian dollar. This significantly added to performance.
• Overall, the Fund's bottom-up security selection was positive for results.
– Strong security selection came within US equities and emerging market equities.
What didn't work:
• Certain equity trades detracted from performance during the reporting period.
– An underweight to US equities negatively impacted performance as periods of weak global growth outside of the US caused a flight to quality.
– The Fund's relative value trade of long Canadian equities versus Australian equities detracted from performance, as falling oil prices caused Canadian equity markets to underperform Australian markets.
• Certain fixed income allocations detracted from results.
– The Fund was positioned with the expectation that the yield curve in the US was going to flatten as the Federal Reserve Board approaches normalization of their interest rate policy. Instead, the US central bank was rather dovish in their June meeting, causing the yield curve to steepen, and we closed the trade.
– Performance was also negatively impacted by a long position in Australian bonds, which gave back some of their gains from earlier periods.
• Certain active currency positions were negative for results relative to the benchmark.
– The Fund's trade of long Japanese yen versus the US dollar and euro detracted from performance, as the yen significantly depreciated after Bank of Japan action during the reporting period.
This letter is intended to assist shareholders in understanding how the Fund performed during the 12 months ended June 30, 2015. The views and opinions in the letter were current as of August 14, 2015. They are not guarantees of future performance or investment results and should not be taken as investment advice. Investment decisions reflect a variety of factors, and we reserve the right to change our views about individual securities, sectors and markets at any time. As a result, the views expressed should not be relied upon as a forecast of the Fund's future investment intent. We encourage you to consult your financial advisor regarding your personal investment program.
Mutual funds are sold by prospectus only. You should read it carefully and consider a fund's investment objectives, risks, charges, expenses and other important information contained in the prospectus before investing. Prospectuses for most of our funds can be obtained from your financial advisor, by calling UBS Funds at 800-647 1568 or by visiting our Web site at www.ubs.com.
34
UBS Global Allocation Fund
Average annual total returns for periods ended 06/30/15 (unaudited)
|
1 year |
5 years |
10 years |
|||||||||||||
|
Before deducting maximum sales charge |
|||||||||||||||
|
Class A1 |
2.08 |
% |
8.13 |
% |
4.13 |
% |
|||||||||
|
Class C2 |
1.20 |
7.26 |
3.31 |
||||||||||||
|
Class P3 |
2.31 |
8.42 |
4.41 |
||||||||||||
|
After deducting maximum sales charge |
|||||||||||||||
|
Class A1 |
(3.51 |
)% |
6.92 |
% |
3.54 |
% |
|||||||||
|
Class C2 |
0.20 |
7.26 |
3.31 |
||||||||||||
|
MSCI All Country World Index (net)4 |
0.71 |
% |
11.93 |
% |
6.41 |
% |
|||||||||
|
Citigroup World Government Bond Index (Hedged in USD)5 |
3.54 |
3.49 |
4.07 |
||||||||||||
|
60% MSCI All Country World Index (net)/40% Citigroup World Government Bond Index (Hedged in USD)6 |
1.95 |
8.75 |
5.87 |
||||||||||||
The annualized gross and net expense ratios, respectively, for each class of shares as in the October 28, 2014 prospectuses were as follows: Class A—1.36% and 1.36%; Class C—2.14% and 2.14%; Class P—1.06% and 1.06%. Net expenses reflect fee waivers and/or expense reimbursements, if any, pursuant to an agreement that is in effect to cap the expenses. The Trust, with respect to the Fund, and UBS Global Asset Management (Americas) Inc., the Fund's investment advisor ("UBS Global AM (Americas)" or the "Advisor"), have entered into a written agreement pursuant to which the Advisor has agreed to waive a portion of its management fees and/or to reimburse expenses (excluding expenses incurred through investment in other investment companies, interest, taxes, brokerage commissions, and extraordinary expenses) to the extent necessary so that the Fund's ordinary operating expenses (excluding expenses incurred through investment in other investment companies, interest, taxes, brokerage commissions, and extraordinary expenses), through the period ending October 27, 2015, do not exceed 1.35% for Class A shares, 2.10% for Class C shares and 1.10% for Class P shares. Pursuant to the written agreement, the Advisor is entitled to be reimbursed for any fees it waives and expenses it reimburses for a period of three years following such fee waivers and expense reimbursements to the extent that such reimbursement of the Advisor by the Fund will not cause the Fund to exceed any applicable expense limit that is in place for the Fund. The fee waiver/expense reimbursement agreement may be terminated by the Fund's Board of Trustees at any time and also will terminate automatically upon the expiration or termination of the Fund's advisory contract with the Advisor. Upon termination of the fee waiver/expense reimbursement agreement, however, UBS Global AM (Americas)'s three year recoupment rights will survive.
1 Maximum sales charge for Class A shares is 5.5%. Class A shares bear ongoing 12b-1 service fees.
2 Maximum contingent deferred sales charge for Class C shares is 1% imposed on redemptions and is reduced to 0% after one year. Class C shares bear ongoing 12b-1 distribution and service fees.
3 Class P shares do not bear initial or contingent deferred sales charges or ongoing 12b-1 service and distribution fees, but Class P shares held through advisory programs may be subject to a program fee, which, if included, would have reduced performance.
4 The MSCI All Country World Index (net) is a free float-adjusted market capitalization weighted index that is designed to measure the equity market performance of developed and emerging markets. Net total return indices reinvest dividends after the deduction of withholding taxes, using a tax rate applicable to non-resident institutional investors who do not benefit from double taxation treaties. The index is constructed and managed with a view to being fully investable from the perspective of international institutional investors. Investors should note that indices do not reflect the deduction of fees and expenses.
5 The Citigroup World Government Bond Index (Hedged in USD) is an unmanaged market capitalization-weighted index designed to measure the performance of fixed-rate, local currency, investment-grade sovereign bonds with a one-year minimum maturity and is hedged back to the US dollar. Investors should note that indices do not reflect the deduction of fees and expenses.
6 The 60% MSCI All Country World Index (net)/40% Citigroup World Government Bond Index (Hedged in USD) is a unmanaged blended index compiled by the Advisor. Investors should note that indices do not reflect the deduction of fees and expenses.
Prior to February 17, 2015, if an investor sold or exchanged shares less than 90 days after purchase, a redemption fee of 1.00% of the amount sold or exchanged was deducted at the time of the transaction, except as noted otherwise in the prospectus. For sales or exchanges taking place on or after February 17, 2015 but prior to August 3, 2015, there is a reduction in the redemption holding period from 90 days to 30 days. Effective August 3, 2015, the 1.00% redemption fee imposed on sales or exchanges of any class of shares of the funds made during the holding periods specified in the prospectus will be eliminated. Please refer to the prospectus for further information.
Past performance does not predict future performance, and the performance information provided does not reflect the deduction of taxes that a shareholder would pay on Fund distributions or the redemption of Fund shares. The return and principal value of an investment will fluctuate, so that an investor's shares, when redeemed, may be worth more or less than their original cost. Performance results assume reinvestment of all dividends and capital gain distributions at net asset value on the ex-dividend dates. Current performance may be higher or lower than the performance data quoted. For month-end performance figures, please visit http://globalam-us.ubs.com/corpweb/performance.do.
35
UBS Global Allocation Fund
Illustration of an assumed investment of $10,000 in Class A shares (adjusted for 5.5% maximum sales charge) and $5,000,000 in Class P shares (unaudited)
The following two graphs depict the performance of UBS Global Allocation Fund Class A and Class P shares versus the MSCI All Country World Index (net), Citigroup World Government Bond Index (Hedged in USD), and the 60% MSCI All Country World Index (net)/40% Citigroup World Government Bond Index (Hedged in USD) over the 10 years ended June 30, 2015. The performance of Class C shares will vary based upon the different class specific expenses and sales charges. The performance provided does not reflect the deduction of taxes that a shareholder would pay on Fund distributions or the redemption of Fund shares. Past performance is no guarantee of future results. Share price and returns will vary with market conditions; investors may realize a gain or loss upon redemption.
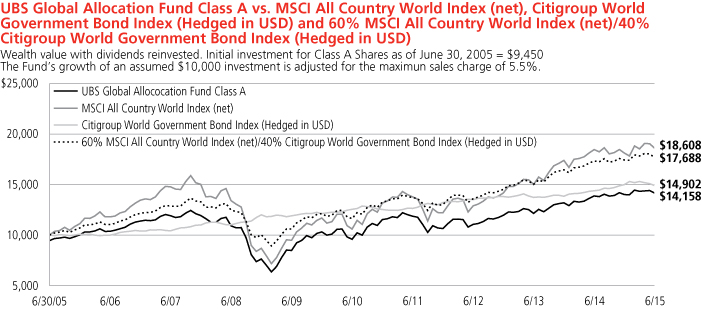
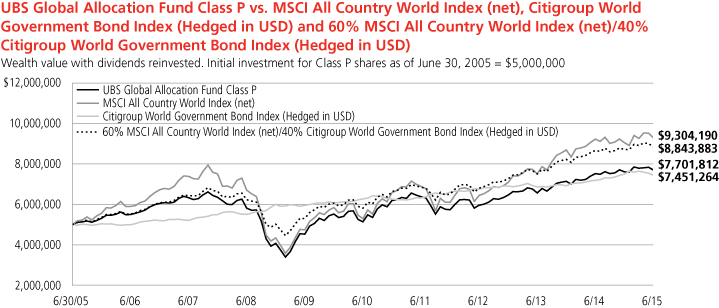
Past performance does not predict future performance, and the performance information provided does not reflect the deduction of taxes that a shareholder would pay on Fund distributions or the redemption of Fund shares. The return and principal value of an investment will fluctuate, so that an investor's shares, when redeemed, may be worth more or less than their original cost. Performance results assume reinvestment of all dividends and capital gain distributions at net asset value on the ex-dividend dates. Current performance may be higher or lower than the performance data quoted. For month-end performance figures, please visit http://globalam-us.ubs.com/corpweb/performance.do.
36
UBS Global Allocation Fund
Top ten equity holdings (unaudited)1
As of June 30, 2015
|
Percentage of net assets |
|||||||
|
Apple, Inc. |
1.1 |
% |
|||||
|
Novartis AG |
0.8 |
||||||
|
Facebook, Inc., Class A |
0.7 |
||||||
|
KDDI Corp. |
0.6 |
||||||
|
AIA Group Ltd. |
0.5 |
||||||
|
Toyota Motor Corp. |
0.5 |
||||||
|
ING Groep NV CVA |
0.5 |
||||||
|
Shire PLC |
0.5 |
||||||
|
Check Point Software Technologies Ltd. |
0.5 |
||||||
|
Toronto-Dominion Bank |
0.5 |
||||||
|
Total |
6.2 |
% |
|||||
Country exposure by issuer, top five (unaudited)2
As of June 30, 2015
|
Percentage of net assets |
|||||||
|
United States |
22.4 |
% |
|||||
|
Japan |
5.7 |
||||||
|
United Kingdom |
5.2 |
||||||
|
Germany |
2.6 |
||||||
|
Canada |
2.0 |
||||||
|
Total |
37.9 |
% |
|||||
Top ten long-term fixed income holdings (unaudited)1
As of June 30, 2015
|
Percentage of net assets |
|||||||
|
US Treasury Notes, 1.625%, due 12/31/19 |
1.0 |
% |
|||||
|
US Treasury Notes, 0.750%, due 12/31/17 |
1.0 |
||||||
|
US Treasury Bonds, 8.000%, due 11/15/21 |
0.6 |
||||||
|
Buoni Poliennali Del Tesoro, 2.500%, due 12/01/24 |
0.6 |
||||||
|
US Treasury Notes, 3.125%, due 04/30/17 |
0.6 |
||||||
|
New Zealand Government Bond, 4.500%, due 04/15/27 |
0.6 |
||||||
|
Bundesobligation, 1.250%, due 10/14/16 |
0.5 |
||||||
|
Canadian Government Bond, 1.500%, due 06/01/23 |
0.5 |
||||||
|
US Treasury Notes, 1.625%, due 11/15/22 |
0.5 |
||||||
|
UK Gilts, 2.000%, due 01/22/16 |
0.4 |
||||||
|
Total |
6.3 |
% |
|||||
1 Figures represent the direct investments of UBS Global Allocation Fund. Figures may be different if a breakdown of the underlying investment companies was included.
2 Figures represent the direct investments of UBS Global Allocation Fund. If a breakdown of the underlying investment companies was included, the country exposure percentages would be as follows: United States: 27.1%, Japan: 5.7%, United Kingdom: 6.6%, Germany: 2.6%, and Canada: 2.3%.
37
UBS Global Allocation Fund
Industry diversification (unaudited)1
As a percentage of net assets as of June 30, 2015
|
Common stocks |
|||||||
|
Airlines |
0.96 |
% |
|||||
|
Auto components |
1.17 |
||||||
|
Automobiles |
1.03 |
||||||
|
Banks |
4.22 |
||||||
|
Beverages |
0.72 |
||||||
|
Biotechnology |
1.56 |
||||||
|
Building products |
0.01 |
||||||
|
Capital markets |
0.51 |
||||||
|
Chemicals |
1.20 |
||||||
|
Communications equipment |
0.11 |
||||||
|
Construction & engineering |
0.18 |
||||||
|
Construction materials |
0.36 |
||||||
|
Consumer finance |
0.17 |
||||||
|
Diversified financial services |
0.95 |
||||||
|
Diversified telecommunication services |
0.44 |
||||||
|
Electric utilities |
0.12 |
||||||
|
Electrical equipment |
0.53 |
||||||
|
Electronic equipment, instruments & components |
0.89 |
||||||
|
Energy equipment & services |
0.28 |
||||||
|
Food & staples retailing |
0.24 |
||||||
|
Food products |
1.50 |
||||||
|
Health care equipment & supplies |
0.39 |
||||||
|
Health care providers & services |
0.55 |
||||||
|
Hotels, restaurants & leisure |
1.10 |
||||||
|
Household durables |
0.57 |
||||||
|
Industrial conglomerates |
0.74 |
||||||
|
Insurance |
2.28 |
||||||
|
Internet & catalog retail |
0.74 |
||||||
|
Internet software & services |
1.62 |
||||||
|
IT services |
0.75 |
||||||
|
Leisure products |
0.03 |
||||||
|
Life sciences tools & services |
0.35 |
||||||
|
Machinery |
1.10 |
||||||
|
Marine |
0.23 |
||||||
|
Media |
0.98 |
||||||
|
Metals & mining |
1.11 |
||||||
|
Multiline retail |
0.06 |
||||||
|
Multi-utilities |
0.16 |
||||||
|
Oil, gas & consumable fuels |
1.95 |
||||||
|
Paper & forest products |
0.04 |
||||||
|
Personal products |
0.48 |
||||||
|
Pharmaceuticals |
2.56 |
||||||
|
Real estate investment trust (REIT) |
0.56 |
||||||
|
Real estate management & development |
0.53 |
||||||
|
Road & rail |
0.45 |
||||||
|
Semiconductors & semiconductor equipment |
0.93 |
||||||
|
Software |
1.36 |
||||||
|
Specialty retail |
0.84 |
||||||
|
Technology hardware, storage & peripherals |
1.30 |
||||||
|
Textiles, apparel & luxury goods |
1.14 |
% |
|||||
|
Tobacco |
0.55 |
||||||
|
Trading companies & distributors |
0.71 |
||||||
|
Transportation infrastructure |
0.08 |
||||||
|
Wireless telecommunication services |
1.04 |
||||||
|
Total common stocks |
44.43 |
% |
|||||
|
Bonds |
|||||||
|
Mortgage & agency debt securities |
0.14 |
||||||
|
US government obligations |
4.36 |
||||||
|
Non-US government obligations |
6.76 |
||||||
|
Total bonds |
11.26 |
% |
|||||
|
Investment companies |
|||||||
|
iShares JP Morgan USD Emerging Markets Bond ETF |
4.86 |
||||||
|
UBS Emerging Markets Equity Relationship Fund |
6.03 |
||||||
|
UBS Global Corporate Bond Relationship Fund |
10.24 |
||||||
|
Total investment companies |
21.13 |
% |
|||||
|
Warrant |
0.002 |
||||||
|
Short-term investment |
18.26 |
||||||
|
Options purchased |
0.43 |
||||||
|
Investment of cash collateral from securities loaned |
4.59 |
||||||
|
Total investments |
100.10 |
% |
|||||
|
Cash and other assets, less liabilities |
(0.10 |
) |
|||||
|
Net assets |
100.00 |
% |
|||||
1 Figures represent the direct investments of UBS Global Allocation Fund. Figures may be different if a breakdown of the underlying investment companies was included.
2 Amount represents less than 0.005%.
38
UBS Global Allocation Fund
Portfolio of investments
June 30, 2015
|
Shares |
Value |
||||||||||
|
Common stocks: 44.43% |
|||||||||||
|
Australia: 0.38% |
|||||||||||
|
Westfield Corp. |
273,291 |
$ |
1,923,022 |
||||||||
|
Brazil: 0.18% |
|||||||||||
|
BB Seguridade Participacoes SA |
10,000 |
109,678 |
|||||||||
| BRF SA |
10,800 |
228,151 |
|||||||||
|
Cielo SA |
14,160 |
199,573 |
|||||||||
|
Fibria Celulose SA ADR1 |
13,000 |
176,930 |
|||||||||
|
Hypermarcas SA* |
25,600 |
186,333 |
|||||||||
|
Total Brazil common stocks |
900,665 |
||||||||||
|
Canada: 1.48% |
|||||||||||
|
Canadian Oil Sands Ltd. |
104,300 |
843,419 |
|||||||||
|
Canadian Pacific Railway Ltd. |
5,799 |
929,174 |
|||||||||
|
Husky Energy, Inc. |
60,600 |
1,159,114 |
|||||||||
|
Suncor Energy, Inc. |
56,800 |
1,564,388 |
|||||||||
|
Teck Resources Ltd., Class B1 |
61,400 |
608,592 |
|||||||||
|
Toronto-Dominion Bank |
56,100 |
2,382,341 |
|||||||||
|
Total Canada common stocks |
7,487,028 |
||||||||||
|
China: 2.04% |
|||||||||||
|
AIA Group Ltd. |
414,517 |
2,713,875 |
|||||||||
|
Baidu, Inc. ADR* |
820 |
163,245 |
|||||||||
|
Bank of Communications Co., Ltd., H Shares |
572,000 |
596,237 |
|||||||||
|
Beijing Capital International Airport Co., Ltd., H Shares |
232,000 |
267,570 |
|||||||||
|
CAR, Inc.* |
66,000 |
140,488 |
|||||||||
|
China Cinda Asset Management Co., Ltd., H Shares* |
297,000 |
165,520 |
|||||||||
|
China Minsheng Banking Corp. Ltd., H Shares |
137,000 |
179,567 |
|||||||||
|
China Railway Group Ltd., H Shares |
209,000 |
225,675 |
|||||||||
|
China Vanke Co., Ltd. |
147,400 |
362,817 |
|||||||||
|
Cosmo Lady China Holdings Co., Ltd.2 |
192,909 |
190,133 |
|||||||||
|
Dalian Wanda Commercial Properties Co., Ltd., H Shares2 |
21,900 |
176,154 |
|||||||||
|
FIH Mobile Ltd. |
455,000 |
275,293 |
|||||||||
|
Hengan International Group Co., Ltd. |
8,000 |
95,052 |
|||||||||
|
Industrial & Commercial Bank of China Ltd., H Shares |
650,000 |
516,542 |
|||||||||
|
Jardine Matheson Holdings Ltd. |
29,900 |
1,696,450 |
|||||||||
|
Ping An Insurance Group Co. of China Ltd., H Shares |
53,000 |
715,870 |
|||||||||
|
Shimao Property Holdings Ltd. |
140,000 |
276,332 |
|||||||||
|
Tencent Holdings Ltd. |
43,100 |
860,159 |
|||||||||
|
West China Cement Ltd. |
1,174,000 |
227,180 |
|||||||||
|
Zhuzhou CSR Times Electric Co., Ltd., H Shares |
18,000 |
134,915 |
|||||||||
|
Shares |
Value |
||||||||||
|
ZTE Corp., H Shares |
116,160 |
$ |
295,512 |
||||||||
|
Total China common stocks |
10,274,586 |
||||||||||
|
Denmark: 0.50% |
|||||||||||
|
AP Moeller - Maersk A/S, Class B |
654 |
1,184,488 |
|||||||||
|
Danske Bank A/S |
44,816 |
1,317,980 |
|||||||||
|
Total Denmark common stocks |
2,502,468 |
||||||||||
|
Finland: 0.42% |
|||||||||||
|
Sampo Oyj, Class A |
44,516 |
2,096,811 |
|||||||||
|
France: 1.03% |
|||||||||||
|
Danone SA |
31,065 |
2,008,357 |
|||||||||
|
LVMH Moet Hennessy Louis Vuitton SE |
9,262 |
1,622,690 |
|||||||||
|
Schneider Electric SE |
22,643 |
1,563,333 |
|||||||||
|
Total France common stocks |
5,194,380 |
||||||||||
|
Germany: 1.80% |
|||||||||||
|
AIXTRON SE*1 |
63,693 |
430,238 |
|||||||||
|
Bayer AG |
15,036 |
2,104,580 |
|||||||||
|
Daimler AG |
19,102 |
1,738,594 |
|||||||||
|
E.ON SE |
62,224 |
828,977 |
|||||||||
|
HeidelbergCement AG |
15,911 |
1,261,731 |
|||||||||
|
KION Group AG* |
24,603 |
1,178,609 |
|||||||||
|
ThyssenKrupp AG |
59,017 |
1,535,329 |
|||||||||
|
Total Germany common stocks |
9,078,058 |
||||||||||
|
Hong Kong: 0.10% |
|||||||||||
|
PAX Global Technology Ltd.* |
103,000 |
147,759 |
|||||||||
|
Yue Yuen Industrial Holdings Ltd. |
100,000 |
334,772 |
|||||||||
|
Total Hong Kong common stocks |
482,531 |
||||||||||
|
India: 0.25% |
|||||||||||
|
Dr Reddy's Laboratories Ltd. ADR |
5,300 |
293,196 |
|||||||||
|
HDFC Bank Ltd. ADR |
4,000 |
242,120 |
|||||||||
|
ICICI Bank Ltd. ADR |
36,500 |
380,330 |
|||||||||
|
Infosys Ltd. ADR |
11,960 |
189,566 |
|||||||||
|
Tata Motors Ltd. ADR |
4,200 |
144,774 |
|||||||||
|
Total India common stocks |
1,249,986 |
||||||||||
|
Indonesia: 0.05% |
|||||||||||
|
Kalbe Farma Tbk PT |
620,800 |
77,993 |
|||||||||
|
Telekomunikasi Indonesia Persero Tbk PT |
706,300 |
155,219 |
|||||||||
|
Total Indonesia common stocks |
233,212 |
||||||||||
|
Ireland: 0.77% |
|||||||||||
|
Ryanair Holdings PLC ADR |
20,300 |
1,448,405 |
|||||||||
|
Shire PLC |
30,753 |
2,461,937 |
|||||||||
|
Total Ireland common stocks |
3,910,342 |
||||||||||
39
UBS Global Allocation Fund
Portfolio of investments
June 30, 2015
|
Shares |
Value |
||||||||||
|
Common stocks—(Continued) |
|||||||||||
|
Israel: 0.52% |
|||||||||||
|
Check Point Software Technologies Ltd.*1 |
30,800 |
$ |
2,450,140 |
||||||||
|
Teva Pharmaceutical Industries Ltd. ADR |
3,316 |
195,976 |
|||||||||
|
Total Israel common stocks |
2,646,116 |
||||||||||
|
Italy: 0.58% |
|||||||||||
|
Intesa Sanpaolo SpA |
479,862 |
1,739,736 |
|||||||||
|
Mediolanum SpA |
145,574 |
1,200,969 |
|||||||||
|
Total Italy common stocks |
2,940,705 |
||||||||||
|
Japan: 5.74% |
|||||||||||
|
Alps Electric Co., Ltd. |
35,500 |
1,095,007 |
|||||||||
|
Bridgestone Corp. |
30,100 |
1,113,517 |
|||||||||
|
Hino Motors Ltd. |
118,900 |
1,470,888 |
|||||||||
|
Hitachi Ltd. |
228,000 |
1,503,047 |
|||||||||
|
Inpex Corp. |
123,600 |
1,405,314 |
|||||||||
|
Japan Airlines Co., Ltd. |
58,800 |
2,051,526 |
|||||||||
|
KDDI Corp. |
117,600 |
2,838,505 |
|||||||||
|
Mitsubishi UFJ Financial Group, Inc. |
313,800 |
2,255,842 |
|||||||||
|
NGK Spark Plug Co., Ltd. |
50,600 |
1,403,661 |
|||||||||
|
ORIX Corp. |
134,700 |
2,004,238 |
|||||||||
|
Shin-Etsu Chemical Co., Ltd. |
26,500 |
1,645,410 |
|||||||||
|
Sony Corp.* |
68,000 |
1,923,291 |
|||||||||
|
Sumitomo Electric Industries Ltd. |
91,000 |
1,410,524 |
|||||||||
|
Sumitomo Realty & Development Co., Ltd. |
48,000 |
1,683,932 |
|||||||||
|
THK Co., Ltd. |
68,700 |
1,485,314 |
|||||||||
|
Toyota Industries Corp. |
18,200 |
1,038,003 |
|||||||||
|
Toyota Motor Corp. |
39,400 |
2,640,832 |
|||||||||
|
Total Japan common stocks |
28,968,851 |
||||||||||
|
Malaysia: 0.03% |
|||||||||||
|
Axiata Group Bhd |
50,400 |
85,492 |
|||||||||
|
BerMaz Motor Sdn Bhd* |
63,000 |
45,083 |
|||||||||
|
Total Malaysia common stocks |
130,575 |
||||||||||
|
Mexico: 0.09% |
|||||||||||
|
Alsea SAB de CV |
36,000 |
108,704 |
|||||||||
|
Cemex SAB de CV ADR* |
10,397 |
95,237 |
|||||||||
|
Grupo Televisa SAB ADR |
6,100 |
236,802 |
|||||||||
|
Total Mexico common stocks |
440,743 |
||||||||||
|
Netherlands: 1.12% |
|||||||||||
|
Heineken NV |
21,856 |
1,658,605 |
|||||||||
|
ING Groep NV CVA |
158,986 |
2,625,006 |
|||||||||
|
Koninklijke DSM NV |
19,388 |
1,123,965 |
|||||||||
|
NXP Semiconductors NV* |
2,420 |
237,644 |
|||||||||
|
Total Netherlands common stocks |
5,645,220 |
||||||||||
|
Shares |
Value |
||||||||||
|
Norway: 0.31% |
|||||||||||
|
Telenor ASA |
72,420 |
$ |
1,586,868 |
||||||||
|
Peru: 0.03% |
|||||||||||
|
Credicorp Ltd. |
1,160 |
161,147 |
|||||||||
|
Philippines: 0.19% |
|||||||||||
|
Ayala Land, Inc. |
222,800 |
184,308 |
|||||||||
|
Cebu Air, Inc. |
44,900 |
84,642 |
|||||||||
|
GT Capital Holdings, Inc. |
3,715 |
112,546 |
|||||||||
|
Metropolitan Bank & Trust Co. |
106,598 |
222,227 |
|||||||||
|
SM Investments Corp. |
10,481 |
208,039 |
|||||||||
|
Universal Robina Corp. |
30,600 |
131,656 |
|||||||||
|
Total Philippines common stocks |
943,418 |
||||||||||
|
Russia: 0.02% |
|||||||||||
|
Magnit PJSC GDR3 |
2,006 |
111,654 |
|||||||||
|
Singapore: 0.00%4 |
|||||||||||
|
Avago Technologies Ltd. |
200 |
26,586 |
|||||||||
|
South Africa: 0.20% |
|||||||||||
|
Aspen Pharmacare Holdings Ltd.* |
6,030 |
178,432 |
|||||||||
|
Naspers Ltd., Class N |
4,166 |
648,904 |
|||||||||
|
Nedbank Group Ltd. |
8,154 |
162,061 |
|||||||||
|
Total South Africa common stocks |
989,397 |
||||||||||
|
South Korea: 0.77% |
|||||||||||
|
Amorepacific Corp. |
1,551 |
581,217 |
|||||||||
|
BGF retail Co., Ltd. |
3,078 |
441,508 |
|||||||||
|
CJ Korea Express Co., Ltd.* |
737 |
128,180 |
|||||||||
|
Cosmax, Inc. |
1,458 |
263,380 |
|||||||||
|
Coway Co., Ltd. |
1,064 |
87,184 |
|||||||||
|
Daewoo Securities Co., Ltd. |
6,066 |
82,932 |
|||||||||
|
Hana Tour Service, Inc. |
1,030 |
117,733 |
|||||||||
|
Hansae Co., Ltd. |
4,832 |
165,261 |
|||||||||
|
Hanssem Co., Ltd. |
2,082 |
524,490 |
|||||||||
|
Hotel Shilla Co., Ltd. |
1,902 |
190,123 |
|||||||||
|
Hyundai Development Co.—Engineering & Construction |
11,243 |
667,252 |
|||||||||
|
Korea Electric Power Corp. |
4,143 |
170,110 |
|||||||||
|
LG Hausys Ltd. |
535 |
71,464 |
|||||||||
|
Samsung Electronics Co., Ltd. |
202 |
229,626 |
|||||||||
|
SK Innovation Co., Ltd.* |
1,694 |
185,278 |
|||||||||
|
Total South Korea common stocks |
3,905,738 |
||||||||||
|
Spain: 0.92% |
|||||||||||
|
Banco Santander SA |
223,905 |
1,563,623 |
|||||||||
|
Bankia SA* |
897,974 |
1,139,259 |
|||||||||
|
Mediaset Espana Comunicacion SA |
148,836 |
1,950,505 |
|||||||||
|
Total Spain common stocks |
4,653,387 |
||||||||||
40
UBS Global Allocation Fund
Portfolio of investments
June 30, 2015
|
Shares |
Value |
||||||||||
|
Common stocks—(Continued) |
|||||||||||
|
Sweden: 0.17% |
|||||||||||
|
Lundin Petroleum AB* |
49,262 |
$ |
843,828 |
||||||||
|
Switzerland: 1.47% |
|||||||||||
|
ACE Ltd. |
2,600 |
264,368 |
|||||||||
|
Glencore PLC* |
364,112 |
1,460,599 |
|||||||||
|
Novartis AG |
42,908 |
4,229,073 |
|||||||||
|
Zurich Insurance Group AG* |
4,751 |
1,446,211 |
|||||||||
|
Total Switzerland common stocks |
7,400,251 |
||||||||||
|
Taiwan: 0.48% |
|||||||||||
|
Catcher Technology Co., Ltd. |
31,000 |
387,820 |
|||||||||
|
Cathay Financial Holding Co., Ltd.* |
50,000 |
87,346 |
|||||||||
|
CTBC Financial Holding Co., Ltd. |
184,000 |
144,912 |
|||||||||
|
Hon Hai Precision Industry Co., Ltd. |
22,000 |
69,163 |
|||||||||
|
Johnson Health Tech Co., Ltd. |
66,000 |
153,372 |
|||||||||
|
Largan Precision Co., Ltd. |
6,000 |
685,475 |
|||||||||
|
Pegatron Corp. |
23,000 |
67,313 |
|||||||||
|
President Chain Store Corp. |
29,000 |
203,957 |
|||||||||
|
Taiwan Semiconductor Manufacturing Co., Ltd. ADR |
27,900 |
633,609 |
|||||||||
|
Total Taiwan common stocks |
2,432,967 |
||||||||||
|
Thailand: 0.07% |
|||||||||||
|
Airports of Thailand PCL |
15,000 |
134,565 |
|||||||||
|
KCE Electronics PCL |
23,297 |
38,282 |
|||||||||
|
Srisawad Power 1979 PCL |
142,800 |
169,116 |
|||||||||
|
Total Thailand common stocks |
341,963 |
||||||||||
|
Turkey: 0.01% |
|||||||||||
|
Turkiye Halk Bankasi AS |
14,759 |
68,010 |
|||||||||
|
United Kingdom: 4.78% |
|||||||||||
|
Anglo American PLC |
65,813 |
949,809 |
|||||||||
|
Aon PLC |
3,200 |
318,976 |
|||||||||
|
ARM Holdings PLC |
65,053 |
1,059,965 |
|||||||||
|
Ashtead Group PLC |
113,228 |
1,955,225 |
|||||||||
|
Associated British Foods PLC |
31,111 |
1,403,435 |
|||||||||
| BP PLC |
283,902 |
1,874,209 |
|||||||||
|
Burberry Group PLC |
49,393 |
1,219,233 |
|||||||||
|
HSBC Holdings PLC |
237,566 |
2,128,044 |
|||||||||
|
Imperial Tobacco Group PLC |
44,340 |
2,136,755 |
|||||||||
|
Lloyds Banking Group PLC |
1,031,643 |
1,381,714 |
|||||||||
|
London Stock Exchange Group PLC |
41,737 |
1,554,229 |
|||||||||
|
Noble Corp. PLC |
12,400 |
190,836 |
|||||||||
|
Prudential PLC |
67,232 |
1,618,907 |
|||||||||
|
Rio Tinto PLC |
25,611 |
1,051,907 |
|||||||||
|
SABMiller PLC |
25,820 |
1,340,422 |
|||||||||
|
Unilever NV CVA |
54,854 |
2,284,407 |
|||||||||
|
Vodafone Group PLC |
453,963 |
1,639,496 |
|||||||||
|
Total United Kingdom common stocks |
24,107,569 |
||||||||||
|
Shares |
Value |
||||||||||
|
United States: 17.93% |
|||||||||||
|
Acorda Therapeutics, Inc.* |
14,496 |
$ |
483,152 |
||||||||
|
Affiliated Managers Group, Inc.* |
4,450 |
972,770 |
|||||||||
|
Allergan PLC* |
7,555 |
2,292,640 |
|||||||||
|
Alnylam Pharmaceuticals, Inc.* |
5,917 |
709,271 |
|||||||||
|
Amazon.com, Inc.* |
5,275 |
2,289,825 |
|||||||||
|
American Express Co. |
4,600 |
357,512 |
|||||||||
|
AMETEK, Inc. |
17,670 |
967,963 |
|||||||||
|
Apple, Inc. |
42,931 |
5,384,621 |
|||||||||
|
Approach Resources, Inc.*1 |
13,700 |
93,845 |
|||||||||
|
Arista Networks, Inc.*1 |
2,938 |
240,152 |
|||||||||
|
Atara Biotherapeutics, Inc.*1 |
4,335 |
228,715 |
|||||||||
|
Best Buy Co., Inc. |
7,833 |
255,434 |
|||||||||
|
Bio-Rad Laboratories, Inc., Class A* |
1,800 |
271,098 |
|||||||||
|
Bluebird Bio, Inc.* |
486 |
81,828 |
|||||||||
|
BorgWarner, Inc. |
16,948 |
963,324 |
|||||||||
|
Broadcom Corp., Class A |
6,100 |
314,089 |
|||||||||
|
Capital One Financial Corp. |
3,800 |
334,286 |
|||||||||
|
Carnival PLC |
25,644 |
1,309,124 |
|||||||||
|
Catalent, Inc.* |
10,059 |
295,030 |
|||||||||
|
Catamaran Corp.* |
9,190 |
561,325 |
|||||||||
|
Caterpillar, Inc. |
5,122 |
434,448 |
|||||||||
|
CBS Corp. (Non-Voting), Class B |
9,980 |
553,890 |
|||||||||
|
CDW Corp. |
6,845 |
234,647 |
|||||||||
|
Celgene Corp.* |
13,425 |
1,553,742 |
|||||||||
|
Charles Schwab Corp. |
25,475 |
831,759 |
|||||||||
|
Chevron Corp. |
3,700 |
356,939 |
|||||||||
|
Chimerix, Inc.* |
17,000 |
785,400 |
|||||||||
|
Citigroup, Inc. |
14,020 |
774,465 |
|||||||||
|
Cobalt International Energy, Inc.* |
28,000 |
271,880 |
|||||||||
|
Colfax Corp.*1 |
4,520 |
208,598 |
|||||||||
|
Cummins, Inc. |
5,760 |
755,654 |
|||||||||
|
Danaher Corp. |
14,769 |
1,264,079 |
|||||||||
|
Delta Air Lines, Inc. |
30,058 |
1,234,783 |
|||||||||
|
Digital Realty Trust, Inc. |
8,100 |
540,108 |
|||||||||
|
Dolby Laboratories, Inc., Class A |
5,902 |
234,191 |
|||||||||
|
Ecolab, Inc. |
12,505 |
1,413,940 |
|||||||||
|
Eli Lilly & Co. |
5,200 |
434,148 |
|||||||||
|
Envision Healthcare Holdings, Inc.* |
7,306 |
288,441 |
|||||||||
|
EOG Resources, Inc. |
3,800 |
332,690 |
|||||||||
|
Estee Lauder Cos., Inc., Class A |
15,088 |
1,307,526 |
|||||||||
|
Express Scripts Holding Co.* |
14,370 |
1,278,068 |
|||||||||
|
Facebook, Inc., Class A* |
39,002 |
3,345,007 |
|||||||||
|
Fastenal Co. |
9,501 |
400,752 |
|||||||||
|
General Electric Co. |
21,373 |
567,881 |
|||||||||
|
General Motors Co. |
20,365 |
678,765 |
|||||||||
|
Gilead Sciences, Inc. |
14,670 |
1,717,564 |
|||||||||
|
Google, Inc., Class A* |
3,325 |
1,795,633 |
|||||||||
|
Google, Inc., Class C* |
2,322 |
1,208,624 |
|||||||||
|
Gulfport Energy Corp.* |
2,200 |
88,550 |
|||||||||
|
Hain Celestial Group, Inc.* |
12,290 |
809,419 |
|||||||||
|
Halliburton Co. |
5,500 |
236,885 |
|||||||||
41
UBS Global Allocation Fund
Portfolio of investments
June 30, 2015
|
Shares |
Value |
||||||||||
|
Common stocks—(Concluded) |
|||||||||||
|
United States—(Concluded) |
|||||||||||
|
Hertz Global Holdings, Inc.* |
19,100 |
$ |
346,092 |
||||||||
|
Home Depot, Inc. |
18,240 |
2,027,011 |
|||||||||
|
Impax Laboratories, Inc.* |
7,352 |
337,604 |
|||||||||
|
Integrated Device Technology, Inc.* |
10,579 |
229,564 |
|||||||||
|
Intuitive Surgical, Inc.* |
2,164 |
1,048,458 |
|||||||||
|
Invesco Ltd. |
6,900 |
258,681 |
|||||||||
|
Jabil Circuit, Inc. |
10,502 |
223,588 |
|||||||||
|
Jarden Corp.* |
6,162 |
318,884 |
|||||||||
|
JPMorgan Chase & Co. |
11,900 |
806,344 |
|||||||||
|
Laboratory Corp. of America Holdings* |
2,200 |
266,684 |
|||||||||
|
Laredo Petroleum, Inc.*1 |
12,400 |
155,992 |
|||||||||
|
Las Vegas Sands Corp. |
24,810 |
1,304,262 |
|||||||||
|
Lexicon Pharmaceuticals, Inc.*1 |
29,689 |
238,996 |
|||||||||
|
Lincoln National Corp. |
8,600 |
509,292 |
|||||||||
|
LinkedIn Corp., Class A* |
3,840 |
793,459 |
|||||||||
|
MacroGenics, Inc.* |
2,800 |
106,316 |
|||||||||
|
Macy's, Inc. |
4,151 |
280,068 |
|||||||||
|
Martin Marietta Materials, Inc. |
1,680 |
237,737 |
|||||||||
|
MasterCard, Inc., Class A |
15,321 |
1,432,207 |
|||||||||
|
Maxim Integrated Products, Inc. |
7,404 |
255,993 |
|||||||||
|
McDermott International, Inc.*1 |
63,300 |
338,022 |
|||||||||
|
McGraw Hill Financial, Inc. |
11,242 |
1,129,259 |
|||||||||
|
MetLife, Inc. |
7,200 |
403,128 |
|||||||||
|
Micron Technology, Inc.* |
26,411 |
497,583 |
|||||||||
|
Mondelez International, Inc., Class A |
17,100 |
703,494 |
|||||||||
|
Monsanto Co. |
3,520 |
375,197 |
|||||||||
|
Morgan Stanley |
6,486 |
251,592 |
|||||||||
|
NextEra Energy, Inc. |
4,600 |
450,938 |
|||||||||
|
NIKE, Inc., Class B |
20,370 |
2,200,367 |
|||||||||
|
Norfolk Southern Corp. |
4,175 |
364,728 |
|||||||||
|
Oasis Petroleum, Inc.*1 |
6,400 |
101,440 |
|||||||||
|
ON Semiconductor Corp.* |
20,287 |
237,155 |
|||||||||
|
Pacific DataVision, Inc.*2 |
10,900 |
459,217 |
|||||||||
|
PDC Energy, Inc.* |
6,100 |
327,204 |
|||||||||
|
PepsiCo, Inc. |
6,660 |
621,644 |
|||||||||
|
Philip Morris International, Inc. |
7,680 |
615,706 |
|||||||||
|
Praxair, Inc. |
3,991 |
477,124 |
|||||||||
|
Priceline Group, Inc.* |
1,245 |
1,433,456 |
|||||||||
|
Qorvo, Inc.* |
3,287 |
263,848 |
|||||||||
|
Regeneron Pharmaceuticals, Inc.* |
1,588 |
810,086 |
|||||||||
|
Regulus Therapeutics, Inc.*1 |
4,400 |
48,224 |
|||||||||
|
Rite Aid Corp.* |
31,500 |
263,025 |
|||||||||
|
Salesforce.com, Inc.* |
19,190 |
1,336,200 |
|||||||||
|
SanDisk Corp. |
4,203 |
244,699 |
|||||||||
|
SBA Communications Corp., Class A* |
5,996 |
689,360 |
|||||||||
|
Schlumberger Ltd. |
7,350 |
633,497 |
|||||||||
|
ServiceNow, Inc.* |
13,680 |
1,016,561 |
|||||||||
|
ServiceSource International, Inc.* |
33,200 |
181,604 |
|||||||||
|
Sherwin-Williams Co. |
3,740 |
1,028,575 |
|||||||||
|
Shares |
Value |
||||||||||
|
Silicon Laboratories, Inc.* |
4,480 |
$ |
241,965 |
||||||||
|
Simon Property Group, Inc. |
2,200 |
380,644 |
|||||||||
|
Skyworks Solutions, Inc. |
2,583 |
268,890 |
|||||||||
|
SM Energy Co. |
5,100 |
235,212 |
|||||||||
|
Starbucks Corp. |
36,880 |
1,977,321 |
|||||||||
|
Symantec Corp. |
21,100 |
490,575 |
|||||||||
|
Thermo Fisher Scientific, Inc. |
11,550 |
1,498,728 |
|||||||||
|
TJX Cos., Inc. |
26,140 |
1,729,684 |
|||||||||
|
Union Pacific Corp. |
3,847 |
366,888 |
|||||||||
|
United Rentals, Inc.* |
14,180 |
1,242,452 |
|||||||||
|
UnitedHealth Group, Inc. |
3,100 |
378,200 |
|||||||||
|
US Bancorp |
8,210 |
356,314 |
|||||||||
|
Vertex Pharmaceuticals, Inc.* |
9,121 |
1,126,261 |
|||||||||
|
Viacom, Inc., Class B |
13,210 |
853,894 |
|||||||||
|
Visa, Inc., Class A |
26,689 |
1,792,166 |
|||||||||
|
VMware, Inc., Class A* |
9,850 |
844,539 |
|||||||||
|
Walgreens Boots Alliance, Inc. |
2,200 |
185,768 |
|||||||||
|
Walt Disney Co. |
6,160 |
703,102 |
|||||||||
|
Wells Fargo & Co. |
2,600 |
146,224 |
|||||||||
|
Western Digital Corp. |
3,094 |
242,631 |
|||||||||
|
Workday, Inc., Class A* |
9,282 |
709,052 |
|||||||||
|
Yum! Brands, Inc. |
7,900 |
711,632 |
|||||||||
|
Zimmer Biomet Holdings, Inc. |
8,510 |
929,547 |
|||||||||
|
Total United States common stocks |
90,436,334 |
||||||||||
|
Total common stocks (cost $208,739,275) |
224,114,416 |
||||||||||
|
Face amount |
|||||||||||
|
Bonds: 11.26% |
|||||||||||
|
Mortgage & agency debt securities: 0.14% |
|||||||||||
|
United States: 0.14% |
|||||||||||
|
Federal Home Loan Mortgage Corp. Gold Pools,5 # G00194, 7.500%, due 02/01/24 |
$ |
21,094 |
23,446 |
||||||||
|
Government National Mortgage Association, Series 2001-35, Class AZ, 6.500%, due 08/20/31 |
566,090 |
665,136 |
|||||||||
|
Total mortgage & agency debt securities (cost $791,239) |
688,582 |
||||||||||
|
US government obligations: 4.36% |
|||||||||||
|
US Treasury Bonds, 2.750%, due 11/15/42 |
1,180,000 |
1,097,768 |
|||||||||
|
3.000%, due 05/15/45 |
665,000 |
651,700 |
|||||||||
|
3.125%, due 02/15/43 |
355,000 |
355,499 |
|||||||||
|
3.750%, due 11/15/43 |
100,000 |
112,485 |
|||||||||
|
5.250%, due 02/15/291 |
450,000 |
587,215 |
|||||||||
42
UBS Global Allocation Fund
Portfolio of investments
June 30, 2015
|
Face amount |
Value |
||||||||||
|
Bonds—(Concluded) |
|||||||||||
|
US government obligations—(Concluded) |
|||||||||||
|
5.375%, due 02/15/311 |
$ |
165,000 |
$ |
221,809 |
|||||||
|
8.000%, due 11/15/21 |
2,385,000 |
3,255,525 |
|||||||||
|
US Treasury Notes, 0.750%, due 12/31/17 |
5,125,000 |
5,114,191 |
|||||||||
|
1.625%, due 12/31/19 |
5,215,000 |
5,236,595 |
|||||||||
|
1.625%, due 11/15/22 |
2,385,000 |
2,305,439 |
|||||||||
|
3.125%, due 04/30/17 |
2,935,000 |
3,070,515 |
|||||||||
|
Total US government obligations (cost $21,911,860) |
22,008,741 |
||||||||||
|
Non-US government obligations: 6.76% |
|||||||||||
|
Australia: 0.70% |
|||||||||||
|
Commonwealth of Australia, 4.500%, due 04/15/203 |
AUD |
2,050,000 |
1,738,907 |
||||||||
|
4.500%, due 04/21/333 |
2,060,000 |
1,803,270 |
|||||||||
|
3,542,177 |
|||||||||||
|
Canada: 0.47% |
|||||||||||
|
Canadian Government Bond, 1.500%, due 06/01/23 |
CAD |
2,950,000 |
2,366,401 |
||||||||
|
France: 0.47% |
|||||||||||
|
France Government Bond OAT, 3.250%, due 04/25/16 |
EUR |
620,000 |
710,423 |
||||||||
|
Government of France, 3.750%, due 04/25/21 |
1,250,000 |
1,656,249 |
|||||||||
|
2,366,672 |
|||||||||||
|
Germany: 0.82% |
|||||||||||
|
Bundesobligation, 1.250%, due 10/14/16 |
2,230,000 |
2,534,346 |
|||||||||
|
Bundesrepublik Deutschland, 3.250%, due 07/04/213 |
1,225,000 |
1,611,106 |
|||||||||
|
4,145,452 |
|||||||||||
|
Ireland: 0.74% |
|||||||||||
|
Republic of Ireland, 0.800%, due 03/15/22 |
1,520,000 |
1,674,881 |
|||||||||
|
5.400%, due 03/13/25 |
1,380,000 |
2,048,996 |
|||||||||
|
3,723,877 |
|||||||||||
|
Italy: 1.35% |
|||||||||||
|
Buoni Poliennali Del Tesoro, 2.100%, due 09/15/213,6 |
1,634,144 |
1,974,312 |
|||||||||
|
2.500%, due 12/01/24 |
2,720,000 |
3,092,373 |
|||||||||
|
2.550%, due 09/15/416 |
533,556 |
669,165 |
|||||||||
|
4.250%, due 02/01/193 |
840,000 |
1,048,583 |
|||||||||
|
6,784,433 |
|||||||||||
|
Face amount |
Value |
||||||||||
|
New Zealand: 1.44% |
|||||||||||
|
New Zealand Government Bond, 2.000%, due 09/20/25 |
NZD |
1,337,830 |
$ |
927,795 |
|||||||
|
3.000%, due 04/15/20 |
2,440,000 |
1,647,576 |
|||||||||
|
4.500%, due 04/15/27 |
4,100,000 |
3,006,924 |
|||||||||
|
5.500%, due 04/15/23 |
2,170,000 |
1,691,999 |
|||||||||
|
7,274,294 |
|||||||||||
|
Spain: 0.35% |
|||||||||||
|
Kingdom of Spain, 3.300%, due 07/30/16 |
EUR |
570,000 |
656,846 |
||||||||
|
3.750%, due 10/31/18 |
920,000 |
1,126,895 |
|||||||||
|
1,783,741 |
|||||||||||
|
United Kingdom: 0.42% |
|||||||||||
|
UK Gilts, 2.000%, due 01/22/16 |
GBP |
1,350,000 |
2,138,995 |
||||||||
|
Total Non-US government obligations (cost $36,645,334) |
34,126,042 |
||||||||||
|
Total bonds (cost $59,348,433) |
56,823,365 |
||||||||||
|
Shares |
|||||||||||
|
Investment companies: 21.13% |
|||||||||||
|
iShares JP Morgan USD Emerging Markets Bond ETF1 |
223,100 |
24,523,152 |
|||||||||
|
UBS Emerging Markets Equity Relationship Fund*7 |
807,248 |
30,420,559 |
|||||||||
|
UBS Global Corporate Bond Relationship Fund*7 |
3,897,068 |
51,629,911 |
|||||||||
|
Total investment companies (cost $106,270,166) |
106,573,622 |
||||||||||
|
Number of warrants |
|||||||||||
|
Warrant: 0.00%4 |
|||||||||||
|
Thailand: 0.00%4 |
|||||||||||
|
Srisawad Power 1979 PCL, strike @ THB 60.00000, expires 06/11/20* (cost $0) |
5,600 |
2,139 |
|||||||||
|
Shares |
|||||||||||
|
Short-term investment: 18.26% |
|||||||||||
|
Investment company: 18.26% |
|||||||||||
|
UBS Cash Management Prime Relationship Fund7 (cost $92,078,493) |
92,078,493 |
92,078,493 |
|||||||||
43
UBS Global Allocation Fund
Portfolio of investments
June 30, 2015
|
Number of contracts |
Value |
||||||||||
|
Options purchased : 0.43% |
|||||||||||
|
Call options: 0.21% |
|||||||||||
|
EURO STOXX 50 Index, strike @ EUR 3,800.00, expires December 2015 |
1,419 |
$ |
1,070,995 |
||||||||
|
Put options: 0.22% |
|||||||||||
|
S&P 500 Index, strike @ USD 1,700.00, expires December 2016 |
147 |
1,080,450 |
|||||||||
|
Total options purchased (cost $2,999,029) |
2,151,445 |
||||||||||
|
Shares |
Value |
||||||||||
|
Investment of cash collateral from securities loaned: 4.59% |
|||||||||||
|
UBS Private Money Market Fund LLC7 (cost $23,131,258) |
23,131,258 |
$ |
23,131,258 |
||||||||
|
Total investments: 100.10% (cost $492,566,654) |
504,874,738 |
||||||||||
|
Cash and other assets, less liabilities: (0.10)% |
(517,878 |
) |
|||||||||
|
Net assets: 100.00% |
$ |
504,356,860 |
|||||||||
Notes to portfolio of investments
Aggregate cost for federal income tax purposes was $495,295,987; and net unrealized appreciation consisted of:
|
Gross unrealized appreciation |
$ |
26,982,712 |
|||||
|
Gross unrealized depreciation |
(17,403,961 |
) |
|||||
|
Net unrealized appreciation of investments |
$ |
9,578,751 |
|||||
For a listing of defined portfolio acronyms, counterparty abbreviations and currency abbreviations that are used throughout the Portfolio of investments as well as the tables that follow, please refer to page 61. Portfolio footnotes begin on page 46.
Forward foreign currency contracts
|
Counterparty |
Contracts |
In |
Maturity |
Unrealized |
|||||||||||||||
|
CIBC |
USD |
10,308,080 |
GBP |
6,535,000 |
09/18/15 |
$ |
(45,850 |
) |
|||||||||||
|
DB |
MYR |
76,495,000 |
USD |
20,252,846 |
09/18/15 |
100,709 |
|||||||||||||
|
DB |
RUB |
99,409,826 |
USD |
1,763,054 |
09/18/15 |
11,350 |
|||||||||||||
|
DB |
TWD |
94,800,000 |
USD |
3,070,943 |
09/18/15 |
(3,167 |
) |
||||||||||||
|
DB |
USD |
18,859,342 |
MXN |
293,970,000 |
09/18/15 |
(260,337 |
) |
||||||||||||
|
GSI |
SEK |
16,660,000 |
USD |
2,056,785 |
09/18/15 |
43,745 |
|||||||||||||
|
HSBC |
CHF |
25,685,000 |
USD |
27,509,867 |
09/18/15 |
(47,796 |
) |
||||||||||||
|
HSBC |
EUR |
10,515,000 |
USD |
11,851,982 |
09/18/15 |
116,191 |
|||||||||||||
|
HSBC |
GBP |
15,790,000 |
USD |
24,397,287 |
09/18/15 |
(398,523 |
) |
||||||||||||
|
HSBC |
USD |
13,091,492 |
JPY |
1,618,200,000 |
09/18/15 |
144,711 |
|||||||||||||
|
JPMCB |
CAD |
2,545,000 |
USD |
2,055,441 |
09/18/15 |
19,975 |
|||||||||||||
|
JPMCB |
EUR |
3,310,000 |
USD |
3,698,260 |
09/18/15 |
3,969 |
|||||||||||||
|
JPMCB |
HKD |
30,495,000 |
USD |
3,932,975 |
09/18/15 |
(749 |
) |
||||||||||||
|
JPMCB |
ILS |
13,560,000 |
USD |
3,542,042 |
09/18/15 |
(52,348 |
) |
||||||||||||
|
JPMCB |
NOK |
10,910,000 |
USD |
1,396,354 |
09/18/15 |
7,432 |
|||||||||||||
|
JPMCB |
NZD |
2,385,000 |
USD |
1,618,835 |
09/18/15 |
13,545 |
|||||||||||||
|
JPMCB |
USD |
2,172,137 |
AUD |
2,825,000 |
09/18/15 |
(1,918 |
) |
||||||||||||
|
JPMCB |
USD |
1,338,015 |
CAD |
1,650,000 |
09/18/15 |
(18,361 |
) |
||||||||||||
|
JPMCB |
USD |
6,365,568 |
GBP |
4,045,000 |
09/18/15 |
(13,506 |
) |
||||||||||||
|
JPMCB |
USD |
1,173,997 |
PLN |
4,335,000 |
09/18/15 |
(23,539 |
) |
||||||||||||
|
JPMCB |
USD |
3,605,279 |
SGD |
4,865,000 |
09/18/15 |
2,802 |
|||||||||||||
|
MSCI |
CNY |
39,290,000 |
USD |
6,386,022 |
09/18/15 |
84,309 |
|||||||||||||
|
MSCI |
IDR |
30,222,300,000 |
USD |
2,211,658 |
09/18/15 |
(15,847 |
) |
||||||||||||
44
UBS Global Allocation Fund
Portfolio of investments
June 30, 2015
Forward foreign currency contracts (Concluded)
|
Counterparty |
Contracts to deliver |
In exchange for |
Maturity date |
Unrealized appreciation/ (depreciation) |
|||||||||||||||
|
MSCI |
KRW |
25,696,000,000 |
USD |
23,048,841 |
09/18/15 |
$ |
54,056 |
||||||||||||
|
MSCI |
USD |
16,923,846 |
INR |
1,100,050,000 |
09/18/15 |
77,589 |
|||||||||||||
|
MSCI |
USD |
9,527,418 |
NZD |
13,970,000 |
09/18/15 |
(124,521 |
) |
||||||||||||
|
MSCI |
USD |
11,056,214 |
PHP |
503,500,000 |
09/18/15 |
62,265 |
|||||||||||||
|
SSB |
EUR |
18,480,000 |
CHF |
19,112,386 |
09/18/15 |
(119,681 |
) |
||||||||||||
|
SSB |
NZD |
52,165,000 |
USD |
36,255,405 |
09/18/15 |
1,144,298 |
|||||||||||||
|
SSB |
USD |
14,127,988 |
SEK |
115,920,000 |
09/18/15 |
(121,288 |
) |
||||||||||||
|
Net unrealized appreciation on forward foreign currency contracts |
$ |
639,515 |
|||||||||||||||||
Futures contracts
|
Expiration date |
Cost/ (proceeds) |
Value |
Unrealized appreciation/ (depreciation) |
||||||||||||||||
|
US Treasury futures buy contracts: |
|||||||||||||||||||
|
US Ultra Bond, 58 contracts (USD) |
September 2015 |
$ |
9,140,061 |
$ |
8,935,625 |
$ |
(204,436 |
) |
|||||||||||
|
US Treasury futures sell contracts: |
|||||||||||||||||||
|
2 Year US Treasury Notes, 164 contracts (USD) |
September 2015 |
(35,828,775 |
) |
(35,905,750 |
) |
(76,975 |
) |
||||||||||||
|
5 Year US Treasury Notes, 214 contracts (USD) |
September 2015 |
(25,479,662 |
) |
(25,521,172 |
) |
(41,510 |
) |
||||||||||||
|
Index futures buy contracts: |
|||||||||||||||||||
|
DAX Index, 66 contracts (EUR) |
September 2015 |
20,275,681 |
20,237,286 |
(38,395 |
) |
||||||||||||||
|
E-mini S&P 500 Index, 189 contracts (USD) |
September 2015 |
19,700,368 |
19,414,080 |
(286,288 |
) |
||||||||||||||
|
EURO STOXX 50 Index, 788 contracts (EUR) |
September 2015 |
31,412,614 |
30,185,321 |
(1,227,293 |
) |
||||||||||||||
|
Hong Kong Hang Seng Index, 203 contracts (HKD) |
July 2015 |
17,372,449 |
16,924,196 |
(448,253 |
) |
||||||||||||||
|
KOSPI 200 Index, 93 contracts (KRW) |
September 2015 |
10,616,368 |
10,515,599 |
(100,769 |
) |
||||||||||||||
|
Russell 2000 Mini Index, 204 contracts (USD) |
September 2015 |
25,757,530 |
25,508,161 |
(249,369 |
) |
||||||||||||||
|
TOPIX Index, 59 contracts (JPY) |
September 2015 |
8,055,747 |
7,860,399 |
(195,348 |
) |
||||||||||||||
|
Index futures sell contracts: |
|||||||||||||||||||
|
FTSE China A50 Index, 1,455 contracts (USD) |
July 2015 |
(17,013,174 |
) |
(18,056,550 |
) |
(1,043,376 |
) |
||||||||||||
|
Mini MSCI Emerging Markets Index, 496 contracts (USD) |
September 2015 |
(23,977,632 |
) |
(23,793,120 |
) |
184,512 |
|||||||||||||
|
OMXS30 Index, 1,069 contracts (SEK) |
July 2015 |
(20,064,786 |
) |
(19,881,310 |
) |
183,476 |
|||||||||||||
|
Interest rate futures buy contracts: |
|||||||||||||||||||
|
Euro-BTP, 171 contracts (EUR) |
September 2015 |
24,794,961 |
24,823,150 |
28,189 |
|||||||||||||||
|
Long Gilt, 85 contracts (GBP) |
September 2015 |
15,602,859 |
15,456,464 |
(146,395 |
) |
||||||||||||||
|
Interest rate futures sell contracts: |
|||||||||||||||||||
|
Japanese Government 10 Year Bond, 22 contracts (JPY) |
September 2015 |
(26,381,794 |
) |
(26,419,414 |
) |
(37,620 |
) |
||||||||||||
|
Net unrealized depreciation on futures contracts |
$ |
(3,699,850 |
) |
||||||||||||||||
Centrally cleared credit default swaps on credit indices—sell protection8
|
Referenced index9 |
Notional amount |
Termination date |
Payments received by the Fund10 |
Value |
Unrealized depreciation |
Credit spread11 |
|||||||||||||||||||||
|
CDX.NA.HY. Series 24 Index |
USD |
26,500,000 |
06/20/20 |
5.000 |
% |
$ |
1,674,504 |
$ |
(329,960 |
) |
0.036 |
% |
|||||||||||||||
45
UBS Global Allocation Fund
Portfolio of investments
June 30, 2015
The following is a summary of the fair valuations according to the inputs used as of June 30, 2015 in valuing the Fund's investments:
|
Description |
Unadjusted quoted prices in active markets for identical investments (Level 1) |
Other significant observable inputs (Level 2) |
Unobservable inputs (Level 3) |
Total |
|||||||||||||||
|
Assets |
|||||||||||||||||||
|
Common stocks |
$ |
223,655,199 |
$ |
459,217 |
$ |
— |
$ |
224,114,416 |
|||||||||||
|
Mortgage & agency debt securities |
— |
688,582 |
— |
688,582 |
|||||||||||||||
|
US government obligations |
— |
22,008,741 |
— |
22,008,741 |
|||||||||||||||
|
Non-US government obligations |
— |
34,126,042 |
— |
34,126,042 |
|||||||||||||||
|
Investment companies |
24,523,152 |
82,050,470 |
— |
106,573,622 |
|||||||||||||||
|
Warrant |
2,139 |
— |
— |
2,139 |
|||||||||||||||
|
Short-term investment |
— |
92,078,493 |
— |
92,078,493 |
|||||||||||||||
|
Options purchased |
2,151,445 |
— |
— |
2,151,445 |
|||||||||||||||
|
Investment of cash collateral from securities loaned |
— |
23,131,258 |
— |
23,131,258 |
|||||||||||||||
|
Forward foreign currency contracts |
— |
1,886,946 |
— |
1,886,946 |
|||||||||||||||
|
Futures contracts |
396,177 |
— |
— |
396,177 |
|||||||||||||||
|
Swap agreements, at value |
— |
1,674,504 |
— |
1,674,504 |
|||||||||||||||
|
Total |
$ |
250,728,112 |
$ |
258,104,253 |
$ |
— |
$ |
508,832,365 |
|||||||||||
|
Liabilities |
|||||||||||||||||||
|
Forward foreign currency contracts |
$ |
— |
$ |
(1,247,431 |
) |
$ |
— |
$ |
(1,247,431 |
) |
|||||||||
|
Futures contracts |
(4,096,027 |
) |
— |
— |
(4,096,027 |
) |
|||||||||||||
|
Total |
$ |
(4,096,027 |
) |
$ |
(1,247,431 |
) |
$ |
— |
$ |
(5,343,458 |
) |
||||||||
At June 30, 2015, there were no transfers between Level 1 and Level 2.
Portfolio footnotes
* Non-income producing security.
1 Security, or portion thereof, was on loan at June 30, 2015.
2 Security exempt from registration pursuant to Rule 144A under the Securities Act of 1933. These securities are considered liquid, unless noted otherwise, and may be resold in transactions exempt from registration, normally to qualified institutional buyers. At June 30, 2015, the value of these securities amounted to $825,504 or 0.16% of net assets.
3 Security exempt from registration pursuant to Regulation S under the Securities Act of 1933. Regulation S applies to securities offerings that are made outside of the United States and do not involve direct selling efforts in the United States. At June 30, 2015, the value of these securities amounted to $8,287,832 or 1.64% of net assets.
4 Amount represents less than 0.005%.
5 On September 7, 2008, the Federal Housing Finance Agency placed the Federal Home Loan Mortgage Corporation and the Federal National Mortgage Association into conservatorship, and the US Treasury guaranteed the debt issued by those organizations.
6 Debt security whose principal and/or interest payments are adjusted for inflation, unlike debt securities that make fixed principal and interest payments. The interest rate paid by the securities is fixed, while the principal value rises or falls based on changes in an index. Thus, if inflation occurs, the principal and interest payments on the securities are adjusted accordingly to protect investors from inflationary loss. During a deflationary period, the principal and interest payments decrease, although the securities' principal amounts will not drop below their face amounts at maturity. In exchange for the inflation protection, the securities generally pay lower interest rates than typical government securities from the issuer's country. Only if inflation occurs will securities offer a higher real yield than a conventional security of the same maturity.
.
46
UBS Global Allocation Fund
Portfolio of investments
June 30, 2015
7 The table below details the Fund's investments in funds advised by the same Advisor as the Fund. The Advisor does not earn a management fee from the affiliated UBS Relationship Funds.
|
Security description |
Value 06/30/14 |
Purchases during the year ended 06/30/15 |
Sales during the year ended 06/30/15 |
Net realized gain during the year ended 06/30/15 |
Change in net unrealized appreciation/ (depreciation) during the year ended 06/30/15 |
Value 06/30/15 |
Net income earned from affiliate for the year ended 06/30/15 |
||||||||||||||||||||||||
|
UBS Cash Management Prime Relationship Fund |
$ |
155,168,975 |
$ |
153,226,104 |
$ |
216,316,586 |
$ |
— |
$ |
— |
$ |
92,078,493 |
$ |
115,378 |
|||||||||||||||||
|
UBS Private Money Market Fund LLCa |
22,940,033 |
369,202,891 |
369,011,666 |
— |
— |
23,131,258 |
2,261 |
||||||||||||||||||||||||
|
UBS Emerging Markets Equity Relationship Fund |
38,619,219 |
— |
8,000,000 |
2,726,118 |
(2,924,778 |
) |
30,420,559 |
— |
|||||||||||||||||||||||
|
UBS Global Corporate Bond Relationship Fund |
14,705,474 |
42,500,000 |
5,000,000 |
509,958 |
(1,085,521 |
) |
51,629,911 |
— |
|||||||||||||||||||||||
|
UBS High Yield Relationship Fund |
18,510,237 |
— |
18,224,818 |
1,640,802 |
(1,926,221 |
) |
— |
— |
|||||||||||||||||||||||
|
$ |
249,943,938 |
$ |
564,928,995 |
$ |
616,553,070 |
$ |
4,876,878 |
$ |
(5,936,520 |
) |
$ |
197,260,221 |
$ |
117,639 |
|||||||||||||||||
a The Advisor earns a management fee from this affiliated fund. Please see the Notes to financial statements for further information.
8 If the Fund is a seller of protection and a credit event occurs, as defined under the terms of that particular swap agreement, the Fund will either (i) pay to the buyer of protection an amount equal to the notional amount of the swap and take delivery of the underlying securities comprising the referenced index or (ii) pay a net settlement amount in the form of cash or securities equal to the notional amount of the swap agreement less the recovery value of the underlying securities comprising the referenced index.
9 Payments to the counterparty will be made upon the occurrence of bankruptcy and/or restructuring event with respect to the referenced index.
10 Payments received are based on the notional amount.
11 Credit spreads, represented in absolute terms, utilized in determining the market value as of period end serve as an indicator of the current status of the payment/performance risk and represent the likelihood or risk of default or other credit event occurring for the credit derivative. The credit spread of a particular referenced entity reflects the cost of buying/selling protection and may include upfront payments required to be made to enter into the agreement. Wider credit spreads represent a deterioration of the referenced entity's credit soundness and a greater likelihood or risk of default or other credit event occurring as defined under the terms of the agreement. A credit spread identified as "Defaulted" indicates a credit event has occurred for the referenced entity.
See accompanying notes to financial statements.
47
UBS Multi-Asset Income Fund
Portfolio performance
For the 12 months ended June 30, 2015, Class A shares of UBS Multi-Asset Income Fund (the "Fund") declined 0.31% (Class A shares fell 4.82% after the deduction of the maximum sales charge), while Class P shares declined 0.07%. For comparison purposes, the Barclays US Corporate Investment Grade Index (the "Index") gained 0.75% during the same time period. (Class P shares have lower expenses than other share classes of the Fund. Returns for all share classes over various time periods are shown on page 50; please note that these returns do not reflect the deduction of taxes that a shareholder would pay on Fund distributions or the redemption of Fund shares, while the Index returns do not reflect the deduction of fees and expenses.)
We managed the portfolio in accordance with our low to moderate risk profile for the Fund. We continued to place a strong emphasis on minimizing interest rate risk and protecting capital during the reporting period. During the 12 months ended June 30, 2015, the Fund paid out income in line with its objective and additionally distributed capital gains earned by the Fund. As such, the yield for the period is well above its stated target of 3% to 6%. For the 12 months ended June 30, 2015, the Fund's yield was 10.38% and 10.61% for Class A and Class P shares, respectively.
During the reporting period, we used derivatives, including writing covered calls, to increase cash flow and implement our market allocations. We also utilized derivatives, including currency forwards, to hedge our exposures to international currency risk, as well as Treasury futures to manage duration and the Fund's yield curve positioning. In summary, while our derivatives exposure was limited in the portfolio, our ability to increase cash flow and manage unwanted risks relating to currency and duration positively contributed to the Fund's performance during the period.
Portfolio performance summary1
What worked:
• The Fund's allocation to US equities contributed to performance.
– The Fund maintained a long position of approximately 14% to US equities, which had strong performance throughout the period, particularly in the second half of 2014. Within US equities, we maintained a preference for high-dividend stocks, which yield on average 3.1%.
• The Fund's exposure to real estate was beneficial for performance.
– The Fund maintained approximately 6% of its assets in global real estate investment trusts which performed well during the reporting period. Real estate provides a source of income while adding diversification to the portfolio.
• The Fund's allocation to global infrastructure added to performance.
– The Fund held approximately 4% of its assets in global infrastructure stocks during the reporting period. These assets performed well, while also offering attractive yield of 5.0%–5.5%, delivered through the combination of secure, long-term and operational contracts with intrinsic inflation protection, which provided an attractive prospect for yield seeking investors.
1 For a detailed commentary on the market environment in general during the reporting period, see page 3.
48
UBS Multi-Asset Income Fund
• Certain duration management positions contributed to results.
– The Fund held a trade of long German government bonds versus French government bonds, which contributed positively to the Fund's results. This was predicated on the fact that the spread between these two sovereigns was too wide based on historical standards and was set to narrow.
What didn't work:
• The Fund's allocation to non-US developed and emerging market equities detracted from performance.
– The Fund held approximately 7% of its assets in non-US developed equities. Due to concerns regarding global growth and political uncertainty, markets such as European equities struggled during the reporting period. International equities do have a higher dividend yield than US equities, however, which helped us meet our income objective.
– The Fund maintained a position of approximately 5% in emerging market equities. As the price in oil rapidly declined toward the end of 2014 and concerns grew over growth and inflation in emerging market economies, the equity markets were negatively impacted. Emerging market equities pay out a high dividend yield of 4.8% and, therefore, do provide a yield cushion.
* The Fund's allocation to high yield corporate bonds was negative during the reporting period.
– High yield corporate bonds continue to be a large portion of the portfolio given their attractive yield levels and the environment of strong fundamentals. However, during the reporting period concern grew in the energy sector, which comprises roughly 15% of the US high yield index, due to the falling price of oil. While spreads in the energy sector have begun to temper since the end of 2014, they are still well above levels seen a year ago.
• The Fund's yield curve allocation within US government bonds detracted from performance.
– During the reporting period, the Fund was positioned with the expectation that the US yield curve would flatten as the Federal Reserve Board was set to raise interest rates. This did not play out as expected, however, given the accommodative tone of the US central bank.
This letter is intended to assist shareholders in understanding how the Fund performed during the 12 months ended June 30, 2015. The views and opinions in the letter were current as of August 14, 2015. They are not guarantees of future performance or investment results and should not be taken as investment advice. Investment decisions reflect a variety of factors, and we reserve the right to change our views about individual securities, sectors and markets at any time. As a result, the views expressed should not be relied upon as a forecast of the Fund's future investment intent. We encourage you to consult your financial advisor regarding your personal investment program.
Mutual funds are sold by prospectus only. You should read it carefully and consider a fund's investment objectives, risks, charges, expenses and other important information contained in the prospectus before investing. Prospectuses for most of our funds can be obtained from your financial advisor, by calling UBS Funds at 800-647 1568 or by visiting our Web site at www.ubs.com.
49
UBS Multi-Asset Income Fund
Average annual total returns for periods ended 06/30/15 (unaudited)
|
1 year |
Inception1 |
||||||||||
|
Before deducting maximum sales charge |
|||||||||||
|
Class A2 |
(0.31 |
)% |
4.06 |
% |
|||||||
|
Class C3 |
(1.13 |
) |
3.30 |
||||||||
|
Class P4 |
(0.07 |
) |
4.34 |
||||||||
|
After deducting maximum sales charge |
|||||||||||
|
Class A2 |
(4.82 |
)% |
2.57 |
% |
|||||||
|
Class C3 |
(1.81 |
) |
3.30 |
||||||||
|
Barclays US Corporate Investment Grade Index5 |
0.75 |
% |
3.55 |
% |
|||||||
The annualized gross and net expense ratios, respectively, for each class of shares as in the October 28, 2014 prospectuses were as follows: Class A—2.04% and 1.35%; Class C—2.79% and 2.10%; Class P—1.57% and 1.10%. Net expenses reflect fee waivers and/or expense reimbursements, if any, pursuant to an agreement that is in effect to cap the expenses. The Trust, with respect to the Fund, and UBS Global Asset Management (Americas) Inc., the Fund's investment advisor ("UBS Global AM (Americas)" or the "Advisor"), have entered into a written agreement pursuant to which the Advisor has agreed to waive a portion of its management fees and/or to reimburse expenses (excluding expenses incurred through investment in other investment companies, interest, taxes, brokerage commissions, extraordinary expenses, and dividend expense and security loan fees for securities sold short) to the extent necessary so that the Fund's ordinary operating expenses (excluding expenses incurred through investment in other investment companies, interest, taxes, brokerage commissions, extraordinary expenses, and dividend expense and security loan fees for securities sold short), through the period ending October 27, 2015, do not exceed 0.95% for Class A shares, 1.70% for Class C shares and 0.70% for Class P shares. Pursuant to the written agreement, the Advisor is entitled to be reimbursed for any fees it waives and expenses it reimburses for a period of three years following such fee waivers and expense reimbursements to the extent that such reimbursement of the Advisor by the Fund will not cause the Fund to exceed any applicable expense limit that is in place for the Fund. The fee waiver/expense reimbursement agreement may be terminated by the Fund's Board of Trustees at any time and also will terminate automatically upon the expiration or termination of the Fund's advisory contract with the Advisor. Upon termination of the fee waiver/expense reimbursement agreement, however, UBS Global AM (Americas)'s three year recoupment rights will survive.
1 Inception date of all share classes of UBS Multi-Asset Income Fund and the index is April 25, 2012.
2 Maximum sales charge for Class A shares is 4.5%. Class A shares bear ongoing 12b-1 service fees.
3 Maximum contingent deferred sales charge for Class C shares is 0.75% imposed on redemptions and is reduced to 0% after one year. Class C shares bear ongoing 12b-1 distribution and service fees.
4 Class P shares do not bear initial or contingent deferred sales charges or ongoing 12b-1 service and distribution fees, but Class P shares held through advisory programs may be subject to a program fee, which, if included, would have reduced performance.
5 The Barclays US Corporate Investment Grade Index is a sub-index of the Barclays US Credit Index, and includes USD-denominated securities publicly issued by US and non-US industrial, utility, and financial issuers that meet the specified maturity, liquidity and quality requirements. Investors should note that the indices do not reflect the deduction of fees and expenses.
Prior to February 17, 2015, if an investor sold or exchanged shares less than 90 days after purchase, a redemption fee of 1.00% of the amount sold or exchanged was deducted at the time of the transaction, except as noted otherwise in the prospectus. For sales or exchanges taking place on or after February 17, 2015 but prior to August 3, 2015, there is a reduction in the redemption holding period from 90 days to 30 days. Effective August 3, 2015, the 1.00% redemption fee imposed on sales or exchanges of any class of shares of the funds made during the holding periods specified in the prospectus will be eliminated. Please refer to the prospectus for further information.
Past performance does not predict future performance, and the performance information provided does not reflect the deduction of taxes that a shareholder would pay on Fund distributions or the redemption of Fund shares. The return and principal value of an investment will fluctuate, so that an investor's shares, when redeemed, may be worth more or less than their original cost. Performance results assume reinvestment of all dividends and capital gain distributions at net asset value on the ex-dividend dates. Current performance may be higher or lower than the performance data quoted. For month-end performance figures, please visit http://globalam-us.ubs.com/corpweb/performance.do.
50
UBS Multi-Asset Income Fund
Illustration of an assumed investment of $10,000 in Class A shares (adjusted for 4.5% maximum sales charge) and $5,000,000 in Class P shares (unaudited)
The following two graphs depict the performance of UBS Multi-Asset Income Fund Class A and Class P shares versus the Barclays US Corporate Investment Grade Index from April 25, 2012, which is the inception date of the two classes, through June 30, 2015. The performance of Class C shares will vary based upon the different class specific expenses and sales charges. The performance provided does not reflect the deduction of taxes that a shareholder would pay on Fund distributions or the redemption of Fund shares. Past performance is no guarantee of future results. Share price and returns will vary with market conditions; investors may realize a gain or loss upon redemption.
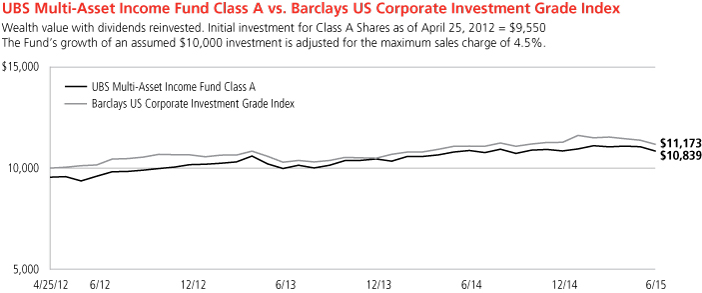
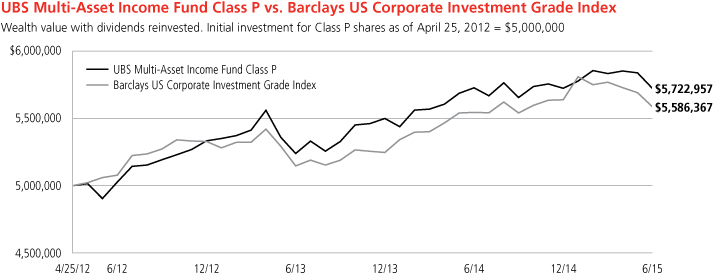
Past performance does not predict future performance, and the performance information provided does not reflect the deduction of taxes that a shareholder would pay on Fund distributions or the redemption of Fund shares. The return and principal value of an investment will fluctuate, so that an investor's shares, when redeemed, may be worth more or less than their original cost. Performance results assume reinvestment of all dividends and capital gain distributions at net asset value on the ex-dividend dates. Current performance may be higher or lower than the performance data quoted. For month-end performance figures, please visit http://globalam-us.ubs.com/corpweb/performance.do.
51
UBS Multi-Asset Income Fund
Top ten equity holdings (unaudited)1
As of June 30, 2015
|
Percentage of net assets |
|||||||
|
John Laing Infrastructure Fund Ltd. |
2.0 |
% |
|||||
|
Simon Property Group, Inc. |
0.1 |
||||||
|
Mitsubishi Estate Co., Ltd. |
0.1 |
||||||
|
Sun Hung Kai Properties Ltd. |
0.1 |
||||||
|
Public Storage |
0.1 |
||||||
|
Equity Residential |
0.1 |
||||||
|
Unibail-Rodamco SE |
0.1 |
||||||
|
Health Care REIT, Inc. |
0.1 |
||||||
|
AvalonBay Communities, Inc. |
0.1 |
||||||
|
Ventas, Inc. |
0.1 |
||||||
|
Total |
2.9 |
% |
|||||
Country exposure by issuer, top five (unaudited)1
As of June 30, 2015
|
Percentage of net assets |
|||||||
|
United States |
16.2 |
% |
|||||
|
United Kingdom |
2.2 |
||||||
|
Japan |
0.3 |
||||||
|
Australia |
0.2 |
||||||
|
China |
0.2 |
||||||
|
Total |
19.1 |
% |
|||||
Top ten long-term fixed income holdings (unaudited)1
As of June 30, 2015
|
Percentage of net assets |
|||||||
|
US Treasury Inflation Indexed Bonds (TIPS), 3.875%, due 04/15/29 |
8.1 |
% |
|||||
|
Government National Mortgage Association, IO, Series 2013-22, Class IO, 3.000%, due 02/20/43 |
1.0 |
||||||
|
Federal National Mortgage Association REMIC, Series 2012-122, Class LI, 4.500%, due 07/25/41 |
0.6 |
||||||
|
Federal National Mortgage Association REMIC, Series 2012-78, Class CI, 2.500%, due 07/25/22 |
0.6 |
||||||
|
JP Morgan Chase Commercial Mortgage Securities Trust, Series 2014-FL5, Class D, 3.686%, due 07/15/31 |
0.6 |
||||||
|
Starwood Retail Property Trust, Series 2014-STAR, Class C, 2.686%, due 11/15/27 |
0.6 |
||||||
|
JP Morgan Chase Commercial Mortgage Securities Trust, Series 2014-CBM, Class D, 2.686%, due 10/15/29 |
0.6 |
||||||
|
Federal National Mortgage Association Pools, 3.000%, TBA |
0.6 |
||||||
|
GS Mortgage Securities Trust, Series 2014-GSFL, Class D, 4.084%, due 07/15/31 |
0.6 |
||||||
|
Federal National Mortgage Association Pools, #AP3839, 3.500%, due 09/01/42 |
0.4 |
||||||
|
Total |
13.7 |
% |
|||||
1 Figures represent the direct investments of UBS Multi-Asset Income Fund. Figures may be different if a breakdown of the underlying investment companies was included.
52
UBS Multi-Asset Income Fund
Industry diversification (unaudited)1
As a percentage of net assets as of June 30, 2015
|
Common stocks |
|||||||
|
Capital markets |
1.97 |
% |
|||||
|
Health care providers & services |
0.002 |
||||||
|
Real estate investment trust (REIT) |
2.32 |
||||||
|
Real estate management & development |
0.62 |
||||||
|
Total common stocks |
4.91 |
% |
|||||
|
Bonds |
|||||||
|
Commercial mortgage-backed securities |
2.22 |
||||||
|
Mortgage & agency debt securities |
4.34 |
||||||
|
US government obligation |
8.12 |
||||||
|
Total bonds |
14.68 |
% |
|||||
|
Investment companies |
|||||||
|
HICL Infrastructure Co., Ltd. |
2.63 |
||||||
|
iShares Core S&P 500 ETF |
7.82 |
||||||
|
iShares iBoxx $ High Yield Corporate Bond ETF |
17.56 |
||||||
|
iShares iBoxx $ Investment Grade Corporate Bond ETF |
13.32 |
||||||
|
iShares JP Morgan USD Emerging Markets Bond ETF |
6.33 |
||||||
|
iShares MSCI EAFE ETF |
6.86 |
||||||
|
iShares Select Dividend Fund |
9.31 |
||||||
|
SPDR Barclays Short Term High Yield Bond ETF |
4.02 |
||||||
|
WisdomTree Emerging Markets Equity Income Fund |
5.31 |
||||||
|
Total investment companies |
73.16 |
% |
|||||
|
Right |
0.002 |
||||||
|
Short-term investments |
4.41 |
||||||
|
Total investments |
97.16 |
% |
|||||
|
Cash and other assets, less liabilities |
2.84 |
||||||
|
Net assets |
100.00 |
% |
|||||
1 Figures represent the direct investments of UBS Multi-Asset Income Fund. Figures may be different if a breakdown of the underlying investment companies was included.
2 Amount represents less than 0.005%.
53
UBS Multi-Asset Income Fund
Portfolio of investments
June 30, 2015
|
Shares |
Value |
||||||||||
|
Common stocks: 4.91% |
|||||||||||
|
Australia: 0.18% |
|||||||||||
|
BWP Trust |
450 |
$ |
1,062 |
||||||||
|
Dexus Property Group |
392 |
2,208 |
|||||||||
|
Federation Centres |
1,494 |
3,366 |
|||||||||
|
Goodman Group |
731 |
3,536 |
|||||||||
|
GPT Group |
845 |
2,790 |
|||||||||
|
Investa Office Fund |
328 |
962 |
|||||||||
|
Mirvac Group |
1,815 |
2,591 |
|||||||||
|
Scentre Group |
2,202 |
6,371 |
|||||||||
|
Stockland |
1,045 |
3,306 |
|||||||||
|
Westfield Corp. |
800 |
5,629 |
|||||||||
|
Total Australia common stocks |
31,821 |
||||||||||
|
Austria: 0.00%1 |
|||||||||||
|
CA Immobilien Anlagen AG* |
43 |
750 |
|||||||||
|
Belgium: 0.01% |
|||||||||||
|
Aedifica SA |
13 |
729 |
|||||||||
|
Cofinimmo SA |
10 |
1,034 |
|||||||||
|
Total Belgium common stocks |
1,763 |
||||||||||
|
Canada: 0.08% |
|||||||||||
|
Allied Properties REIT |
38 |
1,078 |
|||||||||
|
Artis REIT |
74 |
812 |
|||||||||
|
Calloway REIT |
52 |
1,204 |
|||||||||
|
Canadian Apartment Properties REIT |
55 |
1,215 |
|||||||||
|
Canadian REIT |
35 |
1,190 |
|||||||||
|
Chartwell Retirement Residences |
72 |
662 |
|||||||||
|
Cominar REIT |
80 |
1,136 |
|||||||||
|
Dream Office Real Estate Investment Trust |
50 |
982 |
|||||||||
|
H&R REIT |
124 |
2,228 |
|||||||||
|
Killam Properties, Inc. |
156 |
1,273 |
|||||||||
|
RioCan REIT |
142 |
3,043 |
|||||||||
|
Total Canada common stocks |
14,823 |
||||||||||
|
China: 0.18% |
|||||||||||
|
Champion REIT |
2,000 |
1,099 |
|||||||||
|
Hang Lung Properties Ltd. |
1,000 |
2,974 |
|||||||||
|
Hongkong Land Holdings Ltd. |
500 |
4,100 |
|||||||||
|
Kerry Properties Ltd. |
500 |
1,961 |
|||||||||
|
Link REIT |
1,100 |
6,442 |
|||||||||
|
New World Development Co., Ltd. |
1,840 |
2,407 |
|||||||||
|
Sino Land Co., Ltd. |
2,317 |
3,874 |
|||||||||
|
Swire Properties Ltd. |
600 |
1,916 |
|||||||||
|
Wharf Holdings Ltd. |
1,000 |
6,657 |
|||||||||
|
Total China common stocks |
31,430 |
||||||||||
|
Finland: 0.00%1 |
|||||||||||
|
Sponda Oyj |
155 |
572 |
|||||||||
|
Shares |
Value |
||||||||||
|
France: 0.11% |
|||||||||||
|
Fonciere Des Regions |
18 |
$ |
1,530 |
||||||||
|
Gecina SA |
16 |
1,972 |
|||||||||
|
ICADE |
17 |
1,214 |
|||||||||
|
Klepierre |
78 |
3,431 |
|||||||||
|
Unibail-Rodamco SE |
42 |
10,615 |
|||||||||
|
Total France common stocks |
18,762 |
||||||||||
|
Germany: 0.07% |
|||||||||||
|
Deutsche Annington Immobilien SE |
195 |
5,500 |
|||||||||
|
Deutsche Euroshop AG |
24 |
1,054 |
|||||||||
|
Deutsche Wohnen AG |
154 |
3,529 |
|||||||||
|
LEG Immobilien AG* |
28 |
1,945 |
|||||||||
|
TAG Immobilien AG |
85 |
995 |
|||||||||
|
Total Germany common stocks |
13,023 |
||||||||||
|
Hong Kong: 0.09% |
|||||||||||
|
Sun Hung Kai Properties Ltd. |
1,000 |
16,203 |
|||||||||
|
Israel: 0.01% |
|||||||||||
|
Azrieli Group |
19 |
759 |
|||||||||
|
Italy: 0.01% |
|||||||||||
|
Beni Stabili SpA |
1,813 |
1,346 |
|||||||||
|
Japan: 0.33% |
|||||||||||
|
Advance Residence Investment Corp. |
1 |
2,450 |
|||||||||
|
Aeon Mall Co., Ltd. |
60 |
1,125 |
|||||||||
|
Frontier Real Estate Investment Corp. |
1 |
4,478 |
|||||||||
|
GLP J-REIT |
1 |
955 |
|||||||||
|
Hulic Co., Ltd. |
200 |
1,775 |
|||||||||
|
Japan Excellent, Inc. |
1 |
1,155 |
|||||||||
|
Japan Hotel REIT Investment Corp. |
3 |
1,998 |
|||||||||
|
Japan Real Estate Investment Corp. |
1 |
4,543 |
|||||||||
|
Japan Retail Fund Investment Corp. |
1 |
2,001 |
|||||||||
|
Mitsubishi Estate Co., Ltd. |
1,000 |
21,543 |
|||||||||
|
Mori Hills REIT Investment Corp. |
1 |
1,294 |
|||||||||
|
Mori Trust Sogo Reit, Inc. |
1 |
1,942 |
|||||||||
|
Nippon Building Fund, Inc. |
1 |
4,380 |
|||||||||
|
Nippon Prologis REIT, Inc.* |
1 |
1,842 |
|||||||||
|
Nomura Real Estate Holdings, Inc. |
100 |
2,100 |
|||||||||
|
Nomura Real Estate Master Fund, Inc. |
1 |
1,271 |
|||||||||
|
NTT Urban Development Corp. |
100 |
995 |
|||||||||
|
Orix J-REIT, Inc. |
1 |
1,441 |
|||||||||
|
Tokyu REIT, Inc. |
1 |
1,235 |
|||||||||
|
United Urban Investment Corp. |
1 |
1,414 |
|||||||||
|
Total Japan common stocks |
59,937 |
||||||||||
|
Netherlands: 0.01% |
|||||||||||
|
Eurocommercial Properties NV CVA |
24 |
1,001 |
|||||||||
|
NSI NV |
119 |
468 |
|||||||||
54
UBS Multi-Asset Income Fund
Portfolio of investments
June 30, 2015
|
Shares |
Value |
||||||||||
|
Common stocks—(Continued) |
|||||||||||
|
Netherlands—(Concluded) |
|||||||||||
|
Wereldhave NV |
16 |
$ |
909 |
||||||||
|
Total Netherlands common stocks |
2,378 |
||||||||||
|
New Zealand: 0.01% |
|||||||||||
|
Kiwi Property Group Ltd. |
1,026 |
893 |
|||||||||
|
Norway: 0.00%1 |
|||||||||||
|
Norwegian Property ASA* |
316 |
391 |
|||||||||
|
Singapore: 0.08% |
|||||||||||
|
Ascendas REIT |
1,000 |
1,826 |
|||||||||
|
CapitaLand Commercial Trust |
900 |
1,042 |
|||||||||
|
CapitaLand Ltd. |
1,100 |
2,859 |
|||||||||
|
CapitaLand Mall Trust |
1,300 |
2,075 |
|||||||||
|
Global Logistic Properties Ltd. |
1,400 |
2,630 |
|||||||||
|
Mapletree Commercial Trust |
900 |
979 |
|||||||||
|
Mapletree Industrial Trust |
1,112 |
1,288 |
|||||||||
|
Suntec REIT |
1,200 |
1,537 |
|||||||||
|
Total Singapore common stocks |
14,236 |
||||||||||
|
Spain: 0.00%1 |
|||||||||||
|
Inmobiliaria Colonial SA* |
931 |
655 |
|||||||||
|
Sweden: 0.03% |
|||||||||||
|
Castellum AB |
73 |
1,026 |
|||||||||
|
Fabege AB |
68 |
928 |
|||||||||
|
Fastighets AB Balder, Class B* |
48 |
741 |
|||||||||
|
Kungsleden AB |
191 |
1,296 |
|||||||||
|
Wallenstam AB, Class B |
166 |
1,179 |
|||||||||
|
Total Sweden common stocks |
5,170 |
||||||||||
|
Switzerland: 0.02% |
|||||||||||
|
Allreal Holding AG* |
5 |
690 |
|||||||||
|
PSP Swiss Property AG* |
18 |
1,540 |
|||||||||
|
Swiss Prime Site AG* |
26 |
1,973 |
|||||||||
|
Total Switzerland common stocks |
4,203 |
||||||||||
|
United Kingdom: 2.17% |
|||||||||||
|
Big Yellow Group PLC |
70 |
701 |
|||||||||
|
British Land Co., PLC |
423 |
5,274 |
|||||||||
|
Capital & Counties Properties PLC |
293 |
2,003 |
|||||||||
|
Daejan Holdings PLC |
8 |
742 |
|||||||||
|
Derwent London PLC |
42 |
2,245 |
|||||||||
|
Development Securities PLC |
121 |
528 |
|||||||||
|
F&C Commercial Property Trust Ltd. |
244 |
541 |
|||||||||
|
Grainger PLC |
205 |
737 |
|||||||||
|
Great Portland Estates PLC |
149 |
1,817 |
|||||||||
|
Hammerson PLC |
329 |
3,182 |
|||||||||
|
Helical Bar PLC |
89 |
564 |
|||||||||
|
Intu Properties PLC |
361 |
1,745 |
|||||||||
|
Shares |
Value |
||||||||||
|
John Laing Infrastructure Fund Ltd. |
183,528 |
$ |
351,809 |
||||||||
|
Land Securities Group PLC |
332 |
6,281 |
|||||||||
|
LondonMetric Property PLC |
262 |
664 |
|||||||||
|
MedicX Fund Ltd. |
518 |
659 |
|||||||||
|
Picton Property Income Ltd. |
868 |
958 |
|||||||||
|
Primary Health Properties PLC |
134 |
824 |
|||||||||
|
Quintain Estates & Development PLC* |
388 |
646 |
|||||||||
|
Schroder REIT |
896 |
831 |
|||||||||
|
Segro PLC |
301 |
1,919 |
|||||||||
|
Shaftesbury PLC |
117 |
1,596 |
|||||||||
|
ST Modwen Properties PLC |
95 |
676 |
|||||||||
|
Unite Group PLC |
106 |
952 |
|||||||||
|
Workspace Group PLC |
58 |
820 |
|||||||||
|
Total United Kingdom common stocks |
388,714 |
||||||||||
|
United States: 1.51% |
|||||||||||
|
Acadia Realty Trust |
40 |
1,164 |
|||||||||
|
Agree Realty Corp. |
25 |
729 |
|||||||||
|
Alexander's, Inc. |
2 |
820 |
|||||||||
|
Alexandria Real Estate Equities, Inc. |
31 |
2,711 |
|||||||||
|
American Assets Trust, Inc. |
44 |
1,725 |
|||||||||
|
American Campus Communities, Inc. |
47 |
1,771 |
|||||||||
|
American Homes 4 Rent, Class A |
64 |
1,027 |
|||||||||
|
American Realty Capital Properties, Inc. |
388 |
3,154 |
|||||||||
|
Apartment Investment & Management Co., Class A |
67 |
2,474 |
|||||||||
|
Ashford Hospitality Trust, Inc. |
100 |
846 |
|||||||||
|
AvalonBay Communities, Inc. |
56 |
8,953 |
|||||||||
|
BioMed Realty Trust, Inc. |
85 |
1,644 |
|||||||||
|
Boston Properties, Inc. |
65 |
7,868 |
|||||||||
|
Brandywine Realty Trust |
79 |
1,049 |
|||||||||
|
Brixmor Property Group, Inc. |
94 |
2,174 |
|||||||||
|
Camden Property Trust |
36 |
2,674 |
|||||||||
|
CBL & Associates Properties, Inc. |
80 |
1,296 |
|||||||||
|
Chambers Street Properties |
128 |
1,018 |
|||||||||
|
Chesapeake Lodging Trust |
30 |
914 |
|||||||||
|
Corporate Office Properties Trust |
39 |
918 |
|||||||||
|
Cousins Properties, Inc. |
93 |
965 |
|||||||||
|
CubeSmart |
73 |
1,691 |
|||||||||
|
DCT Industrial Trust, Inc. |
45 |
1,415 |
|||||||||
|
DDR Corp. |
127 |
1,963 |
|||||||||
|
DiamondRock Hospitality Co. |
91 |
1,166 |
|||||||||
|
Digital Realty Trust, Inc. |
57 |
3,801 |
|||||||||
|
Douglas Emmett, Inc. |
57 |
1,536 |
|||||||||
|
Duke Realty Corp. |
146 |
2,711 |
|||||||||
|
DuPont Fabros Technology, Inc. |
58 |
1,708 |
|||||||||
|
EastGroup Properties, Inc. |
32 |
1,799 |
|||||||||
|
Empire State Realty Trust, Inc., Class A |
100 |
1,706 |
|||||||||
|
EPR Properties |
31 |
1,698 |
|||||||||
|
Equity Commonwealth* |
54 |
1,386 |
|||||||||
|
Equity LifeStyle Properties, Inc. |
33 |
1,735 |
|||||||||
|
Equity Residential |
153 |
10,736 |
|||||||||
55
UBS Multi-Asset Income Fund
Portfolio of investments
June 30, 2015
|
Shares |
Value |
||||||||||
|
Common stocks—(Concluded) |
|||||||||||
|
United States—(Concluded) |
|||||||||||
|
Essex Property Trust, Inc. |
29 |
$ |
6,163 |
||||||||
|
Extra Space Storage, Inc. |
47 |
3,065 |
|||||||||
|
Federal Realty Investment Trust |
29 |
3,715 |
|||||||||
|
FelCor Lodging Trust, Inc. |
82 |
810 |
|||||||||
|
First Industrial Realty Trust, Inc. |
49 |
918 |
|||||||||
|
First Potomac Realty Trust |
100 |
1,030 |
|||||||||
|
Forest City Enterprises, Inc., Class A* |
97 |
2,144 |
|||||||||
|
General Growth Properties, Inc. |
213 |
5,466 |
|||||||||
|
Government Properties Income Trust |
39 |
723 |
|||||||||
|
HCP, Inc. |
193 |
7,039 |
|||||||||
|
Health Care REIT, Inc. |
148 |
9,713 |
|||||||||
|
Healthcare Realty Trust, Inc. |
43 |
1,000 |
|||||||||
|
Hersha Hospitality Trust |
50 |
1,282 |
|||||||||
|
Highwoods Properties, Inc. |
38 |
1,518 |
|||||||||
|
Home Properties, Inc. |
25 |
1,826 |
|||||||||
|
Hospitality Properties Trust |
63 |
1,816 |
|||||||||
|
Host Hotels & Resorts, Inc. |
320 |
6,346 |
|||||||||
|
Hudson Pacific Properties, Inc. |
41 |
1,163 |
|||||||||
|
Kilroy Realty Corp. |
37 |
2,485 |
|||||||||
|
Kimco Realty Corp. |
170 |
3,832 |
|||||||||
|
Kite Realty Group Trust |
59 |
1,444 |
|||||||||
|
LaSalle Hotel Properties |
47 |
1,667 |
|||||||||
|
Lexington Realty Trust |
118 |
1,001 |
|||||||||
|
Liberty Property Trust |
62 |
1,998 |
|||||||||
|
LTC Properties, Inc. |
23 |
957 |
|||||||||
|
Macerich Co. |
67 |
4,998 |
|||||||||
|
Mack-Cali Realty Corp. |
45 |
829 |
|||||||||
|
Mid-America Apartment Communities, Inc. |
32 |
2,330 |
|||||||||
|
National Health Investors, Inc. |
18 |
1,121 |
|||||||||
|
National Retail Properties, Inc. |
56 |
1,961 |
|||||||||
|
New York REIT, Inc. |
82 |
816 |
|||||||||
|
Omega Healthcare Investors, Inc. |
67 |
2,300 |
|||||||||
|
Parkway Properties, Inc. |
44 |
767 |
|||||||||
|
Pebblebrook Hotel Trust |
35 |
1,501 |
|||||||||
|
Pennsylvania REIT |
49 |
1,046 |
|||||||||
|
Piedmont Office Realty Trust, Inc., Class A |
76 |
1,337 |
|||||||||
|
Post Properties, Inc. |
28 |
1,522 |
|||||||||
|
Prologis, Inc. |
220 |
8,162 |
|||||||||
|
PS Business Parks, Inc. |
15 |
1,082 |
|||||||||
|
Public Storage |
62 |
11,431 |
|||||||||
|
Ramco-Gershenson Properties Trust |
66 |
1,077 |
|||||||||
|
Realty Income Corp. |
98 |
4,350 |
|||||||||
|
Regency Centers Corp. |
40 |
2,359 |
|||||||||
|
Retail Properties of America, Inc., Class A |
100 |
1,393 |
|||||||||
|
RLJ Lodging Trust |
54 |
1,608 |
|||||||||
|
Sabra Health Care REIT, Inc. |
62 |
1,596 |
|||||||||
|
Saul Centers, Inc. |
17 |
836 |
|||||||||
|
Senior Housing Properties Trust |
95 |
1,667 |
|||||||||
|
Simon Property Group, Inc. |
132 |
22,839 |
|||||||||
|
Shares |
Value |
||||||||||
|
SL Green Realty Corp. |
42 |
$ |
4,615 |
||||||||
|
Sovran Self Storage, Inc. |
19 |
1,651 |
|||||||||
|
Spirit Realty Capital, Inc. |
187 |
1,808 |
|||||||||
|
STAG Industrial, Inc. |
35 |
700 |
|||||||||
|
Strategic Hotels & Resorts, Inc.* |
119 |
1,442 |
|||||||||
|
Sun Communities, Inc. |
26 |
1,608 |
|||||||||
|
Sunstone Hotel Investors, Inc. |
109 |
1,636 |
|||||||||
|
Tanger Factory Outlet Centers, Inc. |
46 |
1,458 |
|||||||||
|
Taubman Centers, Inc. |
27 |
1,877 |
|||||||||
|
UDR, Inc. |
110 |
3,523 |
|||||||||
|
Universal Health Realty Income Trust |
17 |
790 |
|||||||||
|
Ventas, Inc. |
140 |
8,693 |
|||||||||
|
Vornado Realty Trust |
72 |
6,835 |
|||||||||
|
Washington REIT |
39 |
1,012 |
|||||||||
|
Weingarten Realty Investors |
46 |
1,504 |
|||||||||
|
WP Carey, Inc. |
36 |
2,122 |
|||||||||
|
WP GLIMCHER, Inc. |
74 |
1,001 |
|||||||||
|
Total United States common stocks |
271,269 |
||||||||||
|
Venezuela: 0.01% |
|||||||||||
|
Warehouses De Pauw CVA |
11 |
850 |
|||||||||
|
Total common stocks (cost $826,834) |
879,948 |
||||||||||
|
Face amount |
|||||||||||
|
Bonds: 14.68% |
|||||||||||
|
Commercial mortgage-backed securities: 2.22% |
|||||||||||
|
United States: 2.22% |
|||||||||||
|
GS Mortgage Securities Trust, Series 2014-GSFL, Class D, 4.084%, due 07/15/312,3 |
$ |
100,000 |
99,026 |
||||||||
|
JP Morgan Chase Commercial Mortgage Securities Trust, Series 2014-CBM, Class D, 2.686%, due 10/15/292,3 |
100,000 |
99,535 |
|||||||||
|
Series 2014-FL5, Class D, 3.686%, due 07/15/312,3 |
100,000 |
100,586 |
|||||||||
|
Starwood Retail Property Trust, Series 2014-STAR, Class C, 2.686%, due 11/15/272,3 |
100,000 |
99,535 |
|||||||||
|
Total commercial mortgage-backed securities (cost $400,142) |
398,682 |
||||||||||
|
Mortgage & agency debt securities: 4.34% |
|||||||||||
|
United States: 4.34% |
|||||||||||
|
Federal Home Loan Mortgage Corp. Gold Pools,4 # Q20860, 3.500%, due 08/01/43 |
44,500 |
45,847 |
|||||||||
56
UBS Multi-Asset Income Fund
Portfolio of investments
June 30, 2015
|
Face amount |
Value |
||||||||||
|
Bonds—(Concluded) |
|||||||||||
|
Mortgage & agency debt securities—(Concluded) |
|||||||||||
|
United States—(Concluded) |
|||||||||||
|
Federal Home Loan Mortgage Corp. REMIC, IO,4 3.000%, due 05/15/27 |
$ |
112,140 |
$ |
10,543 |
|||||||
|
Federal National Mortgage Association Pools,4 3.000%, TBA |
100,000 |
99,369 |
|||||||||
|
# AP0495, 3.500%, due 08/01/42 |
45,361 |
46,898 |
|||||||||
|
# AP3839, 3.500%, due 09/01/42 |
63,267 |
65,435 |
|||||||||
|
Federal National Mortgage Association REMIC, IO,4 Series 2012-78, Class CI, 2.500%, due 07/25/22 |
1,697,563 |
108,031 |
|||||||||
|
Series 2012-122, Class LI, 4.500%, due 07/25/41 |
623,274 |
111,244 |
|||||||||
|
Government National Mortgage Association Pools, # G2 779424, 4.000%, due 06/20/42 |
52,114 |
55,919 |
|||||||||
|
Government National Mortgage Association, IO, Series 2013-22, Class IO, 3.000%, due 02/20/43 |
878,620 |
171,563 |
|||||||||
|
Series 2012-26, Class GI, 3.500%, due 02/20/27 |
629,306 |
63,583 |
|||||||||
|
Total mortgage & agency debt securities (cost $781,512) |
778,432 |
||||||||||
|
US government obligation: 8.12% |
|||||||||||
|
US Treasury Inflation Indexed Bonds (TIPS), 3.875%, due 04/15/295 (cost $1,449,640) |
715,000 |
1,457,552 |
|||||||||
|
Total bonds (cost $2,631,294) |
2,634,666 |
||||||||||
|
Shares |
Value |
||||||||||
|
Investment companies: 73.16% |
|||||||||||
|
HICL Infrastructure Co., Ltd. |
195,143 |
$ |
472,192 |
||||||||
|
iShares Core S&P 500 ETF |
6,770 |
1,402,879 |
|||||||||
|
iShares iBoxx $ High Yield Corporate Bond ETF |
35,466 |
3,149,382 |
|||||||||
|
iShares iBoxx $ Investment Grade Corporate Bond ETF |
20,645 |
2,389,039 |
|||||||||
|
iShares JP Morgan USD Emerging Markets Bond ETF |
10,332 |
1,135,694 |
|||||||||
|
iShares MSCI EAFE ETF |
19,380 |
1,230,436 |
|||||||||
|
iShares Select Dividend Fund |
22,225 |
1,670,209 |
|||||||||
|
SPDR Barclays Short Term High Yield Bond ETF |
24,956 |
721,478 |
|||||||||
|
WisdomTree Emerging Markets Equity Income Fund |
21,935 |
952,637 |
|||||||||
|
Total investment companies (cost $13,571,445) |
13,123,946 |
||||||||||
|
Number of rights |
|||||||||||
|
Right: 0.00%1 |
|||||||||||
|
Finland: 0.00%1 |
|||||||||||
|
Citycon Oyj, expires 07/07/15* (cost $0) |
387 |
42 |
|||||||||
|
Shares |
|||||||||||
|
Short-term investment: 4.41% |
|||||||||||
|
Investment company: 4.41% |
|||||||||||
|
UBS Cash Management Prime Relationship Fund6 (cost $791,797) |
791,797 |
791,797 |
|||||||||
|
Total investments: 97.16% (cost $17,821,370) |
17,430,399 |
||||||||||
|
Cash and other assets, less liabilities: 2.84% |
509,576 |
||||||||||
|
Net assets: 100.00% |
$ |
17,939,975 |
|||||||||
Notes to portfolio of investments
Aggregate cost for federal income tax purposes was $18,063,951; and net unrealized depreciation consisted of:
|
Gross unrealized appreciation |
$ |
160,520 |
|||||
|
Gross unrealized depreciation |
(794,072 |
) |
|||||
|
Net unrealized depreciation of investments |
$ |
(633,552 |
) |
||||
For a listing of defined portfolio acronyms, counterparty abbreviations and currency abbreviations that are used throughout the Portfolio of investments as well as the tables that follow, please refer to page 61. Portfolio footnotes begin on page 60.
57
UBS Multi-Asset Income Fund
Portfolio of investments
June 30, 2015
Forward foreign currency contracts
|
Counterparty |
Contracts to deliver |
In exchange for |
Maturity date |
Unrealized appreciation/ (depreciation) |
|||||||||||||||
|
JPMCB |
AUD |
187,000 |
USD |
146,250 |
07/27/15 |
$ |
2,186 |
||||||||||||
|
JPMCB |
CHF |
83,600 |
USD |
91,337 |
07/27/15 |
1,832 |
|||||||||||||
|
JPMCB |
EUR |
365,900 |
USD |
417,388 |
07/27/15 |
9,324 |
|||||||||||||
|
JPMCB |
GBP |
744,900 |
USD |
1,183,891 |
07/27/15 |
13,677 |
|||||||||||||
|
JPMCB |
HKD |
834,300 |
USD |
107,605 |
07/27/15 |
(23 |
) |
||||||||||||
|
JPMCB |
JPY |
47,651,700 |
USD |
388,576 |
07/27/15 |
(905 |
) |
||||||||||||
|
JPMCB |
USD |
36,582 |
AUD |
47,900 |
07/27/15 |
320 |
|||||||||||||
|
JPMCB |
USD |
61,797 |
EUR |
55,200 |
07/27/15 |
(236 |
) |
||||||||||||
|
JPMCB |
USD |
34,497 |
GBP |
21,900 |
07/27/15 |
(93 |
) |
||||||||||||
|
JPMCB |
USD |
31,446 |
HKD |
243,800 |
07/27/15 |
5 |
|||||||||||||
|
JPMCB |
USD |
58,007 |
JPY |
7,120,400 |
07/27/15 |
191 |
|||||||||||||
|
Net unrealized appreciation on forward foreign currency contracts |
$ |
26,278 |
|||||||||||||||||
Futures contracts
|
Expiration date |
Cost/ (proceeds) |
Value |
Unrealized appreciation/ (depreciation) |
||||||||||||||||
|
Index futures buy contracts: |
|||||||||||||||||||
|
EURO STOXX 50 Index, 22 contracts (EUR) |
September 2015 |
$ |
869,687 |
$ |
842,738 |
$ |
(26,949 |
) |
|||||||||||
|
Index futures sell contracts: |
|||||||||||||||||||
|
E-mini S&P 500 Index, 6 contracts (USD) |
September 2015 |
(630,272 |
) |
(616,320 |
) |
13,952 |
|||||||||||||
|
Mini MSCI Emerging Markets Index, 13 contracts (USD) |
September 2015 |
(628,511 |
) |
(623,610 |
) |
4,901 |
|||||||||||||
|
Interest rate futures buy contracts: |
|||||||||||||||||||
|
Euro-BTP, 4 contracts (EUR) |
September 2015 |
579,999 |
580,658 |
659 |
|||||||||||||||
|
Net unrealized depreciation on futures contracts |
$ |
(7,437 |
) |
||||||||||||||||
58
UBS Multi-Asset Income Fund
Portfolio of investments
June 30, 2015
The following is a summary of the fair valuations according to the inputs used as of June 30, 2015 in valuing the Fund's investments:
|
Description |
Unadjusted quoted prices in active markets for identical investments (Level 1) |
Other significant observable inputs (Level 2) |
Unobservable inputs (Level 3) |
Total |
|||||||||||||||
|
Assets |
|||||||||||||||||||
|
Common stocks |
$ |
879,948 |
$ |
— |
$ |
— |
$ |
879,948 |
|||||||||||
|
Commercial mortgage-backed securities |
— |
398,682 |
— |
398,682 |
|||||||||||||||
|
Mortgage & agency debt securities |
— |
778,432 |
— |
778,432 |
|||||||||||||||
|
US government obligation |
— |
1,457,552 |
— |
1,457,552 |
|||||||||||||||
|
Investment companies |
13,123,946 |
— |
— |
13,123,946 |
|||||||||||||||
|
Right |
42 |
— |
— |
42 |
|||||||||||||||
|
Short-term investment |
— |
791,797 |
— |
791,797 |
|||||||||||||||
|
Forward foreign currency contracts |
— |
27,535 |
— |
27,535 |
|||||||||||||||
|
Futures contracts |
19,512 |
— |
— |
19,512 |
|||||||||||||||
|
Total |
$ |
14,023,448 |
$ |
3,453,998 |
$ |
— |
$ |
17,477,446 |
|||||||||||
|
Liabilities |
|||||||||||||||||||
|
Forward foreign currency contracts |
$ |
— |
$ |
(1,257 |
) |
$ |
— |
$ |
(1,257 |
) |
|||||||||
|
Futures contracts |
(26,949 |
) |
— |
— |
(26,949 |
) |
|||||||||||||
|
Total |
$ |
(26,949 |
) |
$ |
(1,257 |
) |
$ |
— |
$ |
(28,206 |
) |
||||||||
At June 30, 2015, there were no transfers between Level 1 and Level 2.
Level 3 Rollforward Disclosure
The following is a rollforward of the Fund's investments that were valued using unobservable inputs for the period.
|
Mortgage & agency debt securities |
Total |
||||||||||
|
Assets |
|||||||||||
|
Beginning balance |
$ |
233,714 |
$ |
233,714 |
|||||||
|
Purchases |
— |
— |
|||||||||
|
Issuances |
— |
— |
|||||||||
|
Sales |
(120,743 |
) |
(120,743 |
) |
|||||||
|
Accrued discounts (premiums) |
(11,388 |
) |
(11,388 |
) |
|||||||
|
Total realized gain |
(34,220 |
) |
(34,220 |
) |
|||||||
|
Change in net unrealized appreciation/depreciation |
(3,780 |
) |
(3,780 |
) |
|||||||
|
Transfers into Level 3 |
— |
— |
|||||||||
|
Transfers out of Level 37 |
(63,583 |
) |
(63,583 |
) |
|||||||
|
Ending balance |
$ |
— |
$ |
— |
|||||||
At June 30, 2015, there were no securities valued using Level 3 inputs.
See accompanying notes to financial statements.
59
UBS Multi-Asset Income Fund
Portfolio of investments
June 30, 2015
Portfolio footnotes
* Non-income producing security.
1 Amount represents less than 0.005%.
2 Security exempt from registration pursuant to Rule 144A under the Securities Act of 1933. These securities are considered liquid, unless noted otherwise, and may be resold in transactions exempt from registration, normally to qualified institutional buyers. At June 30, 2015, the value of these securities amounted to $398,682 or 2.22% of net assets.
3 Variable or floating rate security—The interest rate shown is the current rate as of June 30, 2015 and changes periodically.
4 On September 7, 2008, the Federal Housing Finance Agency placed the Federal Home Loan Mortgage Corporation and the Federal National Mortgage Association into conservatorship, and the US Treasury guaranteed the debt issued by those organizations.
5 Debt security whose principal and/or interest payments are adjusted for inflation, unlike debt securities that make fixed principal and interest payments. The interest rate paid by the securities is fixed, while the principal value rises or falls based on changes in an index. Thus, if inflation occurs, the principal and interest payments on the securities are adjusted accordingly to protect investors from inflationary loss. During a deflationary period, the principal and interest payments decrease, although the securities' principal amounts will not drop below their face amounts at maturity. In exchange for the inflation protection, the securities generally pay lower interest rates than typical securities from the issuer's country. Only if inflation occurs will securities offer a higher real yield than a conventional security of the same maturity.
6 The table below details the Fund's investment in a fund advised by the same Advisor as the Fund. The Advisor does not earn a management fee from the affiliated UBS Relationship Fund.
|
Security description |
Value 06/30/14 |
Purchases during the year ended 06/30/15 |
Sales during the year ended 06/30/15 |
Value 06/30/15 |
Net income earned from affiliate for the year ended 06/30/15 |
||||||||||||||||||
|
UBS Cash Management Prime Relationship Fund |
$ |
1,554,008 |
$ |
7,964,163 |
$ |
8,726,374 |
$ |
791,797 |
$ |
587 |
|||||||||||||
7 Transfers out of Level 3 represent the value at the end of the period. At June 30, 2015, securities were transferred from Level 3 to Level 2 as the valuations are based on observable inputs from an established pricing source.
60
The UBS Funds
June 30, 2015
Portfolio acronyms
ADR American depositary receipt
CDO Collateralized debt obligations
CVA Dutch certification—depository certificate
ETF Exchange Traded Fund
EURIBOR Euro Interbank Offered Rate
GDR Global depositary receipt
GS Goldman Sachs
IO Interest only—This security entitles the holder to receive interest payments from an underlying pool of mortgages. The risk associated with this security is related to the speed of the principal paydowns. High prepayments would result in a smaller amount of interest being received and cause the yield to decrease. Low prepayments would result in a greater amount of interest being received and cause the yield to increase.
REIT Real estate investment trust
REMIC Real Estate Mortgage Investment Conduit
SPDR Standard & Poor's Depository Receipts
TBA (To be announced) Security is purchased on a forward commitment basis with an approximate principal amount
(generally +/-1.0%) and no definite maturity date. The actual principal amount and maturity date will be determined upon settlement, when the specific mortgage pools are assigned.
TIPS Treasury inflation protected securities ("TIPS") are debt securities issued by the US Treasury whose principal and/or interest payments are adjusted for inflation, unlike debt securities that make fixed principal and interest payments. The interest rate paid by the TIPS is fixed, while the principal value rises or falls based on changes in a published Consumer Price Index ("CPI"). Thus, if inflation occurs, the principal and interest payments on the TIPS are adjusted accordingly to protect investors from inflationary loss. During a deflationary period, the principal and interest payments decrease, although the TIPS principal amounts will not drop below their face amounts at maturity. In exchange for the inflation protection, the TIPS generally pay lower interest rates than typical US Treasury securities. Only if inflation occurs will TIPS offer a higher real yield than a conventional Treasury security of the same maturity.
Counterparty abbreviations
BB Barclays Bank PLC
CIBC Canadian Imperial Bank of Commerce
CITI Citibank NA
DB Deutsche Bank AG
GSI Goldman Sachs International
HSBC HSBC Bank NA
JPMCB JPMorgan Chase Bank
MSCI Morgan Stanley & Co. International PLC
SSB State Street Bank
Currency abbreviations
AUD Australian Dollar
CAD Canadian Dollar
CHF Swiss Franc
CNY Chinese Yuan
EUR Euro
GBP Great Britain Pound
HKD Hong Kong Dollar
IDR Indonesian Rupiah
ILS Israel New Shekel
INR Indian Rupee
JPY Japanese Yen
KRW Korean Won
MXN Mexican Peso
MYR Malaysian Ringgit
NOK Norwegian Krone
NZD New Zealand Dollar
PHP Philippine Peso
PLN Polish Zloty
RUB Russian Ruble
SEK Swedish Krona
SGD Singapore Dollar
THB Thai Baht
TWD Taiwan Dollar
USD United States Dollar
See accompanying notes to financial statements.
61
The UBS Funds
June 30, 2015 (unaudited)
Explanation of expense disclosure
As a shareholder of the Funds, you incur two types of costs: (1) transactional costs (as applicable); including sales charges (loads); and (2) ongoing costs, including management fees; service and/or distribution (12b-1) fees (if applicable); and other Fund expenses. This example is intended to help you understand your ongoing costs (in dollars) of investing in each Fund and to compare these costs with the ongoing costs of investing in other mutual funds.
The example below is based on an investment of $1,000 invested at the beginning of the period and held for the entire period, January 1, 2015 to June 30, 2015.
Actual expenses
The first line for each class of shares in the table below provides information about actual account values and actual expenses. You may use the information in this line, together with the amount you invested, to estimate the expenses that you paid over a period. Simply divide your account value by $1,000 (for example, an $8,600 account value divided by $1,000 = 8.6), then multiply the result by the number in the first line under the heading entitled "Expenses paid during period" to estimate the expenses you paid on your account during this period.
Hypothetical example for comparison purposes
The second line for each class of shares in the table below provides information about hypothetical account values and hypothetical expenses based on that Fund's actual expense ratios for each class of shares and an assumed rate of return of 5% per year before expenses, which is not that Fund's actual return for each class of shares. The hypothetical account values and expenses may not be used to estimate the actual ending account balance or expenses you paid for the period. You may use this information to compare the ongoing costs of investing in a Fund and other funds. To do so, compare this 5% hypothetical example with the 5% hypothetical examples that appear in the shareholder reports of other funds.
Please note that the expenses shown in the table are meant to highlight your ongoing costs only and do not reflect any transactional costs (as applicable), such as sales charges (loads). Therefore, the second line in the table for each class of shares is useful in comparing ongoing costs only, and will not help you determine the relative total costs of owning different funds. In addition, if these transactional costs were included, your costs would have been higher.
This projection assumes that annualized expense ratios were in effect during the period January 1, 2015 to June 30, 2015.
62
The UBS Funds
June 30, 2015 (unaudited)
|
Beginning account value January 1, 2015 |
Ending account value June 30, 2015 |
Expenses paid during period* 01/01/15 – 06/30/15 |
Expense ratio during period |
||||||||||||||||||||
|
UBS Asset Growth Fund |
|||||||||||||||||||||||
|
Class A |
Actual |
$ |
1,000.00 |
$ |
1,040.60 |
$ |
7.08 |
1.40 |
% |
||||||||||||||
|
Hypothetical (5% annual return before expenses) |
1,000.00 |
1,017.85 |
7.00 |
1.40 |
|||||||||||||||||||
|
Class C |
Actual |
1,000.00 |
1,036.40 |
10.86 |
2.15 |
||||||||||||||||||
|
Hypothetical (5% annual return before expenses) |
1,000.00 |
1,014.13 |
10.74 |
2.15 |
|||||||||||||||||||
|
Class P |
Actual |
1,000.00 |
1,041.70 |
5.82 |
1.15 |
||||||||||||||||||
|
Hypothetical (5% annual return before expenses) |
1,000.00 |
1,019.09 |
5.76 |
1.15 |
|||||||||||||||||||
|
UBS Dynamic Alpha Fund |
|||||||||||||||||||||||
|
Class A |
Actual |
1,000.00 |
1,001.40 |
6.70 |
1.35 |
||||||||||||||||||
|
Hypothetical (5% annual return before expenses) |
1,000.00 |
1,018.10 |
6.76 |
1.35 |
|||||||||||||||||||
|
Class C |
Actual |
1,000.00 |
997.00 |
10.40 |
2.10 |
||||||||||||||||||
|
Hypothetical (5% annual return before expenses) |
1,000.00 |
1,014.38 |
10.49 |
2.10 |
|||||||||||||||||||
|
Class P |
Actual |
1,000.00 |
1,001.40 |
5.46 |
1.10 |
||||||||||||||||||
|
Hypothetical (5% annual return before expenses) |
1,000.00 |
1,019.34 |
5.51 |
1.10 |
|||||||||||||||||||
|
UBS Global Allocation Fund |
|||||||||||||||||||||||
|
Class A |
Actual |
1,000.00 |
1,010.80 |
6.63 |
1.33 |
||||||||||||||||||
|
Hypothetical (5% annual return before expenses) |
1,000.00 |
1,018.20 |
6.66 |
1.33 |
|||||||||||||||||||
|
Class C |
Actual |
1,000.00 |
1,006.50 |
10.50 |
2.11 |
||||||||||||||||||
|
Hypothetical (5% annual return before expenses) |
1,000.00 |
1,014.33 |
10.54 |
2.11 |
|||||||||||||||||||
|
Class P |
Actual |
1,000.00 |
1,011.40 |
5.34 |
1.07 |
||||||||||||||||||
|
Hypothetical (5% annual return before expenses) |
1,000.00 |
1,019.49 |
5.36 |
1.07 |
|||||||||||||||||||
* Expenses are equal to the Fund's annualized net expense ratios, multiplied by the average account value over the period, multiplied by 181 divided by 365 (to reflect the one-half year period).
63
The UBS Funds
June 30, 2015 (unaudited)
|
Beginning account value January 1, 2015 |
Ending account value June 30, 2015 |
Expenses paid during period* 01/01/15 – 06/30/15 |
Expense ratio during period |
||||||||||||||||||||
|
UBS Multi-Asset Income Fund |
|||||||||||||||||||||||
|
Class A |
Actual |
$ |
1,000.00 |
$ |
998.90 |
$ |
4.71 |
0.95 |
% |
||||||||||||||
|
Hypothetical (5% annual return before expenses) |
1,000.00 |
1,020.08 |
4.76 |
0.95 |
|||||||||||||||||||
|
Class C |
Actual |
1,000.00 |
995.40 |
8.41 |
1.70 |
||||||||||||||||||
|
Hypothetical (5% annual return before expenses) |
1,000.00 |
1,016.36 |
8.50 |
1.70 |
|||||||||||||||||||
|
Class P |
Actual |
1,000.00 |
999.90 |
3.47 |
0.70 |
||||||||||||||||||
|
Hypothetical (5% annual return before expenses) |
1,000.00 |
1,021.32 |
3.51 |
0.70 |
|||||||||||||||||||
* Expenses are equal to the Fund's annualized net expense ratios, multiplied by the average account value over the period, multiplied by 181 divided by 365 (to reflect the one-half year period).
64
This page intentionally left blank.
65
The UBS Funds
Financial statements
Statement of assets and liabilities
June 30, 2015
|
UBS Asset Growth Fund |
UBS Dynamic Alpha Fund |
||||||||||
|
Assets: |
|||||||||||
|
Investments, at cost: |
|||||||||||
|
Unaffiliated issuers |
$ |
13,132,577 |
$ |
280,141,520 |
|||||||
|
Affiliated issuers |
8,911,211 |
26,421,851 |
|||||||||
|
Investment of cash collateral in an affiliated issuer received from securities loaned1 |
4,817,108 |
1,558,438 |
|||||||||
|
Foreign currency |
4 |
3,536,999 |
|||||||||
|
$ |
26,860,900 |
$ |
311,658,808 |
||||||||
|
Investments, at value: |
|||||||||||
|
Unaffiliated issuers |
$ |
12,867,828 |
$ |
261,767,538 |
|||||||
|
Affiliated issuers |
8,911,211 |
26,421,851 |
|||||||||
|
Investment of cash collateral in an affiliated issuer received from securities loaned1 |
4,817,108 |
1,558,438 |
|||||||||
|
Foreign currency |
4 |
3,480,857 |
|||||||||
|
Receivables: |
|||||||||||
|
Investment securities sold |
2,384,798 |
918,419 |
|||||||||
|
Interest |
2,905 |
2,391,619 |
|||||||||
|
Fund shares sold |
300 |
1,086,216 |
|||||||||
|
Foreign tax reclaims |
— |
17,463 |
|||||||||
|
Due from Advisor |
4,539 |
— |
|||||||||
|
Dividends |
34,037 |
3,069 |
|||||||||
|
Variation margin on centrally cleared swap agreements |
— |
— |
|||||||||
|
Due from broker |
477,988 |
21,325,066 |
|||||||||
|
Cash collateral for futures contracts |
1,321,537 |
9,501,448 |
|||||||||
|
Cash collateral for swap agreements |
— |
5,201,000 |
|||||||||
|
Outstanding swap agreements, at value2 |
— |
5,522,703 |
|||||||||
|
Unrealized appreciation on forward foreign currency contracts |
— |
2,081,309 |
|||||||||
|
Other assets |
33,559 |
52,475 |
|||||||||
|
Total assets |
30,855,814 |
341,329,471 |
|||||||||
|
Liabilities: |
|||||||||||
|
Payables: |
|||||||||||
|
Cash collateral from securities loaned |
4,817,108 |
1,558,438 |
|||||||||
|
Investment securities purchased |
— |
1,613,569 |
|||||||||
|
Investment advisory and administration fee |
— |
201,536 |
|||||||||
|
Custody and fund accounting fees |
25,737 |
89,418 |
|||||||||
|
Fund shares redeemed |
4,600 |
364,035 |
|||||||||
|
Distribution and service fees |
8,637 |
58,359 |
|||||||||
|
Trustees' fees |
6,071 |
18,041 |
|||||||||
|
Due to custodian |
— |
82 |
|||||||||
|
Due to broker |
— |
— |
|||||||||
|
Variation margin on futures contracts |
315,416 |
1,284,800 |
|||||||||
|
Accrued expenses |
84,646 |
165,884 |
|||||||||
|
Options written, at value3 |
— |
1,586,225 |
|||||||||
|
Outstanding swap agreements, at value2 |
— |
5,289,854 |
|||||||||
|
Unrealized depreciation on forward foreign currency contracts |
— |
1,030,605 |
|||||||||
|
Total liabilities |
5,262,215 |
13,260,846 |
|||||||||
|
Net assets |
$ |
25,593,599 |
$ |
328,068,625 |
|||||||
1 The market value of securities loaned by UBS Asset Growth Fund, UBS Dynamic Alpha Fund and UBS Global Allocation Fund as of June 30, 2015 was $4,717,139, $13,676,900 and $24,252,961, respectively.
2 Net upfront payments received by UBS Dynamic Alpha Fund were $86,237.
3 Premiums received by UBS Dynamic Alpha Fund were $1,155,635.
66
The UBS Funds
Financial statements
|
UBS Global Allocation Fund |
UBS Multi-Asset Income Fund |
||||||||||
|
Assets: |
|||||||||||
|
Investments, at cost: |
|||||||||||
|
Unaffiliated issuers |
$ |
296,891,300 |
$ |
17,029,573 |
|||||||
|
Affiliated issuers |
172,544,096 |
791,797 |
|||||||||
|
Investment of cash collateral in an affiliated issuer received from securities loaned1 |
23,131,258 |
— |
|||||||||
|
Foreign currency |
1,827,119 |
40,088 |
|||||||||
|
$ |
494,393,773 |
$ |
17,861,458 |
||||||||
|
Investments, at value: |
|||||||||||
|
Unaffiliated issuers |
$ |
307,614,517 |
$ |
16,638,602 |
|||||||
|
Affiliated issuers |
174,128,963 |
791,797 |
|||||||||
|
Investment of cash collateral in an affiliated issuer received from securities loaned1 |
23,131,258 |
— |
|||||||||
|
Foreign currency |
1,829,330 |
39,919 |
|||||||||
|
Receivables: |
|||||||||||
|
Investment securities sold |
2,885,312 |
1,016,128 |
|||||||||
|
Interest |
401,910 |
19,364 |
|||||||||
|
Fund shares sold |
1,150,084 |
529 |
|||||||||
|
Foreign tax reclaims |
182,290 |
432 |
|||||||||
|
Due from Advisor |
— |
39,144 |
|||||||||
|
Dividends |
291,326 |
25,393 |
|||||||||
|
Variation margin on centrally cleared swap agreements |
732,813 |
— |
|||||||||
|
Due from broker |
5,194,950 |
— |
|||||||||
|
Cash collateral for futures contracts |
13,786,826 |
135,093 |
|||||||||
|
Cash collateral for swap agreements |
1,394,157 |
— |
|||||||||
|
Outstanding swap agreements, at value2 |
— |
— |
|||||||||
|
Unrealized appreciation on forward foreign currency contracts |
1,886,946 |
27,535 |
|||||||||
|
Other assets |
64,777 |
28,713 |
|||||||||
|
Total assets |
534,675,459 |
18,762,649 |
|||||||||
|
Liabilities: |
|||||||||||
|
Payables: |
|||||||||||
|
Cash collateral from securities loaned |
23,131,258 |
— |
|||||||||
|
Investment securities purchased |
722,352 |
571,703 |
|||||||||
|
Investment advisory and administration fee |
368,085 |
— |
|||||||||
|
Custody and fund accounting fees |
102,942 |
25,739 |
|||||||||
|
Fund shares redeemed |
635,351 |
97,533 |
|||||||||
|
Distribution and service fees |
176,054 |
6,188 |
|||||||||
|
Trustees' fees |
25,126 |
5,741 |
|||||||||
|
Due to custodian |
— |
— |
|||||||||
|
Due to broker |
— |
5,840 |
|||||||||
|
Variation margin on futures contracts |
3,706,373 |
7,230 |
|||||||||
|
Accrued expenses |
203,627 |
101,443 |
|||||||||
|
Options written, at value3 |
— |
— |
|||||||||
|
Outstanding swap agreements, at value2 |
— |
— |
|||||||||
|
Unrealized depreciation on forward foreign currency contracts |
1,247,431 |
1,257 |
|||||||||
|
Total liabilities |
30,318,599 |
822,674 |
|||||||||
|
Net assets |
$ |
504,356,860 |
$ |
17,939,975 |
|||||||
See accompanying notes to financial statements.
67
The UBS Funds
Financial statements
Statement of assets and liabilities (continued)
June 30, 2015
|
UBS Asset Growth Fund |
UBS Dynamic Alpha Fund |
||||||||||
|
Net assets consist of: |
|||||||||||
|
Beneficial interest |
$ |
50,537,194 |
$ |
701,658,811 |
|||||||
|
Accumulated undistributed (distributions in excess of) net investment income (loss) |
85,981 |
6,638,142 |
|||||||||
|
Accumulated net realized gain (loss) |
(24,514,540 |
) |
(361,297,747 |
) |
|||||||
|
Net unrealized appreciation (depreciation) |
(515,036 |
) |
(18,930,581 |
) |
|||||||
|
Net assets |
$ |
25,593,599 |
$ |
328,068,625 |
|||||||
|
Class A: |
|||||||||||
|
Net assets |
$ |
13,369,995 |
$ |
89,421,336 |
|||||||
|
Shares outstanding |
1,448,496 |
12,538,066 |
|||||||||
|
Net asset value and redemption proceeds per share |
$ |
9.23 |
$ |
7.13 |
|||||||
|
Offering price per share (NAV per share plus maximum sales charge)1,2 |
$ |
9.77 |
$ |
7.54 |
|||||||
|
Class C: |
|||||||||||
|
Net assets |
$ |
6,514,622 |
$ |
45,870,352 |
|||||||
|
Shares outstanding |
715,123 |
6,862,316 |
|||||||||
|
Net asset value and offering price per share |
$ |
9.11 |
$ |
6.68 |
|||||||
|
Redemption proceeds per share (NAV per share less maximum contingent deferred sales charge)1,2 |
$ |
9.02 |
$ |
6.61 |
|||||||
|
Class P: |
|||||||||||
|
Net assets |
$ |
5,708,982 |
$ |
192,776,937 |
|||||||
|
Shares outstanding |
617,280 |
26,534,134 |
|||||||||
|
Net asset value per share, offering price per share, and redemption proceeds per share1,2 |
$ |
9.25 |
$ |
7.27 |
|||||||
1 For UBS Asset Growth Fund, UBS Dynamic Alpha Fund and UBS Global Allocation Fund, Class A, the maximum sales charge is 5.50%. Classes C and P have no front-end sales charges. For Class A, the maximum contingent deferred sales charge of 1.00% of the shares' offering price or the net asset value at the time of sale by the shareholder, whichever is less, is charged on sales of shares on original purchases of $1 million or more that were not subject to a front-end sales charge made within one year of the purchase date. Class C maximum contingent deferred sales charge is 1.00%. Class P has no contingent deferred sales charge. If an investor sells or exchanges shares less than 90 days after purchase, a redemption fee of 1.00% of the amount sold or exchanged will be deducted at the time of the transaction, except as noted otherwise in the prospectus. For sales or exchanges taking place on or after February 17, 2015, there is a reduction in the redemption holding period from 90 days to 30 days. Shares that an investor holds or purchases prior to implementation of this new holding period are subject to preexisting terms for the holding period as outlined in the prospectus. Effective August 3, 2015, the 1.00% redemption fee imposed on sales or exchanges of any class of shares of the funds made during the holding periods specified in the prospectus will be eliminated.
2 For UBS Multi Asset Income Fund Class A, the maximum sales charge is 4.50%. Classes C and P have no front-end sales charges. For Class A, the maximum contingent deferred sales charge of 1.00% of the shares' offering price or the net asset value at the time of sale by the shareholder, whichever is less, is charged on sales of shares on original purchases of $1 million or more that were not subject to a front-end charge made within one year of the purchase date. Class C maximum contingent deferred sales charge is 0.75%. Class P has no deferred sales charge. If an investor sells or exchanges shares less than 90 days after purchase, a redemption fee of 1.00% of the amount sold or exchanged will be deducted at the time of the transaction, except as noted otherwise in the prospectus. For sales or exchanges taking place on or after February 17, 2015, there is a reduction in the redemption holding period from 90 days to 30 days. Shares that an investor holds or purchases prior to implementation of this new holding period are subject to preexisting terms for the holding period as outlined in the prospectus. Effective August 3, 2015, the 1.00% redemption fee imposed on sales or exchanges of any class of shares of the funds made during the holding periods specified in the prospectus will be eliminated.
68
The UBS Funds
Financial statements
|
UBS Global Allocation Fund |
UBS Multi-Asset Income Fund |
||||||||||
|
Net assets consist of: |
|||||||||||
|
Beneficial interest |
$ |
1,438,435,359 |
$ |
18,402,988 |
|||||||
|
Accumulated undistributed (distributions in excess of) net investment income (loss) |
9,822,635 |
(8,011 |
) |
||||||||
|
Accumulated net realized gain (loss) |
(952,757,732 |
) |
(82,768 |
) |
|||||||
|
Net unrealized appreciation (depreciation) |
8,856,598 |
(372,234 |
) |
||||||||
|
Net assets |
$ |
504,356,860 |
$ |
17,939,975 |
|||||||
|
Class A: |
|||||||||||
|
Net assets |
$ |
234,665,281 |
$ |
3,101,987 |
|||||||
|
Shares outstanding |
20,826,148 |
325,100 |
|||||||||
|
Net asset value and redemption proceeds per share |
$ |
11.27 |
$ |
9.54 |
|||||||
|
Offering price per share (NAV per share plus maximum sales charge)1,2 |
$ |
11.93 |
$ |
9.99 |
|||||||
|
Class C: |
|||||||||||
|
Net assets |
$ |
145,277,007 |
$ |
6,429,047 |
|||||||
|
Shares outstanding |
13,300,644 |
675,181 |
|||||||||
|
Net asset value and offering price per share |
$ |
10.92 |
$ |
9.52 |
|||||||
|
Redemption proceeds per share (NAV per share less maximum contingent deferred sales charge)1,2 |
$ |
10.81 |
$ |
9.45 |
|||||||
|
Class P: |
|||||||||||
|
Net assets |
$ |
124,414,572 |
$ |
8,408,941 |
|||||||
|
Shares outstanding |
10,805,921 |
880,540 |
|||||||||
|
Net asset value per share, offering price per share, and redemption proceeds per share1,2 |
$ |
11.51 |
$ |
9.55 |
|||||||
See accompanying notes to financial statements.
69
The UBS Funds
Financial statements
Statement of operations
For the year ended June 30, 2015
|
UBS Asset Growth Fund |
UBS Dynamic Alpha Fund |
||||||||||
|
Investment income: |
|||||||||||
|
Dividends |
$ |
479,226 |
$ |
— |
|||||||
|
Interest and other |
656 |
6,228,040 |
|||||||||
|
Affiliated income |
8,112 |
25,172 |
|||||||||
|
Securities lending1 |
36,056 |
14,278 |
|||||||||
|
Foreign tax withheld |
— |
(2,821 |
) |
||||||||
|
Total income |
524,050 |
6,264,669 |
|||||||||
|
Expenses: |
|||||||||||
|
Advisory and administration |
285,782 |
2,995,124 |
|||||||||
|
Distribution and service: |
|||||||||||
|
Class A |
39,412 |
258,643 |
|||||||||
|
Class C |
69,646 |
484,070 |
|||||||||
|
Transfer agency and related services fees: |
|||||||||||
|
Class A |
6,410 |
63,034 |
|||||||||
|
Class C |
4,147 |
33,732 |
|||||||||
|
Class P |
1,995 |
129,269 |
|||||||||
|
Custodian and fund accounting |
51,663 |
182,830 |
|||||||||
|
Federal and state registration |
42,257 |
51,079 |
|||||||||
|
Professional services |
108,387 |
193,450 |
|||||||||
|
Shareholder reports |
12,430 |
64,206 |
|||||||||
|
Trustees |
22,505 |
61,775 |
|||||||||
|
Other |
34,152 |
72,864 |
|||||||||
|
Total expenses |
678,786 |
4,590,076 |
|||||||||
|
Fee waivers and/or expense reimbursements by Advisor |
(249,464 |
) |
(287,501 |
) |
|||||||
|
Net expenses |
429,322 |
4,302,575 |
|||||||||
|
Net investment income (loss) |
94,728 |
1,962,094 |
|||||||||
|
Net realized gain (loss) on: |
|||||||||||
|
Investments in unaffiliated issuers |
46,666 |
676,058 |
|||||||||
|
Investments in affiliated issuers |
— |
— |
|||||||||
|
Futures contracts |
660,629 |
7,300,815 |
|||||||||
|
Options written |
— |
823,563 |
|||||||||
|
Swap agreements |
— |
(1,910,274 |
) |
||||||||
|
Forward foreign currency contracts |
— |
18,511,350 |
|||||||||
|
Foreign currency transactions |
15,368 |
(1,875,039 |
) |
||||||||
|
Net realized gain |
722,663 |
23,526,473 |
|||||||||
|
Change in net unrealized appreciation/depreciation on: |
|||||||||||
|
Investments |
(779,118 |
) |
(18,426,692 |
) |
|||||||
|
Futures contracts |
(455,367 |
) |
(2,346,506 |
) |
|||||||
|
Options written |
— |
(1,216,762 |
) |
||||||||
|
Swap agreements |
— |
(856,945 |
) |
||||||||
|
Forward foreign currency contracts |
— |
3,824,556 |
|||||||||
|
Translation of other assets and liabilities denominated in foreign currency |
5,172 |
(309,404 |
) |
||||||||
|
Change in net unrealized appreciation/depreciation |
(1,229,313 |
) |
(19,331,753 |
) |
|||||||
|
Net realized and unrealized gain (loss) |
(506,650 |
) |
4,194,720 |
||||||||
|
Contributions from advisor |
— |
2,068 |
|||||||||
|
Net increase (decrease) in net assets resulting from operations |
$ |
(411,922 |
) |
$ |
6,158,882 |
||||||
1 Includes affiliated income from UBS Private Money Market Fund LLC of $319, $113 and $2,261 for UBS Asset Growth Fund, UBS Dynamic Alpha Fund and UBS Global Allocation Fund, respectively.
70
The UBS Funds
Financial statements
|
UBS Global Allocation Fund |
UBS Multi-Asset Income Fund |
||||||||||
|
Investment income: |
|||||||||||
|
Dividends |
$ |
5,919,178 |
$ |
612,217 |
|||||||
|
Interest and other |
1,049,898 |
69,961 |
|||||||||
|
Affiliated income |
115,378 |
587 |
|||||||||
|
Securities lending1 |
394,758 |
— |
|||||||||
|
Foreign tax withheld |
(270,614 |
) |
(1,136 |
) |
|||||||
|
Total income |
7,208,598 |
681,629 |
|||||||||
|
Expenses: |
|||||||||||
|
Advisory and administration |
4,800,636 |
138,264 |
|||||||||
|
Distribution and service: |
|||||||||||
|
Class A |
625,685 |
10,887 |
|||||||||
|
Class C |
1,593,611 |
70,471 |
|||||||||
|
Transfer agency and related services fees: |
|||||||||||
|
Class A |
157,331 |
4,244 |
|||||||||
|
Class C |
141,625 |
4,604 |
|||||||||
|
Class P |
53,494 |
7,616 |
|||||||||
|
Custodian and fund accounting |
218,832 |
54,847 |
|||||||||
|
Federal and state registration |
48,794 |
42,701 |
|||||||||
|
Professional services |
167,809 |
135,403 |
|||||||||
|
Shareholder reports |
104,269 |
13,404 |
|||||||||
|
Trustees |
91,119 |
21,557 |
|||||||||
|
Other |
107,357 |
29,593 |
|||||||||
|
Total expenses |
8,110,562 |
533,591 |
|||||||||
|
Fee waivers and/or expense reimbursements by Advisor |
— |
(306,977 |
) |
||||||||
|
Net expenses |
8,110,562 |
226,614 |
|||||||||
|
Net investment income (loss) |
(901,964 |
) |
455,015 |
||||||||
|
Net realized gain (loss) on: |
|||||||||||
|
Investments in unaffiliated issuers |
33,630,713 |
125,578 |
|||||||||
|
Investments in affiliated issuers |
4,876,878 |
— |
|||||||||
|
Futures contracts |
12,178,366 |
(139,469 |
) |
||||||||
|
Options written |
— |
— |
|||||||||
|
Swap agreements |
318,815 |
— |
|||||||||
|
Forward foreign currency contracts |
10,650,342 |
506,291 |
|||||||||
|
Foreign currency transactions |
(101,769 |
) |
(7,708 |
) |
|||||||
|
Net realized gain |
61,553,345 |
484,692 |
|||||||||
|
Change in net unrealized appreciation/depreciation on: |
|||||||||||
|
Investments |
(47,204,531 |
) |
(1,085,898 |
) |
|||||||
|
Futures contracts |
(5,879,441 |
) |
1,833 |
||||||||
|
Options written |
— |
— |
|||||||||
|
Swap agreements |
(329,960 |
) |
— |
||||||||
|
Forward foreign currency contracts |
3,462,344 |
68,023 |
|||||||||
|
Translation of other assets and liabilities denominated in foreign currency |
(160,669 |
) |
(1,811 |
) |
|||||||
|
Change in net unrealized appreciation/depreciation |
(50,112,257 |
) |
(1,017,853 |
) |
|||||||
|
Net realized and unrealized gain (loss) |
11,441,088 |
(533,161 |
) |
||||||||
|
Contributions from advisor |
— |
— |
|||||||||
|
Net increase (decrease) in net assets resulting from operations |
$ |
10,539,124 |
$ |
(78,146 |
) |
||||||
See accompanying notes to financial statements.
71
The UBS Funds
Financial statements
Statement of changes in net assets
|
UBS Asset Growth Fund |
UBS Dynamic Alpha Fund |
||||||||||||||||||
|
Year ended June 30, 2015 |
Year ended June 30, 2014 |
Year ended June 30, 2015 |
Year ended June 30, 2014 |
||||||||||||||||
|
Operations: |
|||||||||||||||||||
|
Net investment income (loss) |
$ |
94,728 |
$ |
(38,228 |
) |
$ |
1,962,094 |
$ |
1,831,889 |
||||||||||
|
Net realized gain |
722,663 |
6,880,013 |
23,526,473 |
8,635,591 |
|||||||||||||||
|
Change in net unrealized appreciation/depreciation |
(1,229,313 |
) |
(1,150,890 |
) |
(19,331,753 |
) |
8,435,879 |
||||||||||||
|
Contributions from advisor |
— |
— |
2,068 |
— |
|||||||||||||||
|
Net increase (decrease) in net assets from operations |
(411,922 |
) |
5,690,895 |
6,158,882 |
18,903,359 |
||||||||||||||
|
Dividends and distributions to shareholders by class: |
|||||||||||||||||||
|
Class A: |
|||||||||||||||||||
|
Net investment income |
— |
(101,974 |
) |
(3,213,694 |
) |
(294,356 |
) |
||||||||||||
|
Net realized gain |
— |
— |
— |
— |
|||||||||||||||
|
Total Class A dividends and distributions |
— |
(101,974 |
) |
(3,213,694 |
) |
(294,356 |
) |
||||||||||||
|
Class C: |
|||||||||||||||||||
|
Net investment income |
— |
— |
(1,474,152 |
) |
— |
||||||||||||||
|
Net realized gain |
— |
— |
— |
— |
|||||||||||||||
|
Total Class C dividends and distributions |
— |
— |
(1,474,152 |
) |
— |
||||||||||||||
|
Class P: |
|||||||||||||||||||
|
Net investment income |
— |
(12,725 |
) |
(6,858,469 |
) |
(198,514 |
) |
||||||||||||
|
Net realized gain |
— |
— |
— |
— |
|||||||||||||||
|
Total Class P dividends and distributions |
— |
(12,725 |
) |
(6,858,469 |
) |
(198,514 |
) |
||||||||||||
|
Decrease in net assets from dividends and distributions |
— |
(114,699 |
) |
(11,546,315 |
) |
(492,870 |
) |
||||||||||||
|
Beneficial interest transactions: |
|||||||||||||||||||
|
Proceeds from shares sold |
5,702,511 |
1,610,145 |
167,409,014 |
77,440,021 |
|||||||||||||||
|
Shares issued on reinvestment of dividends and distributions |
— |
109,407 |
10,374,472 |
454,046 |
|||||||||||||||
|
Cost of shares redeemed |
(11,965,940 |
) |
(10,549,189 |
) |
(170,803,372 |
) |
(79,755,521 |
) |
|||||||||||
|
Redemption fees |
514 |
244 |
3,797 |
36,393 |
|||||||||||||||
|
Net increase (decrease) in net assets resulting from beneficial interest transactions |
(6,262,915 |
) |
(8,829,393 |
) |
6,983,911 |
(1,825,061 |
) |
||||||||||||
|
Increase/(decrease) in net assets |
(6,674,837 |
) |
(3,253,197 |
) |
1,596,478 |
16,585,428 |
|||||||||||||
|
Net assets, beginning of year |
32,268,436 |
35,521,633 |
326,472,147 |
309,886,719 |
|||||||||||||||
|
Net assets, end of year |
$ |
25,593,599 |
$ |
32,268,436 |
$ |
328,068,625 |
$ |
326,472,147 |
|||||||||||
|
Accumulated undistributed net investment income (loss) |
$ |
85,981 |
$ |
(12,334 |
) |
$ |
6,638,142 |
$ |
1,688,624 |
||||||||||
72
The UBS Funds
Financial statements
|
UBS Global Allocation Fund |
UBS Multi-Asset Income Fund |
||||||||||||||||||
|
Year ended June 30, 2015 |
Year ended June 30, 2014 |
Year ended June 30, 2015 |
Year ended June 30, 2014 |
||||||||||||||||
|
Operations: |
|||||||||||||||||||
|
Net investment income (loss) |
$ |
(901,964 |
) |
$ |
165,076 |
$ |
455,015 |
$ |
1,256,797 |
||||||||||
|
Net realized gain |
61,553,345 |
68,508,662 |
484,692 |
1,258,798 |
|||||||||||||||
|
Change in net unrealized appreciation/depreciation |
(50,112,257 |
) |
18,116,562 |
(1,017,853 |
) |
1,505,607 |
|||||||||||||
|
Contributions from advisor |
— |
— |
— |
32,823 |
|||||||||||||||
|
Net increase (decrease) in net assets from operations |
10,539,124 |
86,790,300 |
(78,146 |
) |
4,054,025 |
||||||||||||||
|
Dividends and distributions to shareholders by class: |
|||||||||||||||||||
|
Class A: |
|||||||||||||||||||
|
Net investment income |
— |
(4,280,584 |
) |
(178,863 |
) |
(579,873 |
) |
||||||||||||
|
Net realized gain |
— |
— |
(194,660 |
) |
(93,081 |
) |
|||||||||||||
|
Total Class A dividends and distributions |
— |
(4,280,584 |
) |
(373,523 |
) |
(672,954 |
) |
||||||||||||
|
Class C: |
|||||||||||||||||||
|
Net investment income |
— |
(719,266 |
) |
(218,163 |
) |
(192,209 |
) |
||||||||||||
|
Net realized gain |
— |
— |
(429,608 |
) |
(38,755 |
) |
|||||||||||||
|
Total Class C dividends and distributions |
— |
(719,266 |
) |
(647,771 |
) |
(230,964 |
) |
||||||||||||
|
Class P: |
|||||||||||||||||||
|
Net investment income |
— |
(2,051,341 |
) |
(359,914 |
) |
(605,028 |
) |
||||||||||||
|
Net realized gain |
— |
— |
(664,329 |
) |
(113,528 |
) |
|||||||||||||
|
Total Class P dividends and distributions |
— |
(2,051,341 |
) |
(1,024,243 |
) |
(718,556 |
) |
||||||||||||
|
Decrease in net assets from dividends and distributions |
— |
(7,051,191 |
) |
(2,045,537 |
) |
(1,622,474 |
) |
||||||||||||
|
Beneficial interest transactions: |
|||||||||||||||||||
|
Proceeds from shares sold |
78,469,043 |
11,160,079 |
13,349,222 |
3,365,992 |
|||||||||||||||
|
Shares issued on reinvestment of dividends and distributions |
— |
6,342,675 |
1,732,679 |
1,408,988 |
|||||||||||||||
|
Cost of shares redeemed |
(197,453,045 |
) |
(185,419,667 |
) |
(18,599,917 |
) |
(42,916,041 |
) |
|||||||||||
|
Redemption fees |
11,272 |
8,544 |
74 |
1,044 |
|||||||||||||||
|
Net increase (decrease) in net assets resulting from beneficial interest transactions |
(118,972,730 |
) |
(167,908,369 |
) |
(3,517,942 |
) |
(38,140,017 |
) |
|||||||||||
|
Increase/(decrease) in net assets |
(108,433,606 |
) |
(88,169,260 |
) |
(5,641,625 |
) |
(35,708,466 |
) |
|||||||||||
|
Net assets, beginning of year |
612,790,466 |
700,959,726 |
23,581,600 |
59,290,066 |
|||||||||||||||
|
Net assets, end of year |
$ |
504,356,860 |
$ |
612,790,466 |
$ |
17,939,975 |
$ |
23,581,600 |
|||||||||||
|
Accumulated undistributed net investment income (loss) |
$ |
9,822,635 |
$ |
(2,857,802 |
) |
$ |
(8,011 |
) |
$ |
5,324 |
|||||||||
See accompanying notes to financial statements.
73
UBS Asset Growth Fund
Financial highlights
The table below sets forth data for one share of beneficial interest outstanding throughout each year presented.
|
Class A |
|||||||||||||||||||||||
|
Year ended June 30, |
|||||||||||||||||||||||
|
2015 |
2014 |
2013 |
2012 |
2011 |
|||||||||||||||||||
|
Net asset value, beginning of year |
$ |
9.34 |
$ |
7.90 |
$ |
7.08 |
$ |
8.36 |
$ |
6.32 |
|||||||||||||
|
Income (loss) from investment operations: |
|||||||||||||||||||||||
|
Net investment income (loss)1 |
0.05 |
0.003 |
(0.06 |
) |
(0.06 |
) |
(0.09 |
) |
|||||||||||||||
|
Net realized and unrealized gain (loss) |
(0.16 |
) |
1.48 |
0.98 |
(0.84 |
) |
2.38 |
||||||||||||||||
|
Total income (loss) from investment operations |
(0.11 |
) |
1.48 |
0.92 |
(0.90 |
) |
2.29 |
||||||||||||||||
|
Less dividends/distributions: |
|||||||||||||||||||||||
|
From net investment income |
— |
(0.04 |
) |
(0.10 |
) |
(0.38 |
) |
(0.25 |
) |
||||||||||||||
|
Net asset value, end of year |
$ |
9.23 |
$ |
9.34 |
$ |
7.90 |
$ |
7.08 |
$ |
8.36 |
|||||||||||||
|
Total investment return2 |
(1.18 |
)% |
18.75 |
% |
12.98 |
% |
(10.38 |
)% |
36.53 |
% |
|||||||||||||
|
Ratios to average net assets: |
|||||||||||||||||||||||
|
Expenses before fee waivers and/or expense reimbursement |
2.28 |
% |
2.19 |
% |
1.90 |
% |
1.73 |
% |
1.64 |
% |
|||||||||||||
|
Expenses after fee waivers and/or expense reimbursement |
1.40 |
% |
1.40 |
% |
1.40 |
% |
1.40 |
% |
1.40 |
% |
|||||||||||||
|
Net investment income (loss) |
0.52 |
% |
0.05 |
% |
(0.73 |
)% |
(0.78 |
)% |
(1.14 |
)% |
|||||||||||||
|
Supplemental data: |
|||||||||||||||||||||||
|
Net assets, end of year (000's) |
$ |
13,370 |
$ |
22,948 |
$ |
25,047 |
$ |
31,337 |
$ |
50,167 |
|||||||||||||
|
Portfolio turnover rate |
84 |
% |
112 |
% |
49 |
% |
109 |
% |
33 |
% |
|||||||||||||
|
Class P |
|||||||||||||||||||||||
|
Year ended June 30, |
|||||||||||||||||||||||
|
2015 |
2014 |
2013 |
2012 |
2011 |
|||||||||||||||||||
|
Net asset value, beginning of year |
$ |
9.34 |
$ |
7.90 |
$ |
7.09 |
$ |
8.36 |
$ |
6.32 |
|||||||||||||
|
Income (loss) from investment operations: |
|||||||||||||||||||||||
|
Net investment income (loss)1 |
0.06 |
0.03 |
(0.04 |
) |
(0.04 |
) |
(0.07 |
) |
|||||||||||||||
|
Net realized and unrealized gain (loss) |
(0.15 |
) |
1.47 |
0.97 |
(0.83 |
) |
2.38 |
||||||||||||||||
|
Total income (loss) from investment operations |
(0.09 |
) |
1.50 |
0.93 |
(0.87 |
) |
2.31 |
||||||||||||||||
|
Less dividends/distributions: |
|||||||||||||||||||||||
|
From net investment income |
— |
(0.06 |
) |
(0.12 |
) |
(0.40 |
) |
(0.27 |
) |
||||||||||||||
|
Net asset value, end of year |
$ |
9.25 |
$ |
9.34 |
$ |
7.90 |
$ |
7.09 |
$ |
8.36 |
|||||||||||||
|
Total investment return2 |
(0.96 |
)% |
19.12 |
% |
13.21 |
% |
(10.07 |
)% |
36.66 |
% |
|||||||||||||
|
Ratios to average net assets: |
|||||||||||||||||||||||
|
Expenses before fee waivers and/or expense reimbursement |
2.05 |
% |
1.94 |
% |
1.67 |
% |
1.51 |
% |
1.43 |
% |
|||||||||||||
|
Expenses after fee waivers and/or expense reimbursement |
1.15 |
% |
1.15 |
% |
1.15 |
% |
1.15 |
% |
1.15 |
% |
|||||||||||||
|
Net investment income (loss) |
0.61 |
% |
0.30 |
% |
(0.48 |
)% |
(0.54 |
)% |
(0.87 |
)% |
|||||||||||||
|
Supplemental data: |
|||||||||||||||||||||||
|
Net assets, end of year (000's) |
$ |
5,709 |
$ |
1,757 |
$ |
1,835 |
$ |
1,949 |
$ |
1,395 |
|||||||||||||
|
Portfolio turnover rate |
84 |
% |
112 |
% |
49 |
% |
109 |
% |
33 |
% |
|||||||||||||
1 Calculated using the average shares method.
2 Total investment return is calculated assuming a $10,000 investment on the first day of each year reported, reinvestment of all dividends and distributions, if any, at net asset value on the ex-dividend dates, and a sale at net asset value on the last day of each year reported. The figures do not include any applicable sales charges; results would be lower if they were included. Returns do not reflect the deduction of taxes that a shareholder would pay on Fund dividends/distributions or the redemption of Fund shares.
3 Amount represents less than $0.005 per share.
74
UBS Asset Growth Fund
Financial highlights
|
Class C |
|||||||||||||||||||||||
|
Year ended June 30, |
|||||||||||||||||||||||
|
2015 |
2014 |
2013 |
2012 |
2011 |
|||||||||||||||||||
|
Net asset value, beginning of year |
$ |
9.29 |
$ |
7.88 |
$ |
7.05 |
$ |
8.34 |
$ |
6.31 |
|||||||||||||
|
Income (loss) from investment operations: |
|||||||||||||||||||||||
|
Net investment income (loss)1 |
(0.03 |
) |
(0.06 |
) |
(0.11 |
) |
(0.11 |
) |
(0.15 |
) |
|||||||||||||
|
Net realized and unrealized gain (loss) |
(0.15 |
) |
1.47 |
0.97 |
(0.83 |
) |
2.37 |
||||||||||||||||
|
Total income (loss) from investment operations |
(0.18 |
) |
1.41 |
0.86 |
(0.94 |
) |
2.22 |
||||||||||||||||
|
Less dividends/distributions: |
|||||||||||||||||||||||
|
From net investment income |
— |
— |
(0.03 |
) |
(0.35 |
) |
(0.19 |
) |
|||||||||||||||
|
Net asset value, end of year |
$ |
9.11 |
$ |
9.29 |
$ |
7.88 |
$ |
7.05 |
$ |
8.34 |
|||||||||||||
|
Total investment return2 |
(1.94 |
)% |
17.89 |
% |
12.15 |
% |
(11.00 |
)% |
35.39 |
% |
|||||||||||||
|
Ratios to average net assets: |
|||||||||||||||||||||||
|
Expenses before fee waivers and/or expense reimbursement |
3.06 |
% |
2.96 |
% |
2.67 |
% |
2.51 |
% |
2.41 |
% |
|||||||||||||
|
Expenses after fee waivers and/or expense reimbursement |
2.15 |
% |
2.15 |
% |
2.15 |
% |
2.15 |
% |
2.15 |
% |
|||||||||||||
|
Net investment income (loss) |
(0.27 |
)% |
(0.72 |
)% |
(1.48 |
)% |
(1.53 |
)% |
(1.89 |
)% |
|||||||||||||
|
Supplemental data: |
|||||||||||||||||||||||
|
Net assets, end of year (000's) |
$ |
6,515 |
$ |
7,564 |
$ |
8,640 |
$ |
9,931 |
$ |
14,989 |
|||||||||||||
|
Portfolio turnover rate |
84 |
% |
112 |
% |
49 |
% |
109 |
% |
33 |
% |
|||||||||||||
See accompanying notes to financial statements.
75
UBS Dynamic Alpha Fund
Financial highlights
The table below sets forth data for one share of beneficial interest outstanding throughout each year presented.
|
Class A |
|||||||||||||||||||||||
|
Year ended June 30, |
|||||||||||||||||||||||
|
2015 |
2014 |
2013 |
2012 |
2011 |
|||||||||||||||||||
|
Net asset value, beginning of year |
$ |
7.24 |
$ |
6.82 |
$ |
6.36 |
$ |
5.98 |
$ |
5.92 |
|||||||||||||
|
Income (loss) from investment operations: |
|||||||||||||||||||||||
|
Net investment income1 |
0.04 |
0.05 |
0.07 |
0.08 |
0.06 |
||||||||||||||||||
|
Net realized and unrealized gain |
0.11 |
0.38 |
0.50 |
0.30 |
0.16 |
||||||||||||||||||
|
Net increase from payment by Advisor |
0.003 |
— |
— |
— |
— |
||||||||||||||||||
|
Total income from investment operations |
0.15 |
0.43 |
0.57 |
0.38 |
0.22 |
||||||||||||||||||
|
Less dividends/distributions: |
|||||||||||||||||||||||
|
From net investment income |
(0.26 |
) |
(0.01 |
) |
(0.11 |
) |
— |
(0.16 |
) |
||||||||||||||
|
Net asset value, end of year |
$ |
7.13 |
$ |
7.24 |
$ |
6.82 |
$ |
6.36 |
$ |
5.98 |
|||||||||||||
|
Total investment return2 |
2.03 |
%4 |
6.31 |
% |
9.05 |
% |
6.18 |
% |
3.58 |
% |
|||||||||||||
|
Ratios to average net assets: |
|||||||||||||||||||||||
|
Expenses before fee waivers and/or expense reimbursement and after dividend expense and security loan fees for securities sold short |
1.43 |
% |
1.42 |
% |
1.43 |
% |
1.60 |
% |
1.79 |
% |
|||||||||||||
|
Expenses after fee waivers and/or expense reimbursement and after dividend expense and security loan fees for securities sold short |
1.35 |
% |
1.35 |
% |
1.35 |
% |
1.54 |
% |
1.76 |
% |
|||||||||||||
|
Expenses after fee waivers and/or expense reimbursement and before dividend expense and security loan fees for securities sold short |
1.35 |
% |
1.35 |
% |
1.35 |
% |
1.35 |
% |
1.35 |
% |
|||||||||||||
|
Net investment income |
0.58 |
% |
0.66 |
% |
0.98 |
% |
1.33 |
% |
0.95 |
% |
|||||||||||||
|
Supplemental data: |
|||||||||||||||||||||||
|
Net assets, end of year (000's) |
$ |
89,421 |
$ |
194,185 |
$ |
208,369 |
$ |
160,773 |
$ |
216,297 |
|||||||||||||
|
Portfolio turnover rate |
54 |
% |
45 |
% |
74 |
% |
164 |
% |
65 |
% |
|||||||||||||
|
Class P |
|||||||||||||||||||||||
|
Year ended June 30, |
|||||||||||||||||||||||
|
2015 |
2014 |
2013 |
2012 |
2011 |
|||||||||||||||||||
|
Net asset value, beginning of year |
$ |
7.38 |
$ |
6.96 |
$ |
6.48 |
$ |
6.09 |
$ |
6.03 |
|||||||||||||
|
Income (loss) from investment operations: |
|||||||||||||||||||||||
|
Net investment income1 |
0.06 |
0.06 |
0.09 |
0.10 |
0.08 |
||||||||||||||||||
|
Net realized and unrealized gain |
0.12 |
0.39 |
0.52 |
0.29 |
0.16 |
||||||||||||||||||
|
Net increase from payment by Advisor |
0.003 |
— |
— |
— |
— |
||||||||||||||||||
|
Total income from investment operations |
0.18 |
0.45 |
0.61 |
0.39 |
0.24 |
||||||||||||||||||
|
Less dividends/distributions: |
|||||||||||||||||||||||
|
From net investment income |
(0.29 |
) |
(0.03 |
) |
(0.13 |
) |
— |
(0.18 |
) |
||||||||||||||
|
Net asset value, end of year |
$ |
7.27 |
$ |
7.38 |
$ |
6.96 |
$ |
6.48 |
$ |
6.09 |
|||||||||||||
|
Total investment return2 |
2.29 |
%4 |
6.45 |
% |
9.29 |
% |
6.57 |
% |
3.89 |
% |
|||||||||||||
|
Ratios to average net assets: |
|||||||||||||||||||||||
|
Expenses before fee waivers and/or expense reimbursement and after dividend expense and security loan fees for securities sold short |
1.20 |
% |
1.15 |
% |
1.12 |
% |
1.28 |
% |
1.49 |
% |
|||||||||||||
|
Expenses after fee waivers and/or expense reimbursement and after dividend expense and security loan fees for securities sold short |
1.10 |
% |
1.10 |
% |
1.10 |
% |
1.28 |
% |
1.49 |
% |
|||||||||||||
|
Expenses after fee waivers and/or expense reimbursement and before dividend expense and security loan fees for securities sold short |
1.10 |
% |
1.10 |
% |
1.10 |
% |
1.10 |
% |
1.07 |
% |
|||||||||||||
|
Net investment income |
0.84 |
% |
0.87 |
% |
1.25 |
% |
1.56 |
% |
1.25 |
% |
|||||||||||||
|
Supplemental data: |
|||||||||||||||||||||||
|
Net assets, end of year (000's) |
$ |
192,777 |
$ |
81,168 |
$ |
48,113 |
$ |
51,807 |
$ |
87,743 |
|||||||||||||
|
Portfolio turnover rate |
54 |
% |
45 |
% |
74 |
% |
164 |
% |
65 |
% |
|||||||||||||
1 Calculated using the average shares method.
2 Total investment return is calculated assuming a $10,000 investment on the first day of each year reported, reinvestment of all dividends and distributions, if any, at net asset value on the ex-dividend dates, and a sale at net asset value on the last day of each year reported. The figures do not include any applicable sales charges; results would be lower if they were included. Returns do not reflect the deduction of taxes that a shareholder would pay on Fund dividends/distributions or the redemption of Fund shares.
76
UBS Dynamic Alpha Fund
Financial highlights
|
Class C |
|||||||||||||||||||||||
|
Year ended June 30, |
|||||||||||||||||||||||
|
2015 |
2014 |
2013 |
2012 |
2011 |
|||||||||||||||||||
|
Net asset value, beginning of year |
$ |
6.81 |
$ |
6.46 |
$ |
6.02 |
$ |
5.71 |
$ |
5.65 |
|||||||||||||
|
Income (loss) from investment operations: |
|||||||||||||||||||||||
|
Net investment income1 |
(0.01 |
) |
(0.01 |
) |
0.02 |
0.03 |
0.01 |
||||||||||||||||
|
Net realized and unrealized gain |
0.09 |
0.36 |
0.48 |
0.28 |
0.15 |
||||||||||||||||||
|
Net increase from payment by Advisor |
0.003 |
— |
— |
— |
— |
||||||||||||||||||
|
Total income from investment operations |
0.08 |
0.35 |
0.50 |
0.31 |
0.16 |
||||||||||||||||||
|
Less dividends/distributions: |
|||||||||||||||||||||||
|
From net investment income |
(0.21 |
) |
— |
(0.06 |
) |
— |
(0.10 |
) |
|||||||||||||||
|
Net asset value, end of year |
$ |
6.68 |
$ |
6.81 |
$ |
6.46 |
$ |
6.02 |
$ |
5.71 |
|||||||||||||
|
Total investment return2 |
1.21 |
%4 |
5.42 |
% |
8.22 |
% |
5.60 |
% |
2.82 |
% |
|||||||||||||
|
Ratios to average net assets: |
|||||||||||||||||||||||
|
Expenses before fee waivers and/or expense reimbursement and after dividend expense and security loan fees for securities sold short |
2.19 |
% |
2.18 |
% |
2.19 |
% |
2.36 |
% |
2.55 |
% |
|||||||||||||
|
Expenses after fee waivers and/or expense reimbursement and after dividend expense and security loan fees for securities sold short |
2.10 |
% |
2.10 |
% |
2.10 |
% |
2.29 |
% |
2.51 |
% |
|||||||||||||
|
Expenses after fee waivers and/or expense reimbursement and before dividend expense and security loan fees for securities sold short |
2.10 |
% |
2.10 |
% |
2.10 |
% |
2.10 |
% |
2.10 |
% |
|||||||||||||
|
Net investment income |
(0.17 |
)% |
(0.09 |
)% |
0.24 |
% |
0.58 |
% |
0.20 |
% |
|||||||||||||
|
Supplemental data: |
|||||||||||||||||||||||
|
Net assets, end of year (000's) |
$ |
45,871 |
$ |
51,119 |
$ |
53,405 |
$ |
49,155 |
$ |
66,349 |
|||||||||||||
|
Portfolio turnover rate |
54 |
% |
45 |
% |
74 |
% |
164 |
% |
65 |
% |
|||||||||||||
3 Amount represents less than $0.005 per share.
4 During the year ended June 30, 2015 the advisor reimbursed the fund for a trading error in the amount of $2,068, which had no impact on the Fund's total return.
See accompanying notes to financial statements.
77
UBS Global Allocation Fund
Financial highlights
The table below sets forth data for one share of beneficial interest outstanding throughout each year presented.
|
Class A |
|||||||||||||||||||||||
|
Year ended June 30, |
|||||||||||||||||||||||
|
2015 |
2014 |
2013 |
2012 |
2011 |
|||||||||||||||||||
|
Net asset value, beginning of year |
$ |
11.04 |
$ |
9.79 |
$ |
9.12 |
$ |
10.27 |
$ |
8.66 |
|||||||||||||
|
Income (loss) from investment operations: |
|||||||||||||||||||||||
|
Net investment income (loss)1 |
(0.00 |
)3 |
0.02 |
0.01 |
(0.00 |
)3 |
0.003 |
||||||||||||||||
|
Net realized and unrealized gain (loss) |
0.23 |
1.36 |
0.88 |
(0.72 |
) |
2.05 |
|||||||||||||||||
|
Total income (loss) from investment operations |
0.23 |
1.38 |
0.89 |
(0.72 |
) |
2.05 |
|||||||||||||||||
|
Less dividends/distributions: |
|||||||||||||||||||||||
|
From net investment income |
— |
(0.13 |
) |
(0.22 |
) |
(0.43 |
) |
(0.44 |
) |
||||||||||||||
|
Net asset value, end of year |
$ |
11.27 |
$ |
11.04 |
$ |
9.79 |
$ |
9.12 |
$ |
10.27 |
|||||||||||||
|
Total investment return2 |
2.08 |
% |
14.20 |
% |
9.86 |
% |
(6.83 |
)% |
23.87 |
% |
|||||||||||||
|
Ratios to average net assets: |
|||||||||||||||||||||||
|
Expenses |
1.32 |
% |
1.30 |
% |
1.28 |
% |
1.25 |
% |
1.21 |
% |
|||||||||||||
|
Net investment income (loss) |
(0.01 |
)% |
0.17 |
% |
0.12 |
% |
(0.03 |
)% |
0.05 |
% |
|||||||||||||
|
Supplemental data: |
|||||||||||||||||||||||
|
Net assets, end of year (000's) |
$ |
234,665 |
$ |
309,296 |
$ |
377,781 |
$ |
494,604 |
$ |
753,750 |
|||||||||||||
|
Portfolio turnover rate |
62 |
% |
49 |
% |
54 |
% |
93 |
% |
68 |
% |
|||||||||||||
|
Class P |
|||||||||||||||||||||||
|
Year ended June 30, |
|||||||||||||||||||||||
|
2015 |
2014 |
2013 |
2012 |
2011 |
|||||||||||||||||||
|
Net asset value, beginning of year |
$ |
11.25 |
$ |
9.98 |
$ |
9.30 |
$ |
10.48 |
$ |
8.84 |
|||||||||||||
|
Income (loss) from investment operations: |
|||||||||||||||||||||||
|
Net investment income1 |
0.03 |
0.05 |
0.04 |
0.03 |
0.04 |
||||||||||||||||||
|
Net realized and unrealized gain (loss) |
0.23 |
1.39 |
0.90 |
(0.75 |
) |
2.07 |
|||||||||||||||||
|
Total income (loss) from investment operations |
0.26 |
1.44 |
0.94 |
(0.72 |
) |
2.11 |
|||||||||||||||||
|
Less dividends/distributions: |
|||||||||||||||||||||||
|
From net investment income |
— |
(0.17 |
) |
(0.26 |
) |
(0.46 |
) |
(0.47 |
) |
||||||||||||||
|
Net asset value, end of year |
$ |
11.51 |
$ |
11.25 |
$ |
9.98 |
$ |
9.30 |
$ |
10.48 |
|||||||||||||
|
Total investment return2 |
2.31 |
% |
14.56 |
% |
10.22 |
% |
(6.59 |
)% |
24.15 |
% |
|||||||||||||
|
Ratios to average net assets: |
|||||||||||||||||||||||
|
Expenses |
1.04 |
% |
1.00 |
% |
0.98 |
% |
0.95 |
% |
0.92 |
% |
|||||||||||||
|
Net investment income |
0.26 |
% |
0.51 |
% |
0.44 |
% |
0.27 |
% |
0.35 |
% |
|||||||||||||
|
Supplemental data: |
|||||||||||||||||||||||
|
Net assets, end of year (000's) |
$ |
124,415 |
$ |
129,417 |
$ |
127,751 |
$ |
132,941 |
$ |
179,875 |
|||||||||||||
|
Portfolio turnover rate |
62 |
% |
49 |
% |
54 |
% |
93 |
% |
68 |
% |
|||||||||||||
1 Calculated using the average shares method.
2 Total investment return is calculated assuming a $10,000 investment on the first day of each year reported, reinvestment of all dividends and distributions, if any, at net asset value on the ex-dividend dates, and a sale at net asset value on the last day of each year reported. The figures do not include any applicable sales charges; results would be lower if they were included. Returns do not reflect the deduction of taxes that a shareholder would pay on Fund dividends/distributions or the redemption of Fund shares.
3 Amount represents less than $0.005 per share.
78
UBS Global Allocation Fund
Financial highlights
|
Class C |
|||||||||||||||||||||||
|
Year ended June 30, |
|||||||||||||||||||||||
|
2015 |
2014 |
2013 |
2012 |
2011 |
|||||||||||||||||||
|
Net asset value, beginning of year |
$ |
10.79 |
$ |
9.55 |
$ |
8.89 |
$ |
10.00 |
$ |
8.42 |
|||||||||||||
|
Income (loss) from investment operations: |
|||||||||||||||||||||||
|
Net investment income (loss)1 |
(0.09 |
) |
(0.06 |
) |
(0.06 |
) |
(0.07 |
) |
(0.07 |
) |
|||||||||||||
|
Net realized and unrealized gain (loss) |
0.22 |
1.34 |
0.86 |
(0.71 |
) |
1.99 |
|||||||||||||||||
|
Total income (loss) from investment operations |
0.13 |
1.28 |
0.80 |
(0.78 |
) |
1.92 |
|||||||||||||||||
|
Less dividends/distributions: |
|||||||||||||||||||||||
|
From net investment income |
— |
(0.04 |
) |
(0.14 |
) |
(0.33 |
) |
(0.34 |
) |
||||||||||||||
|
Net asset value, end of year |
$ |
10.92 |
$ |
10.79 |
$ |
9.55 |
$ |
8.89 |
$ |
10.00 |
|||||||||||||
|
Total investment return2 |
1.20 |
% |
13.31 |
% |
9.11 |
% |
(7.66 |
)% |
22.90 |
% |
|||||||||||||
|
Ratios to average net assets: |
|||||||||||||||||||||||
|
Expenses |
2.10 |
% |
2.08 |
% |
2.06 |
% |
2.02 |
% |
1.99 |
% |
|||||||||||||
|
Net investment income (loss) |
(0.79 |
)% |
(0.59 |
)% |
(0.65 |
)% |
(0.80 |
)% |
(0.73 |
)% |
|||||||||||||
|
Supplemental data: |
|||||||||||||||||||||||
|
Net assets, end of year (000's) |
$ |
145,277 |
$ |
174,078 |
$ |
195,427 |
$ |
238,054 |
$ |
348,721 |
|||||||||||||
|
Portfolio turnover rate |
62 |
% |
49 |
% |
54 |
% |
93 |
% |
68 |
% |
|||||||||||||
See accompanying notes to financial statements.
79
UBS Multi-Asset Income Fund
Financial highlights
The table below sets forth data for one share of beneficial interest outstanding throughout each year presented.
|
Class A |
|||||||||||||||||||
|
Year ended June 30, |
For the period ended |
||||||||||||||||||
|
2015 |
2014 |
2013 |
June 30, 20123 |
||||||||||||||||
|
Net asset value, beginning of year |
$ |
10.56 |
$ |
10.03 |
$ |
10.00 |
$ |
10.00 |
|||||||||||
|
Income (loss) from investment operations: |
|||||||||||||||||||
|
Net investment income1 |
0.25 |
0.28 |
0.29 |
0.04 |
|||||||||||||||
|
Net realized and unrealized gain (loss) |
(0.27 |
) |
0.59 |
0.11 |
0.01 |
||||||||||||||
|
Net increase from payment by Advisor |
— |
0.01 |
— |
— |
|||||||||||||||
|
Total income (loss) from investment operations |
(0.02 |
) |
0.88 |
0.40 |
0.05 |
||||||||||||||
|
Less dividends/distributions: |
|||||||||||||||||||
|
From net investment income |
(0.38 |
) |
(0.31 |
) |
(0.33 |
) |
(0.05 |
) |
|||||||||||
|
From net realized gains |
(0.62 |
) |
(0.04 |
) |
(0.04 |
) |
— |
||||||||||||
|
Total dividends/distributions |
(1.00 |
) |
(0.35 |
) |
(0.37 |
) |
(0.05 |
) |
|||||||||||
|
Net asset value, end of year |
$ |
9.54 |
$ |
10.56 |
$ |
10.03 |
$ |
10.00 |
|||||||||||
|
Total investment return2 |
(0.31 |
)% |
8.94 |
%5 |
3.98 |
% |
0.50 |
% |
|||||||||||
|
Ratios to average net assets: |
|||||||||||||||||||
|
Expenses before fee waivers and/or expense reimbursement |
2.40 |
% |
1.64 |
% |
1.76 |
% |
2.97 |
%4 |
|||||||||||
|
Expenses after fee waivers and/or expense reimbursement |
0.95 |
% |
0.95 |
% |
0.95 |
% |
0.95 |
%4 |
|||||||||||
|
Net investment income |
2.48 |
% |
2.69 |
% |
2.83 |
% |
2.32 |
%4 |
|||||||||||
|
Supplemental data: |
|||||||||||||||||||
|
Net assets, end of year (000's) |
$ |
3,102 |
$ |
15,949 |
$ |
24,390 |
$ |
2,743 |
|||||||||||
|
Portfolio turnover rate |
86 |
% |
130 |
% |
116 |
% |
17 |
% |
|||||||||||
|
Class P |
|||||||||||||||||||
|
Year ended June 30, |
For the period ended |
||||||||||||||||||
|
2015 |
2014 |
2013 |
June 30, 20123 |
||||||||||||||||
|
Net asset value, beginning of year |
$ |
10.57 |
$ |
10.03 |
$ |
10.00 |
$ |
10.00 |
|||||||||||
|
Income (loss) from investment operations: |
|||||||||||||||||||
|
Net investment income1 |
0.25 |
0.29 |
0.31 |
0.06 |
|||||||||||||||
|
Net realized and unrealized gain (loss) |
(0.25 |
) |
0.61 |
0.12 |
(0.01 |
) |
|||||||||||||
|
Net increase from payment by Advisor |
— |
0.01 |
— |
— |
|||||||||||||||
|
Total income from investment operations |
0.00 |
0.91 |
0.43 |
0.05 |
|||||||||||||||
|
Less dividends/distributions: |
|||||||||||||||||||
|
From net investment income |
(0.40 |
) |
(0.33 |
) |
(0.36 |
) |
(0.05 |
) |
|||||||||||
|
From net realized gains |
(0.62 |
) |
(0.04 |
) |
(0.04 |
) |
— |
||||||||||||
|
Total dividends/distributions |
(1.02 |
) |
(0.37 |
) |
(0.40 |
) |
(0.05 |
) |
|||||||||||
|
Net asset value, end of year |
$ |
9.55 |
$ |
10.57 |
$ |
10.03 |
$ |
10.00 |
|||||||||||
|
Total investment return2 |
(0.07 |
)% |
9.32 |
%5 |
4.23 |
% |
0.53 |
% |
|||||||||||
|
Ratios to average net assets: |
|||||||||||||||||||
|
Expenses before fee waivers and/or expense reimbursement |
2.19 |
% |
1.17 |
% |
1.50 |
% |
2.73 |
%4 |
|||||||||||
|
Expenses after fee waivers and/or expense reimbursement |
0.70 |
% |
0.70 |
% |
0.70 |
% |
0.70 |
%4 |
|||||||||||
|
Net investment income |
2.51 |
% |
2.83 |
% |
3.01 |
% |
3.42 |
%4 |
|||||||||||
|
Supplemental data: |
|||||||||||||||||||
|
Net assets, end of year (000's) |
$ |
8,409 |
$ |
56 |
$ |
26,077 |
$ |
25,118 |
|||||||||||
|
Portfolio turnover rate |
86 |
% |
130 |
% |
116 |
% |
17 |
% |
|||||||||||
1 Calculated using the average shares method.
2 Total investment return is calculated assuming a $10,000 investment on the first day of each period reported, reinvestment of all dividends and distributions, if any, at net asset value on the ex-dividend dates, and a sale at net asset value on the last day of each period reported. The figures do not include any applicable sales charges; results would be lower if they were included. Returns do not reflect the deduction of taxes that a shareholder would pay on Fund distributions or the redemption of Fund shares.
80
UBS Multi-Asset Income Fund
Financial highlights
|
Class C |
|||||||||||||||||||
|
Year ended June 30, |
For the period ended |
||||||||||||||||||
|
2015 |
2014 |
2013 |
June 30, 20123 |
||||||||||||||||
|
Net asset value, beginning of year |
$ |
10.56 |
$ |
10.02 |
$ |
10.00 |
$ |
10.00 |
|||||||||||
|
Income (loss) from investment operations: |
|||||||||||||||||||
|
Net investment income1 |
0.16 |
0.20 |
0.22 |
0.03 |
|||||||||||||||
|
Net realized and unrealized gain (loss) |
(0.27 |
) |
0.60 |
0.10 |
0.01 |
||||||||||||||
|
Net increase from payment by Advisor |
— |
0.01 |
— |
— |
|||||||||||||||
|
Total income (loss) from investment operations |
(0.11 |
) |
0.81 |
0.32 |
0.04 |
||||||||||||||
|
Less dividends/distributions: |
|||||||||||||||||||
|
From net investment income |
(0.31 |
) |
(0.23 |
) |
(0.26 |
) |
(0.04 |
) |
|||||||||||
|
From net realized gains |
(0.62 |
) |
(0.04 |
) |
(0.04 |
) |
— |
||||||||||||
|
Total dividends/distributions |
(0.93 |
) |
(0.27 |
) |
(0.30 |
) |
(0.04 |
) |
|||||||||||
|
Net asset value, end of year |
$ |
9.52 |
$ |
10.56 |
$ |
10.02 |
$ |
10.00 |
|||||||||||
|
Total investment return2 |
(1.13 |
)% |
8.26 |
%5 |
3.14 |
% |
0.42 |
% |
|||||||||||
|
Ratios to average net assets: |
|||||||||||||||||||
|
Expenses before fee waivers and/or expense reimbursement |
3.17 |
% |
2.39 |
% |
2.52 |
% |
3.81 |
%4 |
|||||||||||
|
Expenses after fee waivers and/or expense reimbursement |
1.70 |
% |
1.70 |
% |
1.70 |
% |
1.70 |
%4 |
|||||||||||
|
Net investment income |
1.58 |
% |
1.91 |
% |
2.09 |
% |
1.82 |
%4 |
|||||||||||
|
Supplemental data: |
|||||||||||||||||||
|
Net assets, end of year (000's) |
$ |
6,429 |
$ |
7,577 |
$ |
8,824 |
$ |
1,164 |
|||||||||||
|
Portfolio turnover rate |
86 |
% |
130 |
% |
116 |
% |
17 |
% |
|||||||||||
3 For the period April 25, 2012 (commencement of operations) through June 30, 2012.
4 Annualized.
5 During the year ended June 30, 2014, the Advisor reimbursed the Fund for a trading error in the amount of $32,823. If payment from Advisor was not made, total return would have been 8.84%, 8.16% and 9.22% for Class A, C and P, respectively.
See accompanying notes to financial statements.
81
The UBS Funds
Notes to financial statements
1. Organization and significant accounting policies
The UBS Funds (the "Trust") is registered with the US Securities and Exchange Commission ("SEC") under the Investment Company Act of 1940 (the "1940 Act"), as amended, as an open-end management investment company currently offering multiple series representing separate investment portfolios. The Trust is a Delaware statutory trust organized on August 13, 1993. The trustees of the Trust have the authority to issue an unlimited number of shares of beneficial interest at a par value of $0.001 per share.
The Trust has 13 Funds available for investment, each having its own investment objectives and policies. The following four funds are covered in this report: UBS Asset Growth Fund, UBS Dynamic Alpha Fund, UBS Global Allocation Fund, and UBS Multi-Asset Income Fund (each a "Fund", and collectively, the "Funds").
Each of the Funds is classified as a "diversified" investment company with the exception of UBS Dynamic Alpha Fund which is classified as "non-diversified" for purposes of the 1940 Act. The Funds currently offer Class A, Class C and Class P shares. Each class represents interests in the same assets of the applicable Fund and the classes are identical except for differences in their sales charge structures, ongoing distribution and service charges and certain transfer agency and related services expenses. All classes of shares have equal voting privileges except that each class has exclusive voting rights with respect to its distribution and/or service plan, if any. Class P shares have no distribution or service plan.
In the normal course of business, the Funds may enter into contracts that contain a variety of representations that provide general indemnification for certain liabilities. The Funds' maximum exposure under these arrangements is unknown, as this would involve future claims that may be made against the Funds that have not yet occurred. However, the Funds have not had any prior claims or losses pursuant to these contracts and expect the risk of loss to be remote.
The Trust accounts separately for the assets, liabilities and operations of each series. Expenses directly attributable to each series are charged to that series' operations; expenses which are applicable to all series are allocated among them on a pro rata basis.
The Financial Accounting Standards Board ("FASB") Accounting Standards Codification ("ASC") is the exclusive reference of authoritative US generally accepted accounting principles ("US GAAP") recognized by the FASB to be applied by nongovernmental entities. Rules and interpretive releases of the SEC under authority of federal laws are also sources of authoritative US GAAP for SEC registrants. The Funds' financial statements are prepared in accordance with US GAAP, which may require the use of management estimates and assumptions. Actual results could differ from those estimates. The following is a summary of significant accounting policies:
A. Valuation of investments: Each Fund calculates its net asset value on days that the New York Stock Exchange ("NYSE") is open. A Fund calculates net asset value separately for each class as of the close of regular trading on the NYSE (generally, 4:00 p.m., Eastern time). If trading on the NYSE is halted for the day before 4:00 p.m., Eastern time, a Fund's net asset value per share will be calculated as of the time trading was halted.
Each Fund calculates its net asset value based on the current market value, where available, for its portfolio securities. The Funds normally obtain market values for their investments from independent pricing sources and broker-dealers. Independent pricing sources may use reported last sale prices, official market closing prices, current market quotations or valuations from computerized "evaluation" systems that derive values based on comparable investments. An evaluation system incorporates parameters such as security quality, maturity and coupon, and/or research and evaluations by its staff, including review of broker-dealer market price quotations, if available, in determining the valuation of the portfolio investments. Investments also may be valued based on appraisals derived from information concerning the investment or similar investments received from recognized dealers in those
82
The UBS Funds
Notes to financial statements
holdings. Investments traded in the over-the-counter ("OTC") market and listed on The NASDAQ Stock Market, Inc. ("NASDAQ") normally are valued at the NASDAQ Official Closing Price. Other OTC securities are valued at the last bid price on the valuation date available prior to valuation. Investments which are listed on US and foreign stock exchanges normally are valued at the market closing price, the last sale price on the day the securities are valued or, lacking any sales on such day, at the last available bid price. Investments listed on foreign stock exchanges may be fair valued based on significant events that have occurred subsequent to the close of the foreign markets. In cases where investments are traded on more than one exchange, the investments are valued on the exchange designated as the primary market by UBS Global Asset Management (Americas) Inc. ("UBS Global AM" or the "Advisor"), the investment advisor of the Funds. UBS Global AM is an indirect asset management subsidiary of UBS Group AG. UBS Group AG is an internationally diversified organization with headquarters in Zurich, Switzerland. UBS Group AG operates in many areas of the financial services industry. If a market value is not readily available from an independent pricing source for a particular investment, that investment is valued at fair value as determined in good faith by or under the direction of the Trust's Board of Trustees (the "Board"). Various factors may be reviewed in order to make a good faith determination of an investment's fair value. These factors include, but are not limited to, fundamental analytical data relating to the investment; the nature and duration of restrictions on disposition of the investment; and the evaluation of forces which influence the market in which the investment is purchased and sold. Foreign currency exchange rates are generally determined as of the close of the NYSE.
Certain investments in which the Funds invest are traded in markets that close before 4:00 p.m., Eastern time. Normally, developments that occur between the close of the foreign markets and 4:00 p.m., Eastern time, will not be reflected in the Fund's net asset value. However, if any of the Funds determine that such developments are so significant that they will materially affect the value of the Fund's investments, the Fund may adjust the previous closing prices to reflect what is believed to be the fair value of these investments as of 4:00 p.m., Eastern time.
Certain Funds may use a systematic fair valuation model provided by an independent third party to value investments principally traded in foreign markets in order to adjust for possible stale pricing that may occur between the close of the foreign exchanges and the time for valuation. The systematic fair valuation model may use calculations based on indices of domestic securities and other appropriate indicators, such as prices of relevant ADRs and futures contracts. If an investment is valued at "fair value," that value is likely to be different from the last quoted market price for the investment. The use of the fair valuation model may result in securities being transferred between Level 1 and Level 2 of the fair valuation hierarchy at the end of the reporting period. Transfers between Level 1 and Level 2, if any, are disclosed near the end of each Fund's Portfolio of investments.
The amortized cost method of valuation, which approximates market value, generally is used to value short-term debt instruments with 60 days or less remaining to maturity, unless the Board determines that this does not represent fair value. Investments in open-end investment companies are valued at the daily closing net asset value of the respective investment company. Pursuant to the Funds' use of the practical expedient within ASC Topic 820, investments in non-registered investment companies are also valued at the daily net asset value. All investments quoted in foreign currencies are valued daily in US dollars on the basis of the foreign currency exchange rates prevailing at the time such valuation is determined by the Funds' custodian.
Futures contracts are generally valued at the settlement price established each day on the exchange on which they are traded. Forward foreign currency contracts are valued daily using forward exchange rates quoted by independent pricing services.
Swaps are marked-to-market daily based upon values from third party vendors or quotations from market makers to the extent available, and the change in value, if any, is recorded as an unrealized gain or loss on the Statement of assets and liabilities. In the event that market quotations are not readily available or deemed unreliable, the swap is valued at fair value as determined in good faith by or under the direction of the Board.
83
The UBS Funds
Notes to financial statements
The Board has delegated to the UBS Global AM Global Valuation Committee ("GVC") the responsibility for making fair value determinations with respect to the Funds' portfolio holdings. The GVC is comprised of representatives of management.
The GVC provides reports to the Board at each quarterly meeting regarding any investments that have been fair valued, valued pursuant to standing instructions approved by the GVC, or where non-vendor pricing sources had been used to make fair value determinations when sufficient information exists during the prior quarter. Fair valuation determinations are subject to review at least monthly by the GVC during scheduled meetings. Pricing decisions, processes, and controls over fair value determinations are subject to internal and external reviews, including annual internal compliance reviews and periodic internal audit reviews.
The types of investments for which such fair value pricing may be necessary include, but are not limited to: foreign investments under some circumstances; investments of an issuer that has entered into a restructuring; investments whose trading has been halted or suspended; fixed income securities that are in default and for which there is no current market value quotation; and investments that are restricted as to transfer or resale. The need to fair value a Fund's portfolio investments may also result from low trading volume in foreign markets or thinly traded domestic investments, and when a security that is subject to a trading limit or collar on the exchange or market on which it is primarily traded reaches the "limit up" or "limit down" price and no trading has taken place at that price. Various factors may be reviewed in order to make a good faith determination of an investment's fair value. These factors include, but are not limited to, fundamental analytical data relating to the investment; the nature and duration of restrictions on disposition of the investment; and the evaluation of forces which influence the market in which the investment is purchased and sold. Valuing investments at fair value involves greater reliance on judgment than valuing investments that have readily available market quotations. Fair value determinations can also involve reliance on quantitative models employed by a fair value pricing service.
US GAAP requires disclosure regarding the various inputs that are used in determining the value of the Funds' investments. These inputs are summarized into the three broad levels listed below:
Level 1—Unadjusted quoted prices in active markets for identical investments.
Level 2—Other significant observable inputs, including but not limited to, quoted prices for similar investments, interest rates, prepayment speeds and credit risk.
Level 3—Unobservable inputs inclusive of the Funds' own assumptions in determining the fair value of investments.
A fair value hierarchy has been included near the end of each Fund's Portfolio of investments.
In June 2014, FASB issued Accounting Standards Update No. 2014-11, Transfers & Servicing (Topic 860): "Repurchase-to-Maturity Transactions, Repurchase Financings, and Disclosures" ("ASU 2014-11") to improve the financial reporting of reverse repurchase agreements and other similar transactions. ASU 2014-11 includes expanded disclosure requirements for entities that enter into reverse repurchase agreements and similar transactions accounted for as secured borrowings. ASU 2014-11 is effective for annual reporting periods beginning after December 15, 2014 and interim periods within those fiscal periods. Management is currently evaluating the implications of these changes and their impact on the financial statements and disclosures.
In May 2015, FASB issued Accounting Standards Update No. 2015-07, Fair Value Measurement (Topic 820): "Disclosures for Investments in Certain Entities That Calculate Net Asset Value per Share (or Its Equivalent)" ("ASU 2015-07"). The modification removes the requirement to categorize within the fair value hierarchy all investments for which fair value is measured using the NAV per share practical expedient. ASU 2015-07 is effective
84
The UBS Funds
Notes to financial statements
for annual reporting periods beginning after December 15, 2015 and interim periods within those fiscal periods. Management is currently evaluating the implications of these changes and their impact on the financial statements and disclosures.
The provisions of ASC Topic 815 "Derivatives and Hedging" ("ASC Topic 815") require qualitative disclosures about objectives and strategies for using derivatives, quantitative disclosures about fair value amounts of gains and losses on derivative instruments and disclosures about credit-risk related contingent features in derivative agreements. Since investment companies value their derivatives at fair value and recognize changes in fair value through the Statement of operations, they do not qualify for hedge accounting under ASC Topic 815. Accordingly, even though a Fund's investments in derivatives may represent economic hedges, they are considered to be non-hedge transactions for purposes of disclosure under ASC Topic 815. ASC Topic 815 requires that (1) objectives for using derivative instruments be disclosed in terms of underlying risk and accounting designation, (2) the fair values of derivative instruments and their gains and losses be disclosed in a tabular format, and (3) information be disclosed about credit-risk contingent features of derivatives contracts. Details of this disclosure can be found below as well as in the Portfolio of investments. Swap agreements, forward foreign currency contracts, swaptions and options written entered into by a Fund may contain credit-risk related contingent features that could be triggered subject to certain circumstances. Such circumstances include agreed upon net asset value thresholds. If triggered, the derivative counterparty could request additional cash margin and/or terminate the derivative contract. The aggregate fair value of the derivative contracts that are in a net liability position that contain these triggers can be found in the Portfolio of investments. The aggregate fair value of assets that are already posted as collateral as of June 30, 2015 is reflected in the Statement of assets and liabilities. If the applicable credit-risk related contingent features were triggered as of June 30, 2015, a Fund would be required to post additional collateral or may be required to terminate the contracts and settle any amounts outstanding. The Funds may be sellers of protection through credit default swap agreements which are by nature credit-risk contingent (the terms of these agreements can be found within the Portfolio of investments, with further discussion in the Notes to financial statements). The volume of derivatives as disclosed in each Fund's Portfolio of investments is representative of the volume of derivatives outstanding during the year ended June 30, 2015, except forward foreign currency contracts for UBS Multi-Asset Income Fund for which average volume during the year was lower than year end.
Disclosure of derivatives by underlying risk as of and for the year ended June 30, 2015 is as follows:
|
Asset derivatives1 |
|||||||||||||||
|
Equity risk |
Foreign exchange risk |
Total |
|||||||||||||
|
UBS Asset Growth Fund |
|||||||||||||||
|
Futures contracts |
$ |
12,878 |
$ |
27,496 |
$ |
40,374 |
|||||||||
|
Liability derivatives2 |
|||||||||||||||
|
Equity risk |
Foreign exchange risk |
Total |
|||||||||||||
|
UBS Asset Growth Fund |
|||||||||||||||
|
Futures contracts |
$ |
(291,947 |
) |
$ |
(15,643 |
) |
$ |
(307,590 |
) |
||||||
1 Futures contracts are reported in the table above using cumulative appreciation of futures contracts as reported in the futures contracts table in the Portfolio of investments, but only the unpaid variation margin is reported within the Statement of assets and liabilities within Variation margin on futures contracts.
2 Futures contracts are reported in the table above using cumulative depreciation of futures contracts as reported in the futures contracts table in the Portfolio of investments, but only the unpaid variation margin is reported within the Statement of assets and liabilities within Variation margin on futures contracts.
85
The UBS Funds
Notes to financial statements
Activities in derivative instruments during the year ended June 30, 2015, were as follows:
|
Interest rate risk |
Equity risk |
Foreign exchange risk |
Total |
||||||||||||||||
|
UBS Asset Growth Fund |
|||||||||||||||||||
|
Net realized gain (loss)1 |
|||||||||||||||||||
|
Futures contracts |
$ |
35,313 |
$ |
1,595,294 |
$ |
(969,978 |
) |
$ |
660,629 |
||||||||||
|
Change in net unrealized appreciation/depreciation2 |
|||||||||||||||||||
|
Futures contracts |
1,693 |
(399,511 |
) |
(57,549 |
) |
(455,367 |
) |
||||||||||||
1 Statement of operations location: Net realized gain (loss) on futures contracts.
2 Statement of operations location: Change in net unrealized appreciation/depreciation on futures contracts.
Asset derivatives1
|
Interest rate risk |
Equity risk |
Credit risk |
Foreign exchange risk |
Total |
|||||||||||||||||||
|
UBS Dynamic Alpha Fund |
|||||||||||||||||||||||
|
Forward foreign currency contracts |
$ |
— |
$ |
— |
$ |
— |
$ |
2,081,309 |
$ |
2,081,309 |
|||||||||||||
|
Futures contracts |
514,857 |
289,475 |
— |
— |
804,332 |
||||||||||||||||||
|
Options purchased |
— |
2,852,700 |
— |
— |
2,852,700 |
||||||||||||||||||
|
Swap agreements |
5,499,919 |
— |
22,784 |
— |
5,522,703 |
||||||||||||||||||
|
Total value |
$ |
6,014,776 |
$ |
3,142,175 |
$ |
22,784 |
$ |
2,081,309 |
$ |
11,261,044 |
|||||||||||||
Liability derivatives2
|
Interest rate risk |
Equity risk |
Credit risk |
Foreign exchange risk |
Total |
|||||||||||||||||||
|
UBS Dynamic Alpha Fund |
|||||||||||||||||||||||
|
Forward foreign currency contracts |
$ |
— |
$ |
— |
$ |
— |
$ |
(1,030,605 |
) |
$ |
(1,030,605 |
) |
|||||||||||
|
Futures contracts |
(343,987 |
) |
(2,046,350 |
) |
— |
— |
(2,390,337 |
) |
|||||||||||||||
|
Options written |
— |
(1,586,225 |
) |
— |
— |
(1,586,225 |
) |
||||||||||||||||
|
Swap agreements |
(5,147,588 |
) |
— |
(142,266 |
) |
— |
(5,289,854 |
) |
|||||||||||||||
|
Total value |
$ |
(5,491,575 |
) |
$ |
(3,632,575 |
) |
$ |
(142,266 |
) |
$ |
(1,030,605 |
) |
$ |
(10,297,021 |
) |
||||||||
1 In the Statement of assets and liabilities, options purchased are shown within Investments of unaffiliated issuers, at value, outstanding swap agreements are shown within outstanding swap agreements, at value, while forward foreign currency contracts are shown within unrealized appreciation on forward foreign currency contracts. Futures contracts are reported in the table above using cumulative appreciation of futures contracts as reported in the futures contracts table in the Portfolio of investments, but only the unpaid variation margin is reported within the Statement of assets and liabilities within Variation margin on futures contracts.
2 In the Statement of assets and liabilities, options written and outstanding swap agreements are shown within options written, at value and outstanding swap agreements, at value, while forward foreign currency contracts are shown within unrealized depreciation on forward foreign currency contracts. Futures contracts are reported in the table above using cumulative depreciation of futures contracts as reported in the futures contracts table in the Portfolio of investments, but only the unpaid variation margin is reported within the Statement of assets and liabilities within Variation margin on futures contracts.
86
The UBS Funds
Notes to financial statements
Activities in derivative instruments during the year ended June 30, 2015, were as follows:
|
Interest rate risk |
Equity risk |
Credit risk |
Foreign exchange risk |
Total |
|||||||||||||||||||
|
UBS Dynamic Alpha Fund |
|||||||||||||||||||||||
|
Net realized gain (loss)1 |
|||||||||||||||||||||||
|
Forward foreign currency contracts |
$ |
— |
$ |
— |
$ |
— |
$ |
18,511,350 |
$ |
18,511,350 |
|||||||||||||
|
Futures contracts |
(1,449,610 |
) |
8,750,425 |
— |
— |
7,300,815 |
|||||||||||||||||
|
Options purchased2 |
(24,925 |
) |
4,799 |
(10,370 |
) |
— |
(30,496 |
) |
|||||||||||||||
|
Options written |
— |
823,563 |
— |
— |
823,563 |
||||||||||||||||||
|
Swap agreements |
127,885 |
— |
(2,038,159 |
) |
— |
(1,910,274 |
) |
||||||||||||||||
|
Total net realized gain (loss) |
$ |
(1,346,650 |
) |
$ |
9,578,787 |
$ |
(2,048,529 |
) |
$ |
18,511,350 |
$ |
24,694,958 |
|||||||||||
|
Change in net unrealized appreciation/depreciation3 |
|||||||||||||||||||||||
|
Forward foreign currency contracts |
$ |
— |
$ |
— |
$ |
— |
$ |
3,824,556 |
$ |
3,824,556 |
|||||||||||||
|
Futures contracts |
(170,845 |
) |
(2,175,661 |
) |
— |
— |
(2,346,506 |
) |
|||||||||||||||
|
Options purchased |
— |
322,126 |
5,956 |
— |
328,082 |
||||||||||||||||||
|
Options written |
— |
(1,216,762 |
) |
— |
— |
(1,216,762 |
) |
||||||||||||||||
|
Swap agreements |
(472,544 |
) |
— |
(384,401 |
) |
— |
(856,945 |
) |
|||||||||||||||
|
Total change in net unrealized appreciation/depreciation |
$ |
(643,389 |
) |
$ |
(3,070,297 |
) |
$ |
(378,445 |
) |
$ |
3,824,556 |
$ |
(267,575 |
) |
|||||||||
1 Statement of operations location: Net realized gain (loss) on futures contracts, options written, swap agreements and forward foreign currency contracts, unless otherwise noted.
2 Statement of operations location: Realized and unrealized gain (loss) is included in net realized gain (loss) on investments in unaffiliated issuers and change in net unrealized appreciation/depreciation on investments.
3 Statement of operations location: Change in net unrealized appreciation/depreciation on futures contracts, options written, swap agreements and forward foreign currency contracts.
Asset derivatives1
|
Interest rate risk |
Equity risk |
Credit risk |
Foreign exchange risk |
Total |
|||||||||||||||||||
|
UBS Global Allocation Fund |
|||||||||||||||||||||||
|
Forward foreign currency contracts |
$ |
— |
$ |
— |
$ |
— |
$ |
1,886,946 |
$ |
1,886,946 |
|||||||||||||
|
Futures contracts |
28,189 |
367,988 |
— |
— |
396,177 |
||||||||||||||||||
|
Options purchased |
— |
2,151,445 |
— |
— |
2,151,445 |
||||||||||||||||||
|
Swap agreements |
— |
— |
1,674,504 |
— |
1,674,504 |
||||||||||||||||||
|
Total value |
$ |
28,189 |
$ |
2,519,433 |
$ |
1,674,504 |
$ |
1,886,946 |
$ |
6,109,072 |
|||||||||||||
87
The UBS Funds
Notes to financial statements
Liability derivatives2
|
Interest rate risk |
Equity risk |
Credit risk |
Foreign exchange risk |
Total |
|||||||||||||||||||
|
UBS Global Allocation Fund |
|||||||||||||||||||||||
|
Forward foreign currency contracts |
$ |
— |
$ |
— |
$ |
— |
$ |
(1,247,431 |
) |
$ |
(1,247,431 |
) |
|||||||||||
|
Futures contracts |
(506,936 |
) |
(3,589,091 |
) |
— |
— |
(4,096,027 |
) |
|||||||||||||||
|
Total value |
$ |
(506,936 |
) |
$ |
(3,589,091 |
) |
$ |
— |
$ |
(1,247,431 |
) |
$ |
(5,343,458 |
) |
|||||||||
1 In the Statement of assets and liabilities, options purchased are shown within Investments of unaffiliated issuers, at value, while forward foreign currency contracts are shown within unrealized appreciation on forward foreign currency contracts. Futures contracts are reported in the table above using cumulative appreciation of futures contracts and centrally cleared swaps are reported at value, as reported in the futures contracts and centrally cleared swaps tables in the Portfolio of investments, but only the unpaid variation margin is reported within the Statement of assets and liabilities within Variation margin on futures contracts and Variation margin on centrally cleared swap agreements.
2 In the Statement of assets and liabilities, forward foreign currency contracts are shown within unrealized depreciation on forward foreign currency contracts. Futures contracts are reported in the table above using cumulative depreciation of futures contracts as reported in the futures contracts table in the Portfolio of investments, but only the unpaid variation margin is reported within the Statement of assets and liabilities within Variation margin on futures contracts.
Activities in derivative instruments during the year ended June 30, 2015, were as follows:
|
Interest rate risk |
Equity risk |
Credit risk |
Foreign exchange risk |
Total |
|||||||||||||||||||
|
UBS Global Allocation Fund |
|||||||||||||||||||||||
|
Net realized gain (loss)1 |
|||||||||||||||||||||||
|
Forward foreign currency contracts |
$ |
— |
$ |
— |
$ |
— |
$ |
10,650,342 |
$ |
10,650,342 |
|||||||||||||
|
Futures contracts |
3,614,207 |
8,564,159 |
— |
— |
12,178,366 |
||||||||||||||||||
|
Options purchased2 |
— |
2,529,503 |
— |
— |
2,529,503 |
||||||||||||||||||
|
Swap agreements |
— |
— |
318,815 |
— |
318,815 |
||||||||||||||||||
|
Total net realized gain |
$ |
3,614,207 |
$ |
11,093,662 |
$ |
318,815 |
$ |
10,650,342 |
$ |
25,677,026 |
|||||||||||||
|
Change in net unrealized appreciation/depreciation3 |
|||||||||||||||||||||||
|
Forward foreign currency contracts |
$ |
— |
$ |
— |
$ |
— |
$ |
3,462,344 |
$ |
3,462,344 |
|||||||||||||
|
Futures contracts |
(1,375,739 |
) |
(4,503,702 |
) |
— |
— |
(5,879,441 |
) |
|||||||||||||||
|
Options purchased2 |
— |
(847,584 |
) |
— |
— |
(847,584 |
) |
||||||||||||||||
|
Swap agreements |
— |
— |
(329,960 |
) |
— |
(329,960 |
) |
||||||||||||||||
|
Total change in net unrealized appreciation/depreciation |
$ |
(1,375,739 |
) |
$ |
(5,351,286 |
) |
$ |
(329,960 |
) |
$ |
3,462,344 |
$ |
(3,594,641 |
) |
|||||||||
1 Statement of operations location: Net realized gain (loss) on futures contracts, options written, swap agreements and forward foreign currency contracts, unless otherwise noted.
2 Realized and unrealized gain (loss) is included in net realized gain (loss) on investments in unaffiliated issuers and change in net unrealized appreciation/depreciation on investments.
3 Statement of operations location: Change in net unrealized appreciation/depreciation on futures contracts, options written, swap agreements and forward foreign currency contracts.
Asset derivatives1
|
Interest rate risk |
Equity risk |
Foreign exchange risk |
Total |
||||||||||||||||
|
UBS Multi-Asset Income Fund |
|||||||||||||||||||
|
Forward foreign currency contracts |
$ |
— |
$ |
— |
$ |
27,535 |
$ |
27,535 |
|||||||||||
|
Futures contracts |
659 |
18,853 |
— |
19,512 |
|||||||||||||||
|
Total value |
$ |
659 |
$ |
18,853 |
$ |
27,535 |
$ |
47,047 |
|||||||||||
88
The UBS Funds
Notes to financial statements
Liability derivatives2
|
Equity risk |
Foreign exchange risk |
Total |
|||||||||||||
|
UBS Multi-Asset Income Fund |
|||||||||||||||
|
Forward foreign currency contracts |
$ |
— |
$ |
(1,257 |
) |
$ |
(1,257 |
) |
|||||||
|
Futures contracts |
(26,949 |
) |
— |
(26,949 |
) |
||||||||||
|
Total value |
$ |
(26,949 |
) |
$ |
(1,257 |
) |
$ |
(28,206 |
) |
||||||
1 In the Statement of assets and liabilities, forward foreign currency contracts are shown within unrealized appreciation on forward foreign currency contracts. Futures contracts are reported in the table above using cumulative appreciation of futures contracts as reported in the futures contracts table in the Portfolio of investments, but only the unpaid variation margin is reported within the Statement of assets and liabilities within Variation margin on futures contracts.
2 In the Statement of assets and liabilities, forward foreign currency contracts are shown within unrealized depreciation on forward foreign currency contracts. Futures contracts are reported in the table above using cumulative depreciation of futures contracts as reported in the futures contracts table in the Portfolio of investments, but only the unpaid variation margin is reported within the Statement of assets and liabilities within Variation margin on futures contracts.
Activities in derivative instruments during the year ended June 30, 2015, were as follows:
|
Interest rate risk |
Equity risk |
Foreign exchange risk |
Total |
||||||||||||||||
|
UBS Multi-Asset Income Fund |
|||||||||||||||||||
|
Net realized gain (loss)1 |
|||||||||||||||||||
|
Forward foreign currency contracts |
$ |
— |
$ |
— |
$ |
506,291 |
$ |
506,291 |
|||||||||||
|
Futures contracts |
(155,138 |
) |
15,669 |
— |
(139,469 |
) |
|||||||||||||
|
Total net realized gain (loss) |
$ |
(155,138 |
) |
$ |
15,669 |
$ |
506,291 |
$ |
366,822 |
||||||||||
|
Change in net unrealized appreciation/depreciation2 |
|||||||||||||||||||
|
Forward foreign currency contracts |
$ |
— |
$ |
— |
$ |
68,023 |
$ |
68,023 |
|||||||||||
|
Futures contracts |
9,634 |
(7,801 |
) |
— |
1,833 |
||||||||||||||
|
Total change in net unrealized appreciation/depreciation |
$ |
9,634 |
$ |
(7,801 |
) |
$ |
68,023 |
$ |
69,856 |
||||||||||
1 Statement of operations location: Net realized gain (loss) on futures contracts and forward foreign currency contracts unless otherwise noted.
2 Statement of operations location: Change in net unrealized appreciation/depreciation on futures contracts and forward foreign currency contracts.
The Funds typically enter into International Swaps and Derivatives Association, Inc. Master Agreements ("ISDA Master Agreements") or similar master agreements (collectively, "Master Agreements") with its OTC derivative contract counterparties in order to, among other things, reduce its credit risk to counterparties. ISDA Master Agreements include provisions for general obligations, representations, collateral and events of default or termination. Under an ISDA Master Agreement, the Funds typically may offset with the counterparty certain derivative financial instrument's payables and/or receivables with collateral held and/or posted and create one single net payment (close-out netting) in the event of default or termination.
89
The UBS Funds
Notes to financial statements
The provisions of ASC Topic 210 "Disclosures about Offsetting Assets and Liabilities" require disclosure on the offsetting of financial assets and liabilities. The offsetting disclosures are limited to derivatives, repurchase and reverse repurchase agreements, and security lending and borrowing transactions to the extent that they are (1) offset in the financial statements or (2) subject to an enforceable master netting arrangement ("MNA") or similar agreement. Tables are not presented below for any funds which only hold derivatives which are not subject to offsetting under ASC Topic 210.
UBS Dynamic Alpha Fund
|
Derivative financial instruments: |
Assets ($) |
Liabilities ($) |
|||||||||
|
Forward foreign currency contracts |
2,081,309 |
(1,030,605 |
) |
||||||||
|
Futures contracts1 |
804,332 |
(2,390,337 |
) |
||||||||
|
Options purchased |
2,852,700 |
— |
|||||||||
|
Options written |
— |
(1,586,225 |
) |
||||||||
|
Swap agreements |
5,522,703 |
(5,289,854 |
) |
||||||||
|
Total gross amount of derivative assets and liabilities in the Statement of assets and liabilities |
11,261,044 |
(10,297,021 |
) |
||||||||
|
Derivatives not subject to a master netting agreement or similar agreement ("MNA") |
(3,657,032 |
) |
3,976,562 |
||||||||
|
Total gross amount of assets and liabilities subject to MNA or similar agreements |
7,604,012 |
(6,320,459 |
) |
||||||||
1 Includes cumulative appreciation/depreciation of futures contracts as reported in the futures contracts table in the Portfolio of investments, but only the unpaid variation margin is reported within the Statement of assets and liabilities within Variation margin on futures contracts.
The following tables present the Fund's derivative assets and liabilities by counterparty net of amounts available for offset under a MNA and net of the related collateral received/pledged by the Fund as of June 30, 2015.
|
Counterparty |
Gross amount of assets ($) |
Financial instruments and derivatives available for offset ($) |
Collateral received ($)* |
Net amount of assets ($) |
|||||||||||||||
|
CIBC |
741,929 |
(741,929 |
) |
— |
— |
||||||||||||||
|
CITI |
2,077 |
(2,077 |
) |
— |
— |
||||||||||||||
|
GSI |
5,499,919 |
(21,072 |
) |
— |
5,478,847 |
||||||||||||||
|
JPMCB |
22,804 |
(22,804 |
) |
— |
— |
||||||||||||||
|
SSB |
1,337,283 |
(69,074 |
) |
— |
1,268,209 |
||||||||||||||
|
Total |
7,604,012 |
(856,956 |
) |
— |
6,747,056 |
||||||||||||||
|
Counterparty |
Gross amount of liabilities ($) |
Financial instruments and derivatives available for offset ($) |
Collateral pledged ($)* |
Net amount of liabilities ($) |
|||||||||||||||
|
BB |
(1,848 |
) |
— |
— |
(1,848 |
) |
|||||||||||||
|
CIBC |
(768,914 |
) |
741,929 |
— |
(26,985 |
) |
|||||||||||||
|
CITI |
(9,994 |
) |
2,077 |
— |
(7,917 |
) |
|||||||||||||
|
DB |
(5,147,588 |
) |
— |
5,147,588 |
— |
||||||||||||||
|
GSI |
(21,072 |
) |
21,072 |
— |
— |
||||||||||||||
|
JPMCB |
(189,585 |
) |
22,804 |
— |
(166,781 |
) |
|||||||||||||
|
MSCI |
(112,384 |
) |
— |
— |
(112,384 |
) |
|||||||||||||
|
SSB |
(69,074 |
) |
69,074 |
— |
— |
||||||||||||||
|
Total |
(6,320,459 |
) |
856,956 |
5,147,588 |
(315,915 |
) |
|||||||||||||
* In some instances, the actual collateral received and/or pledged may be more than the amount shown and may be comprised of cash collateral, non-cash collateral or a combination of both.
90
The UBS Funds
Notes to financial statements
UBS Global Allocation Fund
|
Derivative financial instruments: |
Assets ($) |
Liabilities ($) |
|||||||||
|
Forward foreign currency contracts |
1,886,946 |
(1,247,431 |
) |
||||||||
|
Futures contracts1 |
396,177 |
(4,096,027 |
) |
||||||||
|
Options purchased |
2,151,445 |
— |
|||||||||
|
Swap agreements1 |
1,674,504 |
— |
|||||||||
|
Total gross amount of derivative assets and liabilities in the Statement of assets and liabilities |
6,109,072 |
(5,343,458 |
) |
||||||||
|
Derivatives not subject to a master netting agreement or similar agreement ("MNA") |
(4,222,126 |
) |
4,096,027 |
||||||||
|
Total gross amount of assets and liabilities subject to MNA or similar agreements |
1,886,946 |
(1,247,431 |
) |
||||||||
1 Includes cumulative appreciation/depreciation of futures contracts and centrally cleared swaps as reported in the futures contracts and centrally cleared swaps tables in the Portfolio of investments, but only the unpaid variation margin is reported within the Statement of assets and liabilities within Variation margin on futures contracts and centrally cleared swap agreements, respectively.
The following tables present the Fund's derivative assets and liabilities by counterparty net of amounts available for offset under a MNA and net of the related collateral received/pledged by the Fund as of June 30, 2015.
|
Counterparty |
Gross amount of assets ($) |
Financial instruments and derivatives available for offset ($) |
Collateral received ($) |
Net amount of assets ($) |
|||||||||||||||
|
DB |
112,059 |
(112,059 |
) |
— |
— |
||||||||||||||
|
GSI |
43,745 |
— |
— |
43,745 |
|||||||||||||||
|
HSBC |
260,902 |
(260,902 |
) |
— |
— |
||||||||||||||
|
JPMCB |
47,723 |
(47,723 |
) |
— |
— |
||||||||||||||
|
MSCI |
278,219 |
(140,368 |
) |
— |
137,851 |
||||||||||||||
|
SSB |
1,144,298 |
(240,969 |
) |
— |
903,329 |
||||||||||||||
|
Total |
1,886,946 |
(802,021 |
) |
— |
1,084,925 |
||||||||||||||
|
Counterparty |
Gross amount of liabilities ($) |
Financial instruments and derivatives available for offset ($) |
Collateral pledged ($) |
Net amount of liabilities ($) |
|||||||||||||||
|
CIBC |
(45,850 |
) |
— |
— |
(45,850 |
) |
|||||||||||||
|
DB |
(263,504 |
) |
112,059 |
— |
(151,445 |
) |
|||||||||||||
|
HSBC |
(446,319 |
) |
260,902 |
— |
(185,417 |
) |
|||||||||||||
|
JPMCB |
(110,421 |
) |
47,723 |
— |
(62,698 |
) |
|||||||||||||
|
MSCI |
(140,368 |
) |
140,368 |
— |
— |
||||||||||||||
|
SSB |
(240,969 |
) |
240,969 |
— |
— |
||||||||||||||
|
Total |
(1,247,431 |
) |
802,021 |
— |
(445,410 |
) |
|||||||||||||
UBS Multi-Asset Income Fund
|
Derivative financial instruments: |
Assets ($) |
Liabilities ($) |
|||||||||
|
Forward foreign currency contracts |
27,535 |
(1,257 |
) |
||||||||
|
Futures contracts1 |
19,512 |
(26,949 |
) |
||||||||
|
Total gross amount of derivative assets and liabilities in the Statement of assets and liabilities |
47,047 |
(28,206 |
) |
||||||||
|
Derivatives not subject to a master netting agreement or similar agreement ("MNA") |
(19,512 |
) |
26,949 |
||||||||
|
Total gross amount of assets and liabilities subject to MNA or similar agreements |
27,535 |
(1,257 |
) |
||||||||
1 Includes cumulative appreciation/depreciation of futures contracts as reported in the futures contracts table in the Portfolio of investments, but only the unpaid variation margin is reported within the Statement of assets and liabilities within Variation margin on futures contracts.
91
The UBS Funds
Notes to financial statements
The following tables present the Fund's derivative assets and liabilities by counterparty net of amounts available for offset under a MNA and net of the related collateral received/pledged by the Fund as of June 30, 2015.
|
Counterparty |
Gross amount of assets ($) |
Financial instruments and derivatives available for offset ($) |
Collateral received ($) |
Net amount of assets ($) |
|||||||||||||||
|
JPMCB |
27,535 |
(1,257 |
) |
— |
26,278 |
||||||||||||||
|
Counterparty |
Gross amount of liabilities ($) |
Financial instruments and derivatives available for offset ($) |
Collateral pledged ($) |
Net amount of liabilities ($) |
|||||||||||||||
|
JPMCB |
(1,257 |
) |
1,257 |
— |
— |
||||||||||||||
B. Restricted securities: The Funds may invest in securities that are subject to legal or contractual restrictions on resale. These securities generally may be resold in transactions exempt from registration or to the public if the securities are registered. Disposal of these securities may involve time consuming negotiations and expenses, and prompt sale at an acceptable price may be difficult. Information regarding restricted securities, if any, is included in each Fund's Portfolio of investments footnotes.
C. Investment transactions, investment income and expenses: Investment transactions are recorded on the trade date. Realized gains and losses from investment and foreign exchange transactions are calculated using the identified cost method. Dividend income and expenses are recorded on the ex-dividend date ("ex-date") except in the case of certain dividends from foreign securities which are recorded as soon after the ex-date as the respective Fund, using reasonable diligence, becomes aware of such dividends. Interest income is recorded on an accrual basis. Discounts are accreted and premiums are amortized as adjustments to interest income and the identified cost of investments.
Income, expenses (excluding class-specific expenses) and realized/unrealized gains/losses are allocated proportionately to each class of shares based upon the relative net asset value of outstanding shares (or the value of dividend eligible shares, as appropriate) of each class at the beginning of the day after adjusting for current capital share activity of the respective classes. Class specific expenses are charged directly to the applicable class of shares.
D. Foreign currency translation: The Funds use the foreign currency exchange rates determined as of the close of regular trading on the NYSE. For purposes of calculating the US dollar equivalent value of a non US dollar denominated obligation, foreign currency amounts are translated into US dollars on the following basis: (1) market value of investment securities and other assets and liabilities—at the exchange rates prevailing at the end of each Fund's fiscal period; and (2) purchases and sales of investment securities and income and expenses—at the rates of exchange prevailing on the respective dates of such transactions.
Although the net assets and the market value of each Fund's portfolio are presented at the foreign exchange rates at the end of each Fund's fiscal period, the Funds do not generally isolate the effect of fluctuations in foreign exchange rates from the effect of the changes in market prices of securities. However, the Funds do isolate the effect of fluctuations in foreign exchange rates when determining the realized gain or loss upon the sale or maturity of foreign currency-denominated securities pursuant to US federal income tax regulations. Certain foreign exchange gains and losses included in realized and unrealized gains and losses are included in or are a reduction of ordinary income in accordance with US federal income tax regulations.
E. Forward foreign currency contracts: A forward foreign currency contract is a commitment to purchase or sell a foreign currency at a future date at a negotiated forward rate. Risks associated with such contracts include move-
92
The UBS Funds
Notes to financial statements
ment in the value of the foreign currency relative to the US dollar and the potential inability of the counterparty to meet the terms of the contract. The Funds may purchase or sell currencies and/or engage in forward foreign currency transactions in order to expedite settlement of portfolio transactions, manage currency risk or to gain exposure to a currency without purchasing securities denominated in that currency. Forward foreign currency contracts involve, to varying degrees, elements of market risk (specifically foreign currency risk).
A Fund will enter into forward contracts to sell, for a fixed amount of US dollars or other appropriate currency, an amount of foreign currency, to the extent that the value of the short forward contract is covered by the underlying value of securities denominated in the currency being sold. Alternatively, when a Fund enters into a non-cash settled forward contract to sell an amount of foreign currency, the Fund's custodian or sub-custodian will place assets in a segregated account of the Fund in an amount equal to the contract's full notional value. However, currency contracts with respect to identical currencies may be netted against each other and, in such cases, a Fund's custodian or sub-custodian will place assets in a segregated account of the Fund, in an amount equal to the net amount owed (the unrealized loss) by a Fund. If the assets placed in the account decline in value, additional cash or securities will be placed in the account on a daily basis so that the value of the account will equal the amount of a Fund's commitments with respect to such contracts.
The unrealized gain, if any, represents the credit risk to each Fund on a forward foreign currency contract. Fluctuations in the value of the open forward foreign currency contracts are recorded daily for book purposes unrealized gains or losses on foreign forward currency contracts by the Funds. Realized gains and losses include net gains and losses recognized by each Fund on contracts which have been sold or matured.
F. Futures contracts: Each Fund may purchase or sell financial futures contracts. The Funds may purchase or sell futures contracts to increase or reduce their exposure to an asset class without purchasing or selling the underlying securities, either as a hedge or to enhance income or realize gains. Using financial futures contracts involves various market risks, including interest rate and equity risk. Risks of entering into futures contracts include the possibility that there may be an illiquid market or that a change in the value of the contract may not correlate with changes in the value of the underlying securities. To the extent that market prices move in an unexpected direction, there is a risk that a Fund will not achieve the anticipated benefits of the futures contract or may realize a loss.
Upon entering into a futures contract, a Fund is required to deliver to a broker an amount of cash and/or securities equal to a certain percentage of the contract amount. This amount is known as the "initial margin". Subsequent payments, known as "variation margin", are made or received by a Fund each day, depending on the daily fluctuations in the value of the underlying futures contracts. Such variation margin is recorded for financial statement purposes on a daily basis as an unrealized gain or loss on futures until the futures contract is closed or expires, at which time the net gain or loss is reclassified to realized gain or loss on futures.
G. Securities traded on to-be-announced basis: Certain Funds may from time to time purchase, or sell short, securities on a to-be-announced ("TBA") basis. In a TBA transaction, a Fund commits to purchasing or selling securities for which all specific information is not yet known at the time of the trade, particularly the face amount and maturity date of the underlying security transactions. Securities purchased on a TBA basis are not settled until they are delivered to a Fund, normally 15 to 45 days later. Beginning on the date a Fund enters into a TBA transaction, cash, US government securities or other liquid high grade debt obligations are segregated in the Fund's records in an amount equal in value to the purchase price of the TBA security. These transactions are subject to market fluctuations and their current value is determined in the same manner as for other securities.
H. Swap agreements: Certain Funds may engage in swap agreements, including but not limited to interest rate, currency, total return, and credit default swap agreements. The Funds expect to enter into these transactions to preserve a return or spread on a particular investment or to hedge a portion of the portfolio's duration, to protect
93
The UBS Funds
Notes to financial statements
against any increase in the price of securities a Fund anticipates purchasing at a later date, to gain exposure to certain markets in the most economical way possible or in an attempt to enhance income or gains.
Certain Funds may enter into interest rate swap agreements with another party to receive or pay interest (e.g., an exchange of fixed rate payments for floating rate payments) to protect itself from interest rate fluctuations. This type of swap is an agreement that obligates two parties to exchange a series of cash flows at specified intervals based upon or calculated by reference to a specified interest rate(s) for a specified amount. The payment flows are usually netted against each other, with the difference being paid by one party to the other. Interest rate swap agreements are subject to general market risk, liquidity risk, counterparty risk and interest rate risk.
Certain Funds may enter into currency swap agreements with another party to receive or pay amounts based on changes in currency exchange rates in order to protect itself from or take advantage of exchange rate fluctuations. The Funds utilize currency swaps to earn income and enhance returns as well as to manage the risk profile of the Funds. This type of swap is an agreement that obligates two parties to exchange a series of cash flows at specified intervals based upon or calculated by reference to a specified currency exchange rate(s) for a specified amount. Currency swap agreements are subject to general market risk, liquidity risk, counterparty risk, foreign exchange risk and interest rate risk.
Credit default swap agreements involve commitments to make or receive payments in the event of a default or other credit event of a referenced security. As a buyer, a Fund would make periodic payments to the counterparty, and a Fund would receive payments only upon the occurrence of a credit event. If no credit event occurs, a Fund will lose its periodic stream of payments over the term of the contract. However, if a credit event does occur, a Fund typically would receive full notional value for a reference obligation that may have little or no value. As a seller, a Fund would receive periodic payments from the counterparty, and a Fund would make payments only upon the occurrence of a credit event. If no credit event occurs, a Fund will retain the periodic stream of payments it received over the term of the contract. However, if a credit event occurs, a Fund will pay full notional value for a reference obligation that may have little or no value. Credit default swaps may involve greater risks than if a Fund had invested in the reference obligation directly and are subject to general market risk, liquidity risk, counterparty risk and credit risk.
Credit default swap agreements on corporate issues or sovereign issues of an emerging market country involve one party making a stream of payments to another party in exchange for the right to receive a specified return in the event of a default or other credit event. If a credit event occurs and cash settlement is not elected, a variety of other obligations may be delivered in lieu of the specific referenced obligation. The ability to deliver other obligations may result in delivery of a security with a value other than had been anticipated (such as a party's right to choose the deliverable obligation with the lowest value following a credit event). A Fund may use credit default swaps on corporate issues or sovereign issues of an emerging market country to provide a measure of protection against defaults of the issuers (i.e., to reduce risk where a Fund owns or has exposure to the referenced obligation) or to take an active long or short position with respect to the likelihood of a particular issuer's default.
The maximum potential amount of future payments (undiscounted) that a Fund as a seller of protection could be required to make under a credit default swap agreement would be an amount equal to the notional amount of the agreement. Notional amounts of all credit default swap agreements outstanding as of June 30, 2015 for which a Fund is the seller of protection are disclosed under the section "Credit default swaps on corporate issues—buy protection" and "Credit default swaps on corporate issues—sell protection" in the Notes to Portfolio of investments. These potential amounts would be partially offset by any recovery values of the respective referenced obligations, upfront payments received upon entering into the agreement, or net amounts received from the settlement of buy protection credit default swap agreements entered into, if any, by a Fund for the same referenced entity or entities.
94
The UBS Funds
Notes to financial statements
Certain clearinghouses currently offer clearing for limited types of derivatives transactions, such as interest and credit derivatives. In a cleared derivative transaction, a Fund typically enters into the transaction with a financial institution counterparty, and performance of the transaction is effectively guaranteed by a central clearinghouse, thereby reducing or eliminating the Fund's exposure to the credit risk of its original counterparty. The Fund will be required to post specified levels of margin with the clearinghouse or at the instruction of the clearinghouse; the margin required by a clearinghouse may be greater than the margin the Fund would be required to post in an uncleared transaction. Only a limited number of transactions are currently eligible for clearing. Centrally cleared swaps, if any, are reported on the Statement of assets and liabilities based on variation margin receivable or payable, if any.
The use of swap agreements involves investment techniques and risks different from those associated with ordinary portfolio security transactions. If UBS Global AM is incorrect in its forecast of market values, interest rates and other applicable factors, the investment performance of a Fund will be less favorable than it would have been if this investment technique was never used. Swap agreements do not involve the delivery of securities and are subject to counterparty risk. If the other party to a swap agreement defaults and fails to consummate the transaction, a Fund's risk of loss will consist of the net amount of interest or other payments that the Fund is contractually entitled to receive. Therefore, a Fund would consider the creditworthiness of the counterparty to a swap agreement in evaluating potential credit risk.
A Fund accrues for interim payments on swap agreements on a daily basis, with the net amount recorded within unrealized appreciation/depreciation of swap agreements on the Statement of assets and liabilities. Once interim payments are settled in cash, the net amount is recorded as realized gain/loss on swap agreements, in addition to realized gain/loss recorded upon the termination of swap agreements in the Statement of operations. Fluctuations in the value of swap agreements are recorded for financial statement purposes as unrealized appreciation or depreciation on swap agreements.
I. Option writing: Certain Funds may write (sell) put and call options on foreign or US securities, indices, foreign currencies and interest rate swaps (commonly referred to as swaptions), in order to gain exposure to or protect against changes in the markets or in an attempt to enhance income or gains. When a Fund writes a call or a put option, an amount equal to the premium received by the Fund is included in the Fund's Statement of assets and liabilities as an asset and as an equivalent liability. The amount of the liability is subsequently marked-to-market to reflect the current market value of the option written. If an option which the Fund has written either expires on its stipulated expiration date or the Fund enters into a closing purchase transaction, the Fund realizes a gain (or a loss if the cost of a closing purchase transaction exceeds the premium received when the option was written) without regard to any unrealized gain or loss on the underlying security or derivative instrument, and the liability related to such option is extinguished. If a call option which the Fund has written is exercised, the Fund recognizes a realized gain or loss (long-term or short-term, depending on the holding period of the underlying security) from the sale of the underlying security or derivative instrument and the proceeds from the sale are increased by the premium originally received. If a put option which a Fund has written is exercised, the amount of the premium originally received reduces the cost of the security or derivative instrument which the Fund purchases upon exercise of the option.
In writing an option, the Fund bears the market risk of an unfavorable change in the price of the derivative instrument, security, index or currency underlying the written option. Exercise of an option written by the Fund could result in the Fund selling or buying a derivative instrument, security or currency at a price different from current market value.
In the normal course of trading activities, the Funds trade and hold certain fair valued derivative contracts that constitute guarantees. Such contracts include written put options, where a Fund would be obligated to purchase securities at specified prices (i.e. the options are exercised by the counterparties). The maximum payout for these
95
The UBS Funds
Notes to financial statements
contracts is limited to the number of put option contracts written and the related strike prices, respectively. The maximum payout for UBS Dynamic Alpha Fund's written put options is $57,615,426 at June 30, 2015.
J. Purchased options: Certain Funds may purchase put and call options on foreign or US securities, indices, foreign currencies and interest rate swaps (commonly referred to as swaptions), as well as exchange listed call options on particular market segment indices to achieve temporary exposure to a specific security, currency, industry or geographic region. Purchasing call options tends to increase exposure to the underlying instrument. Purchasing put options tends to decrease exposure to the underlying instrument. The Fund pays a premium which is included in the Statement of assets and liabilities as an investment and subsequently marked-to-market to reflect the current value of the option. Premiums paid for purchasing options which expire are treated as realized losses. The risk associated with purchasing put and call options is limited to the premium paid. Premiums paid for purchasing options which are exercised or closed are added to the amounts paid or offset against the proceeds on the underlying futures, security or currency transaction to determine the realized gain or loss.
K. Short sales: UBS Dynamic Alpha Fund may enter into short sales whereby it sells a security it generally does not own, in anticipation of a decline in the security's price. The initial amount of a short sale is recorded as a liability which is marked-to-market daily. Fluctuations in the value of this liability are recorded as unrealized gains or losses on the Statement of operations. If the Fund shorts a security while holding a long position in the security (a "short against the box"), as the security price declines, the short position increases in value, offsetting the long position's decrease in value. The opposite effect occurs if the security price rises. The Fund will realize a gain or loss upon closing of the short sale (returning the security to the lender by way of purchase or delivery of a long position owned). The Fund is liable to the lender for any dividends payable on securities while those securities are in a short position. These dividends are booked as an expense or liability of the Fund. The Fund segregates collateral consisting of cash, US government securities or other liquid assets sufficient to collateralize the market value of short positions. The Fund is charged a securities loan fee in connection with short sale transactions.
L. Dividends and distributions: It is each Fund's (except UBS Multi-Asset Income Fund) policy to distribute its respective net investment income and net capital gains, if any, annually. Income dividends are normally declared and paid by UBS Multi-Asset Income Fund monthly and net realized capital gains, if any, are declared and distributed at least semi-annually, usually in September and December. Dividends and distributions to shareholders are recorded on the ex-distribution date. The amount of dividends from net investment income and distributions from net realized capital gains and/or return of capital is determined in accordance with US federal income tax regulations, which may differ from US GAAP. These "book/tax" differences are either considered temporary or permanent in nature. To the extent these differences are permanent in nature, such amounts are reclassified within the capital accounts based on their federal tax basis treatment; temporary differences do not require reclassification.
M. Concentration of risk: Investing in securities of foreign issuers and currency transactions may involve certain considerations and risks not typically associated with investments in the United States. These risks include revaluation of currencies, adverse fluctuations in foreign currency values and possible adverse political, social and economic developments, including those particular to a specific industry, country or region, which could cause the securities and their markets to be less liquid and prices more volatile than those of comparable US companies and US government securities. These risks are greater with respect to securities of issuers located in emerging market countries in which the Funds invest. The ability of the issuers of debt securities held by a Fund to meet their obligations may be affected by economic and political developments particular to a specific industry, country, state or region.
N. Commission recapture program: The Funds participate in a brokerage commission recapture program. The Funds have established commission recapture arrangements with certain participating brokers or dealers. If a Fund's investment manager chooses to execute a transaction through a participating broker subject to best price
96
The UBS Funds
Notes to financial statements
and execution, the broker will rebate a portion of the commission back to the Fund. Any collateral benefit received through participation in the commission recapture program is directed exclusively to a Fund. For the year ended June 30, 2015, the following Fund recorded recaptured commissions which are reflected in the Statement of operations within the net realized gains (losses) on investments in unaffiliated issuers:
|
Fund |
Amount |
||||||
|
UBS Global Allocation Fund |
$ |
2,874 |
|||||
O. Redemption fees: Each class of each series of The UBS Funds will impose a 1% redemption fee on shares sold or exchanged within 90 days of their purchase date, subject to limited exceptions. This amount is paid to the applicable Fund, not the Advisor or UBS Global Asset Management (US) Inc., ("UBS Global AM (US)"). The redemption fees retained by the Funds are disclosed in the Statement of changes in net assets. For the year ended June 30, 2015, redemption fees for each Fund amounted to less than $0.01 per share and less than 0.01% of average net assets.
Effective February 17, 2015, for purchases of shares on or after that date, the redemption fee will be calculated as a percentage of the amount redeemed within 30 days of purchase, if applicable. Effective August 3, 2015, for purchases of shares on or after that date, the redemption fee will be eliminated.
2. Investment advisory fees and other transactions with affiliates
The Advisor, a registered investment advisor, provides the Funds with investment management services. As compensation for these services, each Fund pays the Advisor a monthly fee, accrued daily and paid monthly, based on each Fund's respective average daily net assets in accordance with the following per annum schedule:
|
Fund |
$0 to $500 mm |
$500 mm to $1.0 billion |
$1.0 billion to $1.5 billion |
$1.5 billion to $2.0 billion |
$2.0 billion to $3.0 billion |
$3.0 billion to $6.0 billion |
$6.0 billion and over |
||||||||||||||||||||||||
|
UBS Asset Growth Fund |
0.950 |
% |
0.950 |
% |
0.950 |
% |
0.950 |
% |
0.950 |
% |
0.950 |
% |
0.950 |
% |
|||||||||||||||||
|
UBS Global Allocation Fund |
0.800 |
0.750 |
0.700 |
0.675 |
0.650 |
0.630 |
0.610 |
||||||||||||||||||||||||
|
$0 to $500 mm |
$500 mm to $1.0 billion |
$1.0 billion to $1.5 billion |
$1.5 billion to $2.0 billion |
$2.0 billion to $4.0 billion |
$4.0 billion and over |
||||||||||||||||||||||
|
UBS Dynamic Alpha Fund |
0.850 |
% |
0.800 |
% |
0.750 |
% |
0.725 |
% |
0.700 |
% |
0.680 |
% |
|||||||||||||||
|
UBS Multi-Asset Income Fund |
0.590 |
0.590 |
0.590 |
0.590 |
0.590 |
0.590 |
|||||||||||||||||||||
For UBS Global Allocation Fund, the Advisor has agreed to waive its fees and/or reimburse expenses (excluding expenses incurred through investment in other investment companies, interest, taxes, brokerage commissions and extraordinary expenses) to the extent necessary so that the Fund's operating expenses (excluding expenses incurred through investment in other investment companies, interest, taxes, brokerage commissions and extraordinary expenses) do not exceed the expense limit of each class of shares as indicated in the following table. For UBS Dynamic Alpha Fund, UBS Asset Growth Fund, and UBS Multi-Asset Income Fund the Advisor has agreed to waive its fees and/or reimburse expenses (excluding expenses incurred through investment in other investment companies, interest, taxes, brokerage commissions, extraordinary expenses and dividend expense and security loan fees for securities sold short) to the extent necessary so that the Funds' operating expenses (excluding expenses incurred through investment in other investment companies, interest, taxes, brokerage commissions, extraordinary expenses and dividend expense and security loan fees for securities sold short) do not exceed the expense limit of each class of shares as indicated in the following table. Investment advisory fees, including the dollar amount waived or reimbursed, for the year ended June 30, 2015 were as follows:
97
The UBS Funds
Notes to financial statements
|
Fund |
Class A expense cap |
Class C expense cap |
Class P expense cap |
Amount due to or (due from) Advisor |
Advisory fees incurred |
Fees waived/ expenses reimbursed |
|||||||||||||||||||||
|
UBS Asset Growth Fund |
1.40 |
% |
2.15 |
% |
1.15 |
% |
$ |
(7,958 |
) |
$ |
264,820 |
$ |
249,464 |
||||||||||||||
|
UBS Dynamic Alpha Fund |
1.35 |
2.10 |
1.10 |
159,418 |
2,751,653 |
287,501 |
|||||||||||||||||||||
|
UBS Global Allocation Fund |
1.35 |
2.10 |
1.10 |
302,650 |
4,385,981 |
— |
|||||||||||||||||||||
|
UBS Multi-Asset Income Fund |
0.95 |
1.70 |
0.70 |
(41,502 |
) |
122,636 |
306,977 |
||||||||||||||||||||
Each Fund will reimburse the Advisor for expenses it waives or reimburses for a period of three years following such expense waivers or reimbursements, provided that the reimbursement by a Fund of the Advisor will not cause the total operating expense ratio to exceed the contractual limit as then may be in effect for the Fund. The expenses waived or reimbursed for the year ended June 30, 2015 are subject to repayment through June 30, 2018. At June 30, 2015, the following Funds had remaining fee waivers and expense reimbursements subject to repayment to the Advisor and respective dates of expiration as follows:
|
Fund |
Fee waivers/ expense reimbursements subject to repayment |
Expires June 30, 2016 |
Expires June 30, 2017 |
Expires June 30, 2018 |
|||||||||||||||
|
UBS Asset Growth Fund—Class A |
$ |
466,699 |
$ |
142,026 |
$ |
185,685 |
$ |
138,988 |
|||||||||||
|
UBS Asset Growth Fund—Class C |
175,795 |
49,000 |
63,371 |
63,424 |
|||||||||||||||
|
UBS Asset Growth Fund—Class P |
69,612 |
8,723 |
13,837 |
47,052 |
|||||||||||||||
|
UBS Dynamic Alpha Fund—Class A |
364,113 |
137,169 |
148,450 |
78,494 |
|||||||||||||||
|
UBS Dynamic Alpha Fund—Class C |
127,691 |
43,675 |
40,482 |
43,534 |
|||||||||||||||
|
UBS Dynamic Alpha Fund—Class P |
203,220 |
9,404 |
28,343 |
165,473 |
|||||||||||||||
|
UBS Multi-Asset Income Fund—Class A |
322,595 |
127,379 |
132,279 |
62,937 |
|||||||||||||||
|
UBS Multi-Asset Income Fund—Class C |
209,740 |
47,130 |
59,142 |
103,468 |
|||||||||||||||
|
UBS Multi-Asset Income Fund—Class P |
446,603 |
210,194 |
95,837 |
140,572 |
|||||||||||||||
Each Fund pays UBS Global AM a monthly administration fee that is accrued daily and paid monthly at an annual rate of 0.075% of the average daily net assets of such Fund. For the year ended June 30, 2015, the Funds owed and incurred administrative fees as follows:
|
Fund |
Administrative fees owed |
Administrative fees incurred |
|||||||||
|
UBS Asset Growth Fund |
$ |
3,419 |
$ |
20,962 |
|||||||
|
UBS Dynamic Alpha Fund |
42,118 |
243,471 |
|||||||||
|
UBS Global Allocation Fund |
65,435 |
414,655 |
|||||||||
|
UBS Multi-Asset Income Fund |
2,358 |
15,628 |
|||||||||
The Funds may invest in certain affiliated investment companies also advised or managed by the Advisor. Investments in affiliated investment companies for the year ended June 30, 2015 have been included near the end of each Fund's Portfolio of investments.
The Funds may invest in UBS Cash Management Prime Relationship Fund ("Cash Prime"). Cash Prime is offered as a cash management option only to mutual funds and certain other accounts. Distributions received from Cash Prime are reflected as affiliated income in the Statement of operations. Amounts relating to those investments at June 30, 2015 and for the year ended have been included near the end of each Fund's Portfolio of investments.
98
The UBS Funds
Notes to financial statements
Under normal conditions, the Funds invest cash collateral from securities lending activities into an affiliated private money market fund, UBS Private Money Market Fund LLC ("Private Money Market"), which operates in compliance with most of the substantive provisions of Rule 2a-7 of the 1940 Act. Private Money Market is managed by the Advisor and is offered as a cash management option only to mutual funds and certain other accounts managed by the Advisor. UBS Global AM acts as managing member and receives a management fee from Private Money Market payable monthly in arrears at the annual rate of 0.10% of Private Money Market's average daily members' equity, minus the aggregate operating expenses of, and incurred by, Private Money Market during each such related month, not including investment expenses (including brokerage commissions, taxes, interest charges and other costs with respect to transactions in securities) and extraordinary expenses including litigation expenses, if any. The Advisor may, in its sole discretion, waive all or any portion of the management fee to which it may be entitled from time to time in order to maintain operating expenses at a certain level. Distributions received from Private Money Market, net of fee rebates paid to borrowers, are reflected as securities lending income in the Statement of operations. Amounts relating to those investments at June 30, 2015 and for the year ended have been included near the end of each Fund's Portfolio of investments.
The following Funds have incurred brokerage commissions with UBS AG, an affiliated broker-dealer. Amounts relating to those transactions for the year ended June 30, 2015, were as follows:
|
Fund |
UBS AG |
||||||
|
UBS Global Allocation Fund |
$ |
438 |
|||||
|
UBS Multi-Asset Income Fund |
24 |
||||||
3. Distribution and service plans
UBS Global AM (US) is the principal underwriter of each Fund's shares. The Trust has adopted distribution and/or service plans (the "Plans") pursuant to Rule 12b-1 under the 1940 Act for Class A and Class C. The Plans govern payments made for the expenses incurred in the service and/or distribution of Class A and Class C. Annual fees under the Plans as a percentage of the average daily net assets of each representative class of each of the Funds are as follows:
|
Fund |
Class A |
Class C |
|||||||||
|
UBS Asset Growth Fund |
0.25 |
% |
1.00 |
% |
|||||||
|
UBS Dynamic Alpha Fund |
0.25 |
1.00 |
|||||||||
|
UBS Global Allocation Fund |
0.25 |
1.00 |
|||||||||
|
UBS Multi-Asset Income Fund |
0.25 |
1.00 |
|||||||||
UBS Global AM (US) also receives the proceeds of the initial sales charges paid upon purchases of Class A shares and the contingent deferred sales charges paid by shareholders upon certain redemptions of Class A and Class C.
99
The UBS Funds
Notes to financial statements
At June 30, 2015, certain Funds owed UBS Global AM (US) distribution and service fees, and for the year ended June 30, 2015, certain Funds were informed by UBS Global AM (US) that it had earned sales charges as follows:
|
Fund |
Distribution and service fees owed |
Sales charges earned |
|||||||||
|
UBS Asset Growth Fund—Class A |
$ |
2,928 |
$ |
3,508 |
|||||||
|
UBS Asset Growth Fund—Class C |
5,709 |
37 |
|||||||||
|
UBS Dynamic Alpha Fund—Class A |
18,939 |
36,543 |
|||||||||
|
UBS Dynamic Alpha Fund—Class C |
39,420 |
414 |
|||||||||
|
UBS Global Allocation Fund—Class A |
50,401 |
27,078 |
|||||||||
|
UBS Global Allocation Fund—Class C |
125,653 |
549 |
|||||||||
|
UBS Multi-Asset Income Fund—Class A |
657 |
3,894 |
|||||||||
|
UBS Multi-Asset Income Fund—Class C |
5,531 |
234 |
|||||||||
4. Transfer agency and related services fees
UBS Financial Services Inc. provides certain services pursuant to a delegation of authority from BNY Mellon Investment Servicing ("BNY Mellon"), as each Fund's transfer agent, and is compensated for these services by BNY Mellon, not the Funds.
For the year ended June 30, 2015, UBS Financial Services Inc. received from BNY Mellon, not the Funds, total service fees as follows:
|
Fund |
Amount paid |
||||||
|
UBS Asset Growth Fund |
$ |
5,453 |
|||||
|
UBS Global Allocation Fund |
154,533 |
||||||
|
UBS Dynamic Alpha Fund |
86,488 |
||||||
|
UBS Multi-Asset Income Fund |
9,542 |
||||||
5. Securities lending
Each Fund may lend securities up to 331/3% of its total assets to qualified broker-dealers or institutional investors. The loans are secured at all times by cash, cash equivalents or US government securities in an amount at least equal to 102% of the market value of the securities loaned with respect to domestic securities and 105% of the market value of the securities loaned with respect to foreign securities, plus accrued interest and dividends, determined on a daily basis and adjusted accordingly.
Each Fund will regain ownership of loaned securities to exercise certain beneficial rights; however, the Fund may bear the risk of delay in recovery of, or even loss of rights in, the securities loaned should the borrower fail financially. A Fund receives compensation for lending its securities from interest or dividends earned on the cash, cash equivalents or US government securities held as collateral, net of fee rebates paid to the borrower plus reasonable administrative and custody fees.
UBS Asset Growth Fund, UBS Dynamic Alpha Fund and UBS Global Allocation Fund loaned securities to certain qualified broker-dealers, with the Funds' custodian acting as the Funds' lending agent. Cash collateral received is invested in Private Money Market, which is included in a Fund's Portfolio of investments. In addition, UBS Dynamic Alpha Fund and UBS Global Allocation Fund received US government agency securities as collateral with a market
100
The UBS Funds
Notes to financial statements
value of $12,413,780 and $1,669,682, respectively, which cannot be resold. The value of loaned securities and related collateral at June 30, 2015 was as follows:
|
Fund |
Market value of securities loaned |
Market value of collateral received from securities loaned |
Market value of investments of cash collateral received |
||||||||||||
|
UBS Asset Growth Fund |
$ |
4,717,139 |
$ |
4,817,108 |
$ |
4,817,108 |
|||||||||
|
UBS Dynamic Alpha Fund |
13,676,900 |
13,972,218 |
1,558,438 |
||||||||||||
|
UBS Global Allocation Fund |
24,252,961 |
24,800,940 |
23,131,258 |
||||||||||||
6. Purchases and sales of securities
For the year ended June 30, 2015, aggregate purchases and sales of portfolio securities, excluding short-term investments and US Government and agency securities, were as follows:
|
Fund |
Purchases |
Sales proceeds |
|||||||||
|
UBS Asset Growth Fund |
$ |
10,838,559 |
$ |
11,868,176 |
|||||||
|
UBS Dynamic Alpha Fund |
123,006,006 |
104,333,475 |
|||||||||
|
UBS Global Allocation Fund |
229,649,432 |
276,220,016 |
|||||||||
|
UBS Multi-Asset Income Fund |
16,582,747 |
21,224,554 |
|||||||||
For the year ended June 30, 2015, aggregate purchases and sales of US Government and agency securities, excluding short-term investments, were as follows:
|
Fund |
Purchases |
Sales proceeds |
|||||||||
|
UBS Global Allocation Fund |
$ |
20,690,444 |
$ |
20,013,117 |
|||||||
|
UBS Multi-Asset Income Fund |
648,351 |
594,680 |
|||||||||
7. Federal income taxes
It is each Fund's policy to comply with all requirements of the Internal Revenue Code applicable to regulated investment companies and to distribute substantially all of their taxable income to their shareholders. In addition, by distributing during each calendar year substantially all of its net investment income, net realized capital gains and certain other amounts, if any, each Fund intends not to be subject to a federal excise tax. Accordingly, no federal income tax provision was required.
The tax character of distributions paid during the fiscal years ended June 30, 2015 and June 30, 2014 were as follows:
|
2015 |
2014 |
||||||||||||||||||||||||||
|
Fund |
Distributions paid from net long-term gains |
Distributions paid from ordinary income |
Total distributions paid |
Distributions paid from net long-term gains |
Distributions paid from ordinary income |
Total distributions paid |
|||||||||||||||||||||
|
UBS Asset Growth Fund |
$ |
— |
$ |
— |
$ |
— |
$ |
— |
$ |
114,699 |
$ |
114,699 |
|||||||||||||||
|
UBS Dynamic Alpha Fund |
— |
11,546,315 |
11,546,315 |
— |
492,870 |
492,870 |
|||||||||||||||||||||
|
UBS Global Allocation Fund |
— |
— |
— |
— |
7,051,191 |
7,051,191 |
|||||||||||||||||||||
|
UBS Multi-Asset Income Fund |
508,605 |
1,536,932 |
2,045,537 |
245,364 |
1,377,110 |
1,622,474 |
|||||||||||||||||||||
101
The UBS Funds
Notes to financial statements
At June 30, 2015 the components of accumulated earnings (deficit) on a tax basis were as follows:
| Fund |
Undistributed long-term gains |
Undistributed ordinary income |
Accumulated capital and other losses |
Unrealized appreciation/ (depreciation) |
Total |
||||||||||||||||||
|
UBS Asset Growth Fund |
$ |
— |
$ |
85,940 |
$ |
(24,533,387 |
) |
$ |
(496,148 |
) |
$ |
(24,943,595 |
) |
||||||||||
|
UBS Dynamic Alpha Fund |
— |
6,562,366 |
(352,856,735 |
) |
(27,295,817 |
) |
(373,590,186 |
) |
|||||||||||||||
|
UBS Global Allocation Fund |
— |
10,547,874 |
(954,257,705 |
) |
9,065,060 |
(934,644,771 |
) |
||||||||||||||||
|
UBS Multi-Asset Income Fund |
39,950 |
240,343 |
— |
(633,300 |
) |
(353,007 |
) |
||||||||||||||||
Due to inherent differences in the recognition of income, expenses and realized gains/losses under US GAAP and federal income tax purposes, permanent differences between book and tax basis reporting for the current fiscal year have been identified and appropriately reclassified. Reclassifications for the year ended June 30, 2015 were as follows:
|
Fund |
Undistributed net investment income |
Accumulated net realized gain/(loss) |
Beneficial interest |
||||||||||||
|
UBS Asset Growth Fund |
$ |
3,587 |
$ |
(3,587 |
) |
$ |
— |
||||||||
|
UBS Dynamic Alpha Fund |
14,533,739 |
(14,533,739 |
) |
— |
|||||||||||
|
UBS Global Allocation Fund |
13,582,401 |
(10,814,546 |
) |
(2,767,855 |
) |
||||||||||
|
UBS Multi-Asset Income Fund |
288,590 |
(288,590 |
) |
— |
|||||||||||
Under the Regulated Investment Company Modernization Act of 2010 (the "Act"), net capital losses recognized by the Funds after December 22, 2010, may be carried forward indefinitely, and retain their character as short-term and/or long-term losses. These carryforwards are available as a reduction, to the extent provided in the regulations, of future realized capital gains. The Act requires that post-enactment net capital losses be used before pre-enactment net capital losses. At June 30, 2015, the Funds had no post-enactment net capital losses.
At June 30, 2015, the following Funds had pre-enactment net capital loss carryforwards for federal income tax purposes available to offset future capital gains through the indicated expiration dates:
|
Expiration Dates |
|||||||||||||||
|
Fund |
June 30, 2017 |
June 30, 2018 |
June 30, 2019 |
||||||||||||
|
UBS Asset Growth Fund |
$ |
11,720,453 |
$ |
9,543,610 |
$ |
3,269,324 |
|||||||||
|
UBS Dynamic Alpha Fund |
103,495,364 |
202,927,795 |
46,428,719 |
||||||||||||
|
UBS Global Allocation Fund |
91,445,433 |
862,762,158 |
— |
||||||||||||
To the extent that such losses are used to offset future net realized capital gains, it is probable these gains will not be distributed.
During the fiscal year ended June 30, 2015, the following Funds utilized capital loss carryforwards to offset current year realized capital gains:
|
Fund |
Amount |
||||||
|
UBS Asset Growth Fund |
$ |
578,746 |
|||||
|
UBS Dynamic Alpha Fund |
10,043,435 |
||||||
|
UBS Global Allocation Fund |
46,293,481 |
||||||
ASC 740-10 "Income Taxes—Overall" sets forth a minimum threshold for financial statement recognition of the benefit of a tax position taken or expected to be taken. The Funds have conducted an analysis and concluded, as
102
The UBS Funds
Notes to financial statements
of June 30, 2015, that there are no significant uncertain tax positions taken or expected to be taken that would require recognition in the financial statements. It is each Fund's policy to record any significant foreign tax exposures in the financial statements. The Funds recognize interest and penalties, if any, related to uncertain tax positions as income tax expense in the Statement of operations. During the year ended June 30, 2015, the Funds did not incur any interest or penalties.
Under the applicable foreign tax laws, gains on certain securities held in certain foreign countries may be subject to taxes that will be paid by the Funds.
Each of the tax years in the four year period ended June 30, 2015 remains subject to examination by the Internal Revenue Service and state taxing authorities.
8. Line of credit
The Trust has entered into an agreement with JPMorgan Chase Bank to provide a $50 million committed line of credit to the Funds ("Committed Credit Facility") to be utilized for temporary financing until the settlement of sales or purchases of portfolio securities, the repurchase or redemption of shares of each Fund at the request of shareholders and other temporary or emergency purposes. Interest on amounts borrowed is calculated based on the prevailing rates in effect at the time of borrowing. Under the Committed Credit Facility arrangement, each Fund has agreed to pay commitment fees, pro rata, based on the relative asset size of the Funds in the Committed Credit Facility. There were no borrowings from the Committed Credit Facility outstanding as of or during the year ended June 30, 2015.
9. Shares of beneficial interest
For the year ended June 30, 2015, transactions in shares of beneficial interest for each of the Funds were as follows:
UBS Asset Growth Fund
|
Class A |
Class C |
Class P* |
|||||||||||||||||||||||||
|
Shares |
Amount |
Shares |
Amount |
Shares |
Amount |
||||||||||||||||||||||
|
Shares sold |
34,459 |
$ |
319,883 |
30,223 |
$ |
283,110 |
545,878 |
$ |
5,099,518 |
||||||||||||||||||
|
Shares repurchased |
(1,041,774 |
) |
(9,722,330 |
) |
(129,143 |
) |
(1,171,762 |
) |
(116,706 |
) |
(1,071,848 |
) |
|||||||||||||||
|
Redemption fees |
— |
299 |
— |
129 |
— |
86 |
|||||||||||||||||||||
|
Net increase (decrease) |
(1,007,315 |
) |
$ |
(9,402,148 |
) |
(98,920 |
) |
$ |
(888,523 |
) |
429,172 |
$ |
4,027,756 |
||||||||||||||
UBS Dynamic Alpha Fund
|
Class A |
Class C |
Class P* |
|||||||||||||||||||||||||
|
Shares |
Amount |
Shares |
Amount |
Shares |
Amount |
||||||||||||||||||||||
|
Shares sold |
2,653,702 |
$ |
19,233,695 |
327,387 |
$ |
2,236,501 |
19,709,662 |
$ |
145,938,818 |
||||||||||||||||||
|
Shares repurchased |
(17,334,381 |
) |
(125,723,664 |
) |
(1,147,281 |
) |
(7,836,630 |
) |
(5,042,353 |
) |
(37,243,078 |
) |
|||||||||||||||
|
Dividends reinvested |
404,482 |
2,871,827 |
176,586 |
1,179,595 |
875,769 |
6,323,050 |
|||||||||||||||||||||
|
Redemption fees |
— |
1,269 |
— |
614 |
— |
1,914 |
|||||||||||||||||||||
|
Net increase (decrease) |
(14,276,197 |
) |
$ |
(103,616,873 |
) |
(643,308 |
) |
$ |
(4,419,920 |
) |
15,543,078 |
$ |
115,020,704 |
||||||||||||||
103
The UBS Funds
Notes to financial statements
UBS Global Allocation Fund
|
Class A |
Class C |
Class P* |
|||||||||||||||||||||||||
|
Shares |
Amount |
Shares |
Amount |
Shares |
Amount |
||||||||||||||||||||||
|
Shares sold |
1,219,630 |
$ |
13,777,786 |
98,989 |
$ |
1,087,450 |
5,659,081 |
$ |
63,603,807 |
||||||||||||||||||
|
Shares repurchased |
(8,400,345 |
) |
(93,015,757 |
) |
(2,933,162 |
) |
(31,943,506 |
) |
(6,352,786 |
) |
(72,493,782 |
) |
|||||||||||||||
|
Redemption fees |
— |
5,031 |
— |
3,244 |
— |
2,997 |
|||||||||||||||||||||
|
Net decrease |
(7,180,715 |
) |
$ |
(79,232,940 |
) |
(2,834,173 |
) |
$ |
(30,852,812 |
) |
(693,705 |
) |
$ |
(8,886,978 |
) |
||||||||||||
UBS Multi-Asset Income Fund
|
Class A |
Class C |
Class P* |
|||||||||||||||||||||||||
|
Shares |
Amount |
Shares |
Amount |
Shares |
Amount |
||||||||||||||||||||||
|
Shares sold |
38,574 |
$ |
386,549 |
16,894 |
$ |
168,263 |
1,230,464 |
$ |
12,794,410 |
||||||||||||||||||
|
Shares repurchased |
(1,256,402 |
) |
(13,045,524 |
) |
(108,452 |
) |
(1,081,669 |
) |
(448,347 |
) |
(4,472,724 |
) |
|||||||||||||||
|
Dividends reinvested |
33,175 |
330,973 |
48,993 |
483,210 |
93,150 |
918,496 |
|||||||||||||||||||||
|
Redemption fees |
— |
13 |
— |
25 |
— |
36 |
|||||||||||||||||||||
|
Net increase |
(1,184,653 |
) |
$ |
(12,327,989 |
) |
(42,565 |
) |
$ |
(430,171 |
) |
875,267 |
$ |
9,240,218 |
||||||||||||||
* Effective July 28, 2014, Class Y shares were renamed Class P shares.
For the year ended June 30, 2014, transactions in shares of beneficial interest for each of the Funds were as follows:
UBS Asset Growth Fund
|
Class A |
Class C |
Class Y* |
|||||||||||||||||||||||||
|
Shares |
Amount |
Shares |
Amount |
Shares |
Amount |
||||||||||||||||||||||
|
Shares sold |
124,121 |
$ |
1,088,605 |
36,491 |
$ |
315,049 |
23,991 |
$ |
206,491 |
||||||||||||||||||
|
Shares repurchased |
(851,961 |
) |
(7,260,277 |
) |
(319,502 |
) |
(2,696,467 |
) |
(69,753 |
) |
(592,445 |
) |
|||||||||||||||
|
Dividends reinvested |
11,634 |
96,682 |
— |
— |
1,535 |
12,725 |
|||||||||||||||||||||
|
Redemption fees |
— |
174 |
— |
57 |
— |
13 |
|||||||||||||||||||||
|
Net decrease |
(716,206 |
) |
$ |
(6,074,816 |
) |
(283,011 |
) |
$ |
(2,381,361 |
) |
(44,227 |
) |
$ |
(373,216 |
) |
||||||||||||
UBS Dynamic Alpha Fund
|
Class A |
Class C |
Class Y* |
|||||||||||||||||||||||||
|
Shares |
Amount |
Shares |
Amount |
Shares |
Amount |
||||||||||||||||||||||
|
Shares sold |
4,599,284 |
$ |
32,454,724 |
1,216,225 |
$ |
8,057,242 |
5,081,730 |
$ |
36,928,055 |
||||||||||||||||||
|
Shares repurchased |
(8,360,195 |
) |
(59,064,240 |
) |
(1,982,672 |
) |
(13,239,060 |
) |
(1,033,768 |
) |
(7,452,221 |
) |
|||||||||||||||
|
Dividends reinvested |
36,239 |
256,205 |
— |
— |
27,477 |
197,841 |
|||||||||||||||||||||
|
Redemption fees |
— |
24,290 |
— |
6,281 |
— |
5,822 |
|||||||||||||||||||||
|
Net increase (decrease) |
(3,724,672 |
) |
$ |
(26,329,021 |
) |
(766,447 |
) |
$ |
(5,175,537 |
) |
4,075,439 |
$ |
29,679,497 |
||||||||||||||
104
The UBS Funds
Notes to financial statements
UBS Global Allocation Fund
|
Class A |
Class C |
Class Y* |
|||||||||||||||||||||||||
|
Shares |
Amount |
Shares |
Amount |
Shares |
Amount |
||||||||||||||||||||||
|
Shares sold |
492,266 |
$ |
5,100,774 |
142,668 |
$ |
1,450,604 |
431,301 |
$ |
4,608,701 |
||||||||||||||||||
|
Shares repurchased |
(11,455,365 |
) |
(119,301,996 |
) |
(4,526,645 |
) |
(46,006,971 |
) |
(1,900,921 |
) |
(20,110,700 |
) |
|||||||||||||||
|
Dividends reinvested |
380,019 |
3,895,196 |
65,888 |
662,837 |
171,107 |
1,784,642 |
|||||||||||||||||||||
|
Redemption fees |
— |
4,463 |
— |
2,406 |
— |
1,675 |
|||||||||||||||||||||
|
Net decrease |
(10,583,080 |
) |
$ |
(110,301,563 |
) |
(4,318,089 |
) |
$ |
(43,891,124 |
) |
(1,298,513 |
) |
$ |
(13,715,682 |
) |
||||||||||||
UBS Multi-Asset Income Fund
|
Class A |
Class C |
Class Y* |
|||||||||||||||||||||||||
|
Shares |
Amount |
Shares |
Amount |
Shares |
Amount |
||||||||||||||||||||||
|
Shares sold |
268,384 |
$ |
2,745,006 |
60,782 |
$ |
620,986 |
— |
$ |
— |
||||||||||||||||||
|
Shares repurchased |
(1,240,796 |
) |
(12,716,153 |
) |
(240,542 |
) |
(2,480,987 |
) |
(2,664,613 |
) |
(27,718,901 |
) |
|||||||||||||||
|
Dividends reinvested |
50,239 |
515,133 |
17,117 |
175,299 |
70,450 |
718,556 |
|||||||||||||||||||||
|
Redemption fees |
— |
408 |
— |
169 |
— |
467 |
|||||||||||||||||||||
|
Net decrease |
(922,173 |
) |
$ |
(9,455,606 |
) |
(162,643 |
) |
$ |
(1,684,533 |
) |
(2,594,163 |
) |
$ |
(26,999,878 |
) |
||||||||||||
* Effective July 28, 2014, Class Y shares were renamed Class P shares.
10. Contribution from Advisor
During the year ended June 30, 2015 the Advisor reimbursed UBS Dynamic Alpha Fund for a trading error in the amount of $2,068.
105
The UBS Funds
Report of independent registered public accounting firm
The Board of Trustees and Shareholders of The UBS Funds
We have audited the accompanying statements of assets and liabilities, including the portfolios of investments, of UBS Asset Growth Fund, UBS Dynamic Alpha Fund, UBS Global Allocation Fund and UBS Multi-Asset Income Fund (four of the series comprising The UBS Funds) (collectively the "Funds") as of June 30, 2015, and the related statements of operations for the year then ended, the statements of changes in net assets for each of the two years in the period then ended and the financial highlights for each of the periods indicated therein. These financial statements and financial highlights are the responsibility of the Funds' management. Our responsibility is to express an opinion on these financial statements and financial highlights based on our audits.
We conducted our audits in accordance with the standards of the Public Company Accounting Oversight Board (United States). Those standards require that we plan and perform the audit to obtain reasonable assurance about whether the financial statements and financial highlights are free of material misstatement. We were not engaged to perform an audit of the Funds' internal control over financial reporting. Our audits included consideration of internal control over financial reporting as a basis for designing audit procedures that are appropriate in the circumstances, but not for the purpose of expressing an opinion on the effectiveness of the Funds' internal control over financial reporting. Accordingly, we express no such opinion. An audit also includes examining, on a test basis, evidence supporting the amounts and disclosures in the financial statements and financial highlights, assessing the accounting principles used and significant estimates made by management, and evaluating the overall financial statement presentation. Our procedures included confirmation of securities owned as of June 30, 2015, by correspondence with the custodian and others or by other appropriate auditing procedures where replies from others were not received. We believe that our audits provide a reasonable basis for our opinion.
In our opinion, the financial statements and financial highlights referred to above present fairly, in all material respects, the financial position of UBS Asset Growth Fund, UBS Dynamic Alpha Fund, UBS Global Allocation Fund and UBS Multi-Asset Income Fund at June 30, 2015, the results of their operations for the year then ended, the changes in their net assets for each of the two years in the period then ended and the financial highlights for each of the periods indicated therein, in conformity with U.S. generally accepted accounting principles.

New York, New York
August 28, 2015
106
The UBS Funds
General information (unaudited)
Quarterly Form N-Q portfolio schedule
The Funds will file their complete schedule of portfolio holdings with the Securities and Exchange Commission ("SEC") for the first and third quarters of each fiscal year on Form N-Q. The Funds' Forms N-Q are available on the SEC's Web site at http://www.sec.gov. The Funds' Forms N-Q may be reviewed and copied at the SEC's Public Reference Room in Washington, D.C. Information on the operation of the SEC's Public Reference Room may be obtained by calling 1-202-551 8090. Additionally, you may obtain copies of Forms N-Q from the Funds upon request by calling 1-800-647 1568.
Proxy voting policies, procedures and record
You may obtain a description of the Funds' (1) proxy voting policies, (2) proxy voting procedures and (3) information regarding how the Funds voted any proxies related to portfolio securities during the most recent 12-month period ended June 30 for which an SEC filing has been made, without charge, upon request by contacting the Funds directly at 1-800-647 1568, online on UBS's Web site: www.ubs.com/ubsglobalam-proxy, or on the EDGAR Database on the SEC's Web site http://www.sec.gov).
107
The UBS Funds
Board approval of investment advisory agreements (unaudited)
At the meeting of the Board of Trustees (the "Board") of The UBS Funds (the "Trust"), held on June 4 and 5, 2015 (the "Meeting"), the Board, including those Trustees who are not "interested persons" (as defined in the 1940 Act) of the Trust or UBS Global Asset Management (Americas) Inc. (the "Advisor") and its affiliates (together, the "Independent Trustees"), considered the continuation of the investment advisory agreements (the "Advisory Agreements") between the Trust and the Advisor for the UBS Dynamic Alpha Fund, UBS Global Allocation Fund, UBS Asset Growth Fund, UBS Multi-Asset Income Fund, UBS Global Sustainable Equity Fund, UBS U.S. Defensive Equity Fund, UBS U.S. Large Cap Equity Fund, UBS U.S. Equity Opportunity Fund, UBS U.S. Small Cap Growth Fund, UBS Equity Long-Short Multi-Strategy Fund, UBS Fixed Income Opportunities Fund and UBS Core Plus Bond Fund (each a "Fund," and together, the "Funds"). Prior to the Meeting, the Independent Trustees' counsel had sent to the Advisor a request detailing the information that the Independent Trustees wished to receive in connection with their consideration of the continuation of the Advisory Agreements. The Independent Trustees met with their independent counsel, as well as an independent consultant engaged by the Board to assist in the annual Advisory Agreement review process, on May 26, 2015, June 4, 2015 and June 5, 2015, to discuss the materials provided to them in response to the information request, including materials prepared by the Advisor, as well as reports prepared by Lipper Inc. ("Lipper Reports"), an independent statistical compilation company, providing comparative expense information on an actual and contractual basis and comparative performance information for the Funds. The Board also made reference to information and material that had been provided to the Independent Trustees throughout the year at quarterly Board meetings.
At the Meeting, the Board considered a number of factors in connection with its deliberations concerning the continuation of the Advisory Agreement for each Fund, including: (i) the nature, extent, and quality of the services provided by the Advisor to the Fund; (ii) the performance of the Fund and the Advisor; (iii) the Fund's expenses, costs of the services to be provided and profits to be realized by the Advisor and its affiliates from the relationship with the Fund; and (iv) whether economies of scale are realized by the Advisor with respect to the Fund, as it grows larger, and the extent to which the economies of scale are reflected in the level of the management fees charged.
Nature, extent, and quality of services.
In considering the nature, extent, and quality of the services provided by the Advisor to a Fund, the Board reviewed the material presented by the Advisor describing the various services provided to each Fund. The Board noted that in addition to investment management services, the Advisor provides each Fund with operational, legal, and compliance support. The Board also considered the scope and depth of the Advisor's organization and the experience and expertise of the professionals currently providing investment management and other services to the Funds. The Board considered that the Advisor was a well-established investment management organization employing investment personnel with significant experience in the investment management industry. The Board also considered the Advisor's in-house research capabilities, as well as other research services available to it, including research services available to the Advisor as a result of securities transactions effected for the Funds and the Advisor's other investment management clients, and noted that the Advisor had extensive global research capabilities. The Board also evaluated the Advisor's portfolio management process for each Fund, including the use of risk management techniques and the proprietary technologies utilized to structure the Fund's portfolio. The Board noted that various presentations had been made by investment personnel at Board meetings throughout the year concerning the Funds' investment performance and investment strategies, including the derivative strategies utilized by certain Funds.
The Board also noted and discussed the services that the Advisor and its affiliates provide to the Funds under other agreements with the Trust, including administration services provided by the Advisor, underwriting services provided by UBS Global Asset Management (US) Inc. ("UBS Global AM (US)"), and sub-transfer agency services provided by UBS Financial Services Inc. ("UBS Financial Services"). In connection with the non-investment management services, the Board also considered the quarterly reports that the Advisor provides to the Board throughout the year pertaining to brokerage commissions, soft dollars, portfolio valuations, and Rule 12b-1 fees, among others. In addition, the Board considered the presentations provided with respect to distribution strategies for the Funds.
108
The UBS Funds
Board approval of investment advisory agreements (unaudited)
After analyzing the services provided by the Advisor to each Fund, both quantitatively and qualitatively, including the impact of these services on investment performance, the Board concluded that the nature, extent, and quality of services provided to each Fund were consistent with the operational requirements of each Fund, and met the needs of the Fund's shareholders.
Performance.
In evaluating the performance of each Fund, the Board analyzed the Lipper Reports, which compared the performance of each Fund with other funds in its respective peer universe over various time periods. The Board also reviewed the memoranda provided by the Advisor providing an analysis of the markets and the Funds' performance during the past year. In reviewing the Lipper Reports, the Board noted that the UBS Dynamic Alpha Fund, UBS Global Allocation Fund, UBS Asset Growth Fund, UBS Multi-Asset Income Fund, UBS Global Sustainable Equity Fund, UBS Equity Long-Short Multi-Strategy Fund, UBS U.S. Large Cap Equity Fund, UBS U.S. Equity Opportunity Fund, UBS U.S. Small Cap Growth Fund and UBS Core Plus Bond Fund each had appeared in one of the top three performance quintiles for the one-year performance period. At the Board's request, the Advisor further addressed the performance data for the UBS U.S. Defensive Equity Fund and UBS Fixed Income Opportunities Fund, each of which had appeared in one of the lower performance quintiles for the one-year period.
In discussing the performance of the UBS U.S. Defensive Equity Fund for the one-year performance period, the Advisor explained that the Fund's defensive strategy was the primary reason for the Fund's underperformance as compared to its peer universe. The Advisor noted that the options overlay strategy for the Fund, which reduced the volatility profile of the Fund, detracted from the Fund's performance. The Advisor stated the options overlay strategy should benefit the Fund's relative performance when the U.S. equity market experiences a down turn.
The Advisor next addressed the relative underperformance of the UBS Fixed Income Opportunities Fund with respect to the Fund's peers. The Fund's weaker relative performance as compared to its peer universe was attributable to its corporate credit exposure in both investment grade and high yield debt, where overall hedging strategies and security selection within the energy sector detracted from results. The Advisor also noted that the Fund's net short duration positioning was not rewarded as yield generally declined over the period. The Advisor did note that the Fund continued to deliver returns with minimal correlation to traditional fixed income markets, as well as many of its unconstrained fixed income peer funds.
The Board concluded that the Advisor's explanations provided a sound basis for understanding the performance of each Fund that underperformed in comparison to its peer universe. The Board determined, after analyzing the performance data, that the performance of each Fund was acceptable as compared with relevant performance standards, given the investment strategies and risk profile of each Fund, the expectations of the shareholder base, the current market environment and the Advisor's efforts to address the underperformance issues of each Fund.
Fund fees and expenses.
When considering the fees and expenses borne by each Fund, and the reasonableness of the management fees paid to the Advisor in light of the services provided to each Fund, the Board compared the fees charged by the Advisor to each Fund to fees charged to the funds in its peer group for comparable services, as provided in the Lipper Reports, on both an actual (taking into account expense limitation arrangements) and a contractual basis (assuming all funds in the peer expense group were similar in size to the respective Fund). In examining the Lipper Reports, and in reviewing comparative costs, it was noted that the results of such expense comparisons showed that the actual management fee rate for each Fund, except the UBS Global Allocation Fund, UBS Dynamic Alpha Fund and UBS U.S. Small Cap Growth Fund, was comparable to, or lower than, the Lipper median in its respective Lipper expense group. The Board also noted that each Fund, except the UBS Global Allocation Fund, UBS Core Plus Bond Fund and UBS U.S. Small Cap Growth Fund, had a contractual fee rate comparable to, or lower than, the Lipper median in its respective Lipper expense group. In addition, the Board reviewed the actual total expenses of
109
The UBS Funds
Board approval of investment advisory agreements (unaudited)
each Fund and noted that each Fund had total expenses that were comparable to, or lower than, the Lipper median in its respective Lipper expense group, except for UBS Global Allocation Fund and UBS U.S. Small Cap Growth Fund.
The Board first discussed the management fee and expenses of the UBS Global Allocation Fund. It was noted that the contractual management fee, actual management fee and total expenses for the UBS Global Allocation Fund were each slightly higher than the fees and expenses of several of the funds in its Lipper expense group. The Advisor noted that a reduction in the UBS Global Allocation Fund's assets was a main driver to the Fund's relative lower rankings. The Board, however, noted the Fund's management fee and total expenses were closer to the medians of its Lipper expense group than such fee and expenses were last year. The Board determined that the management fee and expenses were each reasonable considering that neither the management fee nor the Fund's total expenses were significantly higher than the respective Lipper expense group medians. The Board will continue to monitor the Fund's peers and expenses.
The Board then discussed the management fee of the UBS Dynamic Alpha Fund. It was noted that the actual management fee of UBS Dynamic Alpha Fund was higher than the median of the Fund's Lipper expense group. The Board noted that while the UBS Dynamic Alpha Fund's actual management fee was higher than the median of the Fund's Lipper expense group, the Fund's total expenses were less than the median of the Fund's Lipper expense group, resulting in the total cost to investors being very competitive. The Advisor also noted that the UBS Dynamic Alpha Fund was included in a brand new Lipper peer group category. The Advisor stated that as the new category matures, the rankings of the Fund will become more conclusive.
The Advisor next addressed the management fee of the UBS Core Plus Bond Fund. The Advisor noted that while the contractual management fee of the UBS Core Plus Bond Fund was higher than the median of the Fund's Lipper expense group, the Fund compared very favorable to its Lipper peers with respect to its actual management fee and total expenses. The UBS Core Plus Bond Fund placed in the first quintile of its Lipper expense group for both its actual management fee and total expenses.
The Board next discussed the management fee of the UBS U.S. Small Cap Growth Fund. It was noted that the contractual management fee, actual management fee and total expenses for the UBS U.S. Small Cap Growth Fund were each higher than the medians in its Lipper expense group. The Advisor noted that a new fee waiver and expense cap arrangement was approved for the Fund effective March 27, 2015, that provides for a higher level of fees waived and expenses reimbursed by the Advisor. The Advisor reported that under this new arrangement, the actual management fee and total expenses for the UBS U.S. Small Cap Growth Fund are each expected to be lower than the medians of the Lipper expense group.
The Board also received and considered information about the fee rates charged to other funds and accounts that are managed by the Advisor. After discussing the information about the other funds and accounts with the Advisor, the Board determined that the fees charged by the Advisor to the Funds were within a reasonable range, giving effect to differences in services performed for such other funds and accounts as compared to such fee rates. The Board, after reviewing all pertinent material, concluded that the management fee payable under each Fund's Advisory Agreement was fair and reasonable, both on an absolute basis and in comparison with the fees of other funds identified in its peer group.
Costs and profitability.
The Board considered the costs of providing services to the Funds and the profitability of the Funds to the Advisor and its affiliates by reviewing the profitability analysis provided by the Advisor, including information about its fee revenues and expenses. The Board reviewed the profitability of each Fund to the Advisor and its affiliates, and the compensation that was received for providing services to each Fund. The profitability analysis, which provided
110
The UBS Funds
Board approval of investment advisory agreements (unaudited)
information for the last three calendar years, included schedules relating to the revenue and expenses attributable to: (i) the investment advisory and administration services provided by the Advisor; (ii) the distribution and shareholder services provided by UBS Global AM (US) and UBS Financial Services; (iii) the transfer agency-related services provided by UBS Financial Services; and (iv) all services provided by the Advisor, UBS Global AM (US), and UBS Financial Services shown on a consolidated basis. In discussing the profitability analysis with the Board, the Advisor, as requested by the Board, provided the Board with a presentation on the methodology utilized in the profitability analysis. The Board noted that the methodology used for the profitability analysis provided to the Board for purposes of its annual review of the Advisory Agreements was reasonable. The Advisor also explained to the Board the reasons for an increase or decrease in profitability of each Fund from last calendar year to this calendar year.
The Board also considered "fallout" or ancillary benefits to the Advisor or its affiliates as the result of their relationship with the Funds; for example, the ability to attract other clients due to the Advisor's role as investment advisor to the Funds and the research services available to the Advisor through soft dollar brokerage commissions. The Independent Trustees also considered the ancillary benefits received by the Advisor's affiliates, UBS Securities LLC and UBS AG, in the form of commissions for executing securities transactions for the Funds. Upon closely examining the information provided concerning the Advisor's profitability, the Board concluded that the level of profits realized by the Advisor and its affiliates with respect to each Fund, if any, was reasonable in relation to the nature and quality of the services that were provided.
Economies of scale.
The Board also discussed whether economies of scale are realized by the Advisor with respect to each Fund as it grows larger, and the extent to which this is reflected in the level of management fees charged. The Board noted that with respect most Funds, any actual or potential economies of scale are, or will be, shared with the Fund and its shareholders through existing management fee breakpoints so that as the Fund grows in size, its effective management fee declines. The Board noted that each Fund, except UBS Asset Growth Fund, UBS Equity Long-Short Multi-Strategy Fund, UBS Multi-Asset Income Fund and UBS Fixed Income Opportunities Fund, had a breakpoint schedule that provided for continuing breakpoints past the current asset level for the Fund. Based on each Fund's fees and expenses and the Advisor's profitability analysis, the Board concluded that any actual or potential economies of scale would be reasonably shared with a Fund and its shareholders.
After full consideration of the factors discussed above, with no single factor identified as being of paramount importance, the Board, including a majority of the Independent Trustees, with the assistance of independent counsel, concluded that the continuation of the Advisory Agreement for each Fund was in the best interests of the Fund and its shareholders.
111
The UBS Funds
Trustee and officer information (unaudited)
The Trust is a Delaware statutory trust. Under Delaware law, the Board has overall responsibility for managing the business and affairs of the Trust, including general supervision and review of its investment activities. The Trustees elect the Officers of the Trust, who are responsible for administering the day-to-day operations of the Trust and the Funds.
The table shows, for each Trustee and Officer, his or her name, address and age, the position held with the Trust, the length of time served as a Trustee or Officer of the Trust, the Trustee's or Officer's principal occupations during the last five years, the number of funds in the UBS Family of Funds overseen by the Trustee or Officer and other directorships held by such Trustee.
The Trust's Statement of Additional Information contains additional information about the Trustees and is available, without charge, upon request, by calling 1-800-647 1568.
Non-interested Trustees:
|
Name, address and age |
Position(s) held with Trust |
Term of office1 and length of time served |
Principal occupation(s) during past 5 years |
Number of portfolios in fund complex overseen by Trustee |
Other directorships held by Trustee |
||||||||||||||||||
|
Adela Cepeda; 57 A.C. Advisory, Inc. 150 North Wacker Drive Suite 2160 Chicago, Illinois 60606 |
Trustee |
Since 2004 |
Ms. Cepeda is founder and president of A.C. Advisory, Inc. (since 1995). |
Ms. Cepeda is a director or trustee of four investment companies (consisting of 31 portfolios) for which UBS Global AM serves as investment advisor or manager. |
Ms. Cepeda is a director (since 2012) of BMO Financial Corp. (U.S. holding company for BMO Harris Bank N.A.), director of the Mercer Funds (9 portfolios) (since 2005), trustee of the Morgan Stanley Smith Barney Consulting Group Capital Markets Funds (11 portfolios) (since 2008). Ms. Cepeda was a director of Amalgamated Bank of Chicago (since 2003 to 2012) and a director of the Municipal Securities Rulemaking Board (from 2012 to 2012). |
||||||||||||||||||
|
John J. Murphy; 71 268 Main Street P.O. Box 718 Gladstone, NJ 07934 |
Trustee |
Since 2009 |
Mr. Murphy is the president of Murphy Capital Management (investment advisor) (since 1983) |
Mr. Murphy is a director or trustee of four investment companies (consisting of 31 portfolios) for which UBS Global AM serves as investment advisor or manager. |
Mr. Murphy is a director (since 2007) of the Legg Mason Equity Funds (54 portfolios) and a trustee of Morgan Stanley Smith Barney Consulting Group Capital Markets Funds (11 portfolios). |
||||||||||||||||||
112
The UBS Funds
Trustee and officer information (unaudited)
Non-interested Trustees (continued):
|
Name, address and age |
Position(s) held with Trust |
Term of office1 and length of time served |
Principal occupation(s) during past 5 years |
Number of portfolios in fund complex overseen by Trustee |
Other directorships held by Trustee |
||||||||||||||||||
|
Abbie J. Smith; 62 University of Chicago Booth School of Business 5807 S. Woodlawn Avenue Chicago, IL 60637 |
Trustee |
Since 2009 |
Ms. Smith is Boris and Irene Stern Professor of Accounting in the University of Chicago Booth School of Business (since 1980). Formerly, Ms. Smith was a co-founding partner and Director of Research of Fundamental Investment Advisors, a hedge fund (co-founded in 2004, commenced operations in 2008) (from 2008 to 2010). |
Ms. Smith is a director or trustee of four investment companies (consisting of 31 portfolios) for which UBS Global AM serves as investment advisor or manager. |
Ms. Smith is a director (since 2000) of HNI Corporation and chair of the human resources and compensation committee (formerly known as HON Industries Inc.) (office furniture) and a director (since 2003) and chair of the audit committee of Ryder System Inc. (transportation, logistics and supply-chain management). In addition, Ms. Smith is a trustee/director (since 2000) and a member of the audit committee and portfolio performance committee of the Dimensional Funds complex (89 Portfolios). |
||||||||||||||||||
|
Frank K. Reilly; 79 Mendoza College of Business University of Notre Dame Notre Dame, IN 46556-5649 |
Chairman and Trustee |
Since 1992 |
Mr. Reilly is the Bernard J. Hank Professor of Finance in the Mendoza College of Business at the University of Notre Dame (since 1982). |
Mr. Reilly is a director or trustee of four investment companies (consisting of 31 portfolios) for which UBS Global AM serves as investment advisor or manager. |
Mr. Reilly is a director (since 1994) of Discover Bank, a subsidiary of Discover Financial Services and is Chairman of the Audit Committee for the bank. |
||||||||||||||||||
|
Edward M. Roob; 80 c/o UBS Global AM One North Wacker Drive Chicago, IL 60606 |
Trustee |
Since 1995 |
Mr. Roob is retired (since 1993). |
Mr. Roob is a director or trustee of four investment companies (consisting of 31 portfolios) for which UBS Global AM serves as investment advisor or manager. |
None. |
||||||||||||||||||
113
The UBS Funds
Trustee and officer information (unaudited)
Non-interested Trustees (continued):
|
Name, address and age |
Position(s) held with Trust |
Term of office1 and length of time served |
Principal occupation(s) during past 5 years |
Number of portfolios in fund complex overseen by Trustee |
Other directorships held by Trustee |
||||||||||||||||||
|
J. Mikesell Thomas; 64 c/o UBS Global AM One North Wacker Drive Chicago, IL 60606 |
Trustee |
Since 2004 |
Mr. Thomas is a principal with the investment firm Castle Creek Capital (since 2008) and President and sole shareholder of Mikesell Advisory Corp (since 2009). He is the former President and CEO of Federal Home Loan Bank of Chicago (from 2004 to 2008) and of First Chicago Bancorp (from 2008 to 2011). |
Mr. Thomas is a director or trustee of four investment companies (consisting of 31 portfolios) for which UBS Global AM serves as investment advisor or manager. |
Mr. Thomas is a director (since 1992) and chairman of the Audit Committee for NorthShore University HealthSystem, a not for profit healthcare organization, and a director (since 2012) and member of the Audit and Investment and Finance Committees of HCC Insurance Holdings Inc. Mr. Thomas was previously a director of First Chicago Bancorp (2008-2010) and First Chicago Bank & Trust (from 2008 to 2010). |
||||||||||||||||||
114
The UBS Funds
Trustee and officer information (unaudited)
Interested Trustee:
|
Name, address and age |
Position(s) held with Trust |
Term of office1 and length of time served |
Principal occupation(s) during past 5 years |
Number of portfolios in fund complex overseen by Trustee |
Other directorships held by Trustee |
||||||||||||||||||
|
E. Blake Moore, Jr.; 572* |
Interested Trustee |
Since June 2015 |
Mr. Moore is a Managing Director and Head of Americas at UBS Global Asset Management (Americas) Inc. (since March 2015). Mr. Moore is a member of the UBS Global Asset Management Executive Committee and UBS Americas Executive Committee. Prior to joining UBS Global Asset Management in March 2015, Mr. Moore was EVP Head of Distribution at Mackenzie Investments in Canada for over three years. Before this, Mr. Moore spent over six years at Allianz Global Investors in New York where he held a number of senior management roles. Most recently, he was Chief Executive Officer, Allianz Global Investors Fund Management. Prior to Allianz, Mr. Moore served as a member of the Executive Committee and Partner at Nicholas-Applegate Capital Management. |
Mr. Moore is a director or trustee of three investment companies (consisting of 30 portfolios) for which UBS Global AM serves as investment advisor or manager. |
None |
||||||||||||||||||
115
The UBS Funds
Trustee and officer information (unaudited)
Officers:
|
Name, address and age |
Position(s) held with Trust |
Term of office1 and length of time served |
Principal occupation(s) during past 5 years; number of portfolios in fund complex for which person serves as officer |
||||||||||||
|
Joseph J. Allessie*; 50 |
Vice President, Assistant Secretary and Chief Compliance Officer |
Since 2005 (Vice President and Assistant Secretary); since July 2014 (Chief Compliance Officer) |
Mr. Allessie is a managing director (since 2015) (prior to which he was an executive director) at UBS Global AM—Americas region. Mr. Allessie is head of compliance and operational risk control for the UBS Global Asset Management Division in the Americas with oversight for traditional and alternative investment businesses in Canada, the US and Cayman Islands. Prior to that he served as deputy general counsel (from 2005 to 2014). Mr. Allessie is a vice president, assistant secretary and chief compliance officer (prior to which he was interim chief compliance officer) (from January to July 2014) of 14 investment companies (consisting of 73 portfolios) for which UBS Global AM serves as investment advisor or manager. |
||||||||||||
|
Rose Ann Bubloski*; 47 |
Vice President and Assistant Treasurer |
Since 2011 |
Ms. Bubloski is a director (since 2012) (prior to which she was an associate director) (from 2008 to 2012) and senior manager of the US mutual fund treasury administration department of UBS Global AM—Americas region. She was a vice president and assistant treasurer of certain UBS funds (from 2004 to 2007). She is vice president and assistant treasurer of 14 investment companies (consisting of 73 portfolios) for which UBS Global AM serves as investment advisor or manager. |
||||||||||||
|
Mark E. Carver*; 51 |
President |
Since 2010 |
Mr. Carver is a managing director and head of product development and management—Americas for UBS Global AM—Americas region (since 2008). In this role, he oversees product development and management for both wholesale and institutional businesses. He is a member of the Americas Management Committee (since 2008) and the Regional Operating Committee (since 2008). Prior to 2008, Mr. Carver held a number of product-related or sales responsibilities with respect to funds, advisory programs and separately managed accounts. Mr. Carver is president of 14 investment companies (consisting of 73 portfolios) for which UBS Global AM serves as investment advisor or manager. |
||||||||||||
|
Thomas Disbrow*; 49 |
Vice President, Treasurer and Principal Accounting Officer |
Since 2004 and 2006, respectively |
Mr. Disbrow is a managing director (since 2011), (prior to which he was an executive director) (since 2007) and head of North Americas fund treasury (since 2011) of UBS Global AM—Americas region. Mr. Disbrow is a vice president and treasurer and/or principal accounting officer of 14 investment companies (consisting of 73 portfolios) for which UBS Global AM serves as investment advisor or manager. |
||||||||||||
|
Christopher S. Ha*; 35 |
Vice President and Assistant Secretary |
Since September 2012 |
Mr. Ha is a director and associate general counsel (since September 2012) at UBS Global AM—Americas region. Prior to joining UBS Global AM—Americas region, Mr. Ha was of counsel at Buhler, Duggal & Henry LLP (law firm) (from March 2012 to July 2012) and an associate attorney at Dechert LLP (law firm) (from 2007 to 2009). Mr. Ha is a vice president and assistant secretary of 14 investment companies (consisting of 73 portfolios) for which UBS Global AM serves as investment advisor or manager. |
||||||||||||
116
The UBS Funds
Trustee and officer information (unaudited)
Officers (continued):
|
Name, address and age |
Position(s) held with Trust |
Term of office1 and length of time served |
Principal occupation(s) during past 5 years; number of portfolios in fund complex for which person serves as officer |
||||||||||||
|
Mark F. Kemper**; 57 |
Vice President and Secretary |
Since 1999 |
Mr. Kemper is a managing director (since 2006) and head of the legal department of UBS Global AM—Americas region (since 2004). He has been secretary of UBS Global AM—Americas region (since 2004) and assistant secretary of UBS Global Asset Management Trust Company (since 1993). Mr. Kemper is vice president and secretary of 14 investment companies (consisting of 73 portfolios) for which UBS Global AM serves as investment advisor or manager. |
||||||||||||
|
Joanne M. Kilkeary*; 47 |
Vice President and Assistant Treasurer |
Since 2006 |
Ms. Kilkeary is an executive director (since March 2013) (prior to which she was a director) (since 2008) and a senior manager (since 2004) of the US mutual fund treasury administration department of UBS Global AM—Americas region. Ms. Kilkeary is a vice president and assistant treasurer of 14 investment companies (consisting of 73 portfolios) for which UBS Global AM serves as investment advisor or manager. |
||||||||||||
|
Cindy Lee*, 40 |
Vice President and Assistant Treasurer |
Since November 2014 |
Ms. Lee is an associate director (since 2009) prior to which she was a fund treasury manager (from 2007 to 2009) of the US mutual fund treasury administration department of UBS Global AM—Americas region. Ms. Lee is a vice president and assistant treasurer of 14 investment companies (consisting of 73 portfolios) for which UBS Global AM serves as investment advisor or manager. |
||||||||||||
|
Tammie Lee*; 44 |
Vice President and Assistant Secretary |
Since 2005 |
Ms. Lee is an executive director (since 2010) (prior to which she was a director) (since 2005) and associate general counsel of UBS Global AM—Americas region (since 2005). Ms. Lee is a vice president and assistant secretary of 14 investment companies (consisting of 73 portfolios) for which UBS Global AM serves as investment advisor or manager. |
||||||||||||
|
Nancy D. Osborn*; 49 |
Vice President and Assistant Treasurer |
Since 2007 |
Mrs. Osborn is a director (since 2010) (prior to which she was an associate director) and a senior manager of the US mutual fund treasury administration department of UBS Global AM—Americas region (since 2006). Mrs. Osborn is a vice president and assistant treasurer of 14 investment companies (consisting of 73 portfolios) for which UBS Global AM serves as investment advisor or manager. |
||||||||||||
|
Eric Sanders*; 49 |
Vice President and Assistant Secretary |
Since 2005 |
Mr. Sanders is a director and associate general counsel of UBS Global AM—Americas region (since 2005). Mr. Sanders is a vice president and assistant secretary of 14 investment companies (consisting of 73 portfolios) for which UBS Global AM serves as investment advisor or manager. |
||||||||||||
|
Andrew Shoup*; 59 |
Vice President and Chief Operating Officer |
Since 2006 |
Mr. Shoup is a managing director and global head of the fund treasury administration department of UBS Global AM—Americas region (since 2006). Mr. Shoup is also a director of UBS (IRL) Fund p.l.c. (since 2008). Mr. Shoup is a vice president and chief operating officer of 14 investment companies (consisting of 73 portfolios) for which UBS Global AM serves as investment advisor or manager. |
||||||||||||
117
The UBS Funds
Trustee and officer information (unaudited)
Officers (continued):
|
Name, address and age |
Position(s) held with Trust |
Term of office1 and length of time served |
Principal occupation(s) during past 5 years; number of portfolios in fund complex for which person serves as officer |
||||||||||||
|
Keith A. Weller*; 54 |
Vice President and Assistant Secretary |
Since 2004 |
Mr. Weller is an executive director and senior associate general counsel of UBS Global AM—Americas region (since 2005). Mr. Weller is a vice president and assistant secretary of 14 investment companies (consisting of 73 portfolios) for which UBS Global AM serves as investment advisor or manager. |
||||||||||||
|
Mandy Yu*; 31 |
Vice President |
Since March 2013 |
Ms. Yu is an authorized officer (since 2012) and tax compliance manager (since 2013) of the US mutual fund treasury administration department of UBS Global AM—Americas region. She was a Fund Treasury Manager (from 2012 to 2013) and a Mutual Fund Administrator (from 2007 to 2012) for UBS Global AM—Americas region. Ms. Yu is a vice president of 14 investment companies (consisting of 73 portfolios) for which UBS Global AM serves as investment advisor or manager. |
||||||||||||
1 Each Trustee holds office for an indefinite term. Officers of the Trust are appointed by the Trustees and serve at the pleasure of the Board.
2 Mr. Moore is considered to be an interested person of the Trust under the federal securities laws due to his position as an officer of UBS Global AM.
* This person's business address is 1285 Avenue of the Americas, New York, NY 10019-6028
** This person's business address is One North Wacker Drive, Chicago, IL 60606.
118
The UBS Funds
Federal tax information (unaudited)
For the year ended June 30, 2015, the amounts expected to be passed through to shareholders as foreign tax credits are approximated as follows:
| Fund |
Foreign tax credit |
||||||
|
UBS Multi-Asset Income Fund |
$ |
8,429 |
|||||
For the year ended June 30, 2015, the percentage of income earned from direct US Treasury obligations approximately amounted to the following:
|
Fund |
Direct US Treasury obligations |
||||||
|
UBS Asset Growth Fund |
0.65 |
% |
|||||
|
UBS Global Allocation Fund |
9.16 |
||||||
|
UBS Multi-Asset Income Fund |
7.36 |
||||||
Shareholders should not use the above information to prepare their tax returns. Since the Funds fiscal year end is not the calendar year end, another notification will be sent with respect to calendar year 2015. Such notification, which will reflect the amount to be used by calendar year taxpayers on their federal income tax returns, will be made in conjunction with Form 1099 DIV and will be mailed in February 2016. Shareholders are advised to consult their own tax advisers with respect to the tax consequences of their investment in each of the Funds.
119
The UBS Funds
Fund's privacy notice
This notice describes the privacy policy of the UBS Family of Funds, the PACE Funds and all closed-end funds managed by UBS Global Asset Management (collectively, the "Funds"). The Funds are committed to protecting the personal information that they collect about individuals who are prospective, current or former investors.
The Funds collect personal information in order to process requests and transactions and to provide customer service. Personal information, which is obtained from applications and other forms or correspondence submitted to the Funds, may include name(s), address, e-mail address, telephone number, date of birth, social security number or other tax identification number, bank account information, information about your transactions and experiences with the Funds, and any affiliation a client has with UBS Financial Services Inc. or its affiliates ("Personal Information").
The Funds limit access to Personal Information to those individuals who need to know that information in order to process transactions and service accounts. These individuals are required to maintain and protect the confidentiality of Personal Information and to follow established procedures. The Funds maintain physical, electronic and procedural safeguards to protect Personal Information and to comply with applicable laws and regulations.
The Funds may share Personal Information with their affiliates to facilitate the servicing of accounts and for other business purposes, or as otherwise required or permitted by applicable law. The Funds may also share Personal Information with non-affiliated third parties that perform services for the Funds, such as vendors that provide data or transaction processing, computer software maintenance and development, and other administrative services. When the Funds share Personal Information with a non-affiliated third party, they will do so pursuant to a contract that includes provisions designed to ensure that the third party will uphold and maintain privacy standards when handling Personal Information. In addition to sharing information with non-affiliated third parties to facilitate the servicing of accounts and for other business purposes, the Funds may disclose Personal Information to non-affiliated third parties as otherwise required or permitted by applicable law. For example, the Funds may disclose Personal Information to credit bureaus or regulatory authorities to facilitate or comply with investigations; to protect against or prevent actual or potential fraud, unauthorized transactions, claims or other liabilities; or to respond to judicial or legal process, such as subpoena requests.
Except as described in this privacy notice, the Funds will not use Personal Information for any other purpose unless the Funds describe how such Personal Information will be used and clients are given an opportunity to decline approval of such use of Personal Information relating to them (or affirmatively approve the use of Personal Information, if required by applicable law). The Funds endeavor to keep their customer files complete and accurate. The Funds should be notified if any Personal Information needs to be corrected or updated. Please call 1-800-647 1568 with any questions or concerns regarding your Personal Information or this privacy notice.
Privacy Notice
This privacy notice is not a part of the shareholder report.
This page intentionally left blank.
This page intentionally left blank.
PRESORTED
STANDARD
U.S. POSTAGE
PAID
COMPUTERSHARE

UBS Global Asset Management (Americas) Inc.
1285 Avenue of the Americas
New York, NY 10019
S1196

UBS Equity
Funds
June 30, 2015
The UBS Funds—Equities
Annual Report
|
Table of contents |
|||||||
|
President's letter |
1 |
||||||
|
Market commentary |
3 | ||||||
|
Equity Funds |
|||||||
|
UBS Equity Long-Short Multi-Strategy Fund |
4 | ||||||
|
UBS Global Sustainable Equity Fund |
24 | ||||||
|
UBS U.S. Defensive Equity Fund |
32 | ||||||
|
UBS U.S. Equity Opportunity Fund |
45 | ||||||
|
UBS U.S. Large Cap Equity Fund |
53 | ||||||
|
UBS U.S. Small Cap Growth Fund |
62 | ||||||
|
Explanation of expense disclosure |
72 | ||||||
|
Statement of assets and liabilities |
76 | ||||||
|
Statement of operations |
80 | ||||||
|
Statement of changes in net assets |
82 | ||||||
|
Statement of cash flows |
86 | ||||||
|
Financial highlights |
88 | ||||||
|
Notes to financial statements |
100 | ||||||
|
Report of independent registered public accounting firm |
120 | ||||||
|
General information |
121 | ||||||
|
Board approval of investment advisory agreements |
122 | ||||||
|
Trustee and officer information |
126 | ||||||
|
Federal tax information |
133 | ||||||
This page intentionally left blank.
President's letter
August 14, 2015
Dear Shareholder,
In my last letter, I wrote about the building forward momentum of the US economy against a backdrop of economic weakness outside the United States. Since I last wrote to you, the rise of two economic themes has begun to cast a shadow on the global growth story. The first of these, the continuing Greek debt crisis, appears to be on the road to resolution after an agreement was reached in July between the Greek government and its creditors. Although the risk of Greece's exit from the eurozone is somewhat reduced, substantial political and economic challenges remain. While the news of an agreement has brought relief to global markets, it is disconcerting to consider that the future of the European project has not been in such peril since the introduction of the euro in 1999.
Turning to a development that is decidedly less settled, Chinese equity markets have seen some spectacular declines in recent months, raising questions about the durability of the world's second-largest economy. The Shanghai composite index hit a high of 5,166 on June 12, before falling 30% in just three weeks. Taken together, over $3 trillion of value has been wiped away from the Shanghai and Shenzhen exchanges in a matter of weeks. China's economy grew at its slowest pace since 1990 last year, and early indicators suggest that the economy has weakened further so far into 2015. While investor confidence in China has been understandably shaken, it remains to be seen what effect these headwinds may have outside of the country.
In this global investment landscape of debt crises and shaken confidence, partnering with a knowledgeable asset manager, such as UBS Global Asset Management, can help investors avoid potential pitfalls on the path to reaching their long-term financial goals. As we continue to review the UBS family of funds with an eye toward an ever-changing investment landscape, we remain committed to providing a diverse range of solutions that can be used to create a comprehensive investment plan. Core funds—such as UBS US Large Cap Equity Fund—are the foundation on which many investors build their portfolios. Driven by fundamental research and long-term perspective, these funds used disciplined approaches that time and experience have shown can lead to successful outcomes, despite shorter-term market fluctuations and shocks.
Furthermore, we believe that flexible investment solutions can strengthen an investment plan against market shocks and declines. In this spirit, UBS Global Asset Management provides flexibly managed funds to help create well-balanced, globally diversified portfolios. In our view, flexible funds that may be less correlated to market trends and have multiple sources of revenue are an important component of a comprehensive investment plan. Many of the funds in the UBS family—such as UBS Dynamic Alpha Fund—are designed to achieve consistent returns with less reliance on favorable market conditions. When included in a comprehensive investment plan, these funds act as ballast during volatile market conditions and may have the effect of smoothing a portfolio's performance over time. As we have seen in the first half of 2015, market shocks can take any number of forms and can originate in any corner of the world. In today's market environment, we believe it is crucial that investors diversify their holdings within the context of a carefully considered plan. When combined in the context of such a plan, UBS Global Asset Management's foundational and flexible funds can assist investors in obtaining peace of mind while looking toward the future.
1
President's letter
In my correspondence over the years, I have written at considerable length about the importance of having a sound investment plan. Creating an investment plan with a knowledgeable financial advisor is an opportunity to envision the future that you would like to have, while being cognizant of the potential challenges that lie ahead. At UBS Global Asset Management, we believe that in managing our funds we create more than investment returns: we help our clients achieve their goals. As we continue to evolve our funds to provide stable returns in a variety of market conditions, we rely on our firm's client-oriented culture to guide everything we do. With over 30 years of experience in active investment management, UBS Global Asset Management is ready to serve you with our family of funds and knowledgeable professionals as we look toward the future, a future we create together.
Sincerely,

Mark E. Carver
President
The UBS Funds
Managing Director
UBS Global Asset Management (Americas) Inc.
Mutual funds are sold by prospectus only. You should read it carefully and consider a fund's investment objectives, risks, charges, expenses and other important information contained in the prospectus before investing. A prospectus or summary prospectus for the funds can be obtained from your financial advisor, by calling UBS Funds at 800-647 1568 or by visiting our Web site at www.ubs.com.
2
The markets in review
Global growth generally improves
Growth in the US fluctuated during the reporting period. The US Commerce Department reported that gross domestic product ("GDP") expanded at a 4.3% seasonally adjusted annualized rate during the third quarter of 2014. GDP growth then moderated to 2.1% during the fourth quarter and 0.6% for the first quarter of 2015, partially due to severe winter weather in parts of the country. However, the economy then improved, as the Commerce Department's initial estimate for second quarter GDP was 2.3%.1
The US Federal Reserve Board largely maintained its accommodative monetary policy during the reporting period. The central bank continued to hold the fed funds rate at a historically low range between 0% and 0.25%. (The federal funds rate or the "fed funds rate," is the rate banks charge one another for funds they borrow on an overnight basis.) However, at the Fed's meeting in October 2014, it said that it had concluded its asset purchase program, also known as quantitative easing. At its March 2015 meeting, the Fed said that it "... anticipates that it will be appropriate to raise the target range for the federal funds rate when it has seen further improvement in the labor market and is reasonably confident that inflation will move back to its 2% objective over the medium term." Finally, at the central bank's meeting that concluded in June 2015, the Fed said that it "...currently anticipates that, even after employment and inflation are near mandate-consistent levels, economic conditions may, for some time, warrant keeping the target federal funds rate below levels the Committee views as normal in the longer run."
In terms of the global economy, the International Monetary Fund's ("IMF") July 2015 World Economic Outlook Update, released after the reporting period ended, said "A setback to activity in the first quarter of 2015, mostly in North America, has resulted in a small downward revision to global growth for 2015 relative to the April 2015 World Economic Outlook. Nevertheless, the underlying drivers for a gradual acceleration in economic activity in advanced economies—easy financial conditions, more neutral fiscal policy in the euro area, lower fuel prices, and improving confidence and labor market conditions—remain intact." The IMF projects that 2015 growth in the eurozone will be 1.5%, versus 0.8% in 2014. Japan's economy is expected to expand 0.8% in 2015, an improvement from the 0.1% contraction in 2014. In contrast, the IMF sees growth in emerging market countries decelerating in 2015, with GDP of 4.2% compared to 4.6% in 2014.
US equities post superior results
While it experienced several setbacks, the US equity market generated solid results during the reporting period. Investor sentiment was challenged at times given some mixed global economic data and corporate profit figures, as well as numerous geopolitical issues. All told, the US stock market, as measured by the S&P 500 Index,2 gained 7.42% for the 12 months ended June 30, 2015. In contrast, international equities produced weak results, as they were dragged down by growth concerns, fluctuating oil prices and, most recently, the escalating crisis in Greece. International developed equities, as measured by the MSCI EAFE Index (net),3 fell 4.22% during the period. Emerging market equities, as measured by the MSCI Emerging Markets Index (net),4 declined 5.12% over the same period.
1 Based on the Commerce Department's initial estimate announced on July 30, 2015, after the reporting period had ended.
2 The S&P 500 Index is an unmanaged, weighted index composed of 500 widely held common stocks varying in composition and is not available for direct investment. Investors should note that indices do not reflect the deduction of fees and expenses.
3 The MSCI EAFE Index (net) is an index of stocks designed to measure the investment returns of developed economies outside of North America. Net total return indices reinvest dividends after the deduction of withholding taxes, using a tax rate applicable to non-resident institutional investors who do not benefit from double taxation treaties. The index is constructed and managed with a view to being fully investable from the perspective of international institutional investors. Investors should note that indices do not reflect the deduction of fees and expenses.
4 The MSCI Emerging Markets Index (net) is a market capitalization-weighted index composed of different emerging market countries in Europe, Latin America, and the Pacific Basin. Net total return indices reinvest dividends after the deduction of withholding taxes, using a tax rate applicable to non-resident institutional investors who do not benefit from double taxation treaties. The index is constructed and managed with a view to being fully investable from the perspective of international institutional investors. Investors should note that indices do not reflect the deduction of fees and expenses.
3
UBS Equity Long-Short Multi-Strategy Fund
Portfolio performance
For the 12 months ended June 30, 2015, Class A shares of UBS Equity Long-Short Multi-Strategy Fund (the "Fund") gained 8.46% (Class A shares gained 2.53% after the deduction of the maximum sales charge), while Class P shares gained 8.76%. The Fund's benchmark, the Citigroup Three-Month US Treasury Bill Index (the "Index"), returned 0.02% over the same time period. (Class P shares have lower expenses than other share classes of the Fund. Returns for all share classes over various time periods are shown on page 7; please note that the Fund's returns do not reflect the deduction of taxes that a shareholder would pay on Fund distributions or the redemption of Fund shares, while the Index returns do not reflect the deduction of fees and expenses.)
The Fund generated a positive return and outperformed the Index during the 12 months ended June 30, 2015. The Fund invested in three distinct investment "sleeves" during the reporting period: US fundamental long-short, global equity opportunity long-short and global equity long-short. All three sleeves contributed to the Fund's performance during the reporting period.
During the 12-month period, the sleeves in which the Fund invests used derivative instruments for efficient portfolio and risk management purposes. Currency forwards were used to hedge the Fund's currency exposure. Swaps were used on individual stocks to gain exposure to shares in a more efficient manner. The use of these derivatives was successful in helping manage both the portfolio and risk within the sleeves.
Portfolio performance summary1
What worked
• Overall, the US fundamental long-short sleeve contributed to performance during the reporting period.
– At the stock level, the sleeve had strong contributions from its long position in Chimerix, a biopharmaceutical company that develops antiviral therapeutics; Freescale Semiconductor, a producer of embedded processing semiconductors and related solutions; and Hospira, a pharmaceutical and medication delivery company. Hospira was up strongly in early February following a take-over bid by Pfizer. The Fund no longer holds Freescale Semiconductor and Hospira.
– The sectors within the sleeve that added the most value were health care, information technology and consumer discretionary.
• In aggregate, the global equity opportunity long-short sleeve was beneficial for performance.
– The sleeve's long positions in HCA, Aetna and Anthem added the most value during the reporting period. HCA operates hospitals in the US and the UK, while Aetna and Anthem are providers of health care benefits.
– The best performing sectors within the sleeve were health care, industrials, energy and consumer discretionary.
– From a country perspective, the sleeve's allocations to the US, UK, Finland, France and Canada were the most beneficial during the reporting period.
1 For a detailed commentary on the market environment in general during the reporting period, see page 3.
4
UBS Equity Long-Short Multi-Strategy Fund
• Overall, the global equity long-short sleeve was beneficial for performance.
– The sleeve's short positions in energy companies Pacific Rubiales Energy, a firm that explores, develops and produces oil, and Athabasca Oil Corp., a developer of oil sands in Canada, added the most value. A former long position in Frontline, an owner of a fleet of large crude carriers, contributed to results as well.
– The best performing sectors within the sleeve were energy, industrials and health care.
– From a country perspective, the sleeve's allocations to the US, Norway, Italy and the UK were the most beneficial during the reporting period.
What didn't work
• Certain strategies in the US fundamental long-short sleeve detracted from performance.
– The sleeve's long positions in Micron, a producer of semiconductor devices, and Hertz, an operator of car and equipment rental centers, detracted from performance. A short position in Electronic Arts, a developer and distributor of branded interactive entertainment software, was negative for results as well.
– The sleeve's allocation to the energy and industrials sectors detracted from performance during the reporting period.
• Several positions in the global equity opportunity long-short sleeve dragged on performance.
– The sleeve's long positions in Acciona, a developer of renewable energy, civil infrastructure, water treatment and desalination; BG Group, an integrated natural gas company; and Royal Dutch Shell, an oil company, were the largest individual detractors from results. We no longer hold Royal Dutch Shell.
– Allocations to the telecommunication services and utilities sectors were negative for performance.
– In terms of countries, the sleeve's allocations to Spain and Japan were the largest detractors from results.
• Certain positions in the global long-short sleeve detracted from performance.
– The sleeve's long positions in several energy-related companies—such as Lightstream Resources, a light oil exploration and production firm; Paramount Resources, a firm that explores and develops oil and natural gas; and independent natural gas producer Perpetual Energy—detracted from performance over the reporting period. The position in Lightstream Resources was sold before the end of the reporting period.
– The sleeve's allocation to the information technology and materials sectors detracted from performance during the reporting period.
– In terms of countries, the sleeve's allocations to Turkey, France and Japan were the largest detractors.
5
UBS Equity Long-Short Multi-Strategy Fund
This letter is intended to assist shareholders in understanding how the Fund performed during the 12 months ended June 30, 2015. The views and opinions in the letter were current as of August 14, 2015. They are not guarantees of future performance or investment results and should not be taken as investment advice. Investment decisions reflect a variety of factors, and we reserve the right to change our views about individual securities, sectors and markets at any time. As a result, the views expressed should not be relied upon as a forecast of the Fund's future investment intent. We encourage you to consult your financial advisor regarding your personal investment program.
Mutual funds are sold by prospectus only. You should read it carefully and consider a fund's investment objectives, risks, charges, expenses and other important information contained in the prospectus before investing. Prospectuses for most of our funds can be obtained from your financial advisor, by calling UBS Funds at 800-647 1568 or by visiting our Web site at www.ubs.com.
6
UBS Equity Long-Short Multi-Strategy Fund
Average annual total returns for periods ended 06/30/15 (unaudited)
|
1 year |
5 years |
Inception1 |
|||||||||||||
|
Before deducting maximum sales charge |
|||||||||||||||
|
Class A2 |
8.46 |
% |
2.39 |
% |
2.39 |
% |
|||||||||
|
Class C3 |
7.61 |
1.63 |
1.63 |
||||||||||||
|
Class P4 |
8.76 |
2.66 |
2.66 |
||||||||||||
|
After deducting maximum sales charge |
|||||||||||||||
|
Class A2 |
2.53 |
% |
1.24 |
% |
1.24 |
% |
|||||||||
|
Class C3 |
6.61 |
1.63 |
1.63 |
||||||||||||
|
Citigroup Three-Month US Treasury Bill Index5 |
0.02 |
% |
0.06 |
% |
0.06 |
% |
|||||||||
The annualized gross and net expense ratios, respectively, for each class of shares as in the October 28, 2014 prospectuses were as follows: Class A—6.31% and 4.07%; Class C—6.46% and 4.87%; Class P—5.48% and 3.89%. Net expenses reflect fee waivers and/or expense reimbursements, if any, pursuant to an agreement that is in effect to cap the expenses. The Trust, with respect to the Fund, and UBS Global Asset Management (Americas) Inc., the Fund's investment advisor ("UBS Global AM (Americas)" or the "Advisor"), have entered into a written agreement pursuant to which the Advisor has agreed to waive a portion of its management fees and/or to reimburse expenses (excluding expenses incurred through investment in other investment companies, interest, taxes, brokerage commissions, extraordinary expenses, and dividend expense and security loan fees for securities sold short) to the extent necessary so that the Fund's ordinary operating expenses (excluding expenses incurred through investment in other investment companies, interest, taxes, brokerage commissions, extraordinary expenses, and dividend expense and security loan fees for securities sold short), through the period ending October 27, 2015, do not exceed 1.75% for Class A shares, 2.50% for Class C shares and 1.50% for Class P shares. Pursuant to the written agreement, the Advisor is entitled to be reimbursed for any fees it waives and expenses it reimburses for a period of three years following such fee waivers and expense reimbursements to the extent that such reimbursement of the Advisor by the Fund will not cause the Fund to exceed any applicable expense limit that is in place for the Fund. The fee waiver/expense reimbursement agreement may be terminated by the Fund's Board of Trustees at any time and also will terminate automatically upon the expiration or termination of the Fund's advisory contract with the Advisor. Upon termination of the fee waiver/expense reimbursement agreement, however, UBS Global AM (Americas)'s three year recoupment rights will survive.
1 Inception date of all shares of UBS Equity Long-Short Multi-Strategy Fund and the index is June 30, 2010.
2 Maximum sales charge for Class A shares is 5.5%. Class A shares bear ongoing 12b-1 service fees.
3 Maximum contingent deferred sales charge for Class C shares is 1% imposed on redemptions and is reduced to 0% after one year. Class C shares bear ongoing 12b-1 distribution and service fees.
4 Class P shares do not bear initial or contingent deferred sales charges or ongoing 12b-1 service and distribution fees, but Class P shares held through advisory programs may be subject to a program fee, which, if included, would have reduced performance.
5 The Citigroup Three-Month US Treasury Bill Index is an unmanaged index reflecting monthly return equivalents of yield averages that are not marked to the market and an average of the last three 3-month T-bill month-end rates. 3-month T-bills are the short-term debt obligations of the US government. Investors should note that indices do not reflect the deduction of fees and expenses.
Prior to February 17, 2015, if an investor sold or exchanged shares less than 90 days after purchase, a redemption fee of 1.00% of the amount sold or exchanged was deducted at the time of the transaction, except as noted otherwise in the prospectus. For sales or exchanges taking place on or after February 17, 2015 but prior to August 3, 2015, there is a reduction in the redemption holding period from 90 days to 30 days. Effective August 3, 2015, the 1.00% redemption fee imposed on sales or exchanges of any class of shares of the funds made during the holding periods specified in the prospectus will be eliminated. Please refer to the prospectus for further information.
Past performance does not predict future performance, and the performance information provided does not reflect the deduction of taxes that a shareholder would pay on Fund distributions or the redemption of Fund shares. The return and principal value of an investment will fluctuate, so that an investor's shares, when redeemed, may be worth more or less than their original cost. Performance results assume reinvestment of all dividends and capital gain distributions at net asset value on the ex-dividend dates. Current performance may be higher or lower than the performance data quoted. For month-end performance figures, please visit http://globalam-us.ubs.com/corpweb/performance.do.
7
UBS Equity Long-Short Multi-Strategy Fund
Illustration of an assumed investment of $10,000 in Class A shares (adjusted for 5.5% maximum sales charge) and $5,000,000 in Class P shares (unaudited)
The following two graphs depict the performance of UBS Equity Long-Short Multi-Strategy Fund Class A and Class P shares versus the Citigroup Three-Month US Treasury Bill Index from June 30, 2010, which is the inception date of the two classes, through June 30, 2015. The performance of Class C shares will vary based upon the different class specific expenses and sales charges. The performance provided does not reflect the deduction of taxes that a shareholder would pay on Fund distributions or the redemption of Fund shares. Past performance is no guarantee of future results. Share price and returns will vary with market conditions; investors may realize a gain or loss upon redemption.
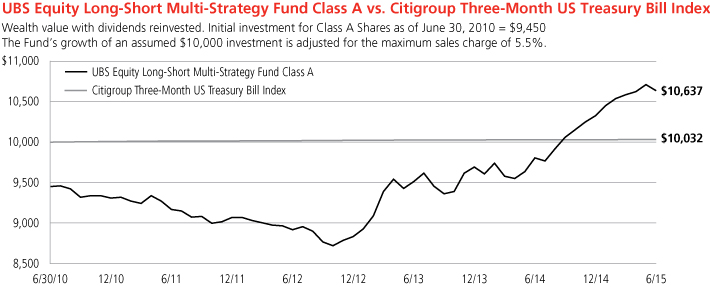
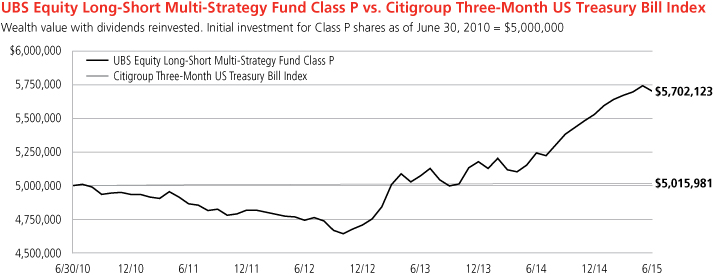
Past performance does not predict future performance, and the performance information provided does not reflect the deduction of taxes that a shareholder would pay on Fund distributions or the redemption of Fund shares. The return and principal value of an investment will fluctuate, so that an investor's shares, when redeemed, may be worth more or less than their original cost. Performance results assume reinvestment of all dividends and capital gain distributions at net asset value on the ex-dividend dates. Current performance may be higher or lower than the performance data quoted. For month-end performance figures, please visit http://globalam-us.ubs.com/corpweb/performance.do.
8
UBS Equity Long-Short Multi-Strategy Fund
Top ten equity holdings (unaudited)1
As of June 30, 2015
|
Percentage of net assets |
|||||||
|
Allergan PLC |
1.6 |
% |
|||||
|
Check Point Software Technologies Ltd. |
1.4 |
||||||
|
Novartis AG |
1.1 |
||||||
|
HCA Holdings, Inc. |
1.1 |
||||||
|
Chimerix, Inc. |
1.0 |
||||||
|
Celgene Corp. |
0.9 |
||||||
|
Philip Morris International, Inc. |
0.9 |
||||||
|
UnitedHealth Group, Inc. |
0.9 |
||||||
|
Citigroup, Inc. |
0.9 |
||||||
|
US Bancorp |
0.9 |
||||||
|
Total |
10.7 |
% |
|||||
1 Only long positions are considered for top ten holdings.
9
UBS Equity Long-Short Multi-Strategy Fund
Industry diversification (unaudited)
As a percentage of net assets as of June 30, 2015
|
Common stocks |
|||||||
|
Aerospace & defense |
0.72 |
% |
|||||
|
Air freight & logistics |
0.20 |
||||||
|
Airlines |
0.76 |
||||||
|
Auto components |
1.24 |
||||||
|
Automobiles |
0.98 |
||||||
|
Banks |
6.05 |
||||||
|
Beverages |
1.09 |
||||||
|
Biotechnology |
5.21 |
||||||
|
Building products |
0.47 |
||||||
|
Capital markets |
1.25 |
||||||
|
Chemicals |
1.74 |
||||||
|
Communications equipment |
0.39 |
||||||
|
Construction & engineering |
0.31 |
||||||
|
Construction materials |
0.36 |
||||||
|
Consumer finance |
1.34 |
||||||
|
Containers & packaging |
0.34 |
||||||
|
Diversified financial services |
0.34 |
||||||
|
Diversified telecommunication services |
0.67 |
||||||
|
Electric utilities |
0.68 |
||||||
|
Electrical equipment |
0.17 |
||||||
|
Electronic equipment, instruments & components |
1.98 |
||||||
|
Energy equipment & services |
0.82 |
||||||
|
Food & staples retailing |
1.14 |
||||||
|
Food products |
2.18 |
||||||
|
Gas utilities |
0.26 |
||||||
|
Health care equipment & supplies |
0.95 |
||||||
|
Health care providers & services |
4.60 |
||||||
|
Hotels, restaurants & leisure |
1.58 |
||||||
|
Household durables |
1.75 |
||||||
|
Household products |
0.53 |
||||||
|
Industrial conglomerates |
0.74 |
||||||
|
Insurance |
4.15 |
||||||
|
Internet & catalog retail |
0.86 |
||||||
|
Internet software & services |
1.88 |
||||||
|
IT services |
3.27 |
||||||
|
Life sciences tools & services |
1.05 |
||||||
|
Machinery |
1.87 |
||||||
|
Marine |
0.26 |
||||||
|
Media |
2.75 |
||||||
|
Metals & mining |
0.52 |
||||||
|
Multiline retail |
0.11 |
||||||
|
Multi-utilities |
0.12 |
||||||
|
Oil, gas & consumable fuels |
6.53 |
||||||
|
Paper & forest products |
0.36 |
||||||
|
Pharmaceuticals |
6.43 |
||||||
|
Professional services |
0.42 |
||||||
|
Real estate investment trust (REIT) |
1.16 |
||||||
|
Real estate management & development |
1.04 |
||||||
|
Road & rail |
0.99 |
||||||
|
Semiconductors & semiconductor equipment |
4.24 |
||||||
|
Software |
2.48 |
||||||
|
Specialty retail |
0.75 |
||||||
|
Technology hardware, storage & peripherals |
2.51 |
||||||
|
Textiles, apparel & luxury goods |
0.28 |
||||||
|
Tobacco |
0.93 |
||||||
|
Trading companies & distributors |
0.52 |
||||||
|
Transportation infrastructure |
0.61 |
||||||
|
Wireless telecommunication services |
0.98 |
||||||
|
Total common stocks |
87.91 |
% |
|||||
|
Preferred stocks |
0.58 |
||||||
|
Short-term investment |
23.97 |
||||||
|
Total investments before investments sold short |
112.46 |
% |
|||||
|
Investments sold short |
|||||||
|
Common stocks |
|||||||
|
Aerospace & defense |
(0.55 |
)% |
|||||
|
Airlines |
(0.16 |
) |
|||||
|
Automobiles |
(0.61 |
) |
|||||
|
Banks |
(2.75 |
) |
|||||
|
Beverages |
(1.23 |
) |
|||||
|
Biotechnology |
(2.21 |
) |
|||||
|
Capital markets |
(2.27 |
) |
|||||
|
Chemicals |
(1.12 |
) |
|||||
|
Commercial services & supplies |
(1.00 |
) |
|||||
|
Communications equipment |
(1.01 |
) |
|||||
|
Construction & engineering |
(1.44 |
) |
|||||
|
Construction materials |
(0.61 |
) |
|||||
|
Distributors |
(0.25 |
) |
|||||
|
Diversified consumer services |
(0.07 |
) |
|||||
|
Diversified financial services |
(0.28 |
) |
|||||
|
Diversified telecommunication services |
(1.37 |
) |
|||||
|
Electric utilities |
(0.87 |
) |
|||||
|
Electrical equipment |
(0.97 |
) |
|||||
|
Electronic equipment, instruments & components |
(0.88 |
) |
|||||
|
Energy equipment & services |
(4.12 |
) |
|||||
|
Food & staples retailing |
(1.37 |
) |
|||||
|
Food products |
(1.09 |
) |
|||||
|
Gas utilities |
(0.10 |
) |
|||||
|
Health care equipment & supplies |
(2.44 |
) |
|||||
|
Health care providers & services |
(0.90 |
) |
|||||
|
Hotels, restaurants & leisure |
(1.22 |
) |
|||||
|
Household durables |
(0.87 |
) |
|||||
|
Household products |
(0.27 |
) |
|||||
|
Independent power and renewable electricity producers |
(0.34 |
) |
|||||
|
Industrial conglomerates |
(0.05 |
) |
|||||
|
Insurance |
(2.68 |
) |
|||||
|
Internet software & services |
(0.93 |
) |
|||||
|
IT services |
(0.95 |
) |
|||||
|
Life sciences tools & services |
(1.19 |
) |
|||||
|
Machinery |
(3.02 |
) |
|||||
|
Marine |
(0.53 |
) |
|||||
|
Media |
(0.94 |
) |
|||||
|
Metals & mining |
(1.39 |
) |
|||||
|
Multiline retail |
(0.27 |
) |
|||||
|
Multi-utilities |
(1.19 |
) |
|||||
|
Oil, gas & consumable fuels |
(4.81 |
) |
|||||
|
Pharmaceuticals |
(1.40 |
) |
|||||
|
Real estate investment trust (REIT) |
(0.50 |
) |
|||||
|
Road & rail |
(0.13 |
) |
|||||
|
Semiconductors & semiconductor equipment |
(2.37 |
) |
|||||
|
Software |
(1.75 |
) |
|||||
|
Specialty retail |
(1.28 |
) |
|||||
|
Technology hardware, storage & peripherals |
(0.77 |
) |
|||||
|
Textiles, apparel & luxury goods |
(1.06 |
) |
|||||
|
Thrifts & mortgage finance |
(0.56 |
) |
|||||
|
Trading companies & distributors |
(0.04 |
) |
|||||
|
Transportation infrastructure |
(0.48 |
) |
|||||
|
Wireless telecommunication services |
(0.66 |
) |
|||||
|
Total common stocks |
(61.32 |
)% |
|||||
|
Preferred stock |
(0.07 |
) |
|||||
|
Rights |
(0.01 |
) |
|||||
|
Total investments sold short |
(61.40 |
)% |
|||||
|
Total investments, net of investments sold short |
51.06 |
||||||
|
Cash and other assets, less liabilities |
48.94 |
||||||
|
Net assets |
100.00 |
% |
|||||
10
UBS Equity Long-Short Multi-Strategy Fund
Portfolio of investments
June 30, 2015
|
Shares |
Value |
||||||||||
|
Common stocks: 87.91% |
|||||||||||
|
Belgium: 0.54% |
|||||||||||
|
bpost SA |
1,265 |
$ |
34,750 |
||||||||
|
Telenet Group Holding NV* |
1,081 |
58,799 |
|||||||||
|
Total Belgium common stocks |
93,549 |
||||||||||
|
Brazil: 0.30% |
|||||||||||
|
Cielo SA |
1,668 |
23,509 |
|||||||||
|
QGEP Participacoes SA |
12,800 |
27,872 |
|||||||||
|
Total Brazil common stocks |
51,381 |
||||||||||
|
Canada: 4.10% |
|||||||||||
|
Canadian Oil Sands Ltd. |
11,544 |
93,350 |
|||||||||
|
Enerplus Corp. |
2,350 |
20,621 |
|||||||||
|
Gran Tierra Energy, Inc.* |
24,430 |
73,153 |
|||||||||
|
Kelt Exploration Ltd.* |
5,260 |
35,544 |
|||||||||
|
MEG Energy Corp.* |
4,545 |
74,234 |
|||||||||
|
Paramount Resources Ltd., Class A* |
4,187 |
96,211 |
|||||||||
|
Perpetual Energy, Inc.* |
133,508 |
104,754 |
|||||||||
|
ShaMaran Petroleum Corp.* |
65,000 |
4,424 |
|||||||||
|
Suncor Energy, Inc. |
975 |
26,853 |
|||||||||
|
Teck Resources Ltd., Class B |
3,700 |
36,674 |
|||||||||
|
Toronto-Dominion Bank |
1,100 |
46,713 |
|||||||||
|
TransGlobe Energy Corp.1 |
20,585 |
82,134 |
|||||||||
|
Trilogy Energy Corp. |
3,545 |
16,036 |
|||||||||
|
Total Canada common stocks |
710,701 |
||||||||||
|
Chile: 0.17% |
|||||||||||
|
Geopark Ltd.1 |
6,100 |
28,792 |
|||||||||
|
China: 1.80% |
|||||||||||
|
AIA Group Ltd. |
8,600 |
56,305 |
|||||||||
|
Alibaba Group Holding Ltd. ADR*1 |
682 |
56,108 |
|||||||||
|
China Biologic Products, Inc.* |
432 |
49,749 |
|||||||||
|
Hollysys Automation Technologies Ltd.1 |
1,890 |
45,417 |
|||||||||
|
Lenovo Group Ltd. |
31,800 |
44,060 |
|||||||||
|
Tianhe Chemicals Group Ltd.*2,3 |
200,000 |
22,641 |
|||||||||
|
Vipshop Holdings Ltd. ADR* |
1,710 |
38,047 |
|||||||||
|
Total China common stocks |
312,327 |
||||||||||
|
Denmark: 1.56% |
|||||||||||
|
AP Moeller - Maersk A/S, Class B |
25 |
45,279 |
|||||||||
|
Danske Bank A/S |
1,688 |
49,642 |
|||||||||
|
Jyske Bank A/S* |
1,025 |
51,496 |
|||||||||
|
Novo Nordisk A/S, Class B |
1,377 |
75,024 |
|||||||||
|
Topdanmark A/S* |
1,851 |
49,622 |
|||||||||
|
Total Denmark common stocks |
271,063 |
||||||||||
|
Finland: 1.14% |
|||||||||||
|
Sampo Oyj, Class A |
2,859 |
134,666 |
|||||||||
|
UPM-Kymmene Oyj |
3,550 |
62,809 |
|||||||||
|
Total Finland common stocks |
197,475 |
||||||||||
|
Shares |
Value |
||||||||||
|
France: 4.11% |
|||||||||||
|
Cap Gemini SA |
727 |
$ |
64,329 |
||||||||
|
Danone SA |
1,099 |
71,051 |
|||||||||
|
Groupe Eurotunnel SA |
4,300 |
62,272 |
|||||||||
|
Ipsen SA |
1,114 |
61,458 |
|||||||||
|
Pernod Ricard SA |
656 |
75,767 |
|||||||||
|
Safran SA |
1,229 |
83,291 |
|||||||||
|
Teleperformance |
1,025 |
72,414 |
|||||||||
|
TOTAL SA |
1,007 |
48,914 |
|||||||||
|
UBISOFT Entertainment* |
3,122 |
55,619 |
|||||||||
|
Unibail-Rodamco SE |
269 |
67,986 |
|||||||||
|
Valeo SA |
313 |
49,324 |
|||||||||
|
Total France common stocks |
712,425 |
||||||||||
|
Germany: 3.79% |
|||||||||||
|
adidas AG |
635 |
48,599 |
|||||||||
|
Bayer AG |
690 |
96,579 |
|||||||||
|
Daimler AG |
714 |
64,986 |
|||||||||
|
Freenet AG |
1,040 |
35,032 |
|||||||||
|
Fresenius Medical Care AG & Co. KGaA |
606 |
50,021 |
|||||||||
|
Fresenius SE & Co KGaA |
1,058 |
67,881 |
|||||||||
|
HeidelbergCement AG |
798 |
63,281 |
|||||||||
|
HOCHTIEF AG |
696 |
53,927 |
|||||||||
|
KION Group AG* |
983 |
47,091 |
|||||||||
| PNE Wind AG* |
12,746 |
29,159 |
|||||||||
|
ThyssenKrupp AG |
2,040 |
53,071 |
|||||||||
|
Wirecard AG |
1,247 |
47,754 |
|||||||||
|
Total Germany common stocks |
657,381 |
||||||||||
|
Greece: 0.08% |
|||||||||||
|
Piraeus Bank SA*,2,3 |
32,629 |
13,096 |
|||||||||
|
Ireland: 0.67% |
|||||||||||
|
Accenture PLC, Class A |
633 |
61,262 |
|||||||||
|
Ryanair Holdings PLC ADR |
765 |
54,583 |
|||||||||
|
Total Ireland common stocks |
115,845 |
||||||||||
|
Israel: 1.88% |
|||||||||||
|
Check Point Software Technologies Ltd.*1 |
3,080 |
245,014 |
|||||||||
|
Teva Pharmaceutical Industries Ltd. ADR |
1,380 |
81,558 |
|||||||||
|
Total Israel common stocks |
326,572 |
||||||||||
|
Italy: 0.86% |
|||||||||||
|
Atlantia SpA |
1,773 |
43,802 |
|||||||||
|
Intesa Sanpaolo SpA |
8,886 |
32,216 |
|||||||||
|
Mediolanum SpA |
8,877 |
73,234 |
|||||||||
|
Total Italy common stocks |
149,252 |
||||||||||
|
Japan: 4.70% |
|||||||||||
|
Bridgestone Corp. |
800 |
29,595 |
|||||||||
|
FUJIFILM Holdings Corp. |
1,900 |
67,898 |
|||||||||
|
Hino Motors Ltd. |
3,800 |
47,009 |
|||||||||
11
UBS Equity Long-Short Multi-Strategy Fund
Portfolio of investments
June 30, 2015
|
Shares |
Value |
||||||||||
|
Common stocks—(Continued) |
|||||||||||
|
Japan—(Concluded) |
|||||||||||
|
Hitachi Ltd. |
6,000 |
$ |
39,554 |
||||||||
|
Inpex Corp. |
3,100 |
35,246 |
|||||||||
|
Japan Airlines Co., Ltd. |
2,200 |
76,758 |
|||||||||
|
Japan Petroleum Exploration Co. |
1,100 |
35,008 |
|||||||||
|
KDDI Corp. |
2,760 |
66,618 |
|||||||||
|
NGK Spark Plug Co., Ltd. |
2,100 |
58,255 |
|||||||||
|
ORIX Corp. |
3,900 |
58,029 |
|||||||||
|
Sony Corp.* |
3,700 |
104,650 |
|||||||||
|
Sumitomo Electric Industries Ltd. |
2,300 |
35,650 |
|||||||||
|
Sumitomo Realty & Development Co., Ltd. |
2,000 |
70,164 |
|||||||||
|
THK Co., Ltd. |
2,400 |
51,889 |
|||||||||
|
Toyota Industries Corp. |
700 |
39,923 |
|||||||||
|
Total Japan common stocks |
816,246 |
||||||||||
|
Luxembourg: 0.43% |
|||||||||||
|
Grand City Properties SA |
4,314 |
74,907 |
|||||||||
|
Netherlands: 1.77% |
|||||||||||
|
Akzo Nobel NV |
970 |
70,583 |
|||||||||
|
ING Groep NV CVA |
3,172 |
52,373 |
|||||||||
|
Koninklijke KPN NV |
15,843 |
60,583 |
|||||||||
|
NN Group NV |
1,789 |
50,290 |
|||||||||
|
NXP Semiconductors NV*1 |
740 |
72,668 |
|||||||||
|
Total Netherlands common stocks |
306,497 |
||||||||||
|
Norway: 1.15% |
|||||||||||
|
Det Norske Oljeselskap ASA* |
2,833 |
20,054 |
|||||||||
|
DNB ASA |
2,935 |
48,964 |
|||||||||
|
Telenor ASA |
2,505 |
54,889 |
|||||||||
|
Yara International ASA |
1,451 |
75,581 |
|||||||||
|
Total Norway common stocks |
199,488 |
||||||||||
|
South Africa: 0.46% |
|||||||||||
|
Naspers Ltd., Class N |
515 |
80,217 |
|||||||||
|
South Korea: 0.62% |
|||||||||||
|
Samsung Electronics Co. Ltd. GDR4 |
58 |
32,966 |
|||||||||
|
Samsung Electronics Co., Ltd. |
14 |
15,915 |
|||||||||
|
Wonik IPS Co., Ltd.* |
4,665 |
59,387 |
|||||||||
|
Total South Korea common stocks |
108,268 |
||||||||||
|
Spain: 2.07% |
|||||||||||
|
Acciona SA* |
781 |
58,973 |
|||||||||
|
Amadeus IT Holding SA, Class A |
1,747 |
69,638 |
|||||||||
|
Atresmedia Corp. de Medios de Comunicacion SA |
2,410 |
37,346 |
|||||||||
|
Bankia SA* |
16,000 |
20,299 |
|||||||||
|
Enagas SA |
1,655 |
45,011 |
|||||||||
|
Mediaset Espana Comunicacion SA |
2,200 |
28,831 |
|||||||||
|
Shares |
Value |
||||||||||
|
Melia Hotels International SA |
2,993 |
$ |
39,507 |
||||||||
|
Red Electrica Corp. SA |
732 |
58,659 |
|||||||||
|
Total Spain common stocks |
358,264 |
||||||||||
|
Sweden: 2.04% |
|||||||||||
|
Assa Abloy AB, Class B |
4,314 |
81,234 |
|||||||||
|
Betsson AB* |
5,107 |
73,803 |
|||||||||
|
Lundin Petroleum AB* |
2,415 |
41,368 |
|||||||||
|
Nordea Bank AB |
7,310 |
91,178 |
|||||||||
|
Svenska Cellulosa AB SCA, Class B |
2,606 |
66,267 |
|||||||||
|
Total Sweden common stocks |
353,850 |
||||||||||
|
Switzerland: 2.19% |
|||||||||||
|
Actelion Ltd.* |
357 |
52,235 |
|||||||||
|
Lonza Group AG* |
508 |
67,864 |
|||||||||
|
Nestle SA |
1,038 |
74,940 |
|||||||||
|
Novartis AG |
1,883 |
185,591 |
|||||||||
|
Total Switzerland common stocks |
380,630 |
||||||||||
|
Taiwan: 0.39% |
|||||||||||
|
Catcher Technology Co., Ltd. GDR4 |
1,080 |
67,556 |
|||||||||
|
United Kingdom: 1.19% |
|||||||||||
|
Aon PLC1 |
1,010 |
100,677 |
|||||||||
|
Noble Corp. PLC1 |
2,990 |
46,016 |
|||||||||
|
Poundland Group PLC |
3,789 |
19,247 |
|||||||||
|
Unilever NV CVA |
993 |
41,354 |
|||||||||
|
Total United Kingdom common stocks |
207,294 |
||||||||||
|
United States: 49.90% |
|||||||||||
|
Acorda Therapeutics, Inc.*1 |
2,820 |
93,991 |
|||||||||
|
Aetna, Inc.1 |
887 |
113,057 |
|||||||||
|
Allergan PLC*1 |
911 |
276,451 |
|||||||||
|
Alliance Data Systems Corp.* |
198 |
57,804 |
|||||||||
|
Alnylam Pharmaceuticals, Inc.*1 |
1,065 |
127,662 |
|||||||||
|
Amazon.com, Inc.*1 |
256 |
111,127 |
|||||||||
|
American Campus Communities, Inc.1 |
730 |
27,514 |
|||||||||
|
American Express Co.1 |
1,280 |
99,482 |
|||||||||
|
American International Group, Inc.1 |
800 |
49,456 |
|||||||||
|
Ameriprise Financial, Inc.1 |
270 |
33,731 |
|||||||||
|
Anthem, Inc.1 |
419 |
68,775 |
|||||||||
|
Apple, Inc.1 |
595 |
74,628 |
|||||||||
|
Approach Resources, Inc.* |
2,000 |
13,700 |
|||||||||
|
Arista Networks, Inc.* |
830 |
67,844 |
|||||||||
|
Atara Biotherapeutics, Inc.*1 |
615 |
32,447 |
|||||||||
|
Bank of America Corp.1 |
3,620 |
61,612 |
|||||||||
|
Best Buy Co., Inc.1 |
1,570 |
51,198 |
|||||||||
|
Bio-Rad Laboratories, Inc., Class A*1 |
760 |
114,464 |
|||||||||
|
Bluebird Bio, Inc.*1 |
218 |
36,705 |
|||||||||
|
Boeing Co.1 |
295 |
40,922 |
|||||||||
|
Broadcom Corp., Class A1 |
1,960 |
100,920 |
|||||||||
12
UBS Equity Long-Short Multi-Strategy Fund
Portfolio of investments
June 30, 2015
|
Shares |
Value |
||||||||||
|
Common stocks—(Continued) |
|||||||||||
|
United States—(Continued) |
|||||||||||
|
Capital One Financial Corp.1 |
1,520 |
$ |
133,714 |
||||||||
|
Catalent, Inc.*1 |
2,720 |
79,778 |
|||||||||
|
CBS Corp. (Non-Voting), Class B1 |
1,475 |
81,862 |
|||||||||
|
CDW Corp. |
2,320 |
79,530 |
|||||||||
|
Celgene Corp.*1 |
1,412 |
163,418 |
|||||||||
|
Chevron Corp.1 |
150 |
14,470 |
|||||||||
|
Chimerix, Inc.*1 |
3,740 |
172,788 |
|||||||||
|
Citigroup, Inc.1 |
2,770 |
153,015 |
|||||||||
|
Cobalt International Energy, Inc.* |
3,450 |
33,499 |
|||||||||
|
Colfax Corp.*1 |
1,360 |
62,764 |
|||||||||
|
Colgate-Palmolive Co.1 |
390 |
25,510 |
|||||||||
|
Control4 Corp.*1 |
1,500 |
13,335 |
|||||||||
|
Cooper Cos., Inc. |
168 |
29,899 |
|||||||||
|
CVS Health Corp.1 |
851 |
89,253 |
|||||||||
|
Danaher Corp.1 |
920 |
78,743 |
|||||||||
|
Digital Realty Trust, Inc.1 |
1,600 |
106,688 |
|||||||||
|
Dolby Laboratories, Inc., Class A |
2,100 |
83,328 |
|||||||||
|
eBay, Inc.* |
1,010 |
60,842 |
|||||||||
|
Eli Lilly & Co.1 |
1,255 |
104,780 |
|||||||||
|
Envision Healthcare Holdings, Inc.*1 |
1,660 |
65,537 |
|||||||||
|
EOG Resources, Inc.1 |
253 |
22,150 |
|||||||||
|
Facebook, Inc., Class A* |
1,290 |
110,637 |
|||||||||
|
Fastenal Co. |
820 |
34,588 |
|||||||||
|
Fifth Third Bancorp1 |
5,890 |
122,630 |
|||||||||
|
Fiserv, Inc.*1 |
852 |
70,571 |
|||||||||
|
Ford Motor Co.1 |
1,620 |
24,316 |
|||||||||
|
General Electric Co.1 |
1,880 |
49,952 |
|||||||||
|
General Motors Co.1 |
2,470 |
82,325 |
|||||||||
|
Google, Inc., Class A*1 |
85 |
45,903 |
|||||||||
|
Google, Inc., Class C*1 |
85 |
44,243 |
|||||||||
|
Gulfport Energy Corp.* |
267 |
10,747 |
|||||||||
|
Halliburton Co. |
538 |
23,172 |
|||||||||
|
HCA Holdings, Inc.*1 |
2,020 |
183,254 |
|||||||||
|
HeartWare International, Inc.*1 |
600 |
43,614 |
|||||||||
|
Hertz Global Holdings, Inc.*1 |
4,240 |
76,829 |
|||||||||
|
Hess Corp.1 |
433 |
28,959 |
|||||||||
|
Hormel Foods Corp.1 |
791 |
44,589 |
|||||||||
|
Impax Laboratories, Inc.*1 |
2,038 |
93,585 |
|||||||||
|
Incyte Corp.*1 |
215 |
22,405 |
|||||||||
|
Integrated Device Technology, Inc.* |
2,586 |
56,116 |
|||||||||
|
Invesco Ltd.1 |
2,090 |
78,354 |
|||||||||
|
Jabil Circuit, Inc.1 |
3,798 |
80,859 |
|||||||||
|
Jarden Corp.* |
1,794 |
92,839 |
|||||||||
|
Joy Global, Inc.1 |
1,510 |
54,662 |
|||||||||
|
JPMorgan Chase & Co.1 |
1,863 |
126,237 |
|||||||||
|
Laboratory Corp. of America Holdings*1 |
750 |
90,915 |
|||||||||
|
Laredo Petroleum, Inc.* |
900 |
11,322 |
|||||||||
|
LDR Holding Corp.* |
731 |
31,616 |
|||||||||
|
Lennar Corp., Class A1 |
2,077 |
106,010 |
|||||||||
|
Lexicon Pharmaceuticals, Inc.*1 |
4,936 |
39,735 |
|||||||||
|
Shares |
Value |
||||||||||
|
Lincoln National Corp.1 |
1,620 |
$ |
95,936 |
||||||||
|
LyondellBasell Industries NV, Class A1 |
575 |
59,524 |
|||||||||
|
MacroGenics, Inc.*1 |
400 |
15,188 |
|||||||||
|
Maxim Integrated Products, Inc. |
2,118 |
73,230 |
|||||||||
|
McDermott International, Inc.*1 |
8,620 |
46,031 |
|||||||||
|
MDU Resources Group, Inc.1 |
1,050 |
20,507 |
|||||||||
|
Medicines Co./The* |
2,173 |
62,170 |
|||||||||
|
MetLife, Inc.1 |
1,970 |
110,300 |
|||||||||
|
Micron Technology, Inc.*1 |
4,726 |
89,038 |
|||||||||
|
Microsoft Corp.1 |
730 |
32,230 |
|||||||||
|
Mondelez International, Inc., Class A1 |
3,540 |
145,636 |
|||||||||
|
Monsanto Co.1 |
220 |
23,450 |
|||||||||
|
Morgan Stanley1 |
2,735 |
106,091 |
|||||||||
|
Norfolk Southern Corp. |
761 |
66,481 |
|||||||||
|
Oasis Petroleum, Inc.* |
725 |
11,491 |
|||||||||
|
ON Semiconductor Corp.* |
5,045 |
58,976 |
|||||||||
|
PDC Energy, Inc.*1 |
1,310 |
70,268 |
|||||||||
|
PepsiCo, Inc.1 |
1,210 |
112,941 |
|||||||||
|
Philip Morris International, Inc.1 |
2,020 |
161,943 |
|||||||||
|
Praxair, Inc.1 |
410 |
49,015 |
|||||||||
|
Qorvo, Inc.* |
667 |
53,540 |
|||||||||
|
Realogy Holdings Corp.*1 |
780 |
36,442 |
|||||||||
|
Receptos, Inc.*1 |
184 |
34,969 |
|||||||||
|
Regeneron Pharmaceuticals, Inc.* |
100 |
51,013 |
|||||||||
|
Regulus Therapeutics, Inc.*1 |
1,030 |
11,289 |
|||||||||
|
Rite Aid Corp.*1 |
7,810 |
65,213 |
|||||||||
|
Rocket Fuel, Inc.*1 |
1,240 |
10,168 |
|||||||||
|
Rock-Tenn Co., Class A1 |
980 |
58,996 |
|||||||||
|
Ross Stores, Inc. |
1,592 |
77,387 |
|||||||||
|
Royal Caribbean Cruises Ltd.1 |
460 |
36,197 |
|||||||||
|
SanDisk Corp. |
1,027 |
59,792 |
|||||||||
|
ServiceSource International, Inc.*1 |
14,090 |
77,072 |
|||||||||
|
Silicon Laboratories, Inc.*1 |
1,400 |
75,614 |
|||||||||
|
Skyworks Solutions, Inc. |
592 |
61,627 |
|||||||||
|
SM Energy Co. |
284 |
13,098 |
|||||||||
|
Snap-on, Inc. |
378 |
60,197 |
|||||||||
|
Symantec Corp.1 |
4,200 |
97,650 |
|||||||||
|
Thoratec Corp.*1 |
1,350 |
60,170 |
|||||||||
|
Time Warner, Inc.1 |
400 |
34,964 |
|||||||||
|
T-Mobile US, Inc.*1 |
1,800 |
69,786 |
|||||||||
|
Ultra Petroleum Corp.*1 |
3,070 |
38,436 |
|||||||||
|
Union Pacific Corp. |
318 |
30,328 |
|||||||||
|
United Rentals, Inc.*1 |
628 |
55,025 |
|||||||||
|
UnitedHealth Group, Inc.1 |
1,300 |
158,600 |
|||||||||
|
US Bancorp1 |
3,460 |
150,164 |
|||||||||
|
US Silica Holdings, Inc.1 |
970 |
28,479 |
|||||||||
|
Veeco Instruments, Inc.*1 |
1,220 |
35,063 |
|||||||||
|
Viacom, Inc., Class B1 |
476 |
30,769 |
|||||||||
|
Visa, Inc., Class A |
1,415 |
95,017 |
|||||||||
|
Walgreens Boots Alliance, Inc.1 |
516 |
43,571 |
|||||||||
|
Walt Disney Co.1 |
1,090 |
124,413 |
|||||||||
|
Wells Fargo & Co.1 |
420 |
23,621 |
|||||||||
13
UBS Equity Long-Short Multi-Strategy Fund
Portfolio of investments
June 30, 2015
|
Shares |
Value |
||||||||||
|
Common stocks—(Concluded) |
|||||||||||
|
United States—(Concluded) |
|||||||||||
|
Western Digital Corp. |
943 |
$ |
73,950 |
||||||||
|
Yum! Brands, Inc.1 |
1,380 |
124,310 |
|||||||||
|
Total United States common stocks |
8,656,753 |
||||||||||
|
Total common stocks (cost $14,047,837) |
15,249,829 | ||||||||||
|
Preferred stocks: 0.58% |
|||||||||||
|
Brazil: 0.24% |
|||||||||||
|
Itau Unibanco Holding SA, Preference shares |
3,750 |
41,274 |
|||||||||
|
Italy: 0.34% |
|||||||||||
|
Telecom Italia SpA, Preference shares |
58,247 |
59,450 |
|||||||||
|
Total preferred stocks (cost $98,491) |
100,724 |
||||||||||
|
Short-term investment: 23.97% |
|||||||||||
|
Investment company: 23.97% |
|||||||||||
|
UBS Cash Management Prime Relationship Fund5 (cost $4,158,148) |
4,158,148 |
4,158,148 |
|||||||||
|
Total investments before investments sold short: 112.46% (cost $18,304,476) |
19,508,701 | ||||||||||
|
Investments sold short: (61.40)% |
|||||||||||
|
Common stocks: (61.32)% |
|||||||||||
|
Australia: (1.45)% |
|||||||||||
|
Carnegie Wave Energy Ltd. |
(62,500 |
) |
(2,170 |
) |
|||||||
|
Energy World Corp. Ltd. |
(81,633 |
) |
(22,989 |
) |
|||||||
|
Fortescue Metals Group Ltd. |
(10,064 |
) |
(14,831 |
) |
|||||||
|
Highfield Resources Ltd. |
(10,527 |
) |
(12,021 |
) |
|||||||
|
InterOil Corp. |
(600 |
) |
(36,120 |
) |
|||||||
|
Sirius Resources NL |
(6,200 |
) |
(15,786 |
) |
|||||||
|
Syrah Resources Ltd. |
(10,000 |
) |
(28,856 |
) |
|||||||
|
Wesfarmers Ltd. |
(2,875 |
) |
(86,576 |
) |
|||||||
|
Woolworths Ltd. |
(1,534 |
) |
(31,909 |
) |
|||||||
|
Total Australia common stocks |
(251,258 |
) |
|||||||||
|
Austria: (0.31)% |
|||||||||||
|
Vienna Insurance Group AG Wiener Versicherung Gruppe |
(1,551 |
) |
(53,214 |
) |
|||||||
|
Belgium: (0.13)% |
|||||||||||
|
Umicore SA |
(475 |
) |
(22,522 |
) |
|||||||
|
Bermuda: (0.37)% |
|||||||||||
|
Golar LNG Ltd. |
(620 |
) |
(29,016 |
) |
|||||||
|
Nabors Industries Ltd. |
(1,000 |
) |
(14,430 |
) |
|||||||
|
Shares |
Value |
||||||||||
|
Seadrill Ltd. |
(2,050 |
) |
$ |
(21,197 |
) |
||||||
|
Total Bermuda common stocks |
(64,643 |
) |
|||||||||
|
Brazil: (0.20)% |
|||||||||||
|
Gafisa SA ADR |
(22,346 |
) |
(34,189 |
) |
|||||||
|
Canada: (1.77)% |
|||||||||||
|
Alterra Power Corp. |
(39,000 |
) |
(13,115 |
) |
|||||||
|
Altius Minerals Corp. |
(900 |
) |
(10,412 |
) |
|||||||
|
Athabasca Oil Corp. |
(20,565 |
) |
(33,589 |
) |
|||||||
|
Ballard Power Systems, Inc. |
(14,305 |
) |
(29,549 |
) |
|||||||
|
Canacol Energy Ltd. |
(5,250 |
) |
(11,643 |
) |
|||||||
|
Copper Mountain Mining Corp. |
(39,165 |
) |
(36,374 |
) |
|||||||
|
Fission Uranium Corp. |
(43,607 |
) |
(34,564 |
) |
|||||||
|
Hydrogenics Corp. |
(1,020 |
) |
(10,373 |
) |
|||||||
|
Just Energy Group, Inc. |
(5,210 |
) |
(27,156 |
) |
|||||||
|
Mega Uranium Ltd. |
(143,500 |
) |
(9,191 |
) |
|||||||
|
MFC Industrial Ltd. |
(1,705 |
) |
(6,905 |
) |
|||||||
|
Northland Power, Inc. |
(1,025 |
) |
(12,983 |
) |
|||||||
|
Petromanas Energy, Inc. |
(193,500 |
) |
(8,521 |
) |
|||||||
|
Petrowest Corp. |
(13,005 |
) |
(2,447 |
) |
|||||||
|
Polaris Materials Corp. |
(8,000 |
) |
(13,451 |
) |
|||||||
|
Rubicon Minerals Corp. |
(9,900 |
) |
(10,304 |
) |
|||||||
|
SNC-Lavalin Group, Inc. |
(410 |
) |
(13,774 |
) |
|||||||
|
Sunshine Oilsands Ltd. |
(135,000 |
) |
(14,978 |
) |
|||||||
|
Trevali Mining Corp. |
(10,520 |
) |
(7,328 |
) |
|||||||
|
Total Canada common stocks |
(306,657 |
) |
|||||||||
|
China: (0.74)% |
|||||||||||
|
Daqo New Energy Corp. ADR |
(510 |
) |
(12,011 |
) |
|||||||
|
Hanergy Thin Film Power Group Ltd.2,3 |
(24,000 |
) |
(12,106 |
) |
|||||||
|
Lonking Holdings Ltd. |
(130,000 |
) |
(25,995 |
) |
|||||||
|
MIE Holdings Corp. |
(116,000 |
) |
(17,359 |
) |
|||||||
|
NewOcean Energy Holdings Ltd. |
(75,000 |
) |
(34,832 |
) |
|||||||
|
Sino Gas & Energy Holdings Ltd. |
(153,047 |
) |
(14,760 |
) |
|||||||
|
Xinyi Solar Holdings Ltd. |
(28,000 |
) |
(11,631 |
) |
|||||||
|
Total China common stocks |
(128,694 |
) |
|||||||||
|
Colombia: (0.58)% |
|||||||||||
|
Pacific Rubiales Energy Corp. |
(26,783 |
) |
(100,998 |
) |
|||||||
|
Cyprus: (0.07)% |
|||||||||||
|
Deep Sea Supply PLC |
(14,602 |
) |
(5,308 |
) |
|||||||
|
Songa Offshore |
(34,000 |
) |
(6,201 |
) |
|||||||
|
Total Cyprus common stocks |
(11,509 |
) |
|||||||||
|
Denmark: (0.62)% |
|||||||||||
|
FLSmidth & Co. A/S |
(1,650 |
) |
(79,395 |
) |
|||||||
|
William Demant Holding A/S |
(365 |
) |
(27,844 |
) |
|||||||
|
Total Denmark common stocks |
(107,239 |
) |
|||||||||
14
UBS Equity Long-Short Multi-Strategy Fund
Portfolio of investments
June 30, 2015
|
Shares |
Value |
||||||||||
|
Investments sold short—(Continued) |
|||||||||||
|
Common stocks—(Continued) |
|||||||||||
|
Finland: (2.08)% |
|||||||||||
|
Fiskars Oyj Abp |
(1,355 |
) |
$ |
(30,922 |
) |
||||||
|
Fortum Oyj |
(1,966 |
) |
(34,937 |
) |
|||||||
|
Kone OYJ, Class B |
(490 |
) |
(19,885 |
) |
|||||||
|
Konecranes Oyj |
(1,589 |
) |
(46,289 |
) |
|||||||
|
Metso Oyj |
(2,905 |
) |
(79,800 |
) |
|||||||
|
Outokumpu Oyj |
(2,746 |
) |
(13,831 |
) |
|||||||
|
Outotec Oyj |
(11,184 |
) |
(72,006 |
) |
|||||||
|
Stockmann Oyj Abp, Class B |
(4,192 |
) |
(29,022 |
) |
|||||||
|
YIT Oyj |
(4,760 |
) |
(34,016 |
) |
|||||||
|
Total Finland common stocks |
(360,708 |
) |
|||||||||
|
France: (2.44)% |
|||||||||||
|
Air France-KLM |
(1,425 |
) |
(10,007 |
) |
|||||||
|
Alstom SA |
(774 |
) |
(21,961 |
) |
|||||||
|
Areva SA |
(2,036 |
) |
(17,162 |
) |
|||||||
|
AXA SA |
(2,221 |
) |
(56,034 |
) |
|||||||
|
Bourbon SA |
(860 |
) |
(13,998 |
) |
|||||||
|
Bouygues SA |
(1,347 |
) |
(50,360 |
) |
|||||||
|
CGG SA |
(8,503 |
) |
(47,540 |
) |
|||||||
|
Electricite de France SA |
(1,831 |
) |
(40,826 |
) |
|||||||
|
GDF Suez |
(1,681 |
) |
(31,184 |
) |
|||||||
|
Lafarge SA |
(361 |
) |
(23,842 |
) |
|||||||
|
Suez Environnement Co. |
(1,020 |
) |
(18,973 |
) |
|||||||
|
Technip SA |
(772 |
) |
(47,784 |
) |
|||||||
|
Veolia Environnement SA |
(2,120 |
) |
(43,228 |
) |
|||||||
|
Total France common stocks |
(422,899 |
) |
|||||||||
|
Germany: (2.86)% |
|||||||||||
|
AIXTRON SE |
(4,654 |
) |
(31,437 |
) |
|||||||
|
Deutsche Lufthansa AG |
(1,400 |
) |
(18,050 |
) |
|||||||
|
Fraport AG Frankfurt Airport Services Worldwide |
(477 |
) |
(29,961 |
) |
|||||||
|
H&R AG |
(1,774 |
) |
(14,966 |
) |
|||||||
|
Hamburger Hafen und Logistik AG |
(2,665 |
) |
(53,925 |
) |
|||||||
|
Hannover Rueck SE |
(430 |
) |
(41,606 |
) |
|||||||
|
Hugo Boss AG |
(209 |
) |
(23,359 |
) |
|||||||
|
K+S AG |
(575 |
) |
(24,222 |
) |
|||||||
|
QSC AG |
(9,380 |
) |
(19,231 |
) |
|||||||
|
Rhoen-Klinikum AG |
(907 |
) |
(24,334 |
) |
|||||||
|
RWE AG |
(3,954 |
) |
(85,010 |
) |
|||||||
|
Salzgitter AG |
(1,627 |
) |
(58,152 |
) |
|||||||
|
SGL Carbon SE |
(3,031 |
) |
(48,929 |
) |
|||||||
|
Wirecard AG |
(599 |
) |
(22,939 |
) |
|||||||
|
Total Germany common stocks |
(496,121 |
) |
|||||||||
|
Hong Kong: (0.15)% |
|||||||||||
|
Brightoil Petroleum Holdings Ltd. |
(51,000 |
) |
(26,317 |
) |
|||||||
|
Shares |
Value |
||||||||||
|
Ireland: (1.15)% |
|||||||||||
|
Bank of Ireland |
(106,372 |
) |
$ |
(42,929 |
) |
||||||
|
Endo International PLC |
(630 |
) |
(50,180 |
) |
|||||||
|
King Digital Entertainment PLC |
(1,600 |
) |
(22,800 |
) |
|||||||
|
Seagate Technology PLC |
(740 |
) |
(35,150 |
) |
|||||||
|
Tyco International PLC |
(1,240 |
) |
(47,715 |
) |
|||||||
|
Total Ireland common stocks |
(198,774 |
) |
|||||||||
|
Italy: (1.86)% |
|||||||||||
|
Italcementi SpA |
(3,492 |
) |
(23,047 |
) |
|||||||
|
Mediaset SpA |
(9,351 |
) |
(44,952 |
) |
|||||||
|
Piaggio & C SpA |
(12,170 |
) |
(40,839 |
) |
|||||||
|
Saipem SpA |
(10,213 |
) |
(107,882 |
) |
|||||||
|
Saras SpA |
(23,246 |
) |
(41,258 |
) |
|||||||
|
Telecom Italia SpA |
(51,228 |
) |
(64,993 |
) |
|||||||
|
Total Italy common stocks |
(322,971 |
) |
|||||||||
|
Japan: (0.57)% |
|||||||||||
|
JX Holdings, Inc. |
(9,100 |
) |
(39,275 |
) |
|||||||
|
Mitsui OSK Lines Ltd. |
(8,000 |
) |
(25,624 |
) |
|||||||
|
Tokyo Electric Power Co., Inc. |
(6,400 |
) |
(34,880 |
) |
|||||||
|
Total Japan common stocks |
(99,779 |
) |
|||||||||
|
Mexico: (0.35)% |
|||||||||||
|
Alfa SAB de CV, Class A |
(5,000 |
) |
(9,553 |
) |
|||||||
|
America Movil SAB de CV, Class L ADR |
(1,400 |
) |
(29,834 |
) |
|||||||
|
Coca-Cola Femsa SAB de CV ADR |
(280 |
) |
(22,246 |
) |
|||||||
|
Total Mexico common stocks |
(61,633 |
) |
|||||||||
|
Netherlands: (1.20)% |
|||||||||||
|
Aegon NV |
(8,947 |
) |
(65,752 |
) |
|||||||
|
Akzo Nobel NV |
(218 |
) |
(15,863 |
) |
|||||||
| CNH Industrial NV |
(2,760 |
) |
(25,170 |
) |
|||||||
|
Fugro NV CVA |
(1,692 |
) |
(37,085 |
) |
|||||||
|
Koninklijke Vopak NV |
(345 |
) |
(17,410 |
) |
|||||||
|
QIAGEN NV |
(1,900 |
) |
(46,675 |
) |
|||||||
|
Total Netherlands common stocks |
(207,955 |
) |
|||||||||
|
Norway: (0.96)% |
|||||||||||
|
DOF ASA |
(5,948 |
) |
(4,552 |
) |
|||||||
|
Farstad Shipping ASA |
(2,582 |
) |
(7,904 |
) |
|||||||
|
Fred Olsen Energy ASA |
(1,332 |
) |
(9,284 |
) |
|||||||
|
Kongsberg Gruppen ASA |
(875 |
) |
(16,349 |
) |
|||||||
|
North Atlantic Drilling Ltd. |
(10,400 |
) |
(12,376 |
) |
|||||||
|
Petroleum Geo-Services ASA |
(3,300 |
) |
(17,758 |
) |
|||||||
|
Solstad Offshore ASA |
(1,481 |
) |
(6,555 |
) |
|||||||
|
Storebrand ASA |
(6,400 |
) |
(26,398 |
) |
|||||||
|
TGS-Nopec Geophysical Co. ASA |
(2,808 |
) |
(65,576 |
) |
|||||||
|
Total Norway common stocks |
(166,752 |
) |
|||||||||
|
Portugal: (0.36)% |
|||||||||||
|
Jeronimo Martins, SGPS SA |
(4,820 |
) |
(61,796 |
) |
|||||||
15
UBS Equity Long-Short Multi-Strategy Fund
Portfolio of investments
June 30, 2015
|
Shares |
Value |
||||||||||
|
Investments sold short—(Continued) |
|||||||||||
|
Common stocks—(Continued) |
|||||||||||
|
Singapore: (0.61)% |
|||||||||||
|
Cosco Corp. Singapore Ltd. |
(33,300 |
) |
$ |
(11,868 |
) |
||||||
|
Dyna-Mac Holdings Ltd. |
(60,500 |
) |
(11,454 |
) |
|||||||
|
Falcon Energy Group Ltd. |
(33,700 |
) |
(6,005 |
) |
|||||||
|
Sembcorp Marine Ltd. |
(13,400 |
) |
(28,256 |
) |
|||||||
|
Wilmar International Ltd. |
(20,100 |
) |
(48,950 |
) |
|||||||
|
Total Singapore common stocks |
(106,533 |
) |
|||||||||
|
South Africa: (0.19)% |
|||||||||||
|
Vodacom Group Ltd. |
(2,855 |
) |
(32,549 |
) |
|||||||
|
Spain: (1.71)% |
|||||||||||
|
Banco Bilbao Vizcaya Argentaria SA |
(3,380 |
) |
(33,130 |
) |
|||||||
|
Banco Popular Espanol SA |
(11,496 |
) |
(55,700 |
) |
|||||||
|
Distribuidora Internacional de Alimentacion SA |
(7,535 |
) |
(57,543 |
) |
|||||||
|
Enagas SA |
(640 |
) |
(17,406 |
) |
|||||||
|
Repsol SA |
(2,090 |
) |
(35,646 |
) |
|||||||
|
Tecnicas Reunidas SA |
(1,385 |
) |
(71,181 |
) |
|||||||
|
Zardoya Otis SA, RFD |
(93 |
) |
(1,013 |
) |
|||||||
|
Zardoya Otis SA |
(2,347 |
) |
(25,564 |
) |
|||||||
|
Total Spain common stocks |
(297,183 |
) |
|||||||||
|
Sweden: (1.27)% |
|||||||||||
|
Alfa Laval AB |
(2,585 |
) |
(45,496 |
) |
|||||||
|
Electrolux AB, Series B |
(1,484 |
) |
(46,508 |
) |
|||||||
|
Modern Times Group AB, Class B |
(2,208 |
) |
(59,236 |
) |
|||||||
|
Ratos AB, Class B |
(5,424 |
) |
(35,005 |
) |
|||||||
|
Svenska Handelsbanken AB, Class A |
(2,280 |
) |
(33,279 |
) |
|||||||
|
Total Sweden common stocks |
(219,524 |
) |
|||||||||
|
Switzerland: (2.18)% |
|||||||||||
|
Aryzta AG |
(330 |
) |
(16,272 |
) |
|||||||
|
Dufry AG |
(455 |
) |
(63,363 |
) |
|||||||
|
Emmi AG |
(83 |
) |
(26,721 |
) |
|||||||
|
Garmin Ltd. |
(860 |
) |
(37,780 |
) |
|||||||
|
Holcim Ltd. |
(260 |
) |
(19,188 |
) |
|||||||
|
Kuehne + Nagel International AG |
(496 |
) |
(65,836 |
) |
|||||||
|
STMicroelectronics NV |
(2,280 |
) |
(18,695 |
) |
|||||||
|
Sulzer AG |
(501 |
) |
(51,523 |
) |
|||||||
|
Swatch Group AG |
(79 |
) |
(30,765 |
) |
|||||||
|
Syngenta AG |
(37 |
) |
(15,038 |
) |
|||||||
|
Transocean Ltd. |
(1,100 |
) |
(17,732 |
) |
|||||||
|
Ypsomed Holding AG |
(137 |
) |
(15,020 |
) |
|||||||
|
Total Switzerland common stocks |
(377,933 |
) |
|||||||||
|
Turkey: (0.21)% |
|||||||||||
|
Anadolu Efes Biracilik Ve Malt Sanayii AS |
(1,500 |
) |
(13,544 |
) |
|||||||
|
Coca-Cola Icecek AS |
(1,410 |
) |
(23,464 |
) |
|||||||
|
Total Turkey common stocks |
(37,008 |
) |
|||||||||
|
Shares |
Value |
||||||||||
|
United Kingdom: (0.82)% |
|||||||||||
|
Awilco Drilling PLC |
(2,820 |
) |
$ |
(17,804 |
) |
||||||
|
Melrose Industries PLC |
(12,450 |
) |
(48,416 |
) |
|||||||
|
Subsea 7 SA |
(5,556 |
) |
(54,388 |
) |
|||||||
|
Ultra Electronics Holdings PLC |
(759 |
) |
(21,132 |
) |
|||||||
|
Total United Kingdom common stocks |
(141,740 |
) |
|||||||||
|
United States: (34.11)% |
|||||||||||
|
Abaxis, Inc. |
(790 |
) |
(40,669 |
) |
|||||||
|
Abbott Laboratories |
(870 |
) |
(42,700 |
) |
|||||||
|
AbbVie, Inc. |
(1,340 |
) |
(90,035 |
) |
|||||||
|
Acorda Therapeutics, Inc. |
(800 |
) |
(26,664 |
) |
|||||||
|
Aegerion Pharmaceuticals, Inc. |
(1,521 |
) |
(28,853 |
) |
|||||||
|
Akamai Technologies, Inc. |
(750 |
) |
(52,365 |
) |
|||||||
|
American Eagle Outfitters, Inc. |
(3,041 |
) |
(52,366 |
) |
|||||||
|
American International Group, Inc. |
(1,690 |
) |
(104,476 |
) |
|||||||
|
Associated Banc-Corp. |
(2,980 |
) |
(60,405 |
) |
|||||||
|
Astoria Financial Corp. |
(3,486 |
) |
(48,072 |
) |
|||||||
|
AT&T, Inc. |
(1,235 |
) |
(43,867 |
) |
|||||||
|
Bank of America Corp. |
(3,160 |
) |
(53,783 |
) |
|||||||
|
Bank of New York Mellon Corp. |
(1,240 |
) |
(52,043 |
) |
|||||||
|
Baxter International, Inc. |
(330 |
) |
(23,077 |
) |
|||||||
|
Bio-Reference Laboratories, Inc. |
(930 |
) |
(38,362 |
) |
|||||||
|
BNK Petroleum, Inc. |
(20,114 |
) |
(8,374 |
) |
|||||||
|
Bristol-Myers Squibb Co. |
(920 |
) |
(61,217 |
) |
|||||||
|
Brown-Forman Corp., Class B |
(500 |
) |
(50,090 |
) |
|||||||
|
Buffalo Wild Wings, Inc. |
(325 |
) |
(50,924 |
) |
|||||||
|
Cadence Design Systems, Inc. |
(2,331 |
) |
(45,827 |
) |
|||||||
|
Caesars Entertainment Corp. |
(1,550 |
) |
(9,486 |
) |
|||||||
|
Cavium, Inc. |
(870 |
) |
(59,865 |
) |
|||||||
|
Celgene Corp. |
(870 |
) |
(100,689 |
) |
|||||||
|
Charles Schwab Corp. |
(3,070 |
) |
(100,236 |
) |
|||||||
|
Cheniere Energy, Inc. |
(199 |
) |
(13,783 |
) |
|||||||
|
Choice Hotels International, Inc. |
(980 |
) |
(53,165 |
) |
|||||||
|
Chubb Corp. |
(130 |
) |
(12,368 |
) |
|||||||
|
Clorox Co. |
(450 |
) |
(46,809 |
) |
|||||||
|
Cognizant Technology Solutions Corp., Class A |
(1,170 |
) |
(71,475 |
) |
|||||||
|
Colfax Corp. |
(1,507 |
) |
(69,548 |
) |
|||||||
|
ConocoPhillips |
(200 |
) |
(12,282 |
) |
|||||||
|
Constellation Brands, Inc., Class A |
(545 |
) |
(63,231 |
) |
|||||||
|
Deere & Co. |
(270 |
) |
(26,204 |
) |
|||||||
|
DENTSPLY International, Inc. |
(600 |
) |
(30,930 |
) |
|||||||
|
Devon Energy Corp. |
(200 |
) |
(11,898 |
) |
|||||||
|
Diamond Offshore Drilling, Inc. |
(450 |
) |
(11,615 |
) |
|||||||
|
Diebold, Inc. |
(1,310 |
) |
(45,850 |
) |
|||||||
|
Douglas Emmett, Inc. |
(620 |
) |
(16,703 |
) |
|||||||
|
Dr. Pepper Snapple Group, Inc. |
(580 |
) |
(42,282 |
) |
|||||||
|
Electronic Arts, Inc. |
(1,400 |
) |
(93,100 |
) |
|||||||
|
Equity Residential |
(370 |
) |
(25,963 |
) |
|||||||
|
F5 Networks, Inc. |
(370 |
) |
(44,529 |
) |
|||||||
|
Federal Realty Investment Trust |
(150 |
) |
(19,213 |
) |
|||||||
16
UBS Equity Long-Short Multi-Strategy Fund
Portfolio of investments
June 30, 2015
|
Shares |
Value |
||||||||||
|
Investments sold short—(Continued) |
|||||||||||
|
Common stocks—(Continued) |
|||||||||||
|
United States—(Continued) |
|||||||||||
|
First Niagara Financial Group, Inc. |
(2,510 |
) |
$ |
(23,694 |
) |
||||||
|
Flextronics International Ltd. |
(5,190 |
) |
(58,699 |
) |
|||||||
|
FMC Corp. |
(936 |
) |
(49,187 |
) |
|||||||
|
FMC Technologies, Inc. |
(580 |
) |
(24,064 |
) |
|||||||
|
Freeport-McMoRan, Inc. |
(2,350 |
) |
(43,757 |
) |
|||||||
|
FreightCar America, Inc. |
(855 |
) |
(17,852 |
) |
|||||||
|
Frontier Communications Corp. |
(6,200 |
) |
(30,690 |
) |
|||||||
|
FuelCell Energy, Inc. |
(26,600 |
) |
(25,986 |
) |
|||||||
|
GameStop Corp., Class A |
(730 |
) |
(31,361 |
) |
|||||||
|
Gannett Co., Inc. |
(750 |
) |
(10,492 |
) |
|||||||
|
Genie Energy Ltd., Class B |
(2,766 |
) |
(28,960 |
) |
|||||||
|
Genuine Parts Co. |
(480 |
) |
(42,974 |
) |
|||||||
|
Gogo, Inc. |
(1,735 |
) |
(37,181 |
) |
|||||||
|
Gulfmark Offshore, Inc., Class A |
(600 |
) |
(6,960 |
) |
|||||||
|
Hartford Financial Services Group, Inc. |
(1,820 |
) |
(75,657 |
) |
|||||||
|
Healthcare Services Group, Inc. |
(2,410 |
) |
(79,650 |
) |
|||||||
|
Helmerich & Payne, Inc. |
(300 |
) |
(21,126 |
) |
|||||||
|
Hercules Offshore, Inc. |
(15,000 |
) |
(3,507 |
) |
|||||||
|
Hess Corp. |
(370 |
) |
(24,746 |
) |
|||||||
|
Houston American Energy Corp. |
(28,500 |
) |
(5,700 |
) |
|||||||
|
Hyatt Hotels Corp., Class A |
(810 |
) |
(45,919 |
) |
|||||||
|
IDEXX Laboratories, Inc. |
(920 |
) |
(59,009 |
) |
|||||||
|
Ingram Micro, Inc., Class A |
(1,899 |
) |
(47,532 |
) |
|||||||
|
Intel Corp. |
(1,820 |
) |
(55,355 |
) |
|||||||
|
International Business Machines Corp. |
(210 |
) |
(34,159 |
) |
|||||||
|
Intrexon Corp. |
(1,170 |
) |
(57,096 |
) |
|||||||
|
Intuitive Surgical, Inc. |
(102 |
) |
(49,419 |
) |
|||||||
|
ITT Educational Services, Inc. |
(2,900 |
) |
(11,513 |
) |
|||||||
|
Janus Capital Group, Inc. |
(3,500 |
) |
(59,920 |
) |
|||||||
|
Juniper Networks, Inc. |
(1,894 |
) |
(49,187 |
) |
|||||||
|
KLA-Tencor Corp. |
(580 |
) |
(32,602 |
) |
|||||||
|
Leucadia National Corp. |
(900 |
) |
(21,852 |
) |
|||||||
|
Level 3 Communications, Inc. |
(714 |
) |
(37,606 |
) |
|||||||
|
Lexmark International, Inc., Class A |
(931 |
) |
(41,150 |
) |
|||||||
|
Ligand Pharmaceuticals, Inc. |
(454 |
) |
(45,809 |
) |
|||||||
|
Lilis Energy, Inc. |
(9,900 |
) |
(9,504 |
) |
|||||||
|
Linear Technology Corp. |
(900 |
) |
(39,807 |
) |
|||||||
|
LinnCo LLC |
(3,250 |
) |
(30,713 |
) |
|||||||
|
Lockheed Martin Corp. |
(160 |
) |
(29,744 |
) |
|||||||
|
Magnum Hunter Resources Corp. |
(24,400 |
) |
(45,628 |
) |
|||||||
|
McCormick & Co. Inc. (Non-voting) |
(775 |
) |
(62,736 |
) |
|||||||
|
McDermott International, Inc. |
(3,120 |
) |
(16,661 |
) |
|||||||
|
Mead Johnson Nutrition Co. |
(410 |
) |
(36,990 |
) |
|||||||
|
MEDNAX, Inc. |
(670 |
) |
(49,654 |
) |
|||||||
|
Mettler-Toledo International, Inc. |
(245 |
) |
(83,658 |
) |
|||||||
|
Michael Kors Holdings Ltd. |
(450 |
) |
(18,941 |
) |
|||||||
|
Miller Energy Resources, Inc. |
(3,255 |
) |
(1,188 |
) |
|||||||
|
Monsanto Co. |
(366 |
) |
(39,012 |
) |
|||||||
|
Motorola Solutions, Inc. |
(720 |
) |
(41,285 |
) |
|||||||
|
Murphy Oil Corp. |
(300 |
) |
(12,471 |
) |
|||||||
|
NetApp, Inc. |
(365 |
) |
(11,519 |
) |
|||||||
|
Shares |
Value |
||||||||||
|
New York Community Bancorp, Inc. |
(2,640 |
) |
$ |
(48,523 |
) |
||||||
|
Northern Trust Corp. |
(480 |
) |
(36,701 |
) |
|||||||
|
Northrop Grumman Corp. |
(190 |
) |
(30,140 |
) |
|||||||
|
Omeros Corp. |
(720 |
) |
(12,953 |
) |
|||||||
|
Pacific Drilling SA |
(2,410 |
) |
(6,748 |
) |
|||||||
|
Panhandle Oil and Gas, Inc., Class A |
(587 |
) |
(12,145 |
) |
|||||||
|
Paragon Offshore PLC |
(5,000 |
) |
(5,450 |
) |
|||||||
|
Patterson Cos., Inc. |
(880 |
) |
(42,812 |
) |
|||||||
|
People's United Financial, Inc. |
(1,990 |
) |
(32,258 |
) |
|||||||
|
PerkinElmer, Inc. |
(710 |
) |
(37,374 |
) |
|||||||
|
Pioneer Natural Resources Co. |
(160 |
) |
(22,190 |
) |
|||||||
|
Plug Power, Inc. |
(5,400 |
) |
(13,230 |
) |
|||||||
|
Polycom, Inc. |
(3,464 |
) |
(39,628 |
) |
|||||||
|
Public Storage |
(130 |
) |
(23,968 |
) |
|||||||
|
PVH Corp. |
(290 |
) |
(33,408 |
) |
|||||||
|
Rackspace Hosting, Inc. |
(1,027 |
) |
(38,194 |
) |
|||||||
|
Red Hat, Inc. |
(1,115 |
) |
(84,662 |
) |
|||||||
|
Repligen Corp. |
(1,190 |
) |
(49,111 |
) |
|||||||
|
ResMed, Inc. |
(340 |
) |
(19,166 |
) |
|||||||
|
Sagent Pharmaceuticals, Inc. |
(1,220 |
) |
(29,658 |
) |
|||||||
|
SandRidge Energy, Inc. |
(3,615 |
) |
(3,170 |
) |
|||||||
|
SBA Communications Corp., Class A |
(460 |
) |
(52,886 |
) |
|||||||
|
Sears Holdings Corp. |
(650 |
) |
(17,355 |
) |
|||||||
|
Solazyme, Inc. |
(3,724 |
) |
(11,693 |
) |
|||||||
|
Southern Co. |
(278 |
) |
(11,648 |
) |
|||||||
|
Spectra Energy Corp. |
(450 |
) |
(14,670 |
) |
|||||||
|
Staples, Inc. |
(2,800 |
) |
(42,868 |
) |
|||||||
|
Stericycle, Inc. |
(340 |
) |
(45,529 |
) |
|||||||
|
STERIS Corp. |
(600 |
) |
(38,664 |
) |
|||||||
|
Stifel Financial Corp. |
(990 |
) |
(57,163 |
) |
|||||||
|
Synopsys, Inc. |
(1,130 |
) |
(57,235 |
) |
|||||||
|
Syntroleum Corp.2,3 |
(1,235 |
) |
(5,311 |
) |
|||||||
|
TD Ameritrade Holding Corp. |
(1,430 |
) |
(52,653 |
) |
|||||||
|
Tech Data Corp. |
(823 |
) |
(47,372 |
) |
|||||||
|
TEGNA, Inc. |
(1,500 |
) |
(48,105 |
) |
|||||||
|
Teradyne, Inc. |
(2,500 |
) |
(48,225 |
) |
|||||||
|
Tesla Motors, Inc. |
(240 |
) |
(64,382 |
) |
|||||||
|
Tesoro Corp. |
(541 |
) |
(45,666 |
) |
|||||||
|
Texas Instruments, Inc. |
(1,693 |
) |
(87,206 |
) |
|||||||
|
Textura Corp. |
(695 |
) |
(19,342 |
) |
|||||||
|
Thermo Fisher Scientific, Inc. |
(290 |
) |
(37,630 |
) |
|||||||
|
Tidewater, Inc. |
(500 |
) |
(11,365 |
) |
|||||||
|
Travelers Cos., Inc. |
(300 |
) |
(28,998 |
) |
|||||||
|
Triangle Petroleum Corp. |
(4,285 |
) |
(21,511 |
) |
|||||||
|
Twitter, Inc. |
(440 |
) |
(15,937 |
) |
|||||||
|
Under Armour, Inc., Class A |
(910 |
) |
(75,930 |
) |
|||||||
|
United Therapeutics Corp. |
(440 |
) |
(76,538 |
) |
|||||||
|
US Geothermal, Inc. |
(17,000 |
) |
(9,010 |
) |
|||||||
|
Valero Energy Corp. |
(295 |
) |
(18,467 |
) |
|||||||
|
Verizon Communications, Inc. |
(890 |
) |
(41,483 |
) |
|||||||
|
Voya Financial, Inc. |
(560 |
) |
(26,023 |
) |
|||||||
|
Vulcan Materials Co. |
(320 |
) |
(26,858 |
) |
|||||||
|
Wendy's Co. |
(4,710 |
) |
(53,129 |
) |
|||||||
|
Werner Enterprises, Inc. |
(835 |
) |
(21,919 |
) |
|||||||
17
UBS Equity Long-Short Multi-Strategy Fund
Portfolio of investments
June 30, 2015
|
Shares |
Value |
||||||||||
|
Investments sold short—(Concluded) |
|||||||||||
|
Common stocks—(Concluded) |
|||||||||||
|
United States—(Concluded) |
|||||||||||
|
Westamerica Bancorporation |
(920 |
) |
$ |
(46,598 |
) |
||||||
|
Williams-Sonoma, Inc. |
(400 |
) |
(32,908 |
) |
|||||||
|
Xerox Corp. |
(3,490 |
) |
(37,134 |
) |
|||||||
|
Zeltiq Aesthetics, Inc. |
(1,370 |
) |
(40,374 |
) |
|||||||
|
Zimmer Biomet Holdings, Inc. |
(340 |
) |
(37,138 |
) |
|||||||
|
Zions Bancorporation |
(2,950 |
) |
(93,618 |
) |
|||||||
|
Total United States common stocks |
(5,917,305 |
) |
|||||||||
|
Total common stocks (proceeds $10,985,254) |
(10,636,403 |
) |
|||||||||
|
Preferred stock: (0.07)% |
|||||||||||
|
United States: (0.07)% |
|||||||||||
|
Magnum Hunter Resources Corp. (proceeds $11,817) |
(400 |
) |
(12,544 |
) |
|||||||
|
Number of Rights |
Value |
||||||||||
|
Rights: (0.01)% |
|||||||||||
|
United States: (0.01)% |
|||||||||||
|
Repsol SA, expires 01/08/15 |
(2,030 |
) |
$ |
(1,052 |
) |
||||||
|
Sears Holdings Corp., expires 07/02/15 |
(650 |
) |
(2,093 |
) |
|||||||
|
Total rights (proceeds $3,819) |
(3,145 |
) |
|||||||||
|
Total investments sold short (proceeds $11,000,890) |
(10,652,092 |
) |
|||||||||
|
Total investments, net of investments sold short: 51.06% |
8,856,609 |
||||||||||
|
Cash and other assets, less liabilities: 48.94% |
8,490,132 |
||||||||||
|
Net assets: 100.00% |
$ |
17,346,741 |
|||||||||
Notes to portfolio of investments
Aggregate cost for federal income tax purposes, before investments sold short, was $18,486,199; and net unrealized appreciation consisted of:
|
Gross unrealized appreciation |
$ |
1,948,625 |
|||||
|
Gross unrealized depreciation |
(926,123 |
) |
|||||
|
Net unrealized appreciation of investments |
$ |
1,022,502 |
|||||
For a listing of defined portfolio acronyms, counterparty abbreviations and currency abbreviations that are used throughout the Portfolio of investments as well as the tables that follow, please refer to page 71. Portfolio footnotes begin on page 22.
Forward foreign currency contracts
|
Counterparty |
Contracts to deliver |
In exchange for |
Maturity date |
Unrealized appreciation/ (depreciation) |
|||||||||||||||
|
JPMCB |
AUD |
195,000 |
USD |
147,919 |
07/22/15 |
$ |
(2,354 |
) |
|||||||||||
|
JPMCB |
BRL |
629,400 |
USD |
200,000 |
07/22/15 |
(942 |
) |
||||||||||||
|
JPMCB |
INR |
9,690,000 |
USD |
150,000 |
07/22/15 |
(1,543 |
) |
||||||||||||
|
JPMCB |
JPY |
17,900,000 |
USD |
150,177 |
07/22/15 |
3,880 |
|||||||||||||
|
JPMCB |
JPY |
12,914,664 |
USD |
105,000 |
07/22/15 |
(551 |
) |
||||||||||||
|
JPMCB |
TRY |
1,097,670 |
USD |
393,953 |
07/22/15 |
(13,058 |
) |
||||||||||||
|
JPMCB |
USD |
143,692 |
EUR |
135,000 |
07/22/15 |
6,854 |
|||||||||||||
|
JPMCB |
ZAR |
1,370,000 |
USD |
110,997 |
07/22/15 |
(1,205 |
) |
||||||||||||
|
Net unrealized depreciation on forward foreign currency contracts |
$ |
(8,919 |
) |
||||||||||||||||
Portfolio Swap Outstanding3
|
Counterparty |
Description |
Termination Date6 |
Value |
||||||||||||
|
CSI |
The Fund receives or pays the total return on a portfolio of long and short positions and pays or receives a specified LIBOR floating rate. |
Twelve month maturities of 09/02/15—03/17/16 |
$(71,595) | ||||||||||||
18
UBS Equity Long-Short Multi-Strategy Fund
Portfolio of investments
June 30, 2015
Additional Information for Portfolio Swap
|
Portfolio swap positions |
Notional Values7 |
Current Values8 |
Value9 |
||||||||||||
|
Long Positions |
|||||||||||||||
|
Chile |
|||||||||||||||
|
GeoPark Ltd. |
$ |
24,084 |
$ |
20,460 |
$ |
(3,624 |
) |
||||||||
|
France |
|||||||||||||||
|
Danone SA |
42,740 |
38,854 |
(3,886 |
) |
|||||||||||
|
LVMH Moet Hennessy Louis Vuitton SE |
39,228 |
39,420 |
192 |
||||||||||||
|
Schneider Electric SE |
47,686 |
44,187 |
(3,499 |
) |
|||||||||||
|
Total France |
129,654 |
122,461 |
(7,193 |
) |
|||||||||||
|
Ireland |
|||||||||||||||
|
Shire PLC |
178,689 |
166,755 |
(11,934 |
) |
|||||||||||
|
Netherlands |
|||||||||||||||
|
Royal Dutch Shell PLC |
1,059 |
926 |
(133 |
) |
|||||||||||
|
United Kingdom |
|||||||||||||||
|
Anglo American PLC |
32,950 |
27,421 |
(5,529 |
) |
|||||||||||
|
ARM Holdings PLC |
51,725 |
48,132 |
(3,593 |
) |
|||||||||||
|
Ashtead Group PLC |
65,769 |
64,237 |
(1,532 |
) |
|||||||||||
|
Associated British Foods PLC |
33,238 |
33,382 |
144 |
||||||||||||
|
AstraZeneca PLC |
77,637 |
71,421 |
(6,216 |
) |
|||||||||||
|
Aviva PLC |
99,146 |
93,356 |
(5,790 |
) |
|||||||||||
|
Balfour Beatty PLC |
32,861 |
31,935 |
(926 |
) |
|||||||||||
|
BG Group PLC |
79,420 |
74,081 |
(5,339 |
) |
|||||||||||
|
Big Yellow Group PLC |
31,854 |
30,451 |
(1,403 |
) |
|||||||||||
|
Burberry Group PLC |
30,386 |
27,400 |
(2,986 |
) |
|||||||||||
|
Capita PLC |
84,526 |
83,663 |
(863 |
) |
|||||||||||
|
Dignity PLC |
60,512 |
61,115 |
603 |
||||||||||||
|
Direct Line Insurance Group PLC |
87,749 |
80,104 |
(7,645 |
) |
|||||||||||
|
Essentra PLC |
68,377 |
67,902 |
(475 |
) |
|||||||||||
|
Esure Group PLC |
25,715 |
25,231 |
(484 |
) |
|||||||||||
|
Genel Energy PLC |
63,927 |
51,820 |
(12,107 |
) |
|||||||||||
|
Glencore PLC |
40,065 |
33,034 |
(7,031 |
) |
|||||||||||
|
Hurricane Energy PLC |
57,958 |
61,993 |
4,035 |
||||||||||||
|
Imperial Tobacco Group PLC |
41,415 |
39,805 |
(1,610 |
) |
|||||||||||
|
Indivior PLC |
20,592 |
20,116 |
(476 |
) |
|||||||||||
|
Legal & General Group PLC |
78,958 |
73,977 |
(4,981 |
) |
|||||||||||
|
London Stock Exchange Group PLC |
105,161 |
100,470 |
(4,691 |
) |
|||||||||||
|
Michael Page International PLC |
43,315 |
34,526 |
(8,789 |
) |
|||||||||||
|
National Grid PLC |
83,413 |
74,448 |
(8,965 |
) |
|||||||||||
|
Nichols PLC |
14,523 |
15,618 |
1,095 |
||||||||||||
|
Petra Diamonds Ltd. |
34,930 |
32,929 |
(2,001 |
) |
|||||||||||
|
Playtech PLC |
72,749 |
71,750 |
(999 |
) |
|||||||||||
|
Premier Oil PLC |
33,678 |
28,652 |
(5,026 |
) |
|||||||||||
|
Reckitt Benckiser Group PLC |
66,265 |
61,655 |
(4,610 |
) |
|||||||||||
|
Rio Tinto PLC |
43,983 |
39,840 |
(4,143 |
) |
|||||||||||
|
Rockhopper Exploration PLC |
34,247 |
35,805 |
1,558 |
||||||||||||
|
SABMiller PLC |
61,314 |
58,300 |
(3,014 |
) |
|||||||||||
|
Standard Life PLC |
70,902 |
64,650 |
(6,252 |
) |
|||||||||||
|
Unilever PLC |
129,384 |
122,465 |
(6,919 |
) |
|||||||||||
|
William Hill PLC |
55,545 |
53,203 |
(2,342 |
) |
|||||||||||
|
Total United Kingdom |
2,014,189 |
1,894,887 |
(119,302 |
) |
|||||||||||
|
Total Long Positions of Portfolio Swap |
2,347,675 |
2,205,489 |
(142,186 |
) |
|||||||||||
19
UBS Equity Long-Short Multi-Strategy Fund
Portfolio of investments
June 30, 2015
|
Portfolio swap positions (continued) |
Notional Values7 |
Current Values8 |
Value9 |
||||||||||||
|
Short Positions |
|||||||||||||||
|
China |
|||||||||||||||
|
Green Dragon Gas Ltd. |
$ |
(8,612 |
) |
$ |
(8,045 |
) |
$ |
567 |
|||||||
|
Hong Kong |
|||||||||||||||
|
China Coal Energy |
(72,031 |
) |
(70,956 |
) |
1,075 |
||||||||||
|
Indonesia |
|||||||||||||||
|
Bank Mandiri Persero Tbk PT |
(37,370 |
) |
(33,921 |
) |
3,449 |
||||||||||
|
Ireland |
|||||||||||||||
|
San Leon Energy PLC |
(6,092 |
) |
(4,341 |
) |
1,751 |
||||||||||
|
Isle of Man |
|||||||||||||||
|
Bahamas Petroleum Company PLC |
(14,849 |
) |
(20,124 |
) |
(5,275 |
) |
|||||||||
|
Malaysia |
|||||||||||||||
|
Maxis Bhd |
(29,471 |
) |
(25,493 |
) |
3,978 |
||||||||||
|
SapuraKencana Petroleum Bhd |
(18,402 |
) |
(15,387 |
) |
3,015 |
||||||||||
|
Total Malaysia |
(47,873 |
) |
(40,880 |
) |
6,993 |
||||||||||
|
Netherlands |
|||||||||||||||
|
Royal Dutch Shell PLC |
(13,507 |
) |
(11,733 |
) |
1,774 |
||||||||||
|
South Korea |
|||||||||||||||
|
Daewoo Shipbuilding and Marine Engineering |
(69,446 |
) |
(57,352 |
) |
12,094 |
||||||||||
|
Hyundai Heavy Industries Co., Ltd |
(54,665 |
) |
(46,372 |
) |
8,293 |
||||||||||
|
South Korea |
(124,111 |
) |
(103,724 |
) |
20,387 |
||||||||||
|
Switzerland |
|||||||||||||||
|
Coca-Cola HBC AG |
(41,948 |
) |
(40,410 |
) |
1,538 |
||||||||||
|
Taiwan |
|||||||||||||||
|
Acer, Inc. |
(15,619 |
) |
(11,576 |
) |
4,043 |
||||||||||
|
Compal Electronics Inc |
(20,035 |
) |
(16,756 |
) |
3,279 |
||||||||||
|
HTC Corp |
(8,229 |
) |
(4,667 |
) |
3,562 |
||||||||||
|
MediaTek, Inc. |
(25,694 |
) |
(27,354 |
) |
(1,660 |
) |
|||||||||
|
Taiwan Glass Industry Corp. |
(26,817 |
) |
(20,696 |
) |
6,121 |
||||||||||
|
Total Taiwan |
(96,394 |
) |
(81,049 |
) |
15,345 |
||||||||||
|
United Kingdom |
|||||||||||||||
|
Admiral Group PLC |
(34,714 |
) |
(30,947 |
) |
3,767 |
||||||||||
|
Aggreko PLC |
(58,615 |
) |
(52,140 |
) |
6,475 |
||||||||||
|
Berendsen PLC |
(27,705 |
) |
(27,587 |
) |
118 |
||||||||||
|
Cable & Wireless Communications PLC |
(32,992 |
) |
(32,623 |
) |
369 |
||||||||||
|
Centrica PLC |
(21,197 |
) |
(20,173 |
) |
1,024 |
||||||||||
|
Chemring Group PLC |
(16,903 |
) |
(17,283 |
) |
(380 |
) |
|||||||||
|
GlaxoSmithKline PLC |
(47,971 |
) |
(41,975 |
) |
5,996 |
||||||||||
|
Home Retail Group PLC |
(53,689 |
) |
(57,609 |
) |
(3,920 |
) |
|||||||||
|
Intertek Group PLC |
(22,513 |
) |
(21,134 |
) |
1,379 |
||||||||||
|
Iofina PLC |
(14,007 |
) |
(10,971 |
) |
3,036 |
||||||||||
|
John Wood Group PLC |
(19,478 |
) |
(18,228 |
) |
1,250 |
||||||||||
|
Legal & General Group PLC |
(40,025 |
) |
(38,326 |
) |
1,699 |
||||||||||
|
Lonmin PLC |
(54,706 |
) |
(43,467 |
) |
11,239 |
||||||||||
|
Marks & Spencer Group PLC |
(37,517 |
) |
(34,538 |
) |
2,979 |
||||||||||
|
Ocado Group PLC |
(67,139 |
) |
(82,911 |
) |
(15,772 |
) |
|||||||||
20
UBS Equity Long-Short Multi-Strategy Fund
Portfolio of investments
June 30, 2015
|
Portfolio swap positions (concluded) |
Notional Values7 |
Current Values8 |
Value9 |
||||||||||||
|
United Kingdom (concluded) |
|||||||||||||||
|
Serco Group PLC |
$ |
(24,812 |
) |
$ |
(21,316 |
) |
$ |
3,496 |
|||||||
|
Tesco PLC |
(76,565 |
) |
(76,068 |
) |
497 |
||||||||||
|
WM Morrison Supermarkets PLC |
(73,821 |
) |
(78,026 |
) |
(4,205 |
) |
|||||||||
|
Xcite Energy Ltd. |
(12,384 |
) |
(12,299 |
) |
85 |
||||||||||
|
Total United Kingdom |
(736,753 |
) |
(717,621 |
) |
19,132 |
||||||||||
|
United States |
|||||||||||||||
|
FuelCell Energy, Inc. |
(10,947 |
) |
(8,694 |
) |
2,253 |
||||||||||
|
Total Short Positions of Portfolio Swap |
(1,210,487 |
) |
(1,141,498 |
) |
68,989 |
||||||||||
|
Net Long and Short Positions of Portfolio Swap |
1,137,188 |
1,063,991 |
(73,197 |
) |
|||||||||||
|
Financing Costs and Other Receivables |
1,602 |
||||||||||||||
|
Net Swap Agreement, at value |
$ |
(71,595 |
) |
||||||||||||
The following is a summary of the fair valuations according to the inputs used as of June 30, 2015 in valuing the Fund's investments:
|
Description |
Unadjusted quoted prices in active markets for identical investments (Level 1) |
Other significant observable inputs (Level 2) |
Unobservable inputs (Level 3) |
Total |
|||||||||||||||
|
Assets |
|||||||||||||||||||
|
Common stocks |
$ |
15,113,570 |
$ |
100,522 |
$ |
35,737 |
$ |
15,249,829 |
|||||||||||
|
Preferred stocks |
100,724 |
— |
— |
100,724 |
|||||||||||||||
|
Short-term investment |
— |
4,158,148 |
— |
4,158,148 |
|||||||||||||||
|
Forward foreign currency contracts |
— |
10,734 |
— |
10,734 |
|||||||||||||||
|
Total |
$ |
15,214,294 |
$ |
4,269,404 |
$ |
35,737 |
$ |
19,519,435 |
|||||||||||
|
Liabilities |
|||||||||||||||||||
|
Common stocks sold short |
$ |
(10,618,986 |
) |
$ |
— |
$ |
(17,417 |
) |
$ |
(10,636,403 |
) |
||||||||
|
Preferred stock |
(12,544 |
) |
— |
— |
(12,544 |
) |
|||||||||||||
|
Rights |
(1,052 |
) |
(2,093 |
) |
— |
(3,145 |
) |
||||||||||||
|
Forward foreign currency contracts |
— |
(19,653 |
) |
— |
(19,653 |
) |
|||||||||||||
|
Swap agreements, net |
— |
(71,595 |
) |
— |
(71,595 |
) |
|||||||||||||
|
Total |
$ |
(10,632,582 |
) |
$ |
(93,341 |
) |
$ |
(17,417 |
) |
$ |
(10,743,340 |
) |
|||||||
As of June 30, 2015, $100,522 of global depository receipts (common stocks) were classified within Level 2 of the fair value hierarchy. Valuations of global depository receipts are based primarily on the foreign market exchange price of the related underlying shares.
21
UBS Equity Long-Short Multi-Strategy Fund
Portfolio of investments
June 30, 2015
Level 3 Rollforward Disclosure
The following is a rollforward of the Fund's investments that were valued using unobservable inputs for the period.
|
Common stocks |
Total |
||||||||||
|
Assets |
|||||||||||
|
Beginning balance |
$ |
— |
$ |
— |
|||||||
|
Purchases |
— |
— |
|||||||||
|
Issuances |
— |
— |
|||||||||
|
Sales |
— |
— |
|||||||||
|
Accrued discounts (premiums) |
— |
— |
|||||||||
|
Total realized gain |
— |
— |
|||||||||
|
Change in net unrealized appreciation/depreciation |
— |
— |
|||||||||
|
Transfers into Level 310 |
35,737 |
35,737 |
|||||||||
|
Transfers out of Level 3 |
— |
— |
|||||||||
|
Ending balance |
$ |
35,737 |
$ |
35,737 |
|||||||
|
Common stocks |
Total |
||||||||||
|
Liabilities |
|||||||||||
|
Beginning balance |
$ |
— |
$ |
— |
|||||||
|
Purchases |
— |
— |
|||||||||
|
Issuances |
— |
— |
|||||||||
|
Sales |
— |
— |
|||||||||
|
Accrued discounts (premiums) |
— |
— |
|||||||||
|
Total realized gain |
— |
— |
|||||||||
|
Change in net unrealized appreciation/depreciation |
— |
— |
|||||||||
|
Transfers into Level 310 |
(17,417 |
) |
(17,417 |
) |
|||||||
|
Transfers out of Level 3 |
— |
— |
|||||||||
|
Ending balance |
$ |
(17,417 |
) |
$ |
(17,417 |
) |
|||||
The change in net unrealized appreciation/depreciation relating to the Level 3 investments held at June 30, 2015 was $(62,161).
Portfolio footnotes
* Non-income producing security.
1 All or a portion of these securities have been delivered to cover open short positions.
2 Security is being fair valued by a valuation committee under the direction of the Board of Trustees. At June 30, 2015, the value of these securities included $35,737 of long positions and $(17,417) of short positions.
3 Illiquid investment as of June 30, 2015.
4 Security exempt from registration pursuant to Regulation S under the Securities Act of 1933. Regulation S applies to securities offerings that are made outside of the United States and do not involve direct selling efforts in the United States. At June 30, 2015, the value of these securities amounted to $100,522 or 0.58% of net assets.
See accompanying notes to financial statements.
22
UBS Equity Long-Short Multi-Strategy Fund
Portfolio of investments
June 30, 2015
5 The table below details the Fund's investment in a fund advised by the same Advisor as the Fund. The Advisor does not earn a management fee from the affiliated UBS Relationship Fund.
|
Security description |
Value 06/30/14 |
Purchases during the year ended 06/30/15 |
Sales during the year ended 06/30/15 |
Value 06/30/15 |
Net income earned from affiliate for the year ended 06/30/15 |
||||||||||||||||||
|
UBS Cash Management Prime Relationship Fund |
$ |
3,208,627 |
$ |
11,129,432 |
$ |
10,179,911 |
$ |
4,158,148 |
$ |
3,311 |
|||||||||||||
6 The twelve month maturity dates are measured from the commencement of investment in each underlying portfolio swap market.
7 Notional value represents the market value (including any fees or commissions) of the long and short positions at the time they are established.
8 Current value represents the market value of these positions based on the securities' last sale or closing price on the principal exchange on which the securities are traded.
9 Value represents the unrealized gain (loss) of the positions at June 30, 2015.
10 Transfers into Level 3 represent the value at end of period. At June 30, 2015, securities were transferred from Level 2 to Level 3 based on unobservable inputs from an established pricing service.
See accompanying notes to financial statements.
23
UBS Global Sustainable Equity Fund
Portfolio performance
For the 12 months ended June 30, 2015, Class A shares of UBS Global Sustainable Equity Fund (the "Fund") gained 7.14% (Class A shares returned 1.26% after the deduction of the maximum sales charge), while Class P shares advanced 7.32%. The Fund's benchmark, the MSCI World Free Index (net) (the "Index") returned 1.43%. (Class P shares have lower expenses than other share classes in the series. Returns for all share classes over various time periods are shown on page 26; please note that these returns do not reflect the deduction of taxes that a shareholder would pay on Fund distributions or the redemption of Fund shares, while the Index returns do not reflect the deduction of fees and expenses.)
The Fund posted a positive absolute return and significantly outperformed its benchmark during the reporting period, primarily due to stock selection. Sector allocation was also beneficial, albeit to a lesser extent.
Portfolio performance summary1
What worked
• Stock selection drove the Fund's outperformance during the reporting period.
• NXP Semiconductors is a leading semiconductor chip manufacturer headquartered in the Netherlands. Its share price rose sharply during the reporting period and it was the leading contributor to the Fund's performance. The company's Near Field Communication (NFC) chip enables smartphones and other devices to establish radio communication with each other. During the reporting period, Apple introduced its extremely successful iPhone 6 with Apple Pay that uses NXP Semiconductors' NFC technology.
• Alnylam Pharmaceuticals is a US-based biopharmaceutical company that specializes in RNAi therapeutics and gene silencing technology. A number of developments helped its shares rally during the reporting period. (For additional details, see "Portfolio Highlights.")
• Eli Lilly and Co. is an American global pharmaceutical company. As was the case with Alnylam Pharmaceutical, it benefited from the development of several new drugs that have helped to lift its share price.
• UnitedHealth Group is a diversified managed health care company headquartered in the US. The company offers a spectrum of products and services through two operating businesses: UnitedHealthcare and Optum. Its shares rallied as the Supreme Court upheld key provisions associated with the Affordable Care Act. This eliminated an overhang on the stock and should help the company as it benefits by having more patients in the population.
• Sector allocation, overall, contributed to results. During the reporting period, overweights to information technology and health care, along with an underweight to energy, were the most beneficial to the Fund's relative performance. The Fund's overall sector allocations are a by-product of our bottom-up stock selection process.
What didn't work
• Several individual stocks had a negative impact on performance.
1 For a detailed commentary on the market environment in general during the reporting period, see page 3.
24
UBS Global Sustainable Equity Fund
• Premier Oil saw its share price decline sharply, and it was the largest detractor from the Fund performance during the reporting period. (For additional details, see "Portfolio Highlights.")
• Statoil is a multinational oil and gas company headquartered in Norway. It is a fully integrated petroleum company with operations in 36 countries. Its shares were also negatively impacted by falling oil prices, which subsequently resulted in Statoil canceling a number of projects.
• Schneider Electric is a European multinational corporation that specializes in electricity distribution and automation management. It also produces installation components for energy management. Its shares declined during the reporting period given concerns about the overall European economy. Nevertheless, we believe the company is extremely well-positioned.
• Teck Resources is a Canadian company that primarily mines metallurgical coal that is used for steel production. It was hurt by weakening steel production given overcapacity and moderating demand from China.
• Sector allocation decisions modestly detracted from performance. During the reporting period, underweights to consumer staples and financials were drags on the Fund's relative performance.
Portfolio highlights
• Alnylam Pharmaceuticals is a US-based biopharmaceutical company. The company's core focus is the development of novel therapeutics based on RNA interference, or RNAi, for genetically defined diseases. The company has a large pipeline of products, many of which received promising results in clinical tests during the reporting period. One such drug seeks to diminish and control the production of cholesterol in the liver.
• Chimerix is a development-stage biotechnology company advancing an antiviral treatment for double-stranded DNA viruses. The first indication is to treat cytomegalovirus in adult stem cell transplant patients, with data coming in 2015 and a handful of additional indications to follow. We believe the drug has greater market potential than Wall Street is currently recognizing. The use of the drug to treat Ebola could result in stockpiling and/or more rapid regulatory approval timelines to facilitate treatment of patients.
• Premier Oil is an independent UK oil company with gas and oil interests in the UK, Asia and Africa. The company's shares were negatively impacted by the overall decline in oil prices during the reporting period. We continue to believe the company is well-positioned.
• Micron Technology is one the largest manufacturers of chip memory in the world. Its shares came under pressure, as PC demand was weaker than expected. However, Micron Technology continues to generate positive cash flow, and we believe the company is structurally well-positioned and that our investment thesis remains intact.
This letter is intended to assist shareholders in understanding how the Fund performed during the 12 months ended June 30, 2015. The views and opinions in the letter were current as of August 14, 2015. They are not guarantees of future performance or investment results and should not be taken as investment advice. Investment decisions reflect a variety of factors, and we reserve the right to change our views about individual securities, sectors and markets at any time. As a result, the views expressed should not be relied upon as a forecast of the Fund's future investment intent. We encourage you to consult your financial advisor regarding your personal investment program.
Mutual funds are sold by prospectus only. You should read it carefully and consider a fund's investment objectives, risks, charges, expenses and other important information contained in the prospectus before investing. Prospectuses for most of our funds can be obtained from your financial advisor, by calling UBS Funds at 800-647 1568 or by visiting our Web site at www.ubs.com.
25
UBS Global Sustainable Equity Fund
Average annual total returns for periods ended 06/30/15 (unaudited)
|
1 year |
5 years |
10 years |
|||||||||||||
|
Before deducting maximum sales charge |
|||||||||||||||
|
Class A1 |
7.14 |
% |
10.07 |
% |
5.27 |
% |
|||||||||
|
Class C2 |
6.36 |
9.26 |
4.48 |
||||||||||||
|
Class P3 |
7.32 |
10.34 |
5.50 |
||||||||||||
|
After deducting maximum sales charge |
|||||||||||||||
|
Class A1 |
1.26 |
% |
8.82 |
% |
4.68 |
% |
|||||||||
|
Class C2 |
5.36 |
9.26 |
4.48 |
||||||||||||
|
MSCI World Free Index (net)4 |
1.43 |
% |
13.10 |
% |
6.38 |
% |
|||||||||
The annualized gross and net expense ratios, respectively, for each class of shares as in the October 28, 2014 prospectuses were as follows: Class A—2.74% and 1.25%; Class C—3.54% and 2.00%; Class P—2.45% and 1.00%. Net expenses reflect fee waivers and/or expense reimbursements, if any, pursuant to an agreement that is in effect to cap the expenses. UBS Global Asset Management (Americas) Inc., the Fund's investment advisor ("UBS Global AM (Americas)" or the "Advisor"), has agreed irrevocably to waive its fees and reimburse certain expenses (excluding expenses incurred through investment in other investment companies, interest, taxes, brokerage commissions and extraordinary expenses) so that the Fund's ordinary operating expenses (excluding expenses incurred through investment in other investment companies, interest, taxes, brokerage commissions and extraordinary expenses) do not exceed 1.25% for Class A shares, 2.00% for Class C shares and 1.00% for Class P shares. This fee waiver and expense arrangement may only be amended or terminated by shareholders.
1 Maximum sales charge for Class A shares is 5.5%. Class A shares bear ongoing 12b-1 service fees.
2 Maximum contingent deferred sales charge for Class C shares is 1% imposed on redemptions and is reduced to 0% after one year. Class C shares bear ongoing 12b-1 distribution and service fees.
3 Class P shares do not bear initial or contingent deferred sales charges or ongoing 12b-1 service and distribution fees, but Class P shares held through advisory programs may be subject to a program fee, which, if included, would have reduced performance.
4 The MSCI World Free Index (net) is a free float-adjusted market capitalization weighted index that is designed to measure the equity market performance of developed markets. Net total return indices reinvest dividends after the deduction of withholding taxes, using a tax rate applicable to non-resident institutional investors who do not benefit from double taxation treaties. The index is constructed and managed with a view to being fully investable from the perspective of international institutional investors. Investors should note that indices do not reflect the deduction of fees and expenses.
Prior to February 17, 2015, if an investor sold or exchanged shares less than 90 days after purchase, a redemption fee of 1.00% of the amount sold or exchanged was deducted at the time of the transaction, except as noted otherwise in the prospectus. For sales or exchanges taking place on or after February 17, 2015 but prior to August 3, 2015, there is a reduction in the redemption holding period from 90 days to 30 days. Effective August 3, 2015, the 1.00% redemption fee imposed on sales or exchanges of any class of shares of the funds made during the holding periods specified in the prospectus will be eliminated. Please refer to the prospectus for further information.
Past performance does not predict future performance, and the performance information provided does not reflect the deduction of taxes that a shareholder would pay on Fund distributions or the redemption of Fund shares. The return and principal value of an investment will fluctuate, so that an investor's shares, when redeemed, may be worth more or less than their original cost. Performance results assume reinvestment of all dividends and capital gain distributions at net asset value on the ex-dividend dates. Current performance may be higher or lower than the performance data quoted. For month-end performance figures, please visit http://globalam-us.ubs.com/corpweb/performance.do.
26
UBS Global Sustainable Equity Fund
Illustration of an assumed investment of $10,000 in Class A shares (adjusted for 5.5% maximum sales charge) and $5,000,000 in Class P shares (unaudited)
The following two graphs depict the performance of UBS Global Sustainable Equity Fund Class A and Class P shares versus the MSCI World Free Index (net) over the 10 years ended June 30, 2015. The performance of Class C shares will vary based upon the different class specific expenses and sales charges. The performance provided does not reflect the deduction of taxes that a shareholder would pay on Fund distributions or the redemption of Fund shares. Past performance is no guarantee of future results. Share price and returns will vary with market conditions; investors may realize a gain or loss upon redemption.
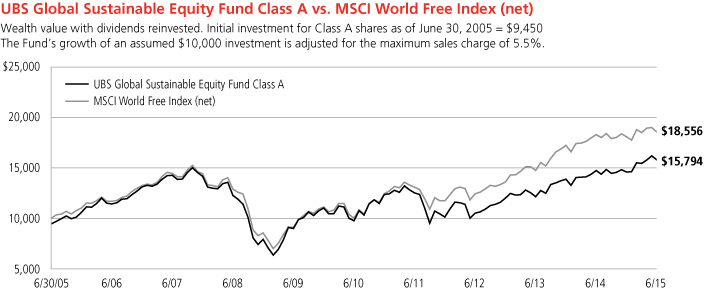
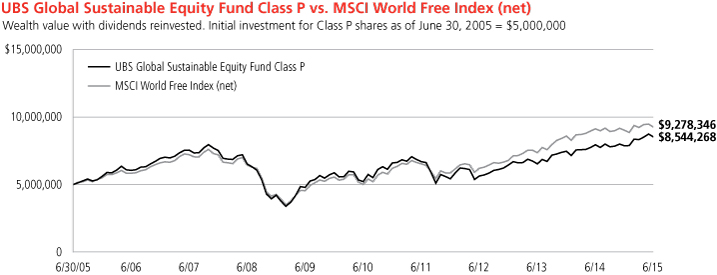
Past performance does not predict future performance, and the performance information provided does not reflect the deduction of taxes that a shareholder would pay on Fund distributions or the redemption of Fund shares. The return and principal value of an investment will fluctuate, so that an investor's shares, when redeemed, may be worth more or less than their original cost. Performance results assume reinvestment of all dividends and capital gain distributions at net asset value on the ex-dividend dates. Current performance may be higher or lower than the performance data quoted. For month-end performance figures, please visit http://globalam-us.ubs.com/corpweb/performance.do.
27
UBS Global Sustainable Equity Fund
Top ten equity holdings (unaudited)
As of June 30, 2015
|
Percentage of net assets |
|||||||
|
NXP Semiconductors NV |
3.7 |
% |
|||||
|
KDDI Corp. |
2.7 |
||||||
|
Eli Lilly & Co. |
2.5 |
||||||
|
Check Point Software Technologies Ltd. |
2.5 |
||||||
|
LyondellBasell Industries NV, Class A |
2.5 |
||||||
|
Tokio Marine Holdings, Inc. |
2.3 |
||||||
|
HeidelbergCement AG |
2.2 |
||||||
|
Sumitomo Mitsui Financial Group, Inc. |
2.2 |
||||||
|
Taiwan Semiconductor Manufacturing Co., Ltd. ADR |
2.2 |
||||||
|
AP Moeller - Maersk A/S, Class B |
2.2 |
||||||
|
Total |
25.0 |
% |
|||||
Industry diversification (unaudited)
As a percentage of net assets as of June 30, 2015
|
Common stocks |
|||||||
|
Automobiles |
2.00 |
% |
|||||
|
Banks |
11.95 |
||||||
|
Biotechnology |
5.23 |
||||||
|
Capital markets |
1.06 |
||||||
|
Chemicals |
6.55 |
||||||
|
Commercial services & supplies |
0.91 |
||||||
|
Construction materials |
2.23 |
||||||
|
Consumer finance |
1.22 |
||||||
|
Containers & packaging |
0.72 |
||||||
|
Diversified telecommunication services |
1.70 |
||||||
|
Electrical equipment |
1.61 |
||||||
|
Food products |
1.60 |
||||||
|
Health care providers & services |
1.83 |
||||||
|
Hotels, restaurants & leisure |
1.80 |
||||||
|
Household durables |
3.93 |
||||||
|
Household products |
1.12 |
||||||
|
Insurance |
6.31 |
||||||
|
Internet & catalog retail |
0.77 |
||||||
|
IT services |
0.41 |
||||||
|
Life sciences tools & services |
1.04 |
||||||
|
Machinery |
4.92 |
||||||
|
Marine |
2.16 |
||||||
|
Media |
1.30 |
||||||
|
Metals & mining |
0.78 |
||||||
|
Multiline retail |
2.57 |
||||||
|
Oil, gas & consumable fuels |
4.91 |
||||||
|
Personal products |
0.94 |
||||||
|
Pharmaceuticals |
4.40 |
||||||
|
Real estate investment trust (REIT) |
0.87 |
||||||
|
Semiconductors & semiconductor equipment |
10.30 |
||||||
|
Software |
4.12 |
||||||
|
Technology hardware, storage & peripherals |
1.06 |
||||||
|
Trading companies & distributors |
0.56 |
||||||
|
Wireless telecommunication services |
2.70 |
||||||
|
Total common stocks |
95.58 |
% |
|||||
|
Preferred stock |
1.97 |
||||||
|
Short-term investment |
2.33 |
||||||
|
Investment of cash collateral from securities loaned |
3.00 |
||||||
|
Total investments |
102.88 |
% |
|||||
|
Liabilities, in excess of cash and other assets |
(2.88 |
) |
|||||
|
Net assets |
100.00 |
% |
|||||
Country exposure by issuer, top five (unaudited)
As of June 30, 2015
|
Percentage of net assets |
|||||||
|
United States |
33.8 |
% |
|||||
|
Japan |
14.8 |
||||||
|
United Kingdom |
9.8 |
||||||
|
Netherlands |
5.5 |
||||||
|
Germany |
4.9 |
||||||
|
Total |
68.8 |
% |
|||||
28
UBS Global Sustainable Equity Fund
Portfolio of investments
June 30, 2015
|
Shares |
Value |
||||||||||
|
Common stocks: 95.58% |
|||||||||||
|
Australia: 0.91% |
|||||||||||
|
Brambles Ltd. |
29,147 |
$ |
238,377 |
||||||||
|
Austria: 0.76% |
|||||||||||
|
OMV AG |
7,263 |
199,838 |
|||||||||
|
Canada: 0.28% |
|||||||||||
|
Teck Resources Ltd., Class B |
7,400 |
73,348 |
|||||||||
|
Denmark: 2.16% |
|||||||||||
|
AP Moeller - Maersk A/S, Class B |
312 |
565,077 |
|||||||||
|
France: 3.22% |
|||||||||||
|
Danone SA |
6,480 |
418,933 |
|||||||||
|
Schneider Electric SE |
6,115 |
422,196 |
|||||||||
|
Total France common stocks |
841,129 |
||||||||||
|
Germany: 2.98% |
|||||||||||
|
HeidelbergCement AG |
7,355 |
583,246 |
|||||||||
|
SAP SE |
2,789 |
194,643 |
|||||||||
|
Total Germany common stocks |
777,889 |
||||||||||
|
Israel: 4.05% |
|||||||||||
|
Check Point Software Technologies Ltd.* |
8,250 |
656,288 |
|||||||||
|
Mellanox Technologies Ltd.* |
8,300 |
403,297 |
|||||||||
|
Total Israel common stocks |
1,059,585 |
||||||||||
|
Italy: 1.25% |
|||||||||||
|
Intesa Sanpaolo SpA |
90,136 |
326,787 |
|||||||||
|
Japan: 14.76% |
|||||||||||
|
Hino Motors Ltd. |
17,800 |
220,200 |
|||||||||
|
Kao Corp. |
5,300 |
246,541 |
|||||||||
|
KDDI Corp. |
29,300 |
707,212 |
|||||||||
|
Makita Corp. |
3,700 |
200,744 |
|||||||||
|
Panasonic Corp. |
25,200 |
346,234 |
|||||||||
|
Shin-Etsu Chemical Co., Ltd. |
4,400 |
273,200 |
|||||||||
|
Sumitomo Mitsui Financial Group, Inc. |
13,000 |
579,867 |
|||||||||
|
THK Co., Ltd. |
14,200 |
307,008 |
|||||||||
|
Tokio Marine Holdings, Inc. |
14,300 |
595,205 |
|||||||||
|
Toyota Motor Corp. |
5,700 |
382,049 |
|||||||||
|
Total Japan common stocks |
3,858,260 |
||||||||||
|
Netherlands: 5.48% |
|||||||||||
|
Koninklijke DSM NV1 |
8,217 |
476,358 |
|||||||||
|
NXP Semiconductors NV* |
9,750 |
957,450 |
|||||||||
|
Total Netherlands common stocks |
1,433,808 |
||||||||||
|
Norway: 3.66% |
|||||||||||
|
Norsk Hydro ASA |
30,895 |
130,232 |
|||||||||
|
Statoil ASA1 |
21,447 |
383,234 |
|||||||||
|
Shares |
Value |
||||||||||
|
Telenor ASA |
20,297 |
$ |
444,748 |
||||||||
|
Total Norway common stocks |
958,214 |
||||||||||
|
Spain: 3.78% |
|||||||||||
|
Banco Bilbao Vizcaya Argentaria SA |
40,114 |
393,188 |
|||||||||
|
Banco Santander SA |
37,124 |
259,252 |
|||||||||
|
Mediaset Espana Comunicacion SA |
25,640 |
336,014 |
|||||||||
|
Total Spain common stocks |
988,454 |
||||||||||
|
Sweden: 3.19% |
|||||||||||
|
Lundin Petroleum AB* |
18,424 |
315,592 |
|||||||||
|
Nordea Bank AB |
41,491 |
517,521 |
|||||||||
|
Total Sweden common stocks |
833,113 |
||||||||||
|
Switzerland: 3.29% |
|||||||||||
|
Novartis AG |
4,993 |
492,117 |
|||||||||
|
Zurich Insurance Group AG* |
1,208 |
367,717 |
|||||||||
|
Total Switzerland common stocks |
859,834 |
||||||||||
|
Taiwan: 2.21% |
|||||||||||
|
Taiwan Semiconductor Manufacturing Co., Ltd. ADR1 |
25,400 |
576,834 |
|||||||||
|
United Kingdom: 9.76% |
|||||||||||
|
Aberdeen Asset Management PLC |
43,515 |
276,227 |
|||||||||
|
Aviva PLC |
59,506 |
460,482 |
|||||||||
|
Berkeley Group Holdings PLC |
7,502 |
394,410 |
|||||||||
|
Compass Group PLC |
28,463 |
470,928 |
|||||||||
|
Next PLC |
3,241 |
379,385 |
|||||||||
|
Premier Oil PLC* |
60,411 |
141,527 |
|||||||||
|
Rotork PLC |
117,599 |
429,792 |
|||||||||
|
Total United Kingdom common stocks |
2,552,751 |
||||||||||
|
United States: 33.84% |
|||||||||||
|
Acorda Therapeutics, Inc.* |
7,985 |
266,140 |
|||||||||
|
Alnylam Pharmaceuticals, Inc.* |
3,178 |
380,947 |
|||||||||
|
Amazon.com, Inc.* |
466 |
202,286 |
|||||||||
|
American Express Co. |
4,110 |
319,429 |
|||||||||
|
Apple, Inc. |
2,217 |
278,067 |
|||||||||
|
Applied Materials, Inc. |
10,893 |
209,364 |
|||||||||
|
Bio-Rad Laboratories, Inc., Class A* |
1,795 |
270,345 |
|||||||||
|
Bluebird Bio, Inc.* |
575 |
96,813 |
|||||||||
|
Broadcom Corp., Class A |
5,554 |
285,975 |
|||||||||
|
Chimerix, Inc.* |
9,516 |
439,639 |
|||||||||
|
Citigroup, Inc. |
3,830 |
211,569 |
|||||||||
|
Colfax Corp.*1 |
2,800 |
129,220 |
|||||||||
|
Digital Realty Trust, Inc. |
3,400 |
226,712 |
|||||||||
|
Eli Lilly & Co. |
7,875 |
657,484 |
|||||||||
|
Envision Healthcare Holdings, Inc.* |
3,600 |
142,128 |
|||||||||
|
Ford Motor Co. |
9,393 |
140,989 |
|||||||||
|
Lexicon Pharmaceuticals, Inc.*1 |
22,909 |
184,417 |
|||||||||
|
LyondellBasell Industries NV, Class A |
6,300 |
652,176 |
|||||||||
29
UBS Global Sustainable Equity Fund
Portfolio of investments
June 30, 2015
|
Shares |
Value |
||||||||||
|
Common stocks—(Concluded) |
|||||||||||
|
United States—(Concluded) |
|||||||||||
|
Macy's, Inc. |
4,325 |
$ |
291,808 |
||||||||
|
MetLife, Inc. |
4,052 |
226,872 |
|||||||||
|
Micron Technology, Inc.* |
13,805 |
260,086 |
|||||||||
|
PDC Energy, Inc.* |
4,535 |
243,257 |
|||||||||
|
PNC Financial Services Group, Inc. |
3,927 |
375,618 |
|||||||||
|
Praxair, Inc. |
2,596 |
310,352 |
|||||||||
|
Procter & Gamble Co. |
3,735 |
292,226 |
|||||||||
|
Rock-Tenn Co., Class A |
3,119 |
187,764 |
|||||||||
|
ServiceSource International, Inc.* |
19,747 |
108,016 |
|||||||||
|
Symantec Corp. |
9,756 |
226,827 |
|||||||||
|
United Rentals, Inc.* |
1,685 |
147,640 |
|||||||||
|
UnitedHealth Group, Inc. |
2,767 |
337,574 |
|||||||||
|
US Bancorp |
10,593 |
459,736 |
|||||||||
|
Whirlpool Corp. |
1,649 |
285,359 |
|||||||||
|
Total United States common stocks |
8,846,835 |
||||||||||
|
Total common stocks (cost $22,873,743) |
24,990,133 |
||||||||||
|
Shares |
Value |
||||||||||
|
Preferred stock: 1.97% |
|||||||||||
|
Germany: 1.97% |
|||||||||||
|
Volkswagen AG, Preference shares (cost $496,813) |
2,225 |
$ |
515,952 |
||||||||
|
Short-term investment: 2.33% |
|||||||||||
|
Investment company: 2.33% |
|||||||||||
|
UBS Cash Management Prime Relationship Fund2 (cost $608,651) |
608,651 |
608,651 |
|||||||||
|
Investment of cash collateral from securities loaned: 3.00% |
|||||||||||
|
UBS Private Money Market Fund LLC2 (cost $785,656) |
785,656 |
785,656 |
|||||||||
|
Total investments: 102.88% (cost $24,764,863) |
26,900,392 |
||||||||||
|
Liabilities, in excess of cash and other assets: (2.88)% |
(754,176 |
) |
|||||||||
|
Net assets: 100.00% |
$ |
26,146,216 |
|||||||||
Notes to portfolio of investments
Aggregate cost for federal income tax purposes was $24,784,546; and net unrealized appreciation consisted of:
|
Gross unrealized appreciation |
$ |
3,335,647 |
|||||
|
Gross unrealized depreciation |
(1,219,801 |
) |
|||||
|
Net unrealized appreciation of investments |
$ |
2,115,846 |
|||||
For a listing of defined portfolio acronyms, counterparty abbreviations and currency abbreviations that are used throughout the Portfolio of investments as well as the tables that follow, please refer to page 71. Portfolio footnotes begin on page 31.
The following is a summary of the fair valuations according to the inputs used as of June 30, 2015 in valuing the Fund's investments:
|
Description |
Unadjusted quoted prices in active markets for identical investments (Level 1) |
Other significant observable inputs (Level 2) |
Unobservable inputs (Level 3) |
Total |
|||||||||||||||
|
Assets |
|||||||||||||||||||
|
Common stocks |
$ |
24,990,133 |
$ |
— |
$ |
— |
$ |
24,990,133 |
|||||||||||
|
Preferred stock |
515,952 |
— |
— |
515,952 |
|||||||||||||||
|
Short-term investment |
— |
608,651 |
— |
608,651 |
|||||||||||||||
|
Investment of cash collateral from securities loaned |
— |
785,656 |
— |
785,656 |
|||||||||||||||
|
Total |
$ |
25,506,085 |
$ |
1,394,307 |
$ |
— |
$ |
26,900,392 |
|||||||||||
At June 30, 2015, there were no transfers between Level 1 and Level 2.
30
UBS Global Sustainable Equity Fund
Portfolio of investments
June 30, 2015
Portfolio footnotes
* Non-income producing security.
1 Security, or portion thereof, was on loan at June 30, 2015.
2 The table below details the Fund's investments in funds advised by the same Advisor as the Fund. The Advisor does not earn a management fee from the affiliated UBS Relationship Funds.
|
Security description |
Value 06/30/14 |
Purchases during the year ended 06/30/15 |
Sales during the year ended 06/30/15 |
Value 06/30/15 |
Net income earned from affiliate for the year ended 06/30/15 |
||||||||||||||||||
|
UBS Cash Management Prime Relationship Fund |
$ |
328,482 |
$ |
7,175,070 |
$ |
6,894,901 |
$ |
608,651 |
$ |
310 |
|||||||||||||
|
UBS Private Money Market Fund LLCa |
103,482 |
8,752,545 |
8,070,371 |
785,656 |
31 |
||||||||||||||||||
|
$ |
431,964 |
$ |
15,927,615 |
$ |
14,965,272 |
$ |
1,394,307 |
$ |
341 |
||||||||||||||
a The Advisor earns a management fee from this affiliated fund. Please see the Notes to financial statements for further information.
See accompanying notes to financial statements.
31
UBS U.S. Defensive Equity Fund
Portfolio performance
For the 12 months ended June 30, 2015, Class A shares of UBS U.S. Defensive Equity Fund (the "Fund") returned 8.33% (Class A shares returned 2.36% after the deduction of the maximum sales charge), while Class P shares returned 8.55%. The Fund's benchmark, the Russell 1000 Index (the "Index"), returned 7.37% over the same time period. (Class P shares have lower expenses than other share classes of the Fund. Returns for all share classes over various time periods are shown on page 35; please note that the Fund's returns do not reflect the deduction of taxes that a shareholder would pay on Fund distributions or the redemption of Fund shares, while the Index returns do not reflect the deduction of fees and expenses.)
The Fund outperformed the Index primarily due to stock selection decisions.
Portfolio performance summary1
What worked
• An overweight to the health care sector, along with strong stock selection within the sector, made a significant contribution to Fund performance. While health care was the best-performing sector in the benchmark index, the Fund benefitted from holding several names in particular.
– Shares of Hospira, Inc. were up 70% during the reporting period. The generic drug company, which provides injectables and infusion technologies, saw its share price rally after Pfizer announced plans to acquire Hospira at a significant premium. We sold the position after that announcement, as the stock reached what we consider fair value.
– Impax Laboratories was a top contributor to relative returns for the 12-month period. The generic drug company has been attempting to develop a branded business for several years. The news that the Food & Drug Administration (FDA) had approved the company's first branded drug RYTARY, an extended-release capsule for the treatment of Parkinson's disease, led the stock to trade higher.
– Chimerix made a strong contribution to Fund performance. The development-stage biotech company boasts a promising drug pipeline that includes an antiviral treatment recently used to treat Ebola.
• The Fund's information technology stocks, particularly the semiconductor names, were positive for performance during the reporting period.
– Freescale Semiconductor was the Fund's top-performing stock during the 12 months. Shares climbed 80% after the company reported strong fourth quarter earnings and a revenue outlook that exceeded market expectations. News of Freescale's acquisition by NXP Semiconductors gave the stock an additional boost, as the deal will create the largest supplier of microchips in the automotive industry. We realized our investment thesis and sold the stock before the end of the period.
1 For a detailed commentary on the market environment in general during the reporting period, see page 3.
32
UBS U.S. Defensive Equity Fund
• Several individual stocks made strong positive contributions to relative returns.
– Shares of Pacific DataVision rose 111% during the 12-month period. Pacific DataVision began as a private placement that was intended to fund the potential acquisition of Sprint's wireless spectrum, which would be used to build a nationwide push-to-talk wireless network and consolidate 4G networks. The Fund's position was contingent on the Sprint spectrum acquisition closing and receiving FCC approval. Now that those milestones have passed, an initial public offering (IPO) is imminent.
• The Fund benefited from the decision not to hold utilities stocks. The sector posted negative returns during the 12 months, which helped the Fund's relative performance.
What didn't work
• Several energy stocks detracted from Fund returns during the 12 months. We believe the market is overreacting to the decline in oil prices, as we have identified attractive opportunities within the exploration and production (E&P) sector.
– Shares of Noble Corporation declined 43% for the 12-month period. Calendar year 2014 presented a difficult environment for offshore drillers, with challenging trends in the number of uncontracted new-build deliveries, rigs rolling off contracts, and operator sublets. As a result, these companies have seen intense competition, falling day rates and rig retirements, all of which exerted downward pressure on Noble's stock price.
– EOG Resources saw its share price struggle as a result of oil price volatility. We remain confident in our long-term thesis and consider EOG Resources best of breed among E&P companies.
– McDermott International also detracted from relative returns. The company reported significant operating losses and indicated that the trend would continue in the near term based on the current environment for companies in the oil and gas industry.
• Several individual stock positions in various industries made a negative contribution to the Fund's returns. Industry weightings did not have any noteworthy negative effects.
– Micron Technology was a top detractor, declining 43% during the period. The semiconductor company indicated an outlook for the fiscal fourth quarter that was worse than expected. While Micron is wrestling with increased costs for product line transitions, we believe the company and its industry are better positioned than at any time in the past. We maintain high conviction in our thesis for Micron, and continue to hold the position.
– Shares of Hertz Global Holdings traded lower during the 12-month period. The car rental company's stock price declined following accounting issues and recent board changes. Given consolidation within the rental car industry, we believe Hertz can realize cost efficiencies and better buying and selling of car inventory, which should lead to margin improvement over the long run.
Portfolio highlights
• Mondelez International manufactures and markets snack food and beverages including cookies, crackers, chocolate, gum, candy, coffee, powdered beverages, and various cheese and grocery products. We believe Mondelez is well-positioned for growth due to its significant exposure to developing markets. We think there is an opportunity for margin expansion from a rebound in Europe and by leveraging synergies across distribution platforms.
33
UBS U.S. Defensive Equity Fund
• Yum! Brands is the leading multi-concept global restaurant company. Its three main concepts are KFC, Taco Bell and Pizza Hut. Our research indicates that the market is undervaluing the long-term value of the KFC and Pizza Hut franchises in China. Unit growth in China has accelerated in recent years as a result of prior investment in infrastructure. This should allow for more rapid growth in smaller cities. We expect Yum! to continue to grow earnings per share by double digits for the next several years through a combination of strong international growth and return of capital to shareholders through dividends and share repurchases.
• Laboratory Corp. of America is a global independent clinical laboratory company. It has significantly underperformed the S&P 500 Index due to a weak utilization environment combined with overhang from government reimbursement pressures. Longer-term, we believe national labs such as Laboratory Corp. stand to grow market share at the expense of higher-cost independent and hospital-owned labs. This trend, combined with the company's cost reduction efforts, should allow Laboratory Corp. to return to operating margins near 20%.
• Philip Morris is a leading player in the global cigarette and tobacco market. We believe the market underappreciates the persistence and predictability of the company's cash flows and its returns to shareholders. Philip Morris's regulatory and consumption risk is well-diversified across 180 markets around the globe. While governments have an interest in reducing tobacco consumption, they have become reliant on steady tobacco tax flows. Many governments are working with Philip Morris to encourage steady but slow declines in consumption while growing taxation and price revenues.
• Praxair produces, sells and distributes atmospheric, process and specialty gases, as well as surface coatings. We believe the company has a high-quality franchise with local scale and density-based competitive advantages in attractive markets such as North America and Brazil. Praxair's strong management team and culture drive best-in-class operating efficiency and strategic capital deployment. In addition, the company's stable cash flow profile allows Praxair to issue large amounts of debt cheaply, creating capital deployment arbitrage opportunities.
This letter is intended to assist shareholders in understanding how the Fund performed during the 12 months ended June 30, 2015. The views and opinions in the letter were current as of August 14, 2015. They are not guarantees of future performance or investment results and should not be taken as investment advice. Investment decisions reflect a variety of factors, and we reserve the right to change our views about individual securities, sectors and markets at any time. As a result, the views expressed should not be relied upon as a forecast of the Fund's future investment intent. We encourage you to consult your financial advisor regarding your personal investment program.
Mutual funds are sold by prospectus only. You should read it carefully and consider a fund's investment objectives, risks, charges, expenses and other important information contained in the prospectus before investing. Prospectuses for most of our funds can be obtained from your financial advisor, by calling UBS Funds at 800-647 1568 or by visiting our Web site at www.ubs.com.
34
UBS U.S. Defensive Equity Fund
Average annual total returns for periods ended 06/30/15 (unaudited)
|
1 year |
5 years |
Inception1 |
|||||||||||||
|
Before deducting maximum sales charge |
|||||||||||||||
|
Class A2 |
8.33 |
% |
14.75 |
% |
4.83 |
% |
|||||||||
|
Class C3 |
7.52 |
13.91 |
4.05 |
||||||||||||
|
Class P4 |
8.55 |
15.04 |
5.08 |
||||||||||||
|
After deducting maximum sales charge |
|||||||||||||||
|
Class A2 |
2.36 |
% |
13.46 |
% |
4.16 |
% |
|||||||||
|
Class C3 |
6.52 |
13.91 |
4.05 |
||||||||||||
|
Russell 1000 Index5 |
7.37 |
% |
17.58 |
% |
7.64 |
% |
|||||||||
The annualized gross and net expense ratios, respectively, for each class of shares as in the October 28, 2014 prospectuses were as follows: Class A—3.80% and 2.15%; Class C—4.61% and 2.90%; Class P—3.53% and 1.90%. Net expenses reflect fee waivers and/or expense reimbursements, if any, pursuant to an agreement that is in effect to cap the expenses. The Trust, with respect to the Fund, and UBS Global Asset Management (Americas) Inc., the Fund's investment advisor ("UBS Global AM (Americas)" or the "Advisor"), have entered into a written agreement pursuant to which the Advisor has agreed to waive a portion of its management fees and/or to reimburse expenses (excluding expenses incurred through investment in other investment companies, interest, taxes, brokerage commissions, extraordinary expenses, and dividend expense and security loan fees for securities sold short) to the extent necessary so that the Fund's ordinary operating expenses (excluding expenses incurred through investment in other investment companies, interest, taxes, brokerage commissions, extraordinary expenses, and dividend expense and security loan fees for securities sold short), through the period ending October 27, 2015, otherwise do not exceed 1.50% for Class A shares, 2.25% for Class C shares and 1.25% for Class P shares. Pursuant to the written agreement, the Advisor is entitled to be reimbursed for any fees it waives and expenses it reimburses for a period of three years following such fee waivers and expense reimbursements, to the extent that such reimbursement of the Advisor by the Fund will not cause the Fund to exceed any applicable expense limit that is in place for the Fund. The fee waiver/expense reimbursement agreement may be terminated by the Fund's Board of Trustees at any time and also will terminate automatically upon the expiration or termination of the Fund's advisory contract with the Advisor. Upon termination of the fee waiver/expense reimbursement agreement, however, UBS Global AM (Americas)'s three year recoupment rights will survive.
1 Inception date of all shares of UBS U.S. Defensive Equity Fund and the index is September 26, 2006.
2 Maximum sales charge for Class A shares is 5.5%. Class A shares bear ongoing 12b-1 service fees.
3 Maximum contingent deferred sales charge for Class C shares is 1% imposed on redemptions and is reduced to 0% after one year. Class C shares bear ongoing 12b-1 distribution and service fees.
4 Class P shares do not bear initial or contingent deferred sales charges or ongoing 12b-1 service and distribution fees, but Class P shares held through advisory programs may be subject to a program fee, which, if included, would have reduced performance.
5 The Russell 1000 Index is designed to measure the performance of the large-cap segment of the US equity universe. It is a subset of the Russell 3000 Index and includes approximately 1,000 of the largest securities based on a combination of their market cap and current index membership. The Russell 1000 Index is constructed to provide a comprehensive and unbiased barometer for the large-cap segment and is completely reconstituted annually to ensure new and growing equities are reflected. Investors should note that indices do not reflect the deduction of fees and expenses.
Prior to February 17, 2015, if an investor sold or exchanged shares less than 90 days after purchase, a redemption fee of 1.00% of the amount sold or exchanged was deducted at the time of the transaction, except as noted otherwise in the prospectus. For sales or exchanges taking place on or after February 17, 2015 but prior to August 3, 2015, there is a reduction in the redemption holding period from 90 days to 30 days. Effective August 3, 2015, the 1.00% redemption fee imposed on sales or exchanges of any class of shares of the funds made during the holding periods specified in the prospectus will be eliminated. Please refer to the prospectus for further information.
Past performance does not predict future performance, and the performance information provided does not reflect the deduction of taxes that a shareholder would pay on Fund distributions or the redemption of Fund shares. The return and principal value of an investment will fluctuate, so that an investor's shares, when redeemed, may be worth more or less than their original cost. Performance results assume reinvestment of all dividends and capital gain distributions at net asset value on the ex-dividend dates. Current performance may be higher or lower than the performance data quoted. For month-end performance figures, please visit http://globalam-us.ubs.com/corpweb/performance.do.
35
UBS U.S. Defensive Equity Fund
Illustration of an assumed investment of $10,000 in Class A shares (adjusted for 5.5% maximum sales charge) and $5,000,000 in Class P shares (unaudited)
The following two graphs depict the performance of UBS U.S. Defensive Equity Fund Class A and Class P shares versus the Russell 1000 Index from September 26, 2006, which is the inception date of the two classes, through June 30, 2015. The performance of Class C shares will vary based upon the class specific expenses and sales charges. The performance provided does not reflect the deduction of taxes that a shareholder would pay on Fund distributions or the redemption of Fund shares. Past performance is no guarantee of future results. Share price and returns will vary with market conditions; investors may realize a gain or loss upon redemption.
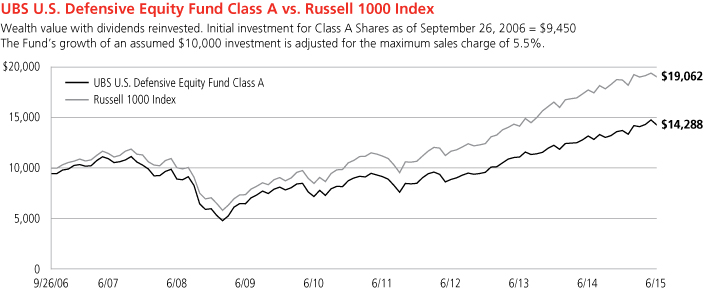
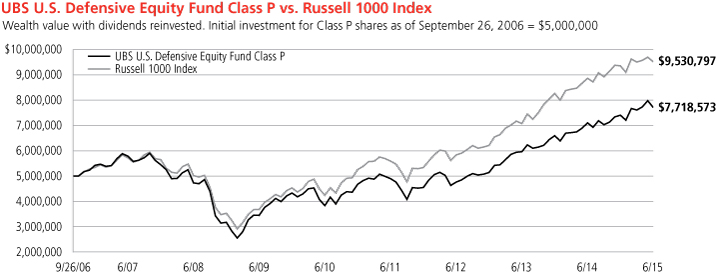
Past performance does not predict future performance, and the performance information provided does not reflect the deduction of taxes that a shareholder would pay on Fund distributions or the redemption of Fund shares. The return and principal value of an investment will fluctuate, so that an investor's shares, when redeemed, may be worth more or less than their original cost. Performance results assume reinvestment of all dividends and capital gain distributions at net asset value on the ex-dividend dates. Current performance may be higher or lower than the performance data quoted. For month-end performance figures, please visit http://globalam-us.ubs.com/corpweb/performance.do.
36
UBS U.S. Defensive Equity Fund
Top ten equity holdings (unaudited)1
As of June 30, 2015
|
Percentage of net assets |
|||||||
|
Mondelez International, Inc., Class A |
3.3 |
% |
|||||
|
Philip Morris International, Inc. |
2.8 |
||||||
|
JPMorgan Chase & Co. |
2.8 |
||||||
|
Walt Disney Co. |
2.8 |
||||||
|
Yum! Brands, Inc. |
2.7 |
||||||
|
UnitedHealth Group, Inc. |
2.6 |
||||||
|
Amazon.com, Inc. |
2.6 |
||||||
|
PepsiCo, Inc. |
2.5 |
||||||
|
Eli Lilly & Co. |
2.4 |
||||||
|
General Electric Co. |
2.4 |
||||||
|
Total |
26.9 |
% |
|||||
1 Only long positions are considered for top ten holdings.
37
UBS U.S. Defensive Equity Fund
Industry diversification (unaudited)
As a percentage of net assets as of June 30, 2015
|
Common stocks |
|||||||
|
Automobiles |
2.86 |
% |
|||||
|
Banks |
9.55 |
||||||
|
Beverages |
2.52 |
||||||
|
Biotechnology |
6.53 |
||||||
|
Capital markets |
2.14 |
||||||
|
Chemicals |
3.47 |
||||||
|
Communications equipment |
0.98 |
||||||
|
Consumer finance |
4.04 |
||||||
|
Diversified telecommunication services |
1.48 |
||||||
|
Electronic equipment, instruments & components |
3.50 |
||||||
|
Energy equipment & services |
2.16 |
||||||
|
Food & staples retailing |
2.49 |
||||||
|
Food products |
3.30 |
||||||
|
Health care equipment & supplies |
1.58 |
||||||
|
Health care providers & services |
6.30 |
||||||
|
Hotels, restaurants & leisure |
2.73 |
||||||
|
Household durables |
2.51 |
||||||
|
Industrial conglomerates |
3.81 |
||||||
|
Insurance |
5.59 |
||||||
|
Internet & catalog retail |
2.56 |
||||||
|
Internet software & services |
2.11 |
||||||
|
IT services |
2.66 |
||||||
|
Life sciences tools & services |
1.26 |
||||||
|
Machinery |
2.00 |
||||||
|
Media |
4.56 |
||||||
|
Oil, gas & consumable fuels |
6.23 |
||||||
|
Pharmaceuticals |
10.12 |
||||||
|
Real estate investment trust (REIT) |
3.30 |
||||||
|
Road & rail |
3.95 |
||||||
|
Semiconductors & semiconductor equipment |
9.88 |
||||||
|
Software |
3.95 |
||||||
|
Specialty retail |
1.22 |
||||||
|
Technology hardware, storage & peripherals |
4.28 |
||||||
|
Tobacco |
2.81 |
||||||
|
Trading companies & distributors |
1.75 |
||||||
|
Total common stocks |
130.18 |
% |
|||||
|
Investment company |
|||||||
|
Short-term investment |
5.77 |
||||||
|
Options purchased |
0.62 |
||||||
|
Total investments before investments sold short |
136.57 |
% |
|||||
|
Investments sold short |
|||||||
|
Common stocks |
|||||||
|
Banks |
(2.59 |
)% |
|||||
|
Beverages |
(1.13 |
) |
|||||
|
Biotechnology |
(2.82 |
) |
|||||
|
Capital markets |
(2.49 |
) |
|||||
|
Commercial services & supplies |
(1.42 |
) |
|||||
|
Communications equipment |
(0.82 |
) |
|||||
|
Diversified telecommunication services |
(0.40 |
) |
|||||
|
Electronic equipment, instruments & components |
(1.12 |
) |
|||||
|
Energy equipment & services |
(0.18 |
) |
|||||
|
Food products |
(0.38 |
) |
|||||
|
Health care equipment & supplies |
(2.18 |
) |
|||||
|
Health care providers & services |
(1.38 |
) |
|||||
|
Hotels, restaurants & leisure |
(2.18 |
) |
|||||
|
Household products |
(0.31 |
) |
|||||
|
Insurance |
(0.90 |
) |
|||||
|
Internet software & services |
(1.16 |
) |
|||||
|
IT services |
(0.83 |
) |
|||||
|
Life sciences tools & services |
(1.42 |
) |
|||||
|
Media |
(0.51 |
) |
|||||
|
Oil, gas & consumable fuels |
(0.19 |
) |
|||||
|
Pharmaceuticals |
(1.54 |
) |
|||||
|
Real estate investment trust (REIT) |
(0.19 |
) |
|||||
|
Semiconductors & semiconductor equipment |
(1.99 |
) |
|||||
|
Software |
(2.03 |
) |
|||||
|
Specialty retail |
(0.81 |
) |
|||||
|
Technology hardware, storage & peripherals |
(0.38 |
) |
|||||
|
Textiles, apparel & luxury goods |
(0.58 |
) |
|||||
|
Thrifts & mortgage finance |
(0.38 |
) |
|||||
|
Total investments sold short |
(32.31 |
)% |
|||||
|
Total investments, net of investments sold short |
104.26 |
||||||
|
Liabilities, in excess of cash and other assets |
(4.26 |
) |
|||||
|
Net assets |
100.00 |
% |
|||||
38
UBS U.S. Defensive Equity Fund
Portfolio of investments
June 30, 2015
|
Shares |
Value |
||||||||||
|
Common stocks: 130.18% |
|||||||||||
|
Automobiles: 2.86% |
|||||||||||
|
Ford Motor Co.1 |
13,230 |
$ |
198,582 |
||||||||
|
General Motors Co.1 |
8,486 |
282,839 |
|||||||||
|
481,421 |
|||||||||||
|
Banks: 9.55% |
|||||||||||
|
Citigroup, Inc.1 |
7,047 |
389,276 |
|||||||||
|
Fifth Third Bancorp1 |
9,138 |
190,253 |
|||||||||
|
JPMorgan Chase & Co.1 |
6,884 |
466,460 |
|||||||||
|
US Bancorp1 |
8,588 |
372,719 |
|||||||||
|
Wells Fargo & Co.1 |
3,360 |
188,967 |
|||||||||
|
1,607,675 |
|||||||||||
|
Beverages: 2.52% |
|||||||||||
|
PepsiCo, Inc.1 |
4,551 |
424,790 |
|||||||||
|
Biotechnology: 6.53% |
|||||||||||
|
Acorda Therapeutics, Inc.*1 |
5,710 |
190,314 |
|||||||||
|
Alnylam Pharmaceuticals, Inc.*1 |
2,484 |
297,757 |
|||||||||
|
Atara Biotherapeutics, Inc.*1 |
1,203 |
63,470 |
|||||||||
|
Bluebird Bio, Inc.*1 |
251 |
42,261 |
|||||||||
|
Chimerix, Inc.*1 |
7,268 |
335,782 |
|||||||||
|
Lexicon Pharmaceuticals, Inc.*1 |
15,782 |
127,045 |
|||||||||
|
MacroGenics, Inc.*1 |
600 |
22,782 |
|||||||||
|
Regulus Therapeutics, Inc.*1 |
1,700 |
18,632 |
|||||||||
|
1,098,043 |
|||||||||||
|
Capital markets: 2.14% |
|||||||||||
|
Invesco Ltd.1 |
5,180 |
194,198 |
|||||||||
|
Morgan Stanley1 |
4,270 |
165,634 |
|||||||||
|
359,832 |
|||||||||||
|
Chemicals: 3.47% |
|||||||||||
|
Monsanto Co.1 |
1,746 |
186,106 |
|||||||||
|
Praxair, Inc.1 |
3,322 |
397,145 |
|||||||||
|
583,251 |
|||||||||||
|
Communications equipment: 0.98% |
|||||||||||
|
Arista Networks, Inc.* |
2,011 |
164,379 |
|||||||||
|
Consumer finance: 4.04% |
|||||||||||
|
American Express Co.1 |
3,783 |
294,015 |
|||||||||
|
Capital One Financial Corp.1 |
4,382 |
385,484 |
|||||||||
|
679,499 |
|||||||||||
|
Diversified telecommunication services: 1.48% |
|||||||||||
|
Pacific DataVision, Inc.*1,2 |
5,900 |
248,567 |
|||||||||
|
Electronic equipment, instruments & components: 3.50% |
|||||||||||
|
CDW Corp. |
5,692 |
195,122 |
|||||||||
|
Dolby Laboratories, Inc., Class A |
5,126 |
203,399 |
|||||||||
|
Shares |
Value |
||||||||||
|
Jabil Circuit, Inc.1 |
8,917 |
$ |
189,843 |
||||||||
|
588,364 |
|||||||||||
|
Energy equipment & services: 2.16% |
|||||||||||
|
Halliburton Co.1 |
3,140 |
135,240 |
|||||||||
|
McDermott International, Inc.*1 |
19,670 |
105,038 |
|||||||||
|
Noble Corp. PLC1 |
8,030 |
123,581 |
|||||||||
|
363,859 |
|||||||||||
|
Food & staples retailing: 2.49% |
|||||||||||
|
Rite Aid Corp.*1 |
14,330 |
119,655 |
|||||||||
|
Walgreens Boots Alliance, Inc.1 |
3,540 |
298,918 |
|||||||||
|
418,573 |
|||||||||||
|
Food products: 3.30% |
|||||||||||
|
Mondelez International, Inc., Class A1 |
13,477 |
554,444 |
|||||||||
|
Health care equipment & supplies: 1.58% |
|||||||||||
|
HeartWare International, Inc.*1 |
1,470 |
106,854 |
|||||||||
|
Thoratec Corp.*1 |
3,550 |
158,224 |
|||||||||
|
265,078 |
|||||||||||
|
Health care providers & services: 6.30% |
|||||||||||
|
Envision Healthcare Holdings, Inc.*1 |
5,470 |
215,955 |
|||||||||
|
Laboratory Corp. of America Holdings*1 |
3,344 |
405,360 |
|||||||||
|
UnitedHealth Group, Inc.1 |
3,592 |
438,224 |
|||||||||
|
1,059,539 |
|||||||||||
|
Hotels, restaurants & leisure: 2.73% |
|||||||||||
|
Yum! Brands, Inc.1 |
5,106 |
459,949 |
|||||||||
|
Household durables: 2.51% |
|||||||||||
|
Jarden Corp.* |
5,710 |
295,493 |
|||||||||
|
Lennar Corp., Class A1 |
2,480 |
126,579 |
|||||||||
|
422,072 |
|||||||||||
|
Industrial conglomerates: 3.81% |
|||||||||||
|
Danaher Corp.1 |
2,753 |
235,630 |
|||||||||
|
General Electric Co.1 |
15,288 |
406,202 |
|||||||||
|
641,832 |
|||||||||||
|
Insurance: 5.59% |
|||||||||||
|
Aon PLC1 |
3,108 |
309,805 |
|||||||||
|
Lincoln National Corp.1 |
5,038 |
298,350 |
|||||||||
|
MetLife, Inc.1 |
5,943 |
332,749 |
|||||||||
|
940,904 |
|||||||||||
|
Internet & catalog retail: 2.56% |
|||||||||||
|
Amazon.com, Inc.*1 |
993 |
431,051 |
|||||||||
|
Internet software & services: 2.11% |
|||||||||||
|
Facebook, Inc., Class A* |
4,146 |
355,582 |
|||||||||
39
UBS U.S. Defensive Equity Fund
Portfolio of investments
June 30, 2015
|
Shares |
Value |
||||||||||
|
Common stocks—(Concluded) |
|||||||||||
|
IT services: 2.66% |
|||||||||||
|
ServiceSource International, Inc.*1 |
24,980 |
$ |
136,641 |
||||||||
|
Visa, Inc., Class A1 |
4,637 |
311,374 |
|||||||||
|
448,015 |
|||||||||||
|
Life sciences tools & services: 1.26% |
|||||||||||
|
Bio-Rad Laboratories, Inc., Class A*1 |
1,406 |
211,758 |
|||||||||
|
Machinery: 2.00% |
|||||||||||
|
Colfax Corp.*1 |
3,460 |
159,679 |
|||||||||
|
Joy Global, Inc.1 |
4,872 |
176,366 |
|||||||||
|
336,045 |
|||||||||||
|
Media: 4.56% |
|||||||||||
|
CBS Corp. (Non-Voting), Class B1 |
5,473 |
303,751 |
|||||||||
|
Walt Disney Co.1 |
4,055 |
462,838 |
|||||||||
|
766,589 |
|||||||||||
|
Oil, gas & consumable fuels: 6.23% |
|||||||||||
|
Approach Resources, Inc.*1 |
8,800 |
60,280 |
|||||||||
|
Chevron Corp.1 |
1,650 |
159,175 |
|||||||||
|
Cobalt International Energy, Inc.*1 |
14,300 |
138,853 |
|||||||||
|
EOG Resources, Inc.1 |
2,220 |
194,361 |
|||||||||
|
Gulfport Energy Corp.*1 |
1,875 |
75,469 |
|||||||||
|
Laredo Petroleum, Inc.*1 |
5,200 |
65,416 |
|||||||||
|
Oasis Petroleum, Inc.*1 |
4,400 |
69,740 |
|||||||||
|
PDC Energy, Inc.*1 |
3,140 |
168,430 |
|||||||||
|
SM Energy Co.1 |
2,525 |
116,453 |
|||||||||
|
1,048,177 |
|||||||||||
|
Pharmaceuticals: 10.12% |
|||||||||||
|
Allergan PLC*1 |
1,276 |
387,215 |
|||||||||
|
Catalent, Inc.*1 |
7,600 |
222,908 |
|||||||||
|
Eli Lilly & Co.1 |
4,889 |
408,182 |
|||||||||
|
Impax Laboratories, Inc.*1 |
6,127 |
281,352 |
|||||||||
|
Medicines Co./The* |
6,065 |
173,520 |
|||||||||
|
Teva Pharmaceutical Industries Ltd. ADR1 |
3,880 |
229,308 |
|||||||||
|
1,702,485 |
|||||||||||
|
Real estate investment trust (REIT): 3.30% |
|||||||||||
|
American Campus Communities, Inc.1 |
1,730 |
65,204 |
|||||||||
|
Digital Realty Trust, Inc.1 |
4,051 |
270,121 |
|||||||||
|
Simon Property Group, Inc.1 |
1,270 |
219,735 |
|||||||||
|
555,060 |
|||||||||||
|
Road & rail: 3.95% |
|||||||||||
|
Hertz Global Holdings, Inc.*1 |
9,953 |
180,348 |
|||||||||
|
Norfolk Southern Corp. |
2,505 |
218,837 |
|||||||||
|
Union Pacific Corp. |
2,785 |
265,606 |
|||||||||
|
664,791 |
|||||||||||
|
Shares |
Value |
||||||||||
|
Semiconductors & semiconductor equipment: 9.88% |
|||||||||||
|
Broadcom Corp., Class A1 |
4,528 |
$ |
233,147 |
||||||||
|
Integrated Device Technology, Inc.* |
7,195 |
156,131 |
|||||||||
|
Maxim Integrated Products, Inc. |
5,292 |
182,971 |
|||||||||
|
Micron Technology, Inc.*1 |
12,858 |
242,245 |
|||||||||
|
NXP Semiconductors NV*1 |
1,724 |
169,297 |
|||||||||
|
ON Semiconductor Corp.* |
14,361 |
167,880 |
|||||||||
|
Qorvo, Inc.* |
2,039 |
163,671 |
|||||||||
|
Silicon Laboratories, Inc.*1 |
3,030 |
163,650 |
|||||||||
|
Skyworks Solutions, Inc. |
1,765 |
183,736 |
|||||||||
|
1,662,728 |
|||||||||||
|
Software: 3.95% |
|||||||||||
|
Check Point Software Technologies Ltd.*1 |
3,679 |
292,665 |
|||||||||
|
Symantec Corp.1 |
16,021 |
372,488 |
|||||||||
|
665,153 |
|||||||||||
|
Specialty retail: 1.22% |
|||||||||||
|
Best Buy Co., Inc.1 |
6,299 |
205,410 |
|||||||||
|
Technology hardware, storage & peripherals: 4.28% |
|||||||||||
|
Apple, Inc.1 |
2,906 |
364,485 |
|||||||||
|
SanDisk Corp. |
2,825 |
164,471 |
|||||||||
|
Western Digital Corp. |
2,440 |
191,345 |
|||||||||
|
720,301 |
|||||||||||
|
Tobacco: 2.81% |
|||||||||||
|
Philip Morris International, Inc.1 |
5,904 |
473,324 |
|||||||||
|
Trading companies & distributors: 1.75% |
|||||||||||
|
Fastenal Co.1 |
7,000 |
295,260 |
|||||||||
|
Total common stocks (cost $18,470,651) |
21,903,800 |
||||||||||
|
Short-term investment: 5.77% |
|||||||||||
|
Investment company: 5.77% |
|||||||||||
|
UBS Cash Management Prime Relationship Fund3 (cost $971,540) |
971,540 |
971,540 |
|||||||||
|
Number of contracts |
|||||||||||
|
Options purchased: 0.62% |
|||||||||||
|
Put options: 0.62% |
|||||||||||
|
E-mini S&P 500 Index, strike @ USD 2,000, expires July 2015 (cost $196,118) |
79 |
102,700 |
|||||||||
|
Total investments before investments sold short: 136.57% (cost $19,638,309) |
22,978,040 |
||||||||||
40
UBS U.S. Defensive Equity Fund
Portfolio of investments
June 30, 2015
|
Shares |
Value |
||||||||||
|
Investments sold short: (32.31)% |
|||||||||||
|
Common stocks: (32.31)% |
|||||||||||
|
Banks: (2.59)% |
|||||||||||
|
Associated Banc-Corp. |
(3,210 |
) |
$ |
(65,067 |
) |
||||||
|
BancorpSouth, Inc. |
(2,740 |
) |
(70,582 |
) |
|||||||
|
Bank of America Corp. |
(3,690 |
) |
(62,804 |
) |
|||||||
|
First Niagara Financial Group, Inc. |
(4,950 |
) |
(46,728 |
) |
|||||||
|
People's United Financial, Inc. |
(3,980 |
) |
(64,516 |
) |
|||||||
|
Westamerica Bancorporation |
(1,250 |
) |
(63,312 |
) |
|||||||
|
Zions Bancorporation |
(1,980 |
) |
(62,835 |
) |
|||||||
|
(435,844 |
) |
||||||||||
|
Beverages: (1.13)% |
|||||||||||
|
Brown-Forman Corp., Class B |
(580 |
) |
(58,104 |
) |
|||||||
|
Constellation Brands, Inc., Class A |
(700 |
) |
(81,214 |
) |
|||||||
|
Dr. Pepper Snapple Group, Inc. |
(700 |
) |
(51,030 |
) |
|||||||
|
(190,348 |
) |
||||||||||
|
Biotechnology: (2.82)% |
|||||||||||
|
Celgene Corp. |
(900 |
) |
(104,161 |
) |
|||||||
|
Intrexon Corp. |
(1,950 |
) |
(95,160 |
) |
|||||||
|
Ligand Pharmaceuticals, Inc., Class B |
(772 |
) |
(77,895 |
) |
|||||||
|
Repligen Corp. |
(2,350 |
) |
(96,985 |
) |
|||||||
|
United Therapeutics Corp. |
(580 |
) |
(100,891 |
) |
|||||||
|
(475,092 |
) |
||||||||||
|
Capital markets: (2.49)% |
|||||||||||
|
Charles Schwab Corp. |
(4,380 |
) |
(143,007 |
) |
|||||||
|
Janus Capital Group, Inc. |
(5,020 |
) |
(85,942 |
) |
|||||||
|
Northern Trust Corp. |
(700 |
) |
(53,522 |
) |
|||||||
|
Stifel Financial Corp. |
(1,340 |
) |
(77,372 |
) |
|||||||
|
TD Ameritrade Holding Corp. |
(1,600 |
) |
(58,912 |
) |
|||||||
|
(418,755 |
) |
||||||||||
|
Commercial services & supplies: (1.42)% |
|||||||||||
|
Healthcare Services Group, Inc. |
(4,670 |
) |
(154,344 |
) |
|||||||
|
Stericycle, Inc. |
(630 |
) |
(84,363 |
) |
|||||||
|
(238,707 |
) |
||||||||||
|
Communications equipment: (0.82)% |
|||||||||||
|
Juniper Networks, Inc. |
(2,890 |
) |
(75,053 |
) |
|||||||
|
Polycom, Inc. |
(5,445 |
) |
(62,291 |
) |
|||||||
|
(137,344 |
) |
||||||||||
|
Diversified telecommunication services: (0.40)% |
|||||||||||
|
Level 3 Communications, Inc. |
(1,289 |
) |
(67,892 |
) |
|||||||
|
Electronic equipment, instruments & components: (1.12)% |
|||||||||||
|
Flextronics International Ltd. |
(5,510 |
) |
(62,318 |
) |
|||||||
|
Ingram Micro, Inc., Class A |
(2,496 |
) |
(62,475 |
) |
|||||||
|
Tech Data Corp. |
(1,108 |
) |
(63,776 |
) |
|||||||
|
(188,569 |
) |
||||||||||
|
Shares |
Value |
||||||||||
|
Energy equipment & services: (0.18)% |
|||||||||||
|
FMC Technologies, Inc. |
(750 |
) |
$ |
(31,118 |
) |
||||||
|
Food products: (0.38)% |
|||||||||||
|
McCormick & Co. Inc. (Non-voting) |
(800 |
) |
(64,760 |
) |
|||||||
|
Health care equipment & supplies: (2.18)% |
|||||||||||
|
Abaxis, Inc. |
(1,410 |
) |
(72,587 |
) |
|||||||
|
DENTSPLY International, Inc. |
(1,120 |
) |
(57,736 |
) |
|||||||
|
IDEXX Laboratories, Inc. |
(876 |
) |
(56,187 |
) |
|||||||
|
STERIS Corp. |
(760 |
) |
(48,974 |
) |
|||||||
|
Zeltiq Aesthetics, Inc. |
(2,580 |
) |
(76,032 |
) |
|||||||
|
Zimmer Biomet Holdings, Inc. |
(500 |
) |
(54,615 |
) |
|||||||
|
(366,131 |
) |
||||||||||
|
Health care providers & services: (1.38)% |
|||||||||||
|
Bio-Reference Laboratories, Inc. |
(2,460 |
) |
(101,475 |
) |
|||||||
|
MEDNAX, Inc. |
(970 |
) |
(71,887 |
) |
|||||||
|
Patterson Cos., Inc. |
(1,220 |
) |
(59,353 |
) |
|||||||
|
(232,715 |
) |
||||||||||
|
Hotels, restaurants & leisure: (2.18)% |
|||||||||||
|
Buffalo Wild Wings, Inc. |
(443 |
) |
(69,414 |
) |
|||||||
|
Choice Hotels International, Inc. |
(2,715 |
) |
(147,289 |
) |
|||||||
|
Hyatt Hotels Corp., Class A |
(1,500 |
) |
(85,035 |
) |
|||||||
|
Wendy's Co. |
(5,820 |
) |
(65,649 |
) |
|||||||
|
(367,387 |
) |
||||||||||
|
Household products: (0.31)% |
|||||||||||
|
Clorox Co. |
(500 |
) |
(52,010 |
) |
|||||||
|
Insurance: (0.90)% |
|||||||||||
|
American International Group, Inc. |
(2,440 |
) |
(150,841 |
) |
|||||||
|
Internet software & services: (1.16)% |
|||||||||||
|
Akamai Technologies, Inc. |
(860 |
) |
(60,045 |
) |
|||||||
|
Gogo, Inc. |
(3,212 |
) |
(68,833 |
) |
|||||||
|
Rackspace Hosting, Inc. |
(1,802 |
) |
(67,017 |
) |
|||||||
|
(195,895 |
) |
||||||||||
|
IT services: (0.83)% |
|||||||||||
|
Cognizant Technology Solutions Corp., Class A |
(1,330 |
) |
(81,250 |
) |
|||||||
|
Xerox Corp. |
(5,426 |
) |
(57,732 |
) |
|||||||
|
(138,982 |
) |
||||||||||
|
Life sciences tools & services: (1.42)% |
|||||||||||
|
Mettler-Toledo International, Inc. |
(330 |
) |
(112,682 |
) |
|||||||
|
PerkinElmer, Inc. |
(1,320 |
) |
(69,485 |
) |
|||||||
|
Thermo Fisher Scientific, Inc. |
(435 |
) |
(56,445 |
) |
|||||||
|
(238,612 |
) |
||||||||||
41
UBS U.S. Defensive Equity Fund
Portfolio of investments
June 30, 2015
|
Shares |
Value |
||||||||||
|
Investments sold short—(Concluded) |
|||||||||||
|
Common stocks—(Concluded) |
|||||||||||
|
Media: (0.51)% |
|||||||||||
|
Gannett Co., Inc. |
(1,100 |
) |
$ |
(15,390 |
) |
||||||
|
TEGNA, Inc. |
(2,200 |
) |
(70,554 |
) |
|||||||
|
(85,944 |
) |
||||||||||
|
Oil, gas & consumable fuels: (0.19)% |
|||||||||||
|
Hess Corp. |
(470 |
) |
(31,434 |
) |
|||||||
|
Pharmaceuticals: (1.54)% |
|||||||||||
|
AbbVie, Inc. |
(1,600 |
) |
(107,504 |
) |
|||||||
|
Endo International PLC |
(1,210 |
) |
(96,376 |
) |
|||||||
|
Sagent Pharmaceuticals, Inc. |
(2,290 |
) |
(55,670 |
) |
|||||||
|
(259,550 |
) |
||||||||||
|
Real estate investment trust (REIT): (0.19)% |
|||||||||||
|
Equity Residential |
(450 |
) |
(31,576 |
) |
|||||||
|
Semiconductors & semiconductor equipment: (1.99)% |
|||||||||||
|
Cavium, Inc. |
(1,125 |
) |
(77,412 |
) |
|||||||
|
Linear Technology Corp. |
(1,200 |
) |
(53,076 |
) |
|||||||
|
Teradyne, Inc. |
(3,080 |
) |
(59,413 |
) |
|||||||
|
Texas Instruments, Inc. |
(2,810 |
) |
(144,743 |
) |
|||||||
|
(334,644 |
) |
||||||||||
|
Software: (2.03)% |
|||||||||||
|
Cadence Design Systems, Inc. |
(4,132 |
) |
(81,235 |
) |
|||||||
|
Electronic Arts, Inc. |
(1,800 |
) |
(119,700 |
) |
|||||||
|
Red Hat, Inc. |
(940 |
) |
(71,374 |
) |
|||||||
|
Synopsys, Inc. |
(1,360 |
) |
(68,884 |
) |
|||||||
|
(341,193 |
) |
||||||||||
|
Shares |
Value |
||||||||||
|
Specialty retail: (0.81)% |
|||||||||||
|
American Eagle Outfitters, Inc. |
(3,990 |
) |
$ |
(68,708 |
) |
||||||
|
Staples, Inc. |
(4,360 |
) |
(66,751 |
) |
|||||||
|
(135,459 |
) |
||||||||||
|
Technology hardware, storage & peripherals: (0.38)% |
|||||||||||
|
Diebold, Inc. |
(1,816 |
) |
(63,560 |
) |
|||||||
|
Textiles, apparel & luxury goods: (0.58)% |
|||||||||||
|
Under Armour, Inc., Class A |
(1,170 |
) |
(97,625 |
) |
|||||||
|
Thrifts & mortgage finance: (0.38)% |
|||||||||||
|
Astoria Financial Corp. |
(4,640 |
) |
(63,986 |
) |
|||||||
|
Total investments sold short (proceeds $4,142,855) |
(5,435,973 |
) |
|||||||||
|
Total investments, net of investments sold short: 104.26% |
17,542,067 |
||||||||||
|
Liabilities, in excess of cash and other assets: (4.26)% |
(716,233 |
) |
|||||||||
|
Net assets: 100.00% |
$ |
16,825,834 |
|||||||||
Notes to portfolio of investments
Aggregate cost for federal income tax purposes, before investments sold short, was $19,637,171; and net unrealized appreciation consisted of:
|
Gross unrealized appreciation |
$ |
4,229,712 |
|||||
|
Gross unrealized depreciation |
(888,843 |
) |
|||||
|
Net unrealized appreciation of investments |
$ |
3,340,869 |
|||||
For a listing of defined portfolio acronyms, counterparty abbreviations and currency abbreviations that are used throughout the Portfolio of investments as well as the tables that follow, please refer to page 71. Portfolio footnotes begin on page 44.
42
UBS U.S. Defensive Equity Fund
Portfolio of investments
June 30, 2015
Options written
|
Expiration date |
Premiums received |
Value |
|||||||||||||
|
Put options |
|||||||||||||||
|
E-mini S&P 500 Index, 79 contracts, strike @ USD 1,790 |
July 2015 |
$ |
43,253 |
$ |
(8,690 |
) |
|||||||||
Written options activity for the year ended June 30, 2015 was as follows:
|
Number of contracts |
Premiums received |
||||||||||
|
Options outstanding at June 30, 2014 |
80 |
$ |
39,800 |
||||||||
|
Options written |
385 |
317,259 |
|||||||||
|
Options terminated in closing purchase transactions |
(386 |
) |
(313,806 |
) |
|||||||
|
Options expired prior to exercise |
— |
— |
|||||||||
|
Options outstanding at June 30, 2015 |
79 |
$ |
43,253 |
||||||||
The following is a summary of the fair valuations according to the inputs used as of June 30, 2015 in valuing the Fund's investments:
|
Description |
Unadjusted quoted prices in active markets for identical investments (Level 1) |
Other significant observable inputs (Level 2) |
Unobservable inputs (Level 3) |
Total |
|||||||||||||||
|
Assets |
|||||||||||||||||||
|
Common stocks |
$ |
21,655,233 |
$ |
248,567 |
$ |
— |
$ |
21,903,800 |
|||||||||||
|
Short-term investment |
— |
971,540 |
— |
971,540 |
|||||||||||||||
|
Options purchased |
102,700 |
— |
— |
102,700 |
|||||||||||||||
|
Total |
$ |
21,757,933 |
$ |
1,220,107 |
$ |
— |
$ |
22,978,040 |
|||||||||||
|
Liabilities |
|||||||||||||||||||
|
Common stocks sold short |
$ |
(5,435,973 |
) |
$ |
— |
$ |
— |
$ |
(5,435,973 |
) |
|||||||||
|
Options written |
(8,690 |
) |
— |
— |
(8,690 |
) |
|||||||||||||
|
Total |
$ |
(5,444,663 |
) |
$ |
— |
$ |
— |
$ |
(5,444,663 |
) |
|||||||||
At June 30, 2015, there were no transfers between Level 1 and Level 2.
43
UBS U.S. Defensive Equity Fund
Portfolio of investments
June 30, 2015
Portfolio footnotes
* Non-income producing security.
1 All or a portion of these securities have been delivered to cover open short positions.
2 Security exempt from registration pursuant to Rule 144A under the Securities Act of 1933. This security is considered liquid, unless noted otherwise, and may be resold in transactions exempt from registration, normally to qualified institutional buyers. At June 30, 2015, the value of this security amounted to $248,567 or 1.48% of net assets.
3 The table below details the Fund's investment in a fund advised by the same Advisor as the Fund. The Advisor does not earn a management fee from the affiliated UBS Relationship Fund.
|
Security description |
Value 06/30/14 |
Purchases during the year ended 06/30/15 |
Sales during the year ended 06/30/15 |
Value 06/30/15 |
Net income earned from affiliate for the year ended 06/30/15 |
||||||||||||||||||
|
UBS Cash Management Prime Relationship Fund |
$ |
232,835 |
$ |
4,453,365 |
$ |
3,714,660 |
$ |
971,540 |
$ |
541 |
|||||||||||||
See accompanying notes to financial statements.
44
UBS U.S. Equity Opportunity Fund
Portfolio performance
For the 12 months ended June 30, 2015, Class A shares of UBS U.S. Equity Opportunity Fund (the "Fund") returned 8.33% (Class A shares returned 2.39% after the deduction of the maximum sales charge), while Class P shares returned 8.65%. The Fund's benchmark, the Russell 1000 Index (the "Index"), returned 7.37% over the same time period. (Class P shares have lower expenses than other share classes of the Fund. Returns for all share classes over various time periods are shown on page 48; please note that the Fund's returns do not reflect the deduction of taxes that a shareholder would pay on Fund distributions or the redemption of Fund shares, while the Index returns do not reflect the deduction of fees and expenses.)
The Fund outperformed the Index primarily due to stock selection decisions.
Portfolio performance summary1
What worked
• Strong stock selection within the health care sector made a significant contribution to Fund performance.
– Hospira, Inc. was the Fund's top-performing stock during the reporting period. The generic drug company, which provides injectables and infusion technologies, saw its share price rise 70% after Pfizer announced plans to acquire Hospira at a significant premium. We sold the position after that announcement, as the stock reached what we consider fair value.
– Alnylam was a top contributor during the 12 months. The biotech company, which specializes in RNAi therapeutics, saw its stock price climb steadily based on positive earnings estimate revision activity and favorable news on both the clinical trial and intellectual property front.
– The stock price of Bluebird Bio soared on the company's announcement that its experimental gene therapy had ended the need for regular blood transfusions in four patients with beta thalassemia major, an inherited blood disorder.
– Chimerix made a strong contribution to Fund performance. The development-stage biotech company boasts a promising drug pipeline that includes an antiviral treatment recently used to treat Ebola.
• The Fund's information technology stocks, particularly the semiconductor names, were positive for performance during the reporting period.
– Shares of Freescale Semiconductor climbed 80% after the company reported strong fourth quarter earnings and a revenue outlook that exceeded market expectations. News of Freescale's acquisition by NXP Semiconductors gave the stock an additional boost, as the deal will create the largest supplier of microchips in the automotive industry. We realized our investment thesis and sold the stock after the end of the reporting period.
• The Fund benefited from underweight positions in the energy and industrials sectors. Falling oil prices led the energy sector to post the worst performance in the benchmark index during the 12 months. Minimizing exposure to these stocks helped the Fund's relative performance.
1 For a detailed commentary on the market environment in general during the reporting period, see page 3.
45
UBS U.S. Equity Opportunity Fund
What didn't work
• The few energy stocks we did hold detracted from Fund returns during the 12 months. We have identified attractive opportunities within the exploration and production (E&P) sector that we believe will add value despite the decline in energy prices.
– EOG Resources saw its share price struggle as a result of oil price volatility. We remain confident in our long-term thesis and consider EOG Resources best of breed among E&P companies.
– Shares of Noble Corporation declined 43% for the 12-month period. Calendar year 2014 presented a difficult environment for offshore drillers, with challenging trends in the number of uncontracted new-build deliveries, rigs rolling off contracts, and operator sublets. As a result, these companies have seen intense competition, falling day rates and rig retirements, all of which exerted downward pressure on Noble's stock price.
• Several individual stock positions in various industries made a negative contribution to the Fund's returns.
– Micron Technology was a top detractor, declining 43% during the period. The semiconductor company indicated an outlook for the fiscal fourth quarter that was worse than expected. While Micron is wrestling with increased costs for product line transitions, we believe the company and its industry are better positioned than at any time in the past. We maintain high conviction in our thesis for Micron and continue to hold the position.
– The share price of ServiceSource International, which provides business software and services for technology-enabled healthcare and life sciences companies, declined during the period. We believe its shares are undervalued due to near-term pressure on margins from investments in sales headcount growth and a new Software as a Service offering. Fears of weak European technology spending and global macro risk have also hurt the stock. However, we see multiple avenues of growth for ServiceSource and believe the company makes an attractive acquisition target for software or information technology services companies. ServiceSource International was sold prior to the end of the reporting period to fund a more compelling price/value opportunity.
– Luxury apparel company Ralph Lauren detracted from relative returns after reporting weak results, especially for its outlet business. Ralph Lauren faces additional headwinds from the impact of US dollar appreciation on its foreign revenues. We sold the position because we identified a violation of our investment thesis.
• Certain sector underweights made a negative contribution to Fund returns. The health care sector was up significantly within the benchmark, and though our stock selection made a positive contribution, the Fund's underweight to the sector as a whole detracted. The Fund's underweight to consumer discretionary stocks also hindered relative returns, as the sector performed strongly during the period.
Portfolio highlights
• Mondelez International manufactures and markets snack food and beverages including cookies, crackers, chocolate, gum, candy, coffee, powdered beverages, and various cheese and grocery products. We believe Mondelez is well-positioned for growth due to its significant exposure to developing markets. We think there is an opportunity for margin expansion from a rebound in Europe and by leveraging synergies across distribution platforms.
• We believe US Bancorp, a financial services firm, is well-positioned to experience above-peer earnings growth over the next several years as a result of solid revenue growth, strong expense discipline, stable-to-improving
46
UBS U.S. Equity Opportunity Fund
credit quality and aggressive capital management. The growth in revenues will likely be driven by a superior business mix that features strong fee-based revenues and solid loan growth accompanied by a fairly stable net interest margin. The company is already Basel III compliant at 8.8% and continues to generate a return on equity (ROE) of greater than 15%.
• Philip Morris is a leading player in the global cigarette and tobacco market. We believe the market underappreciates the persistence and predictability of the company's cash flows and its returns to shareholders. Philip Morris's regulatory and consumption risk is well-diversified across 180 markets around the globe. While governments have an interest in reducing tobacco consumption, they have become reliant on steady tobacco tax flows. Many governments are working with Philip Morris to encourage steady but slow declines in consumption while growing taxation and price revenues.
• Digital Realty Trust is a real estate investment trust (REIT) specializing in technology-related properties. Digital Realty has been aggressively improving its portfolio of global data centers through new developments and acquisitions, particularly in higher-margin overseas markets. We believe the REIT will benefit from improved occupancy levels at higher rents as contracts signed at what are now below-market rents expire and are replaced with higher-rent leases. We believe the REIT's discount to the industry's average implied cap rate will narrow in time as investors recognize its ability to generate above-average earnings growth in most economic scenarios.
• We believe credit services firm American Express is in a strong position to take advantage of improving consumer spending volume and credit card loan growth over the next several years. Positive factors include solid global economic growth, improving business travel expenditures, increasing merchant acceptance and increasing share of the underserved market. As a result, American Express should experience strong profitability, earnings growth and cash flow generation, which will be driven by solid revenue growth, improving operating leverage, manageable credit quality and aggressive capital management.
This letter is intended to assist shareholders in understanding how the Fund performed during the 12 months ended June 30, 2015. The views and opinions in the letter were current as of August 14, 2015. They are not guarantees of future performance or investment results and should not be taken as investment advice. Investment decisions reflect a variety of factors, and we reserve the right to change our views about individual securities, sectors and markets at any time. As a result, the views expressed should not be relied upon as a forecast of the Fund's future investment intent. We encourage you to consult your financial advisor regarding your personal investment program.
Mutual funds are sold by prospectus only. You should read it carefully and consider a fund's investment objectives, risks, charges, expenses and other important information contained in the prospectus before investing. Prospectuses for most of our funds can be obtained from your financial advisor, by calling UBS Funds at 800-647 1568 or by visiting our Web site at www.ubs.com.
47
UBS U.S. Equity Opportunity Fund
Average annual total returns for periods ended 06/30/15 (unaudited)
|
1 year |
5 years |
10 years |
|||||||||||||
|
Before deducting maximum sales charge |
|||||||||||||||
|
Class A1 |
8.33 |
% |
15.18 |
% |
5.57 |
% |
|||||||||
|
Class C2 |
7.54 |
14.35 |
4.78 |
||||||||||||
|
Class P3 |
8.65 |
15.50 |
5.85 |
||||||||||||
|
After deducting maximum sales charge |
|||||||||||||||
|
Class A1 |
2.39 |
% |
13.88 |
% |
4.97 |
% |
|||||||||
|
Class C2 |
6.54 |
14.35 |
4.78 |
||||||||||||
|
Russell 1000 Index4 |
7.37 |
% |
17.58 |
% |
8.13 |
% |
|||||||||
The annualized gross and net expense ratios, respectively, for each class of shares as in the October 28, 2014 prospectuses were as follows: Class A—1.72% and 1.20%; Class C—2.50% and 1.95%; Class P—1.52% and 0.95%. Net expenses reflect fee waivers and/or expense reimbursements, if any, pursuant to an agreement that is in effect to cap the expenses. The Trust, with respect to the Fund, and UBS Global Asset Management (Americas) Inc., the Fund's investment advisor ("UBS Global AM (Americas)" or the "Advisor"), have entered into a written agreement pursuant to which the Advisor has agreed to waive a portion of its management fees and/or to reimburse expenses (excluding expenses incurred through investment in other investment companies, interest, taxes, brokerage commissions and extraordinary expenses) to the extent necessary so that the Fund's ordinary operating expenses (excluding expenses incurred through investment in other investment companies, interest, taxes, brokerage commissions and extraordinary expenses), through the period ending October 27, 2015, do not exceed 1.20% for Class A shares, 1.95% for Class C shares and 0.95% for Class P shares. Pursuant to the written agreement, the Advisor is entitled to be reimbursed for any fees it waives and expenses it reimburses for a period of three years following such fee waivers and expense reimbursements to the extent that such reimbursement of the Advisor by the Fund will not cause the Fund to exceed any applicable expense limit that is in place for the Fund. The fee waiver/expense reimbursement agreement may be terminated by the Fund's Board of Trustees at any time and also will terminate automatically upon the expiration or termination of the Fund's advisory contract with the Advisor. Upon termination of the fee waiver/expense reimbursement agreement, however, UBS Global AM (Americas)'s three year recoupment rights will survive.
1 Maximum sales charge for Class A shares is 5.5%. Class A shares bear ongoing 12b-1 service fees.
2 Maximum contingent deferred sales charge for Class C shares is 1% imposed on redemptions and is reduced to 0% after one year. Class C shares bear ongoing 12b-1 distribution and service fees.
3 Class P shares do not bear initial or contingent deferred sales charges or ongoing 12b-1 service and distribution fees, but Class P shares held through advisory programs may be subject to a program fee, which, if included, would have reduced performance.
4 The Russell 1000 Index is designed to measure the performance of the large-cap segment of the US equity universe. It is a subset of the Russell 3000 Index and includes approximately 1,000 of the largest securities based on a combination of their market cap and current index membership. The Russell 1000 Index is constructed to provide a comprehensive and unbiased barometer for the large-cap segment and is completely reconstituted annually to ensure new and growing equities are reflected. Investors should note that indices do not reflect the deduction of fees and expenses.
Prior to February 17, 2015, if an investor sold or exchanged shares less than 90 days after purchase, a redemption fee of 1.00% of the amount sold or exchanged was deducted at the time of the transaction, except as noted otherwise in the prospectus. For sales or exchanges taking place on or after February 17, 2015 but prior to August 3, 2015, there is a reduction in the redemption holding period from 90 days to 30 days. Effective August 3, 2015, the 1.00% redemption fee imposed on sales or exchanges of any class of shares of the funds made during the holding periods specified in the prospectus will be eliminated. Please refer to the prospectus for further information.
Past performance does not predict future performance, and the performance information provided does not reflect the deduction of taxes that a shareholder would pay on Fund distributions or the redemption of Fund shares. The return and principal value of an investment will fluctuate, so that an investor's shares, when redeemed, may be worth more or less than their original cost. Performance results assume reinvestment of all dividends and capital gain distributions at net asset value on the ex-dividend dates. Current performance may be higher or lower than the performance data quoted. For month-end performance figures, please visit http://globalam-us.ubs.com/corpweb/performance.do.
48
UBS U.S. Equity Opportunity Fund
Illustration of an assumed investment of $10,000 in Class A shares (adjusted for 5.5% maximum sales charge) and $5,000,000 in Class P shares (unaudited)
The following two graphs depict the performance of UBS U.S. Equity Opportunity Fund Class A and Class P shares versus the Russell 1000 Index over the 10 years ended June 30, 2015. The performance of Class C shares will vary based upon the different class specific expenses and sales charges. The performance provided does not reflect the deduction of taxes that a shareholder would pay on Fund distributions or the redemption of Fund shares. Past performance is no guarantee of future results. Share price and returns will vary with market conditions; investors may realize a gain or loss upon redemption.
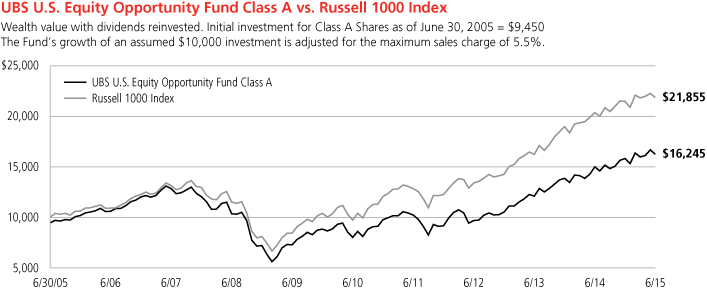
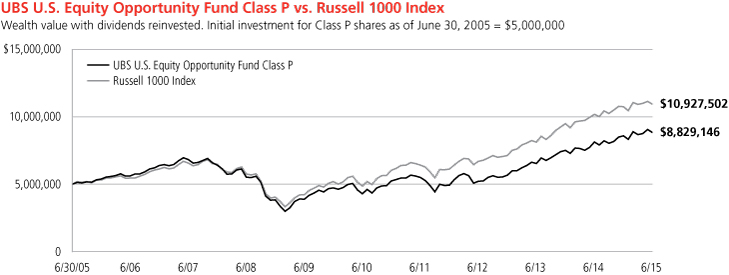
Past performance does not predict future performance, and the performance information provided does not reflect the deduction of taxes that a shareholder would pay on Fund distributions or the redemption of Fund shares. The return and principal value of an investment will fluctuate, so that an investor's shares, when redeemed, may be worth more or less than their original cost. Performance results assume reinvestment of all dividends and capital gain distributions at net asset value on the ex-dividend dates. Current performance may be higher or lower than the performance data quoted. For month-end performance figures, please visit http://globalam-us.ubs.com/corpweb/performance.do.
49
UBS U.S. Equity Opportunity Fund
Top ten equity holdings (unaudited)
As of June 30, 2015
|
Percentage of net assets |
|||||||
|
Apple, Inc. |
6.6 |
% |
|||||
|
Mondelez International, Inc., Class A |
4.8 |
||||||
|
Philip Morris International, Inc. |
4.5 |
||||||
|
Amazon.com, Inc. |
4.4 |
||||||
|
US Bancorp |
4.3 |
||||||
|
American Express Co. |
3.9 |
||||||
|
Digital Realty Trust, Inc. |
3.9 |
||||||
|
Citigroup, Inc. |
3.9 |
||||||
|
MetLife, Inc. |
3.5 |
||||||
|
Alnylam Pharmaceuticals, Inc. |
3.4 |
||||||
|
Total |
43.2 |
% |
|||||
Industry diversification (unaudited)
As a percentage of net assets as of June 30, 2015
|
Common stocks |
|||||||
|
Automobiles |
3.09 |
% |
|||||
|
Banks |
8.18 |
||||||
|
Biotechnology |
12.15 |
||||||
|
Chemicals |
3.11 |
||||||
|
Consumer finance |
3.94 |
||||||
|
Diversified telecommunication services |
1.84 |
||||||
|
Energy equipment & services |
0.94 |
||||||
|
Food & staples retailing |
2.43 |
||||||
|
Food products |
4.84 |
||||||
|
Insurance |
6.66 |
||||||
|
Internet & catalog retail |
4.35 |
||||||
|
Internet software & services |
4.33 |
||||||
|
Life sciences tools & services |
2.35 |
||||||
|
Machinery |
2.93 |
||||||
|
Oil, gas & consumable fuels |
5.87 |
||||||
|
Real estate investment trust (REIT) |
3.92 |
||||||
|
Semiconductors & semiconductor equipment |
11.76 |
||||||
|
Software |
2.88 |
||||||
|
Technology hardware, storage & peripherals |
9.22 |
||||||
|
Tobacco |
4.50 |
||||||
|
Total common stocks |
99.29 |
% |
|||||
|
Short-term investment |
0.89 |
||||||
|
Investment of cash collateral from securities loaned |
2.96 |
||||||
|
Total investments |
103.14 |
% |
|||||
|
Liabilities, in excess of cash and other assets |
(3.14 |
) |
|||||
|
Net assets |
100.00 |
% |
|||||
50
UBS U.S. Equity Opportunity Fund
Portfolio of investments
June 30, 2015
|
Shares |
Value |
||||||||||
|
Common stocks: 99.29% |
|||||||||||
|
Automobiles: 3.09% |
|||||||||||
|
Ford Motor Co. |
92,400 |
$ |
1,386,924 |
||||||||
|
Banks: 8.18% |
|||||||||||
|
Citigroup, Inc. |
31,754 |
1,754,091 |
|||||||||
|
US Bancorp |
44,300 |
1,922,620 |
|||||||||
|
3,676,711 |
|||||||||||
|
Biotechnology: 12.15% |
|||||||||||
|
Acorda Therapeutics, Inc.* |
33,800 |
1,126,554 |
|||||||||
|
Alnylam Pharmaceuticals, Inc.* |
12,700 |
1,522,349 |
|||||||||
|
Bluebird Bio, Inc.* |
3,700 |
622,969 |
|||||||||
|
Chimerix, Inc.* |
32,300 |
1,492,260 |
|||||||||
|
Lexicon Pharmaceuticals, Inc.*1 |
57,885 |
465,974 |
|||||||||
|
MacroGenics, Inc.* |
6,100 |
231,617 |
|||||||||
|
5,461,723 |
|||||||||||
|
Chemicals: 3.11% |
|||||||||||
|
Praxair, Inc. |
11,700 |
1,398,735 |
|||||||||
|
Consumer finance: 3.94% |
|||||||||||
|
American Express Co. |
22,800 |
1,772,016 |
|||||||||
|
Diversified telecommunication services: 1.84% |
|||||||||||
|
Pacific DataVision, Inc.* |
1,900 |
80,047 |
|||||||||
|
Pacific DataVision, Inc.*2 |
17,700 |
745,701 |
|||||||||
|
825,748 |
|||||||||||
|
Energy equipment & services: 0.94% |
|||||||||||
|
Noble Corp. PLC |
27,600 |
424,764 |
|||||||||
|
Food & staples retailing: 2.43% |
|||||||||||
|
Rite Aid Corp.* |
130,800 |
1,092,180 |
|||||||||
|
Food products: 4.84% |
|||||||||||
|
Mondelez International, Inc., Class A |
52,900 |
2,176,306 |
|||||||||
|
Insurance: 6.66% |
|||||||||||
|
Lincoln National Corp. |
23,800 |
1,409,436 |
|||||||||
|
MetLife, Inc. |
28,300 |
1,584,517 |
|||||||||
|
2,993,953 |
|||||||||||
|
Internet & catalog retail: 4.35% |
|||||||||||
|
Amazon.com, Inc.* |
4,500 |
1,953,405 |
|||||||||
|
Internet software & services: 4.33% |
|||||||||||
|
Google, Inc., Class A* |
1,980 |
1,069,279 |
|||||||||
|
Google, Inc., Class C* |
1,684 |
876,539 |
|||||||||
|
1,945,818 |
|||||||||||
|
Shares |
Value |
||||||||||
|
Life sciences tools & services: 2.35% |
|||||||||||
|
Bio-Rad Laboratories, Inc., Class A* |
7,000 |
$ |
1,054,270 |
||||||||
|
Machinery: 2.93% |
|||||||||||
|
Colfax Corp.* |
28,500 |
1,315,275 |
|||||||||
|
Oil, gas & consumable fuels: 5.87% |
|||||||||||
|
EOG Resources, Inc. |
17,200 |
1,505,860 |
|||||||||
|
Laredo Petroleum, Inc.*1 |
90,114 |
1,133,634 |
|||||||||
|
2,639,494 |
|||||||||||
|
Real estate investment trust (REIT): 3.92% |
|||||||||||
|
Digital Realty Trust, Inc. |
26,400 |
1,760,352 |
|||||||||
|
Semiconductors & semiconductor equipment: 11.76% |
|||||||||||
|
Applied Materials, Inc. |
58,600 |
1,126,292 |
|||||||||
|
Broadcom Corp., Class A |
19,300 |
993,757 |
|||||||||
|
Freescale Semiconductor Ltd.* |
24,500 |
979,265 |
|||||||||
|
Mellanox Technologies Ltd.* |
29,100 |
1,413,969 |
|||||||||
|
Micron Technology, Inc.* |
41,000 |
772,440 |
|||||||||
|
5,285,723 |
|||||||||||
|
Software: 2.88% |
|||||||||||
|
Check Point Software Technologies Ltd.* |
16,300 |
1,296,665 |
|||||||||
|
Technology hardware, storage & peripherals: 9.22% |
|||||||||||
|
Apple, Inc. |
23,575 |
2,956,895 |
|||||||||
|
NetApp, Inc. |
37,600 |
1,186,656 |
|||||||||
|
4,143,551 |
|||||||||||
|
Tobacco: 4.50% |
|||||||||||
|
Philip Morris International, Inc. |
25,200 |
2,020,284 |
|||||||||
|
Total common stocks (cost $37,299,153) |
44,623,897 |
||||||||||
|
Short-term investment: 0.89% |
|||||||||||
|
Investment company: 0.89% |
|||||||||||
|
UBS Cash Management Prime Relationship Fund3 (cost $398,780) |
398,780 |
398,780 |
|||||||||
|
Investment of cash collateral from securities loaned: 2.96% |
|||||||||||
|
UBS Private Money Market Fund LLC3 (cost $1,331,642) |
1,331,642 |
1,331,642 |
|||||||||
|
Total investments: 103.14% (cost $39,029,575) |
46,354,319 |
||||||||||
|
Liabilities, in excess of cash and other assets: (3.14)% |
(1,411,712 |
) |
|||||||||
|
Net assets: 100.00% |
$ |
44,942,607 |
|||||||||
51
UBS U.S. Equity Opportunity Fund
Portfolio of investments
June 30, 2015
Notes to portfolio of investments
Aggregate cost for federal income tax purposes was $39,123,192; and net unrealized appreciation consisted of:
|
Gross unrealized appreciation |
$ |
8,930,357 |
|||||
|
Gross unrealized depreciation |
(1,699,230 |
) |
|||||
|
Net unrealized appreciation of investments |
$ |
7,231,127 |
|||||
For a listing of defined portfolio acronyms, counterparty abbreviations and currency abbreviations that are used throughout the Portfolio of investments as well as the tables that follow, please refer to page 71. Portfolio footnotes begin below.
The following is a summary of the fair valuations according to the inputs used as of June 30, 2015 in valuing the Fund's investments:
|
Description |
Unadjusted quoted prices in active markets for identical investments (Level 1) |
Other significant observable inputs (Level 2) |
Unobservable inputs (Level 3) |
Total |
|||||||||||||||
|
Assets |
|||||||||||||||||||
|
Common stocks |
$ |
43,878,196 |
$ |
745,701 |
$ |
— |
$ |
44,623,897 |
|||||||||||
|
Short-term investment |
— |
398,780 |
— |
398,780 |
|||||||||||||||
|
Investment of cash collateral from securities loaned |
— |
1,331,642 |
— |
1,331,642 |
|||||||||||||||
|
Total |
$ |
43,878,196 |
$ |
2,476,123 |
$ |
— |
$ |
46,354,319 |
|||||||||||
At June 30, 2015, there were no transfers between Level 1 and Level 2.
Portfolio footnotes
* Non-income producing security.
1 Security, or portion thereof, was on loan at June 30, 2015.
2 Security exempt from registration pursuant to Rule 144A under the Securities Act of 1933. This security is considered liquid, unless noted otherwise, and may be resold in transactions exempt from registration, normally to qualified institutional buyers. At June 30, 2015, the value of this security amounted to $745,701 or 1.66% of net assets.
3 The table below details the Fund's investments in funds advised by the same Advisor as the Fund. The Advisor does not earn a management fee from the affiliated UBS Relationship Fund.
|
Security description |
Value 06/30/14 |
Purchases during the year ended 06/30/15 |
Sales during the year ended 06/30/15 |
Value 06/30/15 |
Net income earned from affiliate for the year ended 06/30/15 |
||||||||||||||||||
|
UBS Cash Management Prime Relationship Fund |
$ |
1,765,405 |
$ |
12,028,238 |
$ |
13,394,863 |
$ |
398,780 |
$ |
1,500 |
|||||||||||||
|
UBS Private Money Market Fund LLCa |
2,555,583 |
27,257,887 |
28,481,828 |
1,331,642 |
118 |
||||||||||||||||||
|
$ |
4,320,988 |
$ |
39,286,125 |
$ |
41,876,691 |
$ |
1,730,422 |
$ |
1,618 |
||||||||||||||
a The Advisor earns a management fee from this affiliated fund. Please see the Notes to financial statements for further information.
See accompanying notes to financial statements.
52
UBS U.S. Large Cap Equity Fund
Portfolio performance
For the 12 months ended June 30, 2015, Class A shares of UBS U.S. Large Cap Equity Fund (the "Fund") returned 10.61% (Class A shares returned 4.52% after the deduction of the maximum sales charge), while Class P shares returned 10.90%. The Fund's benchmark, the Russell 1000 Index (the "Index"), returned 7.37% over the same time period. (Class P shares have lower expenses than other share classes of the Fund. Returns for all share classes over various time periods are shown on page 56; please note that the Fund's returns do not reflect the deduction of taxes that a shareholder would pay on Fund distributions or the redemption of Fund shares, while the Index returns do not reflect the deduction of fees and expenses.)
The Fund outperformed the Index primarily due to stock selection.
Portfolio performance summary1
What worked
• An overweight to the health care sector, along with strong stock selection within the sector, made a significant contribution to Fund performance. While health care was the best-performing sector in the benchmark index, the Fund benefitted from holding several names in particular.
– Hospira, Inc. was the Fund's top-performing stock during the reporting period. The generic drug company, which provides injectables and infusion technologies, saw its share price rise 70% after Pfizer announced plans to acquire Hospira at a significant premium. We sold the position after that announcement, as the stock reached what we consider fair value.
– Alnylam was a top contributor during the 12 months. The biotech company, which specializes in RNAi therapeutics, saw its stock price climb steadily based on positive earnings estimate revision activity and favorable news on both the clinical trial and intellectual property front.
– Chimerix made a strong contribution to Fund performance. The development-stage biotech company boasts a promising drug pipeline that includes an antiviral treatment recently used to treat Ebola. (For details, see "Portfolio highlights.")
– The stock price of Bluebird Bio soared on the company's announcement that its experimental gene therapy had ended the need for regular blood transfusions in four patients with beta thalassemia major, an inherited blood disorder.
• The Fund's information technology stocks, particularly the semiconductor names, were positive for performance during the reporting period.
– Shares of Freescale Semiconductor climbed 80% after the company reported strong fourth quarter earnings and a revenue outlook that exceeded market expectations. News of Freescale's acquisition by NXP Semiconductors gave the stock an additional boost, as the deal will create the largest supplier of microchips in the automotive industry. We realized our investment thesis and sold the stock before the end of the period.
• The Fund benefited from the decision not to hold utilities stocks. The sector posted negative returns during the 12 months, which helped the Fund's relative performance.
1 For a detailed commentary on the market environment in general during the reporting period, see page 3.
53
UBS U.S. Large Cap Equity Fund
What didn't work
• Several energy stocks detracted from Fund returns during the 12 months. We believe the market is overreacting to the decline in oil prices, as we have identified attractive opportunities within the exploration and production (E&P) sector.
– EOG Resources saw its share price struggle as a result of oil price volatility. We remain confident in our long-term thesis and consider EOG Resources best of breed among E&P companies.
– Shares of Noble Corporation declined 43% for the 12-month period. Calendar year 2014 presented a difficult environment for offshore drillers, with challenging trends in the number of uncontracted new-build deliveries, rigs rolling off contracts, and operator sublets. As a result, these companies have seen intense competition, falling day rates and rig retirements, all of which exerted downward pressure on Noble's stock price.
– McDermott International also detracted from relative returns. The company reported significant operating losses and indicated that the trend would continue in the near term based on the current environment for companies in the oil and gas industry.
• Several individual stock positions in various industries made a negative contribution to the Fund's returns. Industry weightings did not have any noteworthy negative effects.
– Micron Technology was a top detractor, declining 43% during the period. The semiconductor company indicated an outlook for the fiscal fourth quarter that was worse than expected. While Micron is wrestling with increased costs for product line transitions, we believe the company and its industry are better positioned than at any time in the past. We maintain high conviction in our thesis for Micron and continue to hold the position.
– Shares of Hertz Global Holdings traded lower during the 12-month period. The car rental company's stock price declined following accounting issues and recent board changes. Given consolidation within the rental car industry, we believe Hertz can realize cost efficiencies and better buying and selling of car inventory, which should lead to margin improvement over the long run.
Portfolio highlights
• Mondelez International manufactures and markets snack food and beverages including cookies, crackers, chocolate, gum, candy, coffee, powdered beverages, and various cheese and grocery products. We believe Mondelez is well-positioned for growth due to its significant exposure to developing markets. We think there is an opportunity for margin expansion from a rebound in Europe and by leveraging synergies across distribution platforms.
• Yum! Brands is the leading multi-concept global restaurant company. Its three main concepts are KFC, Taco Bell and Pizza Hut. Our research indicates that the market is undervaluing the long-term value of the KFC and Pizza Hut franchises in China. Unit growth in China has accelerated in recent years as a result of prior investment in infrastructure. This should allow for more rapid growth in smaller cities. We expect Yum! to continue to grow earnings per share by double digits for the next several years through a combination of strong international growth and return of capital to shareholders through dividends and share repurchases.
• Philip Morris is a leading player in the global cigarette and tobacco market. We believe the market underappreciates the persistence and predictability of the company's cash flows and its returns to shareholders. Philip Morris's regulatory and consumption risk is well-diversified across 180 markets around the globe. While govern-
54
UBS U.S. Large Cap Equity Fund
ments have an interest in reducing tobacco consumption, they have become reliant on steady tobacco tax flows. Many governments are working with Philip Morris to encourage steady but slow declines in consumption while growing taxation and price revenues.
• Pepsico is a worldwide beverage, snack and food business with 22 brands, each worth $1 billion. The stock has underperformed the market on a relative basis as carbonated beverage volume has declined. We believe Pepsico will grow the share of its revenue from foods, driven by its powerful brands and innovations in the salty snacks category. In addition, the company is emphasizing non-carbonated beverages such as energy drinks and bottled waters.
• Chimerix is a biotechnology company that is advancing an antiviral treatment for double-stranded DNA viruses. The product is being tested for treating cytomegalovirus in adult stem cell transplant patients, with data due to be released in mid-2015. A handful of additional indications for the treatment should follow. We believe the drug has greater market potential than Wall Street currently recognizes. The recent use of the drug to treat Ebola could result in stockpiling and/or more rapid regulatory approval timelines to facilitate treatment of patients.
This letter is intended to assist shareholders in understanding how the Fund performed during the 12 months ended June 30, 2015. The views and opinions in the letter were current as of August 14, 2015. They are not guarantees of future performance or investment results and should not be taken as investment advice. Investment decisions reflect a variety of factors, and we reserve the right to change our views about individual securities, sectors and markets at any time. As a result, the views expressed should not be relied upon as a forecast of the Fund's future investment intent. We encourage you to consult your financial advisor regarding your personal investment program.
Mutual funds are sold by prospectus only. You should read it carefully and consider a fund's investment objectives, risks, charges, expenses and other important information contained in the prospectus before investing. Prospectuses for most of our funds can be obtained from your financial advisor, by calling UBS Funds at 800-647 1568 or by visiting our Web site at www.ubs.com.
55
UBS U.S. Large Cap Equity Fund
Average annual total returns for periods ended 06/30/15 (unaudited)
|
1 year |
5 years |
10 years |
|||||||||||||
|
Before deducting maximum sales charge |
|||||||||||||||
|
Class A1 |
10.61 |
% |
17.23 |
% |
6.98 |
% |
|||||||||
|
Class C2 |
9.80 |
16.36 |
6.19 |
||||||||||||
|
Class P3 |
10.90 |
17.52 |
7.26 |
||||||||||||
|
After deducting maximum sales charge |
|||||||||||||||
|
Class A1 |
4.52 |
% |
15.92 |
% |
6.37 |
% |
|||||||||
|
Class C2 |
8.80 |
16.36 |
6.19 |
||||||||||||
|
Russell 1000 Index4 |
7.37 |
% |
17.58 |
% |
8.13 |
% |
|||||||||
The annualized gross and net expense ratios, respectively, for each class of shares as in the October 28, 2014 prospectuses were as follows: Class A—1.29% and 1.20%; Class C—2.08% and 1.95%; Class P—0.99% and 0.95%. Net expenses reflect fee waivers and/or expense reimbursements, if any, pursuant to an agreement that is in effect to cap the expenses. The Trust, with respect to the Fund, and UBS Global Asset Management (Americas) Inc., the Fund's investment advisor ("UBS Global AM (Americas)" or the "Advisor"), have entered into a written agreement pursuant to which the Advisor has agreed to waive a portion of its management fees and/or to reimburse expenses (excluding expenses incurred through investment in other investment companies, interest, taxes, brokerage commissions and extraordinary expenses) to the extent necessary so that the Fund's ordinary operating expenses (excluding expenses incurred through investment in other investment companies, interest, taxes, brokerage commissions and extraordinary expenses), through the period ending October 27, 2015, do not exceed 1.20% for Class A shares, 1.95% for Class C shares and 0.95% for Class P shares. Pursuant to the written agreement, the Advisor is entitled to be reimbursed for any fees it waives and expenses it reimburses for a period of three years following such fee waivers and expense reimbursements to the extent that such reimbursement of the Advisor by the Fund will not cause the Fund to exceed any applicable expense limit that is in place for the Fund. The fee waiver/expense reimbursement agreement may be terminated by the Fund's Board of Trustees at any time and also will terminate automatically upon the expiration or termination of the Fund's advisory contract with the Advisor. Upon termination of the fee waiver/expense reimbursement agreement, however, UBS Global AM (Americas)'s three year recoupment rights will survive.
1 Maximum sales charge for Class A shares is 5.5%. Class A shares bear ongoing 12b-1 service fees.
2 Maximum contingent deferred sales charge for Class C shares is 1% imposed on redemptions and is reduced to 0% after one year. Class C shares bear ongoing 12b-1 distribution and service fees.
3 Class P shares do not bear initial or contingent deferred sales charges or ongoing 12b-1 service and distribution fees, but Class P shares held through advisory programs may be subject to a program fee, which, if included, would have reduced performance.
4 The Russell 1000 Index is designed to measure the performance of the large-cap segment of the US equity universe. It is a subset of the Russell 3000 Index and includes approximately 1,000 of the largest securities based on a combination of their market cap and current index membership. The Russell 1000 Index is constructed to provide a comprehensive and unbiased barometer for the large-cap segment and is completely reconstituted annually to ensure new and growing equities are reflected. Investors should note that indices do not reflect the deduction of fees and expenses.
Prior to February 17, 2015, if an investor sold or exchanged shares less than 90 days after purchase, a redemption fee of 1.00% of the amount sold or exchanged was deducted at the time of the transaction, except as noted otherwise in the prospectus. For sales or exchanges taking place on or after February 17, 2015 but prior to August 3, 2015, there is a reduction in the redemption holding period from 90 days to 30 days. Effective August 3, 2015, the 1.00% redemption fee imposed on sales or exchanges of any class of shares of the funds made during the holding periods specified in the prospectus will be eliminated. Please refer to the prospectus for further information.
Past performance does not predict future performance, and the performance information provided does not reflect the deduction of taxes that a shareholder would pay on Fund distributions or the redemption of Fund shares. The return and principal value of an investment will fluctuate, so that an investor's shares, when redeemed, may be worth more or less than their original cost. Performance results assume reinvestment of all dividends and capital gain distributions at net asset value on the ex-dividend dates. Current performance may be higher or lower than the performance data quoted. For month-end performance figures, please visit http://globalam-us.ubs.com/corpweb/performance.do.
56
UBS U.S. Large Cap Equity Fund
Illustration of an assumed investment of $10,000 in Class A shares (adjusted for 5.5% maximum sales charge) and $5,000,000 in Class P shares (unaudited)
The following two graphs depict the performance of UBS U.S. Large Cap Equity Fund Class A and Class P shares versus the Russell 1000 Index over the 10 years ended June 30, 2015. The performance of Class C shares will vary based upon the different class specific expenses and sales charges. The performance provided does not reflect the deduction of taxes that a shareholder would pay on Fund distributions or the redemption of Fund shares. Past performance is no guarantee of future results. Share price and returns will vary with market conditions; investors may realize a gain or loss upon redemption.
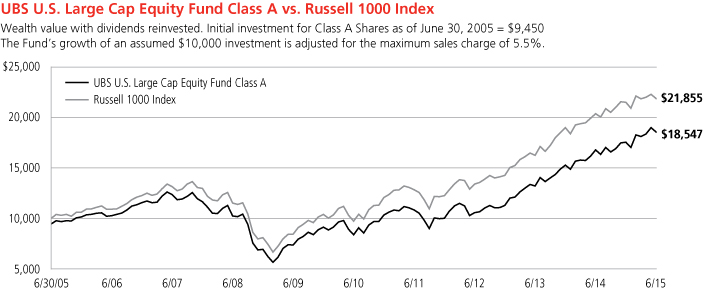
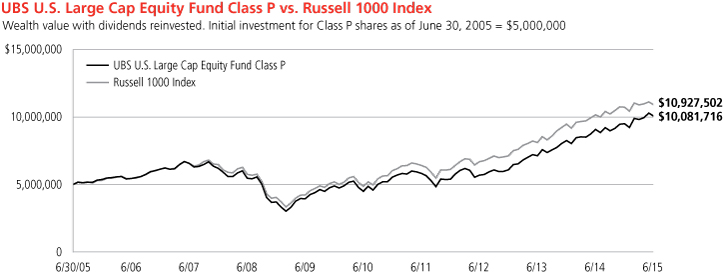
Past performance does not predict future performance, and the performance information provided does not reflect the deduction of taxes that a shareholder would pay on Fund distributions or the redemption of Fund shares. The return and principal value of an investment will fluctuate, so that an investor's shares, when redeemed, may be worth more or less than their original cost. Performance results assume reinvestment of all dividends and capital gain distributions at net asset value on the ex-dividend dates. Current performance may be higher or lower than the performance data quoted. For month-end performance figures, please visit http://globalam-us.ubs.com/corpweb/performance.do.
57
UBS U.S. Large Cap Equity Fund
Top ten equity holdings (unaudited)1
As of June 30, 2015
|
Percentage of net assets |
|||||||
|
Mondelez International, Inc., Class A |
2.7 |
% |
|||||
|
Walt Disney Co. |
2.7 |
||||||
|
JPMorgan Chase & Co. |
2.7 |
||||||
|
Philip Morris International, Inc. |
2.6 |
||||||
|
Yum! Brands, Inc. |
2.6 |
||||||
|
PepsiCo, Inc. |
2.6 |
||||||
|
Citigroup, Inc. |
2.4 |
||||||
|
Facebook, Inc., Class A |
2.2 |
||||||
|
US Bancorp |
1.9 |
||||||
|
UnitedHealth Group, Inc. |
1.9 |
||||||
|
Total |
24.3 |
% |
|||||
Industry diversification (unaudited)1
As a percentage of net assets as of June 30, 2015
|
Common stocks |
|||||||
|
Automobiles |
2.22 |
% |
|||||
|
Banks |
6.99 |
||||||
|
Beverages |
2.55 |
||||||
|
Biotechnology |
6.03 |
||||||
|
Capital markets |
1.67 |
||||||
|
Chemicals |
3.21 |
||||||
|
Communications equipment |
0.69 |
||||||
|
Consumer finance |
2.98 |
||||||
|
Electronic equipment, instruments & components |
2.37 |
||||||
|
Energy equipment & services |
1.94 |
||||||
|
Food & staples retailing |
2.00 |
||||||
|
Food products |
2.75 |
||||||
|
Health care providers & services |
4.41 |
||||||
|
Hotels, restaurants & leisure |
2.55 |
||||||
|
Household durables |
2.05 |
||||||
|
Insurance |
4.45 |
||||||
|
Internet & catalog retail |
1.89 |
||||||
|
Internet software & services |
2.18 |
||||||
|
IT services |
2.35 |
||||||
|
Life sciences tools & services |
0.85 |
||||||
|
Machinery |
2.47 |
||||||
|
Media |
3.98 |
||||||
|
Oil, gas & consumable fuels |
5.59 |
||||||
|
Pharmaceuticals |
6.83 |
||||||
|
Real estate investment trust (REIT) |
2.93 |
||||||
|
Road & rail |
3.66 |
||||||
|
Semiconductors & semiconductor equipment |
6.62 |
||||||
|
Software |
2.84 |
||||||
|
Specialty retail |
0.84 |
||||||
|
Technology hardware, storage & peripherals |
3.10 |
||||||
|
Tobacco |
2.64 |
||||||
|
Trading companies & distributors |
1.19 |
||||||
|
Total common stocks |
98.82 |
% |
|||||
|
Investment company |
|||||||
|
SPDR S&P 500 ETF Trust |
0.76 |
||||||
|
Short-term investment |
1.31 |
||||||
|
Investment of cash collateral from securities loaned |
3.04 |
||||||
|
Total investments |
103.93 |
% |
|||||
|
Liabilities, in excess of cash and other assets |
(3.93 |
) |
|||||
|
Net assets |
100.00 |
% |
|||||
1 Figures represent the direct investments of UBS U.S. Large Cap Equity Fund. Figures may be different if a breakdown of the underlying investment companies was included.
58
UBS U.S. Large Cap Equity Fund
Portfolio of investments
June 30, 2015
|
Shares |
Value |
||||||||||
|
Common stocks: 98.82% |
|||||||||||
|
Automobiles: 2.22% |
|||||||||||
|
Ford Motor Co. |
24,500 |
$ |
367,745 |
||||||||
|
General Motors Co. |
16,100 |
536,613 |
|||||||||
|
904,358 |
|||||||||||
|
Banks: 6.99% |
|||||||||||
|
Citigroup, Inc. |
17,860 |
986,587 |
|||||||||
|
JPMorgan Chase & Co. |
15,932 |
1,079,552 |
|||||||||
|
US Bancorp |
18,061 |
783,847 |
|||||||||
|
2,849,986 |
|||||||||||
|
Beverages: 2.55% |
|||||||||||
|
PepsiCo, Inc. |
11,146 |
1,040,368 |
|||||||||
|
Biotechnology: 6.03% |
|||||||||||
|
Acorda Therapeutics, Inc.* |
11,500 |
383,295 |
|||||||||
|
Alnylam Pharmaceuticals, Inc.* |
6,095 |
730,608 |
|||||||||
|
Atara Biotherapeutics, Inc.* |
3,778 |
199,327 |
|||||||||
|
Bluebird Bio, Inc.* |
467 |
78,629 |
|||||||||
|
Chimerix, Inc.* |
15,761 |
728,158 |
|||||||||
|
Lexicon Pharmaceuticals, Inc.*1 |
29,986 |
241,387 |
|||||||||
|
MacroGenics, Inc.* |
1,300 |
49,361 |
|||||||||
|
Regulus Therapeutics, Inc.*1 |
4,400 |
48,224 |
|||||||||
|
2,458,989 |
|||||||||||
|
Capital markets: 1.67% |
|||||||||||
|
Invesco Ltd. |
11,400 |
427,386 |
|||||||||
|
Morgan Stanley |
6,500 |
252,135 |
|||||||||
|
679,521 |
|||||||||||
|
Chemicals: 3.21% |
|||||||||||
|
Monsanto Co. |
5,166 |
550,644 |
|||||||||
|
Praxair, Inc. |
6,344 |
758,425 |
|||||||||
|
1,309,069 |
|||||||||||
|
Communications equipment: 0.69% |
|||||||||||
|
Arista Networks, Inc.*1 |
3,455 |
282,412 |
|||||||||
|
Consumer finance: 2.98% |
|||||||||||
|
American Express Co. |
8,406 |
653,314 |
|||||||||
|
Capital One Financial Corp. |
6,400 |
563,008 |
|||||||||
|
1,216,322 |
|||||||||||
|
Electronic equipment, instruments & components: 2.37% |
|||||||||||
|
CDW Corp. |
9,211 |
315,753 |
|||||||||
|
Dolby Laboratories, Inc., Class A |
8,445 |
335,097 |
|||||||||
|
Jabil Circuit, Inc. |
14,758 |
314,198 |
|||||||||
|
965,048 |
|||||||||||
|
Shares |
Value |
||||||||||
|
Energy equipment & services: 1.94% |
|||||||||||
|
Halliburton Co. |
7,225 |
$ |
311,181 |
||||||||
|
McDermott International, Inc.* |
45,900 |
245,106 |
|||||||||
|
Noble Corp. PLC |
15,200 |
233,928 |
|||||||||
|
790,215 |
|||||||||||
|
Food & staples retailing: 2.00% |
|||||||||||
|
Rite Aid Corp.* |
46,300 |
386,605 |
|||||||||
|
Walgreens Boots Alliance, Inc. |
5,100 |
430,644 |
|||||||||
|
817,249 |
|||||||||||
|
Food products: 2.75% |
|||||||||||
|
Mondelez International, Inc., Class A |
27,233 |
1,120,366 |
|||||||||
|
Health care providers & services: 4.41% |
|||||||||||
|
Envision Healthcare Holdings, Inc.* |
13,400 |
529,032 |
|||||||||
|
Laboratory Corp. of America Holdings* |
4,036 |
489,244 |
|||||||||
|
UnitedHealth Group, Inc. |
6,400 |
780,800 |
|||||||||
|
1,799,076 |
|||||||||||
|
Hotels, restaurants & leisure: 2.55% |
|||||||||||
|
Yum! Brands, Inc. |
11,557 |
1,041,055 |
|||||||||
|
Household durables: 2.05% |
|||||||||||
|
Jarden Corp.* |
9,900 |
512,325 |
|||||||||
|
Lennar Corp., Class A |
6,300 |
321,552 |
|||||||||
|
833,877 |
|||||||||||
|
Insurance: 4.45% |
|||||||||||
|
Aon PLC |
6,700 |
667,856 |
|||||||||
|
Lincoln National Corp. |
8,588 |
508,581 |
|||||||||
|
MetLife, Inc. |
11,400 |
638,286 |
|||||||||
|
1,814,723 |
|||||||||||
|
Internet & catalog retail: 1.89% |
|||||||||||
|
Amazon.com, Inc.* |
1,777 |
771,378 |
|||||||||
|
Internet software & services: 2.18% |
|||||||||||
|
Facebook, Inc., Class A* |
10,349 |
887,582 |
|||||||||
|
IT services: 2.35% |
|||||||||||
|
ServiceSource International, Inc.* |
48,100 |
263,107 |
|||||||||
|
Visa, Inc., Class A |
10,336 |
694,062 |
|||||||||
|
957,169 |
|||||||||||
|
Life sciences tools & services: 0.85% |
|||||||||||
|
Bio-Rad Laboratories, Inc., Class A* |
2,300 |
346,403 |
|||||||||
59
UBS U.S. Large Cap Equity Fund
Portfolio of investments
June 30, 2015
|
Shares |
Value |
||||||||||
|
Common stocks—(Concluded) |
|||||||||||
|
Machinery: 2.47% |
|||||||||||
|
Caterpillar, Inc. |
4,318 |
$ |
366,253 |
||||||||
|
Colfax Corp.*1 |
7,600 |
350,740 |
|||||||||
|
Joy Global, Inc. |
8,000 |
289,600 |
|||||||||
|
1,006,593 |
|||||||||||
|
Media: 3.98% |
|||||||||||
|
CBS Corp. (Non-Voting), Class B |
9,670 |
536,685 |
|||||||||
|
Walt Disney Co. |
9,500 |
1,084,330 |
|||||||||
|
1,621,015 |
|||||||||||
|
Oil, gas & consumable fuels: 5.59% |
|||||||||||
|
Approach Resources, Inc.*1 |
18,800 |
128,780 |
|||||||||
|
Chevron Corp. |
5,706 |
550,458 |
|||||||||
|
Cobalt International Energy, Inc.* |
30,400 |
295,184 |
|||||||||
|
EOG Resources, Inc. |
4,605 |
403,168 |
|||||||||
|
Gulfport Energy Corp.* |
4,600 |
185,150 |
|||||||||
|
Laredo Petroleum, Inc.*1 |
11,100 |
139,638 |
|||||||||
|
Oasis Petroleum, Inc.*1 |
9,100 |
144,235 |
|||||||||
|
PDC Energy, Inc.* |
5,500 |
295,020 |
|||||||||
|
SM Energy Co. |
3,000 |
138,360 |
|||||||||
|
2,279,993 |
|||||||||||
|
Pharmaceuticals: 6.83% |
|||||||||||
|
Actavis PLC* |
477 |
144,750 |
|||||||||
|
Allergan PLC* |
2,099 |
636,962 |
|||||||||
|
Catalent, Inc.* |
18,400 |
539,672 |
|||||||||
|
Eli Lilly & Co. |
8,163 |
681,529 |
|||||||||
|
Impax Laboratories, Inc.* |
10,991 |
504,707 |
|||||||||
|
Teva Pharmaceutical Industries Ltd. ADR |
4,700 |
277,770 |
|||||||||
|
2,785,390 |
|||||||||||
|
Real estate investment trust (REIT): 2.93% |
|||||||||||
|
Digital Realty Trust, Inc. |
8,600 |
573,448 |
|||||||||
|
Simon Property Group, Inc. |
3,600 |
622,872 |
|||||||||
|
1,196,320 |
|||||||||||
|
Road & rail: 3.66% |
|||||||||||
|
Hertz Global Holdings, Inc.* |
16,400 |
297,168 |
|||||||||
|
Norfolk Southern Corp. |
6,026 |
526,431 |
|||||||||
|
Union Pacific Corp. |
7,010 |
668,544 |
|||||||||
|
1,492,143 |
|||||||||||
|
Semiconductors & semiconductor equipment: 6.62% |
|||||||||||
|
Broadcom Corp., Class A |
8,100 |
417,069 |
|||||||||
|
Integrated Device Technology, Inc.* |
10,556 |
229,065 |
|||||||||
|
Maxim Integrated Products, Inc. |
7,385 |
255,337 |
|||||||||
|
Micron Technology, Inc.* |
26,723 |
503,461 |
|||||||||
|
Shares |
Value |
||||||||||
|
NXP Semiconductors NV* |
2,400 |
$ |
235,680 |
||||||||
|
ON Semiconductor Corp.* |
20,117 |
235,168 |
|||||||||
|
Qorvo, Inc.* |
3,316 |
266,175 |
|||||||||
|
Silicon Laboratories, Inc.* |
4,900 |
264,649 |
|||||||||
|
Skyworks Solutions, Inc. |
2,801 |
291,584 |
|||||||||
|
2,698,188 |
|||||||||||
|
Software: 2.84% |
|||||||||||
|
Check Point Software Technologies Ltd.* |
7,700 |
612,535 |
|||||||||
|
Symantec Corp. |
23,400 |
544,050 |
|||||||||
|
1,156,585 |
|||||||||||
|
Specialty retail: 0.84% |
|||||||||||
|
Best Buy Co., Inc. |
10,489 |
342,046 |
|||||||||
|
Technology hardware, storage & peripherals: 3.10% |
|||||||||||
|
Apple, Inc. |
5,406 |
678,047 |
|||||||||
|
SanDisk Corp. |
4,421 |
257,391 |
|||||||||
|
Western Digital Corp. |
4,192 |
328,737 |
|||||||||
|
1,264,175 |
|||||||||||
|
Tobacco: 2.64% |
|||||||||||
|
Philip Morris International, Inc. |
13,428 |
1,076,523 |
|||||||||
|
Trading companies & distributors: 1.19% |
|||||||||||
|
Fastenal Co. |
11,515 |
485,703 |
|||||||||
|
Total common stocks (cost $36,696,521) |
40,289,840 |
||||||||||
|
Investment company: 0.76% |
|||||||||||
|
SPDR S&P 500 ETF Trust (cost $315,747) |
1,500 |
308,775 |
|||||||||
|
Short-term investment: 1.31% |
|||||||||||
|
Investment company: 1.31% |
|||||||||||
|
UBS Cash Management Prime Relationship Fund2 (cost $533,330) |
533,330 |
533,330 |
|||||||||
|
Investment of cash collateral from securities loaned: 3.04% |
|||||||||||
|
UBS Private Money Market Fund LLC2 (cost $1,240,202) |
1,240,202 |
1,240,202 |
|||||||||
|
Total investments: 103.93% (cost $38,785,800) |
42,372,147 |
||||||||||
|
Liabilities, in excess of cash and other assets: (3.93)% |
(1,600,532 |
) |
|||||||||
|
Net assets: 100.00% |
$ |
40,771,615 |
|||||||||
60
UBS U.S. Large Cap Equity Fund
Portfolio of investments
June 30, 2015
Notes to portfolio of investments
Aggregate cost for federal income tax purposes was $39,127,239; and net unrealized appreciation consisted of:
|
Gross unrealized appreciation |
$ |
4,824,021 |
|||||
|
Gross unrealized depreciation |
(1,579,113 |
) |
|||||
|
Net unrealized appreciation of investments |
$ |
3,244,908 |
|||||
For a listing of defined portfolio acronyms, counterparty abbreviations and currency abbreviations that are used throughout the Portfolio of investments as well as the tables that follow, please refer to page 71. Portfolio footnotes begin below.
The following is a summary of the fair valuations according to the inputs used as of June 30, 2015 in valuing the Fund's investments:
|
Description |
Unadjusted quoted prices in active markets for identical investments (Level 1) |
Other significant observable inputs (Level 2) |
Unobservable inputs (Level 3) |
Total |
|||||||||||||||
|
Assets |
|||||||||||||||||||
|
Common stocks |
$ |
40,289,840 |
$ |
— |
$ |
— |
$ |
40,289,840 |
|||||||||||
|
Investment company |
308,775 |
— |
— |
308,775 |
|||||||||||||||
|
Short-term investment |
— |
533,330 |
— |
533,330 |
|||||||||||||||
|
Investment of cash collateral from securities loaned |
— |
1,240,202 |
— |
1,240,202 |
|||||||||||||||
|
Total |
$ |
40,598,615 |
$ |
1,773,532 |
$ |
— |
$ |
42,372,147 |
|||||||||||
At June 30, 2015, there were no transfers between Level 1 and Level 2.
Portfolio footnotes
* Non-income producing security.
1 Security, or portion thereof, was on loan at June 30, 2015.
2 The table below details the Fund's investments in funds advised by the same Advisor as the Fund. The Advisor does not earn a management fee from the affiliated UBS Relationship Funds.
|
Security description |
Value 06/30/14 |
Purchases during the year ended 06/30/15 |
Sales during the year ended 06/30/15 |
Value 06/30/15 |
Net income earned from affiliate for the year ended 06/30/15 |
||||||||||||||||||
|
UBS Cash Management Prime Relationship Fund |
$ |
1,970,647 |
$ |
28,660,989 |
$ |
30,098,306 |
$ |
533,330 |
$ |
1,114 |
|||||||||||||
|
UBS Private Money Market Fund LLCa |
7,380,954 |
52,794,140 |
58,934,892 |
1,240,202 |
268 |
||||||||||||||||||
|
$ |
9,351,601 |
$ |
81,455,129 |
$ |
89,033,198 |
$ |
1,773,532 |
$ |
1,382 |
||||||||||||||
a The Advisor earns a management fee from this affiliated fund. Please see the Notes to financial statements for further information.
See accompanying notes to financial statements.
61
UBS U.S. Small Cap Growth Fund
Portfolio performance
For the 12 months ended June 30, 2015, Class A shares of UBS U.S. Small Cap Growth Fund (the "Fund") returned 15.61% (Class A shares returned 9.25% after the deduction of the maximum sales charge), while Class P shares returned 15.93%. The Fund's benchmark, the Russell 2000 Growth Index (the "Index"), returned 12.34% over the same time period. (Class P shares have lower expenses than other share classes of the Fund. Returns for all share classes over various time periods are shown on page 65; please note that the Fund's returns do not reflect the deduction of taxes that a shareholder would pay on Fund distributions or the redemption of Fund shares, while the Index returns do not reflect the deduction of fees and expenses.)
The Fund outperformed the Index primarily due to stock selection decisions.
Portfolio performance summary1
What worked
• Stock selection within the health care sector made a significant contribution to Fund returns during the 12 months ended June 30, 2015. Though the Fund was slightly underweight to the biotechnology sector, the biotech names that we held posted strong performance.
– Receptos, a clinical-stage biotechnology company, was one of the Fund's top performers during the 12-month period. The company is focused on the development of a drug with potential use for multiple sclerosis, ulcerative colitis and Crohn's disease. The stock traded higher as investor optimism increased around the potential for Receptos to partner its lead program or be acquired by a large pharmaceutical company.
– The Fund's position in Bluebird Bio made a strong contribution to relative returns. The biotechnology company focuses on gene therapy. The stock price was up after bluebird reported data showing that its LentiGlobin product was able to free certain patients from monthly blood transfusions. We sold the stock after the strong period of outperformance.
– DexCom is a leading provider of continuous glucose monitoring systems. The company saw its shares trade higher during the reporting period, based on the potential for continuous glucose monitoring to become the standard of care for Type 1 diabetics. (For details, see "Portfolio highlights.")
– Shares of Exact Sciences, a molecular diagnostics company, rose after the Centers for Medicare and Medicaid Services finalized its National Coverage Decision and issued higher-than-expected preliminary reimbursement for Cologuard, the company's non-invasive stool-based DNA screening assay.
• Stock selection in the information technology sector also drove the Fund's outperformance. An overweight to the software sector, as well as the specific names we held, made positive contributions to relative returns.
– Imperva was the Fund's top performer during the 12 months. The company develops protection software and services for databases and business applications. Imperva's shares rose based on investor confidence that the demand for data security is increasing while the industry's sales cycles are becoming more predictable. (For details, see "Portfolio highlights.")
– A position in Proofpoint, a global provider of an integrated suite of on-demand protection solutions, made a positive contribution to relative returns. Investors appreciate the company's large market opportunity, as well as the continuing tailwind from a benign competitive landscape. (For details, see "Portfolio highlights.")
1 For a detailed commentary on the market environment in general during the reporting period, see page 3.
62
UBS U.S. Small Cap Growth Fund
– Infoblox, a manufacturer of a device that allows users to create and manage dynamic computer networks, saw its shares rise during the 12 months. The company reported fiscal second quarter revenue and earnings that beat consensus expectations. Infoblox has continued to improve sales execution over the last few quarters.
• Hardware manufacturer Fitbit had a successful initial public offering in June of 2015, and the Fund participated in the gains. The maker of wearable fitness devices sees multiple avenues for growth that include introducing new products, adding new features and services, expanding brand awareness, driving international sales, and penetrating the corporate wellness market. We sold the Fund's position in Fitbit at the end of the reporting period.
What didn't work
• Several individual positions made a negative contribution to Fund returns during the 12 months.
– Forex Capital Markets (FXCM) was the largest detractor in the Fund during the reporting period. The provider of foreign exchange trading services underperformed after a sharp move in the Swiss exchange rate generated a negative equity balance owed to the company by its clients. In order to satisfy regulatory capital requirements and stabilize its business, FXCM entered into a $300 million financing agreement with Leucadia National Corporation. The market viewed the terms as unfavorable to equity shareholders, and the stock price declined. We sold our position in FXCM prior to the end of the reporting period.
– The Fund's position in Constellium detracted from relative returns. The company is a downstream aluminum producer whose shares fell based on investor concern over a more challenging environment for the company's aerospace and transportation segment.
– Shares of Abercrombie & Fitch, a specialty retailer of casual apparel for men, women and kids, underperformed for the 12-month period. The company has been hurt due to slowing same-store sales, a general slowdown in teen retailing and a pushback on its traditional logoed apparel. We believe the company is near an inflection point in inventories and that same-store sales growth is poised to rebound. Furthermore, given the overly pessimistic expectations, we believe valuations are attractive.
– Del Frisco's Restaurant Group saw its shares fall on investor concern that two underperforming locations will weigh on same-store sales results for longer than originally anticipated. (For details, see "Portfolio highlights.")
• An overweight to the energy sector detracted from relative performance.
– We held several stocks in the energy sector during the reporting period, such as Bonanza Creek Energy and Kodiak Oil & Gas. These stocks underperformed during the period based on what we believe is an overreaction to falling oil prices. Bonanza Creek Energy was sold prior to the end of the reporting period, as we sought to reduce our exposure to the energy sector. Kodiak Oil & Gas was acquired by Whiting Petroleum during the period in a transaction in which we received both cash and shares. In June, prior to the end of the reporting period, we sold our remaining position in Whiting petroleum to reduce our exposure to the energy sector.
Portfolio highlights
• Imperva delivers data security, monitoring and web application security as on-site solutions and through the cloud. New management has refined the company's go-to-market strategy and reinvigorated the sales force. Recent acquisitions have bolstered Imperva's product suite, elevating the company's offering to represent a robust cyber security platform.
63
UBS U.S. Small Cap Growth Fund
• Proofpoint is a global provider of enterprise software solutions. The company offers an integrated suite of on-demand solutions that include secure communications, archiving, compliance and cyber security. Proofpoint's software-as-a-service (SaaS) model delivers 95% recurring revenues at greater than 90% renewal rates. The company's main competitor, Postini, was acquired by Google and is in the process of shutting down.
• DexCom is the leader in the move to switch diabetic patients from episodic finger-stick measurements to continuous glucose sensors. Continuous glucose monitoring (CGM) provides alerts, alarms and trend information to help people better manage their diabetes. There are 400 million people worldwide with diabetes, and over 29 million in the US alone. The market is estimated to grow to approximately 600 million people by 2030. We believe there is considerable room for growth, as CGM is used by less than 10% of Type 1 diabetics and less than 1% of Type 2 diabetics.
• Del Frisco's Restaurant Group develops, owns and operates steakhouse restaurants in the US. It is one of the fastest-growing restaurant chains in the category, with over 40 locations and the potential to add five per year. We believe the company is well-positioned to continue adding restaurants while also growing same-store sales through high average checks, private dining and remodeling to increase capacity in existing locations. Del Frisco's is trading at a level that we believe does not reflect its future potential growth, and we remain overweight in the stock.
This letter is intended to assist shareholders in understanding how the Fund performed during the 12 months ended June 30, 2015. The views and opinions in the letter were current as of August 14, 2015. They are not guarantees of future performance or investment results and should not be taken as investment advice. Investment decisions reflect a variety of factors, and we reserve the right to change our views about individual securities, sectors and markets at any time. As a result, the views expressed should not be relied upon as a forecast of the Fund's future investment intent. We encourage you to consult your financial advisor regarding your personal investment program.
Mutual funds are sold by prospectus only. You should read it carefully and consider a fund's investment objectives, risks, charges, expenses and other important information contained in the prospectus before investing. Prospectuses for most of our funds can be obtained from your financial advisor, by calling UBS Funds at 800-647 1568 or by visiting our Web site at www.ubs.com.
64
UBS U.S. Small Cap Growth Fund
Average annual total returns for periods ended 06/30/15 (unaudited)
|
1 year |
5 years |
10 years |
|||||||||||||
|
Before deducting maximum sales charge |
|||||||||||||||
|
Class A1 |
15.61 |
% |
22.54 |
% |
9.50 |
% |
|||||||||
|
Class C2 |
14.71 |
21.62 |
8.68 |
||||||||||||
|
Class P3 |
15.93 |
22.87 |
9.79 |
||||||||||||
|
After deducting maximum sales charge |
|||||||||||||||
|
Class A1 |
9.25 |
% |
21.15 |
% |
8.89 |
% |
|||||||||
|
Class C2 |
13.79 |
21.62 |
8.68 |
||||||||||||
|
Russell 2000 Growth Index4 |
12.34 |
% |
19.33 |
% |
9.86 |
% |
|||||||||
The annualized gross and net expense ratios, respectively, for each class of shares as in the October 28, 2014 prospectuses were as follows: Class A—1.46% and 1.25%; Class C—2.25% and 2.00%; Class P—1.10% and 1.00%. Net expenses reflect fee waivers, as supplemented on March 27, 2015 and/or expense reimbursements, if any, pursuant to an agreement that is in effect to cap the expenses. The Trust, with respect to the Fund, and UBS Global Asset Management (Americas) Inc., the Fund's investment advisor ("UBS Global AM (Americas)" or the "Advisor"), have entered into a written agreement pursuant to which the Advisor has agreed to waive a portion of its management fees and/or to reimburse expenses (excluding expenses incurred through investment in other investment companies, interest, taxes, brokerage commissions, extraordinary expenses, and dividend expense and security loan fees for securities sold short) to the extent necessary so that the Fund's ordinary operating expenses (excluding expenses incurred through investment in other investment companies, interest, taxes, brokerage commissions , extraordinary expenses, and dividend expense and security loan fees for securities sold short), through the period ending October 27, 2016, do not exceed 1.24% for Class A shares, 1.99% for Class C shares and 0.99% for Class P shares. Pursuant to the written agreement, the Advisor is entitled to be reimbursed for any fees it waives and expenses it reimburses for a period of three years following such fee waivers and expense reimbursements to the extent that such reimbursement of the Advisor by the Fund will not cause the Fund to exceed any applicable expense limit that is in place for the Fund. The fee waiver/expense reimbursement agreement may be terminated by the Fund's Board of Trustees at any time and also will terminate automatically upon the expiration or termination of the Fund's advisory contract with the Advisor. Upon termination of the fee waiver/expense reimbursement agreement, however, UBS Global AM (Americas)'s three year recoupment rights will survive.
1 Maximum sales charge for Class A shares is 5.5%. Class A shares bear ongoing 12b-1 service fees.
2 Maximum contingent deferred sales charge for Class C shares is 1% imposed on redemptions and is reduced to 0% after one year. Class C shares bear ongoing 12b-1 distribution and service fees.
3 Class P shares do not bear initial or contingent deferred sales charges or ongoing 12b-1 service and distribution fees, but Class P shares held through advisory programs may be subject to a program fee, which, if included, would have reduced performance.
4 The Russell 2000 Growth Index measures the performance of the small-cap growth segment of the US equity universe. It includes those Russell 2000 Index companies with higher price-to-book ratios and higher forecasted growth values. The Russell 2000 Growth Index is constructed to provide a comprehensive and unbiased barometer for the small-cap growth segment. The Index is completely reconstituted annually to ensure larger stocks do not distort the performance and characteristics of the true small-cap opportunity set and that the represented companies continue to reflect growth characteristics. Investors should note that indices do not reflect the deduction of fees and expenses.
Prior to February 17, 2015, if an investor sold or exchanged shares less than 90 days after purchase, a redemption fee of 1.00% of the amount sold or exchanged was deducted at the time of the transaction, except as noted otherwise in the prospectus. For sales or exchanges taking place on or after February 17, 2015 but prior to August 3, 2015, there is a reduction in the redemption holding period from 90 days to 30 days. Effective August 3, 2015, the 1.00% redemption fee imposed on sales or exchanges of any class of shares of the funds made during the holding periods specified in the prospectus will be eliminated. Please refer to the prospectus for further information.
The Fund invests in IPOs which may have a magnified impact on performance.
Past performance does not predict future performance, and the performance information provided does not reflect the deduction of taxes that a shareholder would pay on Fund distributions or the redemption of Fund shares. The return and principal value of an investment will fluctuate, so that an investor's shares, when redeemed, may be worth more or less than their original cost. Performance results assume reinvestment of all dividends and capital gain distributions at net asset value on the ex-dividend dates. Current performance may be higher or lower than the performance data quoted. For month-end performance figures, please visit http://globalam-us.ubs.com/corpweb/performance.do.
65
UBS U.S. Small Cap Growth Fund
Illustration of an assumed investment of $10,000 in Class A shares (adjusted for 5.5% maximum sales charge) and $5,000,000 in Class P shares (unaudited)
The following two graphs depict the performance of UBS U.S. Small Cap Growth Fund Class A and Class P versus the Russell 2000 Growth Index over the 10 years ended June 30, 2015. The performance of Class C shares will vary based upon the different class specific expenses and sales charges. The performance provided does not reflect the deduction of taxes that a shareholder would pay on Fund distributions or the redemption of Fund shares. Past performance is no guarantee of future results. Share price and returns will vary with market conditions; investors may realize a gain or loss upon redemption.
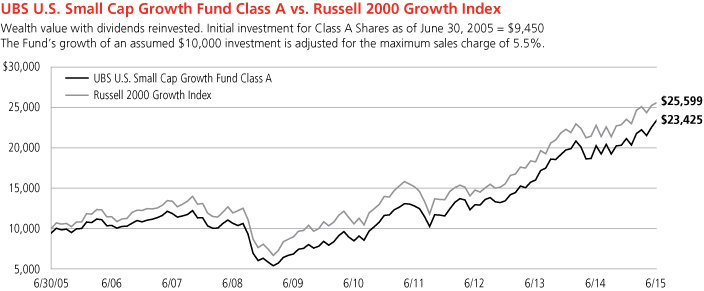
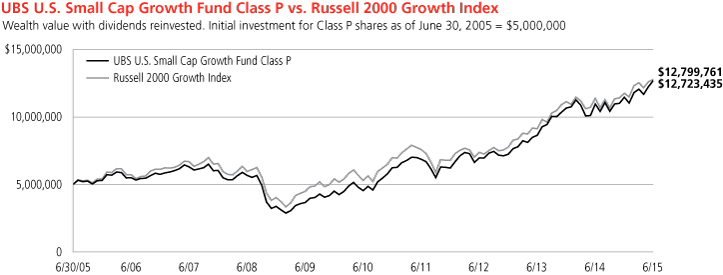
Past performance does not predict future performance, and the performance information provided does not reflect the deduction of taxes that a shareholder would pay on Fund distributions or the redemption of Fund shares. The return and principal value of an investment will fluctuate, so that an investor's shares, when redeemed, may be worth more or less than their original cost. Performance results assume reinvestment of all dividends and capital gain distributions at net asset value on the ex-dividend dates. Current performance may be higher or lower than the performance data quoted. For month-end performance figures, please visit http://globalam-us.ubs.com/corpweb/performance.do.
66
UBS U.S. Small Cap Growth Fund
Top ten equity holdings (unaudited)1
As of June 30, 2015
|
Percentage of net assets |
|||||||
|
Imperva, Inc. |
2.9 |
% |
|||||
|
Proofpoint, Inc. |
2.5 |
||||||
|
DexCom, Inc. |
2.2 |
||||||
|
Universal Display Corp. |
1.8 |
||||||
|
Ultimate Software Group, Inc. |
1.8 |
||||||
|
Acadia Healthcare Co., Inc. |
1.7 |
||||||
|
Popeyes Louisiana Kitchen, Inc. |
1.6 |
||||||
|
IMAX Corp. |
1.6 |
||||||
|
Asbury Automotive Group, Inc. |
1.5 |
||||||
|
Wix.com Ltd. |
1.5 |
||||||
|
Total |
19.1 |
% |
|||||
Industry diversification (unaudited)1
As a percentage of net assets as of June 30, 2015
|
Common stocks |
|||||||
|
Aerospace & defense |
0.57 |
% |
|||||
|
Airlines |
0.91 |
||||||
|
Auto components |
0.86 |
||||||
|
Banks |
2.54 |
||||||
|
Biotechnology |
12.67 |
||||||
|
Building products |
0.83 |
||||||
|
Communications equipment |
1.23 |
||||||
|
Construction & engineering |
1.07 |
||||||
|
Diversified consumer services |
0.82 |
||||||
|
Diversified telecommunication services |
2.12 |
||||||
|
Electrical equipment |
1.37 |
||||||
|
Electronic equipment, instruments & components |
2.94 |
||||||
|
Food & staples retailing |
0.98 |
||||||
|
Health care equipment & supplies |
6.44 |
||||||
|
Health care providers & services |
3.74 |
||||||
|
Health care technology |
0.38 |
||||||
|
Hotels, restaurants & leisure |
6.94 |
||||||
|
Household durables |
1.43 |
||||||
|
Internet & catalog retail |
0.99 |
||||||
|
Internet software & services |
4.69 |
||||||
|
Life sciences tools & services |
1.30 |
||||||
|
Machinery |
2.31 |
||||||
|
Media |
1.56 |
||||||
|
Metals & mining |
1.32 |
||||||
|
Oil, gas & consumable fuels |
4.10 |
||||||
|
Paper & forest products |
1.35 |
||||||
|
Pharmaceuticals |
1.76 |
||||||
|
Real estate investment trust (REIT) |
1.70 |
||||||
|
Road & rail |
0.73 |
||||||
|
Semiconductors & semiconductor equipment |
2.43 |
||||||
|
Software |
15.15 |
||||||
|
Specialty retail |
4.14 |
||||||
|
Textiles, apparel & luxury goods |
1.31 |
||||||
|
Thrifts & mortgage finance |
1.63 |
||||||
|
Total common stocks |
94.31 |
% |
|||||
|
Investment company |
|||||||
|
iShares Russell 2000 Growth ETF |
1.92 |
||||||
|
Short-term investment |
4.52 |
||||||
|
Investment of cash collateral from securities loaned |
7.43 |
||||||
|
Total investments |
108.18 |
% |
|||||
|
Liabilities, in excess of cash and other assets |
(8.18 |
) |
|||||
|
Net assets |
100.00 |
% |
|||||
1 Figures represent the direct investments of UBS U.S. Small Cap Growth Fund. Figures may be different if a breakdown of the underlying investment companies were included.
67
UBS U.S. Small Cap Growth Fund
Portfolio of investments
June 30, 2015
|
Shares |
Value |
||||||||||
|
Common stocks: 94.31% |
|||||||||||
|
Aerospace & defense: 0.57% |
|||||||||||
|
KEYW Holding Corp.*1 |
140,594 |
$ |
1,310,336 |
||||||||
|
Airlines: 0.91% |
|||||||||||
|
Spirit Airlines, Inc.* |
33,766 |
2,096,869 |
|||||||||
|
Auto components: 0.86% |
|||||||||||
|
Tenneco, Inc.* |
34,444 |
1,978,463 |
|||||||||
|
Banks: 2.54% |
|||||||||||
|
Columbia Banking System, Inc. |
51,611 |
1,679,422 |
|||||||||
|
National Bank Holdings Corp., Class A |
69,091 |
1,439,166 |
|||||||||
|
Webster Financial Corp. |
69,088 |
2,732,430 |
|||||||||
|
5,851,018 |
|||||||||||
|
Biotechnology: 12.67% |
|||||||||||
|
Acceleron Pharma, Inc.* |
35,905 |
1,136,034 |
|||||||||
|
Adaptimmune Therapeutics PLC ADR*1 |
86,600 |
1,587,378 |
|||||||||
|
Aduro Biotech, Inc.*1 |
27,990 |
848,937 |
|||||||||
|
Alexion Pharmaceuticals, Inc.* |
0 |
46 |
|||||||||
|
Blueprint Medicines Corp.* |
50,164 |
1,328,844 |
|||||||||
|
Celldex Therapeutics, Inc.* |
40,570 |
1,023,175 |
|||||||||
|
Cepheid, Inc.* |
53,424 |
3,266,878 |
|||||||||
|
Dyax Corp.* |
60,122 |
1,593,233 |
|||||||||
|
Exact Sciences Corp.*1 |
73,894 |
2,197,608 |
|||||||||
|
FibroGen, Inc.* |
42,484 |
998,374 |
|||||||||
|
Juno Therapeutics, Inc.*1 |
21,393 |
1,140,889 |
|||||||||
|
Kite Pharma, Inc.*1 |
30,695 |
1,871,474 |
|||||||||
|
Ligand Pharmaceuticals, Inc.,* |
25,079 |
2,530,471 |
|||||||||
|
MacroGenics, Inc.* |
39,602 |
1,503,688 |
|||||||||
|
Medivation, Inc.* |
14,026 |
1,601,769 |
|||||||||
|
Portola Pharmaceuticals, Inc.* |
22,372 |
1,019,045 |
|||||||||
|
Receptos, Inc.* |
12,059 |
2,291,813 |
|||||||||
|
Sage Therapeutics, Inc.* |
15,431 |
1,126,463 |
|||||||||
|
Sangamo BioSciences, Inc.* |
86,946 |
964,231 |
|||||||||
|
Seres Therapeutics, Inc.* |
29,000 |
1,203,500 |
|||||||||
|
29,233,850 |
|||||||||||
|
Building products: 0.83% |
|||||||||||
|
NCI Building Systems, Inc.* |
126,946 |
1,913,076 |
|||||||||
|
Communications equipment: 1.23% |
|||||||||||
|
Ciena Corp.* |
119,759 |
2,835,893 |
|||||||||
|
Construction & engineering: 1.07% |
|||||||||||
|
EMCOR Group, Inc. |
51,783 |
2,473,674 |
|||||||||
|
Diversified consumer services: 0.82% |
|||||||||||
|
Grand Canyon Education, Inc.* |
44,486 |
1,886,206 |
|||||||||
|
Diversified telecommunication services: 2.12% |
|||||||||||
|
8x8, Inc.* |
337,930 |
3,027,853 |
|||||||||
|
inContact, Inc.* |
188,554 |
1,861,028 |
|||||||||
|
4,888,881 |
|||||||||||
|
Shares |
Value |
||||||||||
|
Electrical equipment: 1.37% |
|||||||||||
|
EnerSys |
44,963 |
$ |
3,160,449 |
||||||||
|
Electronic equipment, instruments & components: 2.94% |
|||||||||||
|
OSI Systems, Inc.* |
36,563 |
2,588,295 |
|||||||||
|
Universal Display Corp.* |
81,003 |
4,190,285 |
|||||||||
|
6,778,580 |
|||||||||||
|
Food & staples retailing: 0.98% |
|||||||||||
|
United Natural Foods, Inc.* |
35,654 |
2,270,447 |
|||||||||
|
Health care equipment & supplies: 6.44% |
|||||||||||
|
DexCom, Inc.* |
62,938 |
5,033,781 |
|||||||||
|
Endologix, Inc.* |
171,967 |
2,637,974 |
|||||||||
|
Glaukos Corp.*1 |
22,800 |
660,744 |
|||||||||
|
K2M Group Holdings, Inc.* |
136,083 |
3,268,714 |
|||||||||
|
LDR Holding Corp.* |
75,100 |
3,248,075 |
|||||||||
|
14,849,288 |
|||||||||||
|
Health care providers & services: 3.74% |
|||||||||||
|
Acadia Healthcare Co., Inc.* |
50,456 |
3,952,219 |
|||||||||
|
MEDNAX, Inc.* |
21,831 |
1,617,895 |
|||||||||
|
Team Health Holdings, Inc.* |
46,648 |
3,047,514 |
|||||||||
|
8,617,628 |
|||||||||||
|
Health care technology: 0.38% |
|||||||||||
|
Evolent Health, Inc., Class A* |
44,300 |
863,850 |
|||||||||
|
Hotels, restaurants & leisure: 6.94% |
|||||||||||
|
BJ's Restaurants, Inc.* |
55,792 |
2,703,123 |
|||||||||
|
Bloomin' Brands, Inc. |
122,262 |
2,610,294 |
|||||||||
|
Bojangles', Inc.* |
28,500 |
680,010 |
|||||||||
|
Del Frisco's Restaurant Group, Inc.* |
111,935 |
2,085,349 |
|||||||||
|
Fogo De Chao, Inc.* |
30,400 |
704,064 |
|||||||||
|
La Quinta Holdings, Inc.* |
119,438 |
2,729,158 |
|||||||||
|
Popeyes Louisiana Kitchen, Inc.* |
61,673 |
3,699,763 |
|||||||||
|
Wingstop, Inc.*1 |
28,300 |
803,720 |
|||||||||
|
16,015,481 |
|||||||||||
|
Household durables: 1.43% |
|||||||||||
|
Ryland Group, Inc. |
71,349 |
3,308,453 |
|||||||||
|
Internet & catalog retail: 0.99% |
|||||||||||
|
HomeAway, Inc.* |
73,431 |
2,285,173 |
|||||||||
|
Internet software & services: 4.69% |
|||||||||||
|
Apigee Corp.*1 |
101,192 |
1,004,837 |
|||||||||
|
Box, Inc., Class A*1 |
43,552 |
811,809 |
|||||||||
|
Constant Contact, Inc.* |
80,994 |
2,329,387 |
|||||||||
|
Hortonworks, Inc.*1 |
62,766 |
1,589,235 |
|||||||||
|
Shopify, Inc., Class A* |
49,900 |
1,694,105 |
|||||||||
|
Wix.com Ltd.* |
143,355 |
3,386,045 |
|||||||||
|
10,815,418 |
|||||||||||
68
UBS U.S. Small Cap Growth Fund
Portfolio of investments
June 30, 2015
|
Shares |
Value |
||||||||||
|
Common stocks—(Concluded) |
|||||||||||
|
Life sciences tools & services: 1.30% |
|||||||||||
|
Charles River Laboratories International, Inc.* |
42,762 |
$ |
3,007,879 |
||||||||
|
Machinery: 2.31% |
|||||||||||
|
Chart Industries, Inc.* |
33,003 |
1,179,857 |
|||||||||
|
Wabash National Corp.* |
171,284 |
2,147,901 |
|||||||||
|
Woodward, Inc. |
36,461 |
2,004,991 |
|||||||||
|
5,332,749 |
|||||||||||
|
Media: 1.56% |
|||||||||||
|
IMAX Corp.* |
89,596 |
3,608,031 |
|||||||||
|
Metals & mining: 1.32% |
|||||||||||
|
Constellium NV, Class A* |
84,163 |
995,648 |
|||||||||
|
Globe Specialty Metals, Inc. |
116,057 |
2,054,209 |
|||||||||
|
3,049,857 |
|||||||||||
|
Oil, gas & consumable fuels: 4.10% |
|||||||||||
|
Callon Petroleum Co.* |
273,653 |
2,276,793 |
|||||||||
|
Carrizo Oil & Gas, Inc.* |
45,011 |
2,216,342 |
|||||||||
|
Diamondback Energy, Inc.* |
29,219 |
2,202,528 |
|||||||||
|
SemGroup Corp., Class A |
34,704 |
2,758,274 |
|||||||||
|
9,453,937 |
|||||||||||
|
Paper & forest products: 1.35% |
|||||||||||
|
Boise Cascade Co.* |
85,178 |
3,124,329 |
|||||||||
|
Pharmaceuticals: 1.76% |
|||||||||||
|
Intersect ENT, Inc.* |
87,710 |
2,511,137 |
|||||||||
|
Pacira Pharmaceuticals, Inc.* |
22,019 |
1,557,184 |
|||||||||
|
4,068,321 |
|||||||||||
|
Real estate investment trust (REIT): 1.70% |
|||||||||||
|
Cousins Properties, Inc. |
193,526 |
2,008,800 |
|||||||||
|
Sovran Self Storage, Inc. |
21,977 |
1,910,021 |
|||||||||
|
3,918,821 |
|||||||||||
|
Road & rail: 0.73% |
|||||||||||
|
Saia, Inc.* |
42,625 |
1,674,736 |
|||||||||
|
Semiconductors & semiconductor equipment: 2.43% |
|||||||||||
|
Cavium, Inc.* |
32,957 |
2,267,771 |
|||||||||
|
Integrated Device Technology, Inc.* |
153,404 |
3,328,867 |
|||||||||
|
5,596,638 |
|||||||||||
|
Software: 15.15% |
|||||||||||
|
CyberArk Software Ltd.*1 |
34,200 |
2,148,444 |
|||||||||
|
Fleetmatics Group PLC* |
68,784 |
3,221,155 |
|||||||||
|
Shares |
Value |
||||||||||
|
Gigamon, Inc.* |
10,764 |
$ |
355,104 |
||||||||
|
Imperva, Inc.* |
96,920 |
6,561,484 |
|||||||||
|
Infoblox, Inc.* |
113,097 |
2,964,272 |
|||||||||
|
Proofpoint, Inc.* |
92,110 |
5,864,644 |
|||||||||
|
Qlik Technologies, Inc.* |
87,529 |
3,060,014 |
|||||||||
|
Synchronoss Technologies, Inc.* |
69,957 |
3,199,134 |
|||||||||
|
Ultimate Software Group, Inc.* |
25,453 |
4,182,946 |
|||||||||
|
Workiva, Inc.*1 |
164,569 |
2,275,989 |
|||||||||
|
Yodlee, Inc.* |
77,732 |
1,122,450 |
|||||||||
|
34,955,636 |
|||||||||||
|
Specialty retail: 4.14% |
|||||||||||
|
Abercrombie & Fitch Co., Class A1 |
57,568 |
1,238,288 |
|||||||||
|
Asbury Automotive Group, Inc.* |
38,022 |
3,445,554 |
|||||||||
|
Five Below, Inc.* |
43,646 |
1,725,326 |
|||||||||
|
Restoration Hardware Holdings, Inc.* |
32,272 |
3,150,715 |
|||||||||
|
9,559,883 |
|||||||||||
|
Textiles, apparel & luxury goods: 1.31% |
|||||||||||
|
G-III Apparel Group Ltd.* |
43,053 |
3,028,778 |
|||||||||
|
Thrifts & mortgage finance: 1.63% |
|||||||||||
|
Essent Group Ltd.* |
74,030 |
2,024,720 |
|||||||||
|
EverBank Financial Corp. |
88,274 |
1,734,585 |
|||||||||
|
3,759,305 |
|||||||||||
|
Total common stocks (cost $166,587,442) |
217,571,933 |
||||||||||
|
Investment company: 1.92% |
|||||||||||
|
iShares Russell 2000 Growth ETF1 (cost $4,323,559) |
28,600 |
4,420,988 |
|||||||||
|
Short-term investment: 4.52% |
|||||||||||
|
Investment company: 4.52% |
|||||||||||
|
UBS Cash Management Prime Relationship Fund2 (cost $10,433,392) |
10,433,392 |
10,433,392 |
|||||||||
|
Investment of cash collateral from securities loaned: 7.43% |
|||||||||||
|
UBS Private Money Market Fund LLC2 (cost $17,148,414) |
17,148,414 |
17,148,414 |
|||||||||
|
Total investments: 108.18% (cost $198,492,807) |
249,574,727 |
||||||||||
|
Liabilities, in excess of cash and other assets: (8.18)% |
(18,868,674 |
) |
|||||||||
|
Net assets: 100.00% |
$ |
230,706,053 |
|||||||||
69
UBS U.S. Small Cap Growth Fund
Portfolio of investments
June 30, 2015
Notes to portfolio of investments
Aggregate cost for federal income tax purposes was $198,779,569; and net unrealized appreciation consisted of:
|
Gross unrealized appreciation |
$ |
58,349,059 |
|||||
|
Gross unrealized depreciation |
(7,553,901 |
) |
|||||
|
Net unrealized appreciation of investments |
$ |
50,795,158 |
|||||
For a listing of defined portfolio acronyms, counterparty abbreviations and currency abbreviations that are used throughout the Portfolio of investments as well as the tables that follow, please refer to page 71. Portfolio footnotes begin below.
The following is a summary of the fair valuations according to the inputs used as of June 30, 2015 in valuing the Fund's investments:
|
Description |
Unadjusted quoted prices in active markets for identical investments (Level 1) |
Other significant observable inputs (Level 2) |
Unobservable inputs (Level 3) |
Total |
|||||||||||||||
|
Assets |
|||||||||||||||||||
|
Common stocks |
$ |
217,571,933 |
$ |
— |
$ |
— |
$ |
217,571,933 |
|||||||||||
|
Investment company |
4,420,988 |
— |
— |
4,420,988 |
|||||||||||||||
|
Short-term investment |
— |
10,433,392 |
— |
10,433,392 |
|||||||||||||||
|
Investment of cash collateral from securities loaned |
— |
17,148,414 |
— |
17,148,414 |
|||||||||||||||
|
Total |
$ |
221,992,921 |
$ |
27,581,806 |
$ |
— |
$ |
249,574,727 |
|||||||||||
At June 30, 2015, there were no transfers between Levels 1 and Level 2.
Portfolio footnotes
* Non-income producing security.
1 Security, or portion thereof, was on loan at June 30, 2015.
2 The table below details the Fund's investments in funds advised by the same Advisor as the Fund. The Advisor does not earn a management fee from the affiliated UBS Relationship Funds.
|
Security description |
Value 06/30/14 |
Purchases during the year ended 06/30/15 |
Sales during the year ended 06/30/15 |
Value 06/30/15 |
Net income earned from affiliate for the year ended 06/30/15 |
||||||||||||||||||
|
UBS Cash Management Prime Relationship Fund |
$ |
5,807,848 |
$ |
83,999,460 |
$ |
79,373,916 |
$ |
10,433,392 |
$ |
4,450 |
|||||||||||||
|
UBS Private Money Market Fund LLCa |
30,452,021 |
183,241,887 |
196,545,494 |
17,148,414 |
1,775 |
||||||||||||||||||
|
$ |
36,259,869 |
$ |
267,241,347 |
$ |
275,919,410 |
$ |
27,581,806 |
$ |
6,225 |
||||||||||||||
a The Advisor earns a management fee from this affiliated fund. Please see the Notes to financial statements for further information.
See accompanying notes to financial statements.
70
The UBS Funds
June 30, 2015
Portfolio acronyms
|
ADR |
American Depositary Receipt |
||||||
|
CVA |
Dutch Certification—Depository Certificate |
||||||
|
ETF |
Exchange Traded Fund |
||||||
|
GDR |
Global Depositary Receipt |
||||||
|
LIBOR |
London Interbank Offered Rate |
||||||
|
REIT |
Real Estate Investment Trust |
||||||
|
RFD |
Ranking for Dividend at Later Date |
||||||
|
SPDR |
Standard & Poor's Depository Receipts |
||||||
Counterparty abbreviations
|
CSI |
Credit Suisse International |
||||||
JPMCB JPMorgan Chase Bank
Currency abbreviations
|
AUD |
Australian Dollar |
||||||
|
BRL |
Brazilian Real |
||||||
|
EUR |
Euro |
||||||
|
INR |
Indian Rupee |
||||||
|
JPY |
Japanese Yen |
||||||
|
TRY |
Turkish Lira |
||||||
|
USD |
United States Dollar |
||||||
|
ZAR |
South African Rand |
||||||
See accompanying notes to financial statements.
71
The UBS Funds
June 30, 2015 (unaudited)
Explanation of expense disclosure
As a shareholder of the Funds, you incur two types of costs: (1) transactional costs (as applicable); including sales charges (loads); and (2) ongoing costs, including management fees; distribution and/or service (12b-1) fees (if applicable); and other Fund expenses. This example is intended to help you understand your ongoing costs (in dollars) of investing in each Fund and to compare these costs with the ongoing costs of investing in other mutual funds.
The example below is based on an investment of $1,000 invested at the beginning of the period and held for the entire period, January 1, 2015 to June 30, 2015.
Actual expenses
The first line for each class of shares in the table below provides information about actual account values and actual expenses. You may use the information in this line, together with the amount you invested, to estimate the expenses that you paid over a period. Simply divide your account value by $1,000 (for example, an $8,600 account value divided by $1,000 = 8.6), then multiply the result by the number in the first line under the heading entitled "Expenses paid during period" to estimate the expenses you paid on your account during this period.
Hypothetical example for comparison purposes
The second line for each class of shares in the table below provides information about hypothetical account values and hypothetical expenses based on that Fund's actual expense ratios for each class of shares and an assumed rate of return of 5% per year before expenses, which is not that Fund's actual return for each class of shares. The hypothetical account values and expenses may not be used to estimate the actual ending account balance or expenses you paid for the period. You may use this information to compare the ongoing costs of investing in a Fund and other funds. To do so, compare this 5% hypothetical example with the 5% hypothetical examples that appear in the shareholder reports of other funds.
Please note that the expenses shown in the table are meant to highlight your ongoing costs only and do not reflect any transactional costs (as applicable), such as sales charges (loads). Therefore, the second line in the table for each class of shares is useful in comparing ongoing costs only, and will not help you determine the relative total costs of owning different funds. In addition, if these transactional costs were included, your costs would have been higher.
This projection assumes that annualized expense ratios were in effect during the period January 1, 2015 to June 30, 2015.
72
The UBS Funds
June 30, 2015 (unaudited)
|
Beginning account value January 1, 2015 |
Ending account value June 30, 2015 |
Expenses paid during period* 01/01/15 – 06/30/15 |
Expense ratio during period |
||||||||||||||||||||
|
UBS Equity Long-Short Multi-Strategy Fund |
|||||||||||||||||||||||
|
Class A |
Actual |
$ |
1,000.00 |
$ |
1,029.80 |
$ |
23.81 |
4.73 |
% |
||||||||||||||
|
Hypothetical (5% annual return before expenses) |
1,000.00 |
1,001.34 |
23.47 |
4.73 |
|||||||||||||||||||
|
Class C |
Actual |
1,000.00 |
1,026.00 |
26.98 |
5.37 |
||||||||||||||||||
|
Hypothetical (5% annual return before expenses) |
1,000.00 |
998.17 |
26.61 |
5.37 |
|||||||||||||||||||
|
Class P |
Actual |
1,000.00 |
1,031.30 |
21.96 |
4.36 |
||||||||||||||||||
|
Hypothetical (5% annual return before expenses) |
1,000.00 |
1,003.17 |
21.66 |
4.36 |
|||||||||||||||||||
|
UBS Global Sustainable Equity Fund |
|||||||||||||||||||||||
|
Class A |
Actual |
1,000.00 |
1,082.30 |
6.45 |
1.25 |
||||||||||||||||||
|
Hypothetical (5% annual return before expenses) |
1,000.00 |
1,018.60 |
6.26 |
1.25 |
|||||||||||||||||||
|
Class C |
Actual |
1,000.00 |
1,078.00 |
10.30 |
2.00 |
||||||||||||||||||
|
Hypothetical (5% annual return before expenses) |
1,000.00 |
1,014.88 |
9.99 |
2.00 |
|||||||||||||||||||
|
Class P |
Actual |
1,000.00 |
1,083.20 |
5.17 |
1.00 |
||||||||||||||||||
|
Hypothetical (5% annual return before expenses) |
1,000.00 |
1,019.84 |
5.01 |
1.00 |
|||||||||||||||||||
|
UBS U.S. Defensive Equity Fund |
|||||||||||||||||||||||
|
Class A |
Actual |
1,000.00 |
1,040.40 |
10.93 |
2.16 |
||||||||||||||||||
|
Hypothetical (5% annual return before expenses) |
1,000.00 |
1,014.08 |
10.79 |
2.16 |
|||||||||||||||||||
|
Class C |
Actual |
1,000.00 |
1,035.80 |
14.94 |
2.96 |
||||||||||||||||||
|
Hypothetical (5% annual return before expenses) |
1,000.00 |
1,010.12 |
14.75 |
2.96 |
|||||||||||||||||||
|
Class P |
Actual |
1,000.00 |
1,041.00 |
9.72 |
1.92 |
||||||||||||||||||
|
Hypothetical (5% annual return before expenses) |
1,000.00 |
1,015.27 |
9.59 |
1.92 |
|||||||||||||||||||
73
The UBS Funds
June 30, 2015 (unaudited)
|
Beginning account value January 1, 2015 |
Ending account value June 30, 2015 |
Expenses paid during period* 01/01/15 – 06/30/15 |
Expense ratio during period |
||||||||||||||||||||
|
UBS U.S. Equity Opportunity Fund |
|||||||||||||||||||||||
|
Class A |
Actual |
$ |
1,000.00 |
$ |
1,026.50 |
$ |
6.03 |
1.20 |
% |
||||||||||||||
|
Hypothetical (5% annual return before expenses) |
1,000.00 |
1,018.84 |
6.01 |
1.20 |
|||||||||||||||||||
|
Class C |
Actual |
1,000.00 |
1,022.20 |
9.78 |
1.95 |
||||||||||||||||||
|
Hypothetical (5% annual return before expenses) |
1,000.00 |
1,015.12 |
9.74 |
1.95 |
|||||||||||||||||||
|
Class P |
Actual |
1,000.00 |
1,028.30 |
4.78 |
0.95 |
||||||||||||||||||
|
Hypothetical (5% annual return before expenses) |
1,000.00 |
1,020.08 |
4.76 |
0.95 |
|||||||||||||||||||
|
UBS U.S. Large Cap Equity Fund |
|||||||||||||||||||||||
|
Class A |
Actual |
1,000.00 |
1,058.00 |
6.12 |
1.20 |
||||||||||||||||||
|
Hypothetical (5% annual return before expenses) |
1,000.00 |
1,018.84 |
6.01 |
1.20 |
|||||||||||||||||||
|
Class C |
Actual |
1,000.00 |
1,054.00 |
9.93 |
1.95 |
||||||||||||||||||
|
Hypothetical (5% annual return before expenses) |
1,000.00 |
1,015.12 |
9.74 |
1.95 |
|||||||||||||||||||
|
Class P |
Actual |
1,000.00 |
1,059.30 |
4.85 |
0.95 |
||||||||||||||||||
|
Hypothetical (5% annual return before expenses) |
1,000.00 |
1,020.08 |
4.76 |
0.95 |
|||||||||||||||||||
|
UBS U.S. Small Cap Growth Fund |
|||||||||||||||||||||||
|
Class A |
Actual |
1,000.00 |
1,107.50 |
6.85 |
1.31 |
||||||||||||||||||
|
Hypothetical (5% annual return before expenses) |
1,000.00 |
1,018.30 |
6.56 |
1.31 |
|||||||||||||||||||
|
Class C |
Actual |
1,000.00 |
1,103.40 |
10.74 |
2.06 |
||||||||||||||||||
|
Hypothetical (5% annual return before expenses) |
1,000.00 |
1,014.58 |
10.29 |
2.06 |
|||||||||||||||||||
|
Class P |
Actual |
1,000.00 |
1,108.60 |
5.49 |
1.05 |
||||||||||||||||||
|
Hypothetical (5% annual return before expenses) |
1,000.00 |
1,019.59 |
5.26 |
1.05 |
|||||||||||||||||||
* Expenses are equal to the Fund's annualized net expense ratios, multiplied by the average account value over the period, multiplied by 181 divided by 365 (to reflect the one-half year period).
74
This page intentionally left blank.
75
The UBS Funds
Financial statements
Statement of assets and liabilities
June 30, 2015
|
UBS Equity Long-Short Multi-Strategy Fund |
UBS Global Sustainable Equity Fund |
UBS U.S. Defensive Equity Fund |
|||||||||||||
|
Assets: |
|||||||||||||||
|
Investments, at cost: |
|||||||||||||||
|
Unaffiliated issuers |
$ |
14,146,328 |
$ |
23,370,556 |
$ |
18,666,769 |
|||||||||
|
Affiliated issuers |
4,158,148 |
608,651 |
971,540 |
||||||||||||
|
Investment of cash collateral in an affiliated issuer received from securities loaned1 |
— |
785,656 |
— |
||||||||||||
|
Foreign currency |
42,401 |
261,397 |
— |
||||||||||||
|
$ |
18,346,877 |
$ |
25,026,260 |
$ |
19,638,309 |
||||||||||
|
Investments, at value: |
|||||||||||||||
|
Unaffiliated issuers |
$ |
15,350,553 |
$ |
25,506,085 |
$ |
22,006,500 |
|||||||||
|
Affiliated issuers |
4,158,148 |
608,651 |
971,540 |
||||||||||||
|
Investment of cash collateral in an affiliated issuer received from securities loaned1 |
— |
785,656 |
— |
||||||||||||
|
Foreign currency |
42,312 |
261,043 |
— |
||||||||||||
|
Cash |
3,424,314 |
— |
13,784 |
||||||||||||
|
Receivables: |
|||||||||||||||
|
Investment securities sold |
37,251 |
146,613 |
— |
||||||||||||
|
Securities sold short |
12,129 |
— |
— |
||||||||||||
|
Interest |
— |
283 |
— |
||||||||||||
|
Fund shares sold |
— |
50,777 |
— |
||||||||||||
|
Foreign tax reclaims |
11,666 |
8,406 |
— |
||||||||||||
|
Due from Advisor |
33,888 |
17,552 |
22,665 |
||||||||||||
|
Dividends |
10,173 |
26,765 |
22,889 |
||||||||||||
|
Due from broker |
9,242 |
— |
— |
||||||||||||
|
Cash collateral for securities sold short |
5,271,710 |
— |
— |
||||||||||||
|
Unrealized appreciation on forward foreign currency contracts |
10,734 |
— |
— |
||||||||||||
|
Other assets |
32,893 |
28,833 |
18,899 |
||||||||||||
|
Total assets |
28,405,013 |
27,440,664 |
23,056,277 |
||||||||||||
|
Liabilities: |
|||||||||||||||
|
Payables: |
|||||||||||||||
|
Cash collateral from securities loaned |
— |
785,656 |
— |
||||||||||||
|
Investment securities purchased |
153,854 |
343,305 |
— |
||||||||||||
|
Investment advisory and administration fees |
— |
— |
— |
||||||||||||
|
Custody and fund accounting fees |
39,254 |
25,740 |
33,241 |
||||||||||||
|
Fund shares redeemed |
— |
27,312 |
— |
||||||||||||
|
Distribution and service fees |
520 |
3,506 |
4,190 |
||||||||||||
|
Trustees' fees |
5,695 |
6,006 |
5,693 |
||||||||||||
|
Dividend expense and security loan fees for securities sold short |
24,262 |
— |
7,528 |
||||||||||||
|
Accrued expenses |
91,347 |
102,923 |
80,970 |
||||||||||||
|
Due to broker |
— |
— |
654,158 |
||||||||||||
|
Options written, at value2 |
— |
— |
8,690 |
||||||||||||
|
Securities sold short, at value3 |
10,652,092 |
— |
5,435,973 |
||||||||||||
|
Outstanding swap agreements, at value |
71,595 |
— |
— |
||||||||||||
|
Unrealized depreciation on forward foreign currency contracts |
19,653 |
— |
— |
||||||||||||
|
Total liabilities |
11,058,272 |
1,294,448 |
6,230,443 |
||||||||||||
|
Net assets |
$ |
17,346,741 |
$ |
26,146,216 |
$ |
16,825,834 |
|||||||||
1 The market value of securities loaned by UBS Global Sustainable Equity Fund, UBS U.S. Equity Opportunity Fund, UBS U.S. Large Cap Equity Fund and UBS U.S. Small Cap Growth Fund, as of June 30, 2015 was $757,750, $1,279,516, $1,197,982 and $16,743,812, respectively.
2 Premiums received by UBS U.S. Defensive Equity Fund were $43,253.
3 Proceeds from securities sold short by UBS Equity Long-Short Multi-Strategy Fund and UBS U.S. Defensive Equity Fund were $11,000,890 and $4,142,855, respectively.
76
The UBS Funds
Financial statements
|
UBS U.S. Equity Opportunity Fund |
UBS U.S. Large Cap Equity Fund |
UBS U.S. Small Cap Growth Fund |
|||||||||||||
|
Assets: |
|||||||||||||||
|
Investments, at cost: |
|||||||||||||||
|
Unaffiliated issuers |
$ |
37,299,153 |
$ |
37,012,268 |
$ |
170,911,001 |
|||||||||
|
Affiliated issuers |
398,780 |
533,330 |
10,433,392 |
||||||||||||
|
Investment of cash collateral in an affiliated issuer received from securities loaned1 |
1,331,642 |
1,240,202 |
17,148,414 |
||||||||||||
|
Foreign currency |
4,815 |
— |
— |
||||||||||||
|
$ |
39,034,390 |
$ |
38,785,800 |
$ |
198,492,807 |
||||||||||
|
Investments, at value: |
|||||||||||||||
|
Unaffiliated issuers |
$ |
44,623,897 |
$ |
40,598,615 |
$ |
221,992,921 |
|||||||||
|
Affiliated issuers |
398,780 |
533,330 |
10,433,392 |
||||||||||||
|
Investment of cash collateral in an affiliated issuer received from securities loaned1 |
1,331,642 |
1,240,202 |
17,148,414 |
||||||||||||
|
Foreign currency |
4,762 |
— |
— |
||||||||||||
|
Cash |
— |
— |
— |
||||||||||||
|
Receivables: |
|||||||||||||||
|
Investment securities sold |
— |
107,235 |
3,137,444 |
||||||||||||
|
Securities sold short |
— |
— |
— |
||||||||||||
|
Interest |
6,507 |
1,995 |
57,737 |
||||||||||||
|
Fund shares sold |
— |
86,645 |
423,940 |
||||||||||||
|
Foreign tax reclaims |
— |
— |
— |
||||||||||||
|
Due from Advisor |
3,589 |
— |
— |
||||||||||||
|
Dividends |
51,091 |
38,142 |
618 |
||||||||||||
|
Due from broker |
— |
— |
— |
||||||||||||
|
Cash collateral for securities sold short |
— |
— |
— |
||||||||||||
|
Unrealized appreciation on forward foreign currency contracts |
— |
— |
— |
||||||||||||
|
Other assets |
26,090 |
30,319 |
33,515 |
||||||||||||
|
Total assets |
46,446,358 |
42,636,483 |
253,227,981 |
||||||||||||
|
Liabilities: |
|||||||||||||||
|
Payables: |
|||||||||||||||
|
Cash collateral from securities loaned |
1,331,642 |
1,240,202 |
17,148,414 |
||||||||||||
|
Investment securities purchased |
— |
489,335 |
4,954,455 |
||||||||||||
|
Investment advisory and administration fees |
— |
8,829 |
140,045 |
||||||||||||
|
Custody and fund accounting fees |
20,739 |
20,739 |
38,052 |
||||||||||||
|
Fund shares redeemed |
29,968 |
10,557 |
110,577 |
||||||||||||
|
Distribution and service fees |
12,038 |
4,371 |
13,957 |
||||||||||||
|
Trustees' fees |
6,827 |
6,620 |
13,562 |
||||||||||||
|
Dividend expense and security loan fees for securities sold short |
— |
— |
— |
||||||||||||
|
Accrued expenses |
102,537 |
84,215 |
102,866 |
||||||||||||
|
Due to broker |
— |
— |
— |
||||||||||||
|
Options written, at value2 |
— |
— |
— |
||||||||||||
|
Securities sold short, at value3 |
— |
— |
— |
||||||||||||
|
Outstanding swap agreements, at value |
— |
— |
— |
||||||||||||
|
Unrealized depreciation on forward foreign currency contracts |
— |
— |
— |
||||||||||||
|
Total liabilities |
1,503,751 |
1,864,868 |
22,521,928 |
||||||||||||
|
Net assets |
$ |
44,942,607 |
$ |
40,771,615 |
$ |
230,706,053 |
|||||||||
See accompanying notes to financial statements.
77
The UBS Funds
Financial statements
Statement of assets and liabilities (continued)
June 30, 2015
|
UBS Equity Long-Short Multi-Strategy Fund |
UBS Global Sustainable Equity Fund |
UBS U.S. Defensive Equity Fund |
|||||||||||||
|
Net assets consist of: |
|||||||||||||||
|
Beneficial interest |
$ |
15,282,274 |
$ |
32,343,936 |
$ |
31,073,468 |
|||||||||
|
Accumulated undistributed (distributions in excess of) net investment income (loss) |
(129,585 |
) |
339,021 |
(10,454 |
) |
||||||||||
|
Accumulated net realized gain (loss) |
722,797 |
(8,669,327 |
) |
(16,318,356 |
) |
||||||||||
|
Net unrealized appreciation |
1,471,255 |
2,132,586 |
2,081,176 |
||||||||||||
|
Net assets |
$ |
17,346,741 |
$ |
26,146,216 |
$ |
16,825,834 |
|||||||||
|
Class A: |
|||||||||||||||
|
Net assets |
$ |
585,850 |
$ |
6,371,106 |
$ |
9,330,639 |
|||||||||
|
Shares outstanding |
52,979 |
673,065 |
670,951 |
||||||||||||
|
Net asset value and redemption proceeds per share |
$ |
11.06 |
$ |
9.47 |
$ |
13.91 |
|||||||||
|
Offering price per share (NAV per share plus maximum sales charge)1 |
$ |
11.70 |
$ |
10.02 |
$ |
14.72 |
|||||||||
|
Class C: |
|||||||||||||||
|
Net assets |
$ |
467,062 |
$ |
2,672,393 |
$ |
2,463,626 |
|||||||||
|
Shares outstanding |
43,840 |
288,674 |
185,387 |
||||||||||||
|
Net asset value and offering price per share |
$ |
10.65 |
$ |
9.26 |
$ |
13.29 |
|||||||||
|
Redemption proceeds per share (NAV per share less maximum contingent deferred sales charge)1 |
$ |
10.54 |
$ |
9.17 |
$ |
13.16 |
|||||||||
|
Class P: |
|||||||||||||||
|
Net assets |
$ |
16,293,829 |
$ |
17,102,717 |
$ |
5,031,569 |
|||||||||
|
Shares outstanding |
1,454,024 |
1,800,725 |
360,065 |
||||||||||||
|
Net asset value per share, offering price per share, and redemption proceeds per share |
$ |
11.21 |
$ |
9.50 |
$ |
13.97 |
|||||||||
1 For Class A, the maximum sales charge is 5.50%. Classes C and P have no front-end sales charges. For Class A, the maximum contingent deferred sales charge of 1.00% of the shares' offering price or the net asset value at the time of sales by the shareholder, whichever is less, is charged on sales of shares on original purchases of $1,000,000 or more that were not subject to a front-end sales charge made within one year of the purchase date. Class C maximum contingent deferred sales charge is 1.00%. Class P has no contingent deferred sales charge. If an investor sells or exchanges shares less than 90 days after purchase, a redemption fee of 1.00% of the amount sold or exchanged will be deducted at the time of the transaction, except as noted otherwise in the prospectus. For sales or exchanges taking place on or after February 17, 2015, there is a reduction in the redemption holding period from 90 days to 30 days. Shares that an investor holds or purchases prior to implementation of this new holding period are subject to preexisting terms for the holding period as outlined in prospectus. Effective August 3, 2015, the 1.00% redemption fee imposed on sales or exchanges of any class of shares of the funds made during the holdings periods specified in the prospectus will be eliminated.
78
The UBS Funds
Financial statements
|
UBS U.S. Equity Opportunity Fund |
UBS U.S. Large Cap Equity Fund |
UBS U.S. Small Cap Growth Fund |
|||||||||||||
|
Net assets consist of: |
|||||||||||||||
|
Beneficial interest |
$ |
42,374,855 |
$ |
118,206,205 |
$ |
165,905,765 |
|||||||||
|
Accumulated undistributed (distributions in excess of) net investment income (loss) |
17,922 |
602,844 |
(62,244 |
) |
|||||||||||
|
Accumulated net realized gain (loss) |
(4,774,860 |
) |
(81,623,781 |
) |
13,780,612 |
||||||||||
|
Net unrealized appreciation |
7,324,690 |
3,586,347 |
51,081,920 |
||||||||||||
|
Net assets |
$ |
44,942,607 |
$ |
40,771,615 |
$ |
230,706,053 |
|||||||||
|
Class A: |
|||||||||||||||
|
Net assets |
$ |
38,656,471 |
$ |
9,783,621 |
$ |
46,813,075 |
|||||||||
|
Shares outstanding |
3,699,703 |
355,096 |
1,983,560 |
||||||||||||
|
Net asset value and redemption proceeds per share |
$ |
10.45 |
$ |
27.55 |
$ |
23.60 |
|||||||||
|
Offering price per share (NAV per share plus maximum sales charge)1 |
$ |
11.06 |
$ |
29.15 |
$ |
24.97 |
|||||||||
|
Class C: |
|||||||||||||||
|
Net assets |
$ |
4,131,699 |
$ |
2,643,378 |
$ |
5,398,090 |
|||||||||
|
Shares outstanding |
408,059 |
100,353 |
262,018 |
||||||||||||
|
Net asset value and offering price per share |
$ |
10.13 |
$ |
26.34 |
$ |
20.60 |
|||||||||
|
Redemption proceeds per share (NAV per share less maximum contingent deferred sales charge)1 |
$ |
10.03 |
$ |
26.08 |
$ |
20.39 |
|||||||||
|
Class P: |
|||||||||||||||
|
Net assets |
$ |
2,154,437 |
$ |
28,344,616 |
$ |
178,494,888 |
|||||||||
|
Shares outstanding |
204,858 |
1,024,352 |
7,108,257 |
||||||||||||
|
Net asset value per share, offering price per share, and redemption proceeds per share |
$ |
10.52 |
$ |
27.67 |
$ |
25.11 |
|||||||||
See accompanying notes to financial statements.
79
The UBS Funds
Financial statements
Statement of operations
For the year ended June 30, 2015
|
UBS Equity Long-Short Multi-Strategy Fund |
UBS Global Sustainable Equity Fund |
UBS U.S. Defensive Equity Fund |
|||||||||||||
|
Investment income: |
|||||||||||||||
|
Dividends |
$ |
247,499 |
$ |
579,029 |
$ |
332,845 |
|||||||||
|
Interest and other |
95 |
— |
1,217 |
||||||||||||
|
Affiliated income |
3,311 |
310 |
541 |
||||||||||||
|
Securities lending1 |
— |
9,296 |
— |
||||||||||||
|
Foreign tax withheld |
(17,371 |
) |
(39,566 |
) |
— |
||||||||||
|
Total income |
233,534 |
549,069 |
334,603 |
||||||||||||
|
Expenses: |
|||||||||||||||
|
Advisory and administration |
221,554 |
201,025 |
173,088 |
||||||||||||
|
Distribution and service: |
|||||||||||||||
|
Class A |
1,145 |
14,744 |
23,839 |
||||||||||||
|
Class C |
4,479 |
19,345 |
23,091 |
||||||||||||
|
Transfer agency and related service fees: |
|||||||||||||||
|
Class A |
3,198 |
5,201 |
5,082 |
||||||||||||
|
Class C |
1,331 |
1,744 |
3,210 |
||||||||||||
|
Class P |
4,514 |
11,373 |
2,658 |
||||||||||||
|
Custodian and fund accounting |
79,883 |
53,021 |
66,552 |
||||||||||||
|
Federal and state registration |
46,165 |
42,817 |
41,338 |
||||||||||||
|
Professional services |
164,718 |
130,053 |
110,452 |
||||||||||||
|
Shareholder reports |
11,981 |
11,974 |
17,960 |
||||||||||||
|
Trustees |
21,069 |
21,938 |
21,012 |
||||||||||||
|
Dividend expense and security loan fees for securities sold short |
427,611 |
— |
119,632 |
||||||||||||
|
Other |
26,641 |
29,302 |
16,314 |
||||||||||||
|
Total expenses |
1,014,289 |
542,537 |
624,228 |
||||||||||||
|
Fee waivers and/or expense reimbursements by Advisor |
(330,249 |
) |
(278,837 |
) |
(256,526 |
) |
|||||||||
|
Net expenses |
684,040 |
263,700 |
367,702 |
||||||||||||
|
Net investment income (loss) |
(450,506 |
) |
285,369 |
(33,099 |
) |
||||||||||
|
Net realized gain (loss) on: |
|||||||||||||||
|
Investments in unaffiliated issuers |
1,297,459 |
1,381,611 |
3,164,706 |
||||||||||||
|
Futures contracts |
(40,720 |
) |
— |
— |
|||||||||||
|
Options written |
— |
— |
268,838 |
||||||||||||
|
Securities sold short |
42,817 |
— |
(594,670 |
) |
|||||||||||
|
Swap agreements |
238,053 |
— |
— |
||||||||||||
|
Forward foreign currency contracts |
47,380 |
(285 |
) |
— |
|||||||||||
|
Foreign currency transactions |
7,671 |
10,400 |
— |
||||||||||||
|
Net realized gain |
1,592,660 |
1,391,726 |
2,838,874 |
||||||||||||
|
Change in net unrealized appreciation/depreciation on: |
|||||||||||||||
|
Investments |
(893,058 |
) |
(65,744 |
) |
(1,716,499 |
) |
|||||||||
|
Options written |
— |
— |
17,563 |
||||||||||||
|
Securities sold short |
1,252,062 |
— |
136,562 |
||||||||||||
|
Swap agreements |
(137,291 |
) |
— |
— |
|||||||||||
|
Forward foreign currency contracts |
20,263 |
— |
— |
||||||||||||
|
Translation of other assets and liabilities denominated in foreign currency |
(3,447 |
) |
(3,405 |
) |
— |
||||||||||
|
Change in net unrealized appreciation/depreciation |
238,529 |
(69,149 |
) |
(1,562,374 |
) |
||||||||||
|
Net realized and unrealized gain |
1,831,189 |
1,322,577 |
1,276,500 |
||||||||||||
|
Net increase in net assets resulting from operations |
$ |
1,380,683 |
$ |
1,607,946 |
$ |
1,243,401 |
|||||||||
1 Includes affiliated income from UBS Private Money Market Fund LLC of $31, $118, $268 and $1,775 for UBS Global Sustainable Equity Fund, U.S. Equity Opportunity Fund, UBS U.S. Large Cap Equity Fund and UBS U.S. Small Cap Growth Fund, respectively.
80
The UBS Funds
Financial statements
|
UBS U.S. Equity Opportunity Fund |
UBS U.S. Large Cap Equity Fund |
UBS U.S. Small Cap Growth Fund |
|||||||||||||
|
Investment income: |
|||||||||||||||
|
Dividends |
$ |
588,818 |
$ |
1,544,672 |
$ |
732,926 |
|||||||||
|
Interest and other |
— |
— |
— |
||||||||||||
|
Affiliated income |
1,500 |
1,114 |
4,450 |
||||||||||||
|
Securities lending1 |
14,195 |
28,447 |
752,137 |
||||||||||||
|
Foreign tax withheld |
— |
— |
— |
||||||||||||
|
Total income |
604,513 |
1,574,233 |
1,489,513 |
||||||||||||
|
Expenses: |
|||||||||||||||
|
Advisory and administration |
350,850 |
707,233 |
2,139,672 |
||||||||||||
|
Distribution and service: |
|||||||||||||||
|
Class A |
97,177 |
22,930 |
97,814 |
||||||||||||
|
Class C |
43,761 |
26,603 |
39,449 |
||||||||||||
|
Transfer agency and related service fees: |
|||||||||||||||
|
Class A |
28,512 |
6,437 |
64,502 |
||||||||||||
|
Class C |
4,689 |
2,203 |
5,773 |
||||||||||||
|
Class P |
2,699 |
4,095 |
36,069 |
||||||||||||
|
Custodian and fund accounting |
41,577 |
49,316 |
86,590 |
||||||||||||
|
Federal and state registration |
41,658 |
43,137 |
50,648 |
||||||||||||
|
Professional services |
112,367 |
111,983 |
108,727 |
||||||||||||
|
Shareholder reports |
38,341 |
17,364 |
30,880 |
||||||||||||
|
Trustees |
24,894 |
30,324 |
49,216 |
||||||||||||
|
Dividend expense and security loan fees for securities sold short |
— |
— |
— |
||||||||||||
|
Other |
20,224 |
32,246 |
45,317 |
||||||||||||
|
Total expenses |
806,749 |
1,053,871 |
2,754,657 |
||||||||||||
|
Fee waivers and/or expense reimbursements by Advisor |
(236,115 |
) |
(137,440 |
) |
(123,737 |
) |
|||||||||
|
Net expenses |
570,634 |
916,431 |
2,630,920 |
||||||||||||
|
Net investment income (loss) |
33,879 |
657,802 |
(1,141,407 |
) |
|||||||||||
|
Net realized gain (loss) on: |
|||||||||||||||
|
Investments in unaffiliated issuers |
4,263,339 |
30,583,132 |
53,723,523 |
||||||||||||
|
Futures contracts |
— |
96,642 |
— |
||||||||||||
|
Options written |
— |
— |
— |
||||||||||||
|
Securities sold short |
— |
— |
— |
||||||||||||
|
Swap agreements |
— |
— |
— |
||||||||||||
|
Forward foreign currency contracts |
— |
— |
— |
||||||||||||
|
Foreign currency transactions |
(96 |
) |
— |
— |
|||||||||||
|
Net realized gain |
4,263,243 |
30,679,774 |
53,723,523 |
||||||||||||
|
Change in net unrealized appreciation/depreciation on: |
|||||||||||||||
|
Investments |
(726,595 |
) |
(22,596,836 |
) |
(20,345,811 |
) |
|||||||||
|
Options written |
— |
— |
— |
||||||||||||
|
Securities sold short |
— |
— |
— |
||||||||||||
|
Swap agreements |
— |
— |
— |
||||||||||||
|
Forward foreign currency contracts |
— |
— |
— |
||||||||||||
|
Translation of other assets and liabilities denominated in foreign currency |
(583 |
) |
— |
— |
|||||||||||
|
Change in net unrealized appreciation/depreciation |
(727,178 |
) |
(22,596,836 |
) |
(20,345,811 |
) |
|||||||||
|
Net realized and unrealized gain |
3,536,065 |
8,082,938 |
33,377,712 |
||||||||||||
|
Net increase in net assets resulting from operations |
$ |
3,569,944 |
$ |
8,740,740 |
$ |
32,236,305 |
|||||||||
See accompanying notes to financial statements.
81
The UBS Funds
Financial statements
Statement of changes in net assets
|
UBS Equity Long-Short Multi-Strategy Fund |
UBS Global Sustainable Equity Fund |
||||||||||||||||||
|
Year ended June 30, 2015 |
Year ended June 30, 2014 |
Year ended June 30, 2015 |
Year ended June 30, 2014 |
||||||||||||||||
|
Operations: |
|||||||||||||||||||
|
Net investment income (loss) |
$ |
(450,506 |
) |
$ |
(403,259 |
) |
$ |
285,369 |
$ |
195,800 |
|||||||||
|
Net realized gain |
1,592,660 |
740,314 |
1,391,726 |
2,863,608 |
|||||||||||||||
|
Change in net unrealized appreciation/depreciation |
238,529 |
172,654 |
(69,149 |
) |
688,433 |
||||||||||||||
|
Net increase in net assets from operations |
1,380,683 |
509,709 |
1,607,946 |
3,747,841 |
|||||||||||||||
|
Dividends and distributions to shareholders by class: |
|||||||||||||||||||
|
Class A: |
|||||||||||||||||||
|
Net investment income |
— |
— |
(66,890 |
) |
(137,135 |
) |
|||||||||||||
|
Net realized gain |
(6,117 |
) |
— |
— |
— |
||||||||||||||
|
Total Class A dividends and distributions |
(6,117 |
) |
— |
(66,890 |
) |
(137,135 |
) |
||||||||||||
|
Class C: |
|||||||||||||||||||
|
Net investment income |
— |
— |
(18,393 |
) |
(10,296 |
) |
|||||||||||||
|
Net realized gain |
(7,704 |
) |
— |
— |
— |
||||||||||||||
|
Total Class C dividends and distributions |
(7,704 |
) |
— |
(18,393 |
) |
(10,296 |
) |
||||||||||||
|
Class P: |
|||||||||||||||||||
|
Net investment income |
— |
— |
(230,480 |
) |
(301,607 |
) |
|||||||||||||
|
Net realized gain |
(261,447 |
) |
— |
— |
— |
||||||||||||||
|
Total Class P dividends and distributions |
(261,447 |
) |
— |
(230,480 |
) |
(301,607 |
) |
||||||||||||
|
Decrease in net assets from dividends and distributions |
(275,268 |
) |
— |
(315,763 |
) |
(449,038 |
) |
||||||||||||
|
Beneficial interest transactions: |
|||||||||||||||||||
|
Proceeds from shares sold |
980,295 |
186,609 |
10,319,936 |
4,275,836 |
|||||||||||||||
|
Shares issued on reinvestment of dividends and distributions |
16,481 |
— |
283,113 |
425,484 |
|||||||||||||||
|
Cost of shares redeemed |
(801,028 |
) |
(811,681 |
) |
(7,332,965 |
) |
(4,197,525 |
) |
|||||||||||
|
Redemption fees |
1,231 |
— |
1,207 |
3,003 |
|||||||||||||||
|
Net increase (decrease) in net assets resulting from beneficial interest transactions |
196,979 |
(625,072 |
) |
3,271,291 |
506,798 |
||||||||||||||
|
Increase (decrease) in net assets |
1,302,394 |
(115,363 |
) |
4,563,474 |
3,805,601 |
||||||||||||||
|
Net assets, beginning of year |
16,044,347 |
16,159,710 |
21,582,742 |
17,777,141 |
|||||||||||||||
|
Net assets, end of year |
$ |
17,346,741 |
$ |
16,044,347 |
$ |
26,146,216 |
$ |
21,582,742 |
|||||||||||
|
Accumulated undistributed (distributions in excess of) net investment income (loss) |
$ |
(129,585 |
) |
$ |
(220,258 |
) |
$ |
339,021 |
$ |
302,800 |
|||||||||
82
The UBS Funds
Financial statements
|
UBS U.S. Defensive Equity Fund |
|||||||||||
|
Year ended June 30, 2015 |
Year ended June 30, 2014 |
||||||||||
|
Operations: |
|||||||||||
|
Net investment income (loss) |
$ |
(33,099 |
) |
$ |
(29,852 |
) |
|||||
|
Net realized gain |
2,838,874 |
2,003,015 |
|||||||||
|
Change in net unrealized appreciation/depreciation |
(1,562,374 |
) |
577,500 |
||||||||
|
Net increase in net assets from operations |
1,243,401 |
2,550,663 |
|||||||||
|
Dividends and distributions to shareholders by class: |
|||||||||||
|
Class A: |
|||||||||||
|
Net investment income |
— |
— |
|||||||||
|
Net realized gain |
— |
— |
|||||||||
|
Total Class A dividends and distributions |
— |
— |
|||||||||
|
Class C: |
|||||||||||
|
Net investment income |
— |
— |
|||||||||
|
Net realized gain |
— |
— |
|||||||||
|
Total Class C dividends and distributions |
— |
— |
|||||||||
|
Class P: |
|||||||||||
|
Net investment income |
— |
— |
|||||||||
|
Net realized gain |
— |
— |
|||||||||
|
Total Class P dividends and distributions |
— |
— |
|||||||||
|
Decrease in net assets from dividends and distributions |
— |
— |
|||||||||
|
Beneficial interest transactions: |
|||||||||||
|
Proceeds from shares sold |
3,712,417 |
2,462,360 |
|||||||||
|
Shares issued on reinvestment of dividends and distributions |
— |
— |
|||||||||
|
Cost of shares redeemed |
(4,149,983 |
) |
(3,648,774 |
) |
|||||||
|
Redemption fees |
12 |
2,288 |
|||||||||
|
Net increase (decrease) in net assets resulting from beneficial interest transactions |
(437,554 |
) |
(1,184,126 |
) |
|||||||
|
Increase (decrease) in net assets |
805,847 |
1,366,537 |
|||||||||
|
Net assets, beginning of year |
16,019,987 |
14,653,450 |
|||||||||
|
Net assets, end of year |
$ |
16,825,834 |
$ |
16,019,987 |
|||||||
|
Accumulated undistributed (distributions in excess of) net investment income (loss) |
$ |
(10,454 |
) |
$ |
(14,173 |
) |
|||||
See accompanying notes to financial statements.
83
The UBS Funds
Financial statements
Statement of changes in net assets (continued)
|
UBS U.S. Equity Opportunity Fund |
UBS U.S. Large Cap Equity Fund |
||||||||||||||||||
|
Year ended June 30, 2015 |
Year ended June 30, 2014 |
Year ended June 30, 2015 |
Year ended June 30, 2014 |
||||||||||||||||
|
Operations: |
|||||||||||||||||||
|
Net investment income (loss) |
$ |
33,879 |
$ |
18,674 |
$ |
657,802 |
$ |
1,030,725 |
|||||||||||
|
Net realized gain |
4,263,243 |
5,721,460 |
30,679,774 |
33,851,558 |
|||||||||||||||
|
Change in net unrealized appreciation/depreciation |
(727,178 |
) |
3,692,020 |
(22,596,836 |
) |
1,678,117 |
|||||||||||||
|
Net increase in net assets from operations |
3,569,944 |
9,432,154 |
8,740,740 |
36,560,400 |
|||||||||||||||
|
Dividends and distributions to shareholders by class: |
|||||||||||||||||||
|
Class A: |
|||||||||||||||||||
|
Net investment income |
(13,899 |
) |
(139,293 |
) |
(43,281 |
) |
(68,839 |
) |
|||||||||||
|
Net realized gain |
— |
— |
— |
— |
|||||||||||||||
|
Total Class A dividends and distributions |
(13,899 |
) |
(139,293 |
) |
(43,281 |
) |
(68,839 |
) |
|||||||||||
|
Class C: |
|||||||||||||||||||
|
Net investment income |
— |
— |
— |
(5,290 |
) |
||||||||||||||
|
Net realized gain |
— |
— |
— |
— |
|||||||||||||||
|
Total Class C dividends and distributions |
— |
— |
— |
(5,290 |
) |
||||||||||||||
|
Class P: |
|||||||||||||||||||
|
Net investment income |
(6,104 |
) |
(7,817 |
) |
(991,668 |
) |
(1,588,113 |
) |
|||||||||||
|
Net realized gain |
— |
— |
— |
— |
|||||||||||||||
|
Total Class P dividends and distributions |
(6,104 |
) |
(7,817 |
) |
(991,668 |
) |
(1,588,113 |
) |
|||||||||||
|
Decrease in net assets from dividends and distributions |
(20,003 |
) |
(147,110 |
) |
(1,034,949 |
) |
(1,662,242 |
) |
|||||||||||
|
Beneficial interest transactions: |
|||||||||||||||||||
|
Proceeds from shares sold |
1,244,813 |
901,262 |
18,239,780 |
15,676,880 |
|||||||||||||||
|
Shares issued on reinvestment of dividends and distributions |
18,587 |
130,167 |
1,027,205 |
1,652,916 |
|||||||||||||||
|
Cost of shares redeemed in kind |
— |
— |
— |
— |
|||||||||||||||
|
Cost of shares redeemed |
(5,573,663 |
) |
(6,214,115 |
) |
(125,721,205 |
) |
(70,030,066 |
) |
|||||||||||
|
Redemption fees |
1,323 |
18 |
8,053 |
18,455 |
|||||||||||||||
|
Net increase (decrease) in net assets resulting from beneficial interest transactions |
(4,308,940 |
) |
(5,182,668 |
) |
(106,446,167 |
) |
(52,681,815 |
) |
|||||||||||
|
Increase (decrease) in net assets |
(758,999 |
) |
4,102,376 |
(98,740,376 |
) |
(17,783,657 |
) |
||||||||||||
|
Net assets, beginning of year |
45,701,606 |
41,599,230 |
139,511,991 |
157,295,648 |
|||||||||||||||
|
Net assets, end of year |
$ |
44,942,607 |
$ |
45,701,606 |
$ |
40,771,615 |
$ |
139,511,991 |
|||||||||||
|
Accumulated undistributed (distributions in excess of) net investment income (loss) |
$ |
17,922 |
$ |
9,806 |
$ |
602,844 |
$ |
1,011,875 |
|||||||||||
84
The UBS Funds
Financial statements
|
UBS U.S. Small Cap Growth Fund |
|||||||||||
|
Year ended June 30, 2015 |
Year ended June 30, 2014 |
||||||||||
|
Operations: |
|||||||||||
|
Net investment income (loss) |
$ |
(1,141,407 |
) |
$ |
(1,718,277 |
) |
|||||
|
Net realized gain |
53,723,523 |
39,716,289 |
|||||||||
|
Change in net unrealized appreciation/depreciation |
(20,345,811 |
) |
17,197,076 |
||||||||
|
Net increase in net assets from operations |
32,236,305 |
55,195,088 |
|||||||||
|
Dividends and distributions to shareholders by class: |
|||||||||||
|
Class A: |
|||||||||||
|
Net investment income |
— |
— |
|||||||||
|
Net realized gain |
(6,507,157 |
) |
(859,809 |
) |
|||||||
|
Total Class A dividends and distributions |
(6,507,157 |
) |
(859,809 |
) |
|||||||
|
Class C: |
|||||||||||
|
Net investment income |
— |
— |
|||||||||
|
Net realized gain |
(756,458 |
) |
(86,066 |
) |
|||||||
|
Total Class C dividends and distributions |
(756,458 |
) |
(86,066 |
) |
|||||||
|
Class P: |
|||||||||||
|
Net investment income |
— |
— |
|||||||||
|
Net realized gain |
(35,905,549 |
) |
(4,582,035 |
) |
|||||||
|
Total Class P dividends and distributions |
(35,905,549 |
) |
(4,582,035 |
) |
|||||||
|
Decrease in net assets from dividends and distributions |
(43,169,164 |
) |
(5,527,910 |
) |
|||||||
|
Beneficial interest transactions: |
|||||||||||
|
Proceeds from shares sold |
51,855,914 |
52,317,437 |
|||||||||
|
Shares issued on reinvestment of dividends and distributions |
41,880,585 |
5,401,279 |
|||||||||
|
Cost of shares redeemed in kind |
(71,312,188 |
) |
— |
||||||||
|
Cost of shares redeemed |
(53,415,665 |
) |
(43,020,809 |
) |
|||||||
|
Redemption fees |
15,649 |
29,689 |
|||||||||
|
Net increase (decrease) in net assets resulting from beneficial interest transactions |
(30,975,705 |
) |
14,727,596 |
||||||||
|
Increase (decrease) in net assets |
(41,908,564 |
) |
64,394,774 |
||||||||
|
Net assets, beginning of year |
272,614,617 |
208,219,843 |
|||||||||
|
Net assets, end of year |
$ |
230,706,053 |
$ |
272,614,617 |
|||||||
|
Accumulated undistributed (distributions in excess of) net investment income (loss) |
$ |
(62,244 |
) |
$ |
13,866 |
||||||
See accompanying notes to financial statements.
85
The UBS Funds
Financial statements
Statement of cash flows
For the year ended June 30, 2015
|
UBS Equity Long-Short Multi-Strategy Fund |
|||||||
|
Cash provided by operating activities: |
|||||||
|
Net increase in net assets from operations |
$ |
1,380,683 |
|||||
|
Adjustments to reconcile net increase in net assets from operations to net cash provided by operating activities: |
|||||||
|
Purchases of investment securities |
(15,491,350 |
) |
|||||
|
Proceeds from disposition of investment securities |
15,057,184 |
||||||
|
Covers of securities sold short |
(9,023,594 |
) |
|||||
|
Proceeds from securities sold short |
10,107,423 |
||||||
|
Sales of short-term investments, net |
300,529 |
||||||
|
Net realized (gain)/loss on investments |
(1,297,459 |
) |
|||||
|
Net realized (gain)/loss on securities sold short |
(42,817 |
) |
|||||
|
Change in net unrealized appreciation/depreciation on investments |
893,058 |
||||||
|
Change in net unrealized appreciation/depreciation on securities sold short |
(1,252,062 |
) |
|||||
|
Change in net unrealized appreciation/depreciation on swap agreements |
137,291 |
||||||
|
Change in net unrealized appreciation/depreciation on forward foreign currency contracts |
(20,263 |
) |
|||||
|
Increase for receivable for securities sold short |
(12,129 |
) |
|||||
|
Net amortization (accretion) of income |
(105 |
) |
|||||
|
Increase in foreign tax reclaims receivable |
(982 |
) |
|||||
|
Increase in due from Advisor |
(33,888 |
) |
|||||
|
Increase in cash collateral for securities sold short |
(605,515 |
) |
|||||
|
Increase in dividends receivable |
(3,166 |
) |
|||||
|
Decrease in due from broker |
4,058 |
||||||
|
Decrease in other assets |
11,011 |
||||||
|
Increase in dividends payable and security loan fees for securities sold short |
1,704 |
||||||
|
Increase in accrued expenses and other liabilities |
26,676 |
||||||
|
Net cash provided by operating activities |
136,287 |
||||||
|
Cash used in financing activities: |
|||||||
|
Proceeds from shares issued |
980,295 |
||||||
|
Payment on shares redeemed (net of redemption fees of 1,231) |
(799,854 |
) |
|||||
|
Cash distributions paid to shareholders (net of reinvestment of 16,481) |
(258,787 |
) |
|||||
|
Net cash used in financing activities |
(78,346 |
) |
|||||
|
Net increase in cash |
57,941 |
||||||
|
Cash1: |
|||||||
|
Beginning of year |
3,408,685 |
||||||
|
End of year |
$ |
3,466,626 |
|||||
1 The Fund considers all cash accounts (including foreign currencies) that are not subject to withdrawal restrictions or penalties to be cash and cash equivalents.
86
The UBS Funds
Financial statements
Statement of cash flows
For the year ended June 30, 2015
|
UBS U.S. Defensive Equity Fund |
|||||||
|
Cash provided by operating activities: |
|||||||
|
Net increase in net assets from operations |
$ |
1,243,401 |
|||||
|
Adjustments to reconcile net increase in net assets from operations to net cash provided by operating activities: |
|||||||
|
Purchases of investment securities |
(11,474,964 |
) |
|||||
|
Proceeds from disposition of investment securities |
12,149,864 |
||||||
|
Covers of securities sold short |
(3,325,211 |
) |
|||||
|
Proceeds from securities sold short |
2,944,323 |
||||||
|
Proceeds from options written |
317,259 |
||||||
|
Cost of closing transactions on options written |
(44,968 |
) |
|||||
|
Purchases of short-term investments, net |
(738,705 |
) |
|||||
|
Net realized (gain)/loss on investments |
(3,164,706 |
) |
|||||
|
Net realized (gain)/loss on securities sold short |
594,670 |
||||||
|
Net realized (gain)/loss on options written |
(268,838 |
) |
|||||
|
Change in net unrealized appreciation/depreciation on investments |
1,716,499 |
||||||
|
Change in net unrealized appreciation/depreciation on securities sold short |
(136,562 |
) |
|||||
|
Change in net unrealized appreciation/depreciation on options written |
(17,563 |
) |
|||||
|
Increase in due from Advisor |
(16,276 |
) |
|||||
|
Increase in dividends receivable |
(1,283 |
) |
|||||
|
Increase in due to broker for securities sold short |
621,371 |
||||||
|
Decrease in other assets |
1,908 |
||||||
|
Increase in dividends payable and security loan fees for securities sold short |
593 |
||||||
|
Increase in accrued expenses and other liabilities |
24,123 |
||||||
|
Net cash provided by operating activities |
424,935 |
||||||
|
Cash used in financing activities: |
|||||||
|
Proceeds from shares issued |
3,736,674 |
||||||
|
Payment on shares redeemed |
(4,159,126 |
) |
|||||
|
Net cash used in financing activities |
(422,452 |
) |
|||||
|
Net increase in cash |
2,483 |
||||||
|
Cash1: |
|||||||
|
Beginning of year |
11,301 |
||||||
|
End of year |
$ |
13,784 |
|||||
1 The Fund considers all cash accounts (including foreign currencies) that are not subject to withdrawal restrictions or penalties to be cash and cash equivalents.
See accompanying notes to financial statements.
87
UBS Equity Long-Short Multi-Strategy Fund
Financial highlights
The table below sets forth financial data for one share of beneficial interest outstanding throughout each year presented.
|
Class A |
|||||||||||||||||||||||
|
Year ended June 30, |
|||||||||||||||||||||||
|
2015 |
2014 |
2013 |
2012 |
2011 |
|||||||||||||||||||
|
Net asset value, beginning of year |
$ |
10.37 |
$ |
10.06 |
$ |
9.43 |
$ |
9.70 |
$ |
10.00 |
|||||||||||||
|
Income (loss) from investment operations: |
|||||||||||||||||||||||
|
Net investment (loss)1 |
(0.32 |
) |
(0.27 |
) |
(0.19 |
) |
(0.22 |
) |
(0.20 |
) |
|||||||||||||
|
Net realized and unrealized gain (loss) |
1.19 |
0.58 |
0.82 |
(0.04 |
) |
(0.12 |
) |
||||||||||||||||
|
Total income (loss) from investment operations |
0.87 |
0.31 |
0.63 |
(0.26 |
) |
(0.32 |
) |
||||||||||||||||
|
Redemption fees |
0.003 |
— |
0.003 |
0.003 |
0.02 |
||||||||||||||||||
|
Less dividends/distributions: |
|||||||||||||||||||||||
|
From net realized gains |
(0.18 |
) |
— |
— |
(0.01 |
) |
— |
||||||||||||||||
|
Net asset value, end of year |
$ |
11.06 |
$ |
10.37 |
$ |
10.06 |
$ |
9.43 |
$ |
9.70 |
|||||||||||||
|
Total investment return2 |
8.46 |
% |
3.08 |
% |
6.68 |
% |
(2.73 |
)% |
(3.00 |
)% |
|||||||||||||
|
Ratios to average net assets: |
|||||||||||||||||||||||
|
Expenses before fee waivers and/or expense reimbursement and after dividend expense and security loan fees for securities sold short |
6.94 |
% |
6.29 |
% |
6.61 |
% |
5.76 |
% |
5.26 |
% |
|||||||||||||
|
Expenses after fee waivers and/or expense reimbursement and after dividend expense and security loan fees for securities sold short |
4.33 |
% |
4.05 |
% |
3.93 |
% |
4.25 |
% |
4.13 |
% |
|||||||||||||
|
Expenses after fee waivers and/or expense reimbursement and before dividend expense and security loan fees for securities sold short |
1.75 |
% |
1.75 |
% |
1.75 |
% |
1.75 |
% |
1.75 |
% |
|||||||||||||
|
Net investment loss |
(3.02 |
)% |
(2.68 |
)% |
(2.04 |
)% |
(2.27 |
)% |
(2.07 |
)% |
|||||||||||||
|
Supplemental data: |
|||||||||||||||||||||||
|
Net assets, end of year (000's) |
$ |
586 |
$ |
870 |
$ |
1,377 |
$ |
2,578 |
$ |
4,466 |
|||||||||||||
|
Portfolio turnover rate |
99 |
% |
148 |
% |
167 |
% |
242 |
% |
460 |
% |
|||||||||||||
|
Class P |
|||||||||||||||||||||||
|
Year ended June 30, |
|||||||||||||||||||||||
|
2015 |
2014 |
2013 |
2012 |
2011 |
|||||||||||||||||||
|
Net asset value, beginning of year |
$ |
10.48 |
$ |
10.14 |
$ |
9.48 |
$ |
9.72 |
$ |
10.00 |
|||||||||||||
|
Income (loss) from investment operations: |
|||||||||||||||||||||||
|
Net investment (loss)1 |
(0.29 |
) |
(0.24 |
) |
(0.18 |
) |
(0.19 |
) |
(0.18 |
) |
|||||||||||||
|
Net realized and unrealized gain (loss) |
1.20 |
0.58 |
0.84 |
(0.04 |
) |
(0.10 |
) |
||||||||||||||||
|
Total income (loss) from investment operations |
0.91 |
0.34 |
0.66 |
(0.23 |
) |
(0.28 |
) |
||||||||||||||||
|
Redemption fees |
0.003 |
— |
0.003 |
— |
— |
||||||||||||||||||
|
Less dividends/distributions: |
|||||||||||||||||||||||
|
From net realized gains |
(0.18 |
) |
— |
— |
(0.01 |
) |
— |
||||||||||||||||
|
Net asset value, end of year |
$ |
11.21 |
$ |
10.48 |
$ |
10.14 |
$ |
9.48 |
$ |
9.72 |
|||||||||||||
|
Total investment return2 |
8.76 |
% |
3.35 |
% |
6.96 |
% |
(2.51 |
)% |
(2.70 |
)% |
|||||||||||||
|
Ratios to average net assets: |
|||||||||||||||||||||||
|
Expenses before fee waivers and/or expense reimbursement and after dividend expense and security loan fees for securities sold short |
6.01 |
% |
5.46 |
% |
6.16 |
% |
5.33 |
% |
4.83 |
% |
|||||||||||||
|
Expenses after fee waivers and/or expense reimbursement and after dividend expense and security loan fees for securities sold short |
4.06 |
% |
3.87 |
% |
3.81 |
% |
4.08 |
% |
3.82 |
% |
|||||||||||||
|
Expenses after fee waivers and/or expense reimbursement and before dividend expense and security loan fees for securities sold short |
1.50 |
% |
1.50 |
% |
1.50 |
% |
1.50 |
% |
1.50 |
% |
|||||||||||||
|
Net investment loss |
(2.66 |
)% |
(2.47 |
)% |
(1.84 |
)% |
(2.00 |
)% |
(1.81 |
)% |
|||||||||||||
|
Supplemental data: |
|||||||||||||||||||||||
|
Net assets, end of year (000's) |
$ |
16,294 |
$ |
14,765 |
$ |
14,370 |
$ |
14,215 |
$ |
14,583 |
|||||||||||||
|
Portfolio turnover rate |
99 |
% |
148 |
% |
167 |
% |
242 |
% |
460 |
% |
|||||||||||||
1 Calculated using the average shares method.
2 Total investment return is calculated assuming a $10,000 investment on the first day of each year reported, reinvestment of all dividends and distributions, if any, at net asset value on the ex-dividend dates, and a sale at net asset value on the last day of each year reported. The figures do not include any applicable sales charges; results would be lower if they were included. Returns do not reflect the deduction of taxes that a shareholder would pay on Fund dividends/distributions or the redemption of Fund shares.
3 Amount represents less than $0.005 per share.
88
UBS Equity Long-Short Multi-Strategy Fund
Financial highlights
|
Class C |
|||||||||||||||||||||||
|
Year ended June 30, |
|||||||||||||||||||||||
|
2015 |
2014 |
2013 |
2012 |
2011 |
|||||||||||||||||||
|
Net asset value, beginning of year |
$ |
10.07 |
$ |
9.85 |
$ |
9.29 |
$ |
9.63 |
$ |
10.00 |
|||||||||||||
|
Income (loss) from investment operations: |
|||||||||||||||||||||||
|
Net investment (loss)1 |
(0.38 |
) |
(0.33 |
) |
(0.27 |
) |
(0.28 |
) |
(0.28 |
) |
|||||||||||||
|
Net realized and unrealized gain (loss) |
1.14 |
0.55 |
0.83 |
(0.05 |
) |
(0.09 |
) |
||||||||||||||||
|
Total income (loss) from investment operations |
0.76 |
0.22 |
0.56 |
(0.33 |
) |
(0.37 |
) |
||||||||||||||||
|
Redemption fees |
0.003 |
— |
0.003 |
— |
0.003 |
||||||||||||||||||
|
Less dividends/distributions: |
|||||||||||||||||||||||
|
From net realized gains |
(0.18 |
) |
— |
— |
(0.01 |
) |
— |
||||||||||||||||
|
Net asset value, end of year |
$ |
10.65 |
$ |
10.07 |
$ |
9.85 |
$ |
9.29 |
$ |
9.63 |
|||||||||||||
|
Total investment return2 |
7.61 |
% |
2.23 |
% |
6.03 |
% |
(3.58 |
)% |
(3.60 |
)% |
|||||||||||||
|
Ratios to average net assets: |
|||||||||||||||||||||||
|
Expenses before fee waivers and/or expense reimbursement and after dividend expense and security loan fees for securities sold short |
7.28 |
% |
6.44 |
% |
6.88 |
% |
6.47 |
% |
5.94 |
% |
|||||||||||||
|
Expenses after fee waivers and/or expense reimbursement and after dividend expense and security loan fees for securities sold short |
5.06 |
% |
4.85 |
% |
4.75 |
% |
5.05 |
% |
4.94 |
% |
|||||||||||||
|
Expenses after fee waivers and/or expense reimbursement and before dividend expense and security loan fees for securities sold short |
2.50 |
% |
2.50 |
% |
2.50 |
% |
2.50 |
% |
2.50 |
% |
|||||||||||||
|
Net investment loss |
(3.66 |
)% |
(3.47 |
)% |
(2.84 |
)% |
(3.01 |
)% |
(2.84 |
)% |
|||||||||||||
|
Supplemental data: |
|||||||||||||||||||||||
|
Net assets, end of year (000's) |
$ |
467 |
$ |
409 |
$ |
413 |
$ |
600 |
$ |
904 |
|||||||||||||
|
Portfolio turnover rate |
99 |
% |
148 |
% |
167 |
% |
242 |
% |
460 |
% |
|||||||||||||
See accompanying notes to financial statements.
89
UBS Global Sustainable Equity Fund
Financial highlights
The table below sets forth financial data for one share of beneficial interest outstanding throughout each year presented.
|
Class A |
|||||||||||||||||||||||
|
Year ended June 30, |
|||||||||||||||||||||||
|
2015 |
2014 |
2013 |
2012 |
2011 |
|||||||||||||||||||
|
Net asset value, beginning of year |
$ |
8.95 |
$ |
7.55 |
$ |
6.75 |
$ |
8.21 |
$ |
6.62 |
|||||||||||||
|
Income (loss) from investment operations: |
|||||||||||||||||||||||
|
Net investment income1 |
0.10 |
0.08 |
0.11 |
0.08 |
0.07 |
||||||||||||||||||
|
Net realized and unrealized gain (loss) |
0.53 |
1.51 |
0.93 |
(1.40 |
) |
1.78 |
|||||||||||||||||
|
Total income (loss) from investment operations |
0.63 |
1.59 |
1.04 |
(1.32 |
) |
1.85 |
|||||||||||||||||
|
Less dividends/distributions: |
|||||||||||||||||||||||
|
From net investment income |
(0.11 |
) |
(0.19 |
) |
(0.24 |
) |
(0.14 |
) |
(0.26 |
) |
|||||||||||||
|
Net asset value, end of year |
$ |
9.47 |
$ |
8.95 |
$ |
7.55 |
$ |
6.75 |
$ |
8.21 |
|||||||||||||
|
Total investment return2 |
7.14 |
% |
21.32 |
% |
15.49 |
% |
(15.99 |
)% |
28.14 |
% |
|||||||||||||
|
Ratios to average net assets: |
|||||||||||||||||||||||
|
Expenses before fee waivers and/or expense reimbursement |
2.47 |
% |
2.74 |
% |
2.65 |
% |
2.28 |
% |
2.04 |
% |
|||||||||||||
|
Expenses after fee waivers and/or expense reimbursement |
1.25 |
% |
1.25 |
% |
1.25 |
% |
1.25 |
% |
1.25 |
% |
|||||||||||||
|
Net investment income |
1.09 |
% |
0.91 |
% |
1.49 |
% |
1.20 |
% |
0.93 |
% |
|||||||||||||
|
Supplemental data: |
|||||||||||||||||||||||
|
Net assets, end of year (000's) |
$ |
6,371 |
$ |
7,541 |
$ |
5,433 |
$ |
5,576 |
$ |
9,207 |
|||||||||||||
|
Portfolio turnover rate |
42 |
% |
137 |
% |
41 |
% |
49 |
% |
76 |
% |
|||||||||||||
|
Class P |
|||||||||||||||||||||||
|
Year ended June 30, |
|||||||||||||||||||||||
|
2015 |
2014 |
2013 |
2012 |
2011 |
|||||||||||||||||||
|
Net asset value, beginning of year |
$ |
8.99 |
$ |
7.58 |
$ |
6.77 |
$ |
8.25 |
$ |
6.65 |
|||||||||||||
|
Income (loss) from investment operations: |
|||||||||||||||||||||||
|
Net investment income1 |
0.13 |
0.09 |
0.13 |
0.11 |
0.09 |
||||||||||||||||||
|
Net realized and unrealized gain (loss) |
0.51 |
1.53 |
0.94 |
(1.43 |
) |
1.79 |
|||||||||||||||||
|
Total income (loss) from investment operations |
0.64 |
1.62 |
1.07 |
(1.32 |
) |
1.88 |
|||||||||||||||||
|
Less dividends/distributions: |
|||||||||||||||||||||||
|
From net investment income |
(0.13 |
) |
(0.21 |
) |
(0.26 |
) |
(0.16 |
) |
(0.28 |
) |
|||||||||||||
|
Net asset value, end of year |
$ |
9.50 |
$ |
8.99 |
$ |
7.58 |
$ |
6.77 |
$ |
8.25 |
|||||||||||||
|
Total investment return2 |
7.32 |
% |
21.65 |
% |
15.95 |
% |
(15.88 |
)% |
28.46 |
% |
|||||||||||||
|
Ratios to average net assets: |
|||||||||||||||||||||||
|
Expenses before fee waivers and/or expense reimbursement |
2.21 |
% |
2.45 |
% |
2.40 |
% |
2.06 |
% |
1.78 |
% |
|||||||||||||
|
Expenses after fee waivers and/or expense reimbursement |
1.00 |
% |
1.00 |
% |
1.00 |
% |
1.00 |
% |
1.00 |
% |
|||||||||||||
|
Net investment income |
1.40 |
% |
1.10 |
% |
1.69 |
% |
1.52 |
% |
1.13 |
% |
|||||||||||||
|
Supplemental data: |
|||||||||||||||||||||||
|
Net assets, end of year (000's) |
$ |
17,103 |
$ |
12,462 |
$ |
11,740 |
$ |
12,966 |
$ |
17,829 |
|||||||||||||
|
Portfolio turnover rate |
42 |
% |
137 |
% |
41 |
% |
49 |
% |
76 |
% |
|||||||||||||
1 Calculated using the average shares method.
2 Total investment return is calculated assuming a $10,000 investment on the first day of each year reported, reinvestment of all dividends and distributions, if any, at net asset value on the ex-dividend dates, and a sale at net asset value on the last day of each year reported. The figures do not include any applicable sales charges; results would be lower if they were included. Returns do not reflect the deduction of taxes that a shareholder would pay on Fund dividends/distributions or the redemption of Fund shares.
90
UBS Global Sustainable Equity Fund
Financial highlights
|
Class C |
|||||||||||||||||||||||
|
Year ended June 30, |
|||||||||||||||||||||||
|
2015 |
2014 |
2013 |
2012 |
2011 |
|||||||||||||||||||
|
Net asset value, beginning of year |
$ |
8.80 |
$ |
7.43 |
$ |
6.63 |
$ |
8.02 |
$ |
6.47 |
|||||||||||||
|
Income (loss) from investment operations: |
|||||||||||||||||||||||
|
Net investment income1 |
0.04 |
0.03 |
0.05 |
0.03 |
0.03 |
||||||||||||||||||
|
Net realized and unrealized gain (loss) |
0.51 |
1.47 |
0.92 |
(1.36 |
) |
1.72 |
|||||||||||||||||
|
Total income (loss) from investment operations |
0.55 |
1.50 |
0.97 |
(1.33 |
) |
1.75 |
|||||||||||||||||
|
Less dividends/distributions: |
|||||||||||||||||||||||
|
From net investment income |
(0.09 |
) |
(0.13 |
) |
(0.17 |
) |
(0.06 |
) |
(0.20 |
) |
|||||||||||||
|
Net asset value, end of year |
$ |
9.26 |
$ |
8.80 |
$ |
7.43 |
$ |
6.63 |
$ |
8.02 |
|||||||||||||
|
Total investment return2 |
6.36 |
% |
20.32 |
% |
14.72 |
% |
(16.59 |
)% |
27.14 |
% |
|||||||||||||
|
Ratios to average net assets: |
|||||||||||||||||||||||
|
Expenses before fee waivers and/or expense reimbursement |
3.23 |
% |
3.54 |
% |
3.40 |
% |
3.06 |
% |
2.82 |
% |
|||||||||||||
|
Expenses after fee waivers and/or expense reimbursement |
2.00 |
% |
2.00 |
% |
2.00 |
% |
2.00 |
% |
2.00 |
% |
|||||||||||||
|
Net investment income |
0.46 |
% |
0.37 |
% |
0.65 |
% |
0.45 |
% |
0.32 |
% |
|||||||||||||
|
Supplemental data: |
|||||||||||||||||||||||
|
Net assets, end of year (000's) |
$ |
2,672 |
$ |
1,579 |
$ |
605 |
$ |
703 |
$ |
1,405 |
|||||||||||||
|
Portfolio turnover rate |
42 |
% |
137 |
% |
41 |
% |
49 |
% |
76 |
% |
|||||||||||||
See accompanying notes to financial statements.
91
UBS U.S. Defensive Equity Fund
Financial highlights
The table below sets forth financial data for one share of beneficial interest outstanding throughout each year presented.
|
Class A |
|||||||||||||||||||||||
|
Year ended June 30, |
|||||||||||||||||||||||
|
2015 |
2014 |
2013 |
2012 |
2011 |
|||||||||||||||||||
|
Net asset value, beginning of year |
$ |
12.84 |
$ |
10.81 |
$ |
8.66 |
$ |
8.94 |
$ |
7.01 |
|||||||||||||
|
Income (loss) from investment operations: |
|||||||||||||||||||||||
|
Net investment income (loss)1 |
(0.02 |
) |
(0.01 |
) |
(0.03 |
) |
0.02 |
0.02 |
|||||||||||||||
|
Net realized and unrealized gain (loss) |
1.09 |
2.04 |
2.20 |
(0.29 |
) |
1.91 |
|||||||||||||||||
|
Total income (loss) from investment operations |
1.07 |
2.03 |
2.17 |
(0.27 |
) |
1.93 |
|||||||||||||||||
|
Less dividends/distributions: |
|||||||||||||||||||||||
|
From net investment income |
— |
— |
(0.02 |
) |
(0.01 |
) |
— |
||||||||||||||||
|
Net asset value, end of year |
$ |
13.91 |
$ |
12.84 |
$ |
10.81 |
$ |
8.66 |
$ |
8.94 |
|||||||||||||
|
Total investment return2 |
8.33 |
% |
18.78 |
% |
25.04 |
% |
(3.02 |
)% |
27.53 |
% |
|||||||||||||
|
Ratios to average net assets: |
|||||||||||||||||||||||
|
Expenses before fee waivers and/or expense reimbursement and after dividend expense and security loan fees for securities sold short |
3.81 |
% |
3.80 |
% |
4.79 |
% |
3.21 |
% |
2.54 |
% |
|||||||||||||
|
Expenses after fee waivers and/or expense reimbursement and after dividend expense and security loan fees for securities sold short |
2.24 |
% |
2.15 |
% |
2.81 |
% |
2.21 |
% |
2.03 |
% |
|||||||||||||
|
Expenses after fee waivers and/or expense reimbursement and before dividend expense and security loan fees for securities sold short |
1.50 |
% |
1.50 |
% |
1.50 |
% |
1.50 |
% |
1.50 |
% |
|||||||||||||
|
Net investment income (loss) |
(0.19 |
)% |
(0.11 |
)% |
(0.34 |
)% |
0.26 |
% |
0.24 |
% |
|||||||||||||
|
Supplemental data: |
|||||||||||||||||||||||
|
Net assets, end of year (000's) |
$ |
9,331 |
$ |
11,473 |
$ |
9,072 |
$ |
9,682 |
$ |
16,726 |
|||||||||||||
|
Portfolio turnover rate |
57 |
% |
60 |
% |
58 |
% |
85 |
% |
85 |
% |
|||||||||||||
|
Class P |
|||||||||||||||||||||||
|
Year ended June 30, |
|||||||||||||||||||||||
|
2015 |
2014 |
2013 |
2012 |
2011 |
|||||||||||||||||||
|
Net asset value, beginning of year |
$ |
12.87 |
$ |
10.80 |
$ |
8.65 |
$ |
8.94 |
$ |
7.01 |
|||||||||||||
|
Income (loss) from investment operations: |
|||||||||||||||||||||||
|
Net investment income (loss)1 |
0.02 |
0.01 |
(0.01 |
) |
0.04 |
0.04 |
|||||||||||||||||
|
Net realized and unrealized gain (loss) |
1.08 |
2.06 |
2.19 |
(0.29 |
) |
1.92 |
|||||||||||||||||
|
Total income (loss) from investment operations |
1.10 |
2.07 |
2.18 |
(0.25 |
) |
1.96 |
|||||||||||||||||
|
Less dividends/distributions: |
|||||||||||||||||||||||
|
From net investment income |
— |
— |
(0.03 |
) |
(0.04 |
) |
(0.03 |
) |
|||||||||||||||
|
Net asset value, end of year |
$ |
13.97 |
$ |
12.87 |
$ |
10.80 |
$ |
8.65 |
$ |
8.94 |
|||||||||||||
|
Total investment return2 |
8.55 |
% |
19.17 |
% |
25.26 |
% |
(2.80 |
)% |
27.91 |
% |
|||||||||||||
|
Ratios to average net assets: |
|||||||||||||||||||||||
|
Expenses before fee waivers and/or expense reimbursement and after dividend expense and security loan fees for securities sold short |
3.59 |
% |
3.53 |
% |
4.51 |
% |
2.85 |
% |
2.26 |
% |
|||||||||||||
|
Expenses after fee waivers and/or expense reimbursement and after dividend expense and security loan fees for securities sold short |
2.00 |
% |
1.90 |
% |
2.57 |
% |
1.93 |
% |
1.78 |
% |
|||||||||||||
|
Expenses after fee waivers and/or expense reimbursement and before dividend expense and security loan fees for securities sold short |
1.25 |
% |
1.25 |
% |
1.25 |
% |
1.25 |
% |
1.25 |
% |
|||||||||||||
|
Net investment income (loss) |
0.13 |
% |
0.12 |
% |
(0.09 |
)% |
0.50 |
% |
0.48 |
% |
|||||||||||||
|
Supplemental data: |
|||||||||||||||||||||||
|
Net assets, end of year (000's) |
$ |
5,031 |
$ |
2,146 |
$ |
2,950 |
$ |
3,806 |
$ |
10,764 |
|||||||||||||
|
Portfolio turnover rate |
57 |
% |
60 |
% |
58 |
% |
85 |
% |
85 |
% |
|||||||||||||
1 Calculated using the average shares method.
2 Total investment return is calculated assuming a $10,000 investment on the first day of each year reported, reinvestment of all dividends and distributions, if any, at net asset value on the ex-dividend dates, and a sale at net asset value on the last day of each year reported. The figures do not include any applicable sales charges; results would be lower if they were included. Returns do not reflect the deduction of taxes that a shareholder would pay on dividends/distributions or the redemption of Fund shares.
92
UBS U.S. Defensive Equity Fund
Financial highlights
|
Class C |
|||||||||||||||||||||||
|
Year ended June 30, |
|||||||||||||||||||||||
|
2015 |
2014 |
2013 |
2012 |
2011 |
|||||||||||||||||||
|
Net asset value, beginning of year |
$ |
12.36 |
$ |
10.48 |
$ |
8.45 |
$ |
8.78 |
$ |
6.93 |
|||||||||||||
|
Income (loss) from investment operations: |
|||||||||||||||||||||||
|
Net investment income (loss)1 |
(0.12 |
) |
(0.10 |
) |
(0.11 |
) |
(0.04 |
) |
(0.04 |
) |
|||||||||||||
|
Net realized and unrealized gain (loss) |
1.05 |
1.98 |
2.14 |
(0.29 |
) |
1.89 |
|||||||||||||||||
|
Total income (loss) from investment operations |
0.93 |
1.88 |
2.03 |
(0.33 |
) |
1.85 |
|||||||||||||||||
|
Less dividends/distributions: |
|||||||||||||||||||||||
|
From net investment income |
— |
— |
— |
— |
— |
||||||||||||||||||
|
Net asset value, end of year |
$ |
13.29 |
$ |
12.36 |
$ |
10.48 |
$ |
8.45 |
$ |
8.78 |
|||||||||||||
|
Total investment return2 |
7.52 |
% |
17.94 |
% |
24.02 |
% |
(3.76 |
)% |
26.70 |
% |
|||||||||||||
|
Ratios to average net assets: |
|||||||||||||||||||||||
|
Expenses before fee waivers and/or expense reimbursement and after dividend expense and security loan fees for securities sold short |
4.68 |
% |
4.61 |
% |
5.61 |
% |
4.04 |
% |
3.36 |
% |
|||||||||||||
|
Expenses after fee waivers and/or expense reimbursement and after dividend expense and security loan fees for securities sold short |
3.01 |
% |
2.90 |
% |
3.59 |
% |
2.96 |
% |
2.78 |
% |
|||||||||||||
|
Expenses after fee waivers and/or expense reimbursement and before dividend expense and security loan fees for securities sold short |
2.25 |
% |
2.25 |
% |
2.25 |
% |
2.25 |
% |
2.25 |
% |
|||||||||||||
|
Net investment income (loss) |
(0.91 |
)% |
(0.87 |
)% |
(1.13 |
)% |
(0.49 |
)% |
(0.52 |
)% |
|||||||||||||
|
Supplemental data: |
|||||||||||||||||||||||
|
Net assets, end of year (000's) |
$ |
2,464 |
$ |
2,401 |
$ |
2,632 |
$ |
3,141 |
$ |
5,029 |
|||||||||||||
|
Portfolio turnover rate |
57 |
% |
60 |
% |
58 |
% |
85 |
% |
85 |
% |
|||||||||||||
See accompanying notes to financial statements.
93
UBS U.S. Equity Opportunity Fund
Financial highlights
The table below sets forth financial data for one share of beneficial interest outstanding throughout each year presented.
|
Class A |
|||||||||||||||||||||||
|
Year ended June 30, |
|||||||||||||||||||||||
|
2015 |
2014 |
2013 |
2012 |
2011 |
|||||||||||||||||||
|
Net asset value, beginning of year |
$ |
9.65 |
$ |
7.81 |
$ |
6.31 |
$ |
6.74 |
$ |
5.33 |
|||||||||||||
|
Income (loss) from investment operations: |
|||||||||||||||||||||||
|
Net investment income (loss)1 |
0.01 |
0.01 |
0.03 |
0.05 |
0.06 |
||||||||||||||||||
|
Net realized and unrealized gain (loss) |
0.79 |
1.86 |
1.53 |
(0.42 |
) |
1.41 |
|||||||||||||||||
|
Total income (loss) from investment operations |
0.80 |
1.87 |
1.56 |
(0.37 |
) |
1.47 |
|||||||||||||||||
|
Less dividends/distributions: |
|||||||||||||||||||||||
|
From net investment income |
0.003 |
(0.03 |
) |
(0.06 |
) |
(0.06 |
) |
(0.06 |
) |
||||||||||||||
|
Net asset value, end of year |
$ |
10.45 |
$ |
9.65 |
$ |
7.81 |
$ |
6.31 |
$ |
6.74 |
|||||||||||||
|
Total investment return2 |
8.33 |
% |
24.01 |
% |
24.92 |
% |
(5.33 |
)% |
27.57 |
% |
|||||||||||||
|
Ratios to average net assets: |
|||||||||||||||||||||||
|
Expenses before fee waivers and/or expense reimbursement |
1.72 |
% |
1.72 |
% |
1.83 |
% |
1.89 |
% |
1.61 |
% |
|||||||||||||
|
Expenses after fee waivers and/or expense reimbursement |
1.20 |
% |
1.20 |
% |
1.20 |
% |
1.20 |
% |
1.20 |
% |
|||||||||||||
|
Net investment income |
0.14 |
% |
0.11 |
% |
0.45 |
% |
0.87 |
% |
0.88 |
% |
|||||||||||||
|
Supplemental data: |
|||||||||||||||||||||||
|
Net assets, end of year (000's) |
$ |
38,657 |
$ |
39,483 |
$ |
36,269 |
$ |
35,538 |
$ |
43,766 |
|||||||||||||
|
Portfolio turnover rate |
48 |
% |
62 |
% |
89 |
% |
138 |
% |
85 |
% |
|||||||||||||
|
Class P |
|||||||||||||||||||||||
|
Year ended June 30, |
|||||||||||||||||||||||
|
2015 |
2014 |
2013 |
2012 |
2011 |
|||||||||||||||||||
|
Net asset value, beginning of year |
$ |
9.71 |
$ |
7.86 |
$ |
6.35 |
$ |
6.79 |
$ |
5.36 |
|||||||||||||
|
Income (loss) from investment operations: |
|||||||||||||||||||||||
|
Net investment income1 |
0.04 |
0.03 |
0.05 |
0.07 |
0.07 |
||||||||||||||||||
|
Net realized and unrealized gain (loss) |
0.80 |
1.87 |
1.54 |
(0.43 |
) |
1.43 |
|||||||||||||||||
|
Total income (loss) from investment operations |
0.84 |
1.90 |
1.59 |
(0.36 |
) |
1.50 |
|||||||||||||||||
|
Less dividends/distributions: |
|||||||||||||||||||||||
|
From net investment income |
(0.03 |
) |
(0.05 |
) |
(0.08 |
) |
(0.08 |
) |
(0.07 |
) |
|||||||||||||
|
Net asset value, end of year |
$ |
10.52 |
$ |
9.71 |
$ |
7.86 |
$ |
6.35 |
$ |
6.79 |
|||||||||||||
|
Total investment return2 |
8.65 |
% |
24.28 |
% |
25.27 |
% |
(5.14 |
)% |
28.13 |
% |
|||||||||||||
|
Ratios to average net assets: |
|||||||||||||||||||||||
|
Expenses before fee waivers and/or expense reimbursement |
1.52 |
% |
1.52 |
% |
1.67 |
% |
1.73 |
% |
1.48 |
% |
|||||||||||||
|
Expenses after fee waivers and/or expense reimbursement |
0.95 |
% |
0.95 |
% |
0.95 |
% |
0.95 |
% |
0.95 |
% |
|||||||||||||
|
Net investment income |
0.39 |
% |
0.36 |
% |
0.70 |
% |
1.12 |
% |
1.13 |
% |
|||||||||||||
|
Supplemental data: |
|||||||||||||||||||||||
|
Net assets, end of year (000's) |
$ |
2,154 |
$ |
1,620 |
$ |
1,304 |
$ |
1,444 |
$ |
1,576 |
|||||||||||||
|
Portfolio turnover rate |
48 |
% |
62 |
% |
89 |
% |
138 |
% |
85 |
% |
|||||||||||||
1 Calculated using the average shares method.
2 Total investment return is calculated assuming a $10,000 investment on the first day of each year reported, reinvestment of all dividends and distributions, if any, at net asset value on the ex-dividend dates, and a sale at net asset value on the last day of each year reported. The figures do not include any applicable sales charges; results would be lower if they were included. Returns do not reflect the deduction of taxes that a shareholder would pay on Fund dividends/distributions or the redemption of Fund shares.
3 Amount represents less than $0.005 per share.
94
UBS U.S. Equity Opportunity Fund
Financial highlights
|
Class C |
|||||||||||||||||||||||
|
Year ended June 30, |
|||||||||||||||||||||||
|
2015 |
2014 |
2013 |
2012 |
2011 |
|||||||||||||||||||
|
Net asset value, beginning of year |
$ |
9.42 |
$ |
7.65 |
$ |
6.18 |
$ |
6.59 |
$ |
5.20 |
|||||||||||||
|
Income (loss) from investment operations: |
|||||||||||||||||||||||
|
Net investment income (loss)1 |
(0.06 |
) |
(0.05 |
) |
(0.02 |
) |
0.01 |
0.01 |
|||||||||||||||
|
Net realized and unrealized gain (loss) |
0.77 |
1.82 |
1.50 |
(0.41 |
) |
1.39 |
|||||||||||||||||
|
Total income (loss) from investment operations |
0.71 |
1.77 |
1.48 |
(0.40 |
) |
1.40 |
|||||||||||||||||
|
Less dividends/distributions: |
|||||||||||||||||||||||
|
From net investment income |
— |
— |
(0.01 |
) |
(0.01 |
) |
(0.01 |
) |
|||||||||||||||
|
Net asset value, end of year |
$ |
10.13 |
$ |
9.42 |
$ |
7.65 |
$ |
6.18 |
$ |
6.59 |
|||||||||||||
|
Total investment return2 |
7.54 |
% |
23.14 |
% |
23.88 |
% |
(6.07 |
)% |
26.87 |
% |
|||||||||||||
|
Ratios to average net assets: |
|||||||||||||||||||||||
|
Expenses before fee waivers and/or expense reimbursement |
2.50 |
% |
2.50 |
% |
2.62 |
% |
2.67 |
% |
2.40 |
% |
|||||||||||||
|
Expenses after fee waivers and/or expense reimbursement |
1.95 |
% |
1.95 |
% |
1.95 |
% |
1.95 |
% |
1.95 |
% |
|||||||||||||
|
Net investment income |
(0.62 |
)% |
(0.64 |
)% |
(0.30 |
)% |
0.12 |
% |
0.13 |
% |
|||||||||||||
|
Supplemental data: |
|||||||||||||||||||||||
|
Net assets, end of year (000's) |
$ |
4,132 |
$ |
4,599 |
$ |
4,026 |
$ |
3,978 |
$ |
4,992 |
|||||||||||||
|
Portfolio turnover rate |
48 |
% |
62 |
% |
89 |
% |
138 |
% |
85 |
% |
|||||||||||||
See accompanying notes to financial statements.
95
UBS U.S. Large Cap Equity Fund
Financial highlights
The table below sets forth financial data for one share of beneficial interest outstanding throughout each year presented.
|
Class A |
|||||||||||||||||||||||
|
Year ended June 30, |
|||||||||||||||||||||||
|
2015 |
2014 |
2013 |
2012 |
2011 |
|||||||||||||||||||
|
Net asset value, beginning of year |
$ |
25.03 |
$ |
19.85 |
$ |
15.96 |
$ |
16.46 |
$ |
12.79 |
|||||||||||||
|
Income (loss) from investment operations: |
|||||||||||||||||||||||
|
Net investment income (loss)1 |
0.14 |
0.11 |
0.11 |
0.10 |
0.09 |
||||||||||||||||||
|
Net realized and unrealized gain (loss) |
2.50 |
5.23 |
3.86 |
(0.51 |
) |
3.65 |
|||||||||||||||||
|
Total income (loss) from investment operations |
2.64 |
5.34 |
3.97 |
(0.41 |
) |
3.74 |
|||||||||||||||||
|
Less dividends/distributions: |
|||||||||||||||||||||||
|
From net investment income |
(0.12 |
) |
(0.16 |
) |
(0.08 |
) |
(0.09 |
) |
(0.07 |
) |
|||||||||||||
|
Net asset value, end of year |
$ |
27.55 |
$ |
25.03 |
$ |
19.85 |
$ |
15.96 |
$ |
16.46 |
|||||||||||||
|
Total investment return2 |
10.61 |
% |
27.05 |
% |
24.99 |
% |
(2.47 |
)% |
29.28 |
% |
|||||||||||||
|
Ratios to average net assets: |
|||||||||||||||||||||||
|
Expenses before fee waivers and/or expense reimbursement/recoupment |
1.56 |
% |
1.29 |
% |
1.28 |
% |
1.24 |
% |
1.19 |
% |
|||||||||||||
|
Expenses after fee waivers and/or expense reimbursement/recoupment |
1.20 |
% |
1.20 |
% |
1.20 |
% |
1.20 |
% |
1.20 |
%3 |
|||||||||||||
|
Net investment income(loss) |
0.53 |
% |
0.47 |
% |
0.63 |
% |
0.64 |
% |
0.57 |
% |
|||||||||||||
|
Supplemental data: |
|||||||||||||||||||||||
|
Net assets, end of year (000's) |
$ |
9,784 |
$ |
9,478 |
$ |
8,534 |
$ |
14,113 |
$ |
19,832 |
|||||||||||||
|
Portfolio turnover rate |
59 |
% |
55 |
% |
58 |
% |
65 |
% |
60 |
% |
|||||||||||||
|
Class P |
|||||||||||||||||||||||
|
Year ended June 30, |
|||||||||||||||||||||||
|
2015 |
2014 |
2013 |
2012 |
2011 |
|||||||||||||||||||
|
Net asset value, beginning of year |
$ |
25.14 |
$ |
19.94 |
$ |
16.07 |
$ |
16.60 |
$ |
12.91 |
|||||||||||||
|
Income (loss) from investment operations: |
|||||||||||||||||||||||
|
Net investment income1 |
0.20 |
0.16 |
0.15 |
0.14 |
0.13 |
||||||||||||||||||
|
Net realized and unrealized gain (loss) |
2.52 |
5.27 |
3.88 |
(0.52 |
) |
3.68 |
|||||||||||||||||
|
Total income (loss) from investment operations |
2.72 |
5.43 |
4.03 |
(0.38 |
) |
3.81 |
|||||||||||||||||
|
Less dividends/distributions: |
|||||||||||||||||||||||
|
From net investment income |
(0.19 |
) |
(0.23 |
) |
(0.16 |
) |
(0.15 |
) |
(0.12 |
) |
|||||||||||||
|
Net asset value, end of year |
$ |
27.67 |
$ |
25.14 |
$ |
19.94 |
$ |
16.07 |
$ |
16.60 |
|||||||||||||
|
Total investment return2 |
10.90 |
% |
27.38 |
% |
25.28 |
% |
(2.23 |
)% |
29.57 |
% |
|||||||||||||
|
Ratios to average net assets: |
|||||||||||||||||||||||
|
Expenses before fee waivers and/or expense reimbursement/recoupment |
1.07 |
% |
0.99 |
% |
0.98 |
% |
0.97 |
% |
0.94 |
% |
|||||||||||||
|
Expenses after fee waivers and/or expense reimbursement/recoupment |
0.95 |
% |
0.95 |
% |
0.95 |
% |
0.95 |
% |
0.95 |
%3 |
|||||||||||||
|
Net investment income |
0.77 |
% |
0.71 |
% |
0.87 |
% |
0.90 |
% |
0.82 |
% |
|||||||||||||
|
Supplemental data: |
|||||||||||||||||||||||
|
Net assets, end of year (000's) |
$ |
28,345 |
$ |
126,735 |
$ |
146,145 |
$ |
185,910 |
$ |
206,555 |
|||||||||||||
|
Portfolio turnover rate |
59 |
% |
55 |
% |
58 |
% |
65 |
% |
60 |
% |
|||||||||||||
1 Calculated using the average shares method.
2 Total investment return is calculated assuming a $10,000 investment on the first day of each year reported, reinvestment of all dividends and distributions, if any, at net asset value on the ex-dividend dates, and a sale at net asset value on the last day of each year reported. The figures do not include any applicable sales charges; results would be lower if they were included. Returns do not reflect the deduction of taxes that a shareholder would pay on Fund dividends/distributions or the redemption of Fund shares.
3 The investment manager recouped expenses previously reimbursed by the investment manager on behalf of the Fund, not to exceed the expense cap.
96
UBS U.S. Large Cap Equity Fund
Financial highlights
|
Class C |
|||||||||||||||||||||||
|
Year ended June 30, |
|||||||||||||||||||||||
|
2015 |
2014 |
2013 |
2012 |
2011 |
|||||||||||||||||||
|
Net asset value, beginning of year |
$ |
23.99 |
$ |
19.06 |
$ |
15.36 |
$ |
15.88 |
$ |
12.37 |
|||||||||||||
|
Income (loss) from investment operations: |
|||||||||||||||||||||||
|
Net investment income (loss)1 |
(0.05 |
) |
(0.06 |
) |
(0.02 |
) |
(0.02 |
) |
(0.03 |
) |
|||||||||||||
|
Net realized and unrealized gain (loss) |
2.40 |
5.03 |
3.72 |
(0.50 |
) |
3.54 |
|||||||||||||||||
|
Total income (loss) from investment operations |
2.35 |
4.97 |
3.70 |
(0.52 |
) |
3.51 |
|||||||||||||||||
|
Less dividends/distributions: |
|||||||||||||||||||||||
|
From net investment income |
— |
(0.04 |
) |
— |
— |
— |
|||||||||||||||||
|
Net asset value, end of year |
$ |
26.34 |
$ |
23.99 |
$ |
19.06 |
$ |
15.36 |
$ |
15.88 |
|||||||||||||
|
Total investment return2 |
9.80 |
% |
26.09 |
% |
24.09 |
% |
(3.28 |
)% |
28.38 |
% |
|||||||||||||
|
Ratios to average net assets: |
|||||||||||||||||||||||
|
Expenses before fee waivers and/or expense reimbursement/recoupment |
2.31 |
% |
2.08 |
% |
2.04 |
% |
2.02 |
% |
2.00 |
% |
|||||||||||||
|
Expenses after fee waivers and/or expense reimbursement/recoupment |
1.95 |
% |
1.95 |
% |
1.95 |
% |
1.95 |
% |
1.95 |
% |
|||||||||||||
|
Net investment income(loss) |
(0.22 |
)% |
(0.27 |
)% |
(0.11 |
)% |
(0.11 |
)% |
(0.18 |
)% |
|||||||||||||
|
Supplemental data: |
|||||||||||||||||||||||
|
Net assets, end of year (000's) |
$ |
2,643 |
$ |
3,299 |
$ |
2,617 |
$ |
2,873 |
$ |
3,467 |
|||||||||||||
|
Portfolio turnover rate |
59 |
% |
55 |
% |
58 |
% |
65 |
% |
60 |
% |
|||||||||||||
See accompanying notes to financial statements.
97
UBS U.S. Small Cap Growth Fund
Financial highlights
The table below sets forth financial data for one share of beneficial interest outstanding throughout each year presented.
|
Class A |
|||||||||||||||||||||||
|
Year ended June 30, |
|||||||||||||||||||||||
|
2015 |
2014 |
2013 |
2012 |
2011 |
|||||||||||||||||||
|
Net asset value, beginning of year |
$ |
24.76 |
$ |
20.10 |
$ |
16.19 |
$ |
16.00 |
$ |
10.60 |
|||||||||||||
|
Income (loss) from investment operations: |
|||||||||||||||||||||||
|
Net investment (loss)1 |
(0.16 |
) |
(0.21 |
) |
(0.11 |
) |
(0.14 |
) |
(0.13 |
) |
|||||||||||||
|
Net realized and unrealized gain |
3.38 |
5.40 |
4.02 |
0.33 |
5.53 |
||||||||||||||||||
|
Total income from investment operations |
3.22 |
5.19 |
3.91 |
0.19 |
5.40 |
||||||||||||||||||
|
Less dividends/distributions: |
|||||||||||||||||||||||
|
From net realized gains |
(4.38 |
) |
(0.53 |
) |
— |
— |
— |
||||||||||||||||
|
Net asset value, end of year |
$ |
23.60 |
$ |
24.76 |
$ |
20.10 |
$ |
16.19 |
$ |
16.00 |
|||||||||||||
|
Total investment return2 |
15.61 |
% |
26.42 |
% |
23.78 |
% |
1.19 |
% |
50.94 |
% |
|||||||||||||
|
Ratios to average net assets: |
|||||||||||||||||||||||
|
Expenses before fee waivers and/or expense reimbursement |
1.51 |
% |
1.45 |
% |
1.55 |
% |
1.57 |
% |
1.54 |
% |
|||||||||||||
|
Expenses after fee waivers and/or expense reimbursement |
1.35 |
% |
1.40 |
% |
1.40 |
% |
1.40 |
% |
1.40 |
% |
|||||||||||||
|
Net investment loss |
(0.69 |
)% |
(0.92 |
)% |
(0.64 |
)% |
(0.93 |
)% |
(0.95 |
)% |
|||||||||||||
|
Supplemental data: |
|||||||||||||||||||||||
|
Net assets, end of year (000's) |
$ |
46,813 |
$ |
42,552 |
$ |
32,848 |
$ |
31,015 |
$ |
38,319 |
|||||||||||||
|
Portfolio turnover rate |
64 |
% |
57 |
% |
42 |
% |
48 |
% |
55 |
% |
|||||||||||||
|
Class P |
|||||||||||||||||||||||
|
Year ended June 30, |
|||||||||||||||||||||||
|
2015 |
2014 |
2013 |
2012 |
2011 |
|||||||||||||||||||
|
Net asset value, beginning of year |
$ |
26.00 |
$ |
21.01 |
$ |
16.88 |
$ |
16.64 |
$ |
11.00 |
|||||||||||||
|
Income (loss) from investment operations: |
|||||||||||||||||||||||
|
Net investment (loss)1 |
(0.11 |
) |
(0.15 |
) |
(0.08 |
) |
(0.11 |
) |
(0.10 |
) |
|||||||||||||
|
Net realized and unrealized gain |
3.60 |
5.67 |
4.21 |
0.35 |
5.74 |
||||||||||||||||||
|
Total income from investment operations |
3.49 |
5.52 |
4.13 |
0.24 |
5.64 |
||||||||||||||||||
|
Less dividends/distributions: |
|||||||||||||||||||||||
|
From net realized gains |
(4.38 |
) |
(0.53 |
) |
— |
— |
— |
||||||||||||||||
|
Net asset value, end of year |
$ |
25.11 |
$ |
26.00 |
$ |
21.01 |
$ |
16.88 |
$ |
16.64 |
|||||||||||||
|
Total investment return2 |
15.93 |
% |
26.79 |
% |
24.17 |
% |
1.44 |
% |
51.27 |
% |
|||||||||||||
|
Ratios to average net assets: |
|||||||||||||||||||||||
|
Expenses before fee waivers and/or expense reimbursement/recoupment |
1.10 |
% |
1.09 |
% |
1.13 |
% |
1.15 |
% |
1.13 |
% |
|||||||||||||
|
Expenses after fee waivers and/or expense reimbursement/recoupment |
1.07 |
% |
1.09 |
% |
1.15 |
%3 |
1.15 |
%3 |
1.15 |
%3 |
|||||||||||||
|
Net investment loss |
(0.43 |
)% |
(0.61 |
)% |
(0.41 |
)% |
(0.68 |
)% |
(0.70 |
)% |
|||||||||||||
|
Supplemental data: |
|||||||||||||||||||||||
|
Net assets, end of year (000's) |
$ |
178,495 |
$ |
226,376 |
$ |
172,436 |
$ |
107,447 |
$ |
112,186 |
|||||||||||||
|
Portfolio turnover rate |
64 |
% |
57 |
% |
42 |
% |
48 |
% |
55 |
% |
|||||||||||||
1 Calculated using the average shares method.
2 Total investment return is calculated assuming a $10,000 investment on the first day of each year reported, reinvestment of all dividends and distributions, if any, at net asset value on the ex-dividend dates, and a sale at net asset value on the last day of each year reported. The figures do not include any applicable sales charges; results would be lower if they were included. Returns do not reflect the deduction of taxes that a shareholder would pay on Fund dividend/distributions or the redemption of Fund shares.
3 The investment manager recouped expenses previously reimbursed by the investment manager on behalf of the Fund, not to exceed the expense cap.
98
UBS U.S. Small Cap Growth Fund
Financial highlights
|
Class C |
|||||||||||||||||||||||
|
Year ended June 30, |
|||||||||||||||||||||||
|
2015 |
2014 |
2013 |
2012 |
2011 |
|||||||||||||||||||
|
Net asset value, beginning of year |
$ |
22.32 |
$ |
18.29 |
$ |
14.85 |
$ |
14.78 |
$ |
9.87 |
|||||||||||||
|
Income (loss) from investment operations: |
|||||||||||||||||||||||
|
Net investment (loss)1 |
(0.29 |
) |
(0.35 |
) |
(0.22 |
) |
(0.23 |
) |
(0.22 |
) |
|||||||||||||
|
Net realized and unrealized gain |
2.95 |
4.91 |
3.66 |
0.30 |
5.13 |
||||||||||||||||||
|
Total income from investment operations |
2.66 |
4.56 |
3.44 |
0.07 |
4.91 |
||||||||||||||||||
|
Less dividends/distributions: |
|||||||||||||||||||||||
|
From net realized gains |
(4.38 |
) |
(0.53 |
) |
— |
— |
— |
||||||||||||||||
|
Net asset value, end of year |
$ |
20.60 |
$ |
22.32 |
$ |
18.29 |
$ |
14.85 |
$ |
14.78 |
|||||||||||||
|
Total investment return2 |
14.71 |
% |
25.51 |
% |
22.83 |
% |
0.47 |
% |
49.75 |
% |
|||||||||||||
|
Ratios to average net assets: |
|||||||||||||||||||||||
|
Expenses before fee waivers and/or expense reimbursement |
2.24 |
% |
2.24 |
% |
2.32 |
% |
2.35 |
% |
2.37 |
% |
|||||||||||||
|
Expenses after fee waivers and/or expense reimbursement |
2.10 |
% |
2.15 |
% |
2.15 |
% |
2.15 |
% |
2.15 |
% |
|||||||||||||
|
Net investment loss |
(1.44 |
)% |
(1.67 |
)% |
(1.39 |
)% |
(1.68 |
)% |
(1.70 |
)% |
|||||||||||||
|
Supplemental data: |
|||||||||||||||||||||||
|
Net assets, end of year (000's) |
$ |
5,398 |
$ |
3,687 |
$ |
2,937 |
$ |
2,442 |
$ |
2,961 |
|||||||||||||
|
Portfolio turnover rate |
64 |
% |
57 |
% |
42 |
% |
48 |
% |
55 |
% |
|||||||||||||
See accompanying notes to financial statements.
99
The UBS Funds
Notes to financial statements
Organization and significant accounting policies
The UBS Funds (the "Trust") is registered with the US Securities and Exchange Commission ("SEC") under the Investment Company Act of 1940 (the "1940 Act"), as amended, as an open-end management investment company currently offering multiple series representing separate investment portfolios. The Trust is a Delaware statutory trust organized on August 13, 1993. The trustees of the Trust have the authority to issue an unlimited number of shares of beneficial interest at a par value of $0.001 per share.
The Trust has 13 Funds available for investment, each having its own investment objectives and policies. The following six funds are covered in this report: UBS Equity Long-Short Multi-Strategy Fund, UBS Global Sustainable Equity Fund, UBS U.S. Defensive Equity Fund, UBS U.S. Equity Opportunity Fund, UBS U.S. Large Cap Equity Fund, and UBS U.S. Small Cap Growth Fund (each a "Fund", and collectively, the "Funds").
Each of the Funds is classified as a "diversified" investment company for purposes of the 1940 Act. The Funds currently offer Class A, Class C and Class P shares. Effective July 28, 2014, Class Y shares were redesignated as Class P shares. Each class represents interests in the same assets of the applicable Fund and the classes are identical except for differences in their sales charge structures, ongoing distribution and service charges and certain transfer agency and related services expenses. All classes of shares have equal voting privileges except that each class has exclusive voting rights with respect to its distribution and/or service plan, if any. Class P shares have no distribution or service plan.
In the normal course of business, the Funds may enter into contracts that contain a variety of representations that provide general indemnification for certain liabilities. The Funds' maximum exposure under these arrangements is unknown, as this would involve future claims that may be made against the Funds that have not yet occurred. However, the Funds have not had any prior claims or losses pursuant to these contracts and expect the risk of loss to be remote.
Under certain circumstances, shareholders of the Funds may receive payment for redemptions in securities rather than in cash.
On January 5, 2015, a shareholder of the UBS U.S. Small Cap Growth Fund,which is a pension plan affiliated with the Advisor, received redemption proceeds of $71,312,188, consisting of portfolio securities valued at $70,260,945 and cash of $1,051,243. The Fund realized a gain of $18,810,041 as a result of the redemption, which is included in the Net realized gain (loss) on: Investments in unaffiliated issuers, within the Statement of operations.
The Trust accounts separately for the assets, liabilities and operations of each series. Expenses directly attributable to each series are charged to that series' operations; expenses which are applicable to all series are allocated among them on a pro rata basis.
The Financial Accounting Standards Board ("FASB") Accounting Standards Codification ("ASC") is the exclusive reference of authoritative US generally accepted accounting principles ("US GAAP") recognized by the FASB to be applied by nongovernmental entities. Rules and interpretive releases of the SEC under authority of federal laws are also sources of authoritative US GAAP for SEC registrants. The Funds' financial statements are prepared in accordance with US GAAP, which may require the use of management estimates and assumptions. Actual results could differ from those estimates. The following is a summary of significant accounting policies:
A. Valuation of investments: Each Fund calculates its net asset value on days that the New York Stock Exchange ("NYSE") is open. A Fund calculates net asset value separately for each class as of the close of regular trading on
100
The UBS Funds
Notes to financial statements
the NYSE (generally, 4:00 p.m., Eastern time). If trading on the NYSE is halted for the day before 4:00 p.m., Eastern time, a Fund's net asset value per share will be calculated as of the time trading was halted.
Each Fund calculates its net asset value based on the current market value, where available, for its portfolio securities. The Funds normally obtain market values for their investments from independent pricing sources and broker-dealers. Independent pricing sources may use reported last sale prices, official market closing prices, current market quotations or valuations from computerized "evaluation" systems that derive values based on comparable investments. An evaluation system incorporates parameters such as security quality, maturity and coupon, and/or research and evaluations by its staff, including review of broker-dealer market price quotations, if available, in determining the valuation of the portfolio investments. Investments also may be valued based on appraisals derived from information concerning the investment or similar investments received from recognized dealers in those holdings. Investments traded in the over-the-counter ("OTC") market and listed on The NASDAQ Stock Market, Inc. ("NASDAQ") normally are valued at the NASDAQ Official Closing Price. Other OTC securities are valued at the last bid price on the valuation date available prior to valuation. Investments which are listed on US and foreign stock exchanges normally are valued at the market closing price, the last sale price on the day the securities are valued or, lacking any sales on such day, at the last available bid price. Investments listed on foreign stock exchanges may be fair valued based on significant events that have occurred subsequent to the close of the foreign markets. In cases where investments are traded on more than one exchange, the investments are valued on the exchange designated as the primary market by UBS Global Asset Management (Americas) Inc. ("UBS Global AM" or the "Advisor"), the investment advisor of the Funds. UBS Global AM is an indirect asset management subsidiary of UBS Group AG. UBS Group AG is an internationally diversified organization with headquarters in Zurich, Switzerland. UBS Group AG operates in many areas of the financial services industry. If a market value is not readily available from an independent pricing source for a particular investment, that investment is valued at fair value determined in good faith by or under the direction of the Board. Various factors may be reviewed in order to make a good faith determination of an investment's fair value. These factors include, but are not limited to, fundamental analytical data relating to the investment; the nature and duration of restrictions on disposition of the investment; and the evaluation of forces which influence the market in which the investment is purchased and sold. Foreign currency exchange rates are generally determined as of the close of the NYSE.
Certain investments in which the Funds invest are traded in markets that close before 4:00 p.m., Eastern time. Normally, developments that occur between the close of the foreign markets and 4:00 p.m., Eastern time, will not be reflected in the Fund's net asset value. However, if any of the Funds determine that such developments are so significant that they will materially affect the value of the Fund's investments, the Fund may adjust the previous closing prices to reflect what is believed to be the fair value of these investments as of 4:00 p.m., Eastern time.
Certain Funds may use a systematic fair valuation model provided by an independent third party to value investments principally traded in foreign markets in order to adjust for possible stale pricing that may occur between the close of the foreign exchanges and the time for valuation. The systematic fair valuation model may use calculations based on indices of domestic securities and other appropriate indicators, such as prices of relevant ADRs and futures contracts. If an investment is valued at "fair value," that value is likely to be different from the last quoted market price for the investment. The use of the fair valuation model may result in securities being transferred between Level 1 and Level 2 of the fair valuation hierarchy at the end of the reporting period. Transfers between Level 1 and Level 2, if any, are disclosed near the end of each Fund's Portfolio of investments.
The amortized cost method of valuation, which approximates market value, generally is used to value short-term debt instruments with 60 days or less remaining to maturity, unless the Board determines that this does not represent fair value. Investments in open-end investment companies are valued at the daily closing net asset value of the respective investment company. Pursuant to the Funds' use of the practical expedient within ASC Topic 820, investments in non-registered investment companies are also valued at the daily net asset value. All investments
101
The UBS Funds
Notes to financial statements
quoted in foreign currencies are valued daily in US dollars on the basis of the foreign currency exchange rates prevailing at the time such valuation is determined by the Funds' custodian.
Futures contracts are generally valued at the settlement price established each day on the exchange on which they are traded. Forward foreign currency contracts are valued daily using forward exchange rates quoted by independent pricing services.
Swaps are marked-to-market daily based upon values from third party vendors or quotations from market makers to the extent available, and the change in value, if any, is recorded as an unrealized gain or loss on the Statement of assets and liabilities. In the event that market quotations are not readily available or deemed unreliable, the swap is valued at fair value as determined in good faith by or under the direction of the Board.
The Board has delegated to the UBS Global AM Global Valuation Committee ("GVC") the responsibility for making fair value determinations with respect to the Funds' portfolio holdings. The GVC is comprised of representatives of management.
The GVC provides reports to the Board at each quarterly meeting regarding any investments that have been fair valued, valued pursuant to standing instructions approved by the GVC, or where non-vendor pricing sources had been used to make fair value determinations when sufficient information exists during the prior quarter. Fair valuation determinations are subject to review at least monthly by the GVC during scheduled meetings. Pricing decisions, processes, and controls over fair value determinations are subject to internal and external reviews, including annual internal compliance reviews and periodic internal audit reviews.
The types of investments for which such fair value pricing may be necessary include, but are not limited to: foreign investments under some circumstances, investments of an issuer that has entered into a restructuring; investments whose trading has been halted or suspended; fixed income securities that are in default and for which there is no current market value quotation; and investments that are restricted as to transfer or resale. The need to fair value a Fund's portfolio investments may also result from low trading volume in foreign markets or thinly traded domestic investments, and when a security that is subject to a trading limit or collar on the exchange or market on which it is primarily traded reaches the "limit up" or "limit down" price and no trading has taken place at that price. Various factors may be reviewed in order to make a good faith determination of an investment's fair value. These factors include, but are not limited to, fundamental analytical data relating to the investment; the nature and duration of restrictions on disposition of the investment; and the evaluation of forces which influence the market in which the investment is purchased and sold. Valuing investments at fair value involves greater reliance on judgment than valuing investments that have readily available market quotations. Fair value determinations can also involve reliance on quantitative models employed by a fair value pricing service.
US GAAP requires disclosure regarding the various inputs that are used in determining the value of the Funds' investments. These inputs are summarized into the three broad levels listed below:
Level 1—Unadjusted quoted prices in active markets for identical investments.
Level 2—Other significant observable inputs, including but not limited to, quoted prices for similar investments, interest rates, prepayment speeds and credit risk.
Level 3—Unobservable inputs inclusive of the Funds' own assumptions in determining the fair value of investments.
A fair value hierarchy has been included near the end of each Fund's Portfolio of investments.
102
The UBS Funds
Notes to financial statements
In June 2014, FASB issued Accounting Standards Update No. 2014-11, Transfers & Servicing (Topic 860): "Repurchase-to-Maturity Transactions, Repurchase Financings, and Disclosures" ("ASU 2014-11") to improve the financial reporting of reverse repurchase agreements and other similar transactions. ASU 2014-11 includes expanded disclosure requirements for entities that enter into reverse repurchase agreements and similar transactions accounted for as secured borrowings. ASU 2014-11 is effective for annual reporting periods beginning after December 15, 2014 and interim periods within those fiscal periods. Management is currently evaluating the implications of these changes and their impact on the financial statements and disclosures.
In May 2015, the FASB issued Accounting Standards Update No. 2015-07, Fair Value Measurement (Topic 820): "Disclosures for Investments in Certain Entities That Calculate Net Asset Value per Share (or Its Equivalent)" ("ASU 2015-07"). The modification removes the requirement to categorize within the fair value hierarchy all investments for which fair value is measured using the NAV per share practical expedient. ASU 2015-07 is effective for annual reporting periods beginning after December 15, 2015 and interim periods within those fiscal periods. Management is currently evaluating the implications of these changes and their impact on the financial statements and disclosures.
The provisions of ASC Topic 815 "Derivatives and Hedging" ("ASC Topic 815") require qualitative disclosures about objectives and strategies for using derivatives, quantitative disclosures about fair value amounts of gains and losses on derivative instruments and disclosures about credit-risk related contingent features in derivative agreements. Since investment companies value their derivatives at fair value and recognize changes in fair value through the Statement of operations, they do not qualify for hedge accounting under ASC Topic 815. Accordingly, even though a Fund's investments in derivatives may represent economic hedges, they are considered to be non-hedge transactions for purposes of disclosure under ASC Topic 815. ASC Topic 815 requires that (1) objectives for using derivative instruments be disclosed in terms of underlying risk and accounting designation, (2) the fair values of derivative instruments and their gains and losses be disclosed in a tabular format, and (3) information be disclosed about credit-risk contingent features of derivatives contracts. Details of this disclosure can be found below as well as in the Portfolio of investments. Forward foreign currency contracts entered into by a Fund may contain credit-risk related contingent features that could be triggered subject to certain circumstances. Such circumstances include agreed upon net asset value thresholds. If triggered, the derivative counterparty could request additional cash margin and/or terminate the derivative contract. The aggregate fair value of the derivative contracts that are in a net liability position that contain these triggers can be found in the Portfolio of investments. The aggregate fair value of assets that are already posted as collateral as of June 30, 2015 is reflected in the Statement of assets and liabilities. If the applicable credit-risk related contingent features were triggered as of June 30, 2015, the Fund would be required to post additional collateral or may be required to terminate the contracts and settle any amounts outstanding. The volume of derivatives as disclosed in each Fund's Portfolio of investments is representative of the volume of derivatives outstanding during the year ended June 30, 2015.
Disclosure of derivatives by underlying risk as of and for the year ended June 30, 2015 is as follows:
Asset derivatives1
|
|
Foreign exchange risk |
Total |
|||||||||||||
|
UBS Equity Long-Short Multi-Strategy Fund |
|||||||||||||||
|
Forward foreign currency contracts |
$ |
10,734 |
$ |
10,734 |
|||||||||||
|
Total value |
$ |
10,734 |
$ |
10,734 |
|||||||||||
103
The UBS Funds
Notes to financial statements
Liability derivatives2
|
Equity risk |
Foreign exchange risk |
Total |
|||||||||||||
|
UBS Equity Long-Short Multi-Strategy Fund |
|||||||||||||||
|
Forward foreign currency contracts |
$ |
— |
$ |
(19,653 |
) |
$ |
(19,653 |
) |
|||||||
|
Swap agreements |
(71,595 |
) |
— |
(71,595 |
) |
||||||||||
|
Total value |
$ |
(71,595 |
) |
$ |
(19,653 |
) |
$ |
(91,248 |
) |
||||||
1 In the Statement of assets and liabilities, forward foreign currency contracts are showing using unrealized appreciation.
2 In the Statement of assets and liabilities, swap agreements are shown at value, while foreign forward currency contracts are shown using unrealized depreciation.
Activities in derivative instruments during the year ended June 30, 2015 were as follows:
|
Equity risk |
Foreign exchange risk |
Total |
|||||||||||||
|
UBS Equity Long-Short Multi-Strategy Fund |
|||||||||||||||
|
Net realized gain (loss)1 |
|||||||||||||||
|
Forward foreign currency contracts |
$ |
— |
$ |
47,380 |
$ |
47,380 |
|||||||||
|
Futures contracts |
(40,720 |
) |
— |
(40,720 |
) |
||||||||||
|
Swap agreements |
238,053 |
— |
238,053 |
||||||||||||
|
Total net realized gain |
$ |
197,333 |
$ |
47,380 |
$ |
244,713 |
|||||||||
|
Change in net unrealized appreciation/depreciation2 |
|||||||||||||||
|
Forward foreign currency contracts |
$ |
— |
$ |
20,263 |
$ |
20,263 |
|||||||||
|
Swap agreements |
(137,291 |
) |
— |
(137,291 |
) |
||||||||||
|
Total change in net unrealized appreciation/depreciation |
$ |
(137,291 |
) |
$ |
20,263 |
$ |
(117,028 |
) |
|||||||
1 Statement of operations location: Net realized gain (loss) on futures contracts, swap agreements and forward foreign currency contracts, unless otherwise noted.
2 Statement of operations location: Change in net unrealized appreciation/depreciation on swap agreements and forward foreign currency contracts.
The Funds typically enter into International Swaps and Derivatives Association, Inc. Master Agreements ("ISDA Master Agreements") or similar master agreements (collectively, "Master Agreements") with its OTC derivative contract counterparties in order to, among other things, reduce its credit risk to counterparties. ISDA Master Agreements include provisions for general obligations, representations, collateral and events of default or termination. Under an ISDA Master Agreement, the Funds typically may offset with the counterparty certain derivative financial instrument's payables and/or receivables with collateral held and/or posted and create one single net payment (close-out netting) in the event of default or termination.
The provisions of ASC Topic 210 "Disclosures about Offsetting Assets and Liabilities" require disclosure on the offsetting of financial assets and liabilities. The offsetting disclosures are limited to derivatives, repurchase and reverse repurchase agreements, and security lending and borrowing transactions to the extent that they are (1) offset in the financial statements or (2) subject to an enforceable master netting arrangement ("MNA") or similar agreement. Tables are not presented below for any funds which only hold derivatives which are not subject to offsetting under ASC Topic 210.
104
The UBS Funds
Notes to financial statements
UBS Equity Long-Short Multi-Strategy Fund
|
Assets ($) |
Liabilities ($) |
||||||||||
|
Derivative financial instruments: |
|||||||||||
|
Forward foreign currency contracts |
10,734 |
(19,653 |
) |
||||||||
|
Swap agreements |
— |
(71,595 |
) |
||||||||
|
Total gross amount of derivative assets and liabilities in the Statement of assets and liabilities |
10,734 |
(91,248 |
) |
||||||||
|
Derivatives not subject to a master netting agreement or similar agreement ("MNA") |
— |
— |
|||||||||
|
Total gross amount of assets and liabilities subject to MNA or similar agreements |
10,734 |
(91,248 |
) |
||||||||
The following tables present the Fund's derivative assets and liabilities by counterparty net of amounts available for offset under a MNA and net of the related collateral received/pledged by the Fund as of June 30, 2015.
|
Counterparty |
Gross amount of assets ($) |
Financial instruments and derivatives available for offset ($) |
Collateral received ($) |
Net amount of assets ($) |
|||||||||||||||
|
JPMCB |
10,734 |
(10,734 |
) |
— |
— |
||||||||||||||
|
Total |
10,734 |
(10,734 |
) |
— |
— |
||||||||||||||
|
Counterparty |
Gross amount of liabilities ($) |
Financial instruments and derivatives available for offset ($) |
Collateral pledged ($) |
Net amount of liabilities ($) |
|||||||||||||||
|
CSI |
(71,595 |
) |
— |
— |
(71,595 |
) |
|||||||||||||
|
JPMCB |
(19,653 |
) |
10,734 |
— |
(8,919 |
) |
|||||||||||||
|
Total |
(91,248 |
) |
10,734 |
— |
(80,514 |
) |
|||||||||||||
B. Restricted securities: The Funds may invest in securities that are subject to legal or contractual restrictions on resale. These securities generally may be resold in transactions exempt from registration or to the public if the securities are registered. Disposal of these securities may involve time consuming negotiations and expenses, and prompt sale at an acceptable price may be difficult. Information regarding restricted securities, if any, is included in each Fund's Portfolio of investments footnotes.
C. Investment transactions, investment income and expenses: Investment transactions are recorded on the trade date. Realized gains and losses from investment and foreign exchange transactions are calculated using the identified cost method. Dividend income and expenses are recorded on the ex-dividend date ("ex-date") except in the case of certain dividends from foreign securities which are recorded as soon after the ex-date as the respective Fund, using reasonable diligence, becomes aware of such dividends. Interest income is recorded on an accrual basis. Discounts are accreted and premiums are amortized as adjustments to interest income and the identified cost of investments.
Income, expenses (excluding class-specific expenses) and realized/unrealized gains/losses are allocated proportionately to each class of shares based upon the relative net asset value of outstanding shares (or the value of dividend eligible shares, as appropriate) of each class at the beginning of the day after adjusting for current capital share activity of the respective classes. Class specific expenses are charged directly to the applicable class of shares.
D. Foreign currency translation: The Funds use the foreign currency exchange rates determined as of the close of regular trading on the NYSE. For purposes of calculating the US dollar equivalent value of a non US dollar denominated obligation, foreign currency amounts are translated into US dollars on the following basis: (1) market value of investment securities and other assets and liabilities—at the exchange rates prevailing at the end of each
105
The UBS Funds
Notes to financial statements
Fund's fiscal period; and (2) purchases and sales of investment securities and income and expenses—at the rates of exchange prevailing on the respective dates of such transactions.
Although the net assets and the market value of each Fund's portfolio are presented at the foreign exchange rates at the end of each Fund's fiscal period, the Funds do not generally isolate the effect of fluctuations in foreign exchange rates from the effect of the changes in market prices of securities. However, the Funds do isolate the effect of fluctuations in foreign exchange rates when determining the realized gain or loss upon the sale or maturity of foreign currency-denominated securities pursuant to US federal income tax regulations. Certain foreign exchange gains and losses included in realized and unrealized gains and losses are included in or are a reduction of ordinary income in accordance with US federal income tax regulations.
E. Portfolio swap: UBS Equity Long-Short Multi-Strategy Fund entered into a portfolio swap agreement to obtain exposure to a portfolio of long and short securities. This is a highly specialized activity and a significant aspect of the Fund's investment strategy.
Under the terms of the agreement, the swap is designed to function as a portfolio of direct investments in long and short equity positions. This means that the Fund has the ability to trade in and out of long and short positions within the swap and will receive all of the economic benefits and risks equivalent to direct investments in these positions such as: capital appreciation (depreciation), corporate actions and dividends received and paid, all of which are reflected in the swap value. The swap value also includes interest charges and credits related to the notional values of the long and short positions and cash balances within the swap. These interest charges and credits are based on defined market rates plus or minus a specified spread and are referred to herein as "financing costs". Positions within the swap are reset periodically, usually annually and financing costs are reset monthly. During a reset, any unrealized gains (losses) on positions and accrued financing costs become available for cash settlement between the Fund and the swap counterparty. Cash settlement in and out of the swap may occur at a reset date or any other date, at the discretion of the Fund and counterparty, over the life of the agreement, and is generally determined based on limits and thresholds established at both the Fund and counterparty.
The swap involves additional risks than if the Fund had invested in the underlying positions directly including: the risk that changes in the value of the swap may not correlate perfectly with the underlying long and short securities; credit risk related to the counterparty's failure to perform under contract terms; liquidity risk related to the lack of a liquid market for the swap contract, which may limit the ability of the Fund to close out its position(s); and, documentation risk relating to disagreement over contract terms. The Fund's activities in the portfolio swap are currently concentrated with a single highly rated counterparty. Investing in swaps results in a form of leverage (i.e., the Fund's risk of loss associated with these instruments may exceed their value as recorded on the Statement of assets and liabilities).
The value of the swap is derived from a combination of (i) the net value of the underlying positions, which are valued daily using the last sale or closing prices on the principal exchange on which the securities are traded; (ii) financing costs; (iii) the value of dividends; (iv) cash balances within the swap; and (v) other factors, as applicable. The value of the swap is recognized as changes in unrealized appreciation or depreciation in the Statement of operations.
Cash settlements between the Fund and counterparty are recognized as realized gains or losses in the Statement of operations.
F. Forward foreign currency contracts: A forward foreign currency contract is a commitment to purchase or sell a foreign currency at a future date at a negotiated forward rate. Risks associated with such contracts include
106
The UBS Funds
Notes to financial statements
movement in the value of the foreign currency relative to the US dollar and the potential inability of the counterparty to meet the terms of the contract. The Funds may purchase or sell currencies and/or engage in forward foreign currency transactions in order to expedite settlement of portfolio transactions, manage currency risk or to gain exposure to a currency without purchasing securities denominated in that currency. Forward foreign currency contracts involve, to varying degrees, elements of market risk (specifically foreign currency risk).
A Fund will enter into forward contracts to sell, for a fixed amount of US dollars or other appropriate currency, an amount of foreign currency, to the extent that the value of the short forward contract is covered by the underlying value of securities denominated in the currency being sold. Alternatively, when a Fund enters into a non-cash settled forward contract to sell an amount of foreign currency, the Fund's custodian or sub-custodian will place assets in a segregated account of the Fund in an amount equal to the contract's full notional value. However, currency contracts with respect to identical currencies may be netted against each other and, in such cases, a Fund's custodian or sub-custodian will place assets in a segregated account of the Fund, in an amount equal to the net amount owed (the unrealized loss) by a Fund. If the assets placed in the account decline in value, additional cash or securities will be placed in the account on a daily basis so that the value of the account will equal the amount of a Fund's commitments with respect to such contracts.
The unrealized gain, if any, represents the credit risk to each Fund on a forward foreign currency contract. Fluctuations in the value of the open forward foreign currency contracts are recorded daily for book purposes as unrealized gains or losses on foreign forward currency contracts by the Funds. Realized gains and losses include net gains and losses recognized by each Fund on contracts which have been sold or matured.
G. Futures contracts: Each Fund may purchase or sell financial futures contracts. The Funds may purchase or sell futures contracts to increase or reduce their exposure to an asset class without purchasing or selling the underlying securities, either as a hedge or to enhance income or realize gains. Using financial futures contracts involves various market risks, including interest rate and equity risk. Risks of entering into futures contracts include the possibility that there may be an illiquid market or that a change in the value of the contract may not correlate with changes in the value of the underlying securities. To the extent that market prices move in an unexpected direction, there is a risk that a Fund will not achieve the anticipated benefits of the futures contract or may realize a loss.
Upon entering into a futures contract, a Fund is required to deliver to a broker an amount of cash and/or securities equal to a certain percentage of the contract amount. This amount is known as the "initial margin". Subsequent payments, known as "variation margin", are made or received by a Fund each day, depending on the daily fluctuations in the value of the underlying futures contracts. Such variation margin is recorded for financial statement purposes on a daily basis as an unrealized gain or loss on futures until the futures contract is closed or expires, at which time the net gain or loss is reclassified to realized gain or loss on futures.
H. Option writing: Certain Funds may write (sell) put and call options on foreign or US securities, indices, foreign currencies and interest rate swaps (commonly referred to as swaptions), in order to gain exposure to or protect against changes in the markets or in an attempt to enhance income or gains. When a Fund writes a call or a put option, an amount equal to the premium received by the Fund is included in the Fund's Statement of assets and liabilities as an asset and as an equivalent liability. The amount of the liability is subsequently marked-to-market to reflect the current market value of the option written. If an option which a Fund has written either expires on its stipulated expiration date or the Fund enters into a closing purchase transaction, the Fund realizes a gain (or a loss if the cost of a closing purchase transaction exceeds the premium received when the option was written) without regard to any unrealized gain or loss on the underlying security or derivative instrument, and the liability related to such option is extinguished. If a call option which a Fund has written is exercised, the Fund recognizes a realized gain or loss (long-term or short-term, depending on the holding period of the underlying security) from the sale of the underlying security or derivative instrument and the proceeds from the sale are increased by the premium
107
The UBS Funds
Notes to financial statements
originally received. If a put option which a Fund has written is exercised, the amount of the premium originally received reduces the cost of the security or derivative instrument which the Fund purchases upon exercise of the option.
In writing an option, a Fund bears the market risk of an unfavorable change in the price of the derivative instrument, security, index or currency underlying the written option. Exercise of an option written by a Fund could result in the Fund selling or buying a derivative instrument, security or currency at a price different from current market value.
In the normal course of trading activities, the Funds trade and hold certain fair valued derivative contracts that constitute guarantees. Such contracts include written put options, where a Fund would be obligated to purchase securities at specified prices (i.e. the options are exercised by the counterparties). The maximum payout for UBS U.S. Defensive Equity Fund's written put options is $14,141,000 at June 30, 2015.
I. Short sales: UBS Equity Long-Short Multi-Strategy Fund, UBS U.S. Defensive Equity Fund and UBS U.S. Small Cap Growth Fund may each enter into short sales whereby it sells a security it generally does not own, in anticipation of a decline in the security's price. The initial amount of a short sale is recorded as a liability which is marked to market daily. Fluctuations in the value of this liability are recorded as unrealized gains or losses in the Statement of operations. If a Fund shorts a security while holding a long position in the security (a "short against the box"), as the security price declines, the short position increases in value, offsetting the long position's decrease in value. The opposite effect occurs if the security price rises. A Fund will realize a gain or loss upon closing of the short sale (returning the security to the lender by way of purchase or delivery of a long position owned). A Fund is liable to the lender for any dividends payable on securities while those securities are in a short position. These dividends are booked as an expense or liability of the Fund. Each Fund segregates collateral consisting of cash, US government securities or other liquid assets sufficient to collateralize the market value of short positions. Each Fund is charged a securities loan fee in connection with short sale transactions. Due to the independence of portfolio management teams that manage the various Fund components, it is likely that UBS Equity Long-Short Multi-Strategy Fund will, at times, hold the same security both long and short (which may technically result in a "short against the box"). There were no short sale transactions for UBS U.S. Small Cap Growth Fund during the year ended June 30, 2015.
J. Dividends and distributions: It is each Fund's policy to distribute its respective net investment income and net capital gains, if any, annually. Dividends and distributions to shareholders are recorded on the ex-distribution date. The amount of dividends from net investment income and distributions from net realized capital gains and/or return of capital is determined in accordance with US federal income tax regulations, which may differ from US GAAP. These "book/tax" differences are either considered temporary or permanent in nature. To the extent these differences are permanent in nature, such amounts are reclassified within the capital accounts based on their federal tax-basis treatment; temporary differences do not require reclassification.
K. Concentration of risk: Investing in securities of foreign issuers and currency transactions may involve certain considerations and risks not typically associated with investments in the United States. These risks include revaluation of currencies, adverse fluctuations in foreign currency values and possible adverse political, social and economic developments, including those particular to a specific industry, country or region, which could cause the securities and their markets to be less liquid and prices more volatile than those of comparable US companies and US government securities. These risks are greater with respect to securities of issuers located in emerging market countries in which the Funds invest.
Small capitalization ("small cap") companies may be more vulnerable than larger capitalization ("large cap") companies to adverse business or economic developments. Small cap companies may also have limited product lines, markets or financial resources, and may be dependent on a relatively small management group. Securities of
108
The UBS Funds
Notes to financial statements
such companies may be less liquid and more volatile than securities of large cap companies. In addition, small cap companies may not be well-known to the investing public, may not have institutional ownership and may have only cyclical, static or moderated growth prospects.
The ability of the issuers of debt securities held by a Fund to meet their obligations may be affected by economic and political developments particular to a specific industry, country, state or region.
L. Commission recapture program: The Funds participate in a brokerage commission recapture program. The Funds have established commission recapture arrangements with certain participating brokers or dealers. If a Fund's investment manager chooses to execute a transaction through a participating broker subject to best price and execution, the broker will rebate a portion of the commission back to the Fund. Any collateral benefit received through participation in the commission recapture program is directed exclusively to the Fund. For the year ended June 30, 2014, the following Funds recorded recaptured commissions which are reflected in the Statement of operations within the net realized gains (losses) on investments in unaffiliated issuers:
|
Fund |
Amount |
||||||
|
UBS U.S. Defensive Equity Fund |
$ |
292 |
|||||
|
UBS U.S. Equity Opportunity Fund |
1,415 |
||||||
|
UBS U.S. Large Cap Equity Fund |
5,777 |
||||||
M. Redemption fees: Each class of each series of The UBS Funds will impose a 1% redemption fee on shares sold or exchanged within 90 days of their purchase date, subject to limited exceptions. This amount is paid to the applicable Fund, not the Advisor or UBS Global Asset Management (US) Inc., ("UBS Global AM (US)"). The redemption fees retained by the Funds are disclosed in the Statement of changes in net assets. For the year ended June 30, 2015, redemption fees for each Fund amounted to less than $0.01 per share and less than 0.01% of average net assets.
Effective February 17, 2015, for purchases of shares on or after that date, the redemption fee will be calculated as a percentage of the amount redeemed within 30 days of purchase, if applicable. Effective August 3, 2015, for purchases of shares on or after that date, the redemption fee will be eliminated.
2. Investment advisory fees and other transactions with affiliates
The Advisor, a registered investment advisor, provides the Funds with investment management services. As compensation for these services, each Fund pays the Advisor a monthly fee, accrued daily and paid monthly, based on each Fund's respective average daily net assets in accordance with the following per annum schedule:
|
Fund |
$0 to $500 mm |
$500 mm to $1.0 billion |
$1.0 billion to $1.5 billion |
$1.5 billion to $2.0 billion |
$2.0 billion and over |
||||||||||||||||||
|
UBS Equity Long-Short Multi-Strategy Fund |
1.250 |
% |
1.250 |
% |
1.250 |
% |
1.250 |
% |
1.250 |
% |
|||||||||||||
|
UBS Global Sustainable Equity Fund |
0.800 |
0.750 |
0.700 |
0.675 |
0.650 |
||||||||||||||||||
|
UBS U.S. Defensive Equity Fund |
1.000 |
0.900 |
0.850 |
0.850 |
0.850 |
||||||||||||||||||
|
UBS U.S. Equity Opportunity Fund |
0.700 |
0.650 |
0.600 |
0.575 |
0.550 |
||||||||||||||||||
|
UBS U.S. Large Cap Equity Fund |
0.700 |
0.650 |
0.600 |
0.575 |
0.550 |
||||||||||||||||||
|
UBS U.S. Small Cap Growth Fund |
0.850 |
0.850 |
0.825 |
0.825 |
0.825 |
||||||||||||||||||
For UBS Global Sustainable Equity Fund, UBS U.S. Equity Opportunity Fund and UBS U.S. Large Cap Equity Fund, the Advisor has agreed to waive its fees and/or reimburse expenses (excluding expenses incurred through
109
The UBS Funds
Notes to financial statements
investment in other investment companies, interest, taxes, brokerage commissions and extraordinary expenses) to the extent necessary so that the Fund's operating expenses (excluding expenses incurred through investment in other investment companies, interest, taxes, brokerage commissions and extraordinary expenses) do not exceed the expense limit of each class of shares as indicated in the following table. For UBS Equity Long-Short Multi-Strategy Fund and UBS U.S. Defensive Equity Fund, the Advisor has agreed to waive its fees and/or reimburse expenses (excluding expenses incurred through investment in other investment companies, interest, taxes, brokerage commissions, extraordinary expenses and dividend expense and security loan fees for securities sold short) to the extent necessary so that each Fund's operating expenses (excluding expenses incurred through investment in other investment companies, interest, taxes, brokerage commissions, extraordinary expenses and dividend expense and security loan fees for securities sold short) do not exceed the expense limit of each class of shares as indicated in the following table. Investment advisory fees, including the dollar amount waived or reimbursed, for the year ended June 30, 2015, were as follows:
|
Fund |
Class A expense cap |
Class C expense cap |
Class P expense cap |
Amount due to or (due from) Advisor |
Advisory fees incurred |
Fees waived/ expenses reimbursed |
|||||||||||||||||||||
|
UBS Equity Long-Short Multi-Strategy Fund |
1.75 |
% |
2.50 |
% |
1.50 |
% |
$ |
(36,096 |
) |
$ |
208,980 |
$ |
330,249 |
||||||||||||||
|
UBS Global Sustainable Equity Fund |
1.25 |
2.00 |
1.00 |
(20,788 |
) |
183,747 |
278,837 |
||||||||||||||||||||
|
UBS U.S. Defensive Equity Fund |
1.50 |
2.25 |
1.25 |
(24,851 |
) |
160,980 |
256,526 |
||||||||||||||||||||
|
UBS U.S. Equity Opportunity Fund |
1.20 |
1.95 |
0.95 |
(9,465 |
) |
316,810 |
236,115 |
||||||||||||||||||||
|
UBS U.S. Large Cap Equity Fund |
1.20 |
1.95 |
0.95 |
3,570 |
638,715 |
137,440 |
|||||||||||||||||||||
|
UBS U.S. Small Cap Growth Fund |
1.24 |
1.99 |
0.99 |
111,986 |
1,965,857 |
123,737 |
|||||||||||||||||||||
For U.S. Small Cap Growth, the Advisor has agreed to waive its fees and/or reimburse expenses (excluding expenses incurred through investment in other investment companies, interest, taxes, brokerage commissions, extraordinary expenses, and dividend expense and security loan fees for securities sold short) to the extent necessary so the Fund's operating expenses do not exceed the amounts above. Prior to March 27, 2015, the fees were not to exceed 1.40% for Class A shares, 2.15% for Class C shares and 1.15% for Class P shares
Each Fund, except for UBS Global Sustainable Equity Fund, will reimburse the Advisor for expenses it waives or reimburses for a period of three years following such expense waivers or reimbursements, provided that the reimbursement by a Fund of the Advisor will not cause the total operating expense ratio to exceed the contractual limit as then may be in effect for the Fund. The expenses waived or reimbursed for the year ended June 30, 2015 are subject to repayment through June 30, 2018. At June 30, 2015, the following Funds had remaining fee waivers and expense reimbursements subject to repayment to the Advisor and respective dates of expiration as follows:
|
Fund |
Fee waivers/ expense reimbursements subject to repayment |
Expires June 30, 2016 |
Expires June 30, 2017 |
Expires June 30, 2018 |
|||||||||||||||
|
UBS Equity Long-Short Multi-Strategy Fund—Class A |
$ |
88,626 |
$ |
49,550 |
$ |
27,163 |
$ |
11,913 |
|||||||||||
|
UBS Equity Long-Short Multi-Strategy Fund—Class C |
26,345 |
10,033 |
6,385 |
9,927 |
|||||||||||||||
|
UBS Equity Long-Short Multi-Strategy Fund—Class P |
861,615 |
324,409 |
228,797 |
308,409 |
|||||||||||||||
|
UBS U.S. Defensive Equity Fund—Class A |
495,904 |
184,778 |
161,307 |
149,819 |
|||||||||||||||
|
UBS U.S. Defensive Equity Fund—Class C |
140,301 |
57,542 |
44,344 |
38,415 |
|||||||||||||||
|
UBS U.S. Defensive Equity Fund—Class P |
175,427 |
66,089 |
41,046 |
68,292 |
|||||||||||||||
110
The UBS Funds
Notes to financial statements
|
Fund |
Fee waivers/ expense reimbursements subject to repayment |
Expires June 30, 2016 |
Expires June 30, 2017 |
Expires June 30, 2018 |
|||||||||||||||
|
UBS U.S. Equity Opportunity Fund—Class A |
$ |
620,871 |
$ |
222,296 |
$ |
198,607 |
$ |
199,968 |
|||||||||||
|
UBS U.S. Equity Opportunity Fund—Class C |
74,148 |
26,132 |
24,001 |
24,015 |
|||||||||||||||
|
UBS U.S. Equity Opportunity Fund—Class P |
29,553 |
9,566 |
7,855 |
12,132 |
|||||||||||||||
|
UBS U.S. Large Cap Equity Fund—Class A |
49,332 |
8,181 |
7,993 |
33,158 |
|||||||||||||||
|
UBS U.S. Large Cap Equity Fund—Class C |
15,640 |
2,443 |
3,730 |
9,467 |
|||||||||||||||
|
UBS U.S. Large Cap Equity Fund—Class P |
196,378 |
46,013 |
55,550 |
94,815 |
|||||||||||||||
|
UBS U.S. Small Cap Growth Fund—Class A |
128,167 |
48,524 |
20,513 |
59,130 |
|||||||||||||||
|
UBS U.S. Small Cap Growth Fund—Class C |
12,827 |
4,478 |
2,856 |
5,493 |
|||||||||||||||
|
UBS U.S. Small Cap Growth Fund—Class P |
59,114 |
— |
— |
59,114 |
|||||||||||||||
Each Fund pays UBS Global AM a monthly administration fee that is accrued daily and paid monthly at an annual rate of 0.075% of the average daily net assets of such Fund. For the year ended June 30, 2015, the Funds owed and incurred administrative fees as follows:
|
Fund |
Administrative fees owed |
Administrative fees incurred |
|||||||||
|
UBS Equity Long-Short Multi-Strategy Fund |
$ |
2,208 |
$ |
12,574 |
|||||||
|
UBS Global Sustainable Equity Fund |
3,236 |
17,278 |
|||||||||
|
UBS U.S. Defensive Equity Fund |
2,186 |
12,108 |
|||||||||
|
UBS U.S. Equity Opportunity Fund |
5,876 |
34,040 |
|||||||||
|
UBS U.S. Large Cap Equity Fund |
5,259 |
68,518 |
|||||||||
|
UBS U.S. Small Cap Growth Fund |
28,059 |
173,815 |
|||||||||
The Funds may invest in certain affiliated investment companies also advised or managed by the Advisor. Investments in affiliated investment companies for the year ended June 30, 2015 have been included near the end of each Fund's Portfolio of investments.
The Funds may invest in UBS Cash Management Prime Relationship Fund ("Cash Prime"). Cash Prime is offered as a cash management option only to mutual funds and certain other accounts. Distributions received from Cash Prime are reflected as affiliated income in the Statement of operations. Amounts relating to those investments at June 30, 2015 and for the year ended have been included near the end of each Fund's Portfolio of investments.
Under normal conditions, the Funds invest cash collateral from securities lending activities into an affiliated private money market fund, UBS Private Money Market Fund LLC ("Private Money Market"), which operates in compliance with most of the substantive provisions of Rule 2a-7 of the 1940 Act. Private Money Market is managed by the Advisor and is offered as a cash management option only to mutual funds and certain other accounts managed by the Advisor. UBS Global AM acts as managing member and receives a management fee from Private Money Market payable monthly in arrears at the annual rate of 0.10% of Private Money Market's average daily members' equity, minus the aggregate operating expenses of, and incurred by, Private Money Market during each such related month, not including investment expenses (including brokerage commissions, taxes, interest charges and other costs with respect to transactions in securities) and extraordinary expenses including litigation expenses, if any. The Advisor may, in its sole discretion, waive all or any portion of the management fee to which it may be entitled from time to time in order to maintain operating expenses at a certain level. Distributions received from Private Money Market, net of fee rebates paid to borrowers, are reflected as securities lending income in the Statement of operations. Amounts relating to those investments at June 30, 2015 and for the year ended have been included near the end of each Fund's Portfolio of investments.
111
The UBS Funds
Notes to financial statements
The following Funds have incurred brokerage commissions with UBS AG, an affiliated broker-dealer. Amounts relating to those transactions for the year ended June 30, 2015, were as follows:
|
Fund |
UBS AG |
||||||
|
UBS Equity Long-Short Multi-Strategy Fund |
$ |
3,520 |
|||||
|
UBS Global Sustainable Equity Fund |
1,295 |
||||||
|
UBS U.S. Defensive Equity Fund |
309 |
||||||
|
UBS U.S. Equity Opportunity Fund |
157 |
||||||
|
UBS U.S. Large Cap Equity Fund |
163 |
||||||
3. Distribution and service plans
UBS Global AM (US) is the principal underwriter of each Fund's shares. The Trust has adopted distribution and/or service plans (the "Plans") pursuant to Rule 12b-1 under the 1940 Act for Class A and Class C. The Plans govern payments made for the expenses incurred in the service and/or distribution of Class A and Class C. Annual fees under the Plans as a percentage of the average daily net assets of each representative class of each of the Funds are as follows:
|
Fund |
Class A |
Class C |
|||||||||
|
UBS Equity Long-Short Multi-Strategy Fund |
0.25 |
% |
1.00 |
% |
|||||||
|
UBS Global Sustainable Equity Fund |
0.25 |
1.00 |
|||||||||
|
UBS U.S. Defensive Equity Fund |
0.25 |
1.00 |
|||||||||
|
UBS U.S. Equity Opportunity Fund |
0.25 |
1.00 |
|||||||||
|
UBS U.S. Large Cap Equity Fund |
0.25 |
1.00 |
|||||||||
|
UBS U.S. Small Cap Growth Fund |
0.25 |
1.00 |
|||||||||
UBS Global AM (US) also receives the proceeds of the initial sales charges paid upon purchases of Class A shares and the contingent deferred sales charges paid by shareholders upon certain redemptions of Class A and Class C. At June 30, 2015, certain Funds owed UBS Global AM (US) distribution and service fees, and for the year ended June 30, 2015, certain Funds were informed by UBS Global AM (US) that it had earned sales charges as follows:
|
Fund |
Distribution and service fees owed |
Sales charges earned |
|||||||||
|
UBS Equity Long-Short Multi-Strategy Fund—Class A |
$ |
124 |
$ |
6,000 |
|||||||
|
UBS Equity Long-Short Multi-Strategy Fund—Class C |
396 |
— |
|||||||||
|
UBS Global Sustainable Equity Fund—Class A |
1,235 |
68,200 |
|||||||||
|
UBS Global Sustainable Equity Fund—Class C |
2,271 |
— |
|||||||||
|
UBS U.S. Defensive Equity Fund—Class A |
2,044 |
8,899 |
|||||||||
|
UBS U.S. Defensive Equity Fund—Class C |
2,146 |
30 |
|||||||||
|
UBS U.S. Equity Opportunity Fund—Class A |
8,436 |
9,847 |
|||||||||
|
UBS U.S. Equity Opportunity Fund—Class C |
3,602 |
— |
|||||||||
|
UBS U.S. Large Cap Equity Fund—Class A |
2,106 |
6,665 |
|||||||||
|
UBS U.S. Large Cap Equity Fund—Class C |
2,265 |
49 |
|||||||||
|
UBS U.S. Small Cap Growth Fund—Class A |
9,673 |
14,917 |
|||||||||
|
UBS U.S. Small Cap Growth Fund—Class C |
4,284 |
399 |
|||||||||
112
The UBS Funds
Notes to financial statements
4. Transfer agency and related services fees
UBS Financial Services Inc. provides certain services pursuant to a delegation of authority from BNY Mellon Investment Servicing ("BNY Mellon"), as each Fund's transfer agent, and is compensated for these services by BNY Mellon, not the Funds. For the year ended June 30, 2015, UBS Financial Services Inc. received from BNY Mellon, not the Funds, total service fees as follows:
|
Fund |
Amount paid |
||||||
|
UBS Equity Long-Short Multi-Strategy Fund |
$ |
986 |
|||||
|
UBS Global Sustainable Equity Fund |
2,954 |
||||||
|
UBS U.S. Defensive Equity Fund |
3,994 |
||||||
|
UBS U.S. Equity Opportunity Fund |
11,041 |
||||||
|
UBS U.S. Large Cap Equity Fund |
2,383 |
||||||
|
UBS U.S. Small Cap Growth Fund |
8,300 |
||||||
5. Securities lending
Each Fund may lend securities up to 331/3% of its total assets to qualified broker-dealers or institutional investors. The loans are secured at all times by cash, cash equivalents or US government securities in an amount at least equal to 102% of the market value of the securities loaned with respect to domestic securities and 105% of the market value of the securities loaned with respect to foreign securities, plus accrued interest and dividends, determined on a daily basis and adjusted accordingly.
Each Fund will regain ownership of loaned securities to exercise certain beneficial rights; however, the Fund may bear the risk of delay in recovery of, or even loss of rights in, the securities loaned should the borrower fail financially. The Fund receives compensation for lending its securities from interest or dividends earned on the cash, cash equivalents or US government securities held as collateral, net of fee rebates paid to the borrower plus reasonable administrative and custody fees.
UBS Global Sustainable Equity Fund, UBS U.S. Equity Opportunity Fund, UBS U.S. Large Cap Equity Fund and UBS U.S. Small Cap Growth Fund loaned securities to certain qualified broker dealers, with the Funds' custodian acting as the Funds' lending agent. Cash collateral received is invested in Private Money Market, which is included in the Fund's Portfolio of investments. The value of loaned securities and related collateral at June 30, 2015 were as follows:
|
Fund |
Market value of securities loaned |
Market value of collateral recevied from securities loaned |
Market value of investments of cash collateral received |
||||||||||||
|
UBS Global Sustainable Equity Fund |
$ |
757,750 |
$ |
785,656 |
$ |
785,656 |
|||||||||
|
UBS U.S. Equity Opportunity Fund |
1,279,516 |
1,331,642 |
1,331,642 |
||||||||||||
|
UBS U.S. Large Cap Equity Fund |
1,197,982 |
1,240,202 |
1,240,202 |
||||||||||||
|
UBS U.S. Small Cap Growth Fund |
16,743,812 |
17,148,414 |
17,148,414 |
||||||||||||
113
The UBS Funds
Notes to financial statements
6. Purchases and sales of securities
For the year ended June 30, 2015, aggregate purchases and sales of portfolio securities, excluding short-term investments and US Government and agency securities, were as follows:
|
Fund |
Purchases |
Sales proceeds |
|||||||||
|
UBS Equity Long-Short Multi-Strategy Fund (long transactions) |
$ |
15,491,350 |
$ |
15,057,184 |
|||||||
|
UBS Equity Long-Short Multi-Strategy Fund (short sale transactions) |
9,023,594 |
10,107,423 |
|||||||||
|
UBS Global Sustainable Equity Fund |
12,695,134 |
9,559,455 |
|||||||||
|
UBS U.S. Defensive Equity Fund (long transactions) |
11,474,964 |
12,149,864 |
|||||||||
|
UBS U.S. Defensive Equity Fund (short sale transactions) |
3,325,211 |
2,944,323 |
|||||||||
|
UBS U.S. Equity Opportunity Fund |
21,063,396 |
24,056,583 |
|||||||||
|
UBS U.S. Large Cap Equity Fund |
49,844,343 |
154,714,294 |
|||||||||
|
UBS U.S. Small Cap Growth Fund |
147,158,070 |
154,960,199 |
|||||||||
7. Federal income taxes
It is each Fund's policy to comply with all requirements of the Internal Revenue Code applicable to regulated investment companies and to distribute substantially all of their taxable income to their shareholders. In addition, by distributing during each calendar year substantially all of its net investment income, net realized capital gains and certain other amounts, if any, each Fund intends not to be subject to a federal excise tax. Accordingly, no federal income tax provision was required.
The tax character of distributions paid during the fiscal years ended June 30, 2015 and June 30, 2014 were as follows:
|
2015 |
2014 |
||||||||||||||||||
| Fund |
Distributions paid from long-term gains |
Distributions paid from ordinary income |
Distributions paid from long-term gains |
Distributions paid from ordinary income |
|||||||||||||||
|
UBS Equity Long-Short Multi-Strategy Fund |
$ |
275,268 |
$ |
— |
$ |
— |
$ |
— |
|||||||||||
|
UBS Global Sustainable Equity Fund |
— |
315,763 |
— |
449,038 |
|||||||||||||||
|
UBS U.S. Equity Opportunity Fund |
— |
20,003 |
— |
147,110 |
|||||||||||||||
|
UBS U.S. Large Cap Equity Fund |
— |
1,034,949 |
— |
1,662,242 |
|||||||||||||||
|
UBS U.S. Small Cap Growth Fund |
31,619,947 |
11,549,217 |
5,527,910 |
— |
|||||||||||||||
At June 30, 2015, the components of accumulated earnings (deficit) on a tax basis were as follows:
| Fund |
Undistributed long-term gains |
Undistributed ordinary income |
Accumulated capital and other losses |
Unrealized appreciation/ (depreciation) |
Total |
||||||||||||||||||
|
UBS Equity Long-Short Multi-Strategy Fund |
$ |
918,954 |
$ |
— |
$ |
(175,943 |
) |
$ |
1,360,512 |
$ |
2,103,523 |
||||||||||||
|
UBS Global Sustainable Equity Fund |
— |
337,042 |
(8,647,665 |
) |
2,112,903 |
(6,197,720 |
) |
||||||||||||||||
|
UBS U.S. Defensive Equity Fund |
— |
— |
(16,295,385 |
) |
2,047,751 |
(14,247,634 |
) |
||||||||||||||||
|
UBS U.S. Equity Opportunity Fund |
— |
10,374 |
(4,673,695 |
) |
7,231,073 |
2,567,752 |
|||||||||||||||||
|
UBS U.S. Large Cap Equity Fund |
— |
598,324 |
(81,277,823 |
) |
3,244,909 |
(77,434,590 |
) |
||||||||||||||||
|
UBS U.S. Small Cap Growth Fund |
8,032,563 |
5,972,567 |
— |
50,795,158 |
64,800,288 |
||||||||||||||||||
114
The UBS Funds
Notes to financial statements
Due to inherent differences in the recognition of income, expenses and realized gains/losses under US GAAP and federal income tax purposes, permanent differences between book and tax basis reporting for the current fiscal year have been identified and appropriately reclassified. Reclassifications for the year ended June 30, 2015 were as follows:
| Fund |
Undistributed net investment income |
Accumulated net realized gain/(loss) |
Beneficial interest |
||||||||||||
|
UBS Equity Long-Short Multi-Strategy Fund |
$ |
541,179 |
$ |
(509,961 |
) |
$ |
(31,218 |
) |
|||||||
|
UBS Global Sustainable Equity Fund |
66,615 |
(66,615 |
) |
— |
|||||||||||
|
UBS U.S. Defensive Equity Fund |
36,818 |
2,182 |
(39,000 |
) |
|||||||||||
|
UBS U.S. Equity Opportunity Fund |
(5,760 |
) |
5,760 |
— |
|||||||||||
|
UBS U.S. Large Cap Equity Fund |
(31,884 |
) |
31,884 |
— |
|||||||||||
|
UBS U.S. Small Cap Growth Fund |
1,065,297 |
(19,806,794 |
) |
18,741,497 |
|||||||||||
Under the Regulated Investment Company Modernization Act of 2010 (the "Act"), net capital losses recognized by the Funds after December 22, 2010, may be carried forward indefinitely, and retain their character as short-term and/or long-term losses. These carryforwards are available as a reduction, to the extent provided in regulations, of future realized capital gains. The Act requires that post-enactment net capital losses be used before pre-enactment net capital losses.
At June 30, 2015, the following Funds had pre-enactment capital loss carryforwards for federal income tax purposes available to offset future capital gains through the indicated expiration dates:
|
Expiration Dates |
|||||||||||
| Fund |
June 30, 2017 |
June 30, 2018 |
|||||||||
|
UBS Global Sustainable Equity Fund |
$ |
— |
$ |
8,647,665 |
|||||||
|
UBS U.S. Defensive Equity Fund |
3,777,928 |
12,503,688 |
|||||||||
|
UBS U.S. Equity Opportunity Fund |
— |
4,673,695 |
|||||||||
|
UBS U.S. Large Cap Equity Fund |
— |
81,277,823 |
|||||||||
To the extent that such losses are used to offset future net realized capital gains, it is probable these gains will not be distributed.
During the fiscal year ended June 30, 2015, the following Funds utilized capital loss carryforwards to offset current year realized capital gains:
|
Fund |
Amount |
||||||
|
UBS Global Sustainable Equity Fund |
$ |
1,193,980 |
|||||
|
UBS U.S. Defensive Equity Fund |
2,609,489 |
||||||
|
UBS U.S. Equity Opportunity Fund |
4,209,672 |
||||||
|
UBS U.S. Large Cap Equity Fund |
29,767,260 |
||||||
115
The UBS Funds
Notes to financial statements
Qualified late year losses are deemed to arise on the first business day of a Fund's next taxable year. For the year ended June 30, 2015, the following Funds incurred and elected to defer qualified late year losses of the following:
|
Post October Capital Loss |
|||||||||||||||
| Fund |
Late year ordinary loss |
Short-term losses |
Long-term losses |
||||||||||||
|
UBS Equity Long-Short Multi-Strategy Fund |
$ |
146,709 |
$ |
— |
$ |
— |
|||||||||
|
UBS U.S. Defensive Equity Fund |
13,769 |
— |
— |
||||||||||||
ASC 740-10 "Income Taxes—Overall" sets forth a minimum threshold for financial statement recognition of the benefit of a tax position taken or expected to be taken. The Funds have conducted an analysis and concluded, as of June 30, 2015, that there are no significant uncertain tax positions taken or expected to be taken that would require recognition in the financial statements. It is each Fund's policy to record any significant foreign tax exposures in the financial statements. The Funds recognize interest and penalties, if any, related to uncertain tax positions as income tax expense in the Statement of operations. During the year ended June 30, 2015, the Funds did not incur any interest or penalties.
Under the applicable foreign tax laws, gains on certain securities held in certain foreign countries may be subject to taxes that will be paid by the Funds.
Each of the tax years in the four year period ended June 30, 2015, or since inception in the case of UBS Equity Long-Short Multi-Strategy Fund, remains subject to examination by the Internal Revenue Service and state taxing authorities.
8. Line of credit
The Trust has entered into an agreement with JPMorgan Chase Bank to provide a $50 million committed line of credit to the Funds ("Committed Credit Facility") to be utilized for temporary financing until the settlement of sales or purchases of portfolio securities, the repurchase or redemption of shares of each Fund at the request of shareholders and other temporary or emergency purposes. Interest on amounts borrowed is calculated based on the prevailing rates in effect at the time of borrowing. Under the Committed Credit Facility arrangement, each Fund has agreed to pay commitment fees, pro rata, based on the relative asset size of the Funds in the Committed Credit Facility. There were no borrowings under the agreement for the year ended June 30, 2015.
9. Shares of beneficial interest
For the year ended June 30, 2015, transactions in shares of beneficial interest for each of the Funds were as follows:
UBS Equity Long-Short Multi-Strategy Fund
|
Class A |
Class C |
Class P* |
|||||||||||||||||||||||||
|
Shares |
Amount |
Shares |
Amount |
Shares |
Amount |
||||||||||||||||||||||
|
Shares sold |
30,486 |
$ |
328,765 |
4,228 |
$ |
43,458 |
57,485 |
$ |
608,072 |
||||||||||||||||||
|
Shares repurchased |
(61,975 |
) |
(643,176 |
) |
(1,715 |
) |
(17,609 |
) |
(12,784 |
) |
(140,243 |
) |
|||||||||||||||
|
Dividends reinvested |
534 |
5,678 |
749 |
7,704 |
288 |
3,099 |
|||||||||||||||||||||
|
Redemption fees |
— |
27 |
— |
33 |
— |
1,171 |
|||||||||||||||||||||
|
Net increase (decrease) |
(30,955 |
) |
$ |
(308,706 |
) |
3,262 |
$ |
33,586 |
44,989 |
$ |
472,099 |
||||||||||||||||
116
The UBS Funds
Notes to financial statements
UBS Global Sustainable Equity Fund
|
Class A |
Class C |
Class P* |
|||||||||||||||||||||||||
|
Shares |
Amount |
Shares |
Amount |
Shares |
Amount |
||||||||||||||||||||||
|
Shares sold |
339,776 |
$ |
3,133,639 |
119,703 |
$ |
1,098,968 |
681,904 |
$ |
6,087,329 |
||||||||||||||||||
|
Shares repurchased |
(514,903 |
) |
(4,577,768 |
) |
(12,376 |
) |
(112,538 |
) |
(293,530 |
) |
(2,642,659 |
) |
|||||||||||||||
|
Dividends reinvested |
5,669 |
48,700 |
1,925 |
16,228 |
25,341 |
218,185 |
|||||||||||||||||||||
|
Redemption fees |
— |
296 |
— |
100 |
— |
811 |
|||||||||||||||||||||
|
Net increase (decrease) |
(169,458 |
) |
$ |
(1,395,133 |
) |
109,252 |
$ |
1,002,758 |
413,715 |
$ |
3,663,666 |
||||||||||||||||
UBS U.S. Defensive Equity Fund
|
Class A |
Class C |
Class P* |
|||||||||||||||||||||||||
|
Shares |
Amount |
Shares |
Amount |
Shares |
Amount |
||||||||||||||||||||||
|
Shares sold |
20,423 |
$ |
270,804 |
19,177 |
$ |
260,192 |
246,809 |
$ |
3,181,421 |
||||||||||||||||||
|
Shares repurchased |
(243,334 |
) |
(3,091,869 |
) |
(28,049 |
) |
(353,513 |
) |
(53,556 |
) |
(704,601 |
) |
|||||||||||||||
|
Redemption fees |
— |
7 |
— |
2 |
— |
3 |
|||||||||||||||||||||
|
Net increase (decrease) |
(222,911 |
) |
$ |
(2,821,058 |
) |
(8,872 |
) |
$ |
(93,319 |
) |
193,253 |
$ |
2,476,823 |
||||||||||||||
UBS U.S. Equity Opportunity Fund
|
Class A |
Class C |
Class P* |
|||||||||||||||||||||||||
|
Shares |
Amount |
Shares |
Amount |
Shares |
Amount |
||||||||||||||||||||||
|
Shares sold |
39,841 |
$ |
389,888 |
870 |
$ |
8,193 |
88,198 |
$ |
846,732 |
||||||||||||||||||
|
Shares repurchased |
(431,799 |
) |
(4,272,910 |
) |
(80,951 |
) |
(784,533 |
) |
(50,710 |
) |
(516,220 |
) |
|||||||||||||||
|
Dividends reinvested |
1,285 |
12,613 |
— |
— |
605 |
5,974 |
|||||||||||||||||||||
|
Redemption fees |
— |
1,137 |
— |
130 |
— |
56 |
|||||||||||||||||||||
|
Net increase (decrease) |
(390,673 |
) |
$ |
(3,869,272 |
) |
(80,081 |
) |
$ |
(776,210 |
) |
38,093 |
$ |
336,542 |
||||||||||||||
UBS U.S. Large Cap Equity Fund
|
Class A |
Class C |
Class P* |
|||||||||||||||||||||||||
|
Shares |
Amount |
Shares |
Amount |
Shares |
Amount |
||||||||||||||||||||||
|
Shares sold |
80,813 |
$ |
2,085,076 |
16,194 |
$ |
405,505 |
611,878 |
$ |
15,749,199 |
||||||||||||||||||
|
Shares repurchased |
(106,054 |
) |
(2,674,089 |
) |
(53,363 |
) |
(1,287,012 |
) |
(4,667,957 |
) |
(121,760,104 |
) |
|||||||||||||||
|
Dividends reinvested |
1,594 |
40,255 |
— |
— |
38,948 |
986,950 |
|||||||||||||||||||||
|
Redemption fees |
— |
892 |
— |
238 |
— |
6,923 |
|||||||||||||||||||||
|
Net increase (decrease) |
(23,647 |
) |
$ |
(547,866 |
) |
(37,169 |
) |
$ |
(881,269 |
) |
(4,017,131 |
) |
$ |
(105,017,032 |
) |
||||||||||||
UBS U.S. Small Cap Growth Fund
|
Class A |
Class C |
Class P* |
|||||||||||||||||||||||||
|
Shares |
Amount |
Shares |
Amount |
Shares |
Amount |
||||||||||||||||||||||
|
Shares sold |
596,836 |
$ |
13,461,409 |
98,405 |
$ |
2,008,231 |
1,516,069 |
$ |
36,386,274 |
||||||||||||||||||
|
Shares repurchased in-kind |
— |
— |
— |
— |
(3,163,806 |
) |
(71,312,188 |
) |
|||||||||||||||||||
|
Shares repurchased |
(599,282 |
) |
(13,845,210 |
) |
(38,574 |
) |
(776,498 |
) |
(1,583,410 |
) |
(38,793,957 |
) |
|||||||||||||||
|
Dividends reinvested |
267,579 |
5,506,787 |
36,995 |
667,385 |
1,632,666 |
35,706,413 |
|||||||||||||||||||||
|
Redemption fees |
— |
2,480 |
— |
247 |
— |
12,922 |
|||||||||||||||||||||
|
Net increase |
265,133 |
$ |
5,125,466 |
96,826 |
$ |
1,899,365 |
(1,598,481 |
) |
$ |
(38,000,536 |
) |
||||||||||||||||
* Effective July 28, 2014, Class Y shares were renamed Class P shares.
117
The UBS Funds
Notes to financial statements
For the year ended June 30, 2014, transactions in shares of beneficial interest for each of the Funds were as follows:
UBS Equity Long-Short Multi-Strategy Fund
|
Class A |
Class C |
Class Y |
|||||||||||||||||||||||||
|
Shares |
Amount |
Shares |
Amount |
Shares |
Amount |
||||||||||||||||||||||
|
Shares sold |
18,045 |
$ |
183,149 |
343 |
$ |
3,460 |
— |
$ |
— |
||||||||||||||||||
|
Shares repurchased |
(70,918 |
) |
(718,746 |
) |
(1,702 |
) |
(16,912 |
) |
(7,534 |
) |
(76,023 |
) |
|||||||||||||||
|
Net decrease |
(52,873 |
) |
$ |
(535,597 |
) |
(1,359 |
) |
$ |
(13,452 |
) |
(7,534 |
) |
$ |
(76,023 |
) |
||||||||||||
UBS Global Sustainable Equity Fund
|
Class A |
Class C |
Class Y |
|||||||||||||||||||||||||
|
Shares |
Amount |
Shares |
Amount |
Shares |
Amount |
||||||||||||||||||||||
|
Shares sold |
367,672 |
$ |
3,105,075 |
110,950 |
$ |
929,936 |
28,584 |
$ |
240,825 |
||||||||||||||||||
|
Shares repurchased |
(259,210 |
) |
(2,185,773 |
) |
(14,191 |
) |
(114,305 |
) |
(226,622 |
) |
(1,897,447 |
) |
|||||||||||||||
|
Dividends reinvested |
14,790 |
119,797 |
1,280 |
10,226 |
36,386 |
295,461 |
|||||||||||||||||||||
|
Redemption fees |
— |
1,023 |
— |
178 |
— |
1,802 |
|||||||||||||||||||||
|
Net increase (decrease) |
123,252 |
$ |
1,040,122 |
98,039 |
$ |
826,035 |
(161,652 |
) |
$ |
(1,359,359 |
) |
||||||||||||||||
UBS U.S. Defensive Equity Fund
|
Class A |
Class C |
Class Y |
|||||||||||||||||||||||||
|
Shares |
Amount |
Shares |
Amount |
Shares |
Amount |
||||||||||||||||||||||
|
Shares sold |
184,160 |
$ |
2,240,912 |
12,948 |
$ |
154,734 |
5,576 |
$ |
66,714 |
||||||||||||||||||
|
Shares repurchased |
(129,755 |
) |
(1,540,412 |
) |
(69,721 |
) |
(805,290 |
) |
(111,766 |
) |
(1,303,072 |
) |
|||||||||||||||
|
Redemption fees |
— |
1,495 |
— |
409 |
— |
384 |
|||||||||||||||||||||
|
Net increase (decrease) |
54,405 |
$ |
701,995 |
(56,773 |
) |
$ |
(650,147 |
) |
(106,190 |
) |
$ |
(1,235,974 |
) |
||||||||||||||
UBS U.S. Equity Opportunity Fund
|
Class A |
Class C |
Class Y |
|||||||||||||||||||||||||
|
Shares |
Amount |
Shares |
Amount |
Shares |
Amount |
||||||||||||||||||||||
|
Shares sold |
60,662 |
$ |
525,433 |
7,754 |
$ |
66,141 |
34,943 |
$ |
309,688 |
||||||||||||||||||
|
Shares repurchased |
(627,228 |
) |
(5,519,903 |
) |
(45,647 |
) |
(394,054 |
) |
(34,954 |
) |
(300,158 |
) |
|||||||||||||||
|
Dividends reinvested |
14,194 |
122,350 |
— |
— |
902 |
7,817 |
|||||||||||||||||||||
|
Redemption fees |
— |
15 |
— |
2 |
— |
1 |
|||||||||||||||||||||
|
Net increase (decrease) |
(552,372 |
) |
$ |
(4,872,105 |
) |
(37,893 |
) |
$ |
(327,911 |
) |
891 |
$ |
17,348 |
||||||||||||||
118
The UBS Funds
Notes to financial statements
UBS U.S. Large Cap Equity Fund
|
Class A |
Class C |
Class Y |
|||||||||||||||||||||||||
|
Shares |
Amount |
Shares |
Amount |
Shares |
Amount |
||||||||||||||||||||||
|
Shares sold |
65,719 |
$ |
1,425,578 |
9,857 |
$ |
208,534 |
631,010 |
$ |
14,042,768 |
||||||||||||||||||
|
Shares repurchased |
(119,827 |
) |
(2,671,043 |
) |
(9,845 |
) |
(213,677 |
) |
(2,989,555 |
) |
(67,145,346 |
) |
|||||||||||||||
|
Dividends reinvested |
2,940 |
64,232 |
232 |
4,885 |
72,254 |
1,583,799 |
|||||||||||||||||||||
|
Redemption fees |
— |
1,075 |
— |
334 |
— |
17,046 |
|||||||||||||||||||||
|
Net increase (decrease) |
(51,168 |
) |
$ |
(1,180,158 |
) |
244 |
$ |
76 |
(2,286,291 |
) |
$ |
(51,501,733 |
) |
||||||||||||||
UBS U.S. Small Cap Growth Fund
|
Class A |
Class C |
Class Y |
|||||||||||||||||||||||||
|
Shares |
Amount |
Shares |
Amount |
Shares |
Amount |
||||||||||||||||||||||
|
Shares sold |
506,062 |
$ |
11,962,647 |
29,382 |
$ |
636,963 |
1,604,174 |
$ |
39,717,827 |
||||||||||||||||||
|
Shares repurchased |
(455,228 |
) |
(10,512,337 |
) |
(28,407 |
) |
(607,249 |
) |
(1,294,544 |
) |
(31,901,223 |
) |
|||||||||||||||
|
Dividends reinvested |
33,015 |
755,043 |
3,672 |
75,974 |
190,666 |
4,570,262 |
|||||||||||||||||||||
|
Redemption fees |
— |
4,549 |
— |
390 |
— |
24,750 |
|||||||||||||||||||||
|
Net increase |
83,849 |
$ |
2,209,902 |
4,647 |
$ |
106,078 |
500,296 |
$ |
12,411,616 |
||||||||||||||||||
10. Subsequent event
On July 6, 2015, the Board of Trustees of The UBS Funds determined that it is in the best interests of the UBS Equity Long-Short Multi-Strategy Fund (the "Fund") and its shareholders to liquidate and dissolve the Fund pursuant to a Plan of Liquidation (the "Plan"). The Plan provides that: (a) all the Fund's assets be converted into cash or cash equivalents or be otherwise liquidated and (b) the Fund distribute pro rata to its shareholders all of its existing assets, in a complete liquidation of the Fund. The liquidation is expected to be completed on or about September 24, 2015 (the "Liquidation Date"). On the Liquidation Date, all shareholders will have their accounts liquidated and the proceeds will be delivered to them.
In connection with the liquidation, the Board approved, effective July 27, 2015, the closure of each class of the Fund to new investments, including new investors, additional purchases from existing investors and purchases for exchange from other funds. The Board also approved, effective July 27, 2015, the closure of each class of the Fund to reinvestments of dividends and distributions. Therefore, the Fund will no longer offer shares for purchase. The Fund reserves the right to change this policy at any time. Of course, shareholders will continue to be able to redeem their shares in accordance with the policies in the Prospectus.
Also in connection with the liquidation, effective July 27, 2015, (a) the investment advisory fee of 1.25% of average net assets is waived; (b) the annual Rule 12b-1 distribution fee of 0.75% of average net assets that is charged to the shareholders of Class C shares is waived; (c) until August 3, 2015, after when the redemption fee is eliminated, the 1.00% redemption fee that is charged on sales or exchanges of any Class of shares of the Fund less than 30 days after purchase is waived; and (d) all contingent deferred sales charges (CDSC) assessed on redemptions that are charged on Class A shares (on purchases of $1,000,000 or more) and Class C shares are eliminated. The annual service fee of 0.25% of average net assets that is charged on Class A shares and Class C shares will not be waived. With respect to exchanges of shares of the Fund for shares of another UBS Family Fund, the length of time you held your shares of the Fund will still be considered when determining whether you must pay a CDSC when you sell the shares of the UBS Family Fund acquired in the exchange.
119
The UBS Funds
Report of independent registered public accounting firm
The Board of Trustees and Shareholders of The UBS Funds
We have audited the accompanying statements of assets and liabilities, including the portfolios of investments, of UBS Equity Long-Short Multi-Strategy Fund, UBS Global Sustainable Equity Fund, UBS U.S. Defensive Equity Fund, UBS U.S. Equity Opportunity Fund, UBS U.S. Large Cap Equity Fund and UBS U.S. Small Cap Growth Fund (six of the series comprising The UBS Funds) (collectively the "Funds") as of June 30, 2015, and the related statements of operations for the year then ended, the statements of cash flows of UBS Equity Long-Short Multi-Strategy Fund and UBS U.S. Defensive Equity Fund for the year then ended, the statements of changes in net assets for each of the two years in the period then ended and the financial highlights for each of the five years in the period then ended. These financial statements and financial highlights are the responsibility of the Funds' management. Our responsibility is to express an opinion on these financial statements and financial highlights based on our audits.
We conducted our audits in accordance with the standards of the Public Company Accounting Oversight Board (United States). Those standards require that we plan and perform the audit to obtain reasonable assurance about whether the financial statements and financial highlights are free of material misstatement. We were not engaged to perform an audit of the Funds' internal control over financial reporting. Our audits included consideration of internal control over financial reporting as a basis for designing audit procedures that are appropriate in the circumstances, but not for the purpose of expressing an opinion on the effectiveness of the Funds' internal control over financial reporting. Accordingly, we express no such opinion. An audit also includes examining, on a test basis, evidence supporting the amounts and disclosures in the financial statements and financial highlights, assessing the accounting principles used and significant estimates made by management, and evaluating the overall financial statement presentation. Our procedures included confirmation of securities owned as of June 30, 2015, by correspondence with the custodian and others or by other appropriate auditing procedures where replies from others were not received. We believe that our audits provide a reasonable basis for our opinion.
In our opinion, the financial statements and financial highlights referred to above present fairly, in all material respects, the financial position of UBS Equity Long-Short Multi-Strategy Fund, UBS Global Sustainable Equity Fund, UBS U.S. Defensive Equity Fund, UBS U.S. Equity Opportunity Fund, UBS U.S. Large Cap Equity Fund and UBS U.S. Small Cap Growth Fund at June 30, 2015, the results of their operations for the year then ended, the statements of cash flows of UBS Equity Long-Short Multi-Strategy Fund and UBS U.S. Defensive Equity Fund for the year then ended, the changes in their net assets for each of the two years in the period then ended and the financial highlights for each of the five years in the period then ended, in conformity with U.S. generally accepted accounting principles.

New York, New York
August 28, 2015
120
The UBS Funds
General information (unaudited)
Quarterly Form N-Q portfolio schedule
The Funds will file their complete schedule of portfolio holdings with the Securities and Exchange Commission ("SEC") for the first and third quarters of each fiscal year on Form N-Q. The Funds' Forms N-Q are available on the SEC's Web site at http://www.sec.gov. The Funds' Forms N-Q may be reviewed and copied at the SEC's Public Reference Room in Washington, D.C. Information on the operation of the SEC's Public Reference Room may be obtained by calling 1-202-551 8090. Additionally, you may obtain copies of Forms N-Q from the Funds upon request by calling 1-800-647 1568.
Proxy voting policies, procedures and record
You may obtain a description of the Funds' (1) proxy voting policies, (2) proxy voting procedures and (3) information regarding how the Funds voted any proxies related to portfolio securities during the most recent 12-month period ended June 30 for which an SEC filing has been made, without charge, upon request by contacting the Funds directly at 1-800-647 1568, online on UBS's Web site: www.ubs.com/ubsglobalam-proxy, or on the EDGAR Database on the SEC's Web site http://www.sec.gov).
121
The UBS Funds
Board approval of investment advisory agreements
(unaudited)
At the meeting of the Board of Trustees (the "Board") of The UBS Funds (the "Trust"), held on June 4 and 5, 2015 (the "Meeting"), the Board, including those Trustees who are not "interested persons" (as defined in the 1940 Act) of the Trust or UBS Global Asset Management (Americas) Inc. (the "Advisor") and its affiliates (together, the "Independent Trustees"), considered the continuation of the investment advisory agreements (the "Advisory Agreements") between the Trust and the Advisor for the UBS Dynamic Alpha Fund, UBS Global Allocation Fund, UBS Asset Growth Fund, UBS Multi-Asset Income Fund, UBS Global Sustainable Equity Fund, UBS U.S. Defensive Equity Fund, UBS U.S. Large Cap Equity Fund, UBS U.S. Equity Opportunity Fund, UBS U.S. Small Cap Growth Fund, UBS Equity Long-Short Multi-Strategy Fund, UBS Fixed Income Opportunities Fund and UBS Core Plus Bond Fund (each a "Fund," and together, the "Funds"). Prior to the Meeting, the Independent Trustees' counsel had sent to the Advisor a request detailing the information that the Independent Trustees wished to receive in connection with their consideration of the continuation of the Advisory Agreements. The Independent Trustees met with their independent counsel, as well as an independent consultant engaged by the Board to assist in the annual Advisory Agreement review process, on May 26, 2015, June 4, 2015 and June 5, 2015, to discuss the materials provided to them in response to the information request, including materials prepared by the Advisor, as well as reports prepared by Lipper Inc. ("Lipper Reports"), an independent statistical compilation company, providing comparative expense information on an actual and contractual basis and comparative performance information for the Funds. The Board also made reference to information and material that had been provided to the Independent Trustees throughout the year at quarterly Board meetings.
At the Meeting, the Board considered a number of factors in connection with its deliberations concerning the continuation of the Advisory Agreement for each Fund, including: (i) the nature, extent, and quality of the services provided by the Advisor to the Fund; (ii) the performance of the Fund and the Advisor; (iii) the Fund's expenses, costs of the services to be provided and profits to be realized by the Advisor and its affiliates from the relationship with the Fund; and (iv) whether economies of scale are realized by the Advisor with respect to the Fund, as it grows larger, and the extent to which the economies of scale are reflected in the level of the management fees charged.
Nature, Extent, and Quality of Services.
In considering the nature, extent, and quality of the services provided by the Advisor to a Fund, the Board reviewed the material presented by the Advisor describing the various services provided to each Fund. The Board noted that in addition to investment management services, the Advisor provides each Fund with operational, legal, and compliance support. The Board also considered the scope and depth of the Advisor's organization and the experience and expertise of the professionals currently providing investment management and other services to the Funds. The Board considered that the Advisor was a well-established investment management organization employing investment personnel with significant experience in the investment management industry. The Board also considered the Advisor's in-house research capabilities, as well as other research services available to it, including research services available to the Advisor as a result of securities transactions effected for the Funds and the Advisor's other investment management clients, and noted that the Advisor had extensive global research capabilities. The Board also evaluated the Advisor's portfolio management process for each Fund, including the use of risk management techniques and the proprietary technologies utilized to structure the Fund's portfolio. The Board noted that various presentations had been made by investment personnel at Board meetings throughout the year concerning the Funds' investment performance and investment strategies, including the derivative strategies utilized by certain Funds.
The Board also noted and discussed the services that the Advisor and its affiliates provide to the Funds under other agreements with the Trust, including administration services provided by the Advisor, underwriting services provided by UBS Global Asset Management (US) Inc. ("UBS Global AM (US)"), and sub-transfer agency services provided by UBS Financial Services Inc. ("UBS Financial Services"). In connection with the non-investment management services, the Board also considered the quarterly reports that the Advisor provides to the Board throughout the year pertaining to brokerage commissions, soft dollars, portfolio valuations, and Rule 12b-1 fees, among others. In addition, the Board considered the presentations provided with respect to distribution strategies for the Funds.
122
The UBS Funds
Board approval of investment advisory agreements
(unaudited)
After analyzing the services provided by the Advisor to each Fund, both quantitatively and qualitatively, including the impact of these services on investment performance, the Board concluded that the nature, extent, and quality of services provided to each Fund were consistent with the operational requirements of each Fund, and met the needs of the Fund's shareholders.
Performance.
In evaluating the performance of each Fund, the Board analyzed the Lipper Reports, which compared the performance of each Fund with other funds in its respective peer universe over various time periods. The Board also reviewed the memoranda provided by the Advisor providing an analysis of the markets and the Funds' performance during the past year. In reviewing the Lipper Reports, the Board noted that the UBS Dynamic Alpha Fund, UBS Global Allocation Fund, UBS Asset Growth Fund, UBS Multi-Asset Income Fund, UBS Global Sustainable Equity Fund, UBS Equity Long-Short Multi-Strategy Fund, UBS U.S. Large Cap Equity Fund, UBS U.S. Equity Opportunity Fund, UBS U.S. Small Cap Growth Fund and UBS Core Plus Bond Fund each had appeared in one of the top three performance quintiles for the one-year performance period. At the Board's request, the Advisor further addressed the performance data for the UBS U.S. Defensive Equity Fund and UBS Fixed Income Opportunities Fund, each of which had appeared in one of the lower performance quintiles for the one-year period.
In discussing the performance of the UBS U.S. Defensive Equity Fund for the one-year performance period, the Advisor explained that the Fund's defensive strategy was the primary reason for the Fund's underperformance as compared to its peer universe. The Advisor noted that the options overlay strategy for the Fund, which reduced the volatility profile of the Fund, detracted from the Fund's performance. The Advisor stated the options overlay strategy should benefit the Fund's relative performance when the U.S. equity market experiences a down turn.
The Advisor next addressed the relative underperformance of the UBS Fixed Income Opportunities Fund with respect to the Fund's peers. The Fund's weaker relative performance as compared to its peer universe was attributable to its corporate credit exposure in both investment grade and high yield debt, where overall hedging strategies and security selection within the energy sector detracted from results. The Advisor also noted that the Fund's net short duration positioning was not rewarded as yield generally declined over the period. The Advisor did note that the Fund continued to deliver returns with minimal correlation to traditional fixed income markets, as well as many of its unconstrained fixed income peer funds.
The Board concluded that the Advisor's explanations provided a sound basis for understanding the performance of each Fund that underperformed in comparison to its peer universe. The Board determined, after analyzing the performance data, that the performance of each Fund was acceptable as compared with relevant performance standards, given the investment strategies and risk profile of each Fund, the expectations of the shareholder base, the current market environment and the Advisor's efforts to address the underperformance issues of each Fund.
Fund Fees and Expenses.
When considering the fees and expenses borne by each Fund, and the reasonableness of the management fees paid to the Advisor in light of the services provided to each Fund, the Board compared the fees charged by the Advisor to each Fund to fees charged to the funds in its peer group for comparable services, as provided in the Lipper Reports, on both an actual (taking into account expense limitation arrangements) and a contractual basis (assuming all funds in the peer expense group were similar in size to the respective Fund). In examining the Lipper Reports, and in reviewing comparative costs, it was noted that the results of such expense comparisons showed that the actual management fee rate for each Fund, except the UBS Global Allocation Fund, UBS Dynamic Alpha Fund and UBS U.S. Small Cap Growth Fund, was comparable to, or lower than, the Lipper median in its respective Lipper expense group. The Board also noted that each Fund, except the UBS Global Allocation Fund, UBS Core Plus Bond Fund and UBS U.S. Small Cap Growth Fund, had a contractual fee rate comparable to, or lower than, the Lipper median in its respective Lipper expense group. In addition, the Board reviewed the actual total expenses of
123
The UBS Funds
Board approval of investment advisory agreements
(unaudited)
each Fund and noted that each Fund had total expenses that were comparable to, or lower than, the Lipper median in its respective Lipper expense group, except for UBS Global Allocation Fund and UBS U.S. Small Cap Growth Fund.
The Board first discussed the management fee and expenses of the UBS Global Allocation Fund. It was noted that the contractual management fee, actual management fee and total expenses for the UBS Global Allocation Fund were each slightly higher than the fees and expenses of several of the funds in its Lipper expense group. The Advisor noted that a reduction in the UBS Global Allocation Fund's assets was a main driver to the Fund's relative lower rankings. The Board, however, noted the Fund's management fee and total expenses were closer to the medians of its Lipper expense group than such fee and expenses were last year. The Board determined that the management fee and expenses were each reasonable considering that neither the management fee nor the Fund's total expenses were significantly higher than the respective Lipper expense group medians. The Board will continue to monitor the Fund's peers and expenses.
The Board then discussed the management fee of the UBS Dynamic Alpha Fund. It was noted that the actual management fee of UBS Dynamic Alpha Fund was higher than the median of the Fund's Lipper expense group. The Board noted that while the UBS Dynamic Alpha Fund's actual management fee was higher than the median of the Fund's Lipper expense group, the Fund's total expenses were less than the median of the Fund's Lipper expense group, resulting in the total cost to investors being very competitive. The Advisor also noted that the UBS Dynamic Alpha Fund was included in a brand new Lipper peer group category. The Advisor stated that as the new category matures, the rankings of the Fund will become more conclusive.
The Advisor next addressed the management fee of the UBS Core Plus Bond Fund. The Advisor noted that while the contractual management fee of the UBS Core Plus Bond Fund was higher than the median of the Fund's Lipper expense group, the Fund compared very favorably to its Lipper peers with respect to its actual management fee and total expenses. The UBS Core Plus Bond Fund placed in the first quintile of its Lipper expense group for both its actual management fee and total expenses.
The Board next discussed the management fee of the UBS U.S. Small Cap Growth Fund. It was noted that the contractual management fee, actual management fee and total expenses for the UBS U.S. Small Cap Growth Fund were each higher than the medians in its Lipper expense group. The Advisor noted that a new fee waiver and expense cap arrangement was approved for the Fund effective March 27, 2015, that provides for a higher level of fees waived and expenses reimbursed by the Advisor. The Advisor reported that under this new arrangement, the actual management fee and total expenses for the UBS U.S. Small Cap Growth Fund are each expected to be lower than the medians of the Lipper expense group.
The Board also received and considered information about the fee rates charged to other funds and accounts that are managed by the Advisor. After discussing the information about the other funds and accounts with the Advisor, the Board determined that the fees charged by the Advisor to the Funds were within a reasonable range, giving effect to differences in services performed for such other funds and accounts as compared to such fee rates. The Board, after reviewing all pertinent material, concluded that the management fee payable under each Fund's Advisory Agreement was fair and reasonable, both on an absolute basis and in comparison with the fees of other funds identified in its peer group.
Costs and Profitability.
The Board considered the costs of providing services to the Funds and the profitability of the Funds to the Advisor and its affiliates by reviewing the profitability analysis provided by the Advisor, including information about its fee revenues and expenses. The Board reviewed the profitability of each Fund to the Advisor and its affiliates, and the compensation that was received for providing services to each Fund. The profitability analysis, which provided
124
The UBS Funds
Board approval of investment advisory agreements
(unaudited)
information for the last three calendar years, included schedules relating to the revenue and expenses attributable to: (i) the investment advisory and administration services provided by the Advisor; (ii) the distribution and shareholder services provided by UBS Global AM (US) and UBS Financial Services; (iii) the transfer agency-related services provided by UBS Financial Services; and (iv) all services provided by the Advisor, UBS Global AM (US), and UBS Financial Services shown on a consolidated basis. In discussing the profitability analysis with the Board, the Advisor, as requested by the Board, provided the Board with a presentation on the methodology utilized in the profitability analysis. The Board noted that the methodology used for the profitability analysis provided to the Board for purposes of its annual review of the Advisory Agreements was reasonable. The Advisor also explained to the Board the reasons for an increase or decrease in profitability of each Fund from last calendar year to this calendar year.
The Board also considered "fallout" or ancillary benefits to the Advisor or its affiliates as the result of their relationship with the Funds; for example, the ability to attract other clients due to the Advisor's role as investment advisor to the Funds and the research services available to the Advisor through soft dollar brokerage commissions. The Independent Trustees also considered the ancillary benefits received by the Advisor's affiliates, UBS Securities LLC and UBS AG, in the form of commissions for executing securities transactions for the Funds. Upon closely examining the information provided concerning the Advisor's profitability, the Board concluded that the level of profits realized by the Advisor and its affiliates with respect to each Fund, if any, was reasonable in relation to the nature and quality of the services that were provided.
Economies of Scale.
The Board also discussed whether economies of scale are realized by the Advisor with respect to each Fund as it grows larger, and the extent to which this is reflected in the level of management fees charged. The Board noted that with respect most Funds, any actual or potential economies of scale are, or will be, shared with the Fund and its shareholders through existing management fee breakpoints so that as the Fund grows in size, its effective management fee declines. The Board noted that each Fund, except UBS Asset Growth Fund, UBS Equity Long-Short Multi-Strategy Fund, UBS Multi-Asset Income Fund and UBS Fixed Income Opportunities Fund, had a breakpoint schedule that provided for continuing breakpoints past the current asset level for the Fund. Based on each Fund's fees and expenses and the Advisor's profitability analysis, the Board concluded that any actual or potential economies of scale would be reasonably shared with a Fund and its shareholders.
After full consideration of the factors discussed above, with no single factor identified as being of paramount importance, the Board, including a majority of the Independent Trustees, with the assistance of independent counsel, concluded that the continuation of the Advisory Agreement for each Fund was in the best interests of the Fund and its shareholders.
125
The UBS Funds
Trustee and officer information (unaudited)
The Trust is a Delaware statutory trust. Under Delaware law, the Board has overall responsibility for managing the business and affairs of the Trust, including general supervision and review of its investment activities. The Trustees elect the Officers of the Trust, who are responsible for administering the day-to-day operations of the Trust and the Funds.
The table shows, for each Trustee and Officer, his or her name, address and age, the position held with the Trust, the length of time served as a Trustee or Officer of the Trust, the Trustee's or Officer's principal occupations during the last five years, the number of funds in the UBS Family of Funds overseen by the Trustee or Officer and other directorships held by such Trustee.
The Trust's Statement of Additional Information contains additional information about the Trustees and is available, without charge, upon request, by calling 1-800-647 1568.
Non-interested Trustees:
|
Name, address and age |
Position(s) held with Trust |
Term of office1 and length of time served |
Principal occupation(s) during past 5 years |
Number of portfolios in fund complex overseen by Trustee |
Other directorships held by Trustee |
||||||||||||||||||
|
Adela Cepeda; 57 A.C. Advisory, Inc. 150 North Wacker Drive Suite 2160 Chicago, Illinois 60606 |
Trustee |
Since 2004 |
Ms. Cepeda is founder and president of A.C. Advisory, Inc. (since 1995). |
Ms. Cepeda is a director or trustee of four investment companies (consisting of 31 portfolios) for which UBS Global AM serves as investment advisor or manager. |
Ms. Cepeda is a director (since 2012) of BMO Financial Corp. (U.S. holding company for BMO Harris Bank N.A.), director of the Mercer Funds (9 portfolios) (since 2005), trustee of the Morgan Stanley Smith Barney Consulting Group Capital Markets Funds (11 portfolios) (since 2008). Ms. Cepeda was a director of Amalgamated Bank of Chicago (since 2003 to 2012) and a director of the Municipal Securities Rulemaking Board (from 2012 to 2012). |
||||||||||||||||||
|
John J. Murphy; 71 268 Main Street P.O. Box 718 Gladstone, NJ 07934 |
Trustee |
Since 2009 |
Mr. Murphy is the president of Murphy Capital Management (investment advisor) (since 1983) |
Mr. Murphy is a director or trustee of four investment companies (consisting of 31 portfolios) for which UBS Global AM serves as investment advisor or manager. |
Mr. Murphy is a director (since 2007) of the Legg Mason Equity Funds (54 portfolios) and a trustee of Morgan Stanley Smith Barney Consulting Group Capital Markets Funds (11 portfolios). |
||||||||||||||||||
126
The UBS Funds
Trustee and officer information (unaudited)
Non-interested Trustees (continued):
|
Name, address and age |
Position(s) held with Trust |
Term of office1 and length of time served |
Principal occupation(s) during past 5 years |
Number of portfolios in fund complex overseen by Trustee |
Other directorships held by Trustee |
||||||||||||||||||
|
Abbie J. Smith; 62 University of Chicago Booth School of Business 5807 S. Woodlawn Avenue Chicago, IL 60637 |
Trustee |
Since 2009 |
Ms. Smith is Boris and Irene Stern Professor of Accounting in the University of Chicago Booth School of Business (since 1980). Formerly, Ms. Smith was a co-founding partner and Director of Research of Fundamental Investment Advisors, a hedge fund (co-founded in 2004, commenced operations in 2008) (from 2008 to 2010). |
Ms. Smith is a director or trustee of four investment companies (consisting of 31 portfolios) for which UBS Global AM serves as investment advisor or manager. |
Ms. Smith is a director (since 2000) of HNI Corporation and chair of the human resources and compensation committee (formerly known as HON Industries Inc.) (office furniture) and a director (since 2003) and chair of the audit committee of Ryder System Inc. (transportation, logistics and supply-chain management). In addition, Ms. Smith is a trustee/director (since 2000) and a member of the audit committee and portfolio performance committee of the Dimensional Funds complex (89 Portfolios). |
||||||||||||||||||
|
Frank K. Reilly; 79 Mendoza College of Business University of Notre Dame Notre Dame, IN 46556-5649 |
Chairman and Trustee |
Since 1992 |
Mr. Reilly is the Bernard J. Hank Professor of Finance in the Mendoza College of Business at the University of Notre Dame (since 1982). |
Mr. Reilly is a director or trustee of four investment companies (consisting of 31 portfolios) for which UBS Global AM serves as investment advisor or manager. |
Mr. Reilly is a director (since 1994) of Discover Bank, a subsidiary of Discover Financial Services and is Chairman of the Audit Committee for the bank. |
||||||||||||||||||
|
Edward M. Roob; 80 c/o UBS Global AM One North Wacker Drive Chicago, IL 60606 |
Trustee |
Since 1995 |
Mr. Roob is retired (since 1993). |
Mr. Roob is a director or trustee of four investment companies (consisting of 31 portfolios) for which UBS Global AM serves as investment advisor or manager. |
None. |
||||||||||||||||||
127
The UBS Funds
Trustee and officer information (unaudited)
Non-interested Trustees (continued):
|
Name, address and age |
Position(s) held with Trust |
Term of office1 and length of time served |
Principal occupation(s) during past 5 years |
Number of portfolios in fund complex overseen by Trustee |
Other directorships held by Trustee |
||||||||||||||||||
|
J. Mikesell Thomas; 64 c/o UBS Global AM One North Wacker Drive Chicago, IL 60606 |
Trustee |
Since 2004 |
Mr. Thomas is a principal with the investment firm Castle Creek Capital (since 2008) and President and sole shareholder of Mikesell Advisory Corp (since 2009). He is the former President and CEO of Federal Home Loan Bank of Chicago (from 2004 to 2008) and of First Chicago Bancorp (from 2008 to 2011). |
Mr. Thomas is a director or trustee of four investment companies (consisting of 31 portfolios) for which UBS Global AM serves as investment advisor or manager. |
Mr. Thomas is a director (since 1992) and chairman of the Audit Committee for NorthShore University HealthSystem, a not for profit healthcare organization, and a director (since 2012) and member of the Audit and Investment and Finance Committees of HCC Insurance Holdings Inc. Mr. Thomas was previously a director of First Chicago Bancorp (2008-2010) and First Chicago Bank & Trust (from 2008 to 2010). |
||||||||||||||||||
128
The UBS Funds
Trustee and officer information (unaudited)
|
Interested Trustee: |
|||
|
Name, address and age |
Position(s) held with Trust |
Term of office1 and length of time served |
Principal occupation(s) during past 5 years |
Number of portfolios in fund complex overseen by Trustee |
Other directorships held by Trustee |
||||||||||||||||||
|
E. Blake Moore, Jr.; 572* |
Interested Trustee |
Since June 2015 |
Mr. Moore is a Managing Director and Head of Americas at UBS Global Asset Management (Americas) Inc. (since March 2015). Mr. Moore is a member of the UBS Global Asset Management Executive Committee and UBS Americas Executive Committee. Prior to joining UBS Global Asset Management in March 2015, Mr. Moore was EVP Head of Distribution at Mackenzie Investments in Canada for over three years. Before this, Mr. Moore spent over six years at Allianz Global Investors in New York where he held a number of senior management roles. Most recently, he was Chief Executive Officer, Allianz Global Investors Fund Management. Prior to Allianz, Mr. Moore served as a member of the Executive Committee and Partner at Nicholas-Applegate Capital Management. |
Mr. Moore is a director or trustee of three investment companies (consisting of 30 portfolios) for which UBS Global AM serves as investment advisor or manager. |
None |
||||||||||||||||||
129
The UBS Funds
Trustee and officer information (unaudited)
Officers:
|
Name, address and age |
Position(s) held with Trust |
Term of office1 and length of time served |
Principal occupation(s) during past 5 years; number of portfolios in fund complex for which person serves as officer |
||||||||||||
|
Joseph J. Allessie*; 50 |
Vice President, Assistant Secretary and Chief Compliance Officer |
Since 2005 (Vice President and Assistant Secretary); since July 2014 (Chief Compliance Officer) |
Mr. Allessie is a managing director (since 2015) (prior to which he was an executive director) at UBS Global AM—Americas region. Mr. Allessie is head of compliance and operational risk control for the UBS Global Asset Management Division in the Americas with oversight for traditional and alternative investment businesses in Canada, the US and Cayman Islands. Prior to that he served as deputy general counsel (from 2005 to 2014). Mr. Allessie is a vice president, assistant secretary and chief compliance officer (prior to which he was interim chief compliance officer) (from January to July 2014) of 14 investment companies (consisting of 73 portfolios) for which UBS Global AM serves as investment advisor or manager. |
||||||||||||
|
Rose Ann Bubloski*; 47 |
Vice President and Assistant Treasurer |
Since 2011 |
Ms. Bubloski is a director (since 2012) (prior to which she was an associate director) (from 2008 to 2012) and senior manager of the US mutual fund treasury administration department of UBS Global AM—Americas region. She was a vice president and assistant treasurer of certain UBS funds (from 2004 to 2007). She is vice president and assistant treasurer of 14 investment companies (consisting of 73 portfolios) for which UBS Global AM serves as investment advisor or manager. |
||||||||||||
|
Mark E. Carver*; 51 |
President |
Since 2010 |
Mr. Carver is a managing director and head of product development and management—Americas for UBS Global AM—Americas region (since 2008). In this role, he oversees product development and management for both wholesale and institutional businesses. He is a member of the Americas Management Committee (since 2008) and the Regional Operating Committee (since 2008). Prior to 2008, Mr. Carver held a number of product-related or sales responsibilities with respect to funds, advisory programs and separately managed accounts. Mr. Carver is president of 14 investment companies (consisting of 73 portfolios) for which UBS Global AM serves as investment advisor or manager. |
||||||||||||
|
Thomas Disbrow*; 49 |
Vice President, Treasurer and Principal Accounting Officer |
Since 2004 and 2006, respectively |
Mr. Disbrow is a managing director (since 2011), (prior to which he was an executive director) (since 2007) and head of North Americas fund treasury (since 2011) of UBS Global AM—Americas region. Mr. Disbrow is a vice president and treasurer and/or principal accounting officer of 14 investment companies (consisting of 73 portfolios) for which UBS Global AM serves as investment advisor or manager. |
||||||||||||
|
Christopher S. Ha*; 35 |
Vice President and Assistant Secretary |
Since September 2012 |
Mr. Ha is a director and associate general counsel (since September 2012) at UBS Global AM—Americas region. Prior to joining UBS Global AM—Americas region, Mr. Ha was of counsel at Buhler, Duggal & Henry LLP (law firm) (from March 2012 to July 2012) and an associate attorney at Dechert LLP (law firm) (from 2007 to 2009). Mr. Ha is a vice president and assistant secretary of 14 investment companies (consisting of 73 portfolios) for which UBS Global AM serves as investment advisor or manager. |
||||||||||||
130
The UBS Funds
Trustee and officer information (unaudited)
Officers (continued):
|
Name, address and age |
Position(s) held with Trust |
Term of office1 and length of time served |
Principal occupation(s) during past 5 years; number of portfolios in fund complex for which person serves as officer |
||||||||||||
|
Mark F. Kemper**; 57 |
Vice President and Secretary |
Since 1999 |
Mr. Kemper is a managing director (since 2006) and head of the legal department of UBS Global AM—Americas region (since 2004). He has been secretary of UBS Global AM—Americas region (since 2004) and assistant secretary of UBS Global Asset Management Trust Company (since 1993). Mr. Kemper is vice president and secretary of 14 investment companies (consisting of 73 portfolios) for which UBS Global AM serves as investment advisor or manager. |
||||||||||||
|
Joanne M. Kilkeary*; 47 |
Vice President and Assistant Treasurer |
Since 2006 |
Ms. Kilkeary is an executive director (since March 2013) (prior to which she was a director) (since 2008) and a senior manager (since 2004) of the US mutual fund treasury administration department of UBS Global AM—Americas region. Ms. Kilkeary is a vice president and assistant treasurer of 14 investment companies (consisting of 73 portfolios) for which UBS Global AM serves as investment advisor or manager. |
||||||||||||
|
Cindy Lee*, 40 |
Vice President and Assistant Treasurer |
Since November 2014 |
Ms. Lee is an associate director (since 2009) prior to which she was a fund treasury manager (from 2007 to 2009) of the US mutual fund treasury administration department of UBS Global AM—Americas region. Ms. Lee is a vice president and assistant treasurer of 14 investment companies (consisting of 73 portfolios) for which UBS Global AM serves as investment advisor or manager. |
||||||||||||
|
Tammie Lee*; 44 |
Vice President and Assistant Secretary |
Since 2005 |
Ms. Lee is an executive director (since 2010) (prior to which she was a director) (since 2005) and associate general counsel of UBS Global AM—Americas region (since 2005). Ms. Lee is a vice president and assistant secretary of 14 investment companies (consisting of 73 portfolios) for which UBS Global AM serves as investment advisor or manager. |
||||||||||||
|
Nancy D. Osborn*; 49 |
Vice President and Assistant Treasurer |
Since 2007 |
Mrs. Osborn is a director (since 2010) (prior to which she was an associate director) and a senior manager of the US mutual fund treasury administration department of UBS Global AM—Americas region (since 2006). Mrs. Osborn is a vice president and assistant treasurer of 14 investment companies (consisting of 73 portfolios) for which UBS Global AM serves as investment advisor or manager. |
||||||||||||
|
Eric Sanders*; 49 |
Vice President and Assistant Secretary |
Since 2005 |
Mr. Sanders is a director and associate general counsel of UBS Global AM—Americas region (since 2005). Mr. Sanders is a vice president and assistant secretary of 14 investment companies (consisting of 73 portfolios) for which UBS Global AM serves as investment advisor or manager. |
||||||||||||
|
Andrew Shoup*; 59 |
Vice President and Chief Operating Officer |
Since 2006 |
Mr. Shoup is a managing director and global head of the fund treasury administration department of UBS Global AM—Americas region (since 2006). Mr. Shoup is also a director of UBS (IRL) Fund p.l.c. (since 2008). Mr. Shoup is a vice president and chief operating officer of 14 investment companies (consisting of 73 portfolios) for which UBS Global AM serves as investment advisor or manager. |
||||||||||||
131
The UBS Funds
Trustee and officer information (unaudited)
Officers (continued):
|
Name, address and age |
Position(s) held with Trust |
Term of office1 and length of time served |
Principal occupation(s) during past 5 years; number of portfolios in fund complex for which person serves as officer |
||||||||||||
|
Keith A. Weller*; 54 |
Vice President and Assistant Secretary |
Since 2004 |
Mr. Weller is an executive director and senior associate general counsel of UBS Global AM—Americas region (since 2005). Mr. Weller is a vice president and assistant secretary of 14 investment companies (consisting of 73 portfolios) for which UBS Global AM serves as investment advisor or manager. |
||||||||||||
|
Mandy Yu*; 31 |
Vice President |
Since March 2013 |
Ms. Yu is an authorized officer (since 2012) and tax compliance manager (since 2013) of the US mutual fund treasury administration department of UBS Global AM—Americas region. She was a Fund Treasury Manager (from 2012 to 2013) and a Mutual Fund Administrator (from 2007 to 2012) for UBS Global AM—Americas region. Ms. Yu is a vice president of 14 investment companies (consisting of 73 portfolios) for which UBS Global AM serves as investment advisor or manager. |
||||||||||||
1 Each Trustee holds office for an indefinite term. Officers of the Trust are appointed by the Trustees and serve at the pleasure of the Board.
2 Mr. Moore is considered to be an interested person of the Trust under the federal securities laws due to his position as an officer of UBS Global AM.
* This person's business address is 1285 Avenue of the Americas, New York, NY 10019-6028
** This person's business address is One North Wacker Drive, Chicago, IL 60606.
132
The UBS Funds
Federal tax information (unaudited)
For the year ended June 30, 2015, the percentage of dividends paid that qualify for the 70% dividends received deduction for corporate shareholders, and the amount expected to be passed through to shareholders as foreign tax credits are approximated as follows:
| Fund |
Dividends received deduction |
Foreign tax credit |
|||||||||
|
UBS Global Sustainable Equity Fund |
5 |
% |
$ |
17,577 |
|||||||
|
UBS U.S. Equity Opportunity Fund |
100 |
— |
|||||||||
|
UBS U.S. Large Cap Equity Fund |
100 |
— |
|||||||||
Shareholders should not use the above information to prepare their tax returns. Since the Funds fiscal year end is not the calendar year end, another notification will be sent with respect to calendar year 2015. Such notification, which will reflect the amount to be used by calendar year taxpayers on their federal income tax returns, will be made in conjunction with Form 1099 DIV and will be mailed in February 2016. Shareholders are advised to consult their own tax advisers with respect to the tax consequences of their investment in each of the Funds.
133
The UBS Funds
Fund's privacy notice
This notice describes the privacy policy of the UBS Family of Funds, the PACE Funds and all closed-end funds managed by UBS Global Asset Management (collectively, the "Funds"). The Funds are committed to protecting the personal information that they collect about individuals who are prospective, current or former investors.
The Funds collect personal information in order to process requests and transactions and to provide customer service. Personal information, which is obtained from applications and other forms or correspondence submitted to the Funds, may include name(s), address, e-mail address, telephone number, date of birth, social security number or other tax identification number, bank account information, information about your transactions and experiences with the Funds, and any affiliation a client has with UBS Financial Services Inc. or its affiliates ("Personal Information").
The Funds limit access to Personal Information to those individuals who need to know that information in order to process transactions and service accounts. These individuals are required to maintain and protect the confidentiality of Personal Information and to follow established procedures. The Funds maintain physical, electronic and procedural safeguards to protect Personal Information and to comply with applicable laws and regulations.
The Funds may share Personal Information with their affiliates to facilitate the servicing of accounts and for other business purposes, or as otherwise required or permitted by applicable law. The Funds may also share Personal Information with non-affiliated third parties that perform services for the Funds, such as vendors that provide data or transaction processing, computer software maintenance and development, and other administrative services. When the Funds share Personal Information with a non-affiliated third party, they will do so pursuant to a contract that includes provisions designed to ensure that the third party will uphold and maintain privacy standards when handling Personal Information. In addition to sharing information with non-affiliated third parties to facilitate the servicing of accounts and for other business purposes, the Funds may disclose Personal Information to non-affiliated third parties as otherwise required or permitted by applicable law. For example, the Funds may disclose Personal Information to credit bureaus or regulatory authorities to facilitate or comply with investigations; to protect against or prevent actual or potential fraud, unauthorized transactions, claims or other liabilities; or to respond to judicial or legal process, such as subpoena requests.
Except as described in this privacy notice, the Funds will not use Personal Information for any other purpose unless the Funds describe how such Personal Information will be used and clients are given an opportunity to decline approval of such use of Personal Information relating to them (or affirmatively approve the use of Personal Information, if required by applicable law). The Funds endeavor to keep their customer files complete and accurate. The Funds should be notified if any Personal Information needs to be corrected or updated. Please call 1-800-647 1568 with any questions or concerns regarding your Personal Information or this privacy notice.
Privacy Notice
This privacy notice is not a part of the shareholder report.
PRESORTED
STANDARD
U.S. POSTAGE
PAID
COMPUTERSHARE

UBS Global Asset Management (Americas) Inc.
1285 Avenue of the Americas
New York, NY 10019
S1198

UBS Fixed
Income Funds
June 30, 2015
The UBS Funds—Fixed Income
Annual Report
|
Table of contents |
|||||||
|
President's letter |
1 | ||||||
|
Market commentary |
3 | ||||||
|
Fixed Income Funds |
|||||||
|
UBS Core Plus Bond Fund |
4 | ||||||
|
UBS Fixed Income Opportunities Fund |
19 | ||||||
|
UBS Municipal Bond Fund |
36 | ||||||
|
Explanation of expense disclosure |
46 | ||||||
|
Statement of assets and liabilities |
48 | ||||||
|
Statement of operations |
52 | ||||||
|
Statement of changes in net assets |
54 | ||||||
|
Financial highlights |
56 | ||||||
|
Notes to financial statements |
61 | ||||||
|
Report of independent registered public accounting firm |
82 | ||||||
|
General information |
83 | ||||||
|
Board approval of investment advisory agreements |
84 | ||||||
|
Trustee and Officer information |
88 | ||||||
|
Federal tax information |
94 | ||||||
This page intentionally left blank.
President's letter
August 14, 2015
Dear Shareholder,
In my last letter, I wrote about the building forward momentum of the US economy against a backdrop of economic weakness outside the United States. Since I last wrote to you, the rise of two economic themes has begun to cast a shadow on the global growth story. The first of these, the continuing Greek debt crisis, appears to be on the road to resolution after an agreement was reached in July between the Greek government and its creditors. Although the risk of Greece's exit from the eurozone is somewhat reduced, substantial political and economic challenges remain. While the news of an agreement has brought relief to global markets, it is disconcerting to consider that the future of the European project has not been in such peril since the introduction of the euro in 1999.
Turning to a development that is decidedly less settled, Chinese equity markets have seen some spectacular declines in recent months, raising questions about the durability of the world's second-largest economy. The Shanghai composite index hit a high of 5,166 on June 12, before falling 30% in just three weeks. Taken together, over $3 trillion of value has been wiped away from the Shanghai and Shenzhen exchanges in a matter of weeks. China's economy grew at its slowest pace since 1990 last year, and early indicators suggest that the economy has weakened further so far into 2015. While investor confidence in China has been understandably shaken, it remains to be seen what effect these headwinds may have outside of the country.
In this global investment landscape of debt crises and shaken confidence, partnering with a knowledgeable asset manager, such as UBS Global Asset Management, can help investors avoid potential pitfalls on the path to reaching their long-term financial goals. As we continue to review the UBS family of funds with an eye toward an ever-changing investment landscape, we remain committed to providing a diverse range of solutions that can be used to create a comprehensive investment plan. Core funds—such as UBS US Large Cap Equity Fund—are the foundation on which many investors build their portfolios. Driven by fundamental research and long-term perspective, these funds used disciplined approaches that time and experience have shown can lead to successful outcomes, despite shorter-term market fluctuations and shocks.
Furthermore, we believe that flexible investment solutions can strengthen an investment plan against market shocks and declines. In this spirit, UBS Global Asset Management provides flexibly managed funds to help create well-balanced, globally diversified portfolios. In our view, flexible funds that may be less correlated to market trends and have multiple sources of revenue are an important component of a comprehensive investment plan. Many of the funds in the UBS family—such as UBS Dynamic Alpha Fund—are designed to achieve consistent returns with less reliance on favorable market conditions. When included in a comprehensive investment plan, these funds act as ballast during volatile market conditions and may have the effect of smoothing a portfolio's performance over time. As we have seen in the first half of 2015, market shocks can take any number of forms and can originate in any corner of the world. In today's market environment, we believe it is crucial that investors diversify their holdings within the context of a carefully considered plan. When combined in the context of such a plan, UBS Global Asset Management's foundational and flexible funds can assist investors in obtaining peace of mind while looking toward the future.
In my correspondence over the years, I have written at considerable length about the importance of having a sound investment plan. Creating an investment plan with a knowledgeable financial advisor is an opportunity to envision the future that you would like to have, while being cognizant of the potential challenges that lie ahead. At UBS Global Asset Management, we believe that in managing our funds we create more than investment returns: we help our clients achieve their goals. As we continue to evolve our funds to provide stable returns in a variety of market conditions, we rely on our firm's client-oriented culture to guide everything we do. With over 30 years of
1
President's letter
experience in active investment management, UBS Global Asset Management is ready to serve you with our family of funds and knowledgeable professionals as we look toward the future, a future we create together.
Sincerely,

Mark E. Carver
President
The UBS Funds
Managing Director
UBS Global Asset Management (Americas) Inc.
Mutual funds are sold by prospectus only. You should read it carefully and consider a fund's investment objectives, risks, charges, expenses and other important information contained in the prospectus before investing. A prospectus or summary prospectus for the funds can be obtained from your financial advisor, by calling UBS Funds at 800-647 1568 or by visiting our Web site at www.ubs.com.
2
The markets in review
Global growth generally improves
Growth in the US fluctuated during the reporting period. The US Commerce Department reported that gross domestic product ("GDP") expanded at a 4.3% seasonally adjusted annualized rate during the third quarter of 2014. GDP growth then moderated to 2.1% during the fourth quarter and 0.6% for the first quarter of 2015, partially due to severe winter weather in parts of the country. However, the economy then improved, as the Commerce Department's initial estimate for second quarter GDP was 2.3%.1
The US Federal Reserve Board largely maintained its accommodative monetary policy during the reporting period. The central bank continued to hold the fed funds rate at a historically low range between 0% and 0.25%. (The federal funds rate, or the "fed funds rate," is the rate banks charge one another for funds they borrow on an overnight basis.) However, at the Fed's meeting in October 2014, it said that it had concluded its asset purchase program, also known as quantitative easing. At its March 2015 meeting, the Fed said that it "anticipates that it will be appropriate to raise the target range for the federal funds rate when it has seen further improvement in the labor market and is reasonably confident that inflation will move back to its 2% objective over the medium term." Finally, at the central bank's meeting that concluded in June 2015, the Fed said that it "currently anticipates that, even after employment and inflation are near mandate-consistent levels, economic conditions may, for some time, warrant keeping the target federal funds rate below levels the Committee views as normal in the longer run."
In terms of the global economy, the International Monetary Fund's ("IMF") July 2015 World Economic Outlook Update, released after the reporting period ended, said that "a setback to activity in the first quarter of 2015, mostly in North America, has resulted in a small downward revision to global growth for 2015 relative to the April 2015 World Economic Outlook. Nevertheless, the underlying drivers for a gradual acceleration in economic activity in advanced economies—easy financial conditions, more neutral fiscal policy in the euro area, lower fuel prices, and improving confidence and labor market conditions—remain intact." The IMF projects that 2015 growth in the eurozone will be 1.5%, versus 0.8% in 2014. Japan's economy is expected to expand 0.8% in 2015, an improvement from the 0.1% contraction in 2014. In contrast, the IMF sees growth in emerging market countries decelerating in 2015, with GDP of 4.2% compared to 4.6% in 2014.
Mixed returns in the fixed income market
The global fixed income markets experienced periods of volatility during the reporting period. This was triggered by incoming economic data, uncertainties surrounding future monetary policy and geopolitical events, including the escalating crisis in Greece. Against this backdrop, the yield on the 10-year Treasury fell from 2.53% to 2.35% during the reporting period and the overall US bond market, as measured by the Barclays US Aggregate Index,2 gained 1.86%. A sharp sell-off late in the reporting period pushed the returns of riskier fixed income securities into negative territory for the 12 months ended June 30, 2015. High yield bonds, as measured by the BofA Merrill Lynch US High Yield Cash Pay Constrained Index3 declined 0.52% during the reporting period. Emerging markets debt, as measured by the J.P. Morgan Emerging Markets Bond Index Global (EMBI Global),4 fell 1.57%.
1 Based on the Commerce Department's initial estimate announced on July 30, 2015, after the reporting period had ended.
2 The Barclays US Aggregate Index is an unmanaged broad based index designed to measure the US dollar-denominated, investment-grade, taxable bond market. The index includes bonds from the Treasury, government-related, corporate, mortgage-backed, asset-backed and commercial mortgage-backed sectors. Investors should note that indices do not reflect the deduction of fees and expenses.
3 The BofA Merrill Lynch US High Yield Cash Pay Constrained Index is an unmanaged index of publicly placed, non-convertible, coupon-bearing US dollar denominated, below investment grade corporate debt with a term to maturity of at least one year. The index is market capitalization weighted, so that larger bond issuers have a greater effect on the index's return. However, the representation of any single bond issuer is restricted to a maximum of 2% of the total index. Investors should note that indices do not reflect the deduction of fees and expenses.
4 The J.P. Morgan Emerging Markets Bond Index Global (EMBI Global) is an unmanaged index which is designed to track total returns for US dollar denominated debt instruments issued by emerging market sovereign and quasi-sovereign entities: Brady bonds, loans and Eurobonds. Investors should note that indices do not reflect the deduction of fees and expenses.
3
UBS Core Plus Bond Fund
Portfolio performance
For the 12 months ended June 30, 2015, Class A shares of UBS Core Plus Bond Fund (the "Fund") gained 1.69% (Class A shares returned -2.86% after the deduction of the maximum sales charge), while Class P shares rose 1.84%. The Fund's benchmark, the Barclays US Aggregate Index (the "Index"), returned 1.86% over the same time period. (Class P shares have lower expenses than other share classes of the Fund. Returns for all share classes over various time periods are shown on page 6; please note that the Fund's returns do not reflect the deduction of taxes that a shareholder would pay on Fund distributions or the redemption of Fund shares, while the Index returns do not reflect the deduction of fees and expenses.)
The Fund posted a positive return during the reporting period but modestly underperformed the benchmark, primarily due to duration positioning and exposure to energy-related companies.
The Fund used derivatives during the reporting period. Certain interest rate derivatives were utilized to facilitate specific duration and yield curve strategies. Credit derivatives (such as credit default swaps and options on credit default swaps) were used to implement specific credit-related investment strategies as part of the Fund's sector allocation and security selection. Throughout the period, the Fund engaged in foreign exchange forwards to help implement its active currency positions. While derivatives play a role in the overall portfolio construction process, they are just one of the tools we use to manage the Fund's overall risk exposure and to implement the aforementioned strategies.
Portfolio performance summary1
What worked:
• Currency positioning was additive to performance. The Fund's exposure to the US dollar against a basket of developed market currencies contributed to performance. At various times during the reporting period, the Fund was long the US dollar against the euro, Japanese yen, Swiss franc, New Zealand dollar, Australian dollar and British pound. The US dollar index appreciated during the period for nine consecutive months and reached a 12-year high against the euro during the reporting period.
• Yield curve positioning was additive to performance. The Fund was positioned to benefit from a flattening of the yield curve in the first half of the reporting period. (When the yield curve flattens, yields on longer maturity bonds decline more than those of shorter maturity instruments, so that the spread between the two narrows.) This played out during the first half of the reporting period, as shorter-term yields modestly increased as investors started to price in the likelihood of rate hikes by the Federal Reserve Board ("Fed"), while longer-term yields declined given strong overseas demand.
• The Fund's securitized exposure was additive to performance. Sector exposure and security selection within commercial mortgage-backed securities (CMBS) and agency pass-throughs contributed to performance during the reporting period. The Fund was generally overweight mortgages given strong market technicals (e.g., Fed quantitative easing purchases) that were supportive to spreads. Within CMBS, the Fund favored select AA-rated and A-rated tranches as well as single asset/single borrower (SASB) deals, all of which performed well during the reporting period due to continued improvement in fundamentals.
1 For a detailed commentary on the market environment in general during the reporting period, see page 2.
4
UBS Core Plus Bond Fund
What didn't work:
• The Fund's allocation to corporate credit detracted from performance. The Fund's allocation to both investment grade and high yield corporate debt was negative for performance, as corporate spreads widened during the reporting period. Security selection in the energy sector also detracted from performance, as the sharp fall in the price of oil led to weak results for companies in oil-related industries. High yield energy credits, in particular, underperformed due to the drop in the price of oil. The negative performance from security selection was partially offset by beta index hedging.
• The Fund's overall duration positioning detracted from performance. During the reporting period, the Fund was generally underweight duration relative to the benchmark on the belief that interest rates would rise given an expectation of continued improvement in the US economy. Interest rates, however, fell during the first half of the reporting period due to increasing overseas demand for US Treasuries and a slowdown in the US economic recovery.
This letter is intended to assist shareholders in understanding how the Fund performed during the 12 months ended June 30, 2015. The views and opinions in the letter were current as of August 14, 2015. They are not guarantees of future performance or investment results and should not be taken as investment advice. Investment decisions reflect a variety of factors, and we reserve the right to change our views about individual securities, sectors and markets at any time. As a result, the views expressed should not be relied upon as a forecast of the Fund's future investment intent. We encourage you to consult your financial advisor regarding your personal investment program.
Mutual funds are sold by prospectus only. You should read it carefully and consider a fund's investment objectives, risks, charges, expenses and other important information contained in the prospectus before investing. Prospectuses for most of our funds can be obtained from your financial advisor, by calling UBS Funds at 800-647 1568 or by visiting our Web site at www.ubs.com.
5
UBS Core Plus Bond Fund
Average annual total returns for periods ended 06/30/15 (unaudited)
|
1 year |
5 years |
10 years |
|||||||||||||
|
Before deducting maximum sales charge |
|||||||||||||||
|
Class A1 |
1.69 |
% |
3.98 |
% |
2.52 |
% |
|||||||||
|
Class C2 |
1.19 |
3.47 |
2.00 |
||||||||||||
|
Class P3 |
1.84 |
4.22 |
2.77 |
||||||||||||
|
After deducting maximum sales charge |
|||||||||||||||
|
Class A1 |
(2.86 |
)% |
3.02 |
% |
2.05 |
% |
|||||||||
|
Class C2 |
0.45 |
3.47 |
2.00 |
||||||||||||
|
Barclays US Aggregate Index4 |
1.86 |
% |
3.35 |
% |
4.44 |
% |
|||||||||
The annualized gross and net expense ratios, respectively, for each class of shares as in the October 28, 2014 prospectuses were as follows: Class A—1.70% and 0.65%; Class C—2.29% and 1.15%; Class P—1.39% and 0.40%. Net expenses reflect fee waivers and/or expense reimbursements, if any, pursuant to an agreement that is in effect to cap the expenses. The Trust, with respect to the Fund, and UBS Global Asset Management (Americas) Inc., the Fund's investment advisor ("UBS Global AM (Americas)" or the "Advisor"), have entered into a written agreement pursuant to which the Advisor has agreed to waive a portion of its management fees and/or to reimburse expenses (excluding expenses incurred through investment in other investment companies, interest, taxes, brokerage commissions and extraordinary expenses) to the extent necessary so that the Fund's ordinary operating expenses (excluding expenses incurred through investment in other investment companies, interest, taxes, brokerage commissions and extraordinary expenses), through the period ending October 27, 2015, do not exceed 0.64% for Class A shares, 1.14% for Class C shares and 0.39% for Class P shares. Pursuant to the written agreement, the Advisor is entitled to be reimbursed for any fees it waives and expenses it reimburses for a period of three years following such fee waivers and expense reimbursements to the extent that such reimbursement of the Advisor by the Fund will not cause the Fund to exceed any applicable expense limit that is in place for the Fund. The fee waiver/expense reimbursement agreement may be terminated by the Fund's Board of Trustees at any time and also will terminate automatically upon the expiration or termination of the Fund's advisory contract with the Advisor. Upon termination of the fee waiver/expense reimbursement agreement, however, UBS Global AM (Americas)'s three year recoupment rights will survive.
1 Maximum sales charge for Class A shares is 4.5%. Class A shares bear ongoing 12b-1 service fees.
2 Maximum contingent deferred sales charge for Class C shares is 0.75% imposed on redemptions and is reduced to 0% after one year. Class C shares bear ongoing 12b-1 distribution and service fees.
3 Class P shares do not bear initial or contingent deferred sales charges or ongoing 12b-1 service and distribution fees, but Class P shares held through advisory programs may be subject to a program fee, which, if included, would have reduced performance.
4 The Barclays US Aggregate Index is an unmanaged broad based index designed to measure the US dollar-denominated, investment-grade, taxable bond market. The index includes bonds from the Treasury, government-related, corporate, mortgage-backed, asset-backed and commercial mortgage-backed sectors. Investors should note that indices do not reflect the deduction of fees and expenses.
Prior to February 17, 2015, if an investor sold or exchanged shares less than 90 days after purchase, a redemption fee of 1.00% of the amount sold or exchanged was deducted at the time of the transaction, except as noted otherwise in the prospectus. For sales or exchanges taking place on or after February 17, 2015 but prior to August 3, 2015, there is a reduction in the redemption holding period from 90 days to 30 days. Effective August 3, 2015, the 1.00% redemption fee imposed on sales or exchanges of any class of shares of the funds made during the holding periods specified in the prospectus will be eliminated. Please refer to the prospectus for further information.
Past performance does not predict future performance, and the performance information provided does not reflect the deduction of taxes that a shareholder would pay on Fund distributions or the redemption of Fund shares. The return and principal value of an investment will fluctuate, so that an investor's shares, when redeemed, may be worth more or less than their original cost. Performance results assume reinvestment of all dividends and capital gain distributions at net asset value on the ex-dividend dates. Current performance may be higher or lower than the performance data quoted. For month-end performance figures, please visit http://globalam-us.ubs.com/corpweb/performance.do.
6
UBS Core Plus Bond Fund
Illustration of an assumed investment of $10,000 in Class A shares (adjusted for 4.5% maximum sales charge) and $5,000,000 in Class P shares (unaudited)
The following two graphs depict the performance of UBS Core Plus Bond Fund Class A and Class P shares versus the Barclays US Aggregate Index over the 10 years ended June 30, 2015. The performance of Class C shares will vary based upon the different class specific expenses and sales charges. The performance provided does not reflect the deduction of taxes that a shareholder would pay on Fund distributions or the redemption of Fund shares. Past performance is no guarantee of future results. Share price and returns will vary with market conditions; investors may realize a gain or loss upon redemption.
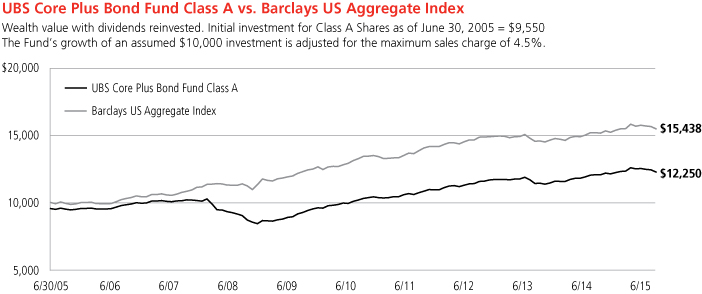
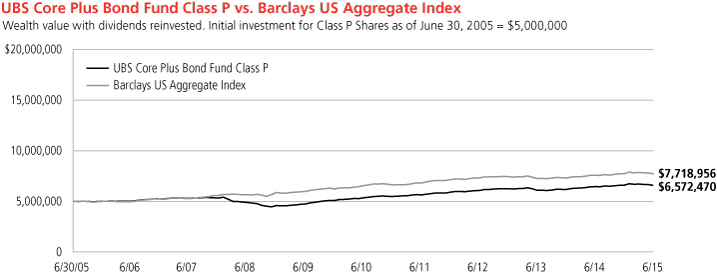
Past performance does not predict future performance, and the performance information provided does not reflect the deduction of taxes that a shareholder would pay on Fund distributions or the redemption of Fund shares. The return and principal value of an investment will fluctuate, so that an investor's shares, when redeemed, may be worth more or less than their original cost. Performance results assume reinvestment of all dividends and capital gain distributions at net asset value on the ex-dividend dates. Current performance may be higher or lower than the performance data quoted. For month-end performance figures, please visit http://globalam-us.ubs.com/corpweb/performance.do.
7
UBS Core Plus Bond Fund
Top ten long-term fixed income holdings (unaudited)
As of June 30, 2015
|
Percentage of net assets |
|||||||
|
US Treasury Notes, 0.625%, due 12/31/16 |
4.1 |
% |
|||||
|
Government National Mortgage Association Pools, 4.000%, TBA |
4.0 |
||||||
|
Federal National Mortgage Association Pools, 3.000%, TBA |
3.7 |
||||||
|
Federal National Mortgage Association Pools, 3.500%, TBA |
3.4 |
||||||
|
US Treasury Inflation Indexed Notes (TIPS), 0.125%, due 04/15/20 |
3.1 |
||||||
|
US Treasury Notes, 1.750%, due 03/31/22 |
2.9 |
||||||
|
US Treasury Notes, 1.750%, due 04/30/22 |
2.7 |
||||||
|
US Treasury Notes, 0.625%, due 05/31/17 |
2.6 |
||||||
|
Federal National Mortgage Association Pools, 3.500%, TBA |
2.4 |
||||||
|
Federal National Mortgage Association Pools, 4.500%, TBA |
2.2 |
||||||
|
Total |
31.1 |
% |
|||||
Industry diversification (unaudited)
As a percentage of net assets as of June 30, 2015
|
Bonds |
|||||||
|
Corporate bonds |
|||||||
|
Air freight & logistics |
0.14 |
% |
|||||
|
Automobiles |
0.12 |
||||||
|
Banks |
3.18 |
||||||
|
Biotechnology |
0.16 |
||||||
|
Building products |
0.13 |
||||||
|
Capital markets |
1.12 |
||||||
|
Chemicals |
0.12 |
||||||
|
Commercial services & supplies |
0.28 |
||||||
|
Consumer finance |
0.48 |
||||||
|
Diversified financial services |
0.63 |
||||||
|
Diversified telecommunication services |
1.63 |
||||||
|
Electric utilities |
0.90 |
||||||
|
Electronic equipment, instruments & components |
0.25 |
||||||
|
Energy equipment & services |
0.22 |
||||||
|
Food & staples retailing |
0.16 |
||||||
|
Food products |
0.29 |
||||||
|
Health care equipment & supplies |
0.16 |
||||||
|
Health care providers & services |
0.03 |
||||||
|
Hotels, restaurants & leisure |
0.53 |
||||||
|
Independent power and renewable electricity producers |
0.36 |
||||||
|
Insurance |
1.33 |
||||||
|
Internet & catalog retail |
0.18 |
||||||
|
IT services |
0.27 |
||||||
|
Machinery |
0.39 |
||||||
|
Media |
1.84 |
||||||
|
Metals & mining |
1.72 |
||||||
|
Multiline retail |
0.15 |
||||||
|
Multi-utilities |
0.40 |
||||||
|
Oil, gas & consumable fuels |
4.82 |
||||||
|
Paper & forest products |
0.09 |
||||||
|
Pharmaceuticals |
0.74 |
||||||
|
Real estate investment trust (REIT) |
0.68 |
||||||
|
Road & rail |
0.56 |
||||||
|
Specialty retail |
0.16 |
||||||
|
Technology hardware, storage & peripherals |
0.12 |
||||||
|
Tobacco |
0.60 |
||||||
|
Trading companies & distributors |
0.31 |
||||||
|
Total corporate bonds |
25.25 |
% |
|||||
|
Asset-backed securities |
4.92 |
||||||
|
Commercial mortgage-backed securities |
8.13 |
||||||
|
Mortgage & agency debt securities |
31.30 |
||||||
|
Municipal bonds |
1.62 |
||||||
|
US government obligations |
22.68 |
||||||
|
Non-US government obligations |
2.61 |
||||||
|
Total bonds |
96.51 |
% |
|||||
|
Short-term investment |
26.18 |
||||||
|
Options purchased |
0.03 |
||||||
|
Investment of cash collateral from securities loaned |
0.50 |
||||||
|
Total investments |
123.22 |
% |
|||||
|
Liabilities, in excess of cash and other assets |
(23.22 |
) |
|||||
|
Net assets |
100.00 |
% |
|||||
8
UBS Core Plus Bond Fund
Portfolio of investments
June 30, 2015
|
Face amount |
Value |
||||||||||
|
Bonds: 96.51% |
|||||||||||
|
Corporate bonds: 25.25% |
|||||||||||
|
Brazil: 1.53% |
|||||||||||
|
Caixa Economica Federal, 2.375%, due 11/06/171 |
$ |
150,000 |
$ |
144,375 |
|||||||
|
Petrobras Global Finance BV, 3.250%, due 03/17/17 |
150,000 |
147,951 |
|||||||||
|
5.375%, due 01/27/21 |
120,000 |
115,197 |
|||||||||
|
Vale Overseas Ltd., 4.375%, due 01/11/222 |
85,000 |
82,852 |
|||||||||
|
Total Brazil corporate bonds |
490,375 |
||||||||||
|
Canada: 0.92% |
|||||||||||
|
Anadarko Finance Co., Series B, 7.500%, due 05/01/312 |
70,000 |
87,658 |
|||||||||
|
Barrick Gold Corp., 3.850%, due 04/01/22 |
130,000 |
126,001 |
|||||||||
|
Talisman Energy, Inc., 3.750%, due 02/01/21 |
50,000 |
49,499 |
|||||||||
|
Teck Resources Ltd., 6.250%, due 07/15/41 |
40,000 |
32,189 |
|||||||||
|
Total Canada corporate bonds |
295,347 |
||||||||||
|
China: 0.63% |
|||||||||||
|
Sinopec Group Overseas Development 2013 Ltd., 2.500%, due 10/17/181 |
200,000 |
201,532 |
|||||||||
|
France: 0.16% |
|||||||||||
|
Total Capital International SA, 3.750%, due 04/10/24 |
50,000 |
51,731 |
|||||||||
|
Germany: 0.64% |
|||||||||||
|
Unitymedia Hessen GmbH & Co. KG, 5.500%, due 01/15/231 |
200,000 |
203,875 |
|||||||||
|
Ireland: 0.08% |
|||||||||||
|
XL Group PLC, 6.375%, due 11/15/24 |
21,000 |
24,750 |
|||||||||
|
Israel: 0.33% |
|||||||||||
|
Teva Pharmaceutical Finance Co. BV, 2.400%, due 11/10/16 |
70,000 |
71,203 |
|||||||||
|
Teva Pharmaceutical Finance IV BV, 3.650%, due 11/10/21 |
34,000 |
34,570 |
|||||||||
|
Total Israel corporate bonds |
105,773 |
||||||||||
|
Luxembourg: 0.42% |
|||||||||||
|
ArcelorMittal, 6.250%, due 03/01/21 |
70,000 |
73,325 |
|||||||||
|
Intelsat Jackson Holdings SA, 7.500%, due 04/01/21 |
60,000 |
59,325 |
|||||||||
|
Total Luxembourg corporate bonds |
132,650 |
||||||||||
|
Face amount |
Value |
||||||||||
|
Mexico: 0.40% |
|||||||||||
|
Petroleos Mexicanos, 4.875%, due 01/24/22 |
$ |
75,000 |
$ |
77,803 |
|||||||
|
6.375%, due 01/23/45 |
50,000 |
51,062 |
|||||||||
|
Total Mexico corporate bonds |
128,865 |
||||||||||
|
Netherlands: 0.12% |
|||||||||||
|
LYB International Finance BV, 4.875%, due 03/15/44 |
40,000 |
38,863 |
|||||||||
|
Norway: 0.37% |
|||||||||||
|
Eksportfinans ASA, 5.500%, due 06/26/17 |
80,000 |
84,775 |
|||||||||
|
Statoil ASA, 4.800%, due 11/08/43 |
30,000 |
31,763 |
|||||||||
|
Total Norway corporate bonds |
116,538 |
||||||||||
|
Spain: 0.48% |
|||||||||||
|
Telefonica Emisiones SAU, 3.192%, due 04/27/18 |
150,000 |
154,086 |
|||||||||
|
United Kingdom: 1.07% |
|||||||||||
|
HSBC Holdings PLC, 6.500%, due 09/15/37 |
100,000 |
120,672 |
|||||||||
|
Imperial Tobacco Finance PLC, 3.500%, due 02/11/231 |
110,000 |
107,047 |
|||||||||
|
Lloyds Bank PLC, 6.500%, due 09/14/201 |
100,000 |
115,261 |
|||||||||
|
Total United Kingdom corporate bonds |
342,980 |
||||||||||
|
United States: 18.10% |
|||||||||||
|
21st Century Fox America, Inc., 6.200%, due 12/15/34 |
35,000 |
40,621 |
|||||||||
|
AbbVie, Inc., 2.500%, due 05/14/20 |
40,000 |
39,590 |
|||||||||
|
Actavis Funding SCS, 3.800%, due 03/15/25 |
20,000 |
19,646 |
|||||||||
|
ADT Corp., 3.500%, due 07/15/22 |
100,000 |
90,500 |
|||||||||
|
Altria Group, Inc., 5.375%, due 01/31/44 |
25,000 |
26,443 |
|||||||||
|
9.950%, due 11/10/38 |
18,000 |
28,984 |
|||||||||
|
AvalonBay Communities, Inc., 3.450%, due 06/01/25 |
40,000 |
39,333 |
|||||||||
|
Bank of America Corp., 4.200%, due 08/26/24 |
70,000 |
69,831 |
|||||||||
|
6.110%, due 01/29/37 |
100,000 |
112,082 |
|||||||||
|
Berkshire Hathaway Energy Co., 5.150%, due 11/15/43 |
30,000 |
32,018 |
|||||||||
|
Boston Properties LP, REIT, 3.800%, due 02/01/24 |
60,000 |
60,721 |
|||||||||
|
Burlington Northern Santa Fe LLC, 5.150%, due 09/01/43 |
90,000 |
96,761 |
|||||||||
9
UBS Core Plus Bond Fund
Portfolio of investments
June 30, 2015
|
Face amount |
Value |
||||||||||
|
Bonds—(Continued) |
|||||||||||
|
Corporate bonds—(Continued) |
|||||||||||
|
United States—(Continued) |
|||||||||||
|
Case New Holland Industrial, Inc., 7.875%, due 12/01/17 |
$ |
85,000 |
$ |
93,075 |
|||||||
|
Caterpillar, Inc., 5.200%, due 05/27/41 |
30,000 |
33,199 |
|||||||||
|
Celgene Corp., 4.000%, due 08/15/23 |
50,000 |
51,141 |
|||||||||
|
Chesapeake Energy Corp., 6.625%, due 08/15/20 |
70,000 |
68,250 |
|||||||||
|
CIT Group, Inc., 5.500%, due 02/15/191 |
70,000 |
72,975 |
|||||||||
|
Continental Resources, Inc., 4.900%, due 06/01/44 |
50,000 |
42,110 |
|||||||||
|
DIRECTV Holdings LLC, 6.000%, due 08/15/40 |
80,000 |
83,020 |
|||||||||
|
DISH DBS Corp., 7.875%, due 09/01/19 |
70,000 |
77,630 |
|||||||||
|
Dollar General Corp., 3.250%, due 04/15/23 |
50,000 |
47,637 |
|||||||||
|
DPL, Inc., 7.250%, due 10/15/21 |
85,000 |
89,675 |
|||||||||
|
DTE Electric Co., 3.700%, due 03/15/45 |
25,000 |
22,600 |
|||||||||
|
Energy Transfer Partners LP, 9.000%, due 04/15/19 |
130,000 |
155,976 |
|||||||||
|
ERAC USA Finance LLC, 2.800%, due 11/01/181 |
80,000 |
81,602 |
|||||||||
|
ERP Operating LP, REIT, 4.750%, due 07/15/20 |
35,000 |
38,557 |
|||||||||
|
Exelon Generation Co. LLC, 2.950%, due 01/15/20 |
105,000 |
105,363 |
|||||||||
|
FedEx Corp., 3.875%, due 08/01/42 |
50,000 |
43,281 |
|||||||||
|
FirstEnergy Transmission LLC, 5.450%, due 07/15/441 |
40,000 |
41,640 |
|||||||||
|
Flextronics International Ltd., 5.000%, due 02/15/23 |
80,000 |
81,212 |
|||||||||
|
Ford Motor Co., 7.450%, due 07/16/31 |
30,000 |
38,334 |
|||||||||
|
Ford Motor Credit Co. LLC, 8.125%, due 01/15/20 |
125,000 |
152,648 |
|||||||||
|
Frontier Communications Corp., 8.500%, due 04/15/20 |
80,000 |
83,640 |
|||||||||
|
General Electric Capital Corp., Series A, 6.750%, due 03/15/32 |
40,000 |
51,930 |
|||||||||
|
Glencore Funding LLC, 2.500%, due 01/15/191 |
120,000 |
118,653 |
|||||||||
|
Goldman Sachs Group, Inc., 5.150%, due 05/22/45 |
30,000 |
28,942 |
|||||||||
|
5.750%, due 01/24/22 |
80,000 |
90,997 |
|||||||||
|
6.150%, due 04/01/18 |
100,000 |
111,188 |
|||||||||
|
Face amount |
Value |
||||||||||
|
Hartford Financial Services Group, Inc., 5.950%, due 10/15/36 |
$ |
80,000 |
$ |
90,747 |
|||||||
|
HJ Heinz Co., 5.200%, due 07/15/451 |
50,000 |
51,241 |
|||||||||
|
International Lease Finance Corp., 7.125%, due 09/01/181 |
90,000 |
100,350 |
|||||||||
|
International Paper Co., 3.800%, due 01/15/262 |
30,000 |
29,394 |
|||||||||
|
JPMorgan Chase & Co., 3.875%, due 09/10/24 |
140,000 |
137,747 |
|||||||||
|
Kinder Morgan Energy Partners LP, 3.950%, due 09/01/22 |
75,000 |
73,343 |
|||||||||
|
5.000%, due 10/01/21 |
80,000 |
84,651 |
|||||||||
|
6.500%, due 09/01/39 |
45,000 |
46,142 |
|||||||||
|
Kinder Morgan, Inc., 5.550%, due 06/01/45 |
25,000 |
23,107 |
|||||||||
|
Kroger Co., 3.850%, due 08/01/23 |
50,000 |
51,287 |
|||||||||
|
Lincoln National Corp., 7.000%, due 06/15/40 |
50,000 |
62,713 |
|||||||||
|
Lowe's Cos., Inc., 4.650%, due 04/15/42 |
50,000 |
51,550 |
|||||||||
|
Masco Corp., 4.450%, due 04/01/25 |
40,000 |
40,100 |
|||||||||
|
Morgan Stanley, 4.350%, due 09/08/26 |
60,000 |
58,793 |
|||||||||
|
Series J, 5.550%, due 07/15/203,4 |
70,000 |
69,492 |
|||||||||
|
NRG Energy, Inc., 8.250%, due 09/01/20 |
10,000 |
10,475 |
|||||||||
|
PNC Preferred Funding Trust I, 1.936%, due 03/15/171,3,4 |
100,000 |
91,000 |
|||||||||
|
PPL Capital Funding, Inc., 3.950%, due 03/15/24 |
80,000 |
82,721 |
|||||||||
|
Principal Financial Group, Inc., 8.875%, due 05/15/19 |
90,000 |
110,795 |
|||||||||
|
Private Export Funding Corp., 2.300%, due 09/15/20 |
150,000 |
150,832 |
|||||||||
|
Prudential Financial, Inc., 5.200%, due 03/15/443 |
95,000 |
94,098 |
|||||||||
|
6.625%, due 12/01/37 |
34,000 |
41,011 |
|||||||||
|
QVC, Inc., 4.450%, due 02/15/25 |
60,000 |
57,897 |
|||||||||
|
Regions Financial Corp., 2.000%, due 05/15/18 |
70,000 |
69,953 |
|||||||||
|
Reynolds American, Inc., 3.250%, due 11/01/22 |
30,000 |
28,895 |
|||||||||
|
Seagate HDD Cayman, 5.750%, due 12/01/341 |
40,000 |
39,385 |
|||||||||
|
Sempra Energy, 9.800%, due 02/15/19 |
75,000 |
94,198 |
|||||||||
|
Southern Copper Corp., 3.500%, due 11/08/22 |
50,000 |
48,680 |
|||||||||
10
UBS Core Plus Bond Fund
Portfolio of investments
June 30, 2015
|
Face amount |
Value |
||||||||||
|
Bonds—(Continued) |
|||||||||||
|
Corporate bonds—(Concluded) |
|||||||||||
|
United States—(Concluded) |
|||||||||||
|
Southwestern Electric Power Co., 3.550%, due 02/15/22 |
$ |
50,000 |
$ |
51,552 |
|||||||
|
Sprint Capital Corp., 6.900%, due 05/01/19 |
70,000 |
71,400 |
|||||||||
|
Starwood Hotels & Resorts Worldwide, Inc., 4.500%, due 10/01/34 |
50,000 |
46,617 |
|||||||||
|
TCI Communications, Inc., 7.875%, due 02/15/26 |
50,000 |
67,433 |
|||||||||
|
Tenet Healthcare Corp., 6.000%, due 10/01/20 |
10,000 |
10,662 |
|||||||||
|
Time Warner Cable, Inc., 6.550%, due 05/01/37 |
35,000 |
36,436 |
|||||||||
|
Time Warner Entertainment Co. LP, 8.375%, due 03/15/23 |
85,000 |
105,665 |
|||||||||
|
Time Warner, Inc., 6.100%, due 07/15/40 |
35,000 |
39,363 |
|||||||||
|
Transocean, Inc., 4.300%, due 10/15/222 |
95,000 |
71,488 |
|||||||||
|
Tyson Foods, Inc., 4.875%, due 08/15/34 |
40,000 |
40,250 |
|||||||||
|
Valeant Pharmaceuticals International, 7.000%, due 10/01/201 |
70,000 |
72,800 |
|||||||||
|
Valero Energy Corp., 6.625%, due 06/15/37 |
90,000 |
101,647 |
|||||||||
|
Ventas Realty LP, 2.700%, due 04/01/20 |
80,000 |
79,763 |
|||||||||
|
Verizon Communications, Inc., 2.036%, due 09/14/183 |
50,000 |
51,727 |
|||||||||
|
4.522%, due 09/15/481 |
107,000 |
94,001 |
|||||||||
|
6.400%, due 09/15/33 |
7,000 |
8,022 |
|||||||||
|
Williams Cos., Inc., 3.700%, due 01/15/23 |
90,000 |
83,800 |
|||||||||
|
Williams Partners LP, 4.300%, due 03/04/24 |
50,000 |
49,176 |
|||||||||
|
Wyndham Worldwide Corp., 5.625%, due 03/01/21 |
110,000 |
120,491 |
|||||||||
|
Xerox Corp., 3.800%, due 05/15/242 |
90,000 |
86,093 |
|||||||||
|
Zimmer Biomet Holdings, Inc., 4.450%, due 08/15/45 |
60,000 |
55,035 |
|||||||||
|
Total United States corporate bonds |
5,795,823 |
||||||||||
|
Total corporate bonds (cost $8,200,483) |
8,083,188 |
||||||||||
|
Asset-backed securities: 4.92% |
|||||||||||
|
United States: 4.92% |
|||||||||||
|
AmeriCredit Automobile Receivables Trust, Series 2014-1, Class D, 2.540%, due 06/08/20 |
125,000 |
124,567 |
|||||||||
|
Face amount |
Value |
||||||||||
|
Series 2013-5, Class D, 2.860%, due 12/09/19 |
$ |
125,000 |
$ |
126,349 |
|||||||
|
Capital Auto Receivables Asset Trust, Series 2013-3, Class B, 2.320%, due 07/20/18 |
150,000 |
152,073 |
|||||||||
|
Series 2014-1, Class C, 2.840%, due 04/22/19 |
155,000 |
157,312 |
|||||||||
|
Ford Credit Auto Owner Trust, Series 2014-A, Class C, 1.900%, due 09/15/19 |
175,000 |
176,849 |
|||||||||
|
Renaissance Home Equity Loan Trust, Series 2006-4, Class AF1, 5.545%, due 01/25/375 |
39,028 |
23,183 |
|||||||||
|
Santander Drive Auto Receivables Trust, Series 2014-1, Class C, 2.360%, due 04/15/20 |
155,000 |
156,057 |
|||||||||
|
Series 2014-2, Class D, 2.760%, due 02/18/20 |
175,000 |
176,243 |
|||||||||
|
Series 2015-3, Class D, 3.490%, due 05/17/21 |
150,000 |
150,556 |
|||||||||
|
Series 2012-4, Class D, 3.500%, due 06/15/18 |
100,000 |
102,707 |
|||||||||
|
Synchrony Credit Card Master Note Trust, Series 2012-6, Class A, 1.360%, due 08/17/20 |
230,000 |
229,844 |
|||||||||
|
Total asset-backed securities (cost $1,585,634) |
1,575,740 |
||||||||||
|
Commercial mortgage-backed securities: 8.13% |
|||||||||||
|
United States: 8.13% |
|||||||||||
|
Americold 2010 LLC Trust, Series 2010-ARTA, Class C, 6.811%, due 01/14/291 |
100,000 |
114,249 |
|||||||||
|
Boca Hotel Portfolio Trust, Series 2013-BOCA, Class D, 3.236%, due 08/15/261,3 |
150,000 |
149,911 |
|||||||||
|
CDGJ Commercial Mortgage Trust, Series 2014-BXCH, Class DPA, 3.184%, due 12/15/271,3 |
100,000 |
99,728 |
|||||||||
|
CG-CCRE Commercial Mortgage Trust, Series 2014-FL1, Class C, 1.936%, due 06/15/311,3 |
125,000 |
124,034 |
|||||||||
|
Commercial Mortgage Loan Trust, Series 2015-DC1, Class A5, 3.350%, due 02/10/48 |
100,000 |
99,795 |
|||||||||
|
Series 2014-LC15, Class C, 5.109%, due 04/10/473 |
150,000 |
157,159 |
|||||||||
|
Series 2013-LC13, Class C, 5.215%, due 08/10/461,3 |
200,000 |
215,152 |
|||||||||
|
Commercial Mortgage Pass Through Certificates, Series 2013-GAM, Class B, 3.531%, due 02/10/281,3 |
200,000 |
201,962 |
|||||||||
11
UBS Core Plus Bond Fund
Portfolio of investments
June 30, 2015
|
Face amount |
Value |
||||||||||
|
Bonds—(Continued) |
|||||||||||
|
Commercial mortgage-backed securities—(Concluded) |
|||||||||||
|
United States—(Concluded) |
|||||||||||
|
CSAIL Commercial Mortgage Trust, Series 2015-C1, Class A4, 3.505%, due 04/15/50 |
$ |
150,000 |
$ |
153,030 |
|||||||
|
CSMC Trust, Series 2015-DEAL, Class D, 3.286%, due 04/15/291,3 |
100,000 |
99,525 |
|||||||||
|
FDIC Structured Sale Guaranteed Notes, Series 2010-C1, Class A, 2.980%, due 12/06/201 |
95,617 |
97,850 |
|||||||||
|
GAHR Commercial Mortgage Trust, Series 2015-NRF, Class CFX, 3.495%, due 12/15/191,3 |
150,000 |
148,930 |
|||||||||
|
GS Mortgage Securities Trust, Series 2014-GSFL, Class D, 4.084%, due 07/15/311,3 |
175,000 |
173,296 |
|||||||||
|
Hilton USA Trust, Series 2013-HLT, Class DFX, 4.407%, due 11/05/301 |
100,000 |
100,868 |
|||||||||
|
JP Morgan Chase Commercial Mortgage Securities Trust, Series 2014-CBM, Class D, 2.686%, due 10/15/291,3 |
125,000 |
124,418 |
|||||||||
|
Morgan Stanley Bank of America Merrill Lynch Trust, Series 2013-C10, Class C, 4.218%, due 07/15/463 |
100,000 |
99,568 |
|||||||||
|
Series 2013-C13, Class C, 5.058%, due 11/15/463 |
50,000 |
52,547 |
|||||||||
|
Starwood Retail Property Trust, Series 2014-STAR, Class C, 2.686%, due 11/15/271,3 |
150,000 |
149,303 |
|||||||||
|
WFCG Commercial Mortgage Trust, Series 2015-BXRP, Class D, 2.757%, due 11/15/291,3 |
96,408 |
95,768 |
|||||||||
|
WFRBS Commercial Mortgage Trust, Series 2014-C23, Class C, 3.995%, due 10/15/573 |
150,000 |
144,086 |
|||||||||
|
Total commercial mortgage-backed securities (cost $2,609,612) |
2,601,179 |
||||||||||
|
Mortgage & agency debt securities: 31.30% |
|||||||||||
|
United States: 31.30% |
|||||||||||
|
Federal Home Loan Mortgage Corp. Gold Pools,6 3.500%, TBA |
125,000 |
128,259 |
|||||||||
|
#A96140, 4.000%, due 01/01/41 |
88,703 |
94,115 |
|||||||||
|
#C63008, 6.000%, due 01/01/32 |
40,578 |
45,939 |
|||||||||
|
#G01717, 6.500%, due 11/01/29 |
39,787 |
45,567 |
|||||||||
|
Face amount |
Value |
||||||||||
|
Federal National Mortgage Association Pools,6 2.500%, TBA |
$ |
575,000 |
$ |
581,965 |
|||||||
| 2.500%, TBA |
575,000 |
580,753 |
|||||||||
| 3.000%, TBA |
1,200,000 |
1,192,430 |
|||||||||
| 3.500%, TBA |
1,050,000 |
1,082,074 |
|||||||||
| 3.500%, TBA |
725,000 |
745,221 |
|||||||||
| 4.500%, TBA |
650,000 |
701,695 |
|||||||||
|
#AT2725, 3.000%, due 05/01/43 |
397,888 |
398,236 |
|||||||||
|
#AP6056, 3.000%, due 07/01/43 |
67,932 |
67,970 |
|||||||||
|
#AS0302, 3.000%, due 08/01/43 |
23,976 |
23,983 |
|||||||||
|
#AU3735, 3.000%, due 08/01/43 |
91,732 |
91,770 |
|||||||||
|
#AV1735, 3.000%, due 11/01/43 |
71,485 |
71,537 |
|||||||||
|
#AH4568, 4.000%, due 03/01/41 |
100,643 |
107,222 |
|||||||||
|
#AO2983, 4.000%, due 05/01/42 |
72,709 |
77,484 |
|||||||||
|
#AL2441, 4.000%, due 09/01/42 |
25,391 |
27,060 |
|||||||||
|
#AL5760, 4.000%, due 09/01/43 |
112,289 |
119,662 |
|||||||||
|
#AE0106, 4.500%, due 06/01/40 |
1,012 |
1,096 |
|||||||||
|
#890209, 5.000%, due 05/01/40 |
149,246 |
164,927 |
|||||||||
|
#AD9114, 5.000%, due 07/01/40 |
201,404 |
223,569 |
|||||||||
|
#AJ1422, 5.000%, due 09/01/41 |
116,897 |
129,297 |
|||||||||
|
#688066, 5.500%, due 03/01/33 |
83,556 |
95,293 |
|||||||||
|
#688314, 5.500%, due 03/01/33 |
85,625 |
97,250 |
|||||||||
|
#802481, 5.500%, due 11/01/34 |
166,005 |
188,250 |
|||||||||
|
#408267, 6.000%, due 03/01/28 |
11,821 |
13,579 |
|||||||||
|
#323715, 6.000%, due 05/01/29 |
7,215 |
8,272 |
|||||||||
|
#676733, 6.000%, due 01/01/33 |
64,620 |
74,569 |
|||||||||
|
#831730, 6.500%, due 09/01/36 |
65,411 |
75,711 |
|||||||||
|
First Horizon Asset Securities, Inc., Series 2004-FL1, Class 1A1, 0.457%, due 02/25/353 |
21,032 |
18,935 |
|||||||||
|
Government National Mortgage Association Pools, #G2 AB2784, 3.500%, due 08/20/42 |
79,690 |
83,215 |
|||||||||
| 3.500%, TBA |
600,000 |
622,711 |
|||||||||
| 4.000%, TBA |
1,200,000 |
1,276,875 |
|||||||||
| 4.000%, TBA |
200,000 |
211,949 |
|||||||||
| 4.500%, TBA |
325,000 |
350,442 |
|||||||||
|
#G2 779425, 4.000%, due 06/20/42 |
85,805 |
92,046 |
|||||||||
|
#G2 2687, 6.000%, due 12/20/28 |
14,909 |
17,046 |
|||||||||
|
#G2 2794, 6.000%, due 08/20/29 |
45,646 |
51,818 |
|||||||||
|
#G2 4245, 6.000%, due 09/20/38 |
36,941 |
41,945 |
|||||||||
|
Total mortgage & agency debt securities (cost $9,885,415) |
10,021,737 |
||||||||||
|
Municipal bonds: 1.62% |
|||||||||||
|
Chicago Transit Authority, Series 2008-A, 6.899%, due 12/01/40 |
50,000 |
56,829 |
|||||||||
|
Los Angeles Unified School District, 6.758%, due 07/01/34 |
110,000 |
142,946 |
|||||||||
|
State of California, GO Bonds, 7.300%, due 10/01/39 |
90,000 |
125,014 |
|||||||||
12
UBS Core Plus Bond Fund
Portfolio of investments
June 30, 2015
|
Face amount |
Value |
||||||||||
|
Bonds—(Concluded) |
|||||||||||
|
Municipal bonds—(Concluded) |
|||||||||||
|
State of Illinois, GO Bonds, 5.877%, due 03/01/19 |
$ |
180,000 |
$ |
193,576 |
|||||||
|
Total municipal bonds (cost $454,724) |
518,365 |
||||||||||
|
US government obligations: 22.68% |
|||||||||||
|
Tennessee Valley Authority, 2.875%, due 09/15/24 |
70,000 |
70,328 |
|||||||||
|
US Treasury Bonds, 2.500%, due 02/15/452 |
50,000 |
44,004 |
|||||||||
|
2.750%, due 11/15/42 |
500,000 |
465,156 |
|||||||||
|
2.875%, due 05/15/43 |
525,000 |
500,309 |
|||||||||
|
3.750%, due 11/15/43 |
150,000 |
168,726 |
|||||||||
|
US Treasury Inflation Indexed Notes (TIPS), 0.125%, due 04/15/207 |
975,000 |
992,999 |
|||||||||
|
US Treasury Notes, 0.625%, due 12/31/16 |
1,300,000 |
1,302,742 |
|||||||||
|
0.625%, due 05/31/17 |
825,000 |
824,871 |
|||||||||
|
1.500%, due 05/31/20 |
125,000 |
124,317 |
|||||||||
|
1.750%, due 03/31/22 |
950,000 |
932,781 |
|||||||||
|
1.750%, due 04/30/22 |
875,000 |
858,594 |
|||||||||
|
2.000%, due 02/15/25 |
600,000 |
582,937 |
|||||||||
|
2.125%, due 05/15/252 |
400,000 |
392,750 |
|||||||||
|
Total US government obligations (cost $7,339,622) |
7,260,514 |
||||||||||
|
Non-US government obligations: 2.61% |
|||||||||||
|
Brazil: 0.63% |
|||||||||||
|
Banco Nacional de Desenvolvimento Economico e Social, 3.375%, due 09/26/161 |
200,000 |
202,000 |
|||||||||
|
Colombia: 0.30% |
|||||||||||
|
Republic of Colombia, 8.125%, due 05/21/24 |
75,000 |
96,112 |
|||||||||
|
Mexico: 0.54% |
|||||||||||
|
United Mexican States, 4.000%, due 10/02/23 |
150,000 |
154,125 |
|||||||||
|
6.750%, due 09/27/34 |
15,000 |
18,825 |
|||||||||
|
172,950 |
|||||||||||
|
Peru: 0.59% |
|||||||||||
|
Peruvian Government International Bond, 7.125%, due 03/30/19 |
50,000 |
58,188 |
|||||||||
|
7.350%, due 07/21/25 |
100,000 |
130,650 |
|||||||||
|
188,838 |
|||||||||||
|
Philippines: 0.20% |
|||||||||||
|
Republic of the Philippines, 10.625%, due 03/16/25 |
40,000 |
63,850 |
|||||||||
|
Face amount |
Value |
||||||||||
|
Turkey: 0.35% |
|||||||||||
|
Republic of Turkey, 6.750%, due 04/03/18 |
$ |
100,000 |
$ |
110,250 |
|||||||
|
Total non-US government obligations (cost $837,258) |
834,000 |
||||||||||
|
Total bonds (cost $30,912,748) |
30,894,723 |
||||||||||
|
Shares |
|||||||||||
|
Short-term investment: 26.18% |
|||||||||||
|
Investment company: 26.18% |
|||||||||||
|
UBS Cash Management Prime Relationship Fund8 (cost $8,382,243) |
8,382,243 |
8,382,243 |
|||||||||
|
Face amount covered by contracts |
|||||||||||
|
Options purchased: 0.03% |
|||||||||||
|
Call options: 0.02% |
|||||||||||
|
Foreign Exchange Option, Buy USD/AUD, strike @ USD 1.32, expires September 2015, counterparty: MSC |
330,000 |
6,334 |
|||||||||
|
Number of contracts |
|||||||||||
|
Put options: 0.00%9 |
|||||||||||
|
3 Year Euro-Dollar Midcurve, strike @ USD 97.75, expires June 2016 |
26 |
650 |
|||||||||
|
Notional amount |
|||||||||||
|
Options purchased on credit default swaps on credit indices: 0.01%10 |
|||||||||||
|
Expiring 07/15/15. If exercised the payment from the counterparty will be made upon the occurrence of a failure to pay, obligation acceleration, repudiation or restructuring of referenced obligation specified in the CDX.NA.IG Series 24 Index and the Fund receives quarterly fixed rate of 1.000% per annum. Underlying credit default swap terminating 06/20/20. European style. Counterparty: JPMCB |
$ |
1,600,000 |
2,805 |
||||||||
|
Total options purchased (cost $48,635) |
9,789 |
||||||||||
13
UBS Core Plus Bond Fund
Portfolio of investments
June 30, 2015
|
Shares |
Value |
||||||||||
|
Investment of cash collateral from securities loaned: 0.50% |
|||||||||||
|
UBS Private Money Market Fund LLC8 (cost $159,900) |
159,900 |
$ |
159,900 |
||||||||
|
Total investments: 123.22% (cost $39,503,526) |
39,446,655 |
||||||||||
|
Liabilities, in excess of cash and other assets: (23.22%) |
(7,432,540 |
) |
|||||||||
|
Net assets: 100.00% |
$ |
32,014,115 |
|||||||||
|
|
|||
Notes to portfolio of investments
Aggregate cost for federal income tax purposes was $39,498,143; and net unrealized depreciation consisted of:
|
Gross unrealized appreciation |
$ |
351,557 |
|||||
|
Gross unrealized depreciation |
(403,045 |
) |
|||||
|
Net unrealized depreciation of investments |
$ |
(51,488 |
) |
||||
For a listing of defined portfolio acronyms, counterparty abbreviations and currency abbreviations that are used throughout the Portfolio of investments as well as the tables that follow, please refer to page 45. Portfolio footnotes begin on page 17.
Forward foreign currency contracts
|
Counterparty |
Contracts to deliver |
In exchange for |
Maturity date |
Unrealized appreciation/ (depreciation) |
|||||||||||||||
|
CIBC |
NZD |
480,000 |
USD |
330,715 |
07/06/15 |
$ |
5,558 |
||||||||||||
|
JPMCB |
EUR |
290,000 |
USD |
322,814 |
07/06/15 |
(510 |
) |
||||||||||||
|
JPMCB |
EUR |
290,000 |
USD |
323,532 |
08/06/15 |
69 |
|||||||||||||
|
JPMCB |
JPY |
39,200,000 |
USD |
316,234 |
07/06/15 |
(4,082 |
) |
||||||||||||
|
JPMCB |
JPY |
39,200,000 |
USD |
319,376 |
08/06/15 |
(1,064 |
) |
||||||||||||
|
JPMCB |
NZD |
315,000 |
USD |
225,038 |
07/06/15 |
11,654 |
|||||||||||||
|
JPMCB |
NZD |
795,000 |
USD |
540,019 |
08/06/15 |
3,018 |
|||||||||||||
|
JPMCB |
USD |
323,399 |
EUR |
290,000 |
07/06/15 |
(75 |
) |
||||||||||||
|
JPMCB |
USD |
319,268 |
JPY |
39,200,000 |
07/06/15 |
1,047 |
|||||||||||||
|
JPMCB |
USD |
541,502 |
NZD |
795,000 |
07/06/15 |
(2,961 |
) |
||||||||||||
|
Net unrealized appreciation on forward foreign currency contracts |
$ |
12,654 |
|||||||||||||||||
Futures contracts
|
Expiration date |
Cost/ (proceeds) |
Value |
Unrealized appreciation/ (depreciation) |
||||||||||||||||
|
US Treasury futures buy contracts: |
|||||||||||||||||||
|
US Ultra Bond, 7 contracts (USD) |
September 2015 |
$ |
1,104,490 |
$ |
1,078,438 |
$ |
(26,052 |
) |
|||||||||||
|
10 Year US Treasury Notes, 1 contract (USD) |
September 2015 |
124,673 |
126,171 |
1,498 |
|||||||||||||||
|
US Treasury futures sell contracts: |
|||||||||||||||||||
|
10 Year US Treasury Notes, 13 contracts (USD) |
September 2015 |
(1,653,825 |
) |
(1,640,234 |
) |
13,591 |
|||||||||||||
|
Net unrealized depreciation on futures contracts |
$ |
(10,963 |
) |
||||||||||||||||
14
UBS Core Plus Bond Fund
Portfolio of investments
June 30, 2015
Credit default swaps on corporate issues—buy protection11
|
Counterparty |
Referenced obligation12 |
Notional amount |
Termination date |
Payments made by the Fund13 |
Upfront payments made |
Value |
Unrealized depreciation |
||||||||||||||||||||||||
|
MSC |
Deutsche Bank AG bond, 5.125%, due 08/31/17 |
EUR |
140,000 |
06/20/17 |
1.000 |
% |
$ |
(2,850 |
) |
$ |
(1,265 |
) |
$ |
(4,115 |
) |
||||||||||||||||
Credit default swaps on credit indices—sell protection14
|
Counterparty |
Referenced index12 |
Notional amount |
Termination date |
Payments received by the Fund13 |
Upfront payments made |
Value |
Unrealized depreciation |
Credit spread15 |
|||||||||||||||||||||||||||
|
MLI |
CMBX.NA.BB. Series 6 Index |
USD |
300,000 |
05/11/63 |
5.000 |
% |
$ |
(9,368 |
) |
$ |
(1,735 |
) |
$ |
(11,103 |
) |
3.205 |
% |
||||||||||||||||||
|
MLI |
CMBX.NA.BB. Series 6 Index |
USD |
325,000 |
05/11/63 |
5.000 |
(858 |
) |
(1,879 |
) |
(2,737 |
) |
3.205 |
|||||||||||||||||||||||
|
$ |
(10,226 |
) |
$ |
(3,614 |
) |
$ |
(13,840 |
) |
|||||||||||||||||||||||||||
Centrally cleared interest rate swap agreements
|
Notional amount |
Termination date |
Payments made by the Fund13 |
Payments received by the Fund13 |
Value |
Unrealized appreciation/ (depreciation) |
||||||||||||||||||
|
AUD |
500,000 |
04/17/25 |
6 month BBSW |
2.695 |
% |
$ |
(20,982 |
) |
$ |
(20,982 |
) |
||||||||||||
|
NZD |
450,000 |
07/24/24 |
3 month BBSW |
4.713 |
24,481 |
24,481 |
|||||||||||||||||
|
NZD |
450,000 |
07/24/24 |
3 month BBSW |
4.712 |
24,468 |
24,468 |
|||||||||||||||||
|
NZD |
400,000 |
07/24/24 |
3 month BBSW |
4.775 |
23,136 |
23,136 |
|||||||||||||||||
|
USD |
825,000 |
02/15/41 |
2.351 |
% |
3 month USD LIBOR |
89,426 |
89,426 |
||||||||||||||||
| $140,529 | $140,529 | ||||||||||||||||||||||
15
UBS Core Plus Bond Fund
Portfolio of investments
June 30, 2015
Options written
|
Expiration date |
Premiums received |
Value |
|||||||||||||
|
Call options |
|||||||||||||||
|
3 Year Euro-Dollar Midcurve, 26 contracts, strike @ USD 98.75 |
June 2016 |
$ |
21,034 |
$ |
(27,300 |
) |
|||||||||
|
Foreign Exchange Option, Sell USD/AUD, 330,000 contracts, strike @ USD 1.47, counterparty: MSC |
September 2015 |
1,584 |
(605 |
) |
|||||||||||
|
Put options |
|||||||||||||||
|
3 Year Euro-Dollar Midcurve, 26 contracts, strike @ USD 96.75 |
June 2016 |
21,034 |
(162 |
) |
|||||||||||
|
Foreign Exchange Option, Sell USD/AUD, 330,000 contracts, strike @ USD 1.26, counterparty: MSC |
September 2015 |
2,838 |
(2,352 |
) |
|||||||||||
|
Options written on credit default swaps on credit indices10 |
|||||||||||||||
|
If option exercised payment from the counterparty will be received upon the occurrence of a failure to pay, obligation acceleration, repudiation or restructuring of the referenced obligation specified in the CDX.NA.IG Series 24 Index and the Fund pays quarterly fixed rate of 1.000% per annum. Underlying credit default swap terminating 06/20/20. European style. Counterparty: JPMCB, Notional Amount USD 1,600,000 |
October 2015 |
3,800 |
(3,823 |
) |
|||||||||||
|
Total options written |
$ |
50,290 |
$ |
(34,242 |
) |
||||||||||
Written options activity for the year ended June 30, 2015 was as follows:
|
Number of contracts |
Premiums received |
||||||||||
|
Options outstanding at June 30, 2014 |
233 |
$ |
141,691 |
||||||||
|
Options written |
— |
— |
|||||||||
|
Options terminated in closing purchase transactions |
(181 |
) |
(99,623 |
) |
|||||||
|
Options expired prior to exercise |
— |
— |
|||||||||
|
Options outstanding at June 30, 2015 |
52 |
$ |
42,068 |
||||||||
Swaptions and foreign exchange written options activity for the year ended June 30, 2015 was as follows:
|
Premiums received |
|||||||
|
Swaptions & foreign exchange options outstanding at June 30, 2014 |
$ |
12,177 |
|||||
|
Swaptions & foreign exchange options written |
83,635 |
||||||
|
Swaptions & foreign exchange options terminated in closing purchase transactions |
(87,590 |
) |
|||||
|
Swaptions & foreign exchange options expired prior to exercise |
— |
||||||
|
Swaptions & foreign exchange options outstanding at June 30, 2015 |
$ |
8,222 |
|||||
16
UBS Core Plus Bond Fund
Portfolio of investments
June 30, 2015
The following is a summary of the fair valuations according to the inputs used as of June 30, 2015 in valuing the Fund's investments:
|
Description |
Unadjusted quoted prices in active markets for identical investments (Level 1) |
Other significant observable inputs (Level 2) |
Unobservable inputs (Level 3) |
Total |
|||||||||||||||
|
Assets |
|||||||||||||||||||
|
Corporate bonds |
$ |
— |
$ |
8,083,188 |
$ |
— |
$ |
8,083,188 |
|||||||||||
|
Asset-backed securities |
— |
1,575,740 |
— |
1,575,740 |
|||||||||||||||
|
Commercial mortgage-backed securities |
— |
2,601,179 |
— |
2,601,179 |
|||||||||||||||
|
Mortgage & agency debt securities |
— |
10,021,737 |
— |
10,021,737 |
|||||||||||||||
|
Municipal bonds |
— |
518,365 |
— |
518,365 |
|||||||||||||||
|
US government obligations |
— |
7,260,514 |
— |
7,260,514 |
|||||||||||||||
|
Non-US government obligations |
— |
834,000 |
— |
834,000 |
|||||||||||||||
|
Short-term investment |
— |
8,382,243 |
— |
8,382,243 |
|||||||||||||||
|
Options purchased |
650 |
9,139 |
— |
9,789 |
|||||||||||||||
|
Investment of cash collateral from securities loaned |
— |
159,900 |
— |
159,900 |
|||||||||||||||
|
Forward foreign currency contracts |
— |
21,346 |
— |
21,346 |
|||||||||||||||
|
Futures contracts |
15,089 |
— |
— |
15,089 |
|||||||||||||||
|
Swap agreements, at value |
— |
161,511 |
— |
161,511 |
|||||||||||||||
|
Total |
$ |
15,739 |
$ |
39,628,862 |
$ |
— |
$ |
39,644,601 |
|||||||||||
|
Liabilities |
|||||||||||||||||||
|
Forward foreign currency contracts |
$ |
— |
$ |
(8,692 |
) |
$ |
— |
$ |
(8,692 |
) |
|||||||||
|
Futures contracts |
(26,052 |
) |
— |
— |
(26,052 |
) |
|||||||||||||
|
Swap agreements, at value |
— |
(25,861 |
) |
— |
(25,861 |
) |
|||||||||||||
|
Options written |
(27,462 |
) |
(6,780 |
) |
— |
(34,242 |
) |
||||||||||||
|
Total |
$ |
(53,514 |
) |
$ |
(41,333 |
) |
$ |
— |
$ |
(94,847 |
) |
||||||||
At June 30, 2015, there were no transfers between Level 1 and Level 2.
Portfolio footnotes
1 Security exempt from registration pursuant to Rule 144A under the Securities Act of 1933. These securities are considered liquid, unless noted otherwise, and may be resold in transactions exempt from registration, normally to qualified institutional buyers. At June 30, 2015, the value of these securities amounted to $3,632,731 or 11.35% of net assets.
2 Security, or portion thereof, was on loan at June 30, 2015.
3 Variable or floating rate security—The interest rate shown is the current rate as of June 30, 2015 and changes periodically.
4 Perpetual investment. Date shown reflects the next call date.
5 Step bond—Coupon rate increases in increments to maturity. Rate disclosed is as of June 30, 2015. Maturity date disclosed is the ultimate maturity date.
6 On September 7, 2008, the Federal Housing Finance Agency placed the Federal Home Loan Mortgage Corporation and the Federal National Mortgage Association into conservatorship, and the US Treasury guaranteed the debt issued by those organizations.
7 Debt security whose principal and/or interest payments are adjusted for inflation, unlike debt securities that make fixed principal and interest payments. The interest rate paid by the securities is fixed, while the principal value rises or falls based on changes in an index. Thus, if inflation occurs, the principal and interest payments on the securities are adjusted accordingly to protect investors from inflationary loss. During a deflationary period, the principal and interest payments decrease, although the securities' principal amounts will not drop below their face amounts at maturity. In exchange for the inflation protection, the securities generally pay lower interest rates than typical government securities from the issuer's country. Only if inflation occurs will securities offer a higher real yield than a conventional security of the same maturity.
17
UBS Core Plus Bond Fund
Portfolio of investments
June 30, 2015
8 The table below details the Fund's investments in funds advised by the same Advisor as the Fund. The Advisor does not earn a management fee from the affiliated UBS Relationship Funds.
|
Security description |
Value 06/30/14 |
Purchases during the year ended 06/30/15 |
Sales during the year ended 06/30/15 |
Net realized gain (loss) during the year ended 06/30/15 |
Change in net unrealized appreciation/ (depreciation) during the year ended 06/30/15 |
Value 06/30/15 |
Net income earned from affiliate for the year ended 06/30/15 |
||||||||||||||||||||||||
|
UBS Cash Management Prime Relationship Fund |
$ |
7,725,321 |
$ |
27,285,546 |
$ |
26,628,624 |
$ |
— |
$ |
— |
$ |
8,382,243 |
$ |
6,000 |
|||||||||||||||||
|
UBS Private Money Market Fund LLCa |
236,033 |
5,034,903 |
5,111,036 |
— |
— |
159,900 |
21 |
||||||||||||||||||||||||
|
UBS High Yield Relationship Fund |
1,690,858 |
— |
1,667,022 |
116,393 |
(140,229 |
) |
— |
— |
|||||||||||||||||||||||
|
$ |
9,652,212 |
$ |
32,320,449 |
$ |
33,406,682 |
$ |
116,393 |
$ |
(140,229 |
) |
$ |
8,542,143 |
$ |
6,021 |
|||||||||||||||||
a The Advisor earns a management fee from this affiliated fund. Please see the Notes to financial statements for further information.
9 Amount represents less than 0.005%.
10 Illiquid investment as of June 30, 2015.
11 If the Fund is a buyer of protection and a credit event occurs, as defined under the terms of that particular swap agreement, the Fund will either (i) receive from the seller of protection an amount equal to the notional amount of the swap and deliver the referenced obligation or (ii) receive a net settlement amount in the form of cash or securities equal to the notional amount of the swap agreement less the recovery value of the referenced obligation.
12 Payments from/to the counterparty will be received/made upon the occurrence of bankruptcy and/or restructuring event with respect to the referenced index/obligation.
13 Payments made or received are based on the notional amount.
14 If the Fund is a seller of protection and a credit event occurs, as defined under the terms of that particular swap agreement, the Fund will either (i) pay to the buyer of protection an amount equal to the notional amount of the swap and take delivery of the underlying securities comprising the referenced index or (ii) pay a net settlement amount in the form of cash or securities equal to the notional amount of the swap agreement less the recovery value of the underlying securities comprising the referenced index.
15 Credit spreads, represented in absolute terms, utilized in determining the market value as of period end serve as an indicator of the current status of the payment/performance risk and represent the likelihood or risk of default or other credit event occurring for the credit derivative. The credit spread of a particular referenced entity reflects the cost of buying/selling protection and may include upfront payments required to be made to enter into the agreement. Wider credit spreads represent a deterioration of the referenced entity's credit soundness and a greater likelihood or risk of default or other credit event occurring as defined under the terms of the agreement. A credit spread identified as "Defaulted" indicates a credit event has occurred for the referenced entity. Credit spreads are unaudited.
See accompanying notes to financial statements
18
UBS Fixed Income Opportunities Fund
Portfolio performance
For the 12 months ended June 30, 2015, Class A shares of UBS Fixed Income Opportunities Fund (the "Fund") declined 0.91% (Class A shares fell 5.34% after the deduction of the maximum sales charge), while Class P shares declined 0.68%. For comparison purposes, The BofA Merrill Lynch US Dollar 3-Month Deposit Offered Rate Constant Maturity Index (the "Index") gained 0.24% over the same time period. (Class P shares have lower expenses than other share classes of the Fund. Returns for all share classes over various time periods are shown on page 21; please note that the Fund's returns do not reflect the deduction of taxes that a shareholder would pay on Fund distributions or the redemption of Fund shares, while the Index returns do not reflect the deduction of fees and expenses.)
The Fund's negative return during the reporting period was driven by a number of factors, including corporate credit, government-related debt and emerging markets debt. These negatives more than offset the positive impact of the Fund's active currency exposure, interest rate strategies and allocation to securitized assets.
The Fund extensively uses derivatives as part of its investment strategy across global interest rate, credit and currency markets. To facilitate specific duration and yield curve strategies, the Fund utilized different interest rate derivatives, including, but not limited to, futures, options, swaps and swaptions. Credit default swaps, credit default swaptions and, to a more limited extent, total return swaps were used to help implement credit-related investment strategies as part of the Fund's sector allocation and security selection. Lastly, the Fund utilized currency derivatives, such as currency forwards and swaps, as part of its currency management strategy.
While derivatives play a role in the overall portfolio construction process, they are just one of the tools we utilize to manage the Fund's overall risk exposure and to implement the aforementioned strategies. The Fund's active interest rate strategies added to performance during the period. Spread management was overall negative for performance, but some spread products contributed positively. "Spread" is the difference between yields paid on a government bond (such as US Treasuries) and a security of a different quality, but with the same or similar maturity. When spreads widen, it implies that the market is factoring in greater risk of default for the lower rated security; conversely, when spreads tighten, the market is factoring in less risk. Such movements in spreads generally result in changes in market prices for such securities. Currency positioning positively contributed to results during the reporting period.
Portfolio performance summary1
What worked:
• The Fund's active currency exposure was positive for results during the reporting period.
– The Fund's exposure to the US dollar against a basket of developed market currencies contributed to performance. At various times during the reporting period, the Fund was long the US dollar against the euro, Japanese yen, Swiss franc, New Zealand dollar, Australian dollar and British pound. The US dollar index appreciated during the period for nine consecutive months and reached a 12-year high against the euro during the reporting period.
1 For a detailed commentary on the market environment in general during the reporting period, see page 2.
19
UBS Fixed Income Opportunities Fund
• Interests rate strategies added to performance during the reporting period.
– The Fund was generally positioned for higher US interest rates and higher volatility in interest rate markets. The Fund was also at times positioned for higher German bund yields. The Fund favored long exposure to interest rates in New Zealand and Australia.
– Interest rate strategies contributed to performance, particularly toward the end of the reporting period as US and German interest rates increased rapidly, while interest rate volatility remained elevated.
• Certain securitized assets and collateralized debt contributed to performance.
– The Fund's holdings of commercial mortgage-backed securities outperformed other spread products.
– The Fund's allocation to collateralized loan obligations also contributed to performance during the reporting period.
What didn't work:
• The Fund's allocation to corporate credit was negative for performance.
– The Fund's allocation to both investment grade and high yield corporate debt was negative for performance, as corporate spreads widened during the reporting period.
– Security selection in the energy sector detracted from performance, as the sharp fall in the price of oil led to weak results for companies in oil-related industries. High yield energy credits, in particular, underperformed due to the drop in the price of oil. The negative performance from security selection was partially offset by beta index hedging.
• The Fund's allocation to emerging markets debt detracted from performance.
– Emerging markets were also affected by the steep decline in the price of oil, particularly those countries that are oil exporters.
– Security selection within emerging markets debt was negative for performance but was offset somewhat by beta index hedging.
This letter is intended to assist shareholders in understanding how the Fund performed for the 12 months ended June 30, 2015. The views and opinions in the letter were current as of August 14, 2015. They are not guarantees of future performance or investment results and should not be taken as investment advice. Investment decisions reflect a variety of factors, and we reserve the right to change our views about individual securities, sectors and markets at any time. As a result, the views expressed should not be relied upon as a forecast of the Fund's future investment intent. We encourage you to consult your financial advisor regarding your personal investment program.
Mutual funds are sold by prospectus only. You should read it carefully and consider a fund's investment objectives, risks, charges, expenses and other important information contained in the prospectus before investing. Prospectuses for most of our funds can be obtained from your financial advisor, by calling UBS Funds at 800-647 1568 or by visiting our Web site at www.ubs.com/globalam-us.
20
UBS Fixed Income Opportunities Fund
Average annual total returns for periods ended 06/30/15 (unaudited)
|
1 year |
Inception1 |
||||||||||
|
Before deducting maximum sales charge |
|||||||||||
|
Class A2 |
(0.91 |
)% |
1.33 |
% |
|||||||
|
Class C3 |
(1.48 |
) |
0.80 |
||||||||
|
Class P4 |
(0.68 |
) |
1.59 |
||||||||
|
After deducting maximum sales charge |
|||||||||||
|
Class A2 |
(5.34 |
)% |
0.32 |
% |
|||||||
|
Class C3 |
(2.21 |
) |
0.80 |
||||||||
|
BofA Merrill Lynch US Dollar 3-Month Deposit Offered Rate Constant Maturity Index5 |
0.24 |
% |
0.32 |
% |
|||||||
The annualized gross and net expense ratios, respectively, for each class of shares as in the October 28, 2014 prospectuses were as follows: Class A—1.52% and 1.04%; Class C—2.02% and 1.54%; Class P—1.23% and 0.79%. Net expenses reflect fee waivers and/or expense reimbursements, if any, pursuant to an agreement that is in effect to cap the expenses. The Trust, with respect to the Fund, and UBS Global Asset Management (Americas) Inc., the Fund's investment advisor ("UBS Global AM (Americas)" or the "Advisor"), have entered into a written agreement pursuant to which the Advisor has agreed to waive a portion of its management fees and/or to reimburse expenses (excluding expenses incurred through investment in other investment companies, interest, taxes, brokerage commissions, extraordinary expenses, and dividend expense and security loan fees for securities sold short) to the extent necessary so that the Fund's ordinary operating expenses (excluding expenses incurred through investment in other investment companies, interest, taxes, brokerage commissions, extraordinary expenses, and dividend expense and security loan fees for securities sold short), through the period ending October 27, 2015, do not exceed 0.95% for Class A shares, 1.45% for Class C shares and 0.70% for Class P shares. Pursuant to the written agreement, the Advisor is entitled to be reimbursed for any fees it waives and expenses it reimburses for a period of three years following such fee waivers and expense reimbursements to the extent that such reimbursement of the Advisor by the Fund will not cause the Fund to exceed any applicable expense limit that is in place for the Fund. The fee waiver/expense reimbursement agreement may be terminated by the Fund's Board of Trustees at any time and also will terminate automatically upon the expiration or termination of the Fund's advisory contract with the Advisor. Upon termination of the fee waiver/expense reimbursement agreement, however, UBS Global AM (Americas)'s three year recoupment rights will survive.
1 Inception date of all shares of UBS Fixed Income Opportunities Fund and the index is November 29, 2010.
2 Maximum sales charge for Class A shares is 4.5%. Class A shares bear ongoing 12b-1 service fees.
3 Maximum contingent deferred sales charge for Class C shares is 0.75% imposed on redemptions and is reduced to 0% after one year. Class C shares bear ongoing 12b-1 distribution and service fees.
4 Class P shares do not bear initial or contingent deferred sales charges or ongoing 12b-1 service and distribution fees, but Class P shares held through advisory programs may be subject to a program fee, which, if included, would have reduced performance.
5 The BofA Merrill Lynch US Dollar 3-Month Deposit Offered Rate Constant Maturity Index (formerly BofA Merrill Lynch US Dollar 3-Month LIBOR Constant Maturity Index) is designed to track the performance of a synthetic asset paying LIBOR to a stated maturity. The index is based on the assumed purchase at par of a synthetic instrument having exactly its stated maturity and with a coupon equal to that day's fixing rate. That issue is assumed to be sold the following business day (priced at a yield equal to the current day fixing rate) and rolled into a new instrument. Investors should note that indices do not reflect the deduction of fees and expenses.
Prior to February 17, 2015, if an investor sold or exchanged shares less than 90 days after purchase, a redemption fee of 1.00% of the amount sold or exchanged was deducted at the time of the transaction, except as noted otherwise in the prospectus. For sales or exchanges taking place on or after February 17, 2015 but prior to August 3, 2015, there is a reduction in the redemption holding period from 90 days to 30 days. Effective August 3, 2015, the 1.00% redemption fee imposed on sales or exchanges of any class of shares of the funds made during the holding periods specified in the prospectus will be eliminated. Please refer to the prospectus for further information.
Past performance does not predict future performance, and the performance information provided does not reflect the deduction of taxes that a shareholder would pay on Fund distributions or the redemption of Fund shares. The return and principal value of an investment will fluctuate, so that an investor's shares, when redeemed, may be worth more or less than their original cost. Performance results assume reinvestment of all dividends and capital gain distributions at net asset value on the ex-dividend dates. Current performance may be higher or lower than the performance data quoted. For month-end performance figures, please visit http://globalam-us.ubs.com/corpweb/performance.do.
21
UBS Fixed Income Opportunities Fund
Illustration of an assumed investment of $10,000 in Class A shares (adjusted for 4.5% maximum sales charge) and $5,000,000 in Class P shares (unaudited)
The following two graphs depict the performance of UBS Fixed Income Opportunities Fund Class A and Class P shares versus the BofA Merrill Lynch US Dollar 3-Month Deposit Offered Rate Constant Maturity Index from November 29, 2010, which is the inception date of the two classes, through June 30, 2015. The performance of Class C shares will vary based upon the different class specific expenses and sales charges. The performance provided does not reflect the deduction of taxes that a shareholder would pay on Fund distributions or the redemption of Fund shares. Past performance is no guarantee of future results. Share price and returns will vary with market conditions; investors may realize a gain or loss upon redemption.
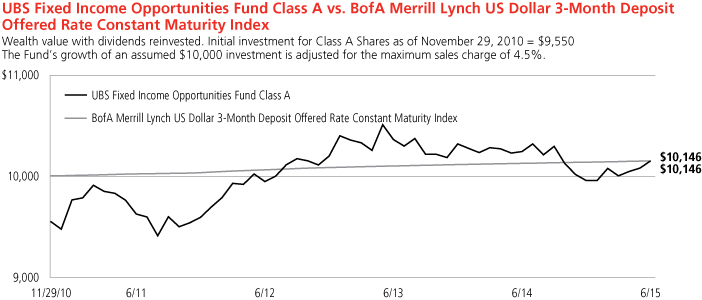
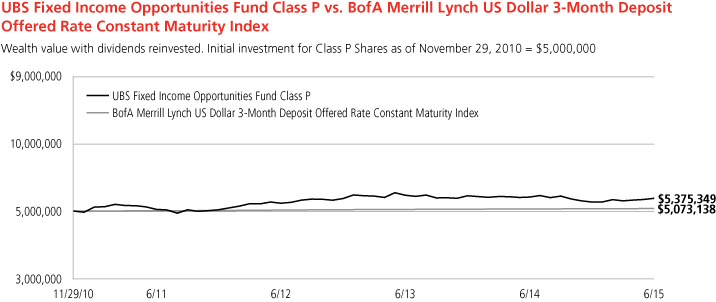
Past performance does not predict future performance, and the performance information provided does not reflect the deduction of taxes that a shareholder would pay on Fund distributions or the redemption of Fund shares. The return and principal value of an investment will fluctuate, so that an investor's shares, when redeemed, may be worth more or less than their original cost. Performance results assume reinvestment of all dividends and capital gain distributions at net asset value on the ex-dividend dates. Current performance may be higher or lower than the performance data quoted. For month-end performance figures, please visit http://globalam-us.ubs.com/corpweb/performance.do.
22
UBS Fixed Income Opportunities Fund
Top ten long-term fixed income holdings (unaudited)
As of June 30, 2015
|
Percentage of net assets |
|||||||
|
US Treasury Notes, 2.000%, due 02/15/22 |
11.7 |
% |
|||||
|
US Treasury Inflation Indexed Notes (TIPS), 0.125%, due 07/15/24 |
3.6 |
||||||
|
US Treasury Bonds, PO, 3.088%, due 05/15/43 |
3.0 |
||||||
|
Eksportfinans ASA, 5.500%, due 05/25/16 |
2.4 |
||||||
|
Royal Bank of Scotland Group PLC, 6.100%, due 06/10/23 |
2.3 |
||||||
|
US Treasury Inflation Indexed Notes (TIPS), 0.125%, due 04/15/16 |
2.1 |
||||||
|
Case New Holland Industrial, Inc., 7.875%, due 12/01/17 |
2.0 |
||||||
|
Caixa Economica Federal, 2.375%, due 11/06/17 |
1.9 |
||||||
|
Lloyds Bank PLC, 6.500%, due 03/24/20 |
1.6 |
||||||
|
Republic of Croatia, 6.250%, due 04/27/17 |
1.6 |
||||||
|
Total |
32.2 |
% |
|||||
Country exposure by issuer, top five (unaudited)
As of June 30, 2015
|
Percentage of net assets |
|||||||
|
United States |
61.0 |
% |
|||||
|
United Kingdom |
6.0 |
||||||
|
Brazil |
4.6 |
||||||
|
Norway |
3.2 |
||||||
|
Luxembourg |
3.0 |
||||||
|
Total |
77.8 |
% |
|||||
Industry diversification (unaudited)
As a percentage of net assets as of June 30, 2015
|
Bonds |
|||||||
|
Corporate bonds |
|||||||
|
Banks |
15.98 |
% |
|||||
|
Building products |
0.50 |
||||||
|
Capital markets |
0.84 |
||||||
|
Chemicals |
1.73 |
||||||
|
Commercial services & supplies |
0.92 |
||||||
|
Construction materials |
3.27 |
||||||
|
Consumer finance |
1.71 |
||||||
|
Diversified financial services |
2.63 |
||||||
|
Diversified telecommunication services |
2.94 |
||||||
|
Electronic equipment, instruments & components |
1.06 |
||||||
|
Energy equipment & services |
0.76 |
||||||
|
Food & staples retailing |
1.36 |
||||||
|
Gas utilities |
0.63 |
||||||
|
Hotels, restaurants & leisure |
1.28 |
||||||
|
Household durables |
0.89 |
||||||
|
Insurance |
5.73 |
||||||
|
Machinery |
1.96 |
||||||
|
Media |
2.79 |
||||||
|
Metals & mining |
4.88 |
||||||
|
Oil, gas & consumable fuels |
5.32 |
||||||
|
Pharmaceuticals |
0.87 |
||||||
|
Real estate investment trust (REIT) |
0.33 |
||||||
|
Real estate management & development |
0.25 |
||||||
|
Technology hardware, storage & peripherals |
0.35 |
||||||
|
Thrifts & mortgage finance |
0.49 |
||||||
|
Tobacco |
0.23 |
||||||
|
Trading companies & distributors |
1.21 |
||||||
|
Total corporate bonds |
60.91 |
% |
|||||
|
Collateralized debt obligations |
5.74 |
||||||
|
Commercial mortgage-backed security |
0.59 |
||||||
|
Mortgage & agency debt securities |
1.28 |
||||||
|
Municipal bonds |
2.17 |
||||||
|
US government obligations |
22.00 |
||||||
|
Non-US government obligation |
1.58 |
||||||
|
Total bonds |
94.27 |
% |
|||||
|
Short-term investment |
4.58 |
||||||
|
Options purchased |
3.04 |
||||||
|
Total investments |
101.89 |
% |
|||||
|
Liabilities, in excess of cash and other assets |
(1.89 |
) |
|||||
|
Net assets |
100.00 |
% |
|||||
23
UBS Fixed Income Opportunities Fund
Portfolio of investments
June 30, 2015
|
Face amount |
Value |
||||||||||
|
Bonds: 94.27% |
|||||||||||
|
Corporate bonds: 60.91% |
|||||||||||
|
Australia: 0.89% |
|||||||||||
|
Crown Group Finance Ltd., 5.750%, due 07/18/17 |
AUD |
370,000 |
$ |
297,818 |
|||||||
|
Brazil: 4.57% |
|||||||||||
|
Banco do Brasil SA, 9.000%, due 06/18/241,2,3 |
$ |
285,000 |
257,127 |
||||||||
|
Caixa Economica Federal, 2.375%, due 11/06/171 |
670,000 |
644,875 |
|||||||||
|
Petrobras Global Finance BV, 5.375%, due 01/27/21 |
350,000 |
335,993 |
|||||||||
|
Vale Overseas Ltd., 4.375%, due 01/11/22 |
300,000 |
292,417 |
|||||||||
|
Total Brazil corporate bonds |
1,530,412 |
||||||||||
|
Canada: 2.51% |
|||||||||||
|
Barrick Gold Corp., 3.850%, due 04/01/22 |
200,000 |
193,847 |
|||||||||
|
NOVA Chemicals Corp., 5.250%, due 08/01/231 |
410,000 |
416,150 |
|||||||||
|
Yamana Gold, Inc., 4.950%, due 07/15/24 |
240,000 |
231,176 |
|||||||||
|
Total Canada corporate bonds |
841,173 |
||||||||||
|
China: 0.63% |
|||||||||||
|
China Oil & Gas Group Ltd., 5.250%, due 04/25/181 |
210,000 |
211,050 |
|||||||||
|
Croatia: 0.74% |
|||||||||||
|
Agrokor DD, 8.875%, due 02/01/201 |
230,000 |
248,400 |
|||||||||
|
France: 1.08% |
|||||||||||
|
Credit Agricole SA, 7.875%, due 01/23/241,2,3 |
350,000 |
359,806 |
|||||||||
|
Germany: 2.86% |
|||||||||||
|
HeidelbergCement Finance BV, 8.500%, due 10/31/194 |
EUR |
250,000 |
353,965 |
||||||||
|
Trionista Holdco GmbH, 5.000%, due 04/30/201 |
160,000 |
184,173 |
|||||||||
|
Unitymedia GmbH, 6.125%, due 01/15/251 |
$ |
400,000 |
418,000 |
||||||||
|
Total Germany corporate bonds |
956,138 |
||||||||||
|
Ireland: 0.77% |
|||||||||||
|
XL Group PLC, Series E, 6.500%, due 04/15/172,3 |
300,000 |
256,689 |
|||||||||
|
Italy: 0.47% |
|||||||||||
|
Generali Finance BV, 6.214%, due 06/16/162,3 |
GBP |
100,000 |
157,969 |
||||||||
|
Face amount |
Value |
||||||||||
|
Luxembourg: 2.97% |
|||||||||||
|
ArcelorMittal, 6.250%, due 03/01/21 |
$ |
500,000 |
$ |
523,750 |
|||||||
|
Intelsat Jackson Holdings SA, 7.500%, due 04/01/21 |
475,000 |
469,656 |
|||||||||
|
Total Luxembourg corporate bonds |
993,406 |
||||||||||
|
Malaysia: 0.60% |
|||||||||||
|
SSG Resources Ltd., 4.250%, due 10/04/224 |
200,000 |
202,321 |
|||||||||
|
Mexico: 1.18% |
|||||||||||
|
Cemex SAB de CV, 5.700%, due 01/11/251 |
200,000 |
189,000 |
|||||||||
|
5.875%, due 03/25/191 |
200,000 |
204,440 |
|||||||||
|
Total Mexico corporate bonds |
393,440 |
||||||||||
|
Netherlands: 0.49% |
|||||||||||
|
Basell Finance Co. BV, 8.100%, due 03/15/271 |
125,000 |
165,128 |
|||||||||
|
Norway: 3.19% |
|||||||||||
|
Eksportfinans ASA, 5.500%, due 05/25/16 |
780,000 |
802,425 |
|||||||||
|
5.500%, due 06/26/17 |
250,000 |
264,923 |
|||||||||
|
Total Norway corporate bonds |
1,067,348 |
||||||||||
|
Portugal: 1.56% |
|||||||||||
|
EDP Finance BV, 4.900%, due 10/01/191 |
500,000 |
520,642 |
|||||||||
|
Singapore: 0.62% |
|||||||||||
|
Olam International Ltd., 5.750%, due 09/20/17 |
200,000 |
207,500 |
|||||||||
|
Switzerland: 0.57% |
|||||||||||
|
Credit Suisse Group AG, 6.250%, due 12/18/241,2,3 |
200,000 |
191,750 |
|||||||||
|
United Kingdom: 6.02% |
|||||||||||
|
Barclays Bank PLC, 4.375%, due 09/11/24 |
250,000 |
239,767 |
|||||||||
|
HBOS PLC, 6.750%, due 05/21/181 |
300,000 |
332,626 |
|||||||||
|
Lloyds Bank PLC, 6.500%, due 03/24/204 |
EUR |
400,000 |
532,464 |
||||||||
|
Pension Insurance Corp. PLC, 6.500%, due 07/03/244 |
GBP |
100,000 |
156,429 |
||||||||
|
Royal Bank of Scotland Group PLC, 6.100%, due 06/10/23 |
$ |
710,000 |
754,898 |
||||||||
|
Total United Kingdom corporate bonds |
2,016,184 |
||||||||||
24
UBS Fixed Income Opportunities Fund
Portfolio of investments
June 30, 2015
|
Face amount |
Value |
||||||||||
|
Bonds—(Continued) |
|||||||||||
|
Corporate bonds—(Concluded) |
|||||||||||
|
United States: 29.19% |
|||||||||||
|
ADT Corp., 3.500%, due 07/15/22 |
$ |
340,000 |
$ |
307,700 |
|||||||
|
Allstate Corp., 5.750%, due 08/15/532 |
400,000 |
422,500 |
|||||||||
|
Bank of America Corp., 4.000%, due 01/22/25 |
200,000 |
194,859 |
|||||||||
|
Barrick North America Finance LLC, 5.750%, due 05/01/43 |
175,000 |
168,335 |
|||||||||
|
Building Materials Corp. of America, 6.750%, due 05/01/211 |
80,000 |
83,400 |
|||||||||
|
Case New Holland Industrial, Inc., 7.875%, due 12/01/17 |
600,000 |
657,000 |
|||||||||
|
Cemex Finance LLC, 6.000%, due 04/01/241 |
350,000 |
345,520 |
|||||||||
|
CIT Group, Inc., 5.000%, due 05/15/17 300,000 309,360 5.000%, due 08/15/22 |
145,000 |
143,550 |
|||||||||
|
Citigroup, Inc., Series M, 6.300%, due 05/15/242,3 |
150,000 |
146,437 |
|||||||||
|
DISH DBS Corp., 7.875%, due 09/01/19 |
465,000 |
515,685 |
|||||||||
|
DR Horton, Inc., 4.000%, due 02/15/20 |
19,000 |
18,899 |
|||||||||
|
Energy Transfer Partners LP, 6.050%, due 06/01/41 |
380,000 |
372,986 |
|||||||||
|
Flextronics International Ltd., 5.000%, due 02/15/23 |
170,000 |
172,575 |
|||||||||
|
Frontier Communications Corp., 7.125%, due 01/15/23 |
400,000 |
355,000 |
|||||||||
|
General Motors Financial Co., Inc., 3.000%, due 09/25/17 140,000 142,732 4.750%, due 08/15/17 |
150,000 |
158,297 |
|||||||||
|
Glencore Funding LLC, 4.625%, due 04/29/241 |
225,000 |
222,998 |
|||||||||
|
Host Hotels & Resorts LP, Series E, 4.000%, due 06/15/25 |
110,000 |
109,183 |
|||||||||
|
International Lease Finance Corp., 8.625%, due 09/15/15 |
400,000 |
405,000 |
|||||||||
|
Kinder Morgan Finance Co. LLC, 5.700%, due 01/05/16 |
210,000 |
214,647 |
|||||||||
|
Kinder Morgan, Inc., 7.250%, due 06/01/18 |
275,000 |
310,143 |
|||||||||
|
Lennar Corp., 4.750%, due 05/30/25 |
110,000 |
106,700 |
|||||||||
|
MetLife, Inc., 6.400%, due 12/15/36 |
445,000 |
488,387 |
|||||||||
|
Midstates Petroleum Co., Inc., 10.750%, due 10/01/20 |
300,000 |
126,000 |
|||||||||
|
Face amount |
Value |
||||||||||
|
Morgan Stanley, Series J, 5.550%, due 07/15/202,3 |
$ |
90,000 |
$ |
89,348 |
|||||||
|
Navient LLC, 3.875%, due 09/10/15 |
270,000 |
270,338 |
|||||||||
|
Pacific Drilling SA, 5.375%, due 06/01/201 |
225,000 |
170,438 |
|||||||||
|
PNC Preferred Funding Trust I, 1.936%, due 03/15/171,2,3 |
400,000 |
364,000 |
|||||||||
|
Prudential Financial, Inc., 5.200%, due 03/15/442 |
385,000 |
381,343 |
|||||||||
|
5.875%, due 09/15/422 |
200,000 |
211,360 |
|||||||||
|
Quicken Loans, Inc., 5.750%, due 05/01/251 |
170,000 |
162,775 |
|||||||||
|
Realogy Group LLC, 7.625%, due 01/15/201 |
80,000 |
84,720 |
|||||||||
|
Regency Energy Partners LP, 5.500%, due 04/15/23 |
160,000 |
162,848 |
|||||||||
|
Reynolds American, Inc., 4.450%, due 06/12/25 |
75,000 |
76,412 |
|||||||||
|
Ryland Group, Inc., 6.625%, due 05/01/20 |
80,000 |
88,800 |
|||||||||
|
Sabine Pass Liquefaction LLC, 6.250%, due 03/15/22 |
250,000 |
258,750 |
|||||||||
|
Seagate HDD Cayman, 5.750%, due 12/01/341 |
120,000 |
118,155 |
|||||||||
|
Standard Pacific Corp., 6.250%, due 12/15/21 |
80,000 |
84,800 |
|||||||||
|
Starwood Hotels & Resorts Worldwide, Inc., 3.750%, due 03/15/25 |
60,000 |
57,836 |
|||||||||
|
4.500%, due 10/01/34 |
80,000 |
74,588 |
|||||||||
|
Transocean, Inc., 6.800%, due 03/15/38 |
110,000 |
82,225 |
|||||||||
|
USG Corp. 5.875%, due 11/01/211 |
80,000 |
84,200 |
|||||||||
|
Valeant Pharmaceuticals International, 7.000%, due 10/01/201 |
280,000 |
291,200 |
|||||||||
|
Virgin Media Secured Finance PLC, 6.000%, due 04/15/211 |
GBP |
99,000 |
161,776 |
||||||||
|
Total United States corporate bonds |
9,773,805 |
||||||||||
|
Total corporate bonds (cost $20,829,246) |
20,390,979 |
||||||||||
|
Collateralized debt obligations: 5.74% |
|||||||||||
|
United States: 5.74% |
|||||||||||
|
Apidos XIV CLO, Series 2013-14A, Class C1, 3.125%, due 04/15/251,2 |
300,000 |
300,000 |
|||||||||
|
Ares XXVII CLO Ltd., Series 2013-2A, Class C, 3.029%, due 07/28/251,2 |
500,000 |
492,500 |
|||||||||
25
UBS Fixed Income Opportunities Fund
Portfolio of investments
June 30, 2015
|
Face amount |
Value |
||||||||||
|
Bonds—(Concluded) |
|||||||||||
|
Collateralized debt obligations—(Concluded) |
|||||||||||
|
United States—(Concluded) |
|||||||||||
|
BlueMountain CLO Ltd., Series 2013-4A, Class C, 2.925%, due 04/15/251,2 |
$ |
300,000 |
$ |
299,220 |
|||||||
|
Galaxy XVI CLO Ltd., Series 2013-16A, Class C, 2.876%, due 11/16/251,2 |
500,000 |
487,500 |
|||||||||
|
Octagon Investment Partners XVII Ltd., Series 2013-1A, Class C, 3.034%, due 10/25/251,2 |
350,000 |
342,489 |
|||||||||
|
Total collateralized debt obligations (cost $1,894,624) |
1,921,709 |
||||||||||
|
Commercial mortgage-backed security: 0.59% |
|||||||||||
|
United States: 0.59% |
|||||||||||
|
BXHTL Mortgage Trust, Series 2015-JWRZ, Class GL2, 3.875%, due 05/15/291,2,5 (cost $199,000) |
200,000 |
198,000 |
|||||||||
|
Mortgage & agency debt securities: 1.28% |
|||||||||||
|
United States: 1.28% |
|||||||||||
|
Federal Home Loan Mortgage Corp. REMIC, IO,6 3.000%, due 05/15/27 |
976,148 |
91,777 |
|||||||||
|
Federal National Mortgage Association REMIC, IO,6 Series 2013-87, Class IW, 2.500%, due 06/25/28 |
3,193,302 |
335,448 |
|||||||||
|
Total mortgage & agency debt securities (cost $412,141) |
427,225 |
||||||||||
|
Municipal bonds: 2.17% |
|||||||||||
|
State of California, GO Bonds, 7.300%, due 10/01/39 |
250,000 |
347,262 |
|||||||||
|
State of Illinois, GO Bonds, 5.665%, due 03/01/18 |
355,000 |
379,176 |
|||||||||
|
Total municipal bonds (cost $633,618) |
726,438 |
||||||||||
|
US government obligations: 22.00% |
|||||||||||
|
US Treasury Bonds, PO, 3.088%, due 05/15/437 |
2,523,000 |
1,014,090 |
|||||||||
|
3.174%, due 08/15/427,8 |
1,250,000 |
514,864 |
|||||||||
|
US Treasury Inflation Indexed Notes (TIPS), 0.125%, due 04/15/16 |
650,000 |
699,995 |
|||||||||
|
0.125%, due 07/15/24 |
1,250,000 |
1,214,690 |
|||||||||
|
Face amount |
Value |
||||||||||
|
US Treasury Notes, 2.000%, due 02/15/228 |
$ |
3,921,000 |
$ |
3,920,388 |
|||||||
|
Total US government obligations (cost $7,558,656) |
7,364,027 |
||||||||||
|
Non-US government obligation: 1.58% |
|||||||||||
|
Croatia: 1.58% |
|||||||||||
|
Republic of Croatia, 6.250%, due 04/27/174 (cost $523,244) |
500,000 |
528,750 |
|||||||||
|
Total bonds (cost $32,050,529) |
31,557,128 |
||||||||||
|
Shares |
|||||||||||
|
Short-term investment: 4.58% |
|||||||||||
|
Investment company: 4.58% |
|||||||||||
|
UBS Cash Management Prime Relationship Fund9 (cost $1,533,682) |
1,533,682 |
1,533,682 |
|||||||||
|
Number of contracts |
|||||||||||
|
Options purchased: 3.04% |
|||||||||||
|
Call options: 1.15% |
|||||||||||
|
10 Year US Treasury Notes, strike@ USD 126.50, expires August 2015 |
198 |
207,281 |
|||||||||
|
30 Year US Treasury Bonds, strike@ USD 151.00, expires July 2015 |
74 |
159,563 |
|||||||||
|
Face amount covered by contracts |
|||||||||||
|
Foreign Exchange Option, Buy USD/AUD, strike@ AUD 1.32, expires September 2015, counterparty: MSC |
$ |
1,020,000 |
19,577 |
||||||||
|
386,421 |
|||||||||||
|
Number of contracts |
|||||||||||
|
Put options: 0.92% |
|||||||||||
|
10 Year US Treasury Notes, strike@ USD 124.00, expires August 2015 |
196 |
79,625 |
|||||||||
26
UBS Fixed Income Opportunities Fund
Portfolio of investments
June 30, 2015
|
Number of contracts |
Value |
||||||||||
|
Options purchased—(Concluded) |
|||||||||||
|
Put options—(Concluded) |
|||||||||||
|
3 Year Euro-Dollar Midcurve, strike@ USD 98.25, expires June 2016 |
89 |
$ |
5,562 |
||||||||
|
30 Year US Treasury Bonds, strike@ USD 148.00, expires July 2015 |
158 |
170,344 |
|||||||||
|
5 Year US Treasury Notes, strike@ USD 118.25, expires August 2015 |
136 |
37,188 |
|||||||||
|
Japanese Government 10 Year Bond, strike@ JPY 146.00, expires August 2015 |
4 |
15,688 |
|||||||||
|
308,407 |
|||||||||||
|
Notional amount |
|||||||||||
|
Options purchased on interest rate swaps: 0.95%10 |
|||||||||||
|
Expiring 01/17/18. If option exercised the Fund pays semi-annually 4.380% and receives quarterly floating 3 month USD LIBOR. Underlying interest rate swap terminating 01/19/48. European style. Counterparty: JPMCB |
$ |
2,675,000 |
63,455 |
||||||||
|
Expiring 12/07/17. If option exercised the Fund pays semi-annually 3.000% and receives quarterly floating 3 month USD LIBOR. Underlying interest rate swap terminating 12/11/22. European style. Counterparty: BB |
3,500,000 |
71,877 |
|||||||||
|
Expiring 12/07/17. If option exercised the Fund pays semi-annually 3.000% and receives quarterly floating 3 month USD LIBOR. Underlying interest rate swap terminating 12/11/22. European style. Counterparty: BB |
8,650,000 |
177,164 |
|||||||||
|
Expiring 12/07/17. If option exercised the Fund pays semi-annually 7.000% and receives quarterly floating 3 month USD LIBOR. Underlying interest rate swap terminating 12/11/22. European style. Counterparty: BB |
3,500,000 |
1,982 |
|||||||||
|
Notional amount |
Value |
||||||||||
|
Expiring 12/07/17. If option exercised the Fund pays semi-annually 7.000% and receives quarterly floating 3 month USD LIBOR. Underlying interest rate swap terminating 12/11/22. European style. Counterparty: BB |
$ |
8,650,000 |
$ |
4,878 |
|||||||
|
319,356 |
|||||||||||
|
Options purchased on credit default swaps on credit indices: 0.02%10 |
|||||||||||
|
Expiring 07/15/15. If exercised the payment from the counterparty will be made upon the occurrence of a failure to pay, obligation acceleration, repudiation or restructuring of referenced obligation specified in the CDX.NA.IG Series 24 Index and the Fund receives quarterly fixed rate of 1.000% per annum. Underlying credit default swap terminating 06/20/20. European style. Counterparty: JPMCB |
3,385,000 |
5,936 |
|||||||||
|
Total options purchased (cost $1,588,685) |
1,020,120 |
||||||||||
|
Total investments: 101.89% (cost $35,172,896) |
34,110,930 |
||||||||||
|
Liabilities, in excess of cash and other assets: (1.89%) |
(631,279 |
) |
|||||||||
|
Net assets: 100.00% |
$ |
33,479,651 |
|||||||||
27
UBS Fixed Income Opportunities Fund
Portfolio of investments
June 30, 2015
Notes to portfolio of investments
Aggregate cost for federal income tax purposes was $35,106,610; and net unrealized depreciation consisted of:
|
Gross unrealized appreciation |
$ |
523,951 |
|||||
|
Gross unrealized depreciation |
(1,519,631 |
) |
|||||
|
Net unrealized depreciation of investments |
$ |
(995,680 |
) |
||||
For a listing of defined portfolio acronyms, counterparty abbreviations and currency abbreviations that are used throughout the Portfolio of investments as well as the tables that follow, please refer to page 45. Portfolio footnotes begin on page 35.
Forward foreign currency contracts
|
Counterparty |
Contracts to deliver |
In exchange for |
Maturity date |
Unrealized appreciation/ (depreciation) |
|||||||||||||||
|
BB |
USD |
266,092 |
INR |
17,280,000 |
09/16/15 |
$ |
1,088 |
||||||||||||
|
CIBC |
NZD |
545,000 |
USD |
375,500 |
07/06/15 |
6,311 |
|||||||||||||
|
CSI |
USD |
230,076 |
BRL |
735,000 |
09/16/15 |
(178 |
) |
||||||||||||
|
CSI |
USD |
181,934 |
ZAR |
2,285,000 |
09/16/15 |
3,355 |
|||||||||||||
|
DB |
USD |
322 |
MXN |
5,000 |
09/17/15 |
(5 |
) |
||||||||||||
|
DB |
USD |
62,480 |
PEN |
200,000 |
09/16/15 |
(281 |
) |
||||||||||||
|
GSI |
NZD |
465,000 |
USD |
329,446 |
07/06/15 |
14,450 |
|||||||||||||
|
GSI |
USD |
232,641 |
TRY |
655,000 |
09/16/15 |
6,427 |
|||||||||||||
|
JPMCB |
AUD |
735,000 |
USD |
560,808 |
07/06/15 |
(6,151 |
) |
||||||||||||
|
JPMCB |
AUD |
335,000 |
USD |
255,701 |
08/06/15 |
(2,236 |
) |
||||||||||||
|
JPMCB |
CAD |
240,000 |
USD |
193,515 |
07/06/15 |
1,372 |
|||||||||||||
|
JPMCB |
EUR |
2,815,000 |
USD |
3,073,507 |
07/06/15 |
(64,964 |
) |
||||||||||||
|
JPMCB |
EUR |
1,860,000 |
USD |
2,075,070 |
08/06/15 |
442 |
|||||||||||||
|
JPMCB |
GBP |
295,000 |
USD |
451,068 |
07/06/15 |
(12,438 |
) |
||||||||||||
|
JPMCB |
GBP |
295,000 |
USD |
464,028 |
08/06/15 |
626 |
|||||||||||||
|
JPMCB |
JPY |
116,600,000 |
USD |
942,838 |
07/06/15 |
(9,937 |
) |
||||||||||||
|
JPMCB |
JPY |
116,600,000 |
USD |
949,980 |
08/06/15 |
(3,165 |
) |
||||||||||||
|
JPMCB |
NZD |
465,000 |
USD |
331,844 |
07/06/15 |
16,848 |
|||||||||||||
|
JPMCB |
NZD |
1,475,000 |
USD |
1,001,922 |
08/06/15 |
5,599 |
|||||||||||||
|
JPMCB |
SEK |
3,250,000 |
USD |
393,347 |
07/06/15 |
1,273 |
|||||||||||||
|
JPMCB |
USD |
564,828 |
AUD |
735,000 |
07/06/15 |
2,131 |
|||||||||||||
|
JPMCB |
USD |
191,861 |
CAD |
240,000 |
07/06/15 |
282 |
|||||||||||||
|
JPMCB |
USD |
193,437 |
CAD |
240,000 |
08/06/15 |
(1,378 |
) |
||||||||||||
|
JPMCB |
USD |
3,147,585 |
EUR |
2,815,000 |
07/06/15 |
(9,113 |
) |
||||||||||||
|
JPMCB |
USD |
464,127 |
GBP |
295,000 |
07/06/15 |
(621 |
) |
||||||||||||
|
JPMCB |
USD |
116,600,000 |
JPY |
949,670 |
07/06/15 |
3,115 |
|||||||||||||
|
JPMCB |
USD |
1,475,000 |
NZD |
1,004,674 |
07/06/15 |
(5,495 |
) |
||||||||||||
|
JPMCB |
USD |
382,346 |
SEK |
3,250,000 |
07/06/15 |
9,728 |
|||||||||||||
|
JPMCB |
USD |
393,591 |
SEK |
3,250,000 |
08/06/15 |
(1,255 |
) |
||||||||||||
|
Net unrealized depreciation on forward foreign currency contracts |
$ |
(44,170 |
) |
||||||||||||||||
28
UBS Fixed Income Opportunities Fund
Portfolio of investments
June 30, 2015
Futures contracts
|
Expiration date |
Cost/ (proceeds) |
Value |
Unrealized appreciation/ (depreciation) |
||||||||||||||||
|
US Treasury futures buy contracts: |
|||||||||||||||||||
|
US Long Bond, 54 contracts (USD) |
September 2015 |
$ |
8,134,954 |
$ |
8,145,563 |
$ |
10,609 |
||||||||||||
|
US Ultra Bond, 13 contracts (USD) |
September 2015 |
2,051,195 |
2,002,812 |
(48,383 |
) |
||||||||||||||
|
2 Year US Treasury Notes, 10 contracts (USD) |
September 2015 |
2,186,733 |
2,189,376 |
2,643 |
|||||||||||||||
|
US Treasury futures sell contracts: |
|||||||||||||||||||
|
US Long Bond, 5 contracts (USD) |
September 2015 |
(772,373 |
) |
(754,219 |
) |
18,154 |
|||||||||||||
|
5 Year US Treasury Notes, 7 contracts (USD) |
September 2015 |
(832,552 |
) |
(834,804 |
) |
(2,252 |
) |
||||||||||||
|
10 Year US Treasury Notes, 67 contracts (USD) |
September 2015 |
(8,452,779 |
) |
(8,453,516 |
) |
(737 |
) |
||||||||||||
|
Interest rate futures sell contracts: |
|||||||||||||||||||
|
90 Day Euro-Dollar, 52 contracts (USD) |
December 2015 |
(12,923,533 |
) |
(12,930,450 |
) |
(6,917 |
) |
||||||||||||
|
90 Day Euro-Dollar Time Deposit, 35 contracts (USD) |
September 2016 |
(8,646,268 |
) |
(8,649,375 |
) |
(3,107 |
) |
||||||||||||
|
Euro-Bobl, 7 contracts (EUR) |
September 2015 |
(1,008,579 |
) |
(1,011,236 |
) |
(2,657 |
) |
||||||||||||
|
Japanese Government 10 Year Bond, 2 contracts (JPY) |
September 2015 |
(2,396,833 |
) |
(2,401,765 |
) |
(4,932 |
) |
||||||||||||
|
Long Gilt, 1 contract (GBP) |
September 2015 |
(180,110 |
) |
(181,840 |
) |
(1,730 |
) |
||||||||||||
|
Net unrealized depreciation on futures contracts |
$ |
(39,309 |
) |
||||||||||||||||
Currency swap agreements10
|
Notional Amount |
|||||||||||||||||||||||||||||||||||
|
Counterparty |
Pay contracts |
Receive contracts |
Termination date |
Pay rate11 |
Receive rate11 |
Upfront payments |
Value |
Unrealized appreciation/ (depreciation) |
|||||||||||||||||||||||||||
|
BB |
USD |
2,407,460 |
AUD |
3,100,000 |
12/24/22 |
3 month USD LIBOR |
3 month BBSW |
$ |
— |
$ |
(7,999 |
) |
$ |
(7,999 |
) |
||||||||||||||||||||
|
CITI |
AUD |
1,884,491 |
USD |
1,462,459 |
09/05/15 |
3 month BBSW |
3 month USD LIBOR |
— |
11,703 |
11,703 |
|||||||||||||||||||||||||
|
JPMCB |
USD |
1,462,459 |
AUD |
1,884,491 |
09/05/23 |
3 month USD LIBOR |
3 month BBSW |
— |
(2,524 |
) |
(2,524 |
) |
|||||||||||||||||||||||
|
MLI |
AUD |
3,100,000 |
USD |
2,407,460 |
12/24/15 |
3 month BBSW |
3 month USD LIBOR |
— |
23,125 |
23,125 |
|||||||||||||||||||||||||
|
$ |
— |
$ |
24,305 |
$ |
24,305 |
||||||||||||||||||||||||||||||
29
UBS Fixed Income Opportunities Fund
Portfolio of investments
June 30, 2015
Interest rate swap agreements
|
Counterparty |
Notional amount |
Termination date |
Payments made by the Fund11 |
Payments received by the Fund11 |
Upfront payments (made)/ received |
Value |
Unrealized appreciation/ (depreciation) |
||||||||||||||||||||||||
|
BB |
JPY |
195,000,000 |
05/27/35 |
1.750 |
% |
6 month JPY LIBOR |
$ |
— |
$ |
(146,805 |
) |
$ |
(146,805 |
) |
|||||||||||||||||
|
CSI |
CAD |
5,490,000 |
02/11/17 |
3 month BA |
3.500 |
% |
(21,312 |
) |
227,860 |
206,548 |
|||||||||||||||||||||
|
CSI |
CAD |
1,550,000 |
02/11/22 |
4.145 |
3 month BA |
— |
(210,940 |
) |
(210,940 |
) |
|||||||||||||||||||||
|
DB |
USD |
2,800,000 |
02/15/38 |
4.474 |
3 month USD LIBOR |
1,006,533 |
(816,976 |
) |
189,557 |
||||||||||||||||||||||
|
DB |
USD |
695,000 |
05/15/40 |
4.560 |
3 month USD LIBOR |
— |
(526,695 |
) |
(526,695 |
) |
|||||||||||||||||||||
|
DB |
USD |
700,000 |
05/15/40 |
3.470 |
3 month USD LIBOR |
(125,600 |
) |
(214,862 |
) |
(340,462 |
) |
||||||||||||||||||||
|
JPMCB |
CAD |
5,490,000 |
02/11/17 |
3.500 |
3 month BA |
— |
(227,860 |
) |
(227,860 |
) |
|||||||||||||||||||||
|
JPMCB |
CAD |
1,550,000 |
02/11/22 |
3 month BA |
4.145 |
— |
210,940 |
210,940 |
|||||||||||||||||||||||
|
JPMCB |
USD |
4,500,000 |
02/18/16 |
2.532 |
3 month USD LIBOR |
— |
(101,179 |
) |
(101,179 |
) |
|||||||||||||||||||||
|
JPMCB |
USD |
40,000,000 |
07/03/42 |
1 month USD LIBOR | 3 month USD LIBOR |
— |
619,361 |
619,361 |
|||||||||||||||||||||||
|
MLI |
CAD |
9,280,000 |
04/09/17 |
3 month BA |
1.978 |
— |
158,516 |
158,516 |
|||||||||||||||||||||||
|
MSC |
CAD |
8,870,000 |
04/08/17 |
3.600 |
3 month BA |
— |
(380,974 |
) |
(380,974 |
) |
|||||||||||||||||||||
|
$ |
859,621 |
$ |
(1,409,614 |
) |
$ |
(549,993 |
) |
||||||||||||||||||||||||
Credit default swaps on credit indices—buy protection12
|
Counterparty |
Referenced index13 |
Notional amount |
Termination date |
Payments made by the Fund11 |
Upfront payments made |
Value |
Unrealized depreciation |
||||||||||||||||||||||||
|
CITI |
iTraxx Europe Sub Financials Series 21 Index |
EUR |
2,000,000 |
06/20/19 |
1.000 |
% |
$ |
(28,484 |
) |
$ |
12,404 |
$ |
(16,080 |
) |
|||||||||||||||||
Credit default swaps on corporate and sovereign issues—buy protection12
|
Counterparty |
Referenced obligation13 |
Notional amount |
Termination date |
Payments made by the Fund11 |
Upfront payments (made)/ received |
Value |
Unrealized appreciation/ (depreciation) |
||||||||||||||||||||||||
|
CITI |
Prudential Financial Inc. bond, 6.100%, due 06/15/17 |
USD |
380,000 |
03/20/20 |
1.000 |
% |
$ |
7,247 |
$ |
(5,440 |
) |
$ |
1,807 |
||||||||||||||||||
|
JPMCB |
Republic of France bond, 4.250%, due 04/25/19 |
USD |
3,025,000 |
09/20/16 |
0.250 |
(97,126 |
) |
(6,840 |
) |
(103,966 |
) |
||||||||||||||||||||
|
MSC |
V.F. Corp. bond, 5.950%, due 11/01/17 |
USD |
500,000 |
12/20/16 |
1.000 |
1,905 |
(7,079 |
) |
(5,174 |
) |
|||||||||||||||||||||
|
$ |
(87,974 |
) |
$ |
(19,359 |
) |
$ |
(107,333 |
) |
|||||||||||||||||||||||
30
UBS Fixed Income Opportunities Fund
Portfolio of investments
June 30, 2015
Credit default swaps on credit indices—sell protection14
|
Counterparty |
Referenced index13 |
Notional amount |
Termination date |
Payments received by the Fund11 |
Upfront payments (made)/ received |
Value |
Unrealized appreciation/ (depreciation) |
Credit spread15 |
|||||||||||||||||||||||||||
|
CSI |
CMBX.NA.BBB-. Series 6 Index |
USD |
1,050,000 |
05/11/63 |
3.000 |
% |
$ |
42,454 |
$ |
(6,845 |
) |
$ |
35,609 |
2.727 |
% |
||||||||||||||||||||
|
JPMCB |
CDX.EM. Series 22 Index |
USD |
1,000,000 |
12/20/19 |
1.000 |
106,662 |
(109,622 |
) |
(2,960 |
) |
3.785 |
||||||||||||||||||||||||
|
MLI |
CDX.EM. Series 22 Index |
USD |
1,400,000 |
12/20/19 |
1.000 |
140,774 |
(153,472 |
) |
(12,698 |
) |
3.785 |
||||||||||||||||||||||||
|
MLI |
CMBX.NA.BB. Series 6 Index |
USD |
700,000 |
05/11/63 |
5.000 |
(21,859 |
) |
(4,049 |
) |
(25,908 |
) |
3.205 |
|||||||||||||||||||||||
|
MSC |
MCDX.NA. Series 24 Index |
USD |
700,000 |
06/20/25 |
1.000 |
19,002 |
(24,402 |
) |
(5,400 |
) |
1.505 |
||||||||||||||||||||||||
|
MSC |
CMBX.NA.BB. Series 6 Index |
USD |
1,000,000 |
05/11/63 |
5.000 |
(31,887 |
) |
(5,783 |
) |
(37,670 |
) |
3.205 |
|||||||||||||||||||||||
|
$ |
255,146 |
$ |
(304,173 |
) |
$ |
(49,027 |
) |
||||||||||||||||||||||||||||
Credit default swaps on corporate and sovereign issues—sell protection14
|
Counterparty |
Referenced obligation13 |
Notional amount |
Termination date |
Payments received by the Fund11 |
Upfront Payments (made)/ received |
Value |
Unrealized appreciation/ (depreciation) |
Credit spread15 |
|||||||||||||||||||||||||||
|
MetLife Inc. bond, CITI |
4.750%, due 02/08/21 |
USD |
380,000 |
03/20/20 |
1.000 |
% |
$ |
(4,978 |
) |
$ |
5,974 |
$ |
996 |
0.661 |
% |
||||||||||||||||||||
|
State of Illinois bond, CITI |
5.000%, due 06/01/29 |
USD |
370,000 |
12/20/23 |
1.000 |
24,231 |
(32,752 |
) |
(8,521 |
) |
2.371 |
||||||||||||||||||||||||
|
$ |
19,253 |
$ |
(26,778 |
) |
$ |
(7,525 |
) |
||||||||||||||||||||||||||||
Centrally cleared interest rate swap agreements
|
Notional amount |
Termination date |
Payments made by the Fund11 |
Payments received by the Fund11 |
Value |
Unrealized appreciation/ (depreciation) |
||||||||||||||||||||||
|
AUD |
2,500,000 |
04/17/25 |
6 month BBSW |
2.695 |
% |
$ |
(104,908 |
) |
$ |
(104,908 |
) |
||||||||||||||||
|
CAD |
1,080,000 |
04/28/25 |
1.984 |
% |
3 month BA |
11,822 |
11,822 |
||||||||||||||||||||
|
GBP |
5,320,000 |
06/17/17 |
6 month GBP LIBOR |
2.190 |
181,245 |
181,245 |
|||||||||||||||||||||
|
GBP |
1,400,000 |
06/17/25 |
3.145 |
6 month GBP LIBOR |
(204,612 |
) |
(204,612 |
) |
|||||||||||||||||||
|
NZD |
1,400,000 |
07/24/24 |
3 month BBSW |
4.712 |
76,124 |
76,124 |
|||||||||||||||||||||
|
NZD |
3,100,000 |
07/24/24 |
3 month BBSW |
4.713 |
168,646 |
168,646 |
|||||||||||||||||||||
|
USD |
2,885,000 |
12/21/18 |
1.627 |
3 month USD LIBOR |
(5,432 |
) |
(5,432 |
) |
|||||||||||||||||||
|
USD |
3,150,000 |
09/24/19 |
2.347 |
3 month USD LIBOR |
(117,947 |
) |
(117,947 |
) |
|||||||||||||||||||
|
USD |
8,250,000 |
12/12/23 |
3.200 |
3 month USD LIBOR |
(588,584 |
) |
(588,584 |
) |
|||||||||||||||||||
|
USD |
1,030,000 |
02/15/41 |
2.825 |
3 month USD LIBOR |
32,328 |
32,328 |
|||||||||||||||||||||
|
$ |
(551,318 |
) |
$ |
(551,318 |
) |
||||||||||||||||||||||
31
UBS Fixed Income Opportunities Fund
Portfolio of investments
June 30, 2015
Centrally cleared credit default swaps on credit indices—buy protection12
|
Referenced index |
Notional amount |
Termination date |
Payments made by the Fund11 |
Value |
Unrealized appreciation/ (depreciation) |
||||||||||||||||||
|
CDX.NA.HY. Series 24 Index |
USD |
1,750,000 |
06/20/20 |
5.000 |
% |
$ |
(110,352 |
) |
$ |
10,128 |
|||||||||||||
|
iTraxx Europe Series 23 Index |
EUR |
3,250,000 |
06/20/20 |
1.000 |
(44,856 |
) |
27,046 |
||||||||||||||||
|
iTraxx Europe Series 22 Index |
EUR |
3,600,000 |
12/20/19 |
1.000 |
(60,306 |
) |
(5,753 |
) |
|||||||||||||||
|
CDX.NA.HY. Series 23 Index |
USD |
3,888,000 |
12/20/19 |
5.000 |
(295,757 |
) |
(116,397 |
) |
|||||||||||||||
|
CDX.NA.IG. Series 24 Index |
USD |
4,100,000 |
06/20/25 |
1.000 |
35,695 |
23,949 |
|||||||||||||||||
|
CDX.NA.IG. Series 23 Index |
USD |
8,200,000 |
12/20/19 |
1.000 |
(111,397 |
) |
1,752 |
||||||||||||||||
|
$ |
(586,973 |
) |
$ |
(59,275 |
) |
||||||||||||||||||
Options written
|
Expiration date |
Premiums received |
Value |
|||||||||||||
|
Call options |
|||||||||||||||
|
3 Year Euro-Dollar Midcurve, 89 contracts, strike @ USD 98.75 |
June 2016 |
$ |
81,226 |
$ |
(93,450 |
) |
|||||||||
|
30 Year US Treasury Bonds, 74 contracts, strike @ USD 154.00 |
July 2015 |
81,988 |
(78,625 |
) |
|||||||||||
|
Foreign Exchange Option, Sell USD/AUD, 1,020,000 contracts, strike @ AUD 1.470 Counterparty: MSC |
September 2015 |
4,896 |
(1,869 |
) |
|||||||||||
|
Put options |
|||||||||||||||
|
5 Year US Treasury Notes, 26 contracts, strike @ USD 119.25 |
August 2015 |
21,493 |
(17,063 |
) |
|||||||||||
|
Euro-Bund, 24 contracts, strike @ EUR 147.50 |
August 2015 |
26,4491 |
(12,040 |
) |
|||||||||||
|
Foreign Exchange Option, Sell USD/AUD, 1,020,000 contracts, strike @ AUD 1.260. Counterparty: MSC |
September 2015 |
8,772 |
(7,270 |
) |
|||||||||||
|
Options written on interest rate swaps10 |
|||||||||||||||
|
If option exercised the Fund receives semi-annually 4.320% and pays quarterly floating 3 month USD LIBOR. Underlying interest rate swap terminating 01/19/20. European style. Counterparty: JPMCB, Notional Amount USD 23,000,000 |
January 2018 |
250,495 |
(48,812 |
) |
|||||||||||
|
If option exercised the Fund receives semi-annually 5.000% and pays quarterly floating 3 month USD LIBOR. Underlying interest rate swap terminating 12/11/22. European style. Counterparty: BB, Notional Amount USD 17,300,000 |
December 2017 |
194,625 |
(49,487 |
) |
|||||||||||
|
If option exercised the Fund receives semi-annually 5.000% and pays quarterly floating 3 month USD LIBOR. Underlying interest rate swap terminating 12/11/22. European style. Counterparty: BB, Notional Amount USD 7,000,000 |
December 2017 |
148,750 |
(20,104 |
) |
|||||||||||
|
Options written on credit default swaps on credit indices10 |
|||||||||||||||
|
If option exercised payment from the counterparty will be received upon the occurrence of a failure to pay, obligation acceleration, repudiation or restructuring of the referenced obligation specified in the CDX.NA.HY Series 24 Index and the Fund pays quarterly fixed rate of 5.000% per annum. Underlying credit default swap terminating 06/20/20. European style. Counterparty: BB, Notional Amount USD 1,770,000 |
July 2015 |
18,585 |
(9,194 |
) |
|||||||||||
|
If option exercised payment from the counterparty will be received upon the occurrence of a failure to pay, obligation acceleration, repudiation or restructuring of the referenced obligation specified in the CDX.NA.HY Series 24 Index and the Fund pays quarterly fixed rate of 5.000% per annum. Underlying credit default swap terminating 06/20/20. European style. Counterparty: JPMCB, Notional Amount USD 1,680,000 |
August 2015 |
3,696 |
(1,487 |
) |
|||||||||||
32
UBS Fixed Income Opportunities Fund
Portfolio of investments
June 30, 2015
Options written (concluded)
|
Expiration date |
Premiums received |
Value |
|||||||||||||
|
If option exercised payment from the counterparty will be received upon the occurrence of a failure to pay, obligation acceleration, repudiation or restructuring of the referenced obligation specified in the CDX.NA.IG Series 24 Index and the Fund pays quarterly fixed rate of 1.000% per annum. Underlying credit default swap terminating 06/20/20. European style. Counterparty: JPMCB, Notional Amount USD 3,385,000 |
October 2015 |
8,039 |
(8,088 |
) |
|||||||||||
|
If option exercised payment from the counterparty will be received upon the occurrence of a failure to pay, obligation acceleration, repudiation or restructuring of the referenced obligation specified in the iTraxx Europe Series 23 Index and the Fund pays quarterly fixed rate of 1.000% per annum. Underlying credit default swap terminating 06/20/20. European style. Counterparty: MSC, Notional Amount EUR 3,250,000 |
September 2015 |
7,421 |
(16,728 |
) |
|||||||||||
|
Total options written |
$ |
856,435 |
$ |
(364,217 |
) |
||||||||||
Written options activity for the year ended June 30, 2015 was as follows:
|
Number of contracts |
Premiums received |
||||||||||
|
Options outstanding at June 30, 2014 |
1,408 |
$ |
600,522 |
||||||||
|
Options written |
1,379 |
719,013 |
|||||||||
|
Options terminated in closing purchase transactions |
(2,574 |
) |
(1,108,379 |
) |
|||||||
|
Options expired prior to exercise |
— |
— |
|||||||||
|
Options outstanding at June 30, 2015 |
213 |
$ |
211,156 |
||||||||
Written swaptions activity for the year ended June 30, 2015 was as follows:
|
Swaptions outstanding at June 30, 2014 |
$ |
1,600,991 |
|||||
|
Swaptions written |
421,740 |
||||||
|
Swaptions terminated in closing purchase transactions |
(1,377,452 |
) |
|||||
|
Swaptions expired prior to exercise |
— |
||||||
|
Swaptions outstanding at June 30, 2015 |
$ |
645,279 |
|||||
1 The premium will be received at either the exercise or expiration date of the contract.
33
UBS Fixed Income Opportunities Fund
Portfolio of investments
June 30, 2015
|
The following is a summary of the fair valuations according to the inputs used as of June 30, 2015 in valuing the Fund's investments: |
|||
|
Description |
Unadjusted quoted prices in active markets for identical investments (Level 1) |
Other significant observable inputs (Level 2) |
Unobservable inputs (Level 3) |
Total |
|||||||||||||||
|
Assets |
|||||||||||||||||||
|
Corporate bonds |
$ |
— |
$ |
20,390,979 |
$ |
— |
$ |
20,390,979 |
|||||||||||
|
Collateralized debt obligations |
— |
1,921,709 |
— |
1,921,709 |
|||||||||||||||
|
Commercial mortgage-backed security |
— |
— |
198,000 |
198,000 |
|||||||||||||||
|
Mortgage & agency debt securities |
— |
427,225 |
— |
427,225 |
|||||||||||||||
|
Municipal bonds |
— |
726,438 |
— |
726,438 |
|||||||||||||||
|
US government obligations |
— |
7,364,027 |
— |
7,364,027 |
|||||||||||||||
|
Non-US government obligation |
— |
528,750 |
— |
528,750 |
|||||||||||||||
|
Short-term investment |
— |
1,533,682 |
— |
1,533,682 |
|||||||||||||||
|
Options purchased |
675,251 |
344,869 |
— |
1,020,120 |
|||||||||||||||
|
Forward foreign currency contracts |
— |
73,047 |
— |
73,047 |
|||||||||||||||
|
Futures contracts |
31,406 |
— |
— |
31,406 |
|||||||||||||||
|
Swap agreements, at value |
— |
1,775,743 |
— |
1,775,743 |
|||||||||||||||
|
Total |
$ |
706,657 |
$ |
35,086,469 |
$ |
198,000 |
$ |
35,991,126 |
|||||||||||
|
Liabilities |
|||||||||||||||||||
|
Forward foreign currency contracts |
$ |
— |
$ |
(117,217 |
) |
$ |
— |
$ |
(117,217 |
) |
|||||||||
|
Futures contracts |
(70,715 |
) |
— |
— |
(70,715 |
) |
|||||||||||||
|
Swap agreements, at value |
— |
(4,637,249 |
) |
— |
(4,637,249 |
) |
|||||||||||||
|
Options written |
(210,317 |
) |
(153,900 |
) |
— |
(364,217 |
) |
||||||||||||
|
Total |
$ |
(281,032 |
) |
$ |
(4,908,366 |
) |
$ |
— |
$ |
(5,189,398 |
) |
||||||||
At June 30, 2015, there were no transfers between Level 1 and Level 2.
Level 3 rollforward disclosure
|
The following is a rollforward of the Fund's investments that were valued using unobservable inputs for the period. |
|||||||||||
|
Collateralized debt obligations |
Total |
||||||||||
|
Assets |
|||||||||||
|
Beginning balance |
$ |
1,075,535 |
$ |
1,075,535 |
|||||||
|
Purchases |
199,000 |
199,000 |
|||||||||
|
Issuances |
— |
— |
|||||||||
|
Sales |
(478,750 |
) |
(478,750 |
) |
|||||||
|
Accrued discounts (premiums) |
— |
— |
|||||||||
|
Total realized loss |
(13,800 |
) |
(13,800 |
) |
|||||||
|
Change in net unrealized appreciation/depreciation |
15,235 |
15,235 |
|||||||||
|
Transfers into Level 3 |
— |
— |
|||||||||
|
Transfers out of Level 316 |
(599,220 |
) |
(599,220 |
) |
|||||||
|
Ending balance |
$ |
198,000 |
$ |
198,000 |
|||||||
The change in net unrealized appreciation/depreciation relating to the Level 3 investments held at June 30, 2015 was $1,000.
34
UBS Fixed Income Opportunities Fund
Portfolio of investments
June 30, 2015
Portfolio footnotes
1 Security exempt from registration pursuant to Rule 144A under the Securities Act of 1933. These securities are considered liquid, unless noted otherwise, and may be resold in transactions exempt from registration, normally to qualified institutional buyers. At June 30, 2015, the value of these securities amounted to $8,552,058 or 25.54% of net assets.
2 Variable or floating rate security—The interest rate shown is the current rate as of June 30, 2015 and changes periodically.
3 Perpetual investment. Date shown reflects the next call date.
4 Security exempt from registration pursuant to Regulation S under the Securities Act of 1933. Regulation S applies to securities offerings that are made outside of the United States and do not involve direct selling efforts in the United States. At June 30, 2015, the value of these securities amounted to $1,773,929 or 5.30% of net assets.
5 Security is being fair valued by a valuation committee under the direction of the Board of Trustees. At June 30, 2015, the value of this security amounted to $198,000 or 0.59% of net assets.
6 On September 7, 2008, the Federal Housing Finance Agency placed the Federal Home Loan Mortgage Corporation and the Federal National Mortgage Association into conservatorship, and the US Treasury guaranteed the debt issued by those organizations.
7 Rate shown reflects annualized yield at June 30, 2015 on zero coupon bond.
8 All or a portion of these securities have been designated as collateral for open swap agreements.
9 The table below details the Fund's investment in funds advised by the same Advisor as the Fund. The Advisor does not earn a management fee from the affiliated UBS Relationship Funds.
|
Security description |
Value 06/30/14 |
Purchases during the year ended 06/30/15 |
Sales during the year ended 06/30/15 |
Net realized gain during the year ended 06/30/15 |
Change in net unrealized appreciation/ (depreciation) during the year ended 06/30/15 |
Value 06/30/15 |
Net income earned from affiliate for the year ended 06/30/15 |
||||||||||||||||||||||||
|
UBS Cash Management Prime Relationship Fund |
$ |
1,161,062 |
$ |
41,942,528 |
$ |
41,569,908 |
$ |
— |
$ |
— |
$ |
1,533,682 |
$ |
1,675 |
|||||||||||||||||
|
UBS Opportunistic Emerging Markets Debt Relationship Fund |
12,199,300 |
— |
11,005,294 |
(343,731 |
) |
(850,275 |
) |
— |
— |
||||||||||||||||||||||
|
$ |
13,360,362 |
$ |
41,942,528 |
$ |
52,575,202 |
$ |
(343,731 |
) |
$ |
(850,275 |
) |
$ |
1,533,682 |
$ |
1,675 |
||||||||||||||||
10 Illiquid investment as of June 30, 2015.
11 Payments made or received are based on the notional amount.
12 If the Fund is a buyer of protection and a credit event occurs, as defined under the terms of that particular swap agreement, the Fund will either (i) receive from the seller of protection an amount equal to the notional amount of the swap and deliver the referenced obligation or underlying securities comprising the referenced index/obligation, or (ii) receive a net settlement amount in the form of cash or securities equal to the notional amount of the swap agreement less the recovery value of the referenced obligation or underlying securities comprising the referenced index/obligation.
13 Payments from/to the counterparty will be received/made upon the occurrence of bankruptcy and/or restructuring event with respect to the referenced index/obligation.
14 If the Fund is a seller of protection and a credit event occurs, as defined under the terms of that particular swap agreement, the Fund will either (i) pay to the buyer of protection an amount equal to the notional amount of the swap and take delivery of the referenced obligation or underlying securities comprising the referenced index/obligation or (ii) pay a net settlement amount in the form of cash or securities equal to the notional amount of the swap agreement less the recovery value of the referenced obligation or underlying securities comprising the referenced index/obligation.
15 Credit spreads, where available, represented in absolute terms, utilized in determining the market value as of period end serve as an indicator of the current status of the payment/performance risk and represent the likelihood or risk of default or other credit event occurring for the credit derivative. The credit spread of a particular referenced entity reflects the cost of buying/selling protection and may include upfront payments required to be made to enter into the agreement. Wider credit spreads represent a deterioration of the referenced entity's credit soundness and a greater likelihood or risk of default or other credit event occurring as defined under the terms of the agreement. A credit spread identified as "Defaulted" indicates a credit event has occurred for the referenced entity. Credit spreads are unaudited.
16 Transfers out of Level 3 represent the value at the end of the period. At June 30, 2015, securities were transferred from Level 3 to Level 2 as the valuations are based on observable inputs from an established pricing source.
See accompanying notes to financial statements.
35
UBS Municipal Bond Fund
Portfolio performance
For the period from its inception on November 10, 2014 through June 30, 2015, Class A shares of UBS Municipal Bond Fund (the "Fund") gained 0.30% (Class A shares declined 1.96% after the deduction of the maximum sales charge), while Class P shares rose 0.45%. For comparison purposes, the Fund's benchmark, the Barclays Municipal Bond Index (the "Index"), gained 1.06%, and the Barclays Municipal Managed Money Intermediate (1-17) Index returned 0.78% over the same time period. (Class P shares have lower expenses than other share classes of the Fund. Returns for all share classes over various time periods are shown on page 38; please note that the Fund's returns do not reflect the deduction of taxes that a shareholder could pay on Fund distributions or the redemption of Fund shares, while the Index returns do not reflect the deduction of fees and expenses.)
The Fund used US Treasury futures during the reporting period to adjust its duration positioning. Overall, the use of Treasury futures contributed to performance.
Portfolio performance summary1
What worked
• Positioning in several parts of the municipal yield curve was additive for performance. The Fund's underweight to the five-year portion of the municipal curve was beneficial given its underperformance versus the Index. In addition, an overweight to the seven-year portion of the curve was additive for results, as it outperformed the Index. (The yield curve plots the interest rates, at a set point in time, of bonds having equal credit quality, but differing maturity dates.)
• The Fund's positioning in a number of sectors was positive for performance. Security selection in the transportation, local general obligation and industrial development revenue/pollution control revenue sectors contributed to performance.
• An overweight to AAA-rated municipal bonds was additive for results, as they outperformed the Index.
1 For a detailed commentary on the market environment in general during the reporting period, see page 2.
36
UBS Municipal Bond Fund
What didn't work
• Positioning in certain portions of the municipal yield curve was detrimental to results. In particular, security selection in the 15-year portion of the curve was negative for performance, as was the Fund's underweight and security selection in the 10-year portion of the curve. Elsewhere, an underweight to securities with maturities of 20+ years, as well as security selection within that group, were drags on results.
• Several of our quality biases detracted from performance. A modest overweight to AA-rated securities, along with an underweight to BBB-rated securities, was not rewarded.
• The Fund's positioning in certain sectors was negative for results. In particular, an overweight to state general obligation bonds was negative for returns, as they lagged the Index. An underweight to the hospital sector detracted from returns as they outperformed the Index.
This letter is intended to assist shareholders in understanding how the Fund performed during the period from its inception on November 10, 2014 through June 30, 2015. The views and opinions in the letter were current as of August 14, 2015. They are not guarantees of future performance or investment results and should not be taken as investment advice. Investment decisions reflect a variety of factors, and we reserve the right to change our views about individual securities, sectors and markets at any time. As a result, the views expressed should not be relied upon as a forecast of the Fund's future investment intent. We encourage you to consult your financial advisor regarding your personal investment program.
Mutual funds are sold by prospectus only. You should read it carefully and consider a fund's investment objectives, risks, charges, expenses and other important information contained in the prospectus before investing. Prospectuses for most of our funds can be obtained from your financial advisor, by calling UBS Funds at 800-647 1568 or by visiting our Web site at www.ubs.com.
37
UBS Municipal Bond Fund
Total returns for periods ended 06/30/15 (unaudited)
|
Inception1 |
|||||||
|
Before deducting maximum sales charge |
|||||||
|
Class A2 |
0.30 |
% |
|||||
|
Class C3 |
0.03 |
||||||
|
Class P4 |
0.45 |
||||||
|
After deducting maximum sales charge |
|||||||
|
Class A2 |
(1.96 |
)% |
|||||
|
Class C3 |
(0.72 |
) |
|||||
|
Barclays Municipal Bond Index5 |
1.06 |
% |
|||||
|
Barclays Municipal Managed Money Intermediate (1-17) Index6 |
0.78 |
% |
|||||
The annualized gross and net expense ratios, respectively, for each class of shares as in the October 28, 2014 prospectuses were as follows: Class A—1.82% and 0.65%; Class C—2.32% and 1.15%; Class P—1.57% and 0.40%. Net expenses reflect fee waivers and/or expense reimbursements, if any, pursuant to an agreement that is in effect to cap the expenses. The Trust, with respect to the Fund, and UBS Global Asset Management (Americas) Inc., the Fund's investment advisor ("UBS Global AM (Americas)" or the "Advisor"), have entered into a written agreement pursuant to which the Advisor has agreed to waive a portion of its management fees and/or to reimburse expenses (excluding expenses incurred through investment in other investment companies, interest, taxes, brokerage commissions and extraordinary expenses) to the extent necessary so that the Fund's ordinary operating expenses (excluding expenses incurred through investment in other investment companies, interest, taxes, brokerage commissions and extraordinary expenses), through the period ending October 27, 2015, do not exceed 0.65% for Class A shares, 1.15% for Class C shares and 0.40% for Class P shares. Pursuant to the written agreement, the Advisor is entitled to be reimbursed for any fees it waives and expenses it reimburses for a period of three years following such fee waivers and expense reimbursements to the extent that such reimbursement of the Advisor by the Fund will not cause the Fund to exceed any applicable expense limit that is in place for the Fund. The fee waiver/expense reimbursement agreement may be terminated by the Fund's Board of Trustees at any time and also will terminate automatically upon the expiration or termination of the Fund's advisory contract with the Advisor. Upon termination of the fee waiver/expense reimbursement agreement, however, UBS Global AM (Americas)'s three year recoupment rights will survive.
1 Inception date of all shares of UBS Municipal Bond Fund and the indices is November 10, 2014.
2 Maximum sales charge for Class A shares is 2.25%. Class A shares bear ongoing 12b-1 service fees.
3 Maximum contingent deferred sales charge for Class C shares is 0.75% imposed on redemptions and is reduced to 0% after one year. Class C shares bear ongoing 12b-1 distribution and service fees.
4 Class P shares do not bear initial or contingent deferred sales charges or ongoing 12b-1 service and distribution fees, but Class P shares held through advisory programs may be subject to a program fee, which, if included, would have reduced performance.
5 The Barclays Municipal Bond Index is an unmanaged index designed to measure the total return of the US dollar denominated long-term tax exempt bond market. Investors should note that indices do not reflect the deduction of fees and expenses.
6 The Barclays Municipal Managed Money Intermediate (1-17) Index is an unmanaged sub-index of the Barclays Municipal Managed Money Index, which is a rules-based, market-value-weighted index designed to track the performance of municipal securities issued by state and local municipalities whose interest is exempt from federal income tax and the federal alternative minimum tax. Investors should note that indices do not reflect the deduction of fees and expenses.
Prior to February 17, 2015, if an investor sold or exchanged shares less than 90 days after purchase, a redemption fee of 1.00% of the amount sold or exchanged was deducted at the time of the transaction, except as noted otherwise in the prospectus. For sales or exchanges taking place on or after February 17, 2015 but prior to August 3, 2015, there is a reduction in the redemption holding period from 90 days to 30 days. Effective August 3, 2015, the 1.00% redemption fee imposed on sales or exchanges of any class of shares of the funds made during the holding periods specified in the prospectus will be eliminated. Please refer to the prospectus for further information.
Past performance does not predict future performance, and the performance information provided does not reflect the deduction of taxes that a shareholder could pay on Fund distributions or the redemption of Fund shares. The return and principal value of an investment will fluctuate, so that an investor's shares, when redeemed, may be worth more or less than their original cost. Performance results assume reinvestment of all dividends and capital gain distributions at net asset value on the ex-dividend dates. Total returns for periods of less than one year have not been annualized. Current performance may be higher or lower than the performance data quoted. For month-end performance figures, please visit http://globalam-us.ubs.com/corpweb/performance.do.
38
UBS Municipal Bond Fund
Illustration of an assumed investment of $10,000 in Class A shares (adjusted for 2.25% maximum sales charge) and $5,000,000 in Class P shares (unaudited)
The following two graphs depict the performance of UBS Municipal Bond Fund Class A and Class P shares versus the Barclays Municipal Bond Index and Barclays Municipal Managed Money Intermediate (1-17) Index from November 10, 2014, which is the inception date of the two classes, through June 30, 2015. The performance of Class C shares will vary based upon the different class specific expenses and sales charges. The performance provided does not reflect the deduction of taxes that a shareholder could pay on Fund distributions or the redemption of Fund shares. Past performance is no guarantee of future results. Share price and returns will vary with market conditions; investors may realize a gain or loss upon redemption.
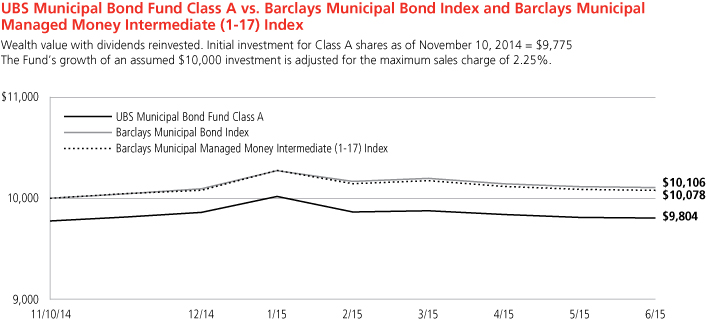
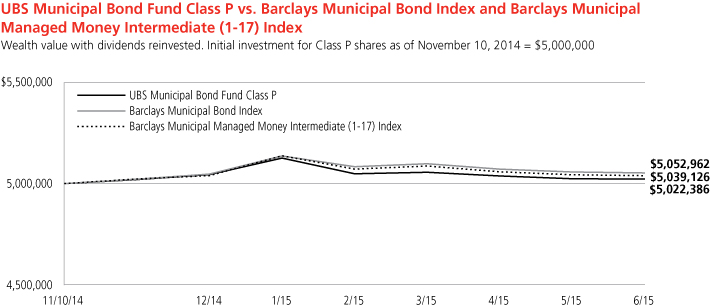
Past performance does not predict future performance, and the performance information provided does not reflect the deduction of taxes that a shareholder could pay on Fund distributions or the redemption of Fund shares. The return and principal value of an investment will fluctuate, so that an investor's shares, when redeemed, may be worth more or less than their original cost. Performance results assume reinvestment of all dividends and capital gain distributions at net asset value on the ex-dividend dates. Total returns for periods of less than one year have not been annualized. Current performance may be higher or lower than the performance data quoted. For month-end performance figures, please visit http://globalam-us.ubs.com/corpweb/performance.do.
39
UBS Municipal Bond Fund
Summary of municipal securities by state
(unaudited)
As a percentage of net assets as of June 30, 2015
|
Long-term municipal bonds |
|||||||
|
Arizona |
3.66 |
% |
|||||
|
California |
7.48 |
||||||
|
Florida |
16.24 |
||||||
|
Illinois |
2.73 |
||||||
|
Massachusetts |
1.75 |
||||||
|
Michigan |
4.14 |
||||||
|
Mississippi |
3.45 |
||||||
|
Nebraska |
3.80 |
||||||
|
New Jersey |
3.74 |
||||||
|
New York |
10.59 |
||||||
|
Ohio |
4.71 |
||||||
|
Pennsylvania |
10.76 |
||||||
|
Rhode Island |
3.39 |
||||||
|
South Carolina |
5.77 |
||||||
|
Texas |
9.91 |
||||||
|
Utah |
1.48 |
||||||
|
Virginia |
1.89 |
||||||
|
Washington |
4.92 |
||||||
|
Total long-term municipal bonds |
100.41 |
% |
|||||
|
Short-term investment |
0.66 |
||||||
|
Total investments |
101.07 |
% |
|||||
|
Liabilities, in excess of cash and other assets |
(1.07 |
) |
|||||
|
Net assets |
100.00 |
% |
|||||
40
UBS Municipal Bond Fund
Portfolio of investments
June 30, 2015
|
Face amount |
Value |
||||||||||
|
Long-term municipal bonds: 100.41% |
|||||||||||
|
Arizona: 3.66% |
|||||||||||
|
City of Glendale, Water & Sewer Revenue Bonds, 5.000%, due 07/01/22 |
$ |
1,000,000 |
$ |
1,180,460 |
|||||||
|
Mesa Arizona Utility System Revenue Bonds, FGIC, 5.000%, due 07/01/161 |
1,000,000 |
1,045,990 |
|||||||||
|
2,226,450 |
|||||||||||
|
California: 7.48% |
|||||||||||
|
Golden State Tobacco Securitization Corp., Enhanced Tobacco Settlement, Asset-Backed Revenue Bonds, Series A, 5.000%, due 06/01/32 |
1,000,000 |
1,130,140 |
|||||||||
|
State of California, Various Purpose, GO Bonds, 5.000%, due 10/01/32 |
1,000,000 |
1,143,990 |
|||||||||
|
5.000%, due 10/01/33 |
2,000,000 |
2,281,100 |
|||||||||
|
4,555,230 |
|||||||||||
|
Florida: 16.24% |
|||||||||||
|
Jea Water & Sewer System Revenue Bonds, Series A-1, 0.030%, due 10/01/382 |
800,000 |
800,000 |
|||||||||
|
School District of St. Lucie County, Sales Tax Revenue Bonds, 5.000%, due 10/01/26 |
1,020,000 |
1,189,789 |
|||||||||
|
The School Board of Broward County, COP, Series B, 5.000%, due 07/01/30 |
2,000,000 |
2,247,760 |
|||||||||
|
The School Board of Miami-Dade County, COP, 5.000%, due 11/01/31 |
1,000,000 |
1,104,280 |
|||||||||
|
Series A, 5.000%, due 05/01/31 |
1,000,000 |
1,112,430 |
|||||||||
|
The School Board of Orange County, COP, Series D, 5.000%, due 08/01/22 |
1,000,000 |
1,179,070 |
|||||||||
|
The School Board of Palm Beach County, COP, Series B, 5.000%, due 08/01/31 |
1,000,000 |
1,128,330 |
|||||||||
|
Face amount |
Value |
||||||||||
|
Volusia Country Florida School Board Certificates Refunding, Master Lease Program, COP, Series B, 5.000%, due 08/01/31 |
$ |
1,000,000 |
$ |
1,122,480 |
|||||||
|
9,884,139 |
|||||||||||
|
Illinois: 2.73% |
|||||||||||
|
City of Chicago O'Hare International Airport, Senior Lien Revenue Bonds, Series B, 5.250%, due 01/01/29 |
500,000 |
564,330 |
|||||||||
|
Illinois Finanace Authority, Sherman Health Systems Revenue Bonds, Series A, 5.500%, due 08/01/171 |
1,000,000 |
1,095,490 |
|||||||||
|
1,659,820 |
|||||||||||
|
Massachusetts: 1.75% |
|||||||||||
|
Massachusetts Water Resources Authority Revenue Bonds, Series E, 5.000%, due 12/01/16 |
1,000,000 |
1,064,200 |
|||||||||
|
Michigan: 4.14% |
|||||||||||
|
Michigan Finance Authority Revenue Bonds, Q-SBLF, 5.000%, due 06/01/20 |
1,150,000 |
1,251,511 |
|||||||||
|
Michigan Municipal Bond Authority, Clean Water Revolving Fund Revenue Bonds, 5.000%, due 10/01/17 |
1,160,000 |
1,269,353 |
|||||||||
|
2,520,864 |
|||||||||||
|
Mississippi: 3.45% |
|||||||||||
|
Mississippi Business Finance Corp., Gulf Opportunity Zone Industrial, Chevron USA, Inc. Revenue Bonds, Series G, 0.010%, due 11/01/352 |
2,100,000 |
2,100,000 |
|||||||||
|
Nebraska: 3.80% |
|||||||||||
|
Public Power Generation Agency, Whelan Energy Center Unit-2, Revenue Bonds, Series A, 5.000%, due 01/01/24 |
2,000,000 |
2,311,220 |
|||||||||
41
UBS Municipal Bond Fund
Portfolio of investments
June 30, 2015
|
Face amount |
Value |
||||||||||
|
Long-term municipal bonds—(Continued) |
|||||||||||
|
New Jersey: 3.74% |
|||||||||||
|
New Jersey Turnpike Authority Revenue Bonds, Series A, 5.000%, due 01/01/27 |
$ |
1,000,000 |
$ |
1,154,210 |
|||||||
|
State of New Jersey, GO Bonds, 5.000%, due 06/01/20 |
1,000,000 |
1,123,940 |
|||||||||
|
2,278,150 |
|||||||||||
|
New York: 10.59% |
|||||||||||
|
City of New York, GO Bonds, Series C, 5.000%, due 08/01/22 |
1,500,000 |
1,773,630 |
|||||||||
|
Series I, 5.000%, due 08/01/17 |
1,040,000 |
1,129,346 |
|||||||||
|
New York City Municipal Water Finance Authority Water and Sewer System Second General Resolution Fiscal 2012 Revenue Bonds, Series FF, 5.000%, due 06/15/33 |
500,000 |
554,750 |
|||||||||
|
New York City Municipal Water Finance Authority Water and Sewer System Second General Resolution Fiscal 2015 Revenue Bonds, Series BB-4, 0.010%, due 06/15/502 |
500,000 |
500,000 |
|||||||||
|
New York City Transitional Finance Authority Revenue Bonds, Series I, 5.000%, due 05/01/34 |
1,250,000 |
1,402,963 |
|||||||||
|
The City of New York, GO Bonds, Series H, 4.000%, due 08/01/18 |
1,000,000 |
1,086,470 |
|||||||||
|
6,447,159 |
|||||||||||
|
Ohio: 4.71% |
|||||||||||
|
State of Ohio, GO Bonds, Series B, 5.000%, due 06/15/28 |
1,500,000 |
1,734,270 |
|||||||||
|
State of Ohio, Major New State Infrastructure Project Revenue Bonds, Series 1, 5.500%, due 06/15/181 |
1,000,000 |
1,130,440 |
|||||||||
|
2,864,710 |
|||||||||||
|
Face amount |
Value |
||||||||||
|
Pennsylvania: 10.76% |
|||||||||||
|
City of Philadelphia, GO Bonds, Series A, 5.000%, due 08/01/22 |
$ |
1,000,000 |
$ |
1,157,600 |
|||||||
|
City of Philadelphia, Water and Wastewater Revenue Bonds, Series B, 5.000%, due 11/01/21 |
1,400,000 |
1,648,108 |
|||||||||
|
Commonwealth of Pennsylvania, GO Bonds, 5.000%, due 08/15/21 |
1,700,000 |
1,969,025 |
|||||||||
|
Pennsylvania Turnpike Commission Revenue Bonds, Series A-1, 5.000%, due 12/01/24 |
1,500,000 |
1,778,010 |
|||||||||
|
6,552,743 |
|||||||||||
|
Rhode Island: 3.39% |
|||||||||||
|
Tobacco Settlement Fing Corp., Asset-Backed Revenue Bonds, Series A, 4.000%, due 06/01/17 |
850,000 |
900,022 |
|||||||||
|
5.000%, due 06/01/21 |
1,000,000 |
1,164,570 |
|||||||||
|
2,064,592 |
|||||||||||
|
South Carolina: 5.77% |
|||||||||||
|
South Carolina State Public Service Authority Revenue Bonds, Series C, 5.000%, due 12/01/22 |
3,000,000 |
3,511,260 |
|||||||||
|
Texas: 9.91% |
|||||||||||
|
Austin Community College District Public Facility Corp., Round Rock Campus Revenue Bonds, 5.000%, due 08/01/24 |
1,000,000 |
1,177,440 |
|||||||||
|
Board of Regents of The Texas A & M University System Permanent University Revenue Bonds, Series A, 5.250%, due 07/01/28 |
1,205,000 |
1,469,835 |
|||||||||
|
Cypress-Fairbanks Independent School District, GO Bonds, Series C, PSF-GTD, 5.000%, due 02/15/31 |
1,000,000 |
1,153,430 |
|||||||||
|
Houston Independent School District, GO Bonds, Series B, PSF-GTD, 5.000%, due 02/15/17 |
1,000,000 |
1,070,580 |
|||||||||
42
UBS Municipal Bond Fund
Portfolio of investments
June 30, 2015
|
Face amount |
Value |
||||||||||
|
Long-term municipal bonds—(Concluded) |
|||||||||||
|
Texas—(Concluded) |
|||||||||||
|
North Texas Tollway Authority System Revenue Bonds, Series A, 5.000%, due 01/01/25 |
$ |
1,000,000 |
$ |
1,162,150 |
|||||||
|
6,033,435 |
|||||||||||
|
Utah: 1.48% |
|||||||||||
|
Murray City Utah Hospital, IHC Health Services, Inc., Revenue Bonds, Series C, 0.030%, due 05/15/372 |
900,000 |
900,000 |
|||||||||
|
Virginia: 1.89% |
|||||||||||
|
Virginia Public School Authority Refunding School Financing Revenue Bonds, Series B, 5.250%, due 08/01/16 |
1,095,000 |
1,153,068 |
|||||||||
|
Washington: 4.92% |
|||||||||||
|
State of Washington, Motor Vehicle Fuel Tax, GO Bonds, Series R-2015D, 4.000%, due 07/01/17 |
1,775,000 |
1,892,026 |
|||||||||
|
Face amount |
Value |
||||||||||
|
State of Washington, Various Purpose, GO Bonds, Series C, 5.000%, due 01/01/181 |
$ |
1,000,000 |
$ |
1,100,190 |
|||||||
|
2,992,216 |
|||||||||||
|
Total long-term municipal bonds (cost $61,790,560) |
61,119,256 |
||||||||||
|
Shares |
|||||||||||
|
Short-term investment: 0.66% |
|||||||||||
|
Investment company: 0.66% |
|||||||||||
|
UBS Cash Management Prime Relationship Fund3 (cost $399,871) |
399,871 |
399,871 |
|||||||||
|
Total investments: 101.07% (cost $62,190,431) |
61,519,127 |
||||||||||
|
Liabilities, in excess of cash and other assets: (1.07%) |
(648,729 |
) |
|||||||||
|
Net assets : 100.00% |
$ |
60,870,398 |
|||||||||
Notes to portfolio of investments
Aggregate cost for federal income tax purposes was $62,190,431; and net unrealized depreciation consisted of:
|
Gross unrealized appreciation |
$ |
70,133 |
|||||
|
Gross unrealized depreciation |
(741,437 |
) |
|||||
|
Net unrealized depreciation of investments |
$ |
(671,304 |
) |
||||
For a listing of defined portfolio acronyms, counterparty abbreviations and currency abbreviations that are used throughout the Portfolio of investments as well as the tables that follow, please refer to page 45. Portfolio footnotes begin on page 44.
Futures contracts
|
Expiration date |
Cost/ (proceeds) |
Value |
Unrealized appreciation |
||||||||||||||||
|
US Treasury futures sell contracts: |
|||||||||||||||||||
|
US Long Bond, 20 contracts (USD) |
September 2015 |
$ |
(3,110,597 |
) |
$ |
(3,016,875 |
) |
$ |
93,722 |
||||||||||
43
UBS Municipal Bond Fund
Portfolio of investments
June 30, 2015
|
The following is a summary of the fair valuations according to the inputs used as of June 30, 2015 in valuing the Fund's investments: |
|||
|
Description |
Unadjusted quoted prices in active markets for identical investments (Level 1) |
Other significant observable inputs (Level 2) |
Unobservable inputs (Level 3) |
Total |
|||||||||||||||
|
Assets |
|||||||||||||||||||
|
Long-term municipal bonds |
$ |
— |
$ |
61,119,256 |
$ |
— |
$ |
61,119,256 |
|||||||||||
|
Short-term investment |
— |
399,871 |
— |
399,871 |
|||||||||||||||
|
Futures contracts |
93,722 |
— |
— |
93,722 |
|||||||||||||||
|
Total |
$ |
93,722 |
$ |
61,519,127 |
$ |
— |
$ |
61,612,849 |
|||||||||||
|
At June 30, 2015, there were no transfers between Level 1 and Level 2. |
|||
Portfolio footnotes
1 Security is prerefunded or escrowed to maturity. The maturity date shown is the earlier reset date or the date of the prerefunded call.
2 Variable or floating rate security—The interest rate shown is the current rate as of June 30, 2015 and changes periodically.
3 The table below details the Fund's investment in a fund advised by the same Advisor as the Fund. The Advisor does not earn a management fee from the affiliated UBS Relationship Fund.
|
Security description |
Value 11/10/14* |
Purchases during the year ended 06/30/15 |
Sales during the year ended 06/30/15 |
Value 06/30/15 |
Net income earned from affiliate for the year ended 06/30/15 |
||||||||||||||||||
|
UBS Cash Management Prime Relationship Fund |
$ |
— |
$ |
79,911,934 |
$ |
79,512,063 |
$ |
399,871 |
$ |
1,538 |
|||||||||||||
* Commencement of operations
See accompanying notes to financial statements.
44
The UBS Funds
June 30, 2015
Portfolio acronym
CLO Collateralized loan obligations
COP Certificate of Participation
FGIC Financial Guaranty Insurance Co.
GO General Obligation
GS Goldman Sachs
IO Interest only—This security entitles the holder to receive interest payments from an underlying pool of mortgages. The risk associated with this security is related to the speed of the principal paydowns. High prepayments would result in a smaller amount of interest being received and cause the yield to decrease. Low prepayments would result in a greater amount of interest being received and cause the yield to increase.
LIBOR London Interbank Offered Rate
PO Principal only security—This security entitles the holder to receive principal payments from an underlying pool of assets or on the security itself. In the case of asset-backed securities, high prepayments return principal faster than expected and cause the yield to increase. Low prepayments return principal slower than expected and cause the yield to decrease.
PSF-GTD Permanent School Fund Guaranteed
REIT Real estate investment trust
REMIC Real Estate Mortgage Investment Conduit
TBA (To be announced) Security is purchased on a forward commitment basis with an approximate principal amount (generally +/-1.0%) and no definite maturity date. The actual principal amount and maturity date will be determined upon settlement, when the specific mortgage pools are assigned.
TIPS Treasury inflation protected securities ("TIPS") are debt securities issued by the US Treasury whose principal and/or interest payments are adjusted for inflation, unlike debt securities that make fixed principal and interest payments. The interest rate paid by the TIPS is fixed, while the principal value rises or falls based on changes in a published Consumer Price Index ("CPI"). Thus, if inflation occurs, the principal and interest payments on the TIPS are adjusted accordingly to protect investors from inflationary loss. During a deflationary period, the principal and interest payments decrease, although the TIPS principal amounts will not drop below their face amounts at maturity. In exchange for the inflation protection, the TIPS generally pay lower interest rates than typical US Treasury securities. Only if inflation occurs will TIPS offer a higher real yield than a conventional Treasury security of the same maturity.
Counterparty abbreviations
BB Barclays Bank PLC
CIBC Canadian Imperial Bank of Commerce
CSI Credit Suisse International
DB Deutsche Bank AG
GSI Goldman Sachs International
JPMCB JPMorgan Chase Bank
MSC Morgan Stanley & Co.
Currency abbreviations
AUD Australian Dollar
BRL Brazilian Real
CAD Canadian Dollar
EUR Euro
GBP Great Britain Pound
INR Indian Rupee
JPY Japanese Yen
MXN Mexican Peso
NZD New Zealand Dollar
PEN Peru Nuevo Sol
SEK Swedish Krona
TRY Turkish Lira
USD United States Dollar
ZAR South African Rand
See accompanying notes to financial statements.
45
The UBS Funds
June 30, 2015 (unaudited)
Explanation of expense disclosure
As a shareholder of the Funds, you incur two types of costs: (1) transactional costs (as applicable); including sales charges (loads); and (2) ongoing costs, including management fees; service and/or distribution (12b-1) fees (if applicable); and other Fund expenses. This example is intended to help you understand your ongoing costs (in dollars) of investing in each Fund and to compare these costs with the ongoing costs of investing in other mutual funds.
The example below is based on an investment of $1,000 invested at the beginning of the period and held for the entire period, January 1, 2015 to June 30, 2015.
Actual expenses
The first line for each class of shares in the table below provides information about actual account values and actual expenses. You may use the information in this line, together with the amount you invested, to estimate the expenses that you paid over a period. Simply divide your account value by $1,000 (for example, an $8,600 account value divided by $1,000 = 8.6), then multiply the result by the number in the first line under the heading entitled "Expenses paid during period" to estimate the expenses you paid on your account during this period.
Hypothetical example for comparison purposes
The second line for each class of shares in the table below provides information about hypothetical account values and hypothetical expenses based on that Fund's actual expense ratios for each class of shares and an assumed rate of return of 5% per year before expenses, which is not that Fund's actual return for each class of shares. The hypothetical account values and expenses may not be used to estimate the actual ending account balance or expenses you paid for the period. You may use this information to compare the ongoing costs of investing in a Fund and other funds. To do so, compare this 5% hypothetical example with the 5% hypothetical examples that appear in the shareholder reports of other funds.
Please note that the expenses shown in the table are meant to highlight your ongoing costs only and do not reflect any transactional costs (as applicable), such as sales charges (loads). Therefore, the second line in the table for each class of shares is useful in comparing ongoing costs only, and will not help you determine the relative total costs of owning different funds. In addition, if these transactional costs were included, your costs would have been higher.
This projection assumes that annualized expense ratios were in effect during the period January 1, 2015 to June 30, 2015.
46
The UBS Funds
June 30, 2015 (unaudited)
|
Beginning account value January 1, 2015 |
Ending account value June 30, 2015 |
Expenses paid during period* 01/01/15 – 06/30/15 |
Expense ratio during period |
||||||||||||||||||||
|
UBS Core Plus Bond Fund |
|||||||||||||||||||||||
|
Class A |
Actual |
$ |
1,000.00 |
$ |
994.90 |
$ |
3.17 |
0.64 |
% |
||||||||||||||
|
Hypothetical (5% annual return before expenses) |
1,000.00 |
1,021.62 |
3.21 |
0.64 |
|||||||||||||||||||
|
Class C |
Actual |
1,000.00 |
993.50 |
5.63 |
1.14 |
||||||||||||||||||
|
Hypothetical (5% annual return before expenses) |
1,000.00 |
1,019.14 |
5.71 |
1.14 |
|||||||||||||||||||
|
Class P |
Actual |
1,000.00 |
996.20 |
1.93 |
0.39 |
||||||||||||||||||
|
Hypothetical (5% annual return before expenses) |
1,000.00 |
1,022.86 |
1.96 |
0.39 |
|||||||||||||||||||
|
UBS Fixed Income Opportunities Fund |
|||||||||||||||||||||||
|
Class A |
Actual |
1,000.00 |
1,019.40 |
4.76 |
0.95 |
||||||||||||||||||
|
Hypothetical (5% annual return before expenses) |
1,000.00 |
1,020.08 |
4.76 |
0.95 |
|||||||||||||||||||
|
Class C |
Actual |
1,000.00 |
1,016.60 |
7.25 |
1.45 |
||||||||||||||||||
|
Hypothetical (5% annual return before expenses) |
1,000.00 |
1,017.60 |
7.25 |
1.45 |
|||||||||||||||||||
|
Class P |
Actual |
1,000.00 |
1,020.60 |
3.51 |
0.70 |
||||||||||||||||||
|
Hypothetical (5% annual return before expenses) |
1,000.00 |
1,021.32 |
3.51 |
0.70 |
|||||||||||||||||||
|
UBS Municipal Bond Fund |
|||||||||||||||||||||||
|
Class A |
Actual |
1,000.00 |
994.30 |
3.21 |
0.65 |
||||||||||||||||||
|
Hypothetical (5% annual return before expenses) |
1,000.00 |
1,021.57 |
3.26 |
0.65 |
|||||||||||||||||||
|
Class C |
Actual |
1,000.00 |
992.10 |
5.68 |
1.15 |
||||||||||||||||||
|
Hypothetical (5% annual return before expenses) |
1,000.00 |
1,019.09 |
5.76 |
1.15 |
|||||||||||||||||||
|
Class P |
Actual |
1,000.00 |
995.60 |
1.98 |
0.40 |
||||||||||||||||||
|
Hypothetical (5% annual return before expenses) |
1,000.00 |
1,022.81 |
2.01 |
0.40 |
|||||||||||||||||||
* Expenses are equal to each Fund's annualized net expense ratios, multiplied by the average account value over the period, multiplied by 181 divided by 365 (to reflect the one-half year period)
47
The UBS Funds
Financial statements
Statement of assets and liabilities
June 30, 2015
|
UBS Core Plus Bond Fund |
UBS Fixed Income Opportunities Fund |
||||||||||
|
Assets: |
|||||||||||
|
Investments, at cost: |
|||||||||||
|
Unaffiliated issuers |
$ |
30,961,383 |
$ |
33,639,214 |
|||||||
|
Affiliated issuers |
8,382,243 |
1,533,682 |
|||||||||
|
Investment of cash collateral in an affiliated issuer received from securities loaned1 |
159,900 |
— |
|||||||||
|
Foreign currency |
356 |
149,065 |
|||||||||
|
$ |
39,503,882 |
$ |
35,321,961 |
||||||||
|
Investments, at value: |
|||||||||||
|
Unaffiliated issuers |
$ |
30,904,512 |
$ |
32,577,248 |
|||||||
|
Affiliated issuers |
8,382,243 |
1,533,682 |
|||||||||
|
Investment of cash collateral in an affiliated issuer received from securities loaned1 |
159,900 |
— |
|||||||||
|
Foreign currency |
352 |
150,448 |
|||||||||
|
Cash |
— |
145 |
|||||||||
|
Receivables: |
|||||||||||
|
Investment securities sold |
9,452,010 |
474 |
|||||||||
|
Interest |
152,799 |
357,293 |
|||||||||
|
Fund shares sold |
— |
12,788 |
|||||||||
|
Foreign tax reclaims |
— |
1,123 |
|||||||||
|
Due from Advisor |
31,994 |
45,123 |
|||||||||
|
Dividends |
709 |
124 |
|||||||||
|
Variation margin on futures contracts |
— |
— |
|||||||||
|
Variation margin on centrally cleared swap agreements |
69,232 |
374,975 |
|||||||||
|
Due from broker |
37,666 |
33,102 |
|||||||||
|
Deferred offering cost |
— |
— |
|||||||||
|
Cash collateral for futures contracts |
17,647 |
316,818 |
|||||||||
|
Cash collateral for swap agreements |
122,965 |
933,302 |
|||||||||
|
Outstanding swap agreements, at value2 |
— |
1,269,883 |
|||||||||
|
Unrealized appreciation on forward foreign currency contracts |
21,346 |
73,047 |
|||||||||
|
Other assets |
25,952 |
23,753 |
|||||||||
|
Total assets |
49,379,327 |
37,703,328 |
|||||||||
|
Liabilities: |
|||||||||||
|
Payables: |
|||||||||||
|
Cash collateral from securities loaned |
159,900 |
— |
|||||||||
|
Investment securities purchased |
16,992,147 |
500 |
|||||||||
|
Custody and fund accounting fees |
28,016 |
38,783 |
|||||||||
|
Fund shares redeemed |
32,811 |
164,423 |
|||||||||
|
Distribution and service fees |
1,295 |
3,577 |
|||||||||
|
Trustees' fees |
6,280 |
6,336 |
|||||||||
|
Due to broker |
— |
367,465 |
|||||||||
|
Variation margin on futures contracts |
10,963 |
39,309 |
|||||||||
|
Accrued expenses |
85,987 |
128,752 |
|||||||||
|
Options written, at value3 |
34,242 |
364,217 |
|||||||||
|
Outstanding swap agreements, at value2 |
4,879 |
2,993,098 |
|||||||||
|
Unrealized depreciation on forward foreign currency contracts |
8,692 |
117,217 |
|||||||||
|
Total liabilities |
17,365,212 |
4,223,677 |
|||||||||
|
Net assets |
$ |
32,014,115 |
$ |
33,479,651 |
|||||||
1 The market value of securities loaned by UBS Core Plus Bond Fund as of June 30, 2015 was $676,441.
2 Net upfront payments (made)/received by UBS Core Plus Bond Fund and UBS Fixed Income Opportunities Fund were $(13,076) and $1,017,566, respectively.
3 Premiums received by UBS Core Plus Bond Fund and UBS Fixed Income Opportunities Fund were $50,290 and $856,435, respectively.
48
The UBS Funds
Financial statements
|
UBS Municipal Bond Fund |
|||||||
|
Assets: |
|||||||
|
Investments, at cost: |
|||||||
|
Unaffiliated issuers |
$ |
61,790,560 |
|||||
|
Affiliated issuers |
399,871 |
||||||
|
Investment of cash collateral in an affiliated issuer received from securities loaned1 |
— |
||||||
|
Foreign currency |
— |
||||||
|
$ |
62,190,431 |
||||||
|
Investments, at value: |
|||||||
|
Unaffiliated issuers |
$ |
61,119,256 |
|||||
|
Affiliated issuers |
399,871 |
||||||
|
Investment of cash collateral in an affiliated issuer received from securities loaned1 |
— |
||||||
|
Foreign currency |
— |
||||||
|
Cash |
— |
||||||
|
Receivables: |
|||||||
|
Investment securities sold |
— |
||||||
|
Interest |
581,970 |
||||||
|
Fund shares sold |
3,363,458 |
||||||
|
Foreign tax reclaims |
— |
||||||
|
Due from Advisor |
38,041 |
||||||
|
Dividends |
190 |
||||||
|
Variation margin on futures contracts |
93,722 |
||||||
|
Variation margin on centrally cleared swap agreements |
— |
||||||
|
Due from broker |
— |
||||||
|
Deferred offering cost |
24,488 |
||||||
|
Cash collateral for futures contracts |
68,000 |
||||||
|
Cash collateral for swap agreements |
— |
||||||
|
Outstanding swap agreements, at value2 |
— |
||||||
|
Unrealized appreciation on forward foreign currency contracts |
— |
||||||
|
Other assets |
20,429 |
||||||
|
Total assets |
65,709,425 |
||||||
|
Liabilities: |
|||||||
|
Payables: |
|||||||
|
Cash collateral from securities loaned |
— |
||||||
|
Investment securities purchased |
4,636,590 |
||||||
|
Custody and fund accounting fees |
16,758 |
||||||
|
Fund shares redeemed |
206 |
||||||
|
Distribution and service fees |
3,719 |
||||||
|
Trustees' fees |
7,625 |
||||||
|
Due to broker |
92,471 |
||||||
|
Variation margin on futures contracts |
— |
||||||
|
Accrued expenses |
81,658 |
||||||
|
Options written, at value3 |
— |
||||||
|
Outstanding swap agreements, at value2 |
— |
||||||
|
Unrealized depreciation on forward foreign currency contracts |
— |
||||||
|
Total liabilities |
4,839,027 |
||||||
|
Net assets |
$ |
60,870,398 |
|||||
See accompanying notes to financial statements.
49
The UBS Funds
Financial statements
Statement of assets and liabilities (continued)
June 30, 2015
|
UBS Core Plus Bond Fund |
UBS Fixed Income Opportunities Fund |
||||||||||
|
Net assets consist of: |
|||||||||||
|
Beneficial interest |
$ |
65,769,737 |
$ |
39,755,145 |
|||||||
|
Accumulated undistributed (distributions in excess of) net investment income |
392,037 |
403,141 |
|||||||||
|
Accumulated net realized loss |
(34,231,421 |
) |
(4,708,096 |
) |
|||||||
|
Net unrealized appreciation (depreciation) |
83,762 |
(1,970,539 |
) |
||||||||
|
Net assets |
$ |
32,014,115 |
$ |
33,479,651 |
|||||||
|
Class A: |
|||||||||||
|
Net assets |
$ |
2,205,402 |
$ |
5,756,337 |
|||||||
|
Shares outstanding |
243,715 |
617,721 |
|||||||||
|
Net asset value and redemption proceeds per share |
$ |
9.05 |
$ |
9.32 |
|||||||
|
Offering price per share (NAV per share plus maximum sales charge)1 |
$ |
9.48 |
$ |
9.76 |
|||||||
|
Class C: |
|||||||||||
|
Net assets |
$ |
1,267,932 |
$ |
3,567,630 |
|||||||
|
Shares outstanding |
140,645 |
383,361 |
|||||||||
|
Net asset value and offering price per share |
$ |
9.02 |
$ |
9.31 |
|||||||
|
Redemption proceeds per share (NAV per share less maximum contingent deferred sales charge)1 |
$ |
8.95 |
$ |
9.24 |
|||||||
|
Class P: |
|||||||||||
|
Net assets |
$ |
28,540,781 |
$ |
24,155,684 |
|||||||
|
Shares outstanding |
3,159,555 |
2,591,142 |
|||||||||
|
Net asset value per share, offering price per share, and redemption proceeds per share |
$ |
9.03 |
$ |
9.32 |
|||||||
1 For Class A, the maximum sales charge is 4.50% for UBS Core Plus Bond Fund and UBS Fixed Income Opportunities Fund, and 2.25% for UBS Municipal Bond Fund. Classes C and P have no front-end sales charges. For Class A shares of each Fund, the maximum contingent deferred sales charge of 1.00% of the shares' offering price or the net asset value at the time of sale by the shareholder, whichever is less, is charged on sales of shares on original purchases of $1,000,000 or more that were not subject to a front-end sales charge made within one year of the purchase date. For Class C, the maximum contingent deferred sales charge is 0.75% for each Fund. Class P has no contingent deferred sales charge. If an investor sells or exchanges shares less than 90 days after purchase, a redemption fee of 1.00% of the amount sold or exchanged is deducted at the time of the transaction, except as noted otherwise in the prospectus. For sales or exchanges taking place on or after February 17, 2015, there will be a reduction in the redemption holding period from 90 days to 30 days. Shares that an investor holds or purchases prior to implementation of this new holding period are subject to preexisting terms for the holding period as outlined in the prospectus. Effective August 3, 2015, the 1.00% redemption fee imposed on sales or exchanges of any class of shares of the funds made during the holdings periods specified in the prospectus will be eliminated.
50
The UBS Funds
Financial statements
|
UBS Municipal Bond Fund |
|||||||
|
Net assets consist of: |
|||||||
|
Beneficial interest |
$ |
61,531,236 |
|||||
|
Accumulated undistributed (distributions in excess of) net investment income |
10,466 |
||||||
|
Accumulated net realized loss |
(93,722 |
) |
|||||
|
Net unrealized appreciation (depreciation) |
(577,582 |
) |
|||||
|
Net assets |
$ |
60,870,398 |
|||||
|
Class A: |
|||||||
|
Net assets |
$ |
10,928,867 |
|||||
|
Shares outstanding |
1,099,177 |
||||||
|
Net asset value and redemption proceeds per share |
$ |
9.94 |
|||||
|
Offering price per share (NAV per share plus maximum sales charge)1 |
$ |
10.17 |
|||||
|
Class C: |
|||||||
|
Net assets |
$ |
2,948,053 |
|||||
|
Shares outstanding |
296,639 |
||||||
|
Net asset value and offering price per share |
$ |
9.94 |
|||||
|
Redemption proceeds per share (NAV per share less maximum contingent deferred sales charge)1 |
$ |
9.87 |
|||||
|
Class P: |
|||||||
|
Net assets |
$ |
46,993,478 |
|||||
|
Shares outstanding |
4,728,563 |
||||||
|
Net asset value per share, offering price per share, and redemption proceeds per share |
$ |
9.94 |
|||||
See accompanying notes to financial statements.
51
The UBS Funds
Financial statements
Statement of operations
For the year ended June 30, 2015
|
UBS Core Plus Bond Fund |
UBS Fixed Income Opportunities Fund |
||||||||||
|
Investment income: |
|||||||||||
|
Interest and other |
$ |
694,468 |
$ |
1,857,617 |
|||||||
|
Affiliated income |
6,000 |
1,675 |
|||||||||
|
Securities lending1 |
1,537 |
— |
|||||||||
|
Total income |
702,005 |
1,859,292 |
|||||||||
|
Expenses: |
|||||||||||
|
Advisory and administration |
181,973 |
347,866 |
|||||||||
|
Distribution and service: |
|||||||||||
|
Class A |
6,524 |
25,487 |
|||||||||
|
Class C |
10,476 |
37,236 |
|||||||||
|
Transfer agency and related services fees: |
|||||||||||
|
Class A |
1,948 |
7,992 |
|||||||||
|
Class C |
2,811 |
3,295 |
|||||||||
|
Class P |
5,581 |
14,667 |
|||||||||
|
Custodian and fund accounting |
56,655 |
79,436 |
|||||||||
|
Federal and state registration |
42,250 |
44,753 |
|||||||||
|
Professional services |
111,548 |
176,822 |
|||||||||
|
Shareholder reports |
12,083 |
45,112 |
|||||||||
|
Trustees |
23,031 |
24,717 |
|||||||||
|
Amortization of offering costs |
— |
— |
|||||||||
|
Other |
18,103 |
36,598 |
|||||||||
|
Total expenses |
472,983 |
843,981 |
|||||||||
|
Fee waivers and/or expense reimbursements by Advisor |
(332,632 |
) |
(443,610 |
) |
|||||||
|
Net expenses |
140,351 |
400,371 |
|||||||||
|
Net investment income |
561,654 |
1,458,921 |
|||||||||
|
Net realized gain (loss) on: |
|||||||||||
|
Investments in unaffiliated issuers |
199,556 |
(1,587,974 |
) |
||||||||
|
Investments in affiliated issuers |
116,393 |
(343,731 |
) |
||||||||
|
Futures contracts |
113,110 |
1,838,639 |
|||||||||
|
Options written |
154,585 |
553,782 |
|||||||||
|
Swap agreements |
(122,635 |
) |
(831,042 |
) |
|||||||
|
Forward foreign currency contracts |
204,410 |
1,697,550 |
|||||||||
|
Foreign currency transactions |
(16,739 |
) |
(227,780 |
) |
|||||||
|
Net realized gain (loss) |
648,680 |
1,099,444 |
|||||||||
|
Change in net unrealized appreciation/depreciation on: |
|||||||||||
|
Investments |
(721,868 |
) |
(3,306,302 |
) |
|||||||
|
Futures contracts |
(39,120 |
) |
(130,817 |
) |
|||||||
|
Options written |
(14,277 |
) |
333,213 |
||||||||
|
Swap agreements |
67,835 |
(374,685 |
) |
||||||||
|
Forward foreign currency contracts |
36,964 |
152,646 |
|||||||||
|
Translation of other assets and liabilities denominated in foreign currency |
(5,257 |
) |
(4,602 |
) |
|||||||
|
Change in net unrealized appreciation/depreciation |
(675,723 |
) |
(3,330,547 |
) |
|||||||
|
Net realized and unrealized loss |
(27,043 |
) |
(2,231,103 |
) |
|||||||
|
Net increase (decrease) in net assets resulting from operations |
$ |
534,611 |
$ |
(772,182 |
) |
||||||
1 Includes affiliated income from UBS Private Money Market Fund LLC of $21 for UBS Core Plus Bond Fund.
2 For the period November 10, 2014 (commencement of operations) through June 30, 2015.
52
The UBS Funds
Financial statements
|
UBS Municipal Bond Fund2 |
|||||||
|
Investment income: |
|||||||
|
Interest and other |
$ |
652,355 |
|||||
|
Affiliated income |
1,538 |
||||||
|
Securities lending1 |
— |
||||||
|
Total income |
653,893 |
||||||
|
Expenses: |
|||||||
|
Advisory and administration |
151,865 |
||||||
|
Distribution and service: |
|||||||
|
Class A |
10,886 |
||||||
|
Class C |
9,250 |
||||||
|
Transfer agency and related services fees: |
|||||||
|
Class A |
793 |
||||||
|
Class C |
631 |
||||||
|
Class P |
4,586 |
||||||
|
Custodian and fund accounting |
19,685 |
||||||
|
Federal and state registration |
3,770 |
||||||
|
Professional services |
78,598 |
||||||
|
Shareholder reports |
23,331 |
||||||
|
Trustees |
17,001 |
||||||
|
Amortization of offering costs |
80,210 |
||||||
|
Other |
13,082 |
||||||
|
Total expenses |
413,688 |
||||||
|
Fee waivers and/or expense reimbursements by Advisor |
(265,905 |
) |
|||||
|
Net expenses |
147,783 |
||||||
|
Net investment income |
506,110 |
||||||
|
Net realized gain (loss) on: |
|||||||
|
Investments in unaffiliated issuers |
(130,295 |
) |
|||||
|
Investments in affiliated issuers |
— |
||||||
|
Futures contracts |
37,365 |
||||||
|
Options written |
— |
||||||
|
Swap agreements |
— |
||||||
|
Forward foreign currency contracts |
— |
||||||
|
Foreign currency transactions |
— |
||||||
|
Net realized gain (loss) |
(92,930 |
) |
|||||
|
Change in net unrealized appreciation/depreciation on: |
|||||||
|
Investments |
(671,304 |
) |
|||||
|
Futures contracts |
93,722 |
||||||
|
Options written |
— |
||||||
|
Swap agreements |
— |
||||||
|
Forward foreign currency contracts |
— |
||||||
|
Translation of other assets and liabilities denominated in foreign currency |
— |
||||||
|
Change in net unrealized appreciation/depreciation |
(577,582 |
) |
|||||
|
Net realized and unrealized loss |
(670,512 |
) |
|||||
|
Net increase (decrease) in net assets resulting from operations |
$ |
(164,402 |
) |
||||
See accompanying notes to financial statements.
53
The UBS Funds
Financial statements
Statement of changes in net assets
|
UBS Core Plus Bond Fund |
|||||||||||
|
Year ended June 30, 2015 |
Year ended June 30, 2014 |
||||||||||
|
Operations: |
|||||||||||
|
Net investment income |
$ |
561,654 |
$ |
650,766 |
|||||||
|
Net realized gain (loss) |
648,680 |
135,320 |
|||||||||
|
Change in net unrealized appreciation/depreciation |
(675,723 |
) |
990,123 |
||||||||
|
Net increase (decrease) in net assets from operations |
534,611 |
1,776,209 |
|||||||||
|
Dividends and distributions to shareholders by class: |
|||||||||||
|
Class A: |
|||||||||||
|
Net investment income |
(79,804 |
) |
(130,087 |
) |
|||||||
|
Return of capital |
— |
— |
|||||||||
|
Total Class A dividends and distributions |
(79,804 |
) |
(130,087 |
) |
|||||||
|
Class C: |
|||||||||||
|
Net investment income |
(36,781 |
) |
(32,432 |
) |
|||||||
|
Return of capital |
— |
— |
|||||||||
|
Total Class C dividends and distributions |
(36,781 |
) |
(32,432 |
) |
|||||||
|
Class P: |
|||||||||||
|
Net investment income |
(917,558 |
) |
(698,024 |
) |
|||||||
|
Return of capital |
— |
— |
|||||||||
|
Total Class P dividends and distributions |
(917,558 |
) |
(698,024 |
) |
|||||||
|
Decrease in net assets from dividends and distributions |
(1,034,143 |
) |
(860,543 |
) |
|||||||
|
Beneficial interest transactions: |
|||||||||||
|
Proceeds from shares sold |
7,314,727 |
2,857,644 |
|||||||||
|
Shares issued on reinvestment of dividends and distributions |
1,008,220 |
783,676 |
|||||||||
|
Cost of shares redeemed |
(5,909,702 |
) |
(9,567,176 |
) |
|||||||
|
Redemption fees |
8,338 |
2,519 |
|||||||||
|
Net increase (decrease) in net assets resulting from beneficial interest transactions |
2,421,583 |
(5,923,337 |
) |
||||||||
|
Increase (decrease) in net asset |
1,922,051 |
(5,007,671 |
) |
||||||||
|
Net assets, beginning of year |
30,092,064 |
35,099,735 |
|||||||||
|
Net assets, end of year |
$ |
32,014,115 |
$ |
30,092,064 |
|||||||
|
Accumulated undistributed net investment income |
$ |
392,037 |
$ |
465,952 |
|||||||
1 For the period November 10, 2014 (commencement of operations) through June 30, 2015.
54
The UBS Funds
Financial statements
|
UBS Fixed Income Opportunities Fund |
UBS Municipal Bond Fund |
||||||||||||||
|
Year ended June 30, 2015 |
Year ended June 30, 2014 |
Period ended June 30, 20151 |
|||||||||||||
|
Operations: |
|||||||||||||||
|
Net investment income |
$ |
1,458,921 |
$ |
2,663,035 |
$ |
506,110 |
|||||||||
|
Net realized gain (loss) |
1,099,444 |
(1,393,181 |
) |
(92,930 |
) |
||||||||||
|
Change in net unrealized appreciation/depreciation |
(3,330,547 |
) |
(2,581,160 |
) |
(577,582 |
) |
|||||||||
|
Net increase (decrease) in net assets from operations |
(772,182 |
) |
(1,311,306 |
) |
(164,402 |
) |
|||||||||
|
Dividends and distributions to shareholders by class: |
|||||||||||||||
|
Class A: |
|||||||||||||||
|
Net investment income |
(133,712 |
) |
— |
(64,280 |
) |
||||||||||
|
Return of capital |
— |
(323,641 |
) |
— |
|||||||||||
|
Total Class A dividends and distributions |
(133,712 |
) |
(323,641 |
) |
(64,280 |
) |
|||||||||
|
Class C: |
|||||||||||||||
|
Net investment income |
(76,913 |
) |
— |
(13,168 |
) |
||||||||||
|
Return of capital |
— |
(7,814 |
) |
— |
|||||||||||
|
Total Class C dividends and distributions |
(76,913 |
) |
(7,814 |
) |
(13,168 |
) |
|||||||||
|
Class P: |
|||||||||||||||
|
Net investment income |
(799,941 |
) |
— |
(449,970 |
) |
||||||||||
|
Return of capital |
— |
(277,596 |
) |
— |
|||||||||||
|
Total Class P dividends and distributions |
(799,941 |
) |
(277,596 |
) |
(449,970 |
) |
|||||||||
|
Decrease in net assets from dividends and distributions |
(1,010,566 |
) |
(609,051 |
) |
(527,418 |
) |
|||||||||
|
Beneficial interest transactions: |
|||||||||||||||
|
Proceeds from shares sold |
32,213,300 |
35,696,320 |
74,538,038 |
||||||||||||
|
Shares issued on reinvestment of dividends and distributions |
780,980 |
362,694 |
240,583 |
||||||||||||
|
Cost of shares redeemed |
(66,092,675 |
) |
(57,876,190 |
) |
(13,221,852 |
) |
|||||||||
|
Redemption fees |
932 |
37,173 |
5,449 |
||||||||||||
|
Net increase (decrease) in net assets resulting from beneficial interest transactions |
(33,097,463 |
) |
(21,780,003 |
) |
61,562,218 |
||||||||||
|
Increase (decrease) in net asset |
(34,880,211 |
) |
(23,700,360 |
) |
60,870,398 |
||||||||||
|
Net assets, beginning of year |
68,359,862 |
92,060,222 |
— |
||||||||||||
|
Net assets, end of year |
$ |
33,479,651 |
$ |
68,359,862 |
$ |
60,870,398 |
|||||||||
|
Accumulated undistributed net investment income |
$ |
403,141 |
$ |
1,207,970 |
$ |
10,466 |
|||||||||
See accompanying notes to financial statements.
55
UBS Core Plus Bond Fund
Financial highlights
The table below sets forth financial data for one share of beneficial interest outstanding throughout each year presented.
|
Class A |
|||||||||||||||||||||||
|
Year ended June 30, |
|||||||||||||||||||||||
|
2015 |
2014 |
2013 |
2012 |
2011 |
|||||||||||||||||||
|
Net asset value, beginning of year |
$ |
9.18 |
$ |
8.91 |
$ |
9.13 |
$ |
8.70 |
$ |
8.69 |
|||||||||||||
|
Income (loss) from investment operations: |
|||||||||||||||||||||||
|
Net investment income1 |
0.15 |
0.17 |
0.16 |
0.20 |
0.24 |
||||||||||||||||||
|
Net realized and unrealized gain (loss) |
0.01 |
0.33 |
(0.15 |
) |
0.46 |
0.18 |
|||||||||||||||||
|
Total income from investment operations |
0.16 |
0.50 |
0.01 |
0.66 |
0.42 |
||||||||||||||||||
|
Redemption fees |
0.003 |
0.003 |
0.003 |
0.003 |
0.003 |
||||||||||||||||||
|
Less dividends/distributions: |
|||||||||||||||||||||||
|
From net investment income |
(0.29 |
) |
(0.23 |
) |
(0.23 |
) |
(0.23 |
) |
(0.41 |
) |
|||||||||||||
|
Net asset value, end of year |
$ |
9.05 |
$ |
9.18 |
$ |
8.91 |
$ |
9.13 |
$ |
8.70 |
|||||||||||||
|
Total investment return2 |
1.69 |
% |
5.68 |
% |
0.06 |
% |
7.64 |
% |
5.00 |
% |
|||||||||||||
|
Ratios to average net assets: |
|||||||||||||||||||||||
|
Expenses before fee waivers and/or expense reimbursement |
1.73 |
% |
1.69 |
% |
1.58 |
% |
1.45 |
% |
1.45 |
% |
|||||||||||||
|
Expenses after fee waivers and/or expense reimbursement |
0.64 |
% |
0.64 |
% |
0.64 |
% |
0.64 |
% |
0.64 |
% |
|||||||||||||
|
Net investment income |
1.60 |
% |
1.89 |
% |
1.77 |
% |
2.18 |
% |
2.76 |
% |
|||||||||||||
|
Supplemental data: |
|||||||||||||||||||||||
|
Net assets, end of year (000's) |
$ |
2,205 |
$ |
3,226 |
$ |
6,951 |
$ |
7,606 |
$ |
5,996 |
|||||||||||||
|
Portfolio turnover rate |
744 |
% |
506 |
% |
374 |
% |
509 |
% |
400 |
% |
|||||||||||||
|
Class P |
|||||||||||||||||||||||
|
Year ended June 30, |
|||||||||||||||||||||||
|
2015 |
2014 |
2013 |
2012 |
2011 |
|||||||||||||||||||
|
Net asset value, beginning of year |
$ |
9.17 |
$ |
8.89 |
$ |
9.11 |
$ |
8.69 |
$ |
8.68 |
|||||||||||||
|
Income (loss) from investment operations: |
|||||||||||||||||||||||
|
Net investment income1 |
0.17 |
0.19 |
0.19 |
0.22 |
0.26 |
||||||||||||||||||
|
Net realized and unrealized gain (loss) |
0.003 |
0.34 |
(0.16 |
) |
0.45 |
0.19 |
|||||||||||||||||
|
Total income from investment operations |
0.17 |
0.53 |
0.03 |
0.67 |
0.45 |
||||||||||||||||||
|
Redemption fees |
0.003 |
0.003 |
0.003 |
0.003 |
0.003 |
||||||||||||||||||
|
Less dividends/distributions: |
|||||||||||||||||||||||
|
From net investment income |
(0.31 |
) |
(0.25 |
) |
(0.25 |
) |
(0.25 |
) |
(0.44 |
) |
|||||||||||||
|
Net asset value, end of year |
$ |
9.03 |
$ |
9.17 |
$ |
8.89 |
$ |
9.11 |
$ |
8.69 |
|||||||||||||
|
Total investment return2 |
1.84 |
% |
6.08 |
% |
0.31 |
% |
7.80 |
% |
5.26 |
% |
|||||||||||||
|
Ratios to average net assets: |
|||||||||||||||||||||||
|
Expenses before fee waivers and/or expense reimbursement |
1.43 |
% |
1.38 |
% |
1.20 |
% |
1.12 |
% |
1.12 |
% |
|||||||||||||
|
Expenses after fee waivers and/or expense reimbursement |
0.39 |
% |
0.39 |
% |
0.39 |
% |
0.39 |
% |
0.39 |
% |
|||||||||||||
|
Net investment income |
1.83 |
% |
2.13 |
% |
2.04 |
% |
2.44 |
% |
3.02 |
% |
|||||||||||||
|
Supplemental data: |
|||||||||||||||||||||||
|
Net assets, end of year (000's) |
$ |
28,541 |
$ |
25,431 |
$ |
26,425 |
$ |
33,501 |
$ |
31,047 |
|||||||||||||
|
Portfolio turnover rate |
744 |
% |
506 |
% |
374 |
% |
509 |
% |
400 |
% |
|||||||||||||
1 Calculated using the average shares method.
2 Total investment return is calculated assuming a $10,000 investment on the first day of each year reported, reinvestment of all dividends and distributions, if any, at net asset value on the ex-dividend dates, and a sale at net asset value on the last day of each year reported. The figures do not include any applicable sales charges; results would be lower if they were included. Returns do not reflect the deduction of taxes that a shareholder would pay on Fund distributions or the redemption of Fund shares.
3 Amount represents less than $0.005 per share.
56
UBS Core Plus Bond Fund
Financial highlights
|
Class C |
|||||||||||||||||||||||
|
Year ended June 30, |
|||||||||||||||||||||||
|
2015 |
2014 |
2013 |
2012 |
2011 |
|||||||||||||||||||
|
Net asset value, beginning of year |
$ |
9.15 |
$ |
8.88 |
$ |
9.10 |
$ |
8.68 |
$ |
8.66 |
|||||||||||||
|
Income (loss) from investment operations: |
|||||||||||||||||||||||
|
Net investment income1 |
0.10 |
0.12 |
0.12 |
0.15 |
0.20 |
||||||||||||||||||
|
Net realized and unrealized gain (loss) |
0.01 |
0.33 |
(0.16 |
) |
0.45 |
0.19 |
|||||||||||||||||
|
Total income from investment operations |
0.11 |
0.45 |
(0.04 |
) |
0.60 |
0.39 |
|||||||||||||||||
|
Redemption fees |
0.003 |
0.003 |
0.003 |
0.003 |
0.003 |
||||||||||||||||||
|
Less dividends/distributions: |
|||||||||||||||||||||||
|
From net investment income |
(0.24 |
) |
(0.18 |
) |
(0.18 |
) |
(0.18 |
) |
(0.37 |
) |
|||||||||||||
|
Net asset value, end of year |
$ |
9.02 |
$ |
9.15 |
$ |
8.88 |
$ |
9.10 |
$ |
8.68 |
|||||||||||||
|
Total investment return2 |
1.19 |
% |
5.30 |
% |
(0.55 |
)% |
7.01 |
% |
4.60 |
% |
|||||||||||||
|
Ratios to average net assets: |
|||||||||||||||||||||||
|
Expenses before fee waivers and/or expense reimbursement |
2.36 |
% |
2.28 |
% |
2.02 |
% |
1.91 |
% |
1.92 |
% |
|||||||||||||
|
Expenses after fee waivers and/or expense reimbursement |
1.14 |
% |
1.14 |
% |
1.14 |
% |
1.14 |
% |
1.14 |
% |
|||||||||||||
|
Net investment income |
1.09 |
% |
1.38 |
% |
1.29 |
% |
1.70 |
% |
2.27 |
% |
|||||||||||||
|
Supplemental data: |
|||||||||||||||||||||||
|
Net assets, end of year (000's) |
$ |
1,268 |
$ |
1,435 |
$ |
1,724 |
$ |
2,187 |
$ |
2,175 |
|||||||||||||
|
Portfolio turnover rate |
744 |
% |
506 |
% |
374 |
% |
509 |
% |
400 |
% |
|||||||||||||
See accompanying notes to financial statements.
57
UBS Fixed Income Opportunities Fund
Financial highlights
The table below sets forth financial data for one share of beneficial interest outstanding throughout each period presented.
|
Class A |
|||||||||||||||||||||||
|
Year ended June 30, |
For the period ended |
||||||||||||||||||||||
|
2015 |
2014 |
2013 |
2012 |
June 30, 20113 |
|||||||||||||||||||
|
Net asset value, beginning of period |
$ |
9.60 |
$ |
9.78 |
$ |
9.66 |
$ |
9.93 |
$ |
10.00 |
|||||||||||||
|
Income (loss) from investment operations: |
|||||||||||||||||||||||
|
Net investment income1 |
0.28 |
0.27 |
0.28 |
0.37 |
0.21 |
||||||||||||||||||
|
Net realized and unrealized gain (loss) |
(0.37 |
) |
(0.39 |
) |
0.13 |
(0.05 |
) |
(0.15 |
) |
||||||||||||||
|
Total income (loss) from investment operations |
(0.09 |
) |
(0.12 |
) |
0.41 |
0.32 |
0.06 |
||||||||||||||||
|
Redemption fees |
0.004 |
0.004 |
0.004 |
0.004 |
0.02 |
||||||||||||||||||
|
Less dividends/distributions: |
|||||||||||||||||||||||
|
From net investment income |
(0.19 |
) |
— |
(0.22 |
) |
(0.34 |
) |
(0.05 |
) |
||||||||||||||
|
Return of capital |
— |
(0.06 |
) |
(0.07 |
) |
— |
(0.10 |
) |
|||||||||||||||
|
From net realized gains |
— |
— |
— |
(0.25 |
) |
— |
|||||||||||||||||
|
Total dividends/distributions |
(0.19 |
) |
(0.06 |
) |
(0.29 |
) |
(0.59 |
) |
(0.15 |
) |
|||||||||||||
|
Net asset value, end of period |
$ |
9.32 |
$ |
9.60 |
$ |
9.78 |
$ |
9.66 |
$ |
9.93 |
|||||||||||||
|
Total investment return2 |
(0.91 |
)% |
(1.14 |
)% |
4.15 |
% |
3.33 |
% |
0.76 |
% |
|||||||||||||
|
Ratios to average net assets: |
|||||||||||||||||||||||
|
Expenses before fee waivers and/or expense reimbursement |
1.84 |
% |
1.43 |
% |
1.42 |
% |
1.42 |
% |
1.39 |
%5 |
|||||||||||||
|
Expenses after fee waivers and/or expense reimbursement |
0.95 |
% |
0.95 |
% |
0.95 |
% |
0.95 |
% |
0.95 |
%5 |
|||||||||||||
|
Net investment income |
2.91 |
% |
2.75 |
% |
2.84 |
% |
3.80 |
% |
3.53 |
%5 |
|||||||||||||
|
Supplemental data: |
|||||||||||||||||||||||
|
Net assets, end of period (000's) |
$ |
5,756 |
$ |
40,366 |
$ |
47,140 |
$ |
37,935 |
$ |
67,314 |
|||||||||||||
|
Portfolio turnover rate |
19 |
% |
38 |
% |
60 |
% |
63 |
% |
48 |
% |
|||||||||||||
|
Class P |
|||||||||||||||||||||||
|
Year ended June 30, |
For the period ended |
||||||||||||||||||||||
|
2015 |
2014 |
2013 |
2012 |
June 30, 20113 |
|||||||||||||||||||
|
Net asset value, beginning of period |
$ |
9.61 |
$ |
9.79 |
$ |
9.67 |
$ |
9.94 |
$ |
10.00 |
|||||||||||||
|
Income (loss) from investment operations: |
|||||||||||||||||||||||
|
Net investment income1 |
0.30 |
0.29 |
0.30 |
0.40 |
0.23 |
||||||||||||||||||
|
Net realized and unrealized gain (loss) |
(0.37 |
) |
(0.39 |
) |
0.13 |
(0.05 |
) |
(0.13 |
) |
||||||||||||||
|
Total income (loss) from investment operations |
(0.07 |
) |
(0.10 |
) |
0.43 |
0.35 |
0.10 |
||||||||||||||||
|
Redemption fees |
0.004 |
0.004 |
0.004 |
0.004 |
— |
||||||||||||||||||
|
Less dividends/distributions: |
|||||||||||||||||||||||
|
From net investment income |
(0.22 |
) |
— |
(0.24 |
) |
(0.37 |
) |
(0.06 |
) |
||||||||||||||
|
Return of capital |
— |
(0.08 |
) |
(0.07 |
) |
— |
(0.10 |
) |
|||||||||||||||
|
From net realized gains |
— |
— |
— |
(0.25 |
) |
— |
|||||||||||||||||
|
Total dividends/distributions |
(0.22 |
) |
(0.08 |
) |
(0.31 |
) |
(0.62 |
) |
(0.16 |
) |
|||||||||||||
|
Net asset value, end of period |
$ |
9.32 |
$ |
9.61 |
$ |
9.79 |
$ |
9.67 |
$ |
9.94 |
|||||||||||||
|
Total investment return2 |
(0.68 |
)% |
(0.99 |
)% |
4.50 |
% |
3.60 |
% |
0.97 |
% |
|||||||||||||
|
Ratios to average net assets: |
|||||||||||||||||||||||
|
Expenses before fee waivers and/or expense reimbursement |
1.64 |
% |
1.14 |
% |
1.13 |
% |
1.14 |
% |
1.29 |
%5 |
|||||||||||||
|
Expenses after fee waivers and/or expense reimbursement |
0.70 |
% |
0.70 |
% |
0.70 |
% |
0.70 |
% |
0.70 |
%5 |
|||||||||||||
|
Net investment income |
3.18 |
% |
2.99 |
% |
3.06 |
% |
4.06 |
% |
3.91 |
%5 |
|||||||||||||
|
Supplemental data: |
|||||||||||||||||||||||
|
Net assets, end of period (000's) |
$ |
24,156 |
$ |
21,139 |
$ |
36,112 |
$ |
26,145 |
$ |
25,523 |
|||||||||||||
|
Portfolio turnover rate |
19 |
% |
38 |
% |
60 |
% |
63 |
% |
48 |
% |
|||||||||||||
1 Calculated using the average shares method.
2 Total investment return is calculated assuming a $10,000 investment on the first day of each period reported, reinvestment of all dividends and distributions, if any, at net asset value on the ex-dividend dates, and a sale at net asset value on the last day of each period reported. The figures do not include any applicable sales charges; results would be lower if they were included. Total investment return for periods of less than one year has not been annualized. Returns do not reflect the deduction of taxes that a shareholder would pay on Fund dividends/distributions or the redemption of Fund shares.
|
Class C |
|||||||||||||||||||||||
|
Year ended June 30, |
For the period ended |
||||||||||||||||||||||
|
2015 |
2014 |
2013 |
2012 |
June 30, 20113 |
|||||||||||||||||||
|
Net asset value, beginning of period |
$ |
9.59 |
$ |
9.76 |
$ |
9.65 |
$ |
9.92 |
$ |
10.00 |
|||||||||||||
|
Income (loss) from investment operations: |
|||||||||||||||||||||||
|
Net investment income1 |
0.23 |
0.22 |
0.23 |
0.32 |
0.18 |
||||||||||||||||||
|
Net realized and unrealized gain (loss) |
(0.36 |
) |
(0.38 |
) |
0.12 |
(0.05 |
) |
(0.14 |
) |
||||||||||||||
|
Total income (loss) from investment operations |
(0.13 |
) |
(0.16 |
) |
0.35 |
0.27 |
0.04 |
||||||||||||||||
|
Redemption fees |
0.004 |
0.004 |
0.004 |
0.004 |
0.004 |
||||||||||||||||||
|
Less dividends/distributions: |
|||||||||||||||||||||||
|
From net investment income |
(0.15 |
) |
— |
(0.17 |
) |
(0.29 |
) |
(0.02 |
) |
||||||||||||||
|
Return of capital |
— |
(0.01 |
) |
(0.07 |
) |
— |
(0.10 |
) |
|||||||||||||||
|
From net realized gains |
— |
— |
— |
(0.25 |
) |
— |
|||||||||||||||||
|
Total dividends/distributions |
(0.15 |
) |
(0.01 |
) |
(0.24 |
) |
(0.54 |
) |
(0.12 |
) |
|||||||||||||
|
Net asset value, end of period |
$ |
9.31 |
$ |
9.59 |
$ |
9.76 |
$ |
9.65 |
$ |
9.92 |
|||||||||||||
|
Total investment return2 |
(1.48 |
)% |
(1.65 |
)% |
3.65 |
% |
2.82 |
% |
0.43 |
% |
|||||||||||||
|
Ratios to average net assets: |
|||||||||||||||||||||||
|
Expenses before fee waivers and/or expense reimbursement |
2.42 |
% |
1.93 |
% |
1.92 |
% |
1.93 |
% |
1.94 |
%5 |
|||||||||||||
|
Expenses after fee waivers and/or expense reimbursement |
1.45 |
% |
1.45 |
% |
1.45 |
% |
1.45 |
% |
1.45 |
%5 |
|||||||||||||
|
Net investment income |
2.42 |
% |
2.24 |
% |
2.34 |
% |
3.31 |
% |
3.06 |
%5 |
|||||||||||||
|
Supplemental data: |
|||||||||||||||||||||||
|
Net assets, end of period (000's) |
$ |
3,568 |
$ |
6,855 |
$ |
8,808 |
$ |
6,519 |
$ |
8,116 |
|||||||||||||
|
Portfolio turnover rate |
19 |
% |
38 |
% |
60 |
% |
63 |
% |
48 |
% |
|||||||||||||
58
UBS Fixed Income Opportunities Fund
Financial highlights
3 For the period November 29, 2010 (commencement of operations) through June 30, 2011.
4 Amount represents less than $0.005 per share.
5 Annualized.
See accompanying notes to financial statements.
59
UBS Municipal Bond Fund
Financial highlights
The table below sets forth financial data for one share of beneficial interest outstanding throughout each period presented.
|
Class A |
Class C |
Class P |
|||||||||||||
|
For the period ended June 30, 20153 |
For the period ended June 30, 20153 |
For the period ended June 30, 20153 |
|||||||||||||
|
Net asset value, beginning of period |
$ |
10.00 |
$ |
10.00 |
$ |
10.00 |
|||||||||
|
Income (loss) from investment operations: |
|||||||||||||||
|
Net investment income1 |
0.09 |
0.06 |
0.10 |
||||||||||||
|
Net realized and unrealized loss |
(0.06 |
) |
(0.06 |
) |
(0.05 |
) |
|||||||||
|
Total income from investment operations |
0.03 |
0.004 |
0.05 |
||||||||||||
|
Less dividends/distributions: |
|||||||||||||||
|
From net investment income |
(0.09 |
) |
(0.06 |
) |
(0.11 |
) |
|||||||||
|
Net asset value, end of period |
$ |
9.94 |
$ |
9.94 |
$ |
9.94 |
|||||||||
|
Total investment return2 |
0.30 |
% |
0.03 |
% |
0.45 |
% |
|||||||||
|
Ratios to average net assets: |
|||||||||||||||
|
Expenses before fee waivers and/or expense reimbursement |
1.46 |
%5 |
1.98 |
%5 |
1.23 |
%5 |
|||||||||
|
Expenses after fee waivers and/or expense reimbursement |
0.65 |
%5 |
1.14 |
%5 |
0.40 |
%5 |
|||||||||
|
Net investment income |
1.43 |
%5 |
0.94 |
%5 |
1.63 |
%5 |
|||||||||
|
Supplemental data: |
|||||||||||||||
|
Net assets, end of period (000's) |
$ |
10,929 |
$ |
2,948 |
$ |
46,993 |
|||||||||
|
Portfolio turnover rate |
72 |
% |
72 |
% |
72 |
% |
|||||||||
1 Calculated using the average shares method.
2 Total investment return is calculated assuming a $10,000 investment on the first day of each period reported, reinvestment of all dividends and distributions, if any, at net asset value on the ex-dividend dates, and a sale at net asset value on the last day of each period reported. The figures do not include any applicable sales charges; results would be lower if they were included. Total investment return for periods of less than one year has not been annualized. Returns do not reflect the deduction of taxes that a shareholder could pay on Fund distributions or the redemption of Fund shares.
3 For the period November 10, 2014 (commencement of operations) through June 30, 2015.
4 Amount represents less than $0.005 per share.
5 Annualized.
See accompanying notes to financial statements.
60
The UBS Funds
Notes to financial statements
1. Organization and significant accounting policies
The UBS Funds (the "Trust") is registered with the US Securities and Exchange Commission ("SEC") under the Investment Company Act of 1940 (the "1940 Act"), as amended, as an open-end management investment company currently offering multiple series representing separate investment portfolios. The Trust is a Delaware statutory trust organized on August 13, 1993. The trustees of the Trust have the authority to issue an unlimited number of shares of beneficial interest at a par value of $0.001 per share.
The Trust has 13 Funds available for investment, each having its own investment objectives and policies. The following three funds are covered in this report: UBS Core Plus Bond Fund, UBS Fixed Income Opportunities Fund and UBS Municipal Bond Fund (each a "Fund", and collectively, the "Funds").
Each of the Funds covered by this report is diversified for purposes of the 1940 Act. The Funds currently offer Class A, Class C and Class P shares. Each class represents interests in the same assets of the applicable Fund and the classes are identical except for differences in their sales charge structures, ongoing distribution and service charges and certain transfer agency and related services expenses. All classes of shares have equal voting privileges except that each class has exclusive voting rights with respect to its distribution and/or service plan, if any. Class P shares have no distribution or service plan.
In the normal course of business, the Funds may enter into contracts that contain a variety of representations that provide general indemnification for certain liabilities. The Funds' maximum exposure under these arrangements is unknown, as this would involve future claims that may be made against the Funds that have not yet occurred. However, the Funds have not had any prior claims or losses pursuant to these contracts and expect the risk of loss to be remote.
The Trust accounts separately for the assets, liabilities and operations of each series. Expenses directly attributable to each series are charged to that series' operations; expenses which are applicable to all series are allocated among them on a pro rata basis.
The Financial Accounting Standards Board ("FASB") Accounting Standards Codification ("ASC") is the exclusive reference of authoritative US generally accepted accounting principles ("US GAAP") recognized by the FASB to be applied by nongovernmental entities. Rules and interpretive releases of the SEC under authority of federal laws are also sources of authoritative US GAAP for SEC registrants. The Funds' financial statements are prepared in accordance with US GAAP, which may require the use of management estimates and assumptions. Actual results could differ from those estimates. The following is a summary of significant accounting policies:
A. Valuation of investments: Each Fund calculates its net asset value on days that the New York Stock Exchange ("NYSE") is open. A Fund calculates net asset value separately for each class as of the close of regular trading on the NYSE (generally, 4:00 p.m., Eastern time). If trading on the NYSE is halted for the day before 4:00 p.m., Eastern time, a Fund's net asset value per share will be calculated as of the time trading was halted.
Each Fund calculates its net asset value based on the current market value, where available, for its portfolio securities. The Funds normally obtain market values for their investments from independent pricing sources and broker-dealers. Independent pricing sources may use reported last sale prices, official market closing prices, current market quotations or valuations from computerized "evaluation" systems that derive values based on comparable investments. An evaluation system incorporates parameters such as security quality, maturity and coupon, and/or research and evaluations by its staff, including review of broker-dealer market price quotations, if available, in determining the valuation of the portfolio investments. Investments also may be valued based on appraisals derived from information concerning the investment or similar investments received from recognized dealers in those holdings. Investments traded in the over-the-counter ("OTC") market and listed on The NASDAQ Stock Market, Inc.
61
The UBS Funds
Notes to financial statements
("NASDAQ") normally are valued at the NASDAQ Official Closing Price. Other OTC securities are valued at the last bid price on the valuation date available prior to valuation. Investments which are listed on US and foreign stock exchanges normally are valued at the market closing price, the last sale price on the day the securities are valued or, lacking any sales on such day, at the last available bid price. Investments listed on foreign stock exchanges may be fair valued based on significant events that have occurred subsequent to the close of the foreign markets. In cases where investments are traded on more than one exchange, the investments are valued on the exchange designated as the primary market by UBS Global Asset Management (Americas) Inc. ("UBS Global AM" or the "Advisor"), the investment advisor of the Funds. UBS Global AM is an asset management subsidiary of UBS Group AG. UBS Group AG an internationally diversified organization with headquarters in Zurich, Switzerland. UBS Group AG operates in many areas of the financial services industry. If a market value is not readily available from an independent pricing source for a particular investment, that investment is valued at fair value determined in good faith by or under the direction of the Board. Various factors may be reviewed in order to make a good faith determination of an investment's fair value. These factors include, but are not limited to, fundamental analytical data relating to the investment; the nature and duration of restrictions on disposition of the investment; and the evaluation of forces which influence the market in which the investment is purchased and sold. Foreign currency exchange rates are generally determined as of the close of the NYSE.
Certain investments in which the Funds invest are traded in markets that close before 4:00 p.m., Eastern time. Normally, developments that occur between the close of the foreign markets and 4:00 p.m., Eastern time, will not be reflected in the Fund's net asset value. However, if any of the Funds determine that such developments are so significant that they will materially affect the value of the Fund's investments, the Fund may adjust the previous closing prices to reflect what is believed to be the fair value of these investments as of 4:00 p.m., Eastern time.
Certain Funds may use a systematic fair valuation model provided by an independent third party to value investments principally traded in foreign markets in order to adjust for possible stale pricing that may occur between the close of the foreign exchanges and the time for valuation. The systematic fair valuation model may use calculations based on indices of domestic securities and other appropriate indicators, such as prices of relevant ADRs and futures contracts. If an investment is valued at "fair value," that value is likely to be different from the last quoted market price for the investment. The use of the fair valuation model may result in securities being transferred between Level 1 and Level 2 of the fair valuation hierarchy at the end of the reporting period. Transfers between Level 1 and Level 2, if any, are disclosed near the end of each Fund's Portfolio of investments.
The amortized cost method of valuation, which approximates market value, generally is used to value short-term debt instruments with 60 days or less remaining to maturity, unless the Board determines that this does not represent fair value. Investments in open-end investment companies are valued at the daily closing net asset value of the respective investment company. Pursuant to the Funds' use of the practical expedient within ASC Topic 820, investments in non-registered investment companies are also valued at the daily net asset value. All investments quoted in foreign currencies are valued daily in US dollars on the basis of the foreign currency exchange rates prevailing at the time such valuation is determined by the Funds' custodian.
Futures contracts are generally valued at the settlement price established each day on the exchange on which they are traded. Forward foreign currency contracts are valued daily using forward exchange rates quoted by independent pricing services.
Swaps are marked-to-market daily based upon values from third party vendors or quotations from market makers to the extent available, and the change in value, if any, is recorded as an unrealized gain or loss on the Statement of assets and liabilities. In the event that market quotations are not readily available or deemed unreliable, the swap is valued at fair value as determined in good faith by or under the direction of the Board.
62
The UBS Funds
Notes to financial statements
The Board has delegated to the UBS Global AM Global Valuation Committee ("GVC") the responsibility for making fair value determinations with respect to the Funds' portfolio holdings. The GVC is comprised of representatives of management.
The GVC provides reports to the Board at each quarterly meeting regarding any investments that have been fair valued, valued pursuant to standing instructions approved by the GVC, or where non-vendor pricing sources had been used to make fair value determinations when sufficient information exists during the prior quarter. Fair valuation determinations are subject to review at least monthly by the GVC during scheduled meetings. Pricing decisions, processes, and controls over fair value determinations are subject to internal and external reviews, including annual internal compliance reviews and periodic internal audit reviews.
The types of investments for which such fair value pricing may be necessary include, but are not limited to: foreign investments under some circumstances; investments of an issuer that has entered into a restructuring; investments whose trading has been halted or suspended; fixed income securities that are in default and for which there is no current market value quotation; and investments that are restricted as to transfer or resale. The need to fair value a Fund's portfolio investments may also result from low trading volume in foreign markets or thinly traded domestic investments, and when a security that is subject to a trading limit or collar on the exchange or market on which it is primarily traded reaches the "limit up" or "limit down" price and no trading has taken place at that price. Various factors may be reviewed in order to make a good faith determination of an investment's fair value. These factors include, but are not limited to, fundamental analytical data relating to the investment; the nature and duration of restrictions on disposition of the investment; and the evaluation of forces which influence the market in which the investment is purchased and sold. Valuing investments at fair value involves greater reliance on judgment than valuing investments that have readily available market quotations. Fair value determinations can also involve reliance on quantitative models employed by a fair value pricing service.
US GAAP requires disclosure regarding the various inputs that are used in determining the value of the Funds' investments. These inputs are summarized into the three broad levels listed below:
Level 1—Unadjusted quoted prices in active markets for identical investments.
Level 2—Other significant observable inputs, including but not limited to, quoted prices for similar investments, interest rates, prepayment speeds and credit risk.
Level 3—Unobservable inputs inclusive of the Funds' own assumptions in determining the fair value of investments.
A fair value hierarchy has been included near the end of the Fund's Portfolio of investments.
In June 2014, FASB issued Accounting Standards Update No. 2014-11, Transfers & Servicing (Topic 860): "Repurchase-to-Maturity Transactions, Repurchase Financings, and Disclosures" ("ASU 2014-11") to improve the financial reporting of reverse repurchase agreements and other similar transactions. ASU 2014-11 includes expanded disclosure requirements for entities that enter into reverse repurchase agreements and similar transactions accounted for as secured borrowings. ASU 2014-11 is effective for annual reporting periods beginning after December 15, 2014 and interim periods within those fiscal periods. Management is currently evaluating the implications of these changes and their impact on the financial statements and disclosures.
In May 2015, FASB issued Accounting Standards Update No. 2015-07, Fair Value Measurement (Topic 820): "Disclosures for Investments in Certain Entities That Calculate Net Asset Value per Share (or Its Equivalent)" ("ASU 2015-07"). The modification removes the requirement to categorize within the fair value hierarchy all investments for which fair value is measured using the NAV per share practical expedient. ASU 2015-07 is effective for annual
63
The UBS Funds
Notes to financial statements
reporting periods beginning after December 15, 2015 and interim periods within those fiscal periods. Management is currently evaluating the implications of these changes and their impact on the financial statements and disclosures.
The provisions of ASC Topic 815 "Derivatives and Hedging" ("ASC Topic 815") require qualitative disclosures about objectives and strategies for using derivatives, quantitative disclosures about fair value amounts of gains and losses on derivative instruments and disclosures about credit-risk related contingent features in derivative agreements. Since investment companies value their derivatives at fair value and recognize changes in fair value through the Statement of operations, they do not qualify for hedge accounting under ASC Topic 815. Accordingly, even though a Fund's investments in derivatives may represent economic hedges, they are considered to be non-hedge transactions for purposes of disclosure under ASC Topic 815. ASC Topic 815 requires that (1) objectives for using derivative instruments be disclosed in terms of underlying risk and accounting designation, (2) the fair values of derivative instruments and their gains and losses be disclosed in a tabular format, and (3) information be disclosed about credit-risk contingent features of derivatives contracts. Details of this disclosure can be found below as well as in the Portfolio of investments. Swap agreements, forward foreign currency contracts, swaptions and options written entered into by a Fund may contain credit-risk related contingent features that could be triggered subject to certain circumstances. Such circumstances include agreed upon net asset value thresholds. If triggered, the derivative counterparty could request additional cash margin and/or terminate the derivative contract. The aggregate fair value of the derivative contracts that are in a net liability position that contain these triggers can be found in the Portfolio of investments. The aggregate fair value of assets that are already posted as collateral as of June 30, 2015 is reflected in the Statement of assets and liabilities. If the applicable credit-risk related contingent features were triggered as of June 30, 2015, a Fund would be required to post additional collateral or may be required to terminate the contracts and settle any amounts outstanding. The Funds may be sellers of protection through credit default swap agreements which are by nature credit-risk contingent (the terms of these agreements can be found within the Portfolio of investments, with further discussion in the Notes to financial statements). The volume of derivatives as disclosed in each Fund's Portfolio of investments is representative of the volume of derivatives outstanding during the year ended June 30, 2015.
Disclosure of derivatives by underlying risk as of and for the year ended June 30, 2015 is as follows:
Asset derivatives
|
Interest rate risk |
Credit risk |
Foreign exchange risk |
Total |
||||||||||||||||
|
UBS Core Plus Bond Fund |
|||||||||||||||||||
|
Forward foreign currency contracts1 |
$ |
— |
$ |
— |
$ |
21,346 |
$ |
21,346 |
|||||||||||
|
Futures contracts2 |
15,089 |
— |
— |
15,089 |
|||||||||||||||
|
Options purchased1 |
650 |
2,805 |
6,334 |
9,789 |
|||||||||||||||
|
Swap agreements1,2 |
161,511 |
— |
— |
161,511 |
|||||||||||||||
|
Total value |
$ |
177,250 |
$ |
2,805 |
$ |
27,680 |
$ |
207,735 |
|||||||||||
1 Statement of assets and liabilities location: Options purchased are shown within investments in securities of unaffiliated issuers, at value, outstanding swap agreements, at value (except centrally cleared swaps) and unrealized appreciation on forward foreign currency contracts.
2 Includes cumulative appreciation of futures contracts and centrally cleared swaps as reported in the futures contracts and centrally cleared swaps tables in the Portfolio of investments, but only the unpaid variation margin is reported within the Statement of assets and liabilities within Variation margin on futures contracts and swap agreements, respectively.
64
The UBS Funds
Notes to financial statements
Liability derivatives
|
Interest rate risk |
Credit risk |
Foreign exchange risk |
Total |
||||||||||||||||
|
UBS Core Plus Bond Fund |
|||||||||||||||||||
|
Forward foreign currency contracts1 |
$ |
— |
$ |
— |
$ |
(8,692 |
) |
$ |
(8,692 |
) |
|||||||||
|
Futures contracts2 |
(26,052 |
) |
— |
— |
(26,052 |
) |
|||||||||||||
|
Options written1 |
(27,462 |
) |
(3,823 |
) |
(2,957 |
) |
(34,242 |
) |
|||||||||||
|
Swap agreements1,2 |
(20,982 |
) |
(4,879 |
) |
— |
(25,861 |
) |
||||||||||||
|
Total value |
$ |
(74,496 |
) |
$ |
(8,702 |
) |
$ |
(11,649 |
) |
$ |
(94,847 |
) |
|||||||
1 Statement of assets and liabilities location: Options written, at value, outstanding swap agreements, at value (except centrally cleared swaps) and unrealized depreciation on forward foreign currency contracts.
2 Includes cumulative depreciation of futures contracts and centrally cleared swaps as reported in the futures contracts and centrally cleared swaps tables in the Portfolio of investments, but only the unpaid variation margin is reported within the Statement of assets and liabilities within Variation margin on futures contracts and swap agreements, respectively.
Activities in derivative instruments during the year ended June 30, 2015, were as follows:
|
Interest rate risk |
Credit risk |
Foreign exchange risk |
Total |
||||||||||||||||
|
UBS Core Plus Bond Fund |
|||||||||||||||||||
|
Net realized gain (loss)1 |
|||||||||||||||||||
|
Forward foreign currency contracts |
$ |
— |
$ |
— |
$ |
204,410 |
$ |
204,410 |
|||||||||||
|
Futures contracts |
113,110 |
— |
— |
113,110 |
|||||||||||||||
|
Options purchased2 |
(134,747 |
) |
(8,308 |
) |
29,421 |
(113,634 |
) |
||||||||||||
|
Options written |
96,978 |
57,607 |
— |
154,585 |
|||||||||||||||
|
Swap agreements |
(177,594 |
) |
54,959 |
— |
(122,635 |
) |
|||||||||||||
|
Total net realized gain (loss) |
$ |
(102,253 |
) |
$ |
104,258 |
$ |
233,831 |
$ |
235,836 |
||||||||||
|
Change in net unrealized appreciation/depreciation3 |
|||||||||||||||||||
|
Forward foreign currency contracts |
$ |
— |
$ |
— |
$ |
36,964 |
$ |
36,964 |
|||||||||||
|
Futures contracts |
(39,120 |
) |
— |
— |
(39,120 |
) |
|||||||||||||
|
Options purchased2 |
48,390 |
(194 |
) |
(2,972 |
) |
45,224 |
|||||||||||||
|
Options written |
(13,632 |
) |
(2,110 |
) |
1,465 |
(14,277 |
) |
||||||||||||
|
Swap agreements |
114,898 |
(47,063 |
) |
— |
67,835 |
||||||||||||||
|
Total change in net unrealized appreciation/depreciation |
$ |
110,536 |
$ |
(49,367 |
) |
$ |
35,457 |
$ |
96,626 |
||||||||||
1 Statement of operations location: Net realized gain (loss) on futures contracts, options written, swap agreements and forward foreign currency contracts, unless otherwise noted.
2 Statement of operations location: Realized and unrealized gain (loss) is included in net realized gain (loss) on investments in unaffiliated issuers and change in net unrealized appreciation/depreciation on investments.
3 Statement of operations location: Change in net unrealized appreciation/depreciation on futures contracts, options written, swap agreements and forward foreign currency contracts.
Asset derivatives
|
Interest rate risk |
Credit risk |
Foreign exchange risk |
Total |
||||||||||||||||
|
UBS Fixed Income Opportunities Fund |
|||||||||||||||||||
|
Forward foreign currency contracts1 |
$ |
— |
$ |
— |
$ |
73,047 |
$ |
73,047 |
|||||||||||
|
Futures contracts2 |
31,406 |
— |
— |
31,406 |
|||||||||||||||
|
Options purchased1 |
994,607 |
5,936 |
19,577 |
1,020,120 |
|||||||||||||||
|
Swap agreements1,2 |
1,686,842 |
54,073 |
34,828 |
1,775,743 |
|||||||||||||||
|
Total value |
$ |
2,712,855 |
$ |
60,009 |
$ |
127,452 |
$ |
2,900,316 |
|||||||||||
1 Statement of assets and liabilities location: Options purchased are shown within investments in securities of unaffiliated issuers, at value, outstanding swap agreements, at value (except centrally cleared swaps) and unrealized appreciation on forward foreign currency contracts.
65
The UBS Funds
Notes to financial statements
2 Includes cumulative appreciation of futures contracts as reported in the futures contracts and centrally cleared swap tables in the Portfolio of investments, but only the unpaid variation margin is reported within the Statement of assets and liabilities within Variation margin on futures contracts and centrally cleared swap agreements, respectively.
Liability derivatives
|
Interest rate risk |
Credit risk |
Foreign exchange risk |
Total |
||||||||||||||||
|
UBS Fixed Income Opportunities Fund |
|||||||||||||||||||
|
Forward foreign currency contracts1 |
$ |
— |
$ |
— |
$ |
(117,217 |
) |
$ |
(117,217 |
) |
|||||||||
|
Futures contracts2 |
(70,715 |
) |
— |
— |
(70,715 |
) |
|||||||||||||
|
Options written1 |
(319,581 |
) |
(35,497 |
) |
(9,139 |
) |
(364,217 |
) |
|||||||||||
|
Swap agreements1,2 |
(3,647,774 |
) |
(978,952 |
) |
(10,523 |
) |
(4,637,249 |
) |
|||||||||||
|
Total value |
$ |
(4,038,070 |
) |
$ |
(1,014,449 |
) |
$ |
(136,879 |
) |
$ |
(5,189,398 |
) |
|||||||
1 Statement of assets and liabilities location: Options written, at value, outstanding swap agreements, at value (except centrally cleared swaps) and unrealized depreciation on forward foreign currency contracts.
2 Includes cumulative depreciation of futures contracts as reported in the futures contracts and centrally cleared swap tables in the Portfolio of investments, but only the unpaid variation margin is reported within the Statement of assets and liabilities within Variation margin on futures contracts and centrally cleared swap agreements, respectively.
Activities in derivative instruments during the year ended June 30, 2015, were as follows:
|
Interest rate risk |
Equity risk |
Credit risk |
Foreign exchange risk |
Total |
|||||||||||||||||||
|
UBS Fixed Income Opportunities Fund |
|||||||||||||||||||||||
|
Net realized gain (loss)1 |
|||||||||||||||||||||||
|
Forward foreign currency contracts |
$ |
— |
$ |
— |
$ |
— |
$ |
1,697,550 |
$ |
1,697,550 |
|||||||||||||
|
Futures contracts |
1,839,984 |
(1,345 |
) |
— |
— |
1,838,639 |
|||||||||||||||||
|
Options purchased2 |
(2,065,249 |
) |
— |
(136,081 |
) |
330,674 |
(1,870,656 |
) |
|||||||||||||||
|
Options written |
244,240 |
— |
309,542 |
— |
553,782 |
||||||||||||||||||
|
Swap agreements |
(628,301 |
) |
— |
(173,431 |
) |
(29,310 |
) |
(831,042 |
) |
||||||||||||||
|
Total net realized gain (loss) |
$ |
(609,326 |
) |
$ |
(1,345 |
) |
$ |
30 |
$ |
1,998,914 |
$ |
1,388,273 |
|||||||||||
|
Change in net unrealized appreciation/depreciation3 |
|||||||||||||||||||||||
|
Forward foreign currency contracts |
$ |
— |
$ |
— |
$ |
— |
$ |
152,646 |
$ |
152,646 |
|||||||||||||
|
Futures contracts |
(130,817 |
) |
— |
— |
— |
(130,817 |
) |
||||||||||||||||
|
Options purchased2 |
627,460 |
— |
(411 |
) |
(9,186 |
) |
617,863 |
||||||||||||||||
|
Options written |
331,878 |
— |
(3,194 |
) |
4,529 |
333,213 |
|||||||||||||||||
|
Swap agreements |
(1,096,705 |
) |
— |
756,498 |
(34,478 |
) |
(374,685 |
) |
|||||||||||||||
|
Total change in net unrealized appreciation/depreciation |
$ |
(268,184 |
) |
$ |
— |
$ |
752,893 |
$ |
113,511 |
$ |
598,220 |
||||||||||||
1 Statement of operations location: Net realized gain (loss) on futures contracts, options written, swap agreements and forward foreign currency contracts, unless otherwise noted.
2 Statement of operations location: Realized and unrealized gain (loss) is included in net realized gain (loss) on investments in unaffiliated issuers and change in net unrealized appreciation/depreciation on investments.
3 Statement of operations location: Change in net unrealized appreciation/depreciation on futures contracts, options written, swap agreements and forward foreign currency contracts.
UBS Municipal Bond Fund had net realized gain of $37,365 on futures contracts related to interest rate risk and change in net unrealized appreciation of $93,722 related to interest rate risk.
The Funds typically enter into International Swaps and Derivatives Association, Inc. Master Agreements ("ISDA Master Agreements") or similar master agreements (collectively, "Master Agreements") with its OTC derivative con-
66
The UBS Funds
Notes to financial statements
tract counterparties in order to, among other things, reduce its credit risk to counterparties. ISDA Master Agreements include provisions for general obligations, representations, collateral and events of default or termination. Under an ISDA Master Agreement, the Funds typically may offset with the counterparty certain derivative financial instrument's payables and/or receivables with collateral held and/or posted and create one single net payment (close-out netting) in the event of default or termination.
The provisions of ASC Topic 210 "Disclosures about Offsetting Assets and Liabilities" require disclosure on the offsetting of financial assets and liabilities. The offsetting disclosures are limited to derivatives, repurchase and reverse repurchase agreements, and security lending and borrowing transactions to the extent that they are (1) offset in the financial statements or (2) subject to an enforceable master netting arrangement ("MNA") or similar agreement. Tables are not presented below for any funds which only hold derivatives which are not subject to offsetting under ASC Topic 210.
UBS Core Plus Bond Fund
|
Derivative financial instruments: |
Assets ($) |
Liabilities ($) |
|||||||||
|
Forward foreign currency contracts |
21,346 |
(8,692 |
) |
||||||||
|
Futures contracts1 |
15,089 |
(26,052 |
) |
||||||||
|
Options purchased |
9,789 |
— |
|||||||||
|
Options written |
— |
(34,242 |
) |
||||||||
|
Swap agreements1 |
161,511 |
(25,861 |
) |
||||||||
|
Total gross amount of derivative assets and liabilities in the Statement of assets and liabilities |
207,735 |
(94,847 |
) |
||||||||
|
Derivatives not subject to a master netting agreement or similar agreement ("MNA") |
(177,250 |
) |
74,496 |
||||||||
|
Total gross amount of assets and liabilities subject to MNA or similar agreements |
30,485 |
(20,351 |
) |
||||||||
1 Includes cumulative appreciation/depreciation of futures contracts and centrally cleared swaps as reported in the futures contracts and centrally cleared swaps tables in the Portfolio of investments but only the unpaid variation margin is reported within the Statement of assets and liabilities within variation margin on futures contracts and centrally cleared swap agreements, respectively.
The following tables present the Fund's derivative assets and liabilities by counterparty net of amounts available for offset under a MNA and net of the related collateral received/pledged by the Fund as of June 30, 2015.
| Counterparty |
Gross amount of assets ($) |
Financial instruments and derivatives available for offset ($) |
Collateral received ($) |
Net amount of assets ($) |
|||||||||||||||
|
CIBC |
5,558 |
— |
— |
5,558 |
|||||||||||||||
|
JPMCB |
18,593 |
(12,515 |
) |
— |
6,078 |
||||||||||||||
|
MSC |
6,334 |
(4,222 |
) |
— |
2,112 |
||||||||||||||
|
Total |
30,485 |
(16,737 |
) |
— |
13,748 |
||||||||||||||
| Counterparty |
Gross amount of liabilities ($) |
Financial instruments and derivatives available for offset ($) |
Collateral pledged ($) |
Net amount of liabilities ($) |
|||||||||||||||
|
JPMCB |
(12,515 |
) |
12,515 |
— |
— |
||||||||||||||
|
MLI |
(3,614 |
) |
— |
— |
(3,614 |
) |
|||||||||||||
|
MSC |
(4,222 |
) |
4,222 |
— |
— |
||||||||||||||
|
Total |
(20,351 |
) |
16,737 |
— |
(3,614 |
) |
|||||||||||||
67
The UBS Funds
Notes to financial statements
UBS Fixed Income Opportunities Fund
|
Derivative financial instruments: |
Assets ($) |
Liabilities ($) |
|||||||||
|
Forward foreign currency contracts |
73,047 |
(117,217 |
) |
||||||||
|
Futures contracts1 |
31,406 |
(70,715 |
) |
||||||||
|
Options purchased |
1,020,120 |
— |
|||||||||
|
Options written |
— |
(364,217 |
) |
||||||||
|
Swap agreements1 |
1,775,743 |
(4,637,249 |
) |
||||||||
|
Total gross amount of derivative assets and liabilities in the Statement of assets and liabilities |
2,900,316 |
(5,189,398 |
) |
||||||||
|
Derivatives not subject to a master netting agreement or similar agreement ("MNA") |
(1,212,517 |
) |
1,916,044 |
||||||||
|
Total gross amount of assets and liabilities subject to MNA or similar agreements |
1,687,799 |
(3,273,354 |
) |
||||||||
1 Includes cumulative appreciation/depreciation of futures contracts and centrally cleared swaps as reported in the futures contracts and centrally cleared swaps tables in the Portfolio of investments but only the unpaid variation margin is reported within the Statement of assets and liabilities within variation margin on futures contracts and centrally cleared swap agreements, respectively.
The following tables present the Fund's derivative assets and liabilities by counterparty net of amounts available for offset under a MNA and net of the related collateral received/pledged by the Fund as of June 30, 2015.
|
Counterparty |
Gross amount of assets ($) |
Financial instruments and derivatives available for offset ($) |
Collateral* received ($) |
Net amount of assets ($) |
|||||||||||||||
|
BB |
256,989 |
(233,589 |
) |
— |
23,400 |
||||||||||||||
|
CIBC |
6,311 |
— |
— |
6,311 |
|||||||||||||||
|
CITI |
30,081 |
(30,081 |
) |
— |
— |
||||||||||||||
|
CSI |
231,215 |
(217,963 |
) |
(13,252 |
) |
— |
|||||||||||||
|
GSI |
20,877 |
— |
— |
20,877 |
|||||||||||||||
|
JPMCB |
941,108 |
(623,165 |
) |
— |
317,943 |
||||||||||||||
|
MLI |
181,641 |
(157,521 |
) |
— |
24,120 |
||||||||||||||
|
MSC |
19,577 |
(19,577 |
) |
— |
— |
||||||||||||||
|
Total |
1,687,799 |
(1,281,896 |
) |
(13,252 |
) |
392,651 |
|||||||||||||
|
Counterparty |
Gross amount of liabilities ($) |
Financial instruments and derivatives available for offset ($) |
Collateral* pledged ($) |
Net amount of liabilities ($) |
|||||||||||||||
|
BB |
(233,589 |
) |
233,589 |
— |
— |
||||||||||||||
|
CITI |
(38,192 |
) |
30,081 |
— |
(8,111 |
) |
|||||||||||||
|
CSI |
(217,963 |
) |
217,963 |
— |
— |
||||||||||||||
|
DB |
(1,558,819 |
) |
— |
— |
(1,558,819 |
) |
|||||||||||||
|
JPMCB |
(623,165 |
) |
623,165 |
— |
— |
||||||||||||||
|
MLI |
(157,521 |
) |
157,521 |
— |
— |
||||||||||||||
|
MSC |
(444,105 |
) |
19,577 |
— |
(424,528 |
) |
|||||||||||||
|
Total |
(3,273,354 |
) |
1,281,896 |
— |
(1,991,458 |
) |
|||||||||||||
* In some instances, the actual collateral received and/or pledged may be more than the amount shown.
B. Restricted securities: The Funds may invest in securities that are subject to legal or contractual restrictions on resale. These securities generally may be resold in transactions exempt from registration or to the public if the securities are registered. Disposal of these securities may involve time consuming negotiations and expenses, and prompt sale at an acceptable price may be difficult. Information regarding restricted securities, if any, is included in each Fund's Portfolio of investments footnotes.
C. Investment transactions, investment income and expenses: Investment transactions are recorded on the trade date. Realized gains and losses from investment and foreign exchange transactions are calculated using the identified cost method. Dividend income and expenses are recorded on the ex-dividend date ("ex-date") except in the case of
68
The UBS Funds
Notes to financial statements
certain dividends from foreign securities which are recorded as soon after the ex-date as the respective Fund, using reasonable diligence, becomes aware of such dividends. Interest income is recorded on an accrual basis. Discounts are accreted and premiums are amortized as adjustments to interest income and the identified cost of investments.
Income, expenses (excluding class-specific expenses) and realized/unrealized gains/losses are allocated proportionately to each class of shares based upon the relative net asset value of outstanding shares (or the value of dividend eligible shares, as appropriate) of each class at the beginning of the day after adjusting for current capital share activity of the respective classes. Class specific expenses are charged directly to the applicable class of shares.
D. Foreign currency translation: The Funds use the foreign currency exchange rates determined as of the close of regular trading on the NYSE. For purposes of calculating the US dollar equivalent value of a non US dollar denominated obligation, foreign currency amounts are translated into US dollars on the following basis: (1) market value of investment securities and other assets and liabilities—at the exchange rates prevailing at the end of each Fund's fiscal period; and (2) purchases and sales of investment securities and income and expenses—at the rates of exchange prevailing on the respective dates of such transactions.
Although the net assets and the market value of each Fund's portfolio are presented at the foreign exchange rates at the end of each Fund's fiscal period, the Funds do not generally isolate the effect of fluctuations in foreign exchange rates from the effect of the changes in market prices of securities. However, the Funds do isolate the effect of fluctuations in foreign exchange rates when determining the realized gain or loss upon the sale or maturity of foreign currency-denominated securities pursuant to US federal income tax regulations. Certain foreign exchange gains and losses included in realized and unrealized gains and losses are included in or are a reduction of ordinary income in accordance with US federal income tax regulations.
E. Forward foreign currency contracts: A forward foreign currency contract is a commitment to purchase or sell a foreign currency at a future date at a negotiated forward rate. Risks associated with such contracts include movement in the value of the foreign currency relative to the US dollar and the potential inability of the counterparty to meet the terms of the contract. The Funds may purchase or sell currencies and/or engage in forward foreign currency transactions in order to expedite settlement of portfolio transactions, manage currency risk or to gain exposure to a currency without purchasing securities denominated in that currency. Forward foreign currency contracts involve, to varying degrees, elements of market risk (specifically foreign currency risk).
A Fund will enter into forward contracts to sell, for a fixed amount of US dollars or other appropriate currency, an amount of foreign currency, to the extent that the value of the short forward contract is covered by the underlying value of securities denominated in the currency being sold. Alternatively, when a Fund enters into a non-cash settled forward contract to sell an amount of foreign currency, the Fund's custodian or sub-custodian will place assets in a segregated account of the Fund in an amount equal to the contract's full notional value. However, currency contracts with respect to identical currencies may be netted against each other and, in such cases, a Fund's custodian or sub-custodian will place assets in a segregated account of the Fund, in an amount equal to the net amount owed (the unrealized loss) by a Fund. If the assets placed in the account decline in value, additional cash or securities will be placed in the account on a daily basis so that the value of the account will equal the amount of a Fund's commitments with respect to such contracts.
The unrealized gain, if any, represents the credit risk to each Fund on a forward foreign currency contract. Fluctuations in the value of the open forward foreign currency contracts are recorded daily for book purposes as unrealized gains or losses on foreign forward currency contracts by the Funds. Realized gains and losses include net gains and losses recognized by each Fund on contracts which have been sold or matured.
F. Futures contracts: The Funds may purchase or sell futures contracts to increase or reduce their exposure to an asset class without purchasing or selling the underlying securities, either as a hedge or to enhance income or
69
The UBS Funds
Notes to financial statements
realize gains. Using financial futures contracts involves various market risks, including interest rate and equity risk. Risks of entering into futures contracts include the possibility that there may be an illiquid market or that a change in the value of the contract may not correlate with changes in the value of the underlying securities. To the extent that market prices move in an unexpected direction, there is a risk that a Fund will not achieve the anticipated benefits of the futures contract or may realize a loss.
Upon entering into a futures contract, the Fund is required to deliver to a broker an amount of cash and/or securities equal to a certain percentage of the contract amount. This amount is known as the "initial margin". Subsequent payments, known as "variation margin", are made or received by the Fund each day, depending on the daily fluctuations in the value of the underlying futures contracts. Such variation margin is recorded for financial statement purposes on a daily basis as an unrealized gain or loss on futures until the futures contract is closed or expires, at which time the net gain or loss is reclassified to realized gain or loss on futures.
G. Securities traded on to-be-announced basis: Certain Funds may from time to time purchase, or sell short, securities on a to-be-announced ("TBA") basis. In a TBA transaction, a Fund commits to purchasing or selling securities for which all specific information is not yet known at the time of the trade, particularly the face amount and maturity date of the underlying security transactions. Securities purchased on a TBA basis are not settled until they are delivered to a Fund, normally 15 to 45 days later. Beginning on the date a Fund enters into a TBA transaction, cash, US government securities or other liquid high grade debt obligations are segregated in the Fund's records in an amount equal in value to the purchase price of the TBA security. These transactions are subject to market fluctuations and their current value is determined in the same manner as for other securities.
H. Swap agreements: Certain Funds may engage in swap agreements, including but not limited to interest rate, currency, total return, and credit default swap agreements. The Funds expect to enter into these transactions to preserve a return or spread on a particular investment or to hedge a portion of the portfolio's duration, to protect against any increase in the price of securities a Fund anticipates purchasing at a later date, to gain exposure to certain markets in the most economical way possible or in an attempt to enhance income or gains.
Certain Funds may enter into interest rate swap agreements with another party to receive or pay interest (e.g., an exchange of fixed rate payments for floating rate payments) to protect itself from interest rate fluctuations. This type of swap is an agreement that obligates two parties to exchange a series of cash flows at specified intervals based upon or calculated by reference to a specified interest rate(s) for a specified amount. The payment flows are usually netted against each other, with the difference being paid by one party to the other. Interest rate swap agreements are subject to general market risk, liquidity risk, counterparty risk and interest rate risk.
Certain Funds may enter into currency swap agreements with another party to receive or pay amounts based on changes in currency exchange rates in order to protect itself from or take advantage of exchange rate fluctuations. A Fund utilizes currency swaps to earn income and enhance returns as well as to manage the risk profile of the Fund. This type of swap is an agreement that obligates two parties to exchange a series of cash flows at specified intervals based upon or calculated by reference to a specified currency exchange rate(s) for a specified amount. Currency swap agreements are subject to general market risk, liquidity risk, counterparty risk, foreign exchange risk and interest rate risk.
Total return swap agreements involve commitments to pay or receive interest in exchange for a market-linked return based on a notional amount. To the extent the total return of the security or index underlying the transaction exceeds or falls short of the offsetting interest rate obligation, a Fund will receive a payment from or make a payment to the counterparty, respectively. Total return swaps are marked-to-market daily, and the change, if any, is recorded as unrealized appreciation or depreciation. Total return swap agreements are subject to general market
70
The UBS Funds
Notes to financial statements
risk, liquidity risk, counterparty risk, interest risk, credit risk and the risk that there may be unfavorable changes in the underlying investments or instruments.
Credit default swap agreements involve commitments to make or receive payments in the event of a default or other credit event of a referenced security. As a buyer, a Fund would make periodic payments to the counterparty, and the Fund would receive payments only upon the occurrence of a credit event. If no credit event occurs, a Fund will lose its periodic stream of payments over the term of the contract. However, if a credit event does occur, a Fund typically would receive full notional value for a reference obligation that may have little or no value. As a seller, a Fund would receive periodic payments from the counterparty, and the Fund would make payments only upon the occurrence of a credit event. If no credit event occurs, a Fund will retain the periodic stream of payments it received over the term of the contract. However, if a credit event occurs, a Fund will pay full notional value for a reference obligation that may have little or no value. Credit default swaps may involve greater risks than if a Fund had invested in the reference obligation directly and are subject to general market risk, liquidity risk, counterparty risk and credit risk.
Credit default swap agreements on corporate issues or sovereign issues of an emerging market country involve one party making a stream of payments to another party in exchange for the right to receive a specified return in the event of a default or other credit event. If a credit event occurs and cash settlement is not elected, a variety of other obligations may be delivered in lieu of the specific referenced obligation. The ability to deliver other obligations may result in delivery of a security with a value other than had been anticipated (such as a party's right to choose the deliverable obligation with the lowest value following a credit event). A Fund may use credit default swaps on corporate issues or sovereign issues of an emerging market country to provide a measure of protection against defaults of the issuers (i.e., to reduce risk where a Fund owns or has exposure to the referenced obligation) or to take an active long or short position with respect to the likelihood of a particular issuer's default.
The maximum potential amount of future payments (undiscounted) that a Fund as a seller of protection could be required to make under a credit default swap agreement would be an amount equal to the notional amount of the agreement. Notional amounts of all credit default swap agreements outstanding as of June 30, 2015 for which a Fund is the seller of protection are disclosed under the section "Credit default swaps on credit indices—sell protection", "Credit default swaps on sovereign issues—sell protection" and "Credit default swaps on corporate and sovereign issues—sell protection" in the Notes to Portfolio of investments. These potential amounts would be partially offset by any recovery values of the respective referenced obligations, upfront payments received upon entering into the agreement, or net amounts received from the settlement of buy protection credit default swap agreements entered into, if any, by a Fund for the same referenced entity or entities.
Certain clearinghouses currently offer clearing for limited types of derivatives transactions, such as interest and credit derivatives. In a cleared derivative transaction, a Fund typically enters into the transaction with a financial institution counterparty, and performance of the transaction is effectively guaranteed by a central clearinghouse, thereby reducing or eliminating the Fund's exposure to the credit risk of its original counterparty. The Fund will be required to post specified levels of margin with the clearinghouse or at the instruction of the clearinghouse; the margin required by a clearinghouse may be greater than the margin the Fund would be required to post in an uncleared transaction. Only a limited number of transactions are currently eligible for clearing. Centrally cleared swaps, if any, are reported on the Statement of assets and liabilities based on variation margin receivable or payable, if any.
The use of swap agreements involves investment techniques and risks different from those associated with ordinary portfolio security transactions. If UBS Global AM is incorrect in its forecast of market values, interest rates and other applicable factors, the investment performance of a Fund will be less favorable than it would have been if this investment technique was never used. Swap agreements do not involve the delivery of securities and are subject to
71
The UBS Funds
Notes to financial statements
counterparty risk. If the other party to a swap agreement defaults and fails to consummate the transaction, a Fund's risk of loss will consist of the net amount of interest or other payments that the Fund is contractually entitled to receive. Therefore, a Fund would consider the creditworthiness of the counterparty to a swap agreement in evaluating potential credit risk.
A Fund accrues for interim payments on swap agreements on a daily basis, with the net amount recorded within unrealized appreciation/depreciation of swap agreements on the Statement of assets and liabilities. Once interim payments are settled in cash, the net amount is recorded as realized gain/loss on swap agreements, in addition to realized gain/loss recorded upon the termination of swap agreements in the Statement of operations. Fluctuations in the value of swap agreements are recorded for financial statement purposes as unrealized appreciation or depreciation on swap agreements.
I. Option writing: Certain Funds may write (sell) put and call options on foreign or US securities, indices, foreign currencies and interest rate swaps (commonly referred to as swaptions), in order to gain exposure to or protect against changes in the markets or in an attempt to enhance income or gains. When a Fund writes a call or a put option, an amount equal to the premium received by the Fund is included in the Fund's Statement of assets and liabilities as an asset and as an equivalent liability. The amount of the liability is subsequently marked-to-market to reflect the current market value of the option written. If an option which the Fund has written either expires on its stipulated expiration date or the Fund enters into a closing purchase transaction, the Fund realizes a gain (or a loss if the cost of a closing purchase transaction exceeds the premium received when the option was written) without regard to any unrealized gain or loss on the underlying security or derivative instrument, and the liability related to such option is extinguished. If a call option which the Fund has written is exercised, the Fund recognizes a realized gain or loss (long-term or short-term, depending on the holding period of the underlying security) from the sale of the underlying security or derivative instrument and the proceeds from the sale are increased by the premium originally received. If a put option which a Fund has written is exercised, the amount of the premium originally received reduces the cost of the security or derivative instrument which the Fund purchases upon exercise of the option.
In writing an option, the Fund bears the market risk of an unfavorable change in the price of the derivative instrument, security, index or currency underlying the written option. Exercise of an option written by the Fund could result in the Fund selling or buying a derivative instrument, security or currency at a price different from current market value.
In the normal course of trading activities, the Funds trade and hold certain fair valued derivative contracts that constitute guarantees. Such contracts include written put options, where a Fund would be obligated to purchase securities at specified prices (i.e. the options are exercised by the counterparties). The maximum payout for these contracts is limited to the number of put option contracts written and the related strike prices, respectively. The maximum payout for UBS Core Plus Bond Fund and UBS Fixed Income Opportunities Fund was $478,688 and $1,355,671, respectively, at June 30, 2015.
J. Purchased options: Certain Funds may purchase put and call options on foreign or US securities, indices, foreign currencies and interest rate swaps (commonly referred to as swaptions), as well as exchange listed call options on particular market segment indices to achieve temporary exposure to a specific security, currency, industry or geographic region. Purchasing call options tends to increase exposure to the underlying instrument. Purchasing put options tends to decrease exposure to the underlying instrument. The Fund pays a premium which is included in the Statement of assets and liabilities as an investment and subsequently marked-to-market to reflect the current value of the option. Premiums paid for purchasing options which expire are treated as realized losses. The risk associated with purchasing put and call options is limited to the premium paid. Premiums paid for purchasing options which are exercised or closed are added to the amounts paid or offset against the proceeds on the underlying futures, security or currency transaction to determine the realized gain or loss.
72
The UBS Funds
Notes to financial statements
K. Dividends and distributions: It is each Fund's policy to distribute its respective net investment income monthly except UBS Fixed Income Opportunities Fund which will distribute its net investment income, if any, quarterly. Net realized capital gains, if any, are paid annually. Dividends and distributions to shareholders are recorded on the ex-distribution date. The amount of dividends from net investment income and distributions from net realized capital gains and/or return of capital is determined in accordance with US federal income tax regulations, which may differ from US GAAP. These "book/tax" differences are either considered temporary or permanent in nature. To the extent these differences are permanent in nature, such amounts are reclassified within the capital accounts based on their federal tax-basis treatment; temporary differences do not require reclassification.
L. Concentration of risk: Investing in securities of foreign issuers and currency transactions may involve certain considerations and risks not typically associated with investments in the United States. These risks include revaluation of currencies, adverse fluctuations in foreign currency values and possible adverse political, social and economic developments, including those particular to a specific industry, country or region, which could cause the securities and their markets to be less liquid and prices more volatile than those of comparable US companies and US government securities. These risks are greater with respect to securities of issuers located in emerging market countries in which the Funds invest. The ability of the issuers of debt securities held by a Fund to meet their obligations may be affected by economic and political developments particular to a specific industry, country, state or region.
Investments in bonds with ratings of BB (Standard & Poor's Ratings Group) or Ba (Moody's Investors Service, Inc.) or below (commonly referred to as "high yield" bonds), or deemed of equivalent quality, have an increased risk of defaulting or otherwise being unable to honor a financial obligation. These securities are considered to be predominately speculative with respect to an issuer's capacity to pay interest and repay principal in accordance with the terms of the obligations. Lower-quality bonds are more likely to be subject to an issuer's default or downgrade than investment grade (higher-quality) bonds.
M. Redemption fees: Each class of each series of The UBS Funds will impose a 1% redemption fee on shares sold or exchanged within 90 days of their purchase date, subject to limited exceptions. This amount is paid to the applicable Fund, not the Advisor or UBS Global Asset Management (US) Inc., ("UBS Global AM (US)"). The redemption fees retained by the Funds are disclosed in the Statement of changes in net assets. For the year ended June 30, 2015, redemption fees for each Fund amounted to less than $0.01 per share and less than 0.01% of average net assets.
Effective February 17, 2015, for purchases of shares on or after that date, the redemption fee is calculated as a percentage of the amount redeemed within 30 days of purchase, if applicable. Effective August 3, 2015, for purchases of shares on or after that date, the redemption fee will be eliminated.
2. Investment advisory fees and other transactions with affiliates
The Advisor, a registered investment advisor, provides the Funds with investment management services. As compensation for these services, each Fund pays the Advisor a monthly fee, accrued daily and paid monthly, based on each Fund's respective average daily net assets in accordance with the following per annum schedule:
|
Fund |
$0 to $500 mm |
$500 mm to $1.0 billion |
$1.0 billion to $1.5 billion |
$1.5 billion to $2.0 billion |
$2.0 billion and over |
||||||||||||||||||
|
UBS Core Plus Bond Fund |
0.500 |
% |
0.475 |
% |
0.450 |
% |
0.425 |
% |
0.400 |
% |
|||||||||||||
|
UBS Fixed Income Opportunities Fund |
0.650 |
0.650 |
0.650 |
0.650 |
0.650 |
||||||||||||||||||
|
UBS Municipal Bond Fund |
0.400 |
0.400 |
0.400 |
0.400 |
0.400 |
||||||||||||||||||
73
The UBS Funds
Notes to financial statements
For UBS Core Plus Bond Fund and UBS Municipal Bond Fund, the Advisor has agreed to waive its fees and/or reimburse expenses (excluding expenses incurred through investment in other investment companies, interest, taxes, brokerage commissions and extraordinary expenses) to the extent necessary so that the Fund's operating expenses (excluding expenses incurred through investment in other investment companies, interest, taxes, brokerage commissions and extraordinary expenses) do not exceed the expense limit of each class of shares as indicated in the following table. For UBS Fixed Income Opportunities Fund, the Advisor has agreed to waive its fees and/or reimburse expenses (excluding expenses incurred through investment in other investment companies, interest, taxes, brokerage commissions, extraordinary expenses and dividend expense and security loan fees for securities sold short) to the extent necessary so that the Fund's operating expenses (excluding expenses incurred through investment in other investment companies, interest, taxes, brokerage commissions, extraordinary expenses and dividend expense and security loan fees for securities sold short) do not exceed the expense limit of each class of shares as indicated in the following table. Investment advisory fees, including the dollar amount waived or reimbursed, for the year ended June 30, 2015, were as follows:
|
Fund |
Class A expense cap |
Class C expense cap |
Class P expense cap |
Amount (due from) advisor |
Advisory fees incurred |
Fees waived/ expenses reimbursed |
|||||||||||||||||||||
|
UBS Core Plus Bond Fund |
0.64 |
% |
1.14 |
% |
0.39 |
% |
$ |
(36,103 |
) |
$ |
158,179 |
$ |
332,632 |
||||||||||||||
|
UBS Fixed Income Opportunities Fund |
0.95 |
1.45 |
0.70 |
(49,469 |
) |
311,817 |
443,610 |
||||||||||||||||||||
|
UBS Municipal Bond Fund |
0.65 |
1.15 |
0.40 |
(46,068 |
) |
127,775 |
265,905 |
||||||||||||||||||||
Each Fund will reimburse the Advisor for expenses it waives or reimburses for a period of three years following such expense waivers or reimbursements, provided that the reimbursement by a Fund of the Advisor will not cause the total operating expense ratio to exceed the contractual limit as then may be in effect for the Fund. The expenses waived or reimbursed for the year ended June 30, 2015 are subject to repayment through June 30, 2018.
At June 30, 2015, the following Funds had remaining fee waivers and expense reimbursements subject to repayment to the Advisor and respective dates of expiration as follows:
|
Fund |
Fee waivers/ expense reimbursements subject to repayment |
Expires June 30, 2016 |
Expires June 30, 2017 |
Expires June 30, 2018 |
|||||||||||||||
|
UBS Core Plus Bond Fund—Class A |
$ |
139,777 |
$ |
58,776 |
$ |
52,584 |
$ |
28,417 |
|||||||||||
|
UBS Core Plus Bond Fund—Class C |
52,615 |
17,658 |
17,952 |
17,005 |
|||||||||||||||
|
UBS Core Plus Bond Fund—Class P |
785,526 |
250,241 |
248,075 |
287,210 |
|||||||||||||||
|
UBS Fixed Income Opportunities Fund—Class A |
520,146 |
171,521 |
258,703 |
89,922 |
|||||||||||||||
|
UBS Fixed Income Opportunities Fund—Class C |
123,199 |
32,820 |
42,562 |
47,817 |
|||||||||||||||
|
UBS Fixed Income Opportunities Fund—Class P |
618,870 |
171,285 |
141,714 |
305,871 |
|||||||||||||||
|
UBS Municipal Bond Fund—Class A |
35,220 |
— |
— |
35,220 |
|||||||||||||||
|
UBS Municipal Bond Fund—Class C |
10,331 |
— |
— |
10,331 |
|||||||||||||||
|
UBS Municipal Bond Fund—Class P |
220,354 |
— |
— |
220,354 |
|||||||||||||||
74
The UBS Funds
Notes to financial statements
Each Fund pays UBS Global AM a monthly administration fee that is accrued daily and paid monthly at an annual rate of 0.075% of the average daily net assets of such Fund. For the year ended June 30, 2015, the Funds owed and incurred administrative fees as follows:
|
Fund |
Administrative fees owed |
Administrative fees incurred |
|||||||||
|
UBS Core Plus Bond Fund |
$ |
4,109 |
$ |
23,794 |
|||||||
|
UBS Fixed Income Opportunities Fund |
4,346 |
36,049 |
|||||||||
|
UBS Municipal Bond Fund |
8,027 |
24,090 |
|||||||||
The Funds may invest in certain affiliated investment companies also advised or managed by the Advisor. Investments in affiliated investment companies for the year ended June 30, 2015 have been included near the end of each Fund's Portfolio of investments.
The Funds may invest in UBS Cash Management Prime Relationship Fund ("Cash Prime"). Cash Prime is offered as a cash management option only to mutual funds and certain other accounts. Distributions received from Cash Prime are reflected as affiliated income in the Statement of operations. Amounts relating to those investments at June 30, 2015 and for the year ended have been included near the end of each Fund's Portfolio of investments.
Under normal conditions, the Funds invest cash collateral from securities lending activities into an affiliated private money market fund, UBS Private Money Market Fund LLC ("Private Money Market"), which operates in compliance with most of the substantive provisions of Rule 2a-7 of the 1940 Act. Private Money Market is managed by the Advisor and is offered as a cash management option only to mutual funds and certain other accounts managed by the Advisor. UBS Global AM acts as managing member and receives a management fee from Private Money Market payable monthly in arrears at the annual rate of 0.10% of Private Money Market's average daily members' equity, minus the aggregate operating expenses of, and incurred by, Private Money Market during each such related month, not including investment expenses (including brokerage commissions, taxes, interest charges and other costs with respect to transactions in securities) and extraordinary expenses including litigation expenses, if any. The Advisor may, in its sole discretion, waive all or any portion of the management fee to which it may be entitled from time to time in order to maintain operating expenses at a certain level. Distributions received from Private Money Market, net of fee rebates paid to borrowers, are reflected as securities lending income in the Statement of operations. Amounts relating to those investments at June 30, 2015 and for the year ended have been included near the end of each Fund's Portfolio of investments.
3. Distribution and service plans
UBS Global AM (US) is the principal underwriter of each Fund's shares. The Trust has adopted distribution and/or service plans (the "Plans") pursuant to Rule 12b-1 under the 1940 Act for Class A and Class C. The Plans govern payments made for the expenses incurred in the service and/or distribution of Class A and Class C. Annual fees under the Plans as a percentage of the average daily net assets of each representative class of each of the Funds are as follows:
|
Fund |
Class A |
Class C |
|||||||||
|
UBS Core Plus Bond Fund |
0.25 |
% |
0.75 |
% |
|||||||
|
UBS Fixed Income Opportunities Fund |
0.25 |
0.75 |
|||||||||
|
UBS Municipal Bond Fund |
0.25 |
0.75 |
|||||||||
UBS Global AM (US) also receives the proceeds of the initial sales charges paid upon purchases of Class A shares and the contingent deferred sales charges paid by shareholders upon certain redemptions of Class A and Class C.
75
The UBS Funds
Notes to financial statements
At June 30, 2015, certain Funds owed UBS Global AM (US) distribution and service fees, and for the year ended June 30, 2015, certain Funds were informed by UBS Global AM (US) that it had earned sales charges as follows:
|
Fund |
Distribution and service fees owed |
Sales charges earned |
|||||||||
|
UBS Core Plus Bond Fund—Class A |
$ |
474 |
$ |
707 |
|||||||
|
UBS Core Plus Bond Fund—Class C |
821 |
— |
|||||||||
|
UBS Fixed Income Opportunities Fund—Class A |
1,255 |
201 |
|||||||||
|
UBS Fixed Income Opportunities Fund—Class C |
2,322 |
184 |
|||||||||
|
UBS Municipal Bond Fund—Class A |
1,858 |
16,710 |
|||||||||
|
UBS Municipal Bond Fund—Class C |
1,861 |
— |
|||||||||
4. Transfer agency and related services fees
UBS Financial Services Inc. provides certain services pursuant to a delegation of authority from BNY Mellon Investment Servicing ("BNY Mellon"), as each Fund's transfer agent, and is compensated for these services by BNY Mellon, not the Funds.
For the year ended June 30, 2015, UBS Financial Services Inc. received from BNY Mellon, not the Funds, total service fees as follows:
|
Fund |
Amount paid |
||||||
|
UBS Core Plus Bond Fund |
$ |
1,611 |
|||||
|
UBS Fixed Income Opportunities Fund |
14,460 |
||||||
|
UBS Municipal Bond Fund |
1,886 |
||||||
5. Securities lending
Each Fund may lend securities up to 331/3% of its total assets to qualified broker-dealers or institutional investors. The loans are secured at all times by cash, cash equivalents or US government securities in an amount at least equal to 102% of the market value of the securities loaned with respect to domestic securities and 105% of the market value of the securities loaned with respect to foreign securities, plus accrued interest and dividends, determined on a daily basis and adjusted accordingly.
Each Fund will regain ownership of loaned securities to exercise certain beneficial rights; however, the Fund may bear the risk of delay in recovery of, or even loss of rights in, the securities loaned should the borrower fail financially. The Fund receives compensation for lending its securities from interest or dividends earned on the cash, cash equivalents or US government securities held as collateral, net of fee rebates paid to the borrower plus reasonable administrative and custody fees.
76
The UBS Funds
Notes to financial statements
UBS Core Plus Bond Fund loaned securities to certain qualified broker-dealers, with the Funds' custodian acting as the Funds' lending agent. In addition, UBS Core Plus Bond Fund received US government agency securities as collateral with a market value of $535,763, which can not be resold. The value of loaned securities and related collateral at June 30, 2015 was as follows:
|
Fund |
Market value of securities loaned |
Market value of collateral received from securities loaned |
Cash collateral received |
||||||||||||
|
UBS Core Plus Bond Fund |
$ |
676,441 |
$ |
695,663 |
$ |
159,900 |
|||||||||
6. Purchases and sales of securities
For the year ended June 30, 2015, aggregate purchases and sales of portfolio securities, excluding short-term investments and US Government and agency securities, were as follows:
|
Fund |
Purchases |
Sales proceeds |
|||||||||
|
UBS Core Plus Bond Fund |
$ |
179,538,358 |
$ |
180,090,640 |
|||||||
|
UBS Fixed Income Opportunities Fund |
5,638,330 |
41,539,557 |
|||||||||
|
UBS Municipal Bond Fund |
99,404,496 |
36,974,454 |
|||||||||
For the year ended June 30, 2015, aggregate purchases and sales of US Government and agency securities, excluding short-term investments, were as follows:
|
Fund |
Purchases |
Sales proceeds |
|||||||||
|
UBS Core Plus Bond Fund |
$ |
38,485,093 |
$ |
34,050,595 |
|||||||
|
UBS Fixed Income Opportunities Fund |
3,616,353 |
3,438,494 |
|||||||||
7. Federal income taxes
It is each Fund's policy to comply with all requirements of the Internal Revenue Code applicable to regulated investment companies and to distribute substantially all of their taxable income to their shareholders. In addition, by distributing during each calendar year substantially all of its net investment income, net realized capital gains and certain other amounts, if any, each Fund intends not to be subject to a federal excise tax. Accordingly, no federal income tax provision was required.
The tax character of distributions paid during the fiscal years ended June 30, 2015 and June 30, 2014 were as follows:
|
2015 |
|||||||||||||||||||
| Fund |
Distributions paid from tax-exempt income |
Distributions paid from ordinary income |
Distributions paid from net long-term capital gains |
Total distributions paid |
|||||||||||||||
|
UBS Core Plus Bond Fund |
$ |
— |
$ |
1,034,143 |
$ |
— |
$ |
1,034,143 |
|||||||||||
|
UBS Fixed Income Opportunities Fund |
— |
1,010,566 |
— |
1,010,566 |
|||||||||||||||
|
UBS Municipal Bond Fund |
525,283 |
1,343 |
792 |
527,418 |
|||||||||||||||
77
The UBS Funds
Notes to financial statements
|
2014 |
|||||||||||||||
| Fund |
Distributions paid from ordinary income |
Return of capital |
Total distributions paid |
||||||||||||
|
UBS Core Plus Bond Fund |
$ |
860,543 |
$ |
— |
$ |
860,543 |
|||||||||
|
UBS Fixed Income Opportunities Fund |
— |
609,051 |
609,051 |
||||||||||||
At June 30, 2015, the components of accumulated earnings (deficit) on a tax basis were as follows:
Undistributed Undistributed Accumulated Unrealized
tax-exempt ordinary capital and appreciation/
Fund income income other losses (depreciation) Total
| UBS Core Plus Bond Fund — |
$ |
398,816 |
$ |
(34,233,161 |
) |
$ |
78,723 |
$ |
(33,755,622 |
) |
|||||||||
| UBS Fixed Income Opportunities Fund — |
56,424 |
(4,769,034 |
) |
(1,500,238 |
) |
(6,212,848 |
) |
||||||||||||
| UBS Municipal Bond Fund 57,598 |
— |
— |
(671,304 |
) |
(613,706 |
) |
|||||||||||||
Due to inherent differences in the recognition of income, expenses and realized gains/losses under US GAAP and federal income tax purposes, permanent differences between book and tax basis reporting for the current fiscal year have been identified and appropriately reclassified. Reclassifications for the year ended June 30, 2015 were as follows:
| Fund |
Undistributed net investment income |
Accumulated net realized gain/(loss) |
Beneficial interest |
||||||||||||
|
UBS Core Plus Bond Fund |
$ |
398,574 |
$ |
(424,973 |
) |
$ |
26,399 |
||||||||
|
UBS Fixed Income Opportunities Fund |
(1,253,184 |
) |
(2,093,951 |
) |
3,347,135 |
||||||||||
|
UBS Municipal Bond Fund |
31,774 |
(792 |
) |
(30,982 |
) |
||||||||||
Under the Regulated Investment Company Modernization Act of 2010 (the "Act"), net capital losses recognized by the Funds after December 22, 2010, may be carried forward indefinitely, and retain their character as short-term and/or long-term losses. These carryforwards are available as a reduction, to the extent provided in the regulations, of future realized capital gains. The Act requires that post-enactment net capital losses be used before pre-enactment net capital losses.
At June 30, 2015, the following Funds had post-enactment net capital losses that will be carried forward indefinitely, as follows:
| Fund |
Short-term losses |
Long-term losses |
Net capital losses |
||||||||||||
|
UBS Core Plus Bond Fund |
$ |
35,412 |
— |
$ |
35,412 |
||||||||||
|
UBS Fixed Income Opportunities Fund |
3,770,097 |
— |
3,770,097 |
||||||||||||
78
The UBS Funds
Notes to financial statements
At June 30, 2015, the following Funds had pre-enactment capital loss carryforwards for federal income tax purposes available to offset future capital gains through the indicated expiration dates:
|
Expiration dates |
|||||||||||
| Fund |
June 30, 2017 |
June 30, 2018 |
|||||||||
|
UBS Core Plus Bond Fund |
$ |
2,127,033 |
$ |
32,070,048 |
|||||||
To the extent that such losses are used to offset future net realized capital gains, it is probable these gains will not be distributed.
During the fiscal year ended June 30, 2015, the following funds utilized capital loss carryforwards to offset current year realized capital gains:
|
Fund |
Amount |
||||||
|
UBS Core Plus Bond Fund |
$ |
255,304 |
|||||
|
UBS Fixed Income Opportunities Fund |
285,210 |
||||||
Qualified late year losses are deemed to arise on the first business day of a Fund's next taxable year. For the year ended June 30, 2015, the following Fund incurred, and elected to defer, losses of the following:
|
Post October capital losses |
|||||||||||||||
| Fund |
Late year ordinary losses |
Short-term |
Long-term |
||||||||||||
|
UBS Fixed Income Opportunities Fund |
— |
998,054 |
— |
||||||||||||
ASC 740-10 "Income Taxes—Overall" sets forth a minimum threshold for financial statement recognition of the benefit of a tax position taken or expected to be taken. The Funds have conducted an analysis and concluded as of June 30, 2014 that there are no significant uncertain tax positions taken or expected to be taken that would require recognition in the financial statements. It is each Fund's policy to record any significant foreign tax exposures in the financial statements. The Funds recognize interest and penalties, if any, related to uncertain tax positions as income tax expense in the Statement of operations. During the year ended June 30, 2015, the Funds did not incur any interest or penalties.
Under the applicable foreign tax laws, gains on certain securities held in foreign countries may be subject to taxes that will be paid by the Fund.
Each of the tax years in the four year ended June 30, 2015, or since inception in the case of UBS Municipal Bond Fund, remains subject to examination by the Internal Revenue Service and state taxing authorities.
8. Line of credit
The Trust has entered into an agreement with JPMorgan Chase Bank to provide a $50 million committed line of credit to the Funds ("Committed Credit Facility") to be utilized for temporary financing until the settlement of sales or purchases of portfolio securities, the repurchase or redemption of shares of each Fund at the request of shareholders and other temporary or emergency purposes. Interest on amounts borrowed is calculated based on the prevailing rates in effect at the time of borrowing. Under the Committed Credit Facility arrangement, each Fund has agreed to pay commitment fees, pro rata, based on the relative asset size of the Funds in the Committed
79
The UBS Funds
Notes to financial statements
Credit Facility. There were no borrowings from the Committed Credit Facility outstanding as of or during the year ended June 30, 2015.
9. Shares of beneficial interest
For the year ended June 30, 2015, transactions in shares of beneficial interest for each of the Funds were as follows:
UBS Core Plus Bond Fund
|
Class A |
Class C |
Class P* |
|||||||||||||||||||||||||
|
Shares |
Amount |
Shares |
Amount |
Shares |
Amount |
||||||||||||||||||||||
|
Shares sold |
20,818 |
$ |
192,060 |
17,059 |
$ |
157,313 |
755,738 |
$ |
6,965,354 |
||||||||||||||||||
|
Shares repurchased |
(135,037 |
) |
(1,243,314 |
) |
(36,713 |
) |
(335,472 |
) |
(470,235 |
) |
(4,330,916 |
) |
|||||||||||||||
|
Dividends reinvested |
6,668 |
61,203 |
3,420 |
31,253 |
99,953 |
915,764 |
|||||||||||||||||||||
|
Redemption fees |
— |
724 |
— |
385 |
— |
7,229 |
|||||||||||||||||||||
|
Net increase (decrease) |
(107,551 |
) |
$ |
(989,327 |
) |
(16,234 |
) |
$ |
(146,521 |
) |
385,456 |
$ |
3,557,431 |
||||||||||||||
UBS Fixed Income Opportunities Fund
|
Class A |
Class C |
Class P* |
|||||||||||||||||||||||||
|
Shares |
Amount |
Shares |
Amount |
Shares |
Amount |
||||||||||||||||||||||
|
Shares sold |
74,384 |
$ |
704,345 |
3,857 |
$ |
35,946 |
3,272,676 |
$ |
31,473,009 |
||||||||||||||||||
|
Shares repurchased |
(3,673,381 |
) |
(35,211,031 |
) |
(341,661 |
) |
(3,215,822 |
) |
(2,945,907 |
) |
(27,665,822 |
) |
|||||||||||||||
|
Dividends reinvested |
12,759 |
117,176 |
6,516 |
59,460 |
65,626 |
604,344 |
|||||||||||||||||||||
|
Redemption fees |
— |
145 |
— |
100 |
— |
687 |
|||||||||||||||||||||
|
Net increase (decrease) |
(3,586,238 |
) |
$ |
(34,389,365 |
) |
(331,288 |
) |
$ |
(3,120,316 |
) |
392,395 |
$ |
4,412,218 |
||||||||||||||
UBS Municipal Bond Fund
|
Class A |
Class C |
Class P |
|||||||||||||||||||||||||
|
Shares |
Amount |
Shares |
Amount |
Shares |
Amount |
||||||||||||||||||||||
|
Shares sold |
1,205,919 |
$ |
12,084,838 |
299,920 |
$ |
3,024,270 |
5,923,033 |
$ |
59,428,930 |
||||||||||||||||||
|
Shares repurchased |
(110,335 |
) |
(1,097,096 |
) |
(4,536 |
) |
(45,000 |
) |
(1,213,674 |
) |
(12,079,756 |
) |
|||||||||||||||
|
Dividends reinvested |
3,593 |
35,972 |
1,255 |
12,563 |
19,204 |
192,048 |
|||||||||||||||||||||
|
Redemption fees |
788 |
229 |
4,432 |
||||||||||||||||||||||||
|
Net increase |
1,099,177 |
$ |
11,024,502 |
296,639 |
$ |
2,992,062 |
4,728,563 |
$ |
47,545,654 |
||||||||||||||||||
* Effective July 28, 2014, Class Y shares were renamed Class P shares.
80
The UBS Funds
Notes to financial statements
For the year ended June 30, 2014, transactions in shares of beneficial interest for each of the Funds were as follows:
UBS Core Plus Bond Fund
|
Class A |
Class C |
Class Y |
|||||||||||||||||||||||||
|
Shares |
Amount |
Shares |
Amount |
Shares |
Amount |
||||||||||||||||||||||
|
Shares sold |
20,408 |
$ |
182,793 |
2,395 |
$ |
21,408 |
294,057 |
$ |
2,653,443 |
||||||||||||||||||
|
Shares repurchased |
(456,390 |
) |
(4,085,317 |
) |
(42,911 |
) |
(384,376 |
) |
(568,982 |
) |
(5,097,483 |
) |
|||||||||||||||
|
Dividends reinvested |
6,919 |
61,956 |
3,165 |
28,236 |
77,511 |
693,484 |
|||||||||||||||||||||
|
Redemption fees |
— |
376 |
— |
130 |
— |
2,013 |
|||||||||||||||||||||
|
Net decrease |
(429,063 |
) |
$ |
(3,840,192 |
) |
(37,351 |
) |
$ |
(334,602 |
) |
(197,414 |
) |
$ |
(1,748,543 |
) |
||||||||||||
UBS Fixed Income Opportunities Fund
|
Class A |
Class C |
Class Y |
|||||||||||||||||||||||||
|
Shares |
Amount |
Shares |
Amount |
Shares |
Amount |
||||||||||||||||||||||
|
Shares sold |
3,404,144 |
$ |
33,107,641 |
266,789 |
$ |
2,588,679 |
— |
$ |
— |
||||||||||||||||||
|
Shares repurchased |
(4,043,059 |
) |
(39,006,988 |
) |
(454,715 |
) |
(4,377,735 |
) |
(1,505,689 |
) |
(14,491,467 |
) |
|||||||||||||||
|
Dividends reinvested |
21,572 |
208,112 |
545 |
5,249 |
15,458 |
149,333 |
|||||||||||||||||||||
|
Redemption fees |
— |
20,977 |
— |
3,403 |
— |
12,793 |
|||||||||||||||||||||
|
Net decrease |
(617,343 |
) |
$ |
(5,670,258 |
) |
(187,381 |
) |
$ |
(1,780,404 |
) |
(1,490,231 |
) |
$ |
(14,329,341 |
) |
||||||||||||
81
The UBS Funds
Report of independent registered public accounting firm
The Board of Trustees and Shareholders of The UBS Funds
We have audited the accompanying statements of assets and liabilities, including the portfolios of investments, of UBS Core Plus Bond Fund, UBS Fixed Income Opportunities Fund and UBS Municipal Bond Fund (three of the series comprising The UBS Funds) (collectively the "Funds") as of June 30, 2015, and the related statements of operations for the year then ended, the statements of changes in net assets and the financial highlights for each of the periods indicated therein. These financial statements and financial highlights are the responsibility of the Funds' management. Our responsibility is to express an opinion on these financial statements and financial highlights based on our audits.
We conducted our audits in accordance with the standards of the Public Company Accounting Oversight Board (United States). Those standards require that we plan and perform the audit to obtain reasonable assurance about whether the financial statements and financial highlights are free of material misstatement. We were not engaged to perform an audit of the Funds' internal control over financial reporting. Our audits included consideration of internal control over financial reporting as a basis for designing audit procedures that are appropriate in the circumstances, but not for the purpose of expressing an opinion on the effectiveness of the Funds' internal control over financial reporting. Accordingly, we express no such opinion. An audit also includes examining, on a test basis, evidence supporting the amounts and disclosures in the financial statements and financial highlights, assessing the accounting principles used and significant estimates made by management, and evaluating the overall financial statement presentation. Our procedures included confirmation of securities owned as of June 30, 2015, by correspondence with the custodian and others or by other appropriate auditing procedures where replies from others were not received. We believe that our audits provide a reasonable basis for our opinion.
In our opinion, the financial statements and financial highlights referred to above present fairly, in all material respects, the financial position of UBS Core Plus Bond Fund, UBS Fixed Income Opportunities Fund and UBS Municipal Bond Fund at June 30, 2015, the results of their operations for the year then ended, the changes in their net assets and the financial highlights for each of the periods indicated therein, in conformity with U.S. generally accepted accounting principles.

New York, New York
August 28, 2015
82
The UBS Funds
General information (unaudited)
Quarterly Form N-Q portfolio schedule
The Funds will file their complete schedule of portfolio holdings with the Securities and Exchange Commission ("SEC") for the first and third quarters of each fiscal year on Form N-Q. The Funds' Forms N-Q are available on the SEC's Web site at http://www.sec.gov. The Funds' Forms N-Q may be reviewed and copied at the SEC's Public Reference Room in Washington, D.C. Information on the operation of the SEC's Public Reference Room may be obtained by calling 1-202-551 8090. Additionally, you may obtain copies of Forms N-Q from the Funds upon request by calling 1-800-647 1568.
Proxy voting policies, procedures and record
You may obtain a description of the Funds' (1) proxy voting policies, (2) proxy voting procedures and (3) information regarding how the Funds voted any proxies related to portfolio securities during the most recent 12-month year ended June 30 for which an SEC filing has been made, without charge, upon request by contacting the Funds directly at 1-800-647 1568, online on UBS's Web site: www.ubs.com/ubsglobalam-proxy, or on the EDGAR Database on the SEC's Web site http://www.sec.gov).
83
The UBS Funds
Board approval of investment advisory agreements
(unaudited)
At the meeting of the Board of Trustees (the "Board") of The UBS Funds (the "Trust"), held on June 4 and 5, 2015 (the "Meeting"), the Board, including those Trustees who are not "interested persons" (as defined in the 1940 Act) of the Trust or UBS Global Asset Management (Americas) Inc. (the "Advisor") and its affiliates (together, the "Independent Trustees"), considered the continuation of the investment advisory agreements (the "Advisory Agreements") between the Trust and the Advisor for the UBS Dynamic Alpha Fund, UBS Global Allocation Fund, UBS Asset Growth Fund, UBS Multi-Asset Income Fund, UBS Global Sustainable Equity Fund, UBS U.S. Defensive Equity Fund, UBS U.S. Large Cap Equity Fund, UBS U.S. Equity Opportunity Fund, UBS U.S. Small Cap Growth Fund, UBS Equity Long-Short Multi-Strategy Fund, UBS Fixed Income Opportunities Fund and UBS Core Plus Bond Fund (each a "Fund," and together, the "Funds"). Prior to the Meeting, the Independent Trustees' counsel had sent to the Advisor a request detailing the information that the Independent Trustees wished to receive in connection with their consideration of the continuation of the Advisory Agreements. The Independent Trustees met with their independent counsel, as well as an independent consultant engaged by the Board to assist in the annual Advisory Agreement review process, on May 26, 2015, June 4, 2015 and June 5, 2015, to discuss the materials provided to them in response to the information request, including materials prepared by the Advisor, as well as reports prepared by Lipper Inc. ("Lipper Reports"), an independent statistical compilation company, providing comparative expense information on an actual and contractual basis and comparative performance information for the Funds. The Board also made reference to information and material that had been provided to the Independent Trustees throughout the year at quarterly Board meetings.
At the Meeting, the Board considered a number of factors in connection with its deliberations concerning the continuation of the Advisory Agreement for each Fund, including: (i) the nature, extent, and quality of the services provided by the Advisor to the Fund; (ii) the performance of the Fund and the Advisor; (iii) the Fund's expenses, costs of the services to be provided and profits to be realized by the Advisor and its affiliates from the relationship with the Fund; and (iv) whether economies of scale are realized by the Advisor with respect to the Fund, as it grows larger, and the extent to which the economies of scale are reflected in the level of the management fees charged.
Nature, extent, and quality of services.
In considering the nature, extent, and quality of the services provided by the Advisor to a Fund, the Board reviewed the material presented by the Advisor describing the various services provided to each Fund. The Board noted that in addition to investment management services, the Advisor provides each Fund with operational, legal, and compliance support. The Board also considered the scope and depth of the Advisor's organization and the experience and expertise of the professionals currently providing investment management and other services to the Funds. The Board considered that the Advisor was a well-established investment management organization employing investment personnel with significant experience in the investment management industry. The Board also considered the Advisor's in-house research capabilities, as well as other research services available to it, including research services available to the Advisor as a result of securities transactions effected for the Funds and the Advisor's other investment management clients, and noted that the Advisor had extensive global research capabilities. The Board also evaluated the Advisor's portfolio management process for each Fund, including the use of risk management techniques and the proprietary technologies utilized to structure the Fund's portfolio. The Board noted that various presentations had been made by investment personnel at Board meetings throughout the year concerning the Funds' investment performance and investment strategies, including the derivative strategies utilized by certain Funds.
The Board also noted and discussed the services that the Advisor and its affiliates provide to the Funds under other agreements with the Trust, including administration services provided by the Advisor, underwriting services provided by UBS Global Asset Management (US) Inc. ("UBS Global AM (US)"), and sub-transfer agency services provided by UBS Financial Services Inc. ("UBS Financial Services"). In connection with the non-investment management services, the Board also considered the quarterly reports that the Advisor provides to the Board throughout the year pertaining to brokerage commissions, soft dollars, portfolio valuations, and Rule 12b-1 fees, among others. In addition, the Board considered the presentations provided with respect to distribution strategies for the Funds. After
84
The UBS Funds
Board approval of investment advisory agreements
(unaudited)
analyzing the services provided by the Advisor to each Fund, both quantitatively and qualitatively, including the impact of these services on investment performance, the Board concluded that the nature, extent, and quality of services provided to each Fund were consistent with the operational requirements of each Fund, and met the needs of the Fund's shareholders.
Performance.
In evaluating the performance of each Fund, the Board analyzed the Lipper Reports, which compared the performance of each Fund with other funds in its respective peer universe over various time periods. The Board also reviewed the memoranda provided by the Advisor providing an analysis of the markets and the Funds' performance during the past year. In reviewing the Lipper Reports, the Board noted that the UBS Dynamic Alpha Fund, UBS Global Allocation Fund, UBS Asset Growth Fund, UBS Multi-Asset Income Fund, UBS Global Sustainable Equity Fund, UBS Equity Long-Short Multi-Strategy Fund, UBS U.S. Large Cap Equity Fund, UBS U.S. Equity Opportunity Fund, UBS U.S. Small Cap Growth Fund and UBS Core Plus Bond Fund each had appeared in one of the top three performance quintiles for the one-year performance period. At the Board's request, the Advisor further addressed the performance data for the UBS U.S. Defensive Equity Fund and UBS Fixed Income Opportunities Fund, each of which had appeared in one of the lower performance quintiles for the one-year period.
In discussing the performance of the UBS U.S. Defensive Equity Fund for the one-year performance period, the Advisor explained that the Fund's defensive strategy was the primary reason for the Fund's underperformance as compared to its peer universe. The Advisor noted that the options overlay strategy for the Fund, which reduced the volatility profile of the Fund, detracted from the Fund's performance. The Advisor stated the options overlay strategy should benefit the Fund's relative performance when the U.S. equity market experiences a down turn.
The Advisor next addressed the relative underperformance of the UBS Fixed Income Opportunities Fund with respect to the Fund's peers. The Fund's weaker relative performance as compared to its peer universe was attributable to its corporate credit exposure in both investment grade and high yield debt, where overall hedging strategies and security selection within the energy sector detracted from results. The Advisor also noted that the Fund's net short duration positioning was not rewarded as yield generally declined over the period. The Advisor did note that the Fund continued to deliver returns with minimal correlation to traditional fixed income markets, as well as many of its unconstrained fixed income peer funds.
The Board concluded that the Advisor's explanations provided a sound basis for understanding the performance of each Fund that underperformed in comparison to its peer universe. The Board determined, after analyzing the performance data, that the performance of each Fund was acceptable as compared with relevant performance standards, given the investment strategies and risk profile of each Fund, the expectations of the shareholder base, the current market environment and the Advisor's efforts to address the underperformance issues of each Fund.
Fund fees and expenses.
When considering the fees and expenses borne by each Fund, and the reasonableness of the management fees paid to the Advisor in light of the services provided to each Fund, the Board compared the fees charged by the Advisor to each Fund to fees charged to the funds in its peer group for comparable services, as provided in the Lipper Reports, on both an actual (taking into account expense limitation arrangements) and a contractual basis (assuming all funds in the peer expense group were similar in size to the respective Fund). In examining the Lipper Reports, and in reviewing comparative costs, it was noted that the results of such expense comparisons showed that the actual management fee rate for each Fund, except the UBS Global Allocation Fund, UBS Dynamic Alpha Fund and UBS U.S. Small Cap Growth Fund, was comparable to, or lower than, the Lipper median in its respective Lipper expense group. The Board also noted that each Fund, except the UBS Global Allocation Fund, UBS Core Plus Bond Fund and UBS U.S. Small Cap Growth Fund, had a contractual fee rate comparable to, or lower than, the Lipper median in its respective Lipper expense group. In addition, the Board reviewed the actual total expenses of
85
The UBS Funds
Board approval of investment advisory agreements
(unaudited)
each Fund and noted that each Fund had total expenses that were comparable to, or lower than, the Lipper median in its respective Lipper expense group, except for UBS Global Allocation Fund and UBS U.S. Small Cap Growth Fund.
The Board first discussed the management fee and expenses of the UBS Global Allocation Fund. It was noted that the contractual management fee, actual management fee and total expenses for the UBS Global Allocation Fund were each slightly higher than the fees and expenses of several of the funds in its Lipper expense group. The Advisor noted that a reduction in the UBS Global Allocation Fund's assets was a main driver to the Fund's relative lower rankings. The Board, however, noted the Fund's management fee and total expenses were closer to the medians of its Lipper expense group than such fee and expenses were last year. The Board determined that the management fee and expenses were each reasonable considering that neither the management fee nor the Fund's total expenses were significantly higher than the respective Lipper expense group medians. The Board will continue to monitor the Fund's peers and expenses.
The Board then discussed the management fee of the UBS Dynamic Alpha Fund. It was noted that the actual management fee of UBS Dynamic Alpha Fund was higher than the median of the Fund's Lipper expense group. The Board noted that while the UBS Dynamic Alpha Fund's actual management fee was higher than the median of the Fund's Lipper expense group, the Fund's total expenses were less than the median of the Fund's Lipper expense group, resulting in the total cost to investors being very competitive. The Advisor also noted that the UBS Dynamic Alpha Fund was included in a brand new Lipper peer group category. The Advisor stated that as the new category matures, the rankings of the Fund will become more conclusive.
The Advisor next addressed the management fee of the UBS Core Plus Bond Fund. The Advisor noted that while the contractual management fee of the UBS Core Plus Bond Fund was higher than the median of the Fund's Lipper expense group, the Fund compared very favorably to its Lipper peers with respect to its actual management fee and total expenses. The UBS Core Plus Bond Fund placed in the first quintile of its Lipper expense group for both its actual management fee and total expenses.
The Board next discussed the management fee of the UBS U.S. Small Cap Growth Fund. It was noted that the contractual management fee, actual management fee and total expenses for the UBS U.S. Small Cap Growth Fund were each higher than the medians in its Lipper expense group. The Advisor noted that a new fee waiver and expense cap arrangement was approved for the Fund effective March 27, 2015, that provides for a higher level of fees waived and expenses reimbursed by the Advisor. The Advisor reported that under this new arrangement, the actual management fee and total expenses for the UBS U.S. Small Cap Growth Fund are each expected to be lower than the medians of the Lipper expense group.
The Board also received and considered information about the fee rates charged to other funds and accounts that are managed by the Advisor. After discussing the information about the other funds and accounts with the Advisor, the Board determined that the fees charged by the Advisor to the Funds were within a reasonable range, giving effect to differences in services performed for such other funds and accounts as compared to such fee rates. The Board, after reviewing all pertinent material, concluded that the management fee payable under each Fund's Advisory Agreement was fair and reasonable, both on an absolute basis and in comparison with the fees of other funds identified in its peer group.
Costs and profitability.
The Board considered the costs of providing services to the Funds and the profitability of the Funds to the Advisor and its affiliates by reviewing the profitability analysis provided by the Advisor, including information about its fee revenues and expenses. The Board reviewed the profitability of each Fund to the Advisor and its affiliates, and the
86
The UBS Funds
Board approval of investment advisory agreements
(unaudited)
compensation that was received for providing services to each Fund. The profitability analysis, which provided information for the last three calendar years, included schedules relating to the revenue and expenses attributable to: (i) the investment advisory and administration services provided by the Advisor; (ii) the distribution and shareholder services provided by UBS Global AM (US) and UBS Financial Services; (iii) the transfer agency-related services provided by UBS Financial Services; and (iv) all services provided by the Advisor, UBS Global AM (US), and UBS Financial Services shown on a consolidated basis. In discussing the profitability analysis with the Board, the Advisor, as requested by the Board, provided the Board with a presentation on the methodology utilized in the profitability analysis. The Board noted that the methodology used for the profitability analysis provided to the Board for purposes of its annual review of the Advisory Agreements was reasonable. The Advisor also explained to the Board the reasons for an increase or decrease in profitability of each Fund from last calendar year to this calendar year.
The Board also considered "fallout" or ancillary benefits to the Advisor or its affiliates as the result of their relationship with the Funds; for example, the ability to attract other clients due to the Advisor's role as investment advisor to the Funds and the research services available to the Advisor through soft dollar brokerage commissions. The Independent Trustees also considered the ancillary benefits received by the Advisor's affiliates, UBS Securities LLC and UBS AG, in the form of commissions for executing securities transactions for the Funds. Upon closely examining the information provided concerning the Advisor's profitability, the Board concluded that the level of profits realized by the Advisor and its affiliates with respect to each Fund, if any, was reasonable in relation to the nature and quality of the services that were provided.
Economies of scale.
The Board also discussed whether economies of scale are realized by the Advisor with respect to each Fund as it grows larger, and the extent to which this is reflected in the level of management fees charged. The Board noted that with respect most Funds, any actual or potential economies of scale are, or will be, shared with the Fund and its shareholders through existing management fee breakpoints so that as the Fund grows in size, its effective management fee declines. The Board noted that each Fund, except UBS Asset Growth Fund, UBS Equity Long-Short Multi-Strategy Fund, UBS Multi-Asset Income Fund and UBS Fixed Income Opportunities Fund, had a breakpoint schedule that provided for continuing breakpoints past the current asset level for the Fund. Based on each Fund's fees and expenses and the Advisor's profitability analysis, the Board concluded that any actual or potential economies of scale would be reasonably shared with a Fund and its shareholders.
After full consideration of the factors discussed above, with no single factor identified as being of paramount importance, the Board, including a majority of the Independent Trustees, with the assistance of independent counsel, concluded that the continuation of the Advisory Agreement for each Fund was in the best interests of the Fund and its shareholders.
87
The UBS Funds
Trustee and officer information (unaudited)
The Trust is a Delaware statutory trust. Under Delaware law, the Board has overall responsibility for managing the business and affairs of the Trust, including general supervision and review of its investment activities. The Trustees elect the Officers of the Trust, who are responsible for administering the day-to-day operations of the Trust and the Funds.
The table shows, for each Trustee and Officer, his or her name, address and age, the position held with the Trust, the length of time served as a Trustee or Officer of the Trust, the Trustee's or Officer's principal occupations during the last five years, the number of funds in the UBS Family of Funds overseen by the Trustee or Officer and other directorships held by such Trustee.
The Trust's Statement of Additional Information contains additional information about the Trustees and is available, without charge, upon request, by calling 1-800-647 1568.
Non-interested Trustees:
|
Name, address and age |
Position(s) held with Trust |
Term of office1 and length of time served |
Principal occupation(s) during past 5 years |
Number of portfolios in fund complex overseen by Trustee |
Other directorships held by Trustee |
||||||||||||||||||
|
Adela Cepeda; 57 A.C. Advisory, Inc. 150 North Wacker Drive Suite 2160 Chicago, Illinois 60606 |
Trustee |
Since 2004 |
Ms. Cepeda is founder and president of A.C. Advisory, Inc. (since 1995). |
Ms. Cepeda is a director or trustee of four investment companies (consisting of 31 portfolios) for which UBS Global AM serves as investment advisor or manager. |
Ms. Cepeda is a director (since 2012) of BMO Financial Corp. (U.S. holding company for BMO Harris Bank N.A.), director of the Mercer Funds (9 portfolios) (since 2005), trustee of the Morgan Stanley Smith Barney Consulting Group Capital Markets Funds (11 portfolios) (since 2008). Ms. Cepeda was a director of Amalgamated Bank of Chicago (since 2003 to 2012) and a director of the Municipal Securities Rulemaking Board (from 2012 to 2012). |
||||||||||||||||||
|
John J. Murphy; 71 268 Main Street P.O. Box 718 Gladstone, NJ 07934 |
Trustee |
Since 2009 |
Mr. Murphy is the president of Murphy Capital Management (investment advisor) (since 1983) |
Mr. Murphy is a director or trustee of four investment companies (consisting of 31 portfolios) for which UBS Global AM serves as investment advisor or manager. |
Mr. Murphy is a director (since 2007) of the Legg Mason Equity Funds (54 portfolios) and a trustee of Morgan Stanley Smith Barney Consulting Group Capital Markets Funds (11 portfolios). |
||||||||||||||||||
88
The UBS Funds
Trustee and officer information (unaudited)
Non-interested Trustees (continued):
|
Name, address and age |
Position(s) held with Trust |
Term of office1 and length of time served |
Principal occupation(s) during past 5 years |
Number of portfolios in fund complex overseen by Trustee |
Other directorships held by Trustee |
||||||||||||||||||
|
Abbie J. Smith; 62 University of Chicago Booth School of Business 5807 S. Woodlawn Avenue Chicago, IL 60637 |
Trustee |
Since 2009 |
Ms. Smith is Boris and Irene Stern Professor of Accounting in the University of Chicago Booth School of Business (since 1980). Formerly, Ms. Smith was a co-founding partner and Director of Research of Fundamental Investment Advisors, a hedge fund (co-founded in 2004, commenced operations in 2008) (from 2008 to 2010). |
Ms. Smith is a director or trustee of four investment companies (consisting of 31 portfolios) for which UBS Global AM serves as investment advisor or manager. |
Ms. Smith is a director (since 2000) of HNI Corporation and chair of the human resources and compensation committee (formerly known as HON Industries Inc.) (office furniture) and a director (since 2003) and chair of the audit committee of Ryder System Inc. (transportation, logistics and supply-chain management). In addition, Ms. Smith is a trustee/director (since 2000) and a member of the audit committee and portfolio performance committee of the Dimensional Funds complex (89 Portfolios). |
||||||||||||||||||
|
Frank K. Reilly; 79 Mendoza College of Business University of Notre Dame Notre Dame, IN 46556-5649 |
Chairman and Trustee |
Since 1992 |
Mr. Reilly is the Bernard J. Hank Professor of Finance in the Mendoza College of Business at the University of Notre Dame (since 1982). |
Mr. Reilly is a director or trustee of four investment companies (consisting of 31 portfolios) for which UBS Global AM serves as investment advisor or manager. |
Mr. Reilly is a director (since 1994) of Discover Bank, a subsidiary of Discover Financial Services and is Chairman of the Audit Committee for the bank. |
||||||||||||||||||
|
Edward M. Roob; 80 c/o UBS Global AM One North Wacker Drive Chicago, IL 60606 |
Trustee |
Since 1995 |
Mr. Roob is retired (since 1993). |
Mr. Roob is a director or trustee of four investment companies (consisting of 31 portfolios) for which UBS Global AM serves as investment advisor or manager. |
None. |
||||||||||||||||||
89
The UBS Funds
Trustee and officer information (unaudited)
Non-interested Trustees (continued):
|
Name, address and age |
Position(s) held with Trust |
Term of office1 and length of time served |
Principal occupation(s) during past 5 years |
Number of portfolios in fund complex overseen by Trustee |
Other directorships held by Trustee |
||||||||||||||||||
|
J. Mikesell Thomas; 64 c/o UBS Global AM One North Wacker Drive Chicago, IL 60606 |
Trustee |
Since 2004 |
Mr. Thomas is a principal with the investment firm Castle Creek Capital (since 2008) and President and sole shareholder of Mikesell Advisory Corp (since 2009). He is the former President and CEO of Federal Home Loan Bank of Chicago (from 2004 to 2008) and of First Chicago Bancorp (from 2008 to 2011). |
Mr. Thomas is a director or trustee of four investment companies (consisting of 31 portfolios) for which UBS Global AM serves as investment advisor or manager. |
Mr. Thomas is a director (since 1992) and chairman of the Audit Committee for NorthShore University HealthSystem a not for profit healthcare organization and a director (since 2012) and a member of the Audit and Investment and Finance Committees of HCC Insurance Holdings Inc. Mr. Thomas was previously a director of First Chicago Bancorp (2008 to 2010) and First Chicago Bank & Trust (from 2008 to 2010). |
||||||||||||||||||
Interested Trustee:
|
E. Blake Moore, Jr.; 572* |
Interested Trustee |
Since June 2015 |
Mr. Moore is a Managing Director and Head of Americas at UBS Global Asset Management (Americas) Inc. (since March 2015). Mr. Moore is a member of the UBS Global Asset Management Executive Committee and UBS Americas Executive Committee. Prior to joining UBS Global Asset Management in March 2015, Mr. Moore was EVP Head of Distribution at Mackenzie Investments in Canada for over three years. Before this, Mr. Moore spent over six years at Allianz Global Investors in New York where he held a number of senior management roles. Most recently, he was Chief Executive Officer, Allianz Global Investors Fund Management. Prior to Allianz, Mr. Moore served as a member of the Executive Committee and Partner at Nicholas-Applegate Capital Management. |
Mr. Moore is a director or trustee of three investment companies (consisting of 30 portfolios) for which UBS Global AM serves as investment advisor or manager. |
None |
||||||||||||||||||
90
The UBS Funds
Trustee and officer information (unaudited)
Officers:
|
Name, address and age |
Position(s) held with Trust |
Term of office1 and length of time served |
Principal occupation(s) during past 5 years; number of portfolios in fund complex for which person serves as officer |
||||||||||||
|
Joseph J. Allessie*; 50 |
Vice President, Assistant Secretary and Chief Compliance Officer |
Since 2005 (Vice President and Assistant Secretary); since July 2014 (Chief Compliance Officer) |
Mr. Allessie is a managing director (since 2015) (prior to which he was an executive director) at UBS Global Asset Management (US) Inc. and UBS Global AM (collectively, "UBS Global AM—Americas region"). Mr. Allessie is head of compliance and operational risk control for the UBS Global Asset Management Division in the Americas with oversight for traditional and alternative investment businesses in Canada, the US and Cayman Islands. Prior to that he served as deputy general counsel (from 2005 to 2014). Mr. Allessie is a vice president, assistant secretary and chief compliance officer (prior to which he was interim chief compliance officer) (from January to July 2014) of 14 investment companies (consisting of 73 portfolios) for which UBS Global AM serves as investment advisor or manager. |
||||||||||||
|
Rose Ann Bubloski*; 47 |
Vice President and Assistant Treasurer |
Since 2011 |
Ms. Bubloski is a director (since 2012) (prior to which she was an associate director) (from 2008 to 2012) and senior manager of the US mutual fund treasury administration department of UBS Global AM—Americas region. She was a vice president and assistant treasurer of certain UBS funds (from 2004 to 2007). She is vice president and assistant treasurer of 15 investment companies (consisting of 73 portfolios) for which UBS Global AM serves as investment advisor or manager. |
||||||||||||
|
Mark E. Carver*; 51 |
President |
Since 2010 |
Mr. Carver is a managing director and Head of Product Development and L.C. Management—Americas for UBS Global AM—Americas region (since 2008). In this role, he oversees product development and management for both wholesale and institutional businesses. He is a member of the Americas Management Committee (since 2008) and the Regional Operating Committee (since 2008). Prior to 2008, Mr. Carver held a number of product-related or sales responsibilities with respect to funds, advisory programs and separately managed accounts. Mr. Carver is president of 14 investment companies (consisting of 73 portfolios) for which UBS Global AM serves as investment advisor or manager. |
||||||||||||
|
Thomas Disbrow*; 49 |
Vice President, Treasurer and Principal Accounting Officer |
Since 2004 and 2006, respectively |
Mr. Disbrow is a managing director (since 2011), (prior to which he was an executive director) (since 2007) and head of North Americas fund treasury (since 2011) of UBS Global AM—Americas region. Mr. Disbrow is a vice president and treasurer and/or principal accounting officer of 14 investment companies (consisting of 73 portfolios) for which UBS Global AM serves as investment advisor or manager. |
||||||||||||
|
Christopher S. Ha*; 35 |
Vice President and Assistant Secretary |
Since September 2012 |
Mr. Ha is a director and associate general counsel (since September 2012) at UBS Global AM—Americas region. Prior to joining UBS Global AM—Americas region, Mr. Ha was of counsel at Buhler, Duggal & Henry LLP (law firm) (from March 2012 to July 2012) and an associate attorney at Dechert LLP (law firm) (from 2007 to 2009). Mr. Ha is a vice president and assistant secretary of 14 investment companies (consisting of 73 portfolios) for which UBS Global AM serves as investment advisor or manager. |
||||||||||||
91
The UBS Funds
Trustee and officer information (unaudited)
Officers (continued):
|
Name, address and age |
Position(s) held with Trust |
Term of office1 and length of time served |
Principal occupation(s) during past 5 years; number of portfolios in fund complex for which person serves as officer |
||||||||||||
|
Mark F. Kemper**; 57 |
Vice President and Secretary |
Since 1999 |
Mr. Kemper is a managing director (since 2006) and head of the legal department of UBS Global AM—Americas region (since 2004). He has been secretary of UBS Global AM—Americas region (since 2004) and assistant secretary of UBS Global Asset Management Trust Company (since 1993). Mr. Kemper is vice president and secretary of 15 investment companies (consisting of 73 portfolios) for which UBS Global AM serves as investment advisor or manager. |
||||||||||||
|
Joanne M. Kilkeary*; 47 |
Vice President and Assistant Treasurer |
Since 2006 |
Ms. Kilkeary is an executive director (since March 2013) (prior to which she was a director) (since 2008) and a senior manager (since 2004) of the US mutual fund treasury administration department of UBS Global AM—Americas region. Ms. Kilkeary is a vice president and assistant treasurer of 14 investment companies (consisting of 73 portfolios) for which UBS Global AM serves as investment advisor or manager. |
||||||||||||
|
Cindy Lee*; 40 |
Vice President and Assistant Treasurer |
Since November 2014 |
Ms. Lee is an associate director (since 2009) prior to which she was a fund treasury manager (from 2007 to 2009) of the US mutual fund treasury administration department of UBS Global AM—Americas region. Ms. Lee is a vice president and assistant treasurer of 14 investment companies (consisting of 73 portfolios) for which UBS Global AM serves as investment advisor or manager. | ||||||||||||
|
Tammie Lee*; 44 |
Vice President and Assistant Secretary |
Since 2005 |
Ms. Lee is an executive director (since 2010) (prior to which she was a director) (since 2005) and associate general counsel of UBS Global AM—Americas region (since 2005). Ms. Lee is a vice president and assistant secretary of 14 investment companies (consisting of 73 portfolios) for which UBS Global AM serves as investment advisor or manager. |
||||||||||||
|
Nancy D. Osborn*; 49 |
Vice President and Assistant Treasurer |
Since 2007 |
Mrs. Osborn is a director (since 2010) (prior to which she was an associate director) and a senior manager of the US mutual fund treasury administration department of UBS Global AM—Americas region (since 2006). Mrs. Osborn is a vice president and assistant treasurer of 14 investment companies (consisting of 73 portfolios) for which UBS Global AM serves as investment advisor or manager. |
||||||||||||
|
Eric Sanders*; 49 |
Vice President and Assistant Secretary |
Since 2005 |
Mr. Sanders is a director and associate general counsel of UBS Global AM—Americas region (since 2005). Mr. Sanders is a vice president and assistant secretary of 14 investment companies (consisting of 73 portfolios) for which UBS Global AM serves as investment advisor or manager. |
||||||||||||
|
Andrew Shoup*; 59 |
Vice President and Chief Operating Officer |
Since 2006 |
Mr. Shoup is a managing director and global head of the fund treasury administration department of UBS Global AM—Americas region (since 2006). Mr. Shoup is also a director of UBS (IRL) Fund p.l.c. (since 2008). Mr. Shoup is a vice president and chief operating officer of 14 investment companies (consisting of 73 portfolios) for which UBS Global AM serves as investment advisor or manager. |
||||||||||||
92
The UBS Funds
Trustee and officer information (unaudited)
Officers (continued):
|
Name, address and age |
Position(s) held with Trust |
Term of office1 and length of time served |
Principal occupation(s) during past 5 years; number of portfolios in fund complex for which person serves as officer |
||||||||||||
|
Keith A. Weller*; 54 |
Vice President and Assistant Secretary |
Since 2004 |
Mr. Weller is an executive director and senior associate general counsel of UBS Global AM—Americas region (since 2005). Mr. Weller is a vice president and assistant secretary of 14 investment companies (consisting of 73 portfolios) for which UBS Global AM serves as investment advisor or manager. |
||||||||||||
|
Mandy Yu*; 31 |
Vice President |
Since March 2013 |
Ms. Yu is an authorized officer (since 2012) and tax compliance manager (since March 2013) of the US mutual fund treasury administration department of UBS Global AM—Americas region. She was a Fund Treasury Manager (from 2012 to March 2013) and a Mutual Fund Administrator (from 2007 to 2012) for UBS Global AM—Americas region. Ms. Yu is a vice president of 14 investment companies (consisting of 73 portfolios) for which UBS Global AM serves as investment advisor or manager. |
||||||||||||
1 Each Trustee holds office for an indefinite term. Officers of the Trust are appointed by the Trustees and serve at the pleasure of the Board.
2 Mr. Moore is considered to be an interested person of the Trust under the federal securities laws due to his position as an officer of UBS Global AM.
* This person's business address is 1285 Avenue of the Americas, New York, NY 10019-6028
** This person's business address is One North Wacker Drive, Chicago, IL 60606.
93
The UBS Funds
Federal tax information (unaudited)
For the year ended June 30, 2015, the percentage of income earned from direct US Treasury obligations approximately amounted to the following:
|
Direct US Treasury obligations |
|||||||
|
UBS Core Plus Bond Fund |
11.83 |
% |
|||||
|
UBS Fixed Income Opportunities Fund |
7.27 |
||||||
Shareholders should not use the above information to prepare their tax returns. Since the Funds fiscal year end is not the calendar year end, another notification will be sent with respect to calendar year 2015. Such notification, which will reflect the amount to be used by calendar year taxpayers on their federal income tax returns, will be made in conjunction with Form 1099 DIV and will be mailed in February 2016. Shareholders are advised to consult their own tax advisers with respect to the tax consequences of their investment in each of the Funds.
94
The UBS Funds
Fund's privacy notice
This notice describes the privacy policy of the UBS Family of Funds, the PACE Funds and all closed-end funds managed by UBS Global Asset Management (collectively, the "Funds"). The Funds are committed to protecting the personal information that they collect about individuals who are prospective, current or former investors.
The Funds collect personal information in order to process requests and transactions and to provide customer service. Personal information, which is obtained from applications and other forms or correspondence submitted to the Funds, may include name(s), address, e-mail address, telephone number, date of birth, social security number or other tax identification number, bank account information, information about your transactions and experiences with the Funds, and any affiliation a client has with UBS Financial Services Inc. or its affiliates ("Personal Information").
The Funds limit access to Personal Information to those individuals who need to know that information in order to process transactions and service accounts. These individuals are required to maintain and protect the confidentiality of Personal Information and to follow established procedures. The Funds maintain physical, electronic and procedural safeguards to protect Personal Information and to comply with applicable laws and regulations.
The Funds may share Personal Information with their affiliates to facilitate the servicing of accounts and for other business purposes, or as otherwise required or permitted by applicable law. The Funds may also share Personal Information with non-affiliated third parties that perform services for the Funds, such as vendors that provide data or transaction processing, computer software maintenance and development, and other administrative services. When the Funds share Personal Information with a non-affiliated third party, they will do so pursuant to a contract that includes provisions designed to ensure that the third party will uphold and maintain privacy standards when handling Personal Information. In addition to sharing information with non-affiliated third parties to facilitate the servicing of accounts and for other business purposes, the Funds may disclose Personal Information to non-affiliated third parties as otherwise required or permitted by applicable law. For example, the Funds may disclose Personal Information to credit bureaus or regulatory authorities to facilitate or comply with investigations; to protect against or prevent actual or potential fraud, unauthorized transactions, claims or other liabilities; or to respond to judicial or legal process, such as subpoena requests.
Except as described in this privacy notice, the Funds will not use Personal Information for any other purpose unless the Funds describe how such Personal Information will be used and clients are given an opportunity to decline approval of such use of Personal Information relating to them (or affirmatively approve the use of Personal Information, if required by applicable law). The Funds endeavor to keep their customer files complete and accurate. The Funds should be notified if any Personal Information needs to be corrected or updated. Please call 1-800-647 1568 with any questions or concerns regarding your Personal Information or this privacy notice.
Privacy Notice
This privacy notice is not a part of the shareholder report.
This page intentionally left blank.
This page intentionally left blank.
This page intentionally left blank.
PRESORTED
STANDARD
U.S. POSTAGE
PAID
COMPUTERSHARE

UBS Global Asset Management (Americas) Inc.
1285 Avenue of the Americas
New York, NY 10019
S1197
Item 2. Code of Ethics.
The registrant has adopted a code of ethics that applies to its principal executive officer, principal financial officer, principal accounting officer or controller, or persons performing similar functions pursuant to Section 406 of the Sarbanes-Oxley Act of 2002. (The registrant has designated the code of ethics adopted pursuant to Sarbanes-Oxley as a “Code of Conduct” to lessen the risk of confusion with its separate code of ethics adopted pursuant to Rule 17j-1 under the Investment Company Act of 1940, as amended.)
Item 3. Audit Committee Financial Expert.
The registrant’s Board has determined that the following person serving on the registrant’s Audit Committee is an “audit committee financial expert” as defined in item 3 of Form N-CSR: J. Mikesell Thomas. Mr. Thomas is independent as defined in item 3 of Form N-CSR.
Item 4. Principal Accountant Fees and Services.
(a) Audit Fees:
For the fiscal years ended June 30, 2015 and June 30, 2014, the aggregate Ernst & Young LLP (E&Y) audit fees for professional services rendered to the registrant were approximately $678,053 and $699,706, respectively.
Fees included in the audit fees category are those associated with the annual audits of financial statements and services that are normally provided in connection with statutory and regulatory filings.
(b) Audit-Related Fees:
In each of the fiscal years ended June 30, 2015 and June 30, 2014, the aggregate audit-related fees billed by E&Y for services rendered to the registrant that are reasonably related to the performance of the audits of the financial statements, but not reported as audit fees, were approximately $69,250 and $67,300, respectively.
Fees included in the audit-related category are those associated with (1) the reading and providing of comments on the 2014 and 2013 semiannual financial statements and (2) agreed upon procedures performed in connection with the review of Form N-1A.
There were no audit-related fees required to be approved pursuant to paragraph (c)(7)(ii) of Rule 2-01 of Regulation S-X during the fiscal years indicated above.
(c) Tax Fees:
In each of the fiscal years ended June 30, 2015 and June 30, 2014, the aggregate tax fees billed by E&Y for professional services rendered to the registrant were approximately $92,624 and $79,873, respectively.
Fees included in the tax fees category comprise all services performed by professional staff in the independent accountant’s tax division except those services related to the audits. This category comprises fees for review of tax returns.
There were no tax fees required to be approved pursuant to paragraph (c)(7)(ii) of Rule 2-01 of Regulation S-X during the fiscal years indicated above.
(d) All Other Fees:
In each of the fiscal years ended June 30, 2015 and June 30, 2014, there were no fees billed by E&Y for products and services, other than the services reported in Item 4(a)-(c) above, rendered to the registrant.
Fees included in the all other fees category would consist of services related to internal control reviews, strategy and other consulting, financial information systems design and implementation, consulting on other information systems, and other tax services unrelated to the registrant.
There were no “all other fees” required to be approved pursuant to paragraph (c)(7)(ii) of Rule 2-01 of Regulation S-X during the fiscal years indicated above.
(e) (1) Audit Committee Pre-Approval Policies and Procedures:
The Audit Committee Charter contains the Audit Committee’s pre-approval policies and procedures. Reproduced below is an excerpt from the Audit Committee Charter regarding pre-approval policies and procedures:
To carry out its purposes, the Audit Committee shall have the following duties and powers:
(a) To pre-approve the engagement of, and to recommend to the Board the engagement, retention or termination of, the independent auditors to provide audit, review or attest services to the UBS Funds, and, in connection therewith, to review and evaluate the capabilities and independence of the auditors, and receive the auditors’ specific representations as to their independence. In evaluating the auditor’s qualifications, performance and independence, the Committee must, among other things, obtain and review a report by the auditors, at least annually, describing the following items: (i) all relationships between the, independent auditors and the UBS Funds, as well as with the UBS Funds, investment advisor or any control affiliate of the investment advisor that provides ongoing services to the UBS Funds; (ii) any material issues raised by the most recent internal quality control review, or peer review, of the audit firm, or by any inquiry or investigation by governmental or professional authorities, within the preceding five years, with respect to one or more independent audits carried out by the firm, and any steps taken to deal with any such issues; and (iii) the audit firm’s internal quality control procedures.
(b) To pre-approve all non-audit services to be provided to the UBS Funds by the independent auditors when, without such pre-approval, the auditors would not be independent of the UBS Funds under applicable federal securities laws, rules or auditing standards.
(c) To pre-approve all non-audit services to be provided by the UBS Funds’ independent auditors to the UBS Funds’ investment advisor or to any entity, that controls, is controlled by or is under common control with the UBS Funds investment advisor (“advisor affiliate”) and that provides ongoing services to the UBS Funds when, without such pre-approval by the Committee, the auditors would not be independent of the UBS Funds under applicable federal securities laws, rules or auditing standards.
(d) To establish, if deemed necessary or appropriate as an alternative to Committee pre-approval of services to be provided by the independent auditors as required by paragraphs (b)
and (c) above, policies and procedures to permit such services to be pre-approved by other means, such as by action of a designated member or members of the Committee, subject to subsequent Committee review or oversight.
(e) To consider whether the non-audit services provided by the UBS Funds’ independent auditor to the UBS Funds investment advisor or any advisor affiliate that provides on-going services to the UBS Funds, which services were not pre-approved by the Committee, are compatible with maintaining the auditors’ independence.
(e) (2) Services approved pursuant to paragraph (c)(7)(i)(C) of Rule 2-01 of Regulation S-X:
Audit-Related Fees:
There were no amounts that were approved by the audit committee pursuant to the de minimis exception for the fiscal years ended June 30, 2015 and June 30, 2014 on behalf of the registrant.
There were no amounts that were required to be approved by the audit committee pursuant to the de minimis exception for the fiscal years ended June 30, 2015 and June 30, 2014 on behalf of the registrant’s service providers that relate directly to the operations and financial reporting of the registrant.
Tax Fees:
There were no amounts that were approved by the audit committee pursuant to the de minimis exception for the fiscal years ended June 30, 2015 and June 30, 2014 on behalf of the registrant.
There were no amounts that were required to be approved by the audit committee pursuant to the de minimis exception for the fiscal years ended June 30, 2015 and June 30, 2014 on behalf of the registrant’s service providers that relate directly to the operations and financial reporting of the registrant.
All Other Fees:
There were no amounts that were approved by the audit committee pursuant to the de minimis exception for the fiscal years ended June 30, 2015 and June 30, 2014 on behalf of the registrant.
There were no amounts that were required to be approved by the audit committee pursuant to the de minimis exception for the fiscal years ended June 30, 2015 and June 30, 2014 on behalf of the registrant’s service providers that relate directly to the operations and financial reporting of the registrant.
(f) For the fiscal year ended June 30, 2015, if greater than 50%, specify the percentage of hours spent on the audit of the registrant’s financial statements for the most recent fiscal year that were attributed to work performed by persons who are not full-time, permanent employees of E&Y. According to E&Y, such amount was below 50%; therefore disclosure item not applicable to this filing.
(g) For the fiscal years ended June 30, 2015 and June 30, 2014, the aggregate fees billed by E&Y of $381,101 and $325,513, respectively, for non-audit services rendered on behalf of the
registrant (“covered”), its investment adviser (not including any sub-adviser whose role is primarily portfolio management and is subcontracted with or overseen by another investment adviser) and any entity controlling, controlled by, or under common control with the adviser (“non-covered”) that provides ongoing services to the registrant for each of the last two fiscal years of the registrant is shown in the table below:
|
|
|
2015 |
|
2014 |
| ||
|
Covered Services |
|
$ |
161,874 |
|
$ |
147,173 |
|
|
Non-Covered Services |
|
$ |
219,227 |
|
$ |
178,340 |
|
(h) The registrant’s audit committee has considered whether the provision of non-audit services that were rendered to the registrant’s investment adviser (not including any sub-adviser whose role is primarily portfolio management and is subcontracted with or overseen by another investment adviser), and any entity controlling, controlled by, or under common control with the investment adviser that provides ongoing services to the registrant that were not pre-approved pursuant to paragraph (c)(7)(ii) of Rule 2-01 of Regulation S-X is compatible with maintaining the principal accountant’s independence.
Item 5. Audit Committee of Listed Registrants.
Not applicable to the registrant.
Item 6. Schedule of Investments.
(a) Included as part of the report to shareholders filed under Item 1 of this form.
(b) Not applicable.
Item 7. Disclosure of Proxy Voting Policies and Procedures for Closed-End Management Investment Companies.
Not applicable to the registrant.
Item 8. Portfolio Managers of Closed-End Management Investment Companies.
Not applicable to the registrant.
Item 9. Purchases of Equity Securities by Closed-End Management Investment Company and Affiliated Purchasers.
Not applicable to the registrant.
Item 10. Submission of Matters to a Vote of Security Holders.
The Nominating Committee will consider nominees recommended by Qualifying Fund Shareholders if an Independent Trustee vacancy on the Board occurs. A Qualifying Fund Shareholder is a shareholder that:
(i) owns of record, or beneficially through a financial intermediary, 1/2 of 1% or more of the Trust’s outstanding shares and (ii) has been a shareholder of at least 1/2 of 1% of the Trust’s total outstanding shares for 12 months or more prior to submitting the recommendation to the Nominating Committee. In order to recommend a nominee, a Qualifying Fund Shareholder should send a letter to the chairperson of the Nominating Committee, Ms. Adela Cepeda, care of Mark Kemper, the Secretary of the UBS Funds at UBS Global Asset Management, One North Wacker Drive, Chicago, Illinois 60606, and indicate on the envelope “Nominating Committee.” The Qualifying Fund Shareholder’s letter should include: (i) the name and address of the Qualifying Fund Shareholder making the recommendation; (ii) the number of shares of each class and series of shares of the Trust which are owned of record and beneficially by such Qualifying Fund Shareholder and the length of time that such shares have been so owned by the Qualifying Fund Shareholder; (iii) a description of all arrangements and understandings between such Qualifying Fund Shareholder and any other person or persons (naming such person or persons) pursuant to which the recommendation is being made; (iv) the name and address of the nominee; and (v) the nominee’s resume or curriculum vitae. The Qualifying Fund Shareholder’s letter must be accompanied by a written consent of the individual to stand for election if nominated for the Board and to serve if elected by shareholders.
Item 11. Controls and Procedures.
(a) The registrant’s principal executive officer and principal financial officer have concluded that the registrant’s disclosure controls and procedures (as defined in Rule 30a-3(c) under the Investment Company Act of 1940, as amended) are effective based on their evaluation of these controls and procedures as of a date within 90 days of the filing date of this document.
(b) The registrant’s principal executive officer and principal financial officer are aware of no changes in the registrant’s internal control over financial reporting that occurred during the registrant’s most recent fiscal half-year that has materially affected, or is reasonably likely to materially affect, the registrant’s internal control over financial reporting.
Item 12. Exhibits.
(a) (1) Code of Ethics as required pursuant to Section 406 of the Sarbanes-Oxley Act of 2002 (and designated by registrant as a “Code of Conduct”) is filed herewith.
(a) (2) Certifications of principal executive officer and principal financial officer pursuant to Section 302 of the Sarbanes-Oxley Act of 2002 is attached hereto as Exhibit EX-99.CERT.
(a) (3) Written solicitation to purchase securities under Rule 23c-1 under the Investment Company Act of 1940 sent or given during the period covered by the report by or on behalf of the registrant to 10 or more persons — not applicable to the registrant.
(b) Certifications of principal executive officer and principal financial officer pursuant to Section 906 of the Sarbanes-Oxley Act of 2002 is attached hereto as Exhibit EX-99.906.CERT.
(c) Iran related activities disclosure pursuant to Section 13(r) of the Securities Exchange Act of 1934 is filed herewith.
SIGNATURES
Pursuant to the requirements of the Securities Exchange Act of 1934 and the Investment Company Act of 1940, the registrant has duly caused this report to be signed on its behalf by the undersigned, thereunto duly authorized.
|
The UBS Funds |
| |
|
|
| |
|
By: |
/s/ Mark E. Carver |
|
|
|
Mark E. Carver |
|
|
|
President |
|
|
|
| |
|
Date: |
September 8, 2015 |
|
|
|
|
|
|
|
| |
|
Pursuant to the requirements of the Securities Exchange Act of 1934 and the Investment Company Act of 1940, this report has been signed below by the following persons on behalf of the registrant and in the capacities and on the dates indicated. | ||
|
|
| |
|
|
| |
|
By: |
/s/ Mark E. Carver |
|
|
|
Mark E. Carver |
|
|
|
President |
|
|
|
| |
|
Date: |
September 8, 2015 |
|
|
|
|
|
|
By: |
/s/ Thomas Disbrow |
|
|
|
Thomas Disbrow |
|
|
|
Vice President, Treasurer and Principal Accounting Officer |
|
|
|
| |
|
Date: |
September 8, 2015 |
|