| ITEM 1. | REPORTS TO STOCKHOLDERS. |
 |
Closed-End Funds |
February 29, 2024 |
Nuveen Municipal
Closed-End
Funds | Nuveen Arizona Quality Municipal Income Fund | NAZ |
|||
| Nuveen California Quality Municipal Income Fund | NAC |
|||
| Nuveen California AMT-Free Quality Municipal Income Fund |
NKX |
|||
| Nuveen California Municipal Value Fund | NCA |
|||
| Nuveen California Select Tax-Free Income Portfolio |
NXC |
|||

Table
of Contents
Important Notices |
3 | |||
Portfolio Managers’ Comments |
4 | |||
Fund Leverage |
10 | |||
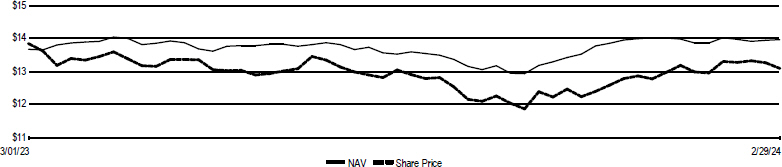
Common Share Information |
11 | |||
About the Funds’ Benchmarks |
13 | |||
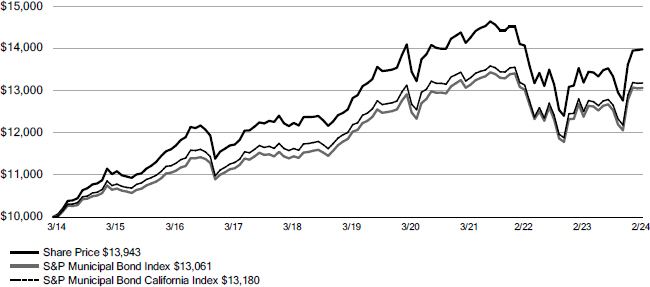
Performance Overview and Holding Summaries |
14 | |||
Report of Independent Registered Public Accounting Firm |
25 | |||
Portfolios of Investments |
27 | |||
Statement of Assets and Liabilities |
72 | |||
Statement of Operations |
73 | |||
Statement of Changes in Net Assets |
74 | |||
Statement of Cash Flows |
77 | |||
Financial Highlights |
78 | |||
Notes to Financial Statements |
83 | |||
Shareholder Update |
97 | |||
Important Tax Information |
126 | |||
Shareholder Meeting Report |
127 | |||
Additional Fund Information |
128 | |||
Glossary of Terms Used in this Report |
129 | |||
Board Members & Officers |
130 | |||
2
Important Notices
Portfolio Manager Update for NAZ
Effective October 13, 2023, Stephen Candido has been added as a portfolio manager. There were no other changes to the portfolio management of the Fund during the reporting period.
Portfolio Manager Update for NAC, NKX, NCA and NXC
Effective October 13, 2023, Kristen DeJong has been added as a portfolio manager. There were no other changes to the portfolio management of the Funds during the reporting period.
NAZ, NAC, NKX and NCA - Change in Fiscal and Tax Year Ends
On February 28, 2024, the Funds’ Board of Trustees (the “Board”) approved that the Funds’ fiscal and tax year ends (collectively, “fiscal year end”) be changed from February 28/29 to August 31. As a result, effective March 1, 2024, the Funds began to adhere to the fiscal reporting and regulatory filing schedule required by an August 31 fiscal year end and the next annual report for the Funds will be for the period from March 1, 2024 through August 31, 2024.
3
Portfolio Managers’
Comments
Nuveen Arizona Quality Municipal Income Fund (NAZ)
Nuveen California Quality Municipal Income Fund (NAC)
Nuveen California
ATM-Free
Quality Municipal Income Fund (NKX) Nuveen California Municipal Value Fund (NCA)
Nuveen California Select
Tax-Free
Income Portfolio (NXC) These Funds feature portfolio management by Nuveen Asset Management, LLC (NAM), an affiliate of Nuveen Fund Advisors, LLC, the Funds’ investment adviser. The portfolio managers for the Nuveen Arizona Quality Municipal Income Fund are Michael Hamilton and Stephen Candido, CFA. The portfolio managers for the Nuveen California Quality Municipal Income Fund (NAC), Nuveen California
AMT-Free
Quality Municipal Income Fund (NKX), Nuveen California Municipal Value Fund (NCA), and Nuveen California Select Tax-Free
Income Portfolio (NXC) are Scott Romans, PhD and Kristen DeJong, CFA.Effective October 13, 2023, Stephen Candido was added as a portfolio manager of NAZ. Michael Hamilton continues to serve as a portfolio manager of NAZ. Effective October 13, 2023, Kristen DeJong was added as a portfolio manager for NAC, NKX, NCA and NXC. Scott Romans continues to serve as a portfolio manager for NAC, NKX, NCA and NXC.
Here, the Funds’ portfolio managers review U.S. economic and market conditions, key investment strategies and the performance of the Funds for the twelve-month reporting period ended February 29, 2024. For more information on the Funds’ investment objectives and policies, please refer to the Shareholder Update section at the end of the report.
What factors affected the U.S. economy and market conditions during the twelve-month annual reporting period ended February 29, 2024?
The U.S. economy performed better than expected despite persistent inflationary pressure and elevated interest rates during the twelve-month period ended February 29, 2024. Gross domestic product rose at an annualized rate of 3.4% in the fourth quarter of 2023, after increasing at an annualized rate of 4.9% in third quarter of 2023, according to the U.S. Bureau of Economic Analysis second estimate. In 2023 as a whole, GDP was up 2.5% (from the 2022 annual level to the 2023 annual level), compared with an increase of 1.9% in 2022. During the reporting period, price pressures eased in comparison to 2022 given normalization in supply chains, falling energy prices and aggressive measures by the U.S. Federal Reserve (Fed) and other global central banks to tighten financial conditions and slow demand in their economies. Nevertheless, during the reporting period, inflation levels remained higher than central banks’ target levels.
The Fed raised its target fed funds rate three times during the reporting period, bringing it to a range of 5.25% to 5.50% as of July 2023 and voting to hold it at that level at its subsequent meetings in 2023 and 2024. Early in the reporting period, the Fed’s activity led to significant volatility in bond and stock markets, given the uncertainty of how rising interest rates would affect the economy. One of the most highly visible impacts occurred in the U.S. regional banking sector in March 2023, when Silicon Valley Bank, Signature Bank, First Republic Bank and Silvergate Bank failed. In the same month, Swiss bank UBS agreed to buy Credit Suisse, which was considered vulnerable in the current environment. The Fed’s monetary tightening policy also contributed to an increase in the U.S. dollar’s value relative to major world currencies, which acts as a headwind to the profits of international companies and U.S. domestic companies with overseas earnings.
During the reporting period, elevated inflation and higher borrowing costs weighed on some segments of the economy, including the real estate market. Consumer spending, however, has remained more resilient than expected, in part because of a still-strong labor market, another key gauge of the economy’s health. As of February 2024, the unemployment rate was 3.9%, near its
pre-pandemic
low, with monthly job growth continuing to moderate from the faster pace earlier in the post-pandemic recovery. The strong labor market and wage gains helped the U.S. economy during the reporting period, even as the Fed sought to soften job growth to help curb inflation pressures. During the reporting period, investors also continued to monitor government funding and deficits. The U.S. government avoided a default scenario after approving an increase to the debt ceiling limit in June 2023. At the same time, the potential for a government shutdown loomed but was ultimately avoided with funding resolutions passed in September and November 2023 and February 2024. Notably, in August 2023, ratings agency Fitch downgraded U.S. debt from AAA to AA+ based on concerns about the U.S.’s growing fiscal debt and reduced confidence in fiscal management
The broad municipal bond market was impacted by interest rate volatility and economic uncertainty during the reporting period. Municipal yields fell across most of the maturity spectrum, with a very slight increase in
30-year
maturities. Much of the decline 4
in yields was concentrated in November-December 2023, when Treasury markets moved sharply to reassess the timing of potential Fed rate cuts and municipal yields followed in kind. While municipal bonds continued to exhibit relatively strong credit fundamentals, the change in yields was the dominant driver of municipal market performance, overpowering the impact of credit spread movements in this reporting period.
What were the economic and market environments in Arizona and California during the twelve-month reporting period ended February 29, 2024?
Arizona’s economy is showing mixed performance, with gains in health care and government but lagging performance in finance. Growth in the labor force outpaced job creation, causing the unemployment rate to increase. As of February 2024, Arizona’s unemployment rate was 4.1%, compared to the national rate of 3.9%. In May 2023, Governor Katie Hobbs signed the state’s $17.8 billion general fund budget for fiscal year 2024 (July 1, 2023, to June 30, 2024), which represented a slight decrease from fiscal year 2023. The budget makes a $250 million deposit into the rainy day fund and focuses on investments in education, water and affordable housing. The state projects it will end fiscal year 2024 with $1.8 billion in the rainy day fund. Arizona does not issue general obligation bonds per its constitution but does issue certificates of participation and lease revenue bonds. As of February 2024, S&P and Moody’s held Arizona’s issuer credit rating at AA and Aa1, respectively, with a stable outlook. Arizona municipal bond new issuance totaled $4.9 billion for the twelve-month period ended February 29, 2024, a 17.5% decrease from the same period a year earlier.
California’s $3.6 trillion economy is the largest in the United States, representing 14.1% of U.S. gross domestic product, and on a standalone basis would be the fifth largest economy in the world. The state’s economy is diverse and generally mirrors the nation’s economic composition but with a higher concentration in the information technology sector. The state’s unemployment rate was
5.3% as of February 2024, compared to the national rate of 3.9%. The state’s general fund budget for fiscal year 2024 (July 1, 2023, to June 30, 2024) totals $225.9 billion, which is 3.6% lower than the revised fiscal year 2023 budget. The fiscal year 2024 budget balanced a $31.7 billion shortfall, driven by “a declining stock market and persistently high inflation experienced in 2022, rising interest rates and job losses in high wage sectors” which have resulted in slower growth in revenues. California’s proposed budget of $208.7 billion for fiscal year 2024-2025 (July 1, 2024, to June 30, 2025) represents a 9.6% decrease over the prior year. The proposed budget projects a $37.9 billion budget gap because of substantial decline in the stock market that lowered revenues in 2022 and delayed income tax collections caused by storms in 2022. The state has released plans to address the deficit that include use of reserves, expenditure cuts, internal borrowing, delay, fund shifts and deferrals. As of February 2024, S&P affirmed its
AA-
rating on California general obligation (GO) debt but changed its outlook to stable from positive, and Moody’s rates the state’s GO Aa2 with a stable outlook. California municipal bond supply totaled $54.5 billion for the twelve-month period ended February 29, 2024, an 11.6% increase from the same period a year earlier. Nuveen Arizona Quality Municipal Income Fund (NAZ)
What key strategies were used to manage the Fund during the twelve-month reporting period ended February 29, 2024?
The Fund seeks to provide current income exempt from both regular federal and Arizona state income taxes by investing primarily in a portfolio of municipal obligations issued by state and local government authorities and its state’s individual income taxes or certain U.S. territories. To the extent that the Fund invests in bonds of municipal issuers located in other states, it may have income that is not exempt from state personal income tax. The Fund uses leverage. Leverage is discussed in more detail later in the Fund Leverage section of this report.
During the reporting period, the Fund’s trading activity remained focused on pursuing its investment objective. The higher yield environment during this reporting period was favorable for the Fund to reset embedded yields higher in its portfolio, primarily by executing on
tax-loss
swap opportunities. This strategy involves selling depreciated bonds with lower embedded yields to reinvest in similarly structured, higher income-producing bonds to support the Fund’s income earnings and capture tax efficiencies. During the reporting period, the Fund employed inverse floating rate securities, which are the residual interest in a tender option bond (TOB) trust, and are sometimes referred to as “inverse floaters,” for a variety of reasons, including duration management, income and total return enhancement. The Fund closed its investments in inverse floating rate securities by the end of the reporting period.
5
Portfolio Managers’ Comments
(continued)
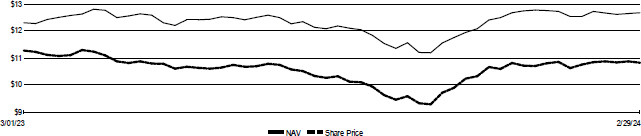
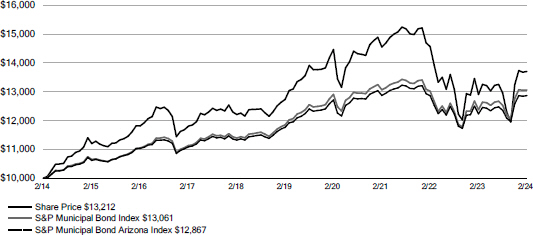
How did the Fund perform during the twelve-month reporting period ended February 29, 2024?
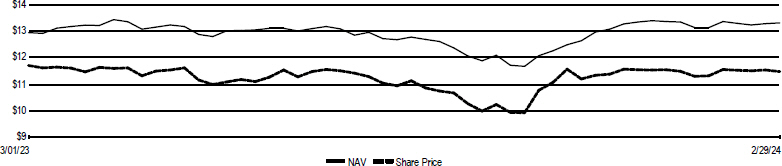
For the twelve months ended February 29, 2024, the Nuveen Arizona Quality Municipal Income Fund (NAZ) outperformed the S&P Municipal Bond Arizona Index. For the purposes of this Performance Commentary, references to relative performance are in comparison to the S&P Municipal Bond Arizona Index.
The Fund’s longer-duration positioning relative to its benchmark was the primary contributor to relative performance during the reporting period. The Fund maintained overweight allocations to longer-duration bonds, which generally performed well as interest rates fell in late 2023. Additionally, the Fund benefited from its overweight allocations to A rated bonds and to bonds rated below investment grade, including
non-rated
bonds. In addition, the Fund’s use of leverage through its issuance of preferred shares and investment in inverse floating rate securities contributed to relative performance during the reporting period. Leverage is discussed in more detail later in the Fund Leverage section of this report. Partially offsetting NAZ’s outperformance was its selection within the incremental tax sector. NAZ’s incremental tax sector holdings were generally shorter duration relative to the index, which detracted as shorter duration bonds lagged during the reporting period.
Nuveen California Quality Municipal Income Fund (NAC)
What key strategies were used to manage the Fund during the twelve-month reporting period ended February 29, 2024?
The Fund seeks to provide current income exempt from both regular federal and California state income taxes by investing primarily in a portfolio of municipal obligations issued by state and local government authorities and its state’s individual income taxes or certain U.S. territories. To the extent that the Fund invests in bonds of municipal issuers located in other states, it may have income that is not exempt from state personal income tax. The Fund uses leverage. Leverage is discussed in more detail later in the Fund Leverage section of this report.
During the reporting period, the Fund’s trading activity remained focused on pursuing its investment objective. The higher yield environment during this reporting period was favorable for the Fund to reset embedded yields higher in its portfolio, primarily by executing on
tax-loss
swap opportunities. This strategy involves selling depreciated bonds with lower embedded yields to reinvest in similarly structured, higher income-producing bonds to support the Fund’s income earnings and capture tax efficiencies. The higher interest rate environment during the reporting period also provided an opportunity for the portfolio management team to buy lower rated credits in the Fund at wider-than-average credit spreads and with incrementally higher yields. These new purchases were funded by selling higher quality, lower yielding paper that had been bought when prevailing interest rates were lower.
As of February 29, 2024, the Fund continued to use inverse floating rate securities. The Fund employs inverse floating rate securities, which are the residual interest in a tender option bond (TOB) trust, and are sometimes referred to as “inverse floaters,” for a variety of reasons, including duration management, income and total return enhancement.
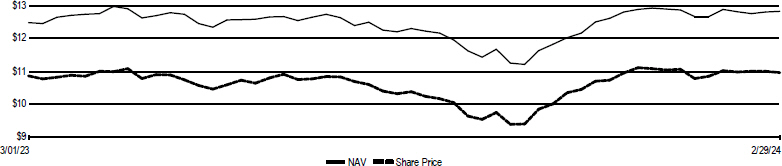
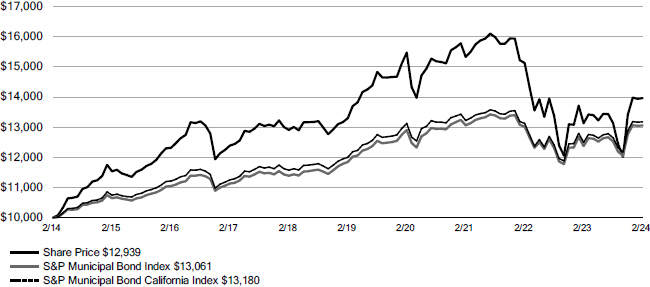
How did the Fund perform during the twelve-month reporting period ended February 29, 2024?
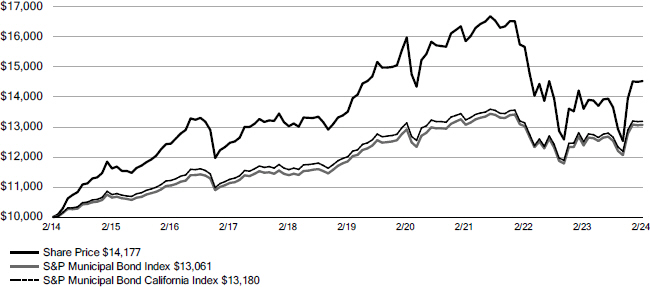
For the twelve months ended February 29, 2024, the Nuveen California Quality Municipal Income Fund (NAC) outperformed the S&P Municipal Bond California Index. For the purposes of this Performance Commentary, references to relative performance are in comparison to the S&P Municipal Bond California Index.
The Fund’s longer-duration positioning relative to its benchmark was the primary contributor to relative performance during the reporting period. The Fund maintained overweight allocations to longer-duration bonds, which generally performed well as interest rates fell in late 2023. The Fund’s overweight allocations to A, BBB and below investment grade rated debt and underweight allocations to AAA and AA rated paper also contributed to relative performance. In addition, the Fund’s use of leverage through inverse floating rate securities and the issuance of preferred shares contributed to relative performance during the reporting period. Leverage is discussed in more detail later in the Fund Leverage section of this report.
Partially offsetting the Fund’s outperformance were underweights to the tobacco, toll roads and higher education sectors, which were among the market’s stronger performers. In addition, an overweight to the public power sector, which lagged, detracted from relative performance.
6
Nuveen California
AMT-Free
Quality Municipal Income Fund (NKX)What key strategies were used to manage the Fund during the twelve-month reporting period ended February 29, 2024?
The Fund seeks to provide current income exempt from regular federal income taxes, California state income taxes and the alternative minimum tax (“AMT”) applicable to individuals, by investing primarily in a portfolio of municipal obligations issued by state and local government authorities and its state’s individual income taxes or certain U.S. territories. To the extent that the Fund invests in bonds of municipal issuers located in other states, it may have income that is not exempt from state personal income tax. The Fund uses leverage. Leverage is discussed in more detail later in the Fund Leverage section of this report.
During the reporting period, the Fund’s trading activity remained focused on pursuing its investment objective. The higher yield environment during this reporting period was favorable for the Fund to reset embedded yields higher in its portfolio, primarily by executing on
tax-loss
swap opportunities. This strategy involves selling depreciated bonds with lower embedded yields to reinvest in similarly structured, higher income-producing bonds to support the Fund’s income earnings and capture tax efficiencies. The higher interest rate environment during the reporting period also provided an opportunity for the portfolio management team to buy lower rated credits in the Fund at wider-than-average credit spreads and with incrementally higher yields. These new purchases were funded by selling higher quality, lower yielding paper that had been bought when prevailing interest rates were lower.
As of February 29, 2024, the Fund continued to use inverse floating rate securities. The Fund employs inverse floating rate securities, which are the residual interest in a tender option bond (TOB) trust, and are sometimes referred to as “inverse floaters,” for a variety of reasons, including duration management, income and total return enhancement.
How did the Fund perform during the twelve-month reporting period ended February 29, 2024?
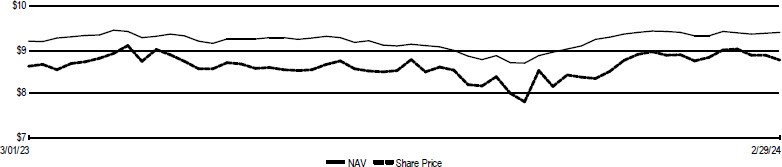
For the twelve months ended February 29, 2024, the Nuveen California
ATM-Free
Quality Municipal Income Fund (NKX) outperformed the S&P Municipal Bond California Index. For the purposes of this Performance Commentary, references to relative performance are in comparison to the S&P Municipal Bond California Index. The Fund’s longer-duration positioning relative to its benchmark was the primary contributor to relative performance during the reporting period. The Fund maintained overweight allocations to longer-duration bonds, which generally performed well as interest rates fell in late 2023. In addition, the Fund’s use of leverage through inverse floating rate securities and the issuance of preferred shares contributed to relative performance during the reporting period. Leverage is discussed in more detail later in the Fund Leverage section of this report.
Partially offsetting the Fund’s outperformance were underweights to the tobacco, toll roads and higher education sectors, which were among the market’s stronger performers. In addition, an overweight to the public power sector, which lagged, detracted from relative performance.
Nuveen California Municipal Value Fund (NCA)
What key strategies were used to manage the Fund during the twelve-month reporting period ended February 29, 2024?
The Fund seeks to provide current income exempt from both regular federal and California state income taxes by investing primarily in a portfolio of municipal obligations issued by state and local government authorities and its state’s individual income taxes or certain U.S. territories. To the extent that the Fund invests in bonds of municipal issuers located in other states, it may have income that is not exempt from state personal income tax. The Fund may use tender option bonds to implement its investment strategies more efficiently, which may create up to 10% effective leverage. NCA had no effective leverage during the reporting period.
During the reporting period, the Fund’s trading activity remained focused on pursuing its investment objective. The higher yield environment during this reporting period was favorable for the Fund to reset embedded yields higher in its portfolio, primarily by executing on
tax-loss
swap opportunities. This strategy involves selling depreciated bonds with lower embedded yields to reinvest in similarly structured, higher income-producing bonds to support the Fund’s income earnings and capture tax efficiencies. The higher interest rate environment during the reporting period also provided an opportunity for the portfolio management team to buy lower rated credits in the Fund at wider-than-average credit spreads and with incrementally higher yields. These new
7
Portfolio Managers’ Comments
(continued)
purchases were funded by selling higher quality, lower yielding paper that had been bought when prevailing interest rates were lower.
How did the Fund perform during the twelve-month reporting period ended February 29, 2024?
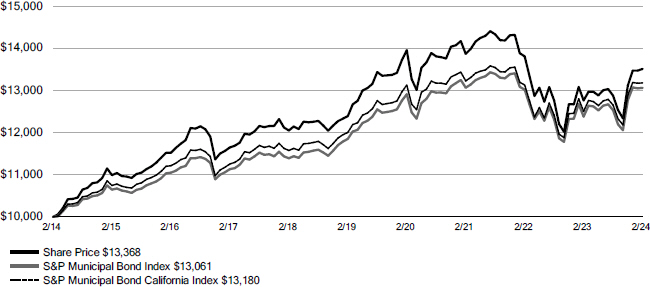
For the twelve months ended February 29, 2024, the Nuveen California Municipal Value Fund (NCA) outperformed the S&P Municipal Bond California Index. For the purposes of this Performance Commentary, references to relative performance are in comparison to the S&P Municipal Bond California Index.
The Fund’s longer-duration positioning relative to its benchmark was the primary contributor to relative performance during the reporting period. The Fund maintained overweight allocations to longer-duration bonds, which generally performed well as interest rates fell in late 2023. The Fund’s overweight allocations to A, BBB and below investment grade rated debt and underweight allocations to AAA and AA rated paper added to relative performance.
Partially offsetting the Fund’s outperformance were underweights to the tobacco, toll roads and higher education sectors, which were among the market’s stronger performers. In addition, an overweight to the public power sector, which lagged, detracted from relative performance.
Nuveen California Select
Tax-Free
Income Portfolio (NXC)What key strategies were used to manage the Fund during the twelve-month reporting period ended February 29, 2024?
The Fund seeks to provide current income exempt from both regular federal and California state income taxes by investing primarily in a portfolio of municipal obligations issued by state and local government authorities and its state’s individual income taxes or certain U.S. territories. To the extent that the Fund invests in bonds of municipal issuers located in other states, it may have income that is not exempt from state personal income tax. The Fund may use tender option bonds to implement its investment strategies more efficiently, which may create up to 10% effective leverage. NXC had no effective leverage during the reporting period.
During the reporting period, the Fund’s trading activity remained focused on pursuing its investment objective. The higher yield environment during this reporting period was favorable for the Fund to reset embedded yields higher in its portfolio, primarily by executing on
tax-loss
swap opportunities. This strategy involves selling depreciated bonds with lower embedded yields to reinvest in similarly structured, higher income-producing bonds to support the Fund’s income earnings and capture tax efficiencies. The higher interest rate environment during the reporting period also provided an opportunity for the portfolio management team to buy lower rated credits in the Fund at wider-than-average credit spreads and with incrementally higher yields. These new purchases were funded by selling higher quality, lower yielding paper that had been bought when prevailing interest rates were lower.
How did the Fund perform during the twelve-month reporting period ended February 29, 2024?
For the twelve months ended February 29, 2024, the Nuveen California Select
Tax-Free
Income Portfolio (NXC) outperformed the S&P Municipal Bond California Index. For the purposes of this Performance Commentary, references to relative performance are in comparison to the S&P Municipal Bond California Index. The Fund’s longer-duration positioning relative to its benchmark was the primary contributor to relative performance during the reporting period. The Fund maintained overweight allocations to longer-duration bonds, which generally performed well as interest rates fell in late 2023. The Fund’s overweight allocations to A, BBB and below investment grade rated debt and underweight allocations to AAA and AA rated paper also added to relative performance.
Partially offsetting the Fund’s outperformance were underweights to the tobacco, toll roads and higher education sectors, which were among the market’s stronger performers. In addition, an overweight to the public power sector, which lagged, detracted from relative performance.
8
This material is not intended to be a recommendation or investment advice, does not constitute a solicitation to buy, sell or hold a security or an investment strategy, and is not provided in a fiduciary capacity. The information provided does not take into account the specific objectives or circumstances of any particular investor, or suggest any specific course of action. Investment decisions should be made based on an investor’s objectives and circumstances and in consultation with his or her advisors.
Certain statements in this report are forward-looking statements. Discussions of specific investments are for illustration only and are not intended as recommendations of individual investments. The forward-looking statements and other views expressed herein are those of the portfolio manager as of the date of this report. Actual future results or occurrences may differ significantly from those anticipated in any forward-looking statements, and the views expressed herein are subject to change at any time, due to numerous market and other factors. The Fund disclaims any obligation to update publicly or revise any forward-looking statements or views expressed herein.
For financial reporting purposes, the ratings disclosed are the highest rating given by one of the following national rating agencies: Standard
& Poor’s Group (S&P), Moody’s Investors Service, Inc. (Moody’s) or Fitch, Inc. (Fitch). This treatment of split-rated securities may differ from that used for other purposes, such as for Fund investment policies. Credit ratings are subject to change. AAA, AA, A and BBB are investment grade ratings, while BB, B, CCC, CC, C and D are below investment grade ratings. Holdings designated N/R are not rated by these national rating agencies.
Bond insurance guarantees only the payment of principal and interest on the bond when due, and not the value of the bonds themselves, which will fluctuate with the bond market and the financial success of the issuer and the insurer. Insurance relates specifically to the bonds in the portfolio and not to the share prices of a Fund. No representation is made as to the insurers’ ability to meet their commitments.
Refer to the Glossary of Terms Used in this Report for further definition of the terms used within this section.
9
Fund Leverage
IMPACT OF THE FUNDS’ LEVERAGE STRATEGY ON PERFORMANCE
One important factor impacting the returns of the Funds’ common shares relative to their comparative benchmarks was the Funds’ use of leverage through their issuance of preferred shares and/or investments in inverse floating rate securities, which represent leveraged investments in underlying bonds. The Funds use leverage because our research has shown that, over time, leveraging provides opportunities for additional income. The opportunity arises when short-term rates that a Fund pays on its leveraging instruments are lower than the interest the Fund earns on its portfolio of long-term bonds that it has bought with the proceeds of that leverage.
However, use of leverage can expose Fund common shares to additional price volatility. When a Fund uses leverage, the Fund’s common shares will experience a greater increase in their net asset value if the securities acquired through the use of leverage increase in value, but will also experience a correspondingly larger decline in their net asset value if the securities acquired through leverage decline in value. All this will make the shares’ total return performance more variable over time.
In addition, common share income in levered funds will typically decrease in comparison to unlevered funds when short-term interest rates increase and increase when short-term interest rates decrease. In recent quarters, fund leverage expenses have generally tracked the overall movement of short-term interest rates. While fund leverage expenses are higher than their prior year lows, leverage nevertheless continues to provide the opportunity for incremental common share income, particularly over longer-term periods.
NAZ, NAC and NKX’s use of leverage contributed to relative performance over this reporting period.
As of February 29, 2024, the Funds’ percentages of leverage are as shown in the accompanying table.
NAZ |
NAC |
NKX |
NCA |
NXC |
||||||||||||||||
Effective Leverage * |
37.54% | 39.80% | 40.48% | 0.00% | 0.00% | |||||||||||||||
Regulatory Leverage * |
37.54% | 38.92% | 38.54% | 0.00% | 0.00% | |||||||||||||||
* |
Effective Leverage is a Fund’s effective economic leverage, and includes both regulatory leverage and the leverage effects of certain derivative and other investments in a Fund’s portfolio that increase the Fund’s investment exposure. Currently, the leverage effects of Tender Option Bond (TOB) inverse floater holdings are included in effective leverage values, in addition to any regulatory leverage. Regulatory leverage consists of preferred shares issued or borrowings of a Fund. Both of these are part of a Fund’s capital structure. A Fund, however, may from time to time borrow on a typically transient basis in connection with its day-to-day |
THE FUNDS’ REGULATORY LEVERAGE
As of February 29, 2024, the following Funds have issued and outstanding preferred shares as shown in the accompanying table.
Variable Rate Preferred* |
Variable Rate Remarketed Preferred** |
|||||||||||
Fund |
Shares Issued at Liquidation Preference |
Shares Issued at Liquidation Preference |
Total |
|||||||||
NAZ |
$88,300,000 | $ - | $88,300,000 | |||||||||
NAC |
$684,900,000 | $497,900,000 | $1,182,800,000 | |||||||||
NKX |
$ - | $397,100,000 | $397,100,000 | |||||||||
* Preferred shares of the Fund featuring a floating rate dividend based on a predetermined formula or spread to an index rate. Includes the following preferred shares AMTP, iMTP,
MFP-VRM
and VRDP in Special Rate Mode, where applicable. See Notes to Financial Statements for further details. ** Preferred shares of the Fund featuring floating rate dividends set by a remarketing agent via a regular remarketing. Includes the following preferred shares VRDP not in Special Rate Mode,
MFP-VRRM
and MFP-VRDM,
where applicable. See Notes to Financial Statements for further details. Refer to Notes to Financial Statements for further details on preferred shares and each Fund’s respective transactions.
10
Common Share Information
COMMON SHARE DISTRIBUTION INFORMATION
The following information regarding the Funds’ distributions is current as of February 29, 2024. Each Fund’s distribution levels may vary over time based on each Fund’s investment activity and portfolio investment value changes.
During the current reporting period, each Fund’s distributions to common shareholders were as shown in the accompanying table.
Per Common Share Amounts |
||||||||||||||||||||
Monthly Distributions (Ex-Dividend Date) |
NAZ |
NAC |
NKX |
NCA |
NXC |
|||||||||||||||
March |
$ | 0.0325 | $ | 0.0360 | $ | 0.0415 | $ | 0.0290 | $ | 0.0435 | ||||||||||
April |
0.0325 | 0.0360 | 0.0415 | 0.0290 | 0.0435 | |||||||||||||||
May |
0.0325 | 0.0360 | 0.0415 | 0.0290 | 0.0435 | |||||||||||||||
June |
0.0325 | 0.0360 | 0.0415 | 0.0290 | 0.0435 | |||||||||||||||
July |
0.0310 | 0.0360 | 0.0415 | 0.0290 | 0.0435 | |||||||||||||||
August |
0.0310 | 0.0360 | 0.0415 | 0.0290 | 0.0435 | |||||||||||||||
September |
0.0310 | 0.0360 | 0.0415 | 0.0290 | 0.0435 | |||||||||||||||
October |
0.0310 | 0.0360 | 0.0415 | 0.0290 | 0.0435 | |||||||||||||||
November |
0.0350 | 0.0435 | 0.0455 | 0.0290 | 0.0435 | |||||||||||||||
December |
0.0350 | 0.0435 | 0.0455 | 0.0290 | 0.0455 | |||||||||||||||
January |
0.0350 | 0.0435 | 0.0455 | 0.0290 | 0.0455 | |||||||||||||||
February |
0.0350 | 0.0435 | 0.0455 | 0.0290 | 0.0455 | |||||||||||||||
Total Distributions from Net Investment Income |
$ | 0.3940 | $ | 0.4620 | $ | 0.5140 | $ | 0.3480 | $ | 0.5280 | ||||||||||
Yields |
NAZ |
NAC |
NKX |
NCA |
NXC |
|||||||||||||||
Market Yield 1 |
3.88% | 4.76% | 4.76% | 3.97% | 4.16% | |||||||||||||||
Taxable-Equivalent Yield 1 |
6.84% | 10.33% | 10.36% | 8.63% | 9.06% | |||||||||||||||