Exhibit
| |
ITEM 8. | FINANCIAL STATEMENTS AND SUPPLEMENTARY DATA |
FIRST DATA CORPORATION
INDEX TO FINANCIAL STATEMENTS
COVERED BY REPORT OF INDEPENDENT REGISTERED PUBLIC ACCOUNTING FIRM
|
| |
First Data Corporation and Subsidiaries: | |
Consolidated Financial Statements: | |
| |
| |
| |
| |
| |
| |
| |
Schedules: | |
| |
Report of Independent Registered Public Accounting Firm
The Board of Directors and Stockholders of First Data Corporation
Opinion on the Financial Statements
We have audited the accompanying consolidated balance sheets of First Data Corporation as of December 31, 2017 and 2016, and the related consolidated statements of operations, comprehensive income (loss), cash flows and equity for each of the three years in the period ended December 31, 2017, and the related notes and the financial statement schedule of valuation and qualifying accounts (collectively referred to as the “financial statements”). In our opinion, the financial statements present fairly, in all material respects, the consolidated financial position of the Company at December 31, 2017 and 2016, and the consolidated results of its operations and its cash flows for each of the three years in the period ended December 31, 2017, in conformity with U.S. generally accepted accounting principles.
We also have audited, in accordance with the standards of the Public Company Accounting Oversight Board (United States) (PCAOB), the Company's internal control over financial reporting as of December 31, 2017, based on criteria established in Internal Control-Integrated Framework issued by the Committee of Sponsoring Organizations of the Treadway Commission (2013 framework), and our report dated February 20, 2018 expressed an unqualified opinion thereon.
Adoption of New Accounting Standards
As discussed in Note 1 to the consolidated financial statements, on January 1, 2018, the Company changed its method for accounting for pension costs and its method of presenting restricted cash and restricted cash equivalents in the statement of cash flow for each of the three years ended December 31, 2017 due to the adoption of new accounting guidance that was applied on a retrospective basis.
Basis for Opinion
These financial statements are the responsibility of the Company's management. Our responsibility is to express an opinion on the Company’s financial statements based on our audits. We are a public accounting firm registered with the PCAOB and are required to be independent with respect to the Company in accordance with the U.S. federal securities laws and the applicable rules and regulations of the Securities and Exchange Commission and the PCAOB.
We conducted our audits in accordance with the standards of the PCAOB. Those standards require that we plan and perform the audit to obtain reasonable assurance about whether the financial statements are free of material misstatement, whether due to error or fraud. Our audits included performing procedures to assess the risks of material misstatement of the financial statements, whether due to error or fraud, and performing procedures that respond to those risks. Such procedures included examining, on a test basis, evidence regarding the amounts and disclosures in the financial statements. Our audits also included evaluating the accounting principles used and significant estimates made by management, as well as evaluating the overall presentation of the financial statements. We believe that our audits provide a reasonable basis for our opinion.
|
| |
/s/ Ernst & Young LLP | |
| |
EY or one of its predecessors began serving consecutively as the Company’s (or one of its predecessors) auditor in 1980. | |
| |
Atlanta, Georgia | |
February 20, 2018, except as to Note 1, Note 5, Note 7, Note 10, Note 14, Note 18, and Note 19, as to which the date is August 13, 2018 | |
FIRST DATA CORPORATION
CONSOLIDATED STATEMENTS OF OPERATIONS
|
| | | | | | | | | | | | |
| | Year ended December 31, |
(in millions, except per share amounts) | | 2017 | | 2016 | | 2015 |
Revenues: | | |
| | |
| | |
|
Transaction and processing service fees (a) | | $ | 6,757 |
| | $ | 6,600 |
| | $ | 6,597 |
|
Product sales and other (a) | | 1,372 |
| | 1,239 |
| | 1,167 |
|
Total revenues (excluding reimbursable items) | | 8,129 |
| | 7,839 |
| | 7,764 |
|
Reimbursable debit network fees, postage, and other | | 3,923 |
| | 3,745 |
| | 3,687 |
|
Total revenues | | 12,052 |
| | 11,584 |
| | 11,451 |
|
Expenses: | | |
| | |
| | |
|
Cost of services (exclusive of items shown below) | | 2,769 |
| | 2,855 |
| | 2,874 |
|
Cost of products sold | | 359 |
| | 337 |
| | 356 |
|
Selling, general, and administrative | | 2,178 |
| | 2,035 |
| | 2,292 |
|
Depreciation and amortization | | 972 |
| | 949 |
| | 1,022 |
|
Other operating expenses | | 143 |
| | 51 |
| | 53 |
|
Total expenses (excluding reimbursable items) | | 6,421 |
| | 6,227 |
| | 6,597 |
|
Reimbursable debit network fees, postage, and other | | 3,923 |
| | 3,745 |
| | 3,687 |
|
Total expenses | | 10,344 |
| | 9,972 |
| | 10,284 |
|
Operating profit | | 1,708 |
| | 1,612 |
| | 1,167 |
|
Interest expense, net | | (931 | ) | | (1,078 | ) | | (1,534 | ) |
Loss on debt extinguishment | | (80 | ) | | (70 | ) | | (1,068 | ) |
Other income | | 16 |
| | 17 |
| | 29 |
|
Income (loss) before income taxes and equity earnings in affiliates | | 713 |
| | 481 |
| | (1,406 | ) |
Income tax (benefit) expense | | (729 | ) | | 81 |
| | 101 |
|
Equity earnings in affiliates | | 222 |
| | 260 |
| | 239 |
|
Net income (loss) | | 1,664 |
| | 660 |
| | (1,268 | ) |
Less: Net income attributable to noncontrolling interests
and redeemable noncontrolling interest | | 199 |
| | 240 |
| | 213 |
|
Net income (loss) attributable to First Data Corporation | | $ | 1,465 |
| | $ | 420 |
| | $ | (1,481 | ) |
| | | | | | |
Net income (loss) per share: | | | | | | |
Basic | | $ | 1.60 |
| | $ | 0.47 |
| | $ | (7.70 | ) |
Diluted | | $ | 1.56 |
| | $ | 0.46 |
| | $ | (7.70 | ) |
| | | | | | |
Weighted-average common shares outstanding: | | | | | | |
Basic | | 916 |
| | 902 |
| | 192 |
|
Diluted | | 940 |
| | 921 |
| | 192 |
|
| |
(a) | Includes processing fees, administrative service fees, and other fees charged to merchant alliances accounted for under the equity method of $215 million, $198 million, and $205 million for the years ended December 31, 2017, 2016, and 2015, respectively. |
See notes to consolidated financial statements.
FIRST DATA CORPORATION
CONSOLIDATED STATEMENTS OF COMPREHENSIVE INCOME (LOSS)
|
| | | | | | | | | | | | |
| | Year ended December 31, |
(in millions) | | 2017 | | 2016 | | 2015 |
Net income (loss) | | $ | 1,664 |
| | $ | 660 |
| | $ | (1,268 | ) |
Other comprehensive income (loss), net of tax: | | |
| | |
| | |
|
Foreign currency translation adjustment | | 201 |
| | (153 | ) | | (290 | ) |
Pension liability adjustments | | 72 |
| | 38 |
| | (13 | ) |
Derivative instruments | | 9 |
| | 3 |
| | — |
|
Marketable securities | | — |
| | — |
| | 3 |
|
Total other comprehensive income (loss), net of tax | | 282 |
| | (112 | ) | | (300 | ) |
Comprehensive income (loss) | | 1,946 |
| | 548 |
| | (1,568 | ) |
Less: Comprehensive income attributable to noncontrolling interests and redeemable noncontrolling interest | | 211 |
| | 235 |
| | 203 |
|
Comprehensive income (loss) attributable to First Data Corporation | | $ | 1,735 |
| | $ | 313 |
| | $ | (1,771 | ) |
See notes to consolidated financial statements.
FIRST DATA CORPORATION
CONSOLIDATED BALANCE SHEETS
|
| | | | | | | | |
| | As of December 31, |
(in millions, except par value) | | 2017 | | 2016 |
ASSETS | | |
| | |
|
Current assets: | | |
| | |
|
Cash and cash equivalents | | $ | 498 |
| | $ | 385 |
|
Accounts receivable, net of allowance for doubtful accounts of $45 and $74 | | 2,176 |
| | 1,877 |
|
Settlement assets | | 20,363 |
| | 14,795 |
|
Prepaid expenses and other current assets | | 335 |
| | 360 |
|
Total current assets | | 23,372 |
| | 17,417 |
|
Property and equipment, net of accumulated depreciation of $1,588 and $1,416 | | 951 |
| | 883 |
|
Goodwill | | 17,710 |
| | 16,696 |
|
Customer relationships, net of accumulated amortization of $5,940 and $5,660 | | 2,184 |
| | 1,739 |
|
Other intangibles, net of accumulated amortization of $2,665 and $2,365 | | 1,935 |
| | 1,800 |
|
Investment in affiliates | | 1,054 |
| | 988 |
|
Other long-term assets | | 1,063 |
| | 769 |
|
Total assets | | $ | 48,269 |
| | $ | 40,292 |
|
| | | | |
LIABILITIES AND EQUITY | | |
| | |
|
Current liabilities: | | |
| | |
|
Accounts payable and accrued liabilities | | $ | 1,659 |
| | $ | 1,564 |
|
Short-term and current portion of long-term borrowings | | 1,271 |
| | 358 |
|
Settlement obligations | | 20,363 |
| | 14,795 |
|
Total current liabilities | | 23,293 |
| | 16,717 |
|
Long-term borrowings | | 17,927 |
| | 18,131 |
|
Deferred tax liabilities | | 77 |
| | 409 |
|
Other long-term liabilities | | 886 |
| | 831 |
|
Total liabilities | | 42,183 |
| | 36,088 |
|
Commitments and contingencies (See note 14) | | | | |
Redeemable noncontrolling interest | | 72 |
| | 73 |
|
First Data Corporation stockholders' equity: | | |
| | |
|
Class A Common stock, $0.01 par value; 1,600 shares authorized as of December 31, 2017 and December 31, 2016, 492 shares and 372 shares issued as of December 31, 2017 and December 31, 2016, respectively; and 482 shares and 368 shares outstanding as of December 31, 2017 and December 31, 2016, respectively | | 5 |
| | 4 |
|
Class B Common stock, $0.01 par value; 523 and 625 shares authorized as of December 31, 2017 and December 31, 2016, respectively; 443 shares and 544 shares issued and outstanding as of December 31, 2017 and December 31, 2016 respectively | | 4 |
| | 5 |
|
Preferred stock, $0.01 par value; 100 shares authorized as of December 31, 2017 and December 31, 2016 ; no shares issued and outstanding as of December 31, 2017 and December 31, 2016 | | — |
| | — |
|
Class A Treasury stock, at cost, 11 shares and 5 shares as of December 31, 2017 and December 31, 2016, respectively | | (149 | ) | | (61 | ) |
Additional paid-in capital | | 13,495 |
| | 13,210 |
|
Accumulated loss | | (9,059 | ) | | (10,524 | ) |
Accumulated other comprehensive loss | | (1,144 | ) | | (1,414 | ) |
Total First Data Corporation stockholders' equity | | 3,152 |
| | 1,220 |
|
Noncontrolling interests | | 2,862 |
| | 2,911 |
|
Total equity | | 6,014 |
| | 4,131 |
|
Total liabilities and equity | | $ | 48,269 |
| | $ | 40,292 |
|
See notes to consolidated financial statements.
FIRST DATA CORPORATION
CONSOLIDATED STATEMENTS OF CASH FLOWS |
| | | | | | | | | | | | |
| | Year ended December 31, |
(in millions) | | 2017 | | 2016 | | 2015 |
CASH FLOWS FROM OPERATING ACTIVITIES | | |
| | |
| | |
|
Net income (loss) | | $ | 1,664 |
| | $ | 660 |
| | $ | (1,268 | ) |
Adjustments to reconcile to net cash provided by operating activities: | | |
| | |
| | |
|
Depreciation and amortization (including amortization netted against equity earnings in affiliates and revenues) | | 1,073 |
| | 1,061 |
| | 1,133 |
|
Deferred income taxes | | (853 | ) | | (38 | ) | | (7 | ) |
Charges related to other operating expenses and other income | | 127 |
| | 34 |
| | 24 |
|
Loss on debt extinguishment | | 80 |
| | 70 |
| | 1,068 |
|
Stock-based compensation expense | | 245 |
| | 263 |
| | 329 |
|
Other non-cash and non-operating items, net | | 41 |
| | 45 |
| | 48 |
|
(Decrease) increase in cash, excluding the effects of acquisitions and dispositions, resulting from changes in: | | |
| | |
| | |
|
Accounts receivable, current and long term | | (196 | ) | | (81 | ) | | (184 | ) |
Other assets, current and long term | | (36 | ) | | 61 |
| | (199 | ) |
Accounts payable and other liabilities, current and long term | | (82 | ) | | 35 |
| | (162 | ) |
Income tax accounts | | (16 | ) | | 1 |
| | 13 |
|
Net cash provided by operating activities | | 2,047 |
| | 2,111 |
| | 795 |
|
CASH FLOWS FROM INVESTING ACTIVITIES | | |
| | |
| | |
|
Additions to property and equipment | | (271 | ) | | (232 | ) | | (282 | ) |
Payments to secure customer service contracts, including outlays for conversion, and capitalized systems development costs | | (247 | ) | | (245 | ) | | (320 | ) |
Acquisitions, net of cash acquired | | (1,607 | ) | | (6 | ) | | (89 | ) |
Proceeds from dispositions | | 88 |
| | 38 |
| | 4 |
|
Proceeds from the maturity of net investment hedges | | 90 |
| | — |
| | — |
|
Proceeds from sale of property and equipment | | — |
| | 38 |
| | 17 |
|
Other investing activities, net | | (5 | ) | | 46 |
| | (15 | ) |
Net cash used in investing activities | | (1,952 | ) | | (361 | ) | | (685 | ) |
CASH FLOWS FROM FINANCING ACTIVITIES | | |
| | |
| | |
|
Short-term borrowings, net | | 823 |
| | 205 |
| | (31 | ) |
Proceeds from issuance of long-term debt | | 4,968 |
| | 3,533 |
| | 10,258 |
|
Payment of call premiums and debt issuance cost | | (63 | ) | | (53 | ) | | (1,062 | ) |
Principal payments on long-term debt | | (5,409 | ) | | (5,073 | ) | | (11,568 | ) |
Payment of taxes related to net settlement of equity awards | | (94 | ) | | (61 | ) | | — |
|
Proceeds from issuance of common stock | | 50 |
| | 23 |
| | 2,718 |
|
Distributions and dividends paid to noncontrolling interests and redeemable noncontrolling interest | | (260 | ) | | (316 | ) | | (312 | ) |
Other financing activities, net | | (6 | ) | | 8 |
| | (19 | ) |
Net cash provided by (used in) financing activities | | 9 |
| | (1,734 | ) | | (16 | ) |
Effect of exchange rate changes on cash, cash equivalents and restricted cash | | 7 |
| | (34 | ) | | (23 | ) |
Change in cash, cash equivalents and restricted cash | | 111 |
| | (18 | ) | | 71 |
|
Cash, cash equivalents and restricted cash at beginning of period | | 414 |
| | 432 |
| | 361 |
|
Cash, cash equivalents and restricted cash at end of period | | $ | 525 |
| | $ | 414 |
| | $ | 432 |
|
SUPPLEMENTAL CASH FLOW INFORMATION: | | | | | | |
Income tax payments, net of refunds received | | $ | 142 |
| | $ | 118 |
| | $ | 95 |
|
Interest paid | | 916 |
| | 1,032 |
| | 1,815 |
|
Distributions received from equity method investments | | 266 |
| | 304 |
| | 289 |
|
NON-CASH TRANSACTIONS: | | | | | | |
Capital leases, net of trade-ins | | $ | 112 |
| | $ | 136 |
| | $ | 83 |
|
Other financing arrangements | | $ | 102 |
| | $ | 79 |
| | $ | — |
|
FIRST DATA CORPORATION
CONSOLIDATED STATEMENTS OF EQUITY
|
| | | | | | | | | | | | | | | | | | | | | | | | | | | | | | | | | | | | | | | | | |
| | First Data Corporation Stockholders' | | | | |
| | Common Stock | | Treasury Stock | | | | | | Accumulated Other Comprehensive Income (Loss) | | | | |
(in millions) | | Class A | | Class B | | Class A | | Additional Paid-In Capital | | Accumulated Loss | | | Noncontrolling Interest | | |
| Shares | | Amount | | Shares | | Amount | | Shares | | Amount | | | | | | Total |
Balance, December 31, 2014 (a) | | — |
| | $ | — |
| | — |
| | $ | — |
| | — |
| | $ | — |
| | $ | 9,906 |
| | $ | (9,459 | ) | | $ | (1,017 | ) | | $ | 3,100 |
| | $ | 2,530 |
|
| | | | | | | | | | | | | | | | | | | | | | |
Dividends and distributions paid to noncontrolling interests (b) | | — |
| | — |
| | — |
| | — |
| | — |
| | — |
| | — |
| | — |
| | — |
| | (277 | ) | | (277 | ) |
Net income (loss) (c) | | — |
| | — |
| | — |
| | — |
| | — |
| | — |
| | — |
| | (1,481 | ) | | — |
| | 179 |
| | (1,302 | ) |
Other comprehensive loss | | — |
| | — |
| | — |
| | — |
| | — |
| | — |
| | — |
| | — |
| | (290 | ) | | (10 | ) | | (300 | ) |
Adjustments to redemption value of redeemable noncontrolling interest | | — |
| | — |
| | — |
| | — |
| | — |
| | — |
| | (8 | ) | | — |
| | — |
| | — |
| | (8 | ) |
Stock compensation expense and other | | — |
| | — |
| | — |
| | — |
| | — |
| | — |
| | 316 |
| | — |
| | — |
| | — |
| | 316 |
|
Cash dividends paid by First Data Corporation to former Parent | | — |
| | — |
| | — |
| | — |
| | — |
| | — |
| | — |
| | (4 | ) | | — |
| | — |
| | (4 | ) |
Holding company merger (a) | | — |
| | — |
| | 719 |
| | 7 |
| | — |
| | — |
| | (20 | ) | | — |
| | — |
| | — |
| | (13 | ) |
Initial Public Offering | | 180 |
| | 2 |
| | — |
| | — |
| | — |
| | — |
| | 2,716 |
| | | | | | | | 2,718 |
|
Balance, December 31, 2015 (a) | | 180 |
| | 2 |
| | 719 |
| | 7 |
| | — |
| | — |
| | 12,910 |
| | (10,944 | ) | | (1,307 | ) | | 2,992 |
| | 3,660 |
|
| | | | | | | | | | | | | | | | | | | | | | |
Dividends and distributions paid to noncontrolling interests (b) | | — |
| | — |
| | — |
| | — |
| | — |
| | — |
| | — |
| | — |
| | — |
| | (283 | ) | | (283 | ) |
Net income (loss) (c) | | — |
| | — |
| | — |
| | — |
| | — |
| | — |
| | — |
| | 420 |
| | — |
| | 207 |
| | 627 |
|
Other comprehensive loss | | — |
| | — |
| | — |
| | — |
| | — |
| | — |
| | — |
| | — |
| | (107 | ) | | (5 | ) | | (112 | ) |
Adjustments to redemption value of redeemable noncontrolling interest | | — |
| | — |
| | — |
| | — |
| | — |
| | — |
| | 4 |
| | — |
| | — |
| | — |
| | 4 |
|
Stock compensation expense | | — |
| | — |
| | — |
| | — |
| | | | | | 263 |
| | — |
| | — |
| | — |
| | 263 |
|
Stock activity under stock compensation plans and other | | 188 |
| | 2 |
| | (175 | ) | | (2 | ) | | 5 |
| | (61 | ) | | 33 |
| | — |
| | — |
| | — |
| | (28 | ) |
Balance, December 31, 2016 | | 368 |
| | 4 |
| | 544 |
| | 5 |
| | 5 |
| | (61 | ) | | 13,210 |
| | (10,524 | ) | | (1,414 | ) | | 2,911 |
| | 4,131 |
|
| | | | | | | | | | | | | | | | | | | | | | |
Dividends and distributions paid to noncontrolling interests (b) | | — |
| | — |
| | — |
| | — |
| | — |
| | — |
| | — |
| | — |
| | — |
| | (229 | ) | | (229 | ) |
Net income (loss) (c) | | — |
| | — |
| | — |
| | — |
| | — |
| | — |
| | — |
| | 1,465 |
| | — |
| | 168 |
| | 1,633 |
|
Other comprehensive income | | — |
| | — |
| | — |
| | — |
| | — |
| | — |
| | — |
| | — |
| | 270 |
| | 12 |
| | 282 |
|
Adjustment to redemption value of redeemable noncontrolling interest | | — |
| | — |
| | — |
| | — |
| | — |
| | — |
| | 1 |
| | — |
| | — |
| | — |
| | 1 |
|
Stock compensation expense | | — |
| | — |
| | — |
| | — |
| | — |
| | — |
| | 245 |
| | — |
| | — |
| | — |
| | 245 |
|
Stock activity under stock compensation plans and other | | 114 |
| | 1 |
| | (101 | ) | | (1 | ) | | 6 |
| | (88 | ) | | 39 |
| | — |
| | — |
| | — |
| | (49 | ) |
Balance, December 31, 2017 | | 482 |
| | $ | 5 |
| | 443 |
| | $ | 4 |
| | 11 |
| | $ | (149 | ) | | $ | 13,495 |
| | $ | (9,059 | ) | | $ | (1,144 | ) | | $ | 2,862 |
| | $ | 6,014 |
|
| |
(a) | 1,000 shares relates to common stock without a class that was eliminated upon the merger with First Data Holdings. |
| |
(b) | The total distribution presented in the consolidated statements of equity for the years ended December 31, 2017, 2016, and 2015 excludes $31 million, $33 million, and $35 million, respectively, in distributions paid to redeemable non-controlling interest not included in equity. |
| |
(c) | The total net income (loss) presented in the consolidated statements of equity for the years ended December 31, 2017, 2016, and 2015 is $31 million different, $33 million different, and $34 million different, respectively, than the amount presented on the consolidated statements of operations due to the net income attributable to the redeemable noncontrolling interest not included in equity. |
See notes to consolidated financial statements.
FIRST DATA CORPORATION
NOTES TO THE CONSOLIDATED FINANCIAL STATEMENTS
Note 1: Summary of Significant Accounting Policies
Business Description
First Data Corporation (FDC or the Company) is a global leader in commerce-enabling technology and solutions for merchants, financial institutions, and card issuers. The Company provides merchant transaction processing and acquiring; credit, retail, and debit card issuing and processing; prepaid services; and check verification, settlement and guarantee services; as well as solutions to help clients grow their businesses including the Company's Clover line of payment solutions and related applications.
On October 15, 2015, the Company filed its Prospectus with the Securities and Exchange Commission pursuant to Rule 424(b). The Company issued 176,076,869 shares of Class A common stock and began trading on the New York Stock Exchange under the symbol "FDC".
On October 13, 2015, First Data Holdings Inc. (FDH), the Company's direct parent company, merged with and into First Data Corporation, with First Data Corporation being the surviving entity (HoldCo Merger). All outstanding shares of FDH were converted into Class B common stock, which are entitled to ten votes per share. All outstanding common stock of First Data Corporation were eliminated upon the merger. The Company accounted for the HoldCo Merger as a transfer of assets between entities under common control and reflected the transaction in its financial statements on a prospective basis.
On October 13, 2015, the Company amended its certificate of incorporation which affected a reverse stock split of the Company’s authorized, issued and outstanding Class B common stock, on the basis of 1 new share of Class B common stock for each 3.16091 old shares of common stock.
Consolidation
The accompanying consolidated financial statements include the accounts of the Company and its controlled subsidiaries. All significant intercompany accounts and transactions have been eliminated. Investments in unconsolidated affiliated companies are accounted for under the equity method and are included in “Investment in affiliates” in the accompanying consolidated balance sheets. The Company generally utilizes the equity method of accounting when it has an ownership interest of between 20% and 50% in an entity, provided the Company is able to exercise significant influence over the investee’s operations.
The Company consolidates an entity’s financial statements when the Company has a controlling financial interest in the entity. Control is normally established when ownership interests exceed 50% in an entity; however, when the Company does not exercise control over a majority-owned entity as a result of other investors having rights over the management and operations of the entity, the Company accounts for the entity under the equity method.
Use of Estimates
The preparation of financial statements in conformity with accounting principles generally accepted in the United States requires management to make estimates and assumptions that affect the amounts reported in the consolidated financial statements and accompanying notes. Actual results could differ from those estimates.
Presentation
Depreciation and amortization, presented as a separate line item on the Company’s consolidated statements of operations, does not include amortization of initial payments for new contracts which is recorded as contra-revenue within “Transaction and processing service fees.” Also not included is amortization related to equity method investments which is netted within “Equity earnings in affiliates.”
The following table presents the amounts associated with such amortization for the periods presented:
|
| | | | | | | | | | | | |
| | Year ended December 31, |
(in millions) | | 2017 | | 2016 | | 2015 |
Amortization of initial payments for new contracts | | $ | 56 |
| | $ | 65 |
| | $ | 51 |
|
Amortization related to equity method investments | | 45 |
| | 47 |
| | 60 |
|
Revenue Recognition
The majority of the Company’s revenues are comprised of: 1) volume-based fees, which typically constitute a percentage of dollar volume processed; 2) fees per transaction processed; 3) fees per account on file during the period; or 4) some combination thereof.
The Company’s arrangements with clients often consist of multiple services and products (multiple-element arrangements). In accounting for multiple-element arrangements, the Company assesses the elements of the contract and whether each element has standalone value and allocates revenue to the various elements based on their estimated selling price as a component of total consideration for the arrangement. The selling price is based on current selling prices offered by the Company or another party for current products or management's best estimate of a selling price.
Revenue is comprised of fees charged to the client, net of interchange fees and assessments charged by the credit card associations, and is recognized at the time the client accepts a point of sale transaction. The fees charged to the client are a percentage of the credit card and debit card transaction’s dollar value, a fixed amount, or a combination of the two. Personal identification number based debit (PIN-debit) and PINless-debit network fees are recognized in “Reimbursable debit network fees, postage, and other” revenues and expenses in the consolidated statements of operations.
Interchange fees and assessments charged by credit card associations to the Company’s consolidated subsidiaries and network fees related to PIN-debit and PINless-debit transactions charged by debit networks were as follows for the periods presented:
|
| | | | | | | | | | | | |
| Year ended December 31, |
(in millions) | | 2017 | | 2016 | | 2015 |
Interchange fees and assessments | | $ | 26,069 |
| | $ | 23,810 |
| | $ | 21,711 |
|
Debit network fees | | 3,227 |
| | 3,121 |
| | 2,991 |
|
The Company charges processing fees to its alliances. In situations where an alliance is accounted for under the equity method, the Company’s consolidated revenues include the processing fees charged to the alliance, as presented in the consolidated statements of operations within "Transaction and processing service fees".
Revenue from check verification, settlement, and guarantee services is recognized at the time of sale less the fair value of the guarantee. The fair value of the guarantee is deferred and recognized at the later of the Company being called upon to honor the guarantee or the expiration of the guarantee. Check verification fees generally are a fixed amount per transaction while check guarantee fees generally are a percentage of the check amount.
The purchase and sale of merchant contract portfolios is an ordinary element of the Company’s businesses, and therefore, the gains from selling these revenue-generating assets are included within “Product sales and other” in the consolidated statements of operations.
Fees based on cardholder accounts on file are recognized as the requisite services or period occurs. Fees for PIN-debit transactions where the Company is the debit card processor for the financial institution are recognized on a per transaction basis. Revenues for output services are derived primarily on a per piece basis and consist of fees for the production, materials, and postage related to mailing finished products and recognized as the services are provided.
The sale and leasing of POS devices (terminals) are reported in “Product sales and other” in the consolidated statements of operations. Revenue for terminals sold or sold under a sales-type lease transaction is recognized when the following four criteria are met: evidence of an agreement exists, delivery has occurred, the selling price or minimum lease payments are fixed or determinable, and collection of the selling price or minimum lease payments is reasonably assured. Revenue for operating leases is recognized on a straight-line basis over the lease term.
Services not specifically described above are generally transaction based fees that are recognized at the time the transactions are processed or programming services that are either recorded as work is performed or are recognized over the life of the contract depending on the underlying business relationship.
Deferred Revenue
The Company records deferred revenue when it receives payments or invoices in advance of the delivery of products or the performance of services. The deferred revenue is recognized when underlying performance obligations are achieved. As of December 31, 2017 and 2016, current deferred revenue included within "Accounts payable and accrued liabilities" in the Company's consolidated balance sheets was $175 million and $149 million, respectively. As of December 31, 2017 and 2016, noncurrent deferred revenue included within "Other long-term liabilities" in the Company's consolidated balance sheets was $177 million and $184 million, respectively.
In January 2017, the Company determined that standalone value had been achieved for its Clover terminal devices, principally because a secondary market had been established. The Company accounted for the change on a prospective basis. Beginning January 1, 2017, the Company recognized revenue on sales of Clover terminal devices upon delivery, while Clover terminal devices sold prior to January 1, 2017 continued to be deferred over the term of the respective processing agreement. As of December 31, 2017, $36 million of the Company's deferred revenue represented sales of Clover terminal devices which did not have standalone value prior to the change in accounting.
Stock-Based Compensation
Stock-based compensation to employees is measured at the grant date fair values of the respective stock options and restricted stock awards. An estimate of forfeitures is applied when calculating compensation expense. To calculate the estimated forfeiture rate, the Company performed an analysis of all forfeitures over a five year period and continues to evaluate the actual forfeit rate compared to its estimate. The estimated forfeiture rate will be adjusted as actual forfeiture vary from the estimate, resulting in the recognition of compensation cost only for awards that vest. Any effect of a change in estimated forfeitures will be recognized through a cumulative catch-up adjustment. The Company recognizes compensation cost on service based awards with graded vesting on a straight-line basis over the requisite service period for the entire award. The Company recognizes compensation cost on performance-based restricted stock grants on a grant basis graded schedule. Refer to note 4 "Stock Compensation Plans" of these consolidated financial statements for details regarding the Company’s stock-based compensation plan.
Treasury Stock
In connection with the vesting of restricted stock awards or exercise of stock options, shares of Class A and Class B common stock are delivered to the Company by employees to satisfy tax withholding obligations. The Company accounts for treasury stock activities under the cost method whereby the cost of the acquired stock is recorded as treasury stock. Because Class B common stock converts automatically to Class A common stock upon any transfer, whether or not for value, except for certain transactions described in the Company's amended and restated certificate of incorporation, all shares of treasury stock reside as Class A.
Foreign Currency Translation
The U.S. dollar is the functional currency of the Company’s U.S.-based businesses and certain foreign-based businesses. Significant operations with a local currency as their functional currency include operations in the United Kingdom, Australia, Germany, Ireland, Greece, Brazil and Argentina. Foreign currency-denominated assets and liabilities for these units and other less significant operations are translated into U.S. dollars based on exchange rates prevailing at the end of the period, and revenues and expenses are translated at average exchange rates during each monthly period. The effects of foreign exchange gains and losses arising from the translation of assets and liabilities of those entities where the functional currency is not the U.S. dollar are included as a component of Other Comprehensive Income (Loss) (OCI). Intercompany loans are generally not considered invested on a long-term basis and such foreign currency gains and losses are included in "Other income" on the consolidated statements of operations. Transaction gains and losses related to operating assets and liabilities are included in “Cost of services” and “Selling, general, and administrative” in the consolidated statements of operations and were immaterial for all periods presented. Non-operating transaction gains and losses derived from non-operating assets and liabilities are included in “Other income” on the consolidated statements of operations and are separately disclosed in note 16 "Supplemental Financial Information" of these consolidated financial statements.
Derivative Financial Instruments
The Company is exposed to various financial and market risks, including those related to changes in interest rates and foreign currency exchange rates, that exist as part of its ongoing business operations. The Company uses derivative instruments (i) to mitigate cash flow risks with respect to changes in interest rates (forecasted interest payments on variable rate debt), (ii) to maintain a desired ratio of fixed rate and floating rate debt, and (iii) to protect the net investment in certain foreign subsidiaries and/or affiliates with respect to changes in foreign currency exchange rates. The Company’s objective is to engage in risk management strategies that provide adequate downside protection.
Derivative instruments are entered into for periods consistent with related underlying exposures. The Company applies strict policies to manage each of these risks, including prohibition against derivatives trading, derivatives market-making or any other speculative activities.
The Company formally documents all relationships between hedging instruments and the underlying hedged items, as well as its risk management objective and strategy for undertaking various hedge transactions. This process includes linking all derivatives that have been designated as cash flow hedges to forecasted transactions and net investment hedges to the underlying investment in a foreign subsidiary or affiliate. For designated hedges, the Company formally assesses, both at inception of the hedge and on an ongoing basis, whether the hedge is highly effective in offsetting changes in cash flows or foreign currency exposure of the underlying hedged items. The Company also performs an assessment of the probability of the forecasted transactions on a periodic basis. If it is determined that a derivative ceases to be highly effective during the term of the hedge or if the forecasted transaction is no longer probable, the Company discontinues hedge accounting prospectively for such derivative.
The Company monitors the financial stability of its derivative counterparties and all counterparties are investment grade. The credit risk inherent in these agreements represents the possibility that a loss may occur from the nonperformance of a counterparty to the agreements. The Company performs a review at inception of the hedge, as circumstances warrant, and at least on a quarterly basis, of the credit risk of these counterparties. The Company also monitors the concentration of its contracts with individual counterparties. The Company’s exposures are in liquid currencies (primarily in U.S. dollars, euros, Australian dollars, British pounds, and Canadian dollars), so there is minimal risk that appropriate derivatives to maintain the hedging program would not be available in the future.
The Company recognizes all derivative financial instruments in the consolidated balance sheets as assets or liabilities at fair value. Such amounts are recorded in “Other current assets”, “Other long-term assets”, “Accounts payable and accrued liabilities” or “Other long-term liabilities” in the consolidated balance sheets. The Company’s policy is to present all derivative balances on a gross basis, without regard to counterparty master netting agreements or similar arrangements. Changes in fair value of derivative instruments are recognized immediately in "Other income" on the consolidated statements of operations unless the derivative is designated and qualifies as a hedge of future cash flows or a hedge of a net investment in a foreign operation. For derivatives that qualify as hedges of future cash flows, the effective portion of changes in fair value is recorded temporarily in equity as a component of OCI and then recognized in "Other income" in the consolidated statements of operations in the same period or periods during which the hedged item affects earnings. For derivatives that qualify as a hedge of a net investment in a foreign operation, the gain or loss is reported in OCI as part of the cumulative translation adjustment to the extent the hedge is effective. Any ineffective portions of cash flow hedges and net investment hedges are recognized in “Other income” in the consolidated statements of operations during the period of change. Additional discussion of derivative instruments is provided in note 13 "Derivative Financial Instruments" of these consolidated financial statements.
Noncontrolling and Redeemable Noncontrolling Interests
Noncontrolling interests represent the minority shareholders’ share of the net income or loss and equity in consolidated subsidiaries. The Company’s noncontrolling interests are presented pretax in the consolidated statements of operations as “Net income attributable to noncontrolling interests and redeemable noncontrolling interest” because the majority of the Company’s non wholly owned consolidated subsidiaries are flow through entities for tax purposes. Noncontrolling interests are presented as a component of equity in the consolidated balance sheets and reflect the original investments by these noncontrolling shareholders in the consolidated subsidiaries, along with their proportionate share of the earnings or losses of the subsidiaries, net of dividends or distributions. Noncontrolling interests that are redeemable at the option of the holder are presented outside of equity and are carried at their estimated redemption value. Refer to note 5 "Stockholders' Equity and Redeemable Noncontrolling Interest" of these consolidated financial statements for more information. A noncontrolling interest is recorded on the date of acquisition based on the total fair value of the acquired entity and the noncontrolling interest’s share of that value.
Reserve for Merchant Credit Losses and Check Guarantees
With respect to the merchant acquiring business, the Company’s merchant customers (or those of its unconsolidated alliances) have the legal obligation to refund any charges properly reversed by the cardholder. In the event, however, that the Company is not able to collect such amounts from the merchants, the Company may be liable for any such reversed charges. The Company’s risk in this area primarily relates to situations where the cardholder has purchased goods or services to be delivered in the future.
The Company’s obligation to perform is minimal in relation to the total dollar volume processed. The Company requires cash deposits, guarantees, letters of credit or other types of collateral from certain merchants to minimize this obligation. Collateral held by the Company is classified within “Settlement assets” and the obligation to repay the collateral if it is not needed is classified within “Settlement obligations” on the Company’s consolidated balance sheets. The Company also utilizes a number of systems and procedures to manage merchant risk. Despite these efforts, the Company historically has experienced some level of losses due to merchant defaults. The amount of deposits and letters of credit held by the Company was $632 million and $628 million as of December 31, 2017 and 2016, respectively.
The Company’s contingent obligation relates to imprecision in its estimates of required collateral. A provision for this obligation is recorded based primarily on historical experience of credit losses and other relevant factors such as economic downturns or increases in merchant fraud. Merchant credit losses are included in “Cost of services” in the Company’s consolidated statements of operations. The amount of the reserves attributable to entities consolidated by the Company was $29 million and $23 million as of December 31, 2017 and 2016, respectively.
The majority of the TeleCheck business involves the guarantee of checks received by merchants. If the check is returned, TeleCheck is required to purchase the check from the merchant at its face value and pursue collection from the check writer. A provision for estimated check returns, net of anticipated recoveries, is recorded at the transaction inception based on recent history. The following table presents the estimate of losses on returned check and the fair value of check guarantees:
|
| | | | | | | | |
| | As of December 31, |
(in millions) | | 2017 | | 2016 |
Estimate of losses on returned checks | | $ | 4 |
| | $ | 5 |
|
Fair value of checks guaranteed | | 14 |
| | 17 |
|
The estimate of losses on returned checks is included in “Accounts payable and accrued liabilities” and the fair value of checks guaranteed is included in “Accounts receivable, net” in the consolidated balance sheets. The maximum potential future payments under the guarantees were approximately $456 million as of December 31, 2017 which represented an estimate of the total uncleared checks at that time.
Income Taxes
The Company and its domestic subsidiaries file a consolidated U.S. income tax return. The Company’s foreign operations file income tax returns in their local jurisdictions. Income taxes reflect the net tax effects of temporary differences between the financial reporting carrying amounts of assets and liabilities and the corresponding income tax amounts. The Company has deferred tax assets and liabilities and maintains valuation allowances where it is more likely than not that all or a portion of deferred tax assets will not be realized. To the extent the Company determines that it will not realize the benefit of some or all of its deferred tax assets, these deferred tax assets will be adjusted through the Company’s provision for income taxes in the period in which this determination is made.
The Company recognizes the tax benefits from uncertain tax positions only when it is more likely than not, based on the technical merits of the position, that the tax position will be sustained upon examination, including the resolution of any related appeals or litigation. The tax benefits recognized in the consolidated financial statements from such a position are measured as the largest benefit that has a greater than fifty percent likelihood of being realized upon ultimate resolution.
Cash and Cash Equivalents
Investments (other than those included in settlement assets) with original maturities of three months or less (that are readily convertible to cash) are considered to be cash equivalents and are stated at cost, which approximates market value. Cash and cash equivalents that were restricted from use due to regulatory requirements are included in “Other long-term assets” in the consolidated balance sheets and was $27 million and $30 million as of December 31, 2017 and 2016, respectively.
Accounts Receivable and Leasing Receivables
Accounts receivable balances are stated net of allowance for doubtful accounts. The Company records allowances for doubtful accounts when it is probable that the accounts receivable balance will not be collected. Long-term accounts receivable balances are included in “Other long-term assets” in the consolidated balance sheets.
The Company has receivables associated with its POS terminal leasing businesses. Leasing receivables are included in “Accounts receivable” and “Other long-term assets” in the consolidated balance sheets. The Company recognizes interest income on its leasing receivables using the effective interest method. Interest income from leasing receivables is included in “Product sales and other” in the consolidated statements of operations. For direct financing leases, the interest rate used incorporates initial direct costs included in the net investment in the lease. For sales type leases, initial direct costs are expensed as incurred.
Property and Equipment
Property and equipment are stated at cost less accumulated depreciation. Depreciation expense is computed using the straight-line method over the lesser of the estimated useful life of the related assets (generally three years to 10 years for equipment, furniture, and leasehold improvements, and 30 years for buildings) or the lease term. Maintenance and repairs which do not extend the useful life of the respective assets are expensed as incurred.
The following table presents depreciation expense related to property and equipment, including equipment under capital lease:
|
| | | | |
Year ended December 31, | | |
(in millions) | | Amount |
2017 | | $ | 321 |
|
2016 | | 300 |
|
2015 | | 290 |
|
Goodwill and Other Intangibles
Goodwill represents the excess of purchase price over tangible and intangible assets acquired less liabilities assumed arising from business combinations. Goodwill is generally allocated to reporting units based upon relative fair value (taking into consideration other factors such as synergies) when an acquired business is integrated into multiple reporting units. The Company’s reporting units are at the operating segment level or one level below the operating segment level for which discrete financial information is prepared and regularly reviewed by management. When a business within a reporting unit is disposed of, goodwill is allocated to the disposed business using the relative fair value method. Relative fair value is estimated using a discounted cash flow analysis.
The Company tests goodwill annually for impairment, as well as upon an indicator of impairment, at the reporting unit level. The Company performed its annual goodwill impairment test in the fourth quarters of 2017 and 2016. As of October 1, 2017, the most recent impairment analysis date, the fair value of each reporting unit exceeded its carrying value. The Company did not record any goodwill impairment charges in 2017, 2016, and 2015.
Customer relationships represent the estimated value of the Company’s relationships with customers, primarily merchants and financial institutions, to which it provides services. Customer relationships are amortized based on the pattern of undiscounted cash flows for the period as a percentage of total projected undiscounted cash flows. The Company selected this amortization method for these customer relationships based on a conclusion that the projected undiscounted cash flows could be reliably determined.
The Company capitalizes initial payments for new contracts, contract renewals, and conversion costs associated with customer processing relationships to the extent recoverable through cash flows from future operations, contractual minimums, and/or penalties in the case of early termination. The Company’s accounting policy is to limit the amount of capitalized costs for a given contract to the lesser of the estimated ongoing future cash flows from the contract or the termination fees the Company would receive in the event of early termination of the contract by the customer. The initial payments for new contracts and contract renewals are amortized over the term of the contract as a reduction of the associated revenue (transaction and processing service fees). Conversion costs are also amortized over the term of the contract but are recorded as an expense in “Depreciation and amortization” in the consolidated statements of operations.
The Company develops software that is used in providing processing services to customers. To a lesser extent, the Company also develops software to be sold or licensed to customers. Costs incurred during the preliminary project stage are expensed as incurred.
Capitalization of costs begins when the preliminary project stage is completed and management, with the relevant authority, authorizes and commits to funding the project and it is probable that the project will be completed and the software will be used to perform the function intended. Capitalization of costs ceases when the software is substantially complete and ready for its intended use. Software development costs are amortized using the straight-line method over the estimated useful life of the software, which is generally 5 years. Software acquired in connection with business combinations is amortized using the straight-line method over the estimated useful life of the software which generally ranges from three years to 10 years.
In addition to capitalized contract and software development costs, other intangibles include copyrights, patents, purchased software, and trademarks acquired in business combinations. Other intangibles, except for the First Data trade name discussed in note 3 “Goodwill and Other Intangibles” of these consolidated financial statements, are amortized on a straight-line basis over the length of the contract or benefit period, which generally ranges from three years to 25 years.
Assets and Liabilities Measured at Fair Value on a Recurring Basis
Fair value is defined by accounting guidance as the price that would be received to sell an asset or paid to transfer a liability in an orderly transaction between market participants at the measurement date. The Company uses the hierarchy prescribed in the accounting guidance for fair value measurements, based upon the available inputs to the valuation and the degree to which they are observable or not observable in the market. The Company maximizes the use of relevant observable inputs and minimizes the use of unobservable inputs. The three levels in the hierarchy are as follows:
| |
• | Level 1 Inputs—Quoted prices (unadjusted) for identical assets or liabilities in active markets that are accessible as of the measurement date. |
| |
• | Level 2 Inputs—Inputs other than quoted prices within Level 1 that are observable either directly or indirectly, including but not limited to quoted prices in markets that are not active, quoted prices in active markets for similar assets or liabilities, and observable inputs other than quoted prices such as interest rates or yield curves. |
| |
• | Level 3 Inputs—Unobservable inputs reflecting the Company’s own assumptions about the assumptions that market participants would use in pricing the asset or liability, including assumptions about risk. |
Assets and Liabilities Measured at Fair Value on a Non-Recurring Basis
During the years ended December 31, 2017 and 2016, the Company did not record any adjustments over $5 million to the carrying value of existing assets based on non-recurring fair value measurements, other than as discussed in note 10 "Other Operating Expenses."
Net Income (Loss) Per Share
Basic net income (loss) per share is calculated by dividing Net income (loss) attributable to First Data Corporation by the weighted-average shares outstanding during the period, without consideration for any potential dilutive shares. Diluted net income (loss) per share is computed by dividing Net income (loss) attributable to First Data Corporation by the weighted-average number of shares of common stock outstanding during the period increased to include the number of additional shares of common stock that would have been outstanding if the potentially dilutive securities had been issued. Potentially dilutive securities include outstanding stock options, unvested restricted stock and unvested restricted stock awards. The dilutive effect of potentially dilutive securities is reflected in diluted net income per share by application of the treasury stock method. Under the treasury stock method, an increase in the fair market value of the Company’s common stock can result in a greater dilutive effect from potentially dilutive securities. For any period where Net income (loss) attributable to First Data Corporation is presented, shares used in the diluted net income per share calculation represent basic shares because using diluted shares would be anti-dilutive.
Reclassifications
Certain amounts for prior years have been reclassified to conform with the current year financial statement presentation. During 2017, the Company revised its financial statements to reflect immaterial adjustments to its accounting for deferred income taxes. In the periods prior to 2015, the Company had incorrectly recorded deferred income tax assets on foreign currency translation adjustments included in other comprehensive income (loss) which the Company provided a full valuation. The adjustment resulted in a decrease of $88 million to the previously reported balances of "Accumulated Loss" and an offsetting increase to "Accumulated Other Comprehensive Income (Loss)" at December 31, 2014, and a reduction to deferred tax assets and related valuation allowance of $124 million at December 31, 2016. Additionally, the consolidated balance sheet as of December 31, 2016 reflects a $102 million reclassification related to settlement activities to conform certain domestic and international businesses to the Company's
global policies, which increased "Cash and cash equivalents" and decreased "Accounts receivable". The consolidated statements of cash flows for the year ended December 31, 2016 reflects the reclassification of $102 million within “Net cash provided by operating activities”.
New Accounting Guidance
Revenue Recognition
In May 2014, the Financial Accounting Standards Board (FASB) issued guidance that requires companies to recognize revenue to depict the transfer of goods or services to customers in amounts that reflect the consideration to which the Company expects to be entitled in an exchange for those goods or services. It also requires enhanced disclosures about revenue, provides guidance for transactions that were not previously addressed comprehensively, and improves guidance for multiple-element arrangements. The FASB has subsequently issued several amendments to the standard, including clarification on accounting for licenses, identifying performance obligations, and principal versus agent consideration (reporting revenue gross vs. net).
Since the issuance of ASC 606 and ASC 340-40 (collectively, the New Revenue Standard) in May 2014, the Company has been preparing for the adoption of the New Revenue Standard. The Company has been monitoring the activity of the FASB and the Transition Resource Group as it relates to specific industry interpretive guidance and further overall interpretations and clarifications. The Company has completed two phases of its three-phase plan to-adopt and implement of the New Revenue Standard. Phase III has begun and includes activities such as running parallel reporting for impacted areas under the New and Current Revenue Standard (ASC 605), recording the accounting adjustments that were identified in Phase II, and revising the Company’s financial statement disclosures. This final phase will be completed during Q1 2018.
The Company adopted the New Revenue Standard using a modified retrospective basis on January 1, 2018. The Company expects the adoption to result in a cumulative adjustment to retained earnings of less than $100 million to apply the New Revenue Standard. This impact was principally driven by certain software arrangements being recognized sooner; changes related to costs to obtain customers, including the related amortization period; and the release of deferred revenue associated with Clover terminals that had previously lacked standalone value. Under the modified retrospective basis, the Company will not restate the prior consolidated financial statements presented for these effects.
The Company currently expects the most significant ongoing impact of adopting the New Revenue Standard in 2018 to be driven by changes in principal versus agent considerations, with the majority of the change overall in total revenues attributable to FDC reflecting our PIN-debit and PINless debit transactions on a net basis prospectively, as opposed to our gross presentation of $3.2 billion in 2017. The Company does not expect the adoption of the New Revenue Standard to have a material impact on net income. The Company will include additional disclosures of the amount by which each financial statement line item is affected during 2018, as compared to the guidance that was in effect before the change, and an explanation of the reasons for significant changes.
Leases
In February 2016, the FASB issued guidance which requires lessees to put most leases on their balance sheets. The guidance also modifies the classification criteria and the accounting for sales-type and direct financing leases for lessors and provides new presentation and disclosure requirements for both lessees and lessors. The standard is effective for financial statements issued for fiscal years beginning after December 15, 2018, and interim periods within those fiscal years. Early adoption is permitted in any interim or annual period subsequent to adoption of the preceding revenue recognition guidance. The Company is currently evaluating the impact of adoption of the new guidance on its consolidated financial statements.
Stock-based Compensation
In March 2016, the FASB issued guidance that will change some aspects of the accounting for stock-based payments to employees. Under the new guidance, companies will be required to record all excess tax benefits and tax deficiencies as income tax expense or benefit in the income statement and to present excess tax benefits as an operating activity on the statement of cash flows. The guidance may also change how companies account for forfeitures and an employee’s use of shares to satisfy the employer’s statutory income tax withholding obligation. The Company adopted the various amendments in its consolidated financial statements for the quarterly period ending March 31, 2017 with an effective date on January 1, 2017. The Company has elected to continue to estimate forfeitures expected to occur to determine the amount of compensation cost to be recognized in each period. The adoption of these amendments did not have a material effect on its consolidated financial statements as the Company still had income tax valuation allowances within the U.S. The Company released its U.S. valuation allowances in the fourth quarter of 2017 and as a result the Company could experience volatility in its income tax expense.
In May 2017, the FASB issued guidance that will clarify when changes to terms or conditions of a stock-based payment award must be accounted for as a modification. Under the new guidance, companies will only apply modification accounting guidance if the value, vesting conditions or classification of an award changes. This new guidance will be effective for fiscal years beginning after December 15, 2017 for all entities, including interim periods within those fiscal years with early adoption permitted. The guidance is adopted prospectively to awards modified on or after the adoption date. The Company will adopt the new guidance on January 1, 2018. The impact of adoption on the Company's consolidated financial statements is dependent on future changes to share-based compensation awards.
Credit Losses
In June 2016, the FASB issued guidance that will change the accounting for credit impairment. Under the new guidance, companies are required to measure all expected credit losses for financial instruments held at the reporting date based on historical experience, current conditions and reasonable supportable forecasts. This replaces the existing incurred loss model and is applicable to the measurement of credit losses on financial assets measured at amortized cost and applies to some off-balance sheet credit exposures. This new guidance will be effective for public companies for fiscal years beginning after December 15, 2019, including interim periods within those fiscal years. Early adoption is permitted for fiscal years beginning after December 15, 2018. The Company is currently evaluating the impact of the new guidance on its consolidated financial statements.
Statement of Cash Flows
In November 2016, the FASB issued guidance that will change the presentation of restricted cash and restricted cash equivalents on the statement of cash flows. Under the new guidance, companies will be required to include restricted cash and restricted cash equivalents with the cash and cash equivalents line item when reconciling beginning-of-period and end-of-period total amounts shown on the statement of cash flows. Given this change, transfers between cash, cash equivalents, and restricted cash and cash equivalents will not be reported as cash flow activities on the statement of cash flows. In addition, the guidance requires entities to disclose information about the nature of restrictions on its cash and cash equivalents, including restricted cash and cash equivalents. The Company adopted the new guidance on January 1, 2018, using a retrospective approach, with no material impact to its statement of cash flows. The adoption of this standard has been reflected in all periods within these financial statements. The Company held restricted cash within "Other long-term assets" of $27 million, $30 million, and $3 million for the years ended December 31, 2017, 2016 and 2015, respectively.
Goodwill
In January 2017, the FASB issued guidance simplifying the test for goodwill impairment. This standard eliminates Step 2 from the goodwill impairment test, instead requiring an entity to recognize a goodwill impairment charge for the amount by which the goodwill carrying amount exceeds the reporting unit’s fair value. This guidance is effective for interim and annual goodwill impairment tests in fiscal years beginning after December 15, 2019, and early adoption is permitted. This guidance must be applied on a prospective basis. The Company adopted the new guidance during the fourth quarter of 2017 with no impact to its consolidated financial statements.
Pension Costs
In March 2017, the FASB issued guidance that requires employers that sponsor defined benefit plans for pensions and/or other post-retirement benefits to present the service cost component of net periodic benefit cost in the same income statement line item as other employee compensation costs arising from services rendered during the period. Only the service cost component will be eligible for capitalization in assets. Employers will present the other components of the net periodic benefit cost separately from the line item that includes the service cost and outside of any subtotal of operating income, if one is presented. The Company adopted the new guidance on January 1, 2018, using a retrospective approach. The adoption of this standard has been reflected in all periods within these financial statements. The impact on the Company's financial statements for the years ended December 31, 2017, 2016 and 2015 was an increase (decrease) in operating expense and a decrease (increase) in "Interest expense, net" of $6 million, ($10) million, and $3 million, respectively.
Derivatives and Hedging
In August 2017, the FASB issued guidance to simplify the current application of hedge accounting. This standard is intended to better align a company’s risk management strategies and financial reporting for hedging relationships through changes to both designation and measurement for qualifying hedging relationships and more accurately presenting the economic effects in the financial statements. In addition, the new guidance establishes flexibility in the requirements to qualify and maintain hedge accounting. This guidance is effective for fiscal years beginning after December 15, 2018 and for interim periods therein, with
early adoption permitted. The Company will adopt the new guidance on January 1, 2018. The Company does not expect the adoption of this guidance to have a material impact on the Company’s consolidated financial statements.
Note 2: Borrowings
|
| | | | | | | | |
| | As of December 31, |
(in millions) | | 2017 | | 2016 |
Short-term borrowings: | | |
| | |
|
Foreign lines of credit and other arrangements | | $ | 205 |
| | $ | 84 |
|
Senior Secured Revolving Credit Facility June 2, 2020 at LIBOR plus 3.50% or a base rate plus 2.50% | | 272 |
| | — |
|
Receivable securitized loan at LIBOR plus 1.5% or a base rate equal to the highest of (i) the applicable lender's prime rate, or (ii) the federal funds rate plus 0.50% | | 600 |
| | 160 |
|
Unamortized deferred financing costs(a) | | (3 | ) | | (2 | ) |
Total short-term borrowings | | 1,074 |
| | 242 |
|
Current portion of long-term borrowings: | | | | |
|
Senior secured term loan facility due June 2020 at LIBOR plus 1.75% or a base rate plus 0.75% | | 78 |
| | — |
|
Other arrangements and capital lease obligations | | 119 |
| | 116 |
|
Total current portion of long-term borrowings | | 197 |
| | 116 |
|
Total short-term and current portion of long-term borrowings | | 1,271 |
| | 358 |
|
Long-term borrowings: | | | | |
|
Senior secured term loan facility due April 2024 at LIBOR plus 2.25% or a base rate plus 1.25% | | 3,892 |
| | — |
|
Senior secured term loan facility due July 2022 at LIBOR plus 2.25% or a base rate plus 1.25% | | 3,758 |
| | — |
|
Senior secured term loan facility due June 2020 at LIBOR plus 1.75% or a base rate plus 0.75% | | 1,404 |
| | — |
|
Senior secured term loan facility due March 2021 at LIBOR and euro LIBOR plus 3.0% or, solely with respect to U.S. dollar-denominated term loans, a base rate plus 2.0% | | — |
| | 4,379 |
|
Senior secured term loan facility due July 2022 at LIBOR plus 3.0% or a base rate plus 2.0%, or solely with respect to euro-denominated term loans, euro LIBOR plus 3.25% | | — |
| | 3,583 |
|
6.75% Senior secured first lien notes due 2020 | | — |
| | 1,398 |
|
5.375% Senior secured first lien notes due 2023 | | 1,210 |
| | 1,210 |
|
5.0% Senior secured first lien notes due 2024 | | 1,900 |
| | 1,900 |
|
5.75% Senior secured second lien notes due 2024 | | 2,200 |
| | 2,200 |
|
7.0% Senior unsecured notes due 2023 | | 3,400 |
| | 3,400 |
|
Unamortized discount and unamortized deferred financing costs (a) | | (123 | ) | | (154 | ) |
Other arrangements and capital lease obligations | | 286 |
| | 215 |
|
Total long-term borrowings (b) | | 17,927 |
| | 18,131 |
|
Total borrowings (c) | | $ | 19,198 |
| | $ | 18,489 |
|
| |
(a) | Unamortized deferred financing costs and certain lenders' fees associated with debt transactions were capitalized as discounts are amortized on a straight-line basis, which approximates the effective interest method, over the remaining term of the respective debt. |
| |
(b) | As of December 31, 2017 and 2016, the fair value of the Company's long-term borrowings was $18.2 billion and $18.8 billion, respectively. The estimated fair value of the Company's long-term borrowings was primarily based on market trading prices and is considered to be a Level 2 measurement. |
| |
(c) | The effective interest rate is not substantially different than the coupon rate on any of the Company's debt tranches. |
Foreign Lines of Credit and Other Arrangements
As of December 31, 2017 and 2016, the Company had $546 million and $489 million, respectively, available under short-term lines of credit and other arrangements with foreign banks and alliance partners primarily to fund settlement activity. As of December 31, 2017 and 2016, this includes a $355 million committed line of credit for one of the Company's consolidated alliances. The remainder of these arrangements are primarily associated with international operations and are in various functional currencies, the most significant of which are the Australian dollar, the Polish zloty, and the euro. Of the amounts outstanding as of December 31, 2017 and 2016, $15 million and $10 million, respectively, were uncommitted. The weighted-average interest rate associated with foreign lines of credit was 2.9% and 2.6% for the years ended December 31, 2017 and 2016, respectively.
Senior Secured Revolving Credit Facility
The Company has a $1.25 billion senior secured revolving credit facility maturing on June 2, 2020. Up to $250 million of the senior secured revolving credit facility is available for letters of credit, of which $29 million and $41 million of letters of credit were issued under the facilities as of December 31, 2017 and 2016, respectively. As of December 31, 2017, $949 million remained available. Interest on the senior secured revolving credit facility is payable at a rate equal to, at Company’s option, either (a) LIBOR for deposits in the applicable currency plus 3.50% or (b) solely with respect to revolving loans denominated in U.S. dollars, a base rate plus 2.50%. The weighted-average interest rate on these facilities was 5.74% and 4.60% for the years ended December 31, 2017 and 2016, respectively. The commitment fee rate for the unused portion of the facility is 0.50% per year, though it may be reduced by the Company’s leverage ratio.
Receivable Securitization Agreement
The Company has a consolidated wholly-owned subsidiary, First Data Receivables, LLC (FDR). FDR and FDC entered into an agreement where certain wholly owned subsidiaries of FDC agreed to transfer and contribute receivables to FDR. FDR’s assets are not available to satisfy obligations of any other entities or affiliates of FDC. FDR's creditors will be entitled, upon its liquidation, to be satisfied out of FDR’s assets prior to any assets or value in FDR becoming available to FDR’s equity holders. As of December 31, 2017, the Company transferred $748 million in receivables to FDR as part of the securitization program and FDR utilized the receivables as collateral in borrowings of $600 million. As of December 31, 2017, the receivables held by FDR are recorded within “Accounts receivable, net” in the Company’s consolidated balance sheets. The weighted-average interest rate on the securitization facility was 2.8% for the year ended December 31, 2017.
Senior Unsecured Revolving Credit Facility
On December 14, 2017 the Company executed a $33 million senior unsecured revolving credit facility maturing December 20, 2019, available for letters of credit. The interest rate associated with the credit facility was 1.85% for the year ended December 31, 2017.
Senior Secured Term Loan Facility
The original terms of the Company’s senior secured term loan facilities required the Company to pay equal quarterly installments in aggregate annual amounts equal to 1% of the original principal amount. However, in conjunction with debt modifications and amendments over the last several years, proceeds from the issuance of the notes were used to prepay portions of the principal balances of the Company’s senior secured term loans which satisfied the future quarterly principal payments. Therefore, the Company made no scheduled principal payments during 2017 or 2016, for the senior secured term loan facility other than $70 million related to June 2020 senior secured term loan facility. The senior secured term loan facilities also require mandatory prepayments based on a percentage of excess cash flow generated by the Company if the Company does not satisfy the leverage ratio. All obligations under the senior secured loan facilities are fully and unconditionally guaranteed by most of the domestic, wholly owned material subsidiaries of the Company, subject to certain exceptions.
Senior Secured Term Loan Facility Due June 2020
On January 23, 2017, the Company incurred an aggregate principal amount of $1.3 billion in new U.S. dollar denominated term loans maturing on June 2, 2020. The interest rate applicable to the new term loans is either LIBOR plus 1.75% or a base rate plus 0.75%. The Company is required to make quarterly principal payments of 1.25% on the new term loans. The new term loans were utilized to pay down a portion of the existing 6.75% senior secured first lien notes. In connection with this transaction, the Company expensed $56 million in loss on debt extinguishment. In November 2017, the Company incurred additional debt of $250 million against this facility to partially fund the purchase of BluePay. The Company made principal payments of $70 million in 2017.
Senior Secured Term Loan Facility Due April 2024
On November 15, 2017, the Company refinanced approximately $3.9 billion of U.S. dollar-denominated senior secured term loans maturing on April 2024. The interest rate applicable to the new loan is either LIBOR plus 2.25% or a base rate plus 1.25%. The proceeds were utilized to pay down the existing March 2021 term loan facility. In connection with this transaction, the Company expensed $9 million in loss on debt extinguishment.
Senior Secured Term Loan Facility Due July 2022
On June 14, 2017, the Company refinanced approximately $2.7 billion of U.S. dollar-denominated senior secured term loans maturing on July 2022 and paid off approximately $1.0 billion of euro-denominated senior secured term loans maturing on March 2021 and July 2022. The U.S. dollar-denominated July 2022 term loan facility was upsized by $1.0 billion, to pay off the euro-denominated term loans. Post transaction, the U.S. dollar-denominated July 2022 term loan facility approximates $3.8 billion of U.S. dollar-denominated term loans maturing July 2022 at an interest rate of LIBOR plus 2.25% or a base rate plus 1.25%. In connection with this transaction, the Company expensed $9 million in loss on debt extinguishment and $4 million in debt issuance costs.
5.375% Senior Secured First Lien Notes
On August 11, 2015, the Company issued approximately $1.2 billion aggregate principal amount of 5.375% senior secured first lien notes due August 15, 2023. Interest on the notes will be payable semi-annually in cash each year, commencing on February 15, 2016. The Company may redeem the notes, in whole or in part, prior to August 15, 2018 at a price equal to 100% of the notes redeemed plus accrued and unpaid interest to the redemption date and a "make-whole premium". Thereafter, the Company may redeem the notes, in whole or in part, at established redemption prices.
5.0% Senior Secured First Lien Notes
On March 29, 2016, the Company issued additional $900 million aggregate principal amount to the existing $1.0 billion principal amount issued November 25, 2015 of 5.0% senior secured first lien notes due 2024. The Company may redeem the notes, in whole or in part, prior to January 15, 2019 at a price equal to 100% of the notes redeemed plus accrued and unpaid interest to the redemption date and a "make-whole premium". Thereafter, the Company may redeem the notes, in whole or in part, at established redemption prices.
5.75% Senior Secured Second Lien Notes
On November 25, 2015, the Company issued $2.2 billion aggregate principal amount of 5.75% senior secured second lien notes due January 15, 2024. Interest on the notes is payable semi-annually in cash on January 15 and July 15 of each year. The Company may redeem the notes, in whole or in part, prior to January 15, 2019 at a price equal to 100% of the notes redeemed plus accrued and unpaid interest to the redemption date and a "make-whole premium". Thereafter, the Company may redeem the notes, in whole or in part, at established redemption prices.
7.0% Senior Unsecured Notes Due 2023
On November 18, 2015, the Company issued $3.4 billion aggregate principal amount of 7.0% senior unsecured notes due December 1, 2023. Interest on the notes is payable semi-annually in cash on June 1 and December 1 of each year. The Company may redeem the notes, in whole or in part, prior to December 1, 2018 at a price equal to 100% of the notes redeemed plus accrued and unpaid interest to the redemption date and a "make-whole premium". Thereafter, the Company may redeem the notes, in whole or in part, at established redemption prices.
Maturities
The following table presents the future aggregate annual maturities of the Company’s capital leases and long-term debt excluding unamortized discounts and deferred financing cost: |
| | | | |
Year ended December 31, (in millions) | | Par Amount |
2018 | | $ | 197 |
|
2019 | | 228 |
|
2020 | | 1,404 |
|
2021 | | 37 |
|
2022 | | 3,759 |
|
Thereafter | | 12,622 |
|
Total | | $ | 18,247 |
|
Guarantees and Covenants
All obligations under the senior secured revolving credit facility and senior secured term loan facilities are unconditionally guaranteed by most of the existing and future, direct and indirect, wholly owned, material domestic subsidiaries of the Company. The senior secured facilities contain a number of covenants that, among other things, restrict the Company’s ability to incur additional indebtedness; create liens; enter into sale and leaseback transactions; engage in mergers or consolidations; sell or transfer assets; pay dividends and distributions or repurchase the Company’s capital stock; make investments, loans or advances; prepay certain indebtedness; make certain acquisitions; engage in certain transactions with affiliates; amend material agreements governing certain indebtedness; and change its lines of business. The senior secured facilities also require the Company to not exceed a maximum senior secured leverage ratio and contain certain customary affirmative covenants and events of default, including a change of control. The senior secured term loan facilities also require mandatory prepayments based on a percentage of excess cash flow generated by the Company. The Company is in compliance with all applicable covenants.
All senior secured notes are guaranteed on a senior secured basis by each of the Company’s existing and future direct and indirect wholly owned domestic subsidiaries that guarantees the Company’s senior secured credit facilities. Each of the guarantees of the notes is a general senior obligation of each guarantor and rank senior in right of payment to all existing and future subordinated indebtedness of the guarantor subsidiary, including the Company’s existing senior subordinated notes. The notes rank equal in right of payment with all existing and future senior indebtedness of the guarantor subsidiary but are effectively senior to the guarantees of the Company’s existing senior unsecured notes and the Company’s existing senior secured second lien notes to the extent of the Company’s and the guarantor subsidiary’s value of the collateral securing the notes. The 5.375% senior secured first lien notes and 5.0% senior secured first lien notes are effectively equal in right of payment with each other and the guarantees of the Company’s senior secured credit facilities. Each series of notes are effectively subordinated to any obligations secured by liens permitted under the indenture for the particular series of notes and structurally subordinated to any existing and future indebtedness and other liabilities of any subsidiary of a guarantor that is not also a guarantor of the notes.
All senior unsecured notes (i) rank senior in right of payment to all of the Company’s existing and future subordinated indebtedness, (ii) rank equally in right of payment to all of the existing and future senior indebtedness, (iii) are effectively subordinated in right of payment to all existing and future secured debt to the extent of the value of the assets securing such debt, and (iv) are structurally subordinated to all obligations of each subsidiary that is not a guarantor of the senior notes.
All obligations under the senior secured first lien notes, senior secured second lien notes, and senior unsecured notes also contain a number of covenants similar to those described for the senior secured obligations noted above. The Company is in compliance with all applicable covenants.
Note 3: Goodwill and Other Intangibles
The following table presents changes to goodwill for the years ended December 31, 2016 and 2017:
|
| | | | | | | | | | | | | | | | |
(in millions) | | Global Business Solutions | | Global Financial
Solutions | | Network & Security Solutions | | Totals |
Balance as of January 1, 2016 | | |
| | |
| | |
| | |
|
Goodwill | | $ | 15,567 |
| | $ | 2,054 |
| | $ | 2,284 |
| | $ | 19,905 |
|
Accumulated impairment losses | | (1,363 | ) | | (683 | ) | | (1,013 | ) | | (3,059 | ) |
| | 14,204 |
| | 1,371 |
| | 1,271 |
| | 16,846 |
|
Acquisitions | | 5 |
| | — |
| | — |
| | 5 |
|
Dispositions | | (25 | ) | | — |
| | — |
| | (25 | ) |
Other adjustments (primarily foreign currency) | | (42 | ) | | (88 | ) | | — |
| | (130 | ) |
Balance as of December 31, 2016 | | |
| | |
| | |
| | |
|
Goodwill | | 15,505 |
| | 1,966 |
| | 2,284 |
| | 19,755 |
|
Accumulated impairment losses | | (1,363 | ) | | (683 | ) | | (1,013 | ) | | (3,059 | ) |
| | 14,142 |
| | 1,283 |
| | 1,271 |
| | 16,696 |
|
Acquisitions | | 875 |
| | — |
| | — |
| | 875 |
|
Dispositions | | — |
| | (17 | ) | | (48 | ) | | (65 | ) |
Other adjustments (primarily foreign currency) | | 104 |
| | 100 |
| | — |
| | 204 |
|
Balance as of December 31, 2017 | | |
| | |
| | |
| | |
|
Goodwill | | 16,484 |
| | 2,049 |
| | 2,236 |
| | 20,769 |
|
Accumulated impairment losses | | (1,363 | ) | | (683 | ) | | (1,013 | ) | | (3,059 | ) |
| | $ | 15,121 |
| | $ | 1,366 |
| | $ | 1,223 |
| | $ | 17,710 |
|
The intangible amortization expense associated with customer relationships and other intangibles, including amortization associated with investments in affiliates, was as follows for the periods indicated:
|
| | | | |
Year ended December 31, | | |
(in millions) | | Amount |
2017 | | $ | 752 |
|
2016 | | 761 |
|
2015 | | 843 |
|
The carrying value of the First Data trade name is $604 million for both the years ended December 31, 2017 and 2016. Upon consideration of many factors, including the determination that there are no legal, regulatory or contractual provisions that limit the useful life of the First Data trade name, the Company determined that the First Data trade name had an indefinite useful life. The Company also considered the effects of obsolescence, demand, competition, other economic factors, and its ability to maintain and protect the trade name without significant expenditures. The First Data trade name is expected to contribute directly or indirectly to the future cash flows of the Company for an indefinite period. As an indefinite lived asset, the First Data trade name is not amortized but is reviewed annually for impairment until such time as it is determined to have a finite life. The First Data trade name was not impaired as of December 31, 2017 or 2016.
The following table provides the components of other intangibles:
|
| | | | | | | | | | | | | | | | | | | | | | | | |
| | As of December 31, |
| | 2017 | | 2016 |
| | | | Accumulated | | Net of Accumulated | | | | Accumulated | | Net of Accumulated |
(in millions) | | Cost | | Amortization | | Amortization | | Cost | | Amortization | | Amortization |
Customer relationships | | $ | 8,124 |
| | $ | (5,940 | ) | | $ | 2,184 |
| | $ | 7,399 |
| | $ | (5,660 | ) | | $ | 1,739 |
|
| | | | | | | | | | | | |
Other intangibles: | | |
| | |
| | |
| | |
| | |
| | |
|
Conversion costs | | $ | 302 |
| | $ | (142 | ) | | $ | 160 |
| | $ | 248 |
| | $ | (109 | ) | | $ | 139 |
|
Contract costs | | 324 |
| | (179 | ) | | 145 |
| | 306 |
| | (149 | ) | | 157 |
|
Software | | 2,552 |
| | (1,920 | ) | | 632 |
| | 2,236 |
| | (1,726 | ) | | 510 |
|
Other, including trade names | | 1,422 |
| | (424 | ) | | 998 |
| | 1,375 |
| | (381 | ) | | 994 |
|
Total other intangibles | | $ | 4,600 |
| | $ | (2,665 | ) | | $ | 1,935 |
| | $ | 4,165 |
| | $ | (2,365 | ) | | $ | 1,800 |
|
The estimated future aggregate amortization expense for the next five years is as follows:
|
| | | | |
Year ended December 31, | | |
(in millions) | | Amount (a) |
2018 | | $ | 705 |
|
2019 | | 615 |
|
2020 | | 530 |
|
2021 | | 399 |
|
2022 | | 310 |
|
(a) Actual amortization expense will be higher due to future activity that generates new intangible balances.
The Company tests contract and conversion costs for recoverability on an annual basis by comparing the remaining expected undiscounted cash flows under the contract to the net book value. Any assets that are determined to be unrecoverable are written down to their fair value. In addition to this annual test, these assets and all other long lived assets are tested for impairment upon an indicator of potential impairment.
Note 4: Stock Compensation Plans
The Company provides stock-based compensation awards to its employees under the 2015 Omnibus Incentive Plan (stock plan). The total number of shares of Class A common stock that may be issued under the stock plan is 71 million, plus any shares of Class B common stock subject to outstanding awards granted under the Company's 2007 Equity Plan that are forfeited, terminated, canceled, expired unexercised, withheld in payment of the exercise price, or withheld to satisfy tax withholding obligations which automatically converted on a one-for-one basis into shares of Class A common stock. The stock plan allows for the Company to award an equity interest in the Company or an award that can be settled in cash measured by reference to the value of the Company's Class A common stock.
Total stock-based compensation expense recognized in the "Cost of services" and “Selling, general, and administrative” line items of the consolidated statements of operations resulting from stock options, non-vested restricted stock awards, and non-vested restricted stock units was as follows for the periods presented:
|
| | | | | | | | | | | | |
Year ended December 31, (in millions) | | Cost of services | | Selling, general, and administrative | | Total |
2017 (c) | | $ | 72 |
| | $ | 173 |
| | $ | 245 |
|
2016 (a) (c) | | 112 |
| | 151 |
| | 263 |
|
2015 (b) (c) | | 130 |
| | 199 |
| | 329 |
|
| |
(a) | Approximately $52 million of stock-based compensation expense was recognized in conjunction with the IPO. |
(b) Approximately $254 million was recognized in conjunction with the IPO and $14 million of stock-based compensation expense was recognized as a result of the departure of certain executive officers.
(c) Directly associated with our initial public offering, the Company incurred $254 million and $52 million in stock-based compensation expense during 2015 and 2016 respectively. During 2016, the Company incurred an increase of $136 million in ongoing stock-based compensation expense as employee awards
were expensed over the requisite service period. During 2017, the stock-based compensation expense consists of ongoing employee award programs that will be expensed over the requisite service period.
On September 28, 2015, the Company authorized the grant of restricted stock awards, restricted stock units, and options to certain executives in connection with the consummation of its initial public offering and these awards were valued at approximately $120 million, resulting in incremental unrecognized compensation expense. Two-thirds of these grants are subject to time-based vesting conditions over five years and one-third are subject to a market-based vesting condition. Subject to the recipient’s continued service with the Company through the applicable vesting event, shares subject to market-based stock options and market-based restricted stock will fully vest on the date immediately following the date on which the closing trading price of a share of Class A common stock on the NYSE or other such primary exchange on which shares of Class A common stock are listed and traded has equaled or exceeded two times the per share price to the public in the offering for ten consecutive trading days.
Employee Stock Purchase Plan
The Company has an employee stock purchase plan under which the sale of 6.3 million shares of the Company's common stock is authorized. The price for shares purchased under the plan is 95% of the market value on the last day of each calendar quarter. For the years ended December 31, 2017, 2016 and 2015, the amount of shares issued under the plan were not material.
Stock Options
During the years ended December 31, 2017, 2016, and 2015, time-based options were granted under the stock plan. The time-based options have a contractual term of 10 years. Time-based options vest equally over a three to five year period from the date of issuance.
As of December 31, 2017, there was approximately $46 million of total unrecognized compensation expense related to stock options to be recognized over a weighted-average period of approximately two years.
The fair value of stock options granted for the years ended December 31, 2017, 2016, and 2015 were estimated at the date of grant using a Black-Scholes option pricing model with the following weighted-average assumptions:
|
| | | | | | | | | | | | |
| | Year ended December 31, |
| | 2017 | | 2016 | | 2015 |
Risk-free interest rate | | 2.28 | % | | 2.08 | % | | 1.87 | % |
Dividend yield | | — |
| | — |
| | — |
|
Expected volatility | | 38.97 | % | | 41.33 | % | | 55.15 | % |
Expected term (in years) | | 7 |
| | 7 |
| | 7 |
|
Fair value of options | | $ | 7.52 |
| | $ | 5.33 |
| | $ | 8.68 |
|
Risk-free interest rate—The risk-free rate for stock options granted during the period was determined by using a zero-coupon U.S. Treasury rate for the periods that coincided with the expected terms listed above.
Expected dividend yield—No routine dividends are currently being paid, or are expected to be paid in future periods.
Expected volatility—As the Company does not have sufficient historical data due to its relatively short history of being publicly traded, the expected volatility is based on the historical volatilities of a group of guideline companies.
Expected term—The Company estimated the expected term by utilizing the “simplified method” as allowed by the SEC.
Fair value of stock—The Company determined the fair value based on discounted cash flows and comparison to a group of guideline companies prior to being publicly traded on October 15, 2015 and the Company's closing stock price thereafter.
A summary of stock option activity for the years ended December 31, 2017 and 2016 was as follows:
|
| | | | | | | | | | | | | |
(options in millions) | | Options | | Weighted-Average Exercise Price | | Weighted-Average Remaining Contractual Term | | Aggregate Intrinsic Value (in millions) |
Outstanding as of December 31, 2015 | | 41 |
| | $ | 11.94 |
| | | | |
Granted | | 2 |
| | 12.62 |
| | | | |
Exercised | | (2 | ) | | 9.86 |
| | | | |
Canceled / Forfeited | | (2 | ) | | 15.39 |
| | | | |
Outstanding as of December 31, 2016 | | 39 |
| | $ | 12.00 |
| | 6 years | | $ | 98 |
|
Granted | | — |
| | — |
| | | | |
Exercised | | (5 | ) | | 9.94 |
| | | | |
Canceled / Forfeited | | — |
| | — |
| | | | |
Outstanding as of December 31, 2017 | | 34 |
| | $ | 12.27 |
| | 6 years | | $ | 150 |
|
Options exercisable as of December 31, 2017 | | 24 |
| | $ | 11.48 |
| | 5 years | | $ | 124 |
|
The total intrinsic value related to stock options exercised for the years ended December 31, 2017, 2016, and 2015 was $32 million, $6 million, and $4 million, respectively.
Restricted Stock Awards and Restricted Stock Units
The grant date fair value of each award is based on the closing stock price at the date of grant. Grants were made as incentive awards, which generally vest 20% on the first anniversary, 40% on the second anniversary, and the remaining 40% on the third anniversary. As of December 31, 2017, there was approximately $344 million of total unrecognized compensation expense related to restricted stock that will be recognized over the respective service period of approximately two years. During 2017, 2016, and 2015, the Company did not pay any significant cash amounts to repurchase stock awards from employees that terminated employment with the Company.
A summary of restricted stock award and restricted stock unit activity for the years ended December 31, 2017 and 2016 is as follows:
|
| | | | | | | |
(awards/units in millions) | | Awards/Units | | Weighted-Average Grant-Date Fair Value |
Non-vested as of December 31, 2015 | | 32 |
| | $ | 14.30 |
|
Granted | | 18 |
| | 12.49 |
|
Vested | | (10 | ) | | 13.91 |
|
Canceled / Forfeited | | (6 | ) | | 13.74 |
|
Non-vested December 31, 2016 | | 34 |
| | $ | 13.59 |
|
Granted | | 23 |
| | 16.94 |
|
Vested | | (15 | ) | | 13.86 |
|
Canceled / Forfeited | | (4 | ) | | 14.11 |
|
Non-vested as of December 31, 2017 (a) | | 38 |
| | $ | 15.47 |
|
| |
(a) | Includes 7 million of shares subject to market conditions. |
The total fair value of shares vested (measured as of the date of vesting) during the twelve months ended December 31, 2017, 2016, and 2015 was $204 million, $137 million, and $11 million, respectively.
Note 5: Stockholders' Equity and Redeemable Noncontrolling Interest
Dividends
The Company’s senior secured revolving credit facility, senior secured term loan facility, and the indentures governing the senior secured notes, senior unsecured notes, and senior subordinated notes limit the Company's ability to pay dividends. The restrictions are subject to numerous qualifications and exceptions, including an exception that allows the Company to pay a dividend to repurchase, under certain circumstances, the equity of the Company's former parent, FDH, held by employees, officers and directors that were obtained in connection with the stock compensation plan. Prior to the Company filing its prospectus with the Securities and Exchange Commission and the merger with FDH, the Company paid cash dividends to FDH totaling $4 million during 2015. The Company has not paid any cash dividends since the IPO.
Other Comprehensive Income
The income tax effects allocated to and the cumulative balance of each component of OCI are as follows:
|
| | | | | | | | | | | | | | | | | | | | |
(in millions) | | Beginning Balance | | Pretax Gain (Loss) Amount | | Tax (Benefit) Expense | | Net-of- Tax Amount | | Ending Balance |
As of December 31, 2017 | | | | | | | | | | |
Foreign currency translation adjustment (a) | | $ | (1,317 | ) | | $ | 165 |
| | $ | (24 | ) | | $ | 189 |
| | $ | (1,128 | ) |
Pension liability adjustments | | (98 | ) | | 93 |
| | 21 |
| | 72 |
| | (26 | ) |
Derivative instruments | | 3 |
| | 9 |
| | — |
| | 9 |
| | 12 |
|
Marketable securities | | (2 | ) | | — |
| | — |
| | — |
| | (2 | ) |
| | $ | (1,414 | ) | | $ | 267 |
| | $ | (3 | ) | | $ | 270 |
| | $ | (1,144 | ) |
| | | | | | | | | | |
As of December 31, 2016 | | |
| | |
| | |
| | |
| | |
|
Foreign currency translation adjustment (a) | | $ | (1,169 | ) | | $ | (149 | ) | | $ | (1 | ) | | $ | (148 | ) | | $ | (1,317 | ) |
Pension liability adjustments (b) | | (136 | ) | | 34 |
| | (4 | ) | | 38 |
| | (98 | ) |
Derivative instruments | | — |
| | 3 |
| | — |
| | 3 |
| | 3 |
|
Marketable securities | | (2 | ) | | — |
| | — |
| | — |
| | (2 | ) |
| | $ | (1,307 | ) | | $ | (112 | ) | | $ | (5 | ) | | $ | (107 | ) | | $ | (1,414 | ) |
| | | | | | | | | | |
As of December 31, 2015 | | |
| | |
| | |
| | |
| | |
|
Foreign currency translation adjustment (a) | | $ | (889 | ) | | $ | (261 | ) | | $ | 19 |
| | $ | (280 | ) | | $ | (1,169 | ) |
Pension liability adjustments | | (123 | ) | | (19 | ) | | (6 | ) | | (13 | ) | | (136 | ) |
Marketable securities | | (5 | ) | | 3 |
| | — |
| | 3 |
| | (2 | ) |
| | $ | (1,017 | ) | | $ | (277 | ) | | $ | 13 |
| | $ | (290 | ) | | $ | (1,307 | ) |
| |
(a) | Net-of-tax Foreign currency translation adjustment for the years ended December 31, 2017, 2016, and 2015 is different than the amount presented on the consolidated statements of comprehensive income (loss) by $12 million, $(5) million, and $(10) million, respectively, due to the foreign currency translation adjustment related to noncontrolling interests not included above. |
| |
(b) | 2016 pretax benefit includes an approximate $10 million reclassification out of OCI to "Interest expense, net" in the consolidated statements of operations related to the lump sum cash payout of certain U.S. based pension liabilities. |
Redeemable Noncontrolling Interest
The following table presents a summary of the redeemable noncontrolling interest activity:
|
| | | | |
(in millions) | | Redeemable Noncontrolling Interest |
Balance as of January 1, 2015 | | $ | 70 |
|
Distributions | | (35 | ) |
Share of income | | 34 |
|
Adjustment to redemption value of redeemable noncontrolling interest | | 8 |
|
Balance as of December 31, 2015 | | 77 |
|
Distributions | | (33 | ) |
Share of income | | 33 |
|
Adjustment to redemption value of redeemable noncontrolling interest | | (4 | ) |
Balance as of December 31, 2016 | | 73 |
|
Distributions | | (31 | ) |
Share of income | | 31 |
|
Adjustment to redemption value of redeemable noncontrolling interest | | (1 | ) |
Balance as of December 31, 2017 | | $ | 72 |
|
Note 6: Net Income (Loss) Per Share
Upon the HoldCo Merger, all outstanding shares of FDH's Class A Common Stock, Class B Common Stock, and Series A Voting Participating Convertible Preferred Stock (Series A Preferred Stock) automatically converted to identical shares of the Company's Class B Common Stock. Other than voting rights, this common stock has the same rights as the Class A Common Stock and therefore both are treated as the same class of stock for purposes of the net income (loss) per share calculation.
Basic net income (loss) per share is calculated by dividing net income (loss) attributable to FDC by the weighted-average shares outstanding during the period, without consideration for any potential dilutive shares. Diluted net income (loss) per share has been computed to give effect to the impact, if any, of shares issuable upon the assumed exercise of the Company’s common stock equivalents, which consist of outstanding stock options and unvested restricted stock. The dilutive effect of potentially dilutive securities is reflected in net income (loss) per share by application of the treasury stock method. Under the treasury stock method, an increase in the fair market value of the Company’s common stock can result in a greater dilutive effect from potentially dilutive securities.
The following table sets forth the computation of the Company's basic and diluted net loss per share:
|
| | | | | | | | | | | | |
| | Year ended December 31, |
(in millions, except per share amounts) | | 2017 | | 2016 | | 2015 |
Numerator: | | | | | | |
Net income (loss) used in computing net income (loss) per share, basic and diluted | | $ | 1,465 |
| | $ | 420 |
| | $ | (1,481 | ) |
| | | | | | |
Denominator: | | | | | | |
Shares used in computing net income (loss) per share, basic (a) | | 916 |
| | 902 |
| | 192 |
|
Effect of dilutive securities | | 24 |
| | 19 |
| | — |
|
Total dilutive securities | | 940 |
| | 921 |
| | 192 |
|
| | | | | | |
Basic net income (loss) per share | | $ | 1.60 |
| | $ | 0.47 |
| | $ | (7.70 | ) |
Diluted net income (loss) per share (b) | | 1.56 |
| | 0.46 |
| | (7.70 | ) |
| | | | | | |
Anti-dilutive shares excluded from diluted net income (loss) per share | | 12 |
| | 21 |
| | 27 |
|
| |
(a) | 2015 weighted-average shares calculated using 1,000 shares outstanding prior to the HoldCo Merger and the filing of the Company's prospectus in October 2015 and the Class A and Class B common stock outstanding after these transactions. |
| |
(b) | Potentially dilutive securities whose effect would have been antidilutive are excluded from the computation of diluted earnings per share. |
Note 7: Segment Information
Operating segments are defined as components of an enterprise about which separate financial information is available that is evaluated regularly by a company’s chief operating decision maker (CODM), or decision-making group, in deciding how to allocate resources and in assessing performance. The Company's CODM is its Chief Executive Officer. The Company is organized into three segments: Global Business Solutions, Global Financial Solutions, and Network & Security Solutions.
The business segment measurements provided to and evaluated by the CODM are computed in accordance with the principles listed below:
| |
• | The accounting policies of the operating segments are the same as those described in the summary of significant accounting policies. |
| |
• | Intersegment revenues are eliminated in the segment that sells directly to the end market. |
| |
• | Segment revenue excludes reimbursable debit network fees, postage, and other revenue. |
| |
• | Segment EBITDA excludes Depreciation and amortization expense, Other operating expenses, and Other income (expense). Additionally, segment EBITDA is adjusted for items similar to certain of those used in calculating the Company's compliance with debt covenants. The additional items that are adjusted to determine segment EBITDA are: |
| |
• | stock-based compensation and related expense is excluded; and |
| |
• | Kohlberg Kravis Roberts & Co. (KKR) related items including annual sponsor and other fees for management, consulting, financial, contract termination, and other advisory services are excluded. Upon the Company's public offering on October 15, 2015, the Company is no longer required to pay management fees to KKR. |
| |
• | For significant affiliates, segment revenue and segment EBITDA are reflected based on the Company's proportionate share of the results of the Company's investments in businesses accounted for under the equity method and consolidated subsidiaries with noncontrolling ownership interests. For other affiliates, the Company includes equity earnings in affiliates, excluding amortization expense, in segment revenue and segment EBITDA. |
| |
• | Corporate operations include corporate-wide governance functions such as the Company's executive management team, tax, treasury, internal audit, corporate strategy, and certain accounting, human resources and legal costs related to supporting the corporate function. Costs incurred by Corporate that are attributable to a segment are allocated to the respective segment. |
The following tables present the Company’s operating segment results for the years ended December 31, 2017, 2016, and 2015:
|
| | | | | | | | | | | | | | | | | | | | |
| | Year ended December 31, 2017 |
(in millions) | | Global Business Solutions | | Global Financial
Solutions | | Network & Security Solutions | | Corporate | | Totals |
Revenues: | | |
| | |
| | |
| | |
| | |
|
Transaction and processing service fees | | $ | 3,936 |
| | $ | 1,418 |
| | $ | 1,348 |
| | $ | — |
| | $ | 6,702 |
|
Product sales and other | | 933 |
| | 205 |
| | 195 |
| | — |
| | 1,333 |
|
Equity earnings in affiliates | | 30 |
| | — |
| | — |
| | — |
| | 30 |
|
Total segment revenues | | $ | 4,899 |
| | $ | 1,623 |
| | $ | 1,543 |
| | $ | — |
| | $ | 8,065 |
|
Depreciation and amortization | | $ | 457 |
| | $ | 352 |
| | $ | 126 |
| | $ | 12 |
| | $ | 947 |
|
Segment EBITDA | | 1,824 |
| | 680 |
| | 729 |
| | (167 | ) | | 3,066 |
|
|
| | | | | | | | | | | | | | | | | | | | |
| | Year ended December 31, 2016 |
(in millions) | | Global Business Solutions | | Global Financial
Solutions | | Network & Security Solutions | | Corporate | | Totals |
Revenues: | | |
| | |
| | |
| | |
| | |
|
Transaction and processing service fees | | $ | 3,819 |
| | $ | 1,372 |
| | $ | 1,309 |
| | $ | — |
| | $ | 6,500 |
|
Product sales and other | | 826 |
| | 221 |
| | 176 |
| | — |
| | 1,223 |
|
Equity earnings in affiliates | | 36 |
| | — |
| | — |
| | — |
| | 36 |
|
Total segment revenues | | $ | 4,681 |
| | $ | 1,593 |
| | $ | 1,485 |
| | $ | — |
| | $ | 7,759 |
|
Depreciation and amortization | | $ | 435 |
| | $ | 357 |
| | $ | 115 |
| | $ | 14 |
| | $ | 921 |
|
Segment EBITDA | | 1,725 |
| | 646 |
| | 666 |
| | (145 | ) | | 2,892 |
|
|
| | | | | | | | | | | | | | | | | | | | |
| | Year ended December 31, 2015 |
(in millions) | | Global Business Solutions | | Global Financial
Solutions | | Network & Security Solutions | | Corporate | | Totals |
Revenues: | | |
| | |
| | |
| | |
| | |
|
Transaction and processing service fees | | $ | 3,851 |
| | $ | 1,323 |
| | $ | 1,322 |
| | $ | — |
| | $ | 6,496 |
|
Product sales and other | | 845 |
| | 172 |
| | 142 |
| | — |
| | 1,159 |
|
Equity earnings in affiliates | | 35 |
| | — |
| | — |
| | — |
| | 35 |
|
Total segment revenues | | $ | 4,731 |
| | $ | 1,495 |
| | $ | 1,464 |
| | $ | — |
| | $ | 7,690 |
|
Depreciation and amortization | | $ | 490 |
| | $ | 393 |
| | $ | 91 |
| | $ | 25 |
| | $ | 999 |
|
Segment EBITDA | | 1,681 |
| | 547 |
| | 639 |
| | (140 | ) | | 2,727 |
|
The following table presents a reconciliation of reportable segment amounts to the Company’s consolidated balances for the years ended December 31, 2017, 2016, and 2015:
|
| | | | | | | | | | | | |
| | Year ended December 31, |
(in millions) | | 2017 | | 2016 | | 2015 |
Total segment revenues | | $ | 8,065 |
| | $ | 7,759 |
| | $ | 7,690 |
|
Adjustments: | | | | | | |
Non wholly-owned entities (a) | | 64 |
| | 80 |
| | 74 |
|
Reimbursable debit network fees, postage, and other | | 3,923 |
| | 3,745 |
| | 3,687 |
|
Consolidated revenues | | $ | 12,052 |
| | $ | 11,584 |
| | $ | 11,451 |
|
| | | | | | |
Total segment EBITDA | | $ | 3,066 |
| | $ | 2,892 |
| | $ | 2,727 |
|
Adjustments: | | | | | | |
|
Non wholly-owned entities (a) | | 30 |
| | 30 |
| | 26 |
|
Depreciation and amortization | | (972 | ) | | (949 | ) | | (1,022 | ) |
Interest expense, net | | (931 | ) | | (1,078 | ) | | (1,534 | ) |
Loss on debt extinguishment | | (80 | ) | | (70 | ) | | (1,068 | ) |
Other items (b) | | (132 | ) | | (61 | ) | | (180 | ) |
Income tax benefit (expense) | | 729 |
| | (81 | ) | | (101 | ) |
Stock-based compensation | | (245 | ) | | (263 | ) | | (329 | ) |
Net income (loss) attributable to First Data Corporation | | $ | 1,465 |
| | $ | 420 |
| | $ | (1,481 | ) |
| |
(a) | Net adjustment to reflect the Company's proportionate share of the results of the Company's investments in businesses accounted for under the equity method and consolidated subsidiaries with noncontrolling ownership interests. Segment revenue for the Company's significant affiliates is reflected based on the Company's proportionate share of the results of the Company's investments in businesses accounted for under the equity method and consolidated subsidiaries with noncontrolling ownership interests. For other affiliates, the Company includes equity earnings in affiliates, excluding amortization expense, in segment revenue. |
| |
(b) | Includes restructuring, certain retention bonuses, non-normal course litigation and regulatory settlements, asset impairments, debt issuance expenses, KKR related items and “Other income" as presented in the consolidated statements of operations, which includes divestitures, derivative gains (losses), non-operating foreign currency gains (losses), and the gain on Visa Europe share sale. KKR related items represent KKR annual sponsorship fees for management, consulting, financial and other advisory services. Upon completing the IPO in October 2015, the Company is no longer obligated to pay KKR annual sponsorship fees. |
Total segment assets, capital expenditures, and investment in unconsolidated affiliates are not disclosed, as the Company's CODM does not utilize such information when allocating resources to the segment or when assessing the segments' performance.
The following tables presents a reconciliation of reportable segment depreciation and amortization amounts to the Company’s consolidated balances in the consolidated statements of cash flows for the years ended December 31, 2017, 2016, and 2015:
|
| | | | | | | | | | | | |
| | Year ended December 31, |
(in millions) | | 2017 | | 2016 | | 2015 |
Segment depreciation and amortization | | $ | 947 |
| | $ | 921 |
| | $ | 999 |
|
Adjustments for non-wholly owned entities | | 70 |
| | 75 |
| | 83 |
|
Amortization of initial payments for new contracts (a) | | 56 |
| | 65 |
| | 51 |
|
Total consolidated depreciation and amortization per consolidated statements of cash flows | | 1,073 |
| | 1,061 |
| | 1,133 |
|
Amortization of equity method investment (b) | | (45 | ) | | (47 | ) | | (60 | ) |
Amortization of initial payments for new contracts (a) | | (56 | ) | | (65 | ) | | (51 | ) |
Total consolidated depreciation and amortization per consolidated statements of operations | | $ | 972 |
| | $ | 949 |
| | $ | 1,022 |
|
| |
(a) | Included in "Transaction and processing service fees" as contra-revenue in the Company's consolidated statements of operations. |
| |
(b) | Included in "Equity earnings in affiliates" in the Company's consolidated statements of operations. |
The following tables presents revenues and long-lived assets by principal geographic area for the years ended December 31, 2017, 2016, and 2015:
|
| | | | | | | | | | | | |
(in millions) | | United
States | | International | | Total |
Revenues: | | |
| | |
| | |
|
2017 | | $ | 10,201 |
| | $ | 1,851 |
| | $ | 12,052 |
|
2016 | | 9,890 |
| | 1,694 |
| | 11,584 |
|
2015 | | 9,795 |
| | 1,656 |
| | 11,451 |
|
Long-Lived Assets: | | |
| | |
| | |
|
2017 | | $ | 20,324 |
| | $ | 2,456 |
| | $ | 22,780 |
|
2016 | | 18,846 |
| | 2,272 |
| | 21,118 |
|
2015 | | 19,400 |
| | 2,316 |
| | 21,716 |
|
Note 8: Income Taxes
The components of pretax income and provision for income taxes for the years ended December 31, 2017, 2016, and 2015, consisted of the following:
|
| | | | | | | | | | | | |
| | Year ended December 31, |
(in millions) | | 2017 | | 2016 | | 2015 |
Components of pretax income (loss): | | | | | | |
Domestic | | $ | 484 |
| | $ | 492 |
| | $ | (1,332 | ) |
Foreign | | 451 |
| | 249 |
| | 165 |
|
| | $ | 935 |
| | $ | 741 |
| | $ | (1,167 | ) |
Provision for income taxes: | | | | | | |
Federal | | $ | (795 | ) | | $ | 20 |
| | $ | 7 |
|
State and local | | (32 | ) | | 20 |
| | 14 |
|
Foreign | | 98 |
| | 41 |
| | 80 |
|
Income tax (benefit) expense | | $ | (729 | ) | | $ | 81 |
| | $ | 101 |
|
| | | | | | |
Effective income tax rate | | (78 | )% | | 11 | % | | (9 | )% |
The Company’s effective tax rates differ from statutory rates as follows:
|
| | | | | | | | | |
| | Year ended December 31, |
| | 2017 | | 2016 | | 2015 |
Federal statutory rate | | 35 | % | | 35 | % | | 35 | % |
State income taxes, net of federal income tax benefit | | 2 |
| | 2 |
| | 3 |
|
Nontaxable income from noncontrolling interests | | (7 | ) | | (11 | ) | | 6 |
|
Impact of foreign operations (a) | | (1 | ) | | 13 |
| | (1 | ) |
Valuation allowances | | (147 | ) | | (35 | ) | | (54 | ) |
Liability for unrecognized tax benefits | | 2 |
| | — |
| | (2 | ) |
Prior year adjustments (b) | | (10 | ) | | 3 |
| | 4 |
|
Enacted tax rate changes | | 27 |
| | (1 | ) | | — |
|
Other tax reform bill impact for foreign related items | | 17 |
| | — |
| | — |
|
Equity Compensation | | — |
| | 5 |
| | — |
|
Impact of divestiture | | 2 |
| | — |
| | — |
|
Other | | 2 |
| | — |
| | — |
|
Effective tax rate | | (78 | )% | | 11 | % | | (9 | )% |
| |
(a) | The impact of foreign operations includes the effects of earnings and profits adjustments, foreign losses, and differences between foreign tax expense and foreign taxes eligible for the U.S. foreign tax credit. |
| |
(b) | Includes prior year true ups for certain foreign and state net operating loss carryforwards as a result of tax rate and restructuring changes. |
The Company’s income tax (benefits) provisions consisted of the following components:
|
| | | | | | | | | | | | |
| | Year ended December 31, |
(in millions) | | 2017 | | 2016 | | 2015 |
Current: | | | | | | |
Federal | | $ | 8 |
| | $ | 22 |
| | $ | 5 |
|
State and local | | 23 |
| | 24 |
| | 23 |
|
Foreign | | 93 |
| | 73 |
| | 80 |
|
| | 124 |
| | 119 |
| | 108 |
|
Deferred: | | | | | | |
Federal | | (803 | ) | | (2 | ) | | 2 |
|
State and local | | (55 | ) | | (4 | ) | | (9 | ) |
Foreign | | 5 |
| | (32 | ) | | — |
|
| | (853 | ) | | (38 | ) | | (7 | ) |
Income tax (benefit) expense | | $ | (729 | ) | | $ | 81 |
| | $ | 101 |
|
Deferred tax assets and liabilities are recognized for the expected tax consequences of temporary differences between the book and tax bases of the Company’s assets and liabilities. Valuation allowances are recorded to reduce deferred tax assets when it is more likely than not that a tax benefit will not be realized. Deferred tax assets are included in "Other long-term assets" and deferred tax liabilities are included in "Deferred tax liabilities" on the Company’s consolidated balance sheets.
The following table outlines the principal components of deferred tax items:
|
| | | | | | | | |
| | As of December 31, |
(in millions) | | 2017 | | 2016 |
Deferred tax assets related to: | | | | |
Reserves and other accrued expenses | | $ | 66 |
| | $ | — |
|
Employee related liabilities | | 121 |
| | 176 |
|
Deferred revenues | | 30 |
| | 34 |
|
Net operating losses and tax credit carryforwards | | 2,281 |
| | 3,122 |
|
U.S. foreign tax credits on undistributed earnings | | 39 |
| | 252 |
|
Total deferred tax assets | | 2,537 |
| | 3,584 |
|
Valuation allowance | | (1,214 | ) | | (2,396 | ) |
Realizable deferred tax assets | | 1,323 |
| | 1,188 |
|
Deferred tax liabilities related to: | | | | |
Property, equipment, and intangibles | | (772 | ) | | (969 | ) |
Reserves and other accrued expenses | | — |
| | (49 | ) |
Pension obligations | | (67 | ) | | (4 | ) |
Investment in affiliates and other | | (209 | ) | | (217 | ) |
Tax on foreign undistributed earnings | | (12 | ) | | (252 | ) |
Foreign exchange gain | | (35 | ) | | (91 | ) |
Total deferred tax liabilities | | (1,095 | ) | | (1,582 | ) |
Net deferred tax asset (liabilities) | | $ | 228 |
| | $ | (394 | ) |
The Company’s deferred tax assets and liabilities included in the consolidated balance sheets were as follows:
|
| | | | | | | | |
| | As of December 31, |
(in millions) | | 2017 | | 2016 |
Deferred tax assets | | $ | 305 |
| | $ | 15 |
|
Deferred tax liabilities | | (77 | ) | | (409 | ) |
Net deferred tax asset (liabilities) | | $ | 228 |
| | $ | (394 | ) |
As of December 31, 2017 and 2016, the Company had recorded valuation allowances of $1.2 billion and $2.4 billion, respectively, against its net deferred tax assets. The decrease to the valuation allowance of $(1.2) billion in 2017 was primarily due to utilization of federal and state net operating losses and the release of the US federal and certain state valuation allowances due to improved performance.
The following table presents the amounts of federal, state, and foreign net operating loss carryforwards, general business credit, and minimum tax credit carryforwards:
|
| | | | |
| | As of December 31, |
(in millions) | | 2017 |
Federal net operating loss carryforwards (a) | | $ | 4,567 |
|
State net operating loss carryforwards (b) | | 6,069 |
|
Foreign net operating loss carryforwards (c) | | 3,403 |
|
General business credit carryforwards (d) | | 12 |
|
Minimum tax credit carryforwards (e) | | 30 |
|
| |
(a) | Will expire if not utilized, for the years 2018, 2019, 2020 of $0.1 million, $0.8 million, $0.1 million, respectively, and the remaining through 2037. |
| |
(b) | Will expire if not utilized, for the years 2018, 2019, 2020 of $90 million, $245 million, $192 million, respectively, and the remaining through 2037. |
| |
(c) | Foreign net operating loss carryforwards of $74 million, if not utilized, will expire in years 2017 through 2035. The remaining foreign net operating loss carryforwards of $3.3 billion have an indefinite life. |
| |
(d) | If not utilized, these carryforwards will expire in years 2027 through 2037. |
| |
(e) | These carryforwards are refundable credits and will be utilized from 2018 through 2021. |
The Company intends to indefinitely invest its net equity in its foreign operations, with the exception of any undistributed foreign earnings in those jurisdictions with positive earnings. Under the U.S. tax reform law changes enacted during 2017, all existing positive earnings were deemed to be distributed, and future foreign earnings will not be taxed in the U.S. Accordingly, as of December 31, 2017, no provision had been made for U.S. federal and state income taxes on the cumulative amount of temporary differences related to investments in foreign subsidiaries. However, these earnings are subject to local country withholding tax upon distribution. Upon sale or liquidation of these investments, the Company would potentially be subject to U.S., state, and foreign income taxes and withholding taxes payable to the various foreign countries. The amount of unrecognized deferred tax liability related to investments in foreign subsidiaries is approximately $165 million as of December 31, 2017.
On December 22, 2017, the Tax Cuts and Jobs Act (tax reform bill) was signed into law in the U.S. The provisions of the tax reform bill with the most significant implications to the Company were the reduction of the federal tax rate from 35% to 21%, the creation of a 100% participation exemption for foreign dividends, the enactment of a one-time transition tax on existing foreign earnings, limitations on the deductibility of interest expense, and the establishment of global intangible low-taxed income (GILTI) rules. The first three provisions impacted the year-ended December 31, 2017. At December 31, 2017, the Company has not completed its accounting for the tax effects of enactment of the Act; however, in certain cases, the Company has made a reasonable estimate of the effects on its existing deferred tax balances, valuation allowance assessment for certain tax assets and the one-time transition tax. The Company recognized a provisional net tax expense of $353 million related to the tax reform bill, which is included as a component of income tax expense from continuing operations.
The Company remeasured certain deferred tax assets and liabilities based on the federal rate at which they are expected to reverse in the future, which is generally 21%. The Company also remeasured the state rate at which certain deferred tax assets and liabilities are expected to reverse in the future. Because the Company’s deferred tax assets exceed its deferred tax liabilities in the U.S., the reduction of the tax rate from 35% to 21% provided by the tax reform bill resulted in a negative impact to the tax rate of $194 million. The Company is still analyzing certain aspects of the Act and refining its calculations, which could potentially affect the measurement of these balances or potentially give rise to new deferred tax amounts.
The one-time transition tax coupled with the 100% participation exemption had an immaterial impact on the tax rate. Because the Company has historically repatriated its foreign earnings, the Company’s cumulative foreign deficits exceed its cumulative foreign profits, causing the one-time taxable inclusion under the transition tax rules to be zero. As a result of the future participation exemption, the Company determined that it will not have enough future foreign sourced income to utilize any foreign tax credit carryforwards, and has therefore determined that it will amend its 2010-2016 tax returns to elect to claim foreign tax deductions, rather than foreign tax credits. The deferred tax impact of changing the election from a credit to a deduction was $159 million. This change was assumed when determining the appropriate valuation allowance on the Company’s foreign tax credit carryforwards in prior years, and as a result, the decision to amend the returns had an immaterial net tax rate impact. The Company is still evaluating the overall impact of the one-time transition tax on the outside basis differences and cumulative temporary differences inherent in these subsidiaries as of December 31, 2017.
The tax reform bill subjects a U.S. shareholder to current tax on GILTI earned by certain foreign subsidiaries. The FASB Staff Q&A, Topic 740 No. 5, Accounting for Global Intangible Low-Taxed Income, states that an entity can make an accounting policy election to either recognize deferred taxes for temporary differences expected to reverse as GILTI in future years or provide for the tax expense related to GILTI in the year the tax is incurred. The Company has elected to recognize the tax on GILTI as a period expense in the period the tax is incurred.
A reconciliation of the unrecognized tax benefits was as follows:
|
| | | | |
(in millions) | | Unrecognized Tax Benefits |
Balance as of January 1, 2015 | | $ | 236 |
|
Increases for tax positions of prior years | | 25 |
|
Decreases for tax positions of prior years | | (4 | ) |
Increases for tax positions related to the current period | | 1 |
|
Decreases for cash settlements with taxing authorities | | (3 | ) |
Decreases due to the lapse of the applicable statute of limitations | | (6 | ) |
Balance as of December 31, 2015 | | 249 |
|
Increases for tax positions of prior years | | 2 |
|
Decreases for tax positions of prior years | | (1 | ) |
Increases for tax positions related to the current period | | — |
|
Decreases for cash settlements with taxing authorities | | (1 | ) |
Decreases due to the lapse of the applicable statute of limitations | | (9 | ) |
Balance as of December 31, 2016 | | 240 |
|
Increases for tax positions of prior years | | 14 |
|
Decreases for tax positions of prior years | | (10 | ) |
Decreases for tax positions related to the current period | | (3 | ) |
Decreases for cash settlements with taxing authorities | | (1 | ) |
Decreases due to the lapse of the applicable statute of limitations | | (7 | ) |
Decreases due to change in tax rates | | (13 | ) |
Balance as of December 31, 2017 | | $ | 220 |
|
Most of the unrecognized tax benefits are included in “Other long-term liabilities” on the consolidated balance sheets, net of the federal benefit on state income taxes (approximately $12 million as of December 31, 2017). However, those unrecognized tax benefits that affect the federal consolidated tax years ending December 31, 2008 through December 31, 2017 are included in “Deferred tax liabilities” on the consolidated balance sheets, as these items reduce the Company’s net operating loss and credit carryforwards from those periods. The unrecognized tax benefits as of December 31, 2017, 2016, and 2015 included approximately $130 million, $133 million, and $136 million, respectively, of tax positions that, if recognized, would affect the effective tax rate.
The Company recognizes interest and penalties related to unrecognized tax benefits in “Income tax (benefit) expense” in the consolidated statements of operations. Cumulative accrued interest and penalties (net of related tax benefits) are not included in the ending balances of unrecognized tax benefits. Cumulative accrued interest and penalties are included in “Other long-term liabilities” on the consolidated balance sheets while the related tax benefits are included in “Deferred tax liabilities” on the consolidated balance sheets. The following table presents the approximate amounts associated with accrued interest expense and the cumulative accrued interest and penalties:
|
| | | | | | | | | | | | |
| | Year ended December 31, |
(in millions) | | 2017 | | 2016 | | 2015 |
Current year accrued interest expense (net of related tax benefits) | | $ | 6 |
| | $ | 5 |
| | $ | 7 |
|
Cumulative accrued interest and penalties (net of related tax benefits) | | 60 |
| | 48 |
| | 45 |
|
As of December 31, 2017, the Company anticipates it is reasonably possible that its liability for unrecognized tax benefits may decrease by approximately $134 million within the next 12 months as a result of the possible closure of federal tax audits, potential settlements with certain states and foreign countries, and the lapse of the statute of limitations in various state and foreign jurisdictions.
The Company or one or more of its subsidiaries file income tax returns in the U.S. federal jurisdiction and various state and foreign jurisdictions. As of December 31, 2017, the Company was no longer subject to income tax examination by the U.S. federal jurisdiction for years before 2005. State and local examinations are substantially complete through 2006. Foreign jurisdictions
generally remain subject to examination by their respective authorities from 2007 forward, none of which are considered major jurisdictions.
In September 2017, the Internal Revenue Service issued a directive pertaining to the research and development (R&D) tax credit. The Company incurred approximately $150 million of R&D expenses during 2017.
Under the Tax Allocation Agreement executed at the time of the spin-off of The Western Union Company (Western Union) on September 29, 2006, Western Union is responsible for and must indemnify the Company against all taxes, interest, and penalties that relate to Western Union for periods prior to the spin-off date. If Western Union were to agree to or be finally determined to owe any amounts for such periods but were to default in its indemnification obligation under the Tax Allocation Agreement, the Company, as parent of the tax filing group during such periods, generally would be required to pay the amounts to the relevant tax authority, resulting in a potentially material adverse effect on the Company’s financial position and results of operations. As of December 31, 2017, the Company had approximately $129 million of income taxes payable, including approximately $4 million of uncertain income tax liabilities, recorded related to Western Union for periods prior to the spin-off date. The Company has recorded a corresponding account receivable of equal amount from Western Union, which is included as a long-term account receivable in “Other long-term assets” on the Company’s consolidated balance sheets, reflecting the indemnification obligation. The uncertain income tax liabilities and corresponding receivable are based on information provided by Western Union regarding its tax contingency reserves for periods prior to the spin-off date. There is no assurance that a Western Union-related issue raised by the IRS or other tax authority will be finally resolved at a cost not in excess of the amount reserved and reflected in the Company’s uncertain income tax liabilities and corresponding receivable from Western Union. The Western Union contingent liability is in addition to the Company’s liability for unrecognized tax benefits discussed above.
The IRS completed its examination of the U.S. federal consolidated income tax returns of the Company for 2005 through 2007 and issued a 30-Day letter in October 2012. The 30-Day letter claims that the Company and its subsidiaries, which included Western Union during some of the years at issue, owe additional taxes with respect to a variety of adjustments. The Company and Western Union agree with several of the adjustments in the 30-Day letter, such adjustments representing tax due of approximately $40 million. This undisputed tax and associated interest due (pretax) of approximately $26 million through December 31, 2017, were fully reserved. The undisputed tax for which Western Union would be required to indemnify the Company is greater than the total tax due, such that settlement of the undisputed tax would result in a net refund to the Company. As to the adjustments that are disputed, such issues represent total taxes allegedly due of approximately $59 million, of which $40 million relates to the Company and $19 million relates to Western Union. The Company estimates that total interest due (pretax) on the disputed amounts is approximately $29 million through December 31, 2017, of which $17 million relates to the Company and $11 million relates to Western Union. As to the disputed issues, the Company and Western Union are contesting the asserted deficiencies with the Appeals Office of the IRS. In December, 2017, the Company was notified by the Appeals Office that the case had been forwarded to the Joint Committee on Taxation for review. The Company believes that it has adequately reserved for the disputed issues in its liability for unrecognized tax benefits described above and that final resolution of those issues will not have a material adverse effect on its financial position or results of operations.
Note 9: Related Party Transactions
Merchant Alliances
A substantial portion of the Company’s business within the Global Business Solutions segment is conducted through merchant alliances. Merchant alliances are alliances between the Company and financial institutions. If the Company has majority ownership and management control over an alliance, then the alliance’s financial statements are consolidated with those of the Company and the related processing fees are treated as an intercompany transaction and eliminated upon consolidation. If the Company does not have a controlling ownership interest in an alliance, it uses the equity method of accounting to account for its investment in the alliance. As a result, the Company’s consolidated revenues include processing fees charged to alliances accounted for under the equity method. No directors or officers of the Company have ownership interests in any of the alliances. The formation of each of these alliances generally involves the Company and the bank contributing contractual merchant relationships to the alliance and a cash payment from one owner to the other to achieve the desired ownership percentage for each. The Company and the bank enter into a long-term processing service agreement as part of the negotiation process. This agreement governs the Company’s provision of transaction processing services to the alliance. As of December 31, 2017 and 2016, the Company had $35 million and $27 million, respectively, of amounts due from unconsolidated merchant alliances included within "Accounts receivable, net" in the Company's consolidated balance sheets. As of December 31, 2017 and 2016, the Company had $6 million and $7 million, respectively, of amounts due to unconsolidated merchant alliances included within "Accounts payable and accrued liabilities" in the Company's consolidated balance sheets.
Management Agreement
In connection with the 2007 acquisition of the Company by affiliates of KKR, the Company entered into a management agreement with KKR and one of its affiliates (Management Agreement) pursuant to which KKR provided advisory services to the Company and received fees and reimbursements of related out-of-pocket expenses. The Management Agreement was terminated upon the consummation of the Company's initial public offering in October 2015 and FDC is no longer required to pay management fees to KKR. In the year ended December 31, 2015, the Company, inclusive of the termination fee paid in October 2015, paid $98 million of management fees to KKR.
Relationship with KKR Capital Markets
For the years ended December 31, 2017, 2016, and 2015, KKR Capital Markets LLC, an affiliate of KKR, acted as an arranger and bookrunner for various financing transactions under the existing credit agreements, and as an initial purchaser of certain existing notes issued by the Company, and received underwriter and transaction fees totaling $1.5 million, $17 million, and $25 million, respectively.
For the year ended December 31, 2015 KKR Capital Markets LLC also acted as a placement agent in the Company's initial public offering for placement of the Company's Class A common stock and in the private placement of shares of Holdings' Class B common stock. For the year ended December 31, 2015, the Company paid $19 million related to such services.
Note 10: Other Operating Expenses
The following table details the components of “Other operating expenses” in the consolidated statements of operations:
|
| | | | | | | | | | | | |
| | Year ended December 31, |
(in millions) | | 2017 | | 2016 | | 2015 |
Restructuring, net | | $ | 83 |
| | $ | 49 |
| | $ | 53 |
|
Deal and deal integration costs | | 27 |
| | — |
| | — |
|
Asset impairment | | 13 |
| | — |
| | — |
|
Other | | 20 |
| | 2 |
| | — |
|
Other operating expenses | | $ | 143 |
| | $ | 51 |
| | $ | 53 |
|
Restructuring
During the years ended December 31, 2017, 2016, and 2015, the Company recorded restructuring charges in connection with ongoing expense management initiatives and the vast majority of costs incurred are severance related. The Company continues to evaluate operating efficiencies and could incur further restructuring costs beyond these initiatives.
A summary of net pretax benefits (charges), incurred by segment, for each period is as follows:
|
| | | | | | | | | | | | |
| | Year ended December 31, |
(in millions) | | 2017 | | 2016 | | 2015 |
Global Business Solutions | | $ | (36 | ) | | $ | (9 | ) | | $ | (20 | ) |
Global Financial Solutions | | (17 | ) | | (10 | ) | | (11 | ) |
Network & Security Solutions | | (8 | ) | | (3 | ) | | (3 | ) |
Corporate | | (22 | ) | | (27 | ) | | (19 | ) |
Restructuring, net | | $ | (83 | ) | | $ | (49 | ) | | $ | (53 | ) |
The following table summarizes the Company’s utilization of restructuring accruals for the years ended December 31, 2016 and 2017:
|
| | | | | | | | |
(in millions) | | Employee Severance | | Other |
Remaining accrual as of January 1, 2016 | | $ | 29 |
| | $ | 1 |
|
Restructuring, net | | 33 |
| | 16 |
|
Loss on sale of property and equipment, net | | — |
| | (13 | ) |
Cash payments and other | | (53 | ) | | (4 | ) |
Remaining accrual as of December 31, 2016 | | 9 |
| | — |
|
Restructuring, net | | 83 |
| | — |
|
Cash payments and other | | (71 | ) | | — |
|
Remaining accrual as of December 31, 2017 | | $ | 21 |
| | $ | — |
|
Deal and Deal Integration Costs
During 2017, the Company completed three acquisitions, the two largest were CardConnect and BluePay. In connection with these acquisitions, the Company incurred $27 million in deal and deal integration costs for the year ended December 31, 2017. Deal and deal integration costs include asset impairment of $9 million, banker fees and other costs to close the transaction of $7 million, and other integration costs. Refer to note 12 "Acquisitions and Dispositions" of these consolidated financial statements for details regarding the Company's acquisitions.
Asset Impairment
For the year ended December 31, 2017, the Company incurred $6 million loss on a prepaid asset related to an early contract terminated and a loss of $7 million related to write down of abandoned technology and property.
Other
For the year ended December 31, 2017, the Company incurred $10 million loss on two customer related matters and $10 million related to earnout expense associated with a previous acquisition.
Note 11: Settlement Assets and Obligations
Settlement assets and obligations result from the Company’s processing services and associated settlement activities, including settlement of payment transactions. Settlement assets are generated principally from merchant services transactions. Certain merchant settlement assets that relate to settlement obligations accrued by the Company are held by partner banks to which the Company does not have legal ownership but has the right to use to satisfy the related settlement obligation. The Company records corresponding settlement obligations for amounts payable to merchants and for payment instruments not yet presented for settlement.
The principal components of the Company’s settlement assets and obligations were as follows:
|
| | | | | | | | |
| | As of December 31, |
(in millions) | | 2017 | | 2016 |
Settlement assets: | | |
| | |
|
Cash and cash equivalents | | $ | 1,738 |
| | $ | 1,620 |
|
Due from card associations, bank partners, and merchants | | 18,625 |
| | 13,175 |
|
Total settlement assets | | $ | 20,363 |
| | $ | 14,795 |
|
Settlement obligations: | | | | |
|
Payment instruments outstanding | | $ | 11 |
| | $ | 12 |
|
Card settlements due to merchants | | 20,352 |
| | 14,783 |
|
Total settlement obligations | | $ | 20,363 |
| | $ | 14,795 |
|
The changes in settlement assets and obligations are presented on a net basis within operating activities in the consolidated statements of cash flows. However, because the changes in the settlement assets balance exactly offset changes in settlement obligations, the activity nets to zero.
Note 12: Acquisitions and Dispositions
Acculynk Acquisition
On May 1, 2017, the Company acquired 100% of Accullink Inc. (Acculynk), a leading technology company that delivers eCommerce solutions for debit card acceptance. The acquisition included Acculynk's PaySecure debit routing technology and its range of other services. The purchase price was approximately $85 million and Acculynk is reported as part of the Company's Global Business Solutions segment.
CardConnect Acquisition
On July 6, 2017, the Company acquired 100% of CardConnect Corp. (CardConnect) for $763 million in cash, net of cash acquired. CardConnect is an innovative provider of payment processing and technology solutions and was one of the Company's largest distribution partners. The transaction is expected to enable the Company to bring innovative partner management tools to improve merchant retention, accelerate the Company's firm-wide independent software vendor (ISV) initiative and bring immediate capabilities in enterprise resource planning (ERP) integrated payment solutions to its customers. CardConnect operations are reported as part of the Company's Global Business Solutions segment.
The acquisition was accounted for as business combination and this accounting is substantially complete. In addition to the purchase price, the Company issued $44 million in the form of stock based compensation to certain key employees of CardConnect, which is subject to service vesting conditions including continued employment with the Company. The value assigned to the common stock is being recorded as post-acquisition compensation expense and has been excluded from the total purchase price.
The following table summarizes the fair values of the assets acquired and liabilities assumed on the acquisition date. The excess of the purchase price over the net tangible and identifiable intangible assets' fair value was recorded as goodwill within the Company’s Global Business Solutions segment. The goodwill recognized was attributable to increased synergies that are expected to be achieved from the integration of CardConnect as well as potential revenue enhancements to the Company.
The Company accounted for the business combination as follows:
|
| | | | |
(in millions) | | |
Other current assets | | $ | 58 |
|
Property and equipment | | 7 |
|
Intangible assets | | 463 |
|
Goodwill | | 432 |
|
Current liabilities | | (58 | ) |
Deferred tax liabilities | | (139 | ) |
The following table sets forth the components of the intangible assets associated with the acquisition as of the acquisition date:
|
| | | | | | |
(in millions) | | Acquisition-Date Fair Value | | Useful Life (Years) |
Agent relationships | | $ | 296 |
| | 18 |
Merchant relationships | | 84 |
| | 7 |
Software systems | | 39 |
| | 5 |
Residual buyouts | | 23 |
| | 4 |
Trade name | | 21 |
| | 9 |
| | $ | 463 |
| | |
In connection with the closing of the acquisition, the Company incurred $6 million of transactions costs, which has been included as deal and deal integration costs within "Other operating expenses" in the consolidated statement of operations for the year ended December 31, 2017.
The revenue and earnings of CardConnect have been included in the Company’s results since the acquisition date and are not material to the Company’s consolidated financial results. Supplemental pro forma results of operations of the combined entities have not been presented as the financial impact to the Company’s consolidated financial statements would be immaterial.
BluePay Acquisition
On December 1, 2017, the Company acquired 100% of BluePay Holdings, Inc. (BluePay) for $759 million in cash, net of cash acquired. BluePay is a provider of technology-enabled payment processing for merchants in the U.S. and Canada and was one of the Company's largest distribution partners with a strong focus on software-enabled payments and card-not-present transactions. The transaction is expected to be highly complementary to the Company's earlier acquisition of CardConnect and enhance the Company's suite of innovative partner management tools to improve merchant retention, accelerate the Company's firm-wide ISV initiative and bring immediate capabilities in ERP integrated payment solutions to its customers. BluePay operations are reported as part of the Company's Global Business Solutions segment.
The acquisition was accounted for as business combination and this accounting is substantially complete. In addition to the purchase price, the Company issued $26 million in the form of stock based compensation to certain key employees of BluePay, which is subject to service vesting conditions including continued employment with the Company. The value assigned to the common stock will be recorded as post-acquisition compensation expense and has been excluded from the total purchase price.
The following table summarizes the fair values of the assets acquired and liabilities assumed on the acquisition date. The excess of the purchase price over the net tangible and identifiable intangible assets' fair value was recorded as goodwill within the Company’s Global Business Solutions segment. The goodwill recognized was attributable to increased synergies that are expected to be achieved from the integration of BluePay as well as potential revenue enhancements to the Company.
The Company accounted for the business combination as follows:
|
| | | | |
(in millions) | | |
Other current assets | | $ | 27 |
|
Property and equipment | | 3 |
|
Intangible assets | | 450 |
|
Goodwill | | 389 |
|
Current liabilities | | (25 | ) |
Deferred tax liabilities | | (85 | ) |
The following table sets forth the components of the intangible assets associated with the acquisition as of the acquisition date:
|
| | | | | | |
(in millions) | | Acquisition-Date Fair Value | | Useful Life (Years) |
Agent relationships | | $ | 195 |
| | 18 |
Merchant relationships | | 216 |
| | 10 |
Software systems | | 27 |
| | 5 |
Trade name | | 12 |
| | 5 |
| | $ | 450 |
| | |
In connection with the closing of the acquisition, the Company incurred $1 million of transactions costs, which has been included as deal and deal integration costs within "Other operating expenses" in the consolidated statement of operations for the year ended December 31, 2017.
The revenue and earnings of BluePay have been included in the Company’s results since the acquisition date and are not material to the Company’s consolidated financial results. Supplemental pro forma results of operations of the combined entities have not been presented as the financial impact to the Company’s consolidated financial statements would be immaterial.
Baltics Divestiture
On September 27, 2017, the Company divested all of its businesses in Lithuania, Latvia and Estonia for €73 million (approximately $85 million), subject to closing adjustments. The businesses were reported within the GFS segment.
Online Banking
On October 2, 2017, the Company formed a digital banking joint venture, named Apiture, which combines FDC and Live Oak Bancshares, Inc. digital banking platforms, products, and services, delivering innovative technology solutions tailored for financial institutions. The joint venture will be accounted for as an equity method investment, as Apiture is owned and managed equally between the Company and Live Oak Bancshares, Inc. As a result, the contributed digital banking business will no longer be consolidated into the Company’s results. During the twelve months ended December 31, 2016, the Company’s digital banking business had revenue and operating income of $57 million and $11 million, respectively. Associated with the transaction, the Company recognized a $18 million gain on the formation of the joint venture, included within "Other income" in the consolidated statement of operations. The gain recognized represents the excess investment value over assets contributed.
2016 Dispositions
On September 30, 2016, the Company completed the sale of its Australian ATM business, which was reported as part of the Company's Global Business Solutions segment. Associated with the transaction, the Company recognized a $34 million loss on the sale, included within "Other income" in the consolidated statement of operations. The loss is comprised of investments of $72 million reduced by cash proceeds of $38 million. The cash proceeds are reflected within "Proceeds from dispositions" within the consolidated statement of cash flows.
2015 Acquisitions
On June 9, 2015, the Company acquired Transaction Wireless, Inc. (TWI) a provider of digital stored value products that offers gift card programs, loyalty incentives, and integrated marketing solutions for retailers, partners, and consumers. The purchase price was approximately $62 million in cash. The acquisition is reported in the Company's Network & Security Solutions segment.
In addition to TWI, the Company also completed an acquisition of a webstore builder as well as an acquisition of a wholesale independent sales organization, both of which are reported in the Company's Global Business Solutions segment.
Note 13: Derivative Financial Instruments
The Company enters into the following types of derivatives:
| |
• | Floating to fixed interest rate collar contracts: The Company uses interest rate collar contracts to mitigate its exposure to interest rate fluctuations on interest payments related to variable rate debt. No payments or receipts are exchanged on interest rate collar contracts unless interest rates rise or fall to exceed a predetermined ceiling or floor rate. The Company uses these contracts in a qualifying hedging relationship. |
| |
• | Foreign exchange contracts: The Company uses cross-currency swaps to protect the net investment in certain foreign subsidiaries and/or affiliates with respect to changes in foreign currency exchange rates. The Company uses these contracts in both qualifying and non-qualifying hedging relationships. |
The Company held the following derivative instruments as of the dates indicated:
|
| | | | | | | | | | | | | | | | | | | | | | | | | | |
| | As of December 31, |
| | 2017 | | 2016 |
(in millions) | | Notional Currency | | Notional Value | | Assets (a) | | Liabilities (a) | | Notional Currency | | Notional Value | | Assets (a) | | Liabilities (a) |
Derivatives designated as hedges of net investments in foreign operations: | | | | | | |
| | |
| | | | |
| | |
| | |
|
Foreign exchange contracts (c) | | AUD | | 100 |
| | $ | 28 |
| | $ | — |
| | AUD | | 211 |
| | $ | 57 |
| | $ | — |
|
Foreign exchange contracts (b) | | EUR | | 915 |
| | — |
| | 76 |
| | EUR | | — |
| | — |
| | — |
|
Foreign exchange contracts (c) | | GBP | | 150 |
| | — |
| | 6 |
| | GBP | | 300 |
| | 78 |
| | — |
|
Foreign exchange contracts (c) | | CAD | | 95 |
| | — |
| | 2 |
| | CAD | | 130 |
| | 9 |
| | — |
|
| | | | | | 28 |
| | 84 |
| | | | | | 144 |
| | — |
|
Derivatives designated as cash flow hedges: | | | | | | | | | | | | | | | | |
Interest rate collar contracts (d) | | USD | | 4,300 |
| | 12 |
| | — |
| | USD | | 3,000 |
| | 3 |
| | — |
|
| | | | | | $ | 40 |
| | $ | 84 |
| | | | | | $ | 147 |
| | $ | — |
|
| |
(a) | The Company's derivatives are subject to master netting agreements to the extent that the swaps are with the same counterparty. The terms of those agreements require that the Company net settle the outstanding positions at the option of the counterparty upon certain events of default. |
| |
(b) | The Company entered into new foreign exchange contracts with a notional value of EUR 915 million on June 14, 2017. |
| |
(c) | Three cross-currency swaps matured in April 2017 (notional values of AUD 111 million, GBP 150 million and CAD 35 million). The Company received $90 million related to these swaps. |
(d) The Company entered into new interest rate collar contracts with a notional value of $1.3 billion and $1.5 billion expiring in January 2019 and September 2018, respectively. The Company's remaining $1.5 billion interest rate collar contract expires in September 2019.
The maximum length of time over which the Company is hedging its currency exposure of net investments in foreign operations, through utilization of foreign exchange contracts, is through June 2020.
The maximum length of time over which the Company is hedging its exposure to the variability in future cash flows for forecasted transactions related to the payment of variable interest on existing financial instruments is through September 2019.
As of December 31, 2017, the Company has not posted any collateral related to any of its derivative financial instruments.
Fair Value Measurement
The carrying amounts for the Company's derivative financial instruments are the estimated fair value of the financial instruments. The Company’s derivatives are not exchange listed and therefore the fair value is estimated under an income approach using Bloomberg analytics models that are based on readily observable market inputs. These models reflect the contractual terms of the derivatives, such as notional value and expiration date, as well as market-based observables including interest and foreign currency exchange rates, yield curves, and the credit quality of the counterparties. The models also incorporate the Company’s creditworthiness in order to appropriately reflect non-performance risk. Inputs to the derivative pricing models are generally observable and do not contain a high level of subjectivity and, accordingly, the Company’s derivatives were classified within Level 2 of the fair value hierarchy. While the Company believes its estimates result in a reasonable reflection of the fair value of these instruments, the estimated values may not be representative of actual values that could have been realized or that will be realized in the future.
Effect of Derivative Instruments on the Consolidated Financial Statements
Derivative gains and (losses) were as follows for the periods indicated:
|
| | | | | | | | | | | | | | | | | | | | | | | | |
| | Year ended December 31, |
| | 2017 | | 2016 | | 2015 |
(in millions, pretax) | | Interest Rate Contracts | | Foreign Exchange Contracts | | Interest Rate Contracts | | Foreign Exchange Contracts | | Interest Rate Contracts | | Foreign Exchange Contracts |
Derivatives designated as hedging instruments: | | |
| | |
| | |
| | |
| | |
| | |
|
(Loss) gain recognized in "Foreign currency translation adjustment" in the consolidated statements of comprehensive income (loss) (effective portion) | | $ | — |
| | $ | (98 | ) | | $ | — |
| | $ | 58 |
| | $ | — |
| | $ | 79 |
|
Gain recognized in "Derivative instruments" in the consolidated statements of comprehensive income (loss) (effective portion) (a) | | 9 |
| | — |
| | 3 |
| | — |
| | — |
| | — |
|
Derivatives not designated as hedging instruments: | | |
| | |
| | |
| | |
| | |
| | |
|
(Loss) gain recognized in "Other income" in the consolidated statements of operations | | $ | — |
| | $ | — |
| | $ | (5 | ) | | $ | — |
| | $ | (19 | ) | | $ | 2 |
|
| |
(a) | Interest rate collar contracts. |
Accumulated Derivative Gains and Losses
The following table summarizes activity in other comprehensive income for the years ended December 31, 2017, 2016, and 2015 related to derivative instruments classified as cash flow hedges and net investment hedges held by the Company:
|
| | | | | | | | | | | | |
| | Year ended December 31, |
(in millions, after tax) | | 2017 | | 2016 | | 2015 |
Accumulated gain included in other comprehensive income (loss) at beginning of the period | | $ | 177 |
| | $ | 116 |
| | $ | 67 |
|
(Decrease) increase in fair value of derivatives that qualify for hedge accounting, net of tax (a) (b) | | (56 | ) | | 61 |
| | 49 |
|
Accumulated gain included in other comprehensive income at end of the period | | $ | 121 |
| | $ | 177 |
| | $ | 116 |
|
| |
(a) | Gains are included in "Derivative instruments" and “Foreign currency translation adjustment” on the consolidated statements of comprehensive income (loss). |
| |
(b) | Net of $33 million and $0 million tax benefit for the years ended December 31, 2017 and 2016, respectively. Net of $30 million of the tax expense for the year ended December 31, 2015. |
Note 14: Commitments and Contingencies
Operating Leases
The Company leases certain of its facilities and equipment under operating lease agreements, substantially all of which contain renewal options and escalation provisions. The Company incurred total rent expense of $80 million, $79 million, and $78 million for the years ended December 31, 2017, 2016, and 2015, respectively. Future minimum aggregate rental commitments as of December 31, 2017 under all noncancelable operating leases, net of sublease income are due in the following years:
|
| | | | |
Year ended December 31, (in millions) | | Amount |
2018 | | $ | 63 |
|
2019 | | 59 |
|
2020 | | 45 |
|
2021 | | 39 |
|
2022 | | 35 |
|
Thereafter | | 105 |
|
Total | | $ | 346 |
|
Sublease income is earned from leased space and leased equipment, which the Company concurrently subleases to third parties with comparable time periods. For the years ended December 31, 2017, 2016, and 2015 sublease amounts totaled less than $5 million in the Company's obligations. In addition, the Company has certain guarantees embedded in leases and other agreements wherein the Company is required to relieve the counterparty in the event of changes in the tax code or rates. The Company believes the fair value of such guarantees is insignificant due to the likelihood and extent of the potential changes.
Letters of Credit
The Company has $29 million in outstanding letters of credit as of December 31, 2017, all of which were issued under the Company’s senior secured revolving credit facility and expire prior to December 15, 2018 with a 1 year renewal option. The letters of credit are held in connection with lease arrangements, bankcard association agreements, and other security agreements. The Company expects to renew most of the letters of credit prior to expiration.
Legal
The Company is involved in various legal proceedings. Accruals have been made with respect to these matters, where appropriate, which are reflected in the Company’s consolidated financial statements. The Company may enter into discussions regarding settlement of these matters, and may enter into settlement agreements, if it believes settlement is in the best interest of the Company. The matters discussed below, if decided adversely to or settled by the Company, individually or in the aggregate, may result in liability material to the Company’s financial condition and/or results of operations.
There are asserted claims against the Company where an unfavorable outcome is considered to be reasonably possible. These claims can generally be categorized in the following areas: (1) patent infringement which results from claims that the Company is using technology that has been patented by another party; (2) merchant customer matters often associated with alleged processing errors or disclosure issues and claims that one of the subsidiaries of the Company has violated a federal or state requirement regarding credit reporting or collection in connection with its check verification guarantee, and collection activities; and (3) other matters which may include issues such as employment. The Company's estimates of the possible ranges of losses in excess of any amounts accrued are $0 to $3 million for patent infringement, $0 to $100 million for merchant customer matters, and $0 to $5 million for other matters, resulting in a total estimated range of possible losses of $0 to $108 million for all of the matters described above.
The estimated range of reasonably possible losses is based on information currently available and involves elements of judgment and significant uncertainties. As additional information becomes available and the resolution of the uncertainties becomes more apparent, it is possible that actual losses may exceed even the high end of the estimated range.
Other
In the normal course of business, the Company is subject to claims and litigation, including indemnification obligations to purchasers of former subsidiaries. Management of the Company believes that such matters will not have a material adverse effect on the Company’s results of operations, liquidity or financial condition.
Note 15: Employee Benefit Plans
Defined Contribution Plans
The Company maintains defined contribution benefit plans covering virtually all of the Company’s U.S. employees and defined contribution pension plans for international employees primarily in the United Kingdom and Australia. The plans provide tax-deferred amounts for each participant, consisting of employee elective contributions, Company matching and discretionary Company contributions. Effective January 1, 2014, the Company suspended matching contributions for all U.S. participants. As a result, the U.S. Plan is no longer a safe harbor plan.
The following table presents the aggregate amounts charged to expense in connection with these plans:
|
| | | | |
Year ended December 31, (in millions) | | Amount |
2017 | | $ | 10 |
|
2016 | | 11 |
|
2015 | | 12 |
|
Defined Benefit Plans
The Company has defined benefit pension plans which are frozen and covers certain full-time employees in the United Kingdom and the U.S. The Company also has separate plans covering certain employees located primarily in Germany, Greece, and Austria.
The Company contributed cash in the amount of $19 million, $19 million, and $12 million to defined benefit plans for the years ended December 31, 2017, 2016, and 2015, respectively.
The Company recognizes the funded status of its defined benefit pension plans, measured as the difference between the fair value of the plan assets and the projected benefit obligation, in the consolidated balance sheets, as follows:
|
| | | | | | | | |
| | As of December 31, |
(in millions) | | 2017 | | 2016 |
U.K. plan: | | |
| | |
|
Plan benefit obligations | | $ | (686 | ) | | $ | (713 | ) |
Fair value of plan assets | | 891 |
| | 808 |
|
Net pension assets (a) | | 205 |
| | 95 |
|
| | | | |
U.S. and other foreign plans: | | | | |
|
Plan benefit obligations | | (234 | ) | | (222 | ) |
Fair value of plan assets | | 166 |
| | 137 |
|
Net pension liabilities (b) | | (68 | ) | | (85 | ) |
Funded status of the plans | | $ | 137 |
| | $ | 10 |
|
| |
(a) | Pension assets are included in “Other long-term assets” of the consolidated balance sheets. |
| |
(b) | Pension liabilities are included in “Other long-term liabilities” of the consolidated balance sheets. |
The accumulated benefit obligation for all defined benefit pension plans was $920 million and $935 million as of December 31, 2017 and 2016, respectively.
Based on the valuation techniques described in note 1 "Summary of Significant Accounting Policies," as of December 31, 2017, Plan assets are comprised of approximately 20% of Level 1 securities, 80% of Level 2 securities, and an immaterial amount of Level 3 securities which comprise less than 1% of total plan assets.
The Plan paid benefits in the amount of $59 million, $39 million, and $41 million for the periods ended December 31, 2017, 2016, and 2015, respectively. The estimated future benefit payments, which reflect expected future service, are expected to be as follows:
|
| | | | |
Year ended December 31, (in millions) | | Amount |
2018 | | $ | 47 |
|
2019 | | 48 |
|
2020 | | 49 |
|
2021 | | 50 |
|
2022 | | 52 |
|
2023-2027 | | 282 |
|
The Company's post-retirement health care and other insurance benefits for retired employees are limited and not material.
Note 16: Supplemental Financial Information
Supplemental Consolidated Statements of Operations Information
The following table details the components of “Other income” on the consolidated statements of operations:
|
| | | | | | | | | | | | |
| | Year ended December 31, |
(in millions) | | 2017 | | 2016 | | 2015 |
Investment gains | | $ | 1 |
| | $ | 35 |
| | $ | — |
|
Derivatives | | — |
| | (5 | ) | | (17 | ) |
Divestitures | | 18 |
| | (34 | ) | | 5 |
|
Non-operating foreign currency (loss) gains | | (1 | ) | | 19 |
| | 41 |
|
Other miscellaneous (expense) income | | (2 | ) | | 2 |
| | — |
|
Other income | | $ | 16 |
| | $ | 17 |
| | $ | 29 |
|
Investment gains
On June 21, 2016, Visa Inc. (Visa) acquired Visa Europe (VE), of which the Company was a member and shareholder through certain subsidiaries. On June 21, 2016, the Company received cash of €24.2 million ($27 million equivalent at June 21, 2016) and Visa preferred stock which is convertible into Visa common shares. The Company will also receive a deferred payment three years after the closing date of the acquisition, valued at approximately €2.3 million ($2.6 million equivalent at June 21, 2016). As of June 21, 2016, the Class A common stock equivalent of the preferred stock was approximately $19 million. However, the preferred shares have been assigned a value of zero based on transfer restrictions and Visa's ability to adjust the conversion ratio dependent on the outcome of existing and potential litigations in the Visa Europe territory over the next 11 years.
Divestitures
See note 12 "Acquisitions and Dispositions" of these consolidated financial statements for more information on the Company's significant divestitures.
Supplemental Consolidated Balance Sheet Information
|
| | | | | | | | |
| | As of December 31, |
(in millions) | | 2017 | | 2016 |
Prepaid expenses and other current assets: | | | | |
|
Prepaid expenses | | $ | 156 |
| | $ | 168 |
|
Inventory | | 98 |
| | 77 |
|
Other | | 81 |
| | 115 |
|
Total Prepaid expenses and other current assets | | $ | 335 |
| | $ | 360 |
|
| | | | |
Property and equipment: | | | | |
|
Land | | $ | 58 |
| | $ | 56 |
|
Buildings | | 270 |
| | 269 |
|
Leasehold improvements | | 96 |
| | 89 |
|
Equipment and furniture | | 1,508 |
| | 1,386 |
|
Equipment under capital lease | | 607 |
| | 499 |
|
Property and equipment | | 2,539 |
| | 2,299 |
|
Less: Accumulated depreciation | | (1,588 | ) | | (1,416 | ) |
Total Property and equipment, net of accumulated depreciation | | $ | 951 |
| | $ | 883 |
|
| | | | |
Accounts payable and accrued liabilities: | | | | |
|
Accounts payable | | $ | 247 |
| | $ | 206 |
|
Accrued interest expense | | 154 |
| | 169 |
|
Other accrued expenses | | 712 |
| | 685 |
|
Other | | 546 |
| | 504 |
|
Total Accounts payable and accrued liabilities | | $ | 1,659 |
| | $ | 1,564 |
|
Note 17: Investment in Affiliates
Segment results include the Company’s proportionate share of income from affiliates, which consist of unconsolidated investments accounted for under the equity method of accounting. The most significant of these affiliates are related to the Company’s merchant bank alliance program.
A merchant alliance, as it pertains to investments accounted for under the equity method, is an agreement between the Company and a financial institution that combines the processing capabilities and management expertise of the Company with the visibility and distribution channel of the bank. The alliance acquires credit and debit card transactions from merchants. The Company provides processing and other services to the alliance and charges fees to the alliance primarily based on contractual pricing. These fees have been separately identified on the face of the consolidated statements of operations.
As of December 31, 2017, there were sixteen affiliates accounted for under the equity method of accounting, comprised of five merchant alliances and eleven strategic investments in companies in related markets.
The Wells Fargo alliance met the Significant Subsidiary test provided in Regulations S-X Rule 1-02 (w) in that the Company's equity earnings of this alliance exceeded 20% of the Company's consolidated income from continuing operations before income taxes for the year ended December 31, 2017.
A summary of financial information for the merchant alliances and other affiliates accounted for under the equity method of accounting is presented below:
|
| | | | | | | | |
| | As of December 31, |
(in millions) | | 2017 | | 2016 |
Total current assets | | $ | 5,427 |
| | $ | 4,070 |
|
Total long-term assets | | 239 |
| | 84 |
|
Total assets | | $ | 5,666 |
| | $ | 4,154 |
|
| | | | |
Total current liabilities | | $ | 5,347 |
| | $ | 3,994 |
|
Total long-term liabilities | | 8 |
| | 9 |
|
Total liabilities | | $ | 5,355 |
| | $ | 4,003 |
|
The primary components of assets and liabilities are settlement-related accounts similar to those described in note 11 "Settlement Assets and Obligations" of these consolidated financial statements.
|
| | | | | | | | | | | | |
| | Year ended December 31, |
(in millions) | | 2017 | | 2016 | | 2015 |
Net operating revenues | | $ | 1,374 |
| | $ | 1,434 |
| | $ | 1,424 |
|
Operating expenses | | 712 |
| | 666 |
| | 666 |
|
Operating income | | $ | 662 |
| | $ | 768 |
| | $ | 758 |
|
Net income | | $ | 646 |
| | $ | 749 |
| | $ | 744 |
|
FDC equity earnings | | 222 |
| | 260 |
| | 239 |
|
The formation of a merchant alliance accounted for under the equity method of accounting generally involves the Company and/or a financial institution contributing merchant contracts to the alliance and a cash payment from one owner to the other to achieve the desired ownership percentages. The asset amounts reflected above are owned by the alliances and other equity method investees and do not include any of such payments made by the Company. The amount by which the total of the Company’s investments in affiliates exceeded its proportionate share of the investees’ net assets was approximately $0.9 billion and $1.0 billion as of December 31, 2017 and 2016, respectively.
The non-goodwill portion of this amount is considered an identifiable intangible asset that is amortized. The estimated future amortization expense for these intangible assets as of December 31, 2017 is as follows:
|
| | | | |
Year ended December 31, (in millions) | | Amount |
2018 | | $ | 29 |
|
2019 | | 4 |
|
These amounts assume that these alliances continue as they currently exist. Much of the difference between the Company's proportionate share of the investees’ net income and the Company's equity earnings noted above relates to this amortization.
Note 18: Selected Quarterly Financial Results (Unaudited)
The following tables show a summary of the Company’s quarterly financial information for each of the four quarters of 2017 and 2016:
|
| | | | | | | | | | | | | | | | |
| | 2017 |
(in millions, except per share amounts) | | First | | Second | | Third | | Fourth |
Revenues | | $ | 2,801 |
| | $ | 3,025 |
| | $ | 3,076 |
| | $ | 3,150 |
|
Expenses | | 2,475 |
| | 2,558 |
| | 2,659 |
| | 2,652 |
|
Operating profit | | $ | 326 |
| | $ | 467 |
| | $ | 417 |
| | $ | 498 |
|
Net income (loss) | | $ | 79 |
| | $ | 243 |
| | $ | 340 |
| | $ | 1,002 |
|
Net income (loss) attributable to First Data Corporation | | 36 |
| | 185 |
| | 296 |
| | 948 |
|
Net income (loss) per share: | | | | | | | | |
Basic | | 0.04 |
| | 0.20 |
| | 0.32 |
| | 1.03 |
|
Diluted | | 0.04 |
| | 0.20 |
| | 0.31 |
| | 1.00 |
|
| | | | | | | | |
| | 2016 |
(in millions, except per share amounts) | | First | | Second | | Third | | Fourth |
Revenues | | $ | 2,777 |
| | $ | 2,928 |
| | $ | 2,936 |
| | $ | 2,943 |
|
Expenses | | 2,539 |
| | 2,498 |
| | 2,482 |
| | 2,453 |
|
Operating profit | | $ | 238 |
| | $ | 430 |
| | $ | 454 |
| | $ | 490 |
|
Net (loss) income | | $ | (6 | ) | | $ | 215 |
| | $ | 200 |
| | $ | 251 |
|
Net (loss) income attributable to First Data Corporation | | (56 | ) | | 152 |
| | 132 |
| | 192 |
|
Net (loss) income per share: | | | | | | | | |
Basic | | (0.06 | ) | | 0.17 |
| | 0.15 |
| | 0.21 |
|
Diluted | | (0.06 | ) | | 0.17 |
| | 0.14 |
| | 0.21 |
|
(Sum of the quarters may not tie to FY due to rounding)
The change in net income during the fourth quarter of 2017 was primarily driven by the release of a valuation allowances associated with the Company's deferred tax assets.
Note 19: Subsequent Events
On April 24, 2018, the Company and the Internal Revenue Service reached an agreement regarding the audit of its federal tax returns for the years 2005-2007, which resulted in a $107 million income tax benefit. The Company recorded this income tax benefit in the second quarter of 2018.
In the second quarter of 2018, the Company entered into an agreement to divest its card processing business in Central and Southeastern Europe for proceeds of approximately €375 million (the U.S. dollar equivalent is approximately $435 million), subject to closing adjustments. The divestiture does not represent a strategic shift that will have a major effect on the Company’s operations and financial statements. The total assets to be divested in the sale, including goodwill, are expected to be $246 million. The card processing business in Central and Southeastern Europe is reported within the GFS segment. The transaction is expected to close in the third quarter of 2018.
On July 26, 2018, the Company amended its Accounts Receivable Securitization Program (“Securitization”) to extend the maturity from June 30, 2020 to July 31, 2021. In addition, under the amended terms, loans under the Securitization will accrue interest at a rate that is 1.15% higher than either LIBOR, down from LIBOR plus 1.5% under the previous agreement, or a base rate equal to the highest of (i) the applicable lender’s “reference” or “prime” rate, or (ii) the federal funds rate plus 0.50%. The Securitization also includes an unused fee at a rate that ranges from 45 to 90 basis points depending on the level of utilization under the Securitization.
FIRST DATA CORPORATION
SCHEDULE II—Valuation and Qualifying Accounts
|
| | | | | | | | | | | | | | | | | | | | | |
| | | | Additions | | Deductions | | |
Description (in millions) | | Balance at Beginning of Period | | Charged to Costs and Expenses | | Reclassifications from Other Accounts (a) | | | Write-offs Against Assets | | Balance at End of Period |
Year ended December 31, 2017 deducted from receivables | | $ | 87 |
| | $ | 82 |
| | $ | 1 |
| | | $ | 116 |
| | $ | 54 |
|
Year ended December 31, 2016 deducted from receivables | | 83 |
| | 85 |
| | 1 |
| | | 82 |
| | 87 |
|
Year ended December 31, 2015 deducted from receivables | | 72 |
| | 79 |
| | 3 |
| | | 71 |
| | 83 |
|
| |
(a) | Amounts related to reclassifications from "Accounts payable and accrued liabilities" to "Allowance for doubtful accounts" in the Company's consolidated balance sheets. |


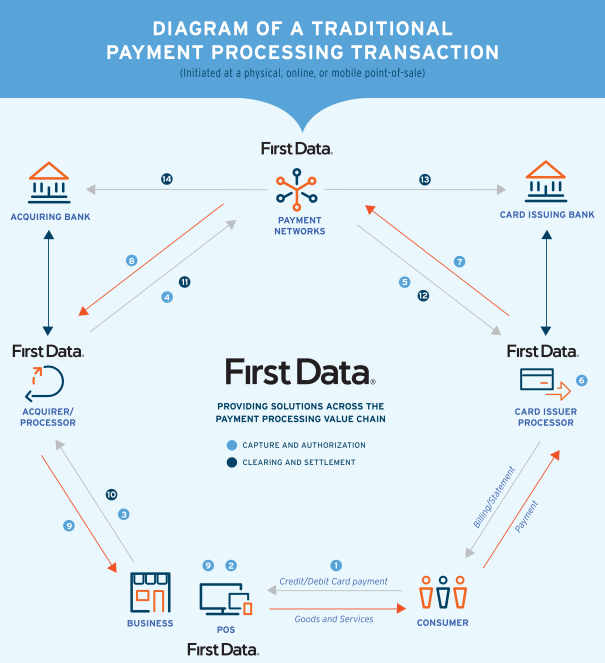
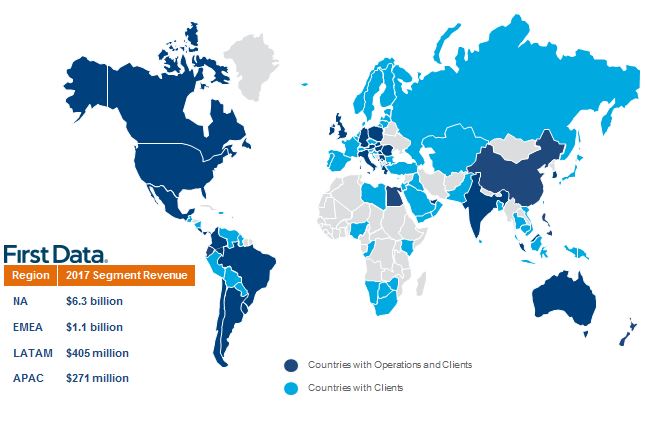 North America