
Summary Prospectus
Small Cap Growth Stock Fund
AUGUST 1, 2014
Class / Ticker Symbol
A / SCGIX C / SSCFX I / SSCTX IS / SCGZX
Before you invest, you may want to review the Fund’s Prospectus and Statement of Additional Information, which contain more information about the Fund and its risks. You can find the Fund’s Prospectus, Statement of Additional Information and other information about the Fund online at http://www.ridgeworth.com/resources/regulatory-tax-info. You can also get this information at no cost by calling the Funds at 1-888-784-3863 or by sending an email request to info@ridgeworth.com. The current Prospectus and Statement of Additional Information, dated August 1, 2014, are incorporated by reference into this summary prospectus.
Investment Objective
The Small Cap Growth Stock Fund (the “Fund”) seeks to provide long-term capital appreciation.
Fees and Expenses of the Fund
This table describes the fees and expenses that you may pay if you buy and hold shares of the Fund. You may qualify for sales charge discounts if you and your family invest, or agree to invest in the future, at least $50,000 in RidgeWorth Funds. More information about these and other discounts is available from your financial professional and in Sales Charges on page 38 of the Fund’s prospectus and Rights of Accumulation on page 75 of the Fund’s statement of additional information.
| Shareholder Fees (fees paid directly from your investment) | ||||||||
| A Shares | C Shares | I Shares | IS Shares | |||||
| Maximum Sales Charge (load) Imposed on Purchases (as a % of offering price) | 5.75% | None | None | None | ||||
| Maximum Deferred Sales Charge (load) (as a % of net asset value) | None | 1.00% | None | None | ||||
| Annual Fund Operating Expenses (expenses that you pay each year as a percentage of |
||||||||||||||
| A Shares | C Shares | I Shares | IS Shares | |||||||||||
| Management Fees | 0.85% | 0.85% | 0.85% | 0.85% | ||||||||||
| Distribution (12b-1) Fees | 0.30% | 1.00% | None | None | ||||||||||
| Other Expenses | 0.14% | 0.09% | 0.46% | 0.09% | ||||||||||
|
|
|
|
|
|
|
|
||||||||
| Total Annual Fund Operating Expenses | 1.29% | 1.94% | 1.31% | 0.94% | ||||||||||
| Fee Waivers and/or Expense Reimbursements(1) | — | — | (0.01)% | — | ||||||||||
|
|
|
|
|
|
|
|
||||||||
| Total Annual Fund Operating Expenses after Fee Waivers and/or Expense Reimbursements | 1.29% | 1.94% | 1.30% | 0.94% | ||||||||||
| (1) | The Adviser has contractually agreed to waive fees and reimburse expenses until at least August 1, 2015, in order to keep Total Annual Fund Operating Expenses (excluding, as applicable, taxes, brokerage commissions, substitute dividend expenses on securities sold short, interest expense, extraordinary expenses and Acquired Fund Fees and Expenses) from exceeding 1.55%, 2.20%, 1.30% and 1.05% for the A, C, I and IS Shares, respectively. This agreement shall terminate upon the termination of the Investment Advisory Agreement between RidgeWorth Funds and the Adviser, or it may be terminated upon written notice to the Adviser by RidgeWorth Funds. |
1
Example
This example is intended to help you compare the cost of investing in the Fund with the cost of investing in other mutual funds. The example assumes that you invest $10,000 in the Fund for the time periods indicated. The example also assumes that your investment has a 5% return each year, that the Fund’s operating expenses remain the same and that you reinvest all dividends and distributions. The example reflects contractual fee waivers and reimbursements for the first year only. Although your actual costs may be higher or lower, based on these assumptions your costs would be:
| 1 Year | 3 Years | 5 Years | 10 Years | |||||||||||||
| A Shares |
$ | 699 | $ | 960 | $ | 1,242 | $ | 2,042 | ||||||||
| C Shares |
$ | 297 | $ | 609 | $ | 1,047 | $ | 2,264 | ||||||||
| I Shares |
$ | 132 | $ | 414 | $ | 717 | $ | 1,578 | ||||||||
| IS Shares | $ | 96 | $ | 300 | $ | 520 | $ | 1,155 | ||||||||
You would pay the following expenses if you did not redeem your shares:
| 1 Year | 3 Years | 5 Years | 10 Years | |||||||||||||
| A Shares |
$ | 699 | $ | 960 | $ | 1,242 | $ | 2,042 | ||||||||
| C Shares |
$ | 197 | $ | 609 | $ | 1,047 | $ | 2,264 | ||||||||
| I Shares |
$ | 132 | $ | 414 | $ | 717 | $ | 1,578 | ||||||||
| IS Shares | $ | 96 | $ | 300 | $ | 520 | $ | 1,155 | ||||||||
Portfolio Turnover
The Fund pays transaction costs, such as commissions, when it buys and sells securities (or “turns over” its portfolio). A higher portfolio turnover rate may indicate higher transaction costs and may result in higher taxes when Fund shares are held in a taxable account. These costs, which are not reflected in annual fund operating expenses or in the example, affect the Fund’s performance. During the most recent fiscal year, the Fund’s portfolio turnover rate was 90% of the average value of its portfolio.
Principal Investment Strategies
Under normal circumstances, the Fund invests at least 80% of its net assets (plus any borrowings for investment purposes) in U.S.-traded equity securities of small-capitalization companies. U.S.-traded equity securities may include American Depositary Receipts (“ADRs”). Silvant Capital Management LLC (“Silvant” or the “Subadviser”) considers small-capitalization companies to be companies with market capitalizations similar to those of companies in the Russell 2000® Growth Index. As of July 1, 2014, the market capitalization range of companies in the Russell 2000® Growth Index was between approximately $13.47 million and $4.6 billion.
In selecting investments for purchase and sale, the Subadviser chooses companies that it believes have above-average growth potential to beat expectations as a result of strong business fundamentals, such as revenue growth, improving cash flows, increasing margins and positive earning trends. The Subadviser applies proprietary quantitative models to rank stocks based on improving fundamentals, valuation, capital deployment and efficiency, and sentiment or behavior factors. It then performs in-depth fundamental analysis to determine the quality and sustainability of expectations to determine whether or not the company is poised to beat expectations. The Subadviser uses a “bottom-up” process based on company fundamentals. Risk controls are in place to assist in maintaining a portfolio that is diversified by sector and minimizes unintended risks relative to the primary benchmark.
Principal Investment Risks
You may lose money if you invest in the Fund. A Fund share is not a bank deposit and it is not insured or guaranteed by the Federal Deposit Insurance Corporation or any other government agency.
ADR Risk: Investments in ADRs involve risks similar to those accompanying direct investments in foreign securities. These include the risk that political and economic events unique to a country or region will affect those markets and their issuers.
Equity Securities Risk: The price of equity securities fluctuates from time to time based on changes in a company’s financial condition or overall market and economic conditions. As a result, the value of the Fund’s equity securities may fluctuate drastically from day to day.
Growth Stock Risk: “Growth” stocks can react differently to issuer, political, market and economic developments than the market as a whole and other types of stocks. “Growth” stocks typically are sensitive to market movements because their market prices tend to reflect future expectations. When it appears those expectations will not be met, the prices of growth stocks typically fall.
Small-Capitalization Companies Risk: Small-capitalization stocks tend to perform differently from other segments of the equity market or the equity market as a whole, and can be more volatile than stocks of mid- or large-capitalization companies. Small-capitalization companies may be newer or less established, and may have limited resources, products and markets, and may be less liquid.
2
Performance
The bar chart and the performance table that follow illustrate the risks and volatility of an investment in the Fund. The Fund’s past performance (before and after taxes) does not indicate how the Fund will perform in the future. As of the fiscal year ended March 31, 2014, the Fund had not issued IS Shares. Performance information for IS shares will be included after the share class has been in operation for one complete calendar year. Updated performance information is available by contacting the RidgeWorth Funds at 1-888-784-3863 or by visiting www.ridgeworth.com.
The annual returns in the bar chart which follows are for the I Shares without reflecting payment of any sales charge; if they did reflect such payment of sales charges, annual returns would be lower.
This bar chart shows changes in the performance of the Fund’s I Shares from year to year.*
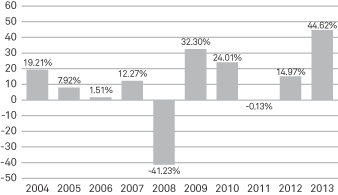
| Best Quarter | Worst Quarter | |
| 18.78% | -28.61% | |
| (6/30/2009) | (12/31/2008) |
| * | The performance information shown above is based on a calendar year. The Fund’s total return for the six months ended June 30, 2014 was -5.01%. |
The following table compares the Fund’s average annual total returns for the periods indicated with those of a broad measure of market performance.
| AVERAGE ANNUAL TOTAL RETURNS (for periods ended December 31, 2013) |
||||||||||||
| 1 Year | 5 Years | 10 Years | ||||||||||
| A Shares Returns Before Taxes | 44.56% | 21.90% | 8.60% | |||||||||
| C Shares Returns Before Taxes | 43.63% | 21.09% | 7.88% | |||||||||
| I Shares Returns Before Taxes | 44.62% | 22.20% | 8.91% | |||||||||
| I Shares Returns After Taxes on Distributions | 36.12% | 20.23% | 6.89% | |||||||||
| I Shares Returns After Taxes on Distributions and Sale of Fund Shares | 29.52% | 18.03% | 7.00% | |||||||||
| Russell 2000® Growth Index (reflects no deduction for fees, expenses or taxes) | 43.30% | 22.58% | 9.41% | |||||||||
After-tax returns are calculated using the historical highest individual U.S. federal marginal income tax rates and do not reflect the impact of state and local taxes. Your actual after-tax returns will depend on your tax situation and may differ from those shown. After-tax returns shown are not relevant to investors who hold their Fund shares through tax-advantaged arrangements, such as 401(k) plans or individual retirement accounts (“IRAs”). After-tax returns are shown for only the I Shares. After-tax returns for other share classes will vary.
Investment Adviser and Subadviser
RidgeWorth Investments is the Fund’s investment adviser (the “Adviser”). Silvant Capital Management LLC is the Fund’s Subadviser.
Portfolio Management
Mr. Christopher Guinther, Chief Investment Officer of Silvant, and Mr. Michael A. Sansoterra, Managing Director of Silvant, have co-managed the Fund since 2007. In addition to Messrs. Guinther and Sansoterra, Mr. Joe Ransom, CFA, Managing Director of Silvant, and Mr. Sandeep Bhatia, PhD, CFA, Director of Silvant, have co-managed the Fund since 2011.
Purchasing and Selling Your Shares
You may purchase or redeem Fund shares on any business day. You may purchase and redeem A, C, I, and IS Shares of the Fund through financial institutions or intermediaries that are authorized to place transactions in Fund shares for their customers or for their own accounts.
3
The minimum initial investment amounts for each share class are shown below, although these minimums may be reduced or waived in some cases.
| Class | Dollar Amount | |
| A Shares | $2,000 | |
| C Shares | $5,000 ($2,000 for IRAs or other tax-advantaged accounts) | |
| I Shares | None | |
| IS Shares | $2,500,000 |
Subsequent investments in A or C Shares must be made in amounts of at least $1,000. The Fund may accept investments of smaller amounts for either class of shares at its discretion. There are no minimums for subsequent investments in I or IS Shares.
Tax Information
The Fund’s distributions are generally taxable as ordinary income, qualified dividend income, or capital gains unless you are investing through a tax-advantaged arrangement, such as a 401(k) plan or an IRA, which may be taxed upon withdrawal.
Payments to Broker-Dealers and Other Financial Intermediaries
If you purchase shares of the Fund through a financial intermediary, such as a broker-dealer or investment adviser, the Fund, the Adviser or the Distributor may pay the intermediary for the sale of Fund shares and related services. These payments may create a conflict of interest by influencing the broker-dealer or other financial intermediary and your salesperson to recommend the Fund over another investment. Ask your financial intermediary or visit your financial intermediary’s website for more information.

|
RFSUM-SCG-0814 |