
Summary Prospectus
Conservative Allocation Strategy
AUGUST 1, 2013
Class / Ticker Symbol
A / SVCAX C / SCCLX I / SCCTX
Before you invest, you may want to review the Fund’s Prospectus and Statement of Additional Information, which contain more information about the Fund and its risks. You can find the Fund’s Prospectus, Statement of Additional Information and other information about the Fund online at http://www.ridgeworth.com/resources/regulatory-tax-info. You can also get this information at no cost by calling the Funds at 1-888-784-3863 or by sending an email request to info@ridgeworth.com. The current Prospectus and Statement of Additional Information, dated August 1, 2013, are incorporated by reference into this summary prospectus.
Investment Objective
The Conservative Allocation Strategy (the “Fund”) seeks to provide a high level of capital appreciation and current income.
Fees and Expenses of the Fund
The following table describes the fees and expenses that you may pay if you buy and hold shares of the Fund. You may qualify for sales charge discounts if you and your family invest, or agree to invest in the future, at least $50,000 in RidgeWorth Funds. More information about these and other discounts is available from your financial professional and in Sales Charges on page 31 of the Fund’s prospectus and Rights of Accumulation on page 60 of the Fund’s statement of additional information.
| Shareholder Fees (fees paid directly from your investment) | ||||||
| A Shares | C Shares | I Shares | ||||
| Maximum Sales Charge (load) Imposed on Purchases (as a % of offering price) | 4.75% | None | None | |||
| Maximum Deferred Sales Charge (load) (as a % of net asset value) | None | 1.00% | None | |||
| Annual Fund Operating Expenses (expenses that you pay each year as a percentage of | ||||||
| A Shares | C Shares | I Shares | ||||
| Management Fees | 0.10% | 0.10% | 0.10% | |||
| Distribution (12b-1) Fees | 0.30% | 1.00% | None | |||
| Other Expenses(1) | 0.30% | 0.25% | 0.31% | |||
| Acquired Fund Fees and Expenses(2) | 0.55% | 0.55% | 0.55% | |||
|
|
|
| ||||
| Total Annual Fund Operating Expenses | 1.25% | 1.90% | 0.96% | |||
| Fee Waivers and/or Expense Reimbursements(3) | (0.10)% | (0.05)% | (0.11)% | |||
|
|
|
| ||||
| Total Annual Fund Operating Expenses after Fee Waivers and/or Expense Reimbursements | 1.15% | 1.85% | 0.85% | |||
| (1) | Restated to reflect current fees. |
| (2) | “Acquired Fund Fees and Expenses” reflect the Fund’s pro rata share of the fees and expenses incurred by investing in other investment companies. The impact of Acquired Fund Fees and Expenses is included in the total returns of the Fund. Acquired Fund Fees and Expenses are not used to calculate the Fund’s net asset value per share (“NAV”) and are not included in the calculation of the ratio of expenses to average net assets shown in the Financial Highlights section of the Fund’s prospectus. |
| (3) | The Adviser has contractually agreed to waive fees and reimburse expenses until at least August 1, 2014, in order to keep Total Annual Fund Operating Expenses (excluding, as applicable, taxes, brokerage commissions, substitute dividend expenses on securities sold short, interest expense, extraordinary expenses and Acquired Fund Fees and Expenses) from exceeding 0.60%, 1.30% and 0.30% for the A, C and I Shares, respectively. This agreement shall terminate upon the termination of the Investment Advisory Agreement between RidgeWorth Funds and the Adviser, or it may be terminated upon written notice to the Adviser by RidgeWorth Funds. |
Example
This example is intended to help you compare the cost of investing in the Fund with the cost of investing in other mutual funds. The example assumes that you invest $10,000 in the Fund for the time periods indicated. The example also assumes that your investment has a 5% return each year, that the Fund’s operating expenses remain the same and that you reinvest all dividends and distributions. The example reflects contractual fee waivers and reimbursements for the first year only. Although your actual costs may be higher or lower, based on these assumptions your costs would be:
| 1 Year | 3 Years | 5 Years | 10 Years | |||||||||||||
| A Shares |
$ | 587 | $ | 845 | $ | 1,123 | $ | 1,913 | ||||||||
| C Shares |
$ | 290 | $ | 597 | $ | 1,030 | $ | 2,234 | ||||||||
| I Shares | $ | 87 | $ | 296 | $ | 522 | $ | 1,172 | ||||||||
You would pay the following expenses if you did not redeem your shares:
| 1 Year | 3 Years | 5 Years | 10 Years | |||||||||||||
| A Shares |
$ | 587 | $ | 845 | $ | 1,123 | $ | 1,913 | ||||||||
| C Shares |
$ | 190 | $ | 597 | $ | 1,030 | $ | 2,234 | ||||||||
| I Shares | $ | 87 | $ | 296 | $ | 522 | $ | 1,172 | ||||||||
1
Portfolio Turnover
The Fund pays transaction costs, such as commissions, when it buys and sells securities (or “turns over” its portfolio). A higher portfolio turnover rate may indicate higher transaction costs and may result in higher taxes when Fund shares are held in a taxable account. These costs, which are not reflected in annual fund operating expenses or in the example, affect the Fund’s performance. During the most recent fiscal year, the Fund’s portfolio turnover rate was 40% of the average value of its portfolio.
Principal Investment Strategies
The Fund invests pursuant to an asset allocation strategy in a combination of RidgeWorth Fixed Income Funds and exchange-traded funds (“ETFs”) that invest in bonds (together, “Underlying Fixed Income Funds”), and to a lesser extent, RidgeWorth Equity Funds and ETFs that invest in equities (together, “Underlying Equity Funds”). The Fund invests between 50% and 80% of its assets in Underlying Fixed Income Funds, and between 20% and 40% of its assets in Underlying Equity Funds (together, “Underlying Funds”). The Fund’s remaining assets may be invested in cash and cash equivalents, including unaffiliated money market funds, securities issued by the U.S. government, its agencies or instrumentalities, repurchase agreements and short-term paper.
The Fund may invest in Underlying Funds that:
| – | invest in debt instruments, including mortgage- and asset-backed instruments, securities restricted as to resale, common stocks and other equity securities of U.S. and non-U.S. companies including those in both developed and emerging markets. |
| – | invest in bank loans and other below investment grade instruments. |
| – | invest in inflation-protected public obligations of the U.S. Treasury (“TIPS”), which are securities issued by the U.S. Treasury that are designed to provide inflation protection to investors. |
In selecting a diversified portfolio of Underlying Fixed Income Funds and Underlying Equity Funds (together, “Underlying Funds”), the Adviser analyzes many factors, including the Underlying Funds’ investment objectives, total return, volatility and expenses.
The table that follows shows how the Adviser currently expects to allocate the Fund’s portfolio among asset classes. The table also shows the sectors within those asset classes to which the Fund will currently have exposure.
| Asset Class |
Investment Range Conservative |
|||
| Underlying Fixed Income Funds |
50-80 | % | ||
| U.S. Investment Grade Bonds | ||||
| U.S. High Yield Bonds | ||||
| U.S. Floating Rate Securities (including bank loans) |
||||
| International Bonds | ||||
| Emerging Market Bonds | ||||
| Asset Class |
Investment Range Conservative |
|||
| Underlying Equity Funds |
20-40 | % | ||
| U.S. Equities | ||||
| International Equities | ||||
| Emerging Market Equities | ||||
| (All Market Capitalizations) | ||||
| Underlying Money Market Investments |
0-20 | % | ||
Principal Investment Risks
You may lose money if you invest in the Fund. A Fund share is not a bank deposit and it is not insured or guaranteed by the Federal Deposit Insurance Corporation or any other government agency.
The value of an investment in the Fund is based primarily on the performance of the Underlying Funds and the allocation of the Fund’s assets among them. The Adviser’s asset allocation decisions may not anticipate market trends successfully. The risks of the Fund will directly correspond to the risks of the Underlying Funds in which it invests. These risks will vary depending upon how the assets are allocated among the Underlying Funds. Certain risks associated with investing in the Underlying Funds are described in this section.
Asset Allocation Risk: Asset allocation risk is the risk that the Fund could lose money as a result of less than optimal or poor asset allocation decisions as to how its assets are allocated or re-allocated.
Below Investment Grade Securities Risk: Securities that are rated below investment grade (sometimes referred to as “junk bonds,” including those bonds rated lower than “BBB-” by Standard & Poor’s Financial Services LLC and Fitch, Inc. or “Baa3” by Moody’s Investors Services, Inc.), or that are unrated but judged by the Adviser to be of comparable quality at the time of purchase, involve greater risk of default or downgrade and are more volatile than investment grade securities and are considered speculative. Below investment grade securities may also be less liquid than higher quality securities, and may cause income and principal losses for the Fund.
Debt Securities Risk: Debt securities, such as bonds, involve credit risk. Credit risk is the risk that the borrower will not make timely payments of principal or interest or will default. Changes in an issuer’s credit rating or the market’s perception of an issuer’s creditworthiness may also affect the value of the Fund’s investment in that issuer. The degree of credit risk depends on the issuer’s financial condition and on the terms of the securities. Debt securities are also subject to interest rate risk, which is the risk that the value of a debt security may fall when interest rates rise. In general, the market price of debt securities with longer maturities will go up or down more in response to changes in interest rates than the market price of shorter term securities.
Equity Securities Risk: The price of equity securities fluctuates from time to time based on changes in a company’s financial condition or overall market and economic conditions. As a result, the value of the Fund’s equity securities may fluctuate drastically from day to day.
2
Exchange-Traded Fund Risk: ETFs, like mutual funds, have expenses associated with their operation, including advisory fees. When a Fund invests in an ETF, in addition to directly bearing expenses associated with its own operations, the Fund bears its pro rata portion of the ETF’s expenses. The impact of these additional expenses, if any, would be shown as part of “Acquired Fund Fees and Expenses” in the Annual Fund Operating Expenses table.
Floating Rate Loan Risk: The value of the collateral securing a floating rate loan can decline, be insufficient to meet the obligations of the borrower, or be difficult to liquidate. As a result, a floating rate loan may not be fully collateralized and can decline significantly in value. Floating rate loans generally are subject to legal or contractual restrictions on resale. The liquidity of floating rate loans, including the volume and frequency of secondary market trading in such loans, varies significantly over time and among individual floating rate loans. During periods of infrequent trading, valuing a floating rate loan can be more difficult; and buying and selling a floating rate loan at an acceptable price can also be more difficult and delayed. Difficulty in selling a floating rate loan can result in a loss.
Foreign Securities Risk: Foreign securities, including depositary receipts such as American Depositary Receipts (“ADRs”), involve special risks such as currency fluctuations (with the exception of ADRs), economic or financial instability, lack of timely or reliable financial information and unfavorable political or legal developments. These risks are increased for investments in emerging markets. The Fund is also subject to the risk that foreign securities may underperform other segments of the equity market or the equity market as a whole.
Growth Stock Risk: Growth stocks can react differently to issuer, political, market and economic developments than the market as a whole and other types of stocks. Growth stocks typically are sensitive to market movements because their market prices tend to reflect future expectations. When it appears those expectations will not be met, the prices of growth stocks typically fall.
Large-Capitalization Companies Risk: Large-capitalization stocks can perform differently from other segments of the equity market or the equity market as a whole. Large-capitalization companies may be less flexible in evolving markets or unable to implement change as quickly as small-capitalization companies.
Mortgage-Backed and Asset-Backed Securities Risk: Mortgage- and asset-backed securities are debt instruments that are secured by interests in pools of mortgage loans or other financial assets. The value of these securities will be influenced by the factors affecting the assets underlying such securities including difficult or frozen credit markets, swings in interest rates, changes in default rates, or deteriorating economic conditions. During periods of declining asset values, mortgage-backed and asset-backed securities may face valuation difficulties and may become more volatile and/or illiquid. The risk of default is generally higher in the case securities backed by loans made to borrowers with “sub-prime” credit metrics.
Prepayment and Call Risk: During periods of falling interest rates, an issuer of a callable bond held by the Fund or an Underlying Fund may “call” or prepay the bond before its stated maturity date. When mortgages and other obligations are prepaid and when securities are called, the Fund or an
Underlying Fund may have to reinvest the proceeds in securities with a lower yield or fail to recover additional amounts paid for securities with higher interest rates resulting in unexpected capital loss and/or a decline in the Fund’s income.
Real Estate Investment Risk: The Fund or an Underlying ETF invests in companies that invest in real estate (e.g. real estate investment trusts) and is exposed to risks specific to the real estate market, including interest rate risk, leverage risk, property risk and management risk.
Restricted Securities Risk: Certain debt securities may be restricted securities, which are not registered with the SEC and thus may not be sold publicly until registration has been made. Therefore, there is the absence of a public market and there is limited investor information.
Small- and Mid-Capitalization Companies Risk: Small- and mid-capitalization stocks tend to perform differently from other segments of the equity market or the equity market as a whole, and can be more volatile than stocks of large-capitalization companies. Small- and mid-capitalization companies may be newer or less established, and may have limited resources, products and markets, and may be less liquid.
U.S. Government Securities Risk: U.S. Treasury securities are backed by the full faith and credit of the U.S. government, while other types of securities issued or guaranteed by federal agencies, instrumentalities, and U.S. government-sponsored entities may or may not be backed by the full faith and credit of the U.S. government. U.S. government securities may underperform other segments of the fixed income market or the fixed income market as a whole.
Value Investing Risk: “Value” investing attempts to identify strong companies whose stocks are selling at a discount from their perceived true worth. It is subject to the risk that the stocks’ intrinsic values may never be fully recognized or realized by the market, their prices may go down, or that stocks judged to be undervalued by the Fund or an Underlying Fund may actually be appropriately priced or remained undervalued.
Performance
The bar chart and the performance table that follow illustrate the risks and volatility of an investment in the Fund. The Fund’s past performance (before and after taxes) does not indicate how the Fund will perform in the future. (I Shares commenced operations on November 6, 2003, A Shares commenced operations on November 11, 2003 and C Shares commenced operations on April 3, 2005. Performance between March 11, 2003 and the commencement of operations of A Shares, C Shares and I Shares is that of the B Shares of the Fund, which converted into A Shares of the Fund on July 16, 2010, and has not been adjusted to reflect A Share, C Share or I Share expenses. If it had been performance for the C Shares would have been lower.) Updated performance information is available by contacting the RidgeWorth Funds at 1-888-784-3863 or by visiting www.ridgeworth.com.
The annual returns in the bar chart which follows are for the I Shares without reflecting payment of any sales charge; if they did reflect such payment of sales charges, annual returns would be lower.
3
This bar chart shows changes in the performance of the Fund’s I Shares from year to year.*
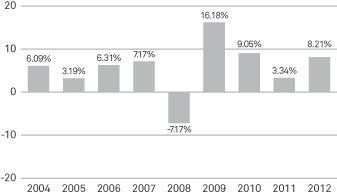
| Best Quarter | Worst Quarter | |
| 7.57% | -4.15% | |
| (9/30/2009) | (9/30/2011) |
| * | The performance information shown above is based on a calendar year. The Fund’s total return for the six months ended June 30, 2013 was 1.06%. |
The following table compares the Fund’s average annual total returns for the periods indicated with those of a broad measure of market performance.
| AVERAGE ANNUAL TOTAL RETURNS (for periods ended December 31, 2012) |
||||||||||||
| 1 Year | 5 Years | Since Inception* |
||||||||||
| A Shares Returns Before Taxes | 7.88 | % | 5.33 | % | 5.92 | % | ||||||
| C Shares Returns Before Taxes | 7.16 | % | 4.58 | % | 5.40 | % | ||||||
| I Shares Returns Before Taxes | 8.21 | % | 5.63 | % | 6.21 | % | ||||||
| I Shares Returns After Taxes on Distributions | 7.09 | % | 4.35 | % | 4.90 | % | ||||||
| I Shares Returns After Taxes on Distributions and Sale of Fund Shares | 5.51 | % | 4.12 | % | 4.64 | % | ||||||
| Hybrid 30/70 Blend of the two Indices below (reflects no deductions for fees, expenses or taxes) | 7.74 | % | 5.04 | % | 6.14 | % | ||||||
| S&P 500 Index (reflects no deductions for fees, expenses or taxes) | 16.00 | % | 1.66 | % | 7.68 | % | ||||||
| Barclays U.S. Aggregate Bond Index (reflects no deduction for fees, expenses or taxes) | 4.22 | % | 5.95 | % | 5.12 | % | ||||||
| * | Since inception of the B Shares on March 11, 2003. Benchmark return since March 1, 2003. |
After-tax returns are calculated using the historical highest individual U.S. federal marginal income tax rates and do not reflect the impact of state and local taxes. Your actual after-tax returns will depend on your tax situation and may differ from those shown. After-tax returns shown are not relevant to
investors who hold their Fund shares through tax-deferred arrangements, such as 401(k) plans or individual retirement accounts (“IRAs”). After-tax returns are shown for only the I Shares. After-tax returns for other share classes will vary.
Investment Adviser
RidgeWorth Investments is the Fund’s investment adviser.
Portfolio Management
Mr. Alan Gayle, Managing Director of the Adviser, has managed the Fund since its inception.
Purchasing and Selling Your Shares
You may purchase or redeem Fund shares on any business day. You may purchase and redeem A, C and I Shares of the Fund through financial institutions or intermediaries that are authorized to place transactions in Fund shares for their customers or for their own accounts.
The minimum initial investment amounts for each share class are shown below, although these minimums may be reduced or waived in some cases.
| Class | Dollar Amount | |
| A Shares | $2,000 | |
| C Shares | $5,000 ($2,000 for IRAs or other tax-deferred accounts) | |
| I Shares | None |
Subsequent investments in A or C Shares must be made in amounts of at least $1,000. The Fund may accept investments of smaller amounts for either class of shares at its discretion. There are no minimums for subsequent investments in I Shares.
Tax Information
The Fund’s distributions are generally taxable, and will be taxed as ordinary income or capital gains, unless you are investing through a tax-deferred arrangement, such as a 401(k) plan or an IRA, which may be taxed upon withdrawal.
Payments to Broker-Dealers and Other Financial Intermediaries
If you purchase shares of the Fund through a financial intermediary, such as a broker-dealer or investment adviser, the Fund, the Adviser or the Distributor may pay the intermediary for the sale of Fund shares and related services. These payments may create a conflict of interest by influencing the broker-dealer or other financial intermediary and your salesperson to recommend the Fund over another investment. Ask your financial intermediary or visit your financial intermediary’s website for more information.

|
RFSUM-LVC-0813 |