Summary Prospectus
Corporate Bond Fund
AUGUST 1, 2012
Class / Ticker Symbol
A / SAINX C / STIFX I / STICX
Before you invest, you may want to review the Fund’s Prospectus and Statement of Additional Information, which contain more information about the Fund and its risks. You can find the Fund’s Prospectus, Statement of Additional Information and other information about the Fund online at http://www.ridgeworth.com/resources/regulatory-tax-info. You can also get this information at no cost by calling the Funds at 1-888-784-3863 or by sending an email request to info@ridgeworth.com. The current Prospectus and Statement of Additional Information, dated August 1, 2012, are incorporated by reference into this summary prospectus.
Investment Objective
The Corporate Bond Fund (the “Fund”) seeks current income and, secondarily, preservation of capital.
Fees and Expenses of the Fund
This table describes the fees and expenses that you may pay if you buy and hold shares of the Fund. You may qualify for sales charge discounts if you and your family invest, or agree to invest in the future, at least $50,000 in RidgeWorth Funds. More information about these and other discounts is available from your financial professional and in Sales Charges on page 85 of the Fund’s prospectus and Rights of Accumulation on page 62 of the Fund’s statement of additional information.
| Shareholder Fees (fees paid directly from your investment) | ||||||
| A Shares | C Shares | I Shares | ||||
| Maximum Sales Charge (load) Imposed on Purchases (as a % of offering price) | 4.75% | None | None | |||
| Maximum Deferred Sales Charge (load) (as a % of net asset value) | None | 1.00% | None | |||
| Annual Fund Operating Expenses (expenses that you pay each year as a percentage of | ||||||||||
| A Shares | C Shares | I Shares | ||||||||
| Management Fees | 0.40% | 0.40% | 0.40% | |||||||
| Distribution (12b-1) Fees | 0.30% | 1.00% | None | |||||||
| Other Expenses(1) | 0.19% | 0.18% | 0.23% | |||||||
|
|
|
|
|
| ||||||
| Total Annual Fund Operating Expenses | 0.89% | 1.58% | 0.63% | |||||||
| Fee Waivers and/or Expense Reimbursements(2) | — | — | (0.01)% | |||||||
|
|
|
|
|
| ||||||
| Total Annual Fund Operating Expenses After Fee Waivers and/or Expense Reimbursements | 0.89% | 1.58% | 0.62% | |||||||
| (1) | Restated to reflect current fees. |
| (2) | The Adviser and Subadviser have contractually agreed to waive fees and reimburse expenses until at least August 1, 2013 in order to keep Total Annual Fund Operating Expenses (excluding, as applicable, taxes, brokerage commissions, substitute dividend expenses on securities sold short, extraordinary expenses and Acquired Fund Fees and Expenses) from exceeding 0.93%, 1.60% and 0.62% for the A, C and I Shares, respectively. This agreement shall terminate upon the termination of the Investment Advisory Agreement between RidgeWorth Funds and the Adviser, or it may be terminated upon written notice to the Adviser by RidgeWorth Funds. |
1
Example
This Example is intended to help you compare the cost of investing in the Fund with the cost of investing in other mutual funds. The Example assumes that you invest $10,000 in the Fund for the time periods indicated. The Example also assumes that your investment has a 5% return each year and that the Fund’s operating expenses remain the same and you reinvest all dividends and distributions. Although your actual costs may be higher or lower, based on these assumptions your costs would be:
| 1 Year | 3 Years | 5 Years | 10 Years | |||||||||||||
| A Shares |
$ | 562 | $ | 746 | $ | 946 | $ | 1,523 | ||||||||
| C Shares |
$ | 261 | $ | 499 | $ | 862 | $ | 1,884 | ||||||||
| I Shares | $ | 63 | $ | 201 | $ | 351 | $ | 789 | ||||||||
You would pay the following expenses if you did not redeem your shares:
| 1 Year | 3 Years | 5 Years | 10 Years | |||||||||||||
| A Shares |
$ | 562 | $ | 746 | $ | 946 | $ | 1,523 | ||||||||
| C Shares |
$ | 161 | $ | 499 | $ | 862 | $ | 1,884 | ||||||||
| I Shares | $ | 63 | $ | 201 | $ | 351 | $ | 789 | ||||||||
Portfolio Turnover
The Fund pays transaction costs, when it buys and sells securities (or “turns over” its portfolio). A higher portfolio turnover rate may indicate higher transaction costs and may result in higher taxes when Fund shares are held in a taxable account. These costs, which are not reflected in annual fund operating expenses or in the example, affect the Fund’s performance. During the most recent fiscal year, the Fund’s portfolio turnover rate was 88% of the average value of its portfolio.
Principal Investment Strategies
The Fund invests in a diversified portfolio of U.S. dollar denominated corporate obligations and other fixed income securities that are rated BBB-/Baa3 or better by Standard & Poor’s Ratings Services, Moody’s Investors Service or Fitch Ratings or unrated securities that the Fund’s Subadviser, Seix Investment Advisors LLC (“Seix” or the “Subadviser”), believes are of comparable quality. Under normal circumstances, the Fund invests at least 80% of its net assets (plus any borrowings for investment purposes) in corporate bonds. The Fund may also invest in U.S. Treasury and agency obligations. The Fund may invest in U.S. dollar denominated obligations of U.S. and non-U.S. issuers. The Fund may invest a portion of its assets in securities that are restricted as to resale.
The Fund will maintain an overall credit quality of A- or better. Securities downgraded below BBB-/Baa3 after purchase by all agencies that rate the securities can be
retained so long as in the aggregate securities that are rated below BBB-/Baa3 do not constitute more than 10% of the Fund’s total net assets.
The Subadviser attempts to identify investment grade corporate bonds offering above average total return. In selecting corporate debt investments for purchase and sale, the Subadviser seeks out companies with good fundamentals and above average return prospects that are currently priced at attractive levels. The primary basis for security selection is the potential income offered by the security relative to the Subadviser’s assessment of the issuer’s ability to generate the cash flow required to meet its obligations. The Subadviser employs a “bottom-up” approach, identifying investment opportunities based on the underlying financial and economic fundamentals of the specific issuer.
Principal Investment Risks
You may lose money if you invest in the Fund. A Fund share is not a bank deposit and it is not insured or guaranteed by the Federal Deposit Insurance Corporation or any other government agency.
Below Investment Grade Securities Risk: Securities that are rated below investment grade (sometimes referred to as “junk bonds”, including those bonds rated lower than “BBB-” by Standard and Poor’s and Fitch, Inc. or “Baa3” by Moody’s Investors Services, Inc.), or that are unrated but judged by the Subadviser to be of comparable quality, at the time of purchase, involve greater risk of default or downgrade and are more volatile than investment grade securities. Below investment grade securities may also be less liquid than higher quality securities, and may cause income and principal losses for the Fund.
Debt Securities Risk: Debt securities, such as bonds, involve credit risk. Credit risk is the risk that the borrower will not make timely payments of principal and interest. Changes in an issuer’s credit rating or the market’s perception of an issuer’s creditworthiness may also affect the value of the Fund’s investment in that issuer. The degree of credit risk depends on the issuer’s financial condition and on the terms of the securities. Debt securities are also subject to interest rate risk, which is the risk that the value of a debt security may fall when interest rates rise. In general, the market price of debt securities with longer maturities will go up or down more in response to changes in interest rates than the market price of shorter term securities.
Certain debt securities may be restricted securities, which are not registered with the SEC and thus may not be not be sold publicly until registration has been made. Therefore, there is the absence of a public market and there is limited investor information.
2
Foreign Companies Risk: Dollar denominated securities of foreign issuers involve special risks such as economic or financial instability, lack of timely or reliable financial information and unfavorable political or legal developments.
U.S. Government-Related Risk: Obligations of U.S. government agencies and authorities are supported by varying degrees of credit, but generally are not backed by the full faith and credit of the U.S. government. U.S. government agencies debt securities may underperform other segments of the fixed income market or the fixed income market as a whole.
Performance
The bar chart and the performance table that follow illustrate the risks and volatility of an investment in the Fund. The Fund’s past performance (before and after taxes) does not indicate how the Fund will perform in the future. The Fund began operating April 1, 2009. Performance prior to April 1, 2009 is that of the Strategic Income Fund, the Fund’s predecessor, which began operations on November 30, 2001. Updated performance information is available by contacting the RidgeWorth Funds at 1-888-784-3863 or by visiting www.ridgeworth.com.
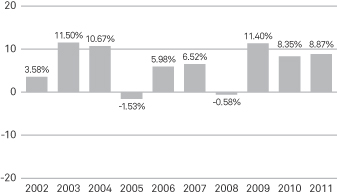
The annual returns in the bar chart which follows are for the I Shares without reflecting payment of any sales charge; if they did reflect such payment of sales charges, annual returns would be lower.
This bar chart shows the changes in performance of the Fund’s I Shares from year to year.*
| Best Quarter | Worst Quarter | |
| 7.54% | -3.98% | |
| (6/30/09) | (3/31/09) |
| * | The performance information shown above is based on a calendar year. The Fund’s total return for the six months ended June 30, 2012 was 3.70%. |
The following table compares the Fund’s average annual total returns for the periods indicated with those of a broad measure of market performance.
| AVERAGE ANNUAL TOTAL RETURNS (for periods ended December 31, 2011) |
||||||||||||||||
| 1 Year | 5 Years | 10 Years | Since Inception of the A Shares* |
|||||||||||||
| A Shares Returns Before Taxes | 8.52% | 6.50% | N/A | 6.03% | ||||||||||||
| C Shares Returns Before Taxes | 7.82% | 5.79% | 5.51% | N/A | ||||||||||||
| I Shares Returns Before Taxes | 8.87% | 6.84% | 6.39% | N/A | ||||||||||||
| I Shares Returns After Taxes on Distributions | 6.07% | 4.44% | 4.12% | N/A | ||||||||||||
| I Shares Returns After Taxes on Distributions and Sale of Fund Shares | 7.15% | 4.58% | 4.20% | N/A | ||||||||||||
| Barclays Capital U.S. Corporate Investment Grade Index (reflects no deduction for fees, expenses or taxes) | 8.15% | 6.82% | 6.36% | 5.77% | ||||||||||||
| * | Since inception of the A Shares on October 8, 2003. |
After-tax returns are calculated using the historical highest individual U.S. federal marginal income tax rates and do not reflect the impact of state and local taxes. Your actual after-tax returns will depend on your tax situation and may differ from those shown. After-tax returns shown are not relevant to investors who hold their Fund shares through tax deferred arrangements, such as 401(k) plans or individual retirement accounts (“IRAs”). After-tax returns are shown for only the I Shares. After-tax returns for other share classes will vary.
Investment Adviser and Subadviser
RidgeWorth Investments is the Fund’s investment adviser (the “Adviser”). Seix Investment Advisors LLC is the Fund’s Subadviser.
Portfolio Management
Mr. James F. Keegan, Chief Investment Officer and Chief Executive Officer, has been a member of the Fund’s management team since 2008. Mr. Adrien Webb, CFA, Managing Director and Senior Portfolio Manager, has been a member of the Fund’s management team since 2004. Mr. Perry Troisi, Managing Director and Senior Portfolio Manager, has been a member of the Fund’s management team since 2004.
3
Purchasing and Selling Your Shares
You may purchase or redeem Fund shares on any business day. You may purchase and redeem A, C, and I Shares of the Fund through financial institutions or intermediaries that are authorized to place transactions in Fund shares for their customers or for their own accounts.
The minimum initial investment amounts for each share class are shown below, although these minimums may be reduced or waived in some cases.
| Class | Dollar Amount | |
| A Shares | $2,000 | |
| C Shares | $5,000 ($2,000 for IRAs or other tax qualified accounts) | |
| I Shares | None |
Subsequent investments in A or C Shares must be made in amounts of at least $1,000. The Fund may accept investments of smaller amounts for either class of shares at its discretion. There are no minimums for subsequent investments in I Shares.
Tax Information
The Fund’s distributions are generally taxable and will be taxed as ordinary income or capital gains unless you are investing through a tax-deferred arrangement, such as a 401(k) plan or an IRA.
Payments to Broker-Dealers and Other Financial Intermediaries
If you purchase shares of the Fund through a financial intermediary, such as a broker-dealer or investment adviser, the Fund, the Adviser or the Distributor may pay the intermediary for the sale of Fund shares and related services. These payments may create a conflict of interest by influencing the broker-dealer or other financial intermediary and your salesperson to recommend the Fund over another investment. Ask your financial intermediary or visit your financial intermediary’s website for more information.

|
RFSUM-CB-0812 |