UNITED STATES
SECURITIES AND EXCHANGE COMMISSION
Washington, D.C. 20549
FORM
CURRENT REPORT
Pursuant to Section 13 or 15(d) of the Securities Exchange Act of 1934
Date of Report
(Date of earliest event reported):
(Exact name of registrant as specified in its charter)
(State or other jurisdiction of |
(Commission File Number) |
(IRS Employer Identification No.) |
(Address of principal executive offices) |
(Zip Code) |
Registrant’s telephone number, including area code: (
(Former name or former address, if changed since last report)
Check the appropriate box below if the Form 8-K filing is intended to simultaneously satisfy the filing obligation of the registrant under any of the following provisions (see General Instruction A.2. below):
Indicate by check mark whether the registrant is an emerging growth company as defined in Rule 405 of the Securities Act of 1933 (§230.405 of this chapter) or Rule 12b-2 of the Securities Exchange Act of 1934 (§240.12b-2 of this chapter).
¨
If an emerging growth company, indicate by check mark if the registrant has elected not to use the extended transition period for complying with any new or revised financial accounting standards provided pursuant to Section 13(a) of the Exchange Act. ¨
Title of each class | Ticker Symbol | Name of each exchange on which registered | ||
Item 1.01 | Entry into a Material Definitive Agreement. |
On February 20, 2020, Fossil Group, Inc. (the “Company”) entered into an Amendment No. 1 (the “Amendment”) to that certain Term Credit Agreement, dated as of September 26, 2019, by and among the Company, as borrower, JPMorgan Chase Bank, N.A. as administrative agent and the lenders party thereto (the “Term Credit Agreement”).
Pursuant to the terms of the Amendment, the Company, the administrative agent and the lenders party thereto (the “Term Credit Agreement Lenders”) agreed to modify certain terms of the Term Credit Agreement to, among other things, (i) increase the interest rate applicable to the term loans under the Term Credit Agreement (a) in the case of Eurodollar loans, from the adjusted LIBO rate plus 6.50% to the adjusted LIBO rate plus 8.00%, and (b) in the case of alternate base rate loans, from the alternate base rate plus 5.50% to the alternate base rate plus 7.00%; (ii) increase the maximum total leverage ratio permitted from 1.50 to 1.00 as of the last day of each fiscal quarter to (a) 2.75 to 1.00 as of the last day of each fiscal quarter ending April 4, 2020, July 4, 2020, October 3, 2020 and January 2, 2021, (b) 2.25 to 1.00 as of the last day of each fiscal quarter ending April 3, 2021, July 3, 2021 and October 2, 2021, and (c) 1.50 to 1.00 as of the last day of each subsequent fiscal quarter; (iii) limit the amount of borrowings in aggregate principal amount at any time outstanding under that certain asset-based revolving credit agreement, dated as of September 26, 2019, by and among the Company and Fossil Partners L.P., as the U.S. borrowers, and Fossil Group Europe GmbH, Fossil Asia Pacific Limited, Fossil (Europe) GmbH, Fossil (UK) Limited and Fossil Canada Inc., as the non-U.S. borrowers, certain other subsidiaries of the Company from time to time party thereto designated as borrowers, certain subsidiaries of the Company from time to time party thereto as guarantors, JPMorgan Chase Bank, N.A. as administrative agent and J.P. Morgan AG, as French collateral agent, to the lesser of the borrowing base thereunder and $200 million; (iv) extend the applicable periods for certain prepayment fees, so that if the Company voluntarily prepays the term loans prior to February 20, 2022, or if the Company incurs certain indebtedness which results in a mandatory prepayment under the Term Credit Agreement prior to February 20, 2022, the Company is required to pay a prepayment fee of 2.00% with respect to the principal amount prepaid prior to February 20, 2021 and 1.00% with respect to the principal amount prepaid between February 21, 2021 and February 20, 2022; and (v) require the Company to pay the foregoing prepayment fee upon acceleration of the loans under the Term Credit Agreement. The Amendment also modifies the negative covenants and events of default in the Term Credit Agreement to reduce the Company’s flexibility with respect to certain matters.
In connection with the execution of the Amendment, the Company paid certain fees and expenses to the administrative agent and the Term Credit Agreement Lenders.
Certain of the Term Credit Agreement Lenders and certain of their respective affiliates have performed investment banking, commercial lending and underwriting services for the Company and its subsidiaries and respective affiliates, from time to time, for which such lenders and their affiliates have received customary fees and expenses. These parties may, from time to time, engage in transactions with, and perform services for the Company, its subsidiaries or their respective affiliates in the ordinary course of their business.
The foregoing description is not complete and is qualified in its entirety by the Amendment, which is filed herewith as Exhibit 10.1, and incorporated herein by reference.
Item 2.02 | Results of Operations and Financial Condition. |
On February 26, 2020, the Company issued a press release announcing financial results for the fiscal quarter and year ended December 28, 2019. A copy of the press release is attached hereto as Exhibit 99.1.
The information in Item 2.02 of this Current Report and the accompanying Exhibit 99.1 are being furnished and shall not be deemed “filed” for purposes of Section 18 of the Securities and Exchange Act of 1934, as amended (the “Exchange Act”), and are not incorporated by reference into any filing of the Company under the Securities Act of 1933, as amended, or the Exchange Act, whether made before or after the date hereof, except as shall be expressly set forth by specific reference to this Current Report in such a filing.
Item 2.03 | Creation of a Direct Financial Obligation or an Obligation under an Off-Balance Sheet Arrangement of a Registrant. |
The information set forth in Item 1.01 is hereby incorporated by reference.
Item 7.01 | Regulation FD Disclosure. |
In connection with the negotiation of the Amendment, the Company entered into confidentiality agreements with certain of the Term Credit Agreement Lenders. Pursuant to the confidentiality agreements, the Company provided these Term Credit Agreement Lenders with certain confidential information regarding the Company, which is furnished as Exhibit 99.2 attached hereto.
The information in Item 7.01 of this Current Report and the accompanying Exhibit 99.2 are being furnished and shall not be deemed “filed” for purposes of Section 18 of the Exchange Act, and are not incorporated by reference into any filing of the Company under the Securities Act of 1933, as amended, or the Exchange Act, whether made before or after the date hereof, except as shall be expressly set forth by specific reference to this Current Report in such a filing.
Forward-Looking Statements
This Current Report, including the exhibits hereto, contain certain statements that are not historical facts, including multi-year profit improvement estimates, the success of our connected accessories, future financial forecasts, estimates and guidance as well as estimated impacts from the coronavirus, tariffs, the Tax Cuts and Jobs Act, foreign currency translation, amortization expense, foreign tax credits, non-cash impairments and restructuring charges. These statements constitute “forward-looking statements” within the meaning of the Private Securities Litigation Reform Act of 1995 and involve a number of risks and uncertainties. The actual results of the future events described in such forward-looking statements could differ materially from those stated in such forward-looking statements. Among the factors that could cause actual results to differ materially are: the effect of worldwide economic conditions; the impact of the coronavirus; significant changes in consumer spending patterns or preferences; interruptions or delays in the supply of key components; acts of war or acts of terrorism; changes in foreign currency valuations in relation to the U.S. dollar; lower levels of consumer spending resulting from a general economic downturn or generally reduced shopping activity caused by public safety or consumer confidence concerns; the performance of our products within the prevailing retail environment; customer acceptance of both new designs and newly-introduced product lines, including risks related to the expanded launch of connected accessories; financial difficulties encountered by customers; the effects of vigorous competition in the markets in which we operate; compliance with debt covenants and other contractual provisions; risks related to the success of our restructuring programs; the termination or non-renewal of material licenses, foreign operations and manufacturing; changes in the costs of materials, labor and advertising; government regulation and tariffs; our ability to secure and protect trademarks and other intellectual property rights; and the outcome of current and possible future litigation, as well as the risks and uncertainties set forth in the Company’s most recent Annual Report on Form 10-K and subsequent Quarterly Reports on Form 10-Q filed with the Securities and Exchange Commission (the “SEC”). These forward-looking statements are based on our current expectations and beliefs concerning future developments and their potential effect on us. While management believes that these forward-looking statements are reasonable as and when made, there can be no assurance that future developments affecting us will be those that we anticipate. Readers should consider these factors in evaluating, and are cautioned not to place undue reliance on, these forward-looking statements. The Company assumes no obligation to publicly update or revise any forward-looking statements, whether as a result of new information, future events, or otherwise, except as required by law.
Item 9.01 | Financial Statements and Exhibits. |
(d) Exhibits
10.1 | Amendment No. 1 to Term Credit Agreement, dated as of February 20, 2020, by and among Fossil Group, Inc., the lenders party thereto and JPMorgan Chase Bank, N.A., as administrative agent. |
99.1 | Press Release, dated February 26, 2020, announcing financial results for the fiscal quarter and year ended December 28, 2019. |
99.2 | Presentation. |
104 | Cover Page Interactive Data File (embedded within the Inline XBRL document). |
SIGNATURES
Pursuant to the requirements of the Securities Exchange Act of 1934, the registrant has duly caused this report to be signed on its behalf by the undersigned hereunto duly authorized.
Date: February 26, 2020 | ||
FOSSIL GROUP, INC. | ||
By: | /s/ JEFFREY N. BOYER | |
Name: | Jeffrey N. Boyer | |
Title: | Executive Vice President, Chief Financial Officer and Treasurer |
Exhibit 10.1
EXECUTION VERSION
AMENDMENT NO. 1 TO TERM CREDIT AGREEMENT
THIS AMENDMENT NO. 1 TO TERM CREDIT AGREEMENT, dated as of February 20, 2020 (this “Agreement”), is entered into by and among FOSSIL GROUP, INC., a Delaware corporation (the “Borrower”), the Lenders party hereto and JPMORGAN CHASE BANK, N.A., as Administrative Agent, under that certain Term Credit Agreement, dated as of September 26, 2019 (the “Term Credit Agreement”), among the Borrower, the Lenders party thereto and the Administrative Agent. All capitalized terms used herein and not otherwise defined shall have the meanings set forth in the Term Credit Agreement.
WHEREAS, Section 9.02 of the Term Credit Agreement permits certain amendments of the Term Credit Agreement with the consent of the Borrower, the Required Lenders and the Administrative Agent; and
WHEREAS, the Borrower, the Required Lenders and the Administrative Agent desire to amend certain provisions of the Term Credit Agreement, as set forth below.
NOW, THEREFORE, in consideration of the premises and covenants contained herein and for other good and valuable consideration, the receipt and sufficiency of which are hereby acknowledged, the parties hereto, intending to be legally bound hereby, agree as follows:
Section 1. Amendments. On the Amendment No. 1 Effective Date (as defined in paragraph (a) below), the Term Credit Agreement shall be amended as follows:
(a) The following defined terms shall be inserted in Section 1.01 of the Term Credit Agreement in their proper alphabetical order:
“Amendment No. 1” means that certain Amendment No. 1 to Term Credit Agreement, among the Borrower, the Administrative Agent and the Lenders party thereto.
“Amendment No. 1 Effective Date” means the date on which the conditions set forth in Section 2 of Amendment No. 1 were satisfied, which date was February 20, 2020.
“JV Entity” means any bona fide joint venture, partnership or other similar arrangement that (i) is between (y) the Borrower or a Restricted Subsidiary and (z) a third party that is not an Affiliate of the Borrower or any Restricted Subsidiary and (ii) is not created for the primary purpose of releasing any Guarantor from its Guarantee under the Collateral Agreement.
(b) The defined terms “Cure Amount”, “Cure Period”, “Cure Right” and “Unrestricted Subsidiary” in Section 1.01 of the Term Credit Agreement shall each be deleted in their entirety.
(c) The defined term “Applicable Prepayment Fee” in Section 1.01 of the Term Credit Agreement shall be amended by deleting the words “Effective Date” each time they appear therein and replacing them with the words “Amendment No. 1 Effective Date.”
(d) The defined term “Applicable Rate” in Section 1.01 of the Term Credit Agreement shall be replaced in its entirety with the following:
“Applicable Rate” means, for any day on and after the Amendment No. 1 Effective Date, (a) with respect to any Term Loan, (i) 8.00% in the case of Eurodollar Term Loans and
(ii) 7.00% in the case of ABR Term Loans, and (b) with respect to any Extended Term Loans of any Series, the rate per annum specified in the Extension Agreement establishing the Extended Term Loans of such Series.
(e) The defined term “Available Amount” in Section 1.01 of the Term Credit Agreement shall be amended as follows:
(i) | Clause (a) of thereof shall be replaced in its entirety with the following: |
“(a) [reserved]”
(ii) | Clause (d) thereof shall be replaced in its entirety with the following: |
“(d) the net cash proceeds received by the Borrower or any Restricted Subsidiary from any distribution, dividend, return of capital, repayment of loans or upon the Disposition of any Investment, in each case to the extent received in respect of an Investment made pursuant to Section 6.04(f) in reliance on the Available Amount, plus”
(iii) | Clause (e) thereof shall be replaced in its entirety with the following: |
“(e) [reserved]”
(iv) | Clause (h) thereof shall replaced in its entirety with the following: | |
“(h) any amount of the Available Amount used to make Restricted Payments pursuant to Sections 6.08(a)(vii) and (b)(vi) after the Effective Date and prior to such time.” |
(f) The defined term “Excluded Subsidiary” in Section 1.01 of the Term Credit shall be replaced in its entirety with the following:
“Excluded Subsidiary” means (a)(i) any Foreign Subsidiary that is not a wholly-owned Subsidiary of the Borrower on the Amendment No. 1 Effective Date for so long as such Foreign Subsidiary remains a non-wholly owned Subsidiary and (ii) any JV Entity created or arising after the Amendment No. 1 Effective Date for so long as such Subsidiary remains a JV Entity, (b)(i) any Foreign Subsidiary of the Borrower, (ii) any Subsidiary that is a direct or indirect Subsidiary of a Foreign Subsidiary of the Borrower that is a CFC and (iii) any CFC Holdco, (c) any Subsidiary that is prohibited or restricted by applicable law from providing a Guarantee of the Secured Obligations or if such Guarantee would require governmental (including regulatory) consent, approval, license or authorization unless such consent, approval, license or authorization has been received, (d) any Subsidiary that is a not-for-profit organization, (e) [reserved], (f) any Subsidiary that is an Immaterial Subsidiary (unless, solely in the case of a Domestic Subsidiary, the Borrower otherwise elects), and (g) any other Subsidiary with respect to which, in the reasonable judgment of the Administrative Agent (confirmed in writing by notice to the Borrower), the cost or other consequences of becoming a Guarantor shall be excessive in view of the benefits to be obtained by the Lenders therefrom. Notwithstanding anything herein to the contrary, if any Guarantor becomes a JV Entity, such Guarantor shall only be permitted to be released from its Guarantee if the fair value of any and all Investments then held by any Loan Party in such JV Entity are permitted as an Investment under the fixed dollar baskets in Section 6.04.
2
(g) The defined term “Fiscal Quarter” in Section 1.01 of the Term Credit Agreement shall be replaced in its entirety with the following:
“Fiscal Quarter” means a fiscal quarter of any Fiscal Year, consistent with the “retail calendar,” as used by the Borrower in its financial reporting.
(h) The defined term “Fee Letter” in Section 1.01 of the Term Credit Agreement shall be replaced in its entirety with the following:
“Fee Letter” means, collectively, (a) the Fee Letter dated June 23, 2019, between the Borrower and the Administrative Agent and (b) the Fee Letter dated the Amendment No. 1 Effective Date between the Borrower and the Administrative Agent.
(i) The defined term “Investment” in Section 1.01 of the Term Credit Agreement shall be amended by adding the following at the end thereof:
“Notwithstanding anything herein to the contrary, the fair value of any and all Investments (which for the avoidance of doubt shall include all debt, Equity Interests and other items described in the foregoing provisions of this definition) held by any Loan Party in any wholly-owned Guarantor that becomes a JV Entity shall be deemed to be an Investment incurred on the date such Guarantor becomes a JV Entity.”
(j) The defined term “Material Indebtedness” in Section 1.01 of the Term Credit Agreement shall replaced in its entirety with the following:
“Material Indebtedness” means the ABL Obligations and any other Indebtedness (other than the Loans and Guarantees under the Loan Documents), or obligations in respect of one or more Swap Agreements, of any one or more of the Borrower and the Restricted Subsidiaries in an aggregate principal amount exceeding $10,000,000. For purposes of determining Material Indebtedness, the “principal amount” of the obligations of the Borrower or any Restricted Subsidiary in respect of any Swap Agreement at any time shall be the maximum aggregate amount (giving effect to any netting agreements) that the Borrower or such Restricted Subsidiary would be required to pay if such Swap Agreement were terminated at such time.
(k) The defined term “Total Assets” in Section 1.01 of the Term Credit Agreement shall be amended by deleting the following in the place it appears therein:
“(i) exclude amounts attributed to Unrestricted Subsidiaries and (ii)”
(l) The defined term “Restricted Subsidiary” in Section 1.01 of the Term Credit Agreement shall be replaced in its entirety with the following:
“Restricted Subsidiary” means each Subsidiary of the Borrower.
(m) The defined term “Retained ECF” in Section 1.01 of the Term Credit Agreement shall be replaced in its entirety with the following:
“Retained ECF” means, at any date of determination, an amount, equal to the aggregate cumulative sum of the Retained Percentage of Excess Cash Flow for the Excess Cash Flow Periods ended on or prior to such date; provided that, for purposes of calculating Retained ECF, Retained ECF for the period beginning as of the Effective Date through and including the Amendment No. 1 Effective Date is deemed to be zero.
3
(n) Section 2.09(b) of the Term Credit Agreement shall be amended by replacing the first sentence thereof in its entirety with the following:
“In the event and on each occasion that any Net Proceeds are received by or on behalf of the Borrower or any Restricted Subsidiary in respect of any Prepayment Event following the Effective Date, the Borrower shall, on the day such Net Proceeds are received (or, in the case of a Prepayment Event described in clause (a) or (b) of the definition of the term “Prepayment Event,” within three Business Days after such Net Proceeds are received), prepay Borrowings in an amount equal to 100% of such Net Proceeds; provided that, in the case of any event described in clause (a) or (b) of the definition of the term “Prepayment Event,” other than a transaction made pursuant to Section 6.06, if the Borrower shall (a) prior to the date of the required prepayment, deliver to the Administrative Agent a certificate of a Financial Officer of the Borrower to the effect that the Borrower intends to cause (i) an amount not to exceed 25% of the Net Proceeds from any such event described in clause (a) of the definition of the term “Prepayment Event” or (ii) the Net Proceeds from any such event described in clause (b) of the definition of the term “Prepayment Event” (or, in each case and subject to the foreging, a portion thereof specified in such certificate) to be applied within 365 days after receipt of such Net Proceeds to acquire real property, equipment or other tangible assets to be used in the business of the Borrower or the Restricted Subsidiaries, and certifying that no Default has occurred and is continuing, and (b) in the case of a sale of Term Priority Collateral, deposit all such Net Proceeds in a Proceeds Collateral Account pending such application, then no prepayment shall be required pursuant to this paragraph in respect of the Net Proceeds from such event (or the portion of such Net Proceeds specified in such certificate, if applicable) except to the extent of any such Net Proceeds that have not been so applied by the end of such 365-day period (or within a period of 180 days thereafter if by the end of such initial 365-day period the Borrower or one or more Restricted Subsidiaries shall have entered into an agreement with a third party to acquire such real property, equipment or other tangible assets with such Net Proceeds) or at such earlier date as the Borrower or applicable Restricted Subsidiary may elect by written notice to the Administrative Agent in accordance with Section 2.09(d), at which time a prepayment shall be required in an amount equal to the Net Proceeds that have not been so applied (and no prepayment shall be required to the extent the aggregate amount of such Net Proceeds that are not reinvested in accordance with this Section does not exceed $5,000,000 in any Fiscal Year, in which case, the Administrative Agent shall cause such funds to be returned to the Borrower); provided, further, that to the extent any such Net Proceeds shall be received in respect of assets owned by a Loan Party, such Net Proceeds may be reinvested only in assets owned by a Loan Party or, in the case of a Permitted Acquisition or other acquisition, by any Person that shall become a Guarantor upon the consummation thereof (other than, in each case, Equity Interests in Foreign Subsidiaries, except to the extent such Net Proceeds shall have resulted from the sale of Equity Interests in one or more Foreign Subsidiaries).”
4
(o) Section 2.10(e) of the Term Credit Agreement shall be replaced in its entirety as follows:
“In the event that, prior to the date that is two years following the Amendment No. 1 Effective Date (i) the Borrower prepays any Term Loan pursuant to (x) Section 2.09(a), (y) solely as it relates to clause (c) of the definition of “Prepayment Event”, Section 2.09(b) or (z) payments made following acceleration of any Term Loans or after the Term Loans have otherwise become due prior to their Maturity Date, in each case in respect of and during the existence of an Event of Default, (ii) any Lender is required to assign its Loan pursuant to Section 2.17(b)(iii), then, in case the Borrower shall pay such Lender a fee equal to the Applicable Prepayment Fee with respect to the principal amount of such Lender’s Loan so prepaid or required to be assigned. For the avoidance of doubt, the Applicable Prepayment Fee will not be payable in connection with any prepayments of term loans pursuant to Section 2.09(b) that are made with the Net Proceeds of Dispositions or the Net Proceeds of any casualty, insured damage, taking under power of eminent domain or condemnation or similar proceeding of any asset of the Borrower or any Restricted Subsidiary. Without limiting the generality of the foregoing clause (z), it is understood and agreed that if the Term Loans are accelerated or otherwise become due prior to their Maturity Date, in each case, in respect of and during the existence of an Event of Default (including upon the occurrence of a bankruptcy or insolvency event (including the acceleration of claims by operation of law)), the Applicable Prepayment Fee with respect to a voluntary prepayment of the Term Loans will also be due and payable on the date of such acceleration or such other prior due date as though the Term Loans were voluntarily prepaid as of such date and shall constitute part of the Secured Obligations, in view of the impracticability and extreme difficulty of ascertaining actual damages and by mutual agreement of the parties as to a reasonable calculation of each Lender’s loss as a result thereof. Any premium payable above shall be presumed to be the liquidated damages sustained by each Lender and the Borrower agrees that it is reasonable under the circumstances currently existing. THE BORROWER EXPRESSLY WAIVES (TO THE FULLEST EXTENT IT MAY LAWFULLY DO SO) THE PROVISIONS OF ANY PRESENT OR FUTURE STATUTE OR LAW THAT PROHIBITS OR MAY PROHIBIT THE COLLECTION OF THE PREPAYMENT FEE IN CONNECTION WITH ANY SUCH ACCELERATION. The Borrower expressly agrees (to the fullest extent it may lawfully do so) that: (A) the Applicable Prepayment Fee is reasonable and is the product of an arm’s length transaction between sophisticated business people, ably represented by counsel; (B) the Applicable Prepayment Fee shall be payable notwithstanding the then prevailing market rates at the time payment is made; (C) there has been a course of conduct between the Lenders and the Borrower giving specific consideration in this transaction for such agreement to pay the Applicable Prepayment Fee; and (D) the Borrower shall be estopped hereafter from claiming differently than as agreed to in this paragraph.
(p) Section 5.01(c) of the Term Credit Agreement shall be amended by replacing the following language in subclause (vi) thereof with “[reserved]”:
“if there are any Unrestricted Subsidiaries setting forth financial information in detail reasonably satisfactory to the Administrative Agent for the applicable period for such Unrestricted Subsidiaries”
(q) Section 5.18 of the Term Credit Agreement shall be replaced in its entirety with: “[Reserved].”
5
(r) Section 6.01(a)(x) of the Term Credit Agreement shall be replaced in its entirety with the following:
“(x) Indebtedness under the ABL Credit Agreement in an aggregate principal amount not to exceed the lesser of (A) $200,000,000 and (B) the Borrowing Base;”
(s) Section 6.01(a)(xvi) of the Term Credit Agreement shall be replaced in its entirety with the following:
“(xvi) other Indebtedness of the Loan Parties in an aggregate principal amount not to exceed $25,000,000 at any time outstanding;”
(t) Section 6.04(s) of the Term Credit Agreement shall be amended by inserting the following language prior to the first word thereof (“Investments”):
“solely in connection with any merger, amalgamation or consolidation between Foreign Subsidiaries having a fair value not to exceed $2,000,000 in the aggregate and provided any such merger, amalgamation or consolidation would not have a material adverse effect on the Lenders,”
(u) Section 6.05(e) of the Term Credit Agreement shall be replaced in its entirety with the following:
“leases, subleases, licenses or sublicenses of real or personal property granted by the Borrower or any Restricted Subsidiary to third Persons in the ordinary course of business and not interfering in any material respect with the business of the Borrower or any Restricted Subsidiary;”
(v) Section 6.09(f) of the Term Loan Credit Agreement shall be amended by deleting the words “Investments permitted by Section 6.04” in their entirety and replacing them with the following:
“Investments permitted by Section 6.04; provided that for purposes of this clause (f), (i) any Investment in Restricted Subsidiaries that are not Loan Parties shall be on terms substantially as favorable to the Borrower or the applicable Restricted Subsidiary as would be obtainable by the Borrower or such Restricted Subsidiary at the time in a comparable arm’s-length transaction with unrelated third parties and (ii) in the case of any Investment in a non-Loan Party in an amount exceeding $15,000,000, the board of directors (or similar governing body) of the Borrower shall have engaged an independent financial advisor reasonably acceptable to the Required Lenders and such independent financial advisor shall have made a determination and delivered a customary fairness opinion stating that such Investment is on terms substantially as favorable to the Borrower or the applicable Restricted Subsidiary as would be obtainable by the Borrower or such Restricted Subsidiary at the time in a comparable arm’s-length transaction with unrelated third parties”
(w) 
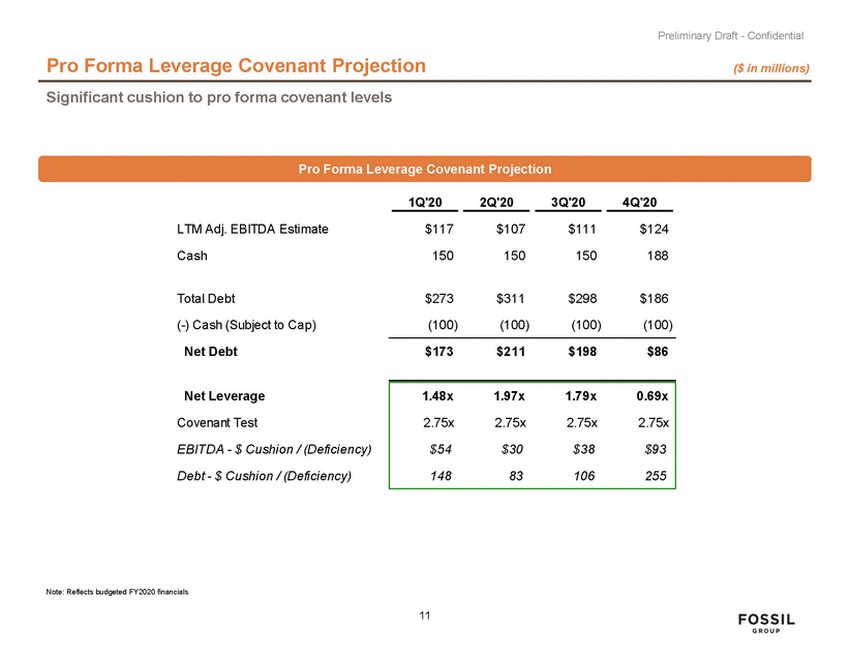
Section 6.13 of the Term Credit Agreement shall be replaced in its entirety with the following:
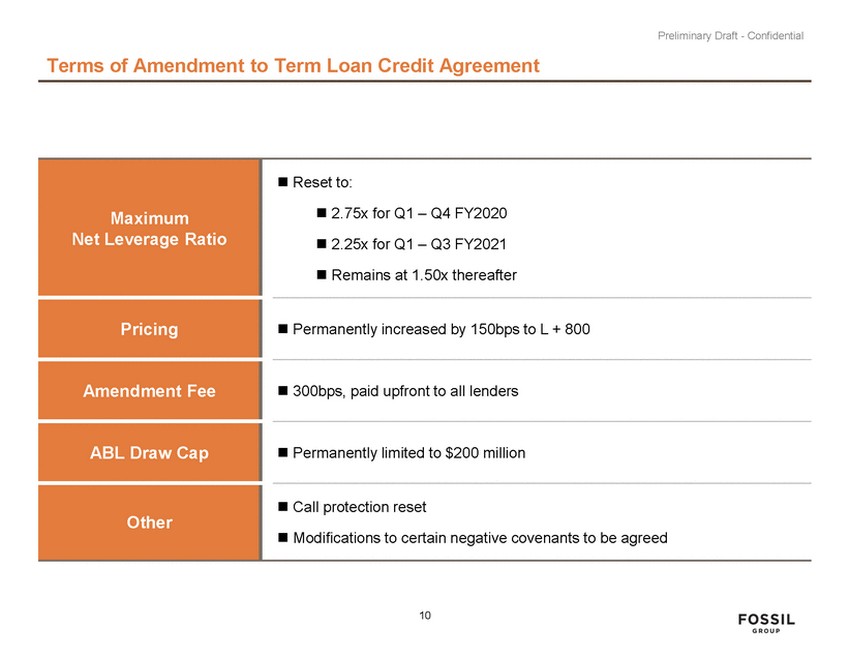
6
Section 6.13. Total Leverage Ratio. The Borrower will not permit the Total Leverage Ratio as of the last day of each Fiscal Quarter (commencing with the last day of the first full Fiscal Quarter ending after the Effective Date) to be greater than the Total Leverage Ratio set forth in the table below for such Fiscal Quarter:
Last Day of Fiscal Quarter | Total Leverage Ratio |
December 28, 2019 | 1.50 to 1.00 |
April 4, 2020 | 2.75 to 1.00 |
July 4, 2020 | 2.75 to 1.00 |
October 3, 2020 | 2.75 to 1.00 |
January 2, 2021 | 2.75 to 1.00 |
April 3, 2021 | 2.25 to 1.00 |
July 3, 2021 | 2.25 to 1.00 |
October 2, 2021 | 2.25 to 1.00 |
Thereafter | 1.50 to 1.00 |
(x) | Article VII of the Term Credit Agreement shall be amended by deleting the last two paragraphs thereof in their entirety. |
(y) | Section 9.16 of the Term Credit Agreement shall be amended as following: |
(i) Clause (ii) thereof shall be amended by deleting the following language:
“or (C) upon the designation of such Subsidiary as an Unrestricted Subsidiary in compliance with Section 5.17”
(ii) Clause (ii) thereof shall be further amended by adding the word “or” immediately prior to “(B)”.
Section 2. Effectiveness of Amendments. The amendments set forth in Section 1. of this Agreement shall become effective upon satisfaction of the following conditions:
(a) The Borrower, the Administrative Agent and Lenders collectively constituting the Required Lenders shall have executed and delivered a counterpart of this Agreement (by electronic transmission or otherwise) to the Administrative Agent.
(b) The Borrower shall have paid all fees and expenses (including expenses of counsel) due and payable on or about the Amendment No. 1 Effective Date.
Section 3. Counterparts; Entire Agreement; Amendment, Modification and Waiver.
(a) This Agreement may be executed in counterparts (and by different parties hereto on different counterparts), each of which shall constitute an original, but all of which when taken together shall constitute a single contract. Delivery of an executed counterpart of a signature page of this Agreement by electronic transmission shall be effective as delivery of a manually executed counterpart of this Agreement.
(b) After the Amendment Effective Date, this Agreement may not be amended, modified or waived except in accordance with Section 9.02 of the Term Credit Agreement.
Section 4. Applicable Law; Waiver of Jury Trial, Etc.. THIS AGREEMENT AND THE RIGHTS AND OBLIGATIONS OF THE PARTIES HEREUNDER SHALL BE GOVERNED BY AND CONSTRUED IN ACCORDANCE WITH THE LAWS OF THE STATE OF NEW YORK, BUT GIVING EFFECT TO FEDERAL LAWS APPLICABLE TO NATIONAL BANKS. THE PROVISIONS OF SECTIONS 9.09(c) THROUGH (e) AND 9.10 OF THE TERM CREDIT AGREEMENT SHALL APPLY TO THIS AGREEMENT MUTATIS MUTANDIS.
7
Section 5. Headings. The headings of this Agreement are for purposes of reference only and shall not limit or otherwise affect the meaning hereof.
Section 6. Effect of Agreement. Except as expressly set forth herein, this Agreement (a) shall not by implication or otherwise limit, impair, constitute a waiver of or otherwise affect the rights and remedies of any party under the Term Credit Agreement or any other Loan Document, and (b) shall not alter, modify, amend or in any way affect any of the terms, conditions, obligations, covenants or agreements contained in the Term Credit Agreement or any other provision of either such agreement or any other Loan Document or be construed as a novation thereof, or serve to effect a novation of the obligations outstanding under the Term Credit Agreement or instruments guaranteeing or securing the same, which shall remain and continue in full force and effect. Each and every term, condition, obligation, covenant and agreement contained in the Term Credit Agreement as amended hereby, or any other Loan Document as amended hereby, is hereby ratified and re-affirmed in all respects and shall continue in full force and effect. This Agreement shall constitute a Loan Document for purposes of the Term Credit Agreement and, from and after the Amendment Effective Date, all references to the Term Credit Agreement in any Loan Document and all references in the Term Credit Agreement to “this Agreement”, “hereunder”, “hereof” or words of like import referring to the Term Credit Agreement, shall, unless expressly provided otherwise, refer to the Term Credit Agreement as amended and supplemented by this Agreement.
[Remainder of Page Left Intentionally Blank]
8
IN WITNESS WHEREOF, the parties hereto have duly executed this Agreement as of the day and year first above written.
FOSSIL GROUP, INC., | |
as the Borrower |
By: | /s/ Kosta N. Kartsotis | ||
Name: |
Kosta N. Kartsotis | ||
Title: | Chairman and Chief Executive Officer |
[Signature Page to Amendment No. 1 to Term Credit Agreement]
JPMORGAN CHASE BANK, N.A., as Administrative Agent and a Lender |
By: | /s/ Ajay Gupta | ||
Name: |
Ajay Gupta | ||
Title: | Vice President |
[Signature Page to Amendment No. 1 to Term Credit Agreement]
HG Vora Special Opportunities master fund, ltd., as a Lender | |
By: HG VORA CAPITAL MANAGEMENT, LLC, investment adviser |
By: | /s/ Philip M. Garthe | ||
Name: | Philip M. Garthe | ||
Title: | Chief Operating Officer |
[Signature Page to Amendment No. 1 to Term Credit Agreement]
AT INVESTMENTS LLC, as a Lender | |
By: HG Vora Capital Management, LLC, investment adviser |
By: | /s/ Philip M. Garthe | ||
Name: | Philip M. Garthe | ||
Title: | Chief Operating Officer |
[Signature Page to Amendment No. 1 to Term Credit Agreement]
CHILTERN HOLDINGS LIMITED, as a Lender | |
By: HG Vora Capital Management, LLC, investment adviser |
By: | /s/ Philip M. Garthe | ||
Name: | Philip M. Garthe | ||
Title: | Chief Operating Officer |
[Signature Page to Amendment No. 1 to Term Credit Agreement]
BEACHHEAD CREDIT OPPORTUNITIES LLC, as a Lender |
By: | /s/ Christine Woodhouse | ||
Name: | Christine Woodhouse | ||
Title: | General Counsel |
[Signature Page to Amendment No. 1 to Term Credit Agreement]
BRYANT PARK FUNDING ULC, as a Lender |
By: | /s/ Irfan Ahmed | ||
Name: | Irfan Ahmed | ||
Title: | Authorized Signatory |
[Signature Page to Amendment No. 1 to Term Credit Agreement]
GEM 1 LOAN FUNDING LLC, as a Lender |
By: | /s/ Matt Jerrell | ||
Name: | Matt Jerrell | ||
Title: | Attorney in Fact |
[Signature Page to Amendment No. 1 to Term Credit Agreement]
Exhibit 99.1
FOSSIL GROUP, INC. REPORTS FOURTH QUARTER AND FULL YEAR 2019 RESULTS;
PROVIDES 2020 FINANCIAL GUIDANCE
Richardson, TX, February 26, 2020 (GLOBE NEWSWIRE) - Fossil Group, Inc. (NASDAQ: FOSL) today announced financial results for the fourth quarter and fiscal year ended December 28, 2019.
Fourth Quarter Financial Overview
• | Worldwide net sales of $712 million decreased 10% on a reported basis and 9% in constant currency. |
• | Double-digit growth in Asia and global third party e-commerce marketplaces, partially offsetting declines in the Wholesale channel. |
• | Strong performance in the Company’s latest generation display product, Gen 5, and new Hybrid HR watch, reflecting positive response to Fossil Group’s high performance technology and design innovation. |
• | Continued progress under the Company’s New World Fossil 2.0 - Transform to Grow Program ("NWF 2.0"), designed to achieve gross margin benefits and operating expense reductions totaling $200 million between 2019 and 2021. |
• | Gross margin of 43.3% compared to 53.0% a year ago, primarily reflecting a one-time, non-cash charge of $38 million related to the write-down of older generation connected inventory. |
• | Operating expenses of $309 million, down 12% year-over-year, attributable to continued progress under NWF 2.0. |
• | Operating loss of $1.0 million compared to operating income of $67 million a year ago due to softness in sales and gross margin, partially offset by benefits from NWF 2.0. |
• | Cash and cash equivalents of $200 million and net debt totaling $5.0 million at year-end. |
Kosta Kartsotis, Chairman and CEO, stated, “We are disappointed to close the year with a challenging fourth quarter, which primarily reflects lower than expected performance in our older generation connected products and ongoing softness in the department store channel. These pressures more than offset strong performance in our Gen 5 offering - our latest generation display product - and our Hybrid HR product, as well as double-digit growth in Asia and solid growth in our third party e-commerce channel. The top line softness resulted in heightened promotional activity and an inventory write-down, which had a substantial impact on our gross margins and profitability in the quarter.”
“As we navigate the challenging operating environment, we are taking actions to pivot our business model by deploying greater resources toward the Direct to Consumer channel, accelerating our connected product offerings and building on our success in the Asia region,” continued Kartsotis. “Our goal is to stabilize our business in traditional channels with a renewed emphasis on consumer driven innovation and enhanced story telling. At the same time, we are strengthening our operations and re-engineering our cost structure through our New World Fossil 2.0 - Transform to Grow program. Our teams made significant progress under this initiative in 2019 - we captured total benefits of $50 million for the full year, primarily through operating expense reductions. Importantly, we remain on track to achieve total benefits of $200 million over the three-year period from 2019 to 2021.”
Fourth Quarter 2019 Operating Results
Worldwide net sales totaled $711.6 million, a decrease of 10% on a reported basis and 9% in constant currency compared to $786.9 million in the fourth quarter of fiscal 2018. The year-over-year decline was primarily due to continued softness in traditional wholesale channels and lower than expected performance in older generation connected watches. Store closures and business exits adversely impacted the year-over-year net sales comparison by approximately 160 basis points. Global retail comparable sales in constant currency decreased 3%. The following table provides a summary of net sales performance, on both an as reported and constant currency basis, for the fourth quarter of 2019 compared to the 2018 fourth quarter (in millions, except percentage data).
Fourth Quarter | ||||||||||||||||||||||||
2019 | 2018 | Growth (Decline) | ||||||||||||||||||||||
Amounts as Reported | Amounts as Reported | Dollars as Reported (1) | Constant Currency Dollars (2) | Percentage as Reported (1) | Percentage Constant Currency (2) | |||||||||||||||||||
Americas | $ | 317 | $ | 377 | $ | (60 | ) | $ | (61 | ) | (16 | )% | (16 | )% | ||||||||||
Europe | 241 | 272 | (31 | ) | (25 | ) | (11 | ) | (9 | ) | ||||||||||||||
Asia | 149 | 135 | 14 | 15 | 10 | 11 | ||||||||||||||||||
Corporate | 5 | 3 | 2 | 2 | 96 | 96 | ||||||||||||||||||
Total net sales | $ | 712 | $ | 787 | $ | (75 | ) | $ | (69 | ) | (10 | )% | (9 | )% | ||||||||||
Watches | $ | 578 | $ | 636 | $ | (58 | ) | $ | (53 | ) | (9 | )% | (8 | )% | ||||||||||
Leathers | 78 | 86 | (8 | ) | (8 | ) | (9 | ) | (9 | ) | ||||||||||||||
Jewelry | 43 | 51 | (8 | ) | (7 | ) | (16 | ) | (14 | ) | ||||||||||||||
Other | 13 | 14 | (1 | ) | (1 | ) | (7 | ) | (7 | ) | ||||||||||||||
Total net sales | $ | 712 | $ | 787 | $ | (75 | ) | $ | (69 | ) | (10 | )% | (9 | )% |
(1) | Reported GAAP amounts include impacts from currency. |
(2) | Eliminates the effect of currency changes in fiscal 2019 to give investors a better understanding of the underlying trends within the business. See constant currency financial information at the end of this release for more information. |
Gross profit totaled $307.9 million compared to $416.9 million in the fourth quarter of 2018 and includes a one-time, non-cash charge of $38 million related to the write-down of older generation connected inventory. Gross margin decreased 970 basis points to 43.3%, largely driven by inventory valuation charges, increased product costs including tariffs and freight, and heightened promotional activity. These costs were partially offset by benefits generated from NWF 2.0, as well as higher margin sales growth in Asia.
Operating expenses totaled $308.8 million compared to $349.6 million a year ago. Operating expenses in the fourth quarter of 2019 include $5.2 million of restructuring costs, primarily related to professional services, employee costs and store closures and operating expenses in the fourth quarter of 2018 include $4.7 million of restructuring costs. Selling, general and administrative expenses decreased 12% to $303.6 million, primarily resulting from corporate and regional infrastructure reductions driven by NWF 2.0 initiatives, lower variable marketing expenses, store closures, and the currency effects of a stronger dollar.
Fourth quarter operating loss was $0.9 million compared to operating income of $67.3 million in the fourth quarter of 2018. Net loss totaled $6.9 million, or ($0.14) per diluted share, compared to net income of $47.6 million, or $0.94 per diluted share, in the fourth quarter of 2018. Per share data includes restructuring charges of $0.08 per diluted share in the fourth quarter of 2019 and $0.07 per diluted share in the fourth quarter of 2018. During the fourth quarter of fiscal 2019, currencies, including both the translation impact on operating earnings and the impact of foreign currency hedging contracts, unfavorably affected loss per diluted share by approximately $0.01.
Full Year 2019 Operating Results
Worldwide net sales decreased 13% to $2.2 billion on a reported basis and 11% in constant currency. Store closures and business exits adversely impacted the year-over-year net sales comparison by approximately 240 basis points. The company closed a net 33 stores in 2019 and expects a net reduction of approximately 10 locations in 2020. Global retail comparable sales in constant currency decreased 4%. The following table provides a summary of net sales performance, on both an as reported and constant currency basis, for full year 2019 compared to 2018 (in millions, except percentage data).
Fiscal Year | ||||||||||||||||||||||||
2019 | 2018 | Growth (Decline) | ||||||||||||||||||||||
Amounts as Reported | Amounts as Reported | Dollars as Reported (1) | Constant Currency Dollars (2) | Percentage as Reported (1) | Percentage Constant Currency (2) | |||||||||||||||||||
Americas | $ | 950 | $ | 1,175 | $ | (225 | ) | $ | (223 | ) | (19 | )% | (19 | )% | ||||||||||
Europe | 716 | 856 | (140 | ) | (109 | ) | (16 | ) | (13 | ) | ||||||||||||||
Asia | 535 | 505 | 30 | 45 | 6 | 9 | ||||||||||||||||||
Corporate | 17 | 5 | 12 | 12 | 229 | 229 | ||||||||||||||||||
Total net sales | $ | 2,218 | $ | 2,541 | $ | (323 | ) | $ | (275 | ) | (13 | )% | (11 | )% | ||||||||||
Watches | $ | 1,803 | $ | 2,033 | $ | (230 | ) | $ | (191 | ) | (11 | )% | (9 | )% | ||||||||||
Leathers | 239 | 289 | (50 | ) | (47 | ) | (18 | ) | (16 | ) | ||||||||||||||
Jewelry | 123 | 168 | (45 | ) | (40 | ) | (27 | ) | (24 | ) | ||||||||||||||
Other | 53 | 51 | 2 | 3 | 4 | 6 | ||||||||||||||||||
Total net sales | $ | 2,218 | $ | 2,541 | $ | (323 | ) | $ | (275 | ) | (13 | )% | (11 | )% |
(1) | Reported GAAP amounts include impacts from currency. |
(2) | Eliminates the effect of currency changes in fiscal 2019 to give investors a better understanding of the underlying trends within the business. See constant currency financial information at the end of this release for more information. |
Gross profit totaled $1.1 billion compared to $1.3 billion in 2018, while gross margin decreased to 49.6% versus 52.7% a year ago. The year-over-year decline was largely driven by inventory valuation adjustments, of which $38 million was recorded in fiscal year 2019 primarily for excess levels of older generation connected watches, increased product costs including tariffs and freight and an unfavorable currency impact of approximately 60 basis points. These costs were partially offset by higher margin sales growth in Asia and benefits from NWF 2.0.
Full year operating expenses were $1.1 billion, including $29.6 million of restructuring costs associated with employee costs, professional services and store closures, and $16.6 million of non-cash intangible asset impairment charges. Selling, general and administrative expenses decreased 12% to $1.1 billion, primarily resulting from corporate and regional infrastructure reductions driven by NWF 2.0 initiatives, store closures and the currency effects of a stronger U.S. dollar.
Operating loss in 2019 totaled $28.4 million compared to operating income of $62.7 million in 2018. Full year net loss was $52.4 million, or ($1.04) per diluted share, compared to net loss of $3.5 million, or ($0.07) per diluted share in 2018. The per share amounts include restructuring charges of $0.47 per diluted share and non-cash intangible asset impairment charges of $0.25 per diluted share in 2019 and restructuring charges of $0.75 per diluted share and non-cash intangible asset impairment charges of $0.10 per diluted share in 2018. Currencies, including both the translation impact on operating earnings and the impact of foreign currency hedging contracts, unfavorably affected the year-over-year diluted loss per share comparison by $0.18.
New World Fossil 2.0 - Transform to Grow Initiative
During 2019, the Company initiated NWF 2.0, which is designed to deliver gross margin benefits and operating expense reductions totaling $200 million over the three-year period from 2019 to 2021. In 2019, the Company captured total benefits of $50 million, primarily related to operating expense savings. In 2020, the Company expects to achieve additional benefits of $65 million, consisting of $15 million of gross margin improvement and $50 million of operating expense reduction.
Balance Sheet Highlights
As of December 28, 2019, the Company had cash and cash equivalents of $200 million, long-term debt of $179 million and net debt of $5.0 million. The Company’s net leverage ratio was 0.8 times at December 28, 2019 compared to 1.4 times a year ago. Inventories at year-end totaled $452 million, an increase of 20% versus a year ago, primarily reflecting underperformance in older generation connected watches during the fourth quarter of 2019.
Term Loan Amendment
On February 20, 2020, the Company and the required lenders under its Term Credit Agreement entered into an amendment to the Term Credit Agreement to modify certain terms therein, including to (i) increase the interest rate, (ii) increase the maximum total leverage ratio through the quarter ending October 2, 2021, at which time the ratio reverts to 1.50 to 1.00, (iii) limit the amount of borrowings under the Company’s revolving credit agreement to the lesser of the borrowing base and $200.0 million, and (iv) extend the applicable period for certain prepayment fees. For more information on the amendment, see the Company’s Current Report on Form 8-K filed with the Securities and Exchange Commission on February 26, 2020.
2020 Financial Guidance
The Company is providing guidance on a GAAP basis. For comparison purposes, the Company has also provided additional information which quantifies the estimated impact on its operating expenses and operating income for non-operational items impacting operating results for fiscal 2020 and the first quarter of fiscal 2020. The Company provided the following financial guidance for the full year and first quarter of fiscal 2020:
Full Year 2020
• | Net sales decline in the range of (11.5%) to (4.5%), including the estimated negative impact of business exits and currency of approximately (1.3%) and (0.5%), respectively |
• | Gross margin in the range of 50.5% to 51.5% |
• | Operating expenses ranging from $1,015 million to $1,055 million, including restructuring charges of $35 million, inclusive of severance and related costs |
• | Operating margin in the range of (1.5%) to 1.5% |
• | Interest expense of approximately $32 million |
• | Income (loss) before income taxes in the range of ($57) million to $3 million |
Q1 2020
• | Net sales decline in the range of (10.0%) to (3.5%), including the estimated negative impacts of business exits and currency of approximately (2.5%) and (1.3%), respectively |
• | Gross margin in the range of 47.0% to 49.0% |
• | Operating expenses ranging from $256 million to $265 million, including restructuring charges of $12 million, inclusive of severance and related costs |
• | Operating margin in the range of (14.0%) to (10.0%) |
• | Interest expense of approximately $8 million |
• | Income (loss) before income taxes in the range of ($67) million to ($52) million |
The Company’s guidance assumes that foreign currency exchange rates remain at prevailing levels. For fiscal 2020, the Company’s first quarter and full year periods will include 14 weeks and 53 weeks, respectively, while the comparative fiscal 2019 periods included 13 weeks and 52 weeks, respectively. The Company estimates the additional week will positively impact full year sales by approximately 50 basis points.
The guidance provided includes our current estimate of the impact of the coronavirus on Fossil Group’s global business performance in the first quarter of 2020. Given our strong inventory levels and the efforts of sourcing and assembly sites to safely return to production in the next few weeks, we do not anticipate a material disruption to our supply chain over the next several months. We are currently anticipating disruption to our China, Hong Kong (SAR), Macau (SAR), South Korea, and Travel Retail businesses, which represent about 10% of our global sales in the first quarter of fiscal 2020. The estimated impact in the first quarter has been included in our current guidance estimates. However, given the dynamic nature of the situation and uncertainty regarding the duration of any business disruption across the globe, the potential longer term financial impact cannot be reasonably estimated at this time. Guidance may need to be revised if the coronavirus impact extends materially beyond the first quarter of fiscal 2020.
Safe Harbor
Certain statements contained herein that are not historical facts, including multi-year profit improvement estimates, the success of our connected accessories, future financial guidance as well as estimated impacts from the coronavirus, tariffs, the Tax Cuts and Jobs Act, foreign currency translation, amortization expense, foreign tax credits, non-cash impairments and restructuring charges, constitute “forward-looking statements” within the meaning of the Private Securities Litigation Reform Act of 1995 and involve a number of risks and uncertainties. The actual results of the future events described in such forward-looking statements could differ materially from those stated in such forward-looking statements. Among the factors that could cause actual results to differ materially are: the effect of worldwide economic conditions; the impact of the coronavirus; significant changes in consumer spending patterns or preferences; interruptions or delays in the supply of key components; acts of war or acts of terrorism; changes in foreign currency valuations in relation to the U.S. dollar; lower levels of consumer spending resulting from a general economic downturn or generally reduced shopping activity caused by public safety or consumer confidence concerns; the performance of our products within the prevailing retail environment; customer acceptance of both new designs and newly-introduced product lines, including risks related to the expanded launch of connected accessories; financial difficulties encountered by customers; the effects of vigorous competition in the markets in which we operate; compliance with debt covenants and other contractual provisions; risks related to the success of our restructuring programs; the termination or non-renewal of material licenses, foreign operations and manufacturing; changes in the costs of materials, labor and advertising; government regulation and tariffs; our ability to secure and protect trademarks and other intellectual property rights; and the outcome of current and possible future litigation, as well as the risks and uncertainties set forth in the Company’s most recent Annual Report on Form 10-K and subsequent Quarterly Reports on Form 10-Q filed with the Securities and Exchange Commission (the “SEC”). These forward-looking statements are based on our current expectations and beliefs concerning future developments and their potential effect on us. While management believes that these forward-looking statements are reasonable as and when made, there can be no assurance that future developments affecting us will be those that we anticipate. Readers of this release should consider these factors in evaluating, and are cautioned not to place undue reliance on, the forward-looking statements contained herein. The Company assumes no obligation to publicly update or revise any forward-looking statements, whether as a result of new information, future events, or otherwise, except as required by law.
About Fossil Group, Inc.
Fossil Group, Inc. is a global design, marketing, distribution and innovation company specializing in lifestyle accessories. Under a diverse portfolio of owned and licensed brands, our offerings include fashion watches, jewelry, handbags, small leather goods and wearables. We are committed to delivering the best in design and innovation across our owned brands, Fossil, Michele, Misfit, Relic, Skagen and Zodiac, and licensed brands, Armani Exchange, BMW, Chaps, Diesel, DKNY, Emporio Armani, kate spade new york, Michael Kors, PUMA and Tory Burch. We bring each brand story to life through an extensive distribution network across numerous geographies, categories and channels. Certain press release and SEC filing information concerning the Company is also available at www.fossilgroup.com.
Investor Relations: | Christine Greany | |
The Blueshirt Group | ||
(858) 523-1732 | ||
christine@blueshirtgroup.com |
For the 13 Weeks Ended |
For the 52 Weeks Ended |
|||||||||
Consolidated Income Statement Data ($ in millions, except per share data): |
December 28, 2019 | December 29, 2018 | December 28, 2019 | December 29, 2018 | ||||||||
Net sales | $ | 711.6 | $ | 786.9 | $ | 2,217.7 | $ | 2,541.5 | ||||
Cost of sales | 403.7 | 370.0 | 1,118.3 | 1,201.4 | ||||||||
Gross profit | 307.9 | 416.9 | 1,099.4 | 1,340.1 | ||||||||
Gross margin | 43.3 | % | 53.0 | % | 49.6 | % | 52.7 | % | ||||
Operating expenses: | ||||||||||||
Selling, general and administrative expenses | 303.6 | 344.9 | 1,081.6 | 1,224.6 | ||||||||
Trade name impairments | — | — | 16.6 | 6.2 | ||||||||
Restructuring charges | 5.2 | 4.7 | 29.6 | 46.6 | ||||||||
Total operating expenses | $ | 308.8 | $ | 349.6 | $ | 1,127.8 | $ | 1,277.4 | ||||
Total operating expenses (% of net sales) | 43.4 | % | 44.4 | % | 50.9 | % | 50.3 | % | ||||
Operating income (loss) | (0.9 | ) | 67.3 | (28.4 | ) | 62.7 | ||||||
Operating margin | (0.1 | )% | 8.6 | % | (1.3 | )% | 2.5 | % | ||||
Interest expense | 7.0 | 10.8 | 29.9 | 42.5 | ||||||||
Other income (expense) - net | 1.9 | 5.3 | 27.0 | — | ||||||||
Income (loss) before income taxes | (6.0 | ) | 61.8 | (31.3 | ) | 20.2 | ||||||
Provision for income taxes | 0.7 | 13.9 | 18.7 | 21.1 | ||||||||
Less: Net income attributable to noncontrolling interest | 0.2 | 0.3 | 2.4 | 2.6 | ||||||||
Net income attributable to Fossil Group, Inc. | $ | (6.9 | ) | $ | 47.6 | $ | (52.4 | ) | $ | (3.5 | ) | |
Earnings per share: | ||||||||||||
Basic | $ | (0.14 | ) | $ | 0.96 | $ | (1.04 | ) | $ | (0.07 | ) | |
Diluted | $ | (0.14 | ) | $ | 0.94 | $ | (1.04 | ) | $ | (0.07 | ) | |
Weighted average common shares outstanding: | ||||||||||||
Basic | 50.5 | 49.5 | 50.2 | 49.2 | ||||||||
Diluted | 50.5 | 50.6 | 50.2 | 49.2 |
Consolidated Balance Sheet Data ($ in millions): | December 28, 2019 | December 29, 2018 | ||||||
Assets: | ||||||||
Cash and cash equivalents | $ | 200.2 | $ | 403.4 | ||||
Accounts receivable - net | 289.7 | 328.0 | ||||||
Inventories | 452.3 | 377.6 | ||||||
Other current assets | 117.2 | 149.6 | ||||||
Total current assets | $ | 1,059.4 | $ | 1,258.6 | ||||
Property, plant and equipment - net | $ | 151.5 | $ | 183.2 | ||||
Operating lease right-of-use assets | 288.2 | — | ||||||
Intangible and other assets - net | 105.6 | 133.4 | ||||||
Total long-term assets | $ | 545.3 | $ | 316.6 | ||||
Total assets | $ | 1,604.7 | $ | 1,575.2 | ||||
Liabilities and stockholders’ equity: | ||||||||
Accounts payable, accrued expenses and other current liabilities | $ | 533.0 | $ | 479.4 | ||||
Short-term debt | 26.2 | 126.4 | ||||||
Total current liabilities | $ | 559.2 | $ | 605.8 | ||||
Long-term debt | $ | 178.8 | $ | 269.8 | ||||
Long-term operating lease liabilities | 288.7 | — | ||||||
Other long-term liabilities | 74.2 | 111.0 | ||||||
Total long-term liabilities | $ | 541.7 | $ | 380.8 | ||||
Stockholders’ equity | $ | 503.8 | $ | 588.6 | ||||
Total liabilities and stockholders’ equity | $ | 1,604.7 | $ | 1,575.2 |
Constant Currency Financial Information
The following table presents the Company’s business segment and product net sales on a constant currency basis which are non-GAAP financial measures. To calculate net sales on a constant currency basis, net sales for the current fiscal year period for entities reporting in currencies other than the U.S. dollar are translated into U.S. dollars at the average rates during the comparable period of the prior fiscal year. The Company presents constant currency information to provide investors with a basis to evaluate how its underlying business performed excluding the effects of foreign currency exchange rate fluctuations. The constant currency financial information presented herein should not be considered a substitute for, or superior to, the measures of financial performance prepared in accordance with GAAP.
Net Sales | |||||||||||||
For the 13 Weeks Ended | |||||||||||||
December 28, 2019 | December 28, 2018 | ||||||||||||
($ in millions) | As Reported | Impact of Foreign Currency Exchange Rates | Constant Currency | As Reported | |||||||||
Segment: | |||||||||||||
Americas | $ | 316.5 | $ | (0.4 | ) | $ | 316.1 | $ | 377.5 | ||||
Europe | 241.3 | 5.8 | 247.1 | 271.6 | |||||||||
Asia | 148.7 | 1.4 | 150.1 | 135.2 | |||||||||
Corporate | 5.1 | — | 5.1 | 2.6 | |||||||||
Total net sales | $ | 711.6 | $ | 6.8 | $ | 718.4 | $ | 786.9 | |||||
Product Categories: | |||||||||||||
Watches | $ | 577.5 | $ | 5.5 | $ | 583.0 | $ | 635.9 | |||||
Leathers | 77.6 | 0.5 | 78.1 | 86.2 | |||||||||
Jewelry | 43.0 | 0.8 | 43.8 | 51.1 | |||||||||
Other | 13.5 | — | 13.5 | 13.7 | |||||||||
Total net sales | $ | 711.6 | $ | 6.8 | $ | 718.4 | $ | 786.9 |
Adjusted EBITDA
Adjusted EBITDA is a non-GAAP financial measure. We define Adjusted EBITDA as our net income (loss) before the impact of income tax expense (benefit), plus interest expense, amortization and depreciation, impairment expense, other non-cash charges, stock-based compensation expense, and restructuring expense minus interest income. We have included Adjusted EBITDA herein because it is widely used by investors for valuation and for comparing our financial performance with the performance of our competitors. We also use Adjusted EBITDA to monitor and compare the financial performance of our operations. Our presentation of Adjusted EBITDA may not be comparable to similarly titled measures other companies report. Adjusted EBITDA is not intended to be used as an alternative to any measure of our performance in accordance with GAAP. The following table reconciles Adjusted EBITDA to the most directly comparable GAAP financial measure, which is income (loss) before income taxes. Certain line items presented in the tables below, when aggregated, may not foot due to rounding.
Fiscal 2019 | ||||||||||||||||||||
($ in millions): | Q1 | Q2 | Q3 | Q4 | Total | |||||||||||||||
Income (loss) before income taxes | $ | (2.2 | ) | $ | (5.2 | ) | $ | (18.0 | ) | $ | (6.0 | ) | $ | (31.3 | ) | |||||
Plus: | ||||||||||||||||||||
Interest expense | 8.1 | 7.4 | 7.4 | 7.0 | 29.9 | |||||||||||||||
Amortization and depreciation | 14.4 | 13.9 | 13.6 | 12.9 | 54.8 | |||||||||||||||
Impairment expense | 0.9 | 1.7 | 18.0 | 4.7 | 25.3 | |||||||||||||||
Other non-cash charges | 0.3 | 1.6 | 8.8 | 35.9 | 46.6 | |||||||||||||||
Stock-based compensation | 4.4 | 5.2 | 4.3 | 1.9 | 15.8 | |||||||||||||||
Restructuring expense | 10.2 | 7.3 | 7.0 | 5.2 | 29.6 | |||||||||||||||
Less: | ||||||||||||||||||||
Interest Income | 0.7 | 0.9 | 0.3 | 0.1 | 2.1 | |||||||||||||||
Adjusted EBITDA | $ | 35.4 | $ | 31.0 | $ | 40.8 | $ | 61.5 | $ | 168.6 |
Store Count Information
December 28, 2019 | December 29, 2018 | ||||||||||||||||||||||||||||||
Americas | Europe | Asia | Total | Americas | Europe | Asia | Total | ||||||||||||||||||||||||
Accessory stores | 85 | 83 | 53 | 221 | 89 | 94 | 53 | 236 | |||||||||||||||||||||||
Outlets | 114 | 74 | 35 | 223 | 126 | 74 | 40 | 240 | |||||||||||||||||||||||
Full priced multi-brand | — | 4 | 3 | 7 | — | 5 | 3 | 8 | |||||||||||||||||||||||
Total stores | 199 | 161 | 91 | 451 | 215 | 173 | 96 | 484 |
END OF RELEASE
Exhibit 99.2
![]() |
Preliminary Draft - Confidential A m e n d m e n t D i s c u s s i o nM a t e r i a l s F e b r u a r y2 0 2 0 |
![]() |
Preliminary Draft - Confidential This presentation has been prepared solely for informational purposes only and the exclusive use of the party to whom the presentation has been delivered (such party, together with its subsidiaries and affiliates, the “Recipient”). This presentation does not purport to be all-inclusive or to contain all of the information that the Recipient may require. Fossil Group, Inc. (the “Company”) does not make any representation or warranty, either express or implied, as to the accuracy, completeness or reliability of the information contained in this presentation. Any estimates or projections contained in this presentation as to events that may occur in the future (including projections of future financial performance and forward-looking statements) are based upon assumptions and analysis that the Company believes, as of the date hereof, provided reasonable basis thereof. The presentation may include certain forward-looking statements and projections provided by the Company. Any such statements and projections reflect various estimates and assumptions by the Company concerning anticipated results. No representations or warranties are made by the Company as to the accuracy of any such statements or projections. Whether or not any such forward-looking statements or projections are in fact achieved will depend upon future events, some of which are not within the control of the Company. Accordingly, actual results may vary from the projected results and such variations may be material. Among the factors that could cause actual results to differ materially include the risks and uncertainties set forth in the Company’s most recent Annual Report on Form 10-K and subsequent Quarterly Reports on Form 10-Q filed with the Securities and Exchange Commission. The Recipient should consider these factors in evaluating, and are cautioned not to place undue reliance on, the forward-looking statements contained herein. Statements contained herein describing documents and agreements are summaries only and such summaries are qualified in their entirety by such documents and agreements. Nothing contained herein is, or shall be relied upon as, a promise or representation as to the past or future. The Company expressly disclaims any and all liability relating to or resulting from the use of this presentation. In addition, the information contained in this presentation is (1) as of the date hereof in the case of information about the Company and (2) as the date of such information from persons other than the Company. The Company has no obligation, and takes no duty, to update such information, including in the event that such information becomes inaccurate. This presentation includes certain non-GAAP financial measures, including Adjusted EBITDA and Free Cash Flow. While the Company believes Adjusted EBITDA and Free Cash Flow are useful measures for investors, they are not presented in accordance with GAAP. You should not consider non-GAAP measures in isolation or as a substitute for items calculated in accordance with GAAP. In addition, Adjusted EBITDA has inherent material limitations as a performance measure because it adds back certain expenses to net income, resulting in those expenses not being taken into account in the applicable financial measure. Because not all companies use identical calculations, the presentation herein of non-GAAP financial measures may not be comparable to other similarly titled measures of other companies. This presentation also includes references to constant currency financial information, which is a non-GAAP financial measure. To calculate amounts on a constant currency basis, amounts for the current year for entities reporting in currencies other than the U.S. dollar are translated into U.S. dollars at the average rates during the comparable period of the prior fiscal year. We present constant currency information to provide investors with a basis to evaluate how our underlying business performed excluding the effects of foreign currency exchange rate fluctuations. The constant currency financial information presented herein should not be considered a substitute for, or superior to, the measures of financial performance prepared in accordance with GAAP. The Recipient acknowledges that the Company considers this presentation and all information contained herein to include confidential, sensitive and proprietary information. The Recipient agrees that the information in this presentation is Confidential Information within the meaning of that certain Confidentiality Agreement, dated as of February 3, 2020, by and between the Recipient and the Company (the “Confidentiality Agreement”) and is subject to the limitations on use and disclosure and other terms and conditions of the Confidentiality Agreement. |
![]() |
Preliminary Draft - Confidential Table of Contents I. Executive Summary II. Q4 2019 Update III. 2020 Budget IV. Overview of Amendment V. Appendix |
![]() |
Preliminary Draft - Confidential Executive Summary |
![]() |
Preliminary Draft - Confidential Executive Summary Fossil Group (Fossil or the Company) has agreed in principle to the terms of an amendment to its Term Loan B with the Required Lenders necessary to effectuate such amendment The Company anticipates that it will fall short of midpoint guidance on Q419 adjusted operating income by ~$60mm primarily due to lower than expected sales of older generation Connected product, discussed in detail herein This underperformance during a critical sales quarter, along with seasonal ABL utilization in Q2 and Q3 FY2020 as the Company builds inventory for the 2020 holiday season, are driving a potential leverage covenant violation in Q220 under current covenant levels However, the Company continues to have confidence in its ability to stabilize sales and pivot to growth through the burgeoning Asia, e-commerce, and Connected categories As such, the Company opened a dialogue with lenders representing ~75% of its outstanding Term Loan and has negotiated the terms of an amendment to provide covenant relief through 2021 and to facilitate the successful execution of its business plan over the coming years These materials contain: A review of preliminary Q419 performance A summary of the Companys 2020 budget The agreed terms of the Term Loan amendment The Company is targeting having a fully documented amendment in advance of its earnings release (tentatively scheduled for [February 20]), at which time the amendment would be announced along with Q4 results 1 |
![]() |
Preliminary Draft - Confidential Q4 2019 Update |
![]() |
Preliminary Draft - Confidential Q419 Financial Performance – Overview ($ in millions) Commentary Q4 performance generally in line with expectations, with notable exception of Gen 4 / Sport Connected performance Going into holiday season, we anticipated that our previous generation Connected product (Gen 4 / Sport) would be a significant growth driver as a lower-tiered pricing option. However, consumer response was negatively impacted by: Strong consumer interest in our higher-priced Gen 5 product with more features Intense price competition for older-generation product Overall core sales2 down 7% year-over-year, roughly in-line with Q2 / Q3 performance Asia (up 12%), pure-play third party e-commerce (up 28%) and own-brand e-commerce (up 3%) continue to drive growth Continued headwinds in wholesale (down 19%) and regional overall declines in Americas (down 14%) and Europe (down 7%) Gross margins negatively impacted by Connected performance including inventory reserves taken (530bps) and promotional activity SG&A and marketing expenses down $41mm driven by New World Fossil initiatives and store closures 1.Reflects preliminary Q4 FY2019 results 2.Core sales removes impact of foreign exchange, store exits, and brand exits 2 Net Sales (-) Cos t of Sales Gross Profit (-) SG&A Expens es (Ex. Marketing) (-) Marketing Expens es (-) Goodwill & Trade Nam e Im pairm ent (-) Res tructuring Charges Operating Income (Loss) Adjusted Operating Income (Loss) Q4 2018 As Reported Actual Q4 2019 As Reported Actual 1 Variance $ / bps % $787 (370) $712 (404) ($75) (34) (9.6%) 9.1% $417 (267) (78) 0 (5) $308 (234) (69) - (5) ($109) 32 9 (0) (1) (26.2%) (12.2%) (11.6%) NM 15.6% $67 72 ($1) 4 ($68) (68) NM (94.1%) Adjusted EBITDA $102 $62 ($40) (39.6%) (-) Interes t Expens e (-) Other Incom e (Expens e) Earnings (Loss) Before Income Tax (-) Taxes (-) Noncontrolling Interes t Net Income (Loss) Adjusted Net Income (Loss) % Sales Decrease % Gross Margin % Adjusted Operating Margin ($11) $5 ($7) $2 $4 ($3) (35.1%) (62.4%) $62 ($14) (0) ($6) ($1) (0) ($68) $13 0 NM (95.0%) (42.0%) $48 51 (14.5%) 53.0% 9.1% ($7) (2) (9.6%) 43.3% 0.6% ($54) (53) 497 b ps (972 b ps) (852 b ps) NM NM NA NA NA % Adjusted EBITDA Margin 12.9% 8.6% (430 b ps) NA |
![]() |
Preliminary Draft - Confidential Q419 Financial Performance vs. Guidance ($ in millions) Operating income miss driven predominantly by Connected inventory challenges Underperformance vs. mid-point guidance on sales, gross margin, and operating income driven primarily by: Connected Gen 4 / Sport underperformance, causing elevated promotional activity and $38mm inventory reserve Modest weakness in traditional, principally in the US Sales $730 ($17) ($2) $712 GM $365 50.0% ($50) ($7) $308 43.3% Operating Expenses Impairments Restructuring Total Opex $300 - $ - - ($1) 5 $299 5 5 - (0) 5 $305 $ - $4 $309 Operating Income $60 8.2% ($50) ($11) ($1) (0.1%) Adj. Operating Income $65 8.9% ($50) ($11) $4 0.6% Note: Reflects preliminary Q4 FY2019 results 3 Q4 2019 Mid-point Guida nce Wa lk Mid-point Guidance Connected Sales, GM, & Reserves Other Preliminary Q4 Actual |
![]() |
Preliminary Draft - Confidential Q419 Connected Performance Review Several issues converged to create our Q4 underperformance and over-inventory situation. We have identified the root causes and are aggressively addressing each of them Product Strategy Going into 2019, management believed that the Gen 4 and Sport platforms would outperform the new Gen 5 platform due to Gen 5 products being larger and higher-priced The Company positioned inventory accordingly, with ~70% of inventory for 2H 2019 being Gen 4 and Sport Actual sales performance was weighted much more heavily to Gen 5 products than expected (~70% of sales), the unanticipated shift in consumer preference exhausted our Gen 5 inventory in the wholesale category and we finished the year with significant excess Gen 4 and Sport inventory Product Performance After the Gen 5 launch with excellent reviews and press, Gen 4 and Sport sell-through greatly reduced due to several factors: Consumers proved highly willing to pay for the latest technology, and the efforts of Fossils PR and Marketing teams led to significant awareness and buzz around the Gen 5 offerings Competition was fiercer than anticipated in the lower-priced end of the wearable market, with older generation products being discounted heavily Go-Forward Strategy Refocus the wearables business around the brands and channels that are working and rationalize supply in others Refine planning capabilities in order to (i) better forecast consumer demand and (ii) swiftly align the supply chain to fulfill these demands Collectively, these initiatives will ensure the right products are directed to the right channels while reducing complexity and improving supply chain efficiency The extremely positive consumer response to the Gen 5 products superior features and continued movement down the cost curve despite lower volume demonstrate the strength of the Connected platform today. We remain confident in wearables as a growth driver for Fossil moving forward. 4 |
![]() |
Preliminary Draft - Confidential Key Q419 Trends by Category / Geography / Channel ($ in millions) Wholesale / E-Comm. / Retail Sales1 E-commerce and APAC continue to be areas of strength, with double-digit year-over-year growth Y-o-Y Core2 sales growth: Successful turnaround of previous challenges with Amazon platform Wholesale: (15.4%) E-Commerce: 15.6% India and China major growth drivers for APAC Retail: (4.0%) Connected year-over-year decline driven by inventory misallocation, as Gen 5 product has demonstrated substantial customer demand Total: (7.1%) Americas / EMEA / APAC Sales3 Traditional / Connected Sales 2 2 Y-o-Y Core Y-o-Y Core $900 $800 $700 $600 $500 $400 $300 $200 $100 $0 $900 $800 $700 $600 $500 $400 $300 $200 $100 $0 (7.1%) (7.1%) (17.7%) 12.4% (7.1%) (4.9%) (14.2%) Q4'18 Q4'19 Connected Q4'18 Q4'19 APAC Traditional Americas EMEA Note: Reflects preliminary Q4 FY2019 results 1. 2. 3. Retail includes retail stores and concessions; wholesale includes wholesale and off-price; E-Commerce includes own-brand E-Commerce and pure-play third-party E-Commerce Core sales removes impact of foreign exchange, store exits, and brand exits Does not aggregate to total sales as $3mm and $5mm of Corporate sales are not included in geographic segment sales for Q4 2018 and Q4 2019, respectively 5 $787 $136 $712 $109 $651 $603 $784 $135 $707 $149 $272 $241 $377 $317 |
![]() |
Preliminary Draft - Confidential 2020 Budget |
![]() |
Preliminary Draft - Confidential 2020 Strategic Goals Deliver value / Build equity / Be fast: • Storytelling Excellence: Using analytics, craft winning product and brand stories, targeting key consumer segments with the right marketing mix • Segment to Win: Build product assortments to maximize margin and reduce cross channel conflict • Insight-driven Product Design: Use analytics to quickly bring consumer preferences into product development • Sustainability: Every product has a pro-planet component Generate Demand in Direct-To-Consumer (DTC) and E-commerce: Grow sales in stores and websites with segmented assortments, better pricing/promo tactics and stock management; develop and execute winning global marketplace and pure play channel strategies; accelerate Customer Experience (CX) initiatives Drive Category Leadership: Develop and execute win-win category strategies around price, mix, margin, inventory that enable us to gain share in key accounts and sales channels Win in Top Tier Accounts: Gain share and stabilize margin in top global accounts with win-win plans for segmented assortments, space management plans, winning drops / exclusives / stories, etc. China: Continue core, go-to-market success (e.g. local assortment, influencers, sales partnerships) in Armani and other key brands. Leverage online expertise and maximize peak sales days. Grow jewelry and smartwatch End to End Manufacturing & Distribution: Maintain On Time Delivery and reduce manufacturing lead-times to better hit market trends and reduce working capital. Strengthen our strategic sourcing capability to improve cost and performance and reduce tariff risk Operational Model Transformation: Transform the global operation structure to enable greater efficiency, better coordination and better focus and accountability against brand, sales and supply chain priorities India: Continue core, go-to-market success (e.g. local assortment, influencers, omnichannel collaboration) in Fossil and apply to other key brands. Continue to balance growth in DTC, pure play, and wholesale. Grow jewelry and smartwatch Cost Base Optimization: Reduce the fixed cost base to targeted levels, enabling improved profitability and investment for growth Planning and Inventory Management: Maintain product availability and inventory flexibility through better integrated planning and Sales & Operations Planning (S&OP) coordination. Deploy analytically driven demand forecasting to improve signals to supply and manufacturing Distort opportunity: • Connected: Develop the category with right product and pre-season preparation • Jewelry: Reinvigorate the category globally with improved product and distribution • Portfolio Renewal: Strengthen the portfolio with new licensed brands that appeal to evolving consumer preferences APAC: Pivot go-to-market approach to e-commerce and digital marketing, supported by analytics. Continue key brands focus across all markets 6 Priorities Mission Cost & Operating Transformation Supply Chain Optimization China and India Acceleration Commercial Transformation Goals Story and Product Innovation [ ] Focus relentlessly on fashion watch and accessory consumers. Be greater together, designing and innovating distinctive watches, wearables and accessories like no one else. Use digital capabilities to generate leading revenue growth and profitability. |
![]() |
Preliminary Draft - Confidential 2020 Budget – Key Metrics ($ in millions) Revenue Revenue declines flatten as increased scale in growth categories (Asia, Connected, e-commerce) begins to outweigh legacy category softness Gross Margin Removal of one-time impact from Connected inventory in 2019 along with NWF initiatives drive ~140bps gross margin improvement $3,000 0.0% $1,500 60.0% $2,500 $1,250 (3.0%) 56.0% $1,053 $2,000 $1,000 (6.0%) 52.0% $1,500 $750 (9.0%) 48.0% $1,000 $500 (12.0%) 44.0% $500 $250 $ - (15.0%) $ - 40.0% FY18A FY19A FY20E FY18A FY19A FY20E Y-o-Y % Core Growth1 Revenue Gross Profit % Margin Adj. EBITDA Unlevered Free Cash Flow Gross profit decline partially offset by meaningful OpEx reductions from NWF program, with all savings initiatives already well underway Working capital normalization (after significant 2018 inflows and 2019 outflows) drives improved free cash flow generation in 2020 $240 $221 16.0% 14.0% 12.0% 10.0% 8.0% 6.0% 4.0% 2.0% 0.0% $350 $300 $250 $200 $150 $100 $50 $ - ($50) $200 $160 $120 $80 $40 $ - FY18A FY19A FY20E Adj. EBITDA % Margin FY18A FY19A FY20E 1. Core sales removes impact of foreign exchange, store exits, and brand exits 7 $268 $65 ($8) 8.7% $169 7.6% $124 6.0% $1,340 52.7% $1,099 49.6% 51.0% $2,542 (4.8%) $2,218 $2,064 (8.4%) (4.6%) |
![]() |
Preliminary Draft - Confidential 2020 Budget – Key Drivers ($ in millions) Wholesale / E-Comm. / Retail Sales1 Moderating revenue decline in 2020 driven by growth in key focus areas partially offsetting declines in challenged legacy segments Y-o-Y Core2 sale growth: Continued double digit core sales growth in Asia and modest growth in the global Direct to Consumer channel, along with return to growth in jewelry Americas and EMEA wholesale declines expected to continue Wholesale: (13.3%) E-Commerce: 20.9% Expected decline in Connected sales driven by refinement of assortment and distribution strategy to focus on selling latest-generation product through consumer electronics and telecom channels, vs. legacy wholesale Retail: (1.9%) Reflects go-to-market strategy shift to get the right product in front of the right consumer, driving a return to Connected growth in future years Total: (4.6%) Scale in growing segments is improving, but not yet sufficient to offset declines elsewhere in the portfolio Traditional / Connected Sales Americas / EMEA / APAC Sales3 '19 - '20 Core 2 '19 - '20 Core 2 $3,000 $3,000 $2,500 $2,500 $2,000 $1,500 $1,000 (4.6%) (8.1%) (4.6%) $2,000 $1,500 15.2% (5.9%) $1,000 (4.0%) $500 $0 $500 $0 (13.8%) FY18A FY19A FY20E (Constant Currency APAC FY18A FY19A FY20E (Constant Currency Connected Americas EMEA Traditional 1. 2. 3. Retail includes retail stores and concessions; wholesale includes wholesale and off-price; E-Commerce includes own-brand E-Commerce and pure-play third-party E-Commerce Core sales removes impact of foreign exchange, store exits, and brand exits Component geographies do not aggregate to total sales due to Corporate sales being reported separately from geographical segment sales 8 $2,541 $401 $2,218$2,085 $2,140 $337 $305 $1,881 $1,780 $2,541 $508 $2,218 $2,085 $535 $608 $858 $715 $660 $1,175 $951 $812 |
![]() |
Preliminary Draft - Confidential New World Fossil Update ($ in millions) Efficiency and cost reduction initiatives continue to progress on or ahead of schedule Includes fully-actioned NWF 1.0 program for $200mm annual run-rate savings; NWF 2.0 program for additional $200mm being implemented currently Organizational restructuring and functional centralization $78mm $40mm $118mm Competitive bidding, local sourcing, and supplier renegotiations Develop guardrails on materials and component costing $60mm $50mm $110mm Zero-based budgeting for indirect spend Reductions across categories (print, shipping, facilities, etc.) $47mm $55mm $102mm Re-negotiate licensor contracts Connected device pricing actions $15mm $0 $15mm Optimize trade investment, pricing and promotion strategy, and assortment $0 $50mm $50mm Closure of unprofitable / marginal stores $5mm $0 $5mm 9 Total$205mm$195mm$400mm Store Footprint Revenue Management Category Management Indirect Sourcing Design to Value and Direct Sourcing Organization Savings to Go Savings to Date Description Total Opportunity |
![]() |
Preliminary Draft - Confidential Overview of Amendment |
![]() |
Preliminary Draft - Confidential Terms of Amendment to Term Loan Credit Agreement 10 Maximum Net Leverage Ratio Reset to: 2.75x for Q1 – Q4 FY2020 2.25x for Q1 – Q3 FY2021 Remains at 1.50x thereafter Pricing Permanently increased by 150bps to L + 800 Amendment Fee 300bps, paid upfront to all lenders ABL Draw Cap Permanently limited to $200 million Other Call protection reset Modifications to certain negative covenants to be agreed |
![]() |
Preliminary Draft - Confidential Pro Forma Leverage Covenant Projection ($ in millions) Significant cushion to pro forma covenant levels Pro Forma Leverage Covenant Projection 1Q'20 2Q'20 3Q'20 4Q'20 LTM Adj. EBITDA Estimate $117 $107 $111 $124 Cash 150 150 150 188 Total Debt $273 $311 $298 $186 (-) Cash (Subject to Cap) (100) (100) (100) (100) Net Debt $173 $211 $198 $86 Net Leverage Covenant Test EBITDA - $ Cushion / (Deficiency) Debt - $ Cushion / (Deficiency) Note: Reflects budgeted FY2020 financials 11 1.48x1.97x1.79x0.69x 2.75x2.75x2.75x2.75x $54$30$38$93 14883106255 |
![]() |
Preliminary Draft - Confidential Appendix |
![]() |
Preliminary Draft - Confidential Connected Gen 5 Product Features Enhanced product features and software experiences put Fossil Group devices on parity with key competitors Product Features Software Enhancements HEART RATE + FITNESS TRACKING Track heart rate during workouts and throughout the day NOTIFICATIONS Receive call, text, email, app alerts and more SMART BATTERY MODES Users can easily alter settings to achieve 2-3 days of battery life SPEAKER + MICROPHONE Answer tethered calls, talk to and hear back from Google Assistant SWIMPROOF Users can keep their watches on while in the pool or shower BRANDED SOFTWARE Unique branded microapps and customizable watch faces INCREASED STORAGE + MEMORY Download more content, music, and apps to the device BUILT-IN GPS Track distance, laps, and pace and view run routes HEALTH & WELLNESS USE CASES Leveraging Google updates and partnerships to unlock sleep tracking, and enhanced wellness metrics QUALCOMM SNAPDRAGON 3100 New processor optimizes power usage NFC PAYMENTS Quick payments with a tap of the wrist 12 |
![]() |
Preliminary Draft - Confidential FY2020 Budget – Summary Output ($ in millions) Actual Forecast Actual Fcst. 4Q'19 1Q'20 2Q'20 3Q'20 4Q'20 FY2017 FY2018 FY2019 FY2020 Total Sales % YoY Growth (-) COGS Gross Profit % Gross Margin (-) OpEx Operating Income (+) D&A (+) Other Incom e (+) Res tructuring Expens es (+) Stock-Bas ed Com p (+) Other $712 (9.6%) (404) $427 (8.3%) (205) $466 (7.0%) (229) $509 (5.7%) (245) $662 (7.0%) (333) $2,788 (8.4%) (1,429) $2,542 (8.8%) (1,201) $2,218 (12.7%) (1,118) $2,064 (6.9%) (1,011) $308 43.3% (309) $222 52.0% (272) $238 51.0% (246) $263 51.8% (248) $329 49.8% (277) $1,359 48.7% (1,783) $1,340 52.7% (1,277) $1,099 49.6% (1,128) $1,053 51.0% (1,043) ($1) 13 2 5 3 40 ($50) 10 - 17 5 2 ($8) 10 - 11 4 3 $16 10 - 11 4 4 $52 10 - 6 3 3 ($424) 82 14 45 32 452 $63 69 (0) 46 23 21 ($28) 54 27 25 18 73 $10 40 - 45 16 13 % Adj. EBITDA Margin (-) CapEx (+/-) Change in NWC (-) Res tructuring Expens es (+/-) Cas h Taxes / Benefits (+/-) Other 8.6% (7) 59 (5) (2) 17 (3.9%) (7) (34) (17) (7) 5 4.5% (9) (31) (11) (6) 4 8.7% (6) (8) (11) (7) 5 11.3% (3) 94 (6) (11) 6 7.2% (25) 122 (45) 13 (77) 8.7% (18) 156 (46) (34) (12) 7.6% (21) (183) (25) (14) 67 6.0% (25) 21 (45) (30) 20 (-) Cas h Interes t (-) Mandatory Am ortization (-) Am endm ent Fee (-) Other (5) - - (7) (5) (5) (6) (3) (5) (5) - (0) (5) (5) - (0) (5) (5) - (0) (21) (20) (6) (4) Beginning Cas h (+/-) LFCF (+/-) RCF Draw / (Paydown) Ending Cash ABL Borrowing Bas e (-) Borrowings Outs tanding (-) Letters of Credit ABL Availability (+) Cas h $147 113 (60) $200 (94) 44 $150 (44) 44 $150 7 (7) $150 145 (107) $200 15 (27) $200 $218 (27) (3) $150 $192 (71) (3) $150 $190 (114) (3) $150 $219 (107) (3) $188 $187 - (3) $200 $218 (27) (3) $188 $187 - (3) $189 200 $119 150 $73 150 $109 150 $184 188 $189 200 $184 188 Note: Reflects preliminary Q4 FY2019 results and budgeted FY2020 financials; FY2020 budget based on internally-established foreign exchange rates 13 Total Liquidity $389 $269 $223 $259 $372 $389 $372 LFCF $113 ($94) ($44) $7 $145 $15 UFCF $125 ($76) ($33) $18 $155 $188 $268 ($8) $65 Adjusted EBITDA $62 ($17) $21 $44 $75 $200 $221 $169 $124 |
![]() |
Preliminary Draft - Confidential 2019A-2020E Gross Margin Bridge Clear line-of-sight into significant year-over-year improvement in gross margin Region / product mix and continuing New World Fossil efforts deliver 100 bps of improvement Non-recurrence of Q4 2019 Gen 4 / Sport one-time inventory reserve Assumed 60 bps of additional promotional headwind to combat category / channel pressures Impact before offsets 2019 Actual 2020 Budget (Constant) Mix NWF Connected Promotions Tariffs Other 14 (0.6%) (0.2%) (0.4%) 51.4% (0.5%) Gross Tariff 49.6% 2.0% 0.4% 0.6% |
![]() |
Preliminary Draft - Confidential FY2020 Budget – Working Capital Detail ($ in millions) Q4 2019 Q1 2020 Q2 2020 Cash and cash equivalents Accounts receivable - net Inventory - net Prepaid expenses and other current assets Accounts payable Accrued expenses Q3 2020 Q4 2020 Ame rica s EMEA APAC Ame rica s EMEA APAC Cash and cash equivalents Accounts receivable - net Inventory - net Prepaid expenses and other current assets ($85.0) N/A N/A N/A $113.0 N/A N/A N/A $124.6 N/A N/A N/A ($87.0) N/A N/A N/A $119.0 N/A N/A N/A $165.8 N/A N/A N/A Accounts payable Accrued expenses N/A N/A N/A N/A N/A N/A N/A N/A N/A N/A N/A N/A Note: Reflects preliminary Q4 FY2019 results and budgeted FY2020 financials; Working capital projections shown prior to impact of amendment 15 Tota l $197.8 $269.8 $394.8 $109.0 $141.9 $297.5 Tota l $152.6 $227.2 $509.0 $119.1 $181.3 $245.3 Americas EMEAAPAC Total Americas EMEAAPAC Total Americas EMEAAPAC Total ($58.2)$80.5$177.8 $82.8$123.3$83.6 $196.5$97.2$158.6 $59.8$20.8$36.6 $62.3$21.8$88.1 $155.7$91.4$84.5 $200.2 $289.7 $452.3 $117.2 $172.2 $331.5 ($70.5) $115.0 $108.0 N/A N/A N/A N/A N/A N/A N/A N/A N/A N/A N/A N/A N/A N/A N/A $152.5 $179.5 $490.2 $122.0 $134.6 $267.8 ($74.5) $104.0 $123.0 N/A N/A N/A N/A N/A N/A N/A N/A N/A N/A N/A N/A N/A N/A N/A $152.5 $181.1 $484.0 $115.8 $125.7 $234.4 |
M'7^6*G_*QN/^TRA_];+-?ZG5!4^GS_0****#,_S$/^#G4Y_X*Y?%X_\ 5-_@
M;_ZKC0Z\!^&7_!'/_@L3\3OAOX"^)'PQ_9X^)NL_#?Q]X,\+>,_ .L6'QA^&
M&EV>J^#/%>CV.M^'-3L=*U'XHVFI:=;76CWUE=65K=6EG>6?GXO[*RP:]]_X
M.=/^4N/Q>_[)O\#?_5<:'7^@;_P3,&?^"<_[!.?^C-_V9^/^Z,^#C_2@Z>?D
MIQMN]/33<_SX_AI_P1-_X+6Z-\1_A]K&N?LU?%6#1]*\;>$M2U2YF^,WPKN(
M[>PL==L+Z]FF@M_BU=W-S]EMX)OQZ=J_T_E& !2T4&$JGM-=-#_* _X+R\
M%=?VU_?XC^&__5;>!S_.O]1G]GS7='\3_ CX*>)?#NJZ?KGA_7_A+\.=8T36
MM*NX;_3-8TO5/"&C7MCJ5A?0+Y%W8WEK/!
<4!I9#:1.2>OUIA22IU(3.!QS3:HFB
M[T8J5+($X$&:@V@%62)FC<.';,Q!J#3 / %9,*'(I> %'MM-2LU*%LB)R8DUK4TY*8@[31+8J39-E(DS1RWC C]Z3C
M<4@X@]*9)WW (QB/K2QD.H3$2:L=D7C?TI<_ 4!- V^)@X]:(5R6S''K6+ 2
MZ\!)$U"#M01S2T,)7)&QO &8W>_K2MUM^);$R=IDTVZT3;)*AR:K[B#=I)'3
M$44.6+EHV\=MPD#J*L$I4VRI4R"!(XJN6H?$())(C\ZN'D[;963P*/)Q$W'W
M2$D)!0/?-,6[90V2,GWH0!*4_2F&E;4D3'K2YMV-@M"%TF%I5P9ZT _01;I)QB)^E!9RH@3
M.Z>.*9U'^CI,'GD4]\BEP;MQ#1Q@@4YI:3+L1@@F>*5LT[F9$'BG]*0/% *VRO[I(Y'
M2!2MZHE*@/W<"F&H#:1U R:Q\!+D:8$K&<>E;>B#B0,D5)B-HX]_]U1O $P!
MP>E(\CO N^"ZR%#"!R.M5@EQQPX CTJW6 EH!*H"N2:K/%VN.I"<"J(\,GER
MB;Z5+L(F<_G0[!&Y+@ G(S4DJ6NQ<4?*$^HJ>EI 0E1,A9SFB7:8^Y#NE0G5
M%"( $P:M"K>\X??K579"=4=CTZGFK6S07%/0,)5CVJ3(5812[U L6R #)S@=
M?6DGBVO25**O.4=/K0M766U)2DQY21!H+3;N[>"DS8K;1)+BFUM!0P3R*>=PF)D3(S
MZT@ZKQ%M(."3S3"B3 G@X/K2I*MC(NW0 1XP$9!CB@J$(7, ^M$W?>R",KD>
M]17 ;<_K$\4R&Z%RTF5;\ET $XZBG%^5I/612;AE\QD\&G;C#"#ZM5W422KD
M;TP0J3!D<4/4$S=;HP:-I025F5$YJ-\!X^[@@Q%#%UD;84MXTC;! ME).1-&
M0V'FDJ(\PZT%!V-+ ,YZ"B,*AJ 3SSZ4#Y"O2#*23F8]:!M 5,F,&MW#GW9/
M6.M!02ZI)/7-<@V]$GYF?YTHC*G1Z*%/N$^$1U%(->93GJ2*9'AD\N4'O$^1
M)X)YCUK=BF$ 3((S4;P'P4* B0:E9 ^&,S ZUE^T+\0_ID?$K2"-L<5:Z>KS
M+/ !JJTP;KI8/I5QIK>U+PG,Y%1YFJ+,2*O5W(OFL
*@/E'3V
MHXNP&MBUG 29,GPX_&KRR"UOV*3$!4YJAM&BHN#,!N:N[9Y8?TU4P N/>EY.
M&.Q\HZ^^O
M09 #<0/BT$*@2:W:'9=/F8Z1.:&J%WO40HT1@)3<7!R2*) LTD[K+;UWF@7#
M4O.'V HI/ZHVK/SG-1N%E=R[B/*(BCCR+ER;Q\,1&9ZXIU:@/ XI$()8(A/
M-.E,MVQS(5S09.1L ;CD.W)B?_*@J[4%7WUH! FN7!C
M!O2+@*C"DY'X5;Z.?NP>GM58LCQ4)&83%6^E(AE9]_2@S1NY4E3$=9I+
M4@4V>!S1G1^KK!F0?6D;U>ZW2CK-)QCLA6K3N"$\XH=HD!>>>E&?!E,9@<^M
M LP=YD8@U>N#S7R#N@"Z0#F?RHBD^4$X@<$4*X(!3QS3"3!2,QR/2C\ KN-B
M? /M'%&2N04\T 'S1Q1&@5+0?:DLA%:S$E;8(1)@1ZT5D0(.*C 2=Q
MS4ED;DD'K %+81,G!3Z?G2+JMI4D#I3I'7UZ FIEP
MSF2?>F[XDOH!F8_(5/-^XHBO:!:4$E>)S$5"=TDQUXQ4U )"N,T-E,P"
$BW
MMVVQYE* RI4D )_$TA]@WMY:=L_LW=GK%NX0YJ'9XN:3=,@CAYI6R)^*=1."B*:
N=C7'EZ)K>H:*M]L(>5I]TMDNI$D!6T^8 \3Q4[W5=0[0/OZEJ
M=]=:GJ#Z4%Z[O'5.NKCC